Ryzen AI 9 HX 375 Leistungdebüt: HP OmniBook Ultra 14 Laptop im Test

Die Einführung von CPUs mit KI-Beschleunigung hat HP dazu veranlasst, neben den Spectre- und Envy-Familien eine weitere Modellreihe auf den Markt zu bringen. Die OmniBook-Serie umfasst Co-Pilot+-kompatible Geräte mit Qualcomm Snapdragon- und AMD Zen 5-CPUs. Zu den derzeit erhältlichen Modellen gehören das OmniBook X 14, das OmniBook Ultra 14 Clamshell und das OmniBook Ultra Flip 14.
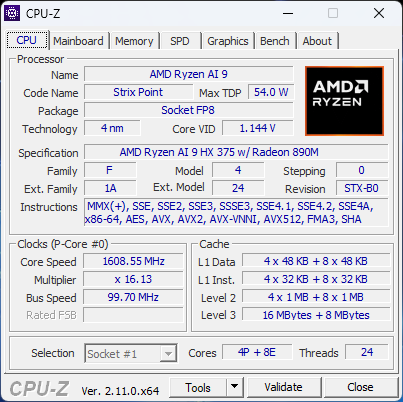
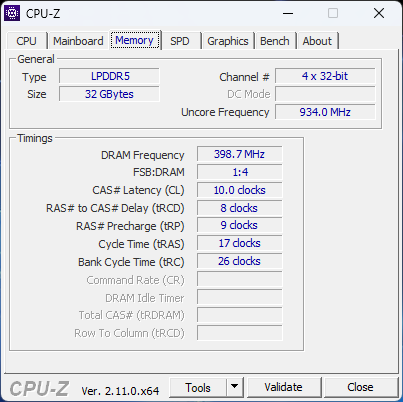
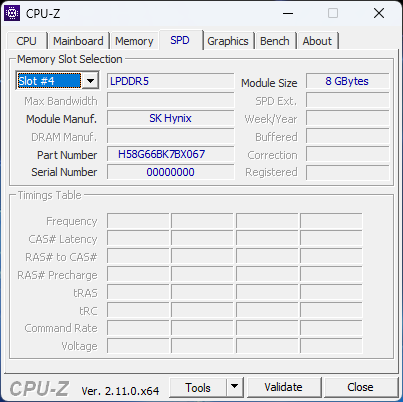
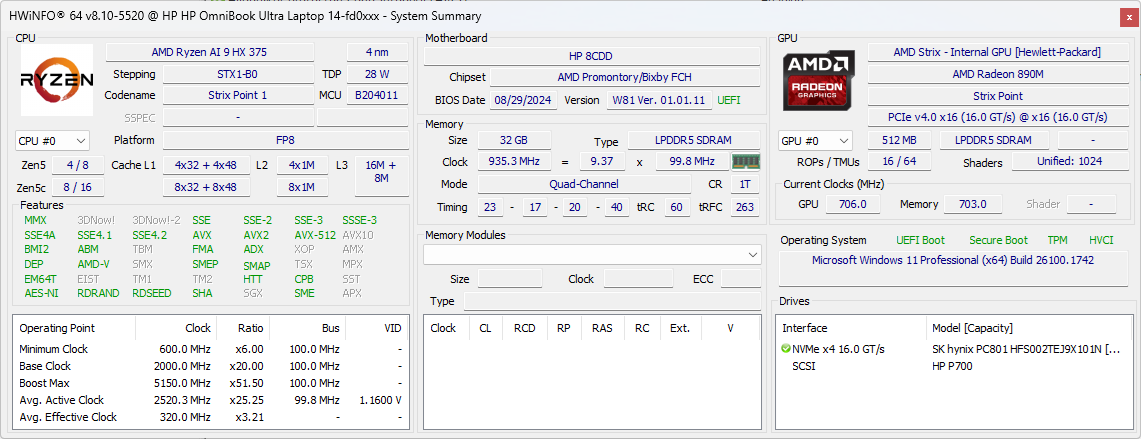
Unser heutiges Testgerät ist das OmniBook Ultra 14 Clamshell, ausgestattet mit der Ryzen AI 9 HX 375 CPU, 32 GB LPDDR5x-7500 RAM und einem 1600p IPS-Display, das für 1.599 Euro im Handel erhältlich ist. Andere SKUs sind mit halb so viel Speicher und einem Ryzen AI 9 365 erhältlich, wobei der gleiche IPS-Touchscreen bei allen Konfigurationen erhalten bleibt.
Zu den Alternativen gehören andere 14-Zoll-Subnotebooks der oberen Mittelklasse bis hin zum High-End-Bereich, wie das Asus Zenbook S 14 UX5406, Lenovo Yoga Pro 7 14 G9 oder Dell XPS 14.
Weitere HP Bewertungen:
Mögliche Konkurrenten im Vergleich
Bew. | Version | Datum | Modell | Gewicht | Dicke | Größe | Auflösung | Preis ab |
|---|---|---|---|---|---|---|---|---|
| 88 % | v8 | 10 / 2024 | HP OmniBook Ultra 14 Ryzen AI 9 HX 375, Radeon 890M | 1.5 kg | 16.5 mm | 14.00" | 2240x1400 | |
| 91.4 % v7 (old) | v7 (old) | 02 / 2024 | HP Spectre x360 14-eu0078ng Ultra 7 155H, Arc 8-Core | 1.5 kg | 16.9 mm | 14.00" | 2880x1800 | |
| 88.1 % | v8 | 09 / 2024 | Asus Zenbook S 14 UX5406 Core Ultra 7 258V, Arc 140V | 1.2 kg | 13 mm | 14.00" | 2880x1800 | |
| 85.1 % | v8 | 09 / 2024 | Lenovo Yoga Pro 7 14ASP G9 Ryzen AI 9 365, Radeon 880M | 1.5 kg | 18 mm | 14.50" | 3072x1920 | |
| 85.1 % | v8 | 09 / 2024 | Samsung Galaxy Book4 Edge 14 SD X Elite X1E-80-100, Adreno X1-85 3.8 TFLOPS | 1.2 kg | 10.9 mm | 14.00" | 2880x1800 | |
| 86.3 % v7 (old) | v7 (old) | 04 / 2024 | Dell XPS 14 2024 OLED Ultra 7 155H, GeForce RTX 4050 Laptop GPU | 1.8 kg | 19 mm | 14.50" | 3200x2000 |
Hinweis: Wir haben unser Rating-System kürzlich aktualisiert und die Ergebnisse von Version 8 sind nicht mit den Ergebnissen von Version 7 vergleichbar. Weitere Informationen dazu sind hier verfügbar.
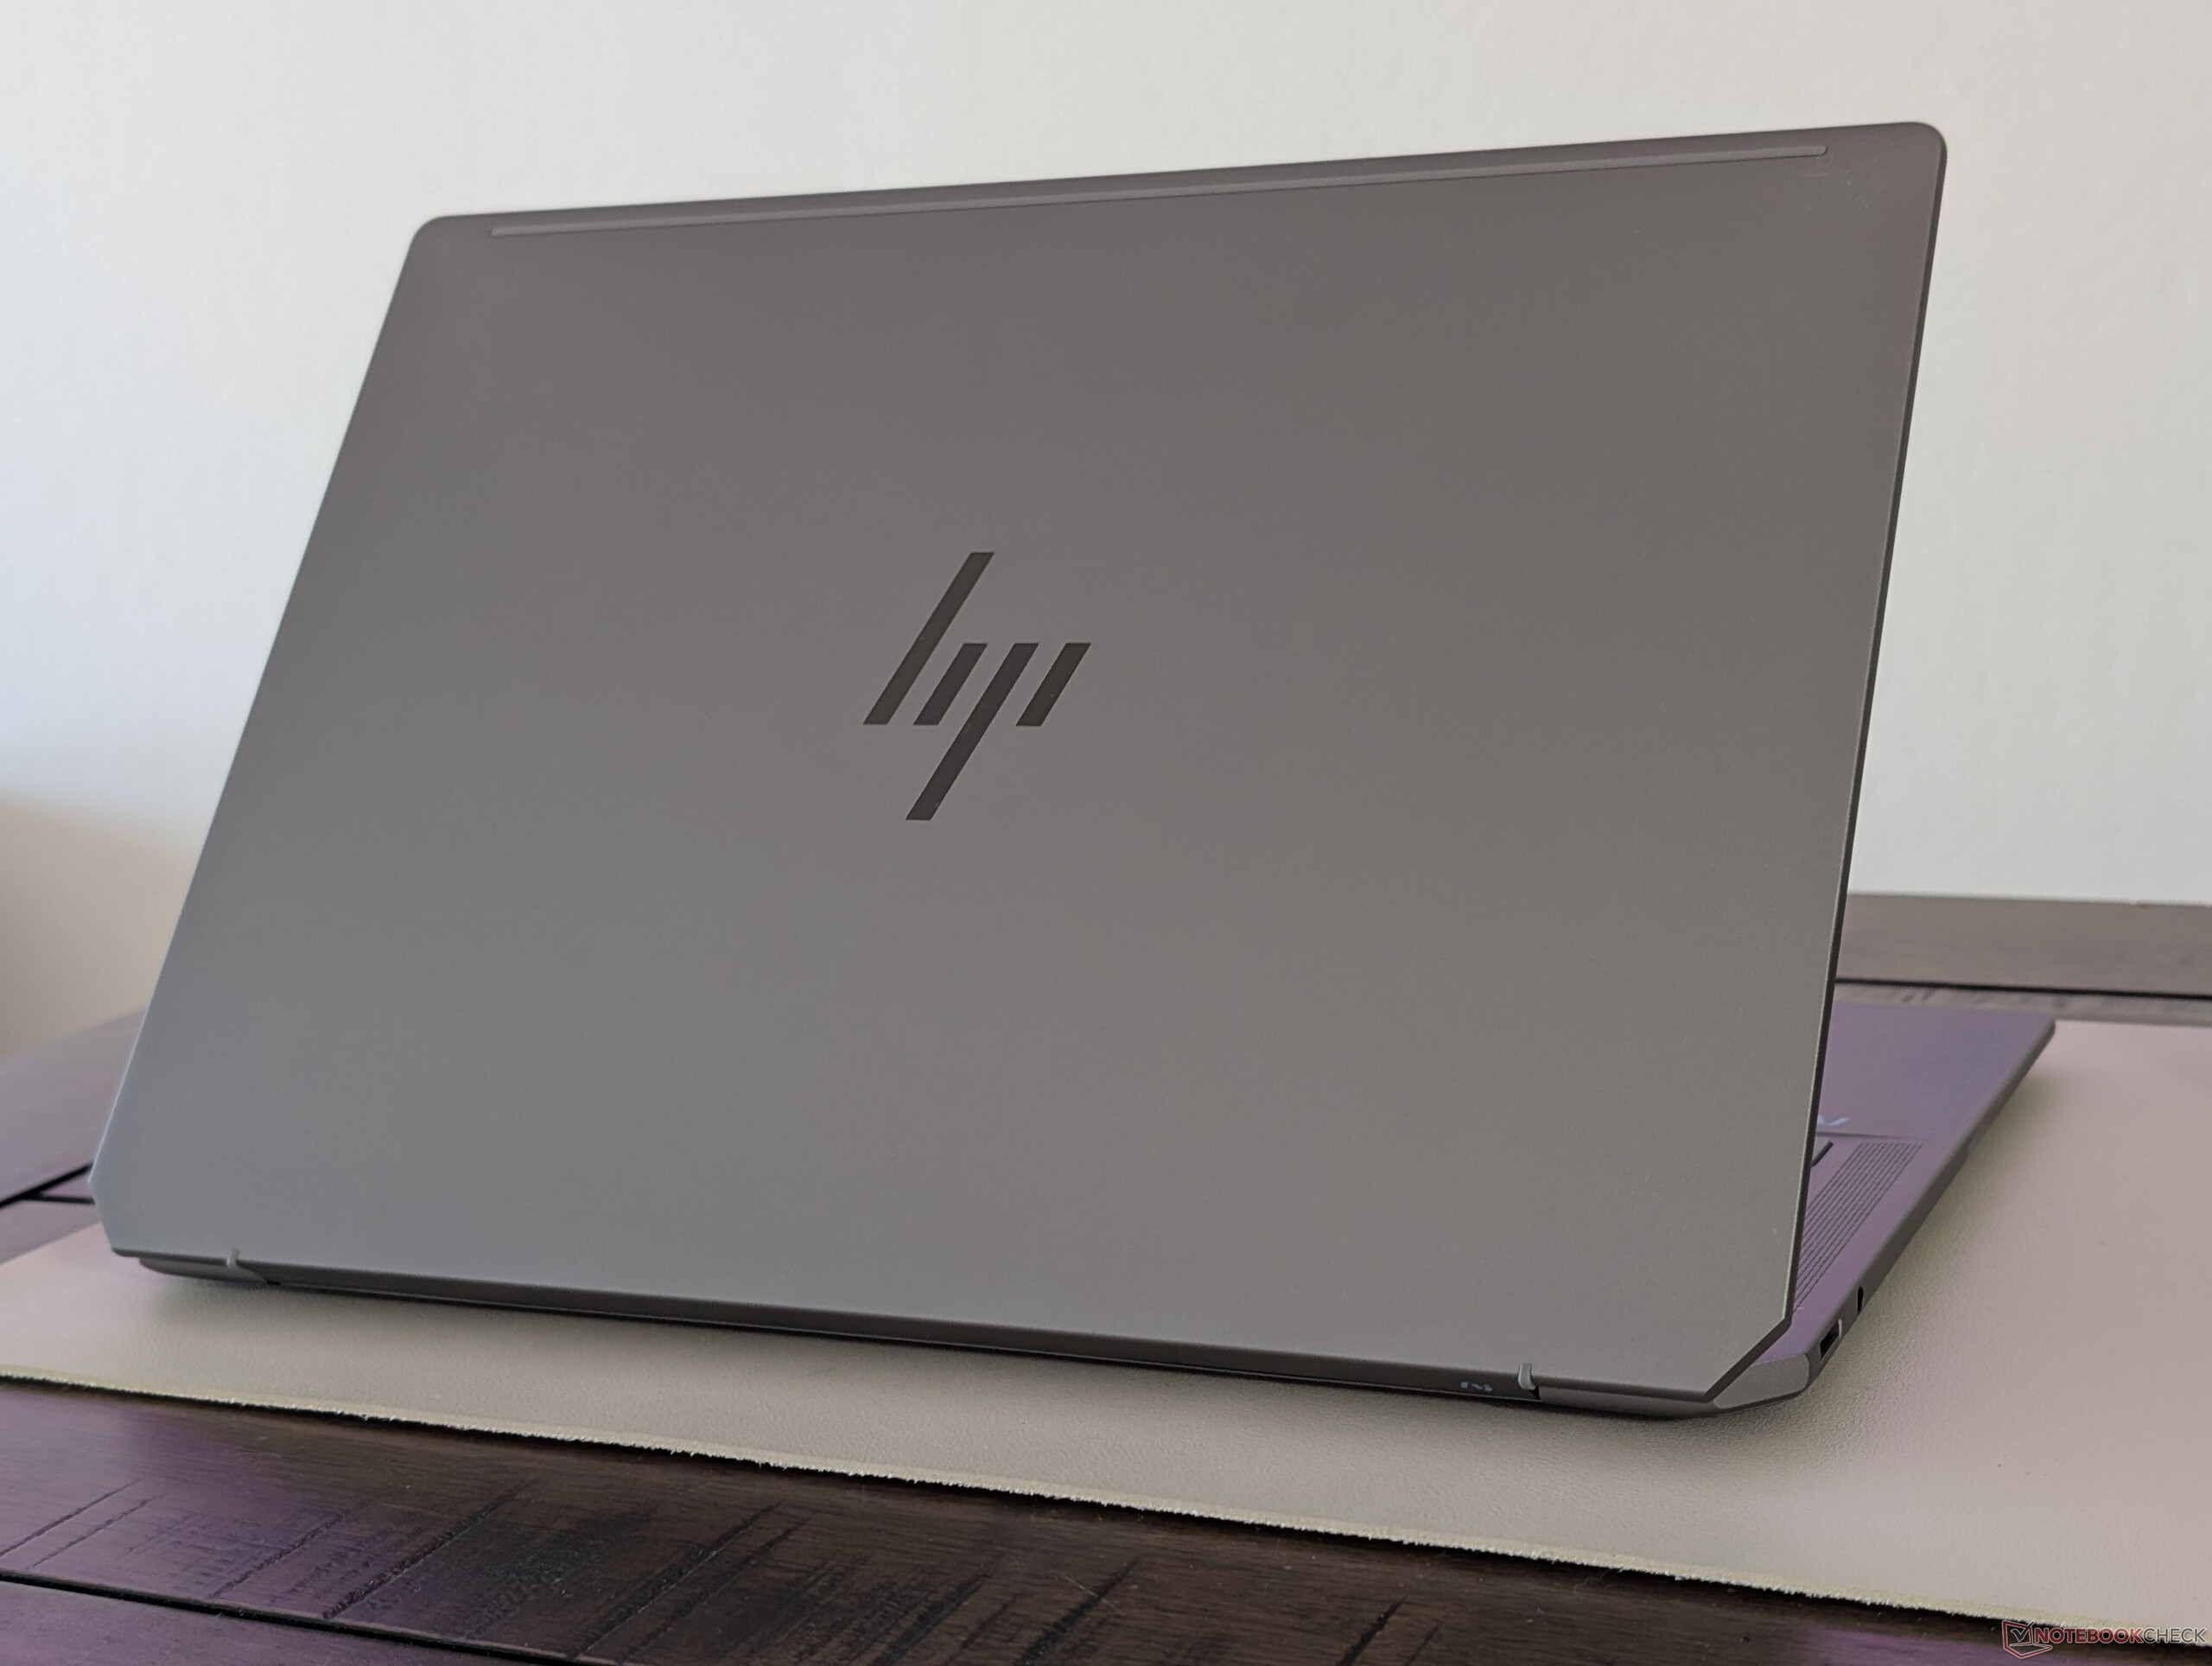
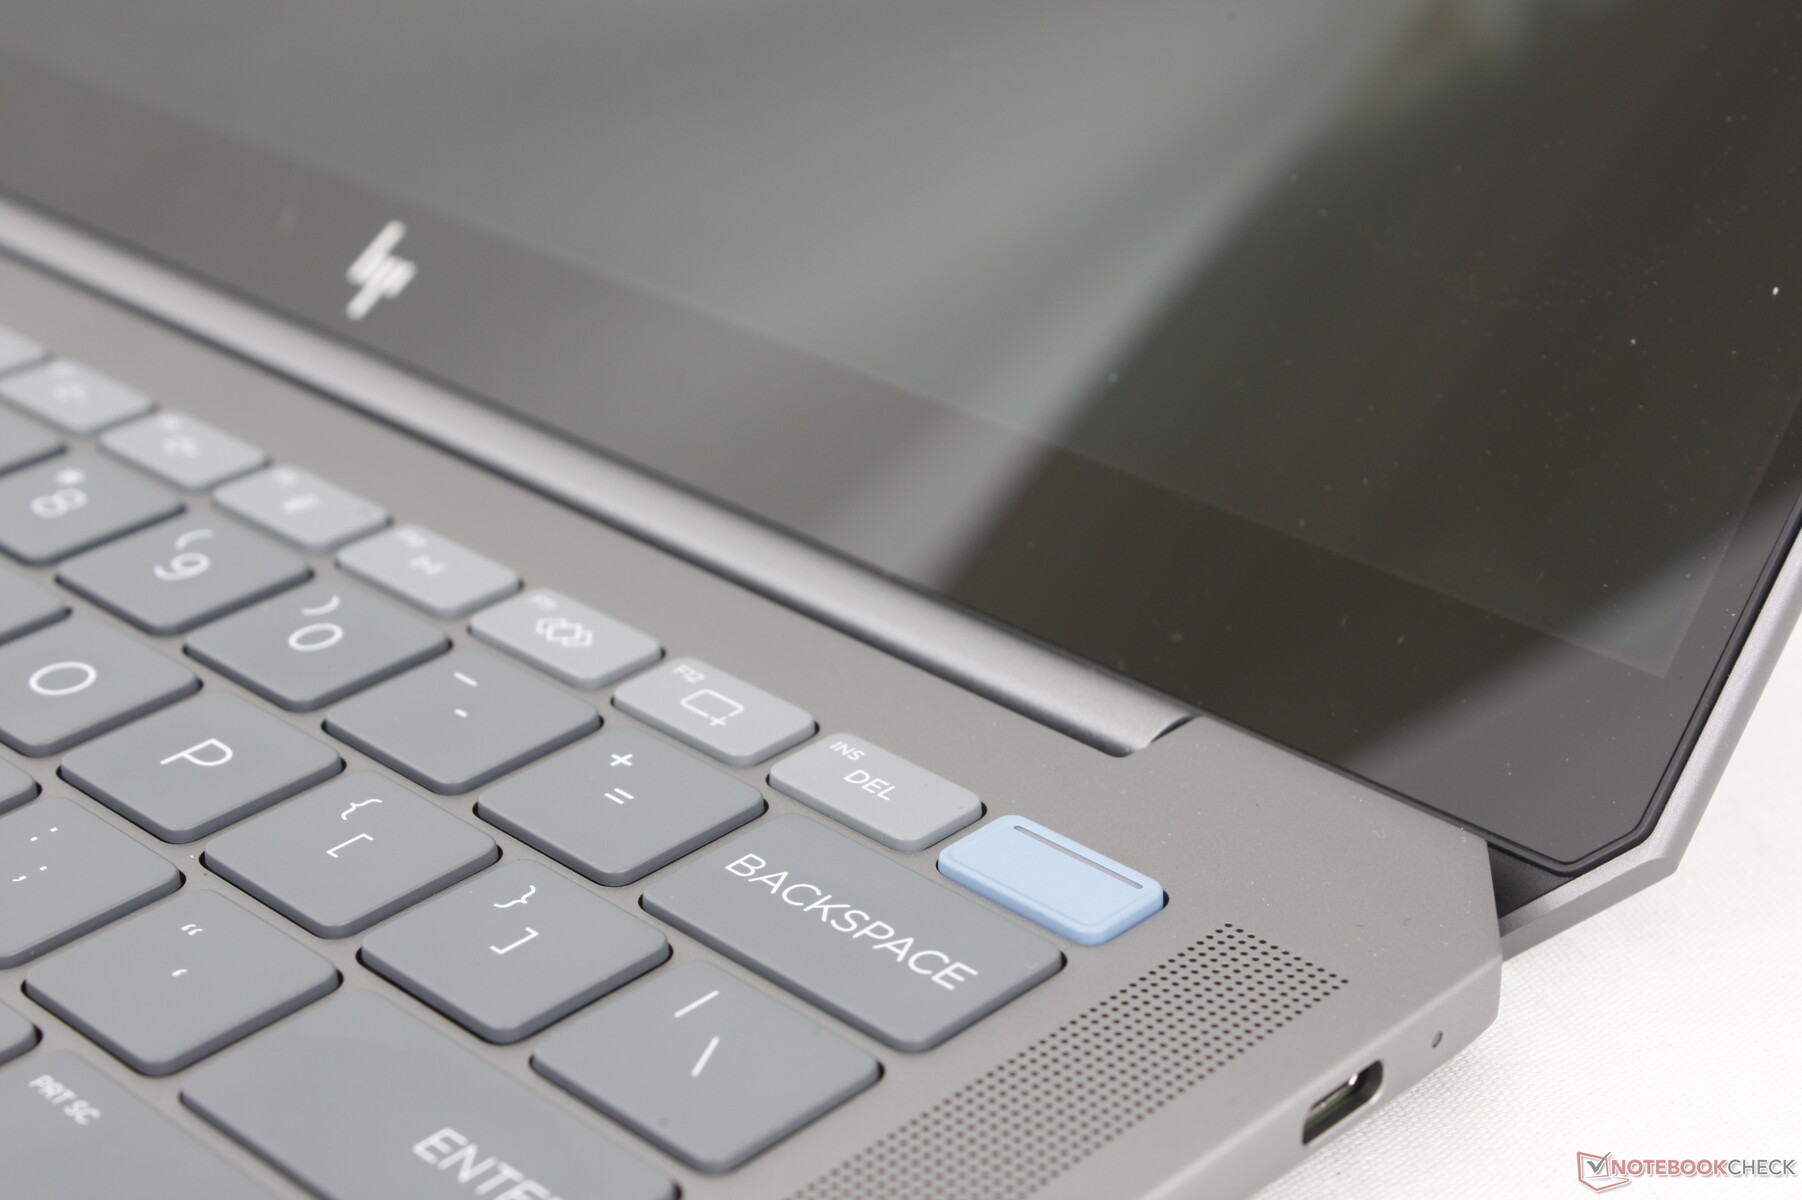
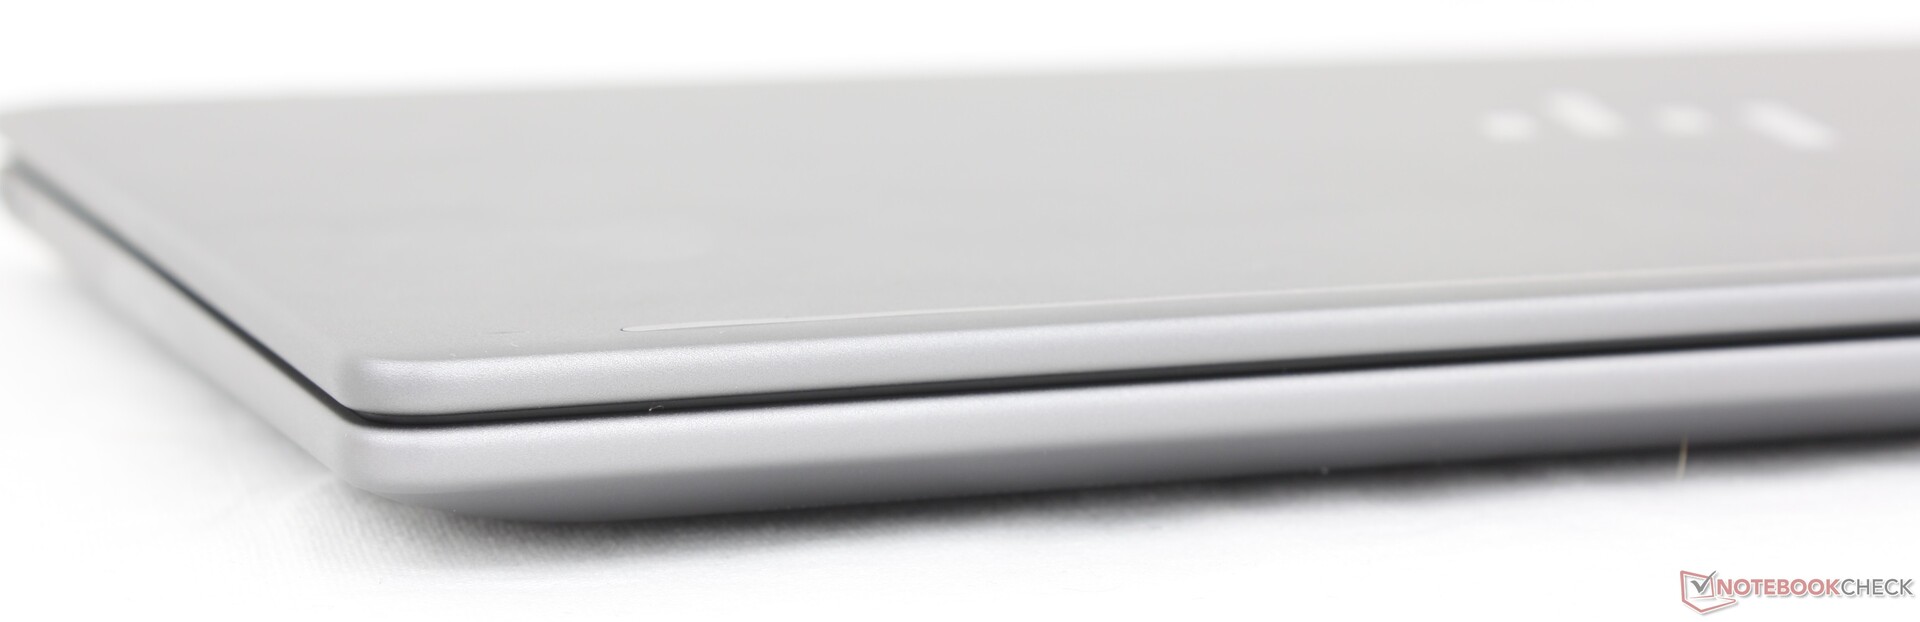
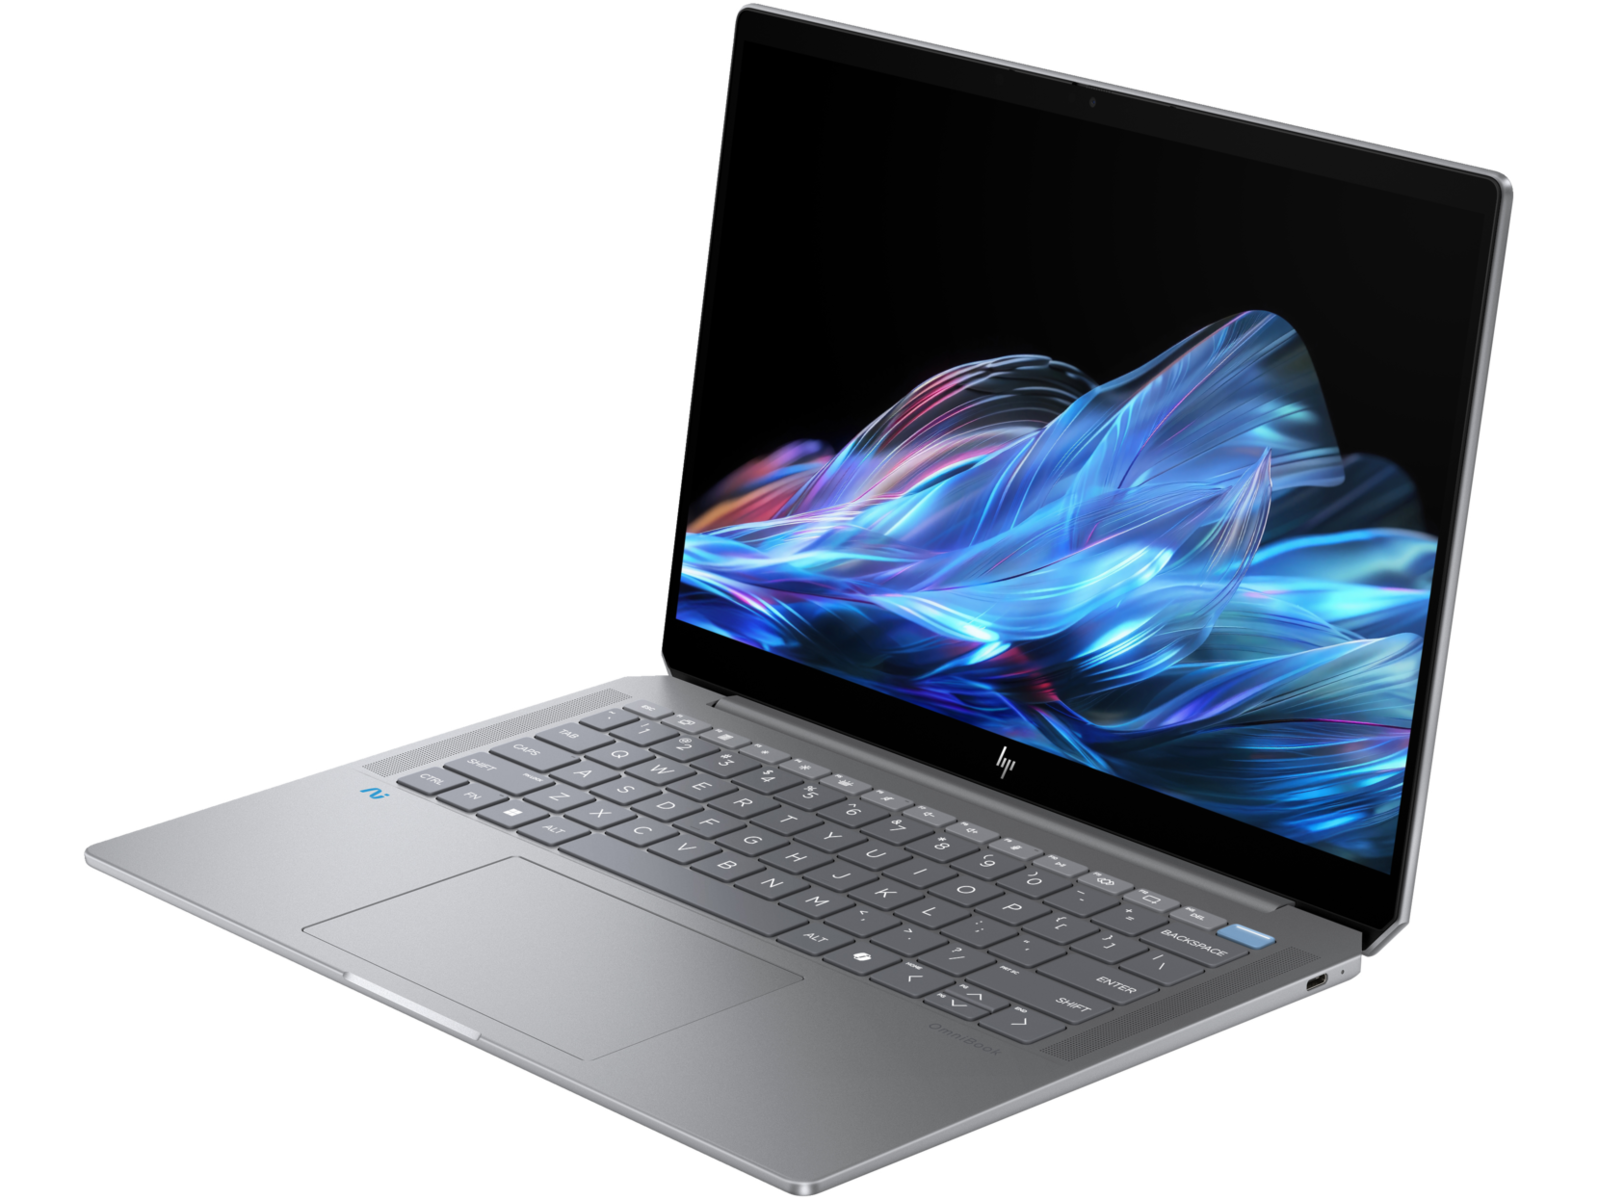
Gehäuse — Spectre-inspiriertes Design
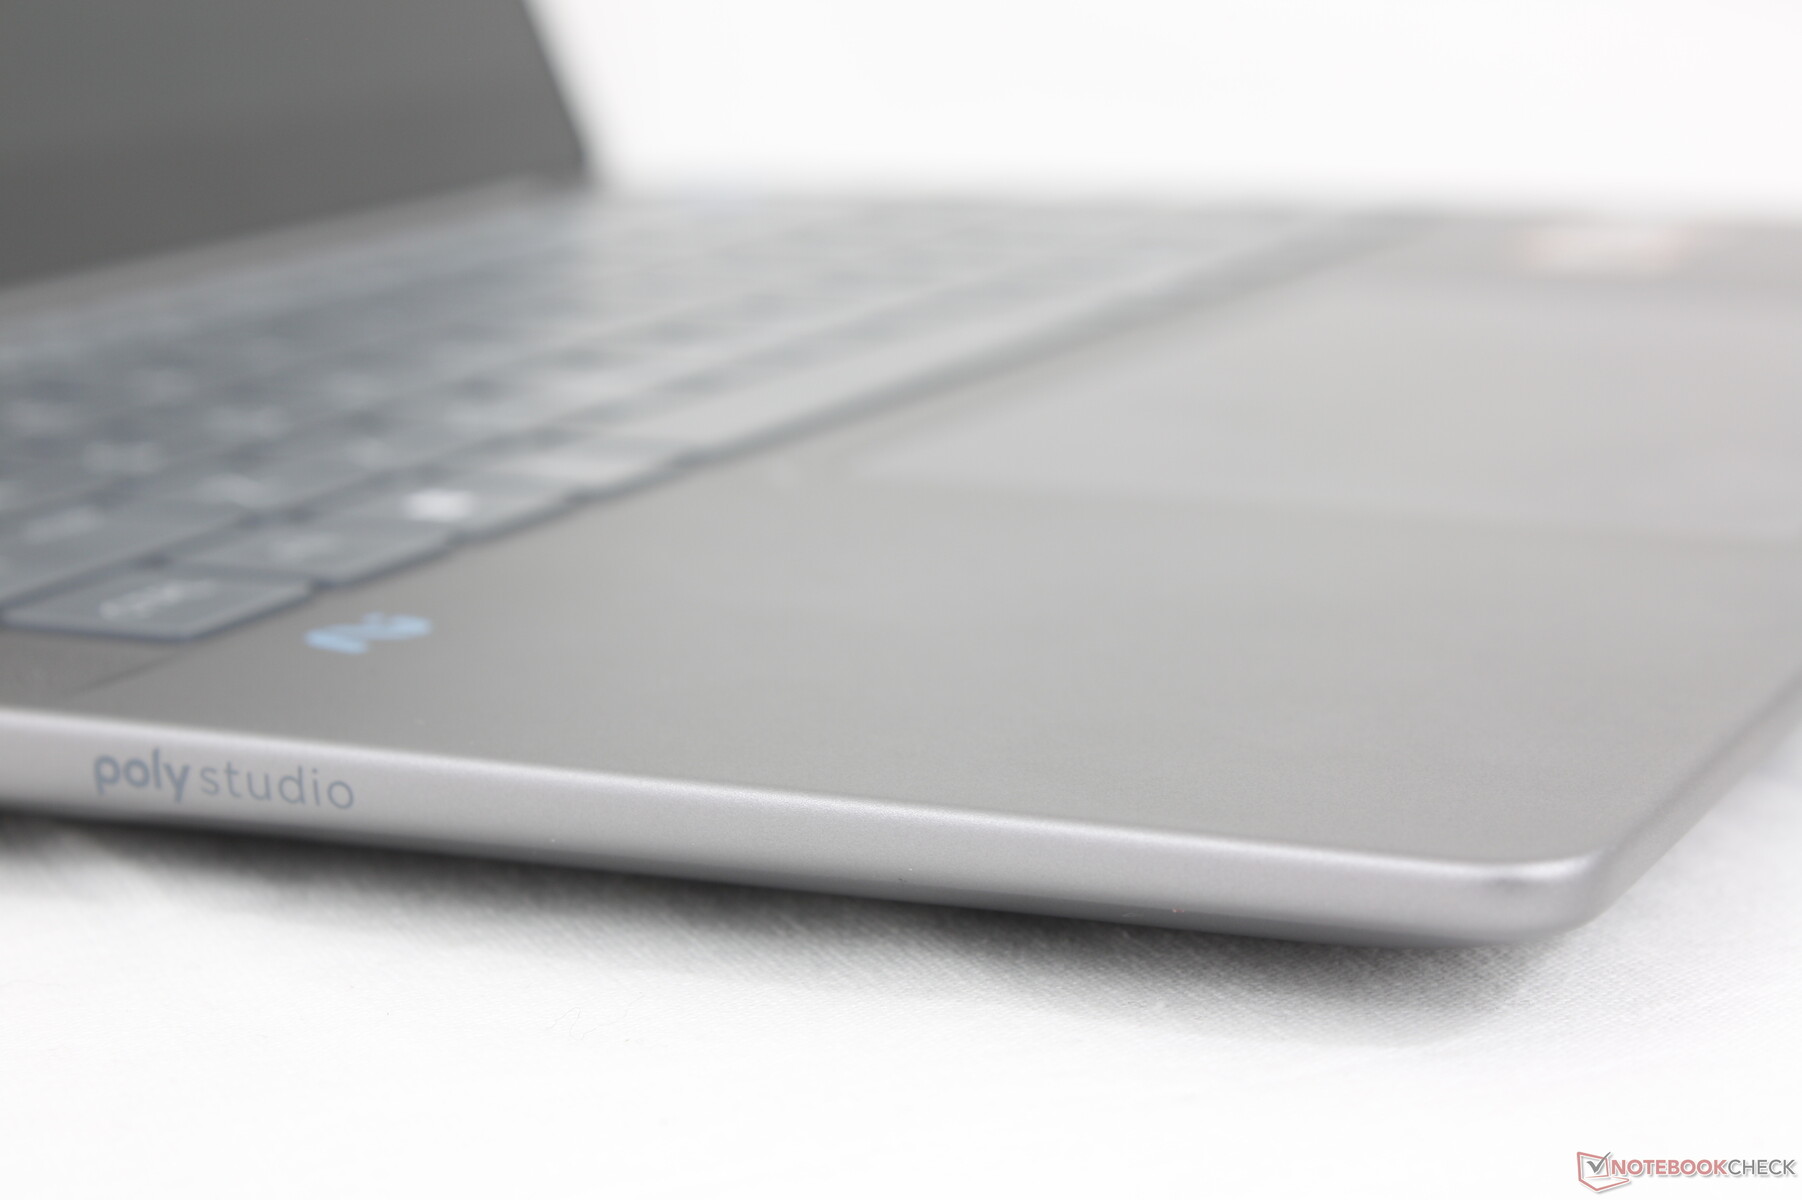
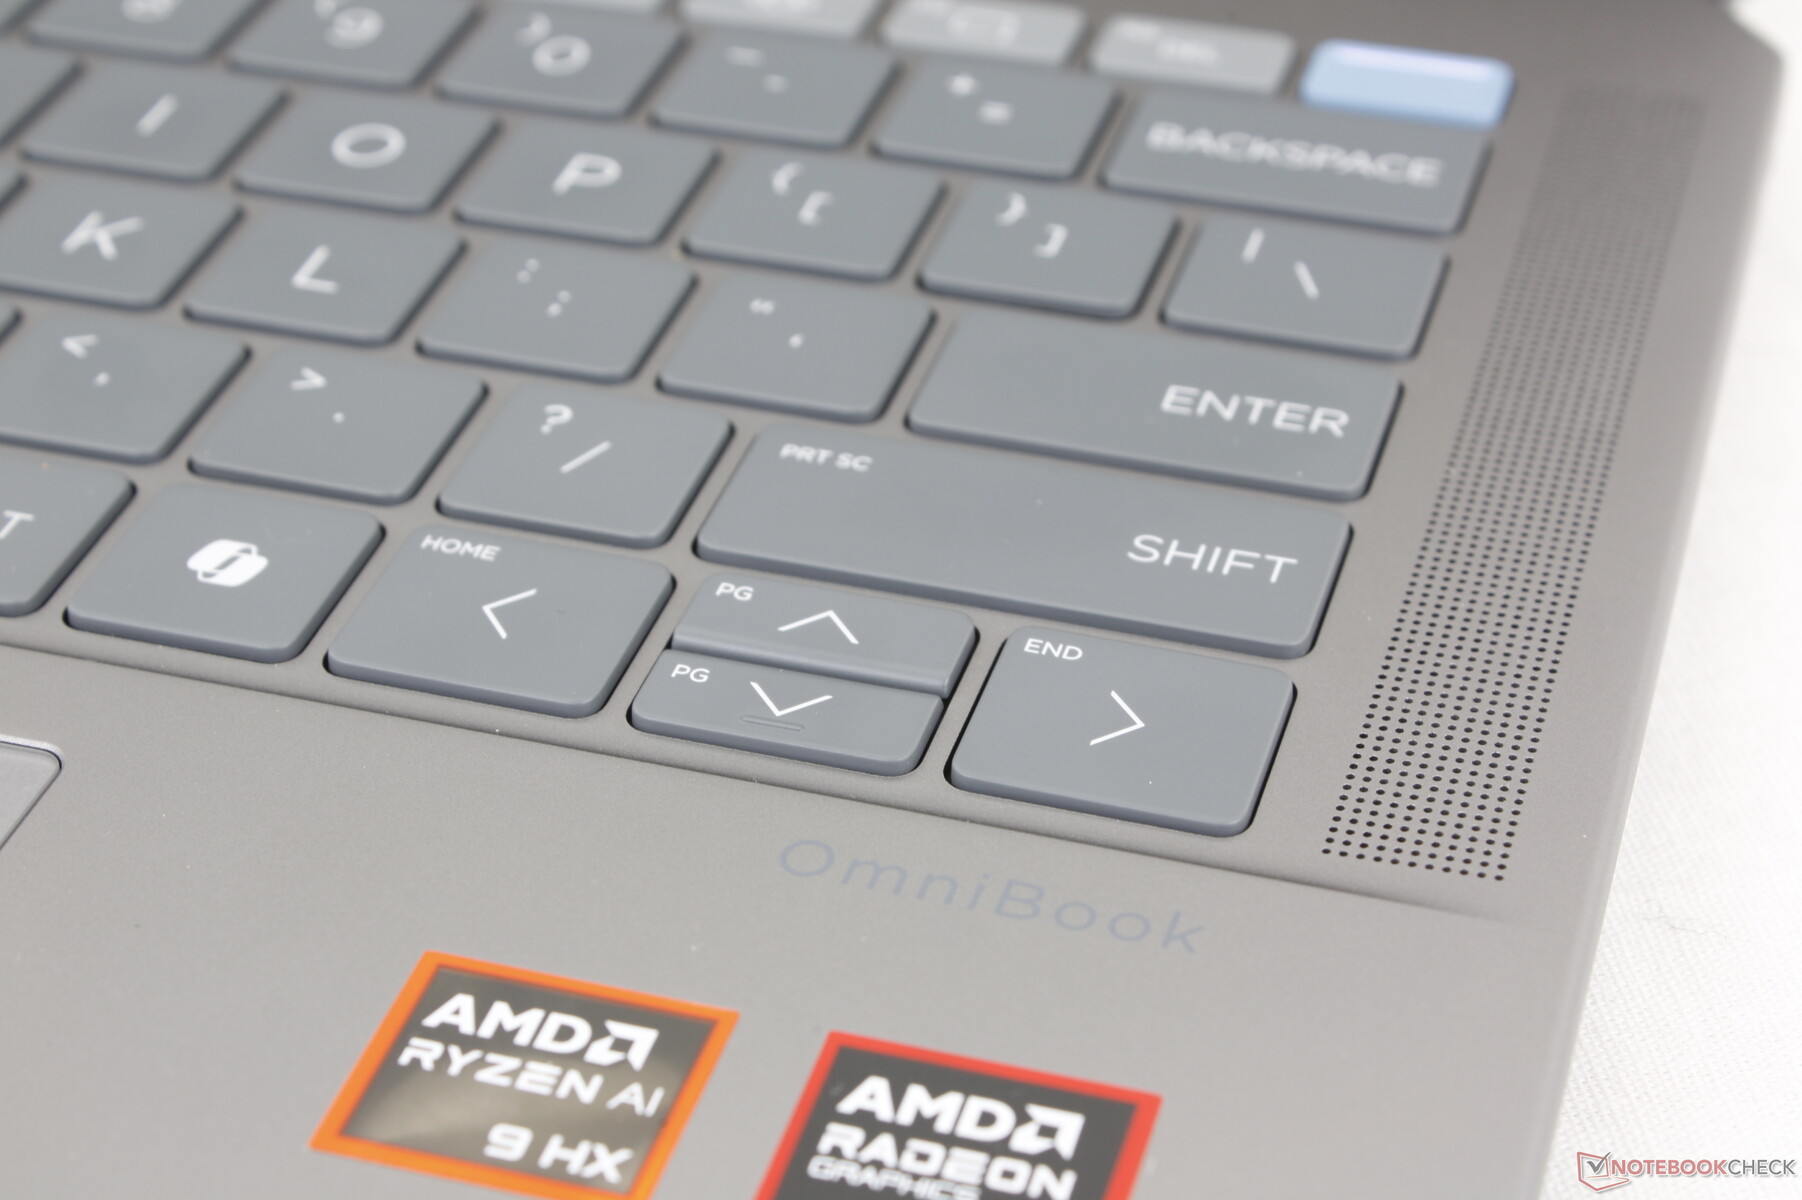
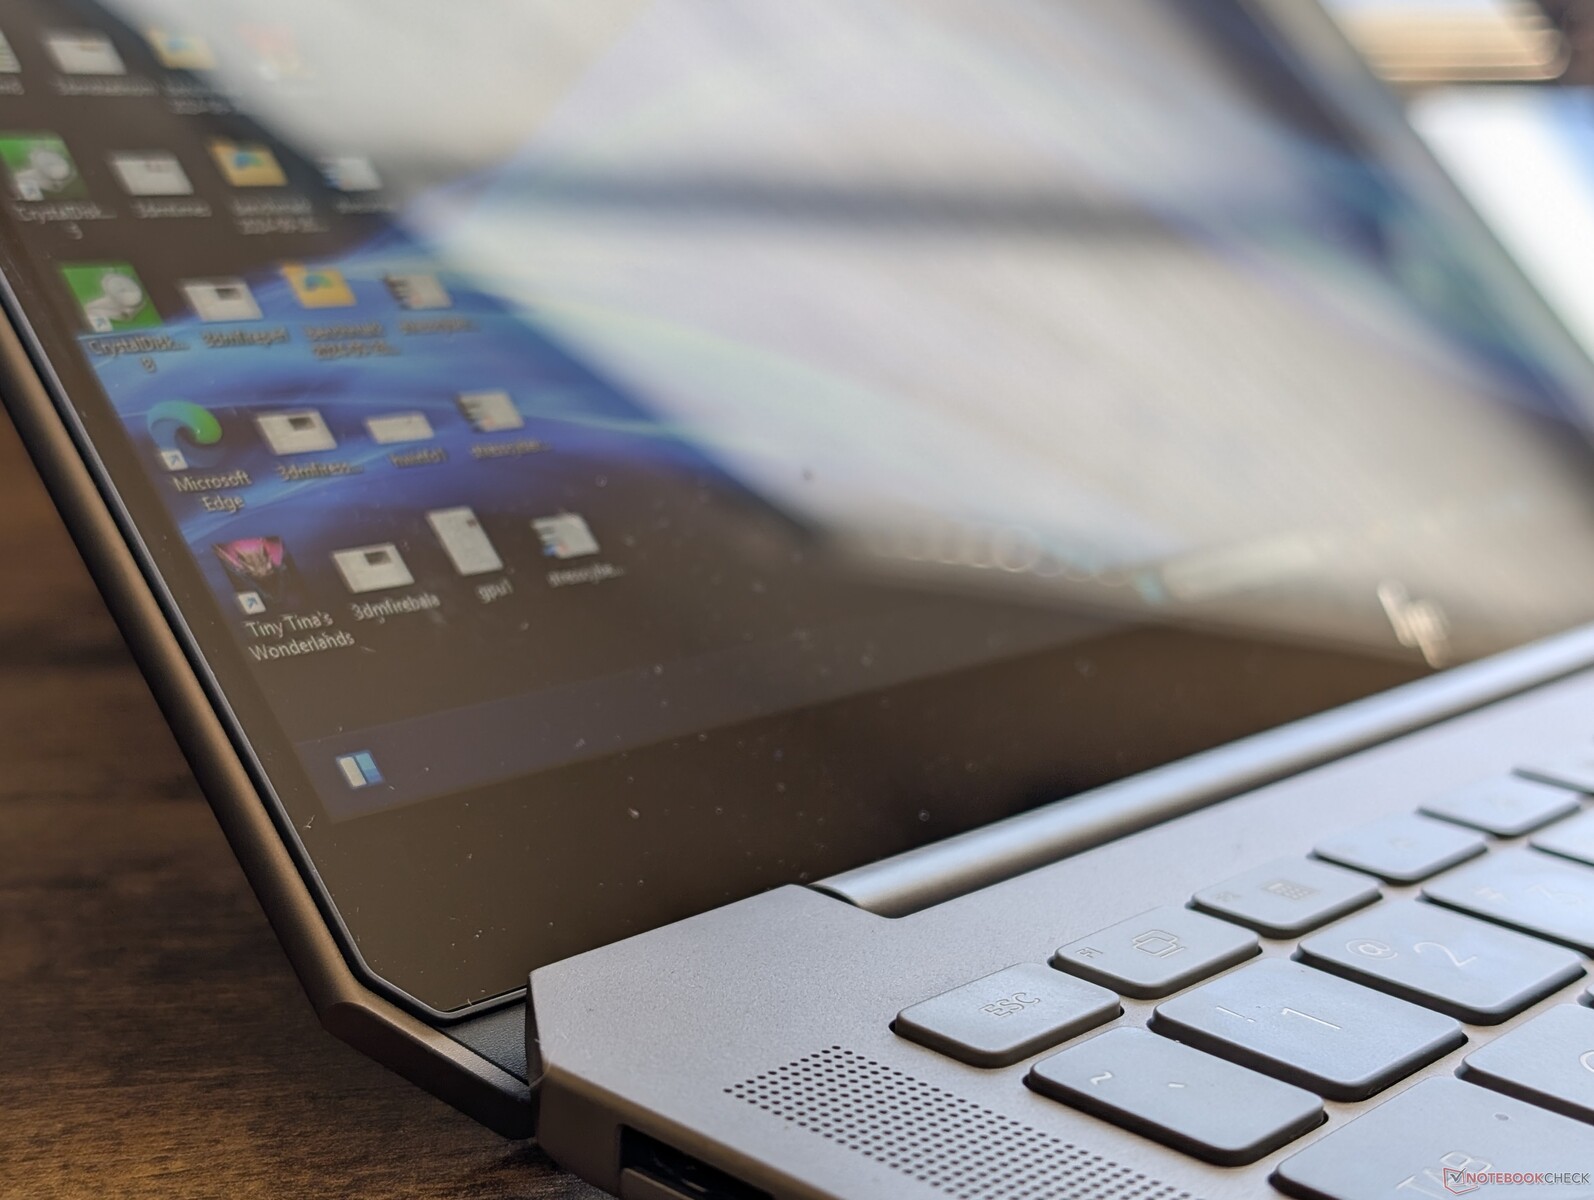
Wenn man ein Spectre x360 14 mit einem EliteBook 1040 kreuzt, erhält man das OmniBook Ultra 14. Das neue Modell orientiert sich stark an der Spectre-Serie, einschließlich des Tastaturdecks, der „diamantgeschliffenen“ hinteren Ecken und des Tastaturlayouts, während es die vertraute dunkelgraue Textur und die Metallmaterialien der meisten EliteBook-Notebooks übernimmt. Es hat somit mehr Gemeinsamkeiten mit HPs höherwertigen Modellen als mit günstigeren oder dickeren Varianten wie der Pavilion- oder Envy-Serie.
Die Gehäusesteifigkeit ist ausgezeichnet, mit minimalem Knarzen und Verziehen, wenn man versucht, das System zu verdrehen oder Druck auf seine Oberflächen ausübt. Der schwächste Bauteil ist jedoch das Scharnier, das beim Einstellen des Winkels zum Wippen neigt und sich bei größeren Öffnungswinkeln weniger stabil anfühlt.
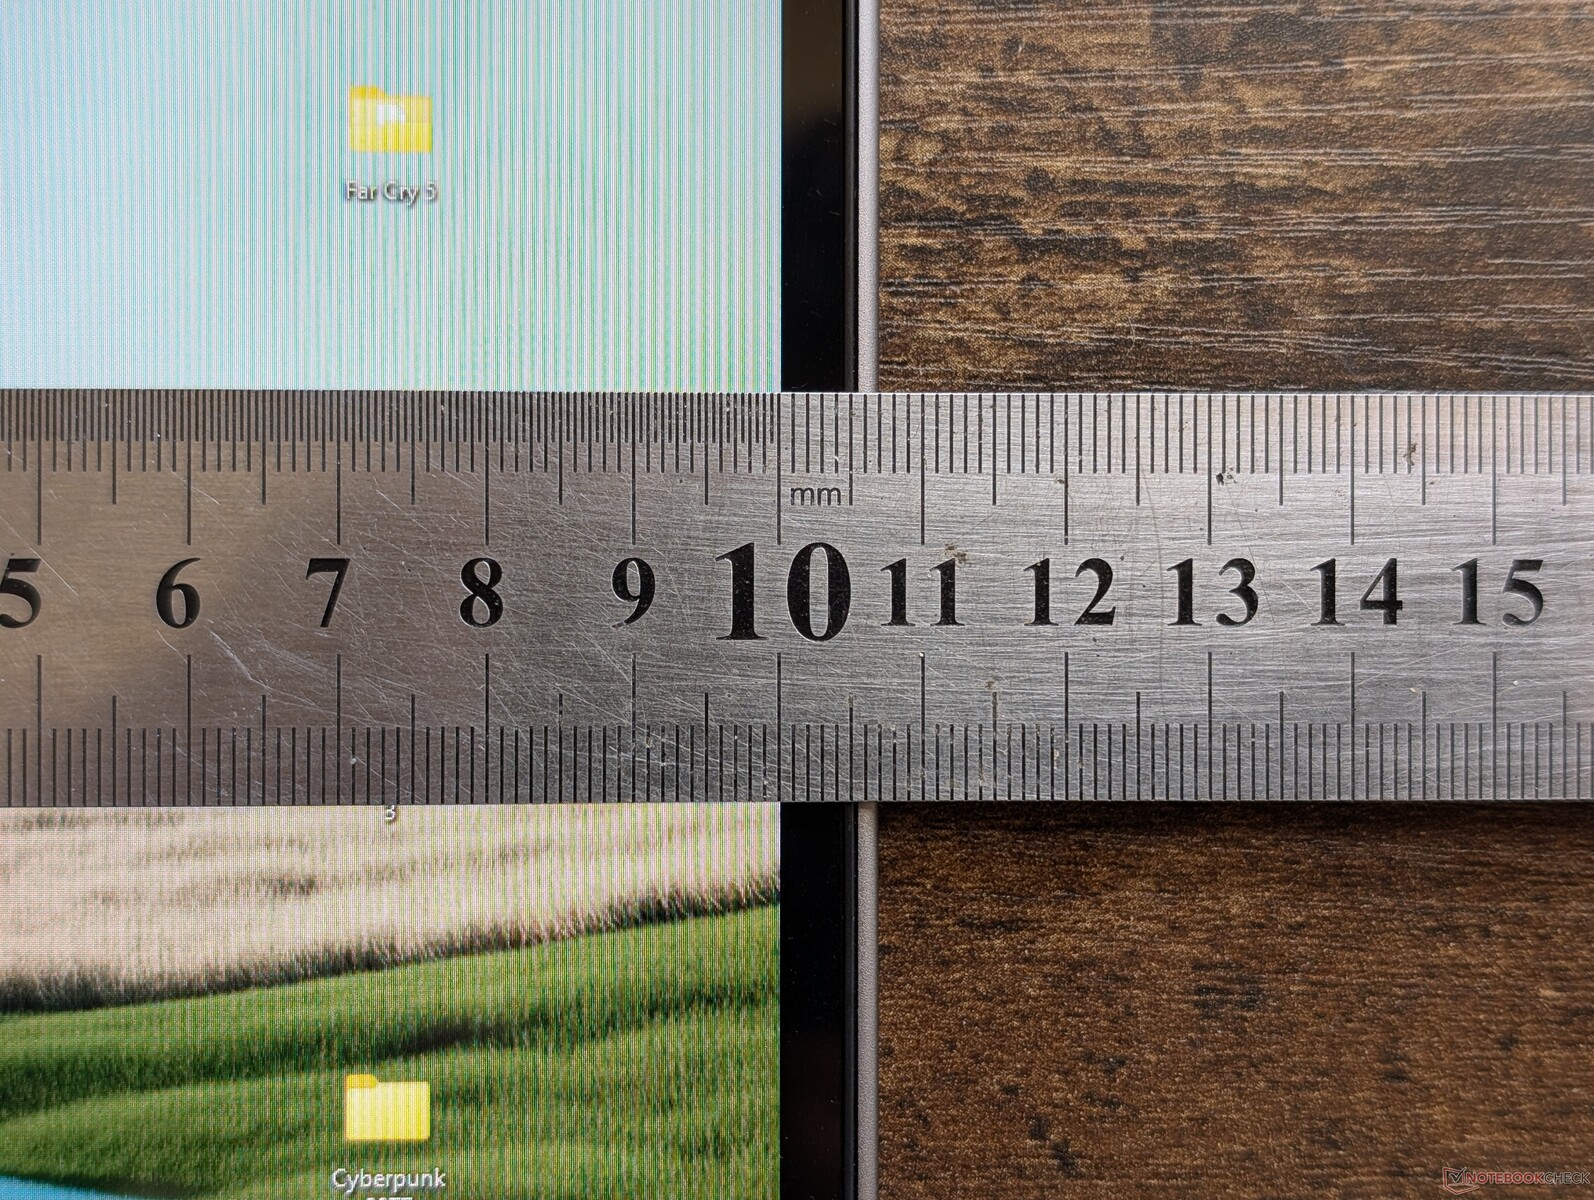
Das System wiegt ungefähr so viel wie das Spectre x360 14, hat jedoch eine etwas größere Stellfläche. Die größeren Abmessungen lassen sich auf die breiteren Einfassungen ober- und unterhalb des Bildschirms zurückführen.
Es ist erwähnenswert, dass das XPS 14 merklich schwerer ist, da es mit diskreten GPU-Optionen ausgestattet ist.
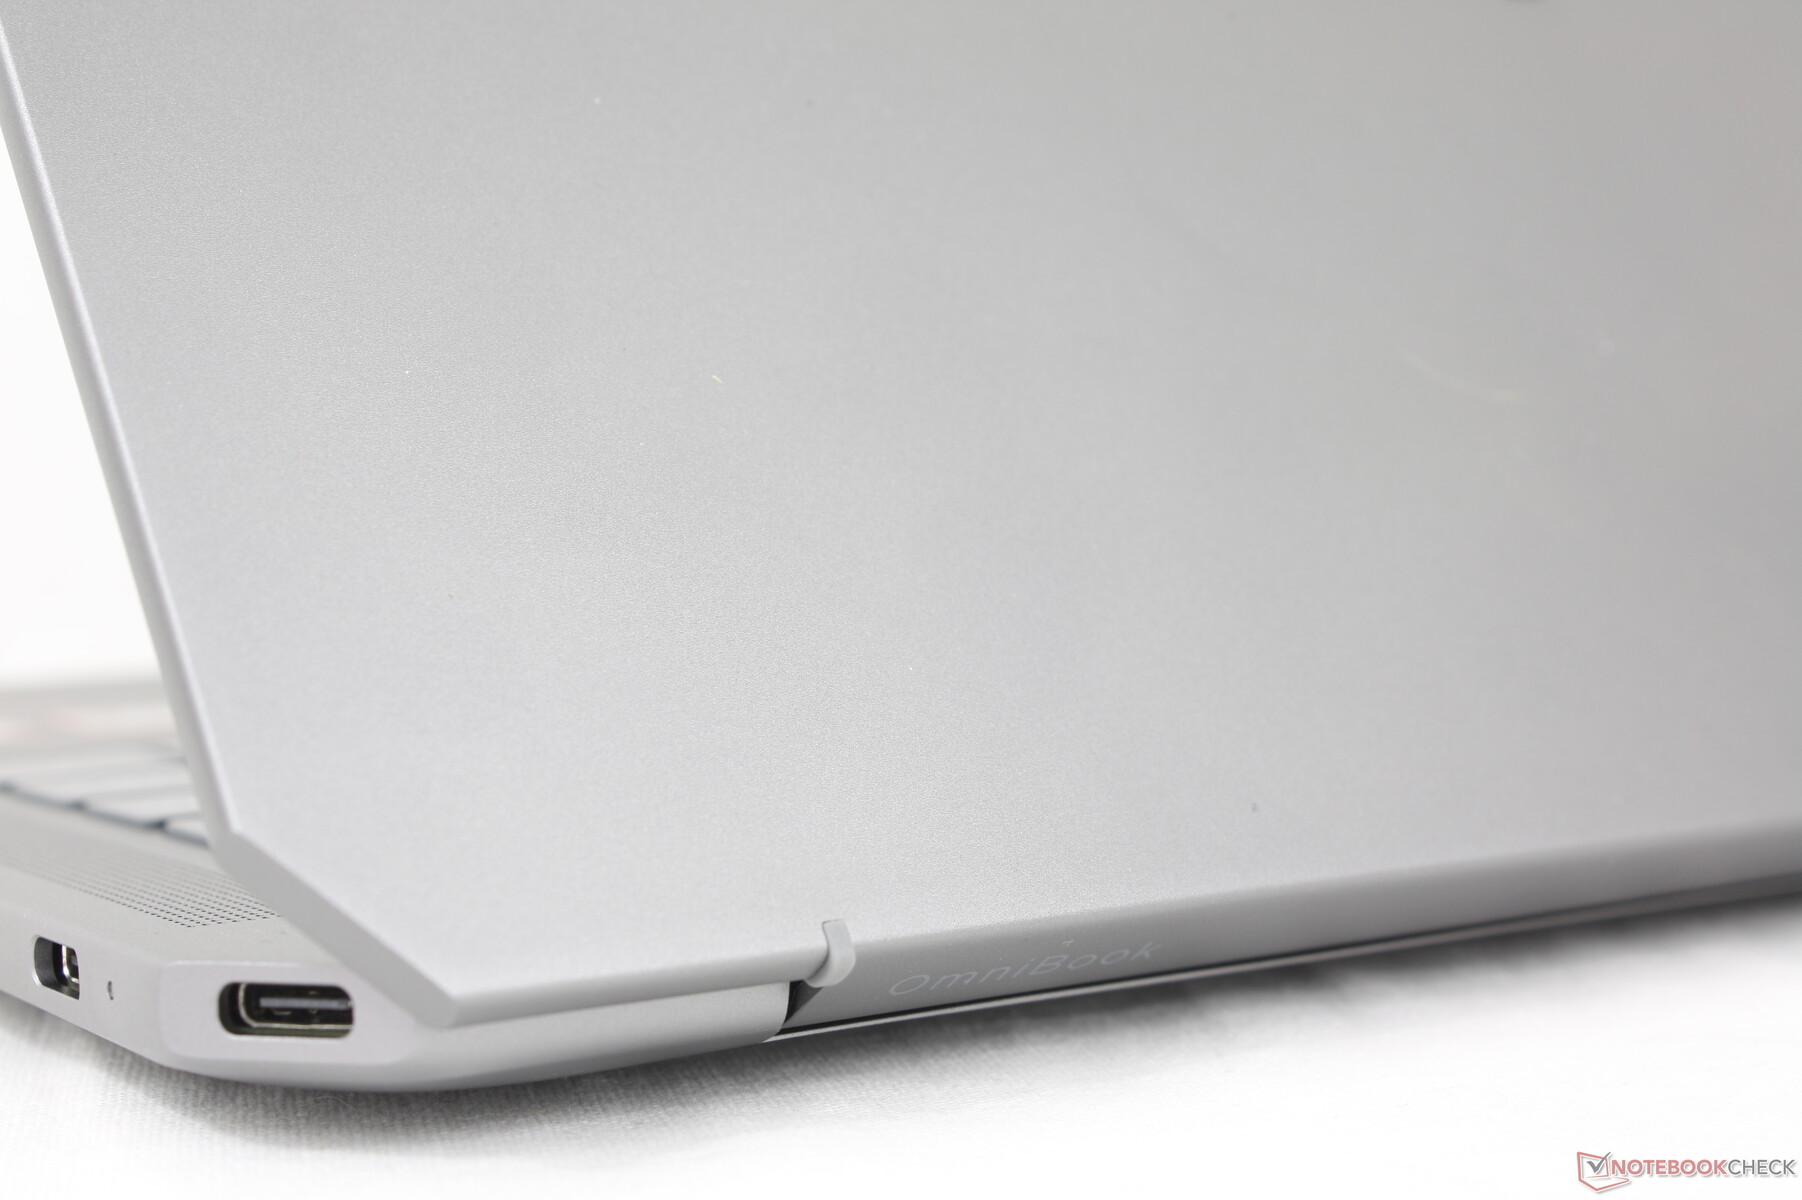

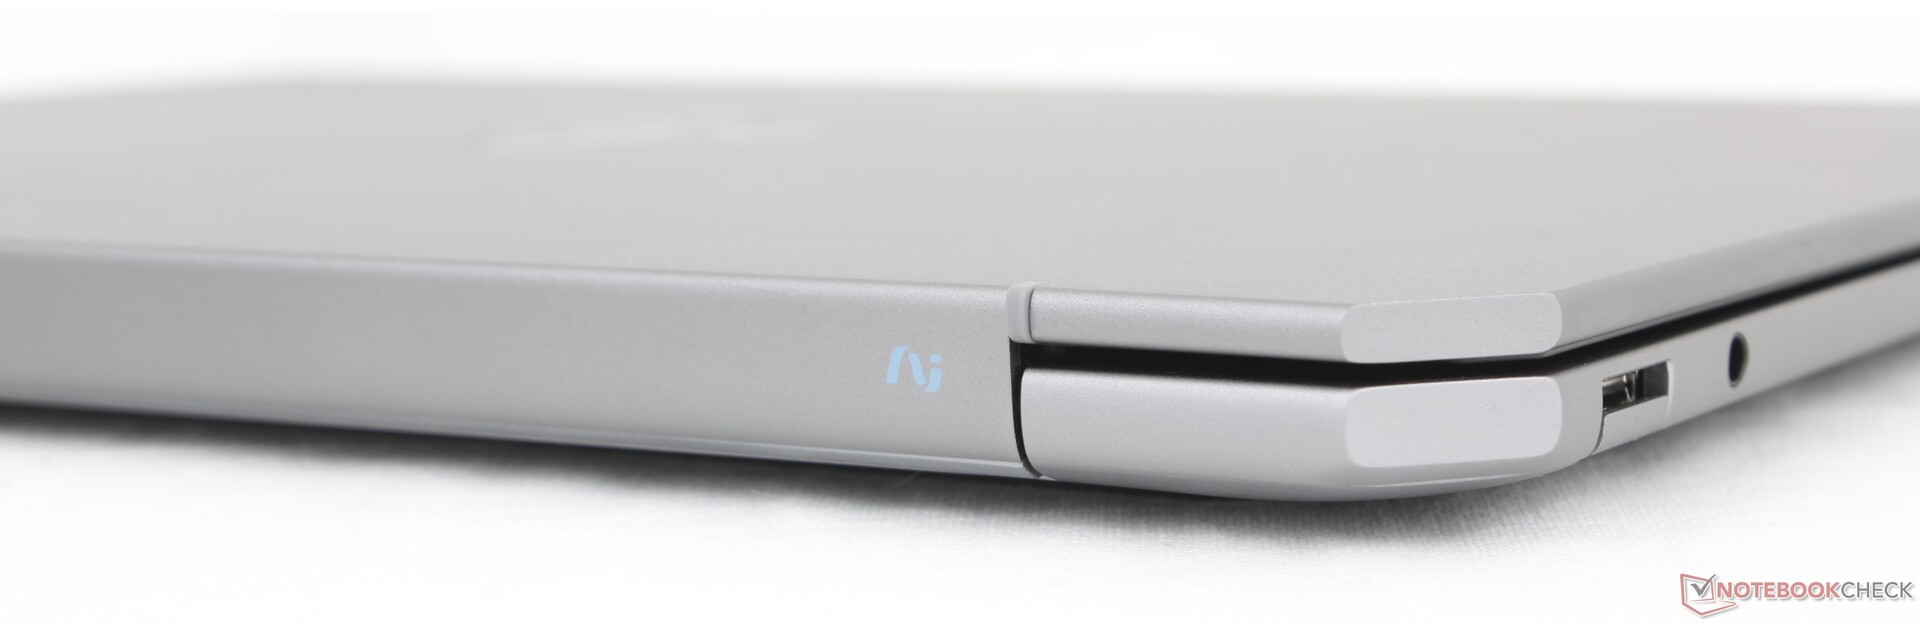
Ausstattung — AMD jetzt offiziell mit Thunderbolt 4
Die Anschlussmöglichkeiten sind auf die gleichen beschränkt wie beim Spectre x360 14. Alternativen wie das XPS 14 oder das Yoga Pro 7 14 G9 haben mehr USB-C Ports bzw. integriertes HDMI, aber wir schätzen den integrierten USB-A-Anschluss am OmniBook, da er bei Subnotebooks immer seltener zu finden ist.
Es hätte eine bessere Anordnung der Anschlüsse geben können. Insbesondere die beiden USB-C-Anschlüsse befinden sich beide auf der gleichen Seite des Systems, was bedeutet, dass Ladegeräte und Dockingstationen auf der gleichen Seite des Notebooks angeschlossen werden müssen. Im Vergleich dazu ist das Razer Blade 14 und XPS 14 haben USB-C-Anschlüsse auf beiden Seiten ihres jeweiligen Designs für mehr Flexibilität und Komfort.


Kommunikation
Das Mediatek Wi-Fi 7 MT7925-Modul unterstützt standardmäßig Wi-Fi 7 sowie Bluetooth 5.4. In Kombination mit unserem Wi-Fi 6E-Testrouter konnten wir stabile Geschwindigkeiten erreichen, ohne auf Verbindungsprobleme zu stoßen.
| Networking | |
| iperf3 transmit AXE11000 | |
| Lenovo Yoga Pro 7 14ASP G9 | |
| Asus Zenbook S 14 UX5406 | |
| Dell XPS 14 2024 OLED | |
| HP Spectre x360 14-eu0078ng | |
| Samsung Galaxy Book4 Edge 14 | |
| HP OmniBook Ultra 14 | |
| iperf3 receive AXE11000 | |
| Asus Zenbook S 14 UX5406 | |
| Samsung Galaxy Book4 Edge 14 | |
| Lenovo Yoga Pro 7 14ASP G9 | |
| Dell XPS 14 2024 OLED | |
| HP Spectre x360 14-eu0078ng | |
| HP OmniBook Ultra 14 | |
| iperf3 transmit AXE11000 6GHz | |
| HP OmniBook Ultra 14 | |
| Samsung Galaxy Book4 Edge 14 | |
| iperf3 receive AXE11000 6GHz | |
| HP OmniBook Ultra 14 | |
| Samsung Galaxy Book4 Edge 14 | |
Webcam
HP verbaut in vielen seiner Laptops eine der höchstauflösenden Webcams auf dem Markt. Die hier verwendete 9-Megapixel-Webcam bietet eine bessere Bildqualität als bei den meisten Konkurrenten, aber das geht, wie bereits erwähnt, auf Kosten eines dickeren oberen Displayrahmens. Sowohl IR-Technologie als auch ein physischer Kameraverschluss sind standardmäßig integriert.
Leider bleibt die Videoqualität trotz der hohen Megapixel-Anzahl auf eine Auflösung von 1440p bei 30 FPS beschränkt.


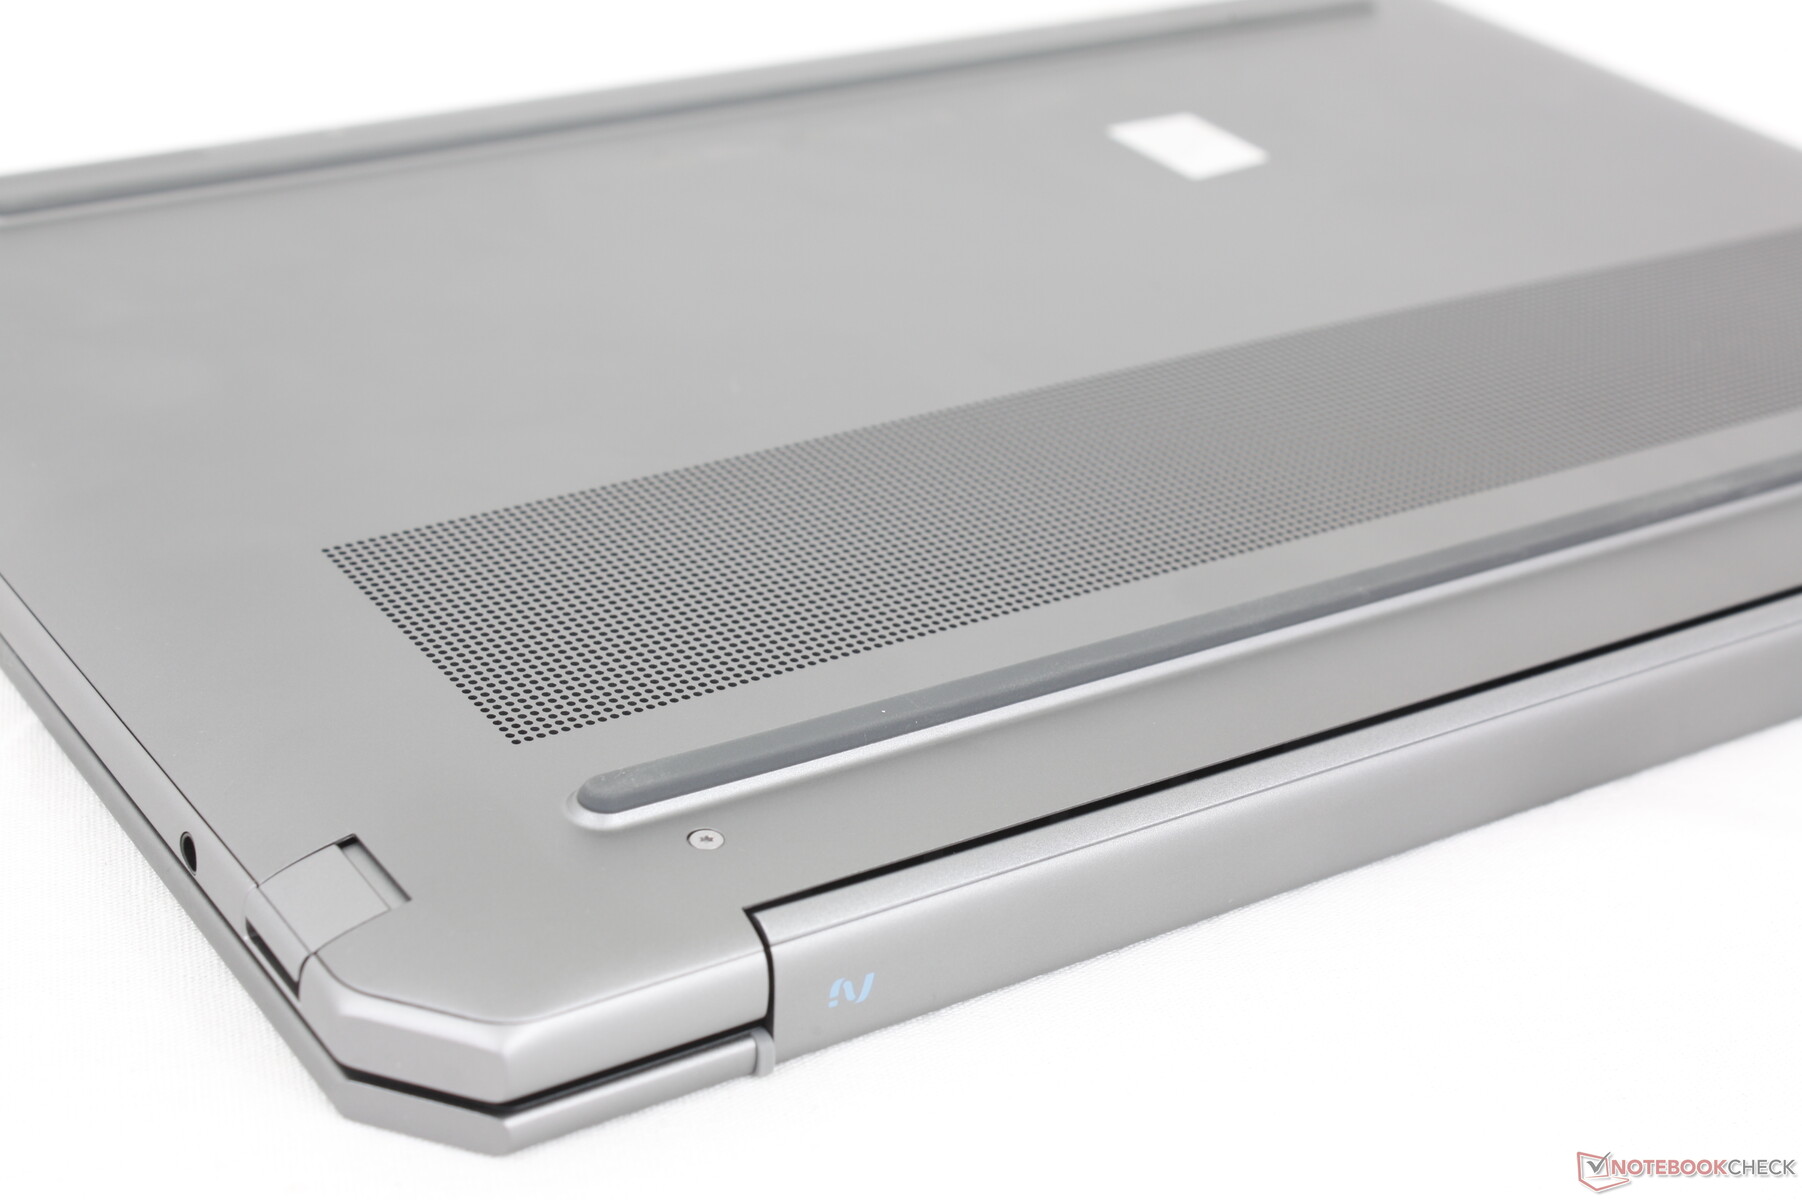
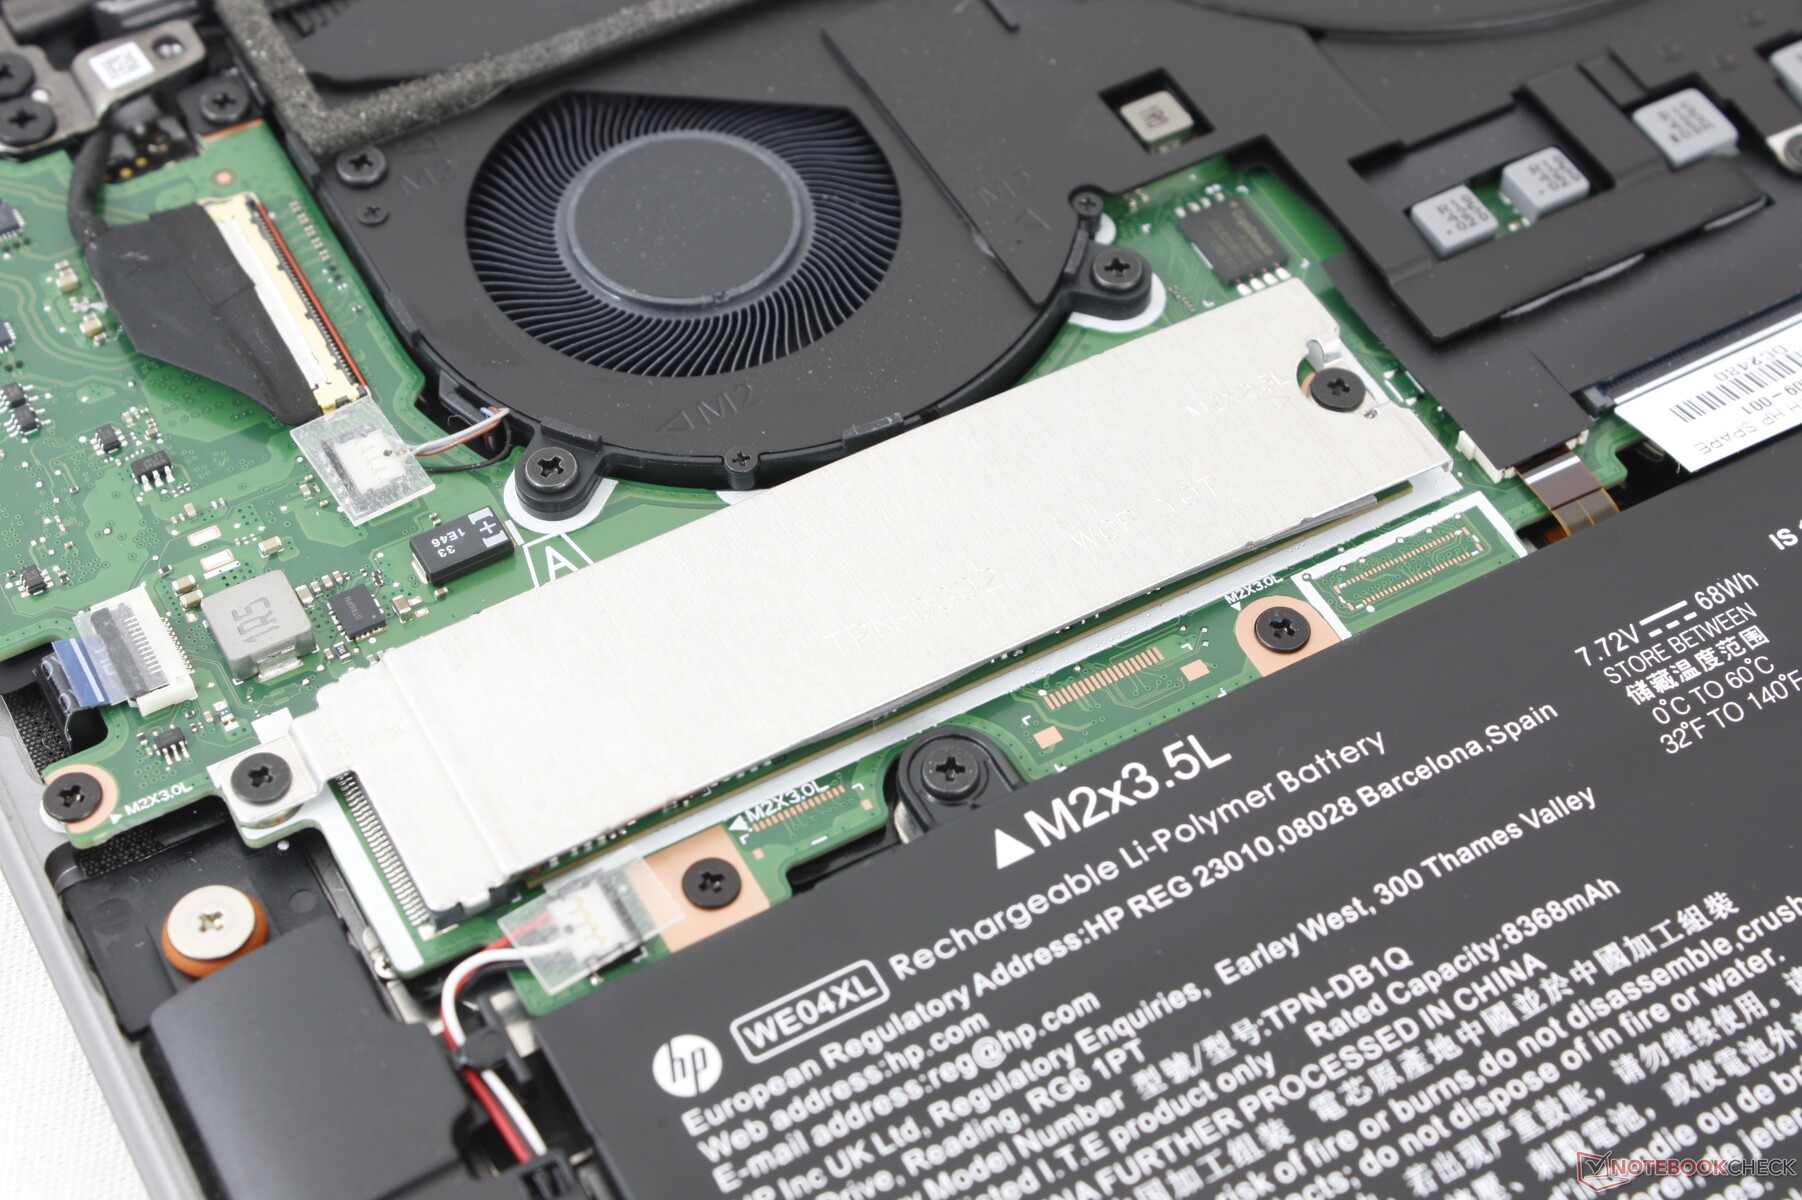
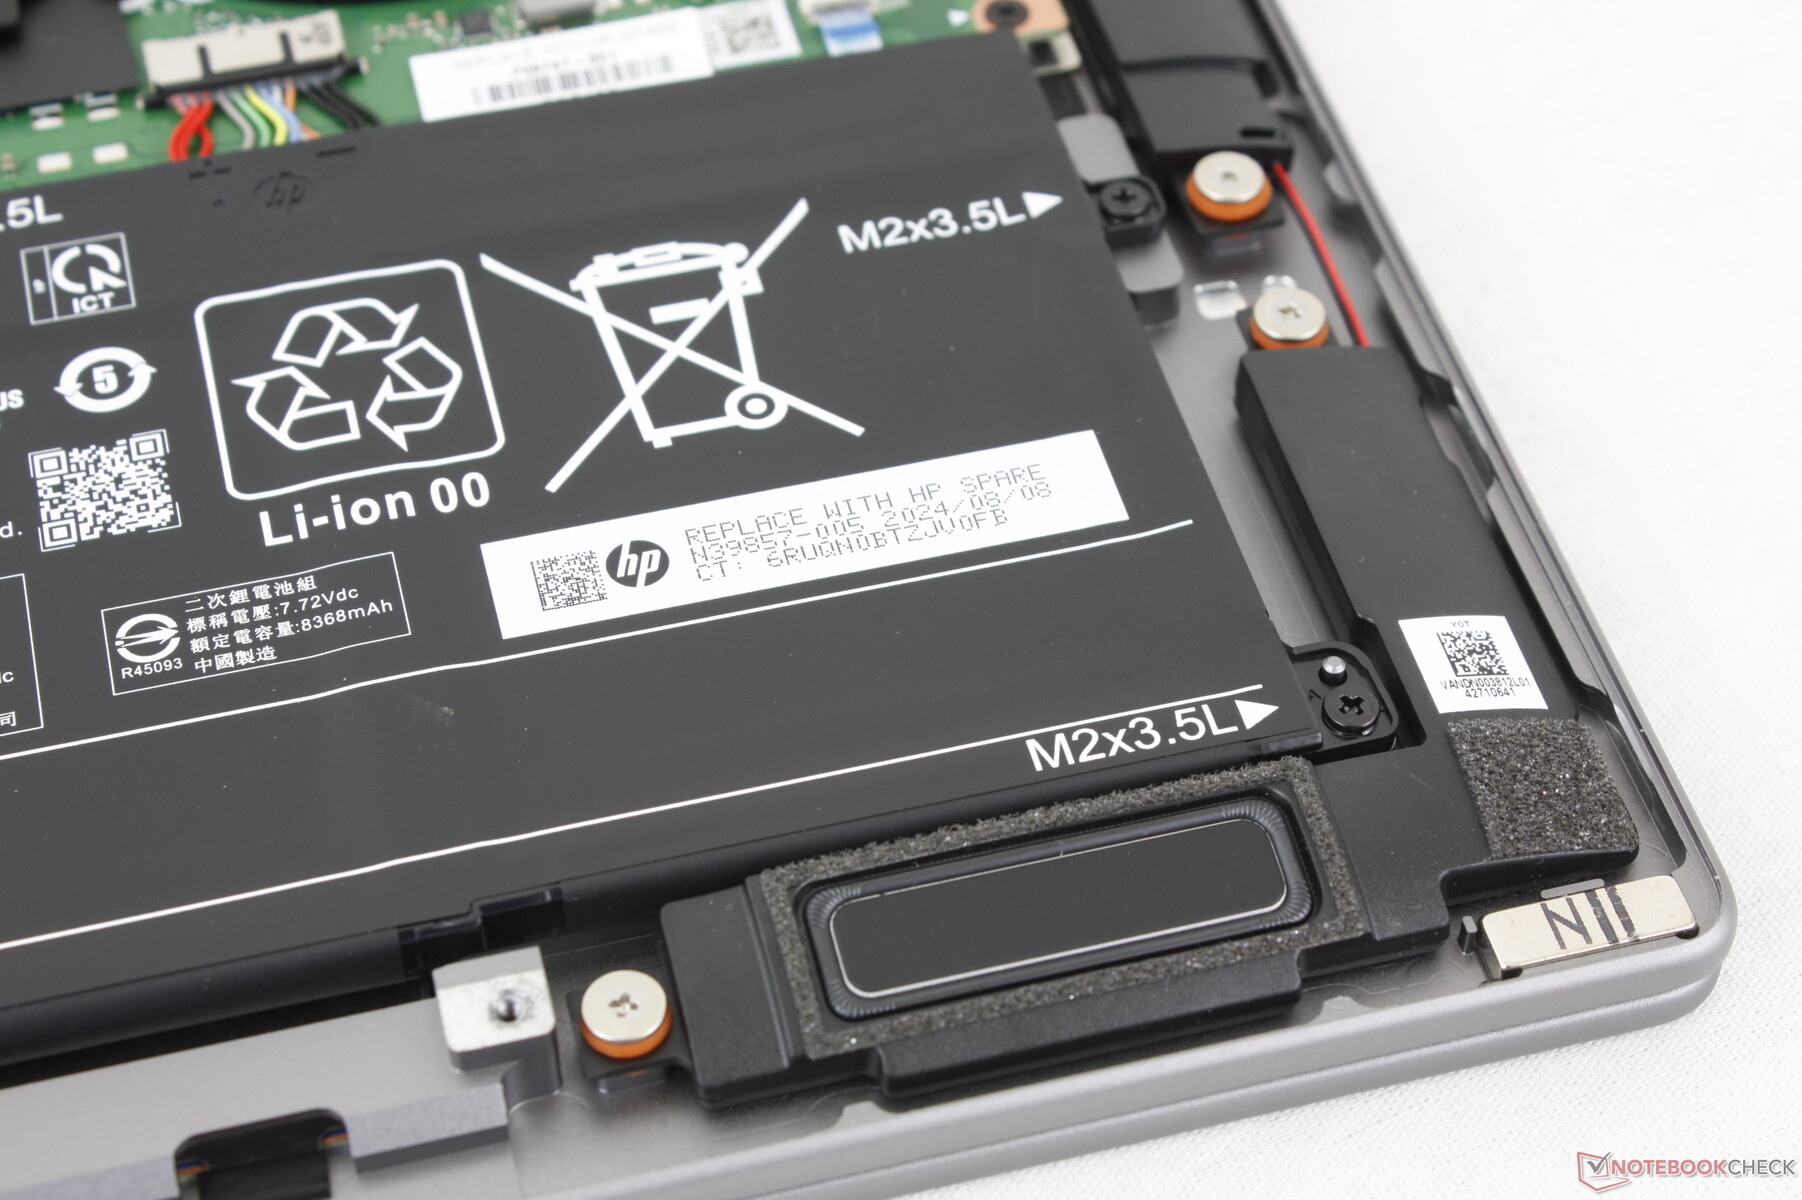
Wartung
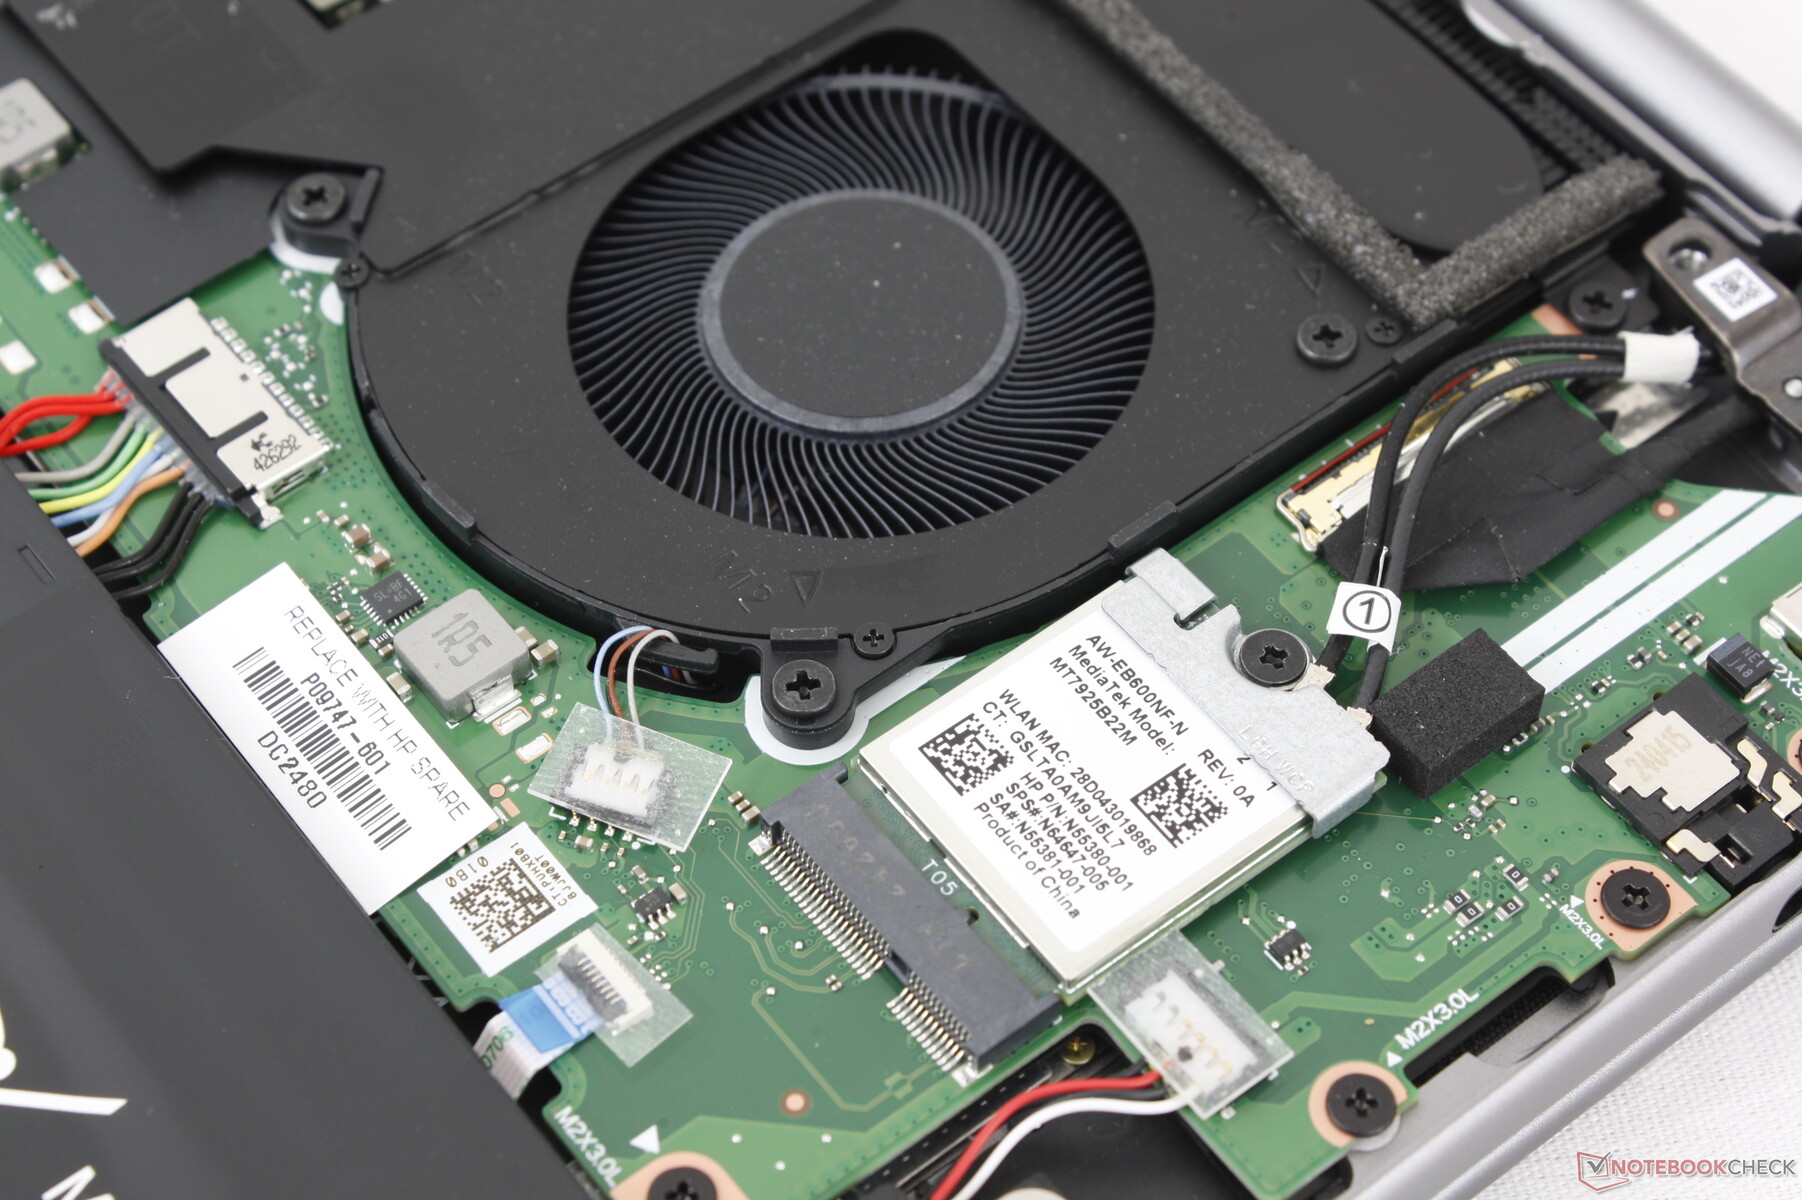
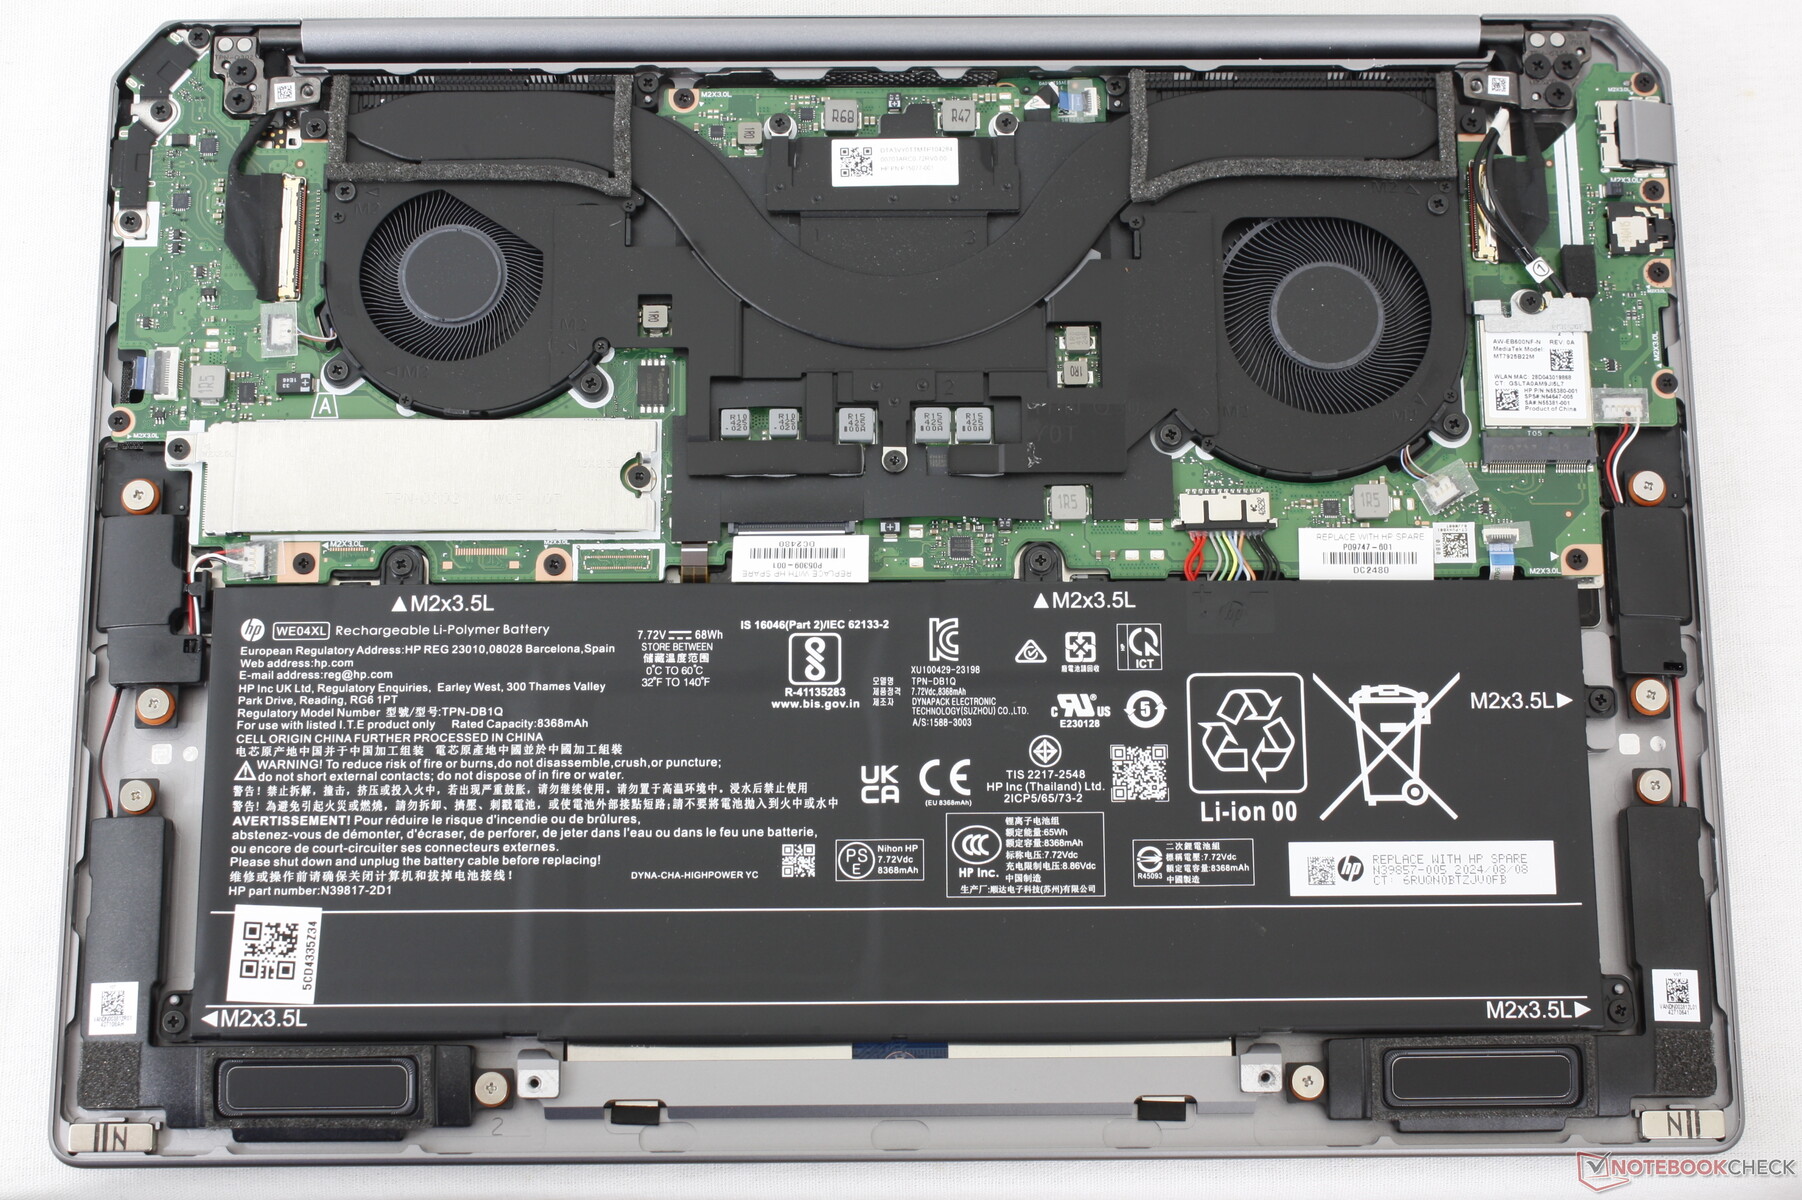
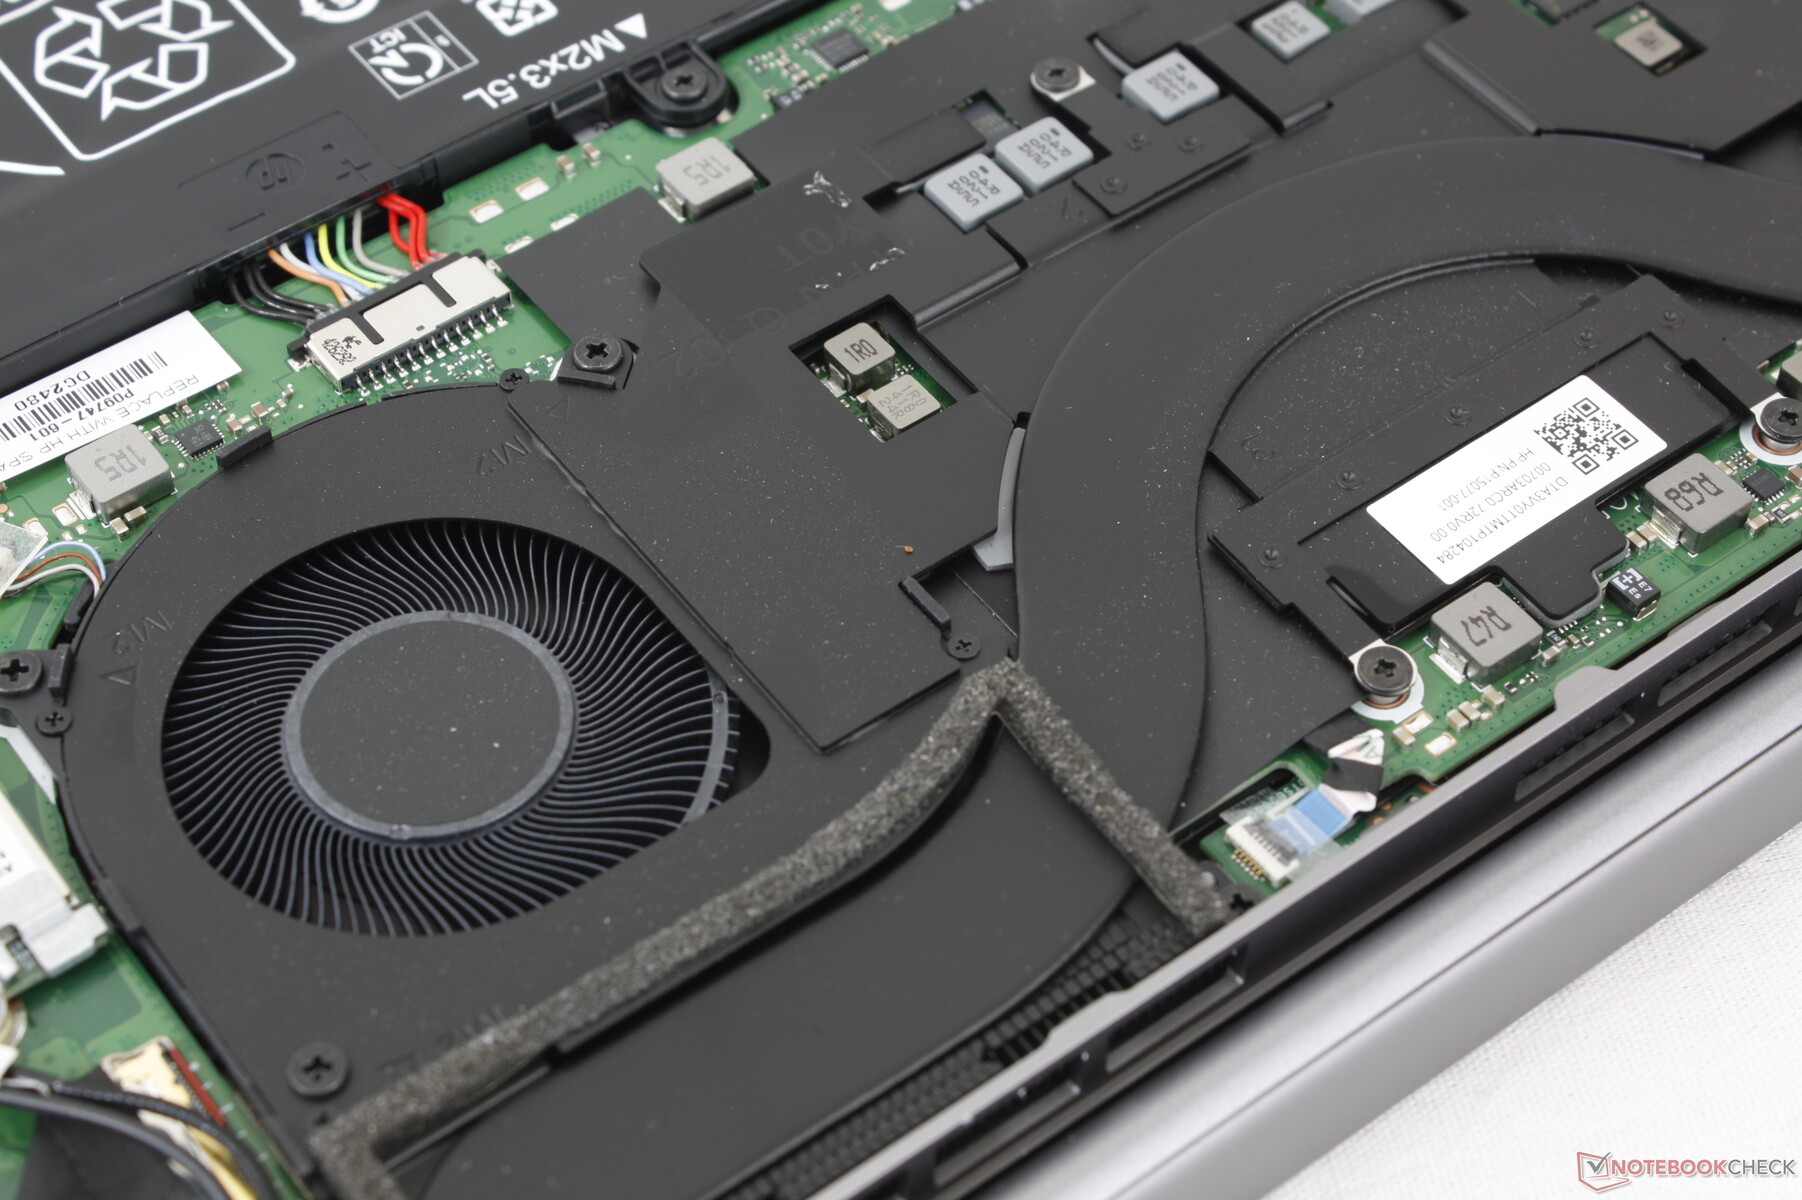
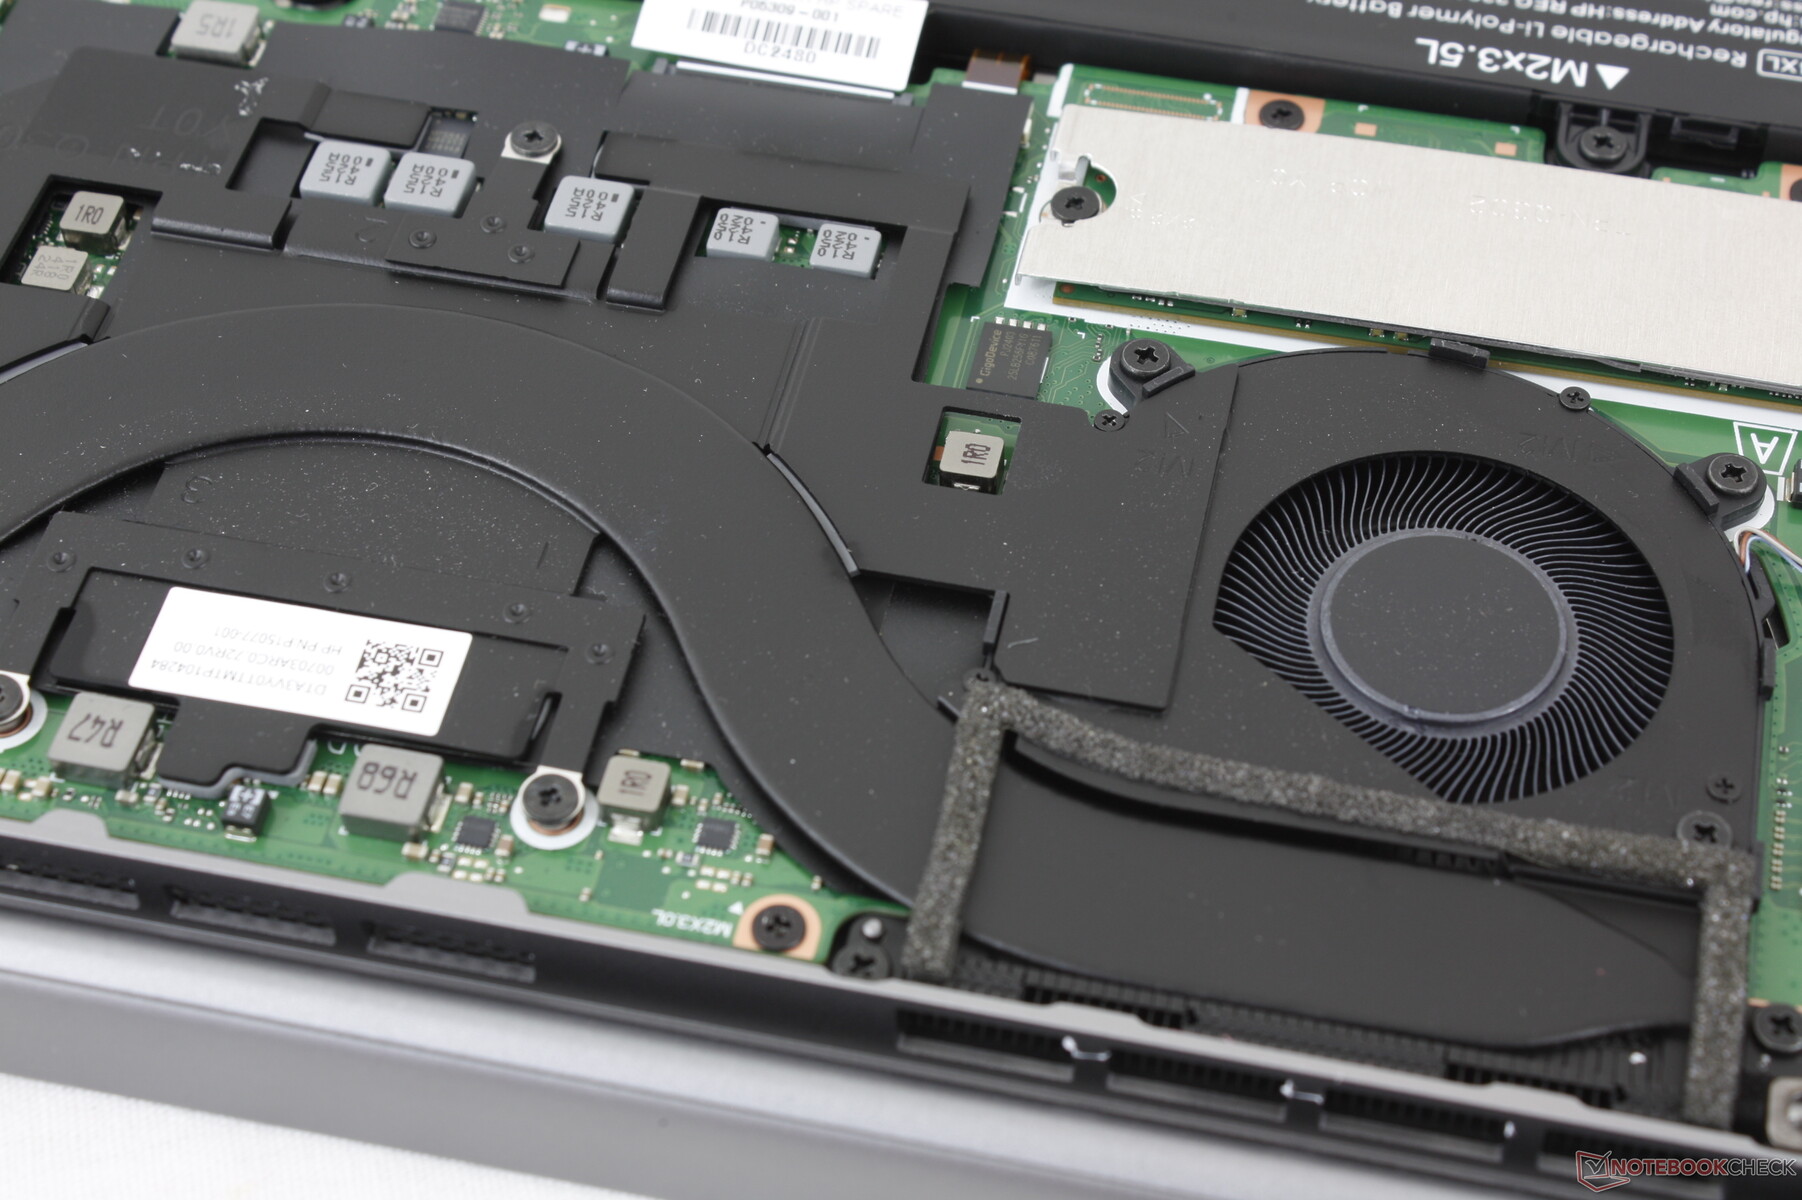
Die Bodenplatte ist mit nur vier Torx-Schrauben befestigt, um die Wartung zu erleichtern. Es wird empfohlen, eine Plastikkarte oder eine harte Kante zu verwenden, um die Ränder des Bodens vorsichtig zu lösen, da diese fest mit der Basis verbunden sind.
Das Innere des OmniBook Ultra 14 unterscheidet sich trotz vieler äußerer Ähnlichkeiten stark vom Spectre x360 14. Die Kühllösung zum Beispiel ist jetzt symmetrisch und entspricht damit eher den meisten anderen Subnotebooks der oberen Preisklasse. Die aufrüstbaren Optionen sind jedoch immer noch dieselben, einschließlich des einzelnen M.2 2280 SSD-Slots, des herausnehmbaren M.2 WLAN-Moduls und des verlöteten RAMs.
Nachhaltigkeit
Ein hoher Prozentsatz der Materialien, die für die Herstellung des OmniBook Ultra 14 verwendet werden, stammt aus post-industriellem Recycling. Dazu gehören bis zu 50 % Kunststoff für die Tastenkappen und die Schere, 45 % Kunststoff für den Bildschirmrand und die Lautsprecher, 85 % Metall für die äußere Abdeckung und das Tastaturdeck sowie 50 % Metall für die untere Abdeckung.
Die plastikfreie Verpackung besteht zu 100 % aus nachhaltig beschafften Materialien.
Zubehör und Garantie
Im Karton befinden sich, abgesehen vom üblichen Netzteil und den Unterlagen, keine weiteren Extras. Die Garantie erstreckt sich in Deutschland über 24 Monate.
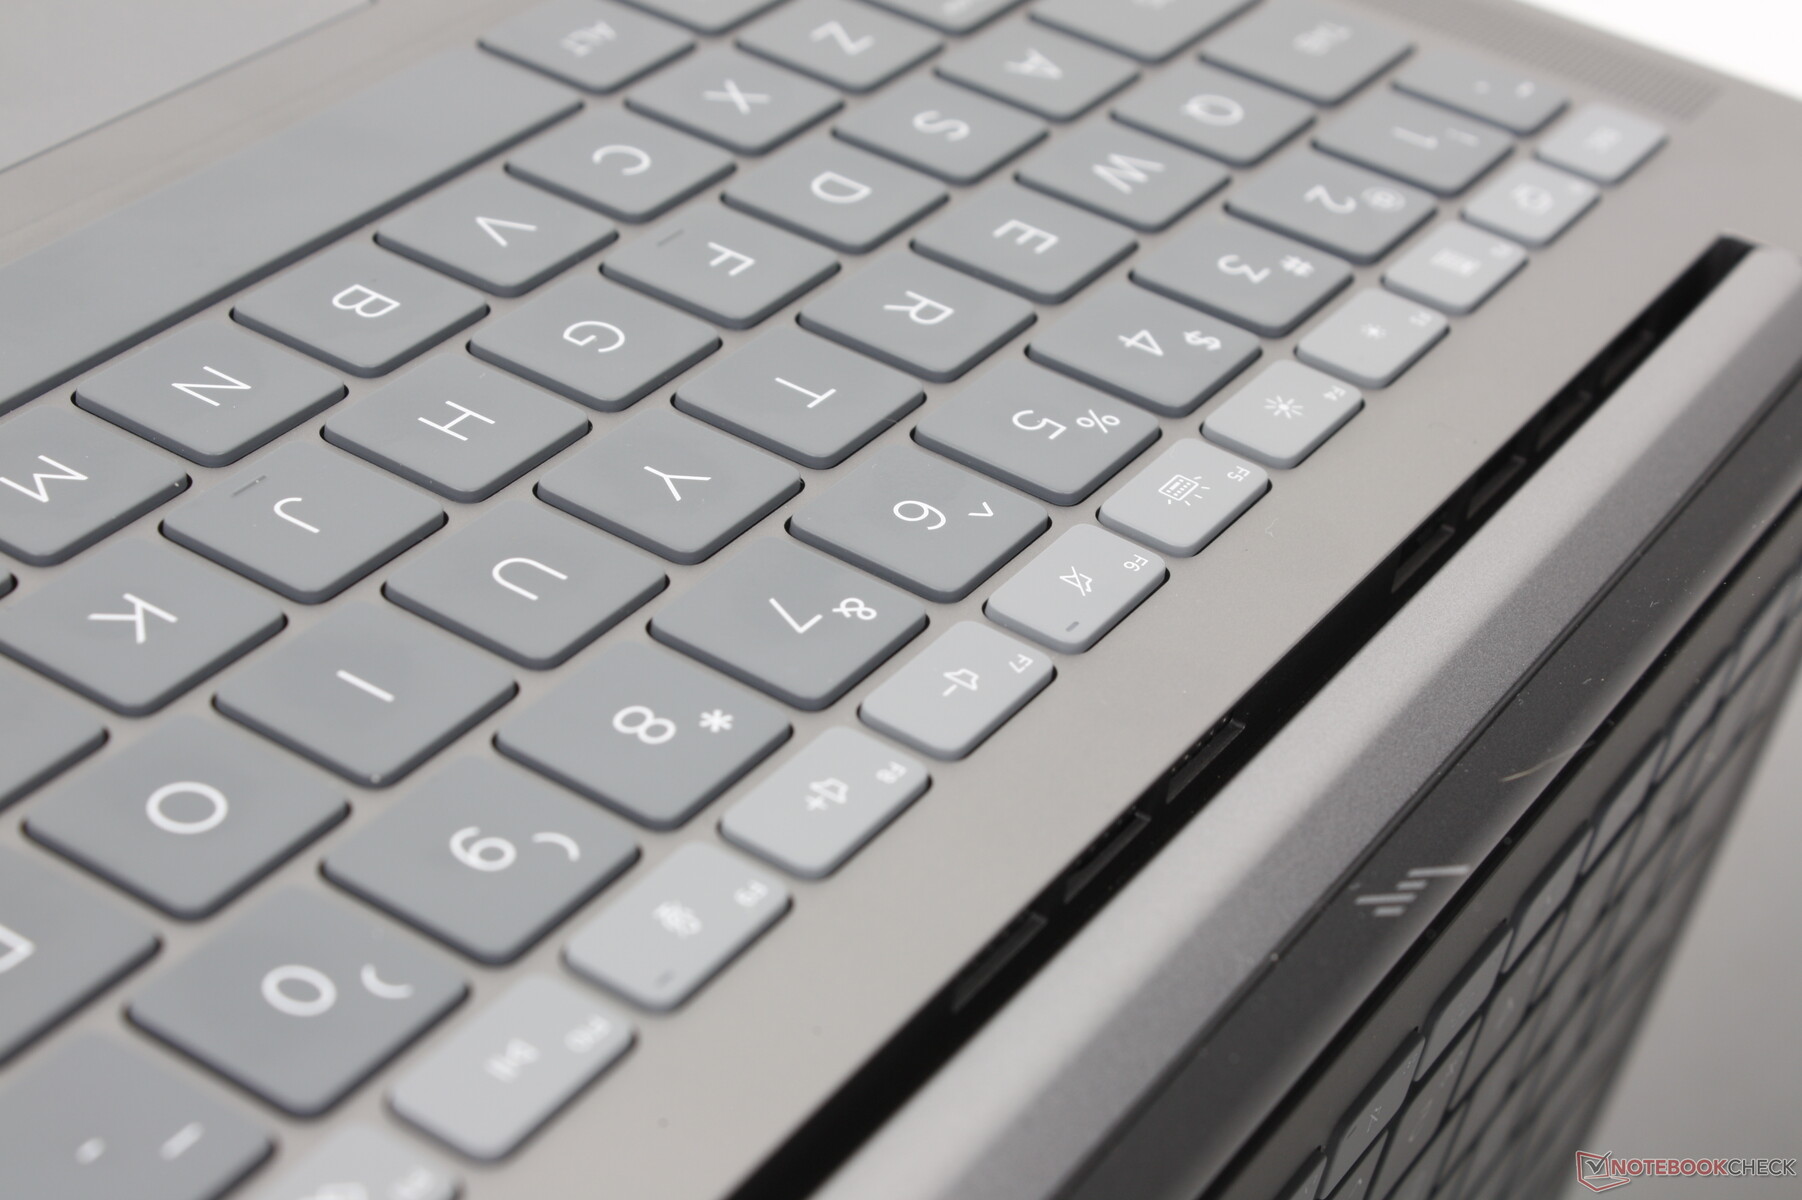
Eingabegeräte - Vertraute Erfahrung
Tastatur
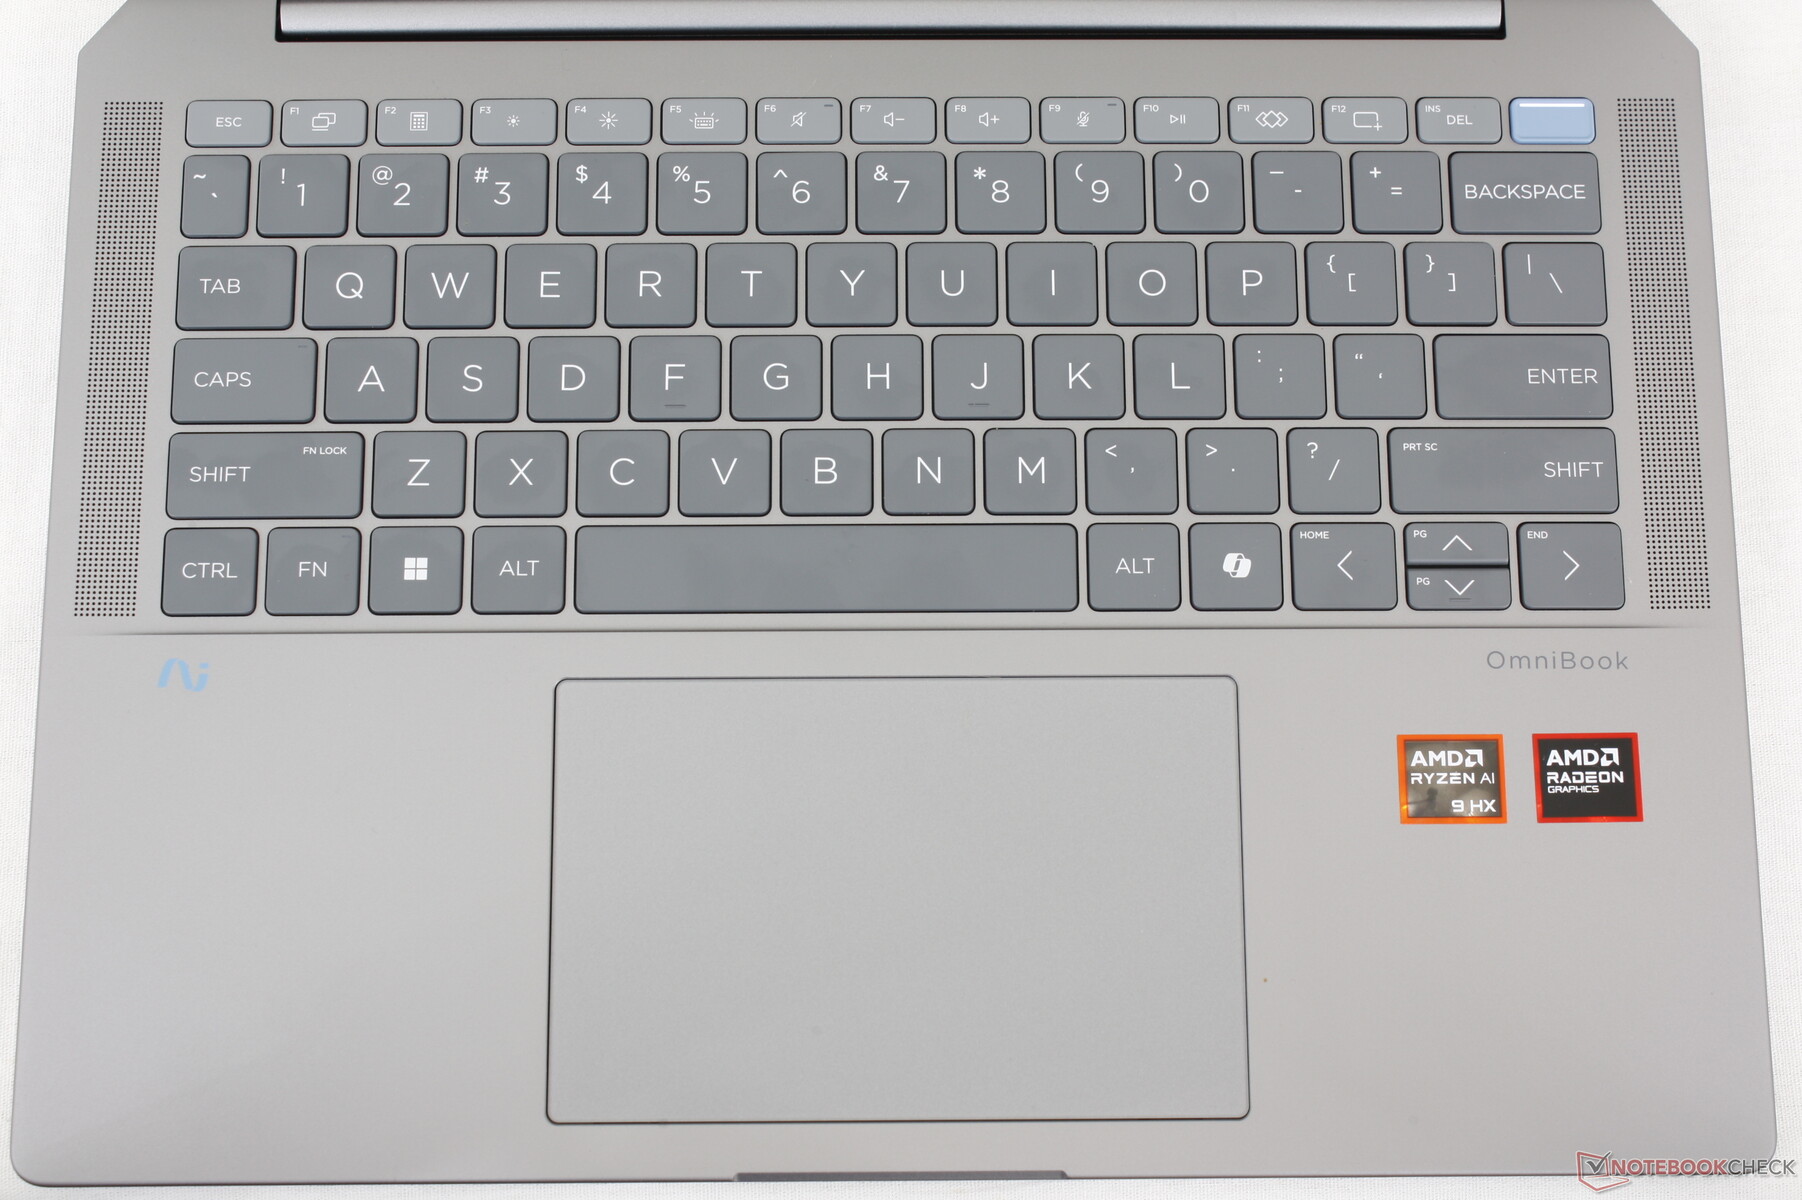
Das Tippen auf dem OmniBook Ultra 14 fühlt sich sehr ähnlich an wie das Tippen auf dem Spectre x360 14, da beide das gleiche Layout mit ähnlichen Tasten haben. Das ist nicht unbedingt etwas Schlechtes, denn die Tastaturen der High-End-Modelle von HP, wie dem Spectre oder EliteBook, sind in der Regel klickfreudiger und bieten ein schärferes Feedback als die meisten anderen Subnotebooks, was zu einem befriedigenderen Tipperlebnis führt. Wir schätzen es, dass HP etwas Vertrautes anbietet und nicht etwas Eigenartiges, wie bei der umstrittenen Tastatur des XPS 14.
Zu den negativen Aspekten der Tastatur gehören die beengten Pfeiltasten und das Fehlen einer programmierbaren Taste, über die bestimmte EliteBooks verfügen.
Touchpad
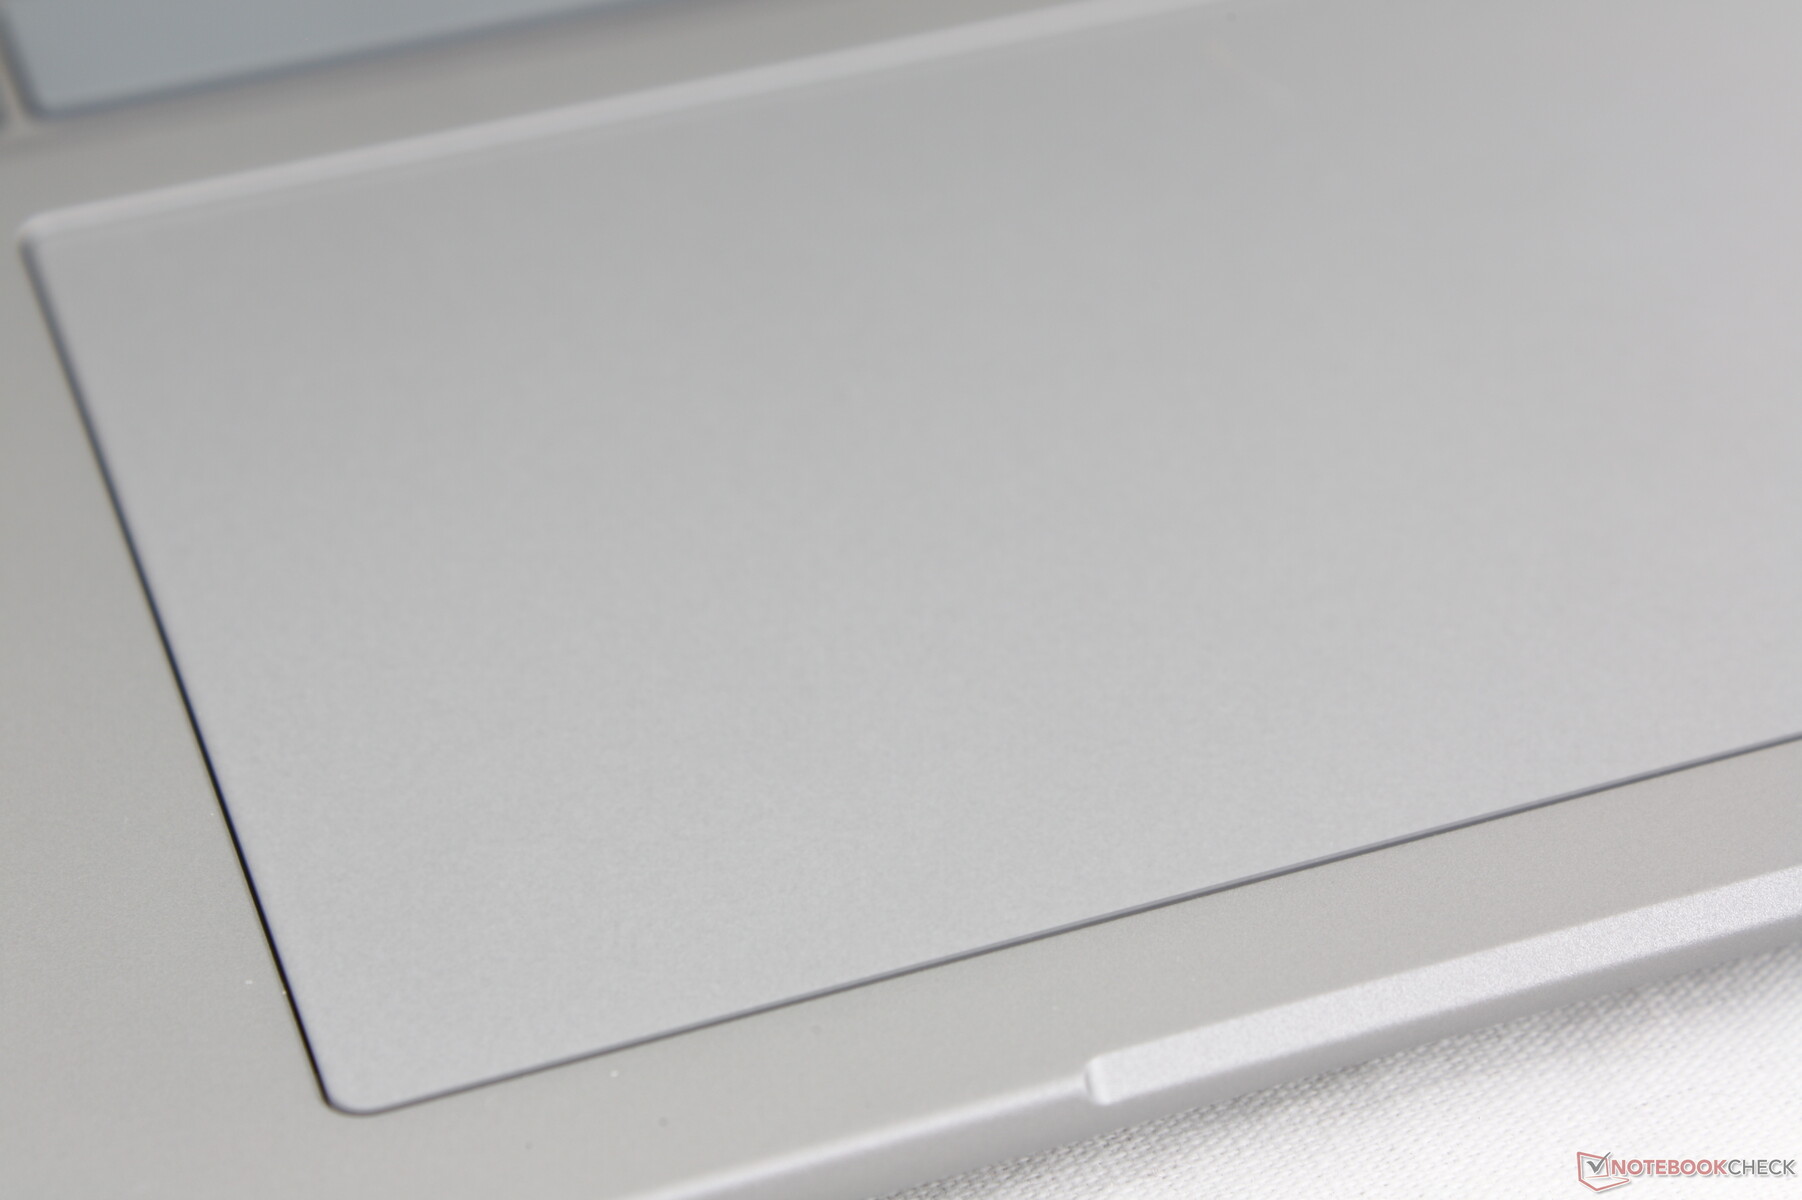
Das Clickpad ist etwas kleiner als beim konkurrierenden Yoga Pro 7 14 G9 (12,5 x 8 cm vs. 13,5 x 8 cm). Es ist dennoch geräumig für die Bildschirmgröße und bietet ein etwas festeres und klickfreudigeres Feedback als erwartet.

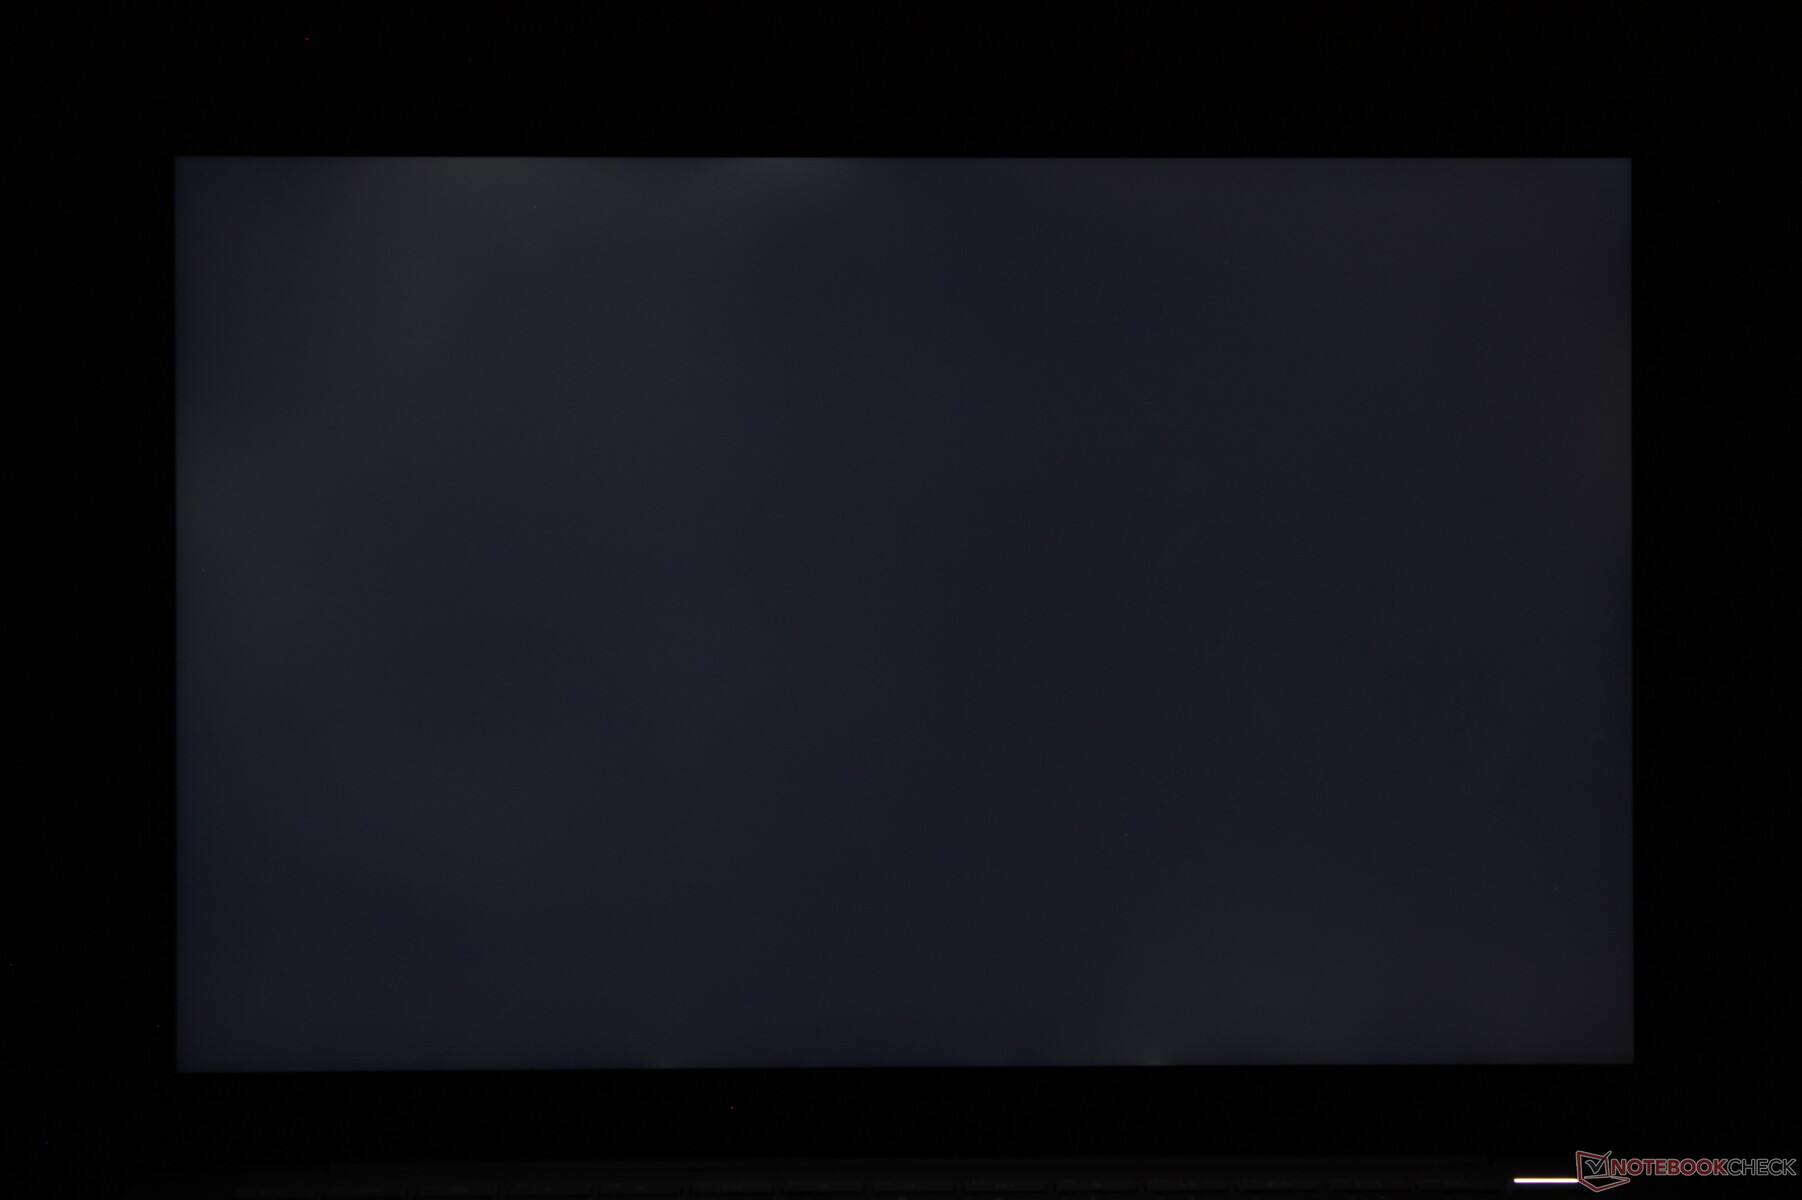
Display — Nur 60 Hz IPS
Interessanterweise wird das OmniBook Ultra 14 mit einem IPS-Display ausgeliefert, während die meisten anderen 14-Zoll-Subnotebooks in dieser Preisklasse standardmäßig mit einem OLED-Display ausgestattet sind. Sogar das Snapdragon-betriebene OmniBook X 14 wird mit OLED ausgeliefert, wodurch das AMD-betriebene OmniBook Ultra 14 wie ein schlechter Daumen aus der Masse heraussticht, da es weder P3-Farben noch extrem tiefen Schwarzwerte oder eine hohe Bildwiederholrate bietet. Diese Nachteile kennzeichnen ein Mittelklasse-Panel in einem ansonsten hochwertigen HP-Gerät.
Der einzige Vorteil, der für das OmniBook Ultra 14 spricht, ist vielleicht die Unterstützung von FreeSync. Im Vergleich zu anderen Subnotebooks, bei denen die FreeSync-Unterstützung relativ unüblich ist, sorgt dies dafür, dass das Spielen auf dem System flüssiger verläuft.

| |||||||||||||||||||||||||
Ausleuchtung: 92 %
Helligkeit Akku: 359.5 cd/m²
Kontrast: 1331:1 (Schwarzwert: 0.27 cd/m²)
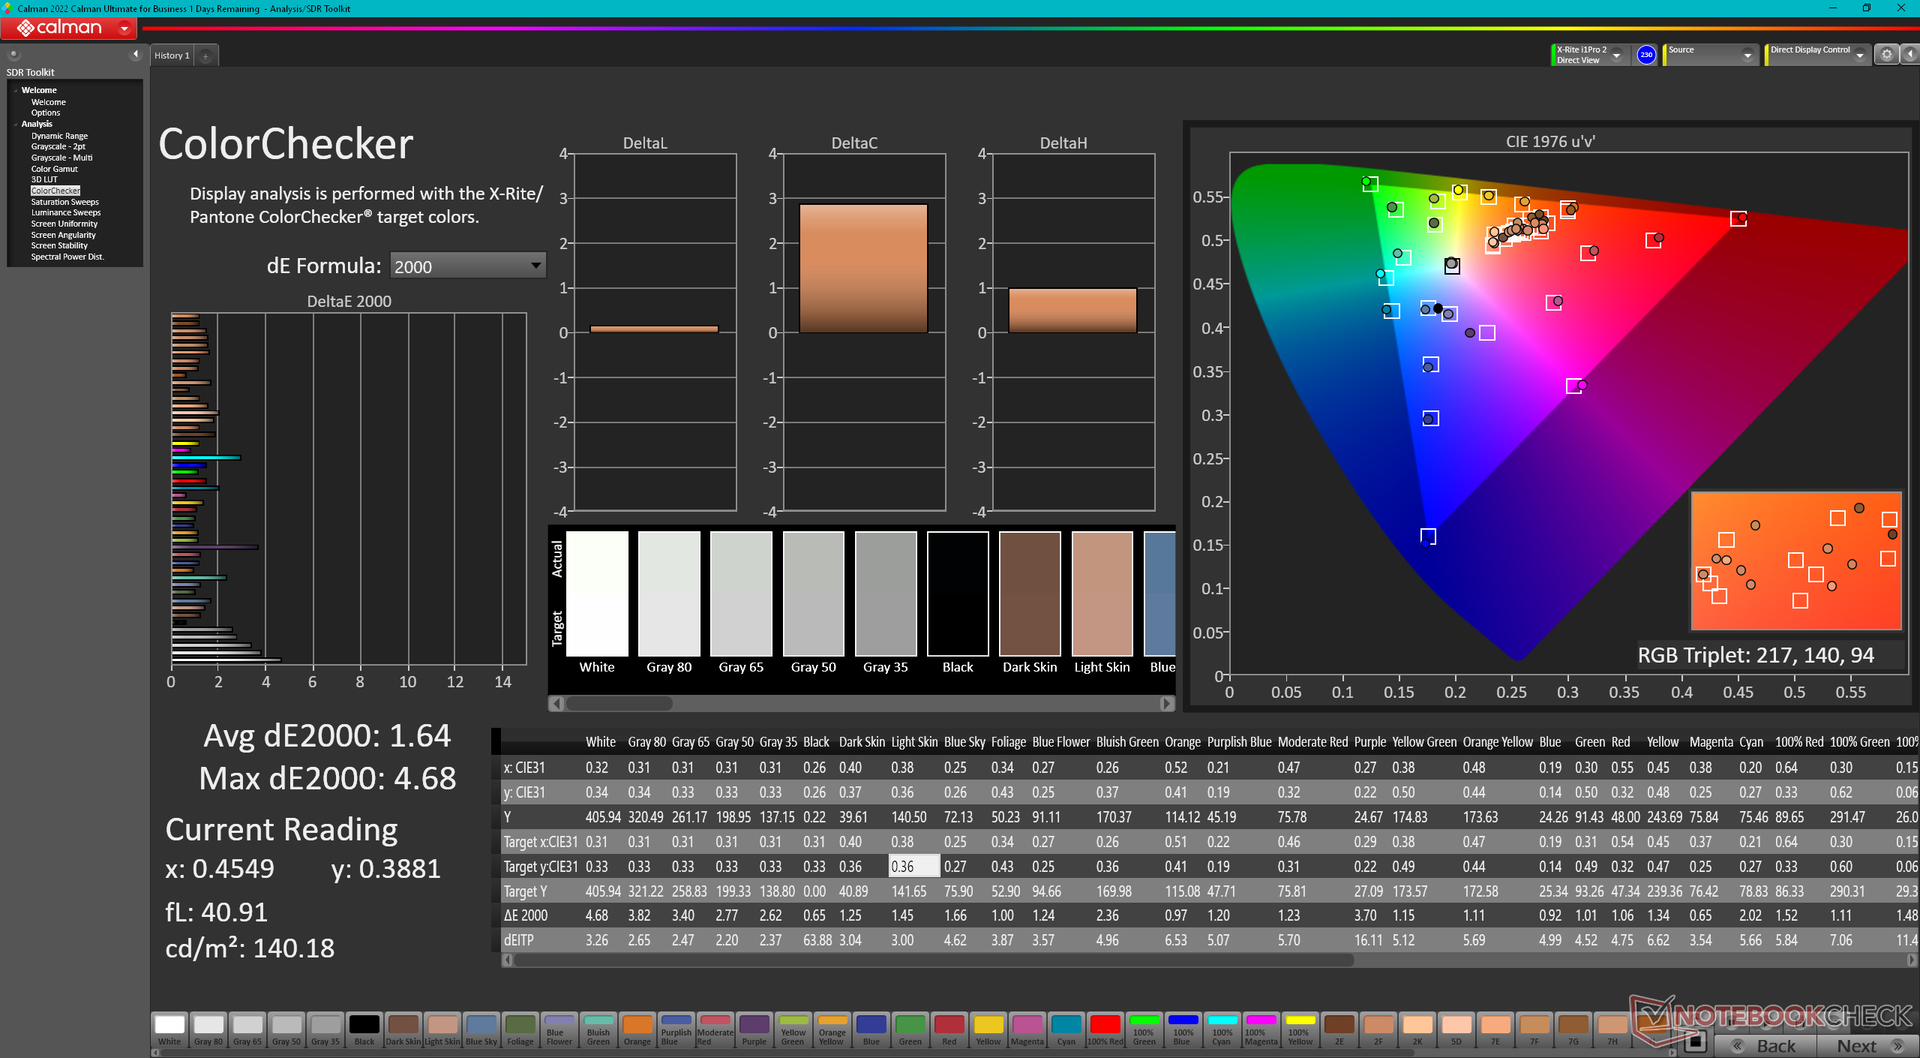
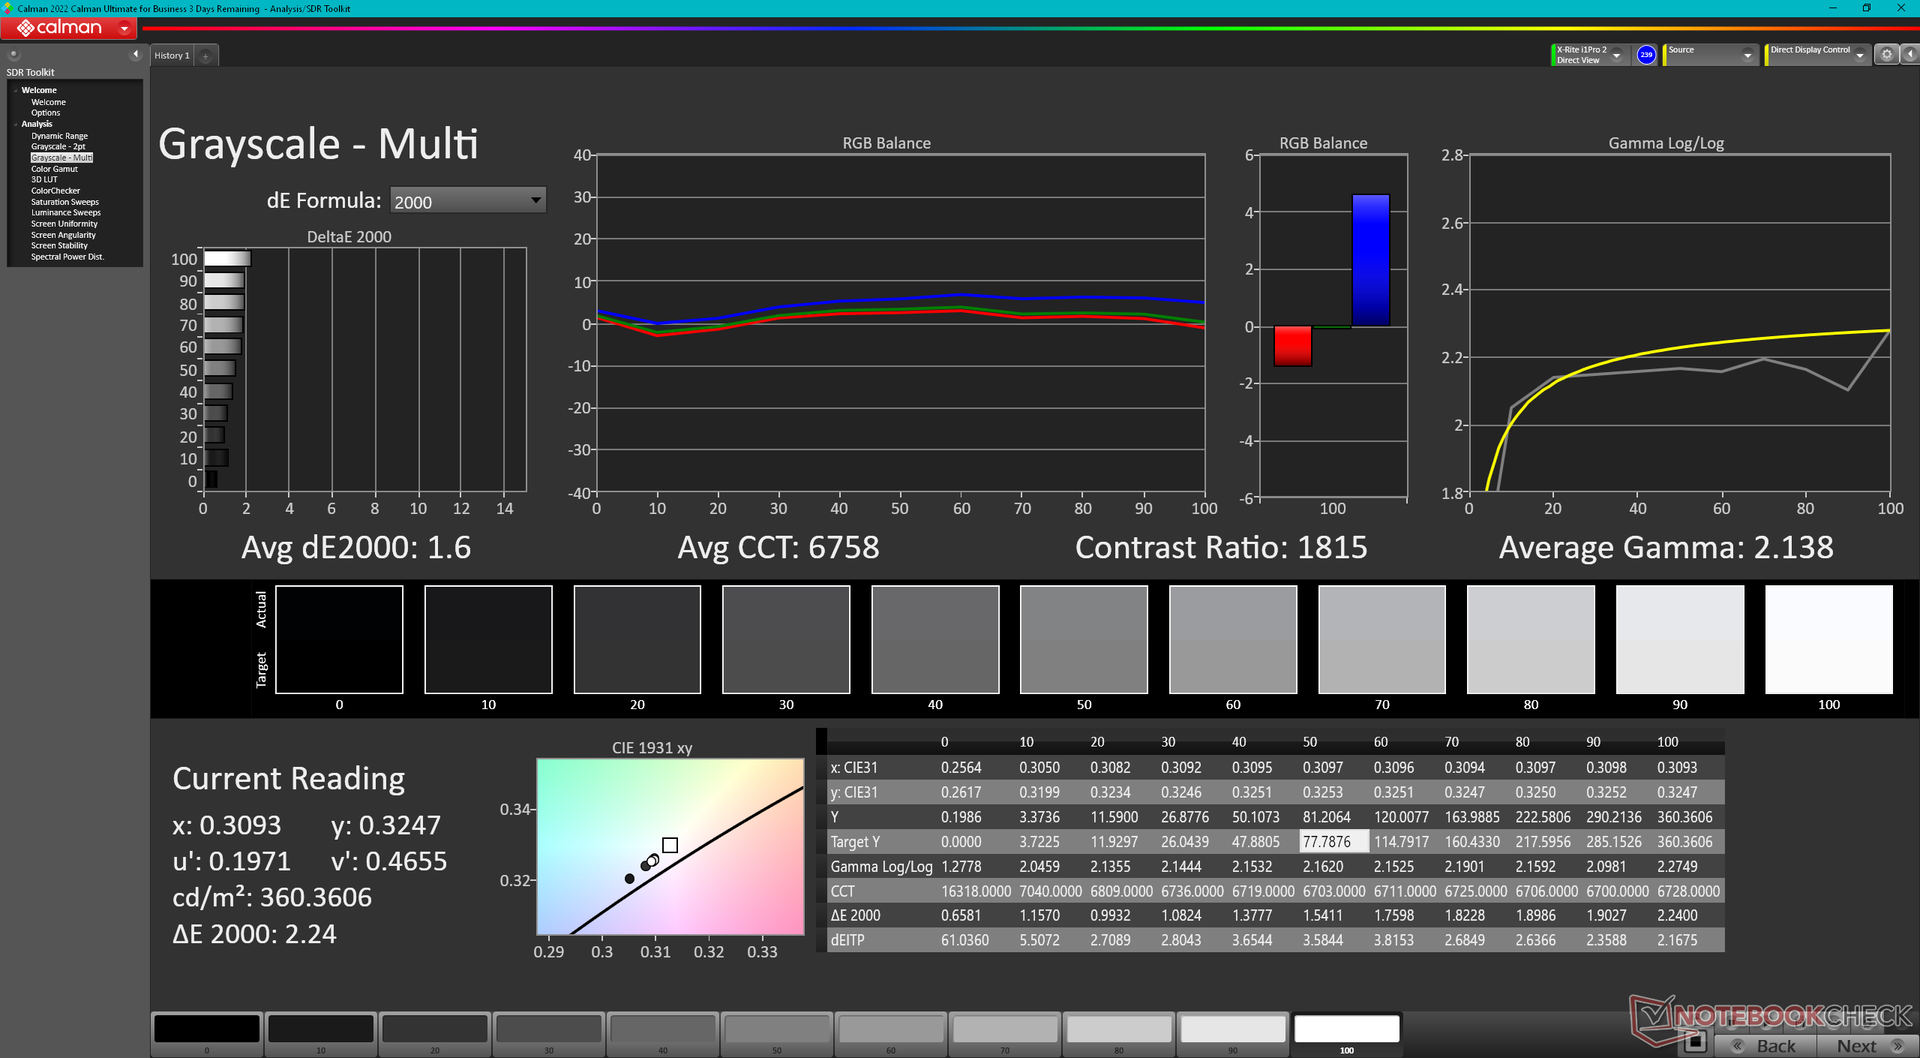
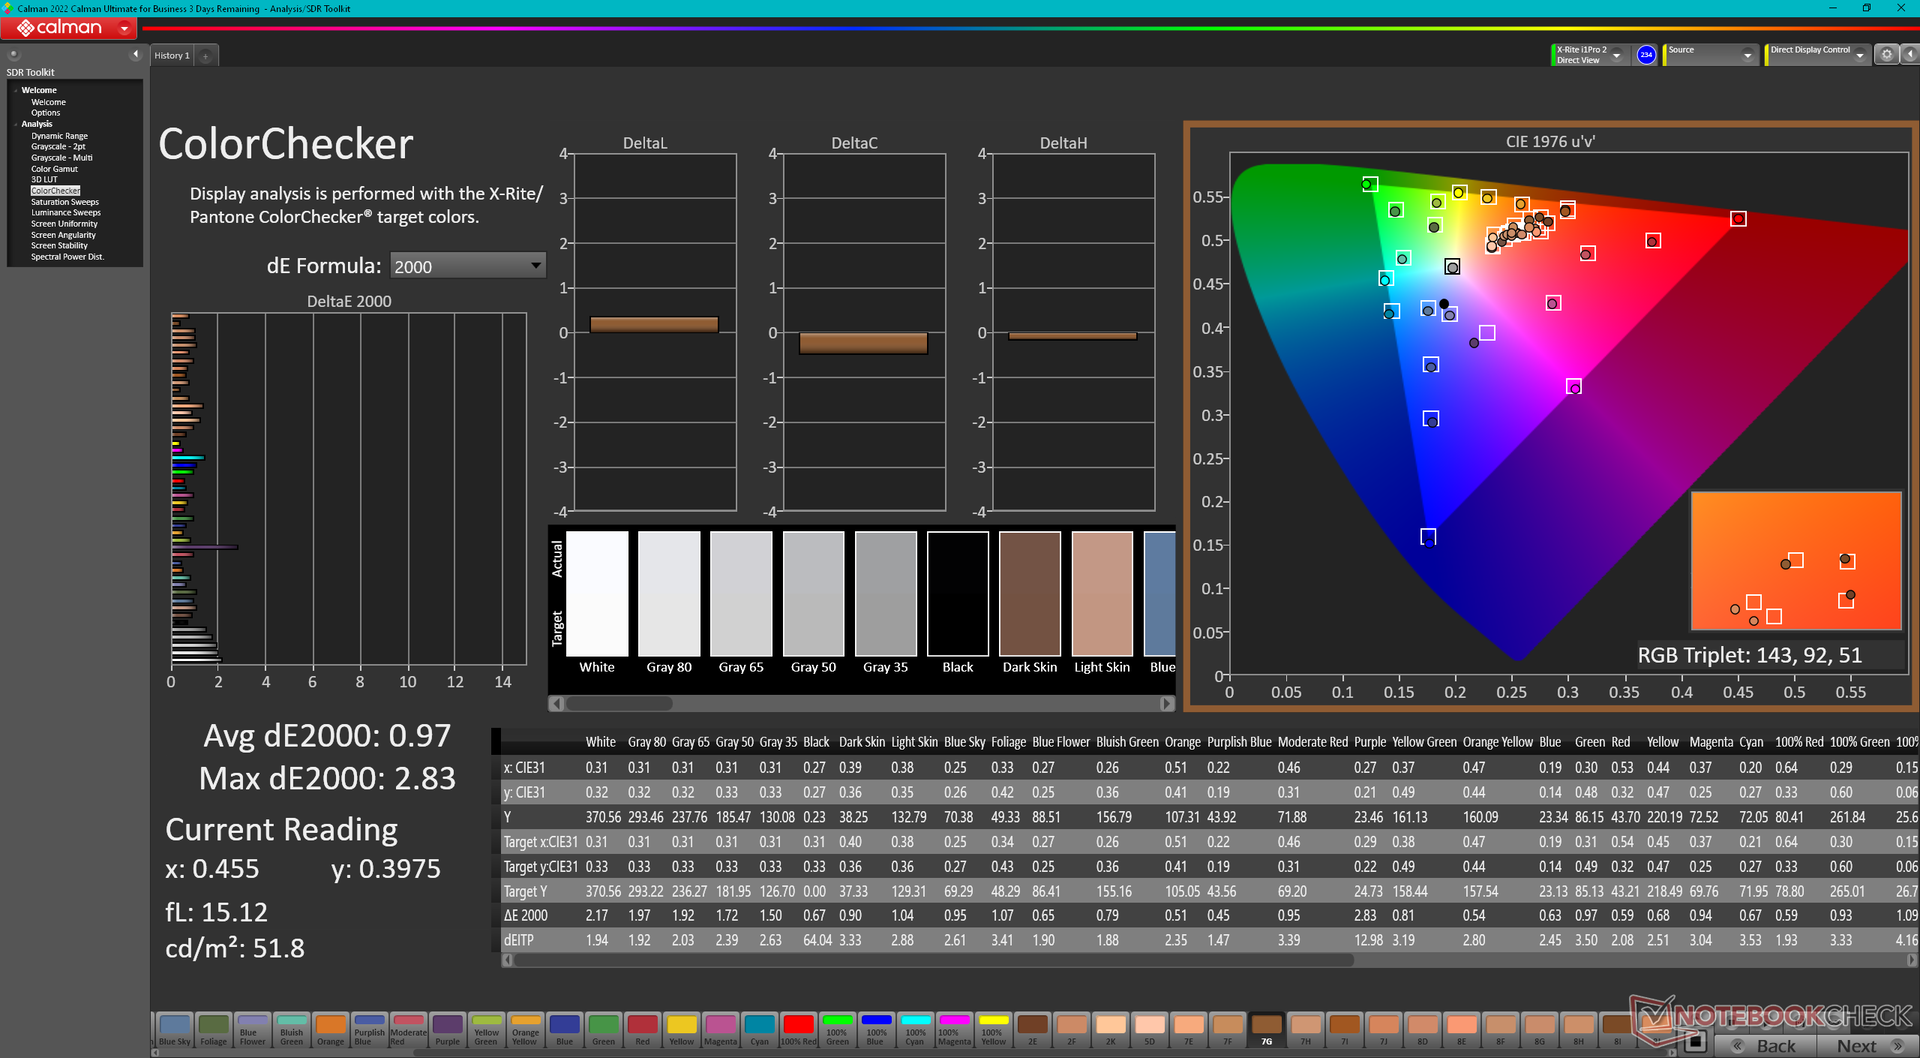
ΔE ColorChecker Calman: 1.64 | ∀{0.5-29.43 Ø4.76}
calibrated: 0.97
ΔE Greyscale Calman: 2.6 | ∀{0.09-98 Ø5}
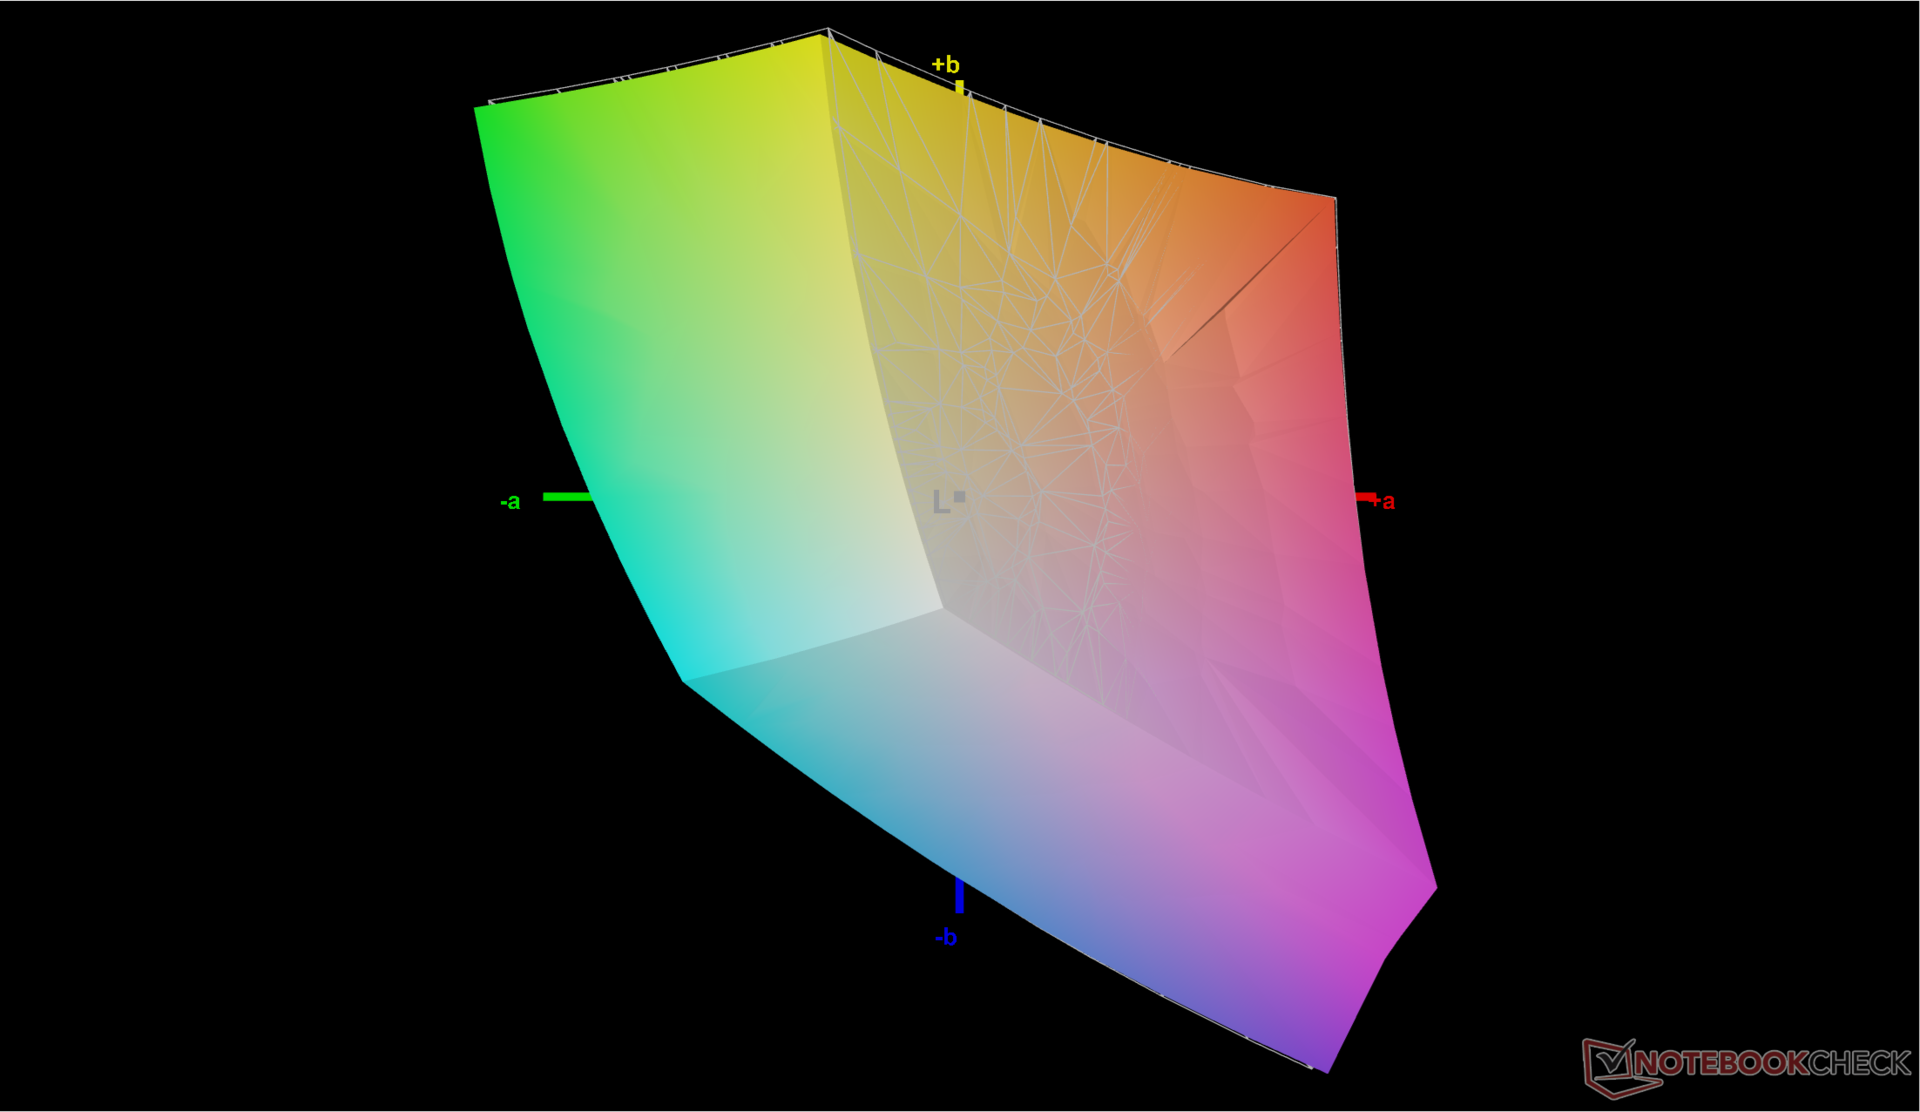
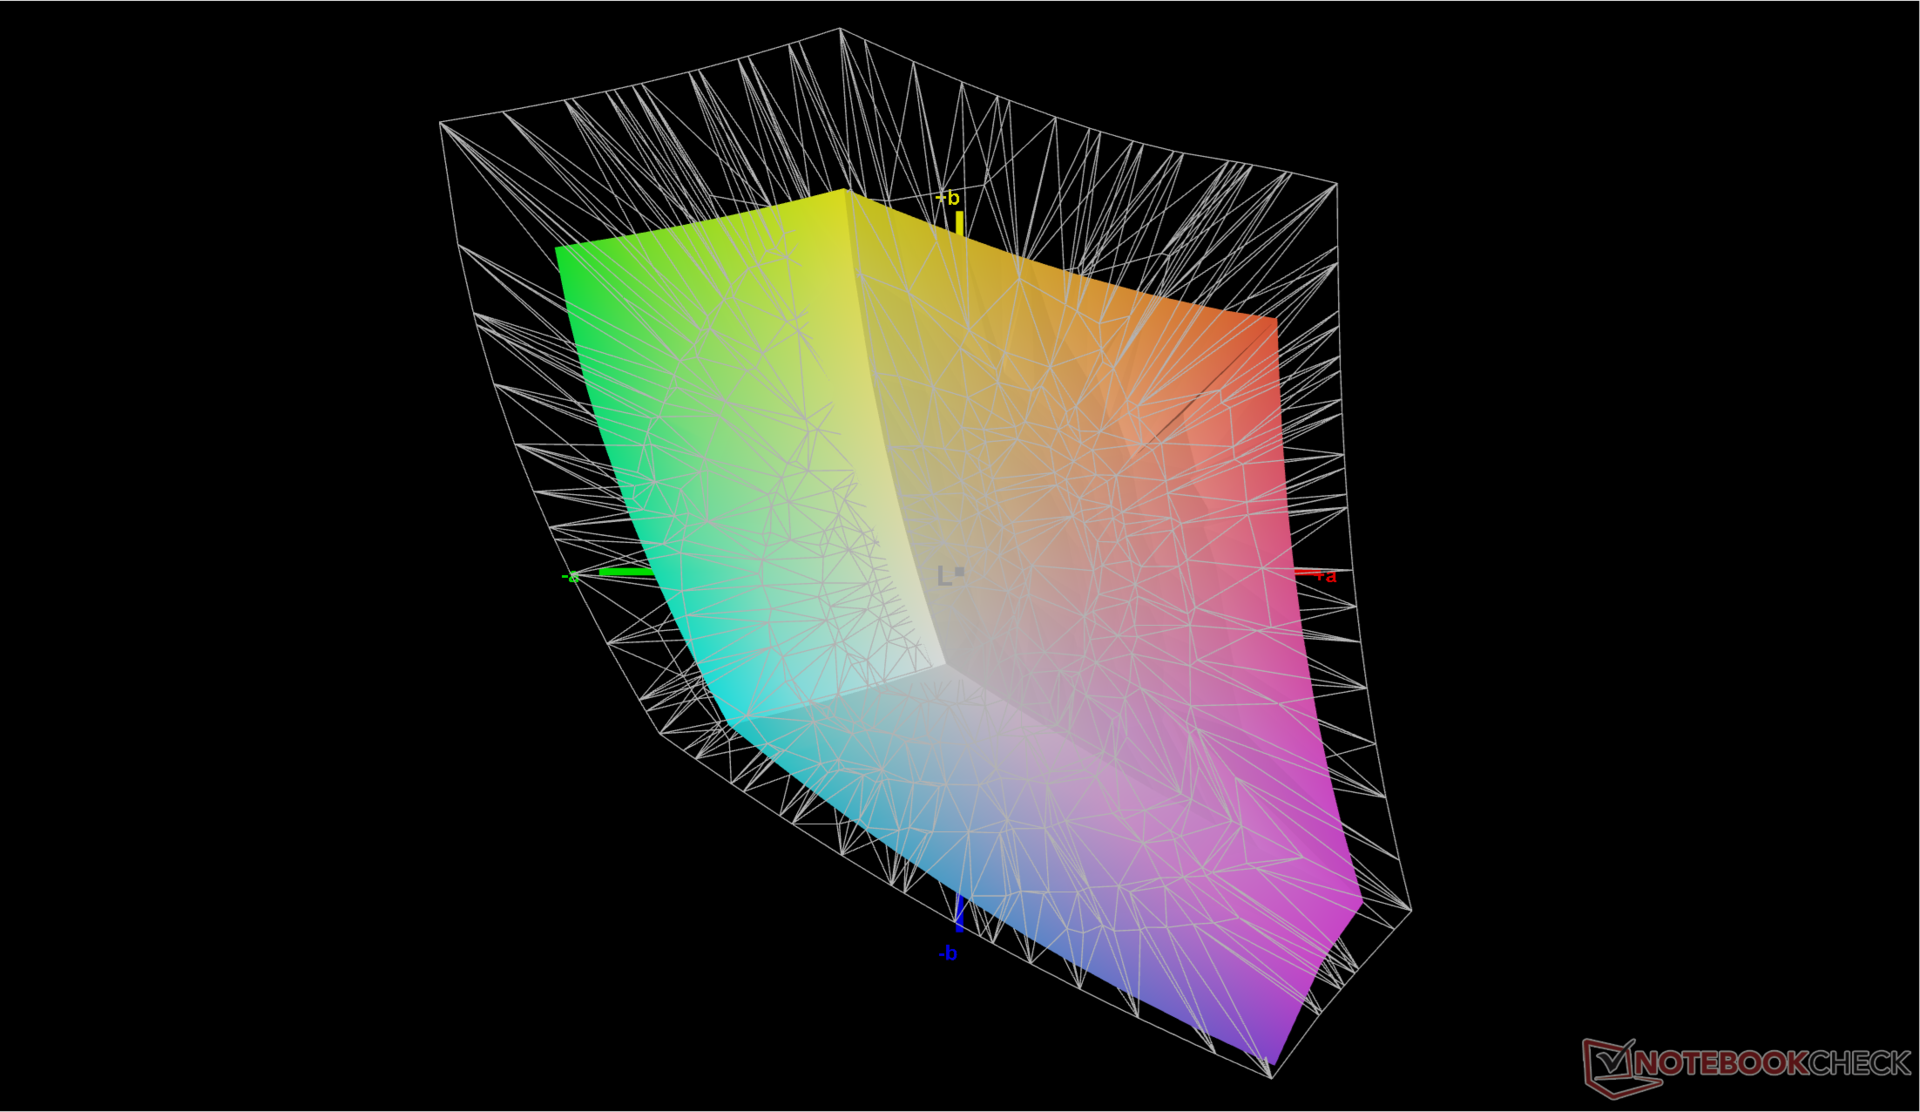
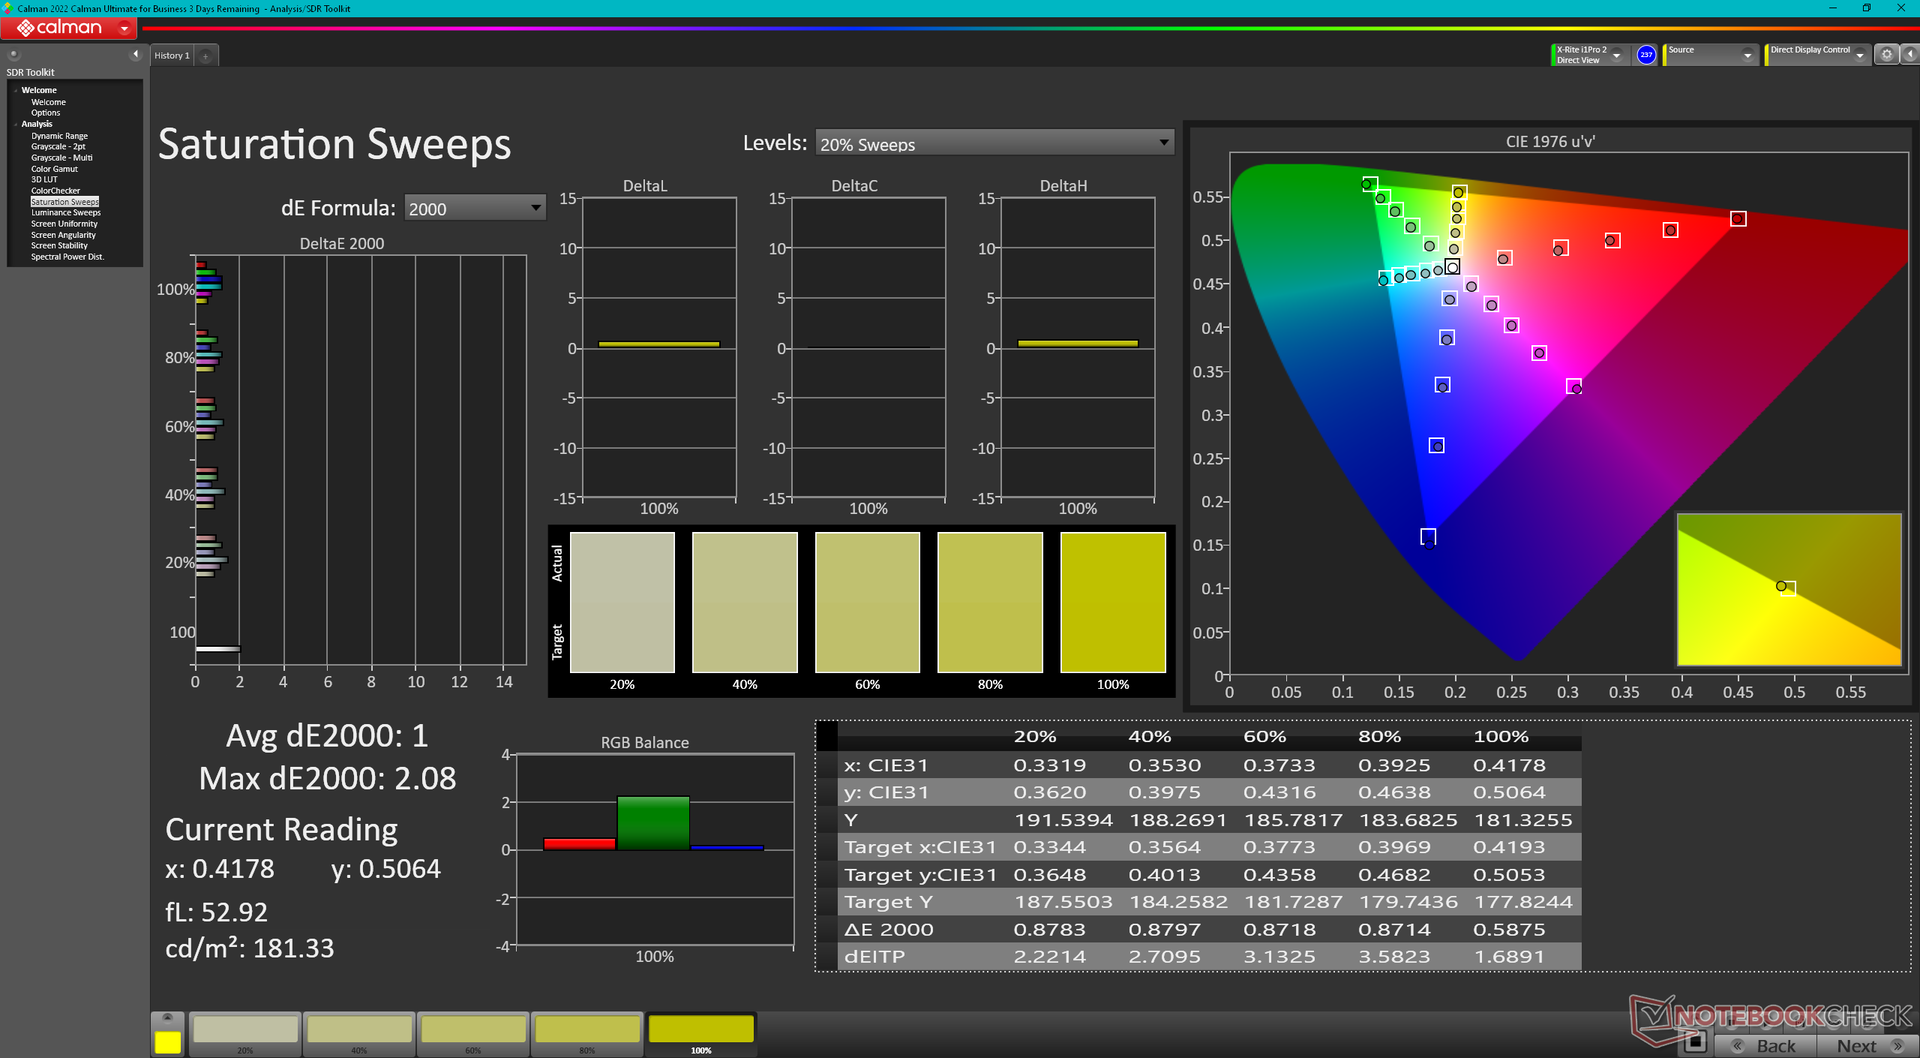
68.9% AdobeRGB 1998 (Argyll 3D)
99% sRGB (Argyll 3D)
67.1% Display P3 (Argyll 3D)
Gamma: 2.22
CCT: 6388 K
| HP OmniBook Ultra 14 BOE0C9E, IPS, 2240x1400, 14", 60 Hz | HP Spectre x360 14-eu0078ng SDC4197, OLED, 2880x1800, 14", 120 Hz | Asus Zenbook S 14 UX5406 ATNA40CU09-0, OLED, 2880x1800, 14", 120 Hz | Lenovo Yoga Pro 7 14ASP G9 LEN145WQ+, OLED, 3072x1920, 14.5", 120 Hz | Samsung Galaxy Book4 Edge 14 ATNA40CU07-0, OLED, 2880x1800, 14", 120 Hz | Dell XPS 14 2024 OLED SDC41A2, OLED, 3200x2000, 14.5", 120 Hz | |
|---|---|---|---|---|---|---|
| Display | 27% | 26% | 25% | 23% | 25% | |
| Display P3 Coverage (%) | 67.1 | 99.8 49% | 99 48% | 98 46% | 97 45% | 98.5 47% |
| sRGB Coverage (%) | 99 | 100 1% | 100 1% | 99.9 1% | 100 1% | 100 1% |
| AdobeRGB 1998 Coverage (%) | 68.9 | 89.3 30% | 89.2 29% | 88.1 28% | 85.2 24% | 87.2 27% |
| Response Times | 98% | 98% | 99% | 98% | 98% | |
| Response Time Grey 50% / Grey 80% * (ms) | 35.9 ? | 0.77 ? 98% | 0.7 ? 98% | 0.44 ? 99% | 0.83 ? 98% | 0.7 ? 98% |
| Response Time Black / White * (ms) | 28 ? | 0.75 ? 97% | 0.71 ? 97% | 0.61 ? 98% | 0.69 ? 98% | 0.77 ? 97% |
| PWM Frequency (Hz) | 480 | 480 ? | 240 ? | 240 | 480 | |
| PWM Amplitude * (%) | 26 | 56 | 50 | |||
| Bildschirm | 20% | 28% | 26% | 15% | 7% | |
| Helligkeit Bildmitte (cd/m²) | 359.5 | 378 5% | 374 4% | 400 11% | 392 9% | 351 -2% |
| Brightness (cd/m²) | 361 | 384 6% | 379 5% | 403 12% | 398 10% | 353 -2% |
| Brightness Distribution (%) | 92 | 97 5% | 98 7% | 97 5% | 97 5% | 97 5% |
| Schwarzwert * (cd/m²) | 0.27 | |||||
| Kontrast (:1) | 1331 | |||||
| Delta E Colorchecker * | 1.64 | 1.4 15% | 1 39% | 1 39% | 1.3 21% | 1.7 -4% |
| Colorchecker dE 2000 max. * | 4.68 | 2.2 53% | 2.2 53% | 2.8 40% | 3.2 32% | 2.2 53% |
| Colorchecker dE 2000 calibrated * | 0.97 | 0.8 18% | ||||
| Delta E Graustufen * | 2.6 | 1.7 35% | 1.1 58% | 1.3 50% | 2.3 12% | 3.1 -19% |
| Gamma | 2.22 99% | 2.17 101% | 2.15 102% | 2.23 99% | 2.24 98% | 2.12 104% |
| CCT | 6388 102% | 6256 104% | 6549 99% | 6586 99% | 6517 100% | 6616 98% |
| Durchschnitt gesamt (Programm / Settings) | 48% /
36% | 51% /
40% | 50% /
39% | 45% /
32% | 43% /
27% |
* ... kleinere Werte sind besser
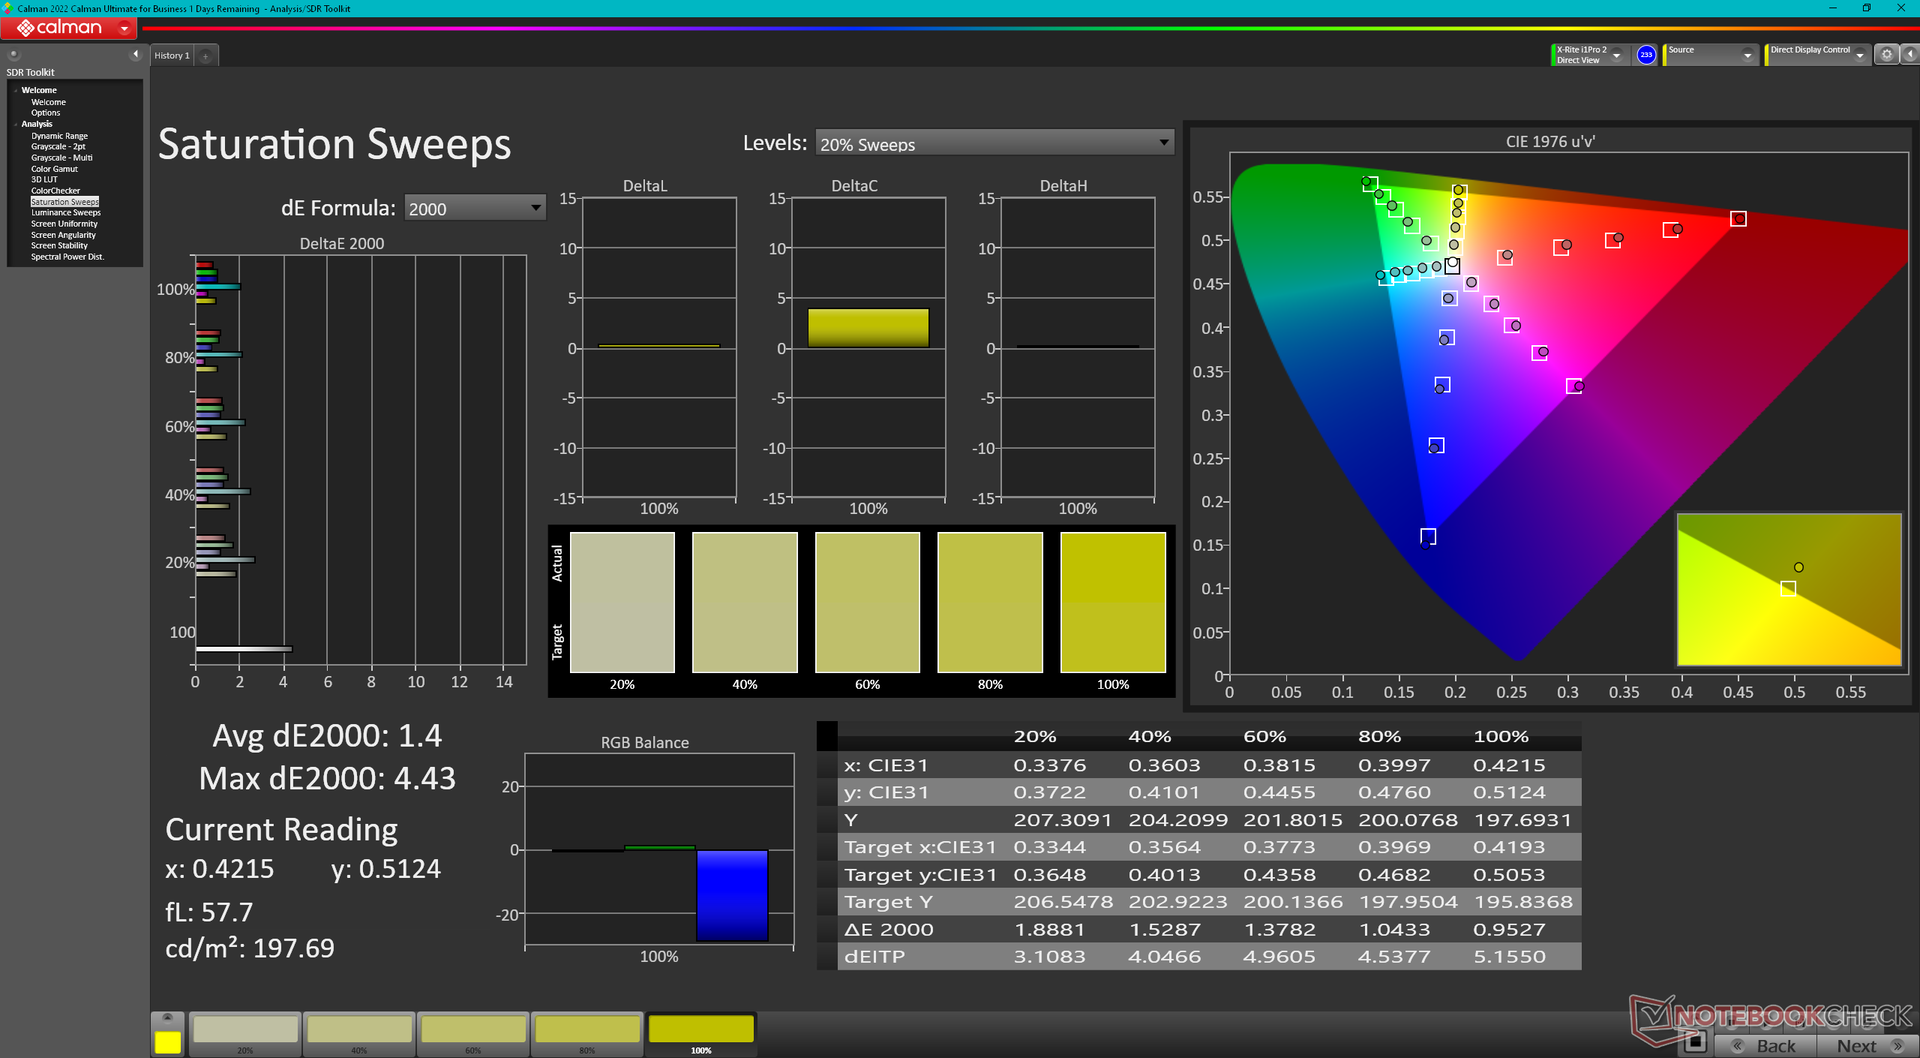
Das Display ist bereits im Auslieferungszustand gut kalibriert, mit durchschnittlichen Graustufen- und Farb-DeltaE-Werten von nur 2,6 bzw. 1,64. Eine weitere Kalibrierung des Bildschirms mit unserem X-Rite-Kolorimeter würde diese Ergebnisse zwar geringfügig verbessern, ist jedoch für die Mehrheit der Nutzer wahrscheinlich unnötig. Unser kalibriertes ICM-Profil steht jedoch oben zum kostenlosen Download bereit.

Reaktionszeiten (Response Times) des Displays
| ↔ Reaktionszeiten Schwarz zu Weiß | ||
|---|---|---|
| 28 ms ... steigend ↗ und fallend ↘ kombiniert | ↗ 16.5 ms steigend | 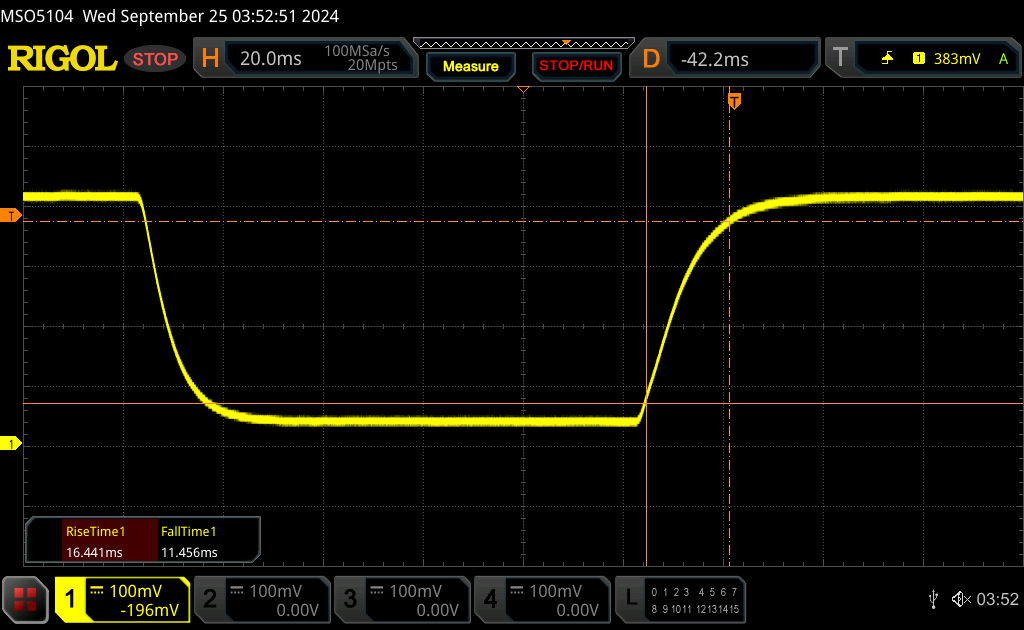 |
| ↘ 11.5 ms fallend | ||
| Die gemessenen Reaktionszeiten sind mittelmäßig und dadurch für Spieler eventuell zu langsam. Im Vergleich rangierten die bei uns getesteten Geräte von 0.1 (Minimum) zu 240 (Maximum) ms. » 70 % aller Screens waren schneller als der getestete. Daher sind die gemessenen Reaktionszeiten schlechter als der Durchschnitt aller vermessenen Geräte (20.1 ms). | ||
| ↔ Reaktionszeiten 50% Grau zu 80% Grau | ||
| 35.9 ms ... steigend ↗ und fallend ↘ kombiniert | ↗ 17 ms steigend | 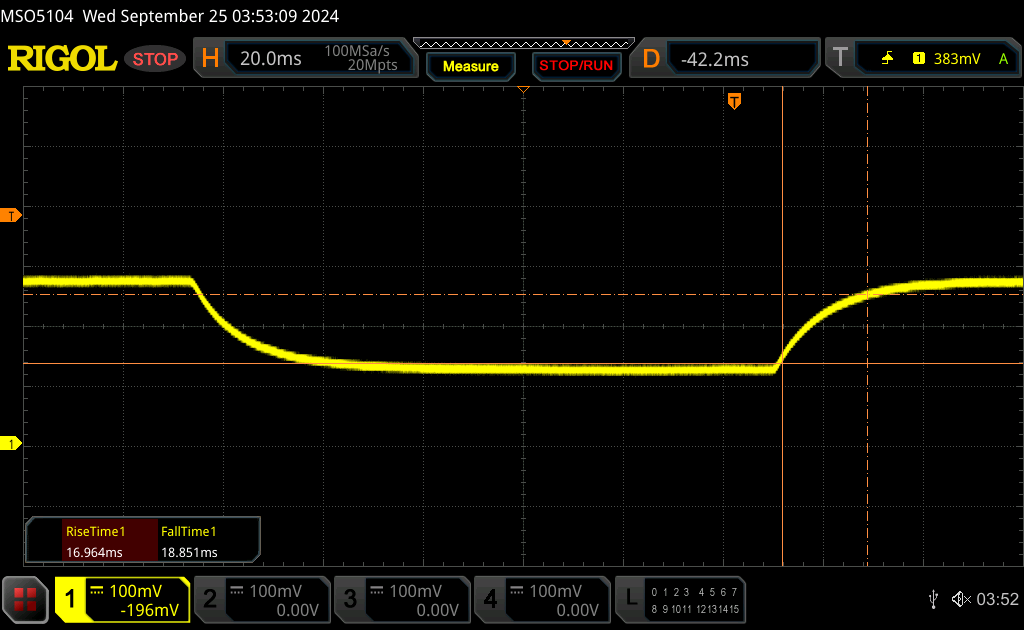 |
| ↘ 18.9 ms fallend | ||
| Die gemessenen Reaktionszeiten sind langsam und dadurch für viele Spieler wahrscheinlich zu langsam. Im Vergleich rangierten die bei uns getesteten Geräte von 0.165 (Minimum) zu 636 (Maximum) ms. » 49 % aller Screens waren schneller als der getestete. Daher sind die gemessenen Reaktionszeiten schlechter als der Durchschnitt aller vermessenen Geräte (31.5 ms). | ||
Bildschirm-Flackern / PWM (Pulse-Width Modulation)
| Flackern / PWM nicht festgestellt | 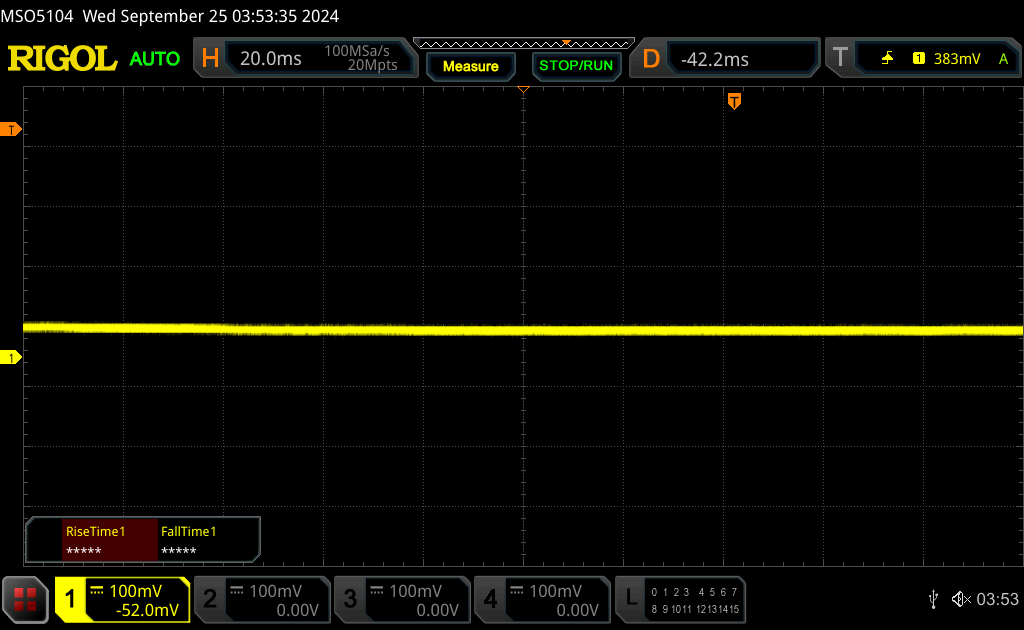 | ||
Im Vergleich: 53 % aller getesteten Geräte nutzten kein PWM um die Helligkeit zu reduzieren. Wenn PWM eingesetzt wurde, dann bei einer Frequenz von durchschnittlich 8075 (Minimum 5, Maximum 343500) Hz. | |||
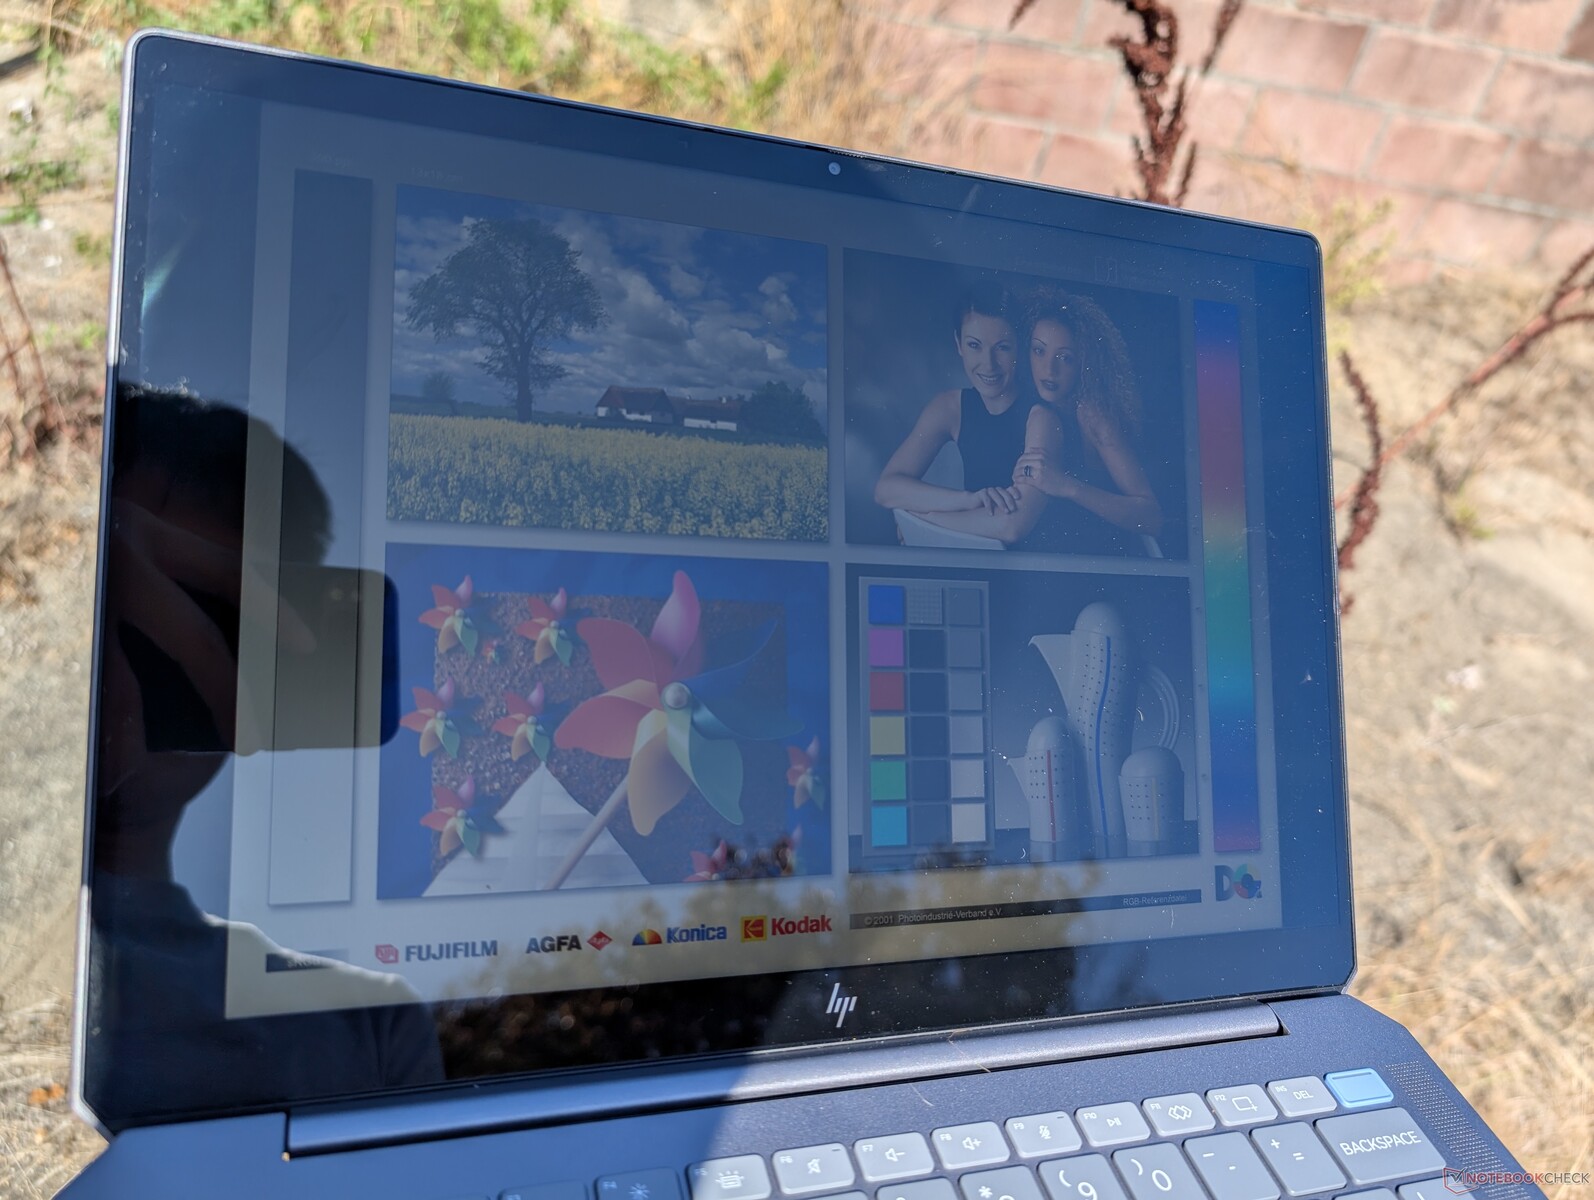
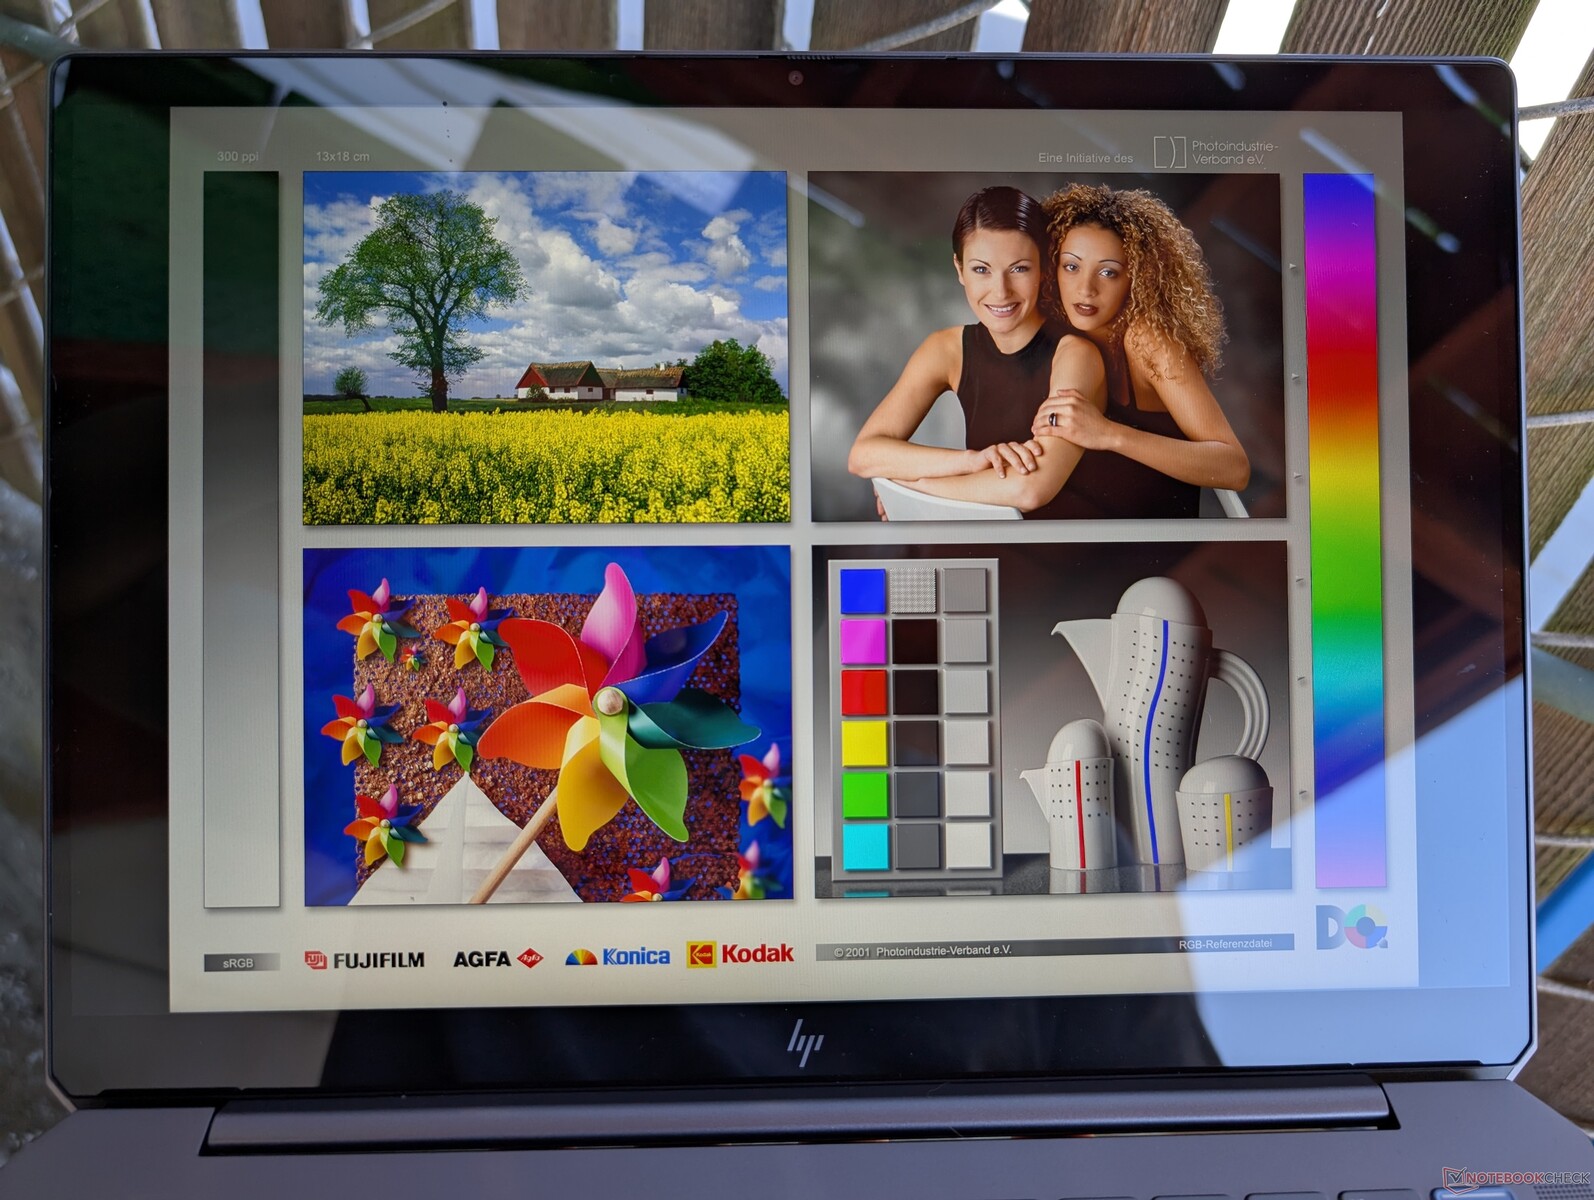
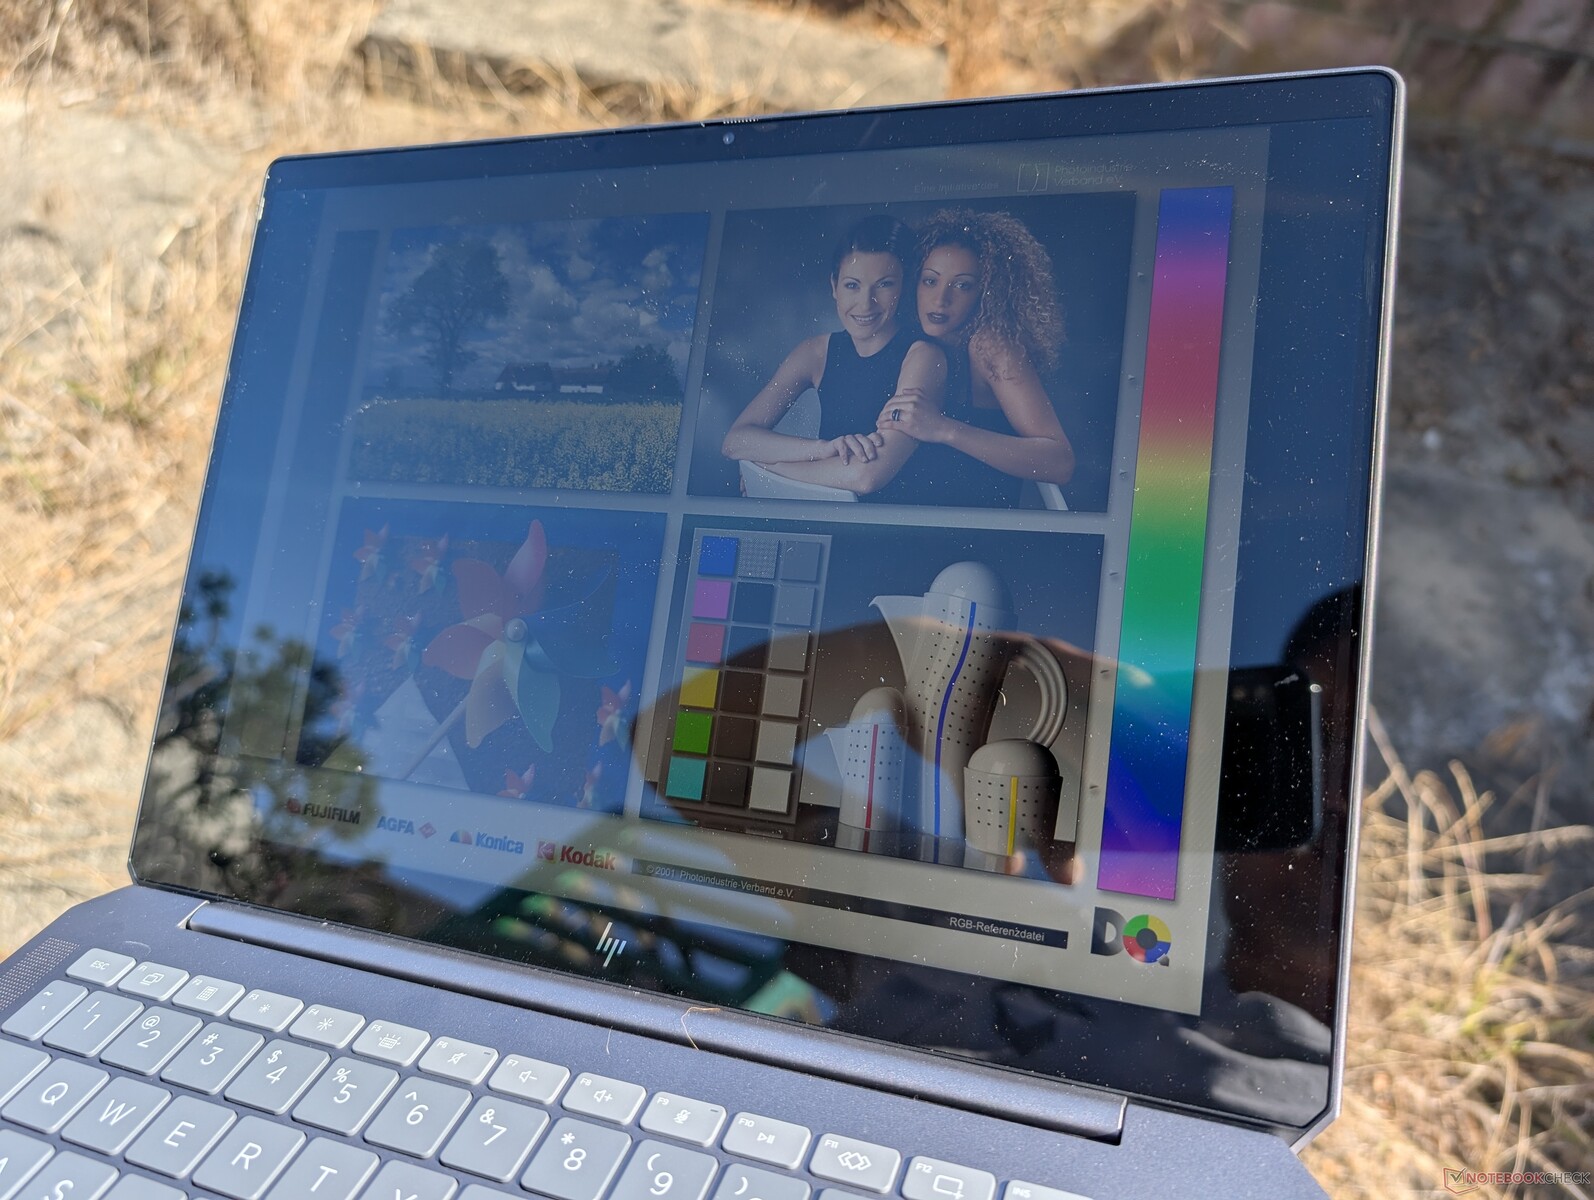
Die Sichtbarkeit im Freien ist angemessen, aber nicht so gut wie beim Yoga Pro 7 14ASP G9 oder dem Galaxy Book4 Edge 14, die mit helleren OLED-Panels ausgestattet sind. Blendeffekte sind stets vorhanden und spürbar, weshalb direktes Sonnenlicht vermieden werden sollte, um die Farbtreue zu erhalten. Es ist schade, dass das Display nicht heller sein kann, da das System ansonsten recht leicht und tragbar ist.
Performance — Spielbereit
Testbedingungen
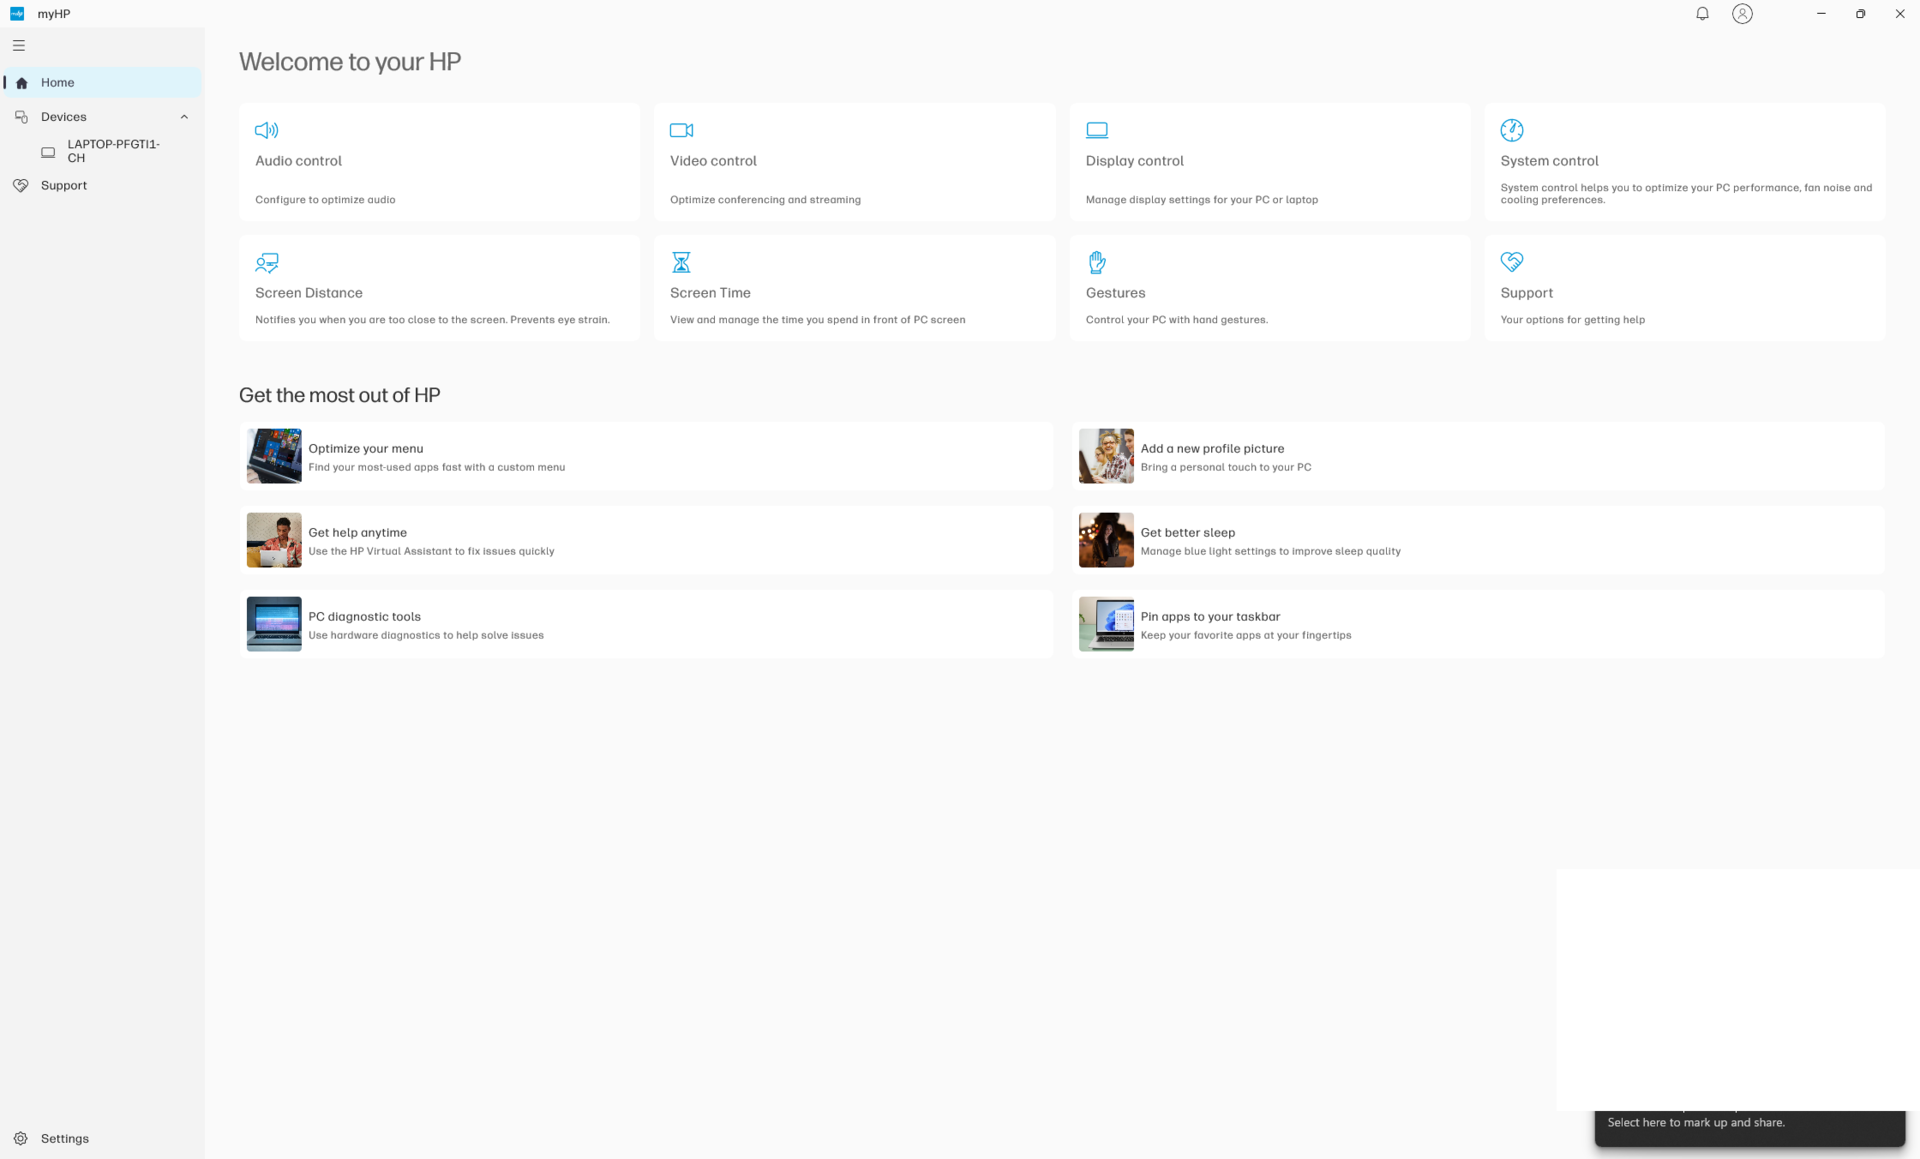
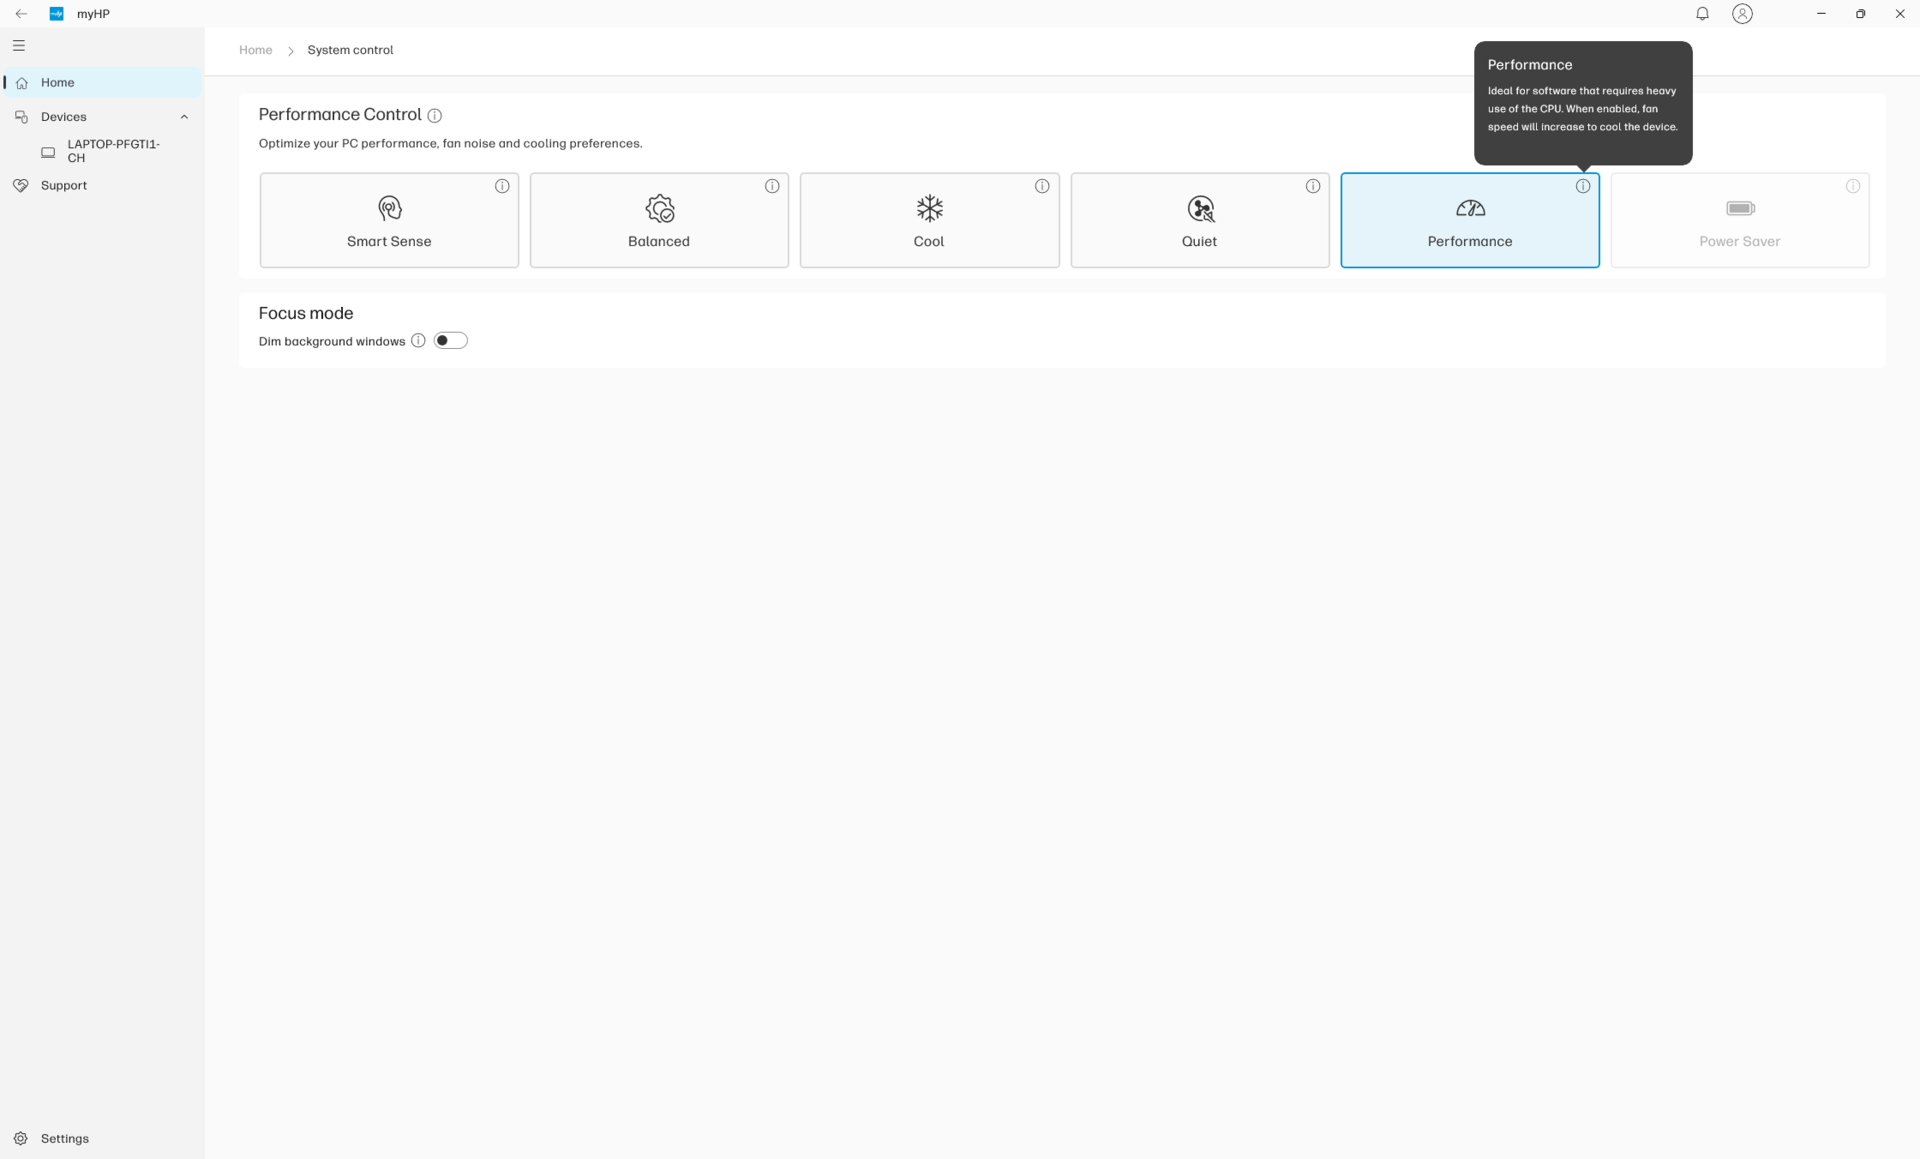
Wir haben sowohl Windows als auch MyHP auf den Performance-Modus eingestellt, bevor wir die folgenden Benchmarks durchgeführt haben. Wir empfehlen den Besitzern dringend, sich mit den MyHP-Energieprofilen vertraut zu machen, da es im Vergleich zu anderen Laptops mehr Einstellungen als üblich gibt, darunter Balanced, Cool, Quiet, Performance und Power Saver. Einige dieser Einstellungen wirken sich direkt auf die Leistung aus, wie unsere Ergebnisse weiter unten zeigen werden.
Jedes HP-Energieprofil dient einem anderen Zweck:
- Smart Sense: Passt das System automatisch an Ihre Bedürfnisse an und optimiert Leistung, Lüftergeräusch und Temperatur je nach Anwendung, Platzierung des Laptops und Akkustatus
- Balanced: Gleicht Lüftergeschwindigkeit, Leistung und Temperatur aus
- Cool: Erhöht das Lüftergeräusch und verringert die Leistung für kühlere Oberflächentemperaturen
- Quiet: Verringert das Lüftergeräusch und die Leistung in geräuschempfindlichen Umgebungen
- Performance: Erhöht die Obergrenze für das Lüftergeräusch
- Power Saver: Verringert die Leistung. Nur im Akkubetrieb verfügbar
Prozessor
Der Ryzen AI 9 HX 375 verfügt über zwei Kerne mehr als die kleinere Ryzen AI 9 HX 365-Konfiguration, was einen ungefähren 15-prozentigen Anstieg der Multi-Thread-Leistung laut synthetischen Benchmarks bedeutet. Der Ryzen AI 9 365 übertrifft bereits gängige Alternativen wie den Core i7-13700H. Daher ist es beeindruckend zu sehen, dass der Ryzen AI 9 375 immer noch einen anständigen Leistungsschub bieten kann. Dies steht im Gegensatz zum Ryzen 7 8845HS, der nur geringe bis gar keine Vorteile gegenüber dem Ryzen 7 7840HS bietet, den er direkt ersetzt.
Im Vergleich zu anderen 14-Zoll-Subnotebooks, die derzeit auf dem Markt sind, ist das OmniBook Ultra 14 dank der AMD Zen 5 CPU mit Abstand eines der schnellsten. Die Vorteile sind besonders groß für diejenigen, die möglicherweise von einer CPU der U-Serie oder sogar einer Meteor Lake-H-Plattform wie dem Core Ultra 7 155H wechseln. Unsere Grafik zeigt, dass CineBench R15 xT in einer Schleife läuft, was zu einer erstaunlich stabilen Leistung führt. Die Ergebnisse sinken nur um wenige Prozentpunkte, wenn CineBench R15 xT in einer Schleife läuft.
Unsere Zen 5 CPU ist im Gegensatz zu den CPUs der Zen 4 Hawk Point Serie mit Co-Pilot+ kompatibel.
Cinebench R15 Multi Dauertest
Cinebench R23: Multi Core | Single Core
Cinebench R20: CPU (Multi Core) | CPU (Single Core)
Cinebench R15: CPU Multi 64Bit | CPU Single 64Bit
Blender: v2.79 BMW27 CPU
7-Zip 18.03: 7z b 4 | 7z b 4 -mmt1
Geekbench 6.5: Multi-Core | Single-Core
Geekbench 5.5: Multi-Core | Single-Core
HWBOT x265 Benchmark v2.2: 4k Preset
LibreOffice : 20 Documents To PDF
R Benchmark 2.5: Overall mean
* ... kleinere Werte sind besser
AIDA64: FP32 Ray-Trace | FPU Julia | CPU SHA3 | CPU Queen | FPU SinJulia | FPU Mandel | CPU AES | CPU ZLib | FP64 Ray-Trace | CPU PhotoWorxx
| Performance Rating | |
| HP OmniBook Ultra 14 | |
| Durchschnittliche AMD Ryzen AI 9 HX 375 | |
| Lenovo Yoga Pro 7 14ASP G9 | |
| Dell XPS 14 2024 OLED | |
| HP Spectre x360 14-eu0078ng | |
| Asus Zenbook S 14 UX5406 | |
| Samsung Galaxy Book4 Edge 14 | |
| AIDA64 / FP32 Ray-Trace | |
| HP OmniBook Ultra 14 | |
| Durchschnittliche AMD Ryzen AI 9 HX 375 (n=1) | |
| Lenovo Yoga Pro 7 14ASP G9 | |
| Dell XPS 14 2024 OLED | |
| Asus Zenbook S 14 UX5406 | |
| HP Spectre x360 14-eu0078ng | |
| Samsung Galaxy Book4 Edge 14 | |
| AIDA64 / FPU Julia | |
| HP OmniBook Ultra 14 | |
| Durchschnittliche AMD Ryzen AI 9 HX 375 (n=1) | |
| Lenovo Yoga Pro 7 14ASP G9 | |
| Dell XPS 14 2024 OLED | |
| Asus Zenbook S 14 UX5406 | |
| HP Spectre x360 14-eu0078ng | |
| Samsung Galaxy Book4 Edge 14 | |
| AIDA64 / CPU SHA3 | |
| HP OmniBook Ultra 14 | |
| Durchschnittliche AMD Ryzen AI 9 HX 375 (n=1) | |
| Lenovo Yoga Pro 7 14ASP G9 | |
| Dell XPS 14 2024 OLED | |
| Samsung Galaxy Book4 Edge 14 | |
| Asus Zenbook S 14 UX5406 | |
| HP Spectre x360 14-eu0078ng | |
| AIDA64 / CPU Queen | |
| HP OmniBook Ultra 14 | |
| Durchschnittliche AMD Ryzen AI 9 HX 375 (n=1) | |
| Lenovo Yoga Pro 7 14ASP G9 | |
| HP Spectre x360 14-eu0078ng | |
| Dell XPS 14 2024 OLED | |
| Samsung Galaxy Book4 Edge 14 | |
| Asus Zenbook S 14 UX5406 | |
| AIDA64 / FPU SinJulia | |
| HP OmniBook Ultra 14 | |
| Durchschnittliche AMD Ryzen AI 9 HX 375 (n=1) | |
| Lenovo Yoga Pro 7 14ASP G9 | |
| Dell XPS 14 2024 OLED | |
| HP Spectre x360 14-eu0078ng | |
| Asus Zenbook S 14 UX5406 | |
| Samsung Galaxy Book4 Edge 14 | |
| AIDA64 / FPU Mandel | |
| HP OmniBook Ultra 14 | |
| Durchschnittliche AMD Ryzen AI 9 HX 375 (n=1) | |
| Lenovo Yoga Pro 7 14ASP G9 | |
| Dell XPS 14 2024 OLED | |
| Asus Zenbook S 14 UX5406 | |
| HP Spectre x360 14-eu0078ng | |
| Samsung Galaxy Book4 Edge 14 | |
| AIDA64 / CPU AES | |
| HP OmniBook Ultra 14 | |
| Durchschnittliche AMD Ryzen AI 9 HX 375 (n=1) | |
| Lenovo Yoga Pro 7 14ASP G9 | |
| Dell XPS 14 2024 OLED | |
| HP Spectre x360 14-eu0078ng | |
| Samsung Galaxy Book4 Edge 14 | |
| Asus Zenbook S 14 UX5406 | |
| AIDA64 / CPU ZLib | |
| HP OmniBook Ultra 14 | |
| Durchschnittliche AMD Ryzen AI 9 HX 375 (n=1) | |
| Lenovo Yoga Pro 7 14ASP G9 | |
| Dell XPS 14 2024 OLED | |
| HP Spectre x360 14-eu0078ng | |
| Asus Zenbook S 14 UX5406 | |
| Samsung Galaxy Book4 Edge 14 | |
| AIDA64 / FP64 Ray-Trace | |
| HP OmniBook Ultra 14 | |
| Durchschnittliche AMD Ryzen AI 9 HX 375 (n=1) | |
| Lenovo Yoga Pro 7 14ASP G9 | |
| Dell XPS 14 2024 OLED | |
| Asus Zenbook S 14 UX5406 | |
| HP Spectre x360 14-eu0078ng | |
| Samsung Galaxy Book4 Edge 14 | |
| AIDA64 / CPU PhotoWorxx | |
| Asus Zenbook S 14 UX5406 | |
| Dell XPS 14 2024 OLED | |
| Lenovo Yoga Pro 7 14ASP G9 | |
| HP OmniBook Ultra 14 | |
| Durchschnittliche AMD Ryzen AI 9 HX 375 (n=1) | |
| HP Spectre x360 14-eu0078ng | |
| Samsung Galaxy Book4 Edge 14 | |
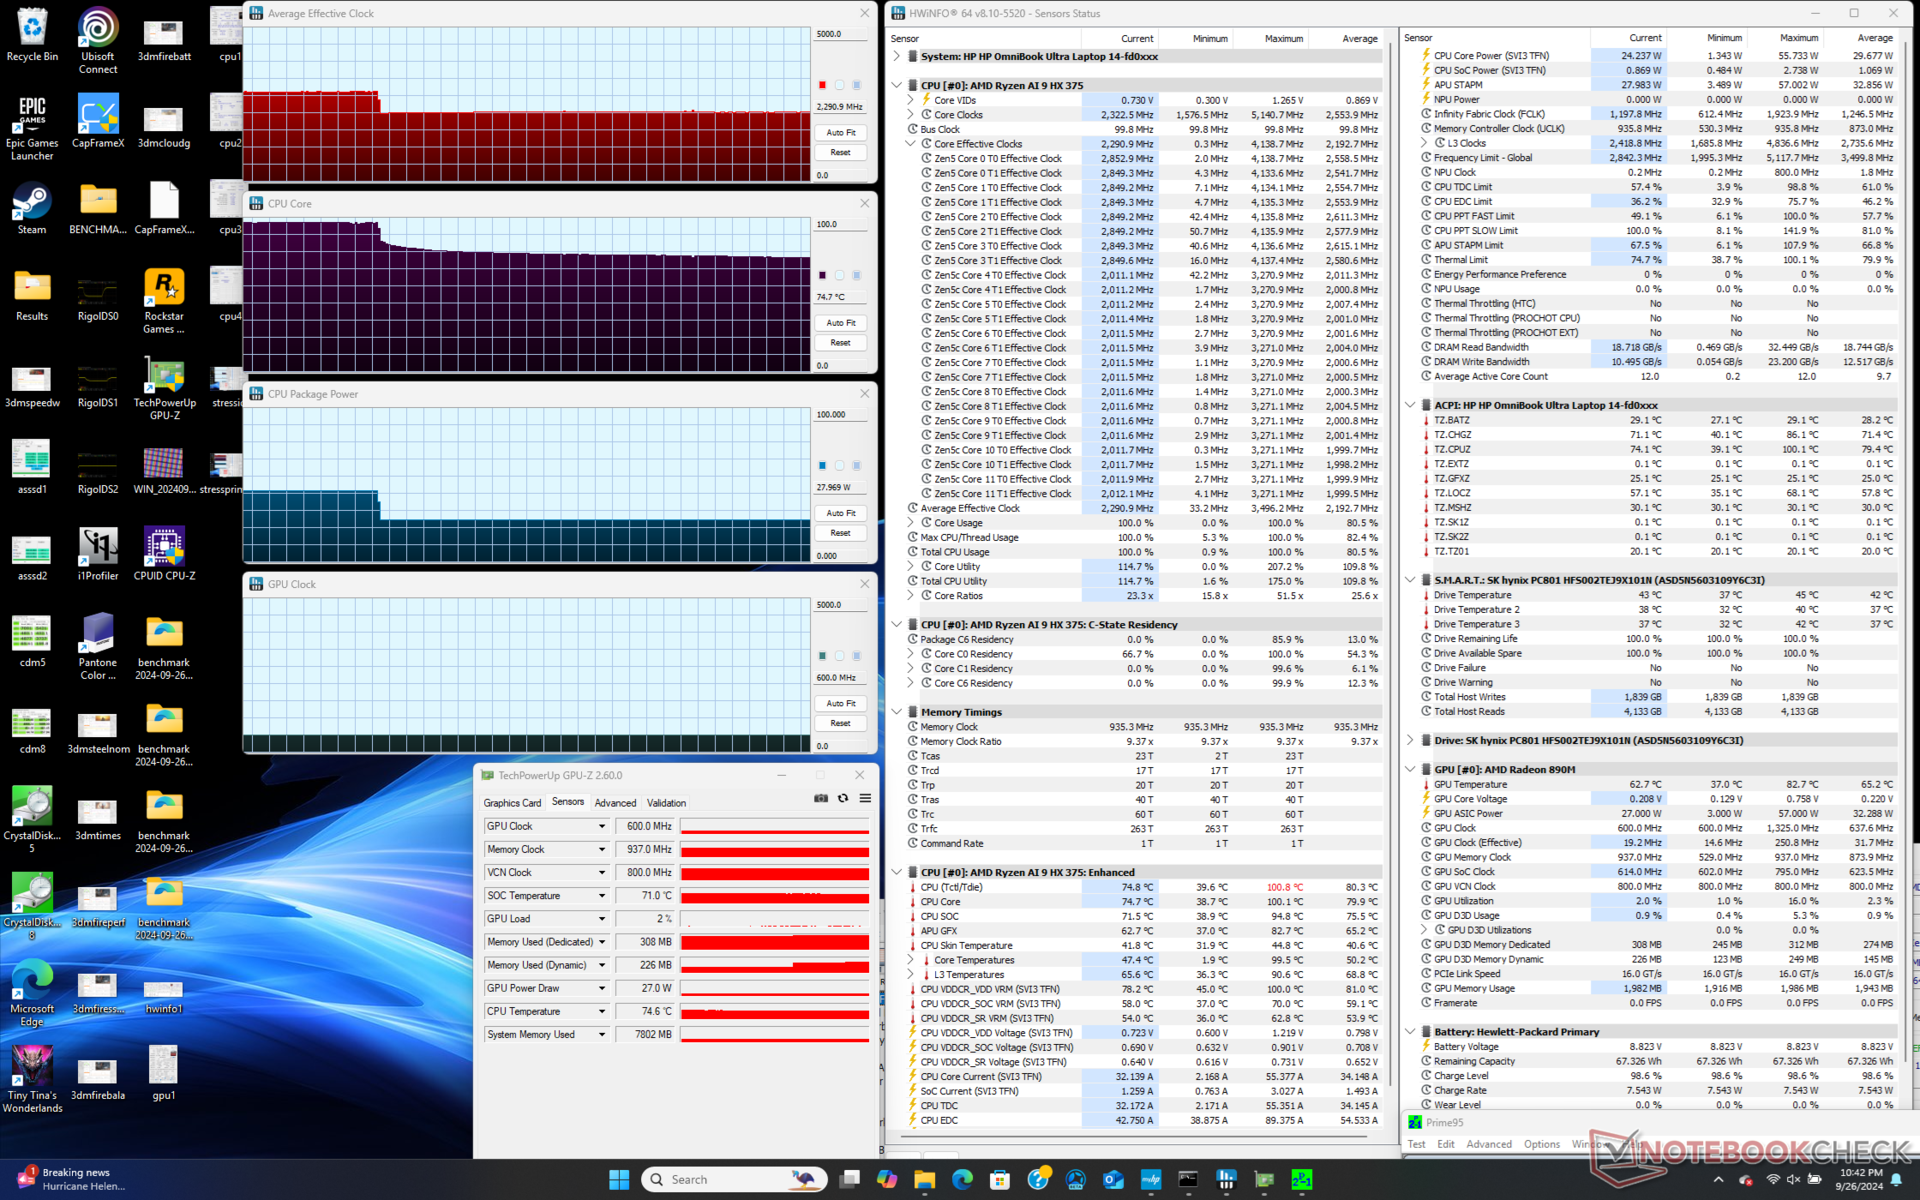
Stresstest
Als Prime95 im Performance-Modus lief, stieg die CPU für etwa eine Minute auf 3,5 GHz und 67 W, bevor sie sich bei 3 GHz und 47 W stabilisierte. Die Kerntemperatur war mit über 97 °C sehr hoch, was darauf hindeutete, dass HP so viel Leistung wie möglich herausholte, während die Kühllösung an ihre Grenzen stieß. Der Leistungsabfall war relativ gering, vor allem im Vergleich zu Subnotebooks, die mit Prozessoren der U-Serie betrieben wurden.
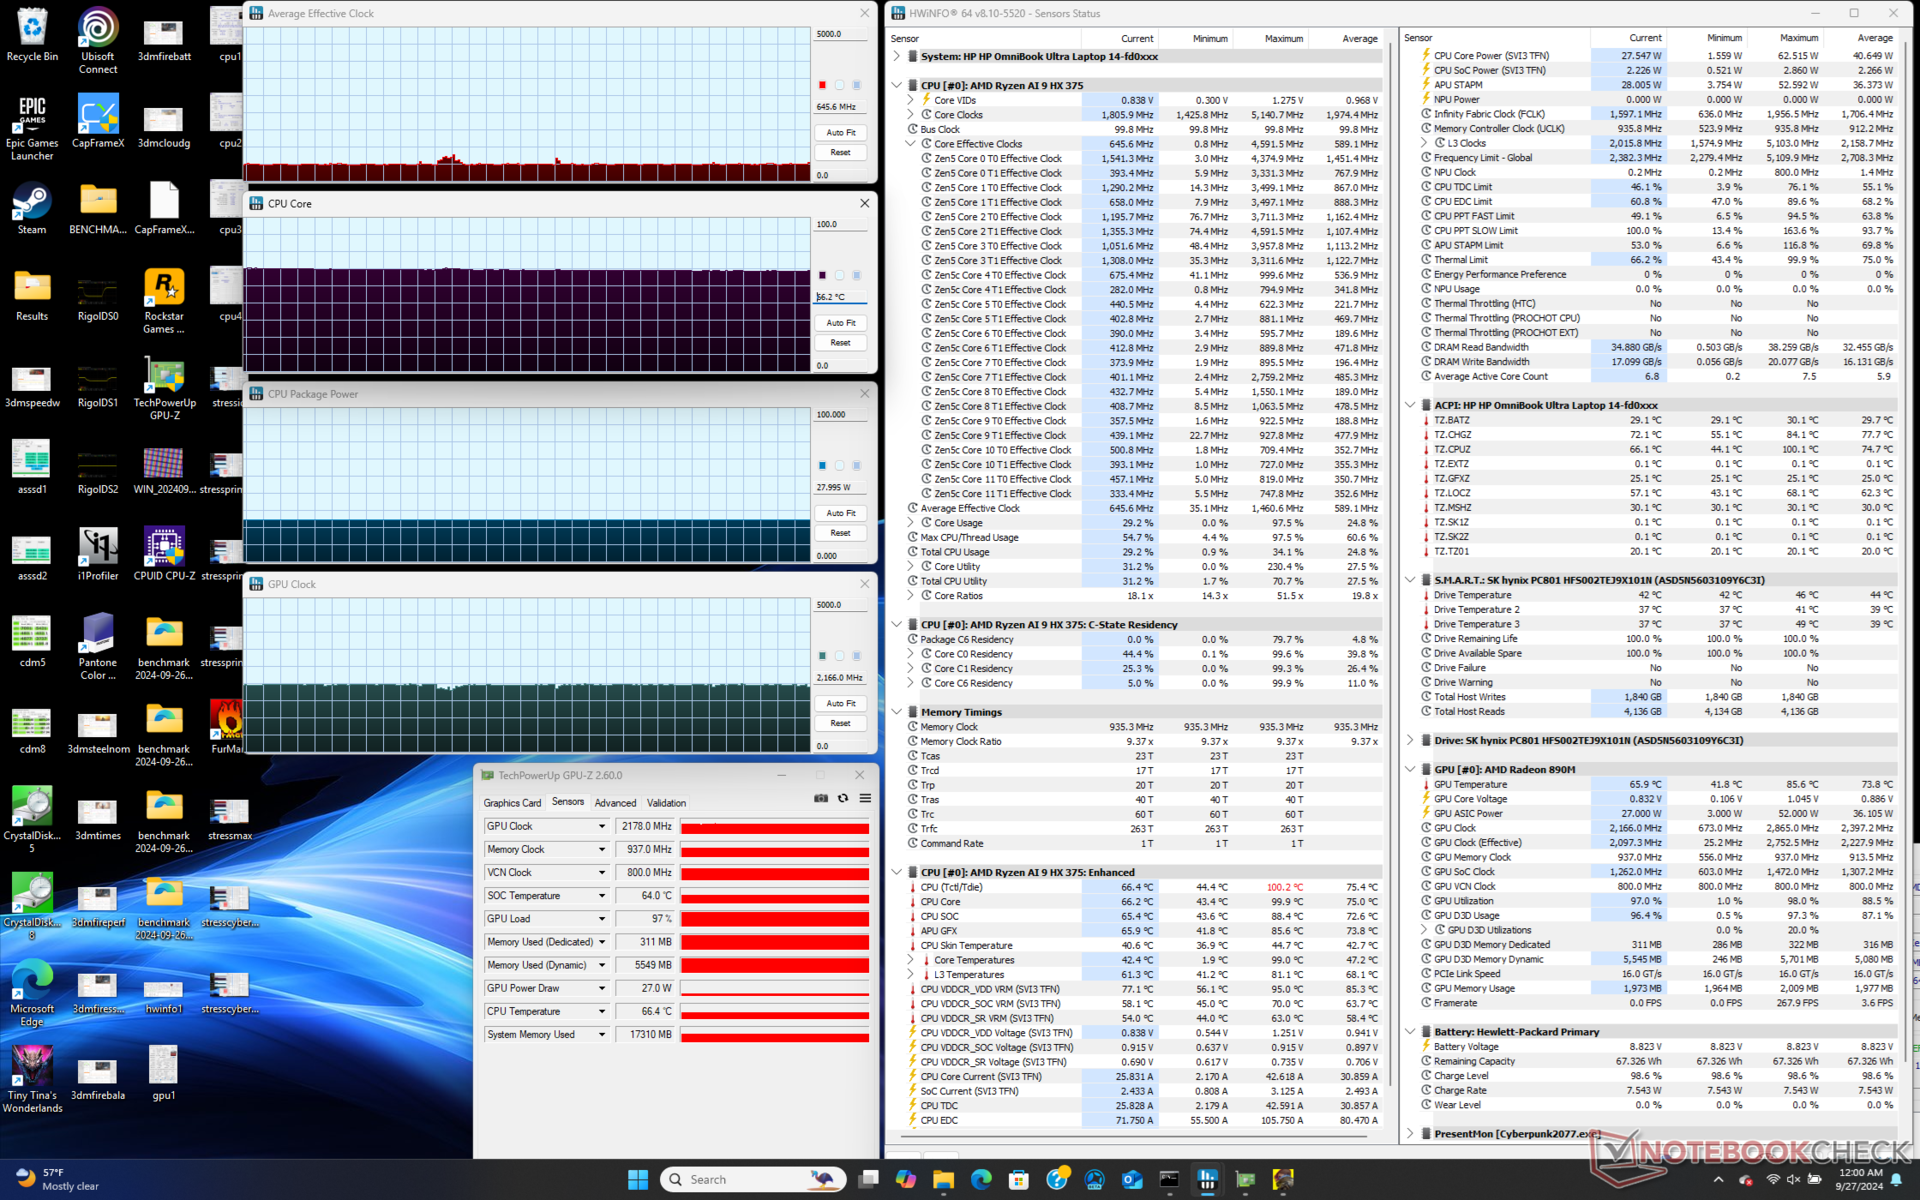
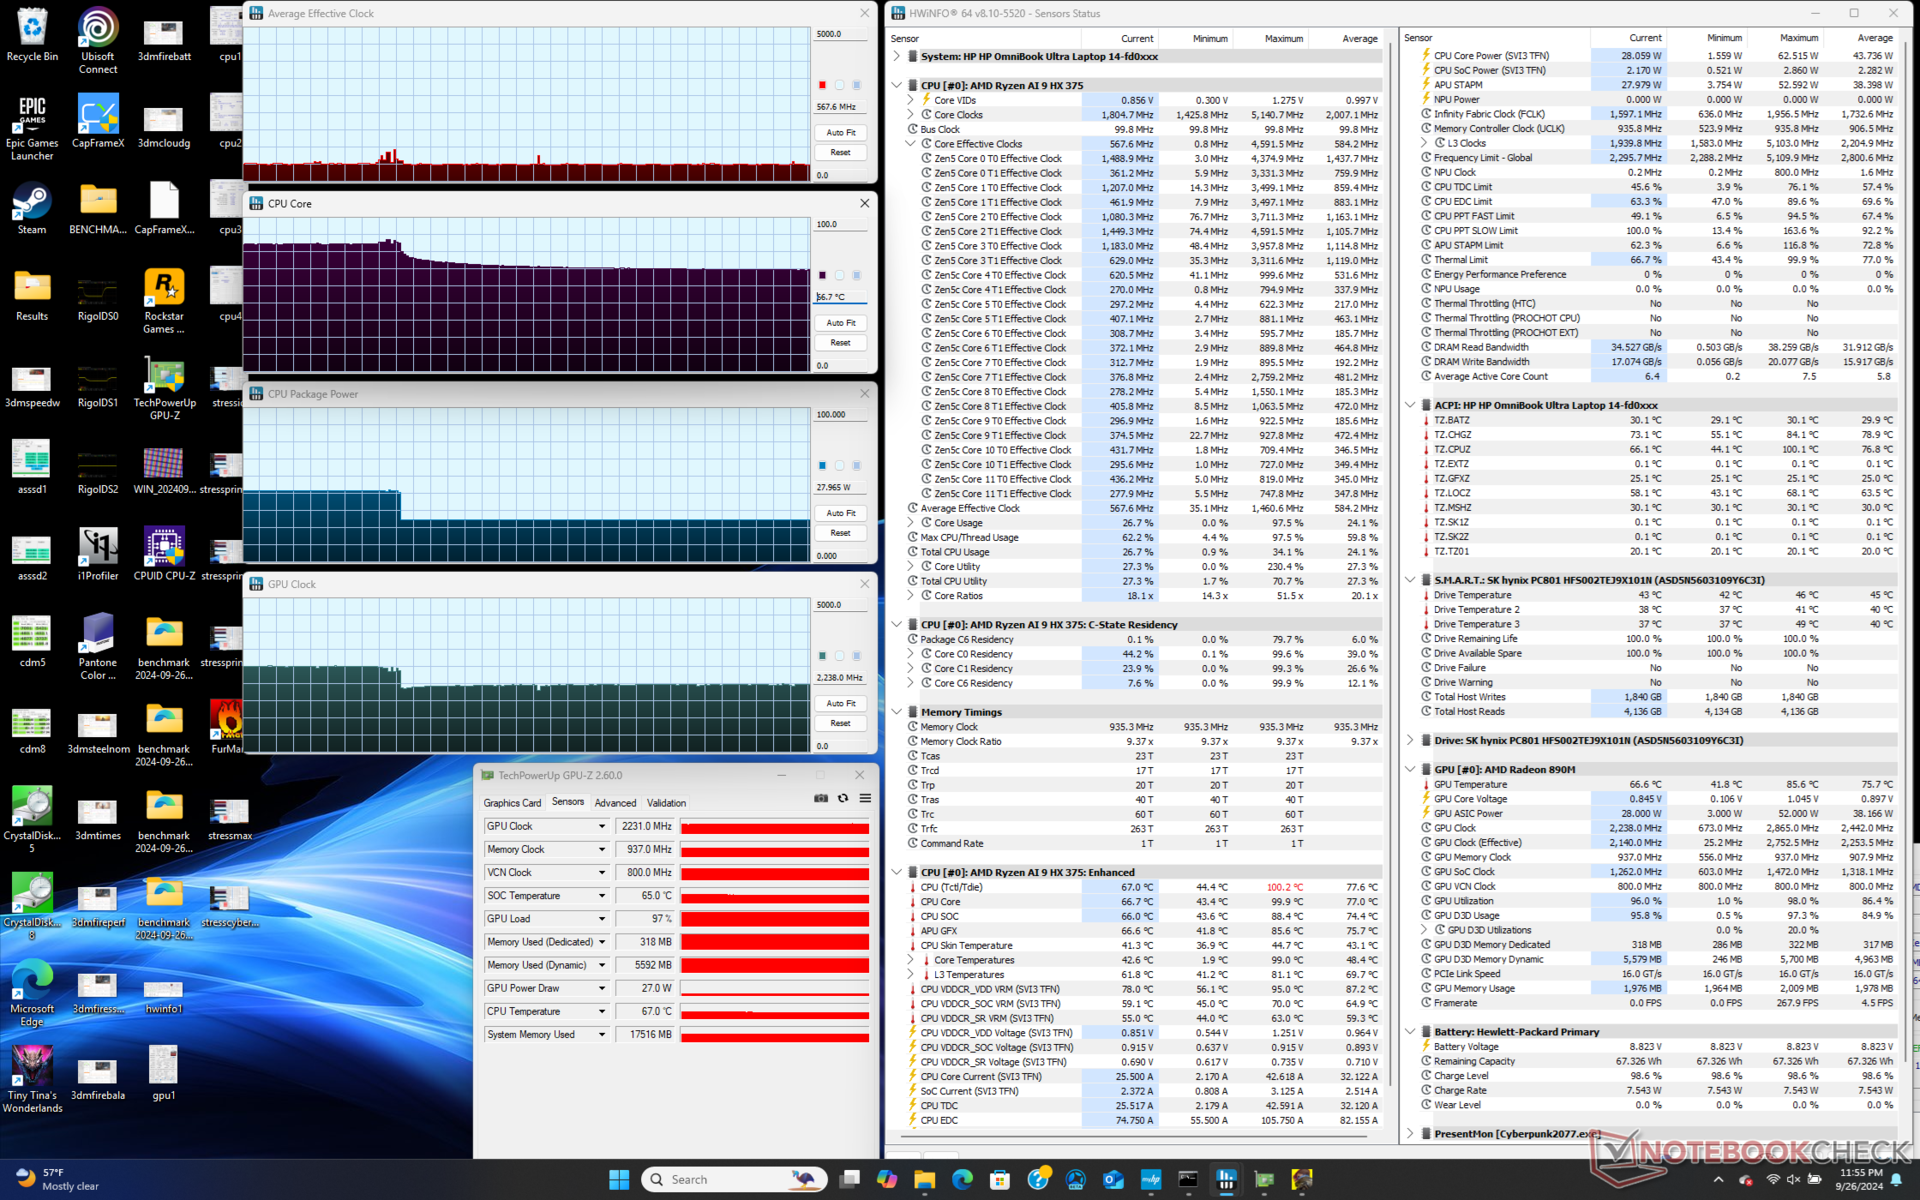
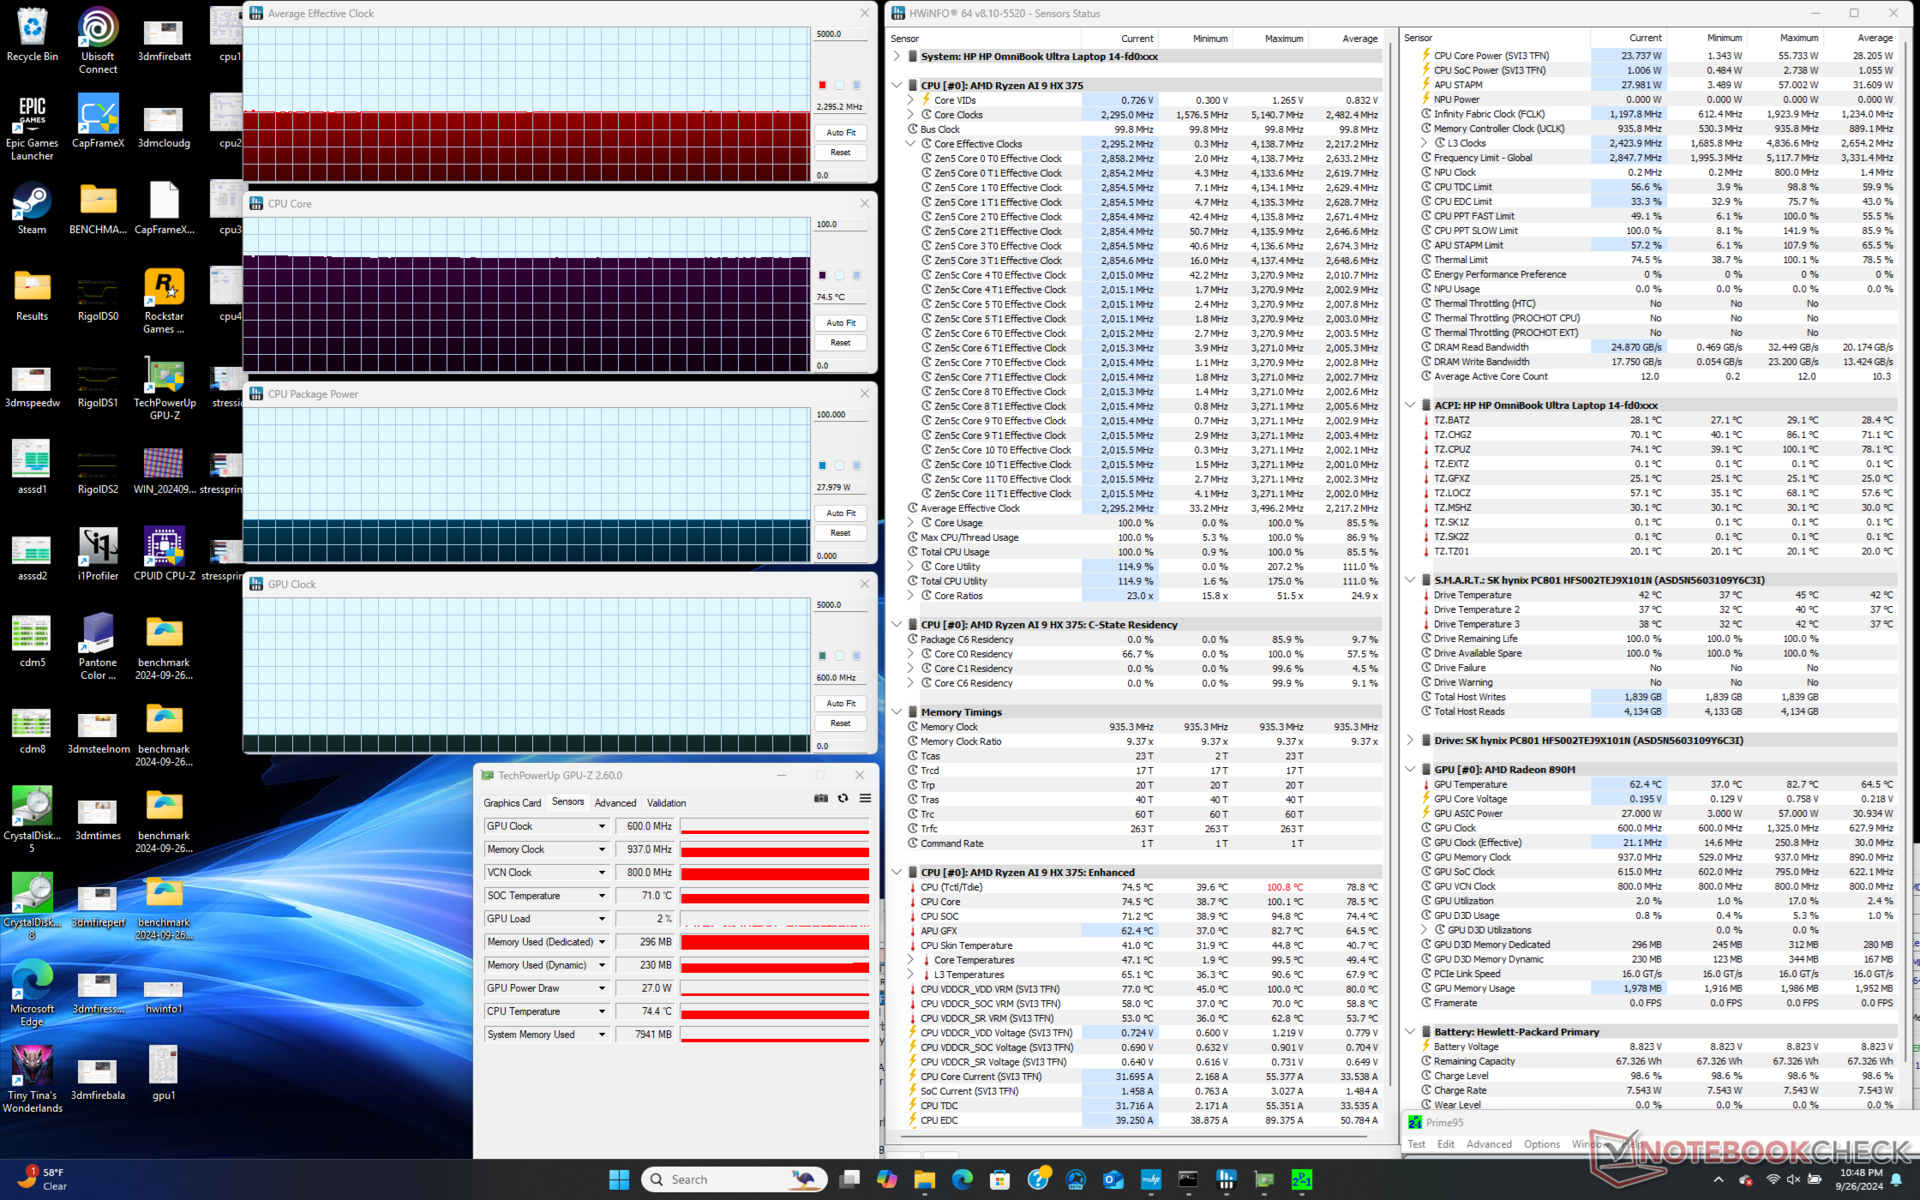
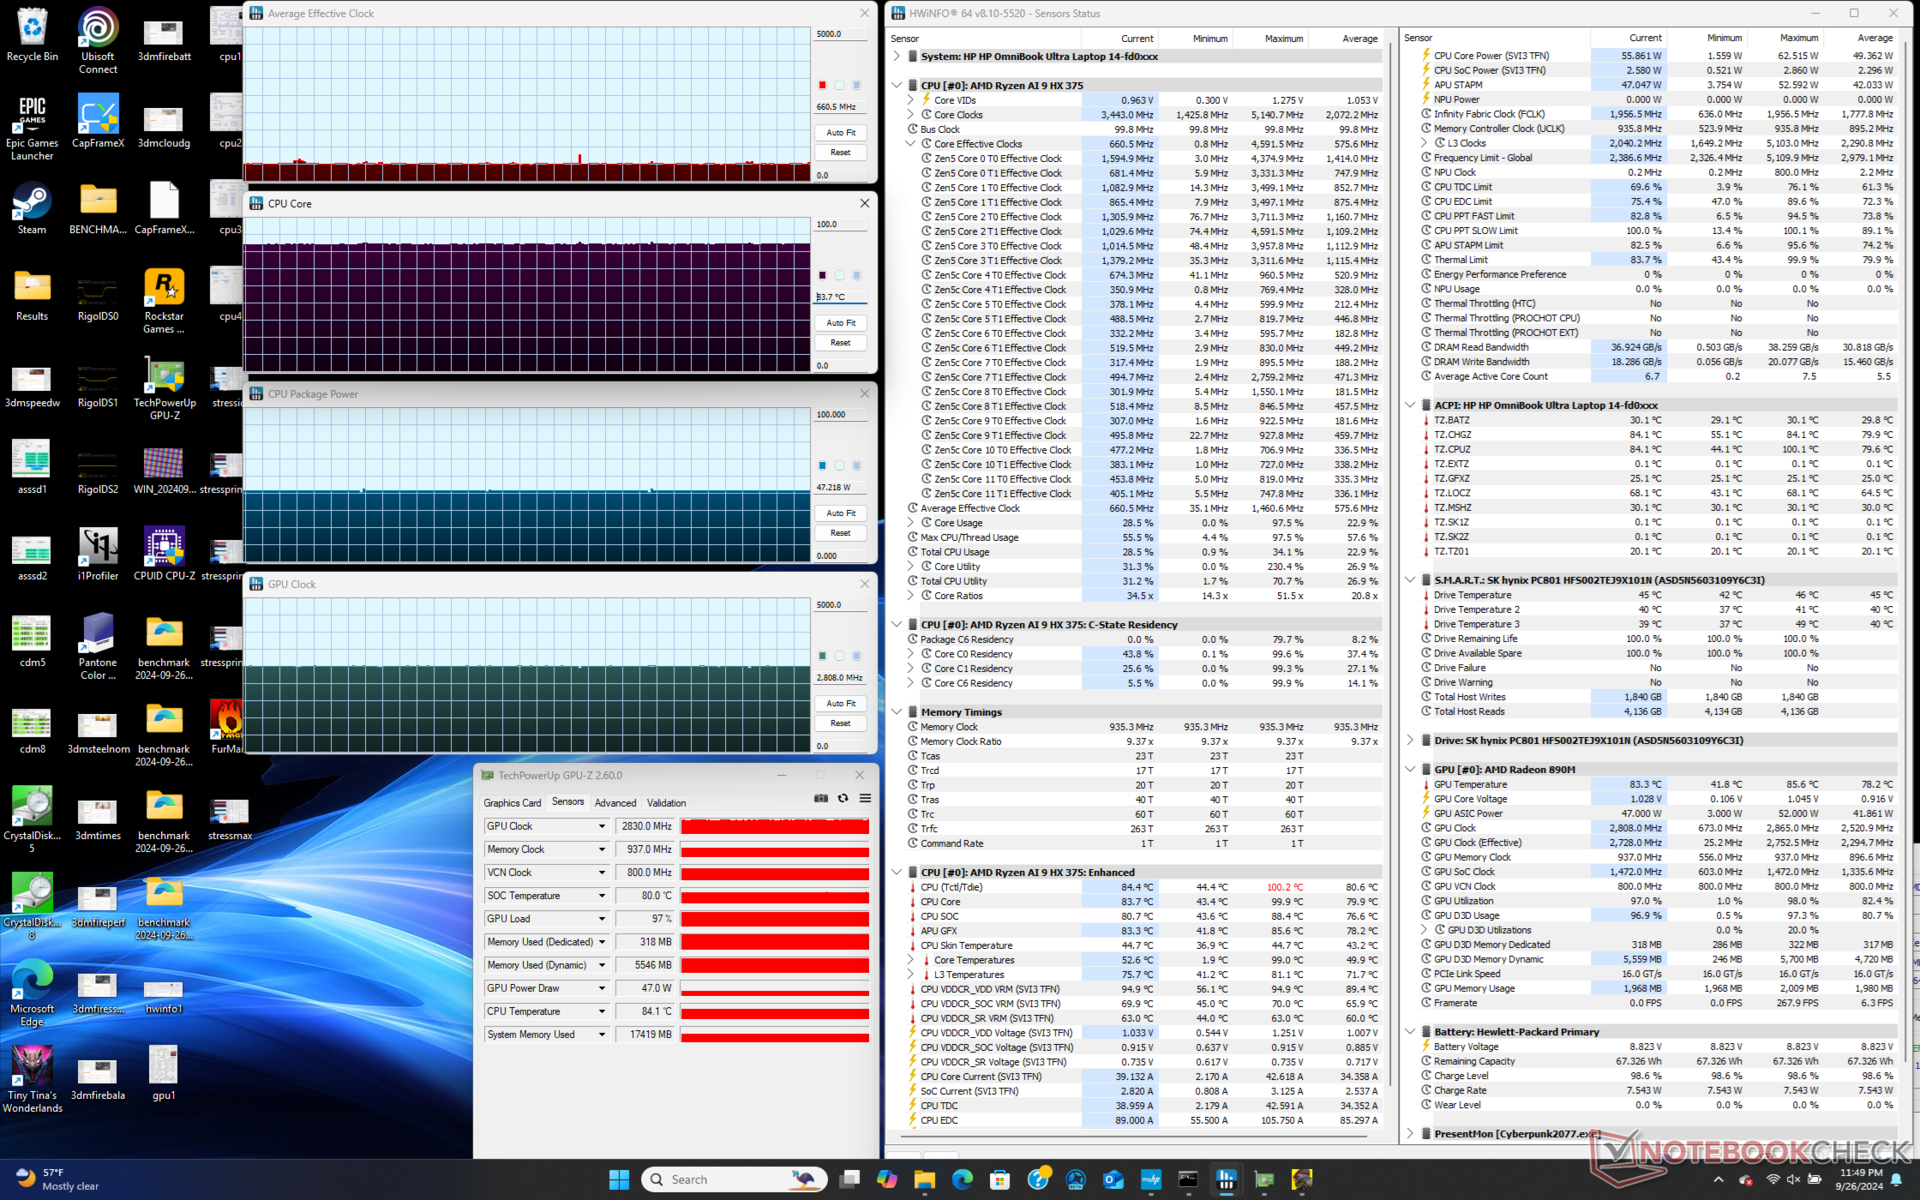
Die iGPU stabilisierte sich bei 2830 MHz und 84 °C mit einer GPU-Leistungsaufnahme von 47 W, als Cyberpunk 2077 im Performance-Modus lief. Im Balanced-Modus sanken diese Werte auf 2231 MHz, 57 °C und 27 W. Man musste also die lauteren Lüfter und wärmeren Temperaturen des Performance-Modus in Kauf nehmen, wenn man das Beste aus dem Gerät herausholen wollte.
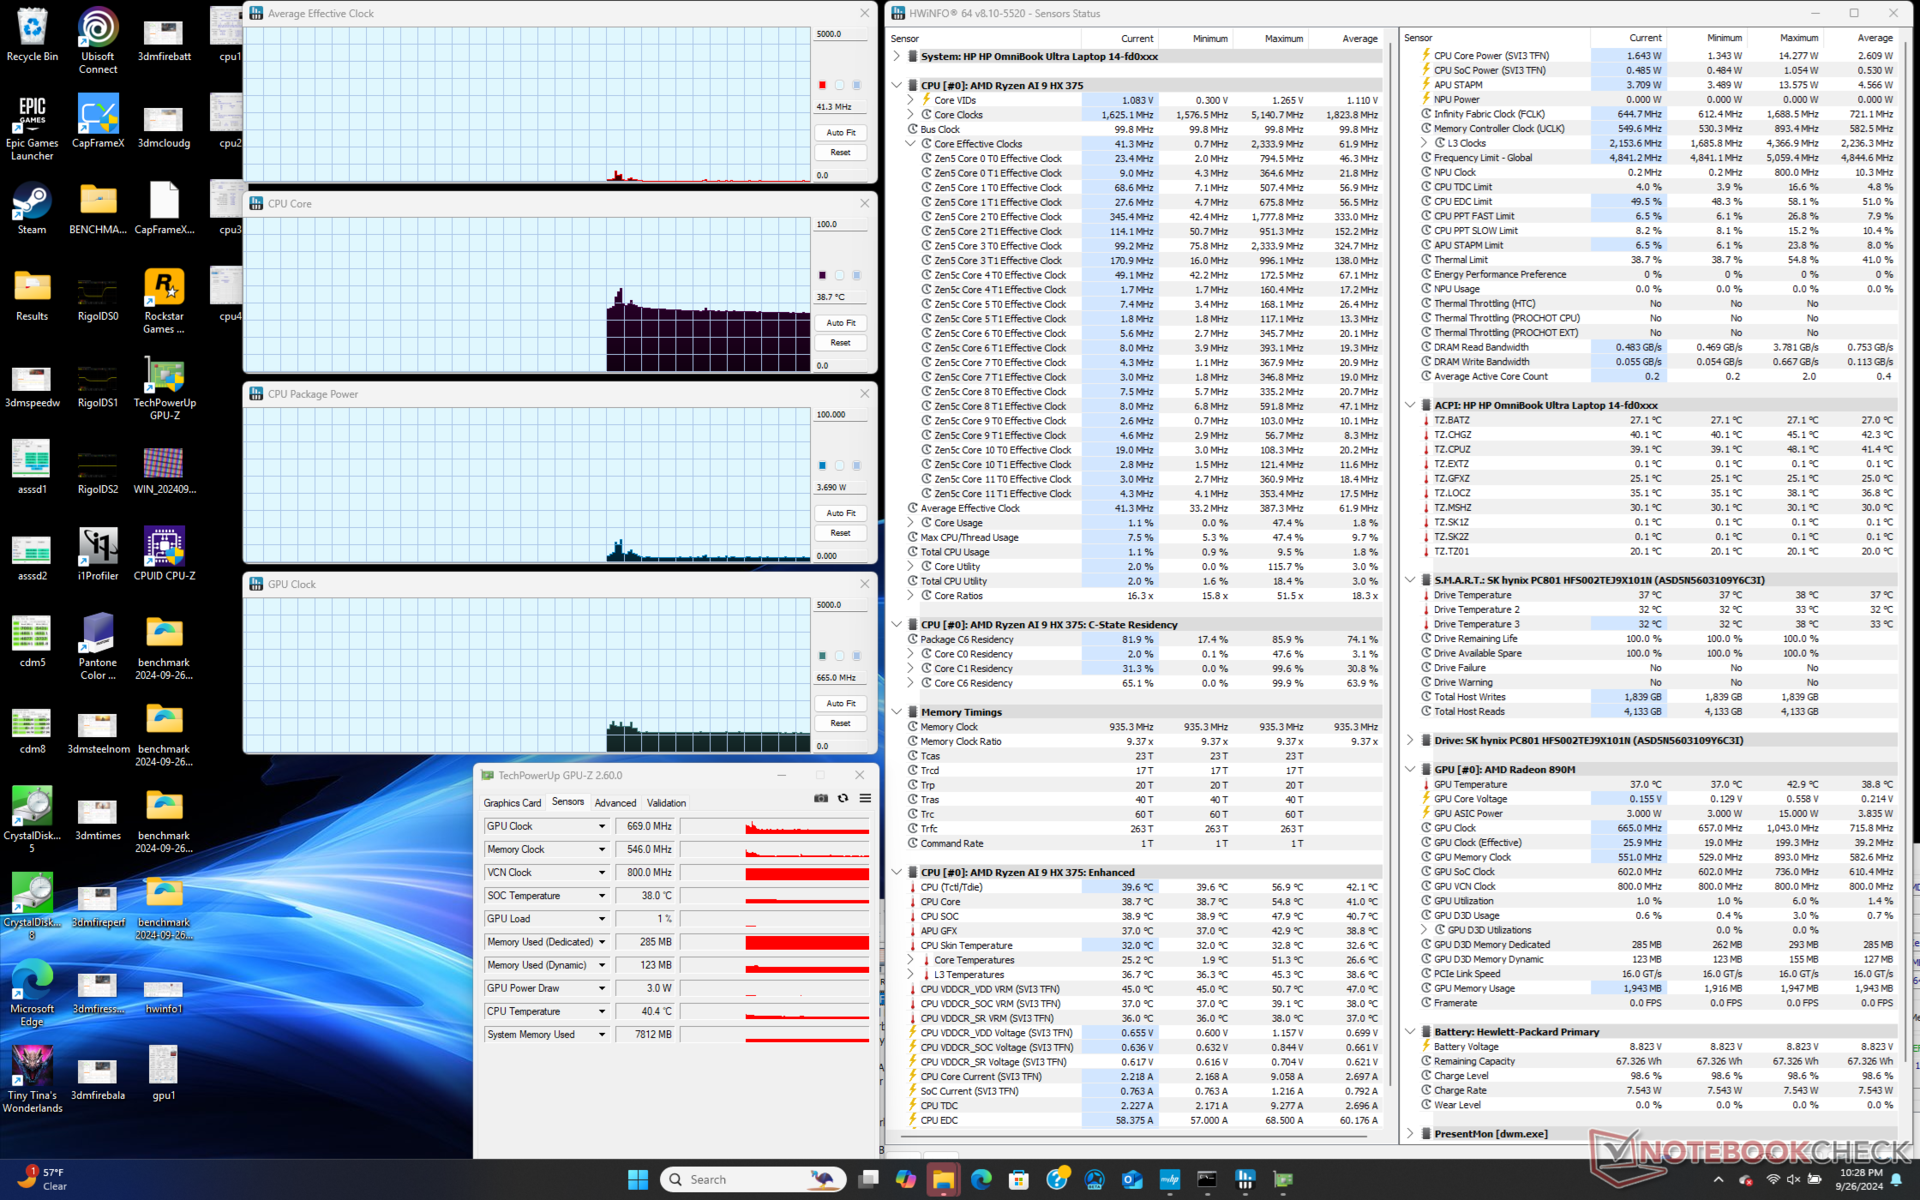
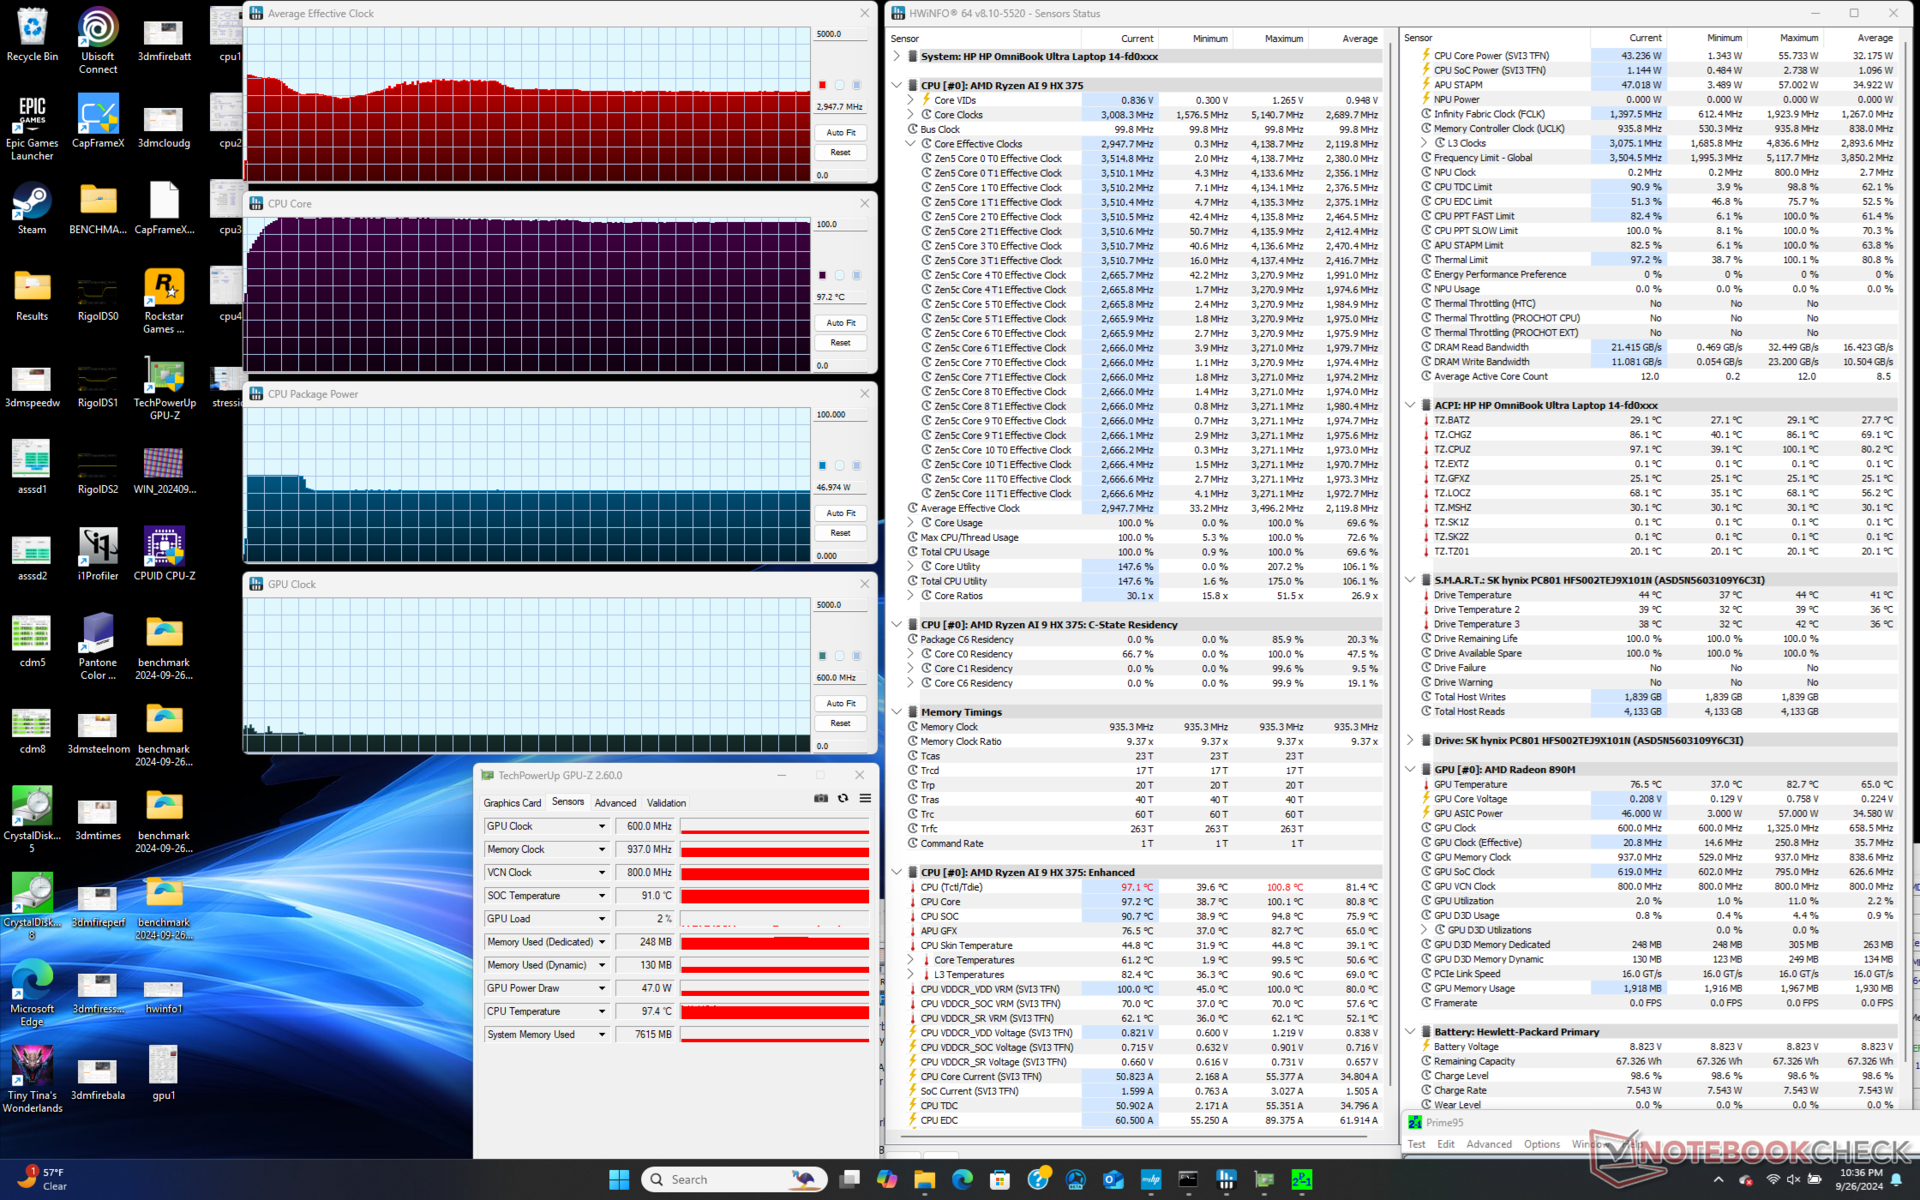

| Durchschnittlicher CPU-Takt (GHz) | GPU-Takt (MHz) | Durchschnittliche CPU-Temperatur (°C) | |
| System im Leerlauf | -- | -- | 39 |
| Prime95 Stresstest (Performance-Modus) | 3,0 | -- | 97 |
| Prime95 + FurMark Stresstest (Performance-Modus) | 3,3 | 1400 | 94 |
| Cyberpunk 2077 Stresstest (Balanced-Modus) | 0,6 | 2231 | 57 |
| Cyberpunk 2077 Stresstest (Smart Sense-Modus) | 0,7 | 2178 | 56 |
| Cyberpunk 2077 Stresstest (Performance-Modus) | 0,7 | 2830 | 84 |
System Performance
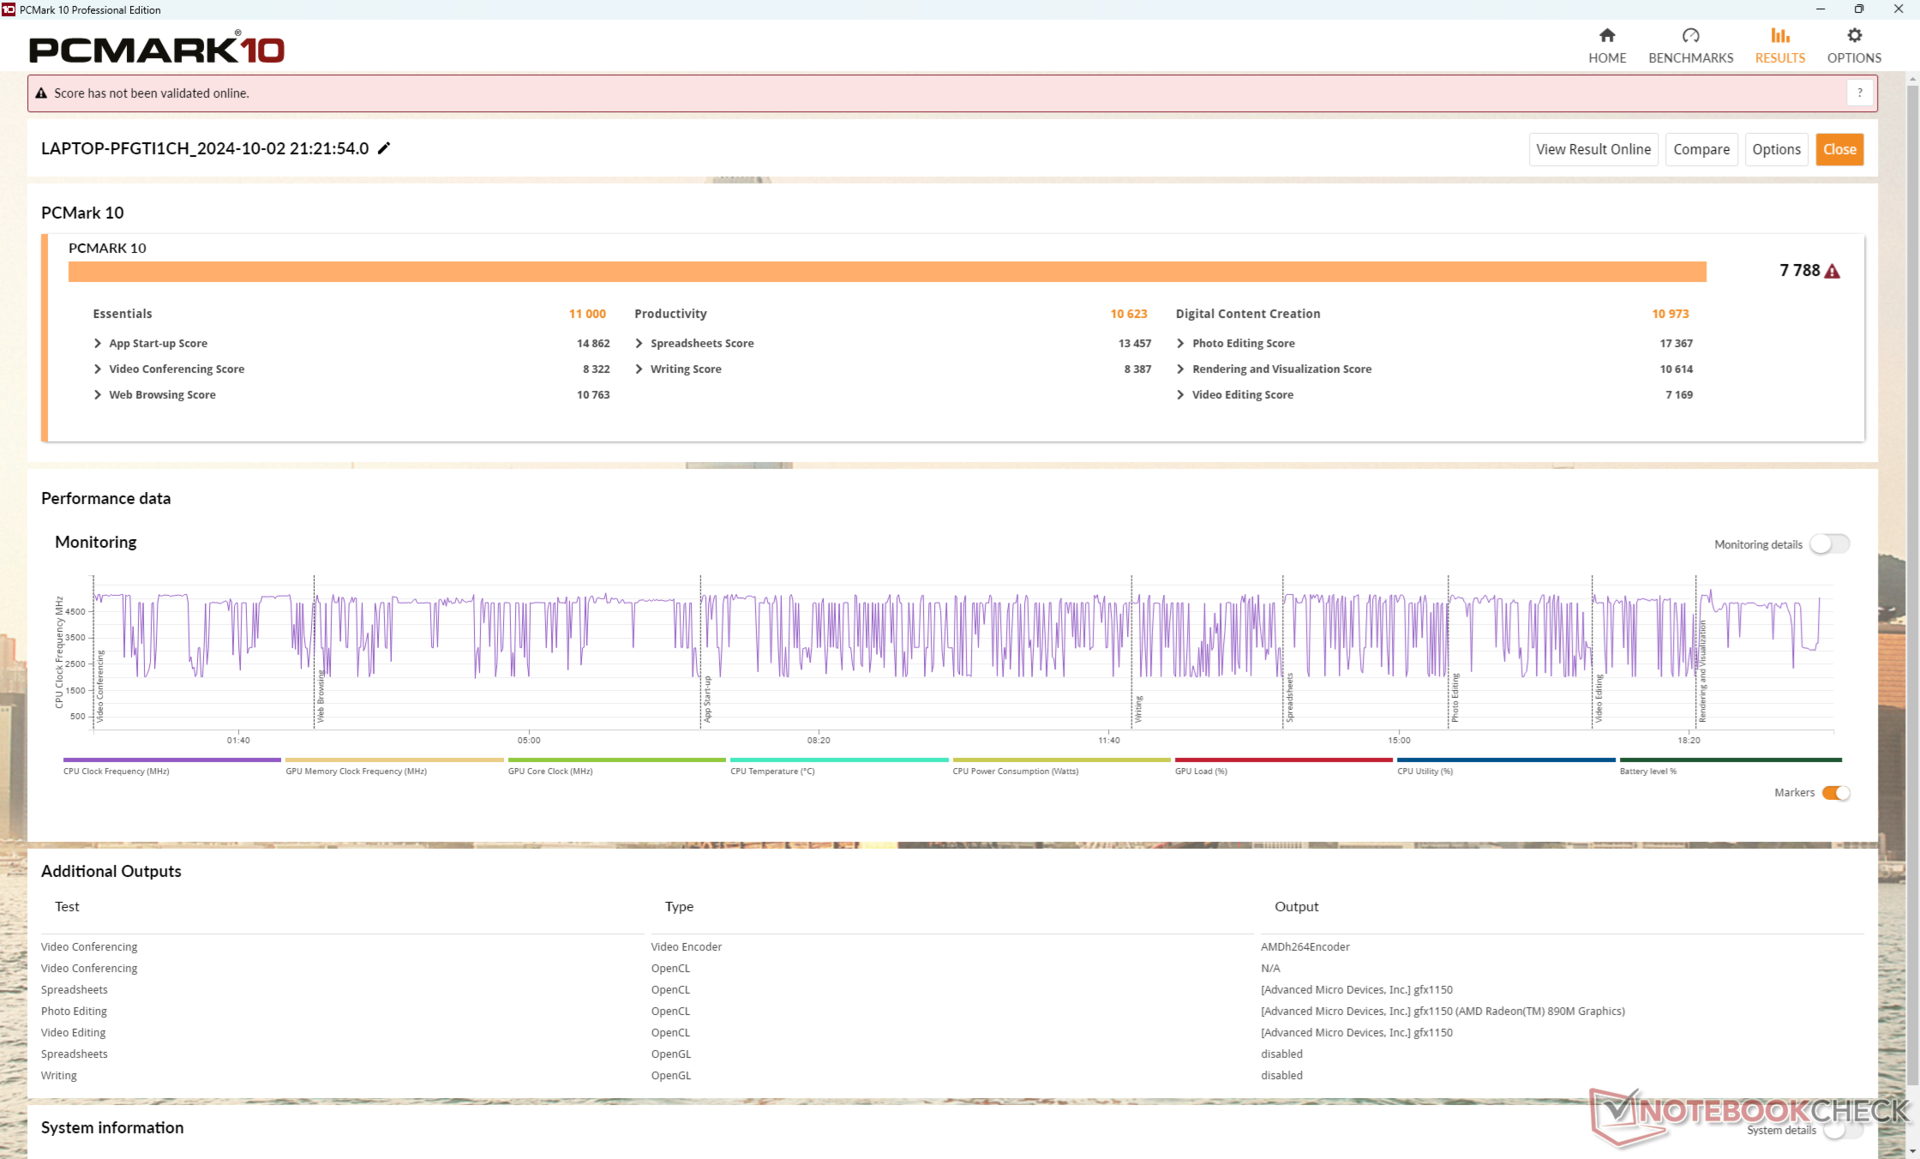
Insbesondere in den Untertests Produktivität und Erstellung digitaler Inhalte führte die hohe Anzahl von Kernen und Threads in Verbindung mit der schnellsten integrierten GPU, die damals verfügbar war, zu beeindruckenden PCMark-Ergebnissen. Bei der Bearbeitung und bei Multi-Thread-Aufgaben hatte unser HP einen Vorsprung vor der unmittelbaren Konkurrenz.
CrossMark: Overall | Productivity | Creativity | Responsiveness
WebXPRT 3: Overall
WebXPRT 4: Overall
Mozilla Kraken 1.1: Total
| PCMark 10 / Score | |
| HP OmniBook Ultra 14 | |
| Durchschnittliche AMD Ryzen AI 9 HX 375, AMD Radeon 890M (n=1) | |
| Lenovo Yoga Pro 7 14ASP G9 | |
| Asus Zenbook S 14 UX5406 | |
| HP Spectre x360 14-eu0078ng | |
| Dell XPS 14 2024 OLED | |
| PCMark 10 / Essentials | |
| Lenovo Yoga Pro 7 14ASP G9 | |
| HP Spectre x360 14-eu0078ng | |
| HP OmniBook Ultra 14 | |
| Durchschnittliche AMD Ryzen AI 9 HX 375, AMD Radeon 890M (n=1) | |
| Dell XPS 14 2024 OLED | |
| Asus Zenbook S 14 UX5406 | |
| PCMark 10 / Productivity | |
| HP OmniBook Ultra 14 | |
| Durchschnittliche AMD Ryzen AI 9 HX 375, AMD Radeon 890M (n=1) | |
| Lenovo Yoga Pro 7 14ASP G9 | |
| Asus Zenbook S 14 UX5406 | |
| Dell XPS 14 2024 OLED | |
| HP Spectre x360 14-eu0078ng | |
| PCMark 10 / Digital Content Creation | |
| HP OmniBook Ultra 14 | |
| Durchschnittliche AMD Ryzen AI 9 HX 375, AMD Radeon 890M (n=1) | |
| Lenovo Yoga Pro 7 14ASP G9 | |
| Asus Zenbook S 14 UX5406 | |
| HP Spectre x360 14-eu0078ng | |
| Dell XPS 14 2024 OLED | |
| CrossMark / Overall | |
| HP OmniBook Ultra 14 | |
| Durchschnittliche AMD Ryzen AI 9 HX 375, AMD Radeon 890M (n=1) | |
| Dell XPS 14 2024 OLED | |
| Lenovo Yoga Pro 7 14ASP G9 | |
| Asus Zenbook S 14 UX5406 | |
| Samsung Galaxy Book4 Edge 14 | |
| HP Spectre x360 14-eu0078ng | |
| CrossMark / Productivity | |
| HP OmniBook Ultra 14 | |
| Durchschnittliche AMD Ryzen AI 9 HX 375, AMD Radeon 890M (n=1) | |
| Dell XPS 14 2024 OLED | |
| Asus Zenbook S 14 UX5406 | |
| Lenovo Yoga Pro 7 14ASP G9 | |
| Samsung Galaxy Book4 Edge 14 | |
| HP Spectre x360 14-eu0078ng | |
| CrossMark / Creativity | |
| Lenovo Yoga Pro 7 14ASP G9 | |
| HP OmniBook Ultra 14 | |
| Durchschnittliche AMD Ryzen AI 9 HX 375, AMD Radeon 890M (n=1) | |
| Dell XPS 14 2024 OLED | |
| Asus Zenbook S 14 UX5406 | |
| HP Spectre x360 14-eu0078ng | |
| Samsung Galaxy Book4 Edge 14 | |
| CrossMark / Responsiveness | |
| HP OmniBook Ultra 14 | |
| Durchschnittliche AMD Ryzen AI 9 HX 375, AMD Radeon 890M (n=1) | |
| Dell XPS 14 2024 OLED | |
| Samsung Galaxy Book4 Edge 14 | |
| Asus Zenbook S 14 UX5406 | |
| Lenovo Yoga Pro 7 14ASP G9 | |
| HP Spectre x360 14-eu0078ng | |
| WebXPRT 3 / Overall | |
| Samsung Galaxy Book4 Edge 14 | |
| HP OmniBook Ultra 14 | |
| Durchschnittliche AMD Ryzen AI 9 HX 375, AMD Radeon 890M (n=1) | |
| Lenovo Yoga Pro 7 14ASP G9 | |
| HP Spectre x360 14-eu0078ng | |
| Dell XPS 14 2024 OLED | |
| Asus Zenbook S 14 UX5406 | |
| WebXPRT 4 / Overall | |
| Samsung Galaxy Book4 Edge 14 | |
| HP OmniBook Ultra 14 | |
| Durchschnittliche AMD Ryzen AI 9 HX 375, AMD Radeon 890M (n=1) | |
| Lenovo Yoga Pro 7 14ASP G9 | |
| HP Spectre x360 14-eu0078ng | |
| Dell XPS 14 2024 OLED | |
| Asus Zenbook S 14 UX5406 | |
| Mozilla Kraken 1.1 / Total | |
| Asus Zenbook S 14 UX5406 | |
| HP Spectre x360 14-eu0078ng | |
| Dell XPS 14 2024 OLED | |
| Lenovo Yoga Pro 7 14ASP G9 | |
| HP OmniBook Ultra 14 | |
| Durchschnittliche AMD Ryzen AI 9 HX 375, AMD Radeon 890M (n=1) | |
| Samsung Galaxy Book4 Edge 14 | |
* ... kleinere Werte sind besser
| PCMark 10 Score | 7788 Punkte | |
Hilfe | ||
| AIDA64 / Memory Copy | |
| Asus Zenbook S 14 UX5406 | |
| HP Spectre x360 14-eu0078ng | |
| Dell XPS 14 2024 OLED | |
| HP OmniBook Ultra 14 | |
| Durchschnittliche AMD Ryzen AI 9 HX 375 (n=1) | |
| Lenovo Yoga Pro 7 14ASP G9 | |
| Samsung Galaxy Book4 Edge 14 | |
| AIDA64 / Memory Read | |
| HP OmniBook Ultra 14 | |
| Durchschnittliche AMD Ryzen AI 9 HX 375 (n=1) | |
| Lenovo Yoga Pro 7 14ASP G9 | |
| HP Spectre x360 14-eu0078ng | |
| Dell XPS 14 2024 OLED | |
| Asus Zenbook S 14 UX5406 | |
| Samsung Galaxy Book4 Edge 14 | |
| AIDA64 / Memory Write | |
| Asus Zenbook S 14 UX5406 | |
| Lenovo Yoga Pro 7 14ASP G9 | |
| HP OmniBook Ultra 14 | |
| Durchschnittliche AMD Ryzen AI 9 HX 375 (n=1) | |
| Dell XPS 14 2024 OLED | |
| HP Spectre x360 14-eu0078ng | |
| Samsung Galaxy Book4 Edge 14 | |
| AIDA64 / Memory Latency | |
| HP Spectre x360 14-eu0078ng | |
| Dell XPS 14 2024 OLED | |
| HP OmniBook Ultra 14 | |
| Durchschnittliche AMD Ryzen AI 9 HX 375 (n=1) | |
| Lenovo Yoga Pro 7 14ASP G9 | |
| Asus Zenbook S 14 UX5406 | |
| Samsung Galaxy Book4 Edge 14 | |
* ... kleinere Werte sind besser
Massenspeicher
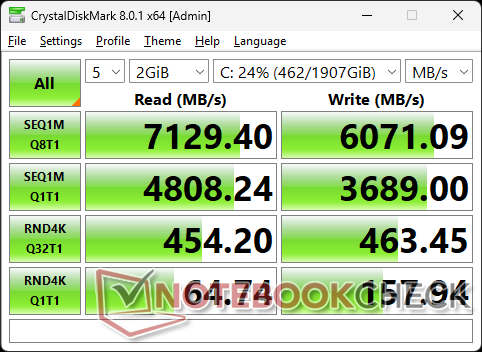
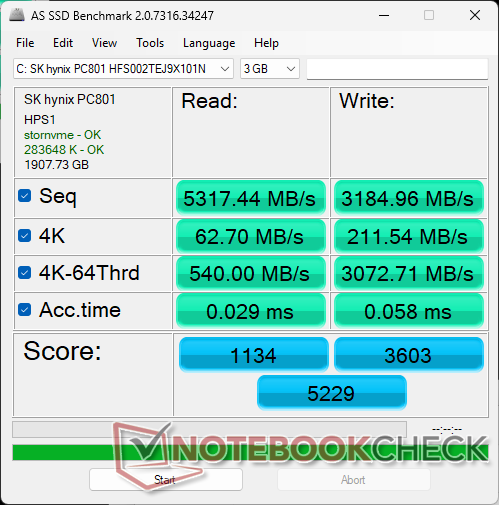
Unser Gerät wurde mit einer 2 TB SK Hynix PC801 PCIe4 x4 NVMe SSD anstelle der Kioxia XG8 geliefert, die im Spectre x360 14 zu finden war. Die Übertragungsraten waren hervorragend und vergleichbar mit der Samsung PM9A1, die ohne Probleme Geschwindigkeiten von über 7100 MB/s erreichte.

| Drive Performance Rating - Percent | |
| HP OmniBook Ultra 14 | |
| Dell XPS 14 2024 OLED | |
| Lenovo Yoga Pro 7 14ASP G9 | |
| HP Spectre x360 14-eu0078ng | |
| Samsung Galaxy Book4 Edge 14 | |
| Asus Zenbook S 14 UX5406 | |
* ... kleinere Werte sind besser
Dauerleistung Lesen: DiskSpd Read Loop, Queue Depth 8
GPU Performance
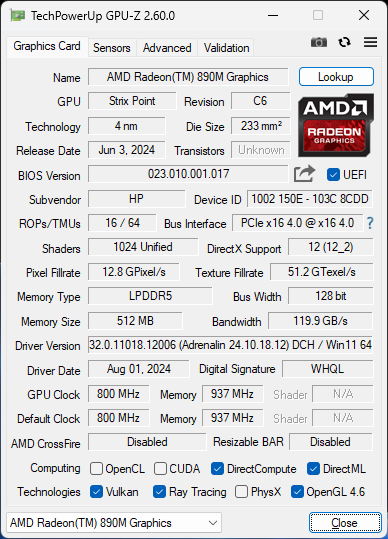
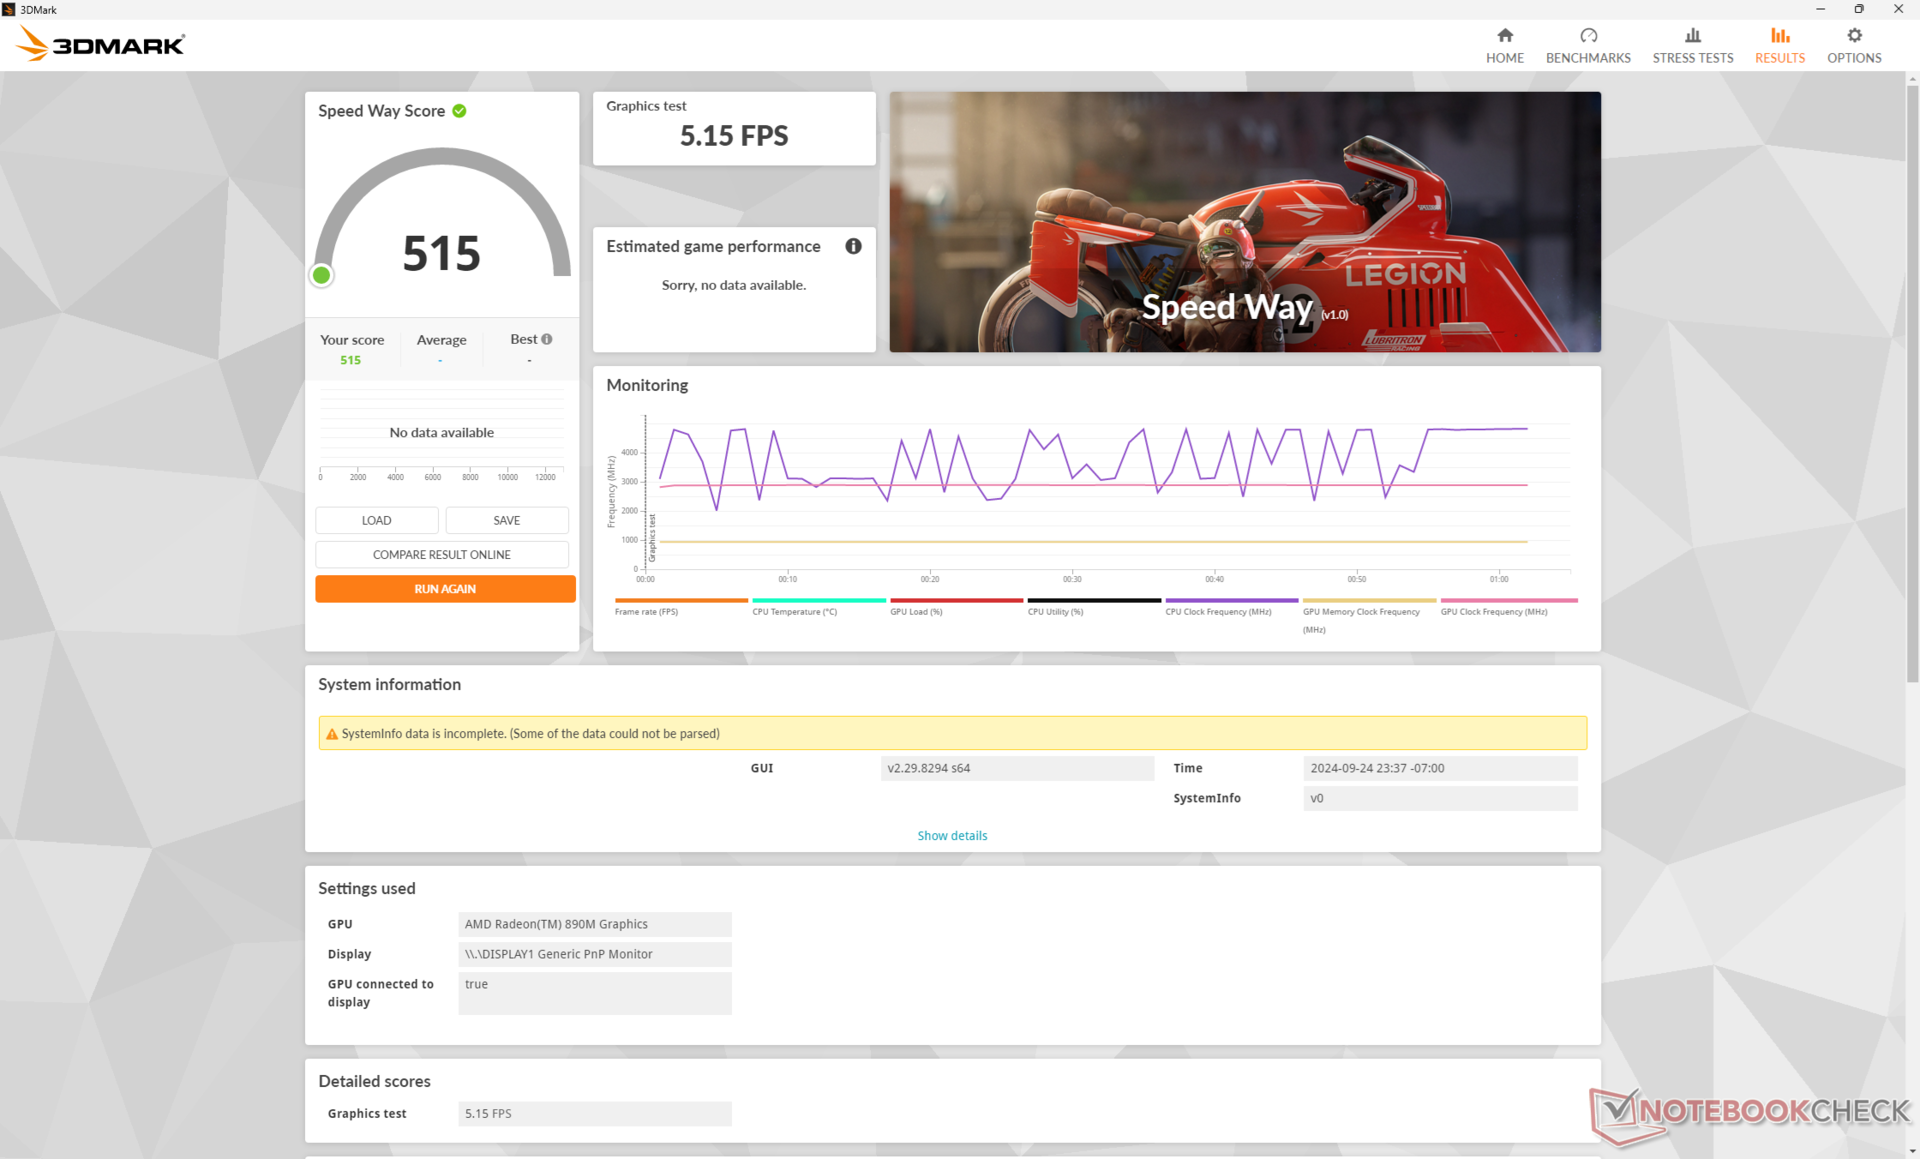
Die Radeon 890M bietet eine größere Steigerung der Grafikleistung als die Radeon 780M, verglichen mit dem Sprung von der Radeon 680M zur 780M. Den größten Schub gibt es bei DX12-Titeln, bei denen die 890M laut 3DMark-Benchmarks zwischen 30 und 40 Prozent schneller sein kann als die bisherige 780M. Bei DX11-Titeln wird eine geringere Steigerung von nur 10 bis 20 Prozent erwartet.
Während die neuere Arc Graphics 140V bei synthetischen Benchmarks mit der neuen AMD-Lösung gleichauf liegt, bleibt die konkurrierende Intel Arc 8 um bis zu 15 % hinter der Radeon 890M zurück. Allerdings ist die Leistung aufgrund unserer Ryzen 9 CPU immer noch zugunsten der Radeon 890M, wie im nächsten Abschnitt unten dargestellt.
| Energieprofile | Grafikleistung | CPU-Leistung | Gesamtwert |
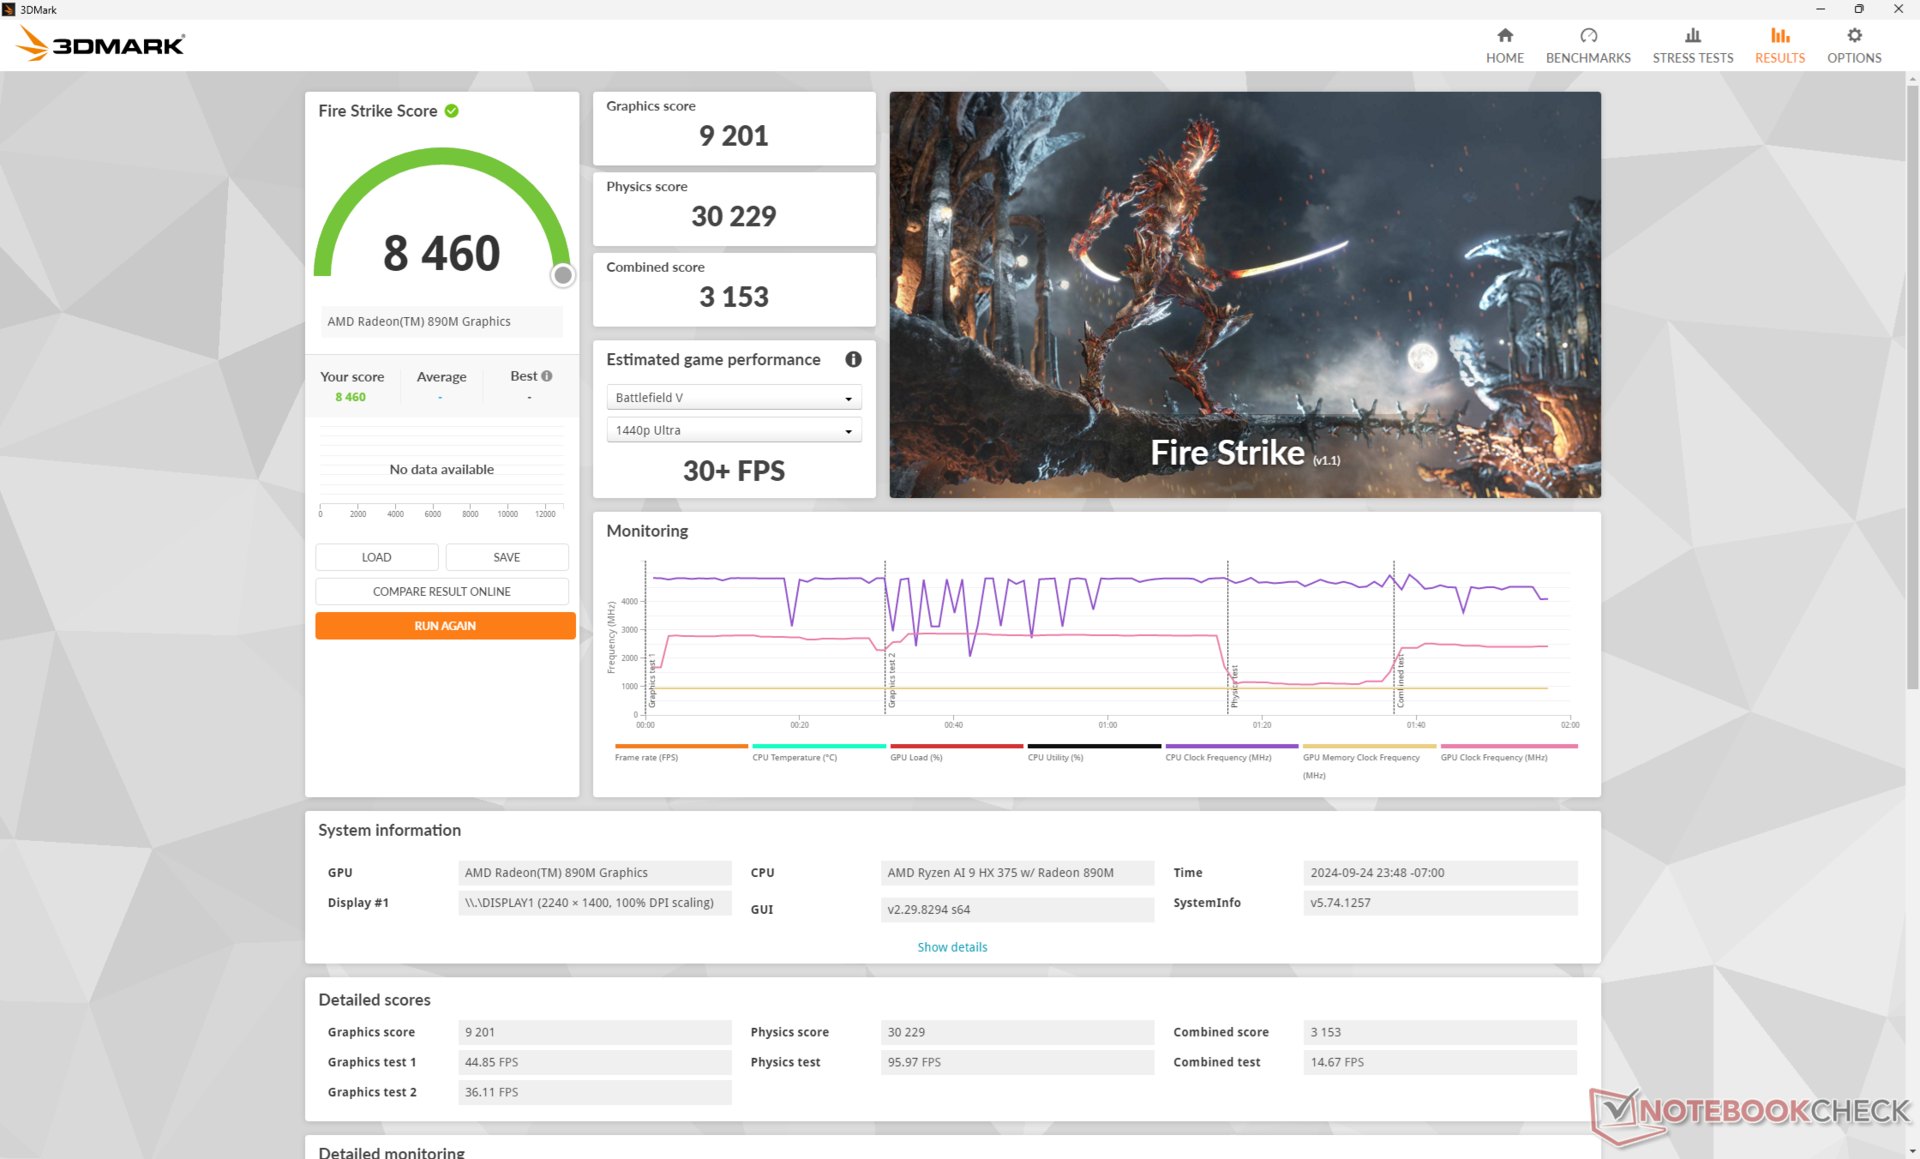
| Performance-Modus | 9.201 | 30.229 | 3.153 |
| Smart Sense-Modus | 9.134 (-1%) | 27.315 (-10%) | 3.201 (-0%) |
| Balanced-Modus | 9.149 (-1%) | 27.403 (-9%) | 3.175 (-0%) |
| Battery Power | 8.791 (-5%) | 28.073 (-7%) | 3.091 (-2%) |
Der Betrieb im Smart Sense- oder Balanced-Modus kann die Leistung um bis zu 10 % beeinträchtigen, wie unsere Fire Strike-Ergebnistabelle oben zeigt. Beim Spielen fällt das Defizit jedoch noch deutlicher aus. Wenn Sie Baldur's Gate 3 und Tiny Tina's Wonderlands mit 1080p Ultra-Einstellungen spielen, erreichen Sie durchschnittlich 31 bzw. 34 FPS, verglichen mit nur 25 bzw. 28 FPS im Smart Sense- oder Balanced-Modus.
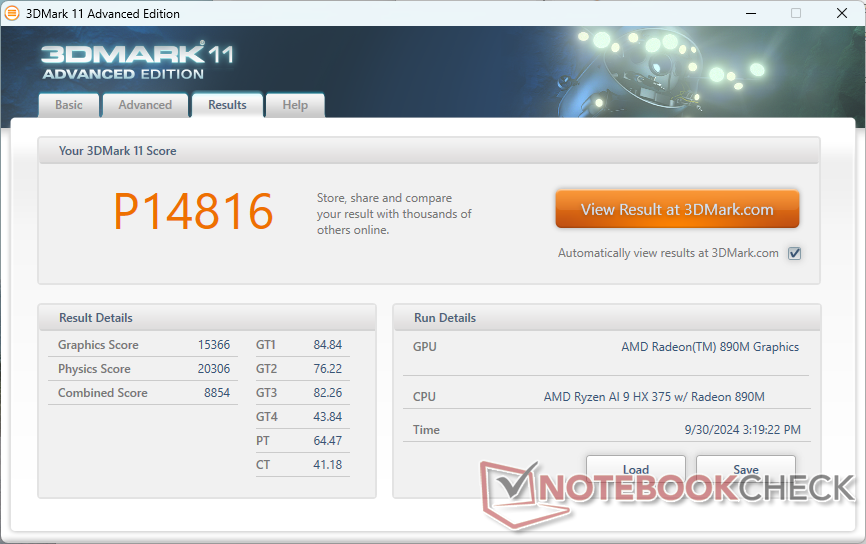
| 3DMark 11 Performance | 14816 Punkte | |
| 3DMark Cloud Gate Standard Score | 39102 Punkte | |
| 3DMark Fire Strike Score | 8460 Punkte | |
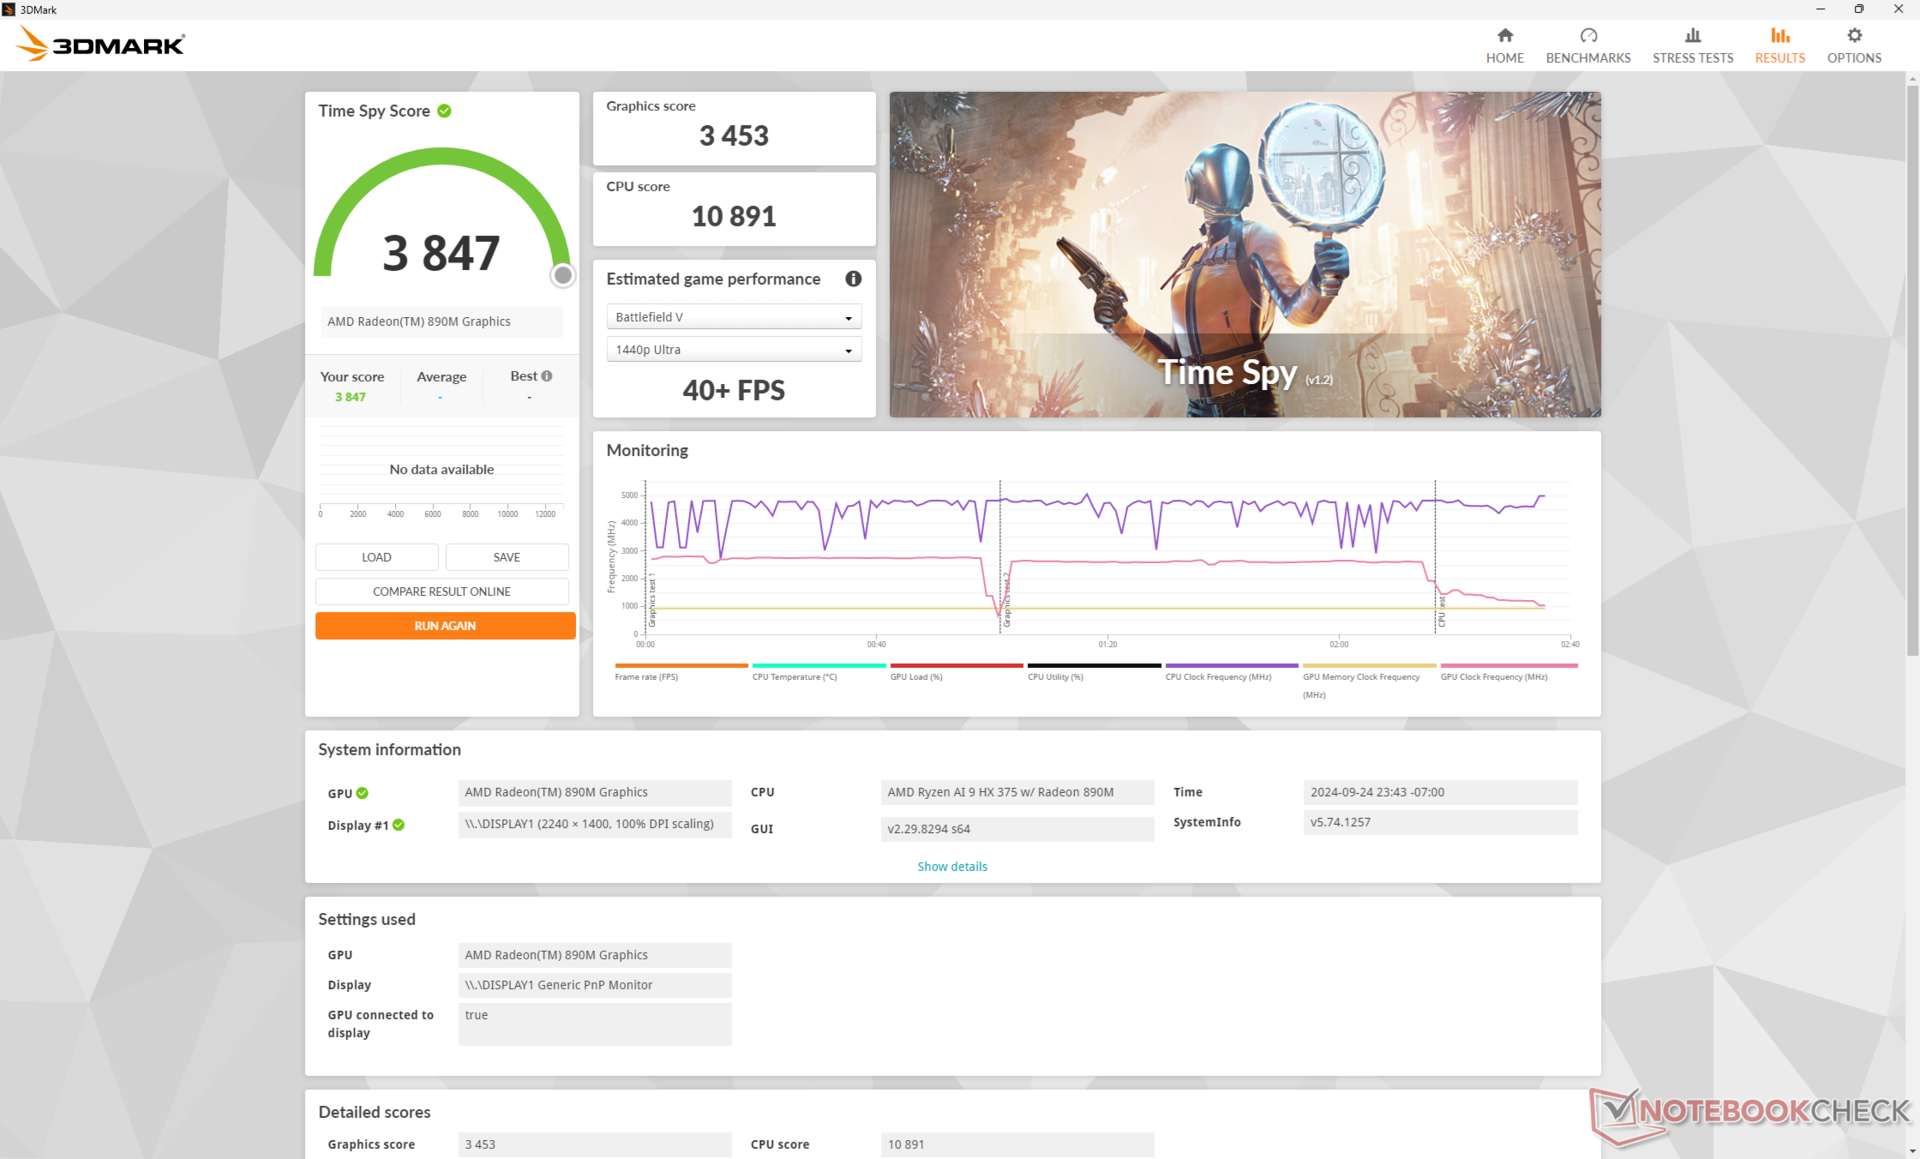
| 3DMark Time Spy Score | 3847 Punkte | |
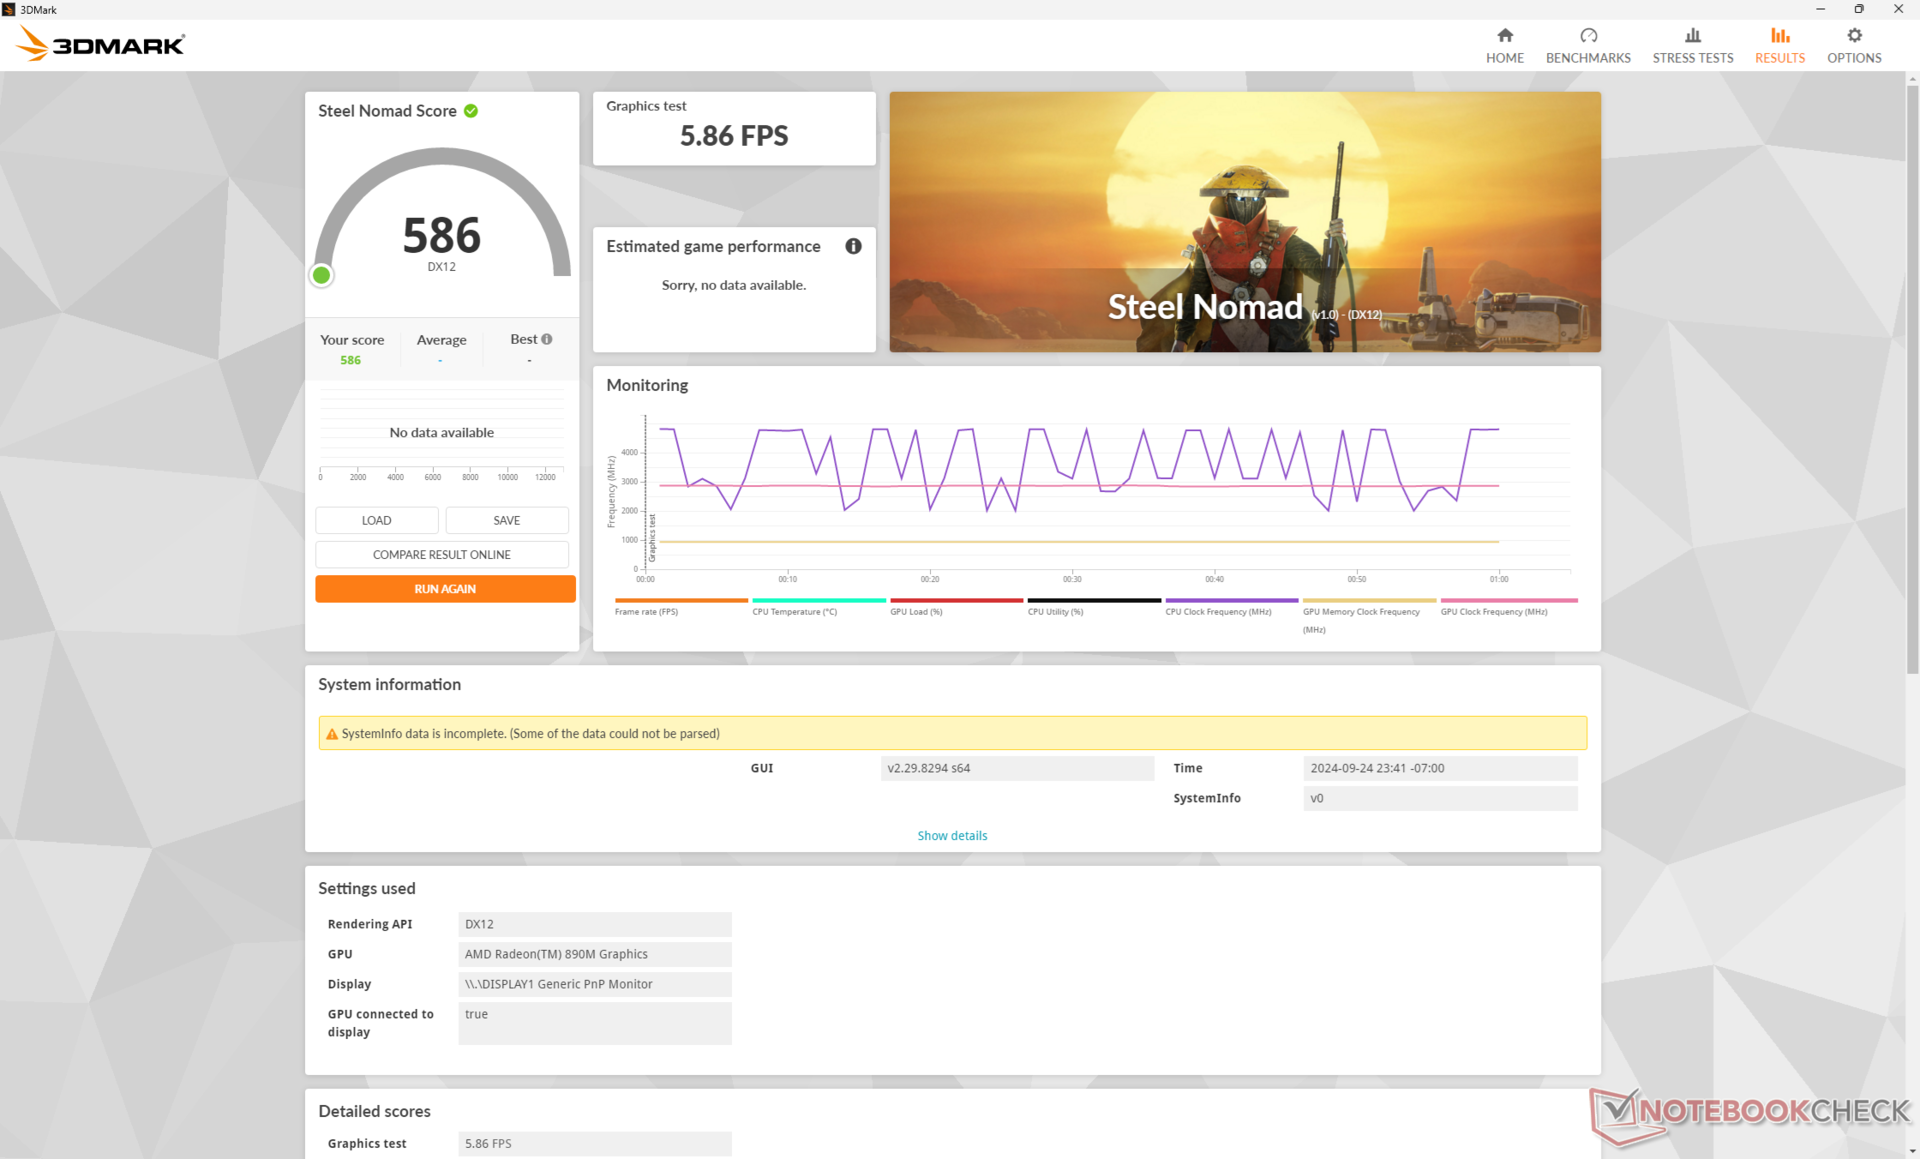
| 3DMark Steel Nomad Score | 586 Punkte | |
Hilfe | ||
* ... kleinere Werte sind besser
Gaming Performance
Während die Radeon 890M bei den 3DMark-Ergebnissen ziemlich nah an den konkurrierenden Arc 8 und Arc 140V liegt, ist bei der Ausführung von Spielen das Gegenteil der Fall. Die Radeon 890M übertrifft die beiden Intel-Lösungen durchweg, manchmal sogar mit großem Abstand. Final Fantasy XV und Baldur's Gate 3 laufen auf unserem OmniBook jeweils bis zu 35 % schneller als auf dem Zenbook S 14 UX5406 oder Spectre x360 14. Bei bestimmten Titeln wie Cyberpunk 2077 sind die Unterschiede geringer, aber sie begünstigen die AMD-GPU immer noch um bis zu 10 %, bevor man Upscaling oder Frame-Generierungstechniken berücksichtigt.
Es ist erwähnenswert, dass DOTA 2 Reborn mit Fehlern läuft, wenn die Einstellungen Hoch oder Ultra gewählt werden, daher sind diese spezifischen Ergebnisse nicht in den Daten für unseren Rechner enthalten. Seltsamerweise läuft das Spiel ansonsten ohne Probleme auf der Radeon 880M.
| Performance Rating - Percent | |
| Dell XPS 14 2024 OLED | |
| Lenovo Yoga Pro 7 14ASP G9 | |
| HP OmniBook Ultra 14 | |
| Asus Zenbook S 14 UX5406 | |
| HP Spectre x360 14-eu0078ng | |
| Samsung Galaxy Book4 Edge 14 -2! | |
| GTA V - 1920x1080 Highest AA:4xMSAA + FX AF:16x | |
| Dell XPS 14 2024 OLED | |
| Lenovo Yoga Pro 7 14ASP G9 | |
| HP OmniBook Ultra 14 | |
| Asus Zenbook S 14 UX5406 | |
| Samsung Galaxy Book4 Edge 14 | |
| HP Spectre x360 14-eu0078ng | |
| Final Fantasy XV Benchmark - 1920x1080 High Quality | |
| Dell XPS 14 2024 OLED | |
| Lenovo Yoga Pro 7 14ASP G9 | |
| HP OmniBook Ultra 14 | |
| Asus Zenbook S 14 UX5406 | |
| HP Spectre x360 14-eu0078ng | |
| Samsung Galaxy Book4 Edge 14 | |
| Strange Brigade - 1920x1080 ultra AA:ultra AF:16 | |
| Dell XPS 14 2024 OLED | |
| Lenovo Yoga Pro 7 14ASP G9 | |
| HP OmniBook Ultra 14 | |
| Asus Zenbook S 14 UX5406 | |
| HP Spectre x360 14-eu0078ng | |
| Samsung Galaxy Book4 Edge 14 | |
| Dota 2 Reborn - 1920x1080 ultra (3/3) best looking | |
| Dell XPS 14 2024 OLED | |
| Lenovo Yoga Pro 7 14ASP G9 | |
| HP Spectre x360 14-eu0078ng | |
| Asus Zenbook S 14 UX5406 | |
| HP OmniBook Ultra 14 | |
| Samsung Galaxy Book4 Edge 14 | |
| X-Plane 11.11 - 1920x1080 high (fps_test=3) | |
| Dell XPS 14 2024 OLED | |
| Lenovo Yoga Pro 7 14ASP G9 | |
| HP OmniBook Ultra 14 | |
| HP Spectre x360 14-eu0078ng | |
| Asus Zenbook S 14 UX5406 | |
| Far Cry 5 - 1920x1080 Ultra Preset AA:T | |
| Dell XPS 14 2024 OLED | |
| HP OmniBook Ultra 14 | |
| Lenovo Yoga Pro 7 14ASP G9 | |
| Asus Zenbook S 14 UX5406 | |
| HP Spectre x360 14-eu0078ng | |
| Tiny Tina's Wonderlands | |
| 1280x720 Lowest Preset (DX12) | |
| HP OmniBook Ultra 14 | |
| Durchschnittliche AMD Radeon 890M (104.3 - 172.1, n=6) | |
| Lenovo Yoga 7 2-in-1 14IML9 | |
| Lenovo ThinkPad T14s G4 i7-1365U | |
| 1920x1080 Low Preset (DX12) | |
| HP OmniBook Ultra 14 | |
| Durchschnittliche AMD Radeon 890M (68.1 - 88.3, n=6) | |
| Lenovo Yoga 7 2-in-1 14IML9 | |
| Lenovo ThinkPad T14s G4 i7-1365U | |
| 1920x1080 Medium Preset (DX12) | |
| HP OmniBook Ultra 14 | |
| Durchschnittliche AMD Radeon 890M (52.2 - 62.4, n=6) | |
| Lenovo Yoga 7 2-in-1 14IML9 | |
| 1920x1080 High Preset (DX12) | |
| HP OmniBook Ultra 14 | |
| Durchschnittliche AMD Radeon 890M (35.9 - 41.8, n=6) | |
| Lenovo Yoga 7 2-in-1 14IML9 | |
| 1920x1080 Badass Preset (DX12) | |
| HP OmniBook Ultra 14 | |
| Durchschnittliche AMD Radeon 890M (28.1 - 34.1, n=6) | |
| Lenovo Yoga 7 2-in-1 14IML9 | |
Im Leerlauf kommt es bei Cyberpunk 2077 gelegentlich zu regelmäßigen Leistungseinbrüchen, die darauf hindeuten, dass die Treiber für die Radeon 890M noch verbessert werden könnten. Die Einbrüche sind glücklicherweise gering, aber sie sollten trotzdem nicht auftreten, zumal Throttling bei diesem System kein Thema ist.
Cyberpunk 2077 ultra FPS-Diagramm
| min. | mittel | hoch | max. | |
|---|---|---|---|---|
| GTA V (2015) | 167 | 78.2 | 31.9 | |
| Dota 2 Reborn (2015) | 170.6 | 133.2 | 46.4 | 44.7 |
| Final Fantasy XV Benchmark (2018) | 82.9 | 44.5 | 31.5 | |
| X-Plane 11.11 (2018) | 77.3 | 60 | 46.7 | |
| Far Cry 5 (2018) | 93 | 58 | 53 | 51 |
| Strange Brigade (2018) | 186.1 | 75.7 | 64.3 | 54.6 |
| Tiny Tina's Wonderlands (2022) | 86.9 | 62.1 | 41.2 | 34.1 |
| F1 22 (2022) | 107.3 | 98.2 | 74.3 | 20.9 |
| Baldur's Gate 3 (2023) | 46 | 37.9 | 31.2 | 31.1 |
| Cyberpunk 2077 (2023) | 43.7 | 38.1 | 30.4 | 26.2 |
Emissionen
Geräuschemissionen
Beide internen Lüfter des OmniBook Ultra 14 laufen im Allgemeinen bei etwa 32 dB(A), während der Hintergrundgeräuschpegel bei 23,8 dB(A) liegt, wenn man zwischen Browser-Tabs wechselt oder Video-Streaming und Multitasking betreibt. Das System ist zwar hörbar, bleibt aber dennoch leise genug, um nicht störend zu wirken, und das Lüftergeräusch ist gleichmäßig, ohne störende Schwankungen.
Die Lautstärke der Lüfter variiert erheblich je nach gewähltem Leistungsprofil. Wenn man zum Beispiel Cyberpunk 2077 im Performance-Modus spielt, erreicht das Lüftergeräusch einen Spitzenwert von fast 41 dB(A), während es im Balanced- oder Smart Sense-Modus nur bei etwa 35,4 dB(A) liegt. Allerdings geht die geringere Lautstärke der Lüfter mit einem entsprechenden Leistungseinbruch einher, wie bereits im Abschnitt zur GPU-Leistung beschrieben. Ein Lüftergeräusch im niedrigen 40 dB(A)-Bereich ist dennoch lauter als bei einigen anderen 14-Zoll-Subnotebooks wie dem Zenbook S 14 UX5406, aber vergleichbar mit dem Yoga Pro 7 14ASP G9.
Lautstärkediagramm
| Idle |
| 24.9 / 24.9 / 24.9 dB(A) |
| Last |
| 32.9 / 43 dB(A) |
 | ||
30 dB leise 40 dB(A) deutlich hörbar 50 dB(A) störend |
||
min: | ||
| HP OmniBook Ultra 14 Radeon 890M, Ryzen AI 9 HX 375, SK hynix PC801 HFS002TEJ9X101N | HP Spectre x360 14-eu0078ng Arc 8-Core, Ultra 7 155H, Kioxia XG8 KXG80ZNV2T04 | Asus Zenbook S 14 UX5406 Arc 140V, Core Ultra 7 258V, WD PC SN560 SDDPNQE-1T00 | Lenovo Yoga Pro 7 14ASP G9 Radeon 880M, Ryzen AI 9 365, Micron 2550 1TB MTFDKCD1T0TGE | Samsung Galaxy Book4 Edge 14 Adreno X1-85 3.8 TFLOPS, SD X Elite X1E-80-100 | Dell XPS 14 2024 OLED GeForce RTX 4050 Laptop GPU, Ultra 7 155H, Samsung PM9A1 MZVL21T0HCLR | |
|---|---|---|---|---|---|---|
| Geräuschentwicklung | 10% | 10% | -2% | 13% | -6% | |
| aus / Umgebung * (dB) | 23.8 | 23.4 2% | 23.7 -0% | 23.8 -0% | 24 -1% | 24.3 -2% |
| Idle min * (dB) | 24.9 | 23.4 6% | 23.7 5% | 23.8 4% | 24 4% | 24.3 2% |
| Idle avg * (dB) | 24.9 | 23.4 6% | 23.7 5% | 23.8 4% | 24 4% | 26.5 -6% |
| Idle max * (dB) | 24.9 | 25.6 -3% | 23.7 5% | 23.8 4% | 26.3 -6% | 28.5 -14% |
| Last avg * (dB) | 32.9 | 25.6 22% | 30.5 7% | 44.6 -36% | 27.2 17% | 37 -12% |
| Cyberpunk 2077 ultra * (dB) | 40.9 | 31.1 24% | 35.9 12% | 27.2 33% | ||
| Last max * (dB) | 43 | 32.6 24% | 33.6 22% | 44.6 -4% | 27.2 37% | 43.3 -1% |
| Witcher 3 ultra * (dB) | 30.9 | 39.1 |
* ... kleinere Werte sind besser
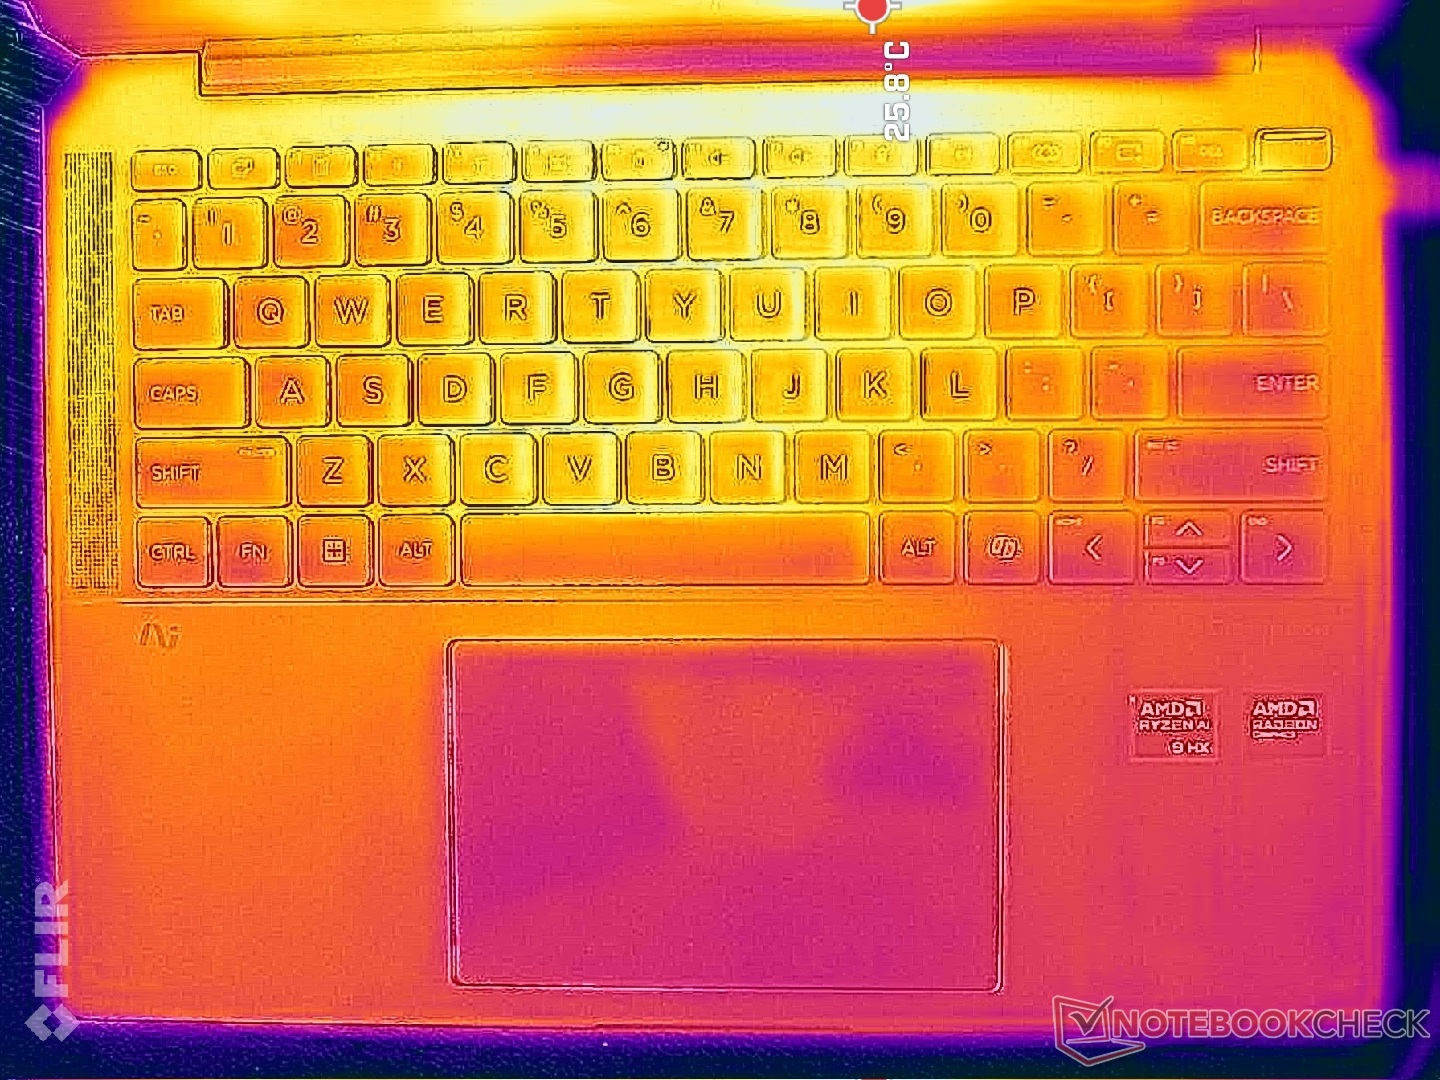
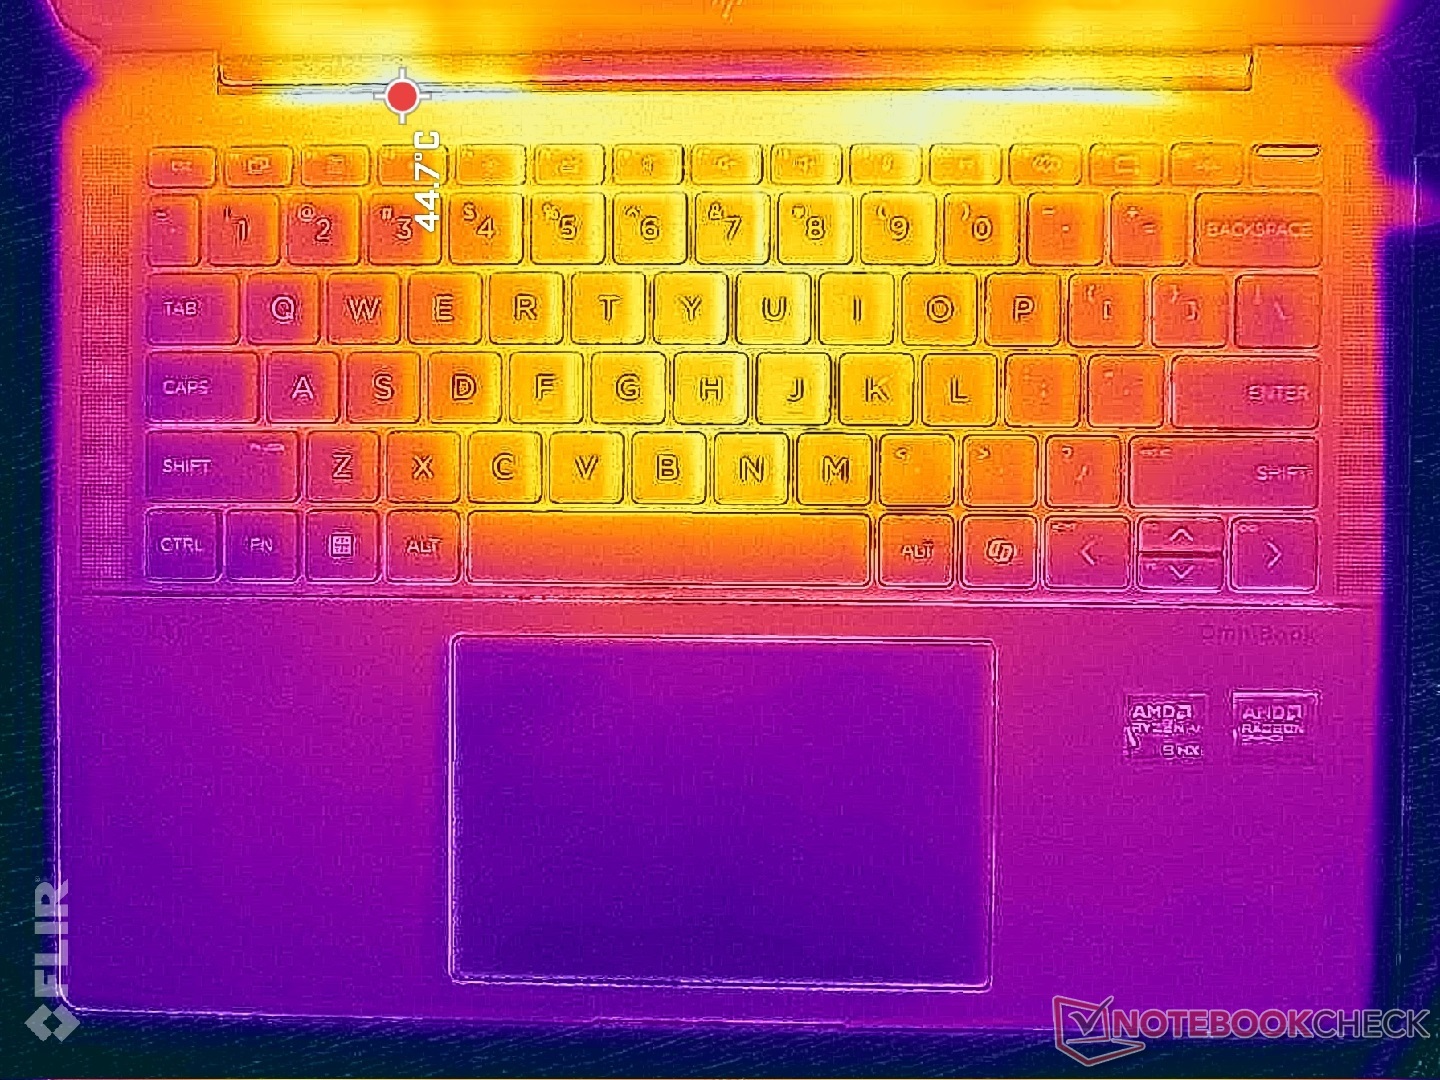
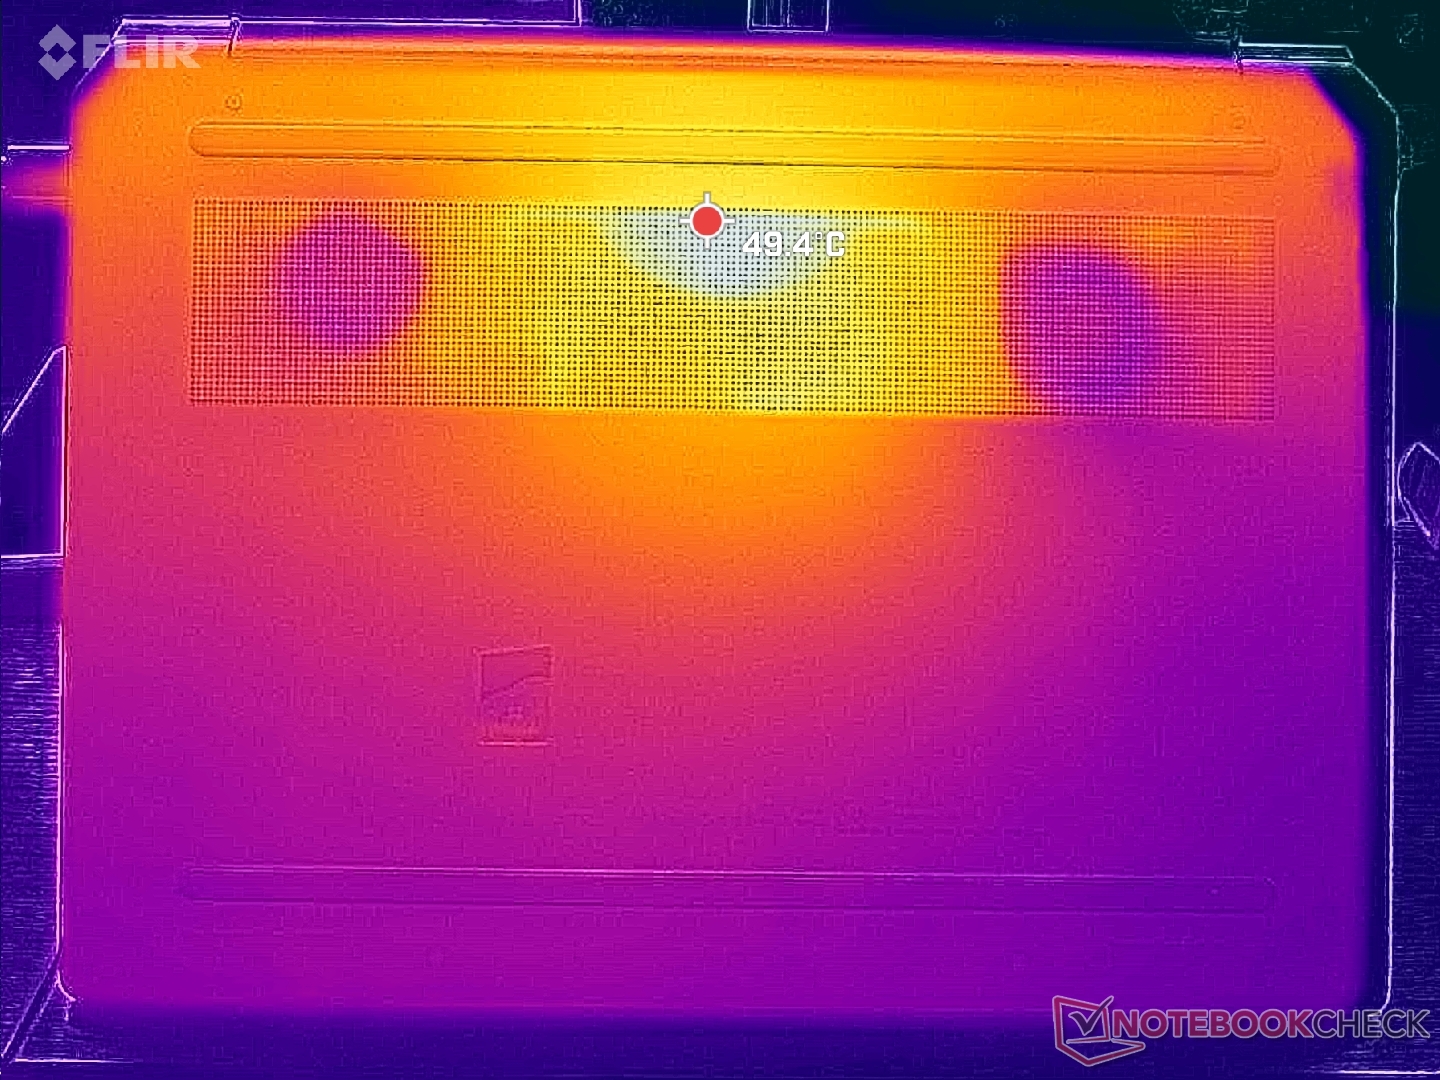
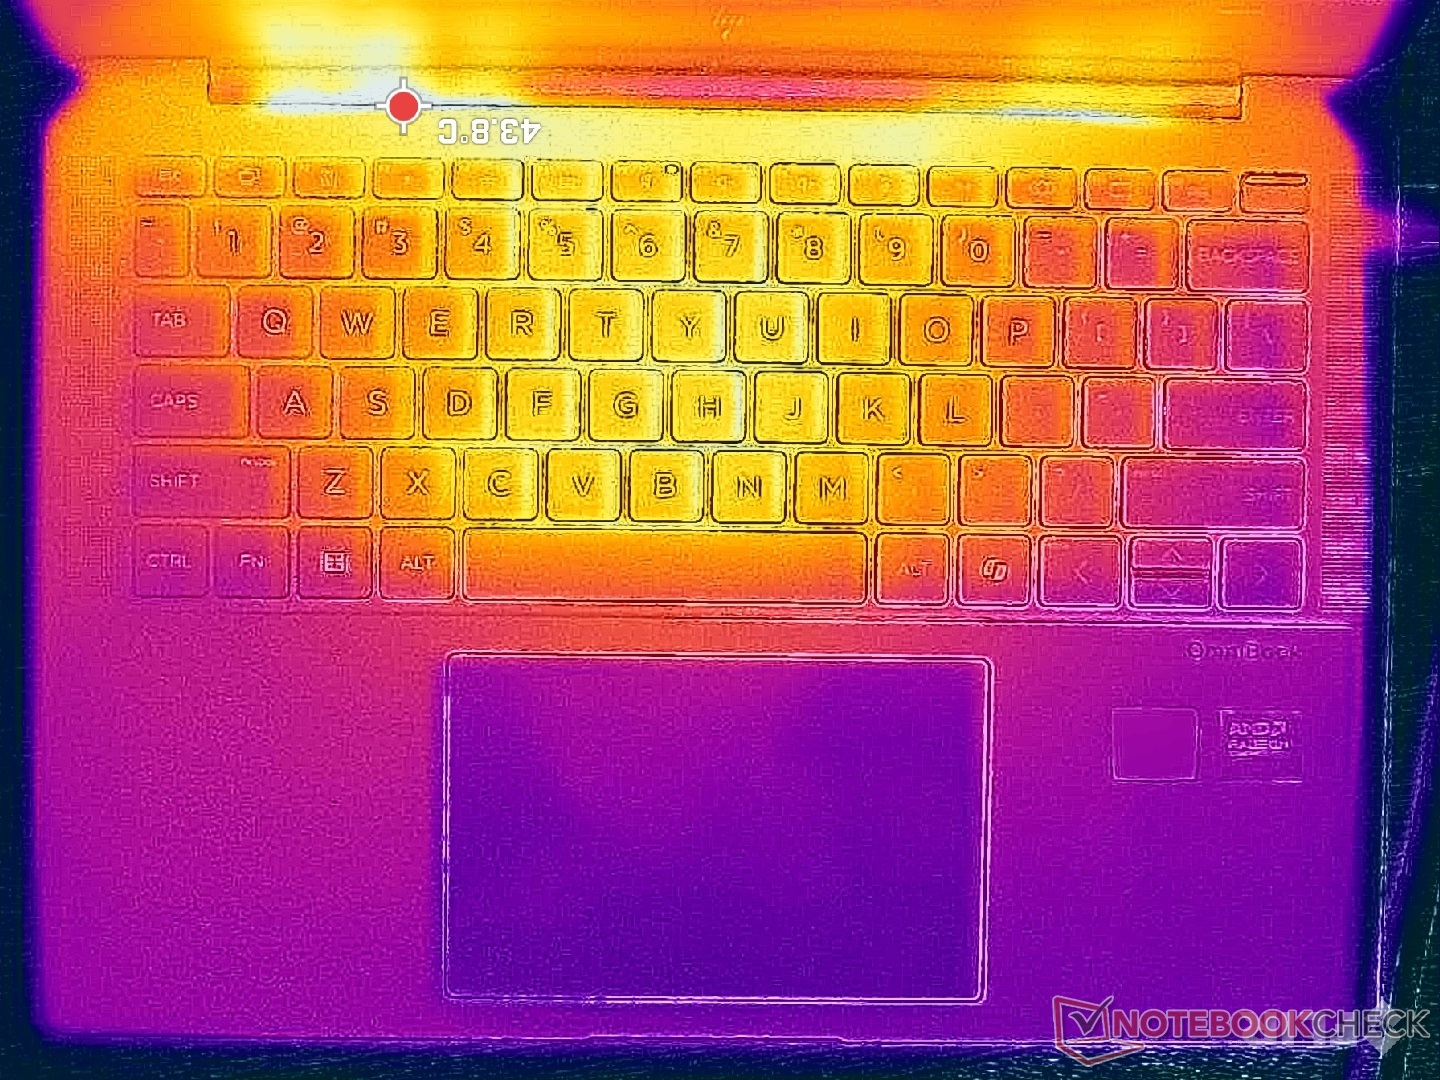
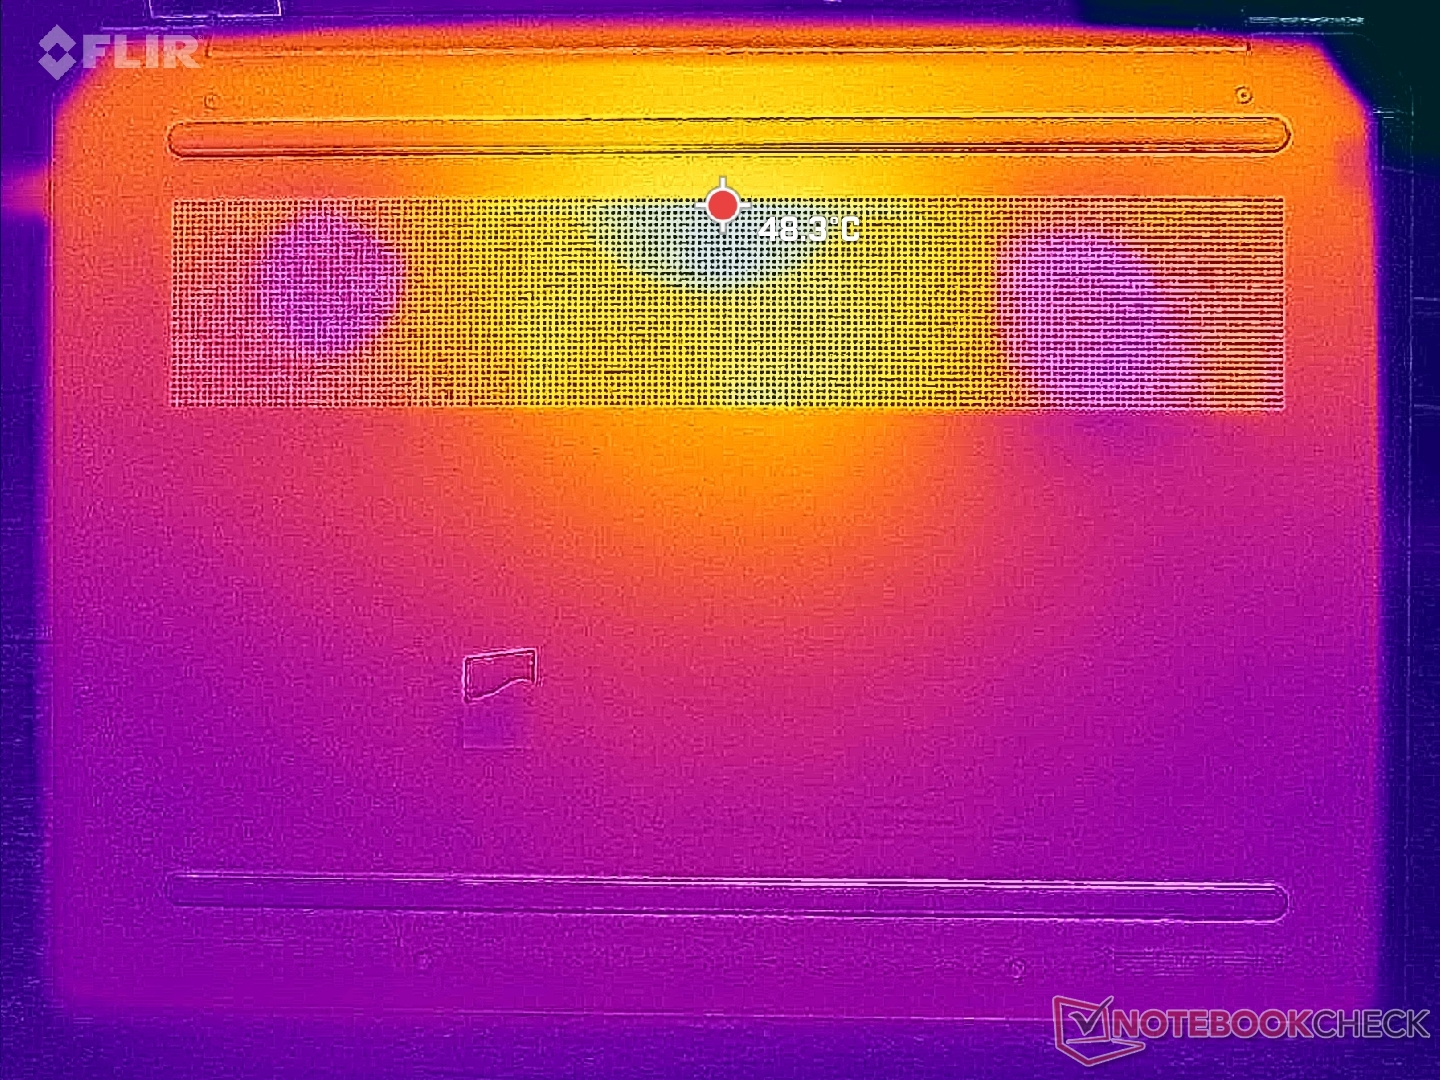
Temperatur
Die Oberflächentemperaturentwicklung ist symmetrisch, um die symmetrische Kühllösung im Inneren widerzuspiegeln. Hotspots in der Mitte der Tastatur erreichen knapp über 41 °C, wenn Spiele oder andere anspruchsvolle Aufgaben ausgeführt werden. Damit ist es im Durchschnitt kühler als das Spectre x360 14 unter ähnlichen Bedingungen. Das konkurrierende Yoga Pro 7 14 G9, das ebenfalls auf einer ähnlichen Zen-5-Plattform läuft, erreicht ähnliche maximale Oberflächentemperaturen wie unser OmniBook, allerdings mit größeren Hotspots.
Im täglichen Gebrauch erweist sich das OmniBook als angenehm hautverträglich.
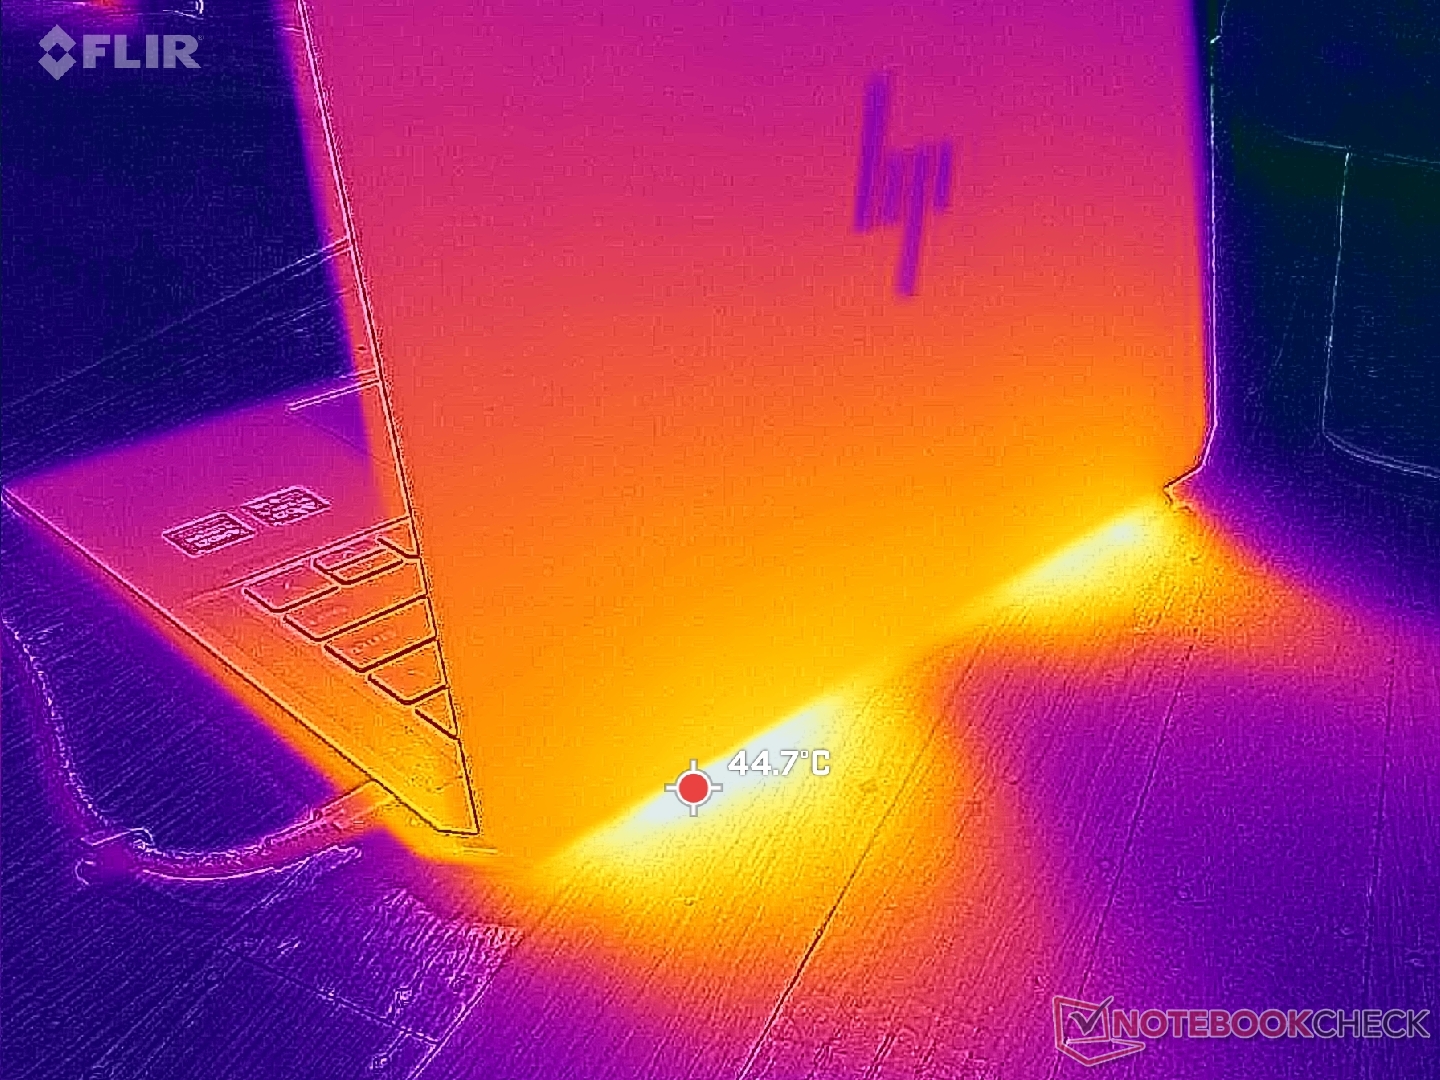
(±) Die maximale Temperatur auf der Oberseite ist 40.4 °C. Im Vergleich liegt der Klassendurchschnitt bei 35.9 °C (von 21.4 bis 59 °C für die Klasse Subnotebook).
(±) Auf der Unterseite messen wir eine maximalen Wert von 43.6 °C (im Vergleich zum Durchschnitt von 39.3 °C).
(+) Ohne Last messen wir eine durchschnittliche Temperatur von 29.2 °C auf der Oberseite. Der Klassendurchschnitt erreicht 30.8 °C.
(±) 3: The average temperature for the upper side is 34.7 °C / 94 F, compared to the average of 30.8 °C / 87 F for the class Subnotebook.
(+) Die Handballen und der Touchpad-Bereich sind mit gemessenen 29 °C kühler als die typische Hauttemperatur und fühlen sich dadurch kühl an.
(±) Die durchschnittliche Handballen-Temperatur anderer getesteter Geräte war 28.2 °C (-0.8 °C).

| HP OmniBook Ultra 14 AMD Ryzen AI 9 HX 375, AMD Radeon 890M | HP Spectre x360 14-eu0078ng Intel Core Ultra 7 155H, Intel Arc 8-Core iGPU | Asus Zenbook S 14 UX5406 Intel Core Ultra 7 258V, Intel Arc Graphics 140V | Lenovo Yoga Pro 7 14ASP G9 AMD Ryzen AI 9 365, AMD Radeon 880M | Samsung Galaxy Book4 Edge 14 Qualcomm Snapdragon X Elite X1E-80-100, Qualcomm SD X Adreno X1-85 3.8 TFLOPS | Dell XPS 14 2024 OLED Intel Core Ultra 7 155H, NVIDIA GeForce RTX 4050 Laptop GPU | |
|---|---|---|---|---|---|---|
| Hitze | 12% | 5% | 6% | -2% | 7% | |
| Last oben max * (°C) | 40.4 | 39.3 3% | 43.7 -8% | 42 -4% | 47.9 -19% | 40.5 -0% |
| Last unten max * (°C) | 43.6 | 45 -3% | 46.9 -8% | 40.6 7% | 51.3 -18% | 42.6 2% |
| Idle oben max * (°C) | 31 | 23.8 23% | 25.8 17% | 28.2 9% | 26.7 14% | 26.9 13% |
| Idle unten max * (°C) | 32.2 | 24 25% | 26.3 18% | 28.9 10% | 26.9 16% | 27.8 14% |
* ... kleinere Werte sind besser
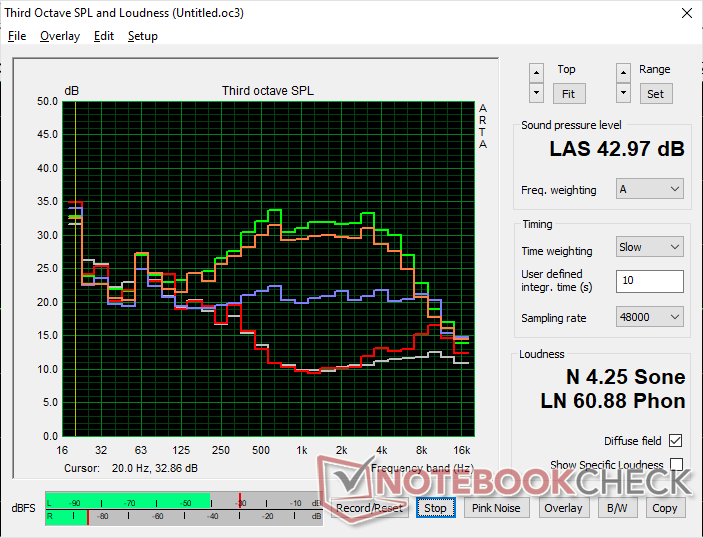
Lautsprecher
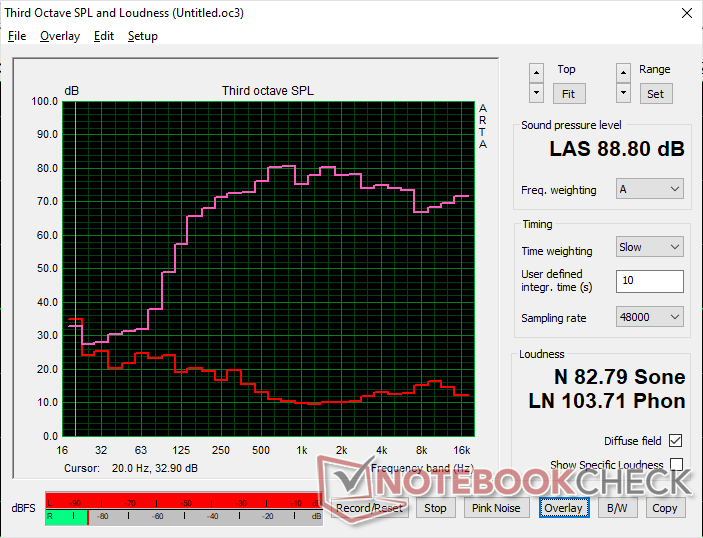
HP OmniBook Ultra 14 Audio Analyse
(+) | Die Lautsprecher können relativ laut spielen (88.8 dB)
Bass 100 - 315 Hz
(±) | abgesenkter Bass - 9.9% geringer als der Median
(±) | durchschnittlich lineare Bass-Wiedergabe (9.5% Delta zum Vorgänger)
Mitteltöne 400 - 2000 Hz
(+) | ausgeglichene Mitten, vom Median nur 4% abweichend
(+) | lineare Mitten (4.3% Delta zum Vorgänger)
Hochtöne 2 - 16 kHz
(+) | ausgeglichene Hochtöne, vom Median nur 2.7% abweichend
(+) | sehr lineare Hochtöne (3.6% Delta zum Vorgänger)
Gesamt im hörbaren Bereich 100 - 16.000 Hz
(+) | hörbarer Bereich ist sehr linear (9.2% Abstand zum Median
Im Vergleich zu allen Geräten derselben Klasse
» 4% aller getesteten Geräte dieser Klasse waren besser, 1% vergleichbar, 95% schlechter
» Das beste Gerät hat einen Delta-Wert von 5%, durchschnittlich ist 18%, das schlechteste Gerät hat 53%
Im Vergleich zu allen Geräten im Test
» 3% aller getesteten Geräte waren besser, 1% vergleichbar, 96% schlechter
» Das beste Gerät hat einen Delta-Wert von 4%, durchschnittlich ist 24%, das schlechteste Gerät hat 134%
Apple MacBook Pro 16 2021 M1 Pro Audio Analyse
(+) | Die Lautsprecher können relativ laut spielen (84.7 dB)
Bass 100 - 315 Hz
(+) | guter Bass - nur 3.8% Abweichung vom Median
(+) | lineare Bass-Wiedergabe (5.2% Delta zum Vorgänger)
Mitteltöne 400 - 2000 Hz
(+) | ausgeglichene Mitten, vom Median nur 1.3% abweichend
(+) | lineare Mitten (2.1% Delta zum Vorgänger)
Hochtöne 2 - 16 kHz
(+) | ausgeglichene Hochtöne, vom Median nur 1.9% abweichend
(+) | sehr lineare Hochtöne (2.7% Delta zum Vorgänger)
Gesamt im hörbaren Bereich 100 - 16.000 Hz
(+) | hörbarer Bereich ist sehr linear (4.6% Abstand zum Median
Im Vergleich zu allen Geräten derselben Klasse
» 0% aller getesteten Geräte dieser Klasse waren besser, 0% vergleichbar, 100% schlechter
» Das beste Gerät hat einen Delta-Wert von 5%, durchschnittlich ist 17%, das schlechteste Gerät hat 45%
Im Vergleich zu allen Geräten im Test
» 0% aller getesteten Geräte waren besser, 0% vergleichbar, 100% schlechter
» Das beste Gerät hat einen Delta-Wert von 4%, durchschnittlich ist 24%, das schlechteste Gerät hat 134%
Energieverwaltung
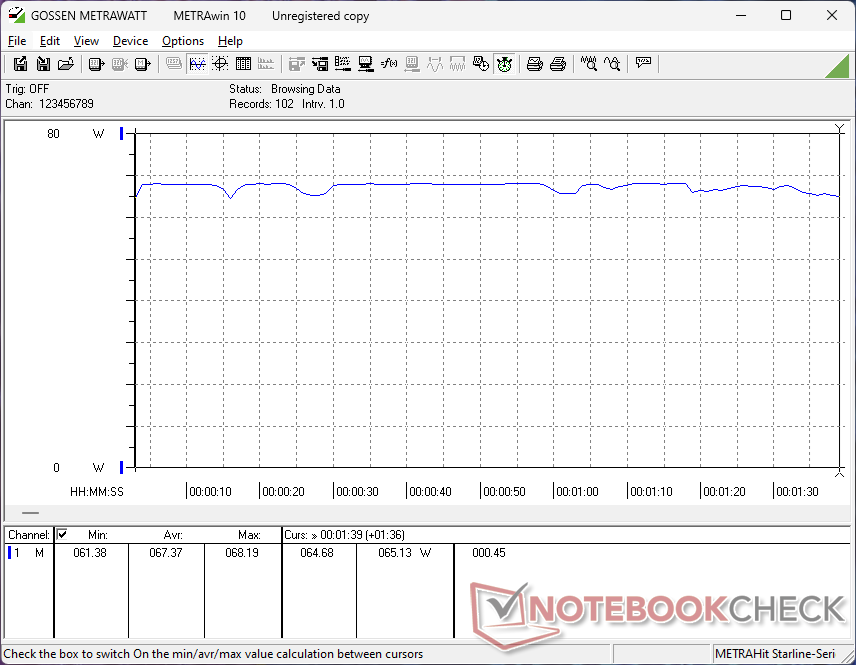
Energieaufnahme
Im Vergleich zum IdeaPad Pro 5 14, das mit dem Zen 4 Ryzen 7 8845HS ausgestattet ist, verbraucht unser HP unter Last weniger Strom, was es sowohl schneller als auch effizienter macht und eine bessere Leistung pro Watt erzielt. Die Ausführung von Prime95 Stresstest auf dem HP würde beispielsweise etwa 68 W benötigen, also 8 W weniger als auf dem Lenovo, obwohl der Ryzen 8845HS etwa 25 bis 30 % langsamer ist als unser Ryzen 9 AI 375.
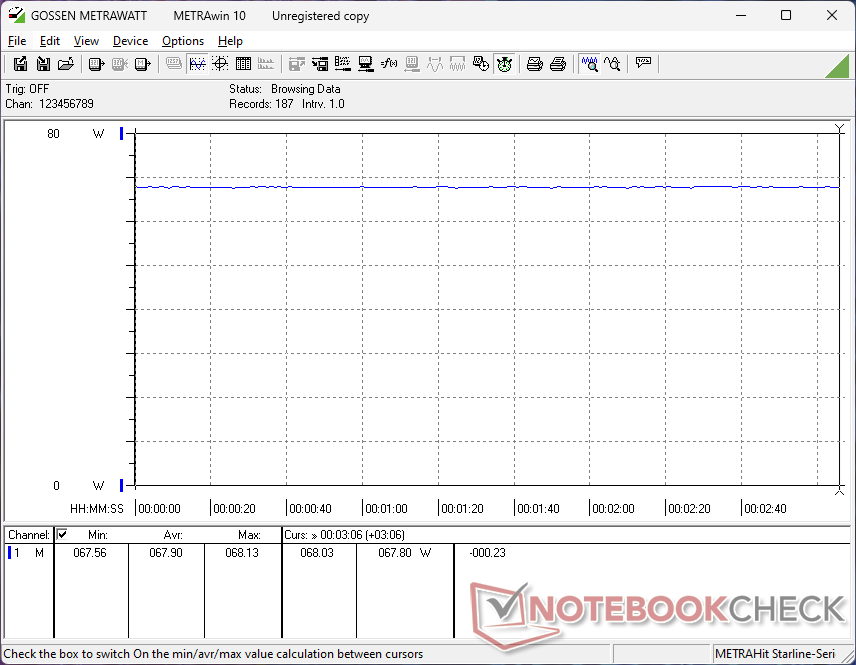
Interessant sind auch die Vergleiche mit dem Zenbook S 14 UX5406 und seinem neuen Arc 140V. Der Verbrauch ist auf unserem HP viel höher, da der Ryzen 9 AI 375 eine höhere Leistungsobergrenze hat als der Core Ultra 7 258V. Dennoch können die Leistungsunterschiede beim Spielen trotz der erheblichen Verbrauchsunterschiede manchmal vergleichsweise minimal sein. Wenn man zum Beispiel Cyberpunk 2077 mit 1080p und Ultra-Einstellungen spielt, verbraucht das Asus nur 33 W, während unser HP 67 W verbraucht, obwohl das Spiel auf dem HP nur 10 % schneller läuft.
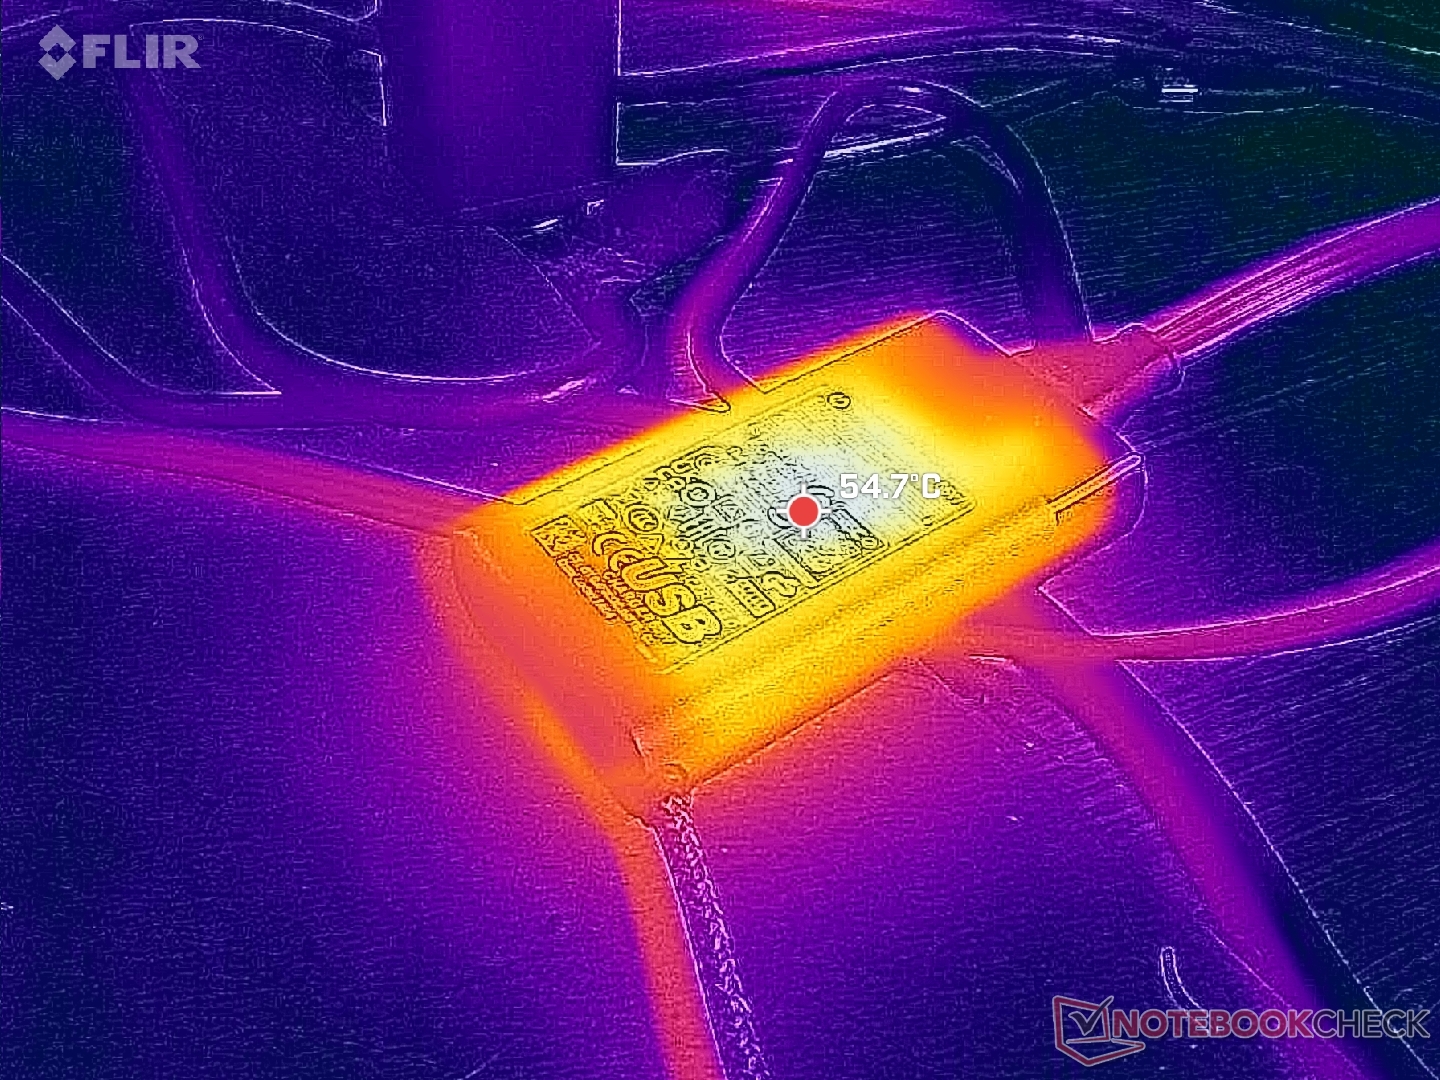
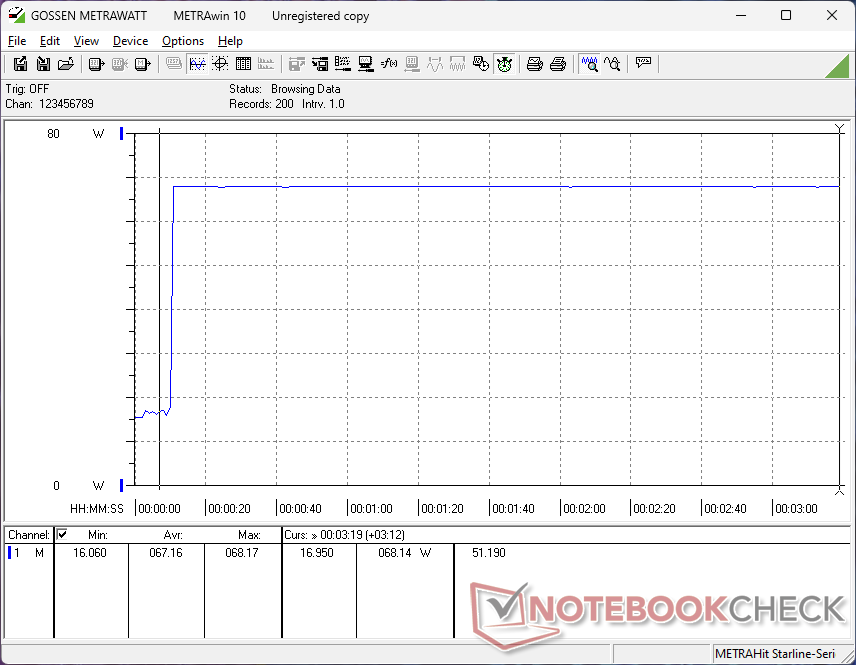
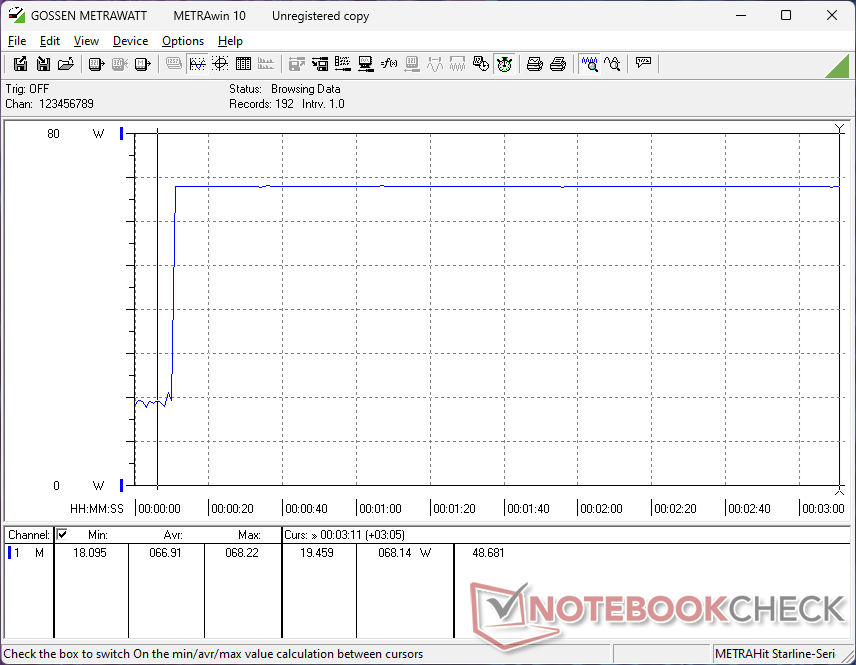
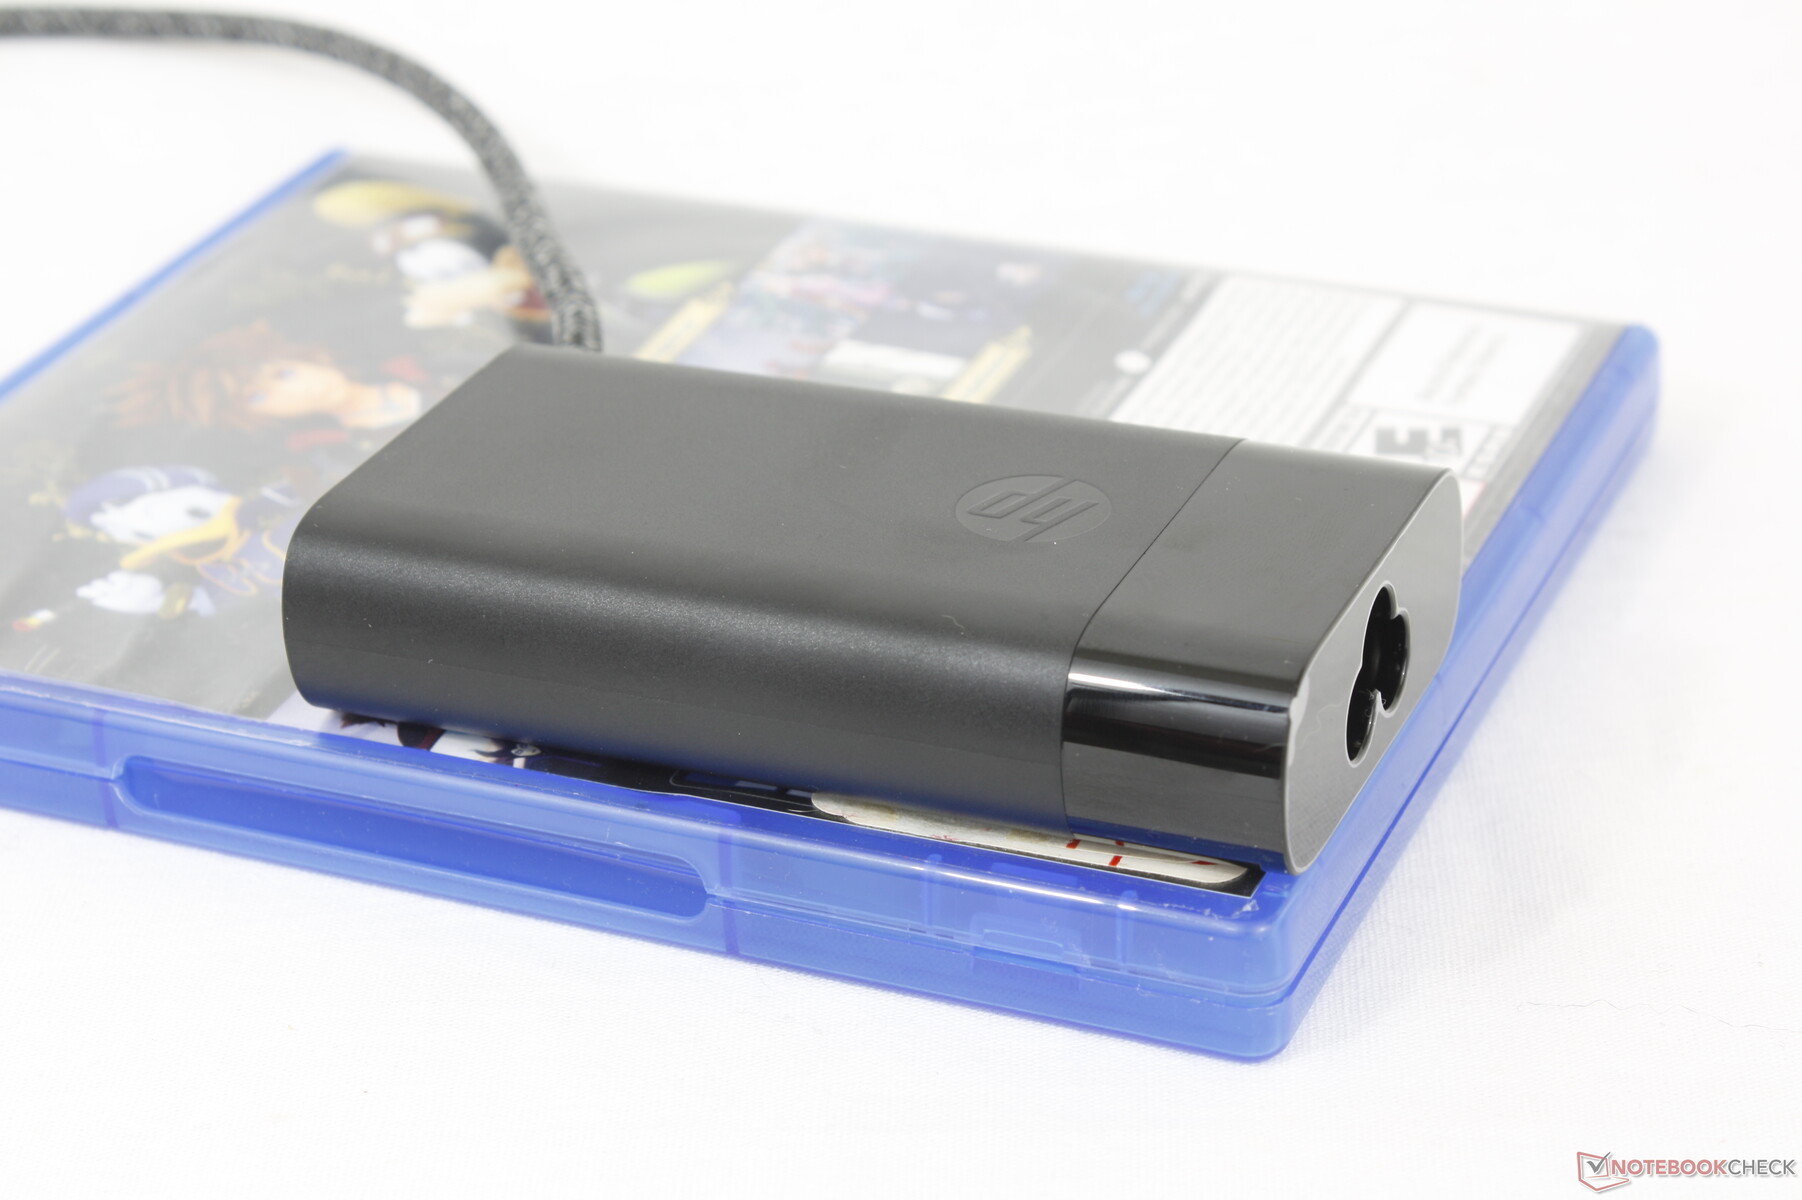
Mit dem kleinen (~9,8 x 5,4 x 2 cm) 65-W-USB-C-Netzteil können wir eine maximale Leistungsaufnahme von 69 W verzeichnen, wenn die CPU zu 100 % ausgelastet ist oder wenn Spiele laufen. Da das System in der Lage ist, diesen Wert unter Stress zu erreichen, könnte man damit rechnen, dass die Ladegeschwindigkeit bei gleichzeitiger starker Belastung ins Stocken geraten kann.
| Aus / Standby | |
| Idle | |
| Last |
|
Legende:
min: | |
| HP OmniBook Ultra 14 Ryzen AI 9 HX 375, Radeon 890M, SK hynix PC801 HFS002TEJ9X101N, IPS, 2240x1400, 14" | HP Spectre x360 14-eu0078ng Ultra 7 155H, Arc 8-Core, Kioxia XG8 KXG80ZNV2T04, OLED, 2880x1800, 14" | Asus Zenbook S 14 UX5406 Core Ultra 7 258V, Arc 140V, WD PC SN560 SDDPNQE-1T00, OLED, 2880x1800, 14" | Lenovo Yoga Pro 7 14ASP G9 Ryzen AI 9 365, Radeon 880M, Micron 2550 1TB MTFDKCD1T0TGE, OLED, 3072x1920, 14.5" | Samsung Galaxy Book4 Edge 14 SD X Elite X1E-80-100, Adreno X1-85 3.8 TFLOPS, , OLED, 2880x1800, 14" | Dell XPS 14 2024 OLED Ultra 7 155H, GeForce RTX 4050 Laptop GPU, Samsung PM9A1 MZVL21T0HCLR, OLED, 3200x2000, 14.5" | |
|---|---|---|---|---|---|---|
| Stromverbrauch | 11% | 5% | -33% | -11% | -88% | |
| Idle min * (Watt) | 2.7 | 3.2 -19% | 5.1 -89% | 5.5 -104% | 5.4 -100% | 8.1 -200% |
| Idle avg * (Watt) | 5.4 | 4.2 22% | 6.2 -15% | 7.6 -41% | 9.7 -80% | 9.9 -83% |
| Idle max * (Watt) | 5.5 | 4.9 11% | 6.9 -25% | 7.9 -44% | 10.2 -85% | 10.4 -89% |
| Last avg * (Watt) | 67.4 | 40.5 40% | 38.7 43% | 77.9 -16% | 28.9 57% | 75.6 -12% |
| Cyberpunk 2077 ultra external monitor * (Watt) | 67.8 | 28.6 58% | 61.5 9% | 22 68% | ||
| Cyberpunk 2077 ultra * (Watt) | 67.9 | 33.1 51% | 63 7% | 24.7 64% | ||
| Last max * (Watt) | 68.3 | 68.6 -0% | 60 12% | 94.8 -39% | 68.2 -0% | 107.1 -57% |
| Witcher 3 ultra * (Watt) | 37.9 | 65.6 |
* ... kleinere Werte sind besser
Energieaufnahme Cyberpunk / Stresstest
Energieaufnahme externer Monitor
Akkulaufzeit
Die Akkukapazität beträgt 68 Wh, die dieselbe wie beim OLED Spectre x360 14 ist. Die WLAN-Laufzeit unseres OmniBooks ist jedoch um etwa zwei Stunden länger und liegt bei knapp über 11 Stunden, was zum Teil auf das weniger anspruchsvolle IPS-Display zurückzuführen ist. Das System hält nicht ganz so lange durch wie das Zenbook S 14 UX5406, aber es übertrifft immer noch die meisten anderen 14-Zoll-Modelle.
Das Aufladen von leerer bis voller Kapazität dauert etwa 100 Minuten, was für diese Kategorie durchschnittlich ist.
| HP OmniBook Ultra 14 Ryzen AI 9 HX 375, Radeon 890M, 68 Wh | HP Spectre x360 14-eu0078ng Ultra 7 155H, Arc 8-Core, 68 Wh | Asus Zenbook S 14 UX5406 Core Ultra 7 258V, Arc 140V, 72 Wh | Lenovo Yoga Pro 7 14ASP G9 Ryzen AI 9 365, Radeon 880M, 73 Wh | Samsung Galaxy Book4 Edge 14 SD X Elite X1E-80-100, Adreno X1-85 3.8 TFLOPS, 55.9 Wh | Dell XPS 14 2024 OLED Ultra 7 155H, GeForce RTX 4050 Laptop GPU, 69.5 Wh | |
|---|---|---|---|---|---|---|
| Akkulaufzeit | 16% | 52% | -7% | -3% | -21% | |
| Idle (h) | 36.6 | |||||
| WLAN (h) | 11 | 9.3 -15% | 14.3 30% | 8.8 -20% | 9 -18% | 7.8 -29% |
| Last (h) | 1.5 | 2.2 47% | 2.6 73% | 1.6 7% | 1.7 13% | 1.3 -13% |
| H.264 (h) | 16.7 | 20 | 10.8 | 13.8 | 10.6 |
Pro
Contra
Fazit — Ein herausragendes 14-Zoll-Subnotebook
Das Highlight des OmniBook Ultra 14 ist sicherlich seine Zen 5 CPU. Die Leistung, die sie bietet, ist im Verhältnis zum Preis von 1.599 Euro und dem kompakten 14-Zoll-Formfaktor erstaunlich. HP vermarktet das OmniBook Ultra 14 nicht als eines der schnellsten 14-Zoll-Subnotebooks auf dem Markt, aber vielleicht sollten sie das tun, denn es ist schwer, etwas Schnelleres zu finden, ohne auf schwerere Modelle mit diskreten GPUs wie das XPS 14 zurückgreifen zu müssen. Die Ergebnisse sind beeindruckend, besonders da Hawk Point wohl enttäuschend war.
Die beeindruckende Leistung hat ihren Preis in Form höherer Kerntemperaturen und lauteren Lüftern im Vergleich zu langsameren 14-Zoll-Subnotebooks. Sie können natürlich immer den Balanced-Modus wählen, um ein kühleres Gerät zu erhalten, falls die zusätzliche Leistung überflüssig ist.
Das OmniBook Ultra 14 ist dank der Ryzen 9 Zen 5 CPU ein wahres Subnotebook. Wenn Sie die P3-Farben oder höhere Auflösungen benötigen, sollten Sie jedoch die teurere Spectre-Serie in Betracht ziehen.
Was die Aspekte jenseits des Prozessors angeht, ist das System im Wesentlichen ein Spectre 14“ ohne die 360-Grad-Scharniere oder die breite P3-Farbskala. Es ist eine luxuriöse Lösung zu einem vernünftigen Preis. Nutzer, die nicht so viel Leistung benötigen, finden vielleicht leichtere Alternativen wie das LG Gram 14 oder das Asus Zenbook S 14 UX5406 besser geeignet.
Preis und Verfügbarkeit
HP liefert das OmniBook Ultra 14 ab sofort mit dem Ryzen AI 9 365, 16 GB RAM und einer 1 TB SSD für 1.599 Euro aus. Ein Upgrade auf den leistungsstärkeren Ryzen AI 9 375 sowie die Verdoppelung des Arbeitsspeichers auf 32 GB kostet zusätzlich 300 bis 400 Euro.
Hinweis: Wir haben unser Rating-System kürzlich aktualisiert und die Ergebnisse von Version 8 sind nicht mit den Ergebnissen von Version 7 vergleichbar. Weitere Informationen dazu sind hier verfügbar.
HP OmniBook Ultra 14
- 04.10.2024 v8
Allen Ngo
 Total Sustainability Score:
 Transparenz
Die Auswahl der zu testenden Geräte erfolgt innerhalb der Redaktion. Das vorliegende Testmuster wurde dem Autor vom Hersteller oder einem Shop zu Testzwecken leihweise zur Verfügung gestellt. Eine Einflussnahme des Leihstellers auf den Testbericht gab es nicht, der Hersteller erhielt keine Version des Reviews vor der Veröffentlichung. Es bestand keine Verpflichtung zur Publikation. Als eigenständiges, unabhängiges Unternehmen unterliegt Notebookcheck keiner Diktion von Herstellern, Shops und Verlagen.
So testet Notebookcheck
Pro Jahr werden von Notebookcheck hunderte Laptops und Smartphones unabhängig in von uns standardisierten technischen Verfahren getestet, um eine Vergleichbarkeit aller Testergebnisse zu gewährleisten. Seit rund 20 Jahren entwickeln wir diese Testmethoden kontinuierlich weiter und setzen damit Branchenstandards. In unseren Testlaboren kommt ausschließlich hochwertiges Messequipment in die Hände erfahrener Techniker und Redakteure. Die Tests unterliegen einer mehrstufigen Kontrolle. Unsere komplexe Gesamtbewertung basiert auf hunderten fundierten Messergebnissen und Benchmarks, womit Ihnen Objektivität garantiert ist. Weitere Informationen zu unseren Testmethoden gibt es hier.
Preisvergleich

