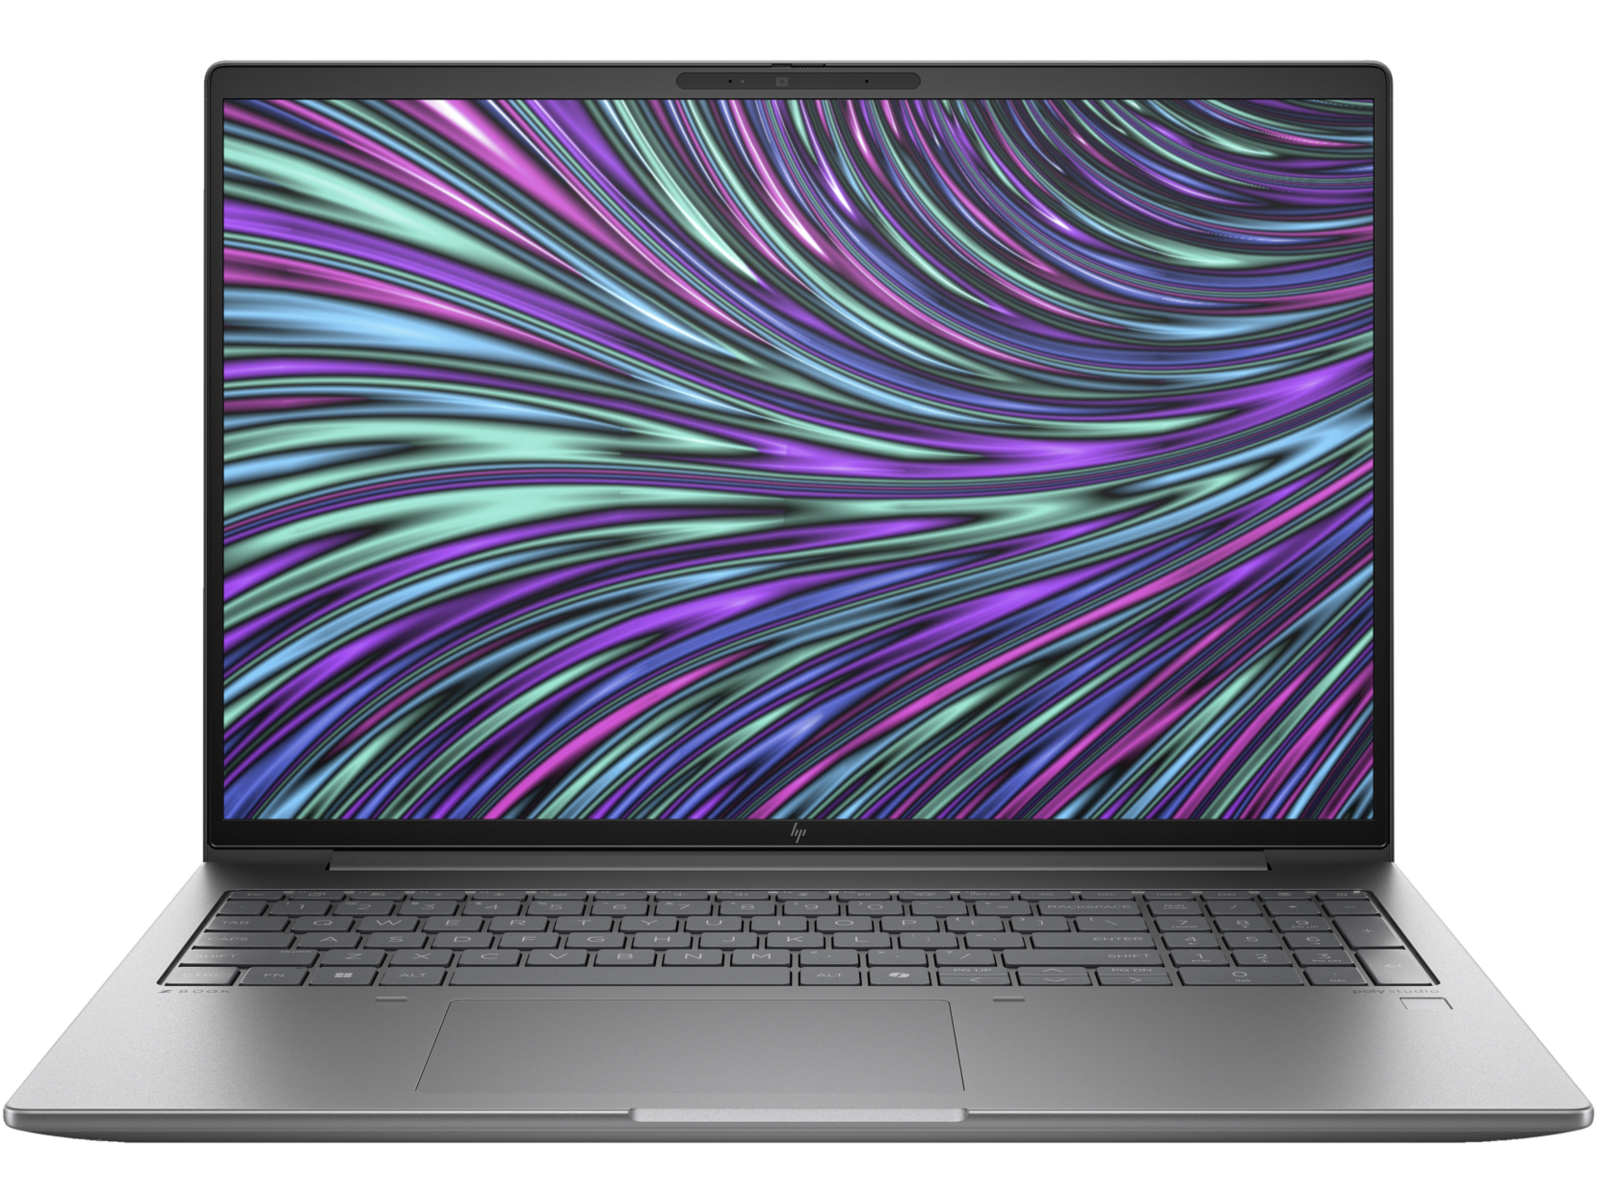
HP ZBook Power 16 G11 A im Test: Leistungsstarke Workstation mit AMD Zen 4

Das ZBook Power 16 G11 ist der Nachfolger des älteren ZBook Power 15 G10 und bringt sowohl interne als auch äußere Veränderungen mit sich. Wie der Name schon andeutet, modernisiert das ZBook Power 16 G11 die Serie, indem es den bisherigen 15,6-Zoll-Formfaktor gegen ein 16-Zoll-Design eintauscht. In Sachen Leistung positioniert es sich zwischen dem ZBook Firefly am unteren Ende und dem leistungsstärkeren ZBook Fury. Nutzer können es entweder mit Intel Core Ultra CPUs aus der Meteor Lake-Generation oder AMD Ryzen Zen 4 CPUs sowie Nvidia RTX-Grafikkarten konfigurieren.
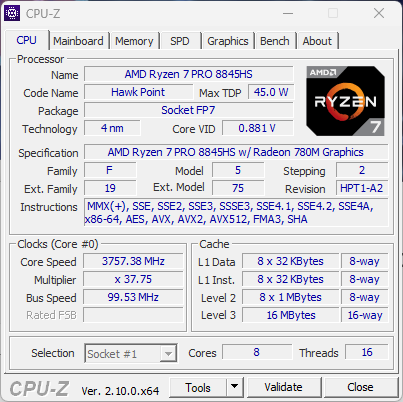
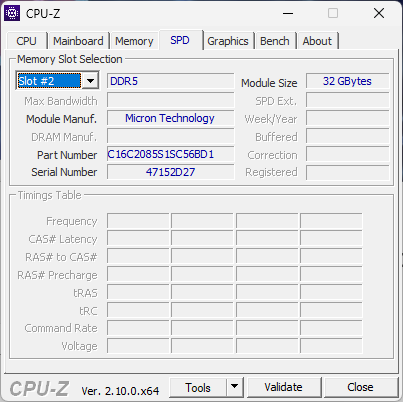
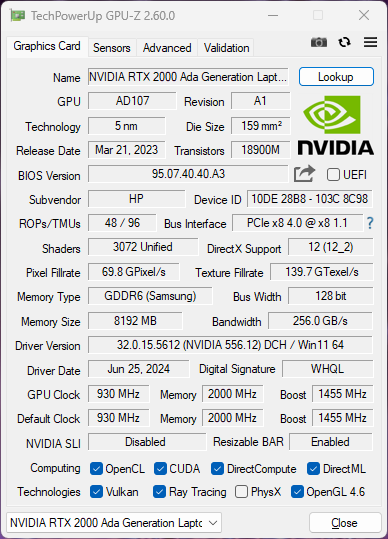
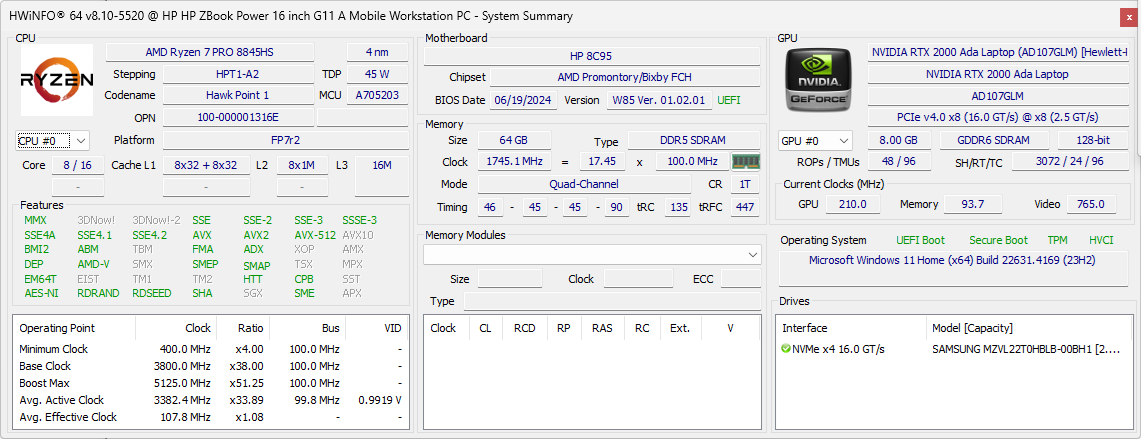
Unser Testgerät ist eine High-End-Version mit AMD-Hardware (ZBook Power 16 G11 A), ausgestattet mit einem Ryzen 7 8845HS-Prozessor, einer RTX 2000 Ada-GPU und einem 120Hz-2560 x 1600p-IPS-Display, und kostet etwa 2,200 Euro. Die Auswahlmöglichkeiten reichen vom Ryzen 5 8645HS bis hin zum Ryzen 9 8945HS, gepaart mit einem 1200p-Display und wahlweise RTX 1000-, RTX 2000- oder RTX 3000-Grafik. Es besteht auch die Möglichkeit, auf eine diskrete Grafikkarte zu verzichten.
Zu den Wettbewerbern in dieser Kategorie zählen andere 16-Zoll-Workstations wie das Dell Precision 5690, MSI CreatorPro Z16P oder das Lenovo ThinkPad P16s G2.
Weitere HP Bewertungen:
Preisvergleich
Mögliche Konkurrenten im Vergleich
Bew. | Version | Datum | Modell | Gewicht | Dicke | Größe | Auflösung | Preis ab |
|---|---|---|---|---|---|---|---|---|
| 85.4 % | v8 | 10 / 2024 | HP ZBook Power 16 G11 A R7 8845HS, RTX 2000 Ada Generation Laptop | 2.2 kg | 22.9 mm | 16.00" | 2560x1600 | |
| 88.9 % v7 (old) | v7 (old) | 12 / 2023 | HP ZBook Power 15 G10 R7 PRO 7840HS, RTX 2000 Ada Generation Laptop | 2 kg | 22.9 mm | 15.60" | 2560x1440 | |
| 85.9 % | v8 | 08 / 2024 | HP ZBook Fury 16 G11 i9-14900HX, RTX 3500 Ada Generation Laptop | 2.6 kg | 28.5 mm | 16.00" | 3840x2400 | |
| 83.5 % | v8 | 10 / 2024 | Lenovo ThinkPad P1 Gen 7 21KV001SGE Ultra 7 155H, GeForce RTX 4060 Laptop GPU | 2 kg | 20.5 mm | 16.00" | 2560x1600 | |
| 88.6 % v7 (old) | v7 (old) | 01 / 2024 | Lenovo ThinkPad P16s G2 21K9000CGE R7 PRO 7840U, Radeon 780M | 1.8 kg | 24.4 mm | 16.00" | 3840x2400 | |
| 88.3 % v7 (old) | v7 (old) | 05 / 2024 | Dell Precision 5690 Ultra 9 185H, RTX 5000 Ada Generation Laptop | 2.3 kg | 22.17 mm | 16.00" | 3840x2400 |
Hinweis: Wir haben unser Rating-System kürzlich aktualisiert und die Ergebnisse von Version 8 sind nicht mit den Ergebnissen von Version 7 vergleichbar. Weitere Informationen dazu sind hier verfügbar.
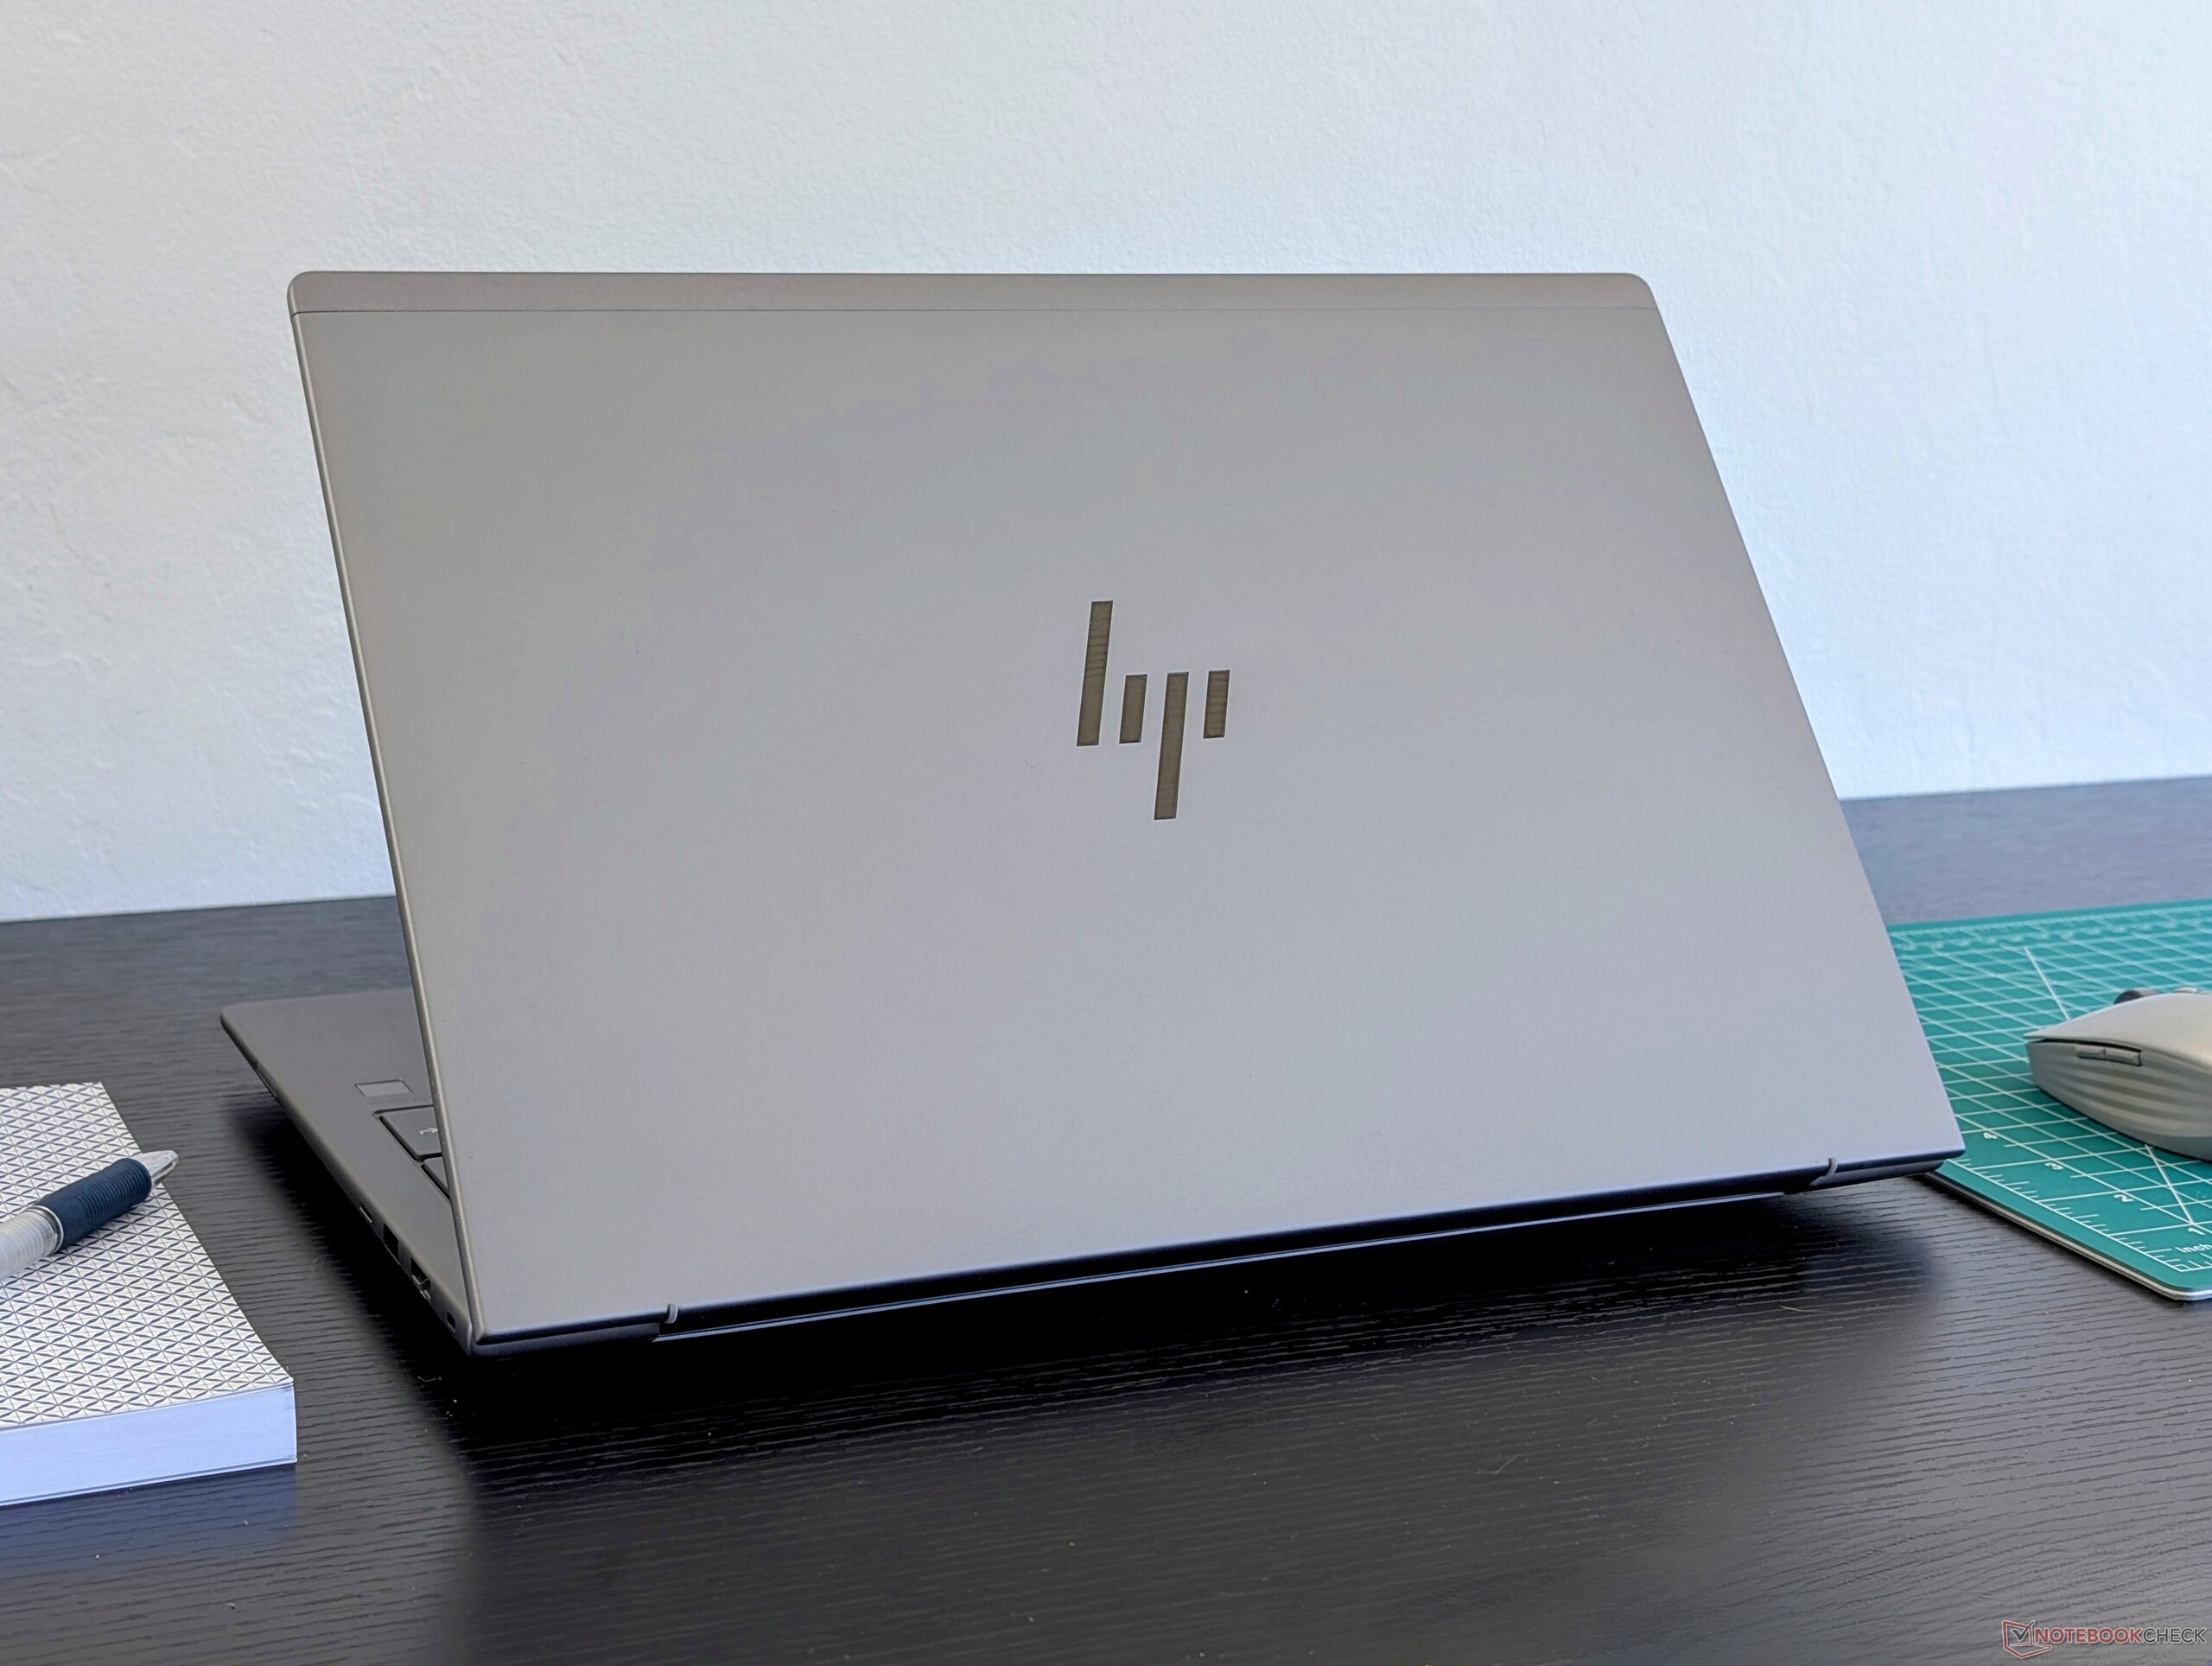
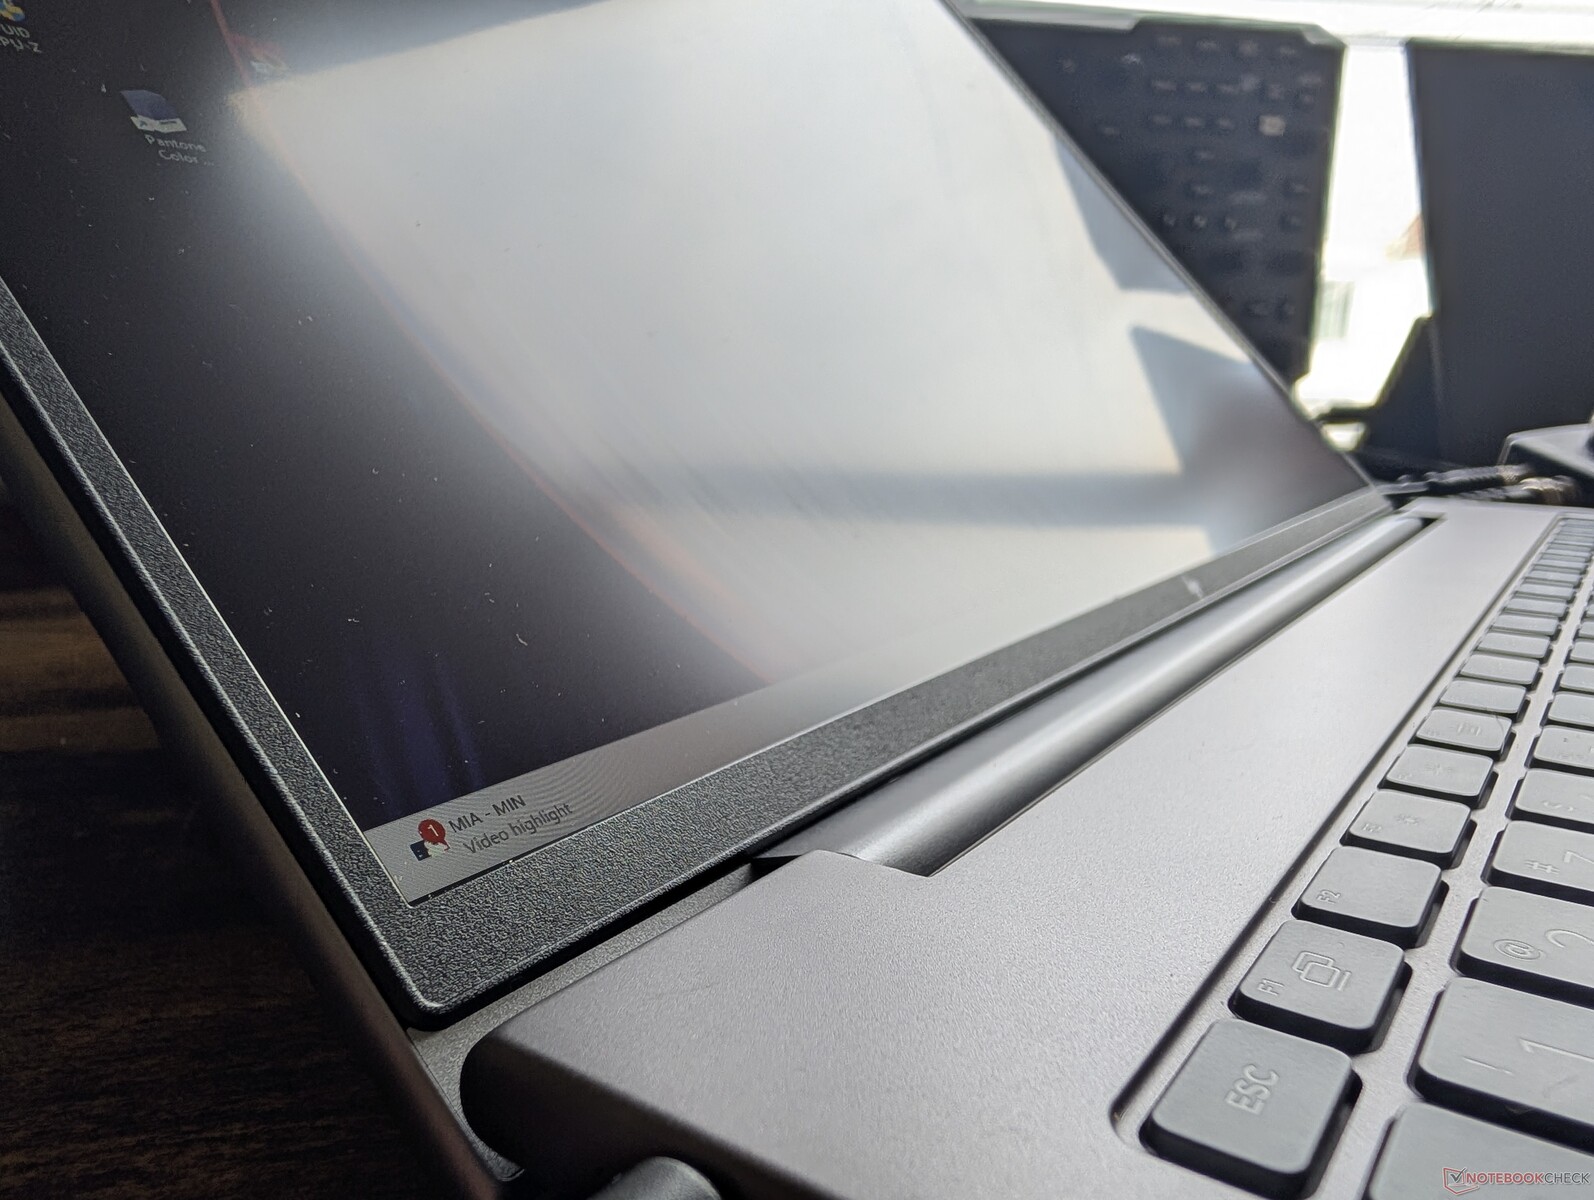
Gehäuse — MIL-STD 810 zertifiziert
HP verwendet für fast alle seine ZBook-Modelle ähnliche graue Aluminiumlegierungen, um eine einheitliche Optik innerhalb der gesamten Serie zu gewährleisten. Das ZBook Power 16 G11 behält dieselbe glatte, matte Metalloberfläche bei wie das ZBook Power 15 G10, weist jedoch subtile Änderungen an den Tastaturrändern, der äußeren Deckelverkleidung und der Unterseite auf.
Die Gehäusesteifigkeit ist hervorragend, mit minimaler Verwindung und Eindrückung beim Versuch, die Basis zu verbiegen. Allerdings hätten die Scharniere und der Deckel stabiler sein können, insbesondere da sich der Deckel im Gegensatz zum Precision 5690 fast um 180 Grad öffnen lässt.
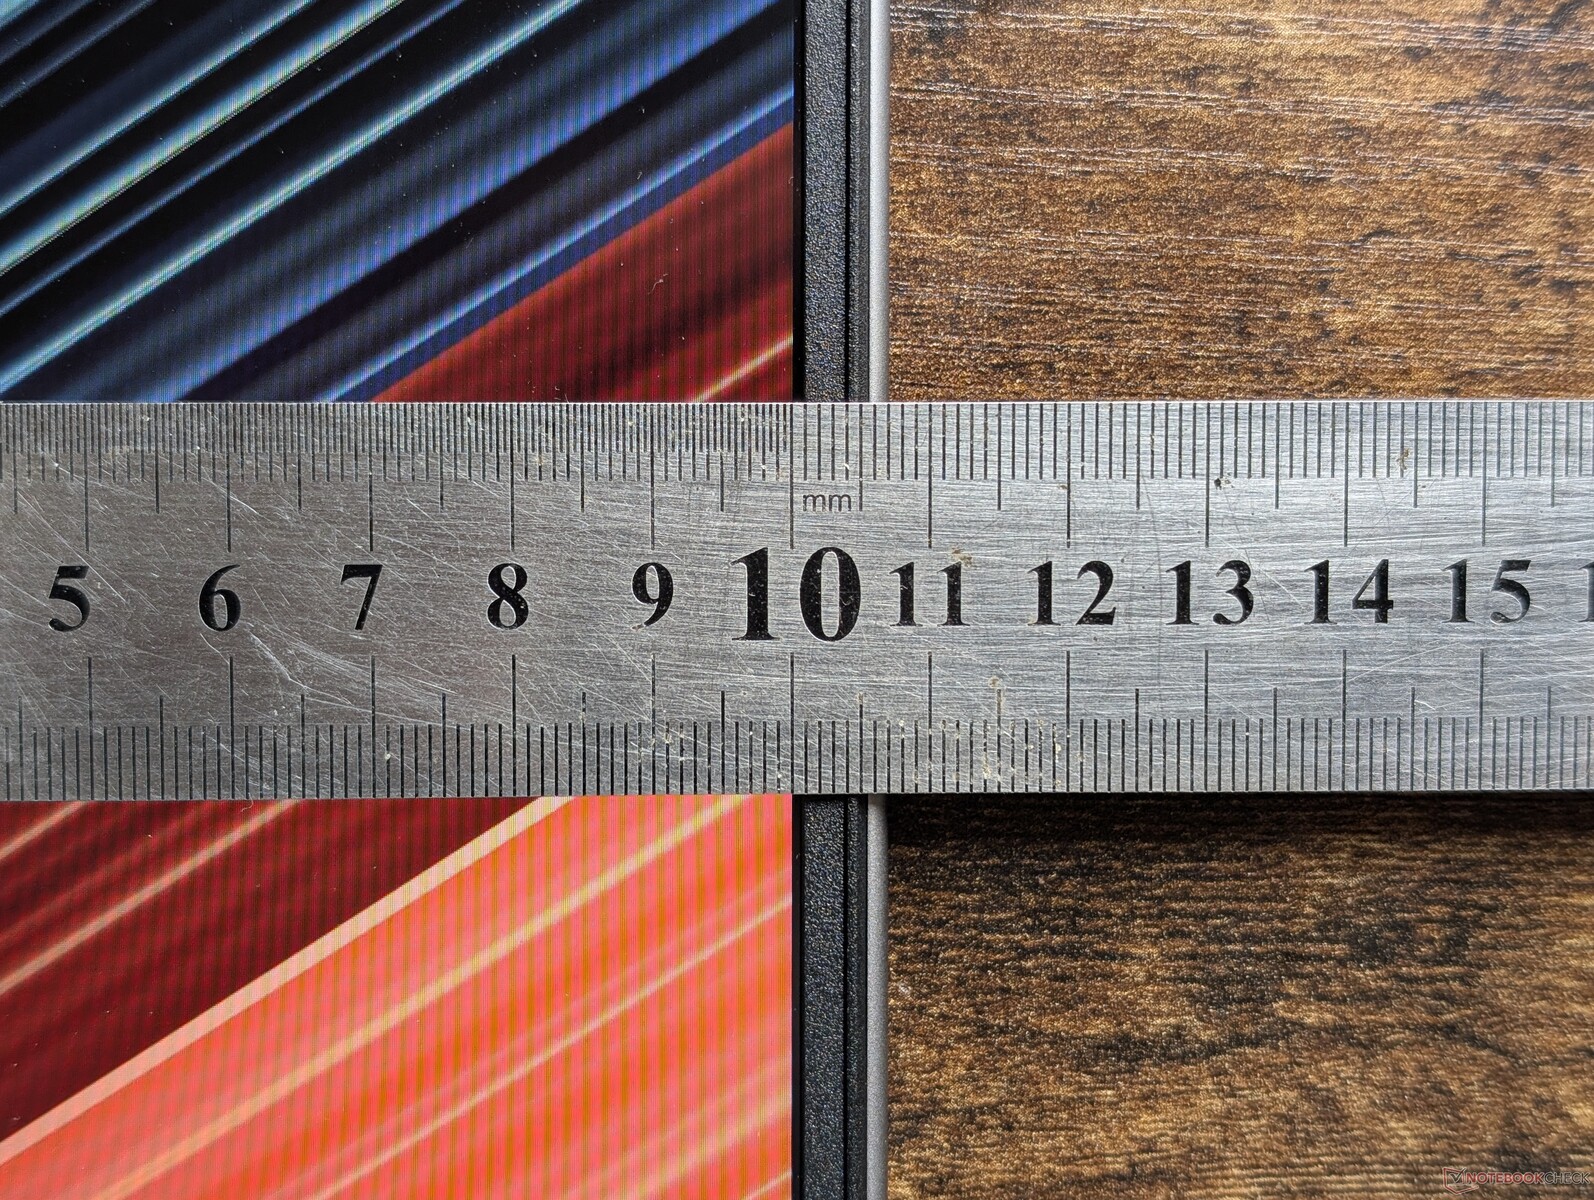
Das neue 16-Zoll-Design ist etwa 10 Prozent schwerer und 7 Prozent größer als das vorherige 15-Zoll-Modell. Leider ist es nicht dünner geworden, was bedauerlich ist, da es bereits dicker ist als einige Konkurrenten wie das ThinkPad P1 Gen 7. Das ZBook Fury 16 G11 ist sogar noch schwerer und dicker, bietet dafür jedoch schnellere CPU- und GPU-Optionen. Für Benutzer, die eine tragbarere Option wünschen, bietet HP die schlankere ZBook Firefly 16-Serie an.
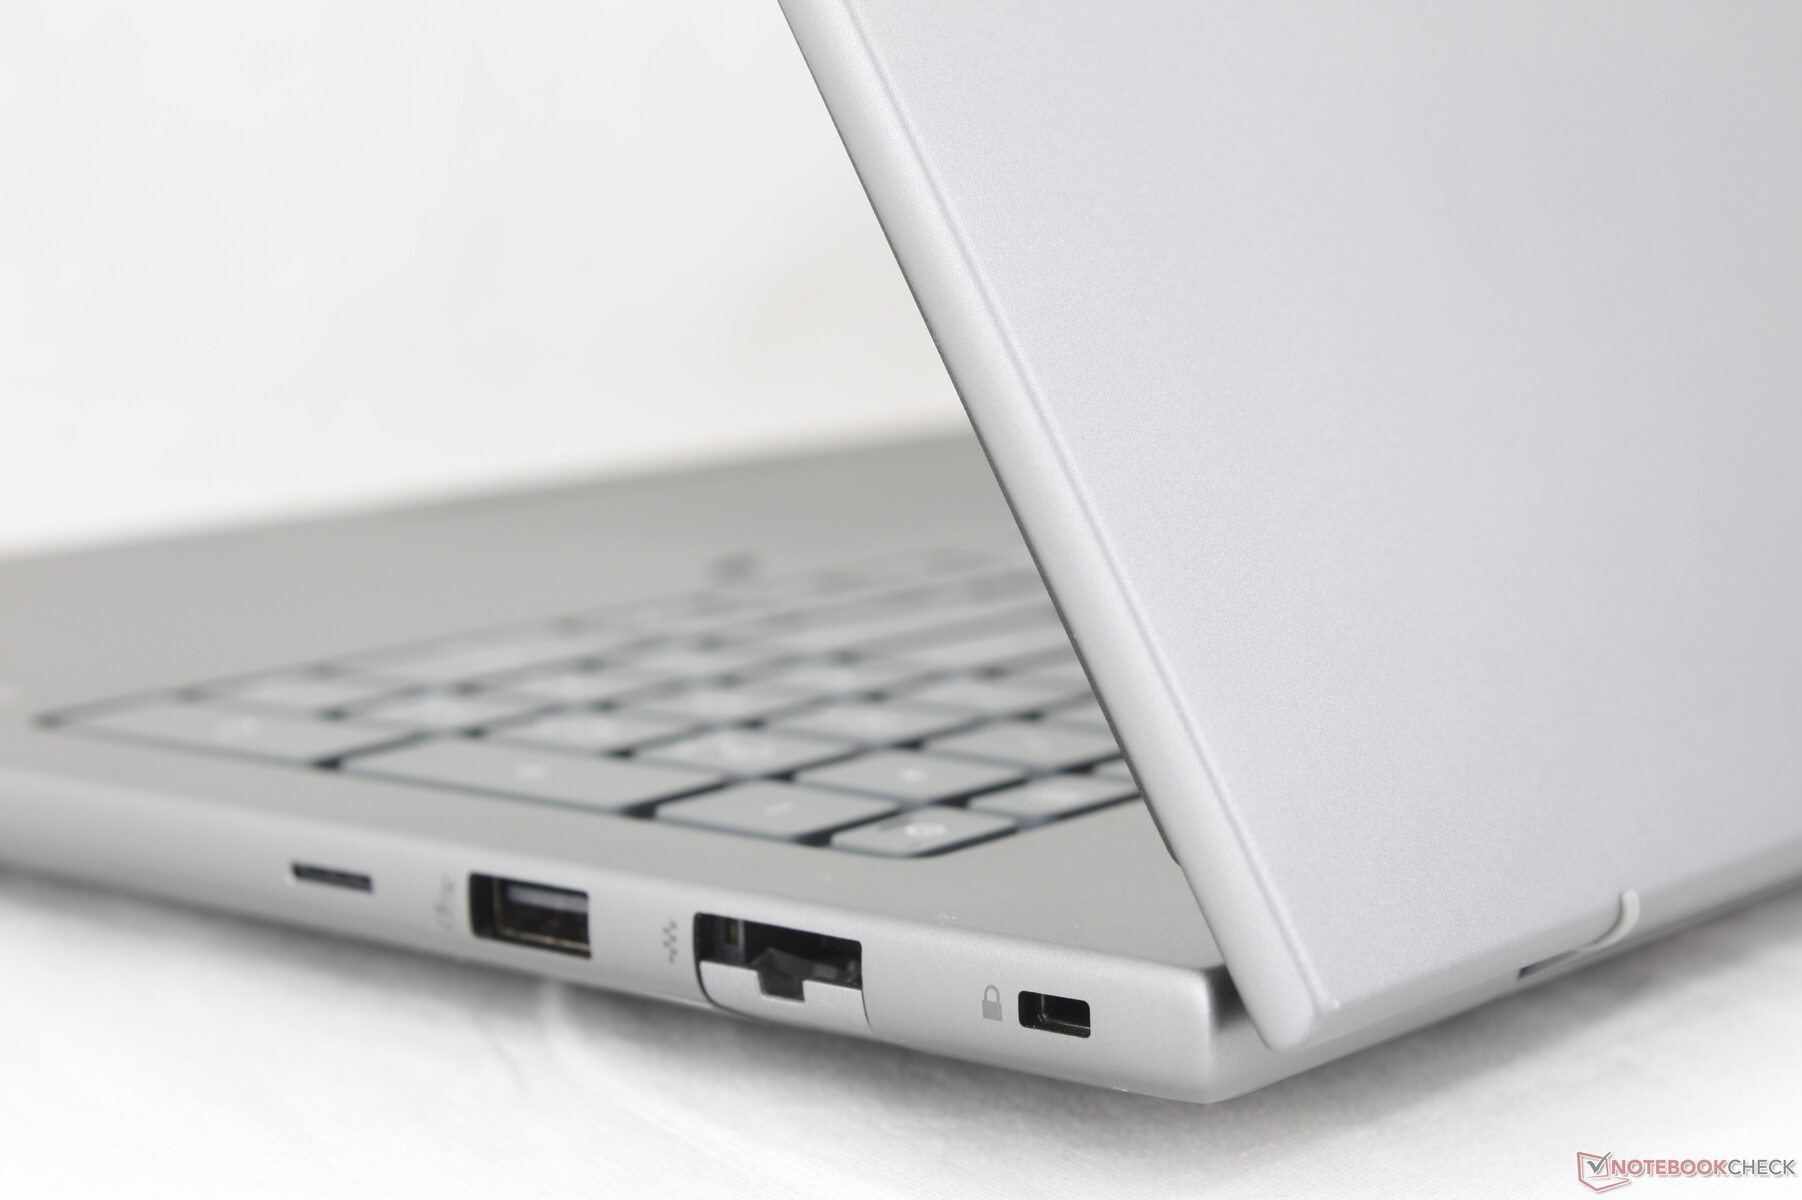
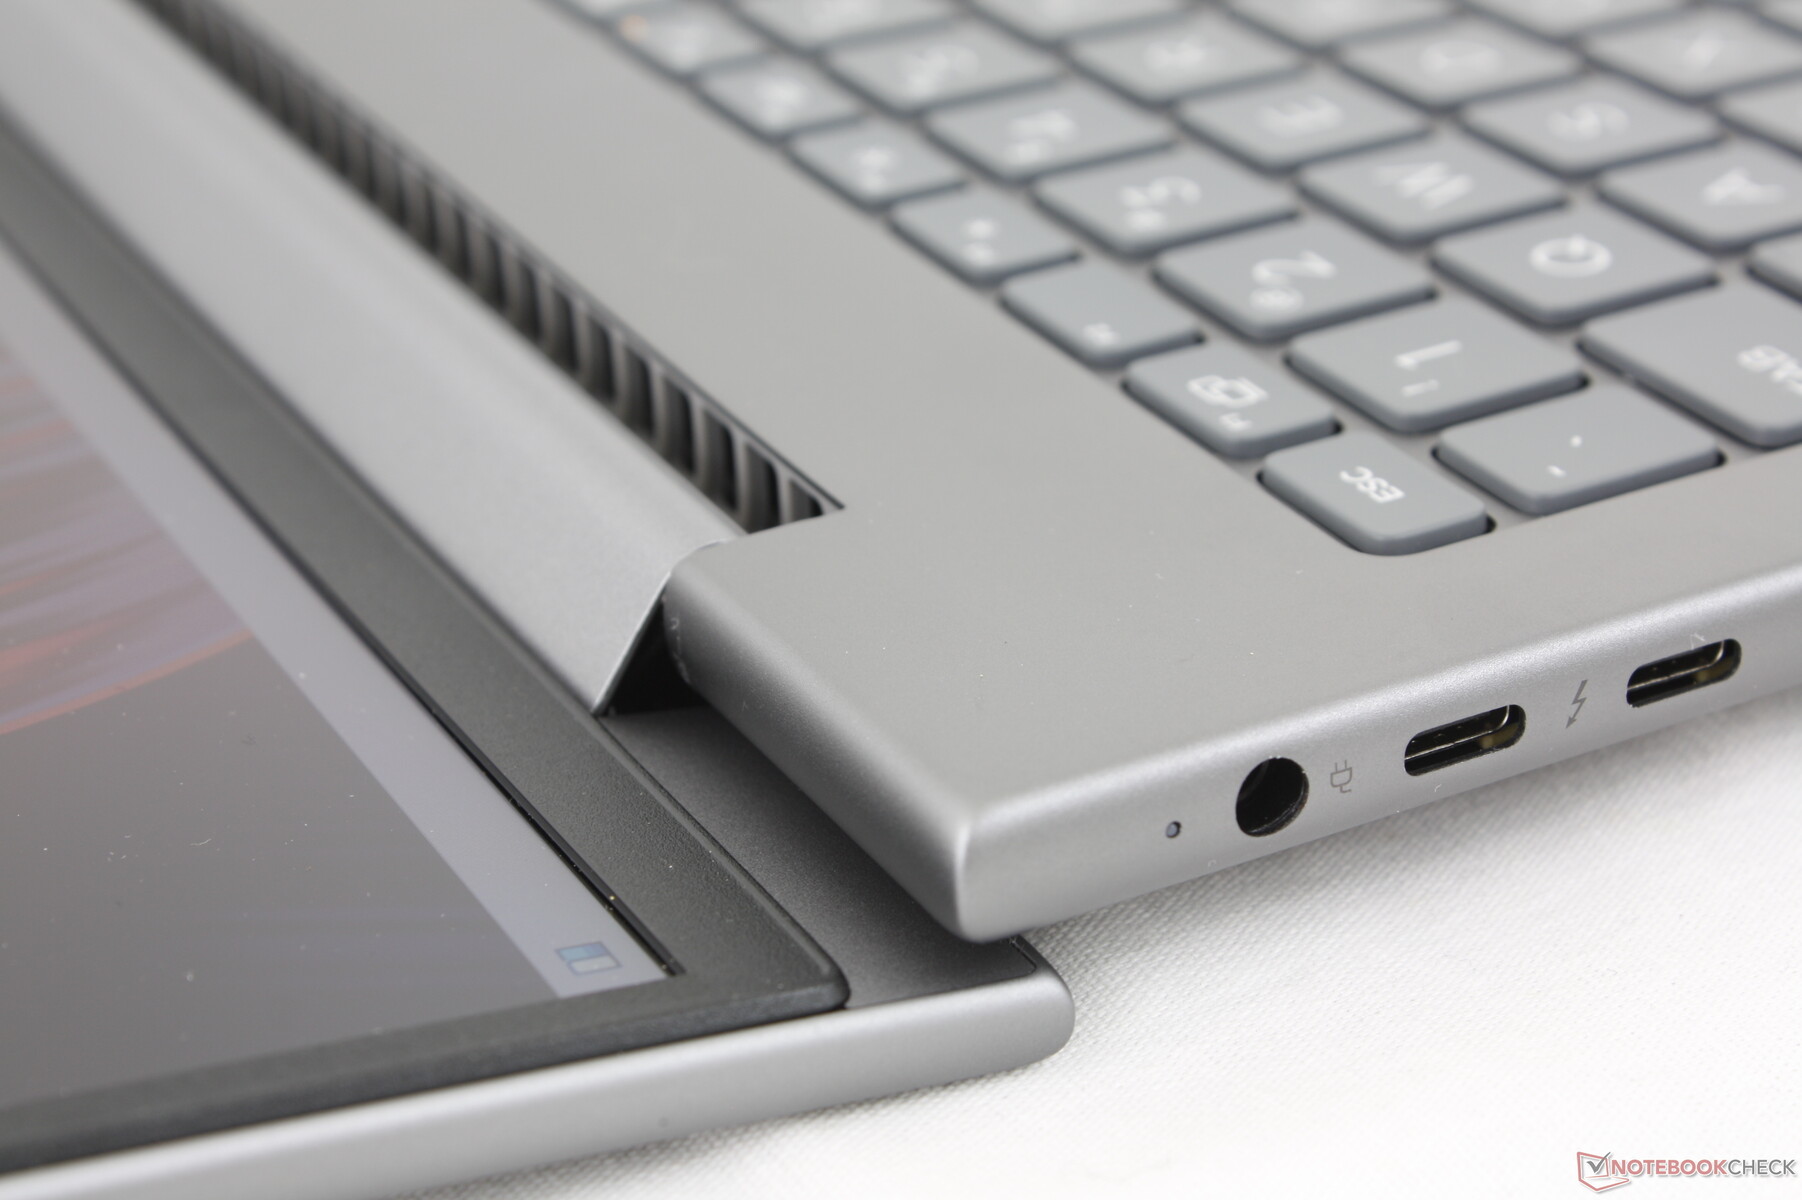
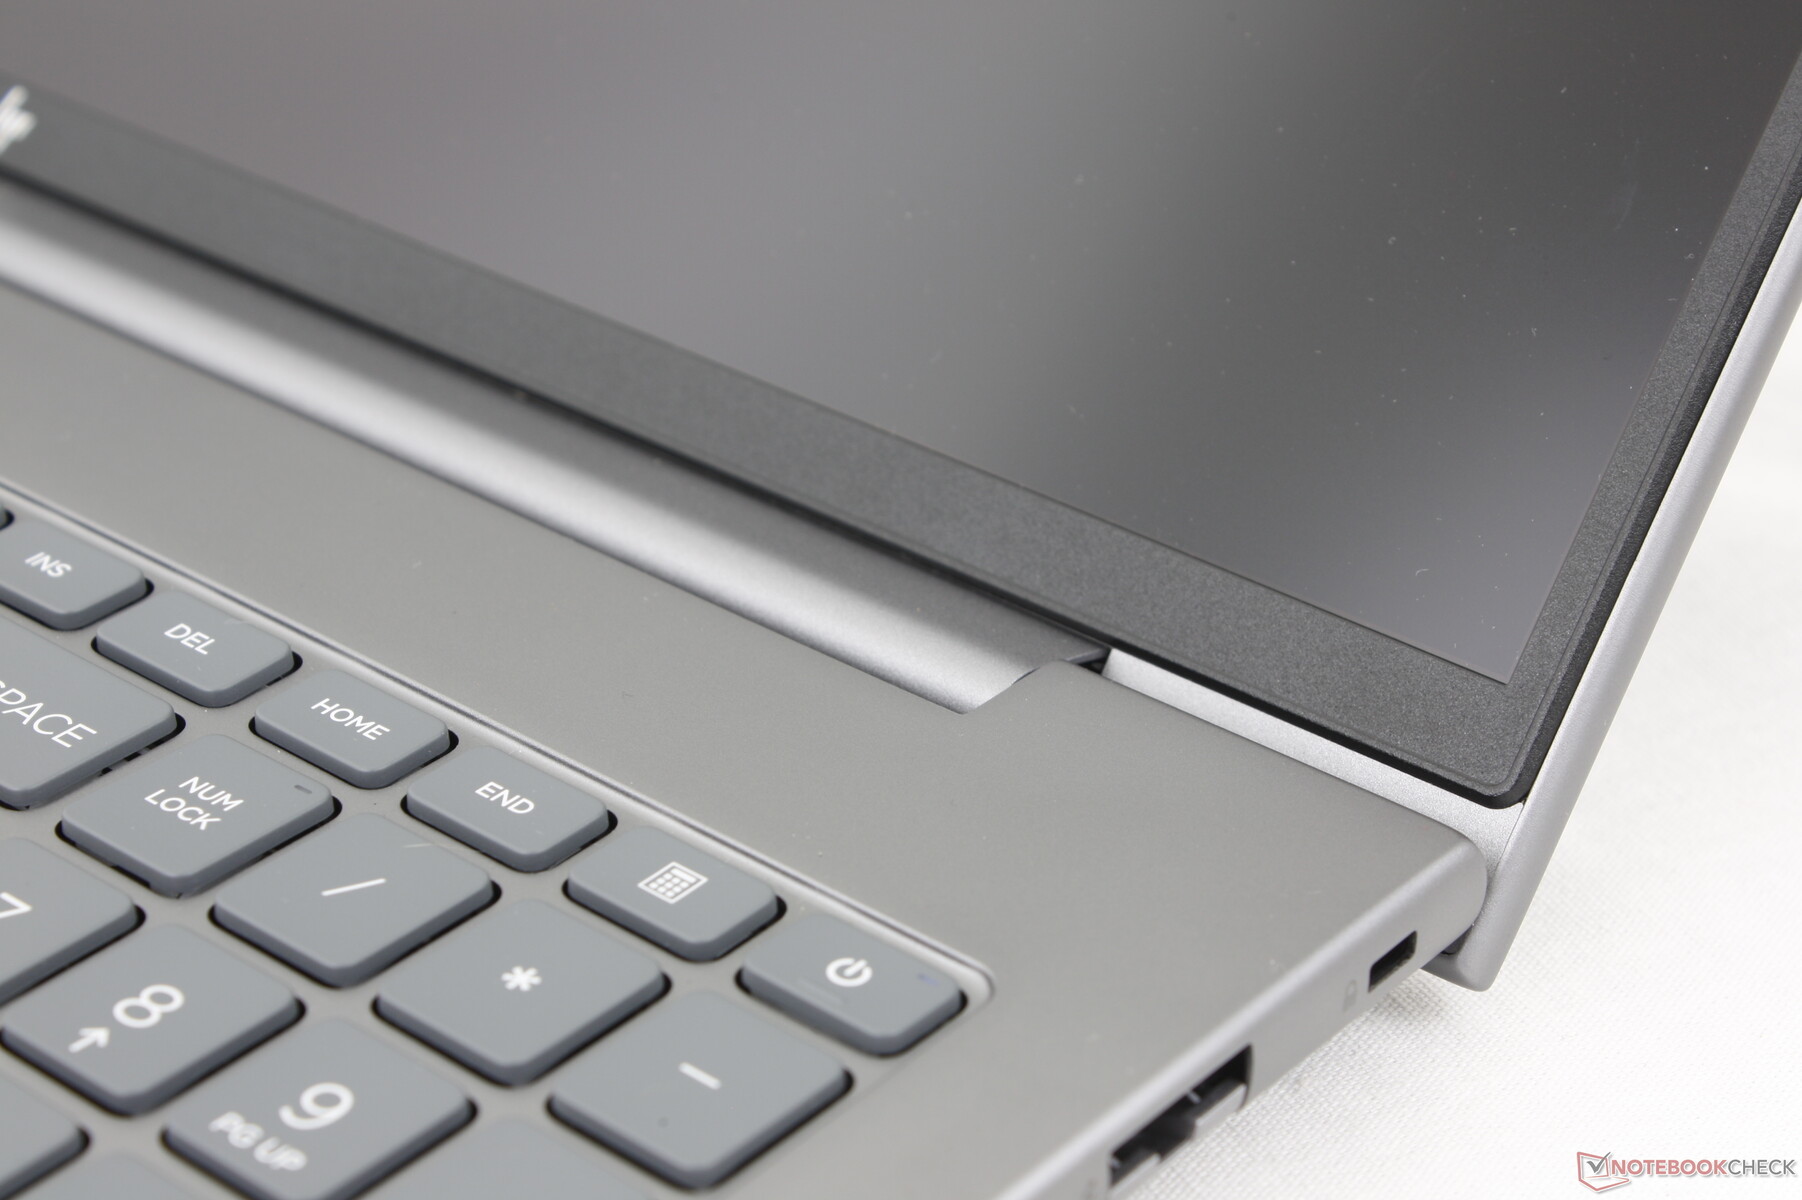
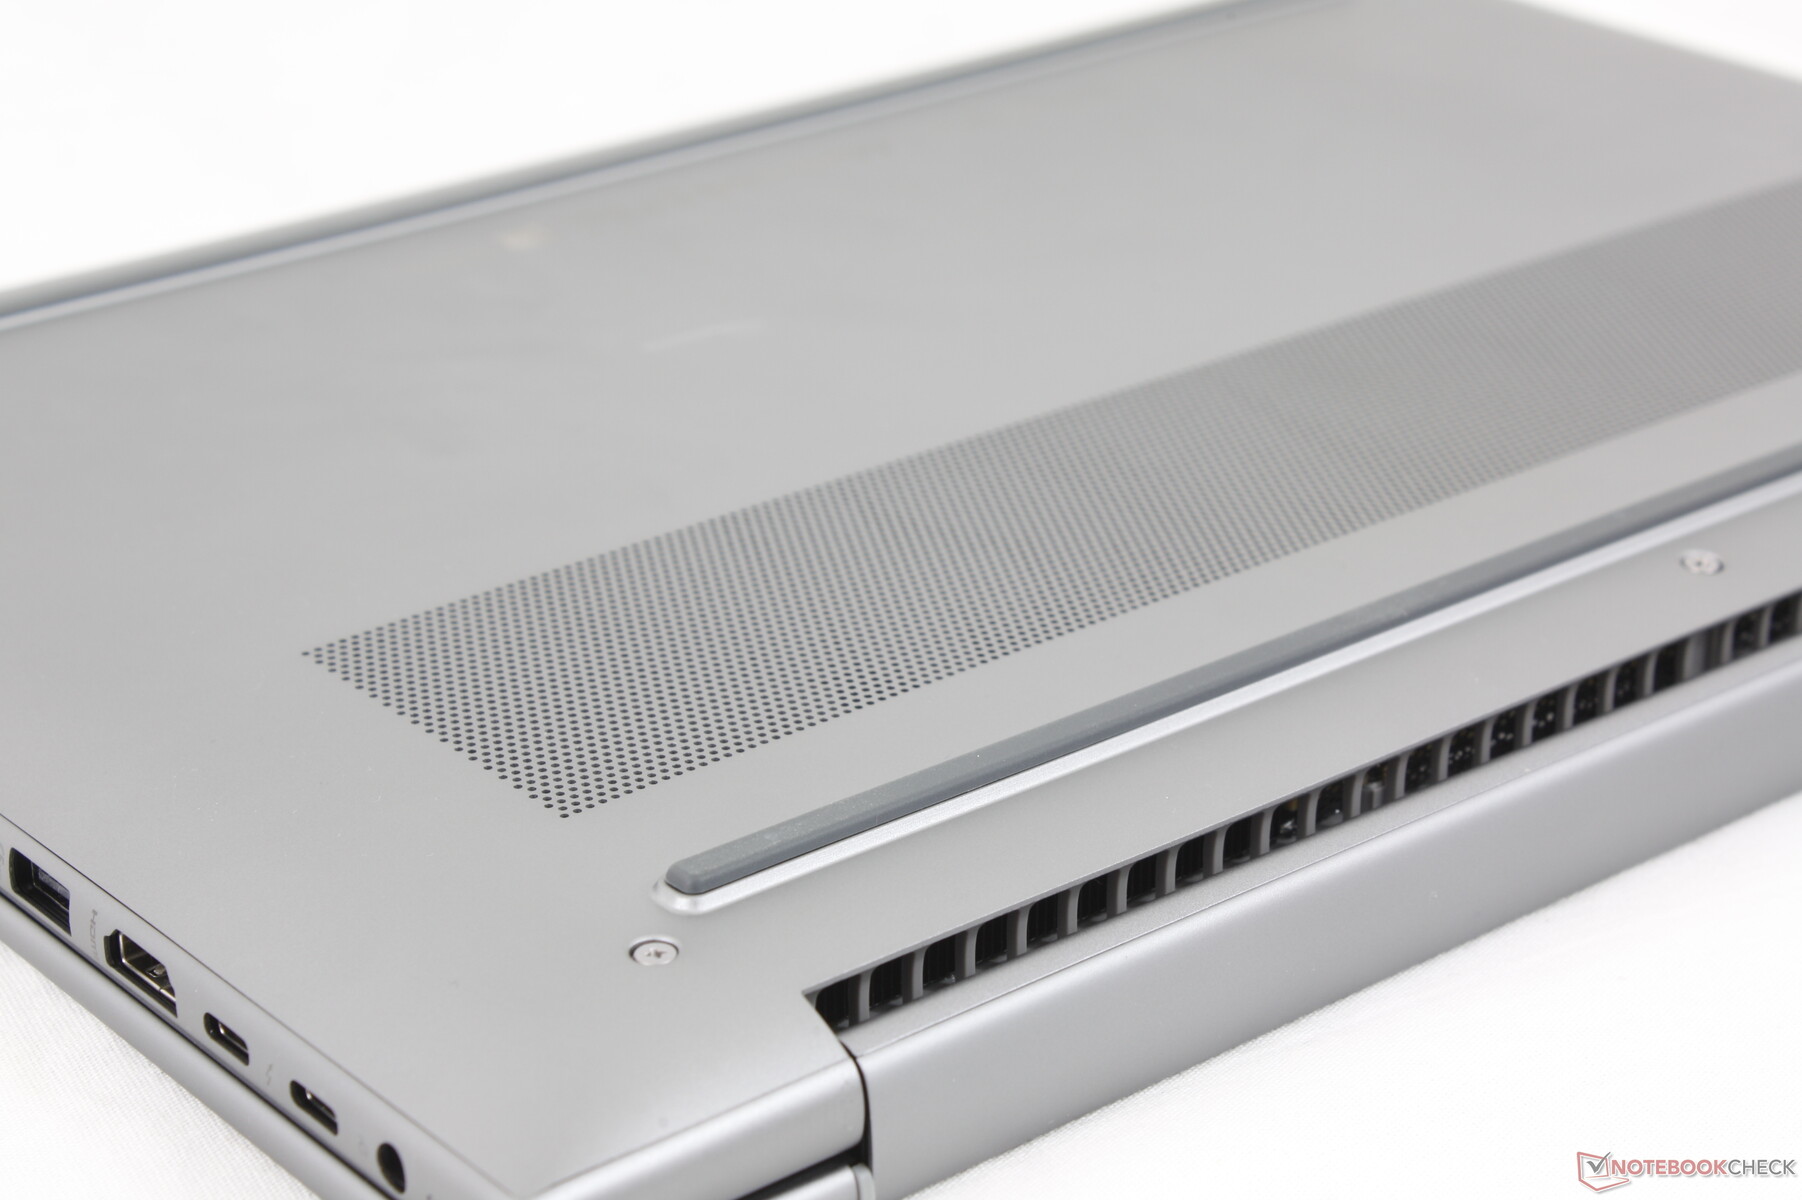
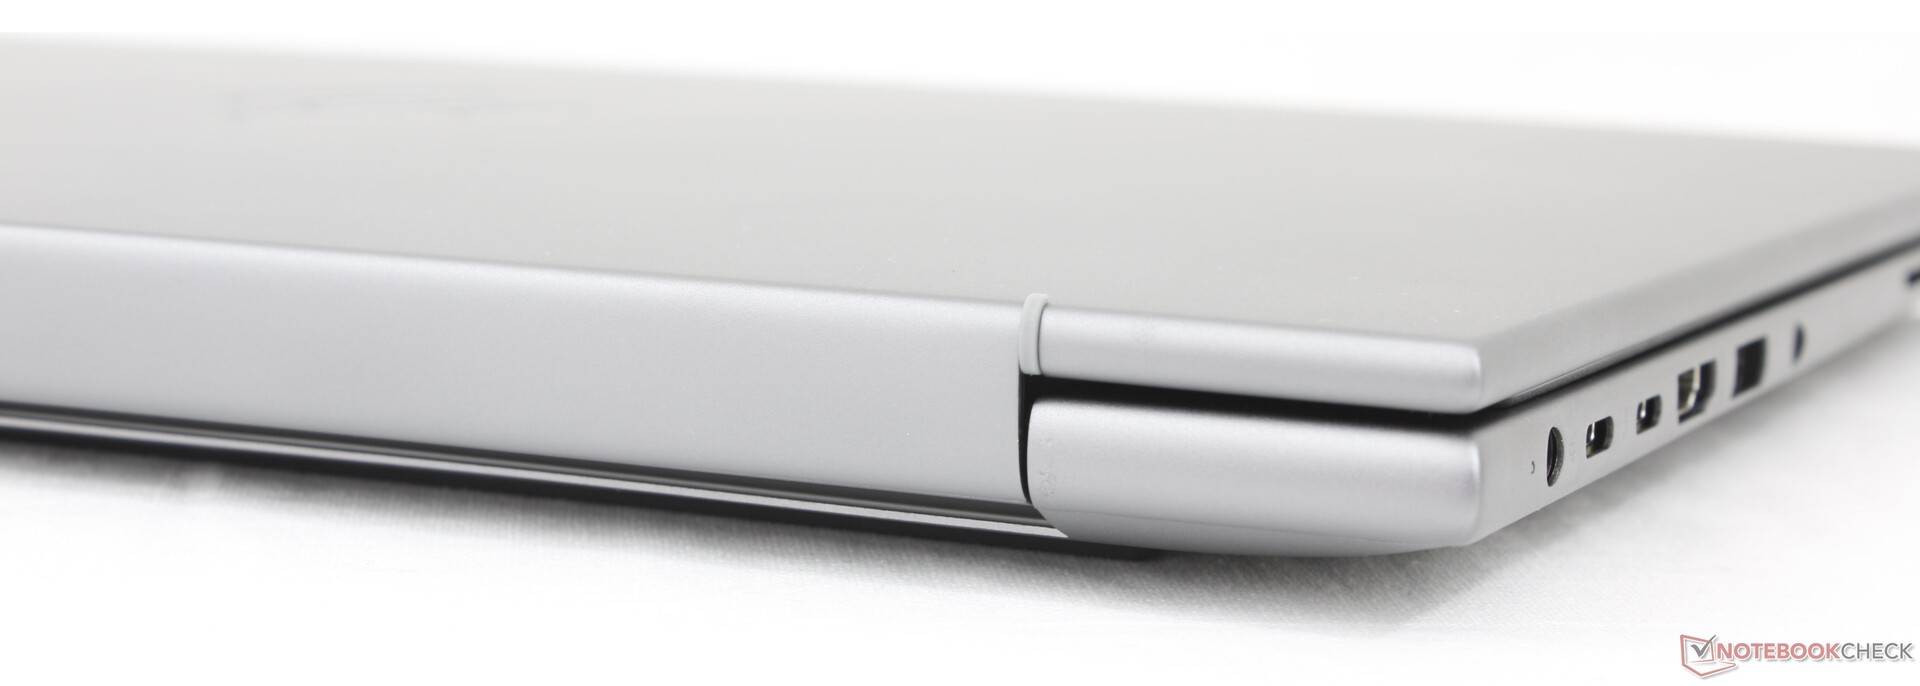
Ausstattung — Thunderbolt 4-Anschlüsse
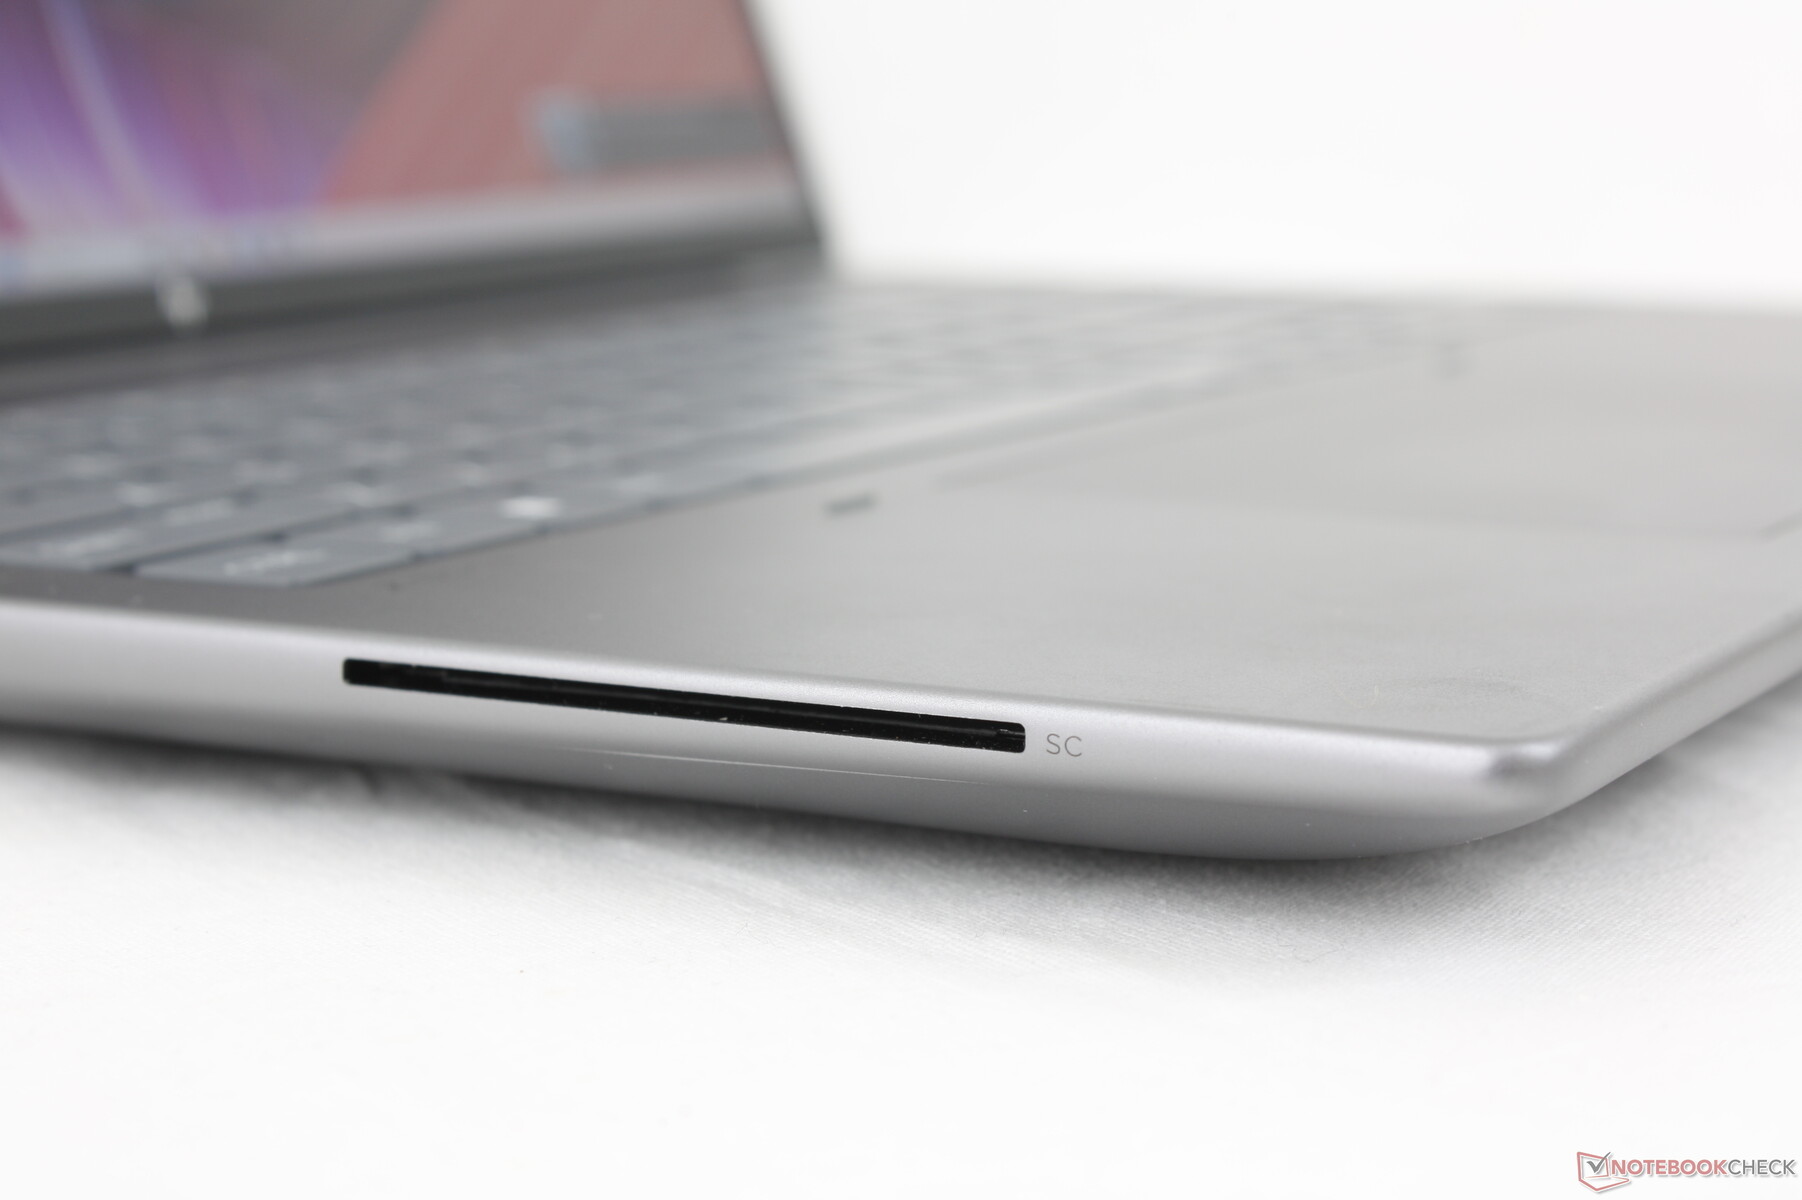
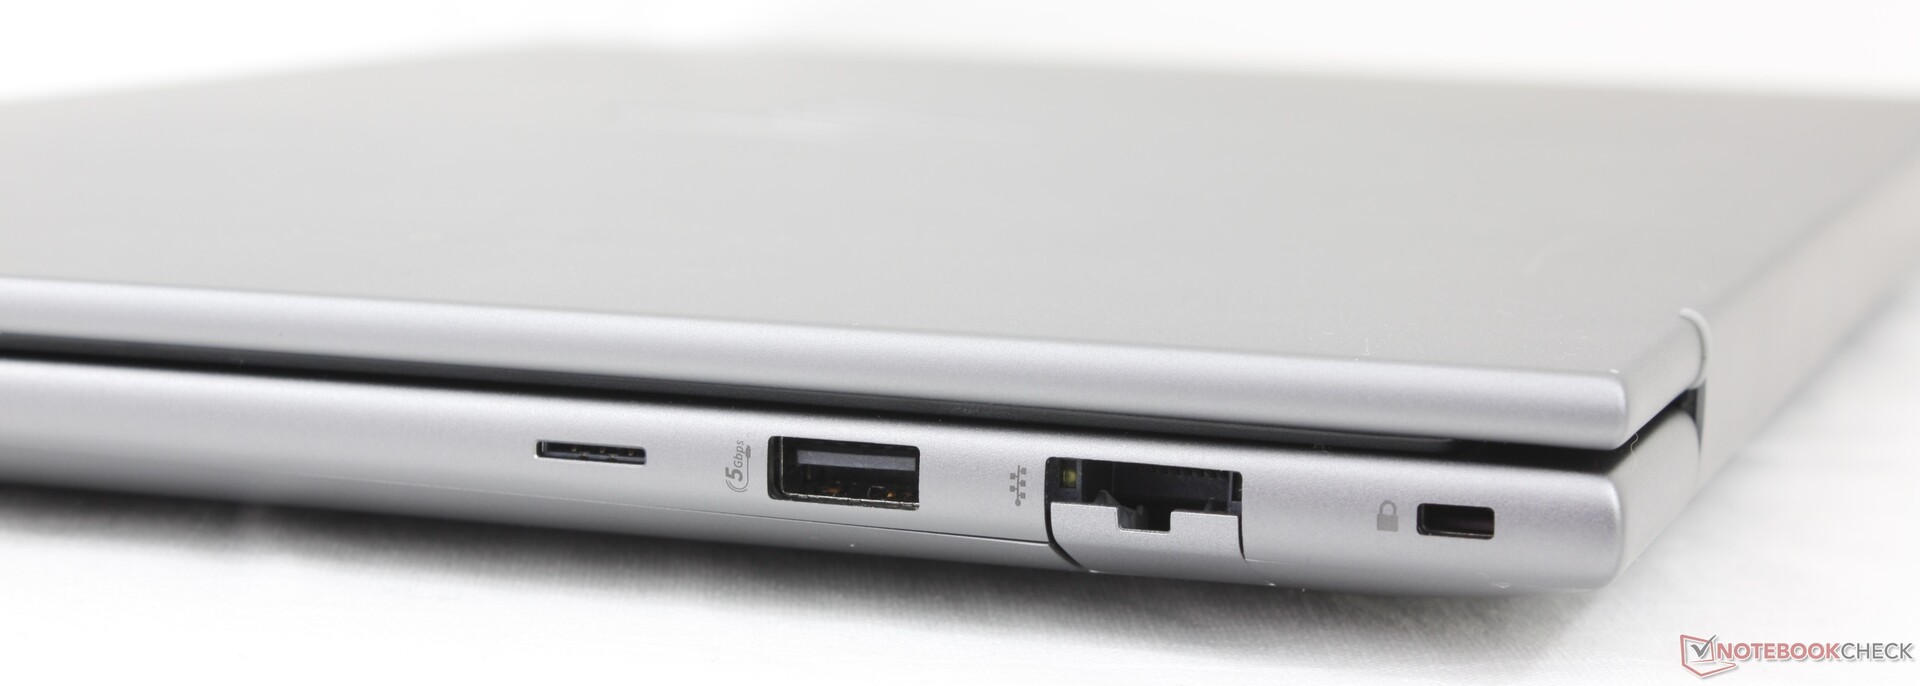
Das Modell verfügt über weniger USB-A-Anschlüsse als das ZBook Power 15 G10 aus dem letzten Jahr. Ansonsten sind alle Anschlüsse wieder vorhanden, einschließlich des Smart-Card-Lesegeräts und der beiden USB-C-Thunderbolt-4-Anschlüsse, die jedoch neu angeordnet wurden. Besonders die Anschlüsse an der linken Kante sind viel zu eng platziert und hätten etwas besser verteilt werden können.
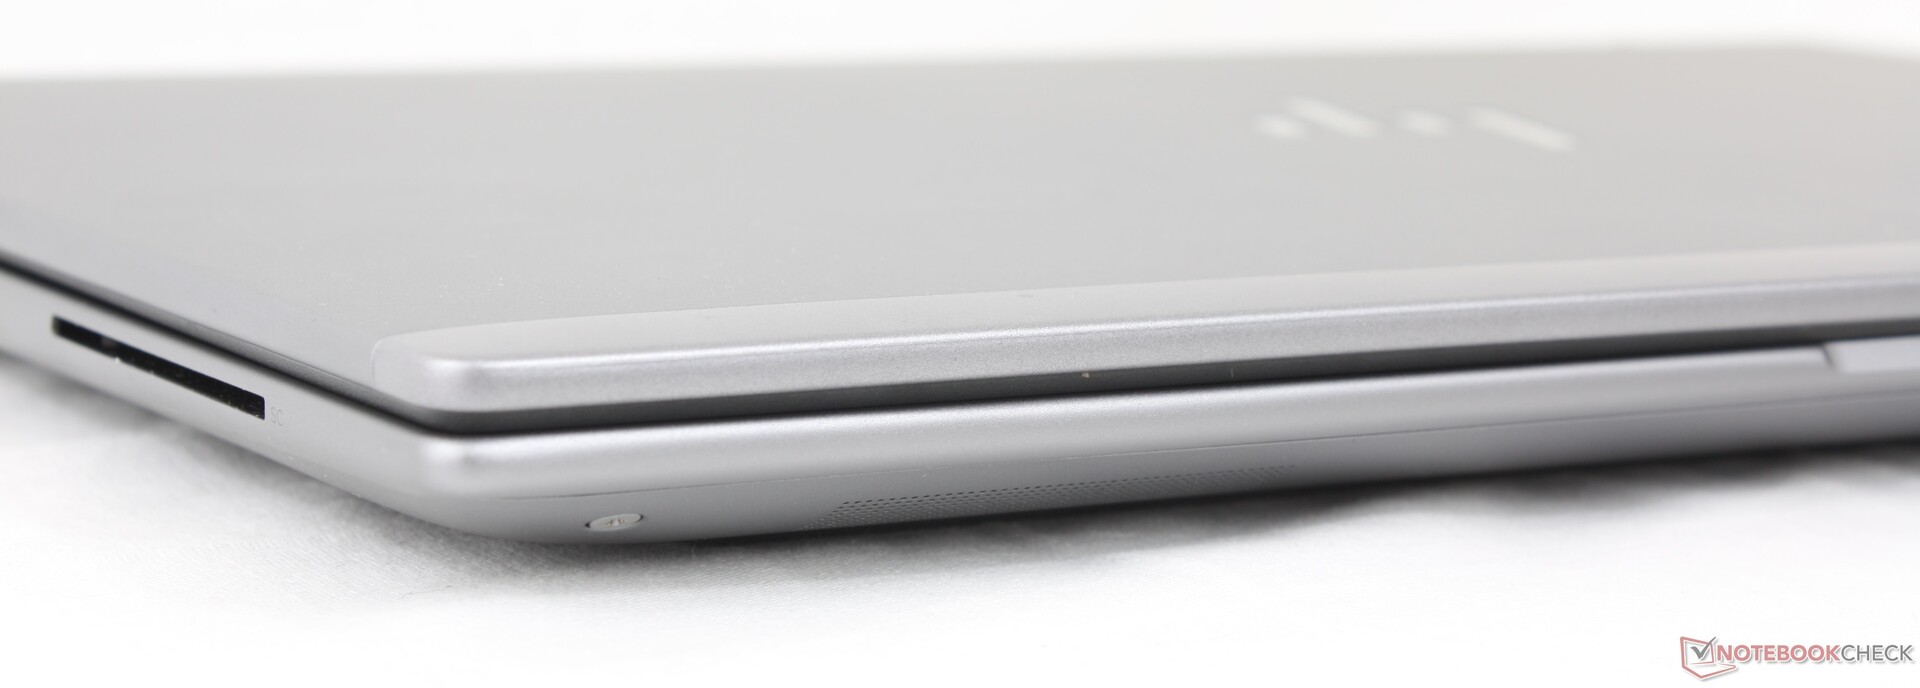

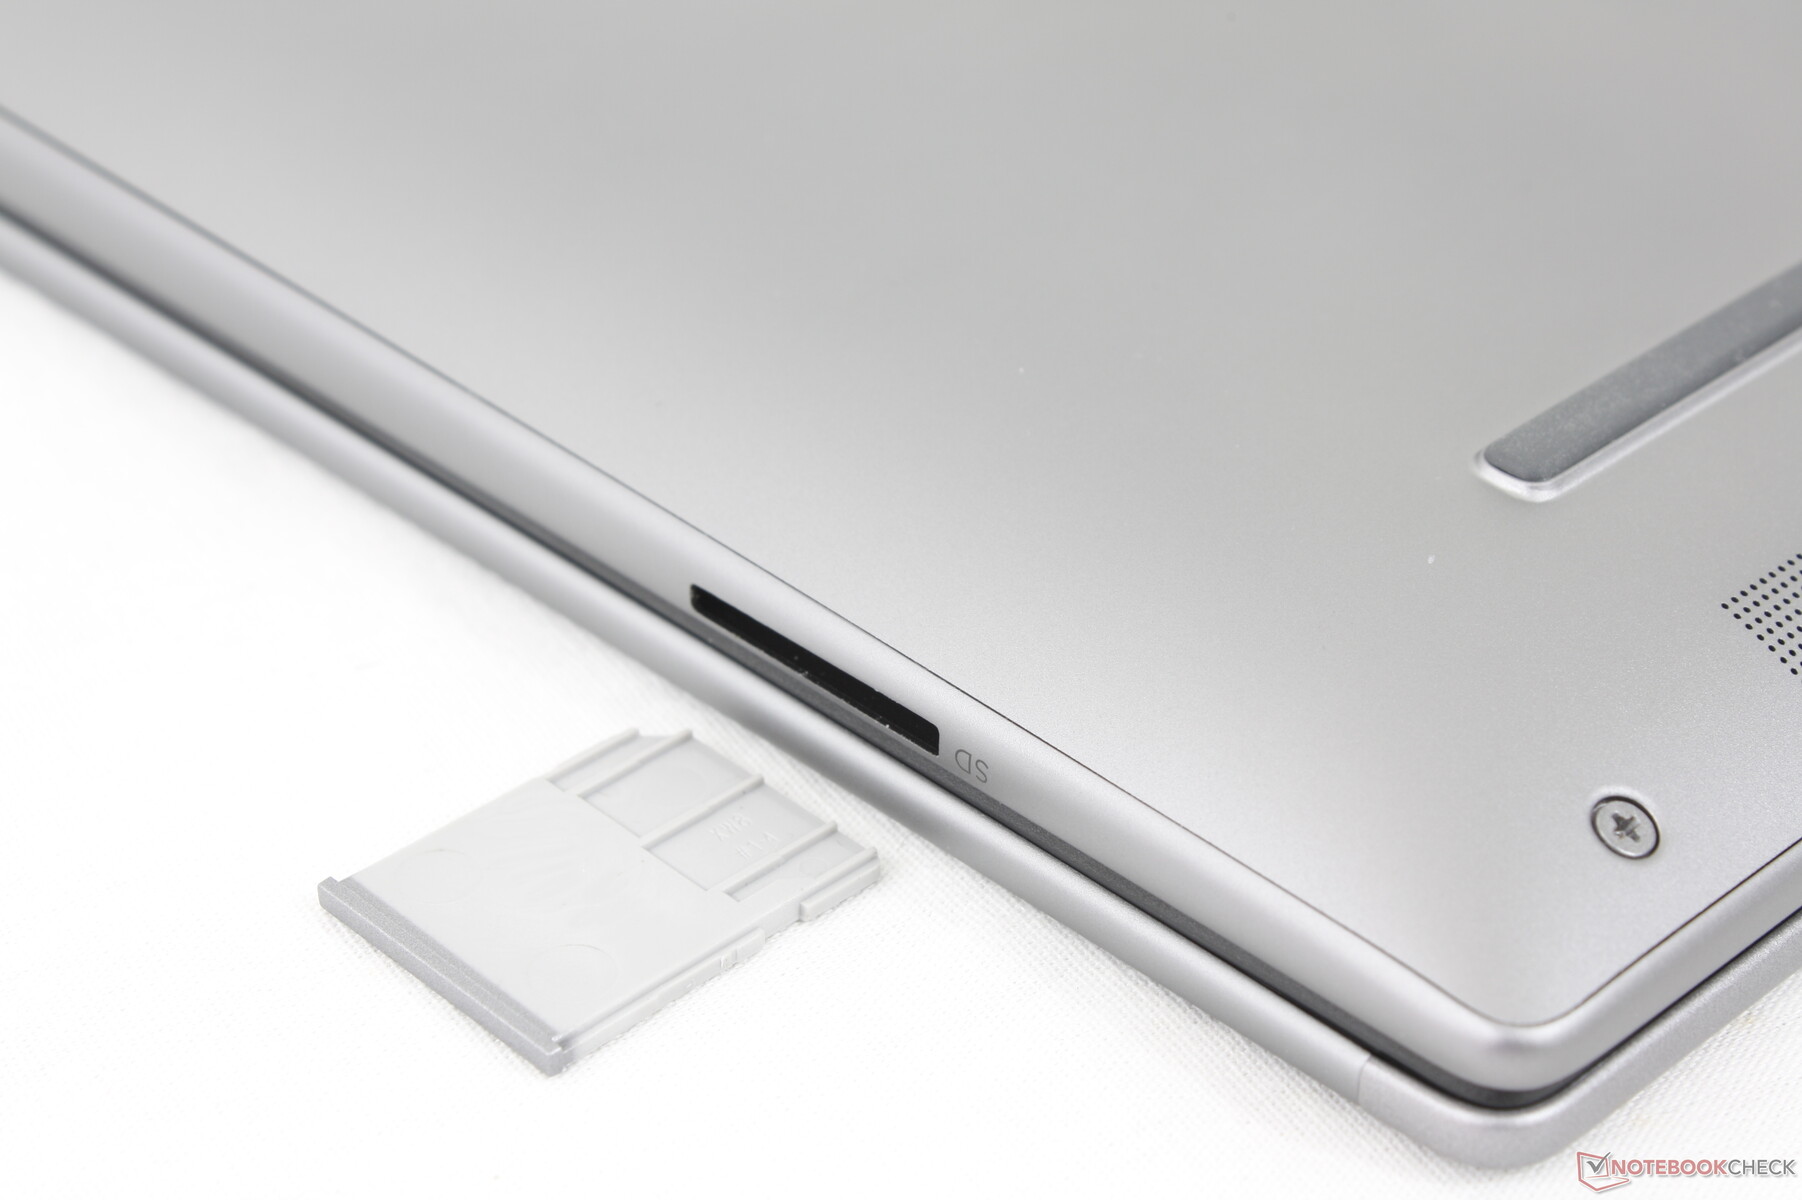
SD Card Reader
Es verfügt über einen MicroSD-Kartenleser, der beim ZBook Power 15 G10 fehlte. Die Übertragungsraten sind sehr schnell; es dauert weniger als 6 Sekunden, um 1 GB Bilder von unserer UHS-II-Testkarte zu übertragen, während sie beim ZBook Fury 16 G11 oder ThinkPad P1 Gen 7 12 Sekunden in Anspruch nimmt.
| SD Card Reader | |
| average JPG Copy Test (av. of 3 runs) | |
| HP ZBook Power 16 G11 A (Toshiba Exceria Pro SDXC 64 GB UHS-II) | |
| HP ZBook Fury 16 G11 (Toshiba Exceria Pro SDXC 64 GB UHS-II) | |
| Lenovo ThinkPad P1 Gen 7 21KV001SGE (AV Pro V60) | |
| maximum AS SSD Seq Read Test (1GB) | |
| HP ZBook Power 16 G11 A (Toshiba Exceria Pro SDXC 64 GB UHS-II) | |
| HP ZBook Fury 16 G11 (Toshiba Exceria Pro SDXC 64 GB UHS-II) | |
| Lenovo ThinkPad P1 Gen 7 21KV001SGE (AV Pro V60) | |
Kommunikation
Der MediaTek MT7922 ist standardmäßig mit Wi-Fi 6E und Bluetooth 5.2 ausgestattet. Zusätzlich sind Optionen von Realtek verfügbar, ebenso wie der HP 4000 oder der Qualcomm 9205 für WAN-Konnektivität.
Webcam
Eine 5-MP-Webcam gehört ebenso zum Standard wie IR und ein Schieberegler, ähnlich wie beim ThinkPad P16s G2. Im Gegensatz dazu ist das Precision 5690 mit einer deutlich niedriger auflösenden 2-MP-Webcam ausgestattet.


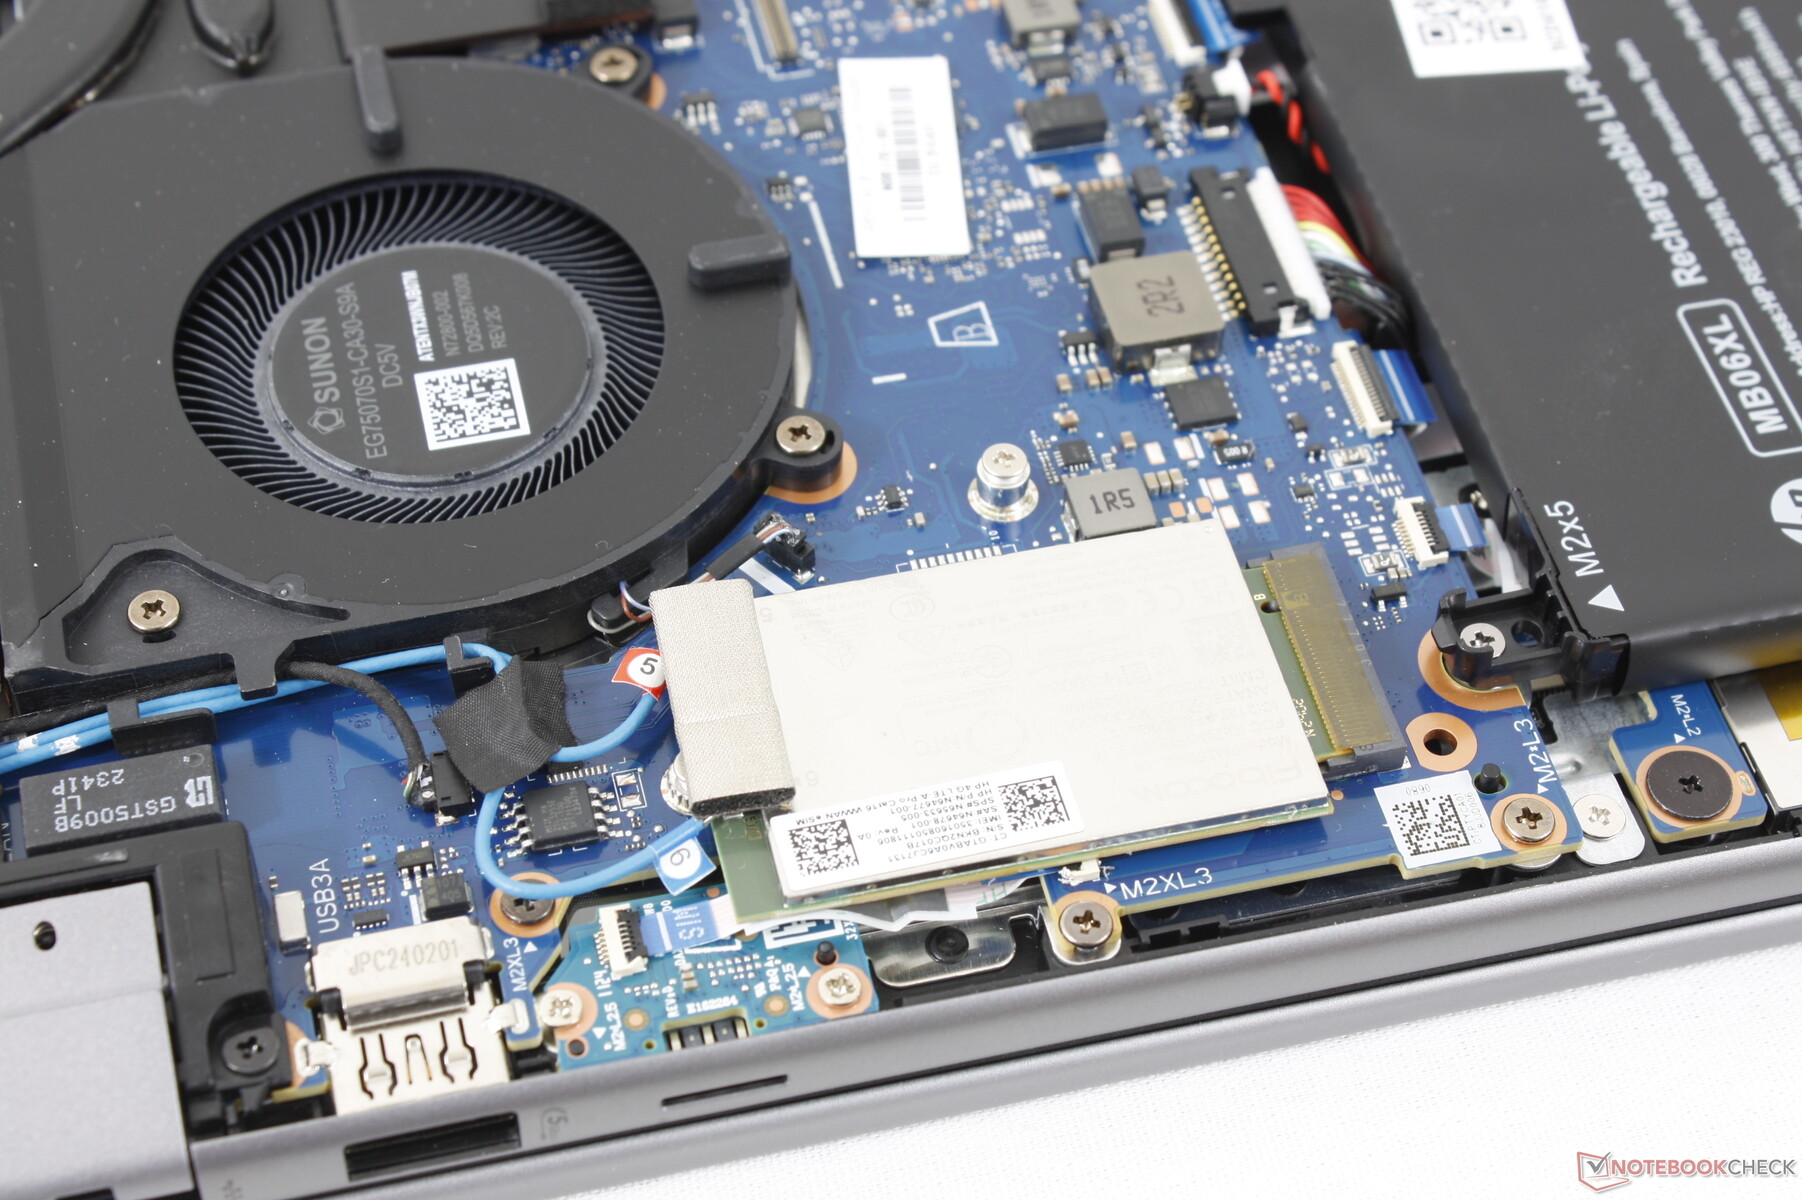
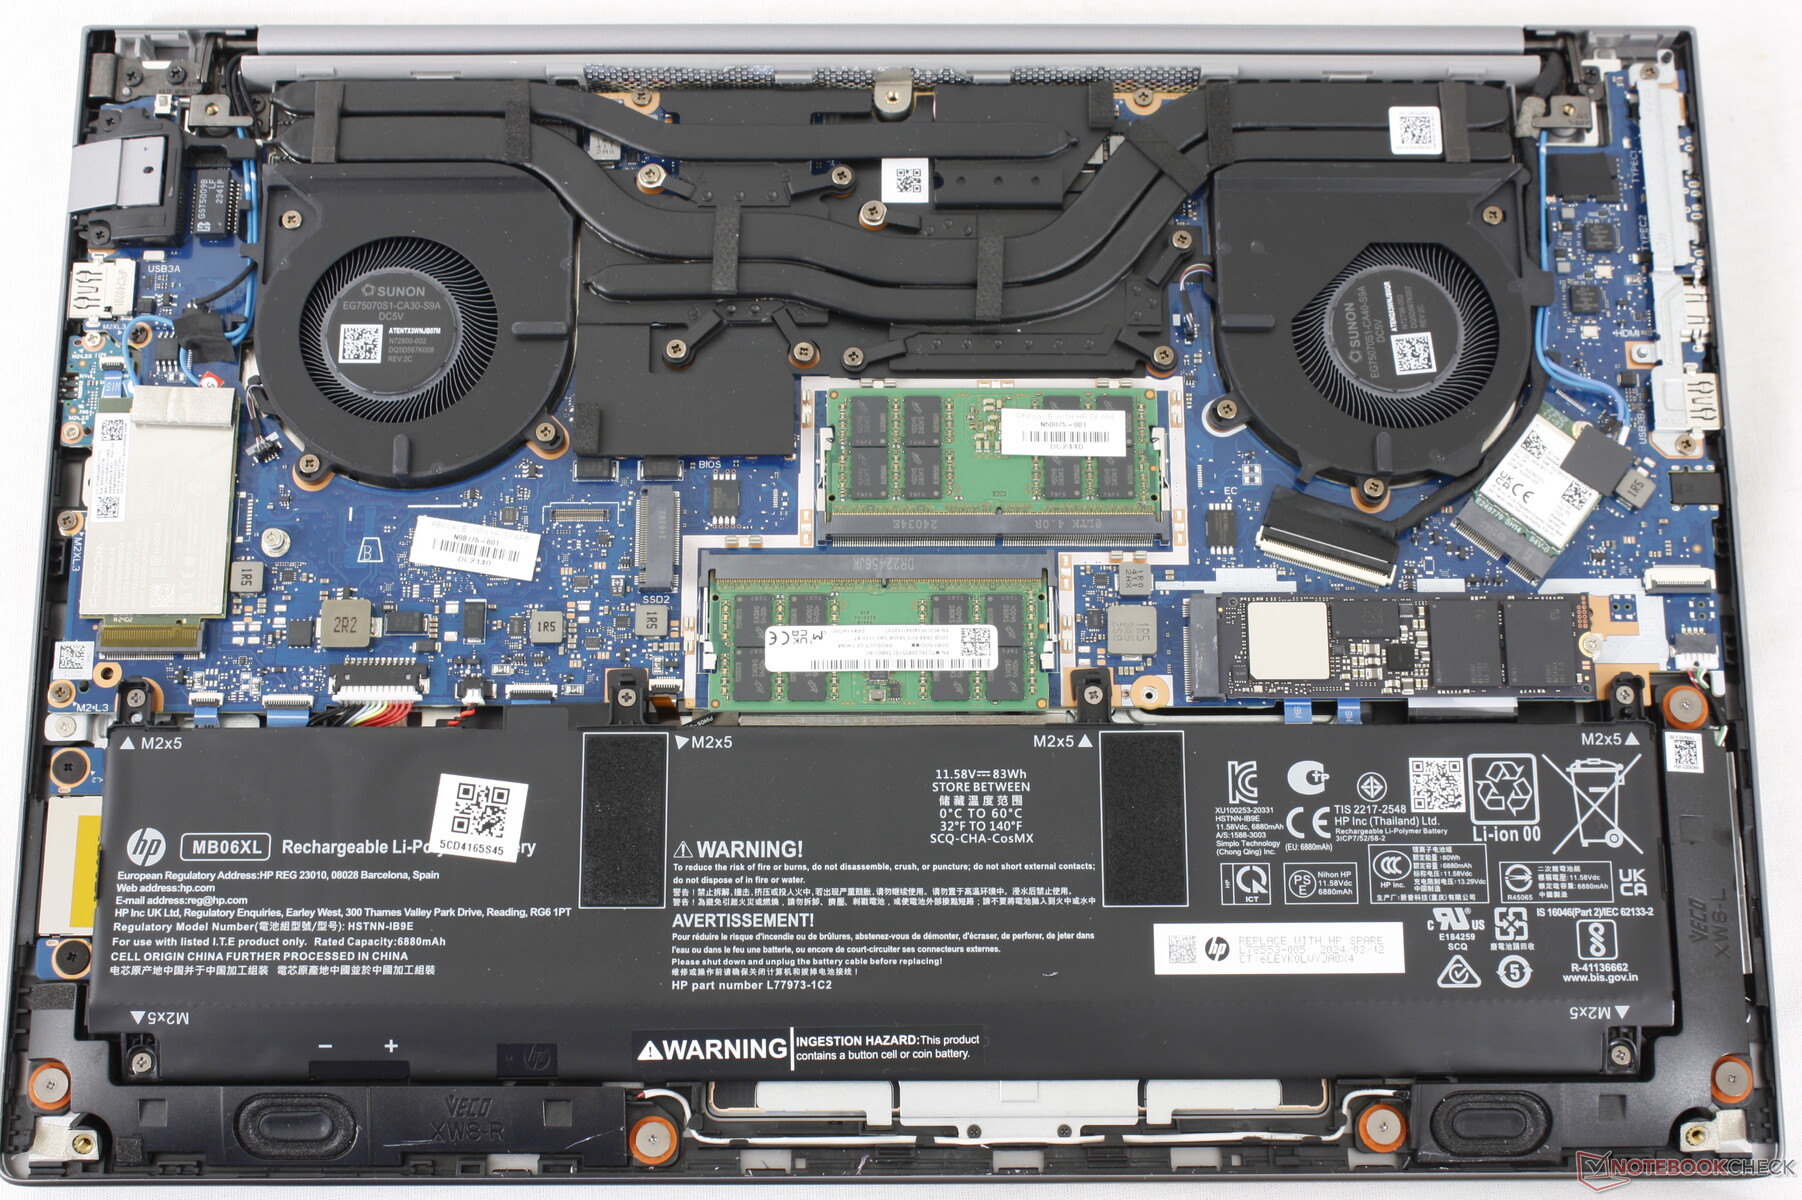
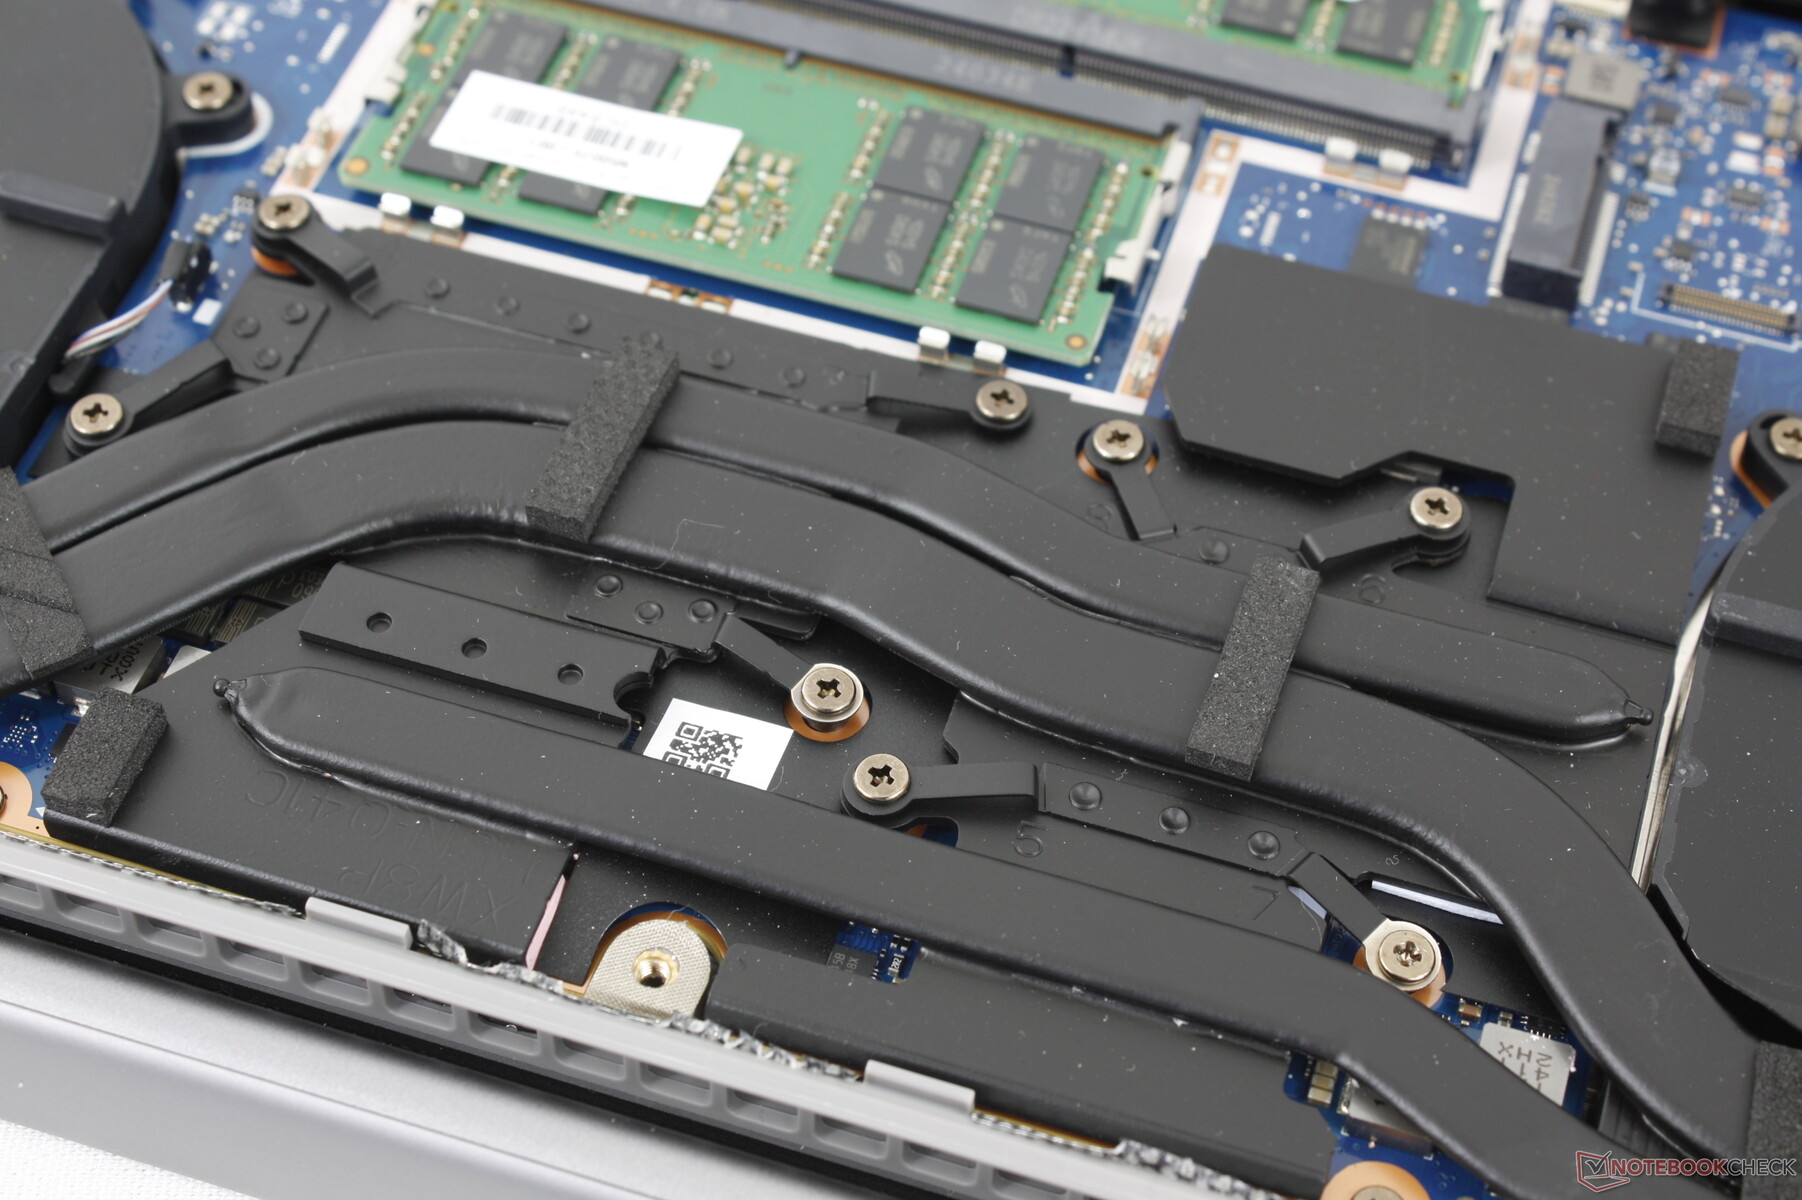
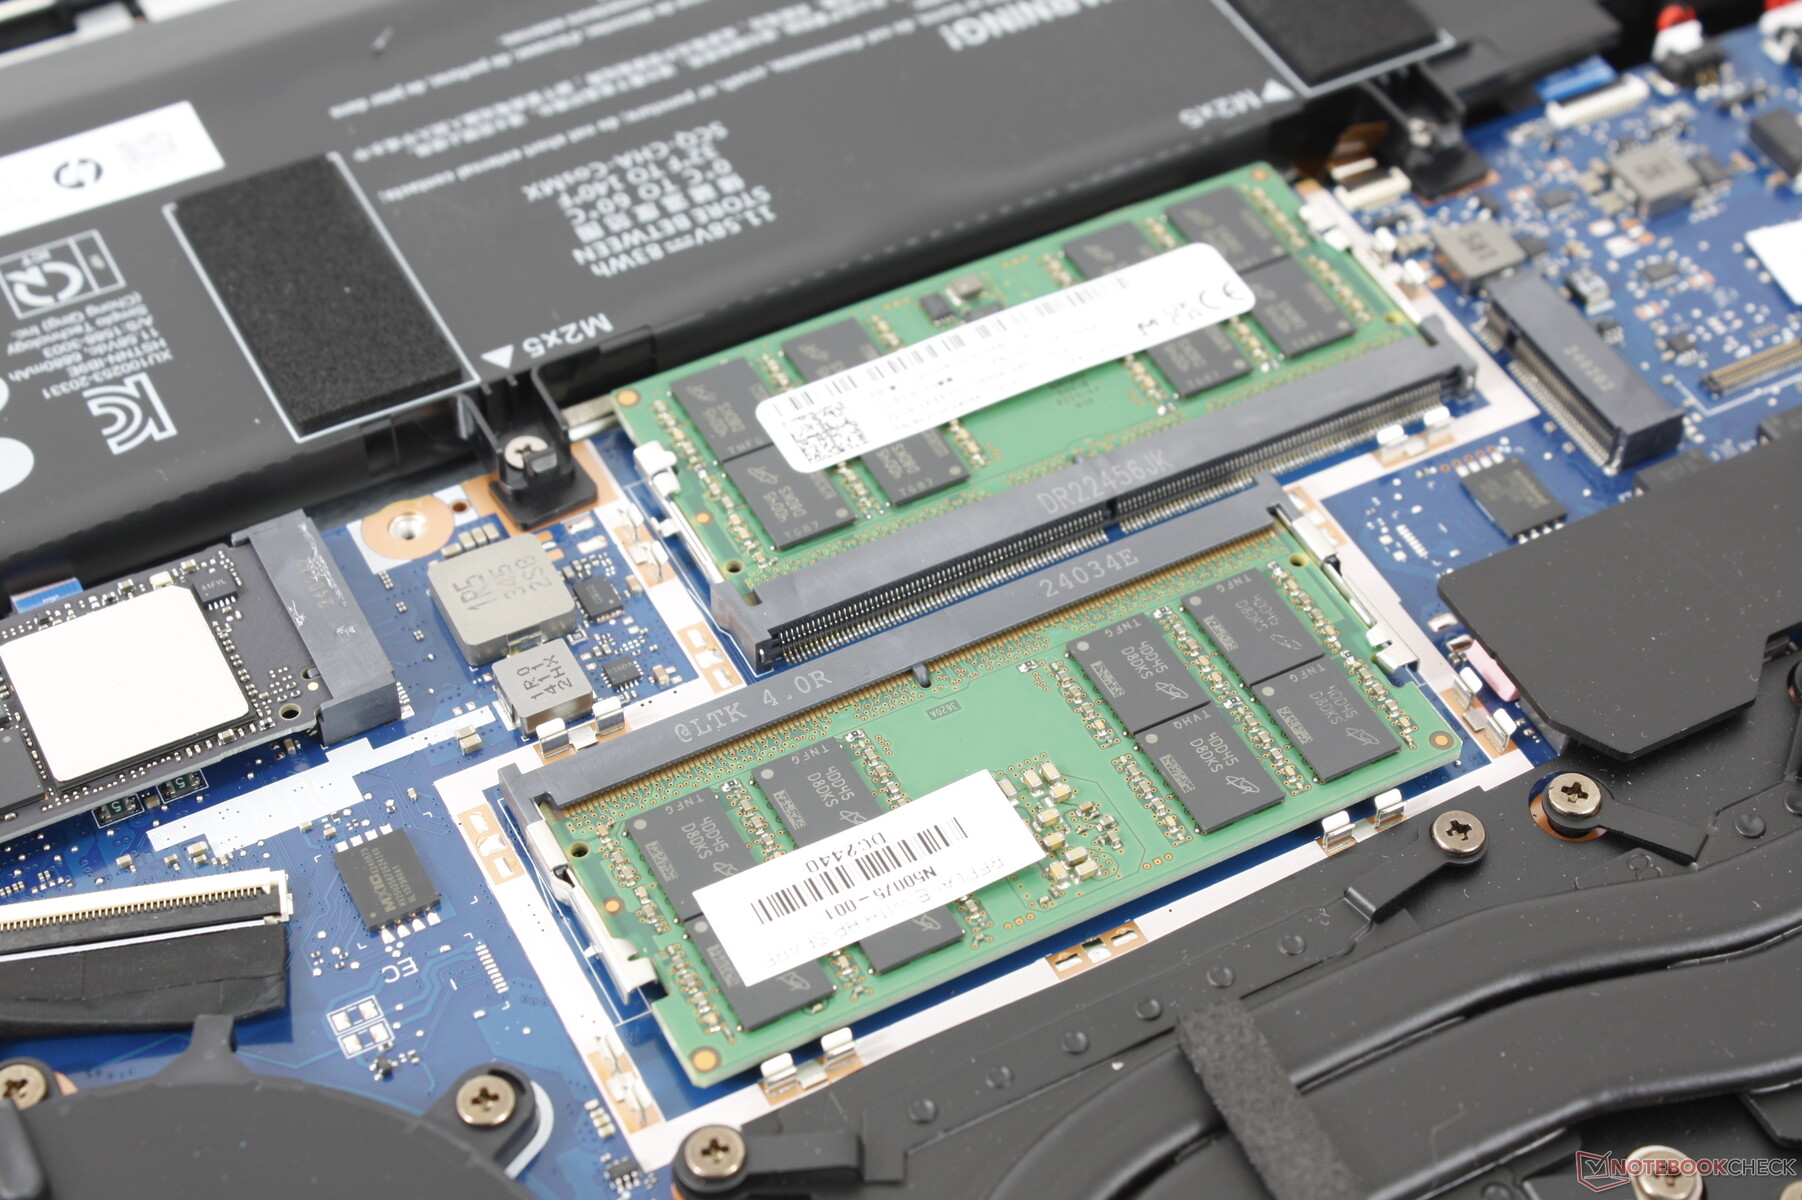
Wartung
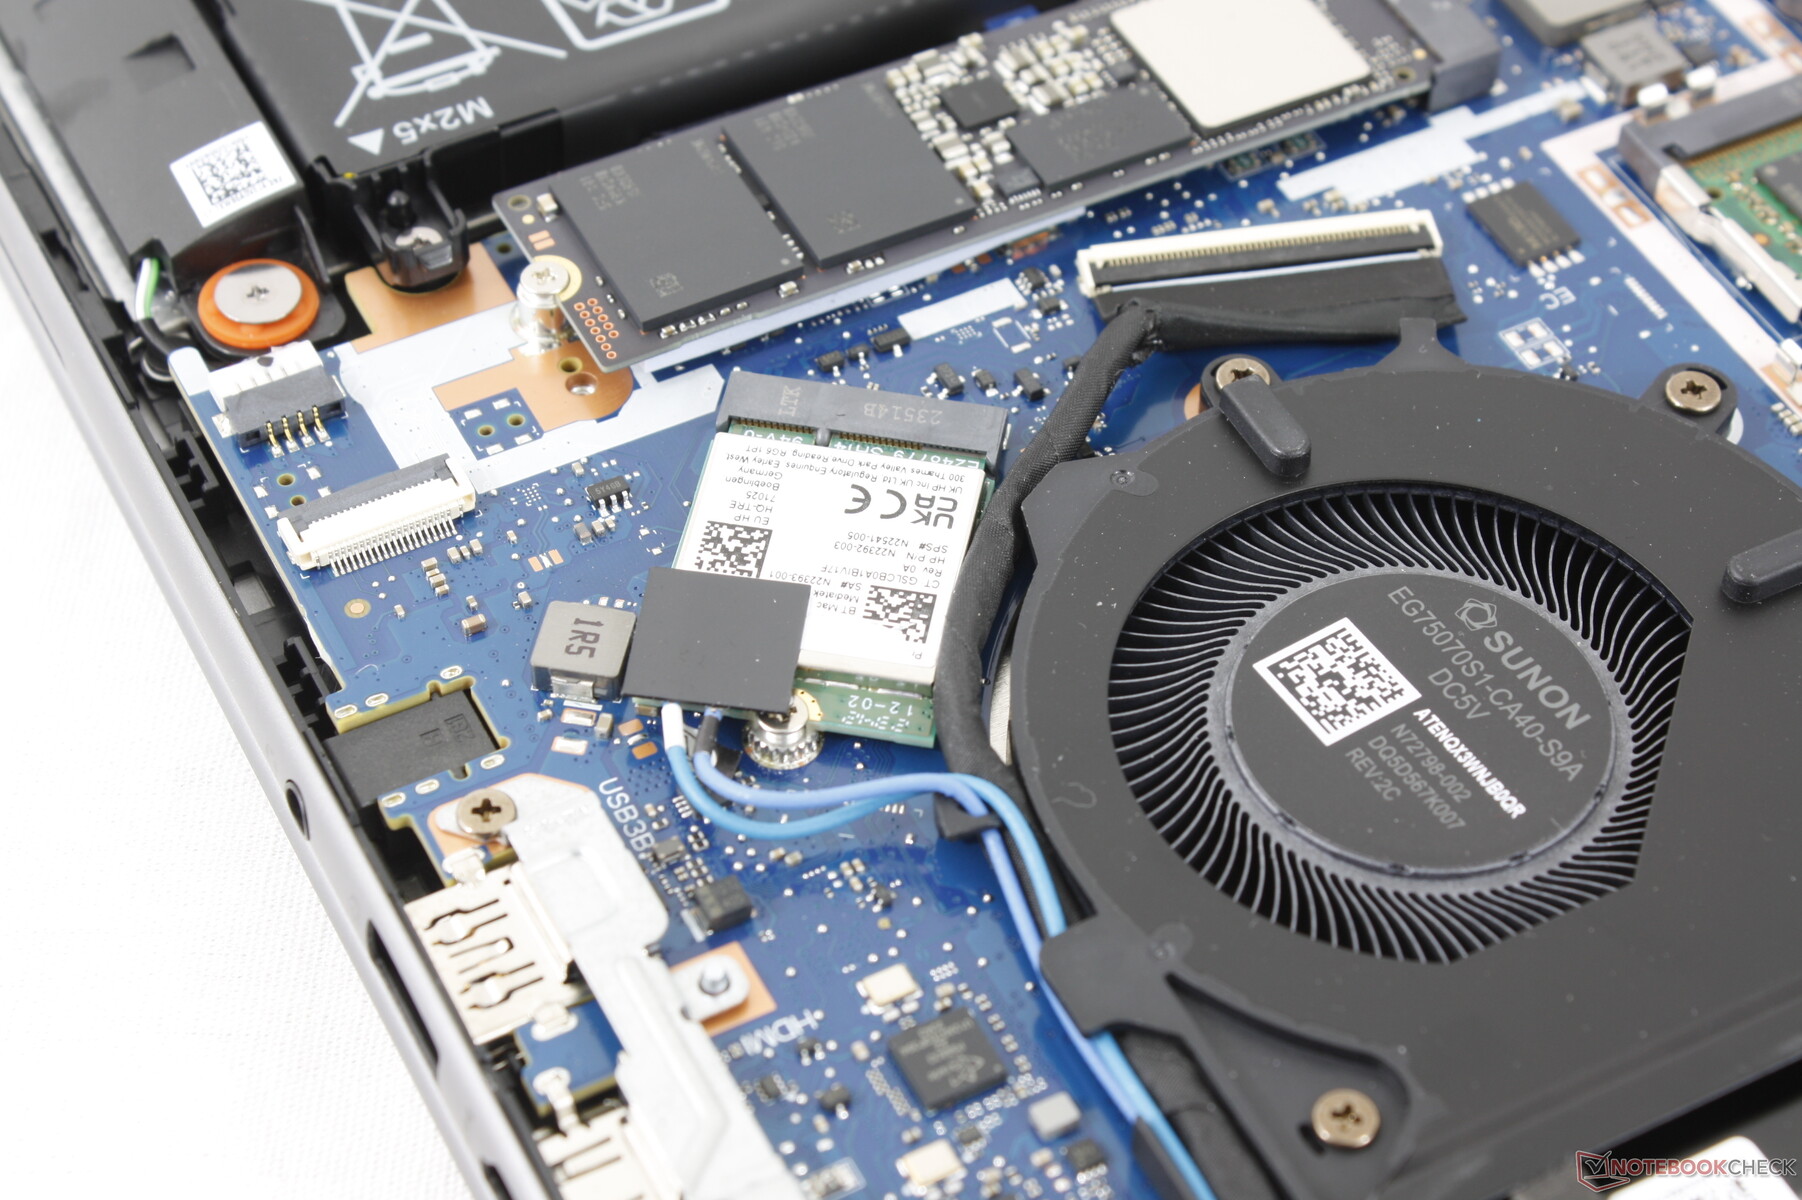
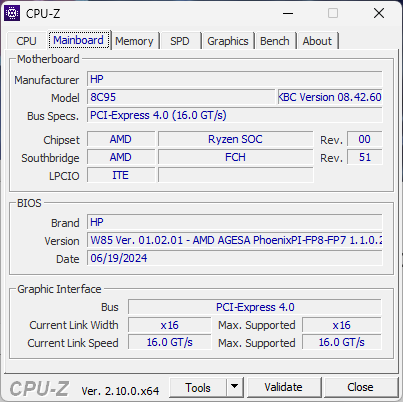
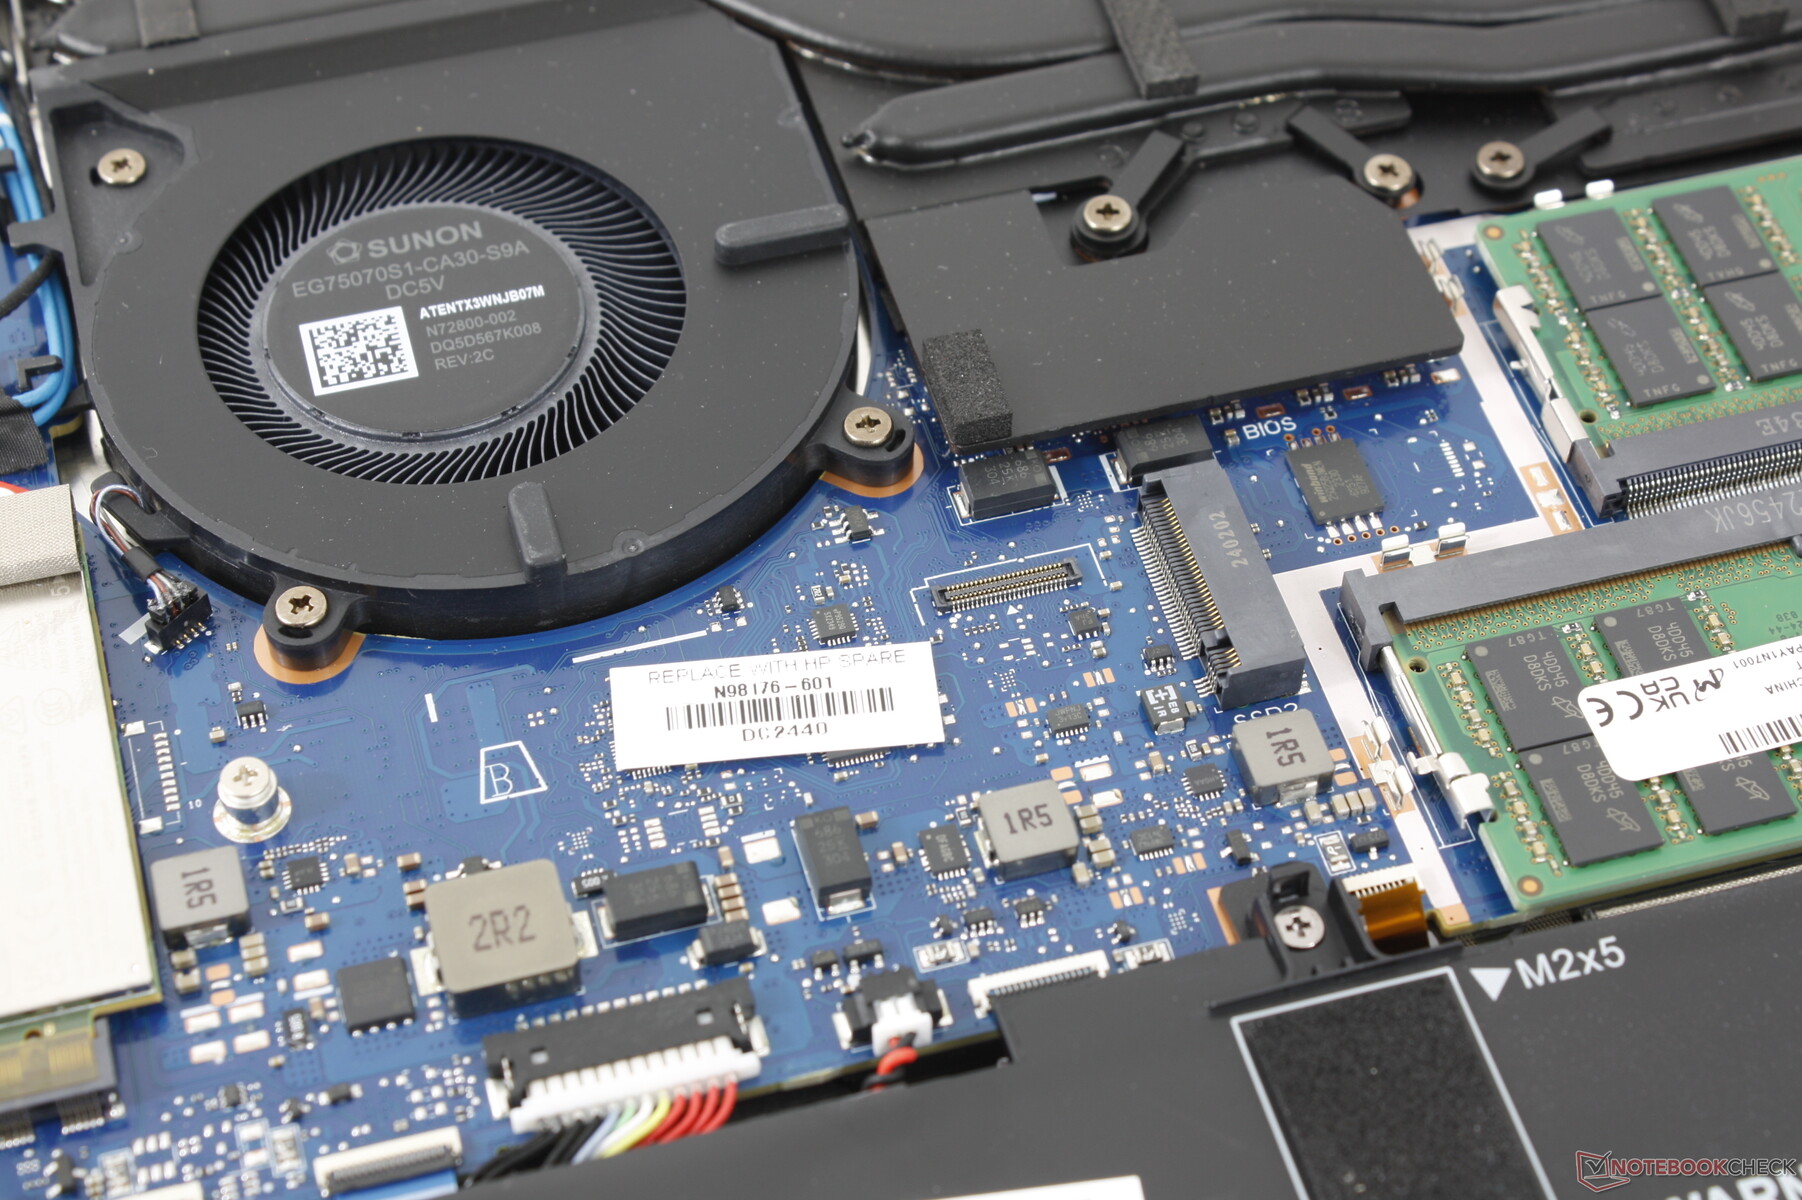
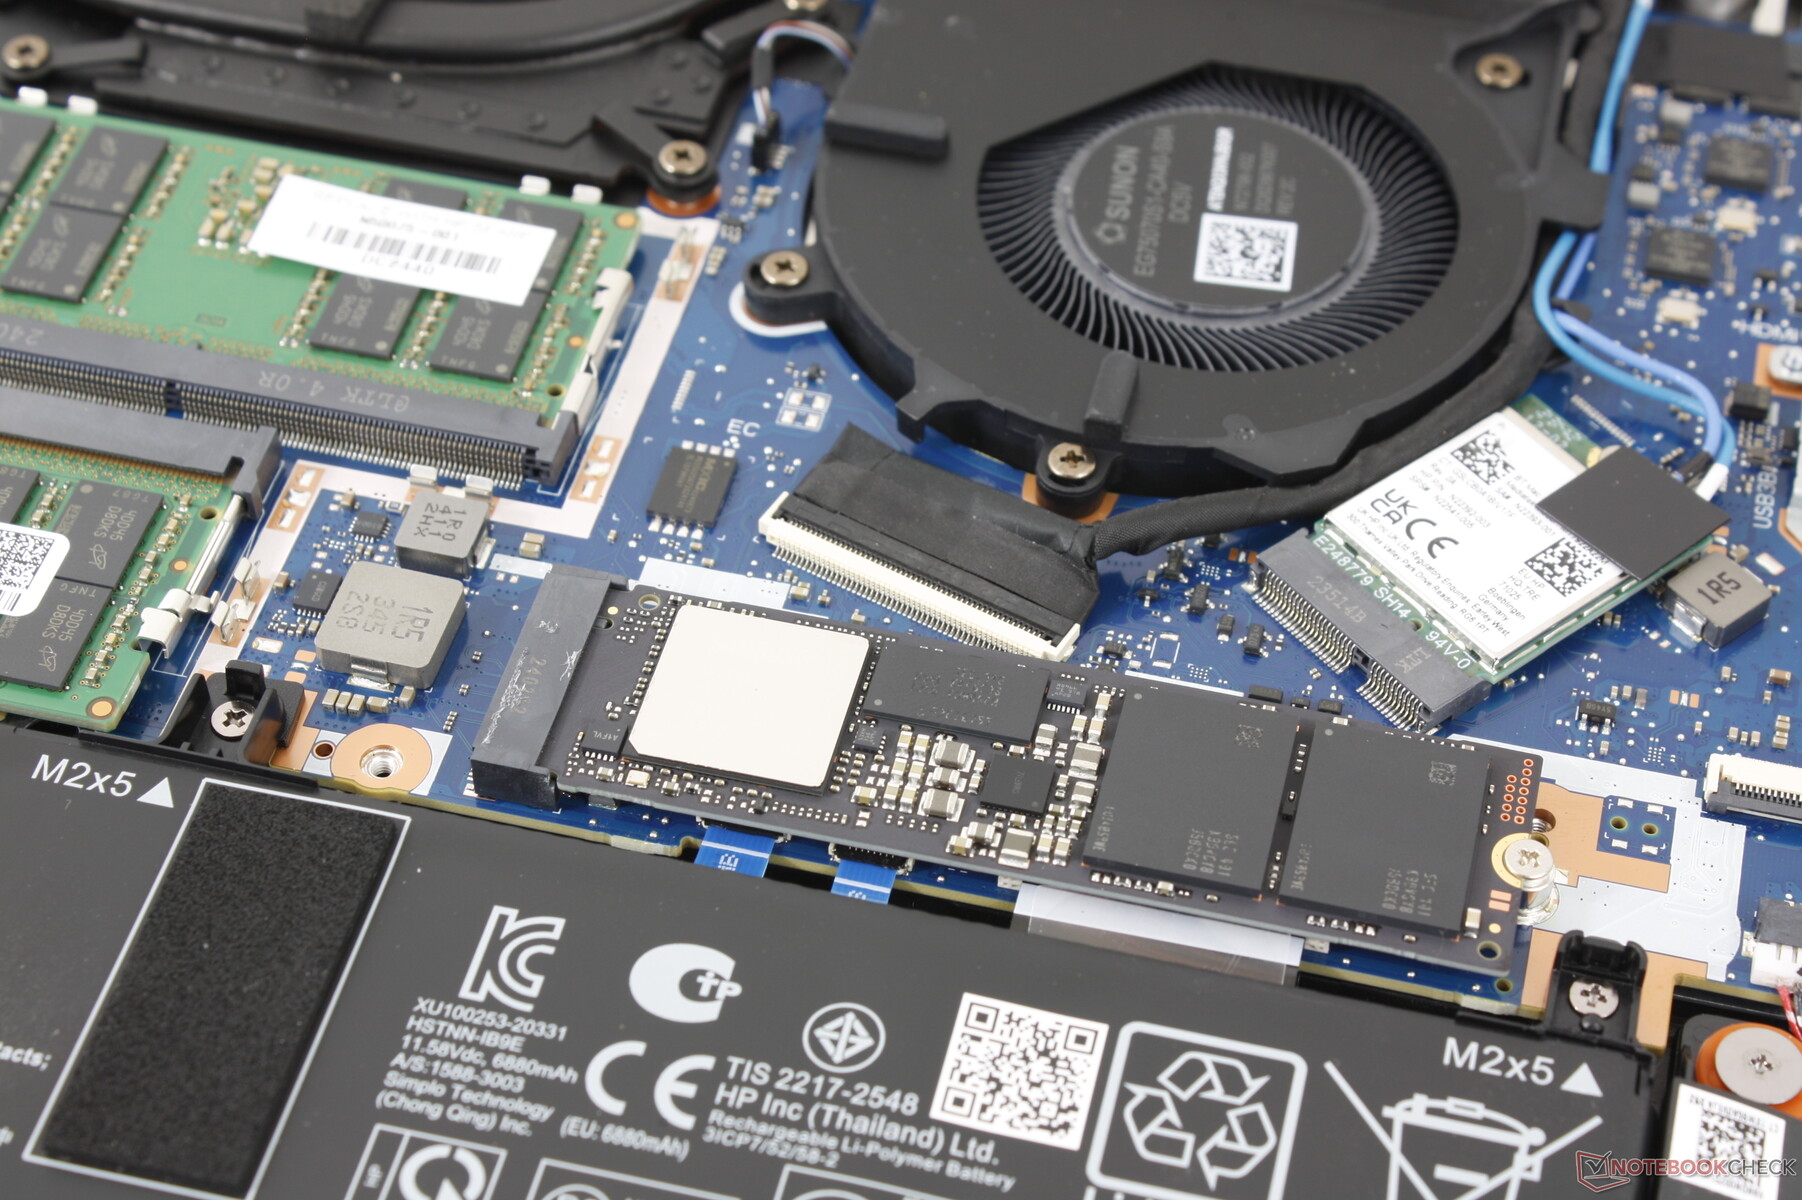
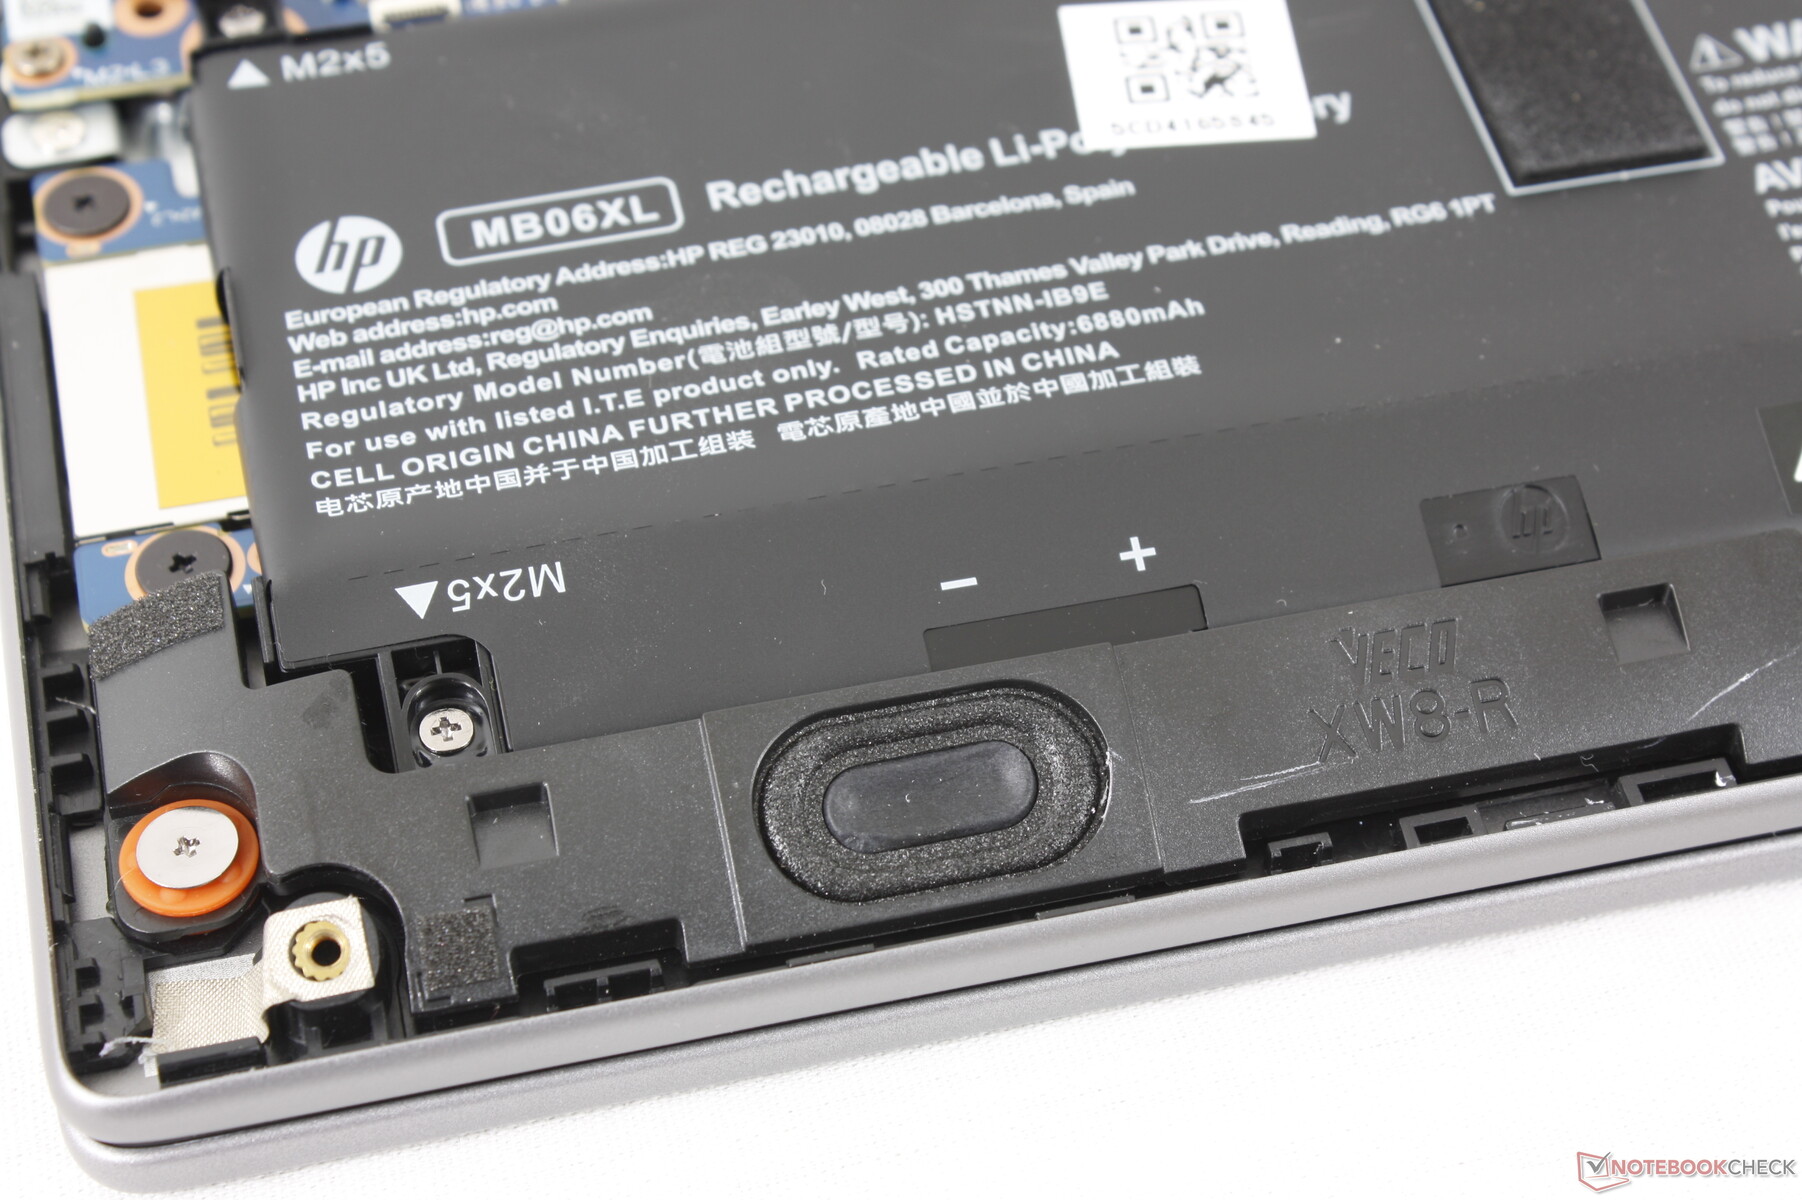
Die Bodenplatte lässt sich mit einem Kreuzschlitzschraubendreher und einem scharfen Werkzeug relativ einfach abnehmen. Im Vergleich zum ZBook Power 15 G10 wurde das Innenleben vollständig überarbeitet, wobei die gleichen aufrüstbaren Optionen wie die 2x SODIMM-Steckplätze, 2x PCIe4 x4 NVMe SSD-Steckplätze und das herausnehmbare WLAN-Modul beibehalten wurden. Neu hinzugekommen ist diesmal eine zusätzliche WAN-Option.
Nachhaltigkeit
Bei der Herstellung werden halogenarme Materialien verwendet, während die Verpackungen aus geformtem Papierzellstoff und recyceltem Kunststoff bestehen, die zu 100 Prozent aus nachhaltigen Quellen und zu 60 Prozent aus Post-Consumer-Quellen stammen.
Zubehör und Garantie
Neben dem Netzteil und den beiliegenden Dokumenten sind keine weiteren Extras in der Verpackung enthalten. Enttäuschend ist, dass die eingeschränkte Standardgarantie nur ein Jahr beträgt, während das ZBook Fury standardmäßig mit drei Jahren Garantie ausgestattet ist.
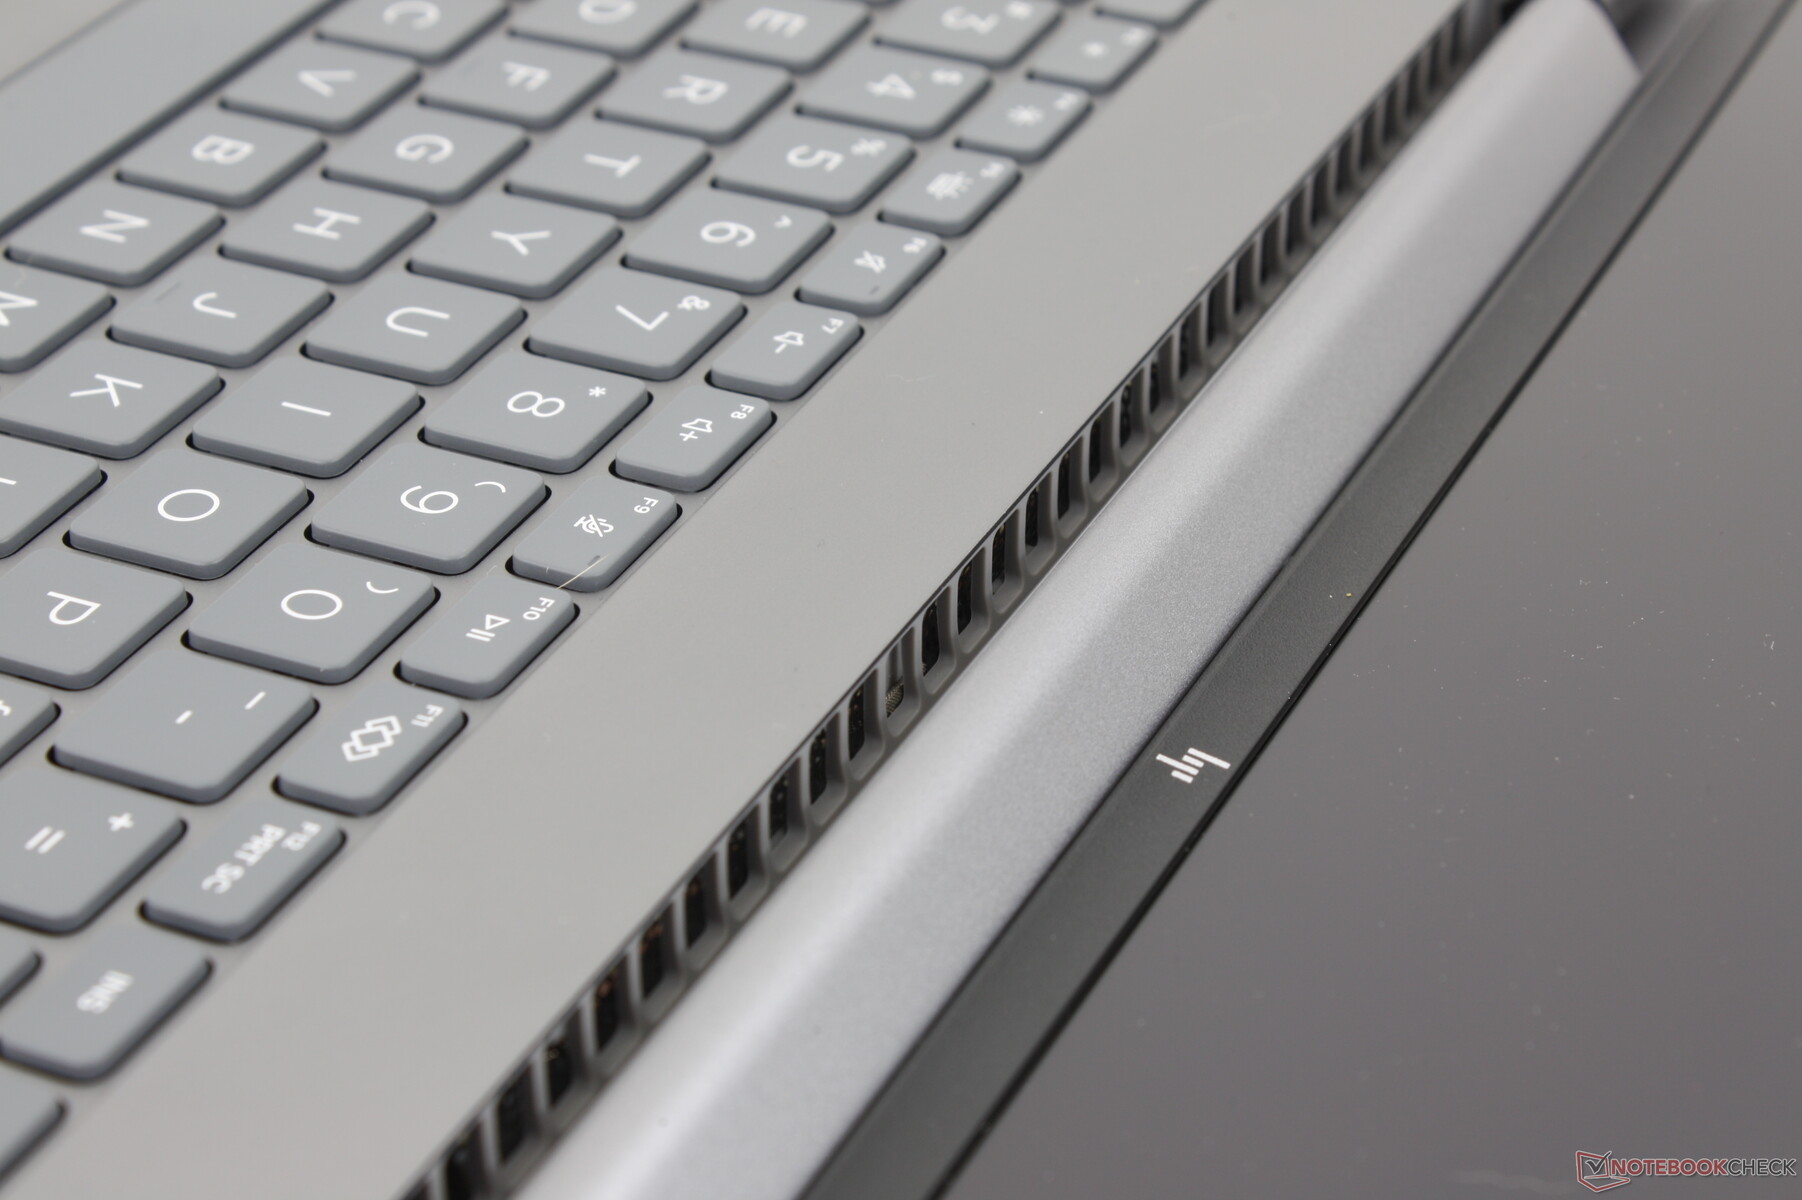
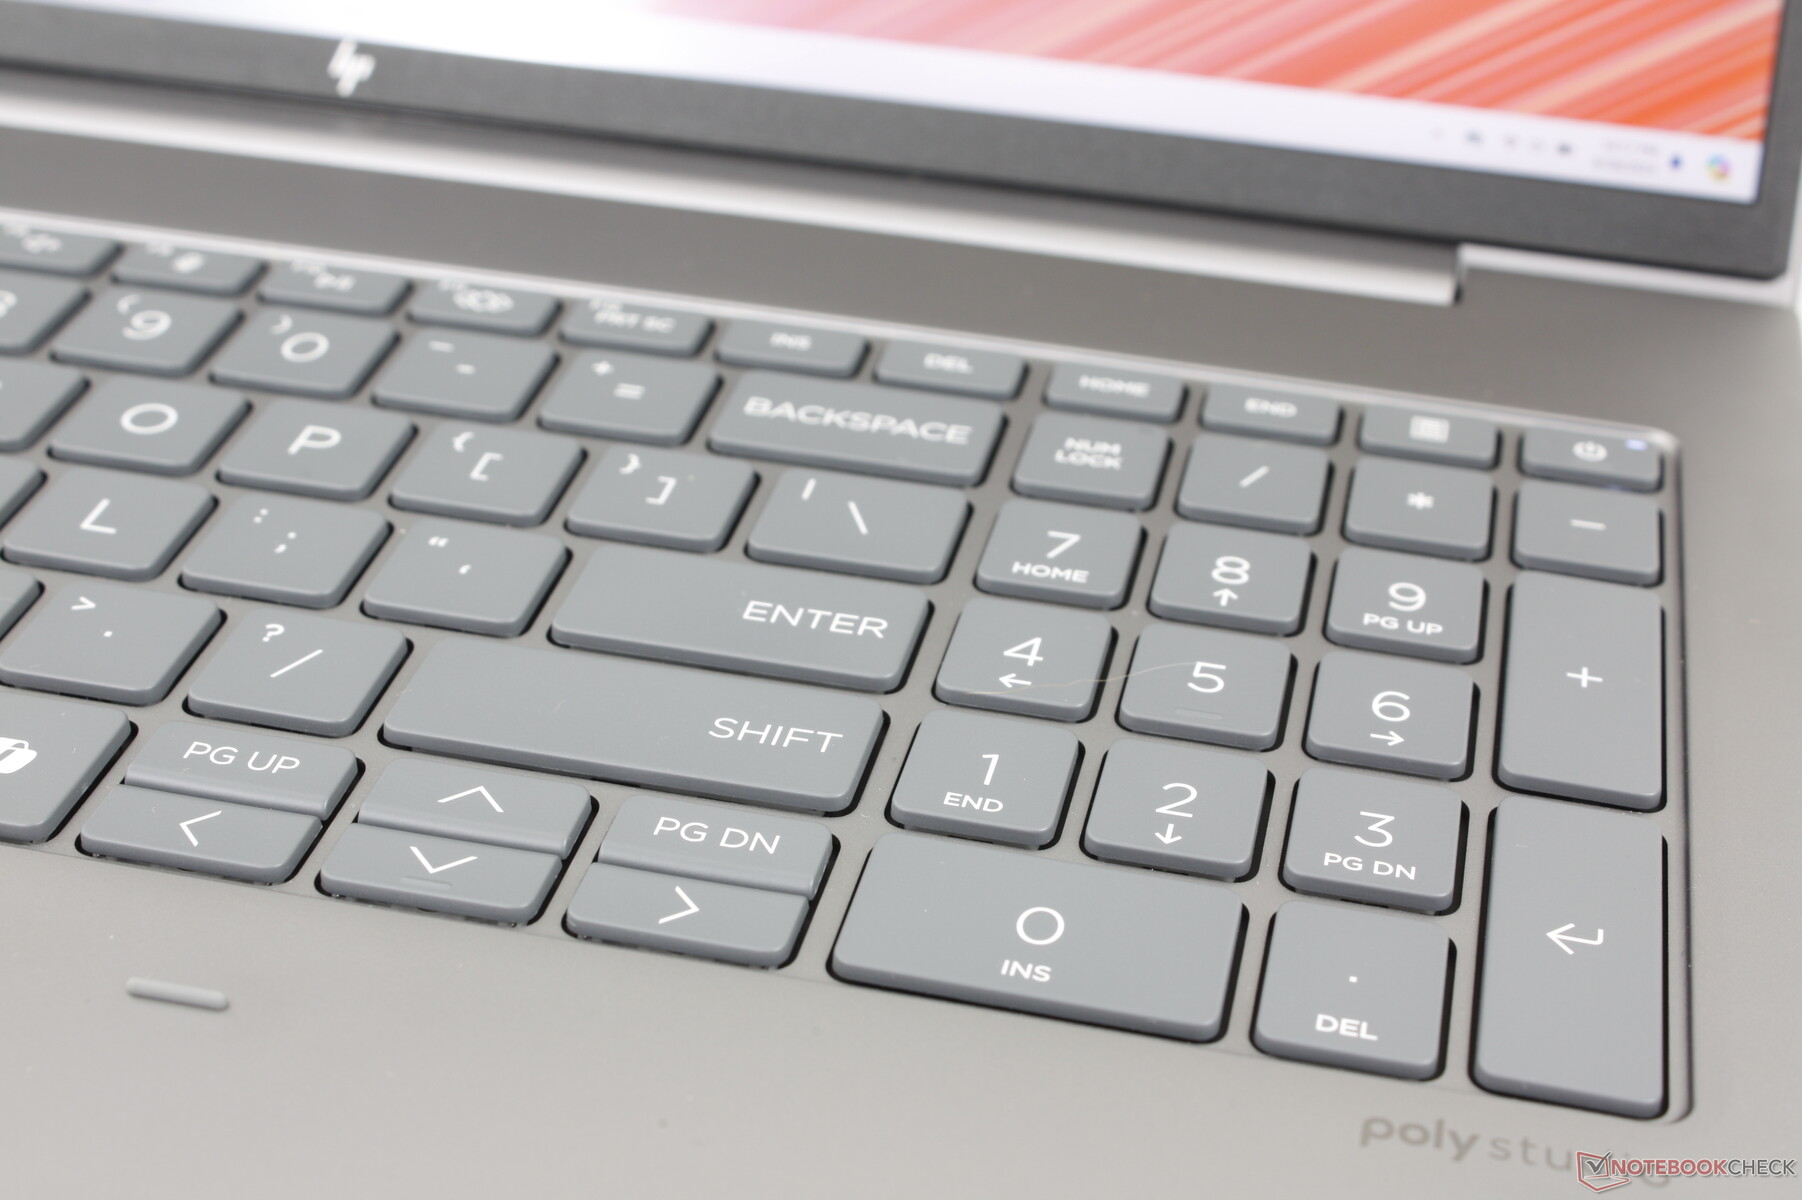
Eingabegeräten — Große Tasten
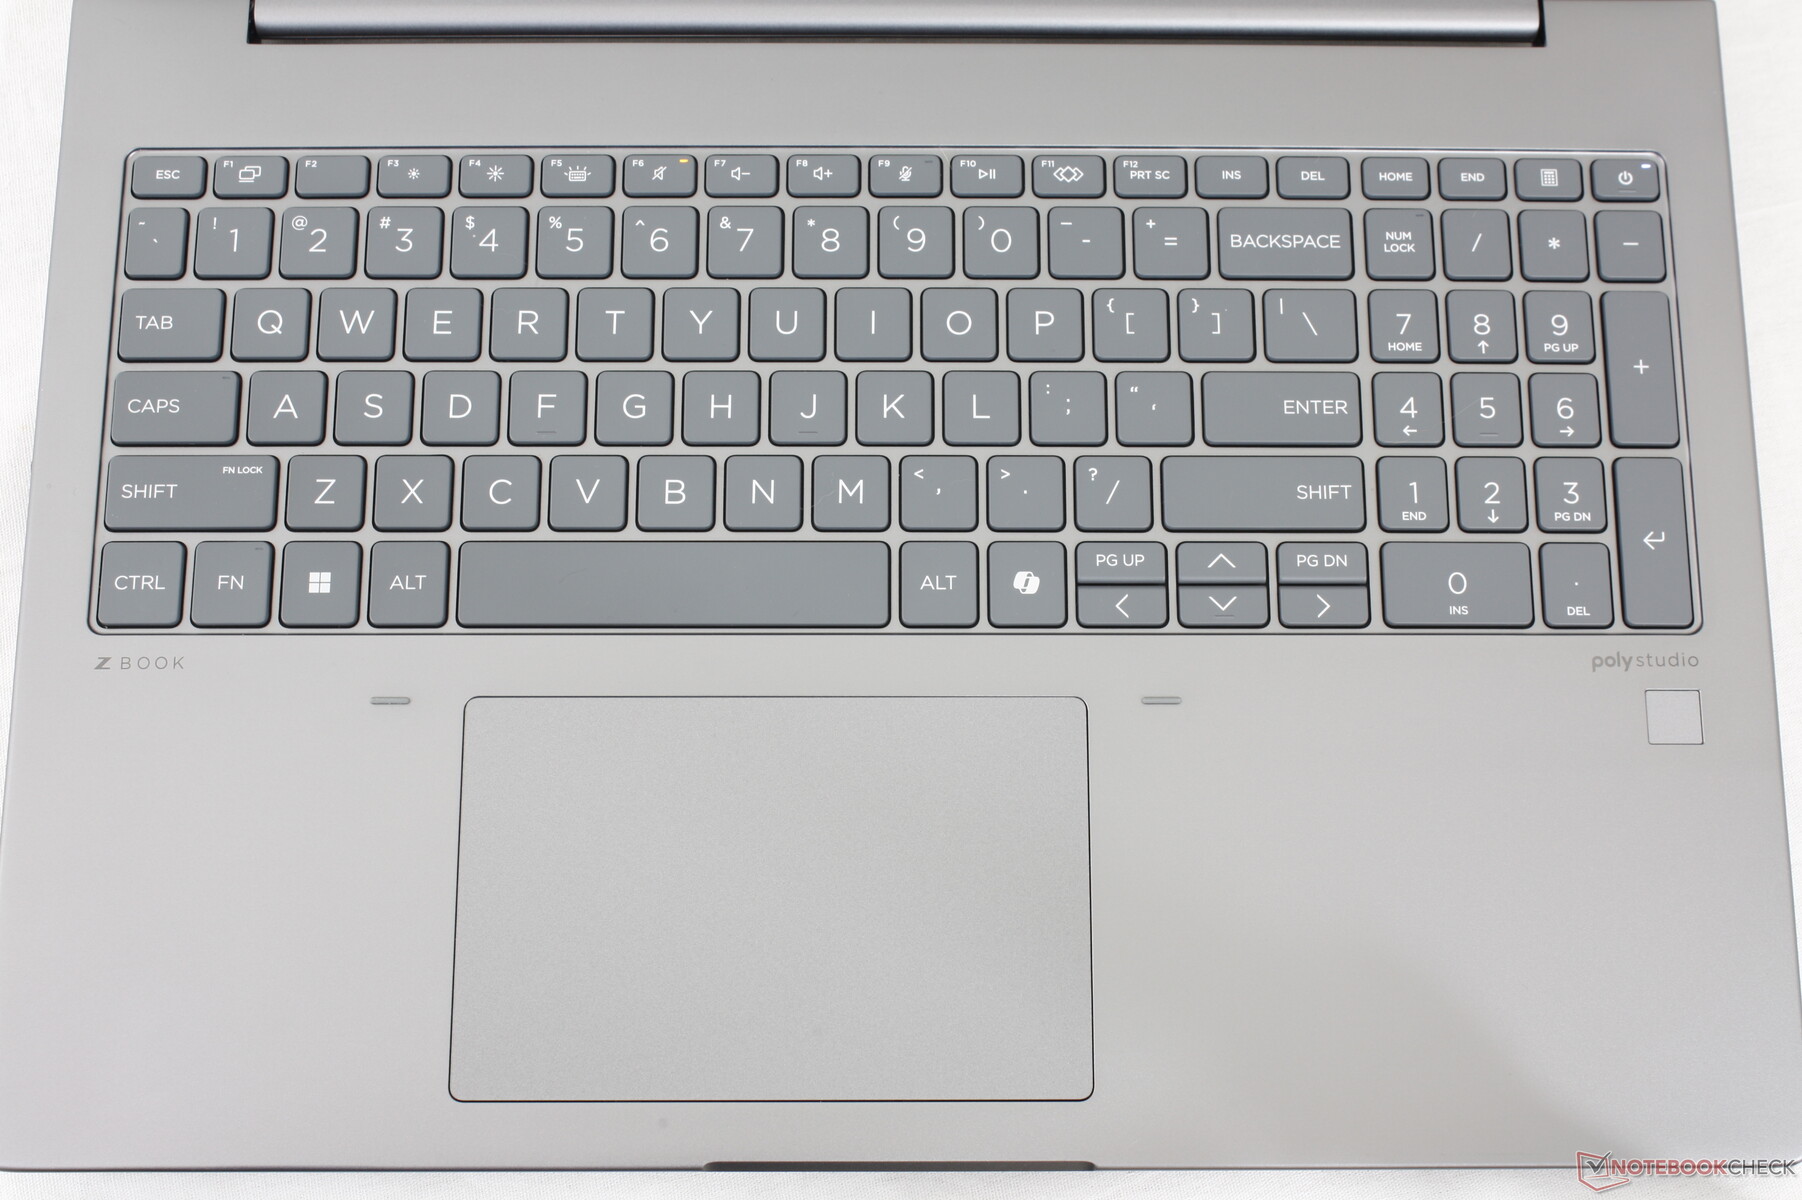
Tastatur
Das Tipperlebnis ähnelt dem des Spectre x360 16: Die Tasten sind fest und bieten ein relativ präzises Feedback, was ein komfortables Tippen ermöglicht. Besonders der Tastenhub fühlt sich tiefer an als bei den meisten Ultrabooks, um das übliche flache oder schwammige Feedback zu vermeiden.
Der Ziffernblock ist erneut vorhanden, während er beim konkurrierenden Precision 5690 fehlte. Die Tasten sind jedoch etwas schmaler als die QWERTZ-Haupttasten, was dazu führt, dass das Feedback beim Drücken spürbar weicher ist.
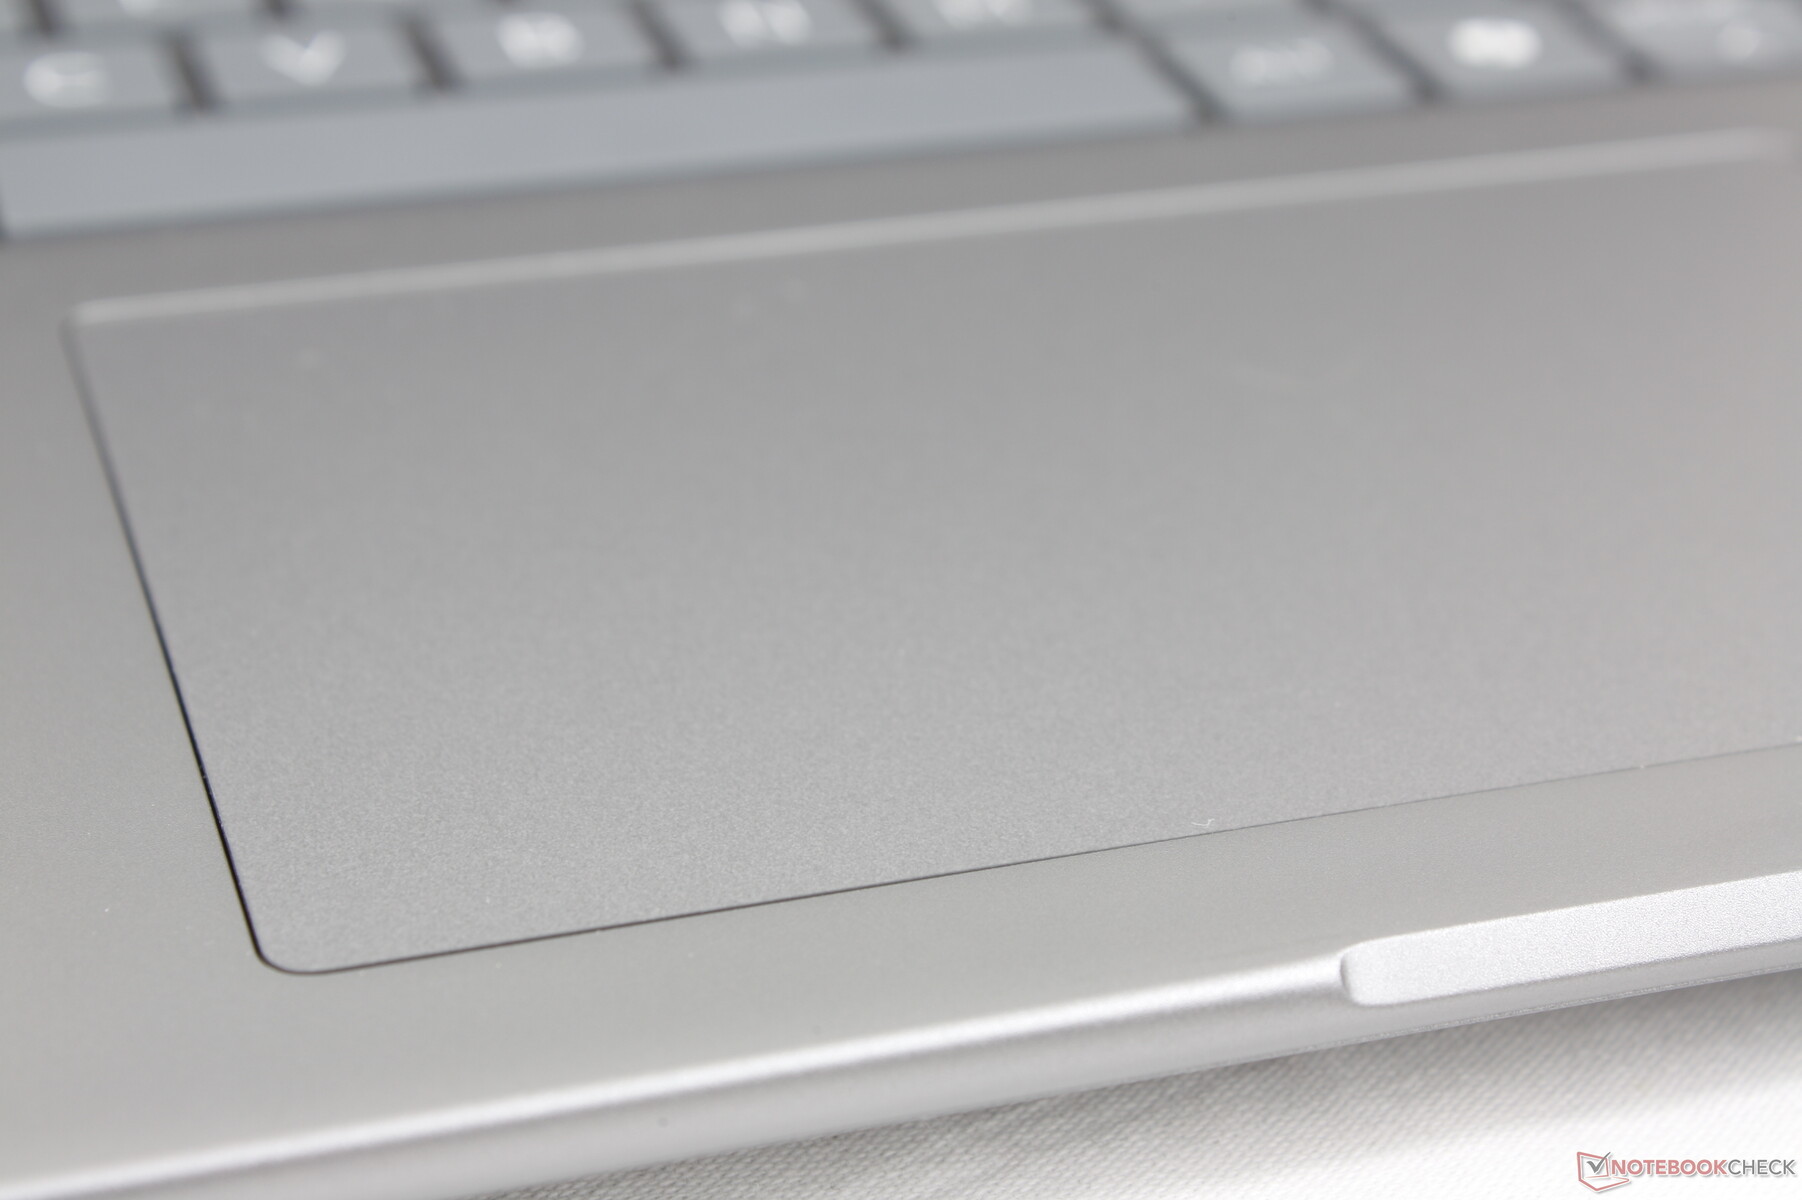
Touchpad
Das Clickpad ist größer als zuvor (12,5 x 8 cm im Vergleich zu 11,5 x 7 cm), um den Vorteil des größeren 16-Zoll-Formfaktors zu nutzen. Dedizierte Tasten fehlen nach wie vor und sind stattdessen bei der teureren ZBook Fury-Serie zu finden. Der Druckpunkt und die Rückmeldung sind jedoch weich und klickend, was sie zuverlässiger macht als die normalerweise schwammigeren Clickpads der meisten Verbraucher Notebooks.

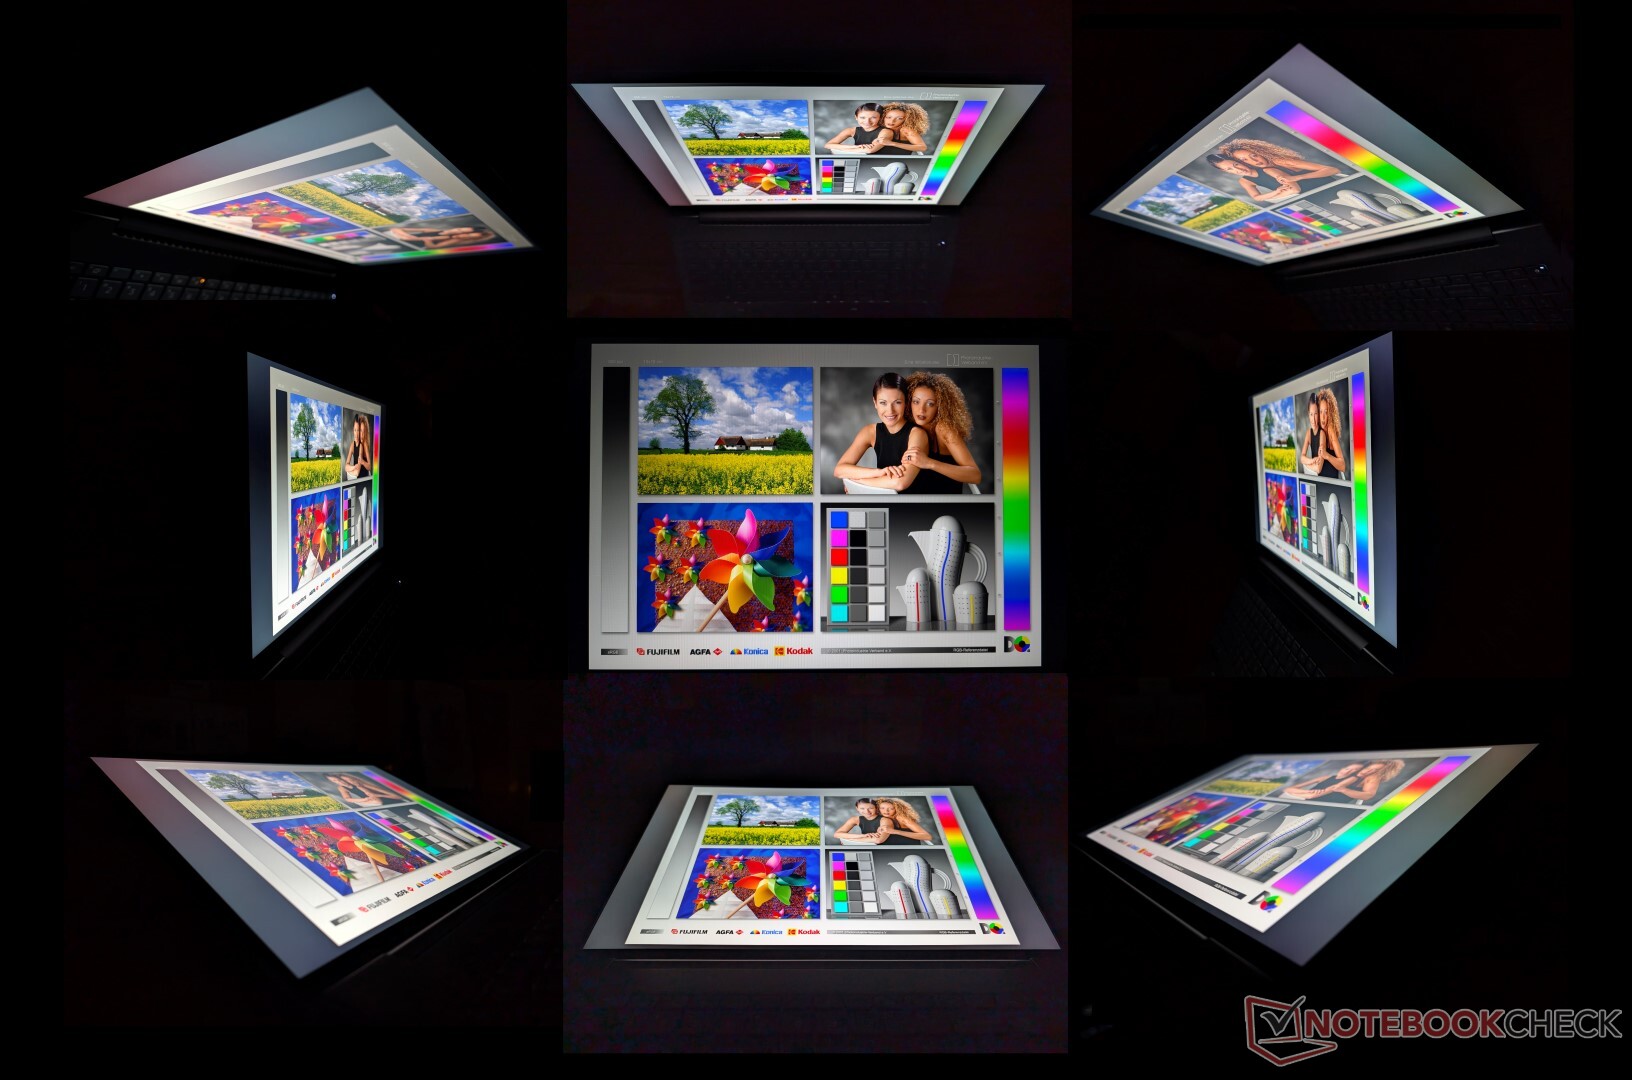
Display — Durchgängig IPS
Insgesamt stehen fünf Display-Optionen zur Verfügung, die alle IPS sind. Unsere Konfiguration wird mit der fettgedruckten Option ausgeliefert:
- 1920 x 1200, Non-Touch, matt, 250 nits, 45 Prozent NTSC, 60 Hz
- 1920 x 1200, Touch, matt, 250 nits, 45 Prozent NTSC, 60 Hz
- 1920 x 1200, Non-Touch, matt, 400 nits, 100 Prozent sRGB, 60 Hz
- 1920 x 1200, Non-Touch, matt, 1000 nits, 100 Prozent sRGB, HP Sure View, 60 Hz
- 2560 x 1600, Non-touch, matt, 400 nits, 100 Prozent sRGB, 120 Hz
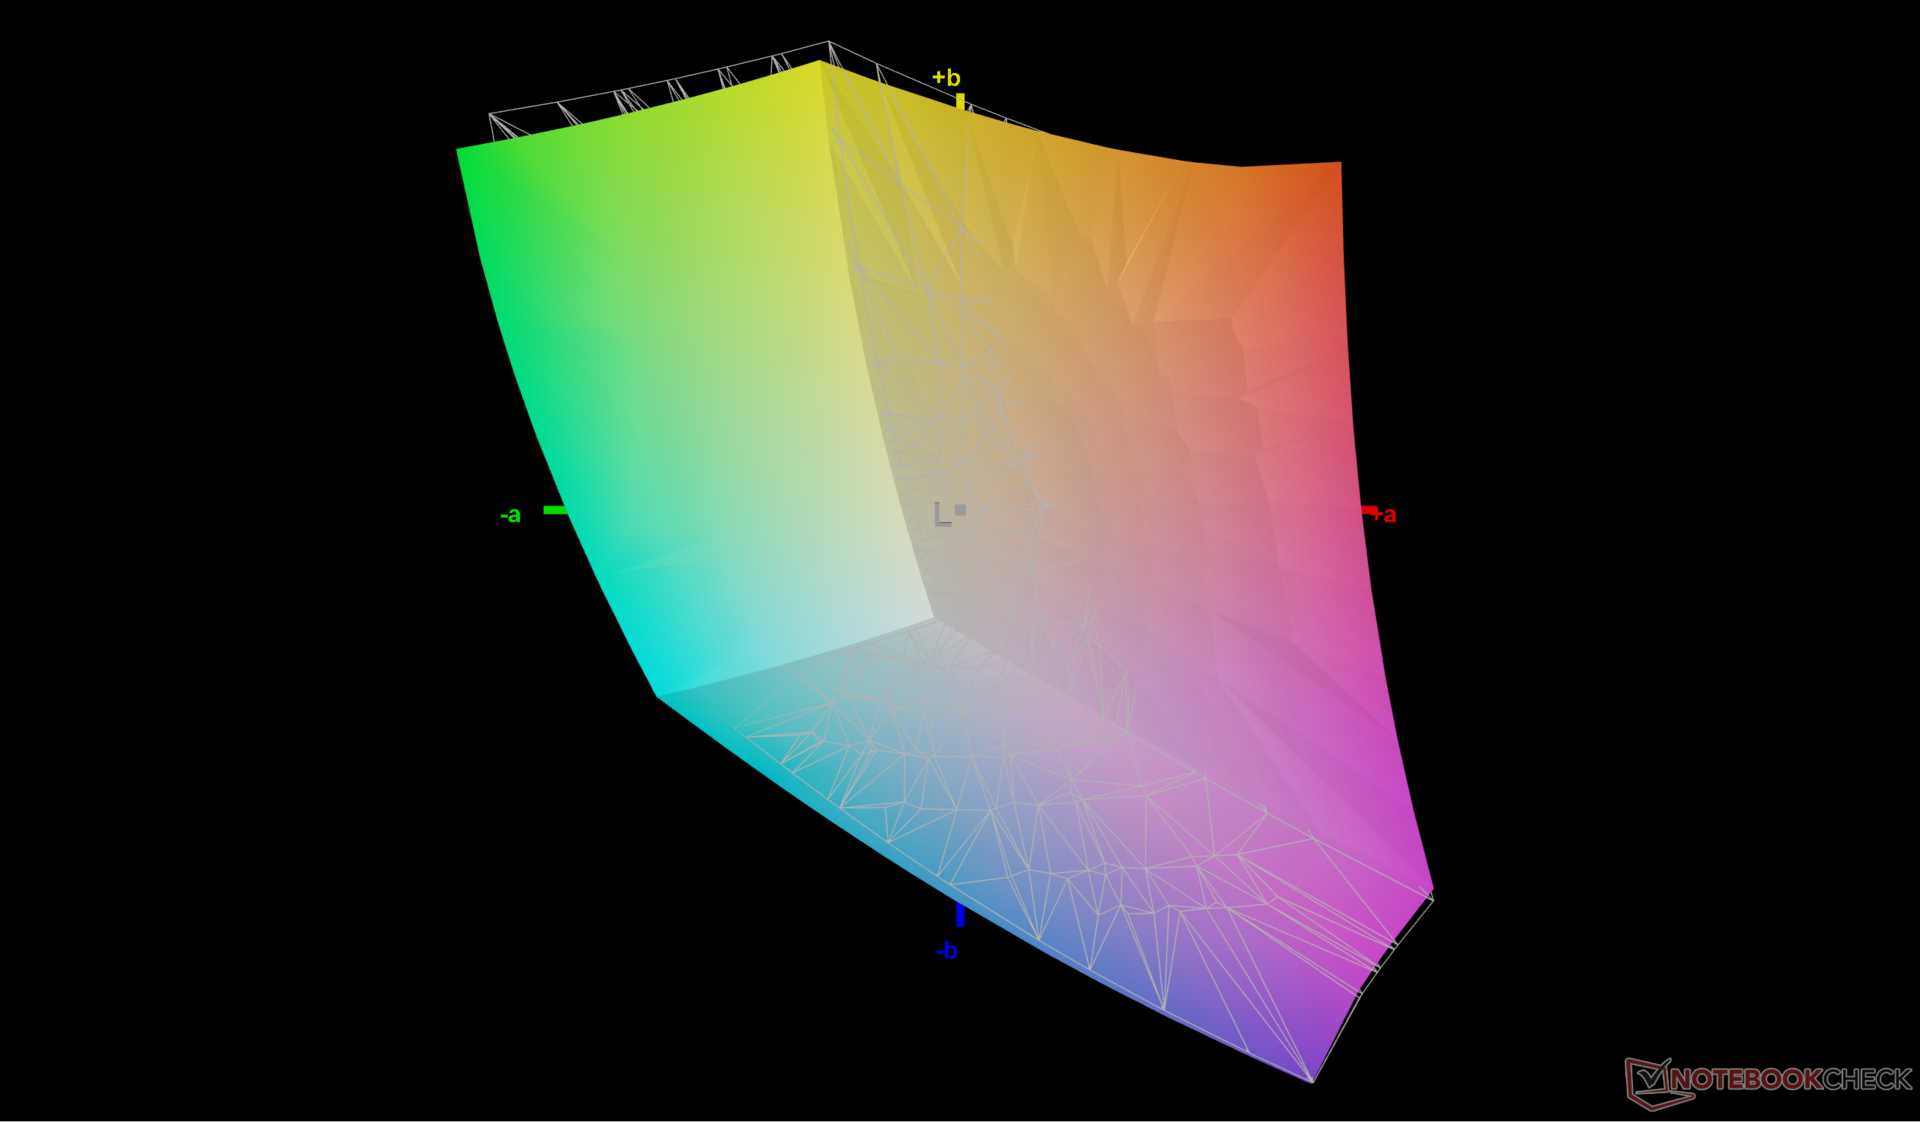
Wenn Ihnen die Bildqualität wichtig ist, sollten Sie die ersten beiden Optionen meiden, da die Farbabdeckung nur etwa 60 % von sRGB beträgt. Das superhelle 1000-Nit-Panel ist bemerkenswert, da viele andere Workstations diese Funktion nicht bieten; leider ist diese Option an Sure View gebunden, was die Blickwinkel für mehr Privatsphäre stark einschränkt. Es gibt keine nennenswerten OLED-, HDR- oder P3-Optionen, was für eine Performance-Workstation etwas enttäuschend ist. Für solche Funktionen müssten Nutzer auf das HP ZBook Fury 16 G11 aufrüsten oder das ThinkPad P16s G2 in Betracht ziehen.


| |||||||||||||||||||||||||
Ausleuchtung: 88 %
Helligkeit Akku: 470.7 cd/m²
Kontrast: 826:1 (Schwarzwert: 0.57 cd/m²)
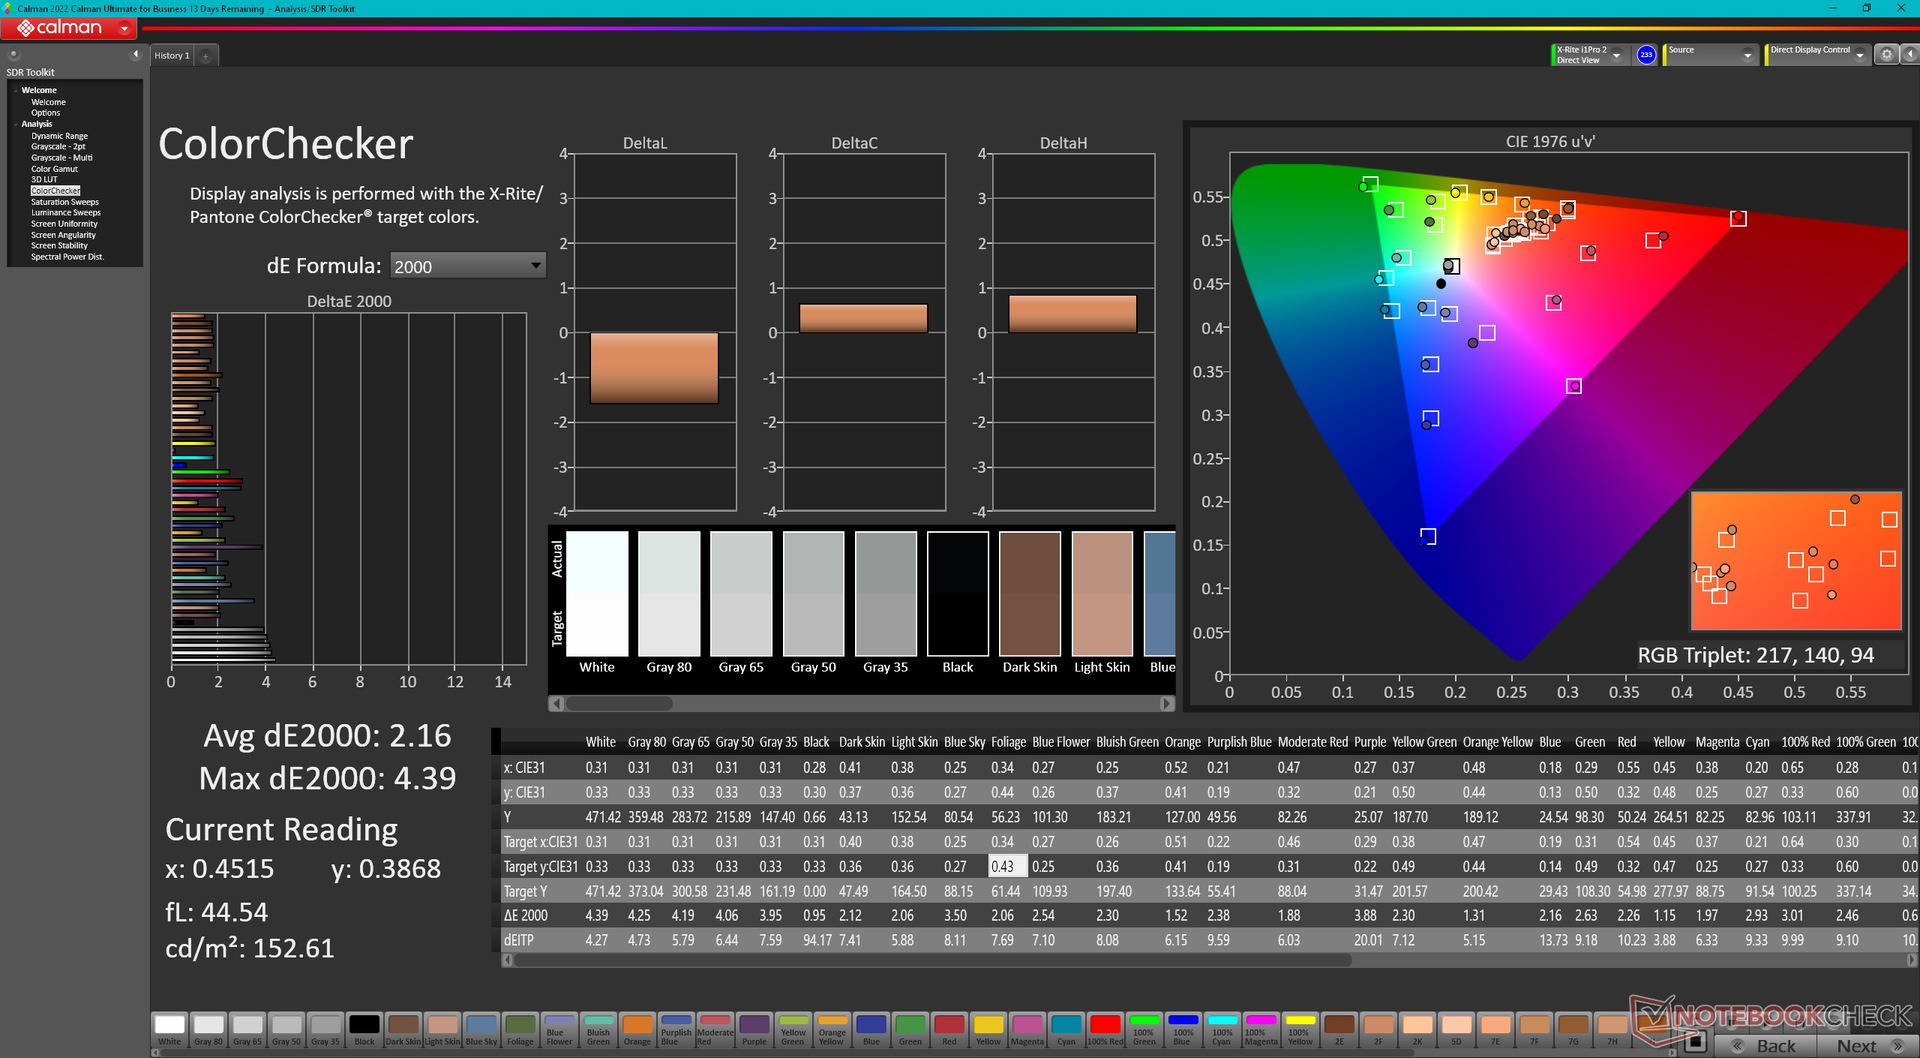
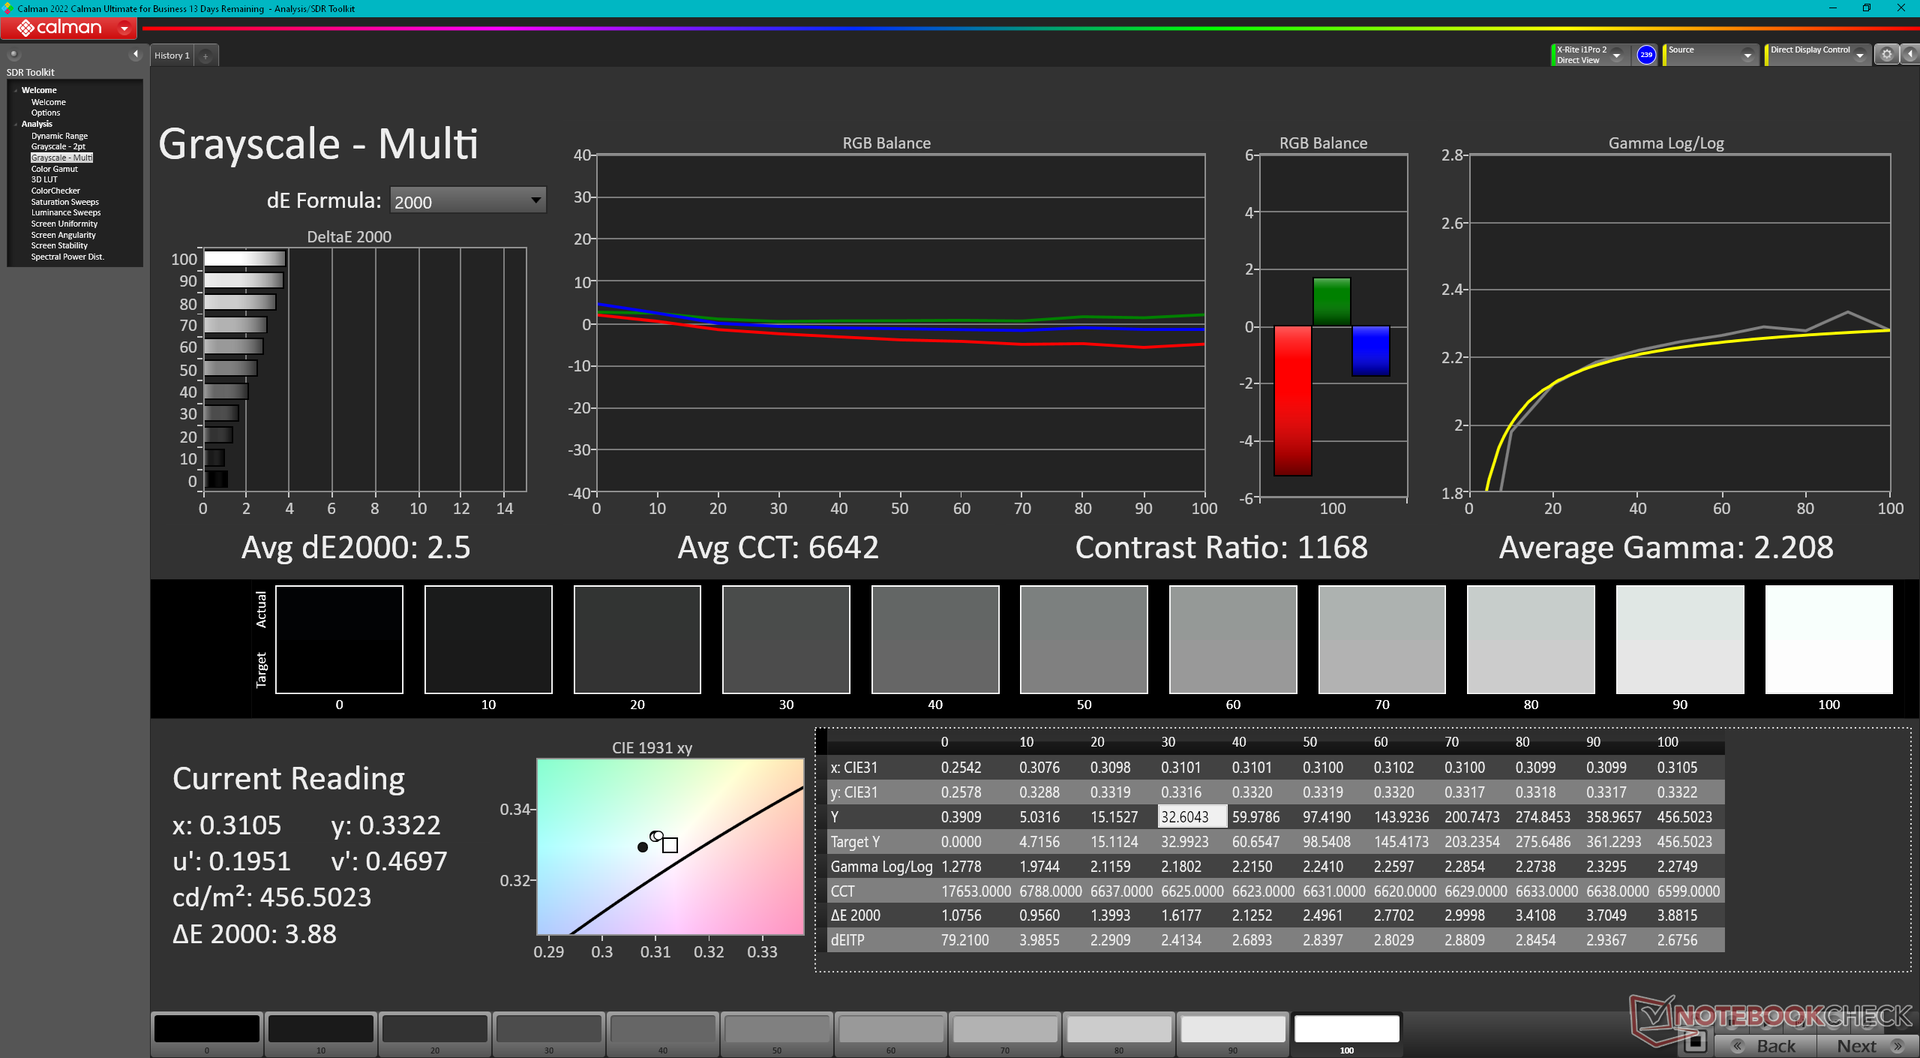
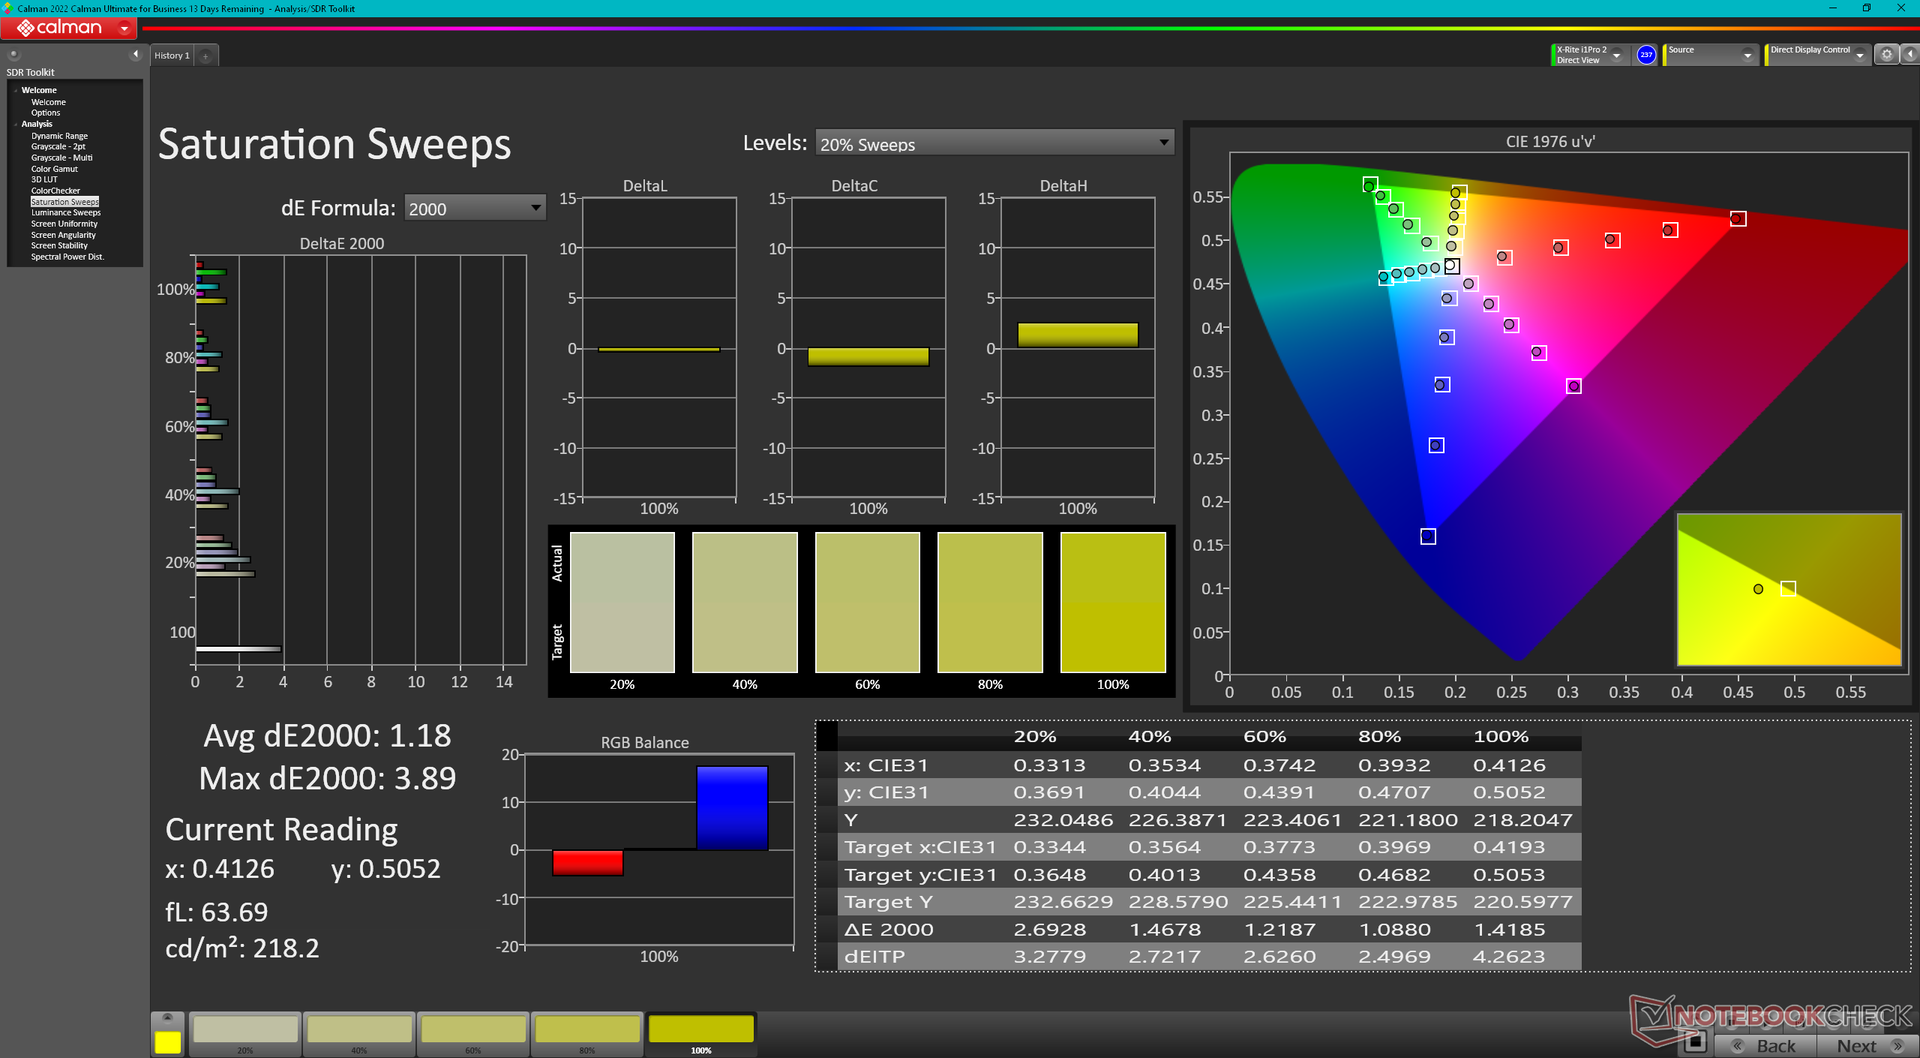
ΔE ColorChecker Calman: 2.16 | ∀{0.5-29.43 Ø4.78}
calibrated: 1.37
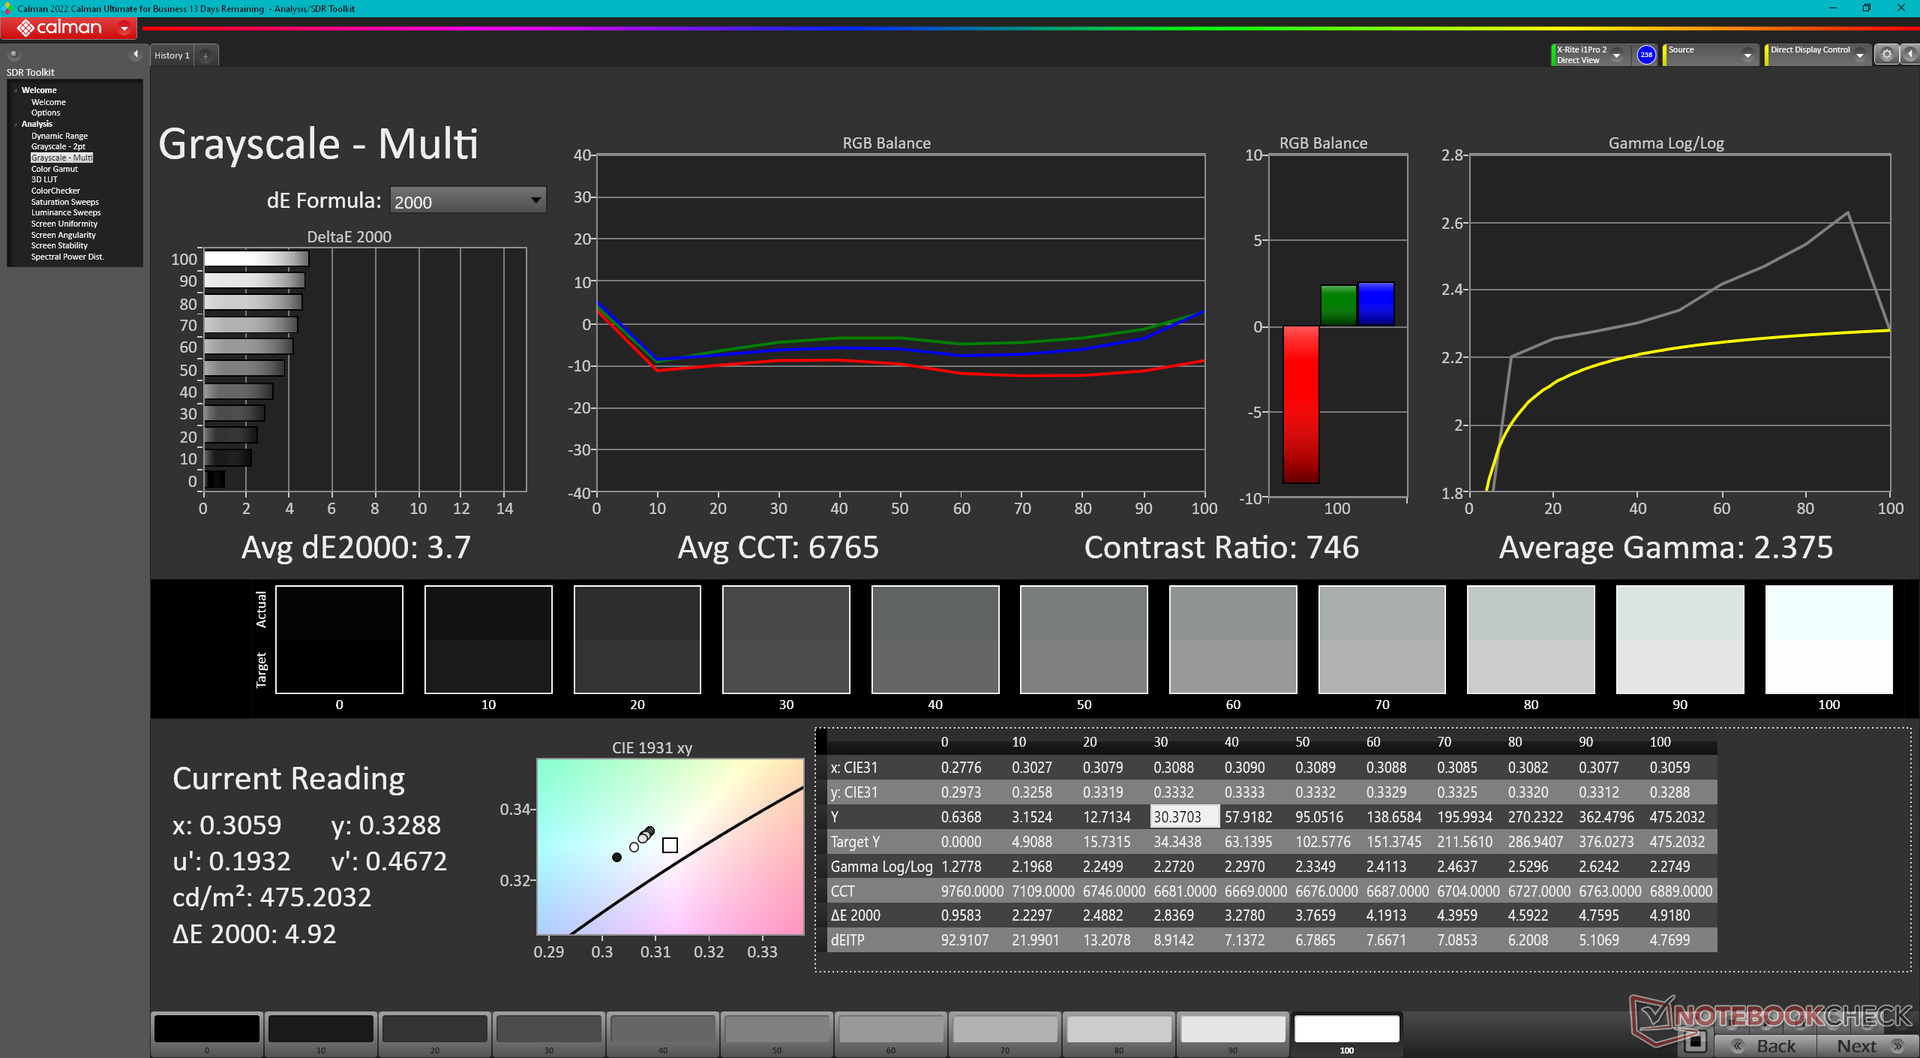
ΔE Greyscale Calman: 3.7 | ∀{0.09-98 Ø5}
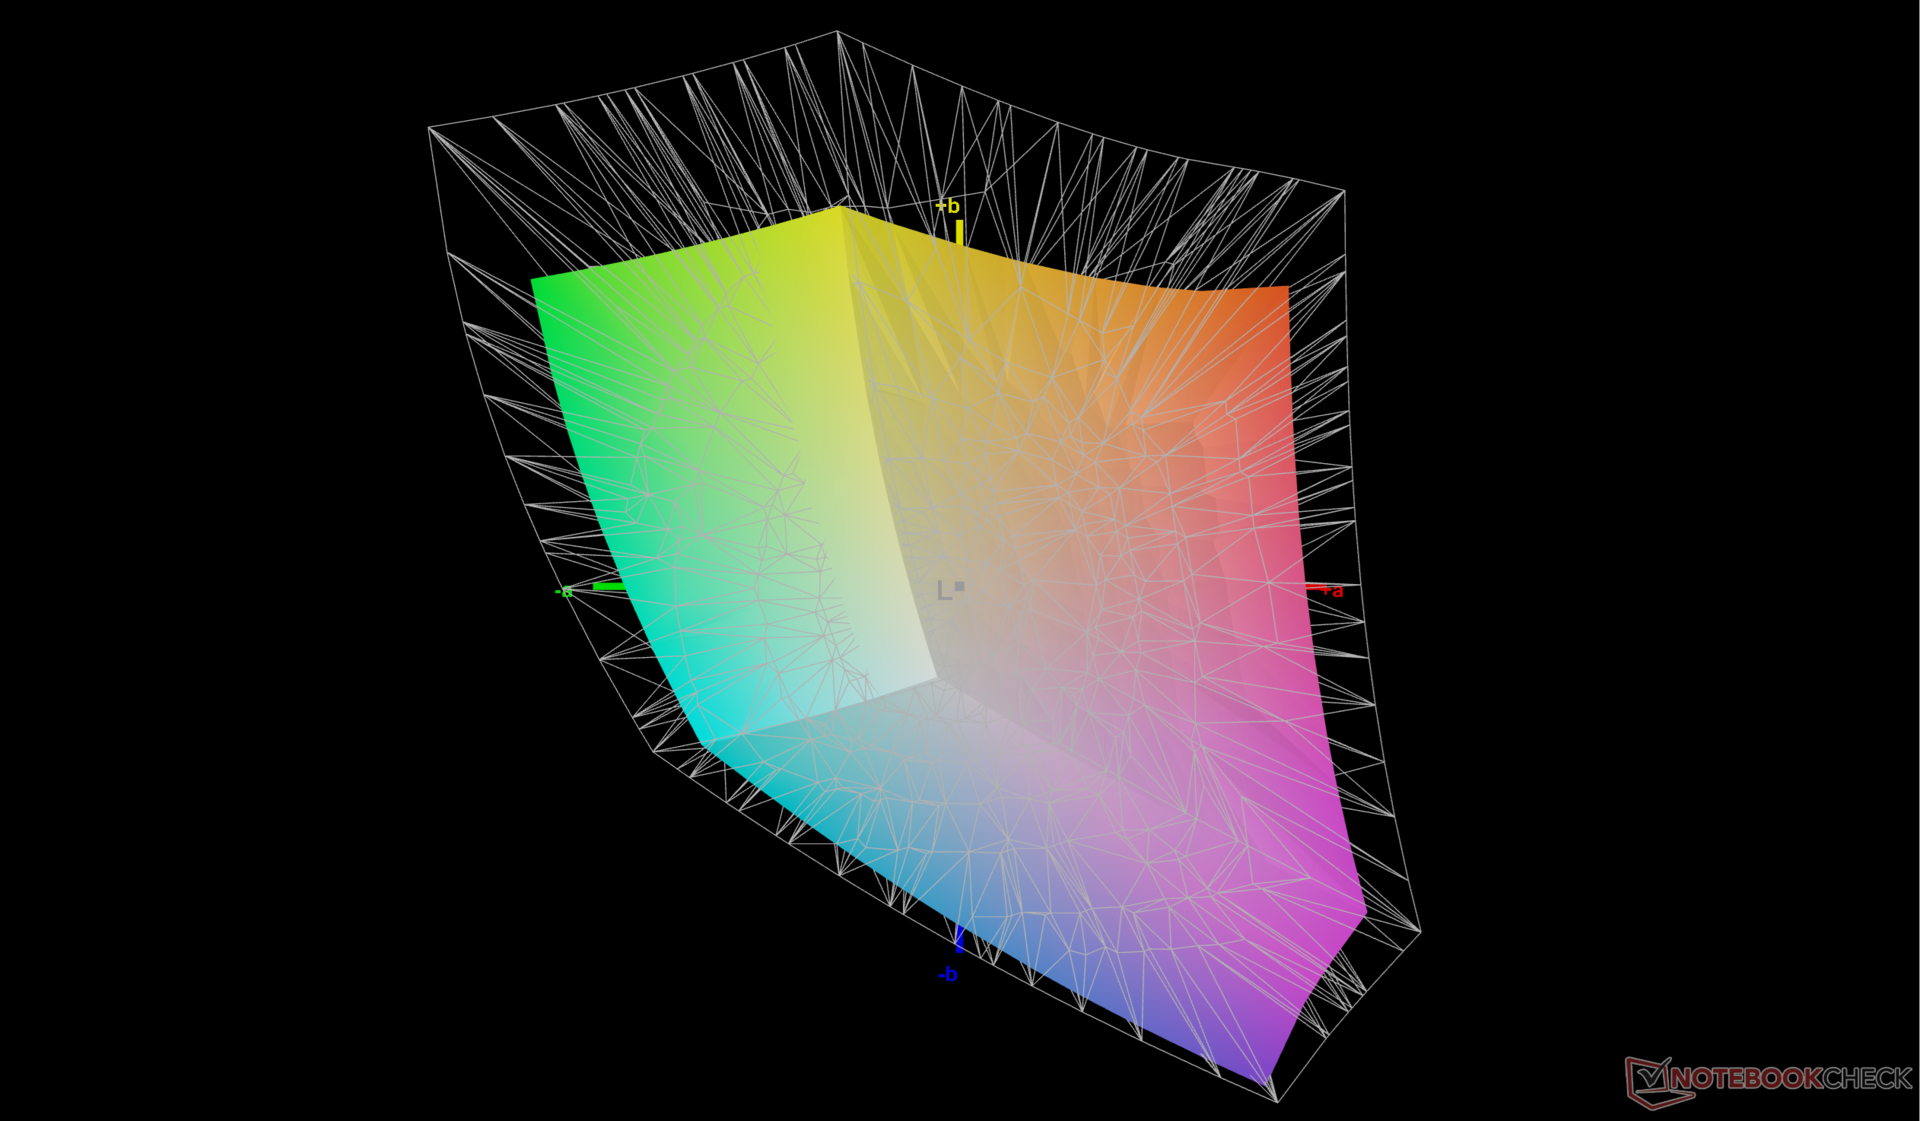
71% AdobeRGB 1998 (Argyll 3D)
97.7% sRGB (Argyll 3D)
69.1% Display P3 (Argyll 3D)
Gamma: 2.38
CCT: 6765 K
| HP ZBook Power 16 G11 A AUOA0A9, IPS, 2560x1600, 16", 120 Hz | HP ZBook Power 15 G10 BOE0B6A, IPS, 2560x1440, 15.6", 120 Hz | HP ZBook Fury 16 G11 AUO87A8, IPS, 3840x2400, 16", 120 Hz | Lenovo ThinkPad P1 Gen 7 21KV001SGE MNG007DA1-9 , IPS LED, 2560x1600, 16", 165 Hz | Lenovo ThinkPad P16s G2 21K9000CGE ATNA60YV04-0, OLED, 3840x2400, 16", 60 Hz | Dell Precision 5690 Samsung 160YV03, OLED, 3840x2400, 16", 60 Hz | |
|---|---|---|---|---|---|---|
| Display | -1% | 22% | 0% | 28% | 27% | |
| Display P3 Coverage (%) | 69.1 | 68.2 -1% | 98.4 42% | 69.4 0% | 99.9 45% | 99.8 44% |
| sRGB Coverage (%) | 97.7 | 95.6 -2% | 99.9 2% | 97.6 0% | 100 2% | 100 2% |
| AdobeRGB 1998 Coverage (%) | 71 | 70.5 -1% | 86 21% | 71.8 1% | 96.9 36% | 96.6 36% |
| Response Times | -10% | 8% | -4% | 87% | 84% | |
| Response Time Grey 50% / Grey 80% * (ms) | 13.6 ? | 13 ? 4% | 11.4 ? 16% | 11.2 ? 18% | 1.5 ? 89% | 1.7 ? 87% |
| Response Time Black / White * (ms) | 8.4 ? | 10.4 ? -24% | 8.4 ? -0% | 10.6 ? -26% | 1.3 ? 85% | 1.7 ? 80% |
| PWM Frequency (Hz) | 60 | 60 ? | ||||
| Bildschirm | -13% | 5% | -10% | 2% | -14% | |
| Helligkeit Bildmitte (cd/m²) | 470.7 | 313.8 -33% | 457.6 -3% | 516 10% | 416 -12% | 348.1 -26% |
| Brightness (cd/m²) | 431 | 302 -30% | 466 8% | 505 17% | 421 -2% | 351 -19% |
| Brightness Distribution (%) | 88 | 83 -6% | 83 -6% | 89 1% | 98 11% | 97 10% |
| Schwarzwert * (cd/m²) | 0.57 | 0.29 49% | 0.43 25% | 0.41 28% | ||
| Kontrast (:1) | 826 | 1082 31% | 1064 29% | 1259 52% | ||
| Delta E Colorchecker * | 2.16 | 3.27 -51% | 2.78 -29% | 3.5 -62% | 1.3 40% | 4.18 -94% |
| Colorchecker dE 2000 max. * | 4.39 | 7.81 -78% | 5.53 -26% | 8.8 -100% | 2.8 36% | 6.68 -52% |
| Colorchecker dE 2000 calibrated * | 1.37 | 0.56 59% | 1.37 -0% | 1.2 12% | 2.9 -112% | 0.97 29% |
| Delta E Graustufen * | 3.7 | 5.9 -59% | 2 46% | 5.6 -51% | 1.8 51% | 1.7 54% |
| Gamma | 2.38 92% | 2.18 101% | 2.28 96% | 2.27 97% | 2.25 98% | 2.2 100% |
| CCT | 6765 96% | 6323 103% | 6806 96% | 6071 107% | 6574 99% | 6198 105% |
| Durchschnitt gesamt (Programm / Settings) | -8% /
-10% | 12% /
9% | -5% /
-7% | 39% /
22% | 32% /
13% |
* ... kleinere Werte sind besser
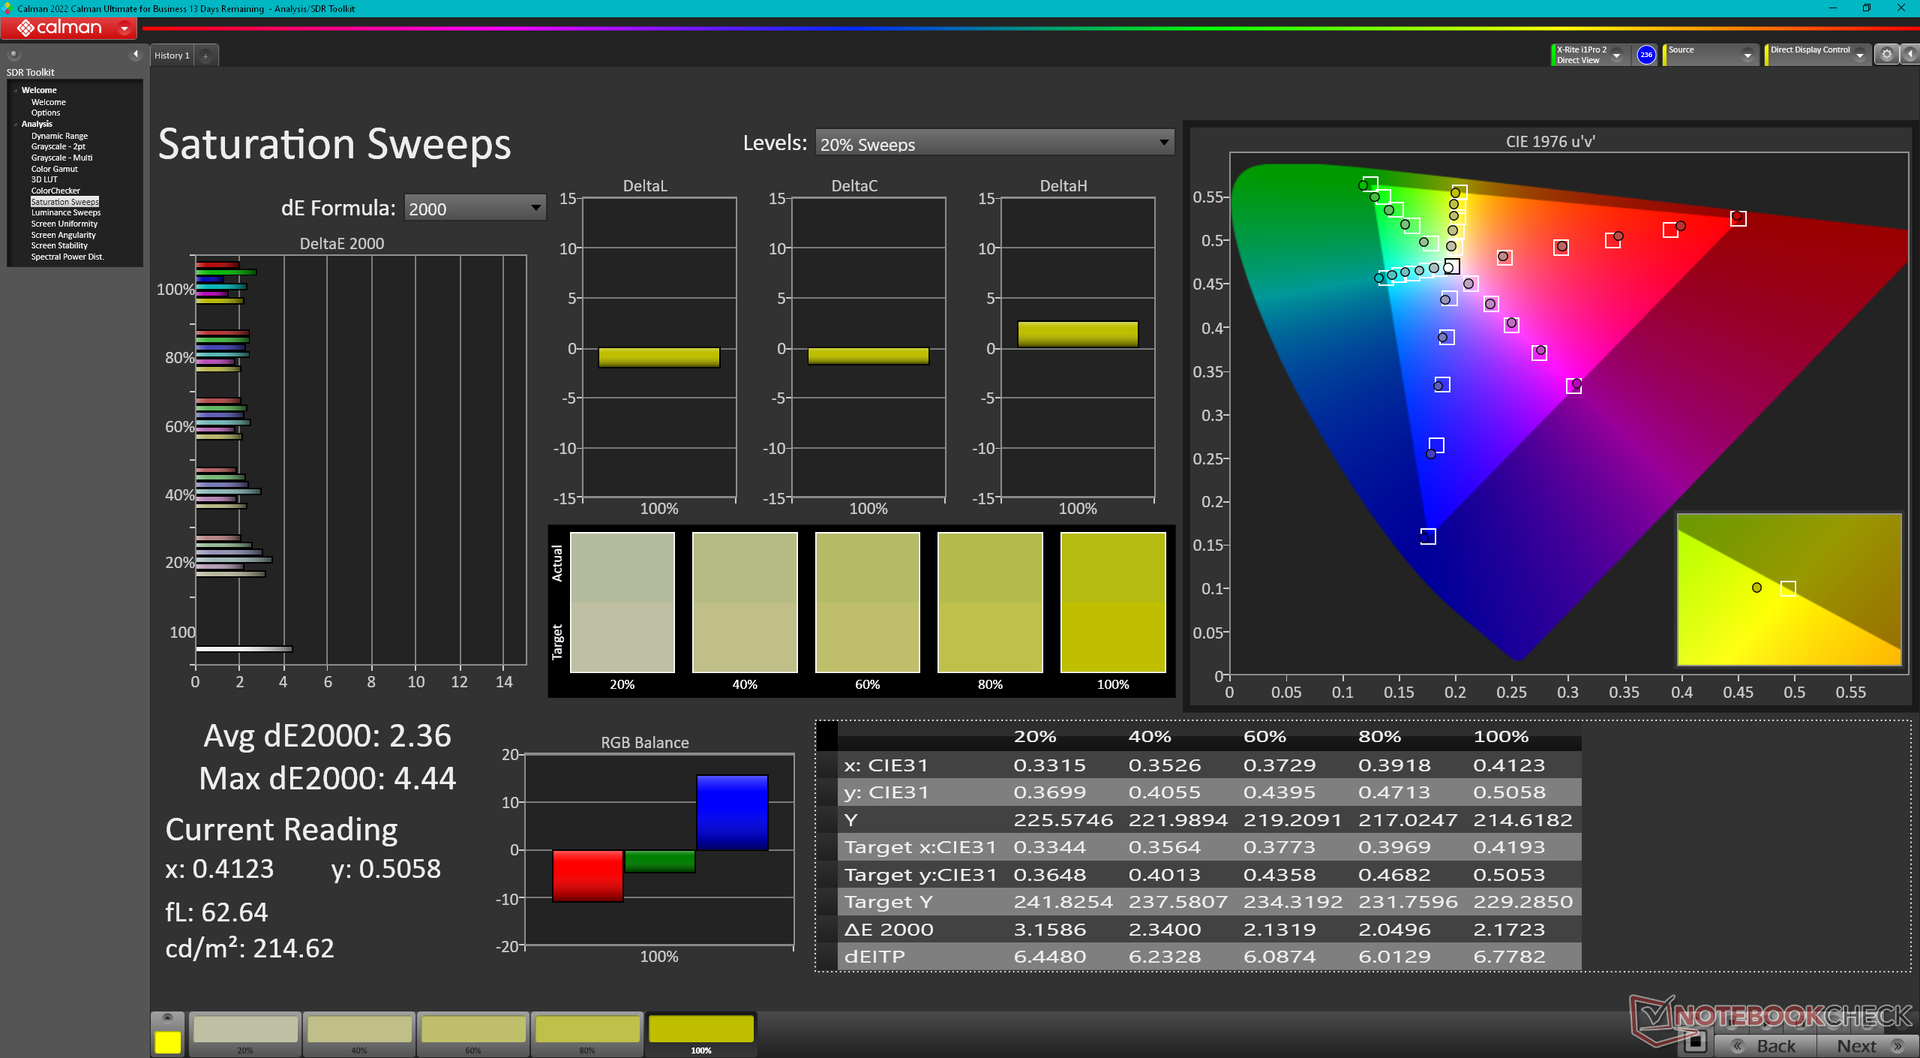
Der Bildschirm ist bereits im Auslieferungszustand ordentlich auf den sRGB-Standard kalibriert. Eine Kalibrierung des Panels mit unserem X-Rite-Kolorimeter würde die durchschnittlichen Graustufen- und Farb-DeltaE-Werte sogar noch weiter verbessern, von 3,7 und 2,16 auf lediglich 2,5 bzw. 1,37. Unser kalibriertes ICM-Profil steht oben zum kostenlosen Download bereit.

Reaktionszeiten (Response Times) des Displays
| ↔ Reaktionszeiten Schwarz zu Weiß | ||
|---|---|---|
| 8.4 ms ... steigend ↗ und fallend ↘ kombiniert | ↗ 4.5 ms steigend | 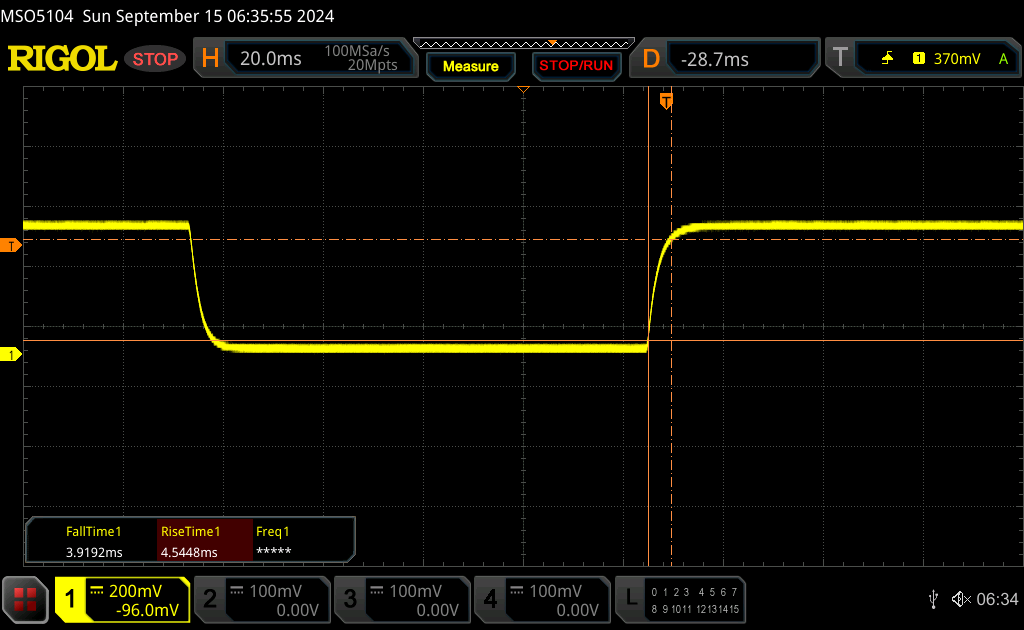 |
| ↘ 3.9 ms fallend | ||
| Die gemessenen Reaktionszeiten sind kurz wodurch sich der Bildschirm auch für Spiele gut eignen sollte. Im Vergleich rangierten die bei uns getesteten Geräte von 0.1 (Minimum) zu 240 (Maximum) ms. » 22 % aller Screens waren schneller als der getestete. Daher sind die gemessenen Reaktionszeiten besser als der Durchschnitt aller vermessenen Geräte (20.2 ms). | ||
| ↔ Reaktionszeiten 50% Grau zu 80% Grau | ||
| 13.6 ms ... steigend ↗ und fallend ↘ kombiniert | ↗ 7.2 ms steigend | 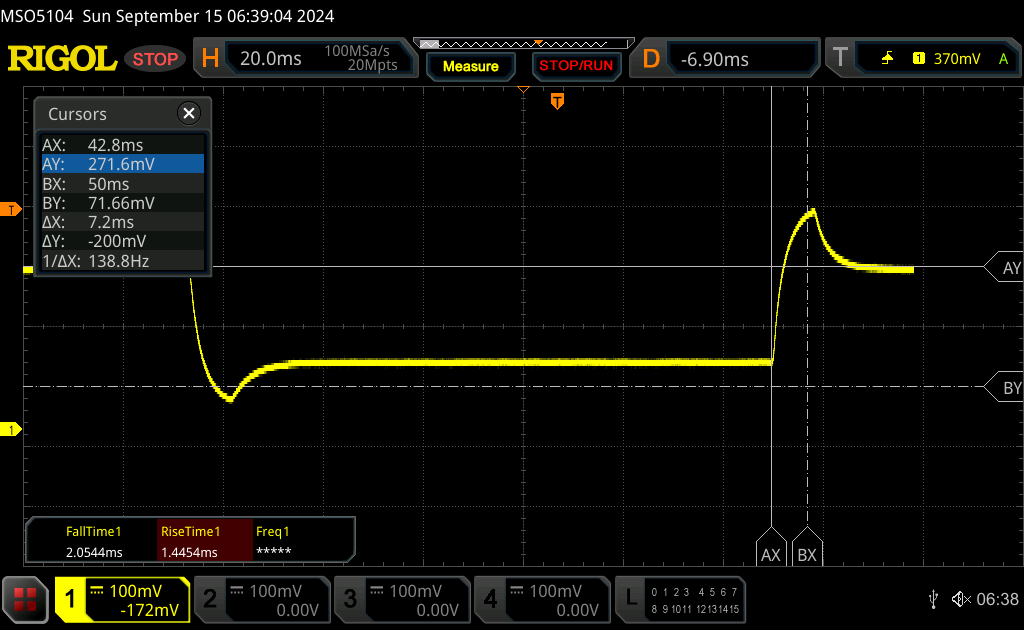 |
| ↘ 6.4 ms fallend | ||
| Die gemessenen Reaktionszeiten sind gut, für anspruchsvolle Spieler könnten der Bildschirm jedoch zu langsam sein. Im Vergleich rangierten die bei uns getesteten Geräte von 0.165 (Minimum) zu 636 (Maximum) ms. » 26 % aller Screens waren schneller als der getestete. Daher sind die gemessenen Reaktionszeiten besser als der Durchschnitt aller vermessenen Geräte (31.6 ms). | ||
Bildschirm-Flackern / PWM (Pulse-Width Modulation)
| Flackern / PWM nicht festgestellt |  | ||
Im Vergleich: 53 % aller getesteten Geräte nutzten kein PWM um die Helligkeit zu reduzieren. Wenn PWM eingesetzt wurde, dann bei einer Frequenz von durchschnittlich 8111 (Minimum 5, Maximum 343500) Hz. | |||
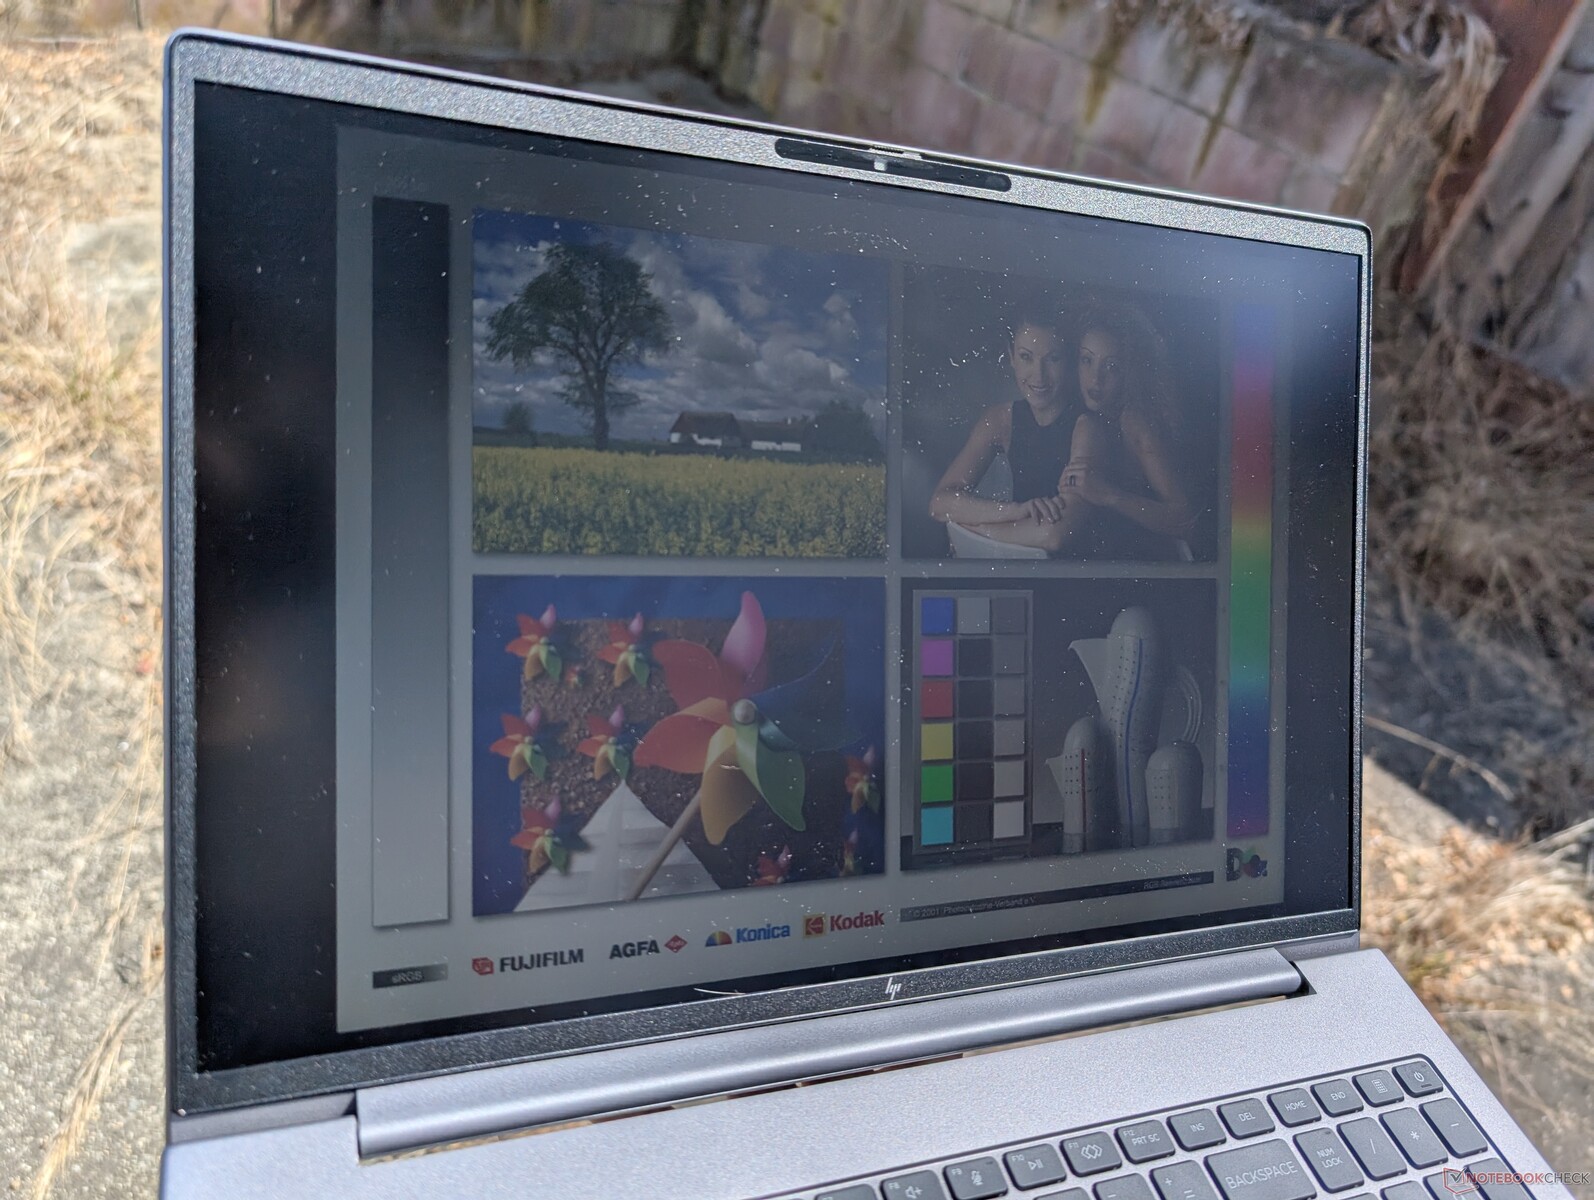
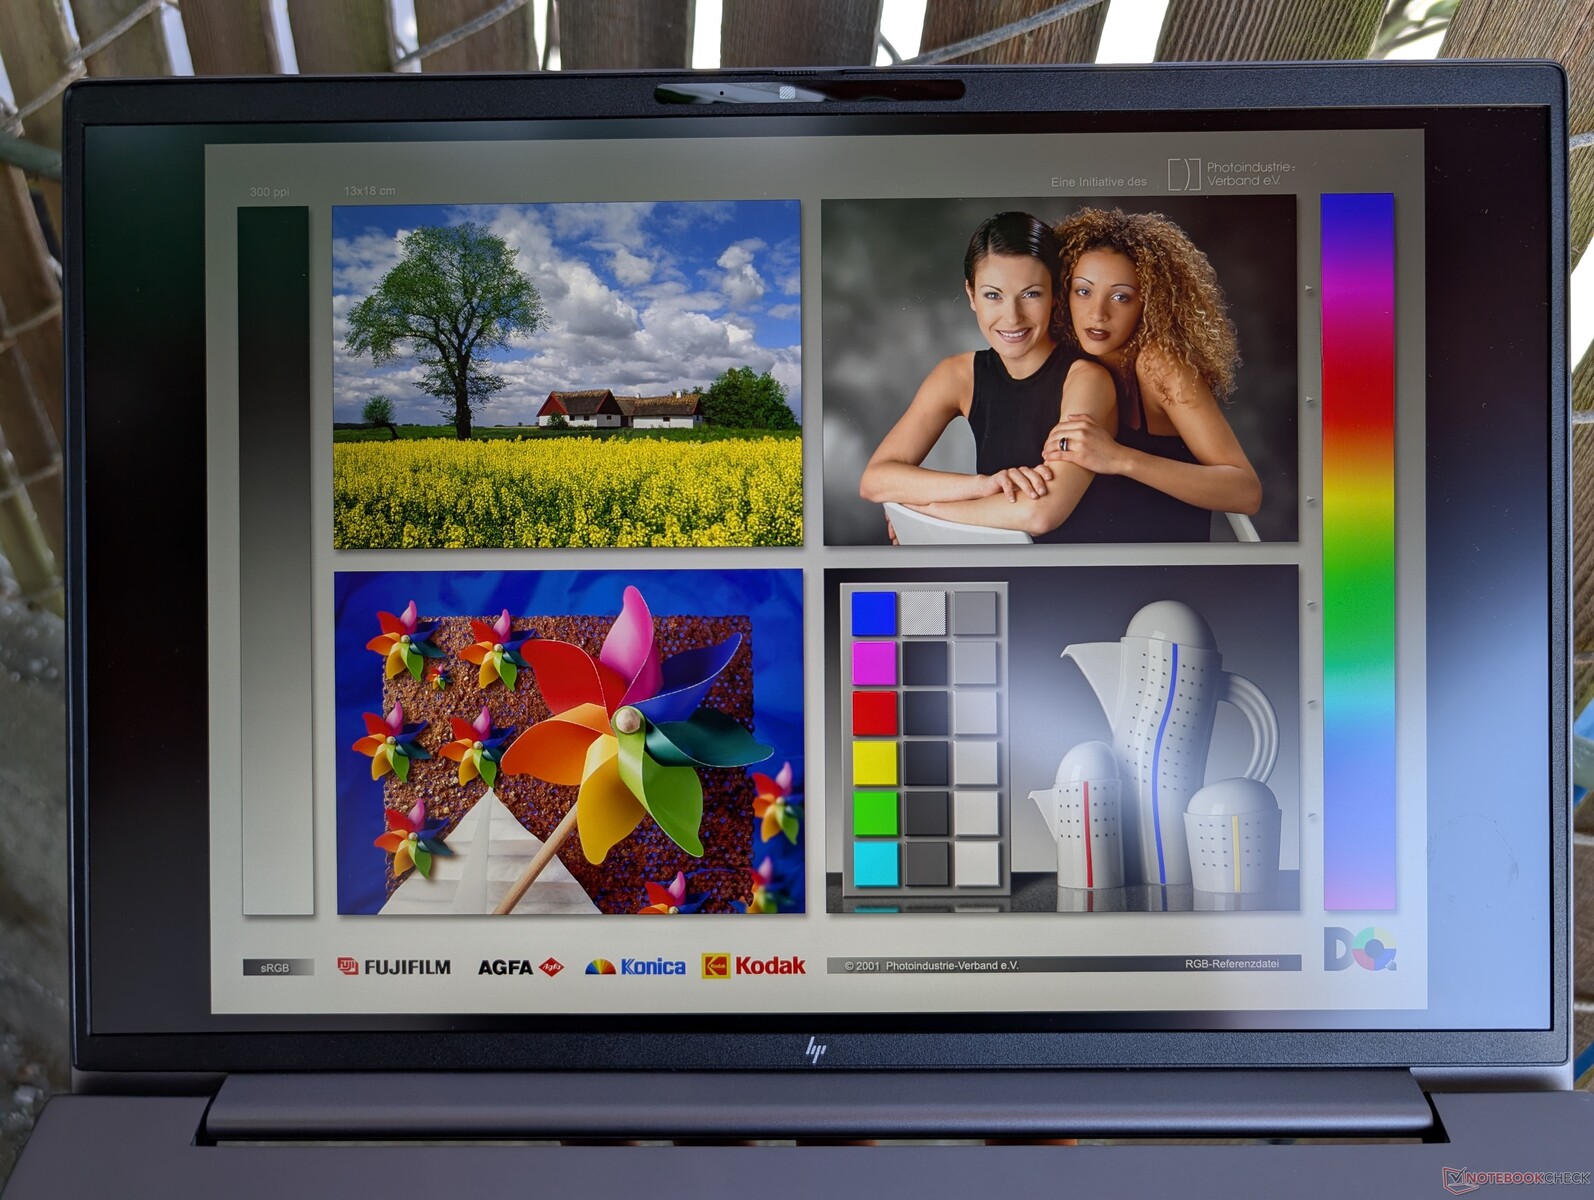
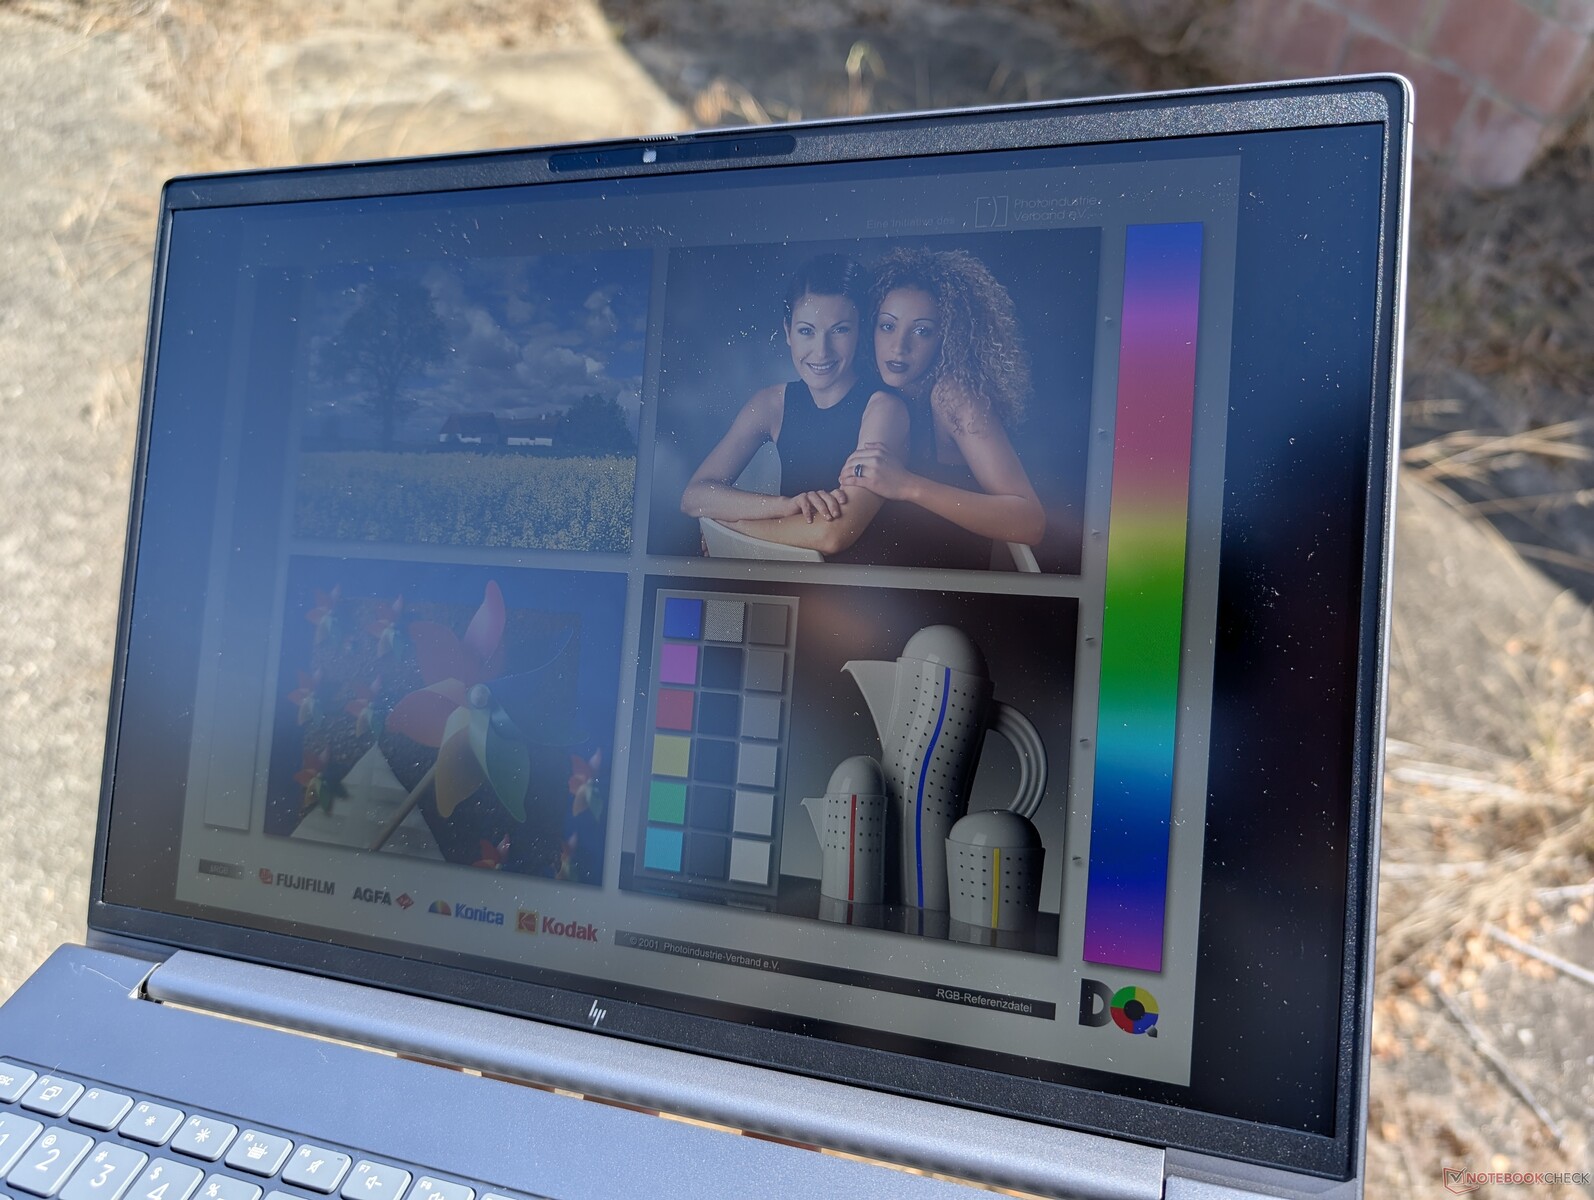
Die Sichtbarkeit im Freien ist mit unserem 1600p-Panel im Schatten akzeptabel, während die niedrigeren Optionen schwächer sind und anfälliger für Blendung. Die 1000-Nit-Option sollte in Betracht gezogen werden, wenn Sie häufig im Freien arbeiten.
Performance — Neuer Zen 4, gleiche Leistung wie der Zen 4
Testbedingungen
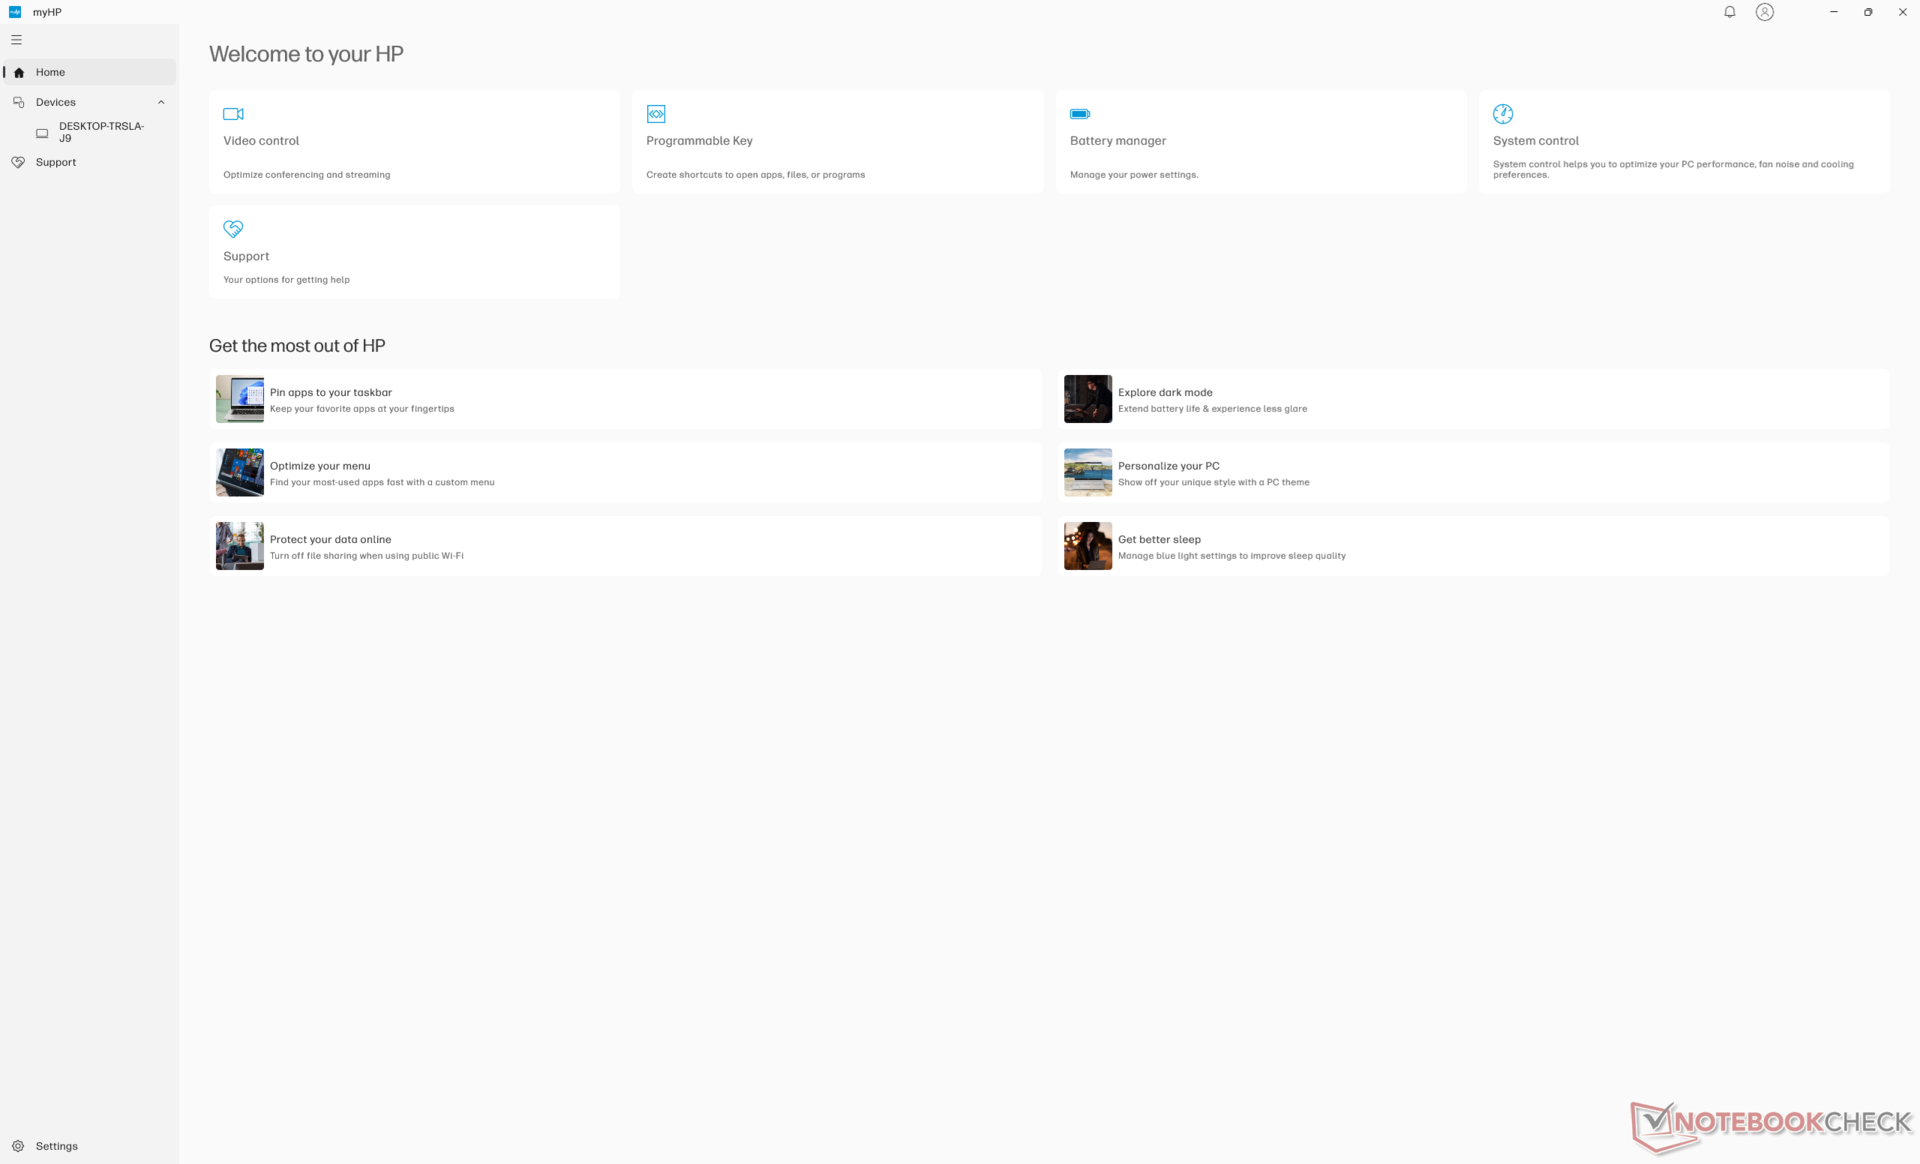
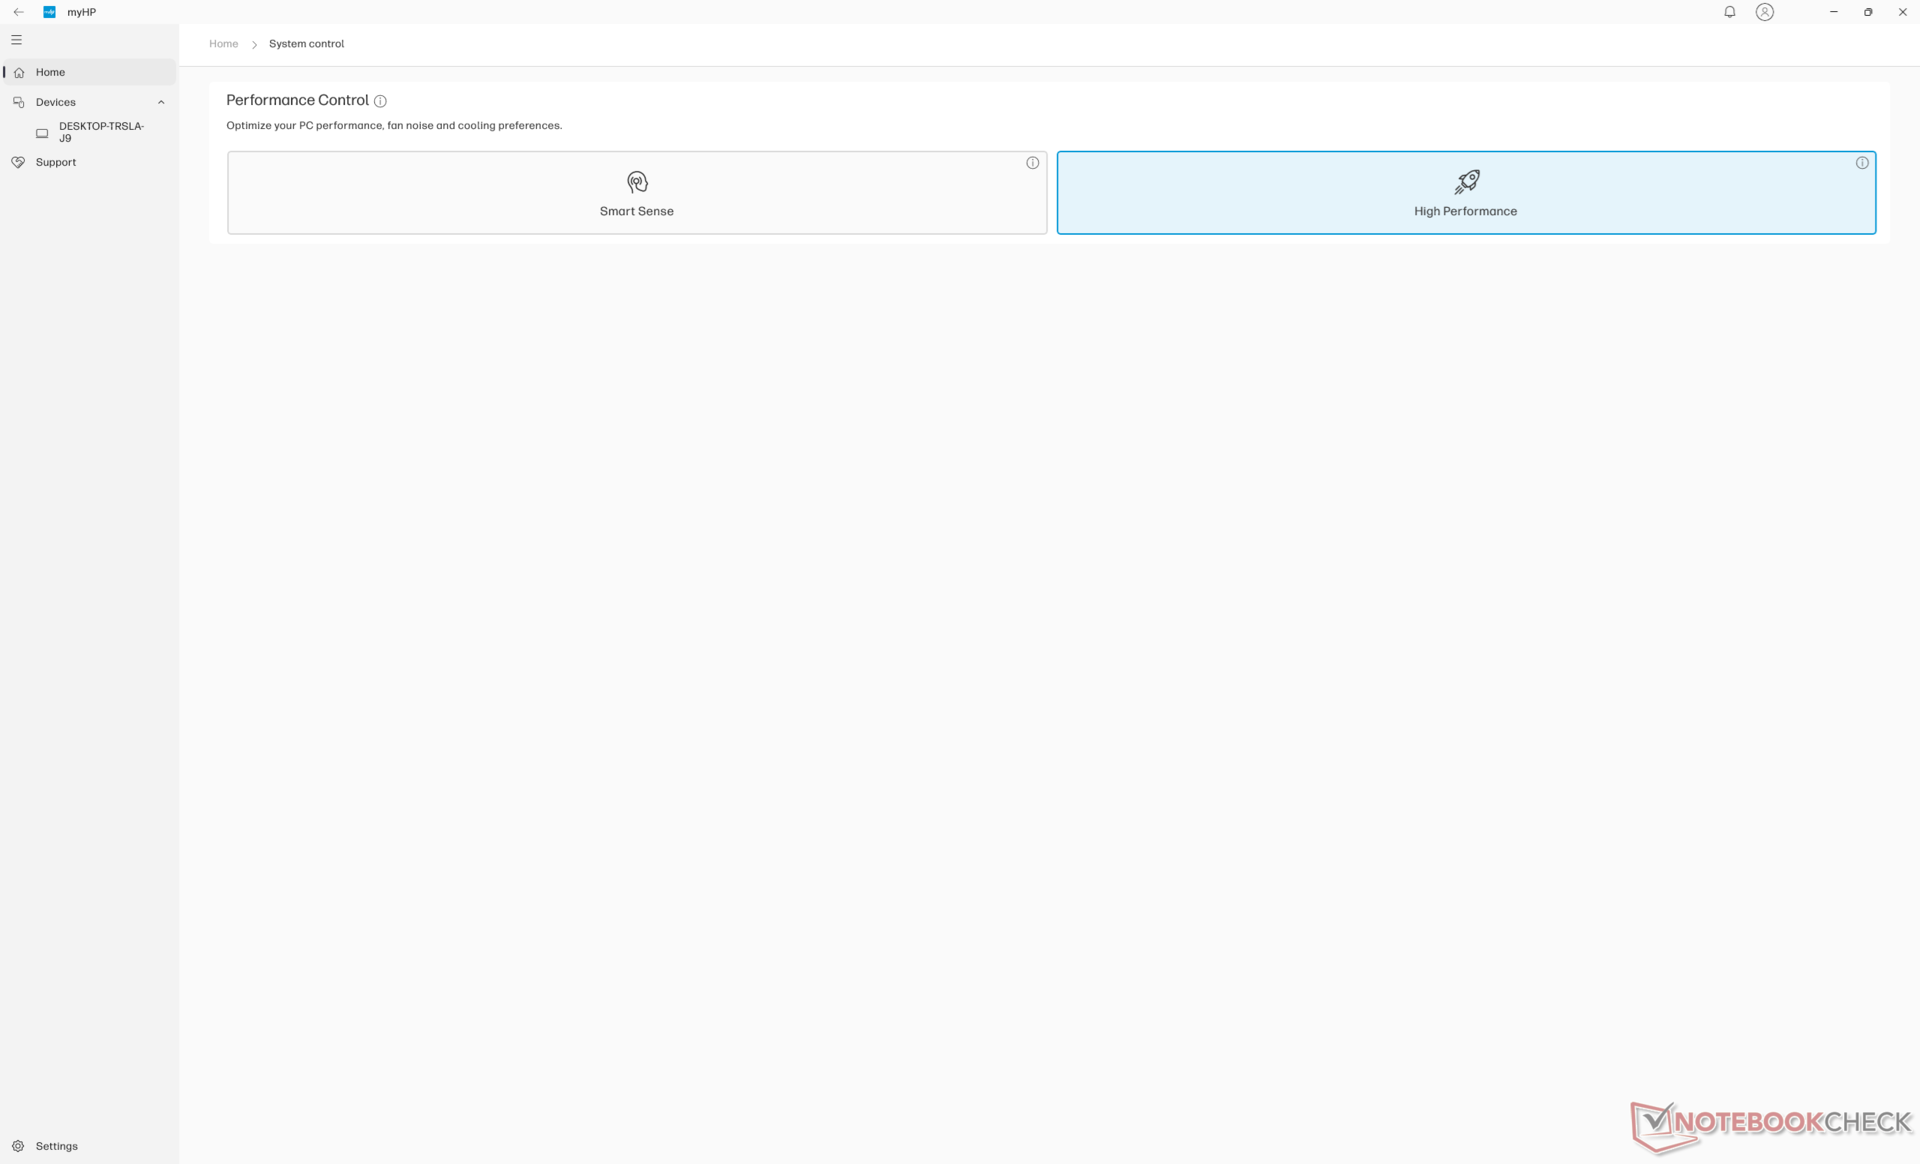
Wir haben sowohl Windows als auch MyHP auf den Performance-Modus eingestellt, bevor wir die folgenden Benchmarks durchgeführt haben. Optimus 1.0 wird unterstützt.
Prozessor
Der Ryzen 7 8845HS bietet nicht viel mehr als der Ryzen 7 7840HS, den er im ZBook Power 15 G10 des letzten Jahres ersetzt hat. Tatsächlich liegen beide Prozessoren in den Benchmarks nur wenige Prozentpunkte auseinander und sind im Wesentlichen identisch. Das könnte Power-User enttäuschen, die beim Wechsel vom 15-Zoll- zum 16-Zoll-Modell eine deutliche Leistungssteigerung erwartet hatten. Schnellere Raptor Lake-HX-Optionen sind nur für die dickere ZBook Fury-Serie von HP verfügbar.
Einer der wesentlichen Vorteile des Ryzen 7 8845HS im Vergleich zum Ryzen 7 7840HS ist die Beschleunigung der KI durch die eingebaute NPU. Allerdings ist Co-Pilot+ nicht mit Hawk-Point-CPUs kompatibel, sodass die NPU auf diesem Gerät nur sehr eingeschränkt genutzt werden kann.
Ein Downgrade auf den Ryzen 5 8645HS wird voraussichtlich die Leistung um 25 bis 30 Prozent verringern, während ein Upgrade auf den Ryzen 9 8945HS die Leistung voraussichtlich nur um 5 Prozent steigern wird.
Cinebench R15 Multi Dauertest
Cinebench R23: Multi Core | Single Core
Cinebench R20: CPU (Multi Core) | CPU (Single Core)
Cinebench R15: CPU Multi 64Bit | CPU Single 64Bit
Blender: v2.79 BMW27 CPU
7-Zip 18.03: 7z b 4 | 7z b 4 -mmt1
Geekbench 6.5: Multi-Core | Single-Core
Geekbench 5.5: Multi-Core | Single-Core
HWBOT x265 Benchmark v2.2: 4k Preset
LibreOffice : 20 Documents To PDF
R Benchmark 2.5: Overall mean
| CPU Performance Rating | |
| HP ZBook Fury 16 G11 | |
| Asus ExpertBook B6 Flip B6602FC2 -2! | |
| Dell Precision 5690 | |
| HP ZBook Fury 16 G9 -2! | |
| HP ZBook Power 15 G10 | |
| Durchschnittliche AMD Ryzen 7 8845HS | |
| HP ZBook Power 16 G11 A | |
| Dell Precision 5000 5490 | |
| MSI CreatorPro Z16P B12UKST -2! | |
| Lenovo ThinkPad P16v G1 AMD | |
| Lenovo ThinkPad P16s G2 21K9000CGE | |
| Lenovo ThinkPad P1 G4-20Y4Z9DVUS -2! | |
| HP ZBook Firefly 16 G9-6B897EA -2! | |
| Geekbench 6.5 / Multi-Core | |
| HP ZBook Fury 16 G11 | |
| Dell Precision 5690 | |
| Dell Precision 5000 5490 | |
| HP ZBook Power 15 G10 | |
| Durchschnittliche AMD Ryzen 7 8845HS (11073 - 14014, n=18) | |
| HP ZBook Power 16 G11 A | |
| Lenovo ThinkPad P16s G2 21K9000CGE | |
| Lenovo ThinkPad P16v G1 AMD | |
| Geekbench 6.5 / Single-Core | |
| HP ZBook Fury 16 G11 | |
| HP ZBook Power 15 G10 | |
| Durchschnittliche AMD Ryzen 7 8845HS (2510 - 2698, n=16) | |
| HP ZBook Power 16 G11 A | |
| Lenovo ThinkPad P16v G1 AMD | |
| Dell Precision 5690 | |
| Lenovo ThinkPad P16s G2 21K9000CGE | |
| Dell Precision 5000 5490 | |
Cinebench R23: Multi Core | Single Core
Cinebench R20: CPU (Multi Core) | CPU (Single Core)
Cinebench R15: CPU Multi 64Bit | CPU Single 64Bit
Blender: v2.79 BMW27 CPU
7-Zip 18.03: 7z b 4 | 7z b 4 -mmt1
Geekbench 6.5: Multi-Core | Single-Core
Geekbench 5.5: Multi-Core | Single-Core
HWBOT x265 Benchmark v2.2: 4k Preset
LibreOffice : 20 Documents To PDF
R Benchmark 2.5: Overall mean
* ... kleinere Werte sind besser
AIDA64: FP32 Ray-Trace | FPU Julia | CPU SHA3 | CPU Queen | FPU SinJulia | FPU Mandel | CPU AES | CPU ZLib | FP64 Ray-Trace | CPU PhotoWorxx
| Performance Rating | |
| Durchschnittliche AMD Ryzen 7 8845HS | |
| HP ZBook Power 15 G10 | |
| HP ZBook Power 16 G11 A | |
| HP ZBook Fury 16 G11 | |
| Lenovo ThinkPad P16s G2 21K9000CGE | |
| Dell Precision 5690 | |
| Lenovo ThinkPad P1 Gen 7 21KV001SGE | |
| AIDA64 / FP32 Ray-Trace | |
| Durchschnittliche AMD Ryzen 7 8845HS (23708 - 29544, n=13) | |
| HP ZBook Power 15 G10 | |
| HP ZBook Power 16 G11 A | |
| Lenovo ThinkPad P16s G2 21K9000CGE | |
| HP ZBook Fury 16 G11 | |
| Dell Precision 5690 | |
| Lenovo ThinkPad P1 Gen 7 21KV001SGE | |
| AIDA64 / FPU Julia | |
| HP ZBook Power 16 G11 A | |
| Durchschnittliche AMD Ryzen 7 8845HS (99659 - 125873, n=13) | |
| HP ZBook Power 15 G10 | |
| HP ZBook Fury 16 G11 | |
| Lenovo ThinkPad P16s G2 21K9000CGE | |
| Dell Precision 5690 | |
| Lenovo ThinkPad P1 Gen 7 21KV001SGE | |
| AIDA64 / CPU SHA3 | |
| HP ZBook Fury 16 G11 | |
| HP ZBook Power 16 G11 A | |
| Durchschnittliche AMD Ryzen 7 8845HS (4332 - 5180, n=13) | |
| HP ZBook Power 15 G10 | |
| Lenovo ThinkPad P16s G2 21K9000CGE | |
| Dell Precision 5690 | |
| Lenovo ThinkPad P1 Gen 7 21KV001SGE | |
| AIDA64 / CPU Queen | |
| HP ZBook Fury 16 G11 | |
| HP ZBook Power 16 G11 A | |
| Durchschnittliche AMD Ryzen 7 8845HS (109458 - 124695, n=13) | |
| HP ZBook Power 15 G10 | |
| Lenovo ThinkPad P16s G2 21K9000CGE | |
| Dell Precision 5690 | |
| Lenovo ThinkPad P1 Gen 7 21KV001SGE | |
| AIDA64 / FPU SinJulia | |
| Durchschnittliche AMD Ryzen 7 8845HS (14062 - 15519, n=13) | |
| HP ZBook Power 15 G10 | |
| HP ZBook Power 16 G11 A | |
| Lenovo ThinkPad P16s G2 21K9000CGE | |
| HP ZBook Fury 16 G11 | |
| Dell Precision 5690 | |
| Lenovo ThinkPad P1 Gen 7 21KV001SGE | |
| AIDA64 / FPU Mandel | |
| Durchschnittliche AMD Ryzen 7 8845HS (53436 - 67367, n=13) | |
| HP ZBook Power 15 G10 | |
| HP ZBook Power 16 G11 A | |
| Lenovo ThinkPad P16s G2 21K9000CGE | |
| HP ZBook Fury 16 G11 | |
| Dell Precision 5690 | |
| Lenovo ThinkPad P1 Gen 7 21KV001SGE | |
| AIDA64 / CPU AES | |
| HP ZBook Fury 16 G11 | |
| Durchschnittliche AMD Ryzen 7 8845HS (64515 - 172642, n=13) | |
| Dell Precision 5690 | |
| HP ZBook Power 15 G10 | |
| Lenovo ThinkPad P1 Gen 7 21KV001SGE | |
| HP ZBook Power 16 G11 A | |
| Lenovo ThinkPad P16s G2 21K9000CGE | |
| AIDA64 / CPU ZLib | |
| HP ZBook Fury 16 G11 | |
| Dell Precision 5690 | |
| Lenovo ThinkPad P1 Gen 7 21KV001SGE | |
| HP ZBook Power 16 G11 A | |
| HP ZBook Power 15 G10 | |
| Lenovo ThinkPad P16s G2 21K9000CGE | |
| Durchschnittliche AMD Ryzen 7 8845HS (627 - 1080, n=13) | |
| AIDA64 / FP64 Ray-Trace | |
| HP ZBook Power 15 G10 | |
| Durchschnittliche AMD Ryzen 7 8845HS (12361 - 15911, n=13) | |
| HP ZBook Power 16 G11 A | |
| Lenovo ThinkPad P16s G2 21K9000CGE | |
| HP ZBook Fury 16 G11 | |
| Dell Precision 5690 | |
| Lenovo ThinkPad P1 Gen 7 21KV001SGE | |
| AIDA64 / CPU PhotoWorxx | |
| Dell Precision 5690 | |
| HP ZBook Power 15 G10 | |
| Lenovo ThinkPad P1 Gen 7 21KV001SGE | |
| HP ZBook Power 16 G11 A | |
| Durchschnittliche AMD Ryzen 7 8845HS (33192 - 41668, n=13) | |
| Lenovo ThinkPad P16s G2 21K9000CGE | |
| HP ZBook Fury 16 G11 | |
Stresstest
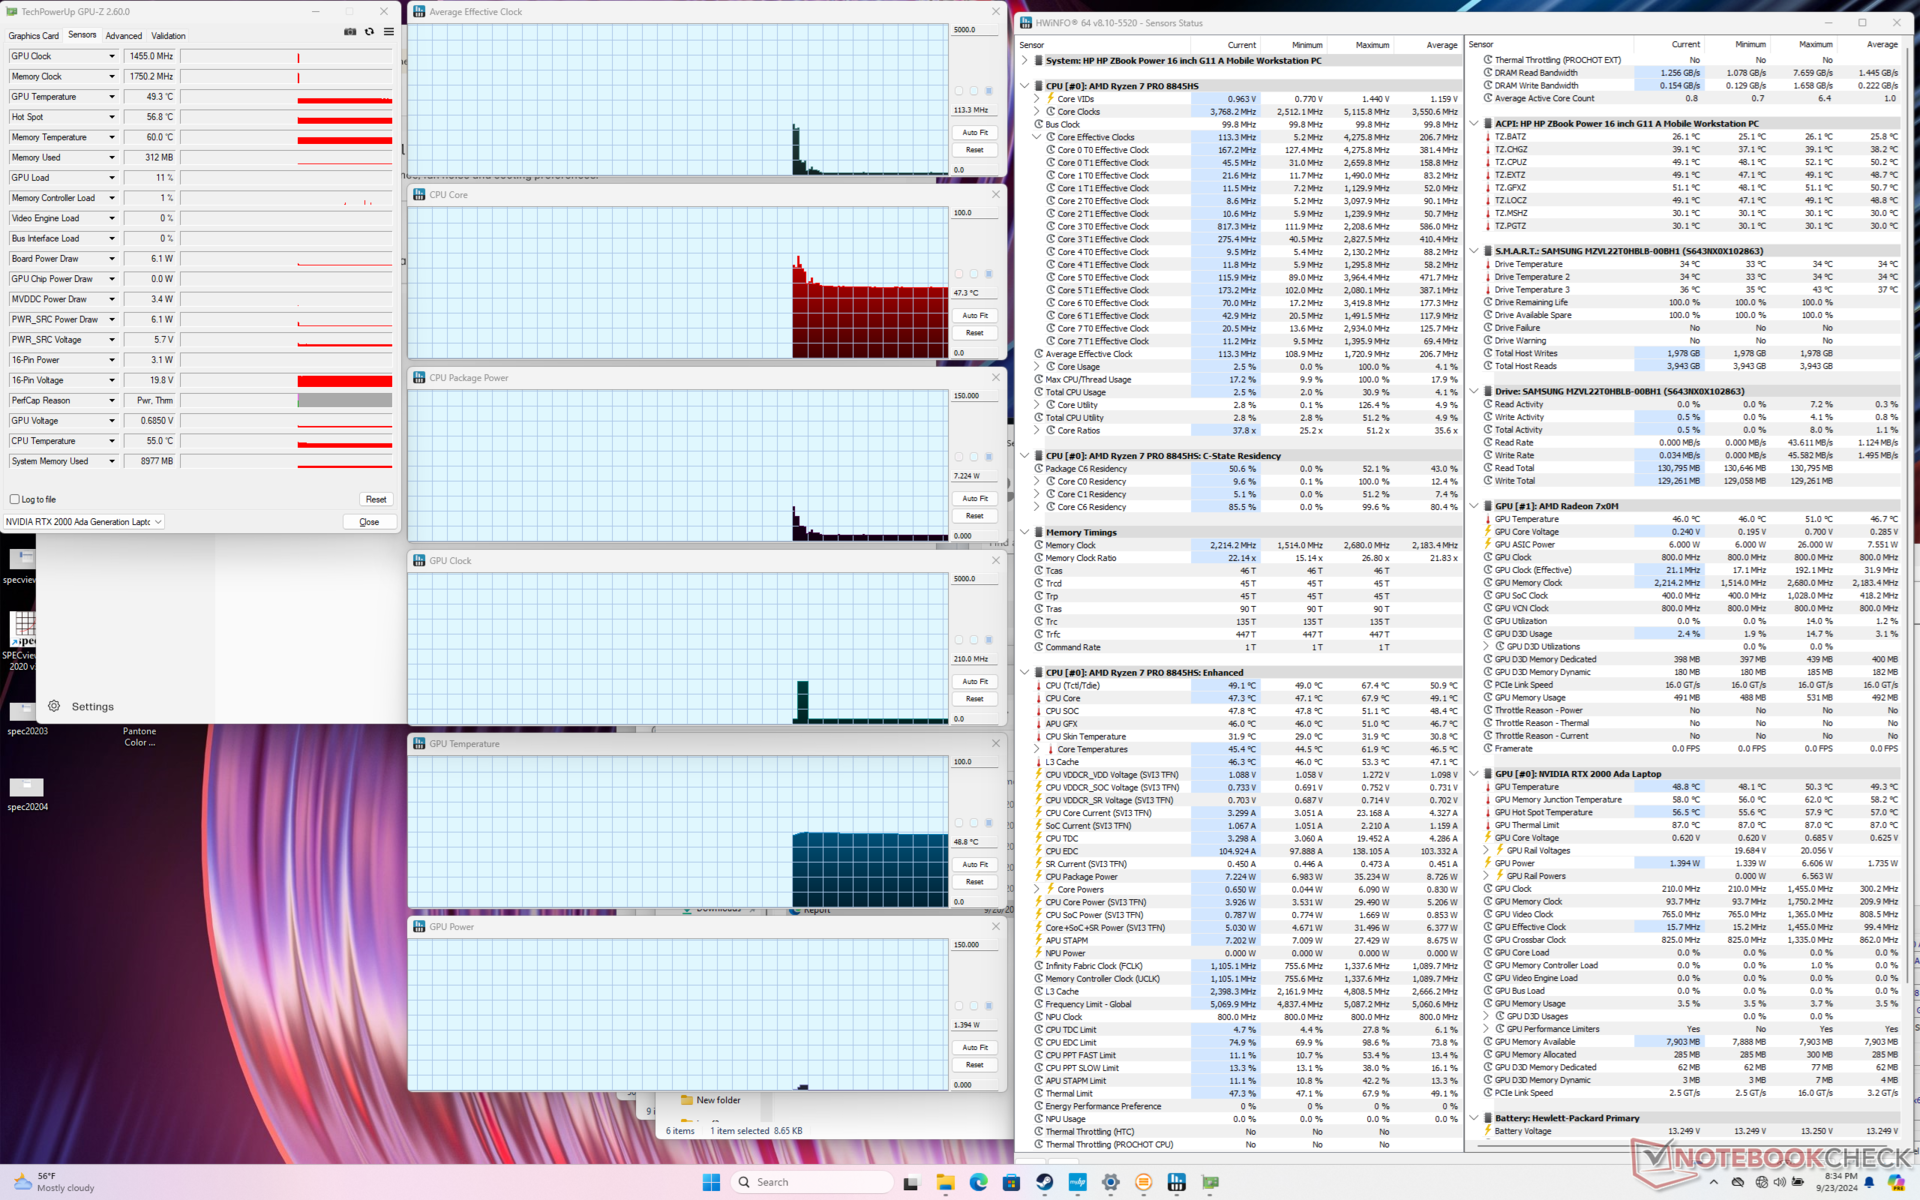
Unter Prime95-Stresstest stieg die CPU auf 4,3 GHz, 65 W und 90 °C, bevor sie schnell wieder auf 3,8 GHz und 50 W sank, um höhere Kerntemperaturen zu vermeiden. Die Ergebnisse entsprechen in etwa denen, die wir beim ZBook Power 15 G10 beobachtet haben, möglicherweise sind sie sogar ein paar Grad wärmer.
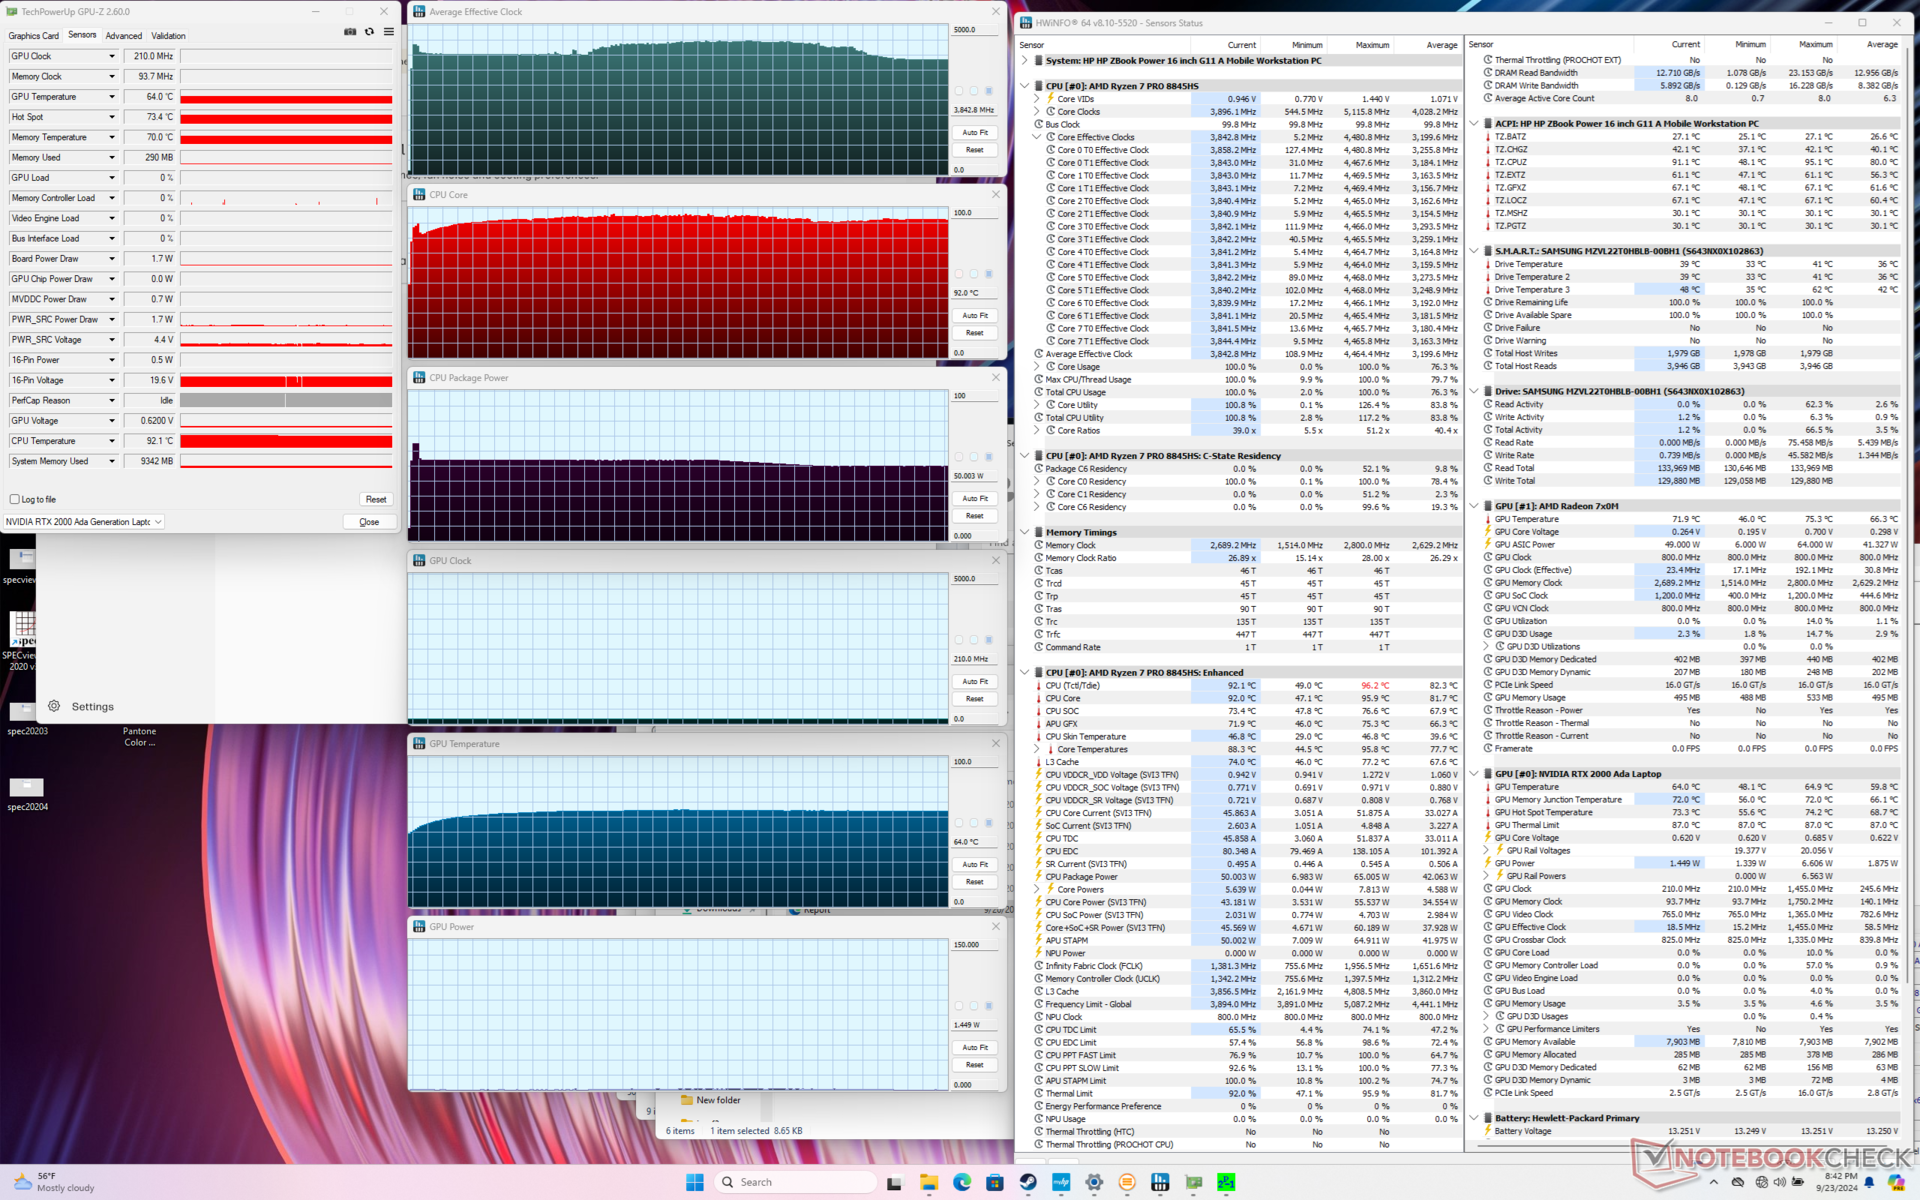
Interessanterweise drosselt die CPU stärker auf nur 2,8 GHz, wenn Prime95 und FurMark gleichzeitig laufen, anstatt auf 3,8 GHz wie beim Vorjahresmodell. Diese Änderung wurde wahrscheinlich vorgenommen, um die Kerntemperaturen zu verbessern; die CPU stabilisiert sich nun bei angenehmen 66 °C statt bei 99 °C wie beim ZBook Power 15 G10.
Wenn man Cyberpunk 2077 im Balanced-Modus statt im Performance-Modus spielen, werden die Kerntemperaturen etwas kühler und die durchschnittlichen Taktraten etwas langsamer, wie unten gezeigt. Die Leistungsaufnahme der GPU sinkt ebenfalls von 35 W auf 30 W gegenüber dem angegebenen Maximum von 50 W.
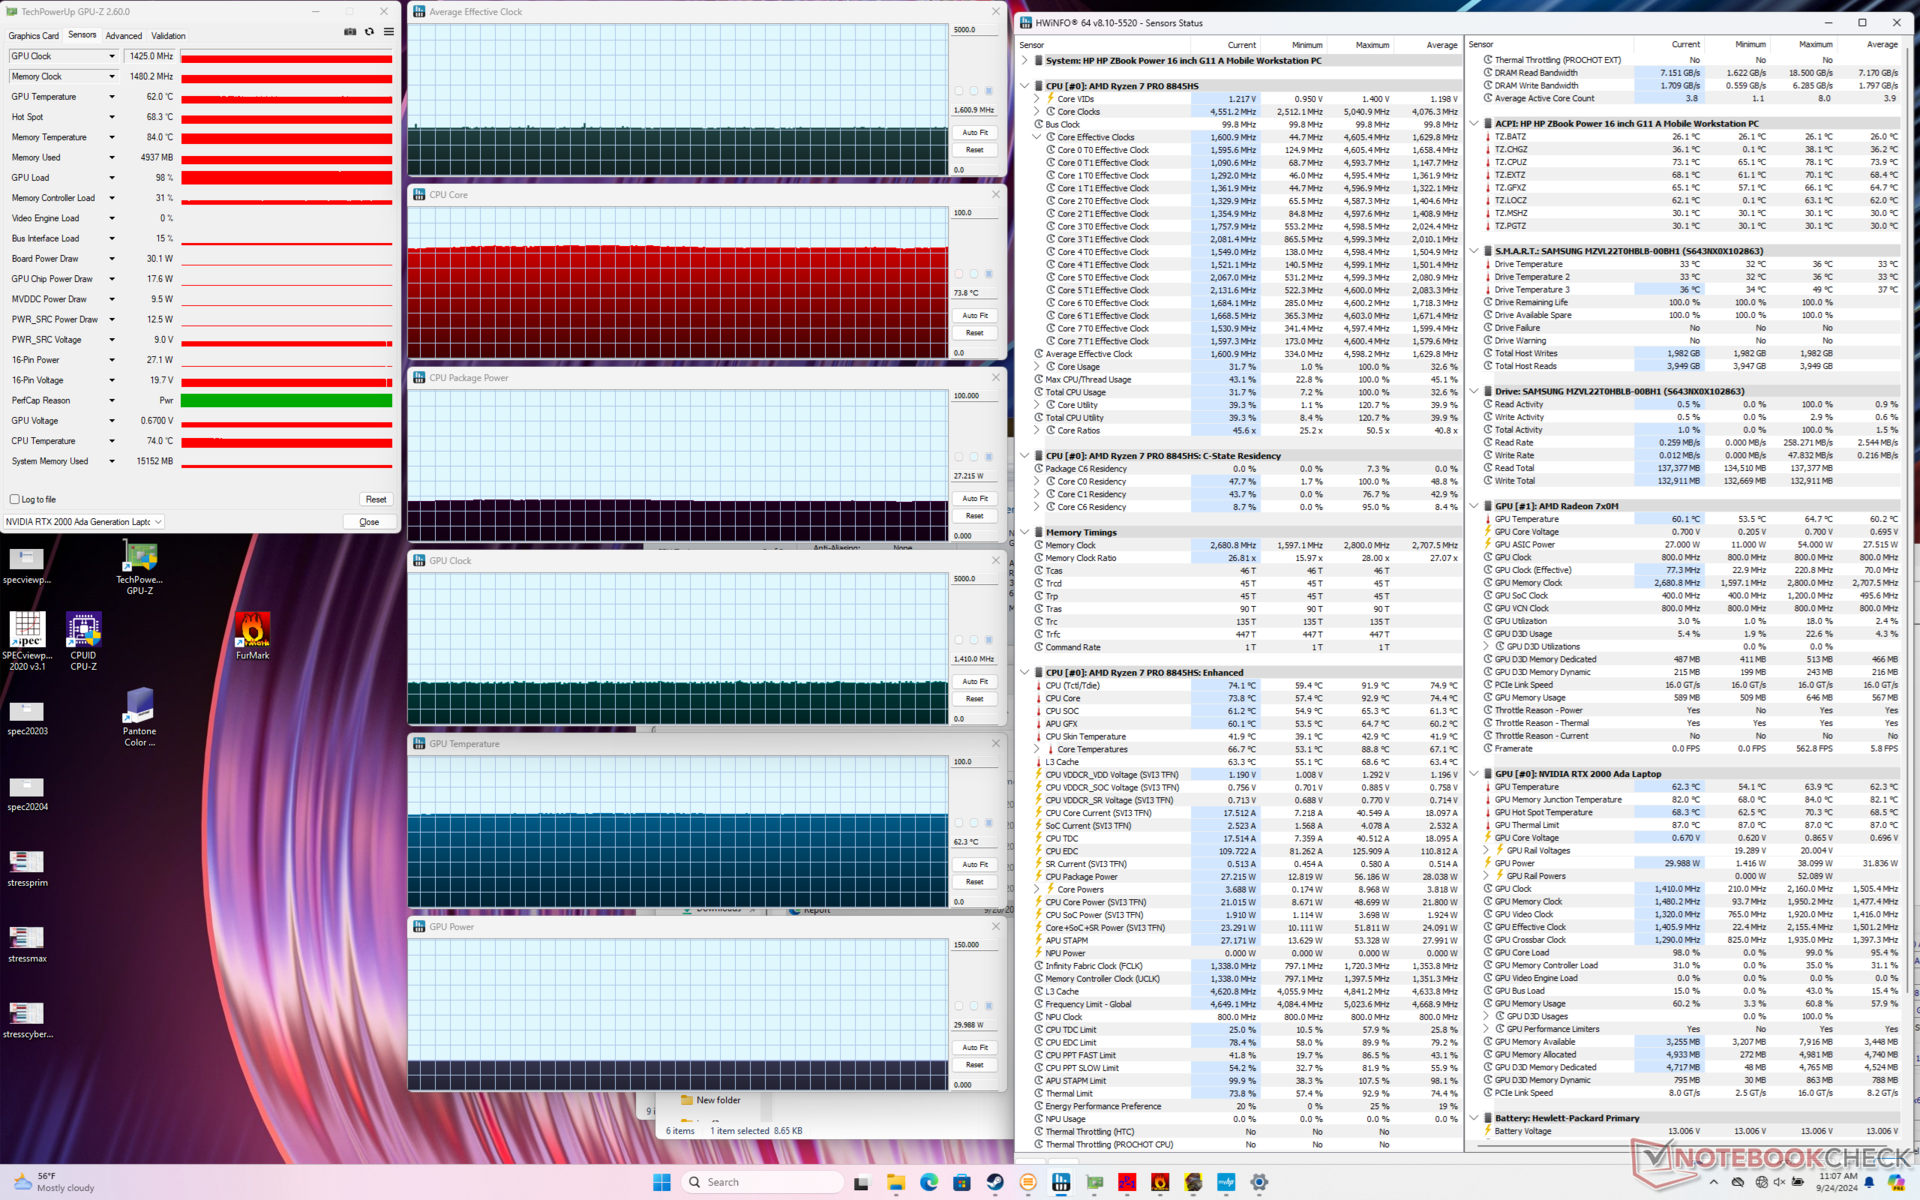
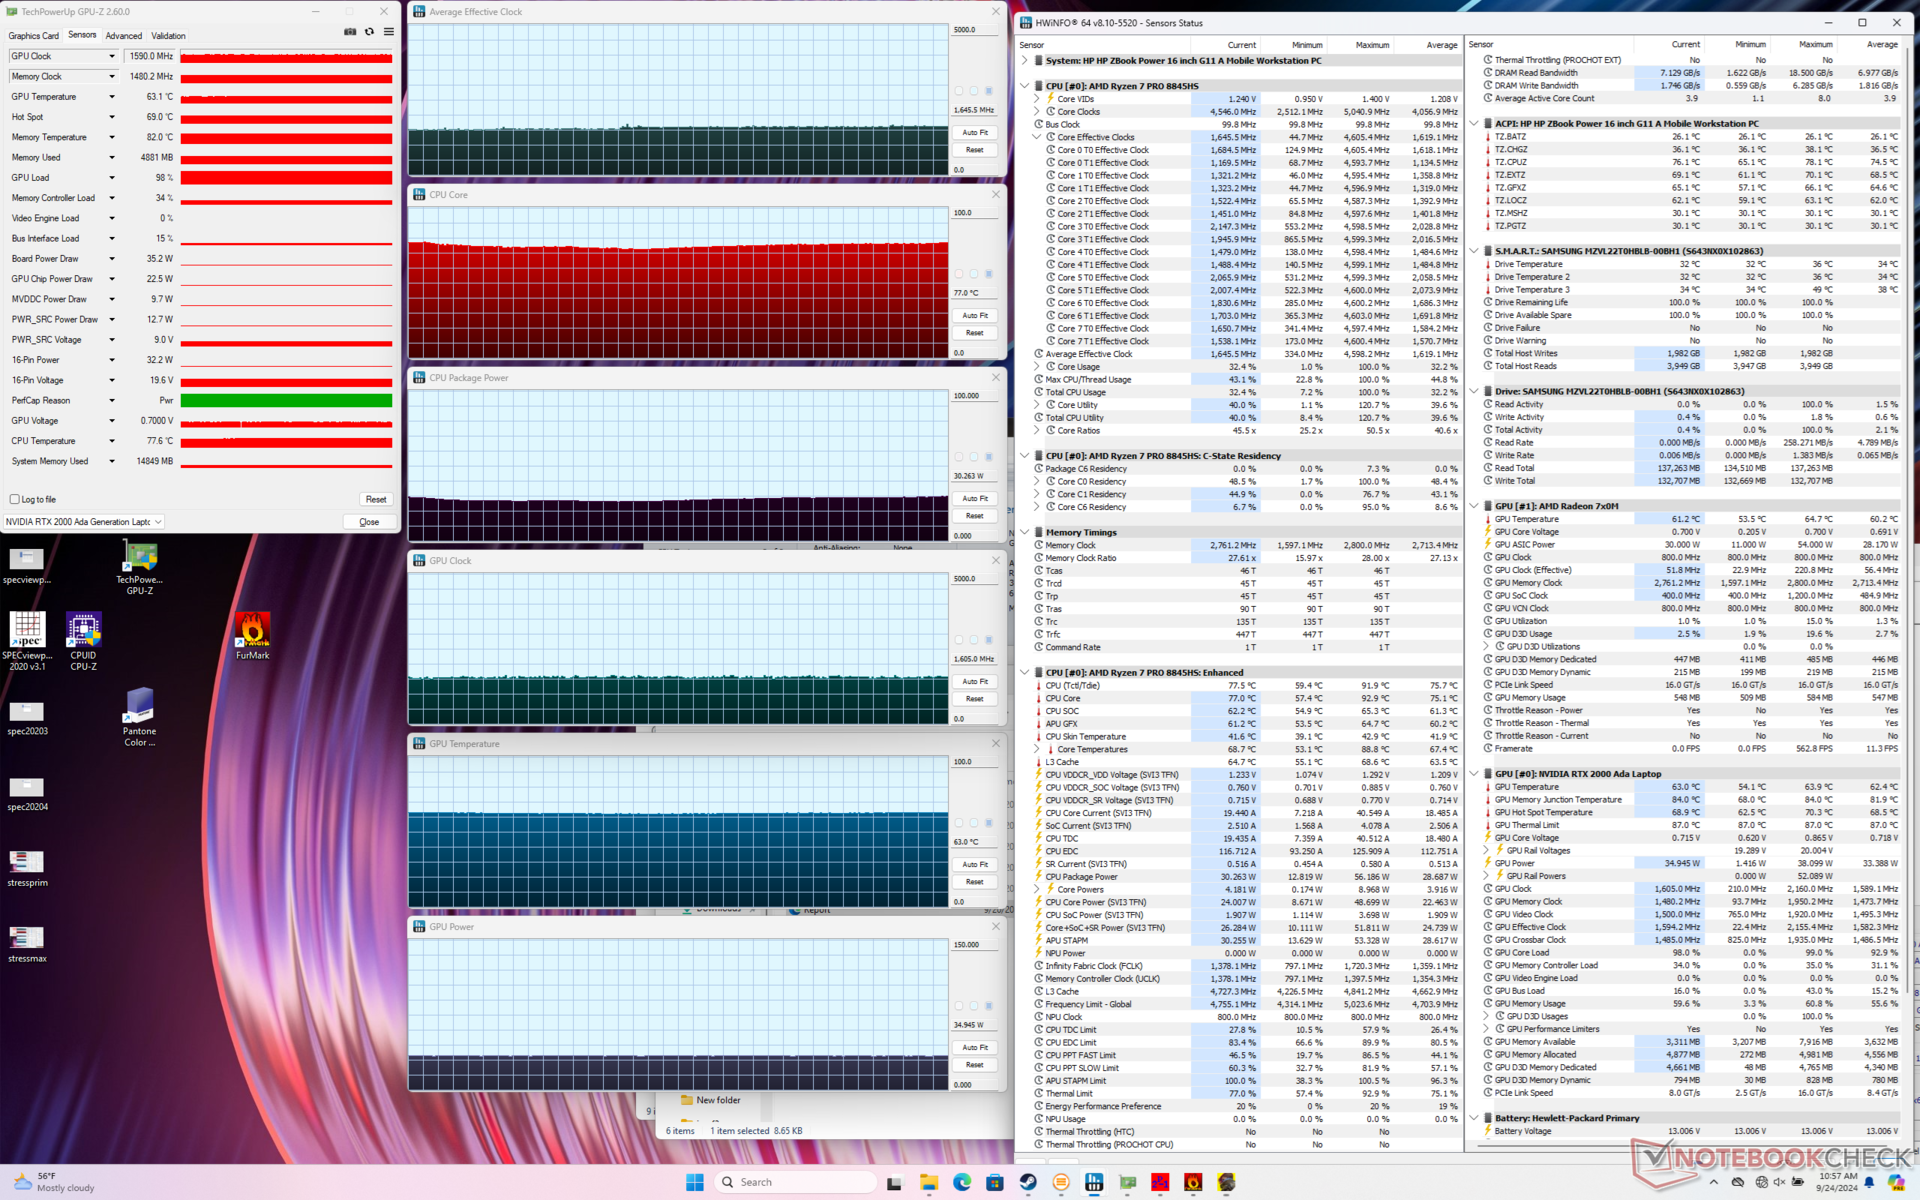
| Durchschnittlicher CPU-Takt (GHz) | GPU-Takt (MHz) | Durchschnittliche CPU-Temperatur (°C) | Durchschnittliche GPU-Temperatur (°C) | |
| System im Leerlauf | -- | -- | 47 | 49 |
| Prime95 Stresstest | 3.9 | -- | 92 | 64 |
| Prime95 + FurMark Stresstest | 2.8 | 1320 | 66 | 65 |
| Cyberpunk 2077 Stresstest (Balanced-Modus) | 1.6 | 1425 | 74 | 62 |
| Cyberpunk 2077 Stresstest (Performance-Modus) | 1.7 | 1590 | 77 | 63 |
System Performance
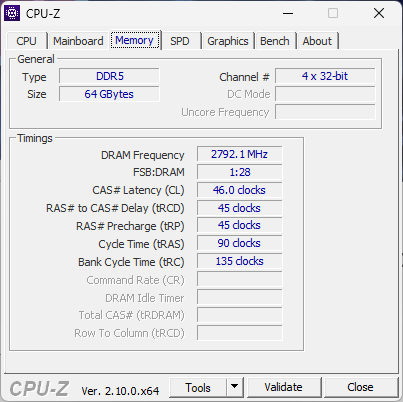
Die PCMark-Ergebnisse sind fast identisch mit denen, die wir mit dem ZBook Power 15 G10 aus dem letzten Jahr erzielt haben. Das bedeutet, dass herkömmliche alltägliche Aufgaben wie Surfen oder Bearbeiten auf unserem neueren Modell nicht spürbar schneller sind. Auch die RAM-Leistung hat sich nicht verbessert.
Wir hatten ein Problem beim Aufwachen aus dem Ruhezustand, bei dem ein hartes Herunterfahren erforderlich war, um zu Windows zurückzukehren. Das Problem konnten wir nicht zuverlässig reproduzieren, aber die Tatsache, dass es auf einer mobilen Workstation überhaupt auftritt, ist dennoch bemerkenswert.

CrossMark: Overall | Productivity | Creativity | Responsiveness
WebXPRT 3: Overall
WebXPRT 4: Overall
Mozilla Kraken 1.1: Total
| PCMark 10 / Score | |
| Dell Precision 5690 | |
| HP ZBook Fury 16 G11 | |
| HP ZBook Power 15 G10 | |
| HP ZBook Power 16 G11 A | |
| Durchschnittliche AMD Ryzen 7 8845HS, NVIDIA RTX 2000 Ada Generation Laptop (n=1) | |
| Lenovo ThinkPad P1 Gen 7 21KV001SGE | |
| Lenovo ThinkPad P16s G2 21K9000CGE | |
| PCMark 10 / Essentials | |
| Dell Precision 5690 | |
| HP ZBook Power 15 G10 | |
| HP ZBook Power 16 G11 A | |
| Durchschnittliche AMD Ryzen 7 8845HS, NVIDIA RTX 2000 Ada Generation Laptop (n=1) | |
| Lenovo ThinkPad P1 Gen 7 21KV001SGE | |
| Lenovo ThinkPad P16s G2 21K9000CGE | |
| HP ZBook Fury 16 G11 | |
| PCMark 10 / Productivity | |
| Dell Precision 5690 | |
| HP ZBook Power 15 G10 | |
| HP ZBook Power 16 G11 A | |
| Durchschnittliche AMD Ryzen 7 8845HS, NVIDIA RTX 2000 Ada Generation Laptop (n=1) | |
| HP ZBook Fury 16 G11 | |
| Lenovo ThinkPad P1 Gen 7 21KV001SGE | |
| Lenovo ThinkPad P16s G2 21K9000CGE | |
| PCMark 10 / Digital Content Creation | |
| HP ZBook Fury 16 G11 | |
| Dell Precision 5690 | |
| Lenovo ThinkPad P1 Gen 7 21KV001SGE | |
| HP ZBook Power 15 G10 | |
| HP ZBook Power 16 G11 A | |
| Durchschnittliche AMD Ryzen 7 8845HS, NVIDIA RTX 2000 Ada Generation Laptop (n=1) | |
| Lenovo ThinkPad P16s G2 21K9000CGE | |
| CrossMark / Overall | |
| HP ZBook Fury 16 G11 | |
| Dell Precision 5690 | |
| HP ZBook Power 16 G11 A | |
| Durchschnittliche AMD Ryzen 7 8845HS, NVIDIA RTX 2000 Ada Generation Laptop (n=1) | |
| Lenovo ThinkPad P1 Gen 7 21KV001SGE | |
| HP ZBook Power 15 G10 | |
| Lenovo ThinkPad P16s G2 21K9000CGE | |
| CrossMark / Productivity | |
| HP ZBook Fury 16 G11 | |
| Dell Precision 5690 | |
| HP ZBook Power 16 G11 A | |
| Durchschnittliche AMD Ryzen 7 8845HS, NVIDIA RTX 2000 Ada Generation Laptop (n=1) | |
| Lenovo ThinkPad P1 Gen 7 21KV001SGE | |
| HP ZBook Power 15 G10 | |
| Lenovo ThinkPad P16s G2 21K9000CGE | |
| CrossMark / Creativity | |
| HP ZBook Fury 16 G11 | |
| HP ZBook Power 16 G11 A | |
| Durchschnittliche AMD Ryzen 7 8845HS, NVIDIA RTX 2000 Ada Generation Laptop (n=1) | |
| Dell Precision 5690 | |
| Lenovo ThinkPad P1 Gen 7 21KV001SGE | |
| HP ZBook Power 15 G10 | |
| Lenovo ThinkPad P16s G2 21K9000CGE | |
| CrossMark / Responsiveness | |
| HP ZBook Fury 16 G11 | |
| Dell Precision 5690 | |
| HP ZBook Power 16 G11 A | |
| Durchschnittliche AMD Ryzen 7 8845HS, NVIDIA RTX 2000 Ada Generation Laptop (n=1) | |
| Lenovo ThinkPad P1 Gen 7 21KV001SGE | |
| Lenovo ThinkPad P16s G2 21K9000CGE | |
| HP ZBook Power 15 G10 | |
| WebXPRT 3 / Overall | |
| HP ZBook Fury 16 G11 | |
| HP ZBook Power 15 G10 | |
| HP ZBook Power 16 G11 A | |
| Durchschnittliche AMD Ryzen 7 8845HS, NVIDIA RTX 2000 Ada Generation Laptop (n=1) | |
| Dell Precision 5690 | |
| Lenovo ThinkPad P1 Gen 7 21KV001SGE | |
| Lenovo ThinkPad P16s G2 21K9000CGE | |
| WebXPRT 4 / Overall | |
| HP ZBook Fury 16 G11 | |
| Dell Precision 5690 | |
| Lenovo ThinkPad P1 Gen 7 21KV001SGE | |
| HP ZBook Power 16 G11 A | |
| Durchschnittliche AMD Ryzen 7 8845HS, NVIDIA RTX 2000 Ada Generation Laptop (n=1) | |
| HP ZBook Power 15 G10 | |
| Mozilla Kraken 1.1 / Total | |
| Lenovo ThinkPad P16s G2 21K9000CGE | |
| HP ZBook Power 15 G10 | |
| HP ZBook Power 16 G11 A | |
| Durchschnittliche AMD Ryzen 7 8845HS, NVIDIA RTX 2000 Ada Generation Laptop (n=1) | |
| Lenovo ThinkPad P1 Gen 7 21KV001SGE | |
| Dell Precision 5690 | |
| HP ZBook Fury 16 G11 | |
* ... kleinere Werte sind besser
| PCMark 10 Score | 7376 Punkte | |
Hilfe | ||
| AIDA64 / Memory Copy | |
| Dell Precision 5690 | |
| HP ZBook Power 15 G10 | |
| Durchschnittliche AMD Ryzen 7 8845HS (61459 - 71873, n=13) | |
| Lenovo ThinkPad P16s G2 21K9000CGE | |
| Lenovo ThinkPad P1 Gen 7 21KV001SGE | |
| HP ZBook Power 16 G11 A | |
| HP ZBook Fury 16 G11 | |
| AIDA64 / Memory Read | |
| Dell Precision 5690 | |
| Lenovo ThinkPad P1 Gen 7 21KV001SGE | |
| HP ZBook Power 15 G10 | |
| HP ZBook Power 16 G11 A | |
| HP ZBook Fury 16 G11 | |
| Durchschnittliche AMD Ryzen 7 8845HS (49866 - 61976, n=13) | |
| Lenovo ThinkPad P16s G2 21K9000CGE | |
| AIDA64 / Memory Write | |
| Lenovo ThinkPad P16s G2 21K9000CGE | |
| Durchschnittliche AMD Ryzen 7 8845HS (68425 - 93239, n=13) | |
| HP ZBook Power 15 G10 | |
| HP ZBook Power 16 G11 A | |
| Dell Precision 5690 | |
| Lenovo ThinkPad P1 Gen 7 21KV001SGE | |
| HP ZBook Fury 16 G11 | |
| AIDA64 / Memory Latency | |
| Dell Precision 5690 | |
| Lenovo ThinkPad P1 Gen 7 21KV001SGE | |
| Lenovo ThinkPad P16s G2 21K9000CGE | |
| HP ZBook Power 15 G10 | |
| HP ZBook Power 16 G11 A | |
| Durchschnittliche AMD Ryzen 7 8845HS (82.5 - 117, n=13) | |
| HP ZBook Fury 16 G11 | |
* ... kleinere Werte sind besser
DPC-Latenzen
LatencyMon zeigt DPC-Probleme im Zusammenhang mit HDAudBus.sys, auch nach mehreren Wiederholungstests. Abgesehen davon ist die 4K-Videowiedergabe bei 60 FPS hervorragend. Während eines 60-Sekunden-Fensters wurde nur ein einziger Bildausfall verzeichnet.
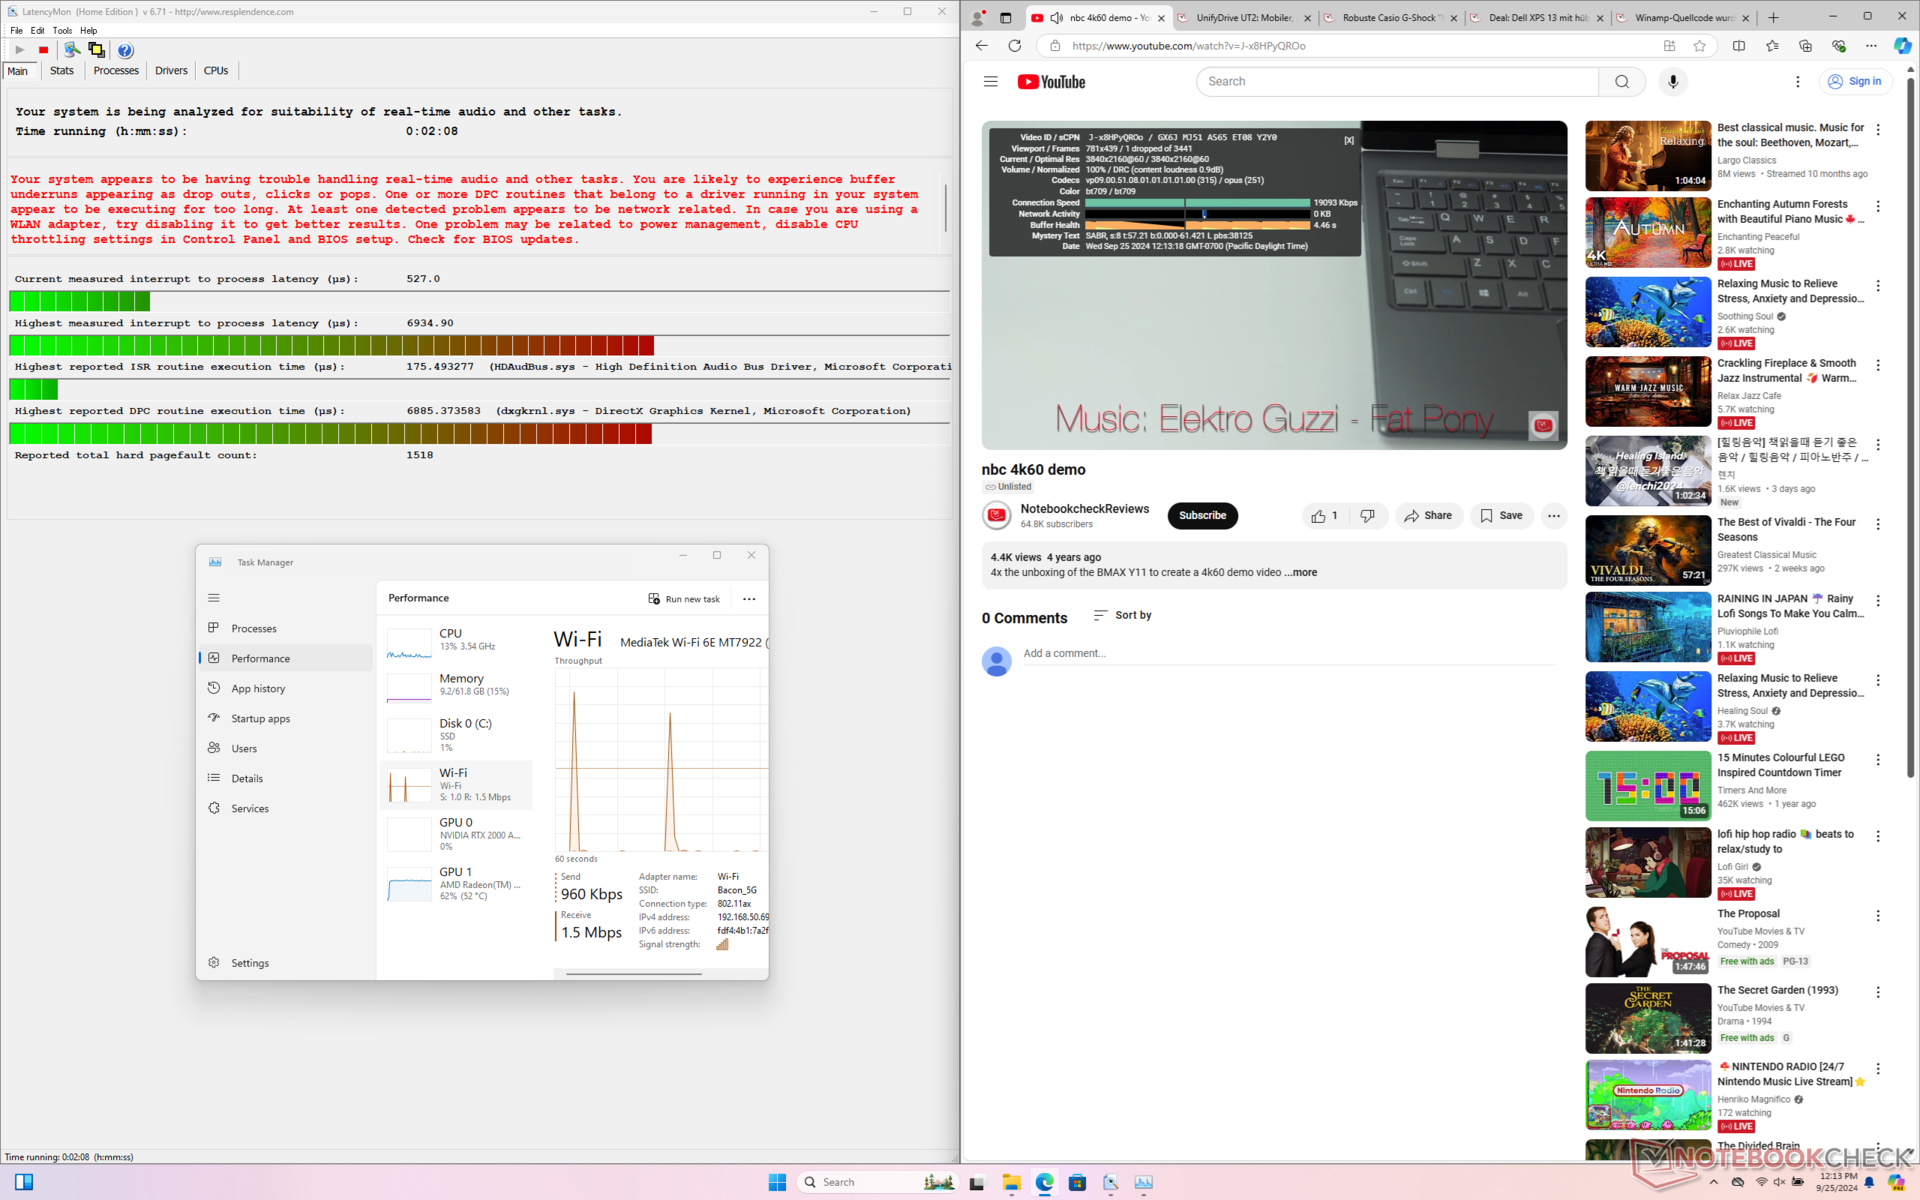
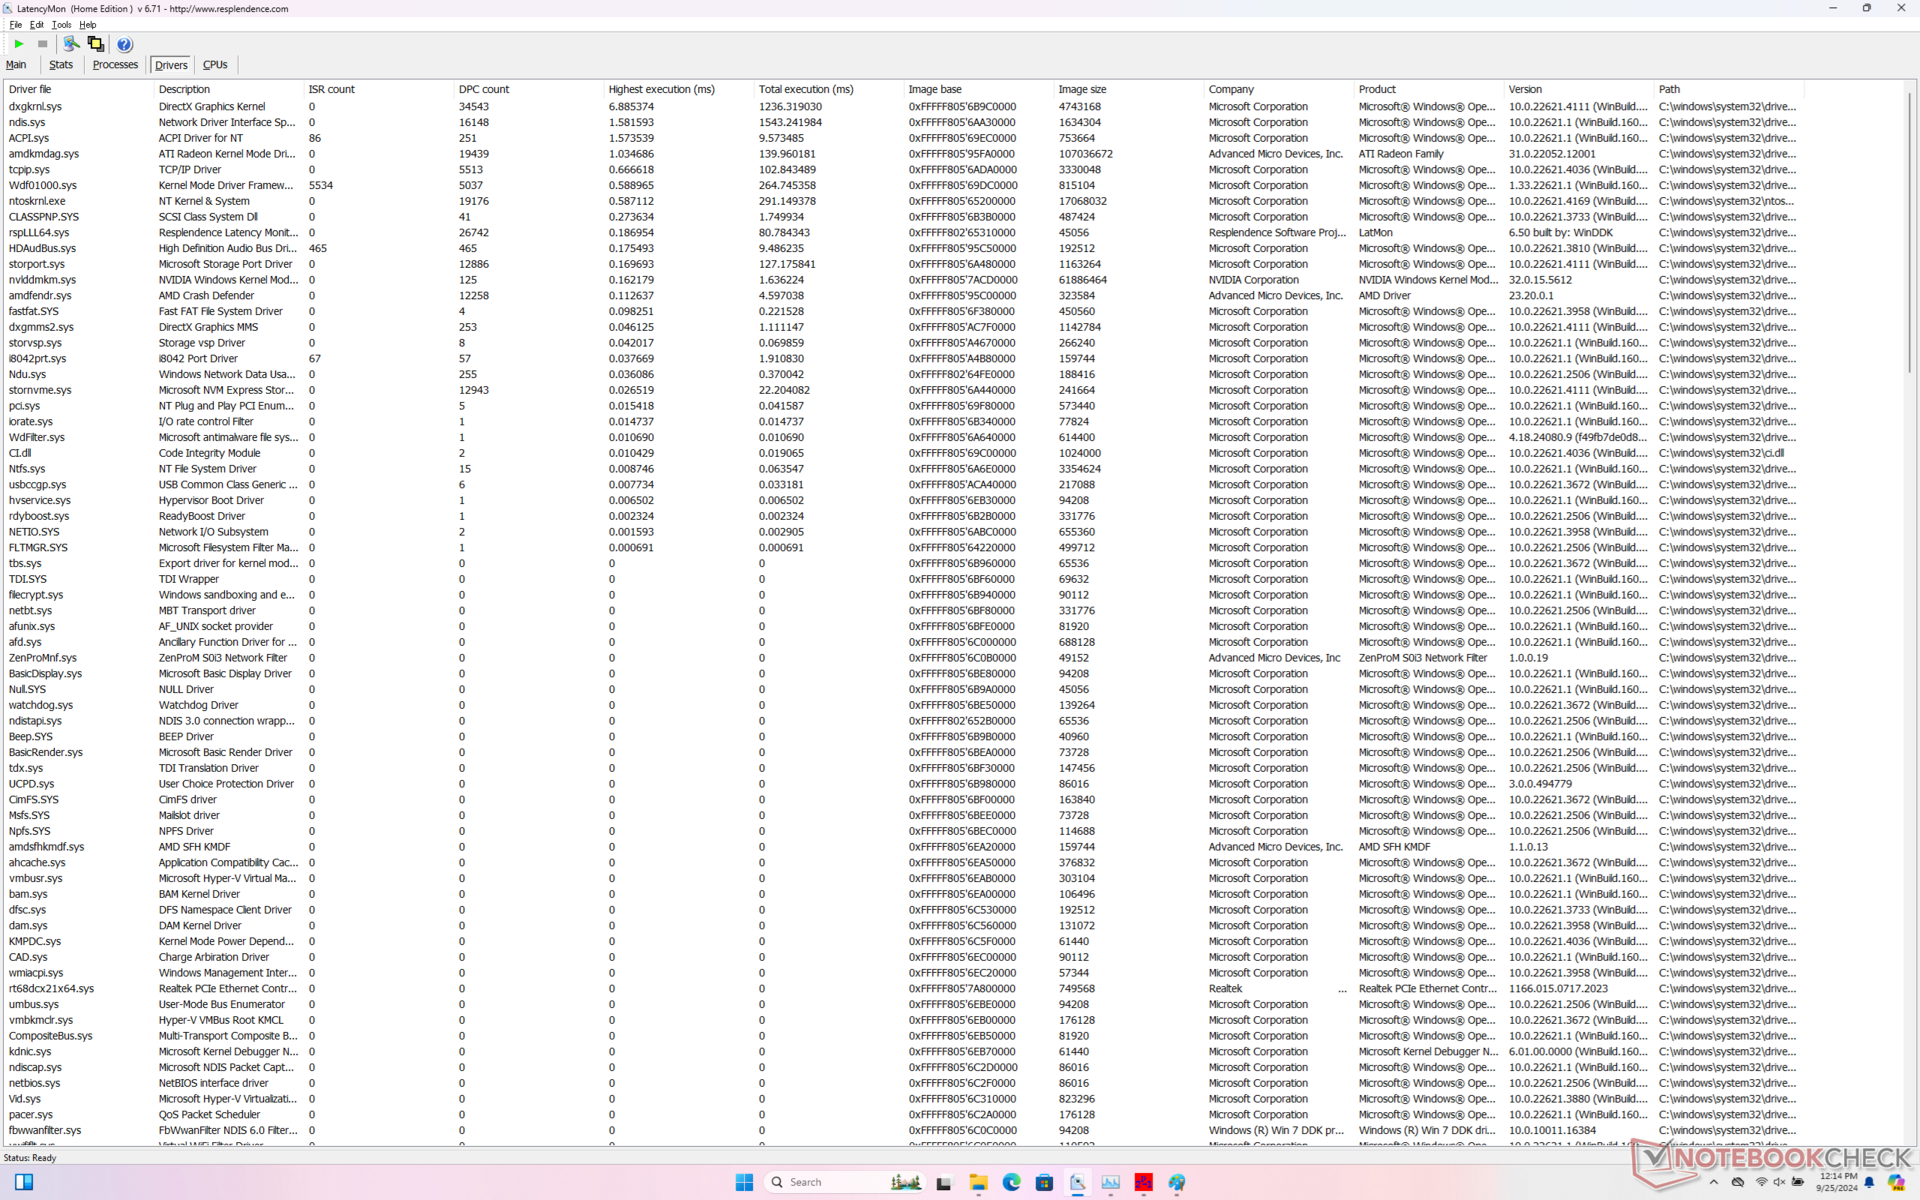
| DPC Latencies / LatencyMon - interrupt to process latency (max), Web, Youtube, Prime95 | |
| HP ZBook Fury 16 G11 | |
| HP ZBook Power 16 G11 A | |
| HP ZBook Power 15 G10 | |
| Lenovo ThinkPad P1 Gen 7 21KV001SGE | |
| Lenovo ThinkPad P16s G2 21K9000CGE | |
| Dell Precision 5690 | |
* ... kleinere Werte sind besser
Massenspeicher
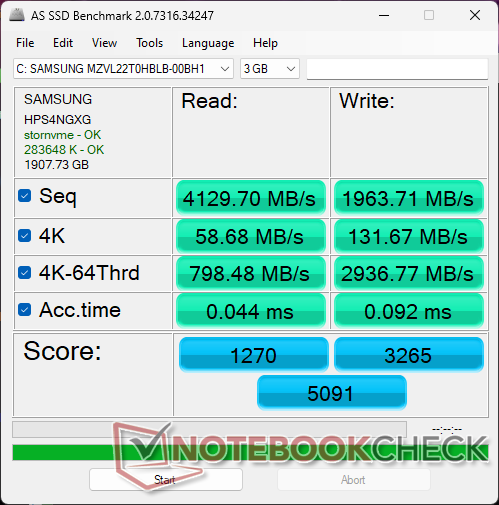
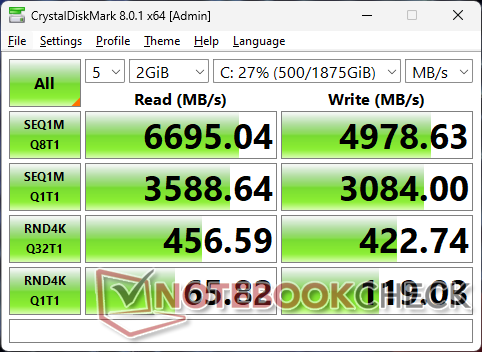
Unser Testgerät wurde mit einer 2 TB Samsung PM9A1 PCIe4 x4 NVMe SSD ausgestattet, die sequenzielle Leseraten von bis zu 6700 MB/s bietet. Leider fiel die Geschwindigkeit des Laufwerks nach nur wenigen Minuten Belastung schnell auf niedrige 2000 MB/s, wie unsere DiskSpd-Schleifentest-Ergebnisse zeigen. Wir wiederholten den Test, doch die Ergebnisse verbesserten sich nicht. Dies ist enttäuschend, da das WD-Laufwerk im älteren ZBook Power 15 G10 keine Drosselungsprobleme aufwies. Ein Heatspreader hätte die Leistung wahrscheinlich verbessert.

| Drive Performance Rating - Percent | |
| HP ZBook Fury 16 G11 | |
| Dell Precision 5690 | |
| Lenovo ThinkPad P16s G2 21K9000CGE | |
| HP ZBook Power 15 G10 | |
| HP ZBook Power 16 G11 A | |
| Lenovo ThinkPad P1 Gen 7 21KV001SGE | |
* ... kleinere Werte sind besser
Dauerleistung Lesen: DiskSpd Read Loop, Queue Depth 8
GPU Performance
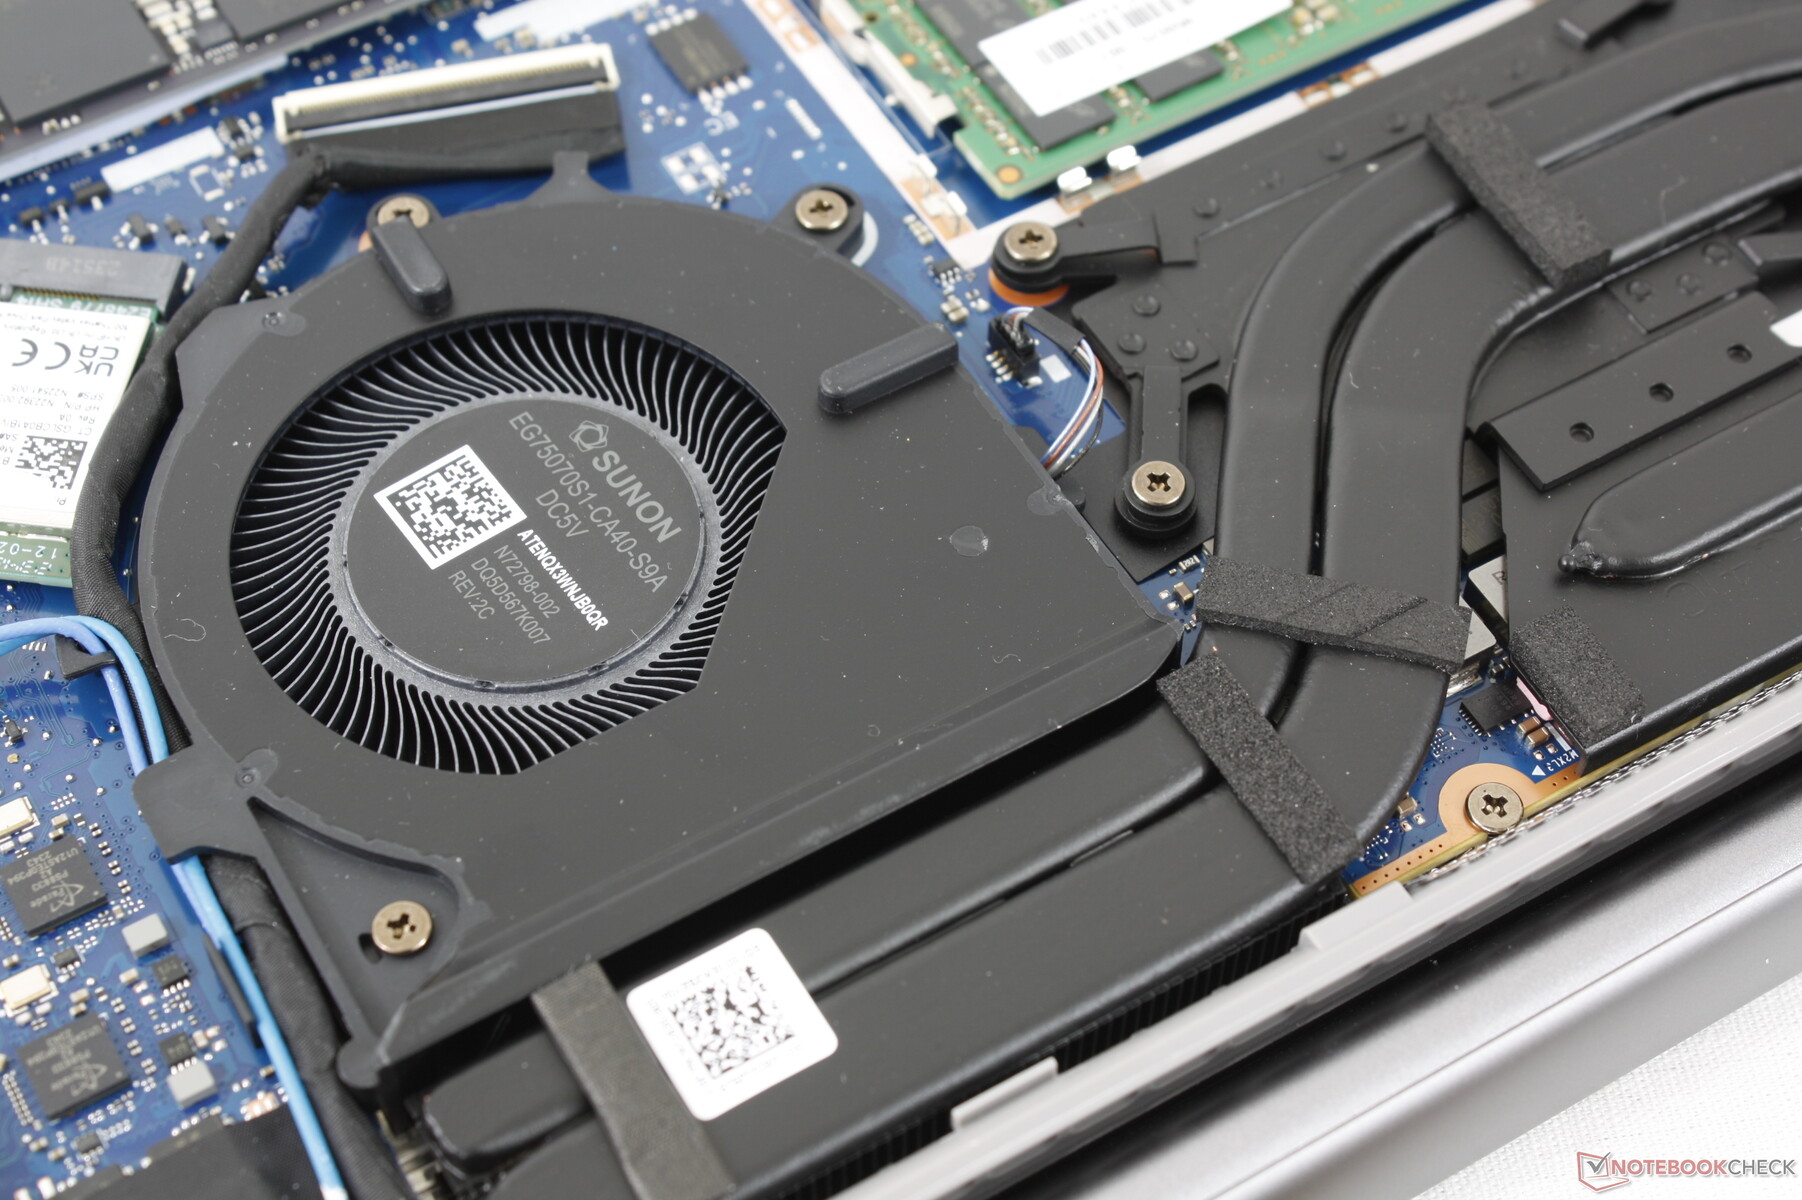
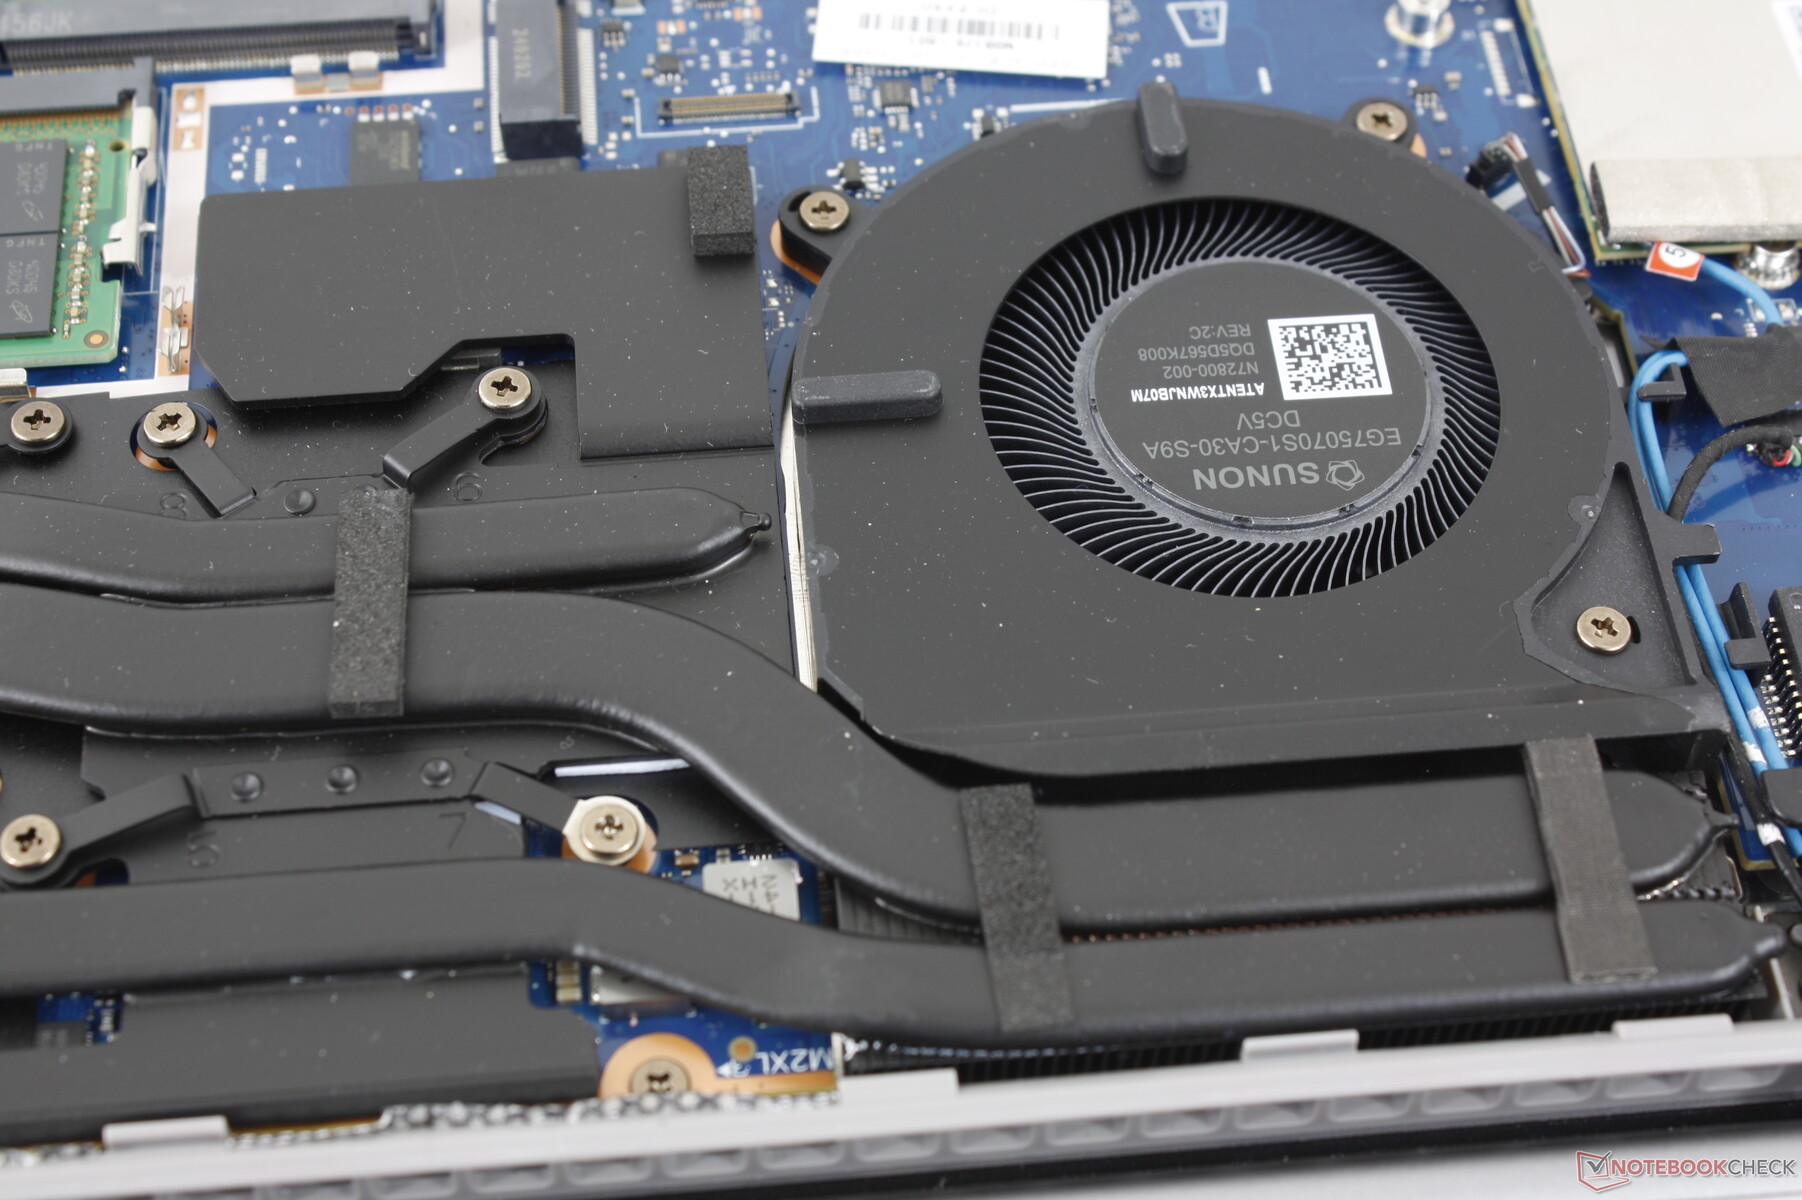
Die Optionen für diskrete GPUs sind identisch mit denen des 15-Zoll-ZBook Power 15 G10, da Nvidia noch keinen Nachfolger für die mobile Ada Lovelace-Serie vorgestellt hat. Zudem hat sich die Kühllösung beim Wechsel zum 16-Zoll-Formfaktor nicht wesentlich verbessert, was bedeutet, dass das ZBook Power 16 G11 weiterhin auf die gleiche 50-W-TGP-Obergrenze und die Grafikoptionen RTX 1000 Ada, RTX 2000 Ada und RTX 3000 Ada beschränkt ist wie zuvor. Nutzer, die höhere RTX Ada-Optionen benötigen, sollten die dickere ZBook Fury 16-Serie in Betracht ziehen.
Ein Upgrade auf die RTX 3000 Ada bringt bestenfalls marginale Leistungssteigerungen, basierend auf unseren Erfahrungen mit dem Dell Precision 5490.
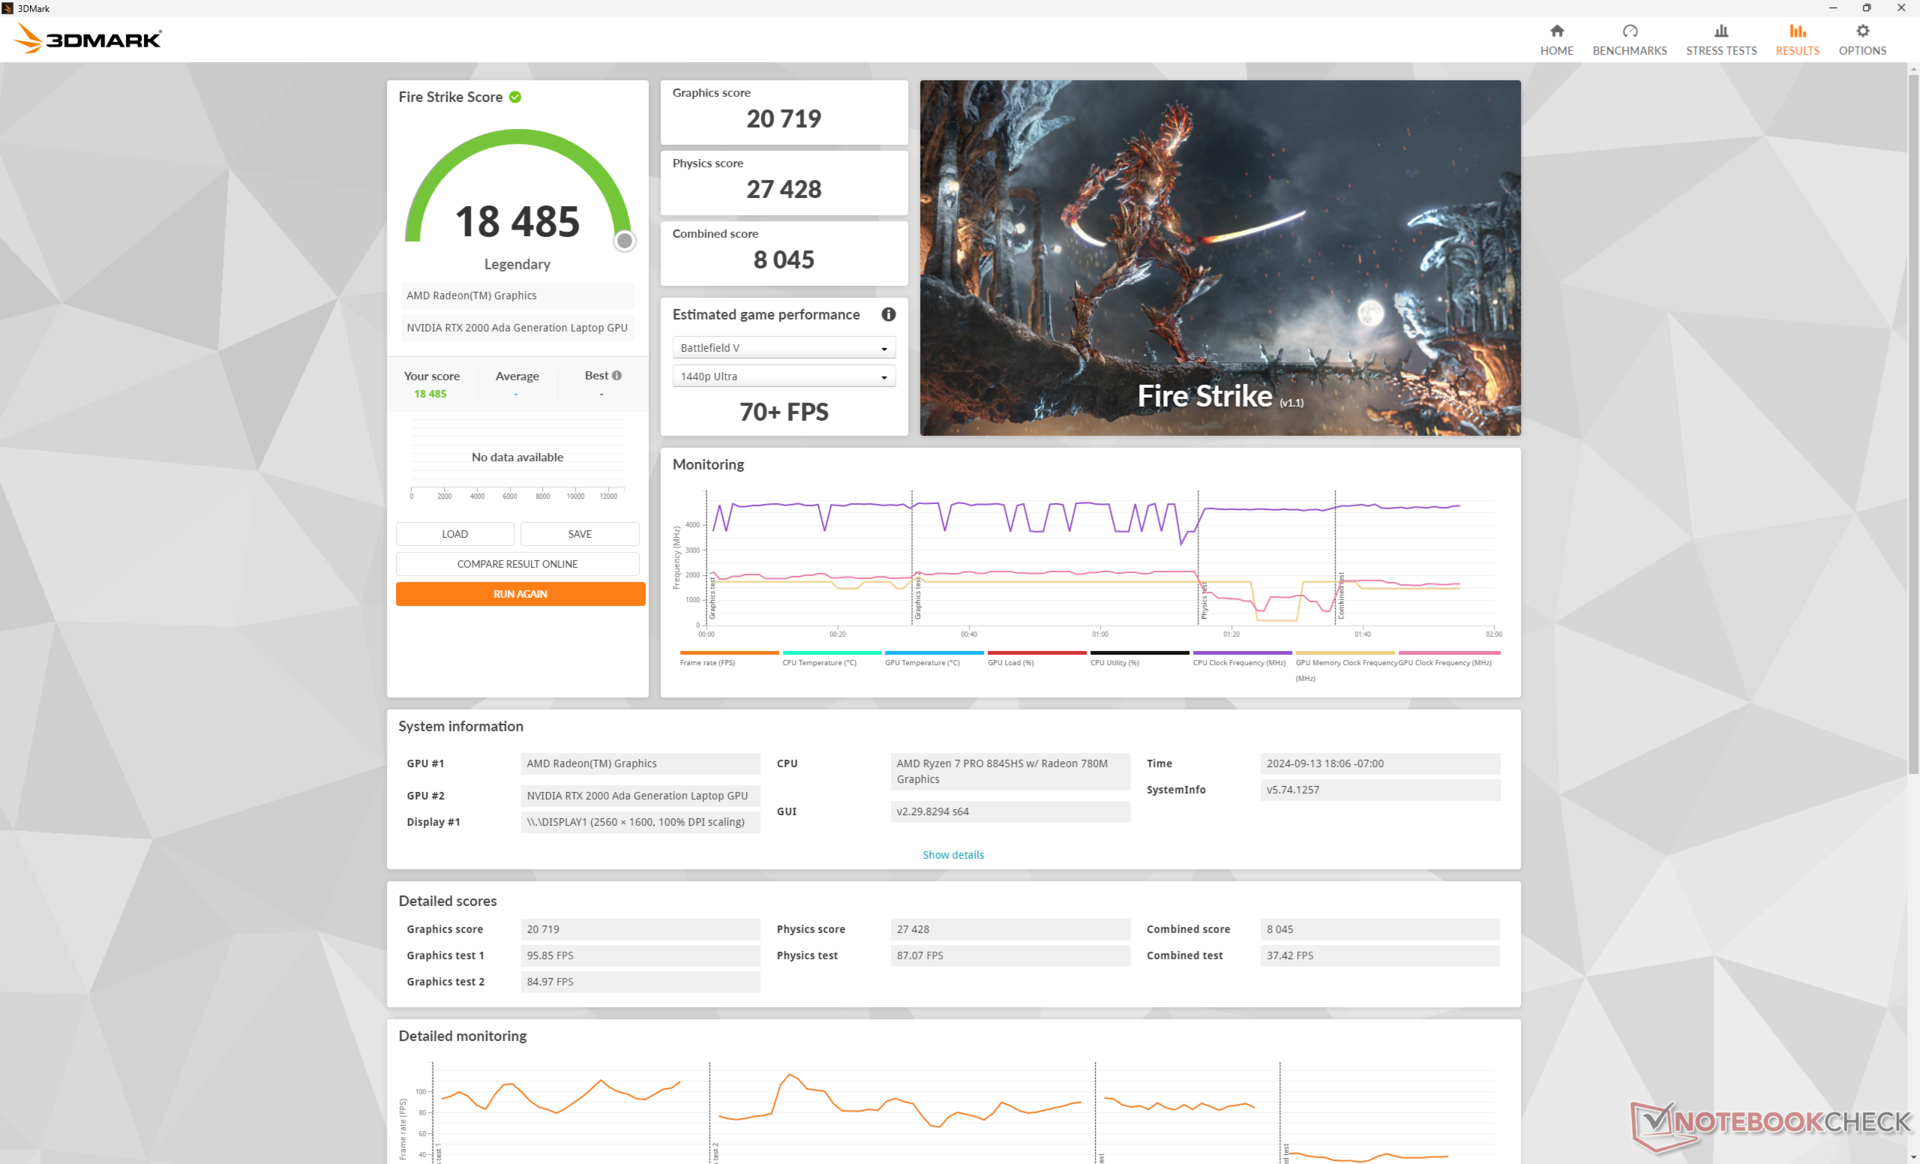
| Energieprofile | Grafikleistung | CPU-Leistung | Gesamtwert |
| Performance-Modus | 20719 | 27428 | 8045 |
| Balanced-Modus | 19961 (-4%) | 26363 (-4%) | 7633 (-5%) |
| Battery Power | 8108 (-61%) | 6149 (-78%) | 1727 (-79%) |
Die Verwendung des Balanced-Modus anstelle des Performance-Modus hat nur einen geringen Einfluss auf die Leistung, wie die obige Tabelle der Fire-Strike-Ergebnisse zeigt. Allerdings sind sowohl die CPU- als auch die GPU-Leistung in Battery Power deutlich reduziert.
| 3DMark Performance Rating - Percent | |
| Dell Precision 5690 -3! | |
| HP ZBook Fury 16 G11 | |
| HP ZBook Fury 16 G9 -3! | |
| HP ZBook Power 16 G11 A | |
| Durchschnittliche NVIDIA RTX 2000 Ada Generation Laptop | |
| Dell Precision 5000 5490 -3! | |
| MSI CreatorPro Z16P B12UKST -19! | |
| HP ZBook Power 15 G10 -11! | |
| Asus ExpertBook B6 Flip B6602FC2 -19! | |
| Lenovo ThinkPad P16v G1 AMD -18! | |
| Lenovo ThinkPad P1 G4-20Y4Z9DVUS -19! | |
| Lenovo ThinkPad P16s G2 21K9000CGE -19! | |
| HP ZBook Firefly 16 G9-6B897EA -19! | |
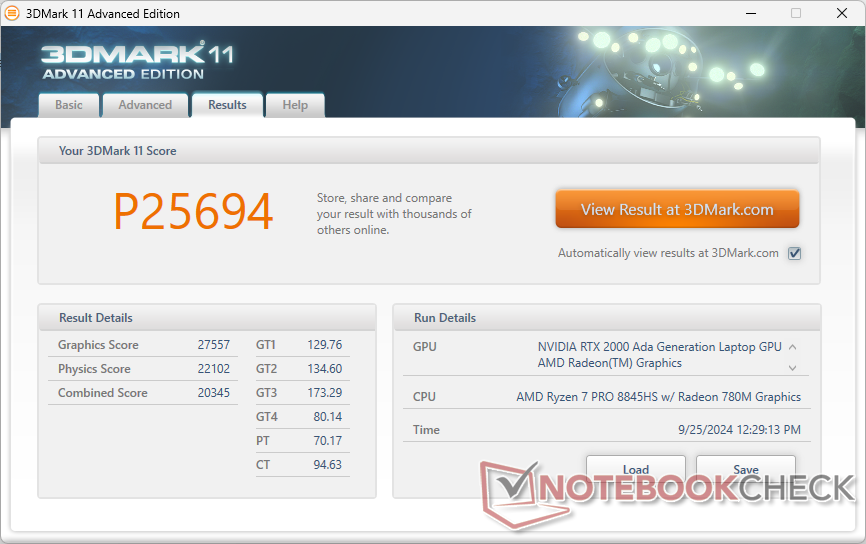
| 3DMark 11 Performance | 25694 Punkte | |
| 3DMark Cloud Gate Standard Score | 51846 Punkte | |
| 3DMark Fire Strike Score | 18485 Punkte | |
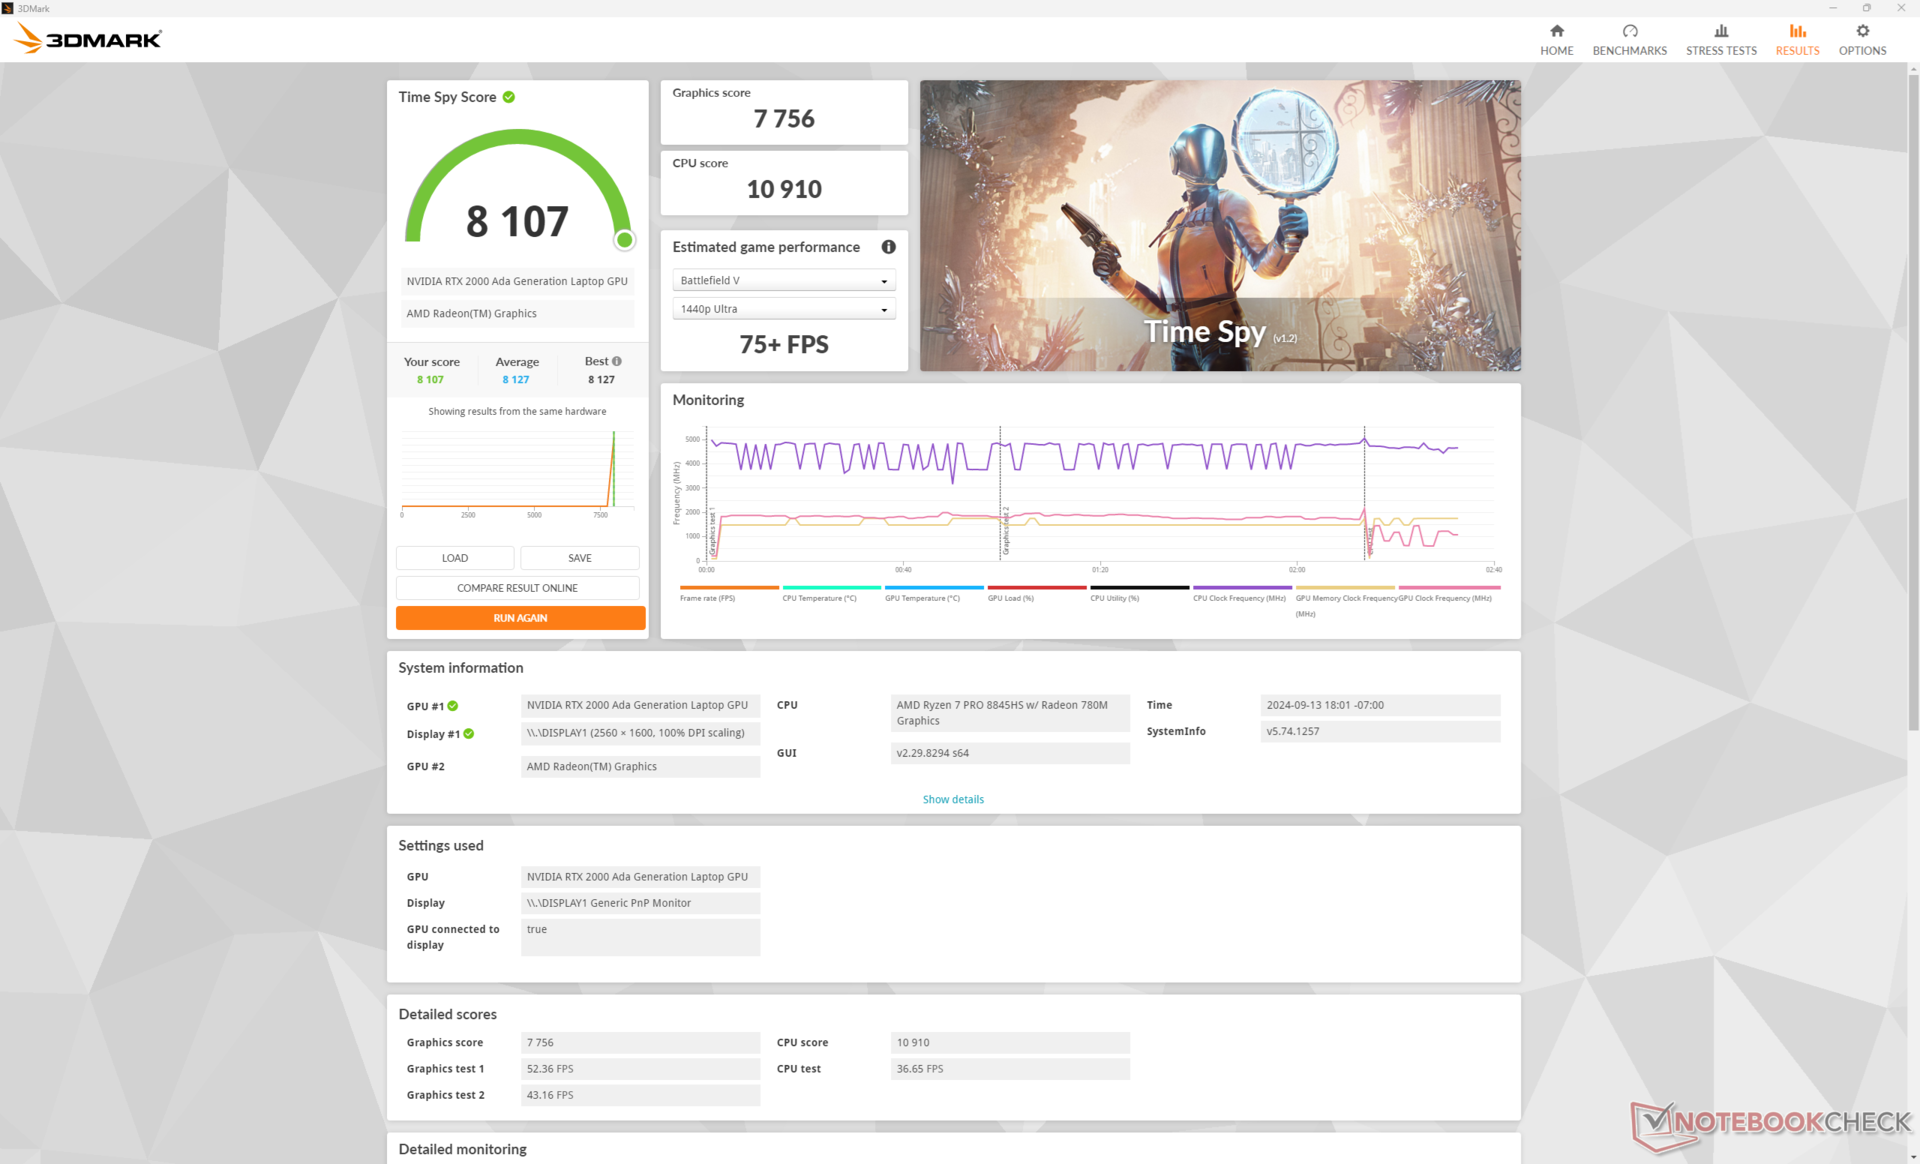
| 3DMark Time Spy Score | 8107 Punkte | |
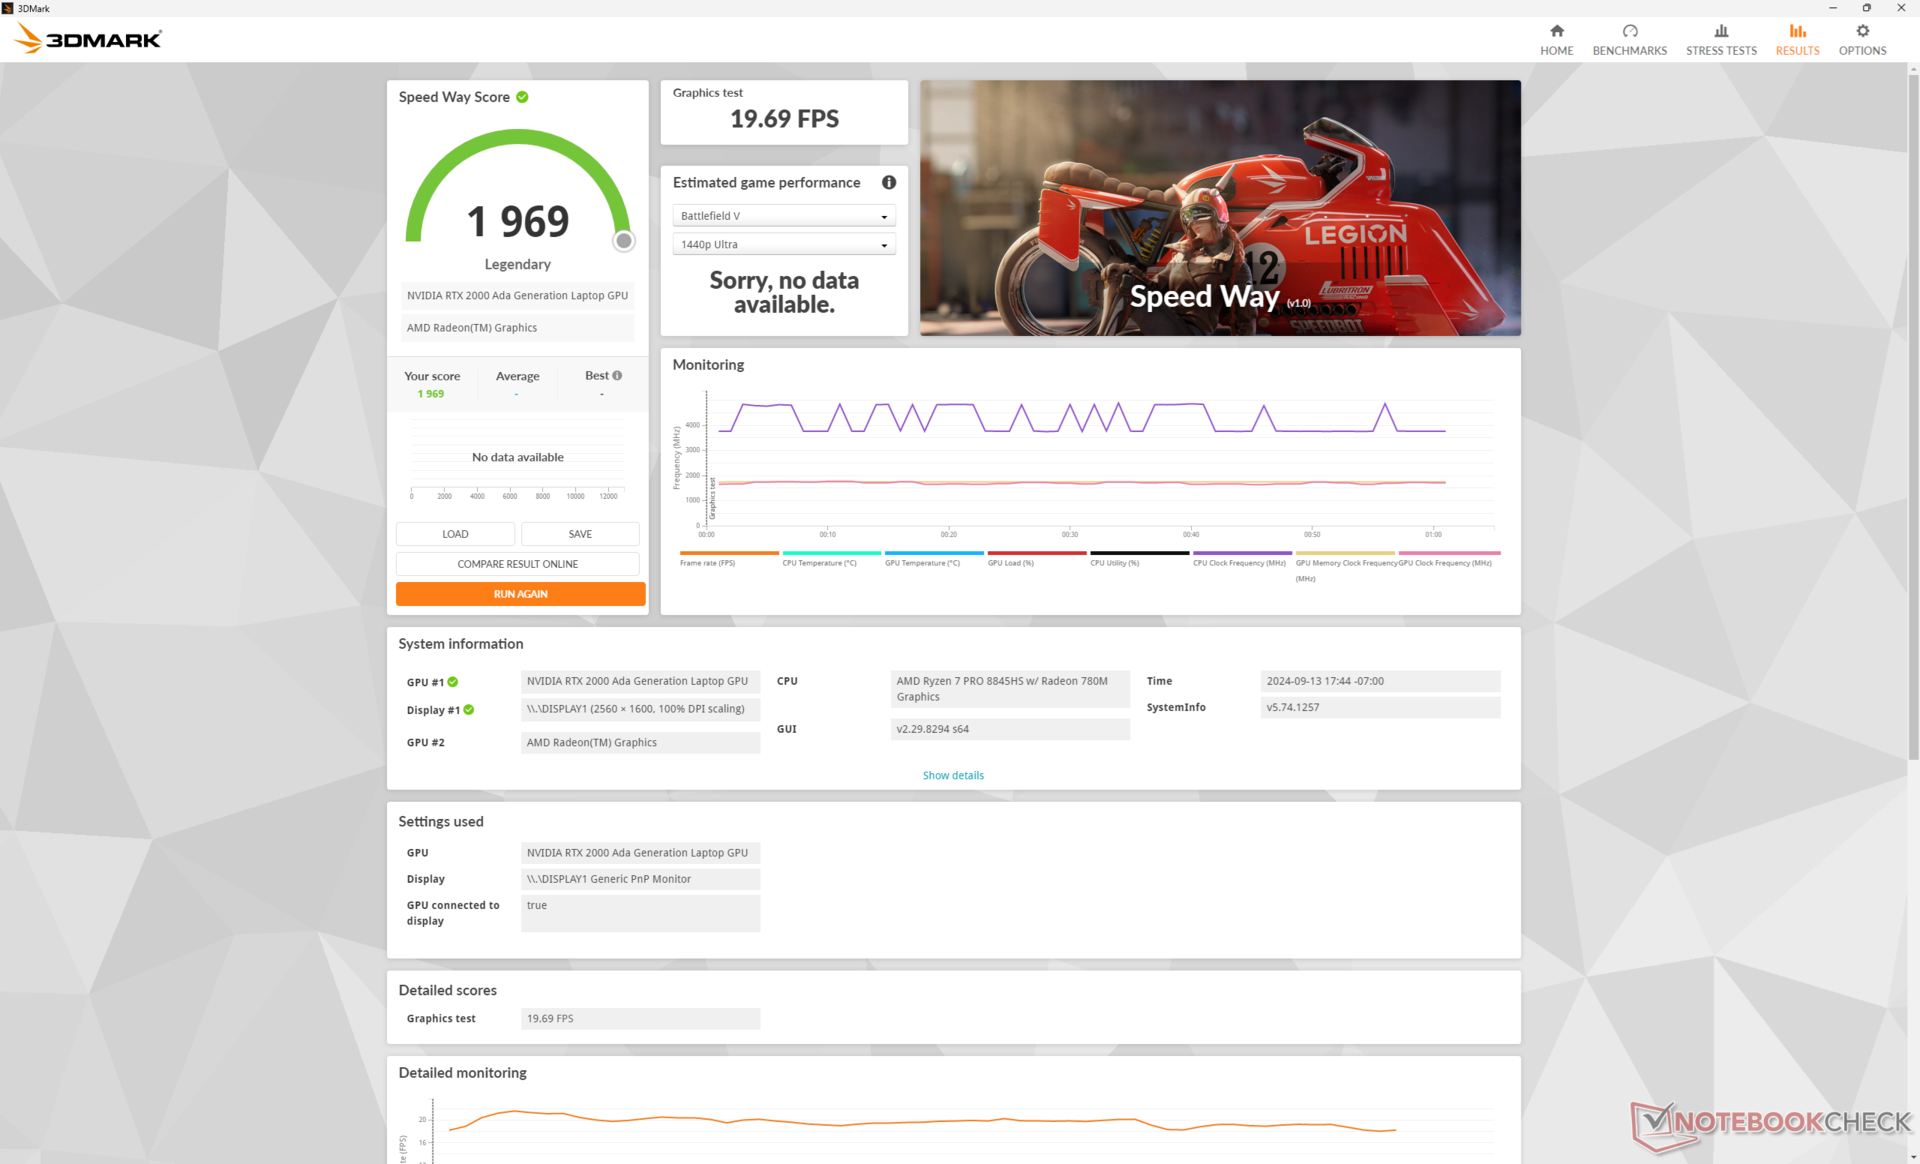
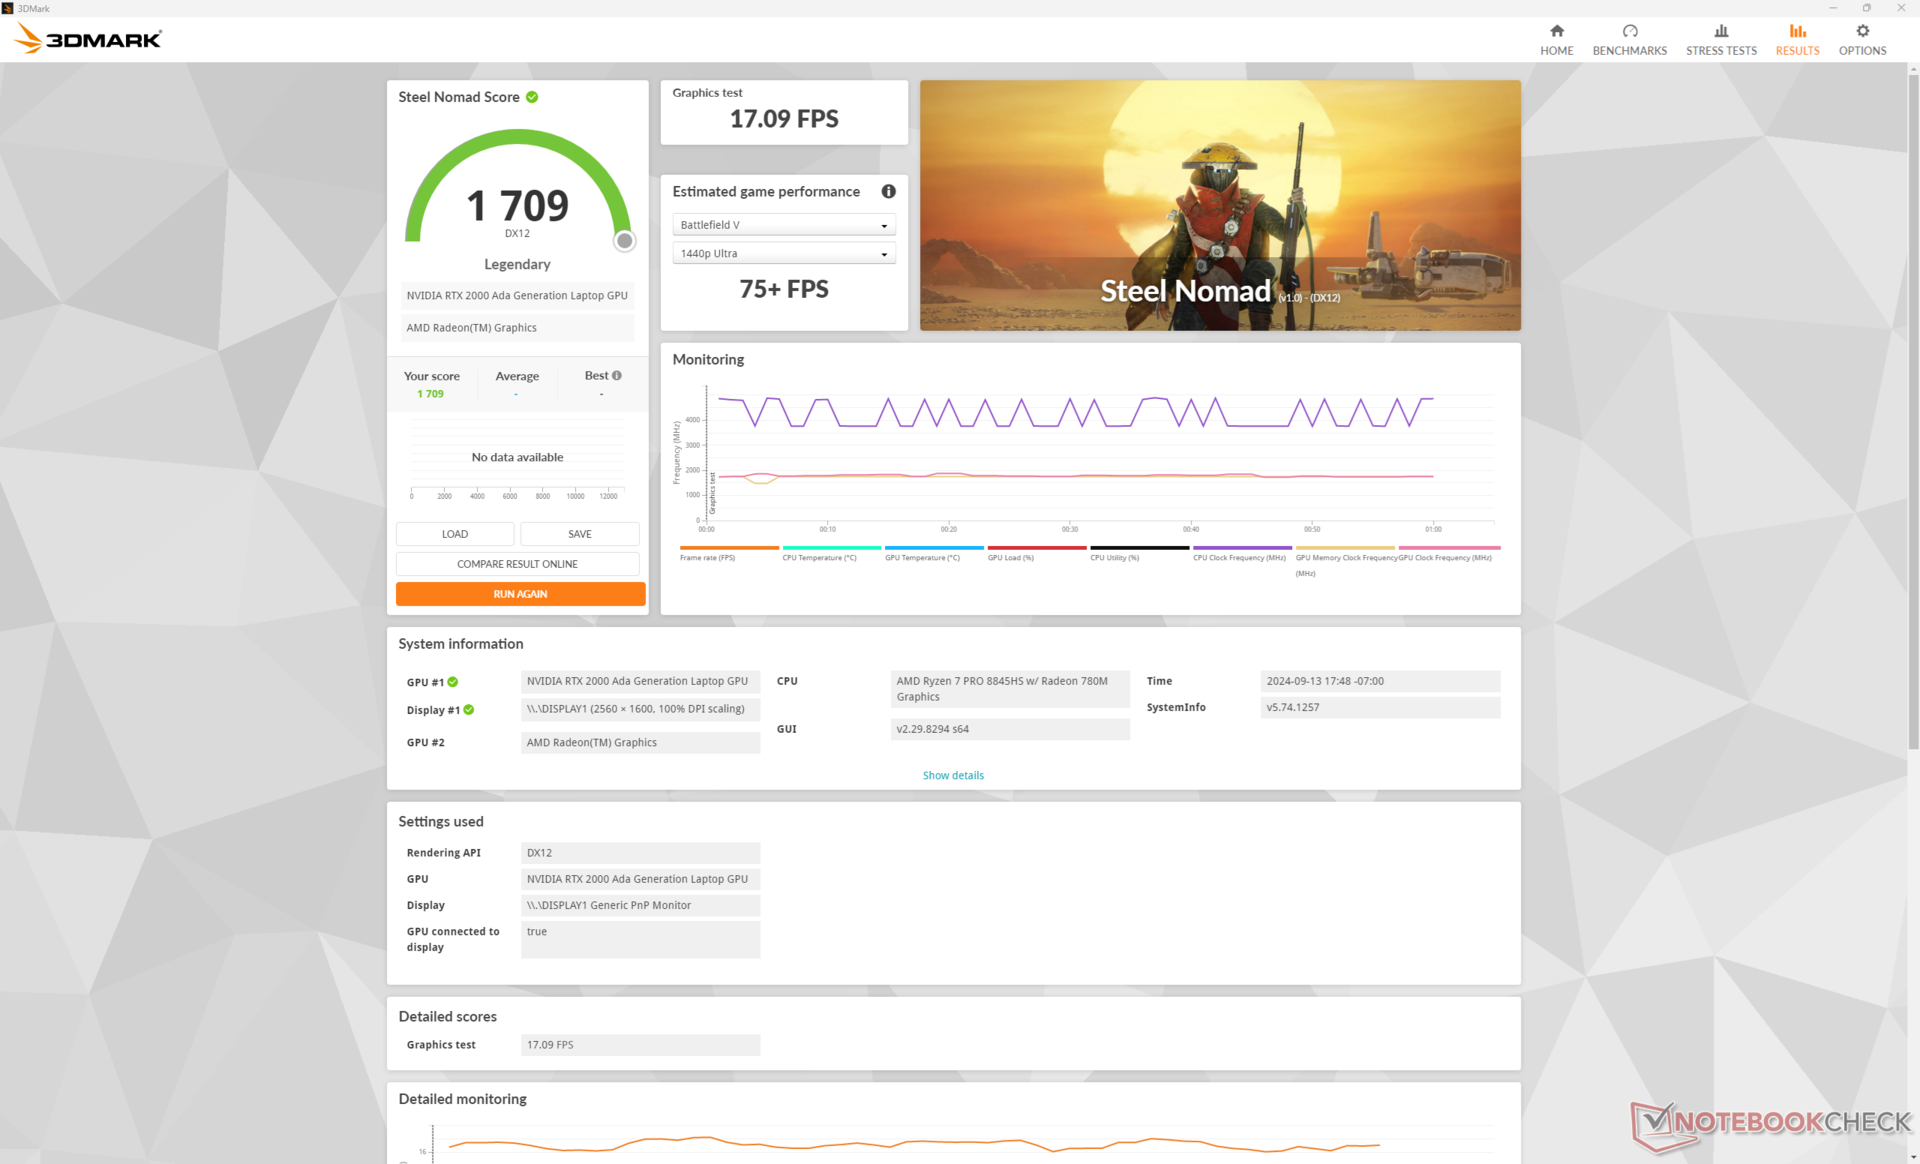
| 3DMark Steel Nomad Score | 1709 Punkte | |
Hilfe | ||
* ... kleinere Werte sind besser
Gaming Performance
Obwohl die RTX 2000 Ada nicht speziell für Spiele optimiert ist, ähnelt sie am meisten Laptops, die mit der GeForce RTX 3060 oder RTX 4060 ausgestattet sind.
| Baldur's Gate 3 | |
| 1920x1080 High Preset AA:T | |
| Dell Precision 5690 | |
| HP ZBook Fury 16 G11 | |
| Dell Precision 5000 5490 | |
| HP ZBook Power 16 G11 A | |
| Durchschnittliche NVIDIA RTX 2000 Ada Generation Laptop (n=1) | |
| 1920x1080 Ultra Preset AA:T | |
| Dell Precision 5690 | |
| HP ZBook Fury 16 G11 | |
| Dell Precision 5000 5490 | |
| HP ZBook Power 16 G11 A | |
| Durchschnittliche NVIDIA RTX 2000 Ada Generation Laptop (n=1) | |
| 2560x1440 Ultra Preset AA:T | |
| Dell Precision 5690 | |
| HP ZBook Fury 16 G11 | |
| HP ZBook Power 16 G11 A | |
| Durchschnittliche NVIDIA RTX 2000 Ada Generation Laptop (n=1) | |
Cyberpunk 2077 Ultra FPS-Diagramm
| min. | mittel | hoch | max. | QHD | |
|---|---|---|---|---|---|
| GTA V (2015) | 180.6 | 162.7 | 90.3 | 63.4 | |
| Dota 2 Reborn (2015) | 145.2 | 142 | 126.1 | 119.9 | |
| Final Fantasy XV Benchmark (2018) | 166.1 | 89.3 | 66.3 | 49.4 | |
| X-Plane 11.11 (2018) | 83.2 | 72.1 | 60.6 | ||
| Far Cry 5 (2018) | 138 | 111 | 104 | 98 | 67 |
| Strange Brigade (2018) | 329 | 187.8 | 158.1 | 138.5 | 99.5 |
| Tiny Tina's Wonderlands (2022) | 139.1 | 115.1 | 80 | 64.4 | 46.3 |
| F1 22 (2022) | 186.6 | 171.1 | 129.1 | 46.2 | 29.8 |
| Baldur's Gate 3 (2023) | 87.1 | 75.7 | 67.6 | 66.1 | 45.6 |
| Cyberpunk 2077 (2023) | 81.1 | 61.4 | 51.7 | 44.8 | 29.7 |
Emissionen
Geräuschemissionen
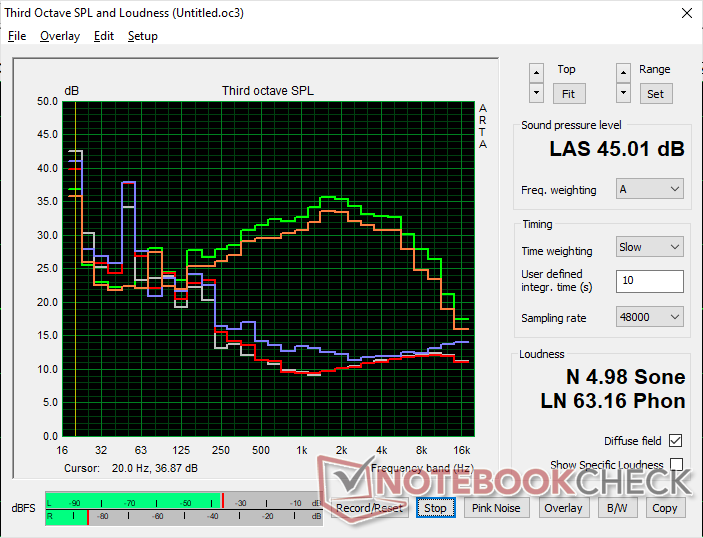
Die Lüftergeräusche und das Verhalten sind ähnlich wie bei dem letztjährigen Modell. Selbst nach der ersten Benchmark-Szene des 3DMark 06 bleibt das System mit nur 25,4 dB(A) leise, was deutlich ruhiger ist als Konkurrenzmodelle wie das ThinkPad P16s G2 oder das Precision 5690 unter ähnlichen Bedingungen.
Beachten Sie, dass die Lüftergeräusche im Balanced-Modus deutlich leiser sind; Cyberpunk 2077 kann im Performance-Modus bis zu 43 dB(A) laut sein, während es im Balanced-Modus nur 37,5 dB(A) erreicht.
Lautstärkediagramm
| Idle |
| 23.8 / 24.2 / 24.2 dB(A) |
| Last |
| 25.4 / 45 dB(A) |
 | ||
30 dB leise 40 dB(A) deutlich hörbar 50 dB(A) störend |
||
min: | ||
| HP ZBook Power 16 G11 A RTX 2000 Ada Generation Laptop, R7 8845HS, Samsung PM9A1 MZVL22T0HBLB | HP ZBook Power 15 G10 RTX 2000 Ada Generation Laptop, R7 PRO 7840HS, WDC PC SN810 2TB | HP ZBook Fury 16 G11 RTX 3500 Ada Generation Laptop, i9-14900HX, SK hynix PC801 HFS001TEJ9X101N | Lenovo ThinkPad P1 Gen 7 21KV001SGE GeForce RTX 4060 Laptop GPU, Ultra 7 155H, Kioxia XG8 KXG8AZNV1T02 | Lenovo ThinkPad P16s G2 21K9000CGE Radeon 780M, R7 PRO 7840U, SK hynix PC801 HFS001TEJ9X162N | Dell Precision 5690 RTX 5000 Ada Generation Laptop, Ultra 9 185H, 2x Samsung PM9A1 1TB (RAID 0) | |
|---|---|---|---|---|---|---|
| Geräuschentwicklung | -3% | -15% | -18% | -3% | -17% | |
| aus / Umgebung * (dB) | 23.5 | 24.2 -3% | 23.2 1% | 24.7 -5% | 22.6 4% | 23.4 -0% |
| Idle min * (dB) | 23.8 | 24.4 -3% | 23.2 3% | 24.7 -4% | 22.6 5% | 23.6 1% |
| Idle avg * (dB) | 24.2 | 24.4 -1% | 23.2 4% | 24.7 -2% | 22.6 7% | 24.9 -3% |
| Idle max * (dB) | 24.2 | 24.4 -1% | 29.5 -22% | 24.7 -2% | 22.6 7% | 30.9 -28% |
| Last avg * (dB) | 25.4 | 27.4 -8% | 43 -69% | 43.7 -72% | 37.8 -49% | 40.4 -59% |
| Cyberpunk 2077 ultra * (dB) | 43 | 48.2 -12% | 53.2 -24% | |||
| Last max * (dB) | 45 | 46.8 -4% | 48.2 -7% | 53.3 -18% | 40.5 10% | 51.9 -15% |
| Witcher 3 ultra * (dB) | 43.3 | 40.3 | 48.3 |
* ... kleinere Werte sind besser
Temperatur
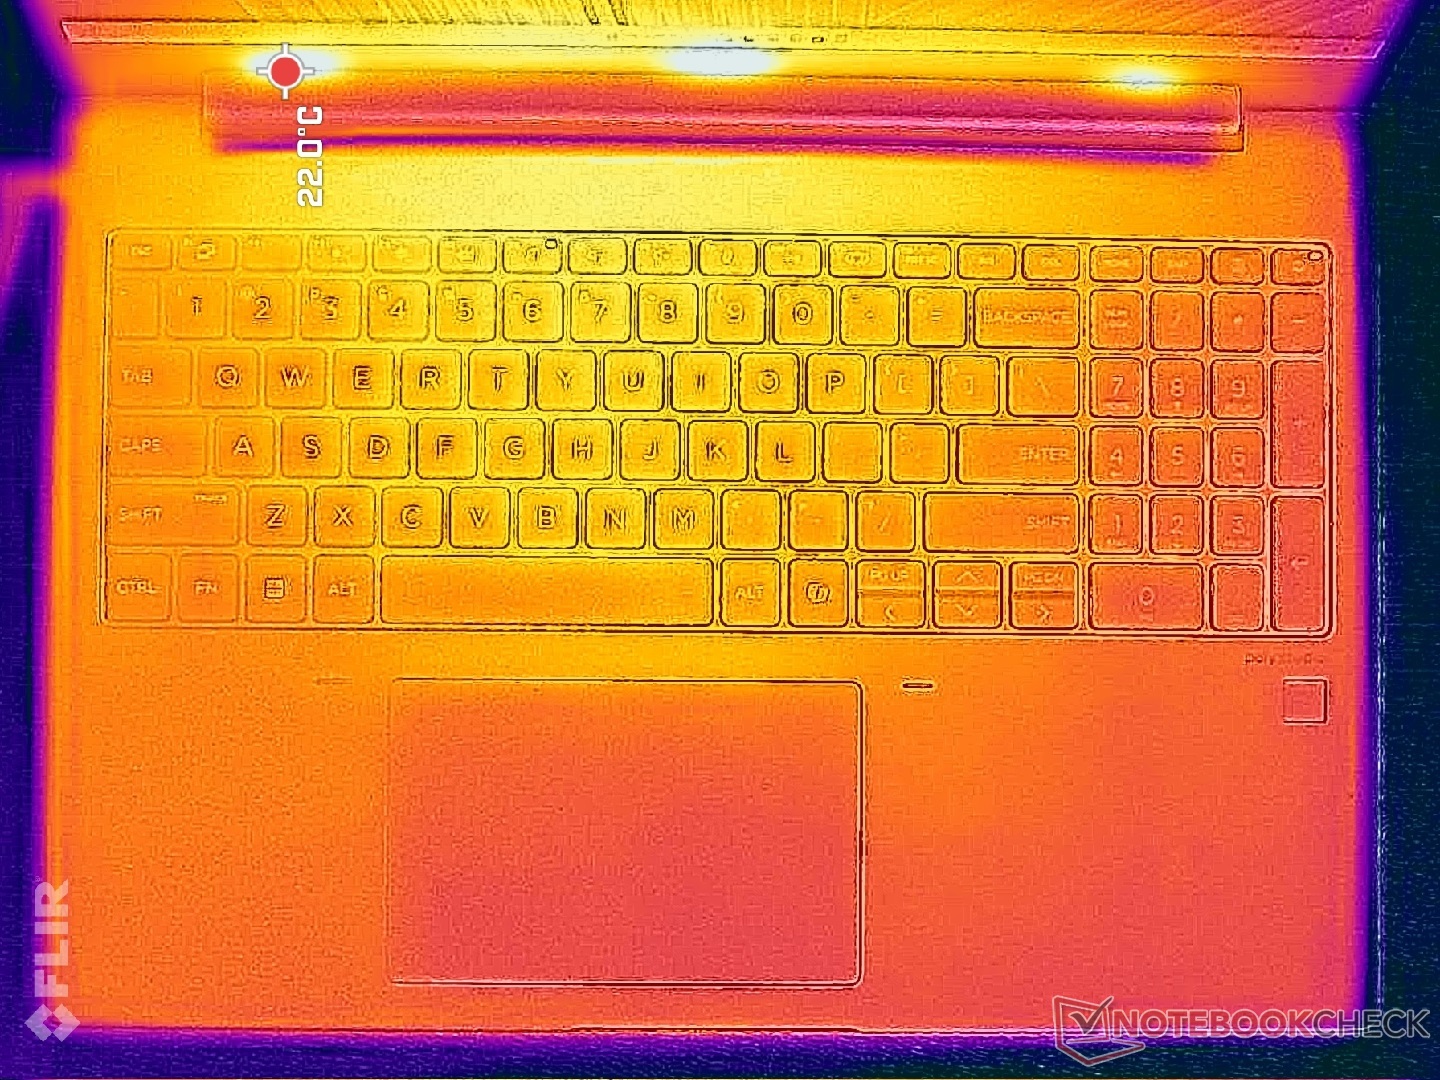
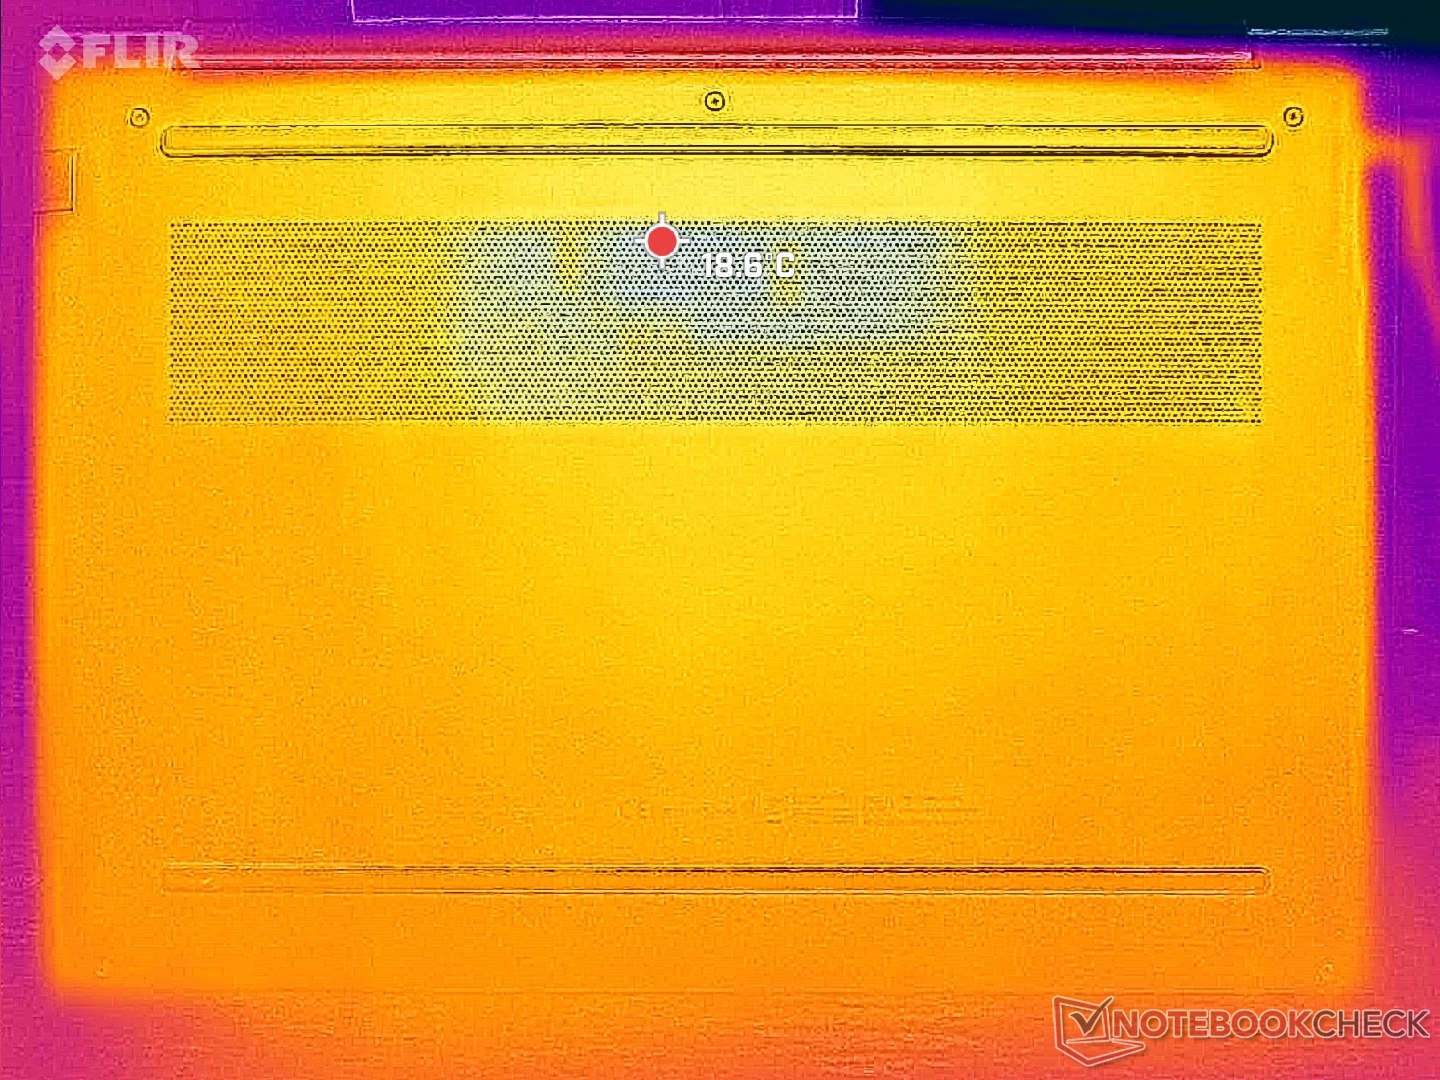
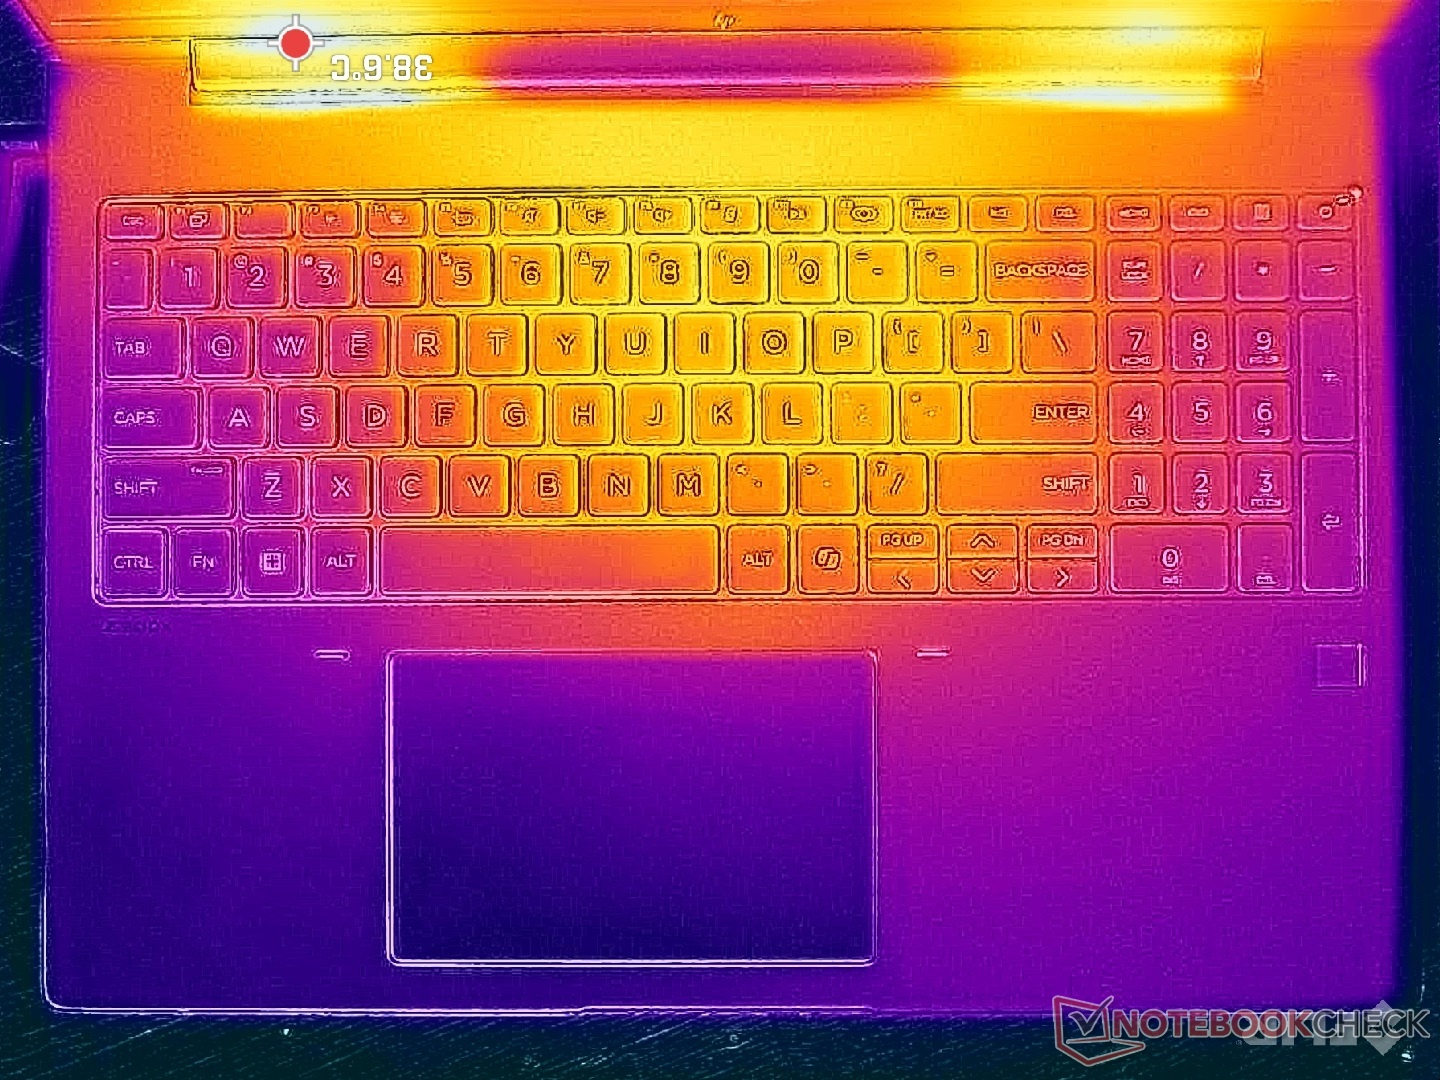
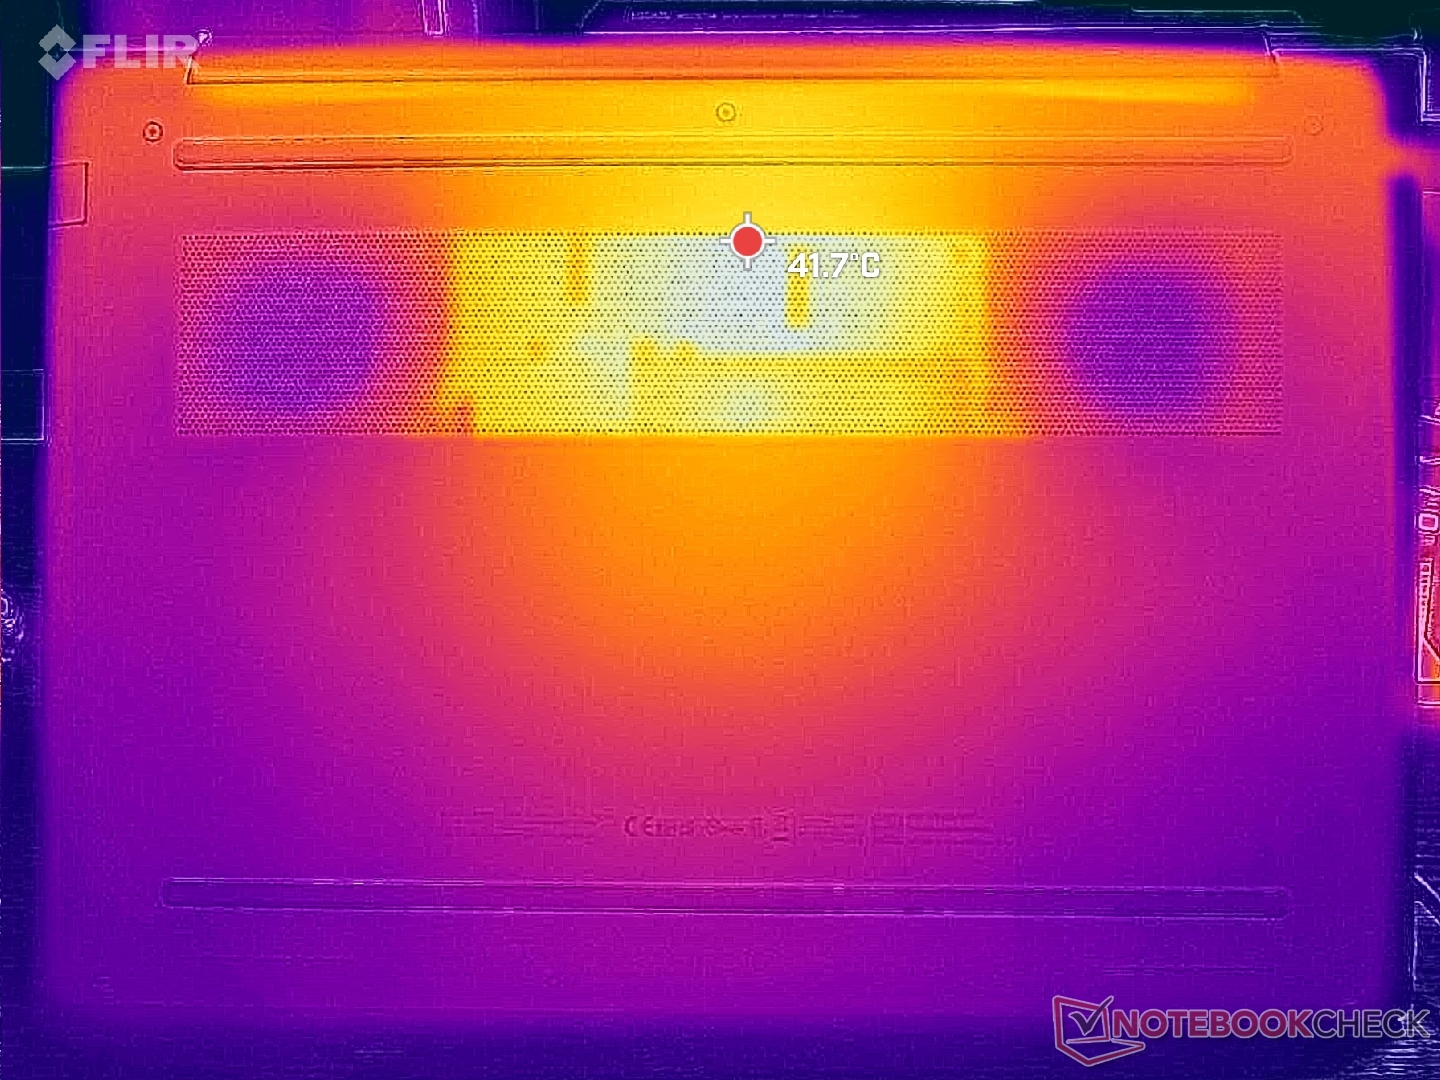
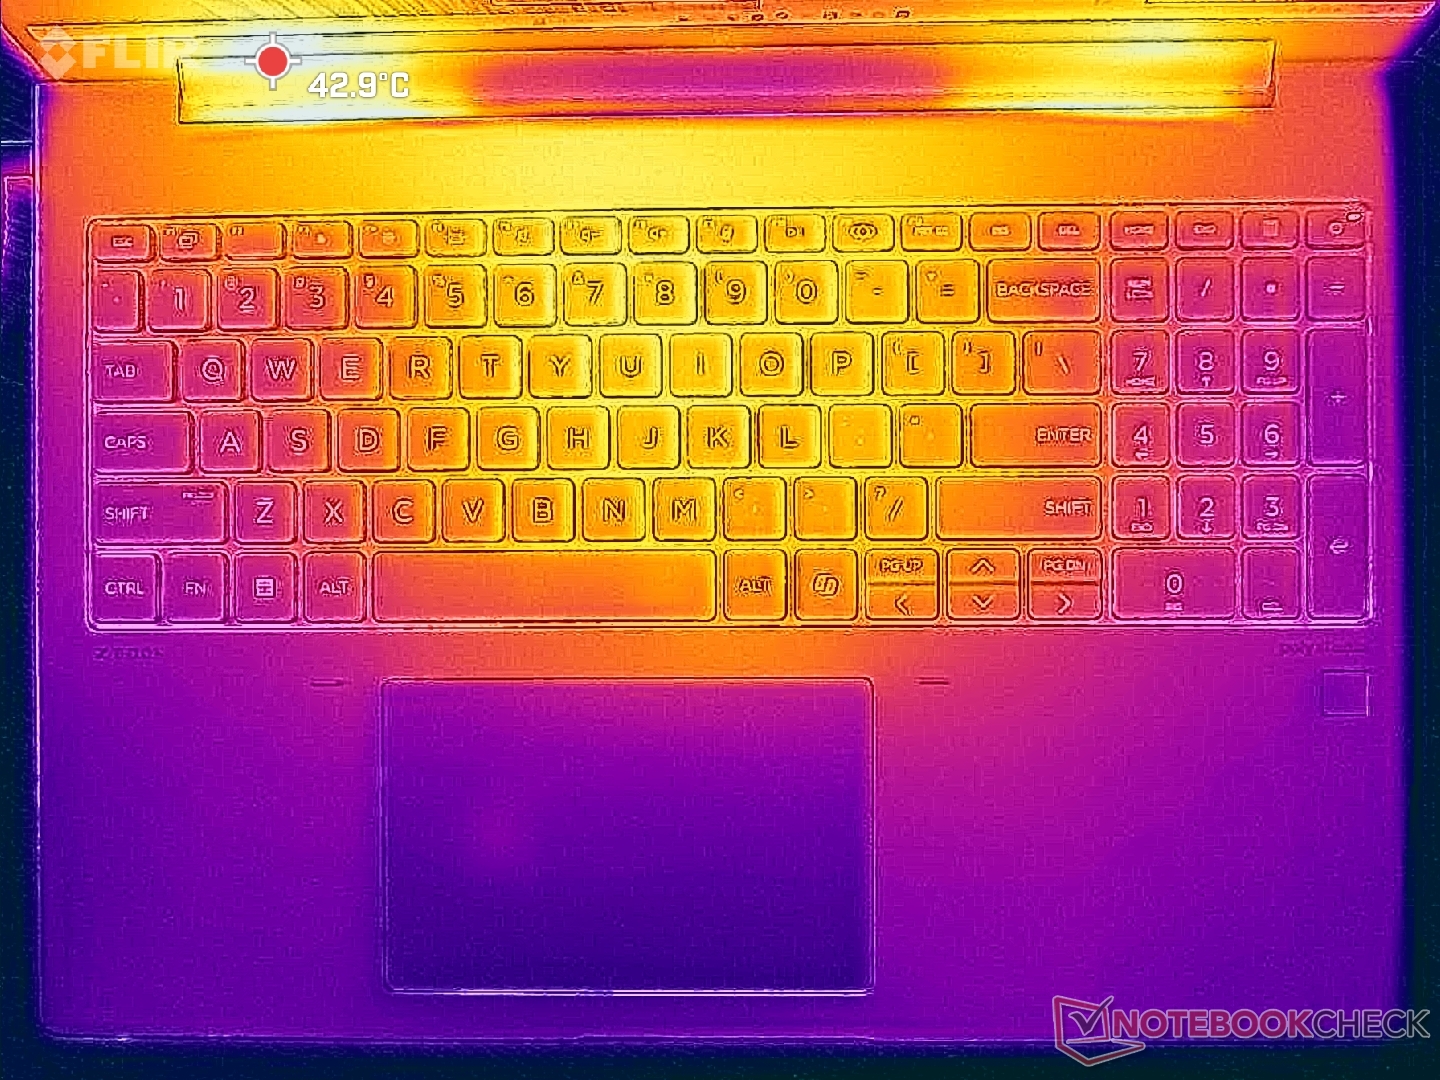
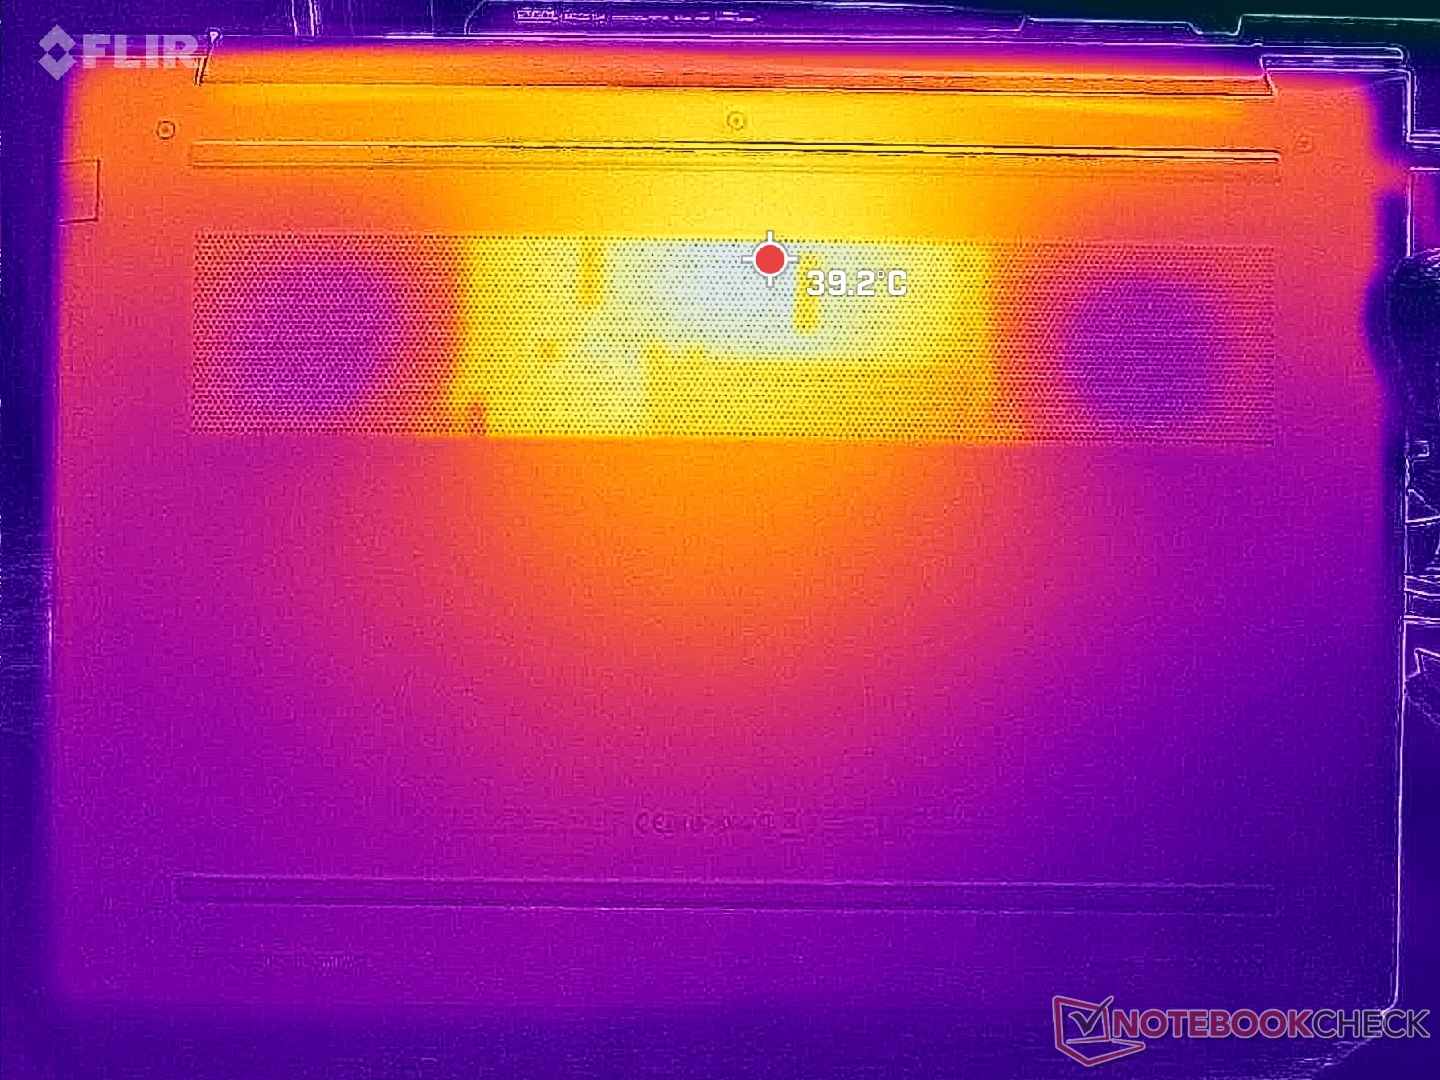
Die Oberflächentemperaturen unseres neuen 16-Zoll-Formfaktors sind insgesamt kühler, insbesondere auf der Unterseite. Bei anspruchsvoller Last erreichen die Wärmepunkte auf der Unterseite lediglich 41 °C, im Vergleich zu 48 °C beim älteren ZBook Power 15 G10. Der Hot Spot in der Mitte der Tastatur erreicht ebenfalls 41 °C, während die Handballenablagen und die Seiten kühler bleiben, was für Handflächen und Finger angenehmer ist.
Im Vergleich zum leistungsstärkeren Precision 5690 ist das Dell-Gerät auf der Tastatur wärmer, während es auf der Unterseite kühler ist.
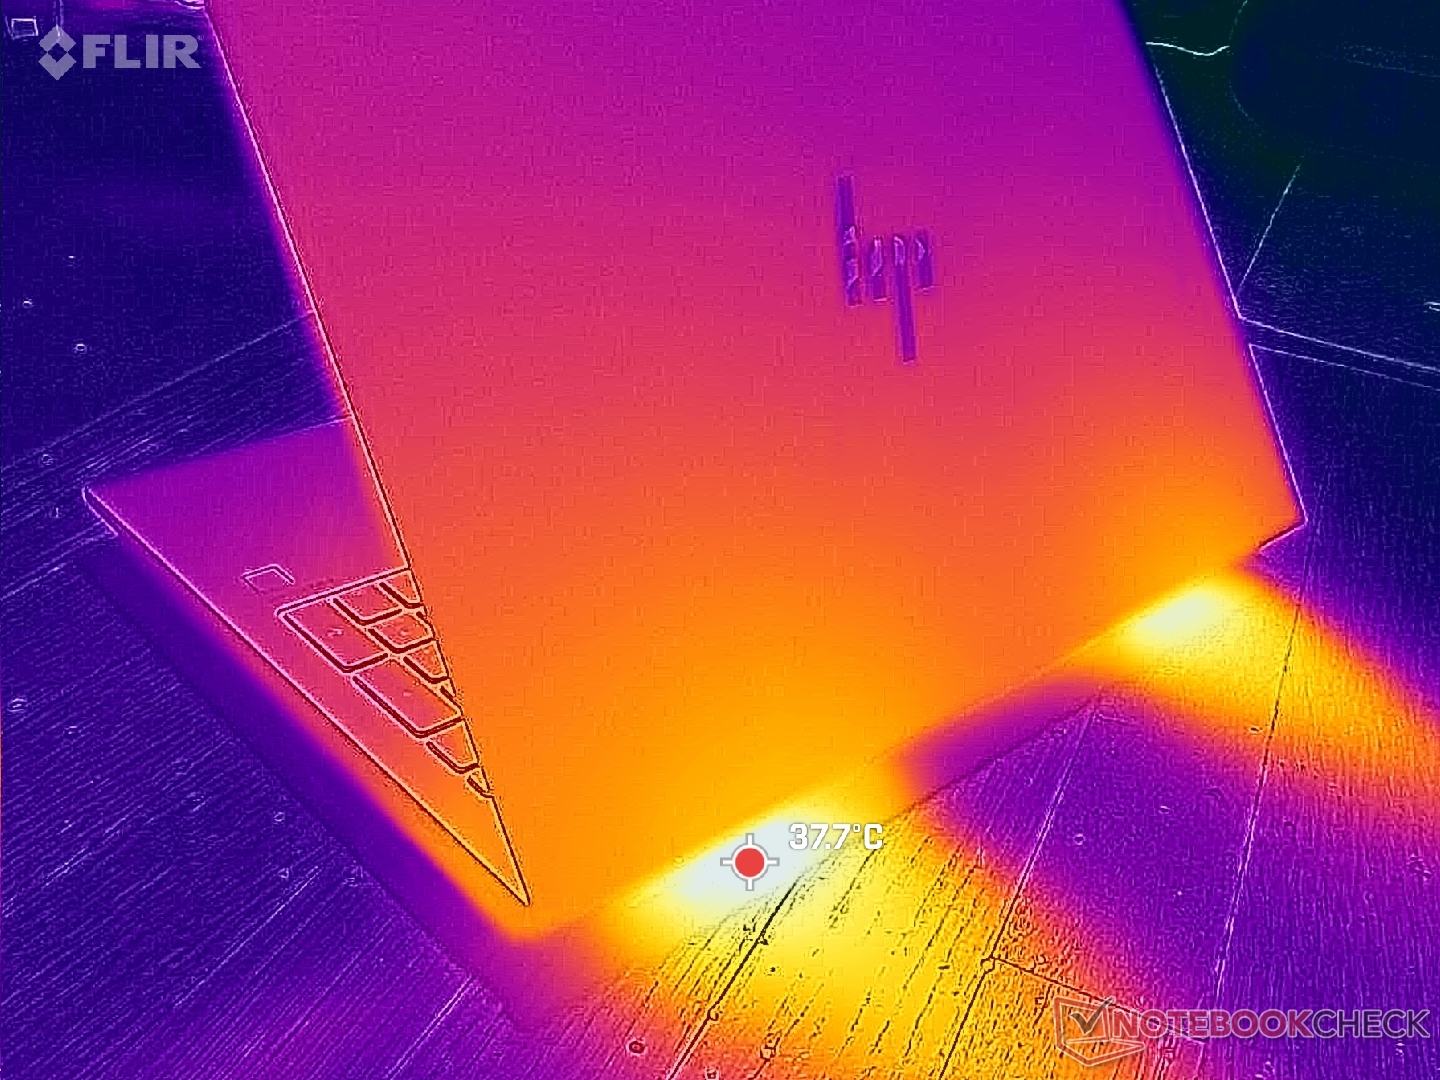
(±) Die maximale Temperatur auf der Oberseite ist 40.6 °C. Im Vergleich liegt der Klassendurchschnitt bei 38.2 °C (von 22.2 bis 69.8 °C für die Klasse Workstation).
(±) Auf der Unterseite messen wir eine maximalen Wert von 40.6 °C (im Vergleich zum Durchschnitt von 41.1 °C).
(+) Ohne Last messen wir eine durchschnittliche Temperatur von 24.6 °C auf der Oberseite. Der Klassendurchschnitt erreicht 32 °C.
(+) 3: The average temperature for the upper side is 30.1 °C / 86 F, compared to the average of 32 °C / 90 F for the class Workstation.
(+) Die Handballen und der Touchpad-Bereich sind mit gemessenen 27.2 °C kühler als die typische Hauttemperatur und fühlen sich dadurch kühl an.
(±) Die durchschnittliche Handballen-Temperatur anderer getesteter Geräte war 27.8 °C (+0.6 °C).
| HP ZBook Power 16 G11 A AMD Ryzen 7 8845HS, NVIDIA RTX 2000 Ada Generation Laptop | HP ZBook Power 15 G10 AMD Ryzen 7 PRO 7840HS, NVIDIA RTX 2000 Ada Generation Laptop | HP ZBook Fury 16 G11 Intel Core i9-14900HX, NVIDIA RTX 3500 Ada Generation Laptop | Lenovo ThinkPad P1 Gen 7 21KV001SGE Intel Core Ultra 7 155H, NVIDIA GeForce RTX 4060 Laptop GPU | Lenovo ThinkPad P16s G2 21K9000CGE AMD Ryzen 7 PRO 7840U, AMD Radeon 780M | Dell Precision 5690 Intel Core Ultra 9 185H, Nvidia RTX 5000 Ada Generation Laptop | |
|---|---|---|---|---|---|---|
| Hitze | -7% | -26% | -8% | -9% | -8% | |
| Last oben max * (°C) | 40.6 | 42.4 -4% | 42.2 -4% | 50.3 -24% | 42.7 -5% | 46.6 -15% |
| Last unten max * (°C) | 40.6 | 47.8 -18% | 48 -18% | 38 6% | 47.2 -16% | 33 19% |
| Idle oben max * (°C) | 26 | 26.8 -3% | 37 -42% | 28.3 -9% | 27.8 -7% | 32.4 -25% |
| Idle unten max * (°C) | 26.6 | 27.2 -2% | 36.8 -38% | 27.3 -3% | 28.4 -7% | 29.4 -11% |
* ... kleinere Werte sind besser
Lautsprecher
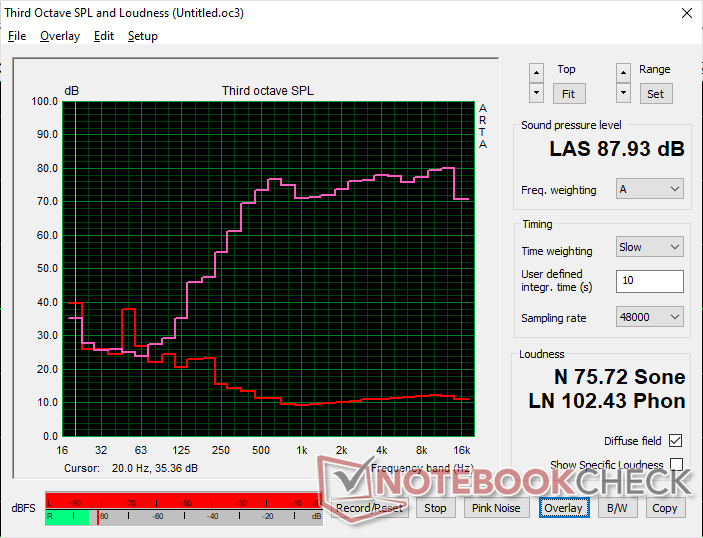
HP ZBook Power 16 G11 A Audio Analyse
(+) | Die Lautsprecher können relativ laut spielen (87.9 dB)
Bass 100 - 315 Hz
(-) | kaum Bass - 28.1% niedriger als der Median
(±) | durchschnittlich lineare Bass-Wiedergabe (9% Delta zum Vorgänger)
Mitteltöne 400 - 2000 Hz
(+) | ausgeglichene Mitten, vom Median nur 1.9% abweichend
(+) | lineare Mitten (4.8% Delta zum Vorgänger)
Hochtöne 2 - 16 kHz
(+) | ausgeglichene Hochtöne, vom Median nur 3.6% abweichend
(+) | sehr lineare Hochtöne (2.4% Delta zum Vorgänger)
Gesamt im hörbaren Bereich 100 - 16.000 Hz
(±) | hörbarer Bereich ist durchschnittlich linear (15.1% Abstand zum Median)
Im Vergleich zu allen Geräten derselben Klasse
» 33% aller getesteten Geräte dieser Klasse waren besser, 7% vergleichbar, 60% schlechter
» Das beste Gerät hat einen Delta-Wert von 7%, durchschnittlich ist 17%, das schlechteste Gerät hat 35%
Im Vergleich zu allen Geräten im Test
» 20% aller getesteten Geräte waren besser, 4% vergleichbar, 76% schlechter
» Das beste Gerät hat einen Delta-Wert von 4%, durchschnittlich ist 24%, das schlechteste Gerät hat 134%
Apple MacBook Pro 16 2021 M1 Pro Audio Analyse
(+) | Die Lautsprecher können relativ laut spielen (84.7 dB)
Bass 100 - 315 Hz
(+) | guter Bass - nur 3.8% Abweichung vom Median
(+) | lineare Bass-Wiedergabe (5.2% Delta zum Vorgänger)
Mitteltöne 400 - 2000 Hz
(+) | ausgeglichene Mitten, vom Median nur 1.3% abweichend
(+) | lineare Mitten (2.1% Delta zum Vorgänger)
Hochtöne 2 - 16 kHz
(+) | ausgeglichene Hochtöne, vom Median nur 1.9% abweichend
(+) | sehr lineare Hochtöne (2.7% Delta zum Vorgänger)
Gesamt im hörbaren Bereich 100 - 16.000 Hz
(+) | hörbarer Bereich ist sehr linear (4.6% Abstand zum Median
Im Vergleich zu allen Geräten derselben Klasse
» 0% aller getesteten Geräte dieser Klasse waren besser, 0% vergleichbar, 100% schlechter
» Das beste Gerät hat einen Delta-Wert von 5%, durchschnittlich ist 17%, das schlechteste Gerät hat 45%
Im Vergleich zu allen Geräten im Test
» 0% aller getesteten Geräte waren besser, 0% vergleichbar, 100% schlechter
» Das beste Gerät hat einen Delta-Wert von 4%, durchschnittlich ist 24%, das schlechteste Gerät hat 134%
Energieverwaltung
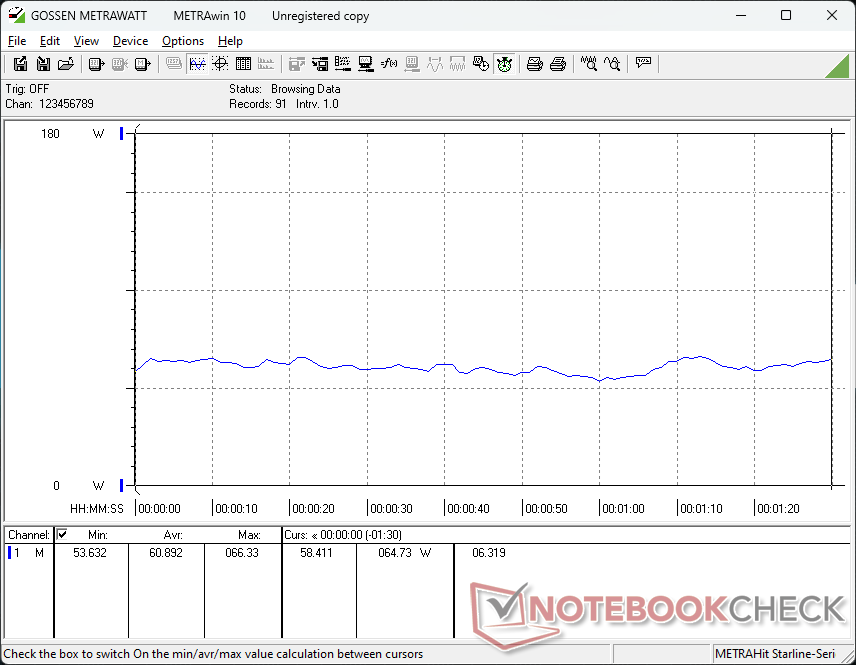
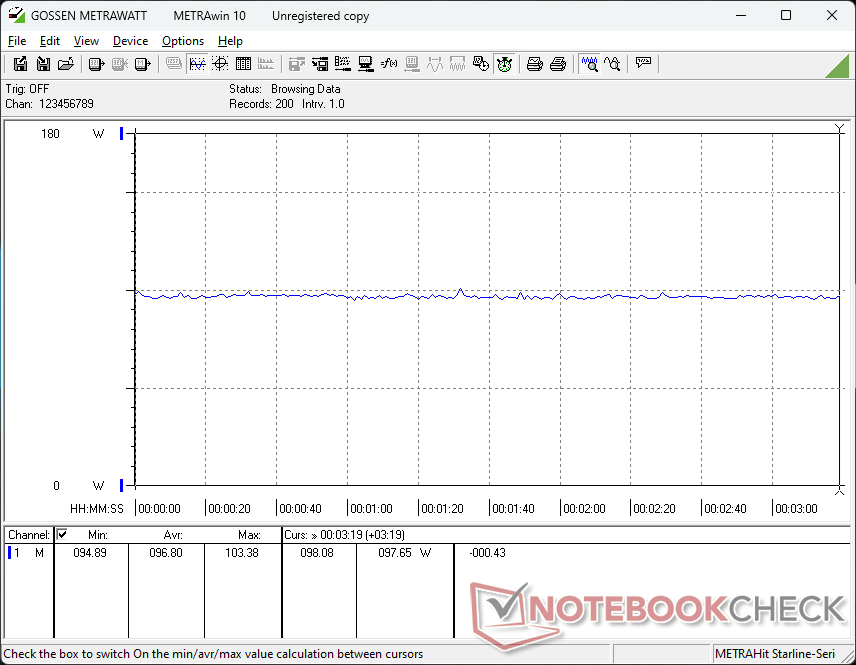
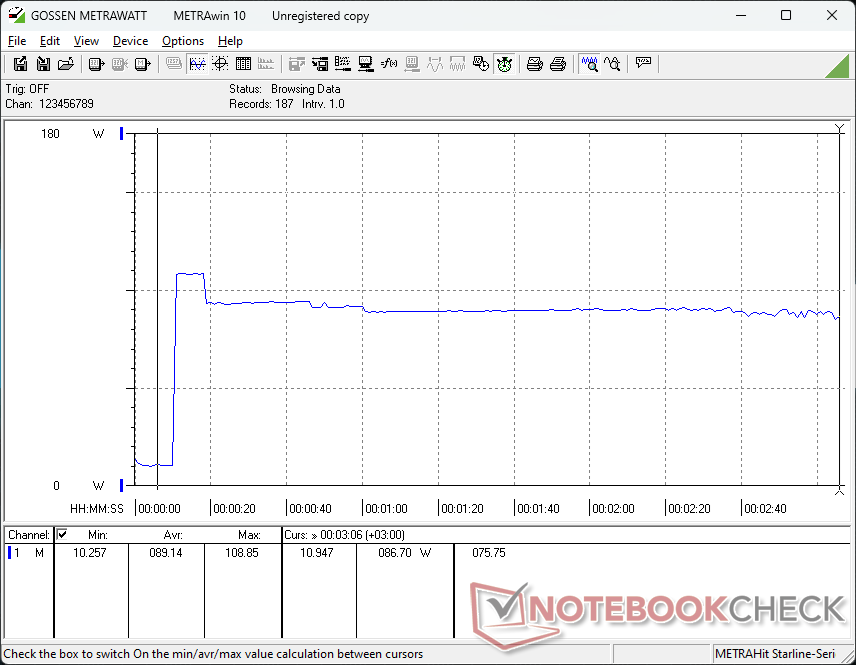
Energieaufnahme
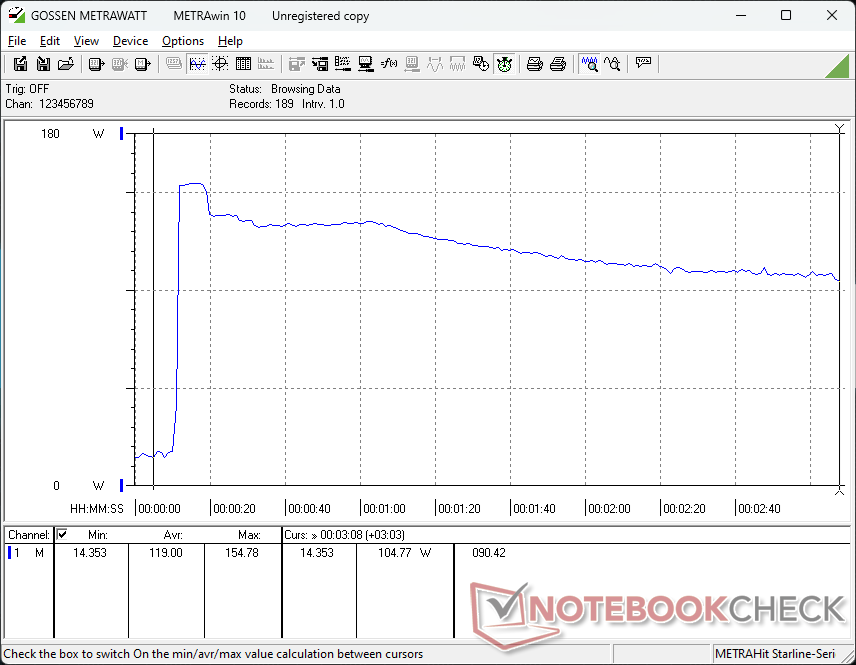
Die Verbrauchswerte und das Verhalten sind ähnlich wie beim ZBook Power 15 G10, was nicht verwunderlich ist, da die Leistungsaufnahme beider Geräte gleich ist. Der vielleicht bemerkenswerteste Unterschied ist der geringere Verbrauch von etwa 25 W, wenn Prime95 und FurMark gleichzeitig laufen. Dies kann auf die stärkere Drosselung zurückgeführt werden, die zur Kühlung der Kerntemperaturen bei solchen Belastungen erforderlich ist, wie im vorhergehenden Abschnitt über den Stresstest erwähnt.
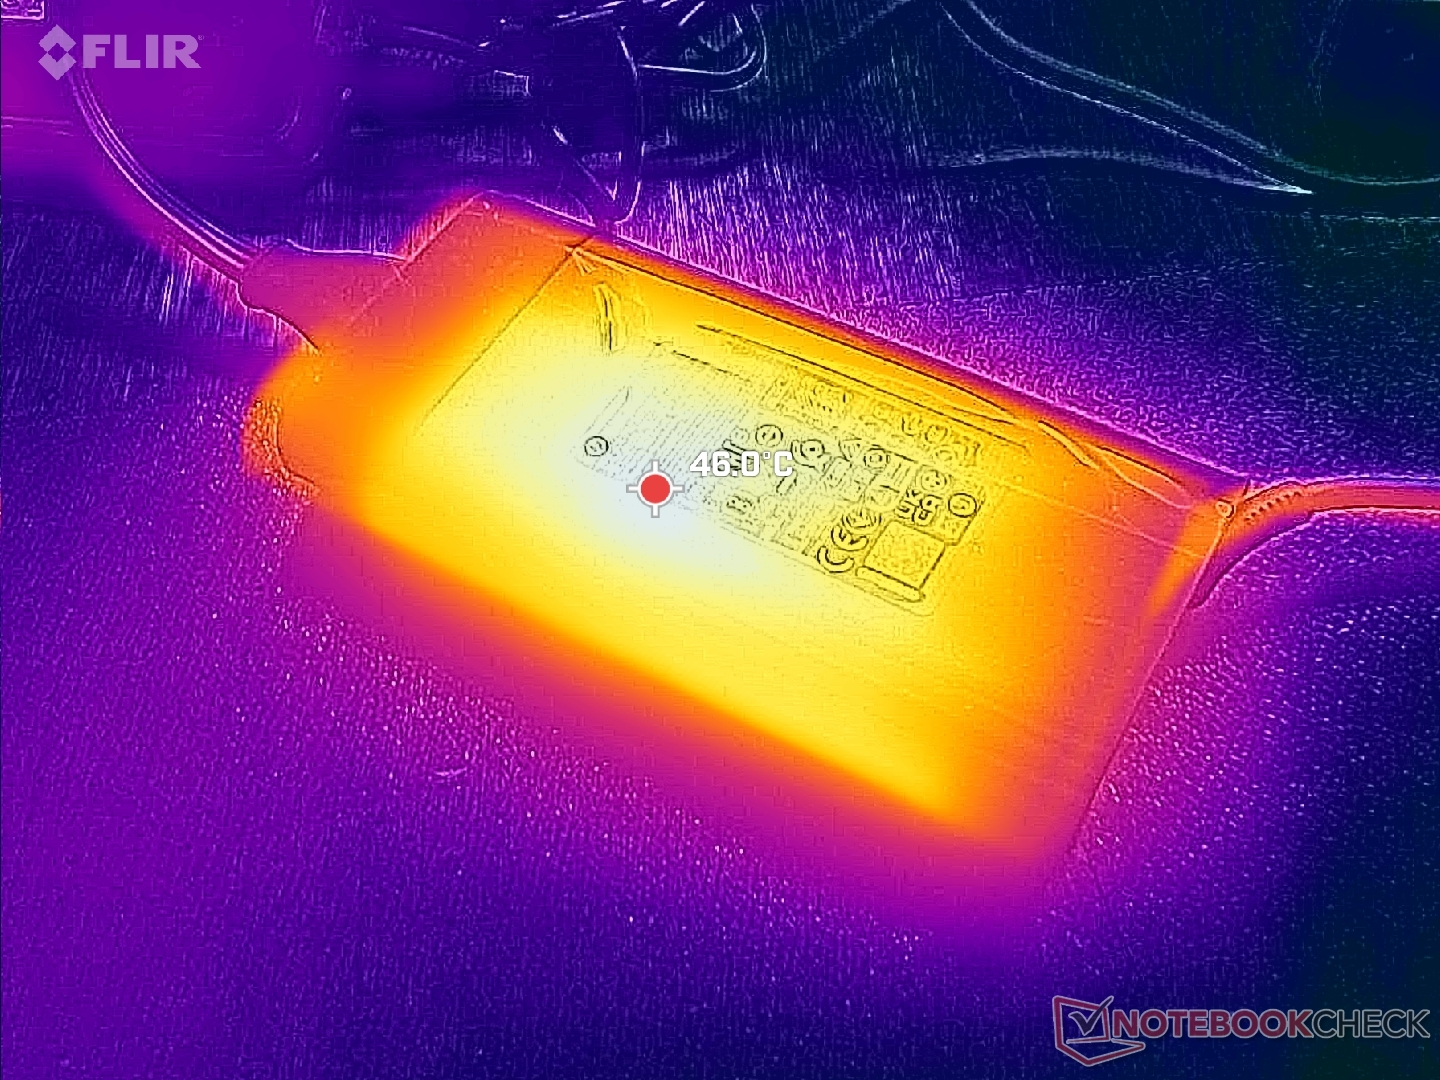
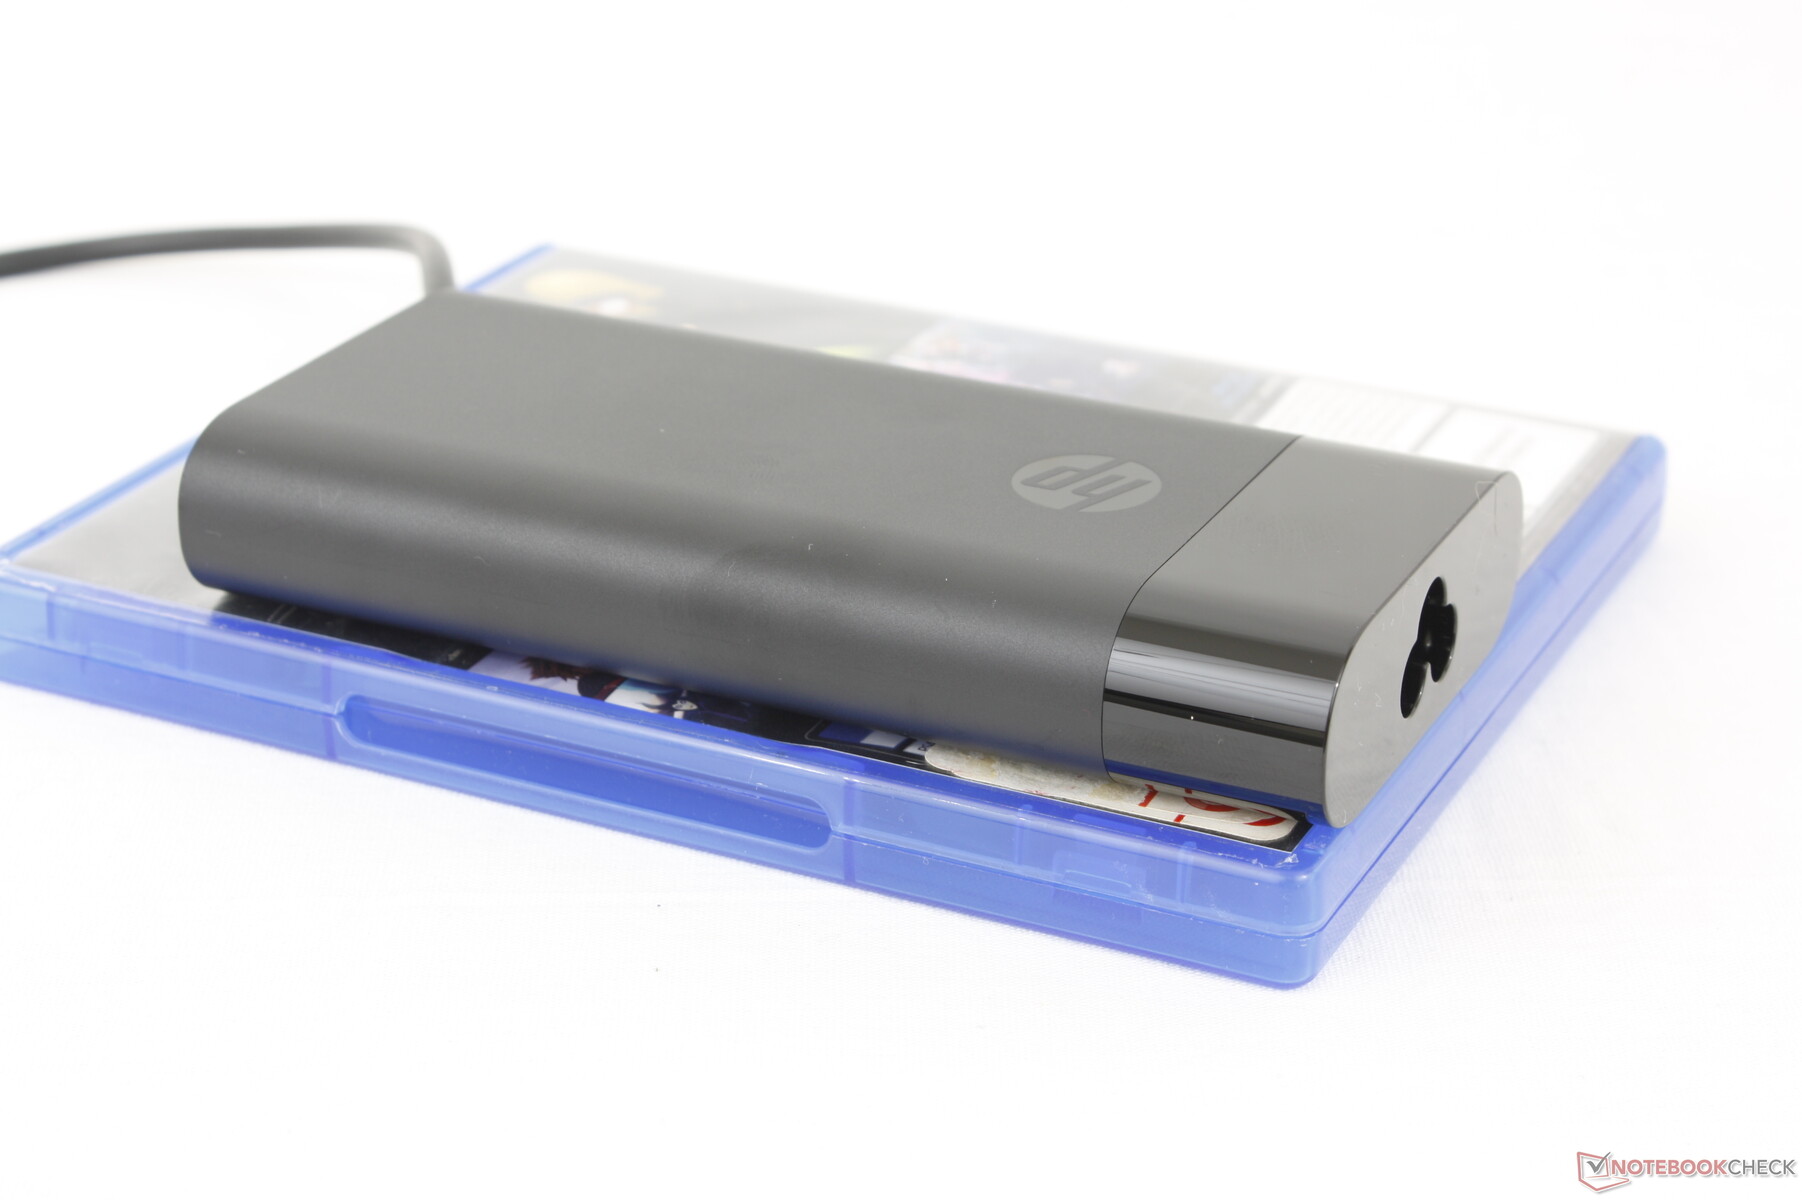
Mit dem mittelgroßen (~13,8 x 6,5 x 2,2 cm) 150-Watt-Netzteil konnten wir einen temporären Maximalverbrauch von 155 W messen.
| Aus / Standby | |
| Idle | |
| Last |
|
Legende:
min: | |
| HP ZBook Power 16 G11 A R7 8845HS, RTX 2000 Ada Generation Laptop, Samsung PM9A1 MZVL22T0HBLB, IPS, 2560x1600, 16" | HP ZBook Power 15 G10 R7 PRO 7840HS, RTX 2000 Ada Generation Laptop, WDC PC SN810 2TB, IPS, 2560x1440, 15.6" | HP ZBook Fury 16 G11 i9-14900HX, RTX 3500 Ada Generation Laptop, SK hynix PC801 HFS001TEJ9X101N, IPS, 3840x2400, 16" | Lenovo ThinkPad P1 Gen 7 21KV001SGE Ultra 7 155H, GeForce RTX 4060 Laptop GPU, Kioxia XG8 KXG8AZNV1T02, IPS LED, 2560x1600, 16" | Lenovo ThinkPad P16s G2 21K9000CGE R7 PRO 7840U, Radeon 780M, SK hynix PC801 HFS001TEJ9X162N, OLED, 3840x2400, 16" | Dell Precision 5690 Ultra 9 185H, RTX 5000 Ada Generation Laptop, 2x Samsung PM9A1 1TB (RAID 0), OLED, 3840x2400, 16" | |
|---|---|---|---|---|---|---|
| Stromverbrauch | -13% | -80% | -35% | 20% | -67% | |
| Idle min * (Watt) | 4.6 | 5.3 -15% | 8.6 -87% | 7.3 -59% | 6.1 -33% | 7.9 -72% |
| Idle avg * (Watt) | 10 | 9.9 1% | 14.8 -48% | 12.3 -23% | 6.5 35% | 12 -20% |
| Idle max * (Watt) | 10.6 | 16.7 -58% | 15.7 -48% | 17.9 -69% | 7 34% | 28.6 -170% |
| Last avg * (Watt) | 60.9 | 61.3 -1% | 129.4 -112% | 78.2 -28% | 56.6 7% | 98.8 -62% |
| Cyberpunk 2077 ultra external monitor * (Watt) | 92.8 | 192.6 -108% | 117.7 -27% | |||
| Cyberpunk 2077 ultra * (Watt) | 96.8 | 199.4 -106% | 123.5 -28% | |||
| Last max * (Watt) | 154.8 | 145.3 6% | 236.1 -53% | 167.5 -8% | 68.3 56% | 174.8 -13% |
| Witcher 3 ultra * (Watt) | 87.9 | 61.2 | 144.5 |
* ... kleinere Werte sind besser
Energieaufnahme Cyberpunk / Stresstest
Energieaufnahme external Monitor
Akkulaufzeit
Die Batteriekapazität hat sich im Vergleich zum letztjährigen ZBook Power 15 G10 trotz des neuen Formfaktors nicht verändert. Vielleicht ist es Zufall, dass die Laufzeit mit etwas mehr als 9,5 Stunden beim realen WLAN-Browsing vor dem automatischen Herunterfahren fast gleich geblieben ist.
Der Ladevorgang vom leeren zum vollen Akku ist mit unter 70 Minuten relativ schnell. Das Aufladen über USB-C wird unterstützt, allerdings mit niedrigeren Geschwindigkeiten.
| HP ZBook Power 16 G11 A R7 8845HS, RTX 2000 Ada Generation Laptop, 83 Wh | HP ZBook Power 15 G10 R7 PRO 7840HS, RTX 2000 Ada Generation Laptop, 83 Wh | HP ZBook Fury 16 G11 i9-14900HX, RTX 3500 Ada Generation Laptop, 95 Wh | Lenovo ThinkPad P1 Gen 7 21KV001SGE Ultra 7 155H, GeForce RTX 4060 Laptop GPU, 90 Wh | Lenovo ThinkPad P16s G2 21K9000CGE R7 PRO 7840U, Radeon 780M, 84 Wh | Dell Precision 5690 Ultra 9 185H, RTX 5000 Ada Generation Laptop, 98 Wh | |
|---|---|---|---|---|---|---|
| Akkulaufzeit | 3% | -31% | 7% | -2% | -5% | |
| Idle (h) | 26.1 | |||||
| WLAN (h) | 9.7 | 10 3% | 6.7 -31% | 9.9 2% | 10.6 9% | 9.2 -5% |
| Last (h) | 1.7 | 1.9 12% | 1.5 -12% | |||
| H.264 (h) | 13.3 |
Pro
Contra
Fazit — Größerer Bildschirm, aber gleiche Leistung
Das ZBook Power 16 G11 ersetzt die ZBook Power 15-Serie durch ein größeres und schwereres 16-Zoll-Design. Man könnte annehmen, dass der größere Formfaktor zu einer schnelleren Leistung führt, doch das ist leider nicht der Fall. Die neuen Hawk-Point-CPUs bieten nicht viel mehr als die Phoenix-Optionen des Vorjahres, während die GPU-Optionen bis auf die TGP-Obergrenzen identisch bleiben. Das Redesign des Gehäuses war HPs Gelegenheit, die Kühllösung zu verbessern und mehr Leistung aus den Prozessoren herauszuholen, aber wir vermuten, dass der Hersteller nicht zu sehr in das Gebiet des höherwertigen ZBook Fury eindringen wollte.
Auch die Display-Optionen sind für eine Workstation etwas enttäuschend. Abgesehen von der einzigartigen 1000-Nit-Option gibt es keine nennenswerten Merkmale wie OLED, P3-Farben oder 4K-Auflösung. Solche Panels hätten die größere Bildschirmgröße im Vergleich zur vorherigen 15,6-Zoll-Version deutlich attraktiver gemacht. Stattdessen sind die Nutzer auf 2K und IPS-Displays beschränkt.
Im Vergleich zu seinem Vorgänger bietet das ZBook Power 16 G11 außer dem größeren 16-Zoll-Bildschirm nicht viel mehr. Leistung und Ausstattung sind bei beiden Modellen nahezu identisch.
Trotzdem bleibt das HP ZBook Power 16 G11 eine starke Mittelklasse-Workstation, auch wenn es keine signifikanten Leistungsverbesserungen oder neuen Funktionen gibt. Die CPU-Leistung ist nach wie vor deutlich schneller als die des ThinkPad P16s G2, das auf CPUs der Ryzen-U-Serie beschränkt ist, und gleichzeitig günstiger als das beliebte Dell Precision 5690, wenn es mit der gleichen GPU konfiguriert ist. Wenn Sie jedoch bereits ein ZBook Power 15 G10 besitzen, könnte sich die schwerere 16-Zoll-Version wie ein Seitenschritt anfühlen.
Preis und Verfügbarkeit
HP bietet das ZBook Power 16 G11 A jetzt ab etwa 1,072 Euro in der Basiskonfiguration mit Ryzen 5 und integrierter Grafik an. Unsere Testkonfiguration mit Ryzen 7-CPU, RTX 2000 Ada-GPU und 1600p-Display liegt bei etwa 2,200 Euro.
HP ZBook Power 16 G11 A
- 30.09.2024 v8
Allen Ngo
 Total Sustainability Score:
 Transparenz
Die Auswahl der zu testenden Geräte erfolgt innerhalb der Redaktion. Das vorliegende Testmuster wurde dem Autor vom Hersteller oder einem Shop zu Testzwecken leihweise zur Verfügung gestellt. Eine Einflussnahme des Leihstellers auf den Testbericht gab es nicht, der Hersteller erhielt keine Version des Reviews vor der Veröffentlichung. Es bestand keine Verpflichtung zur Publikation. Als eigenständiges, unabhängiges Unternehmen unterliegt Notebookcheck keiner Diktion von Herstellern, Shops und Verlagen.
So testet Notebookcheck
Pro Jahr werden von Notebookcheck hunderte Laptops und Smartphones unabhängig in von uns standardisierten technischen Verfahren getestet, um eine Vergleichbarkeit aller Testergebnisse zu gewährleisten. Seit rund 20 Jahren entwickeln wir diese Testmethoden kontinuierlich weiter und setzen damit Branchenstandards. In unseren Testlaboren kommt ausschließlich hochwertiges Messequipment in die Hände erfahrener Techniker und Redakteure. Die Tests unterliegen einer mehrstufigen Kontrolle. Unsere komplexe Gesamtbewertung basiert auf hunderten fundierten Messergebnissen und Benchmarks, womit Ihnen Objektivität garantiert ist. Weitere Informationen zu unseren Testmethoden gibt es hier.
Preisvergleich

