

Nvidia RTX 3500 Ada Leistungsdebüt: HP ZBook Fury 16 G11 Workstation im Test
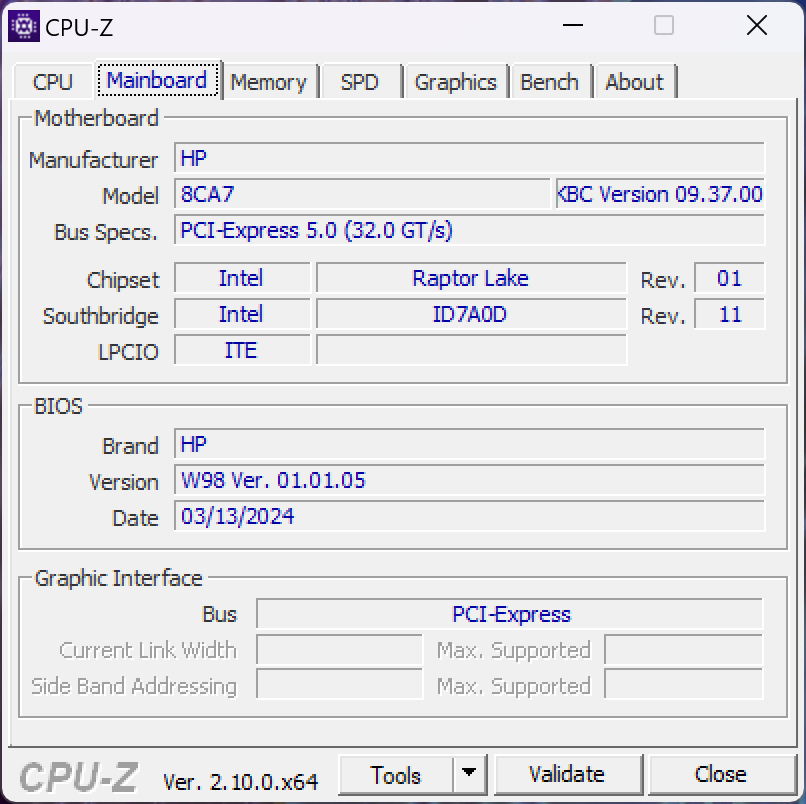
Das 2024er ZBook Fury 16 G11 ist der Nachfolger des 2023 Fury 16 G10 und ersetzt die Raptor Lake-HX-CPUs durch neuere Raptor Lake-HX Refresh-Optionen. Abgesehen von diesen internen Updates bleibt das Gehäuse unverändert im Vergleich zum Fury 16 G10 oder Fury 16 G9, ebenso wie viele der konfigurierbaren Optionen. Um mehr über die physikalischen Eigenschaften des Modells zu erfahren, empfehlen wir, unseren Testbericht zum Fury 16 G9 zu lesen.
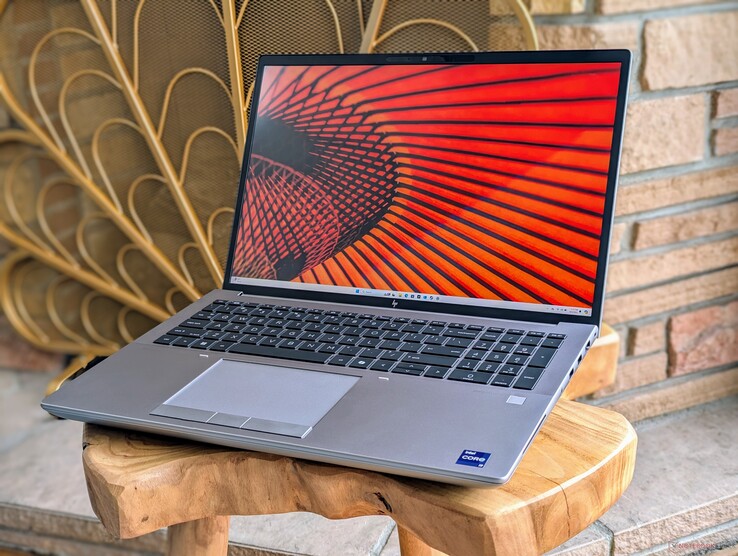
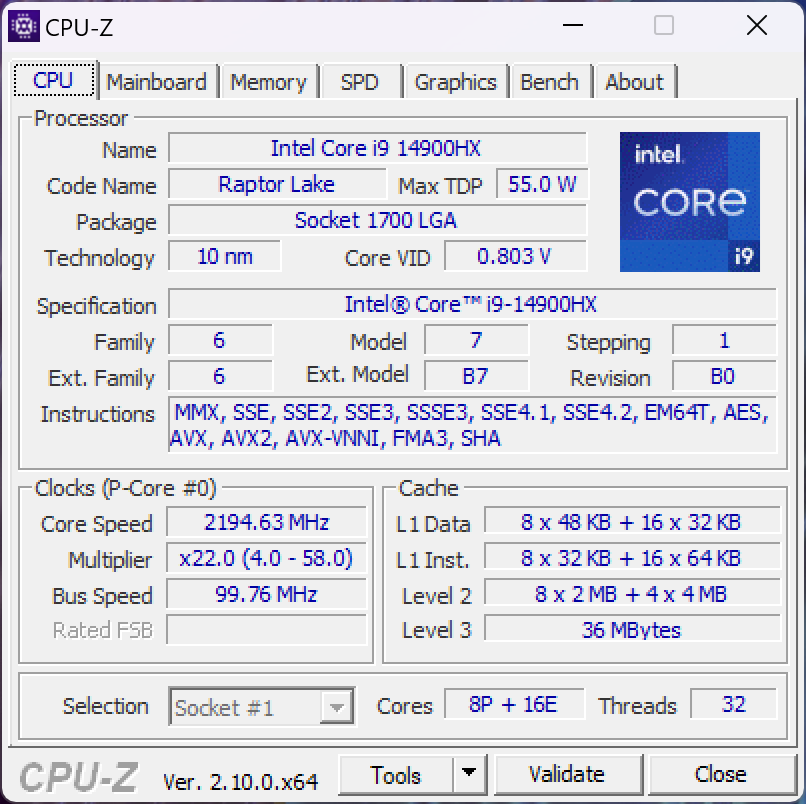
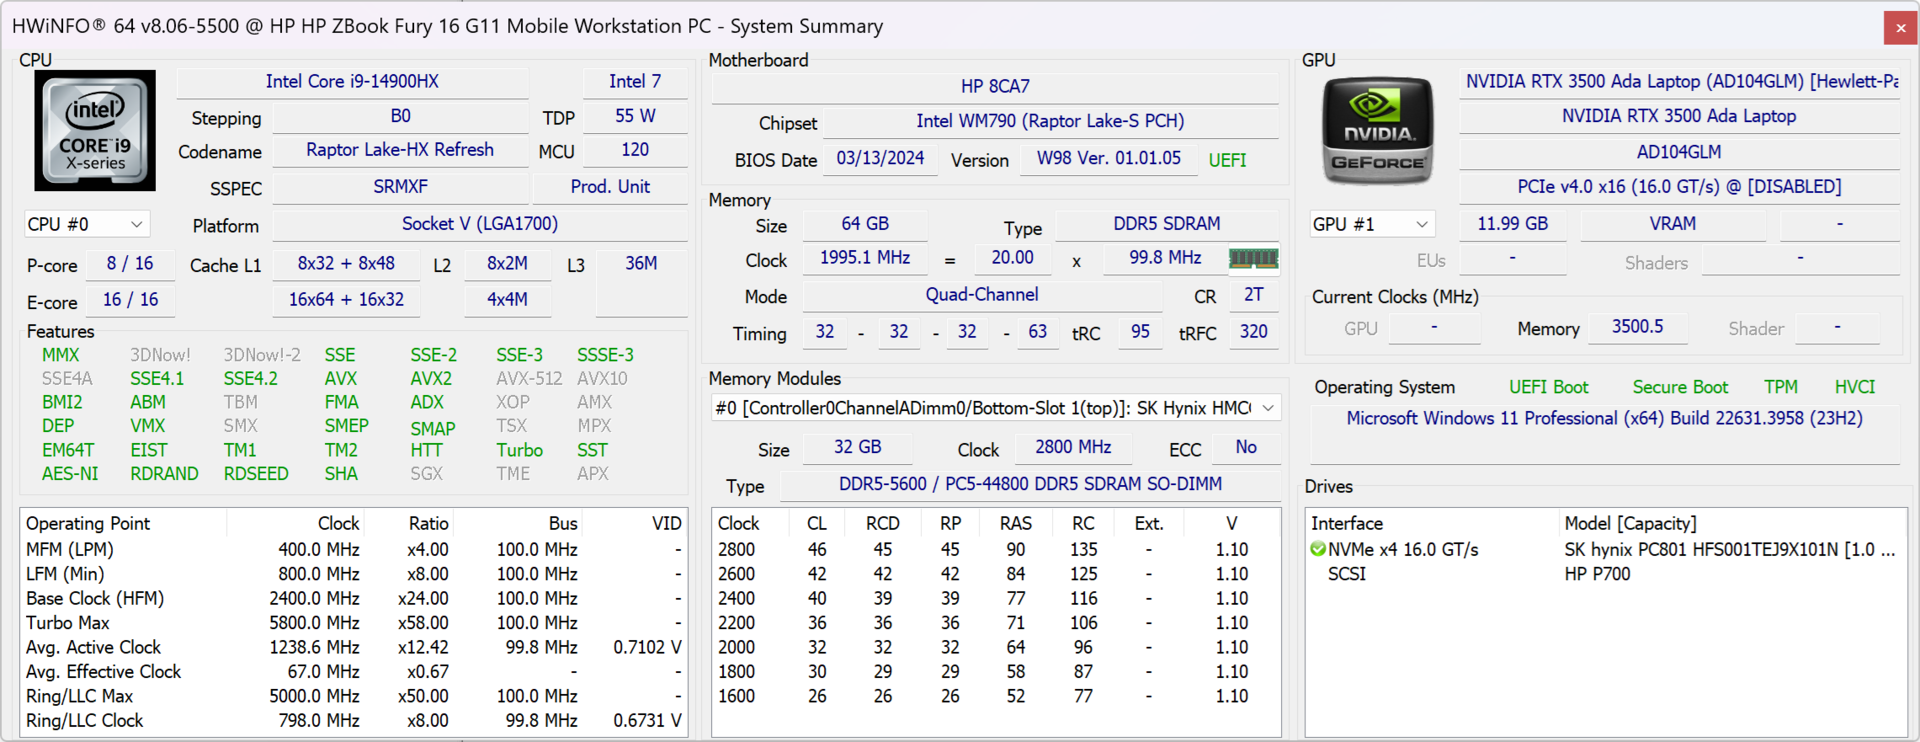
Unser Testgerät ist eine obere Mittelklassekonfiguration mit einem Core i9-14900HX-Prozessor, einer RTX 3500 Ada-Grafikkarte und einem 120-Hz-IPS-Display mit einer Auflösung von 3840 x 2400 Pixeln, was etwa 3400 Euro kostet. Andere Modelle reichen vom Core i5-13600HX bis hin zur RTX 5000 Ada und einem 2400p OLED-Touchscreen. Eine Meteor Lake CPU-Option gibt es nicht.
Zu den Konkurrenz-Modellen des ZBook Fury 16 G11 gehören andere 16-Zoll-Workstations wie das Dell Precision 5690, Lenovo ThinkPad P16 G2 oder Asus ProArt Studiobook 16.
Weitere HP Bewertungen:
Preisvergleich
Mögliche Konkurrenten im Vergleich
Bew. | Version | Datum | Modell | Gewicht | Dicke | Größe | Auflösung | Preis ab |
|---|---|---|---|---|---|---|---|---|
| 85.9 % | v8 | 08 / 2024 | HP ZBook Fury 16 G11 i9-14900HX, NVIDIA RTX 3500 Ada Generation Laptop GPU | 2.6 kg | 28.5 mm | 16.00" | 3840x2400 | |
| 92.3 % v7 (old) | v7 (old) | 09 / 2023 | HP ZBook Fury 16 G10 i9-13950HX, NVIDIA RTX 5000 Ada Generation Laptop GPU | 2.6 kg | 28.5 mm | 16.00" | 3840x2400 | |
| 91 % v7 (old) | v7 (old) | 06 / 2023 | HP ZBook Fury 16 G9 i9-12950HX, RTX A5500 Laptop GPU | 2.6 kg | 28.5 mm | 16.00" | 3840x2400 | |
| 88.3 % v7 (old) | v7 (old) | 05 / 2024 | Dell Precision 5690 Ultra 9 185H, NVIDIA RTX 5000 Ada Generation Laptop GPU | 2.3 kg | 22.17 mm | 16.00" | 3840x2400 | |
| 90.2 % v7 (old) | v7 (old) | 03 / 2024 | Lenovo ThinkPad P16 G2 21FA000FGE i7-13700HX, NVIDIA RTX 2000 Ada Generation Laptop GPU | 3 kg | 30.23 mm | 16.00" | 2560x1600 | |
| 90.1 % v7 (old) | v7 (old) | 12 / 2023 | Lenovo ThinkPad P1 G6 21FV001KUS i7-13800H, NVIDIA GeForce RTX 4080 Laptop GPU | 1.9 kg | 17.5 mm | 16.00" | 3480x2400 | |
| 86.1 % v7 (old) | v7 (old) | 06 / 2023 | Asus ProArt Studiobook 16 OLED H7604 i9-13980HX, NVIDIA GeForce RTX 4070 Laptop GPU | 2.4 kg | 23.9 mm | 16.00" | 3200x2000 |
Gehäuse
Eine einfache Möglichkeit, das ZBook Fury 16 G11 von den früheren Versionen zu unterscheiden, ist die Co-Pilot-Taste auf der Tastatur. Abgesehen davon bleibt das Gehäusedesign unverändert im Vergleich zu den Vorgängermodellen.

Ausstattung


SD Card Reader
| SD Card Reader | |
| average JPG Copy Test (av. of 3 runs) | |
| Lenovo ThinkPad P1 G6 21FV001KUS (Toshiba Exceria Pro SDXC 64 GB UHS-II) | |
| HP ZBook Fury 16 G11 (Toshiba Exceria Pro SDXC 64 GB UHS-II) | |
| HP ZBook Fury 16 G10 (Toshiba Exceria Pro SDXC 64 GB UHS-II) | |
| HP ZBook Fury 16 G9 (PNY EliteX-PRO60) | |
| Asus ProArt Studiobook 16 OLED H7604 (Angelibird AV Pro V60) | |
| Lenovo ThinkPad P16 G2 21FA000FGE | |
| maximum AS SSD Seq Read Test (1GB) | |
| HP ZBook Fury 16 G11 (Toshiba Exceria Pro SDXC 64 GB UHS-II) | |
| Lenovo ThinkPad P1 G6 21FV001KUS (Toshiba Exceria Pro SDXC 64 GB UHS-II) | |
| HP ZBook Fury 16 G10 (Toshiba Exceria Pro SDXC 64 GB UHS-II) | |
| HP ZBook Fury 16 G9 (PNY EliteX-PRO60) | |
| Lenovo ThinkPad P16 G2 21FA000FGE | |
| Asus ProArt Studiobook 16 OLED H7604 (Angelibird AV Pro V60) | |
Kommunikation
Zur Unterstützung von WLAN 7 wurde das Intel AX211 WLAN-Modul auf das BE200 aufgerüstet. Allerdings werden die meisten Nutzer in der Praxis weiterhin einen Wi-Fi 6 oder 6E Access Point nutzen.
Webcam


Wartung
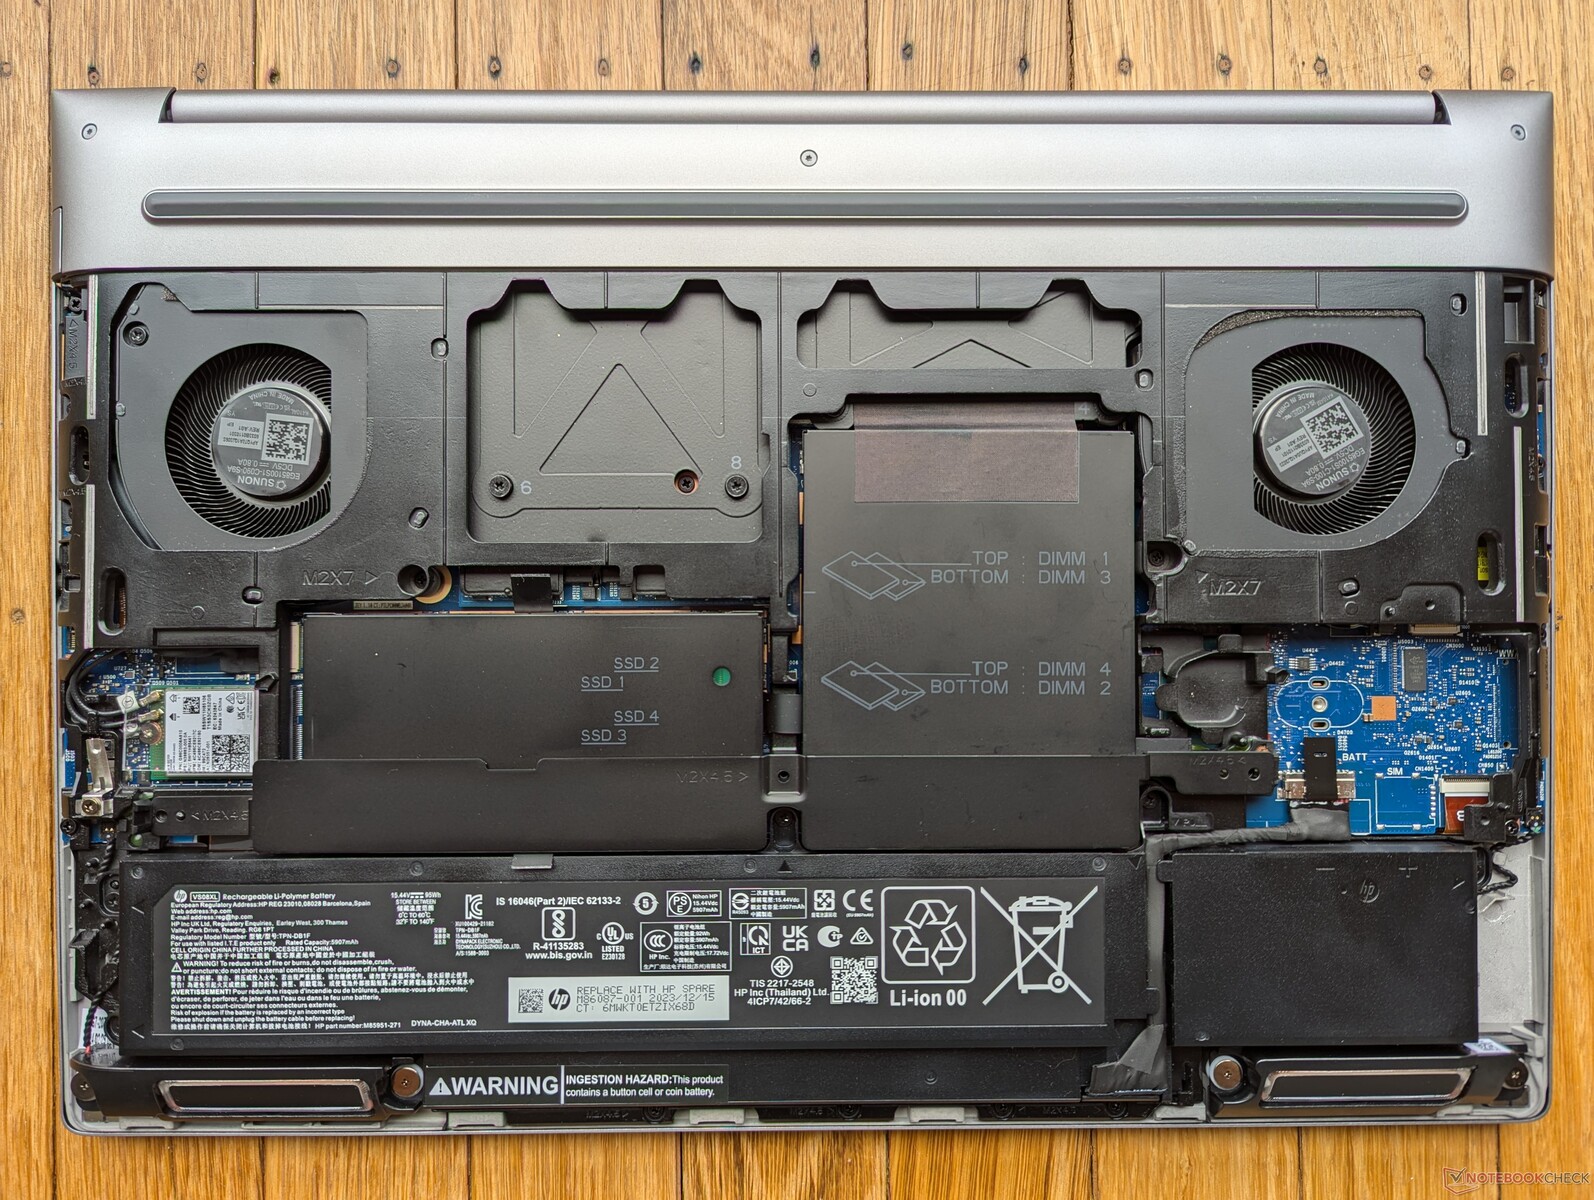
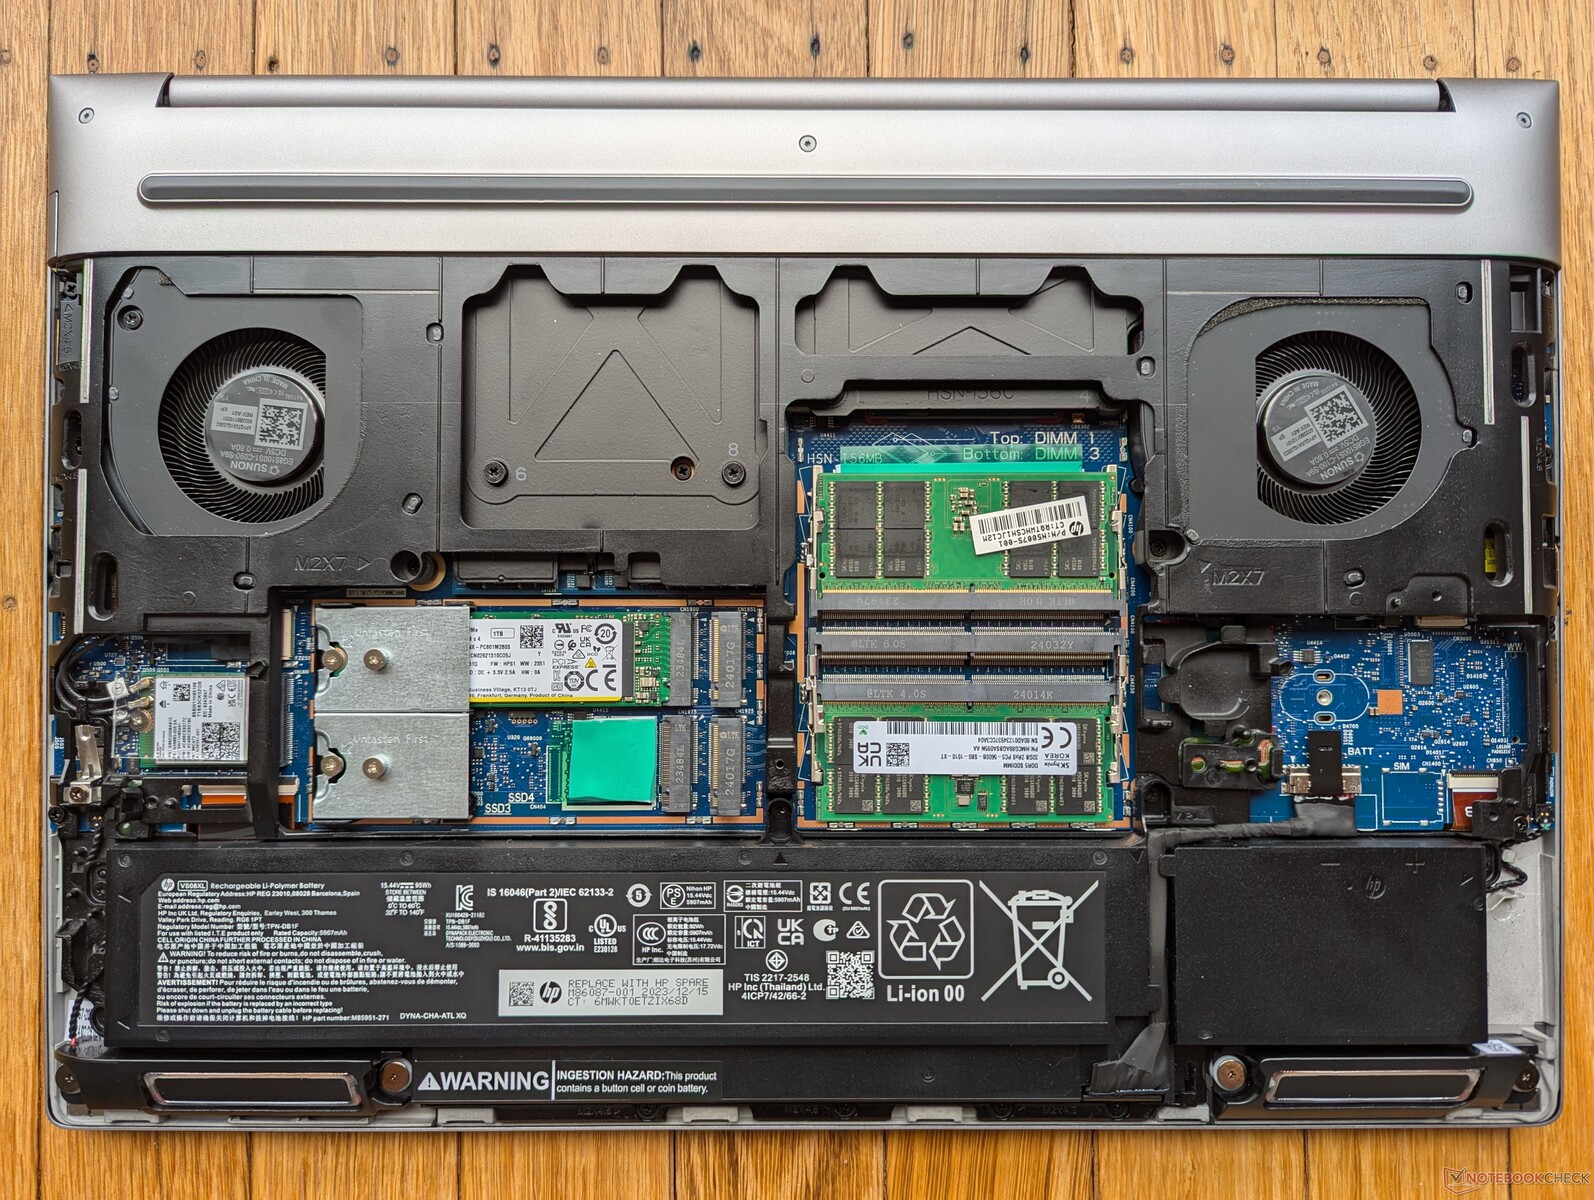
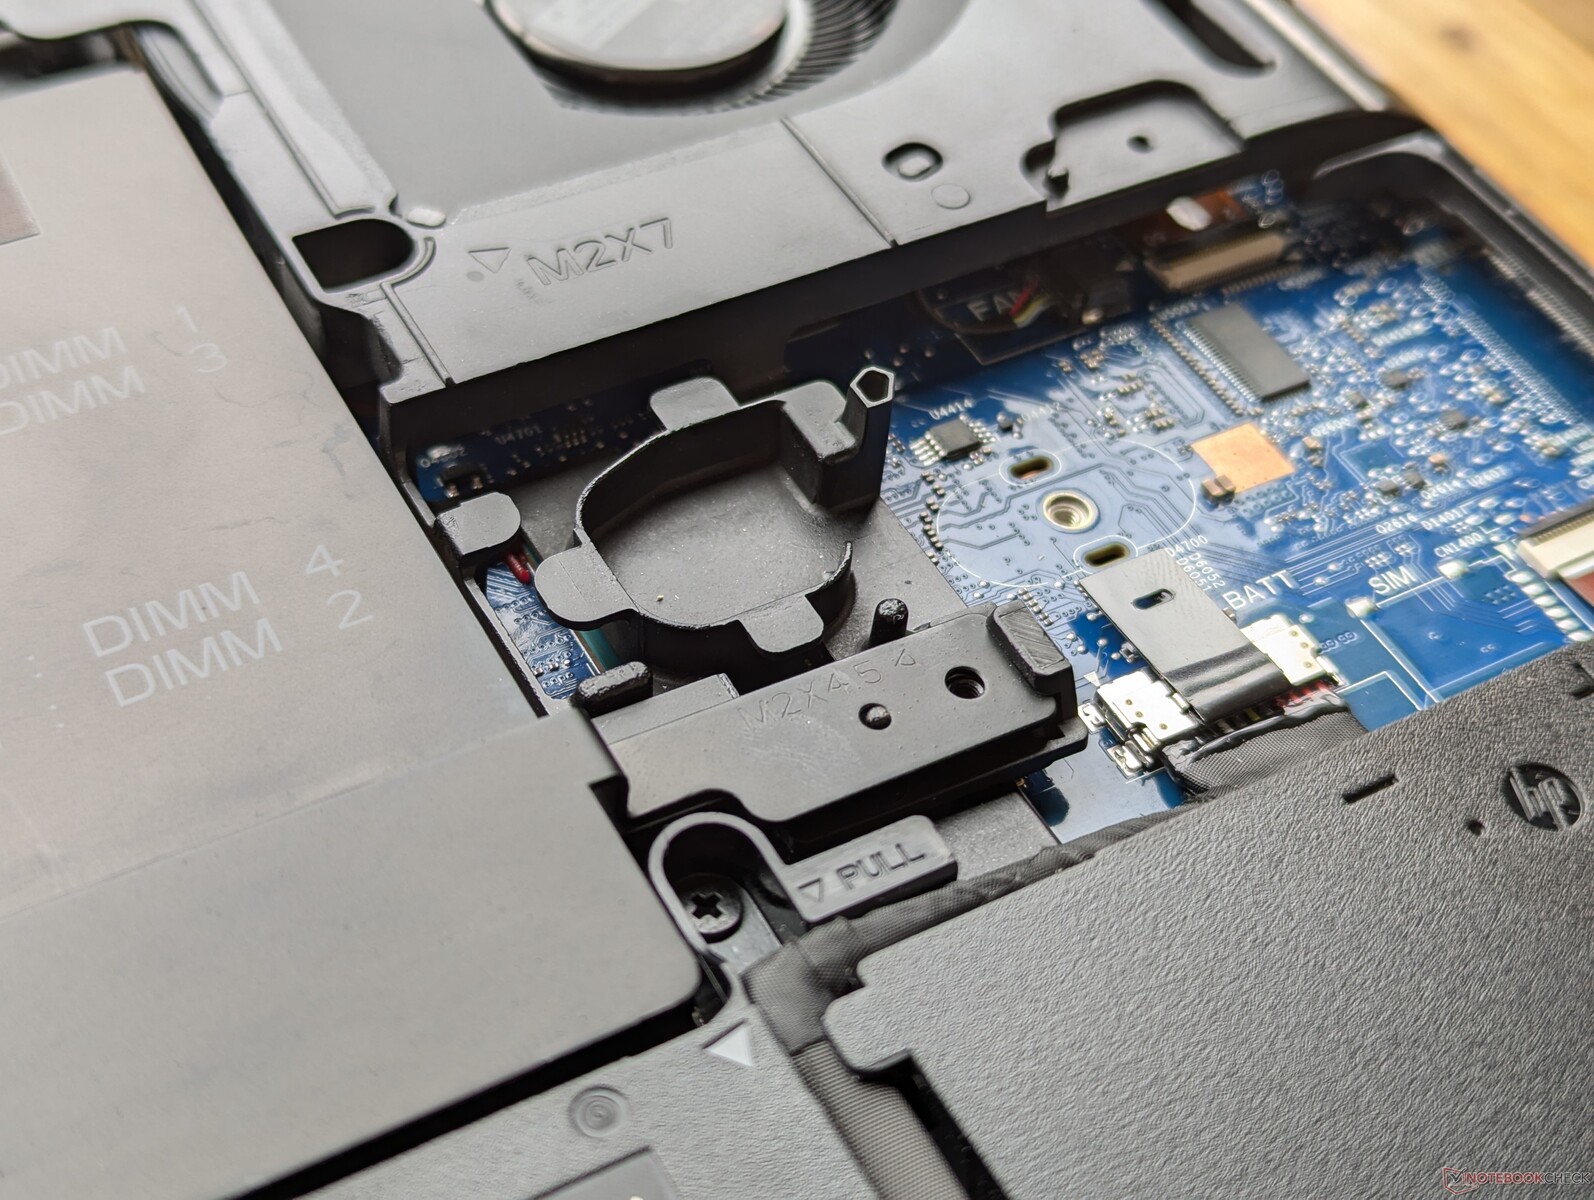
HP hebt die werkzeuglose Wartung seiner Fury 16-Serie hervor, die seit dem G9-Modell Anfang letzten Jahres verfügbar ist. Während sich die Bodenplatte leicht und ohne Werkzeug entfernen lässt, war die Aluminiumabdeckung, die die RAM- und SODIMM-Module schützte, bislang nur mit einem Schraubendreher zu entfernen. Beim G11-Modell wurde diese Aluminiumabdeckung jedoch auf ein Riegel-System umgestellt, sodass die Benutzer die RAM-Module jetzt ganz ohne Werkzeug installieren können.
Die SSDs bleiben jedoch nach wie vor mit Schrauben an der Hauptplatine befestigt, weshalb ein Schraubendreher beim Austausch der Laufwerke erforderlich ist. Das System unterstützt bis zu vier SSDs und vier RAM-Module.

Nachhaltigkeit
Die Verpackung ist vollständig recycelbar und besteht größtenteils aus Papier. Das Netzteil ist das einzige Element, das in Kunststoff verpackt ist.
Zubehör und Garantie
Die Verkaufsverpackung enthält neben dem Netzteil und den Unterlagen keine weiteren Extras. Beim Kauf in Deutschland gilt eine dreijährige Herstellergarantie.
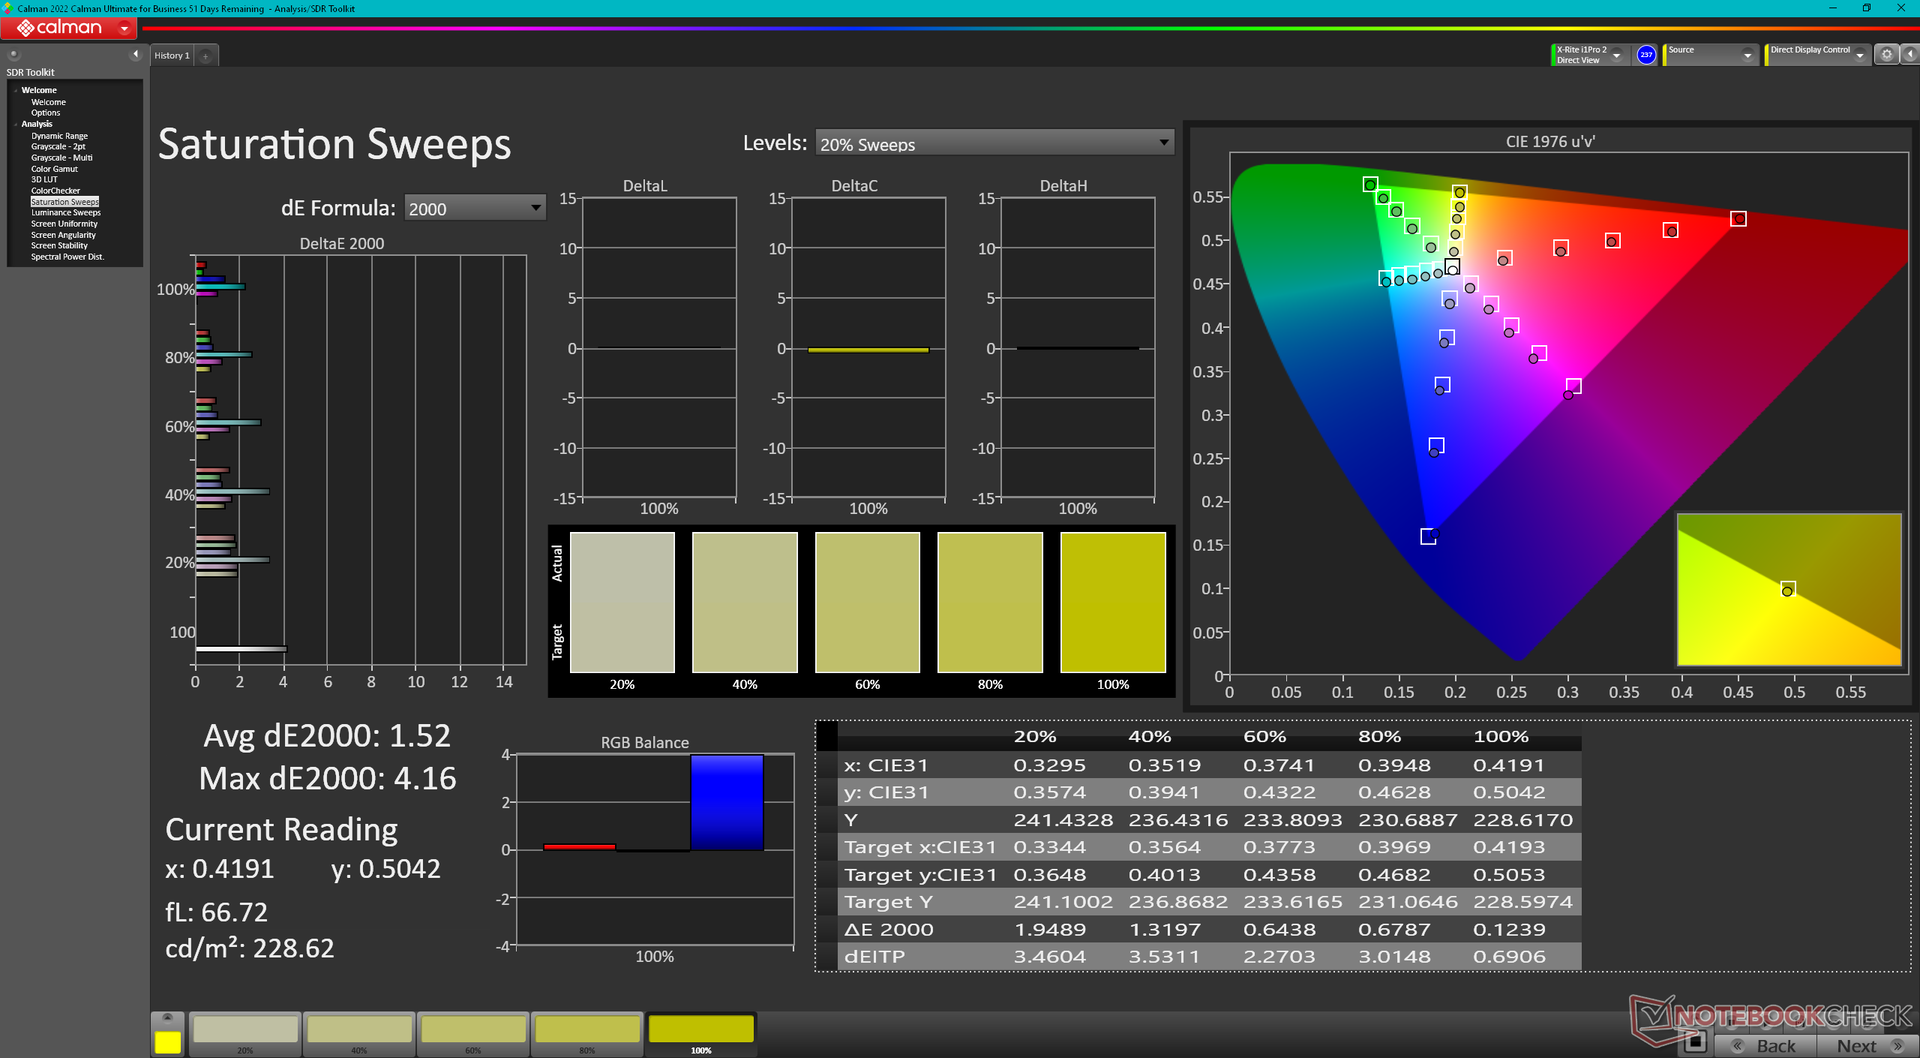
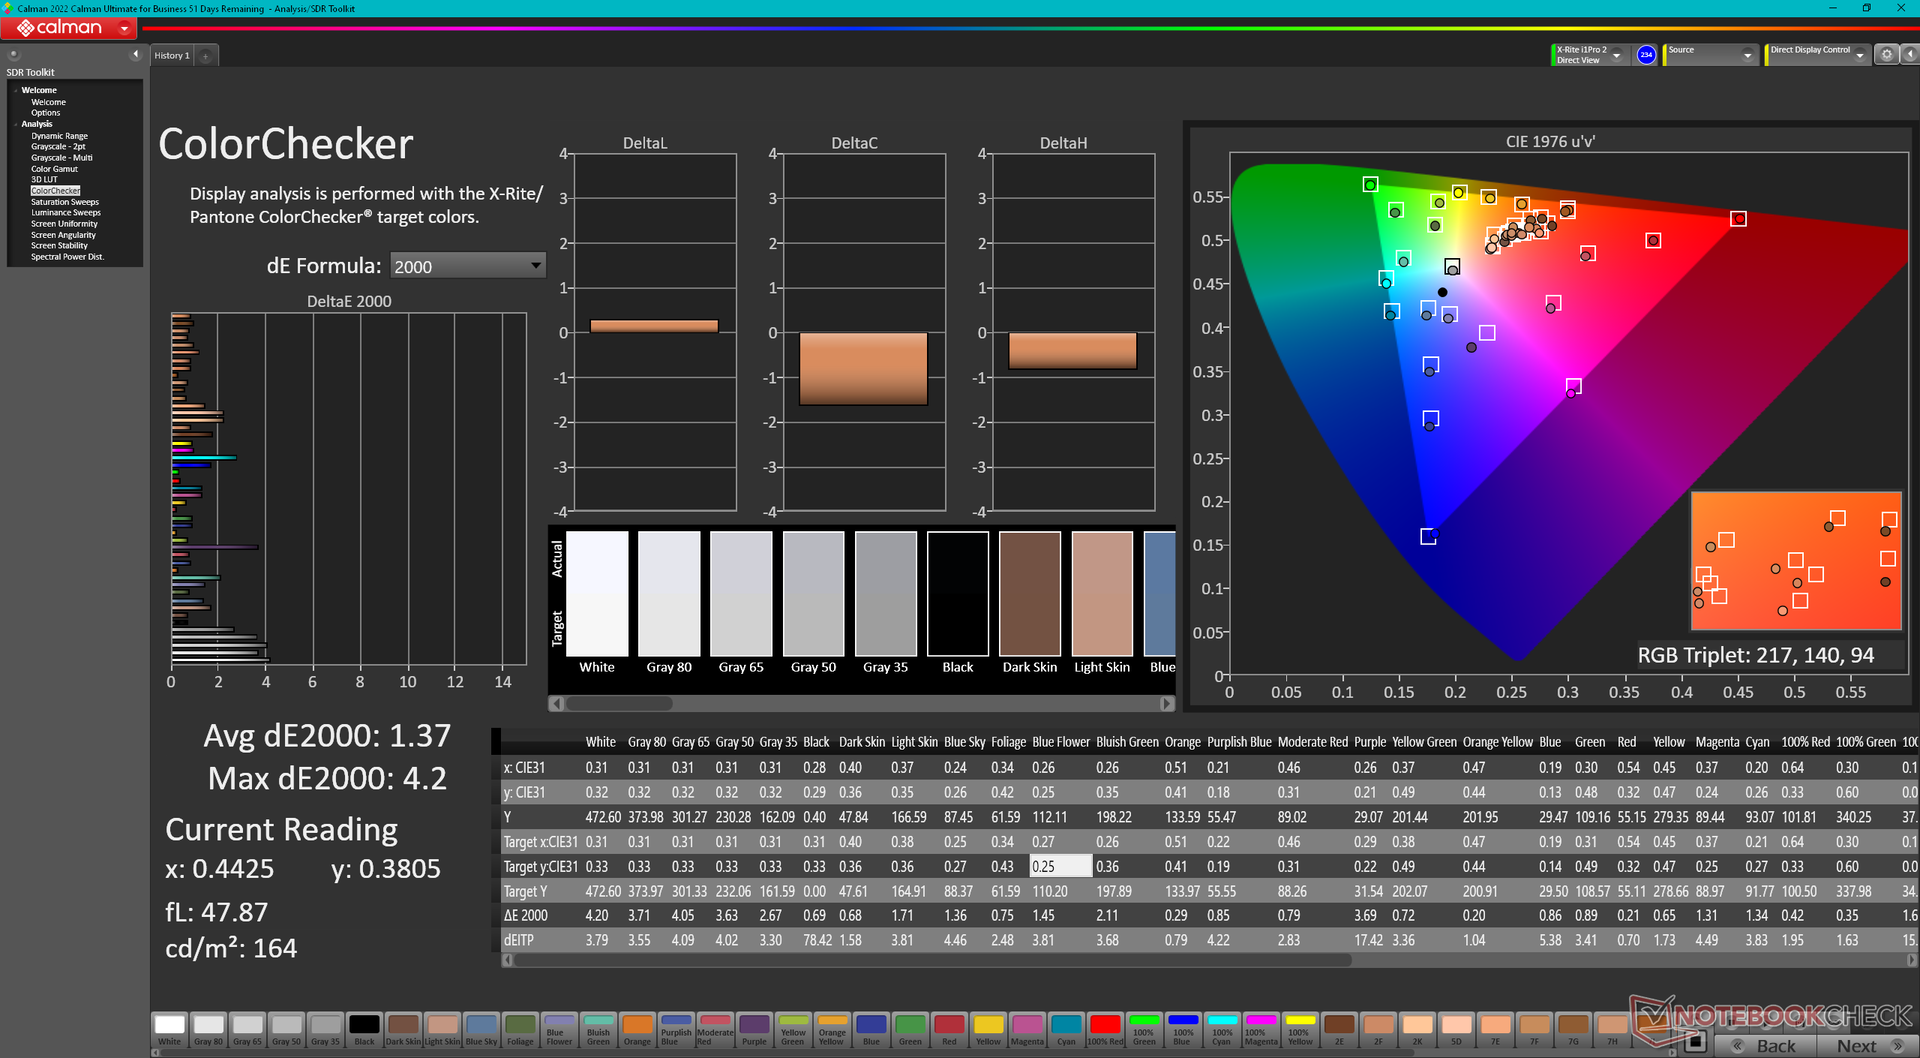
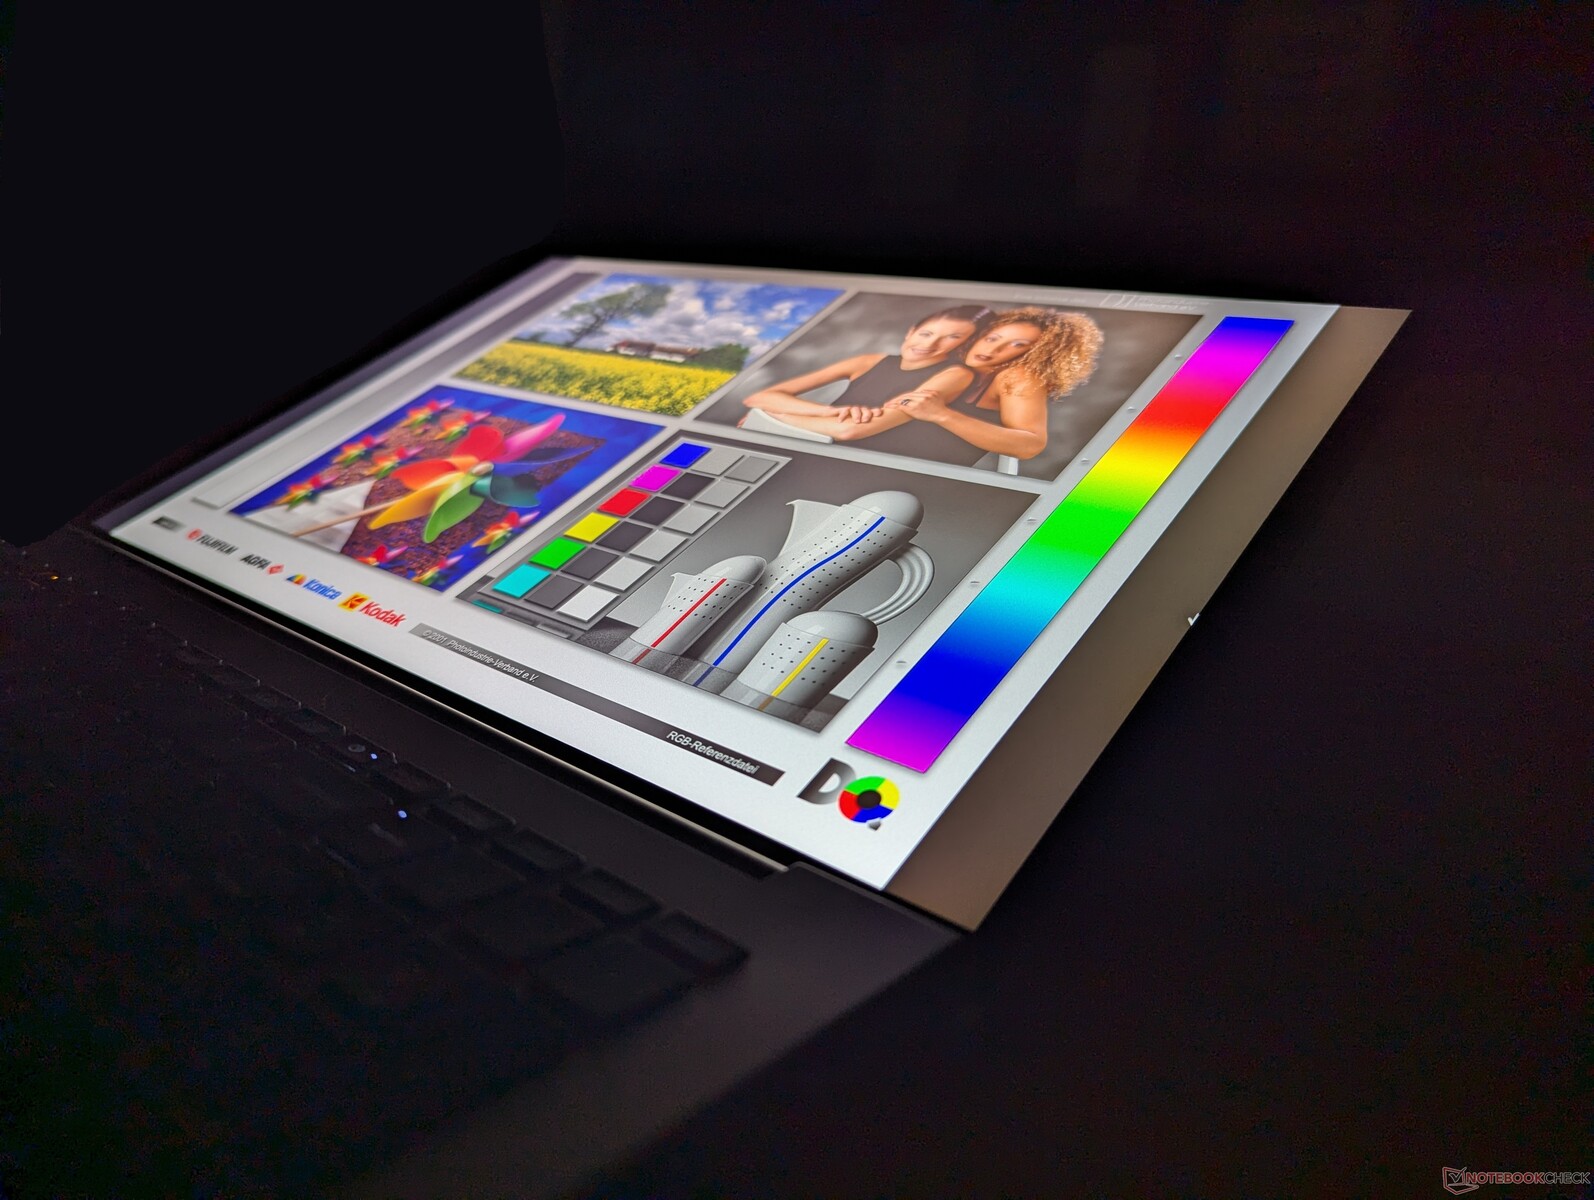
Display
Hier sind die fünf verfügbaren Anzeigeoptionen. Unser Testgerät ist mit dem fettgedruckten Panel ausgestattet:
- 3840 x 2400, OLED, Touchscreen, glänzend, 400 nits, 100% DCI-P3, 60 Hz
- 3840 x 2400, IPS, Non Touch, matt, 500 nits, 100% DCI-P3, 120 Hz
- 1920 x 1200, IPS, Non Touch, matt, 400 nits, 100% sRGB, 60 Hz
- 1920 x 1200, IPS, Non Touch, matt, 1000 nits, 100% sRGB, 60 Hz, Sure View integriert
- 1920 x 1200, IPS, Touchscreen, glänzend, 400 nits, 100% sRGB, 60 Hz
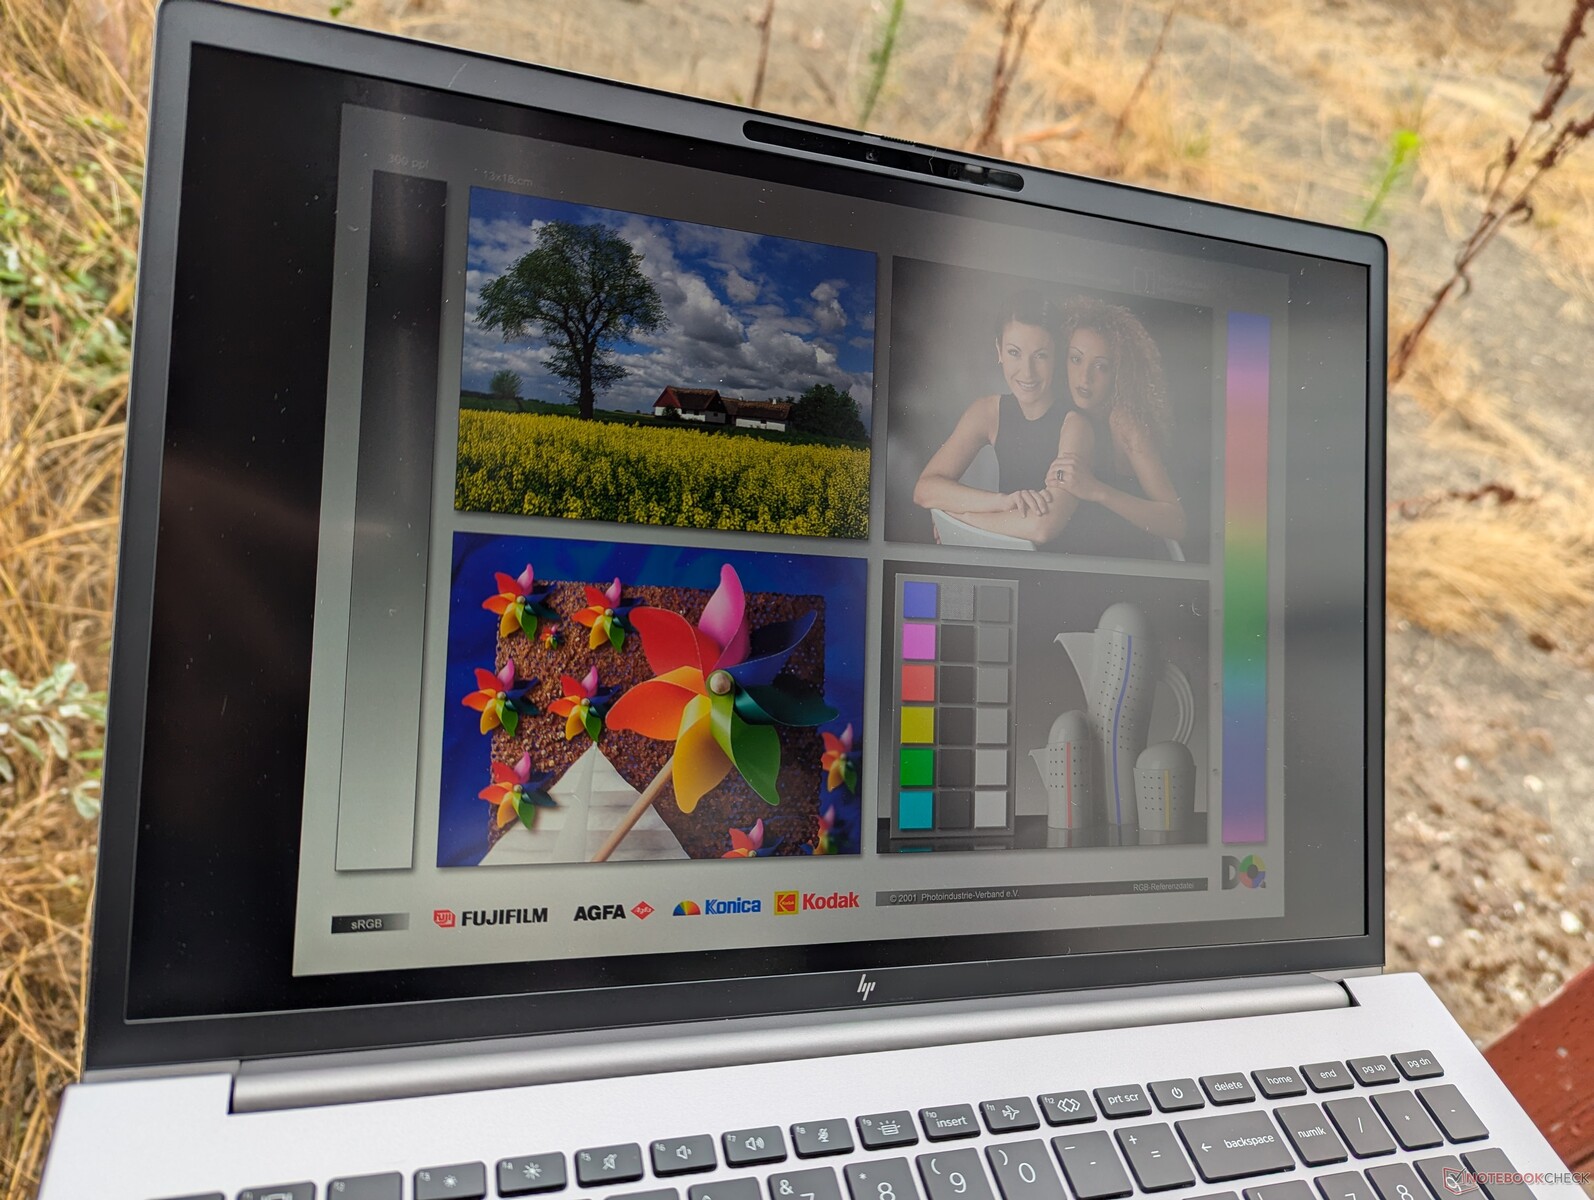
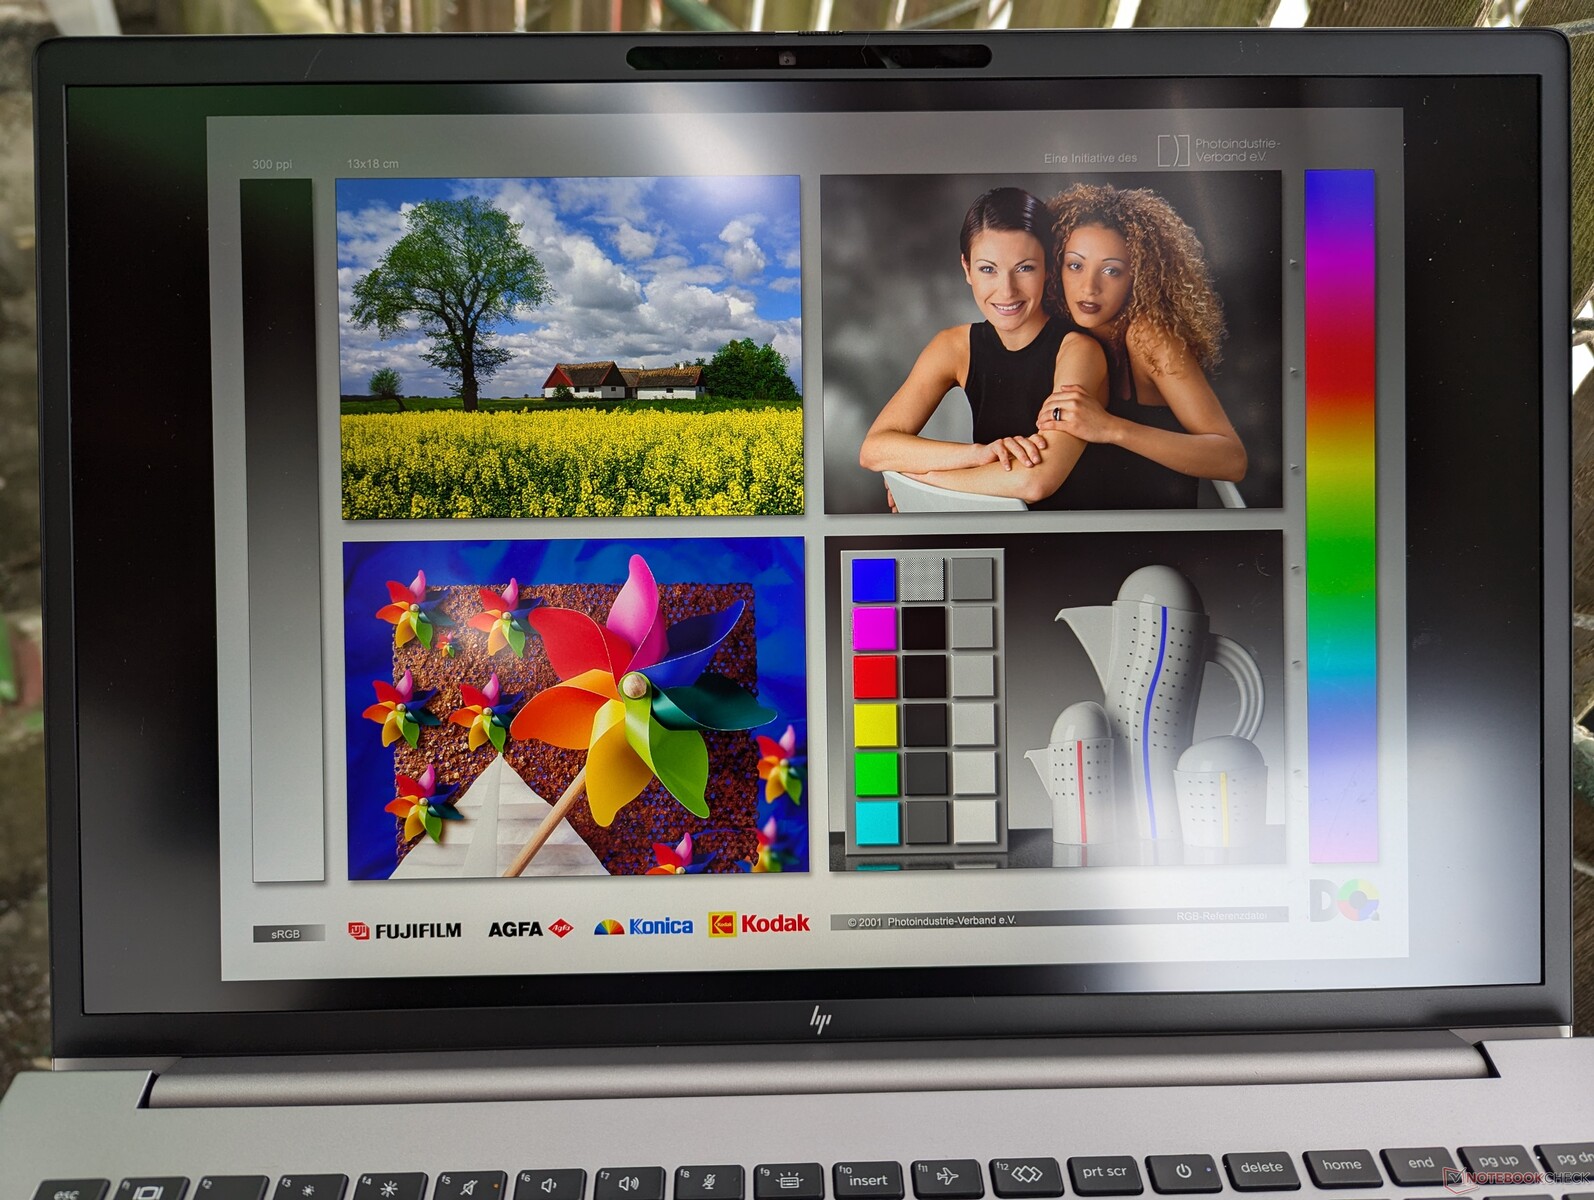
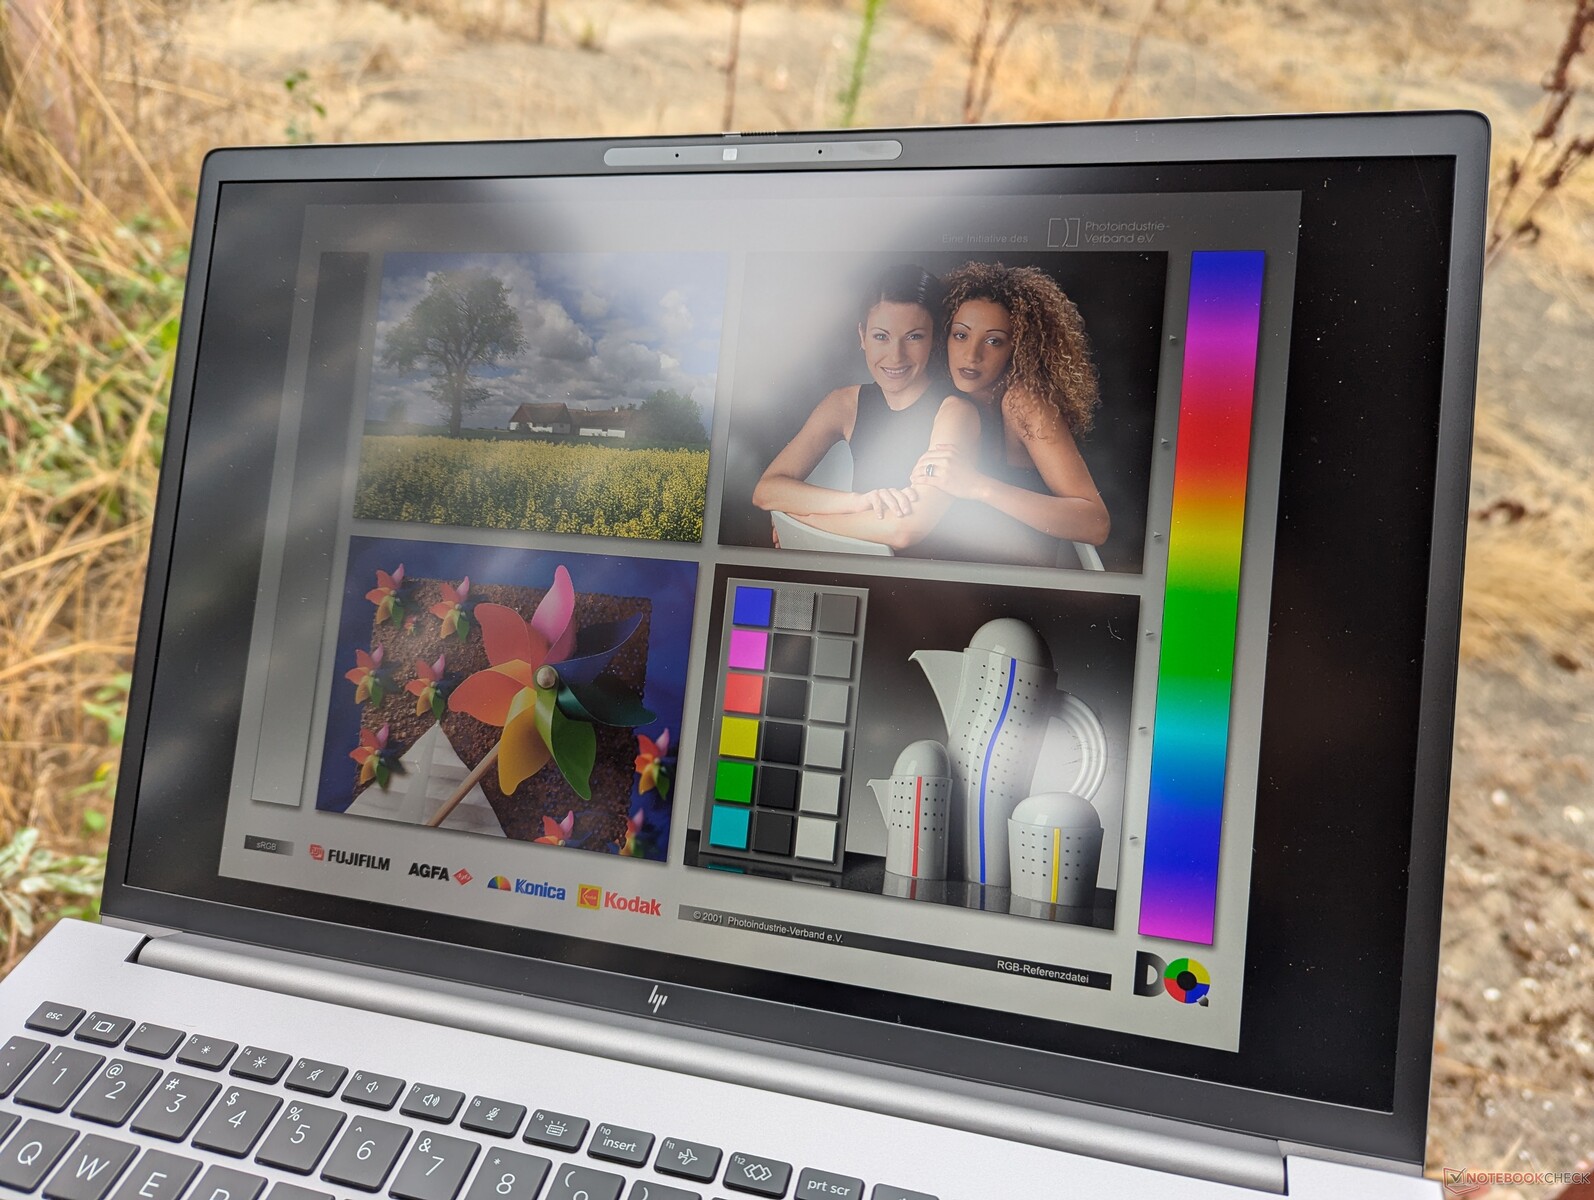
Bei diesem Bildschirm handelt es sich um das gleiche Modell, das auch bei unserem ZBook Fury 16 G10 verwendet wurde, sodass das visuelle Erlebnis identisch bleibt. Käufer, die das Notebook im Freien verwenden möchten, sollten die 1000-Nit-Option in Betracht ziehen. Diese ist jedoch leider mit der Sure View-Technologie verbunden, was die Betrachtungswinkel erheblich einschränkt und es schwieriger macht, den Bildschirm mit anderen zu teilen. Die OLED-Option bietet hingegen wesentlich bessere Schwarzwerte für Digitalkünstler und Multimedia-Bearbeitungsanwendungen, aber das glänzende Overlay und die Bildwiederholrate von nur 60 Hz könnten abschreckend wirken.
Die Windows dynamische Bildwiederholfrequenz wird bei unserem konfigurierten Bildschirm nur bis zu 60 Hz unterstützt.
| |||||||||||||||||||||||||
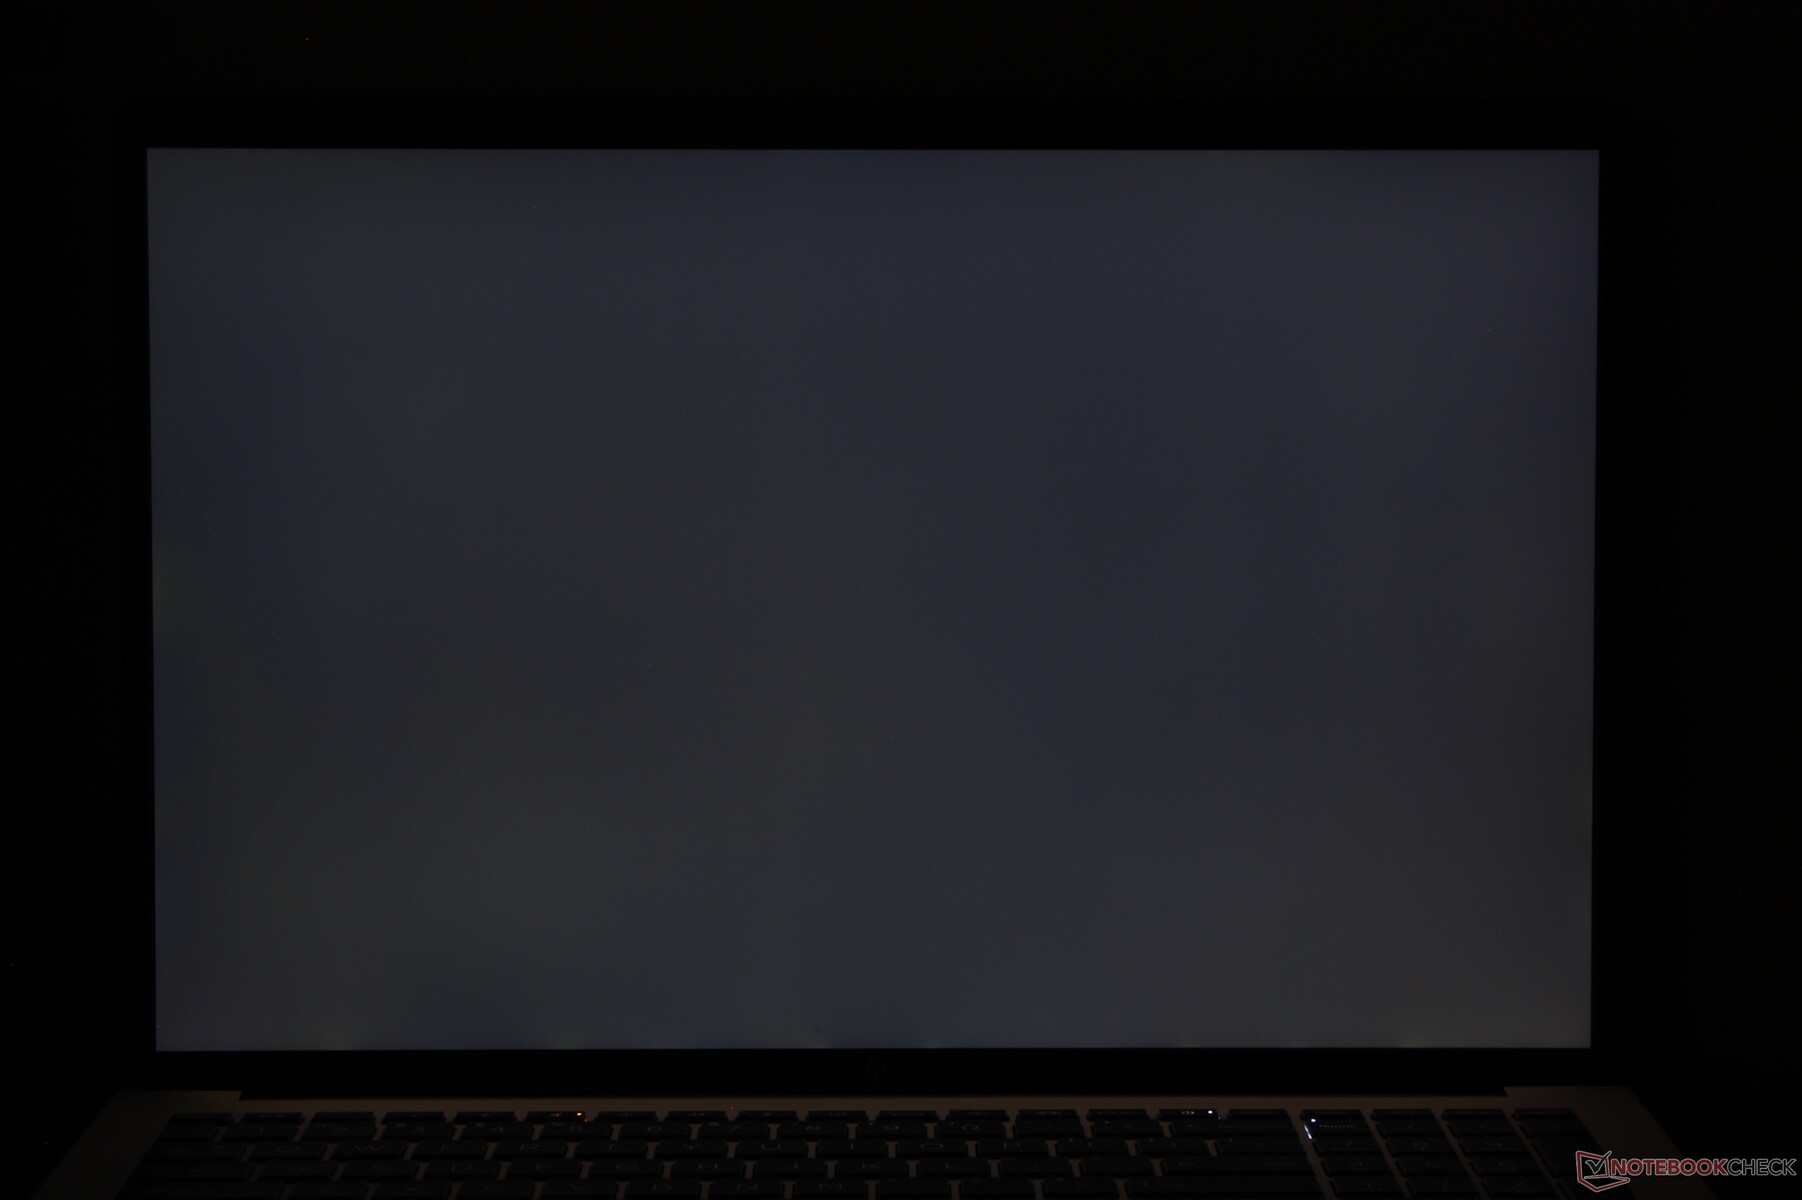
Ausleuchtung: 83 %
Helligkeit Akku: 457.6 cd/m²
Kontrast: 1064:1 (Schwarzwert: 0.43 cd/m²)
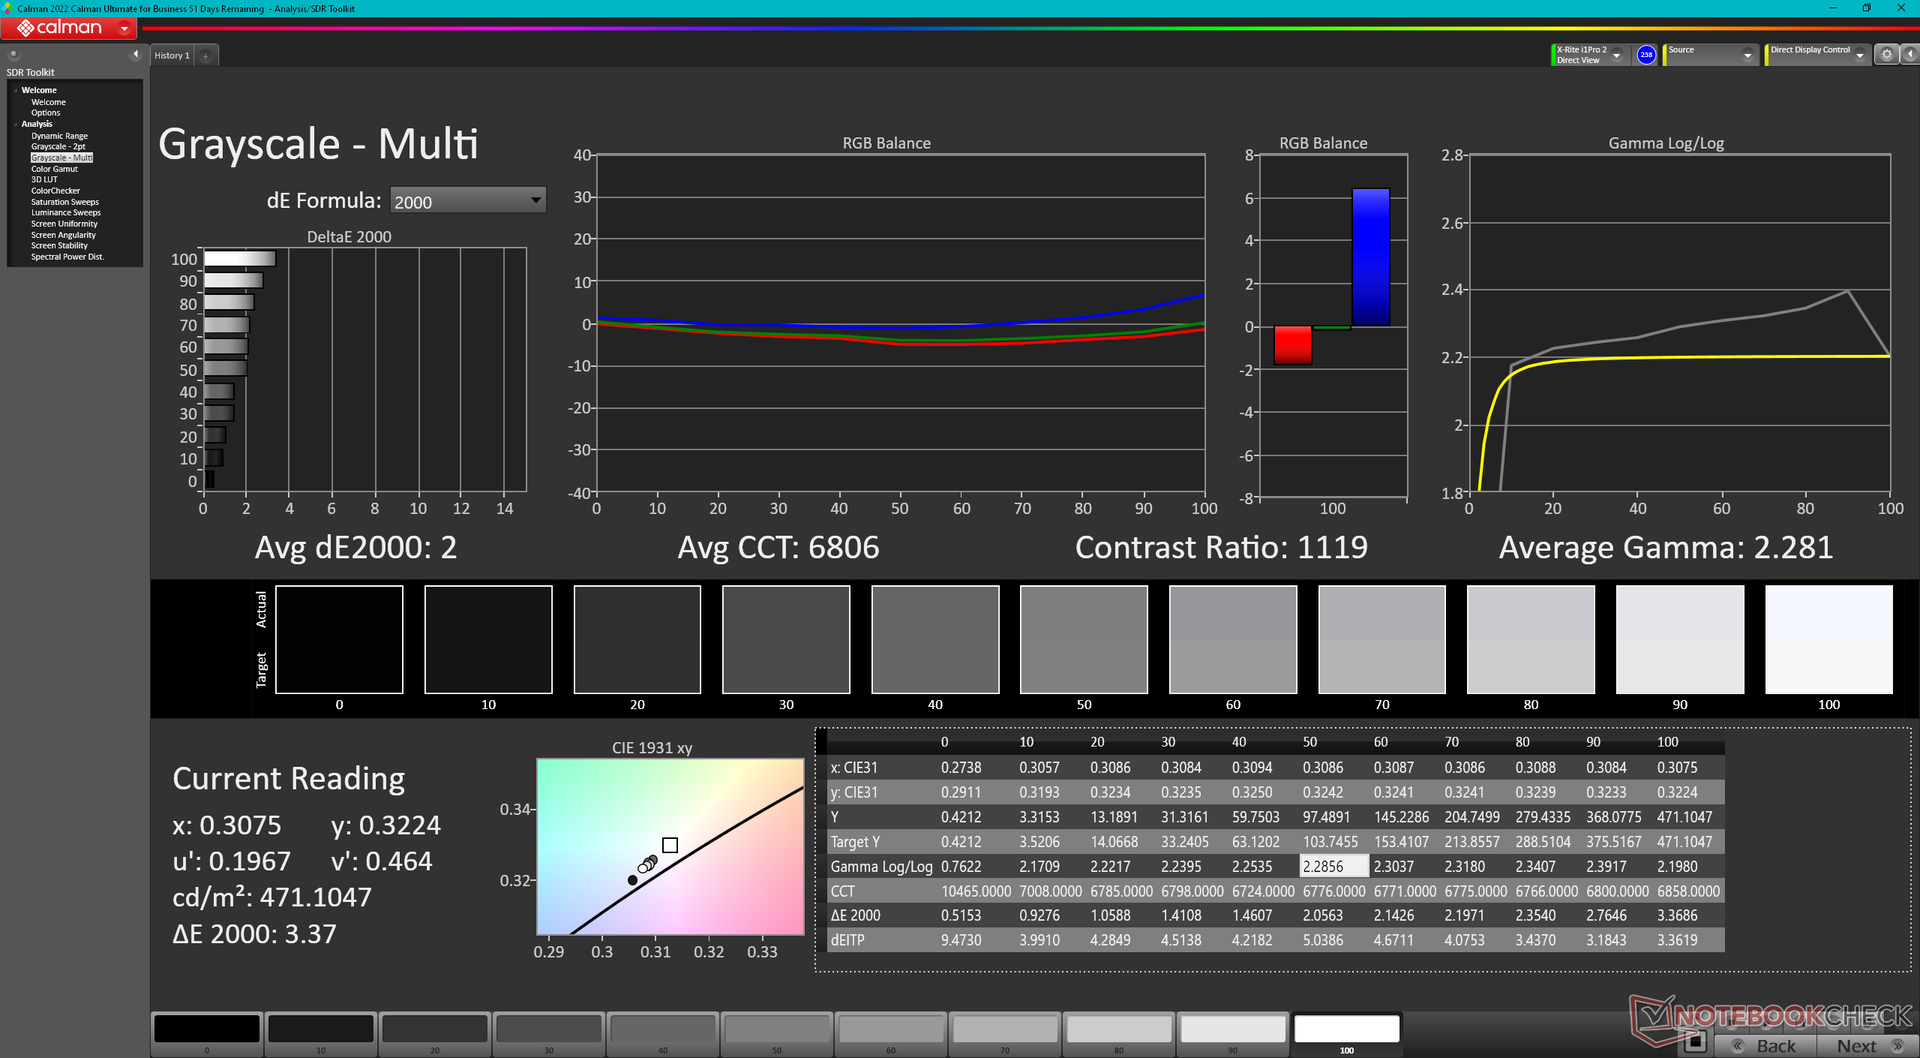
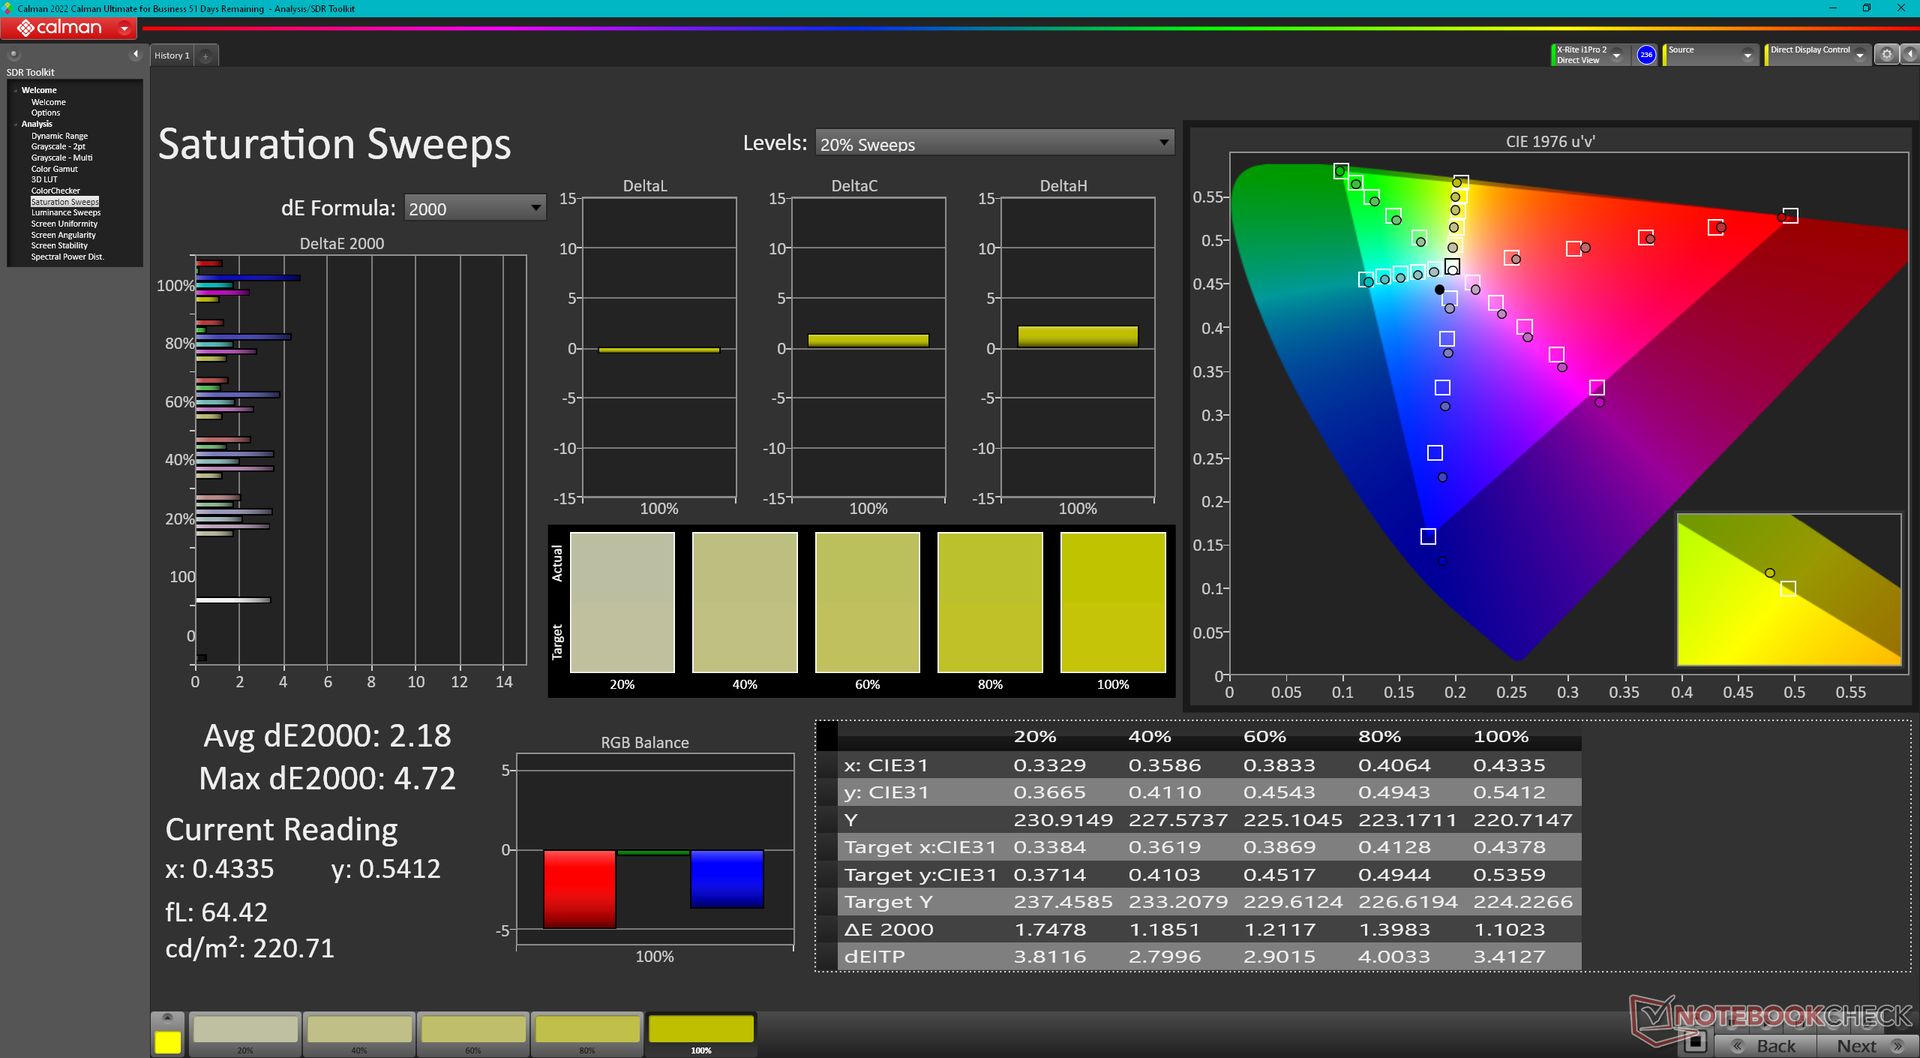
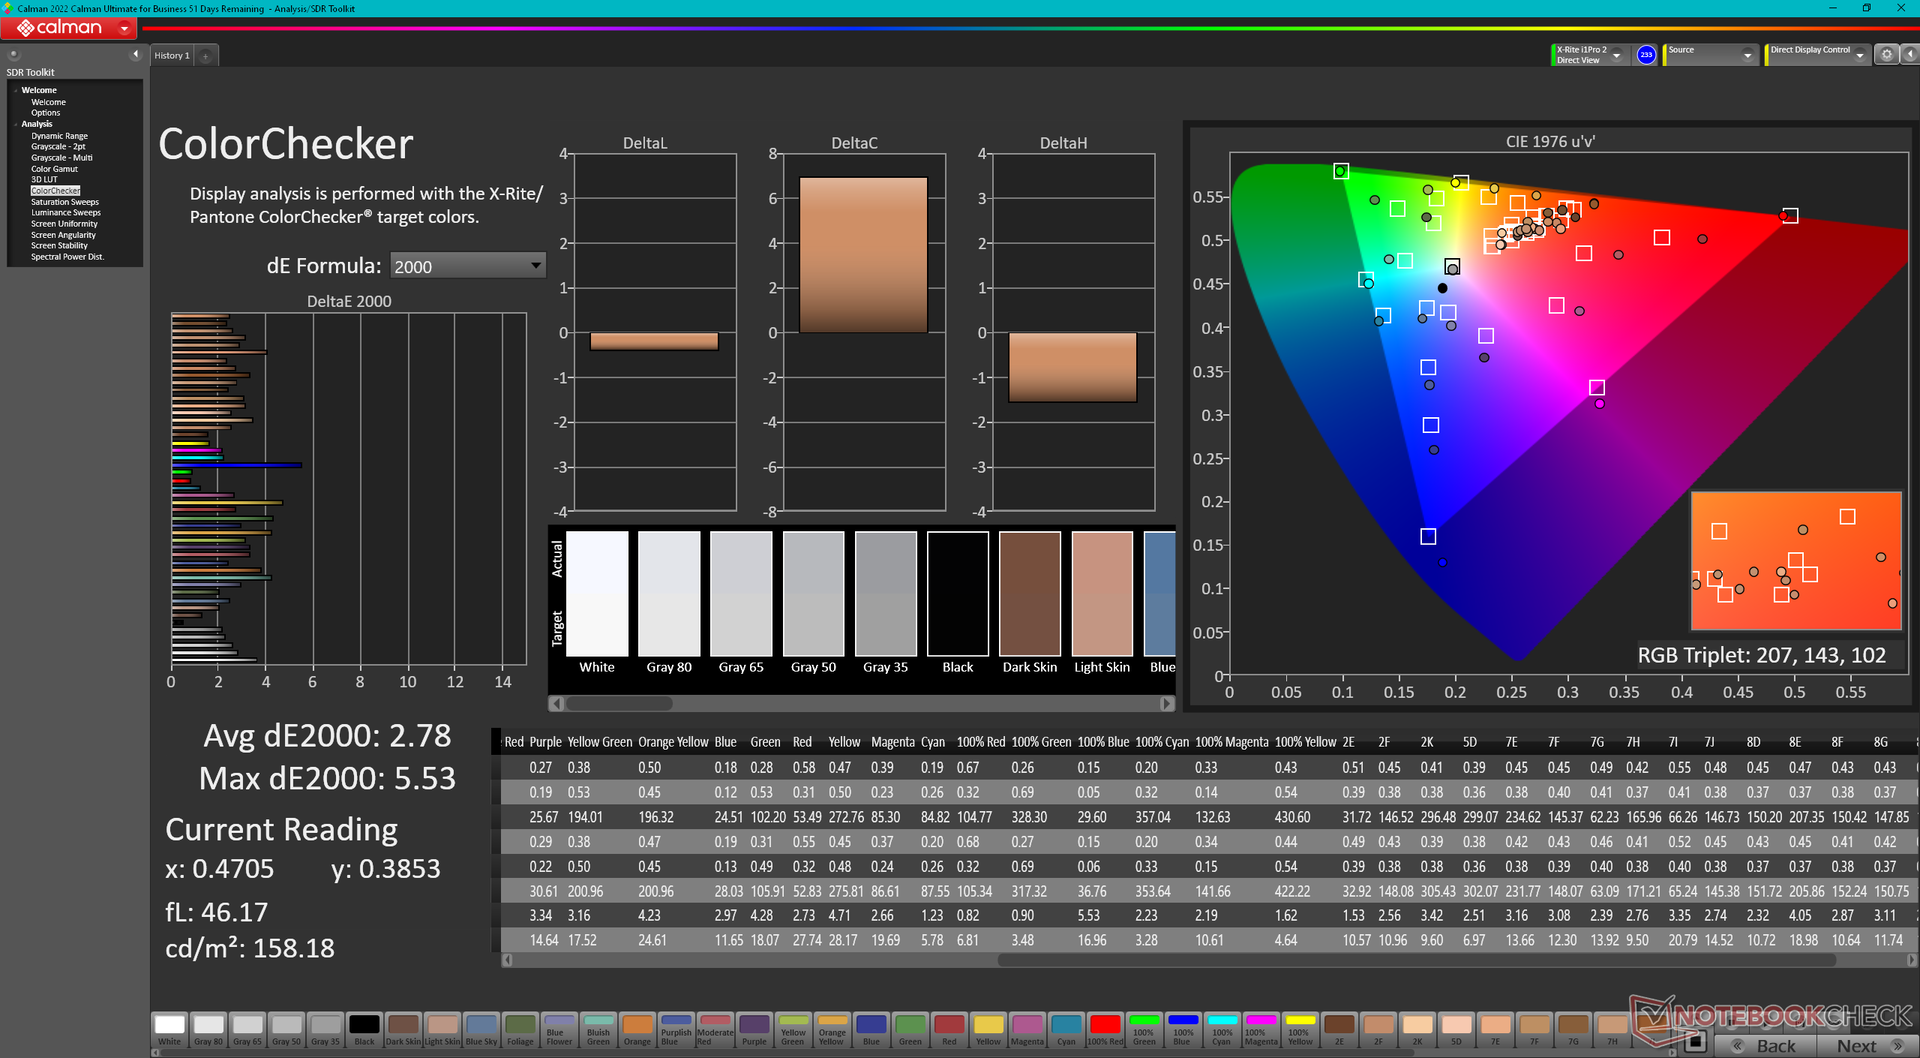
ΔE Color 2.78 | 0.5-29.43 Ø4.87, calibrated: 1.37
ΔE Greyscale 2 | 0.5-98 Ø5.1
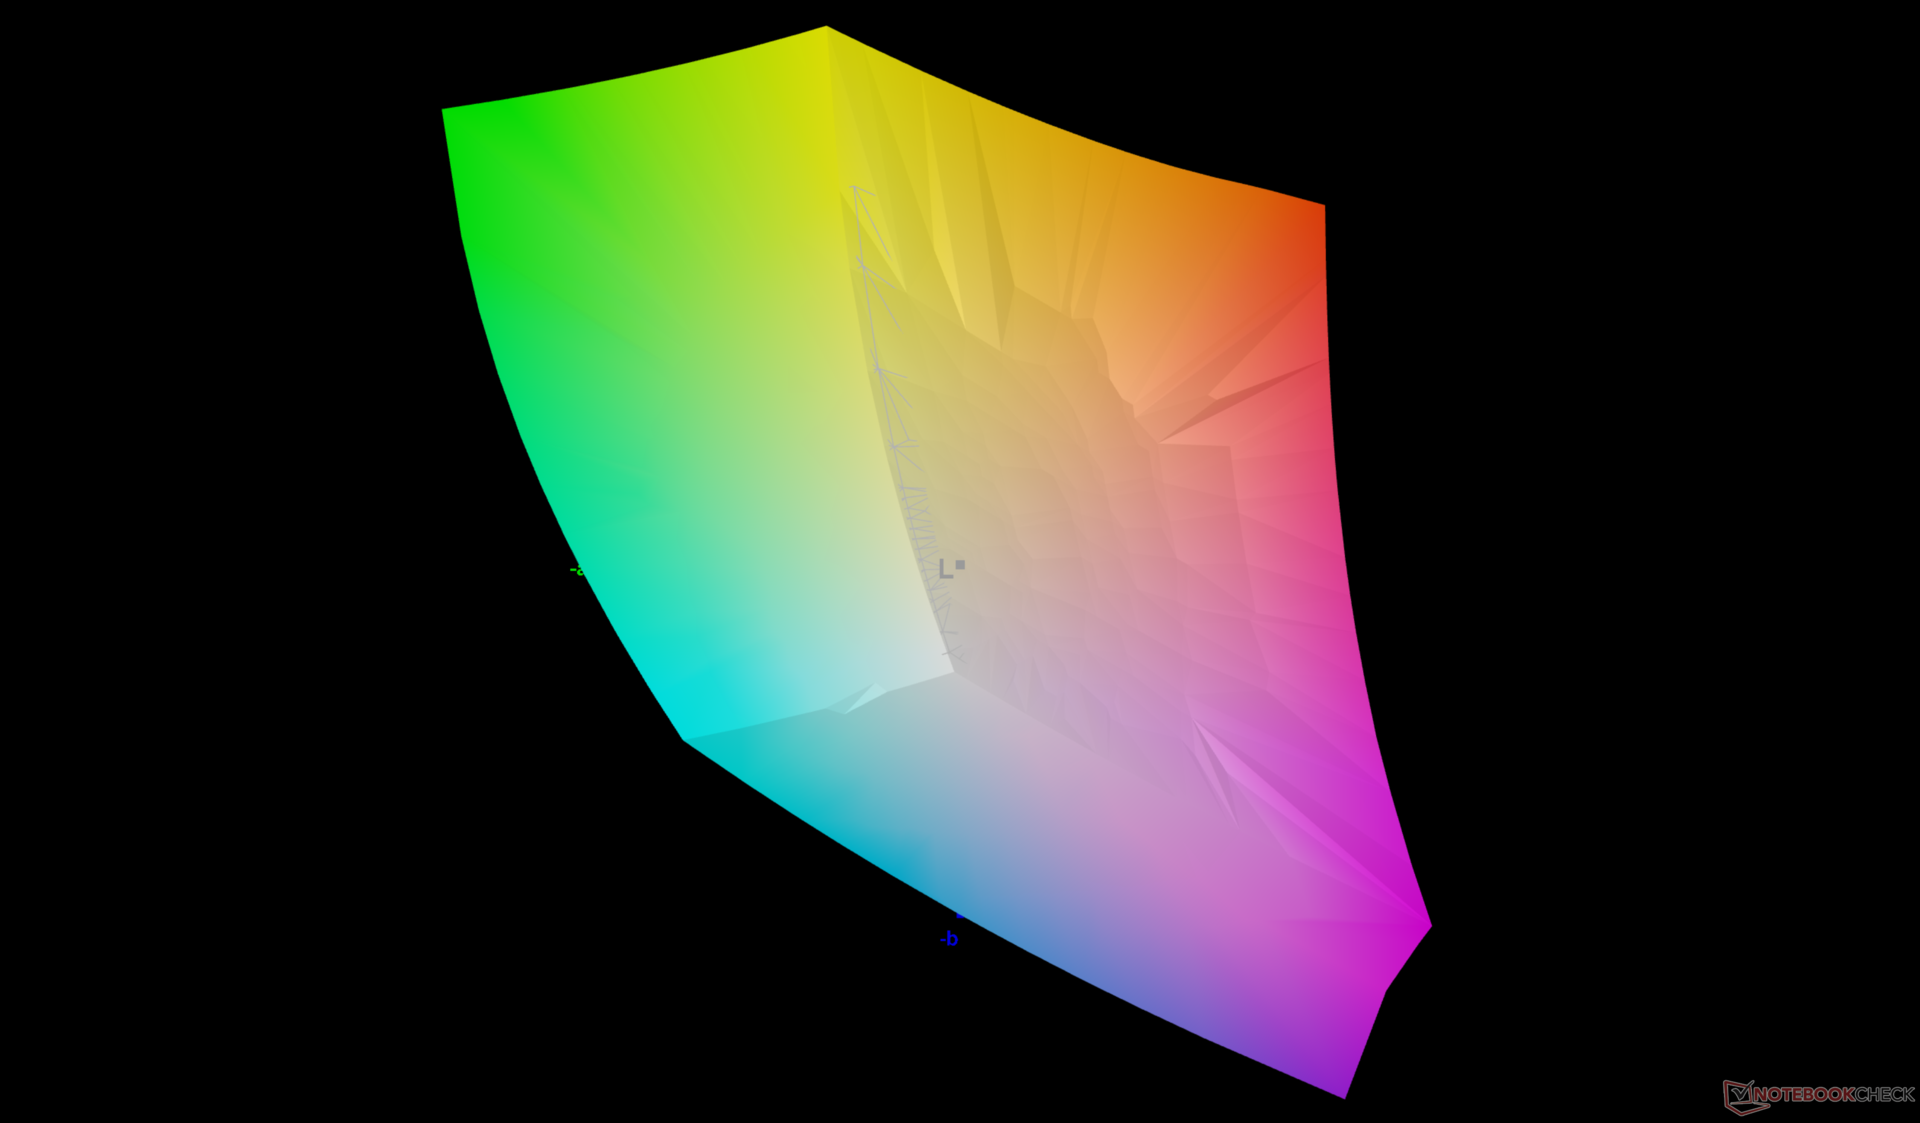
86% AdobeRGB 1998 (Argyll 2.2.0 3D)
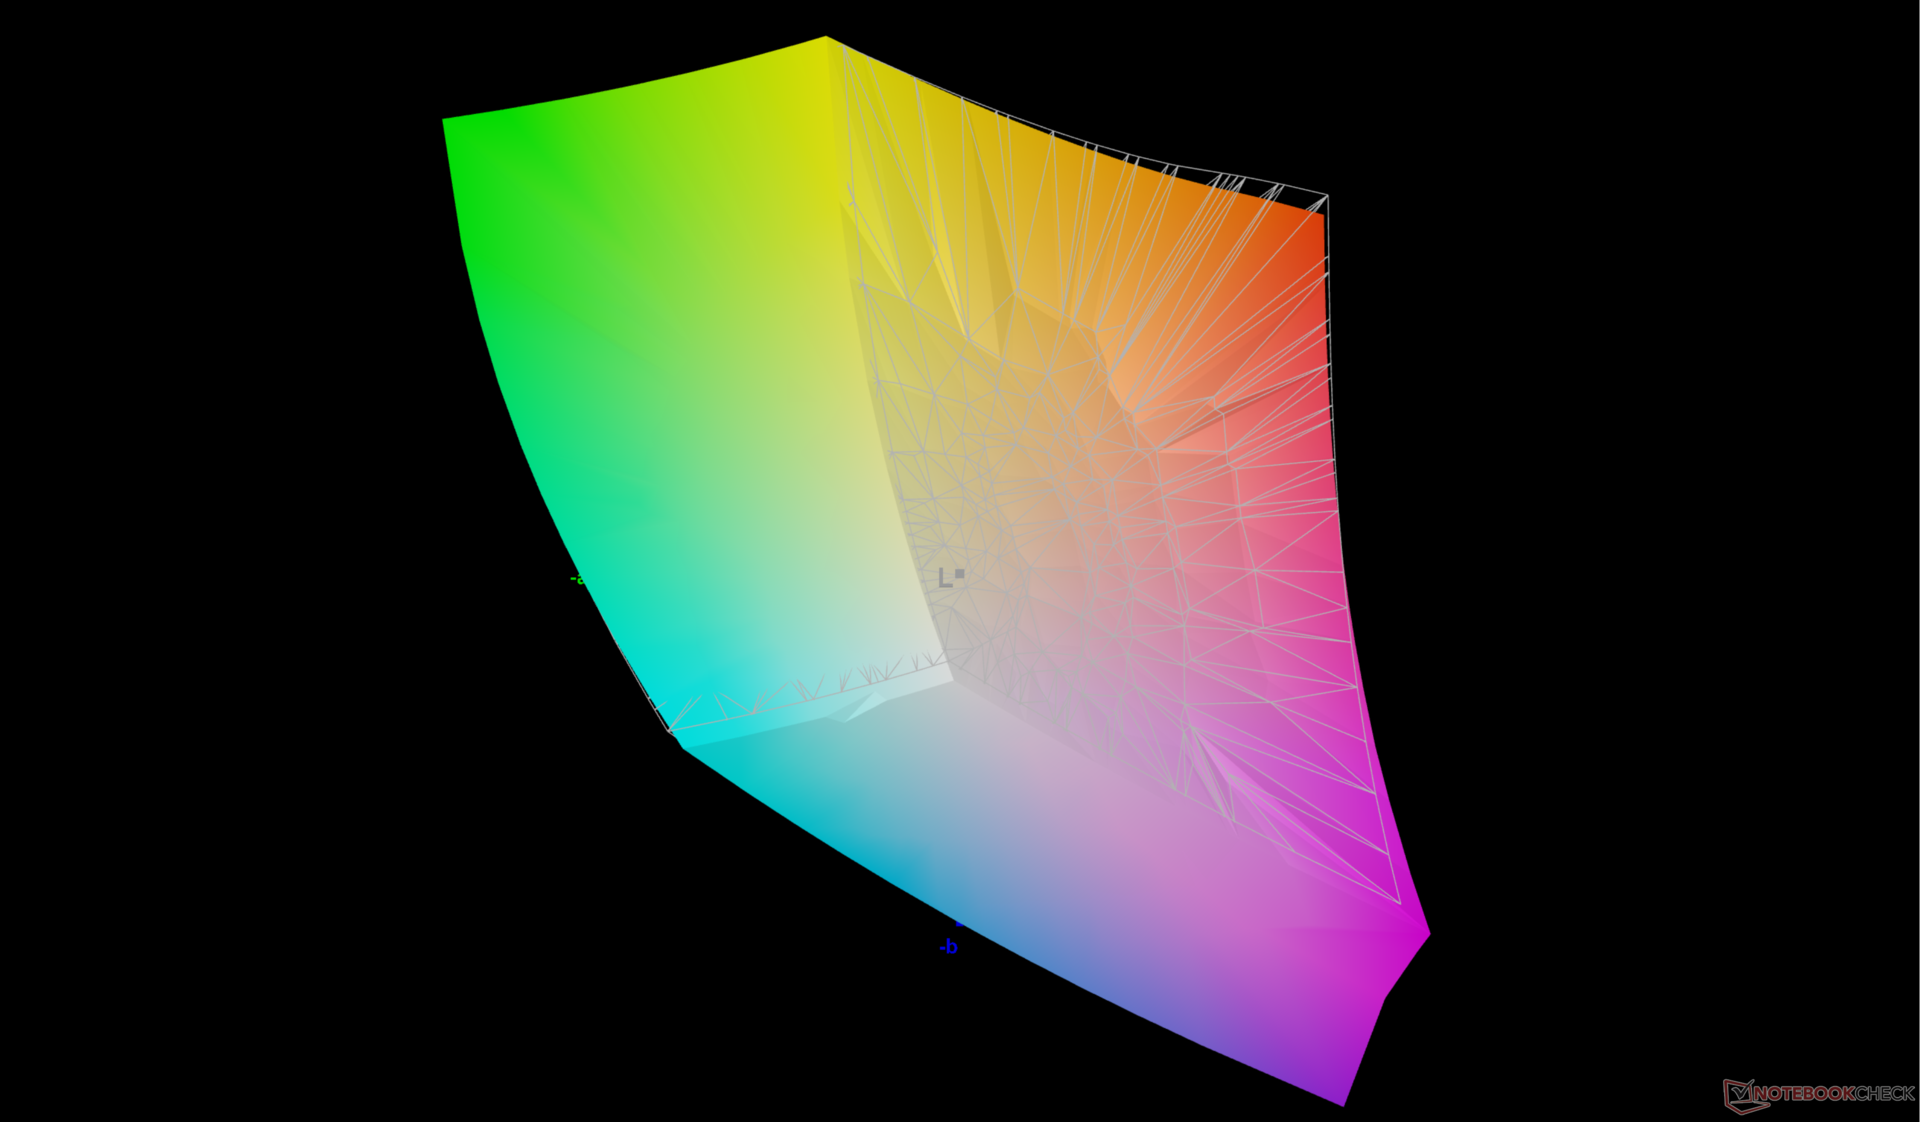
99.9% sRGB (Argyll 2.2.0 3D)
98.4% Display P3 (Argyll 2.2.0 3D)
Gamma: 2.28
| HP ZBook Fury 16 G11 AUO87A8, IPS, 3840x2400, 16", 120 Hz | HP ZBook Fury 16 G10 AUO87A8, IPS, 3840x2400, 16", 120 Hz | HP ZBook Fury 16 G9 BOE0A52, IPS, 3840x2400, 16", 60 Hz | Dell Precision 5690 Samsung 160YV03, OLED, 3840x2400, 16", 60 Hz | Lenovo ThinkPad P16 G2 21FA000FGE MNG007DA1-9, IPS LED, 2560x1600, 16", 165 Hz | Lenovo ThinkPad P1 G6 21FV001KUS Samsung ATNA60YV04-0, OLED, 3480x2400, 16", 60 Hz | Asus ProArt Studiobook 16 OLED H7604 ATNA60BX01-1, OLED, 3200x2000, 16", 120 Hz | |
|---|---|---|---|---|---|---|---|
| Display | 0% | -0% | 4% | -15% | 5% | 2% | |
| Display P3 Coverage | 98.4 | 98 0% | 97.4 -1% | 99.8 1% | 71 -28% | 99.8 1% | 99.6 1% |
| sRGB Coverage | 99.9 | 99.9 0% | 99.9 0% | 100 0% | 99.2 -1% | 100 0% | 100 0% |
| AdobeRGB 1998 Coverage | 86 | 86.2 0% | 86.3 0% | 96.6 12% | 73.2 -15% | 97.9 14% | 89.4 4% |
| Response Times | -9% | -11% | 83% | -16% | 82% | 93% | |
| Response Time Grey 50% / Grey 80% * | 11.4 ? | 11.9 ? -4% | 13.7 ? -20% | 1.7 ? 85% | 12.8 ? -12% | 1.69 ? 85% | 0.59 ? 95% |
| Response Time Black / White * | 8.4 ? | 9.6 ? -14% | 8.6 ? -2% | 1.7 ? 80% | 10.1 ? -20% | 1.73 ? 79% | 0.79 ? 91% |
| PWM Frequency | 60 ? | 60 ? | 240 ? | ||||
| Bildschirm | 19% | -25% | -8% | -7% | 19% | 179% | |
| Helligkeit Bildmitte | 457.6 | 514.6 12% | 530.5 16% | 348.1 -24% | 510 11% | 375.1 -18% | 349 -24% |
| Brightness | 466 | 495 6% | 476 2% | 351 -25% | 517 11% | 379 -19% | 350 -25% |
| Brightness Distribution | 83 | 90 8% | 83 0% | 97 17% | 89 7% | 98 18% | 95 14% |
| Schwarzwert * | 0.43 | 0.46 -7% | 0.57 -33% | 0.37 14% | 0.02 95% | ||
| Kontrast | 1064 | 1119 5% | 931 -12% | 1378 30% | 17450 1540% | ||
| Delta E Colorchecker * | 2.78 | 2.4 14% | 2.26 19% | 4.18 -50% | 2.6 6% | 1.16 58% | 2.1 24% |
| Colorchecker dE 2000 max. * | 5.53 | 4.86 12% | 6.68 -21% | 5.2 6% | 2.94 47% | 5.5 1% | |
| Colorchecker dE 2000 calibrated * | 1.37 | 0.4 71% | 4.73 -245% | 0.97 29% | 2.3 -68% | 2.1 -53% | |
| Delta E Graustufen * | 2 | 1 50% | 1 50% | 1.7 15% | 3.6 -80% | 1.4 30% | 1.2 40% |
| Gamma | 2.28 96% | 2.3 96% | 2.28 96% | 2.2 100% | 2.26 97% | 2.2 100% | 2.19 100% |
| CCT | 6806 96% | 6553 99% | 6543 99% | 6198 105% | 5969 109% | 6325 103% | 6545 99% |
| Durchschnitt gesamt (Programm / Settings) | 3% /
11% | -12% /
-17% | 26% /
10% | -13% /
-10% | 35% /
27% | 91% /
129% |
* ... kleinere Werte sind besser
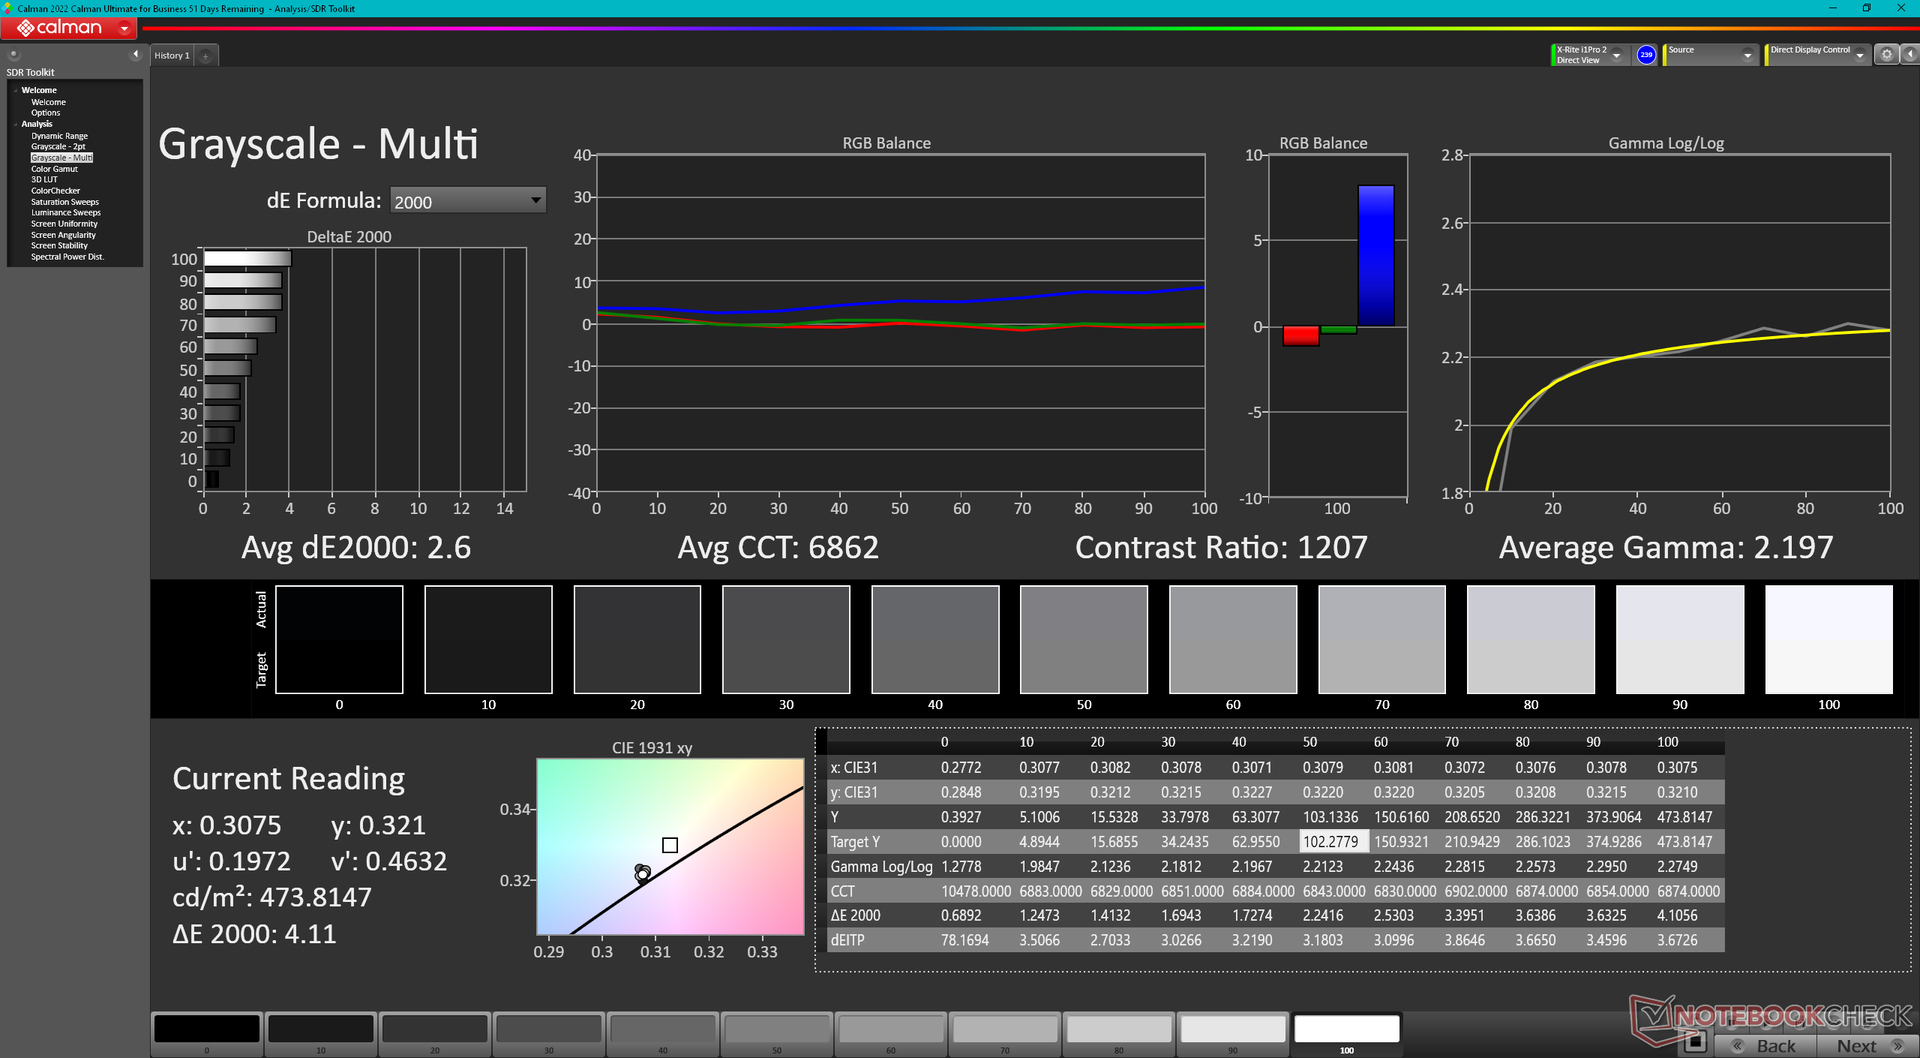
Das Display ist mit durchschnittlichen Delta-E-Werten für Graustufen und Farben von nur 2 bzw. 2,18 gut auf den P3-Standard kalibriert. Eine zusätzliche Kalibrierung des Bildschirms mit unserem X-Rite-Kolorimeter würde die Genauigkeit nur minimal verbessern und wäre für die meisten Nutzer nicht notwendig.
Reaktionszeiten (Response Times) des Displays
| ↔ Reaktionszeiten Schwarz zu Weiß | ||
|---|---|---|
| 8.4 ms ... steigend ↗ und fallend ↘ kombiniert | ↗ 4.7 ms steigend | 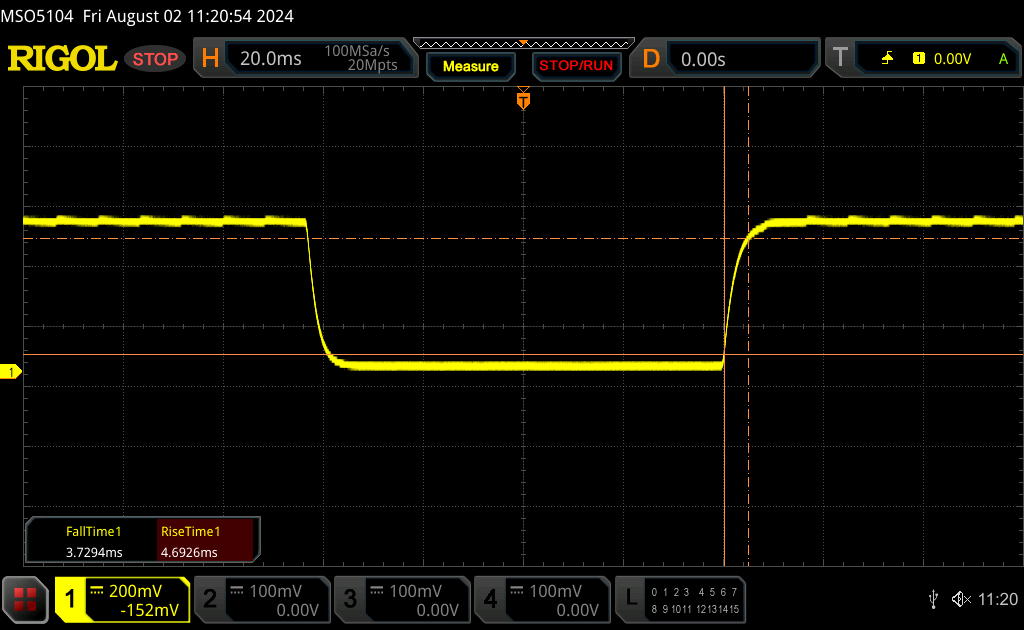 |
| ↘ 3.7 ms fallend | ||
| Die gemessenen Reaktionszeiten sind kurz wodurch sich der Bildschirm auch für Spiele gut eignen sollte. Im Vergleich rangierten die bei uns getesteten Geräte von 0.1 (Minimum) zu 240 (Maximum) ms. » 21 % aller Screens waren schneller als der getestete. Daher sind die gemessenen Reaktionszeiten besser als der Durchschnitt aller vermessenen Geräte (20.8 ms). | ||
| ↔ Reaktionszeiten 50% Grau zu 80% Grau | ||
| 11.4 ms ... steigend ↗ und fallend ↘ kombiniert | ↗ 5.3 ms steigend | 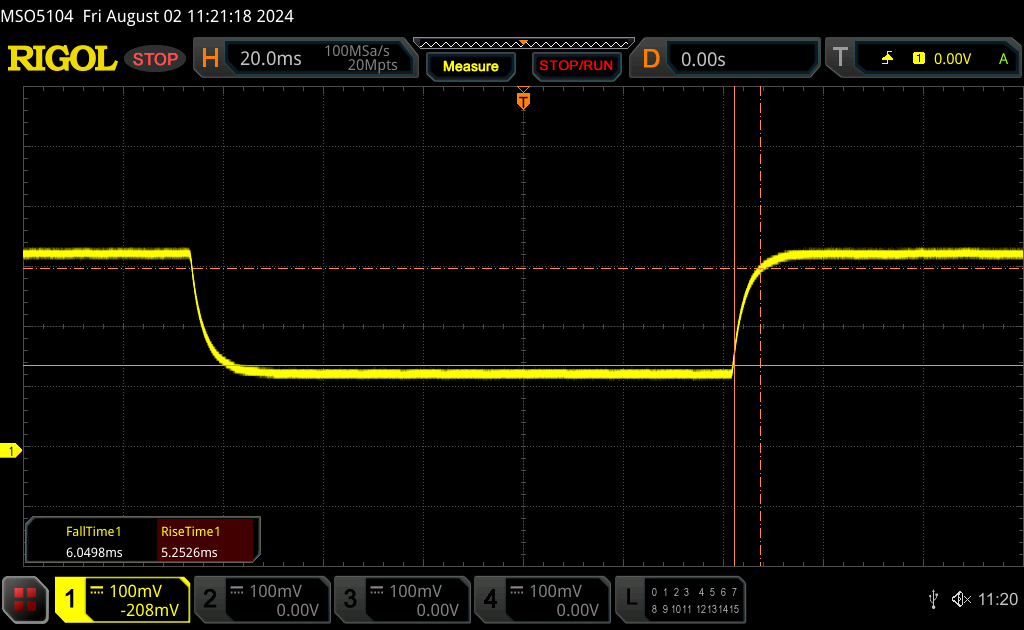 |
| ↘ 6.1 ms fallend | ||
| Die gemessenen Reaktionszeiten sind gut, für anspruchsvolle Spieler könnten der Bildschirm jedoch zu langsam sein. Im Vergleich rangierten die bei uns getesteten Geräte von 0.165 (Minimum) zu 636 (Maximum) ms. » 22 % aller Screens waren schneller als der getestete. Daher sind die gemessenen Reaktionszeiten besser als der Durchschnitt aller vermessenen Geräte (32.5 ms). | ||
Bildschirm-Flackern / PWM (Pulse-Width Modulation)
| Flackern / PWM nicht festgestellt |  | ||
Im Vergleich: 53 % aller getesteten Geräte nutzten kein PWM um die Helligkeit zu reduzieren. Wenn PWM eingesetzt wurde, dann bei einer Frequenz von durchschnittlich 8516 (Minimum 5, Maximum 343500) Hz. | |||


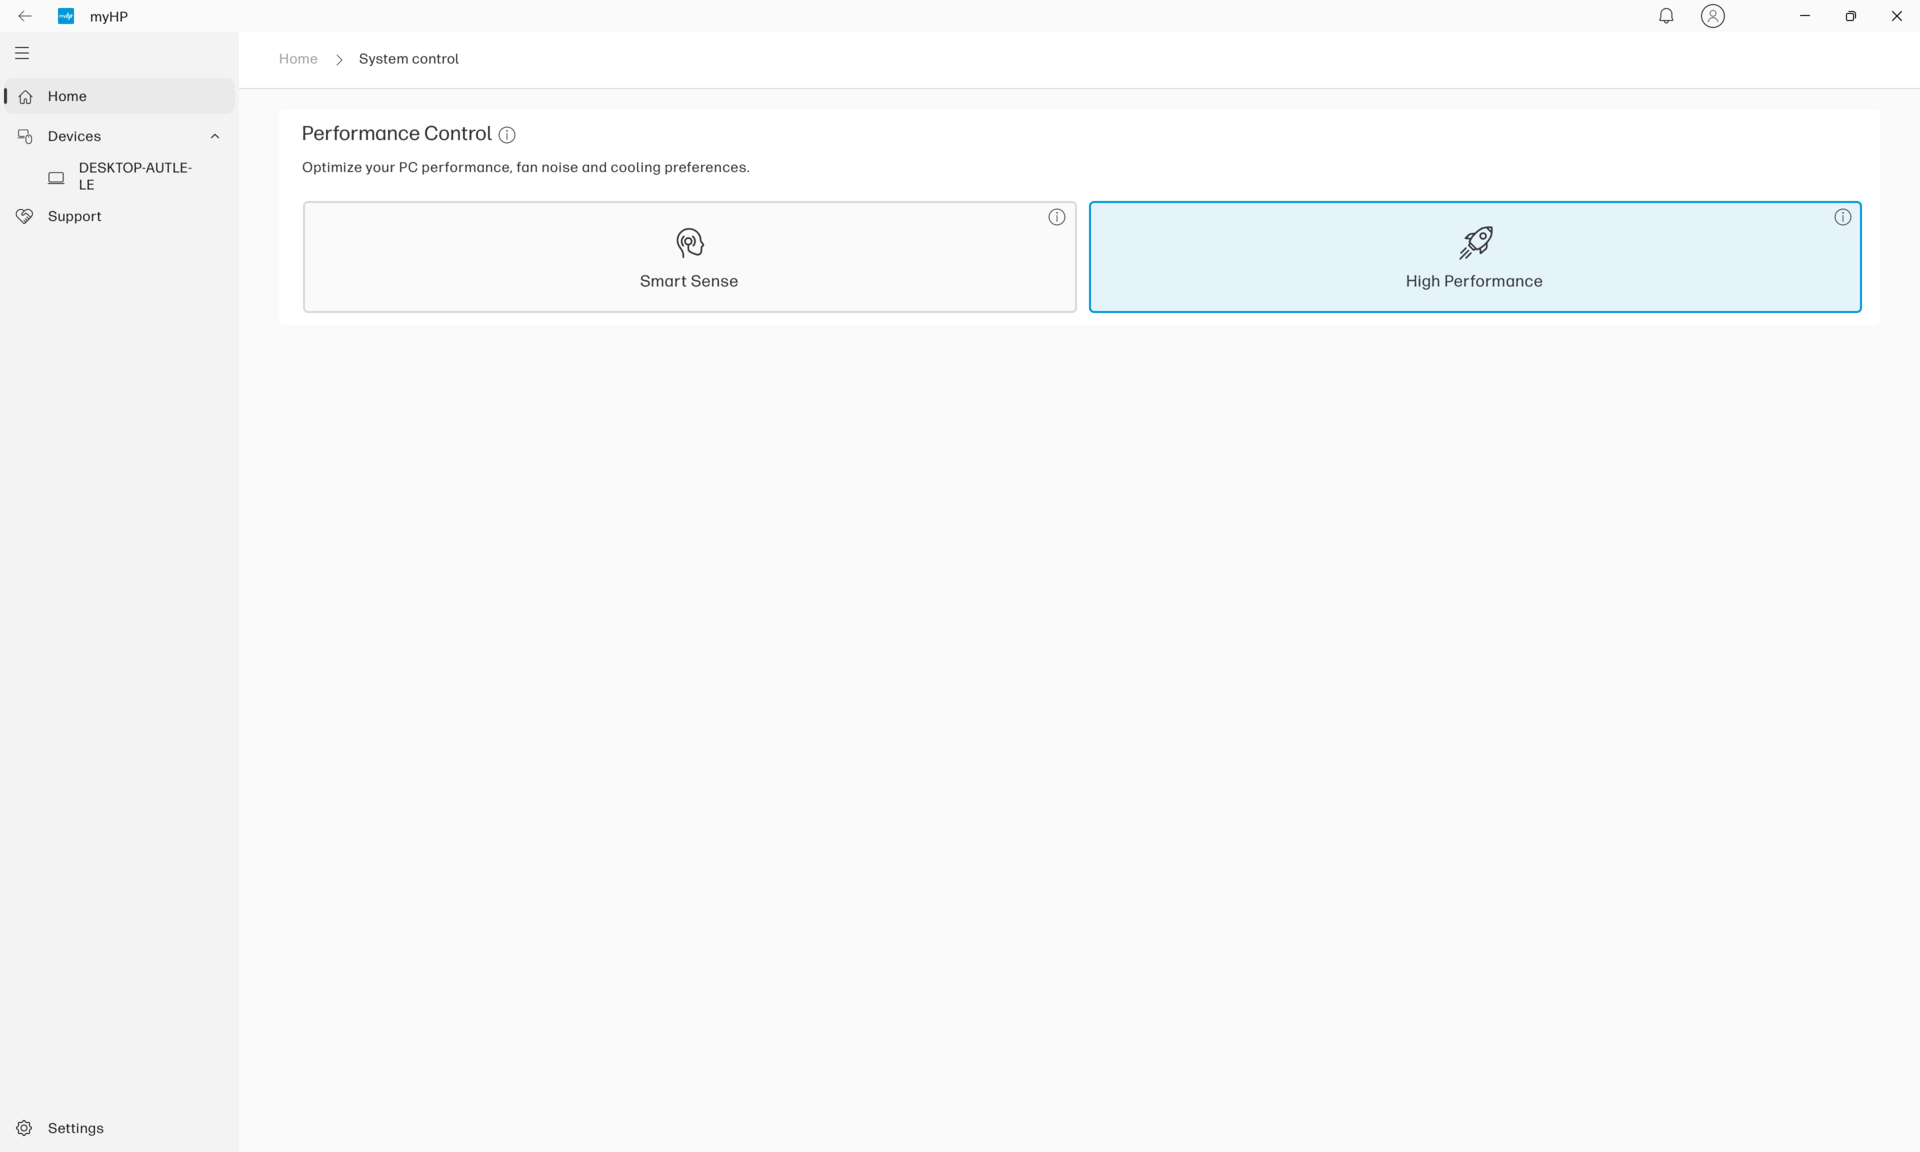
Performance - Höheres Turbo-Boost-Potenzial
Testbedingungen
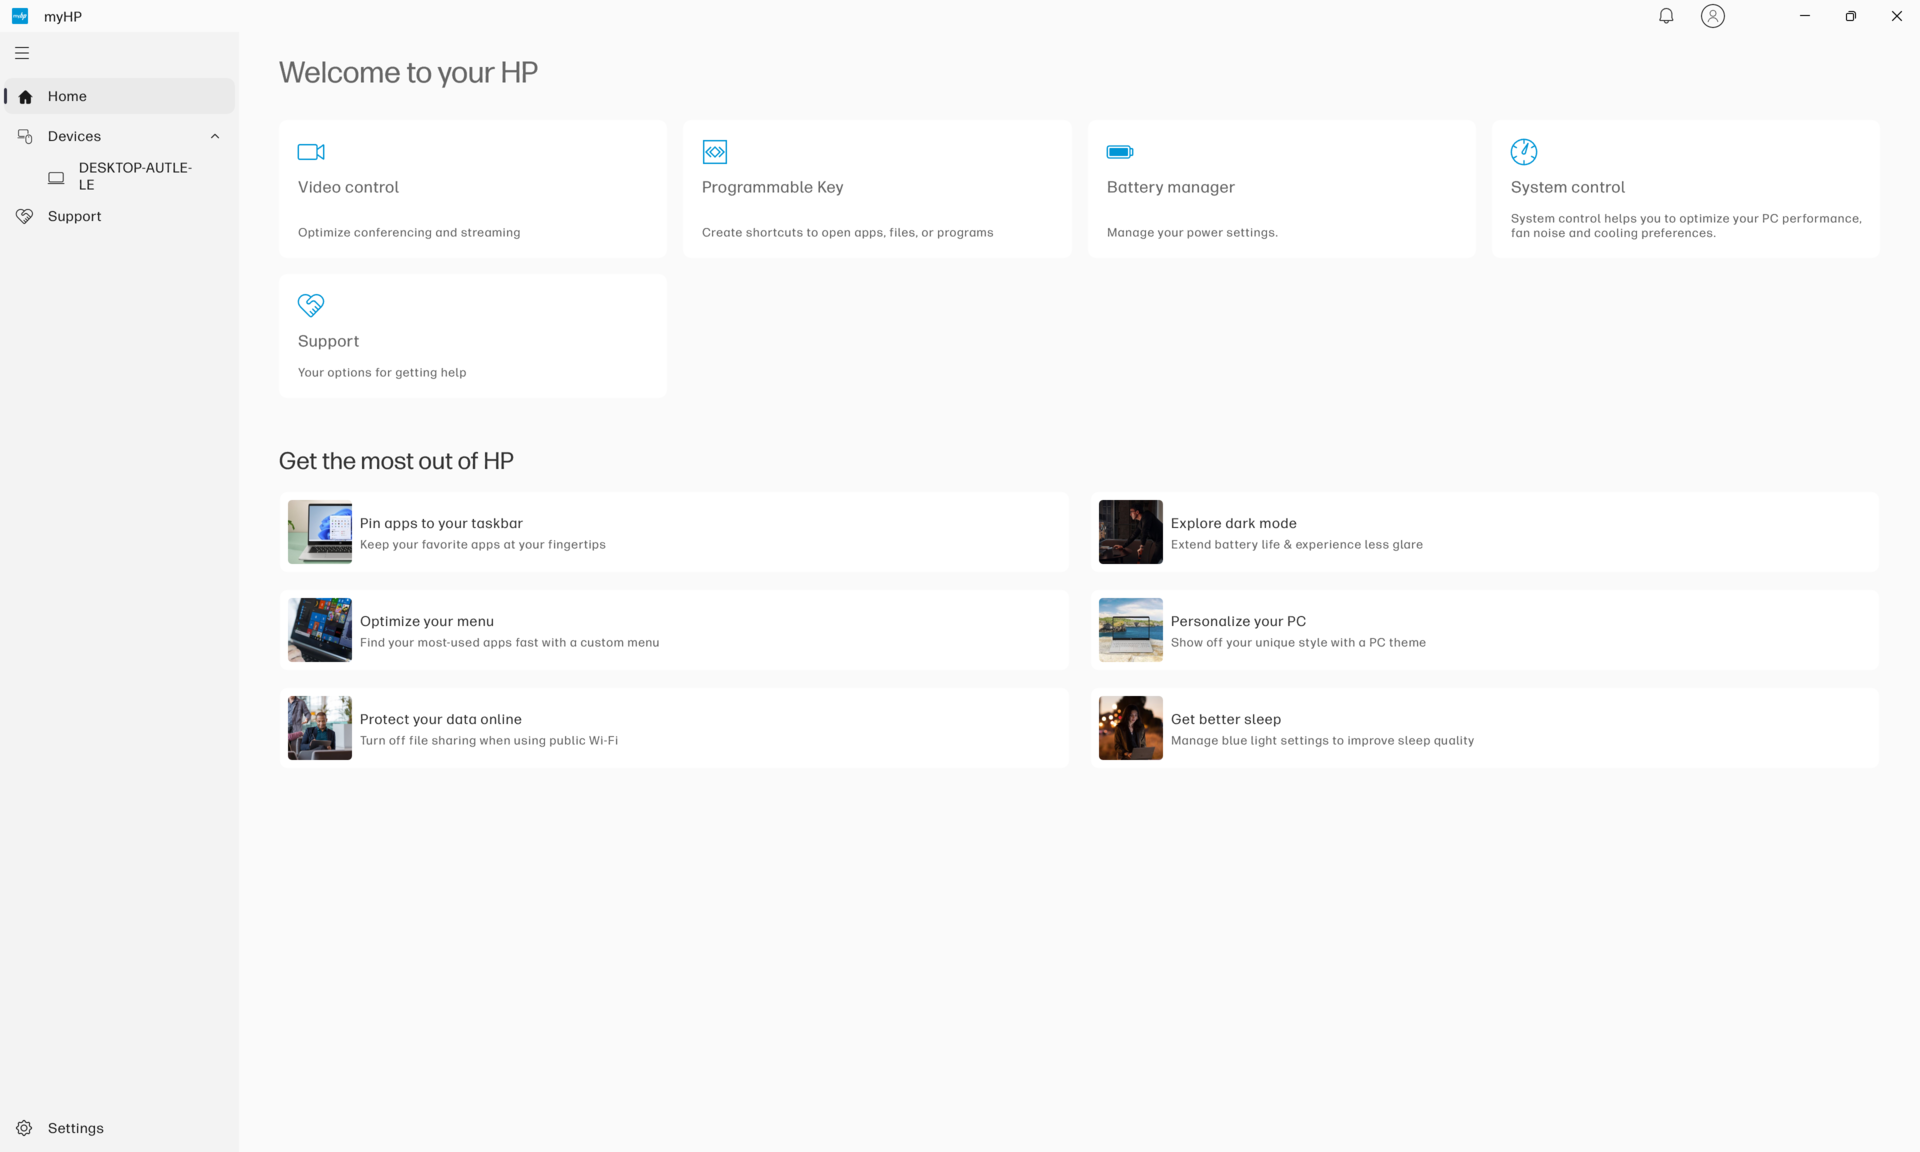
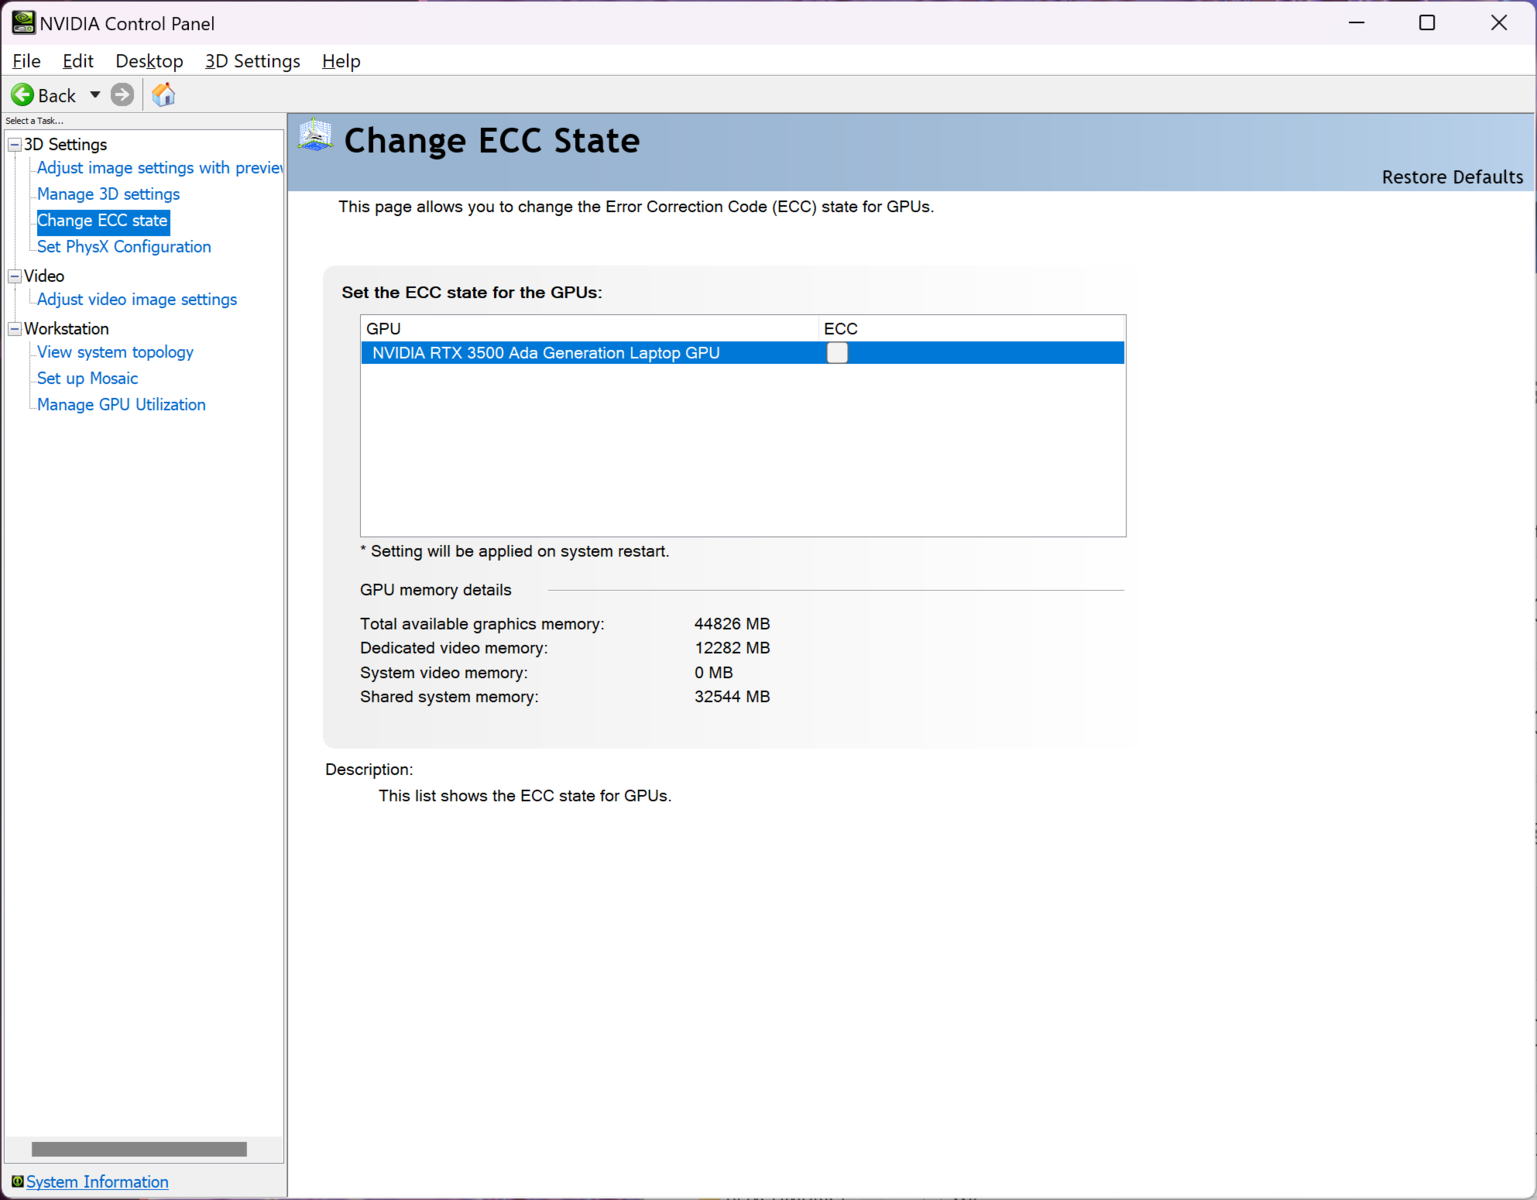
Wir haben sowohl Windows als auch MyHP auf den Performance-Modus eingestellt, bevor wir die folgenden Benchmarks durchgeführt haben. Zudem haben wir den GPU-ECC-Modus über die Nvidia-Systemsteuerung deaktiviert.
Prozessor
Der Sprung vom Core i9-12950HX im ZBook Fury 16 G9 zum Core i9-13950HX im Fury 16 G10 führte zu erheblichen Leistungssteigerungen. Leider lässt sich dasselbe beim Übergang vom Core i9-13950HX im Fury 16 G10 zum Core i9-14900HX in unserer Fury 16 G11-Konfiguration nicht sehen. Der Leistungszuwachs ist viel geringer, etwa 10 bis 15 Prozent, bevor die Drosselung einbezogen wird. Berücksichtigt man die Drosselung, ist die Gesamtleistung des Prozessors im Wesentlichen vergleichbar mit der des Core i9-13950HX, wie unsere CineBench R15 xT Schleifentest-Ergebnisse zeigen. Der Core i9-14900HX basiert auf derselben Architektur wie der Core i9-13950HX und kann daher als Rebranding der letztjährigen Optionen betrachtet werden. Der Hauptvorteil des Core i9-14900HX liegt in der höheren Turbo-Boost-Obergrenze, auch wenn diese höheren Taktraten nur von kurzer Dauer sind.
Das Lenovo Legion 9 16IRX9, das ebenfalls mit dem Core i9-14900HX ausgestattet ist, könnte bis zu 20 Prozent schneller laufen, vermutlich aufgrund seiner leistungsfähigeren Kühllösung, die höhere Turbo-Boost-Taktraten länger aufrechterhält.
Cinebench R15 Multi Dauertest
Cinebench R23: Multi Core | Single Core
Cinebench R20: CPU (Multi Core) | CPU (Single Core)
Cinebench R15: CPU Multi 64Bit | CPU Single 64Bit
Blender: v2.79 BMW27 CPU
7-Zip 18.03: 7z b 4 | 7z b 4 -mmt1
Geekbench 6.4: Multi-Core | Single-Core
Geekbench 5.5: Multi-Core | Single-Core
HWBOT x265 Benchmark v2.2: 4k Preset
LibreOffice : 20 Documents To PDF
R Benchmark 2.5: Overall mean
| CPU Performance Rating | |
| Asus ProArt Studiobook 16 OLED H7604 -2! | |
| Durchschnittliche Intel Core i9-14900HX | |
| HP ZBook Fury 16 G11 | |
| HP ZBook Fury 16 G10 | |
| Dell Precision 5000 5680 | |
| Lenovo ThinkPad P1 G6 21FV001KUS | |
| Asus ExpertBook B6 Flip B6602FC2 -2! | |
| Lenovo ThinkPad P16 G2 21FA000FGE -2! | |
| Lenovo ThinkPad P1 G6-21FV000DGE | |
| Dell Precision 5690 | |
| HP ZBook Fury 16 G9 -2! | |
| MSI CreatorPro Z16P B12UKST -2! | |
| Lenovo ThinkPad P16v G1 AMD | |
| Lenovo ThinkPad P1 G4-20Y4S0KS00 -2! | |
Cinebench R23: Multi Core | Single Core
Cinebench R20: CPU (Multi Core) | CPU (Single Core)
Cinebench R15: CPU Multi 64Bit | CPU Single 64Bit
Blender: v2.79 BMW27 CPU
7-Zip 18.03: 7z b 4 | 7z b 4 -mmt1
Geekbench 6.4: Multi-Core | Single-Core
Geekbench 5.5: Multi-Core | Single-Core
HWBOT x265 Benchmark v2.2: 4k Preset
LibreOffice : 20 Documents To PDF
R Benchmark 2.5: Overall mean
* ... kleinere Werte sind besser
AIDA64: FP32 Ray-Trace | FPU Julia | CPU SHA3 | CPU Queen | FPU SinJulia | FPU Mandel | CPU AES | CPU ZLib | FP64 Ray-Trace | CPU PhotoWorxx
| Performance Rating | |
| Asus ProArt Studiobook 16 OLED H7604 | |
| Durchschnittliche Intel Core i9-14900HX | |
| HP ZBook Fury 16 G10 | |
| HP ZBook Fury 16 G11 | |
| Dell Precision 5690 | |
| Lenovo ThinkPad P16 G2 21FA000FGE | |
| HP ZBook Fury 16 G9 | |
| Lenovo ThinkPad P1 G6 21FV001KUS | |
Stresstest
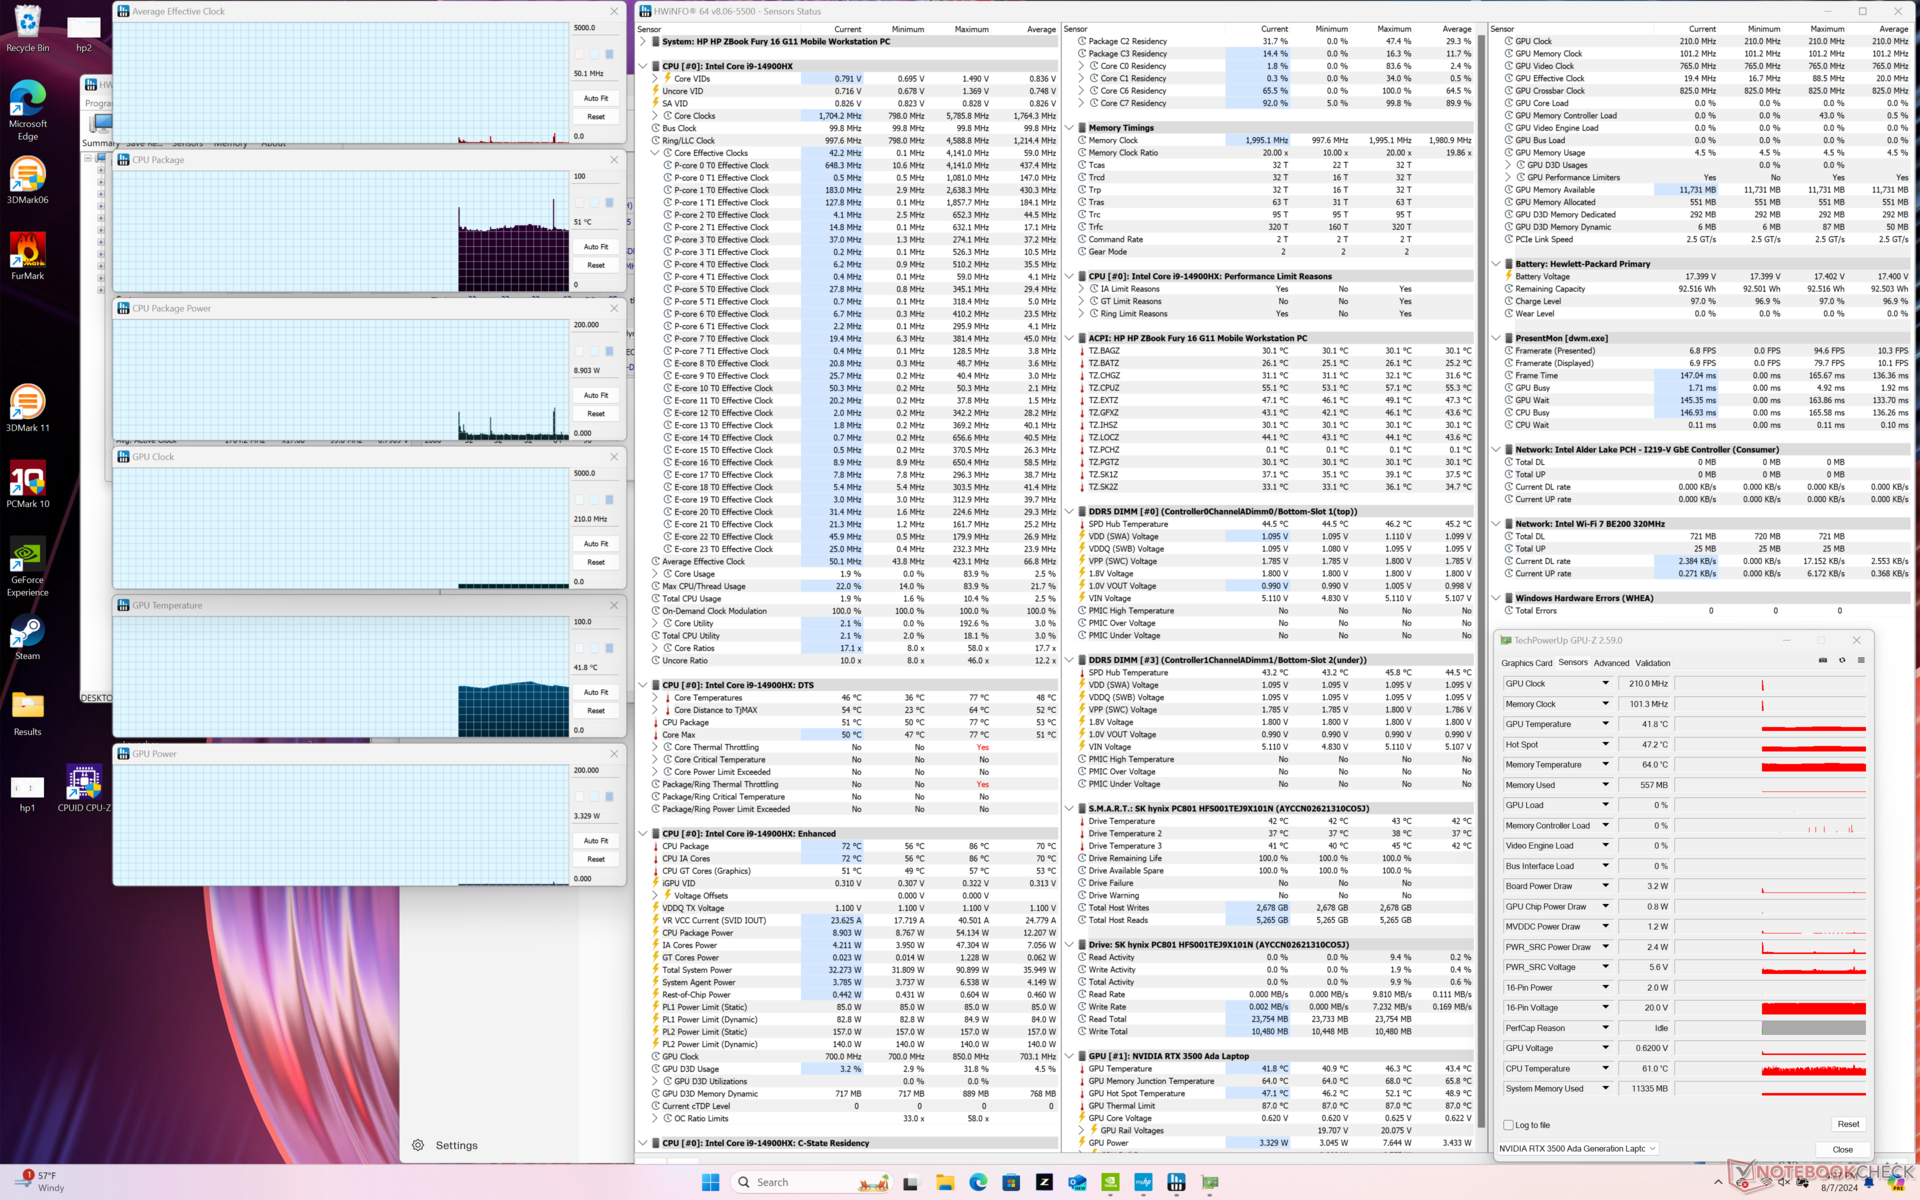
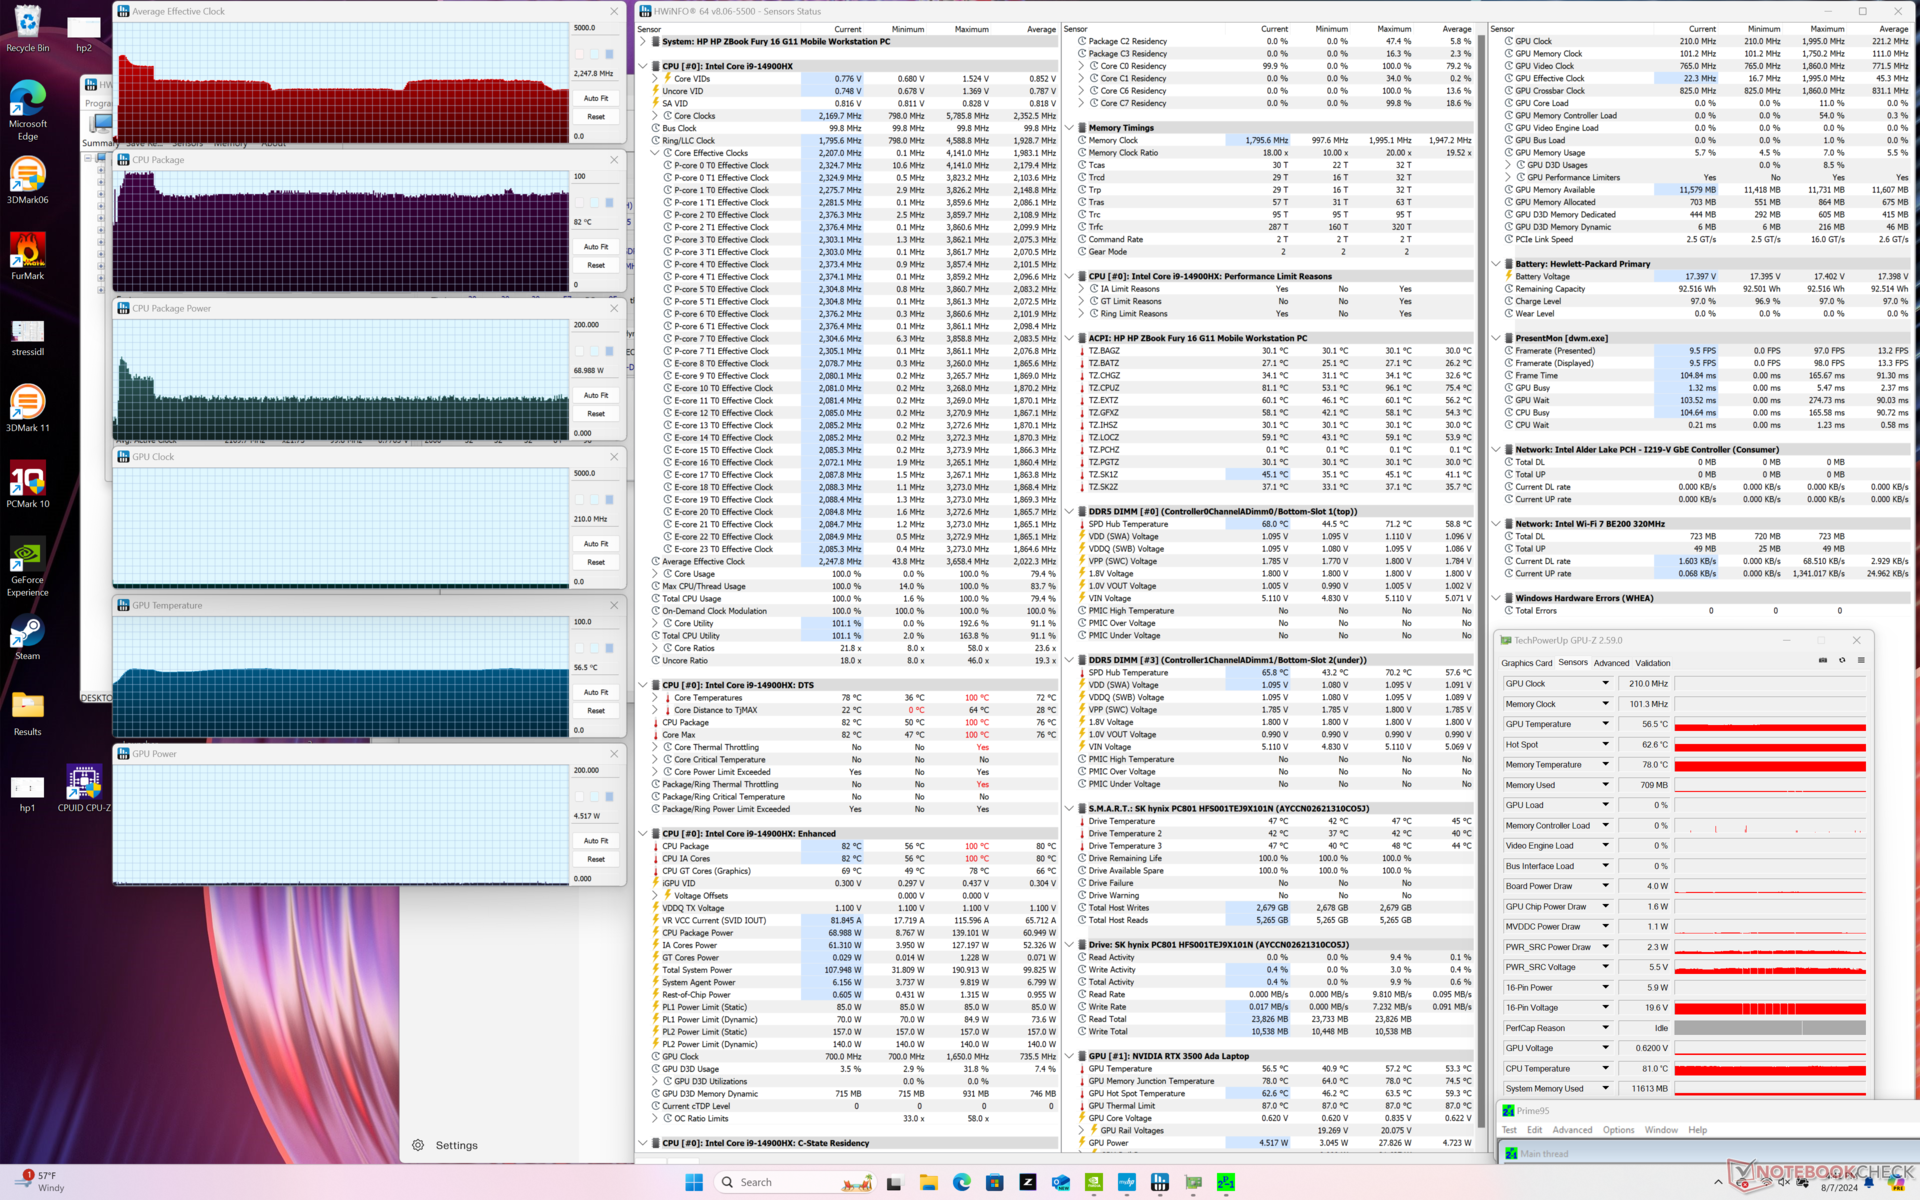
Als wir Prime95 ausführten, um die CPU zu belasten, stiegen die Kerntaktraten und die Leistungsaufnahme des Pakets auf 3,7 GHz bzw. 139 W, wobei diese Werte höchstens eine Minute lang gehalten wurden. Währenddessen erreichte die Kerntemperatur 99 °C. Danach pendelte sich die CPU bei 2,3 GHz und 69 W ein, um eine kontrollierbare Kerntemperatur von 82 °C aufrechtzuerhalten. Der relativ starke Leistungsabfall im Laufe der Zeit erklärt die fortlaufend niedrigeren CineBench R15 xT-Schleifenergebnisse.
Trotz der Leistungsunterschiede stabilisieren sich die CPU- und GPU-Temperaturen bei höherer Last, wie beispielsweise beim Spielen, auf nahezu den gleichen Werten wie beim letztjährigen ZBook Fury 16 G10.
| Durchschnittliche CPU-Takt (GHz) | GPU-Takt (MHz) | Durchschnittliche CPU-Temperatur (°C) | Durchschnittliche GPU-Temperatur (°C) | |
| System im Leerlauf | -- | -- | 51 | 42 |
| Prime95 Stresstest | 2.2 - 2.6 | -- | 82 | 57 |
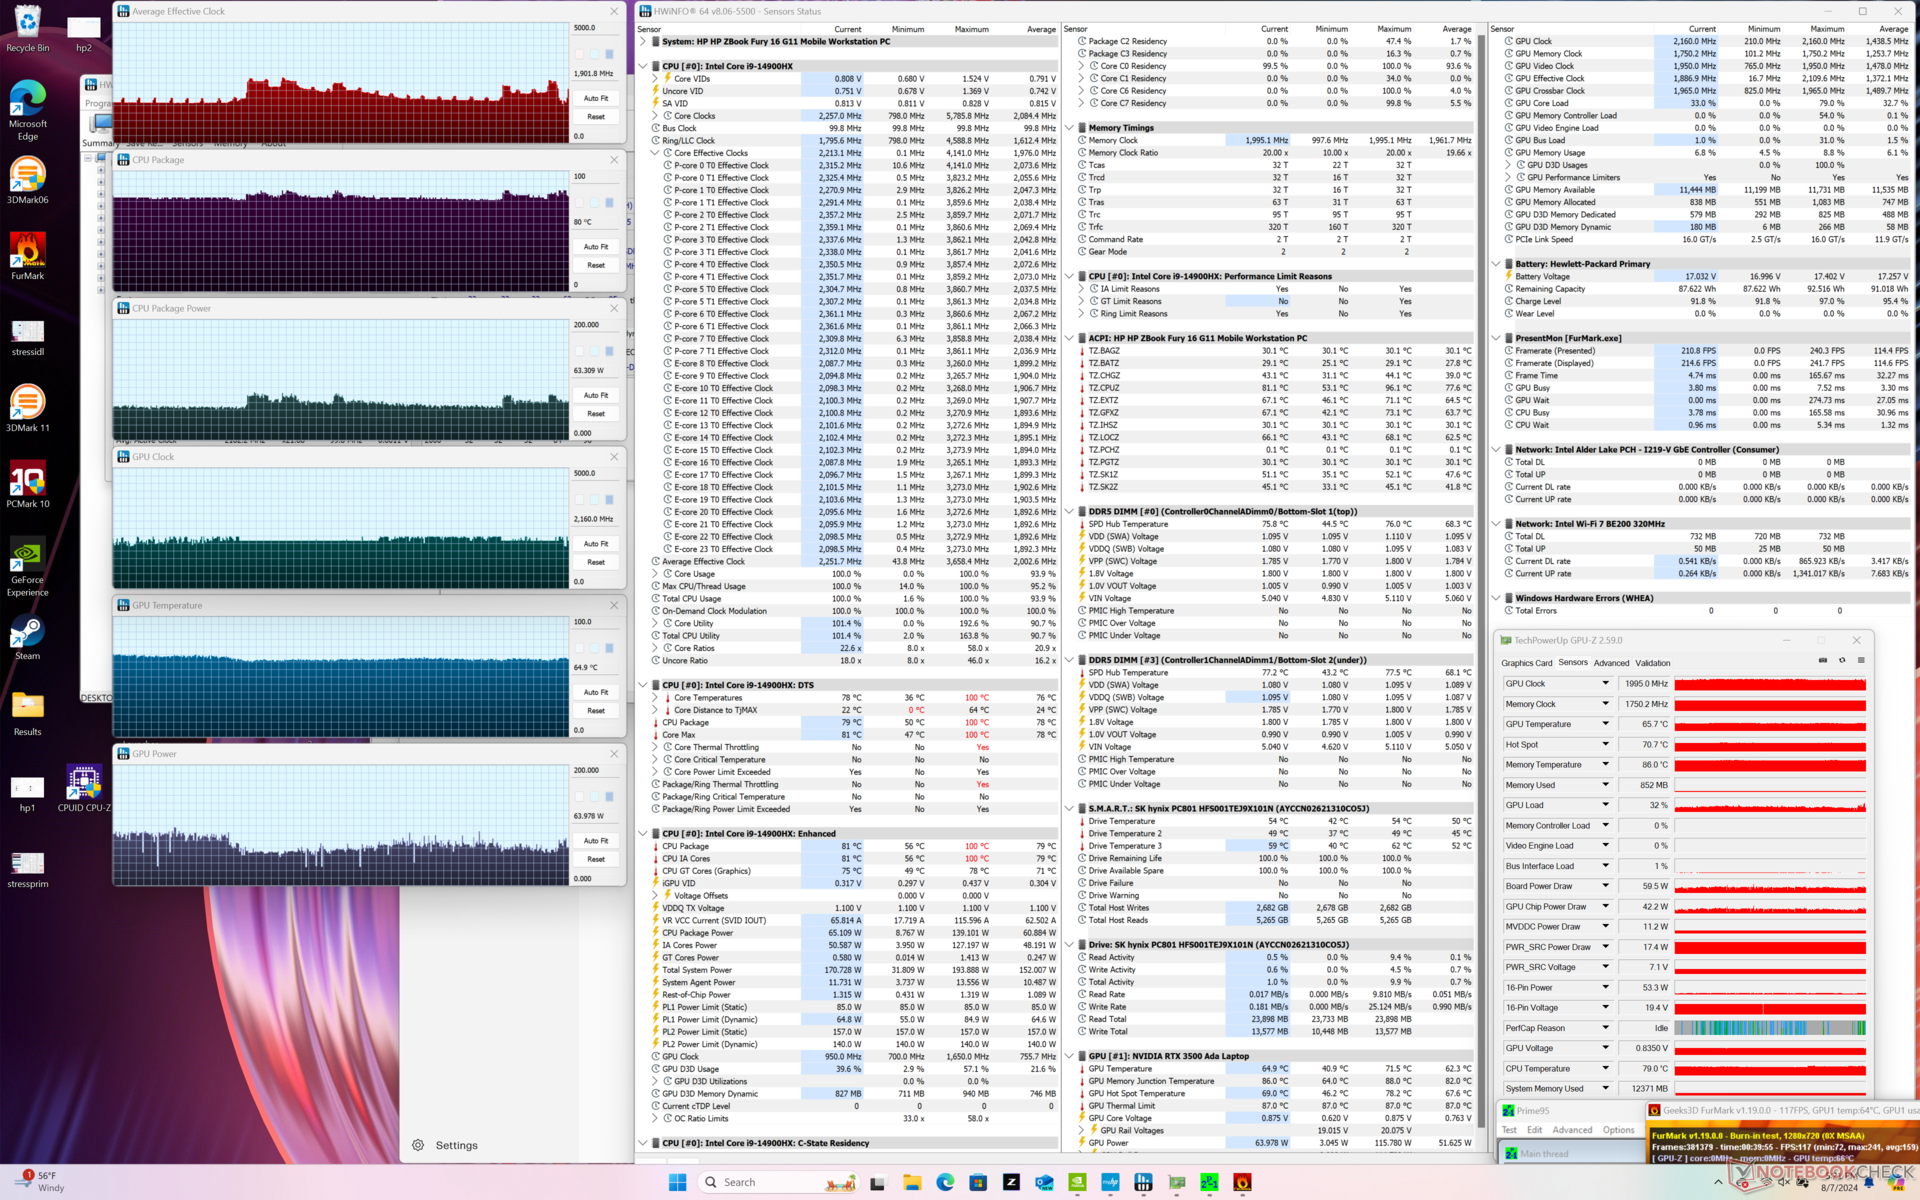
| Prime95 + FurMark Stresstest | 1.8 | 1995 | 81 | 65 |
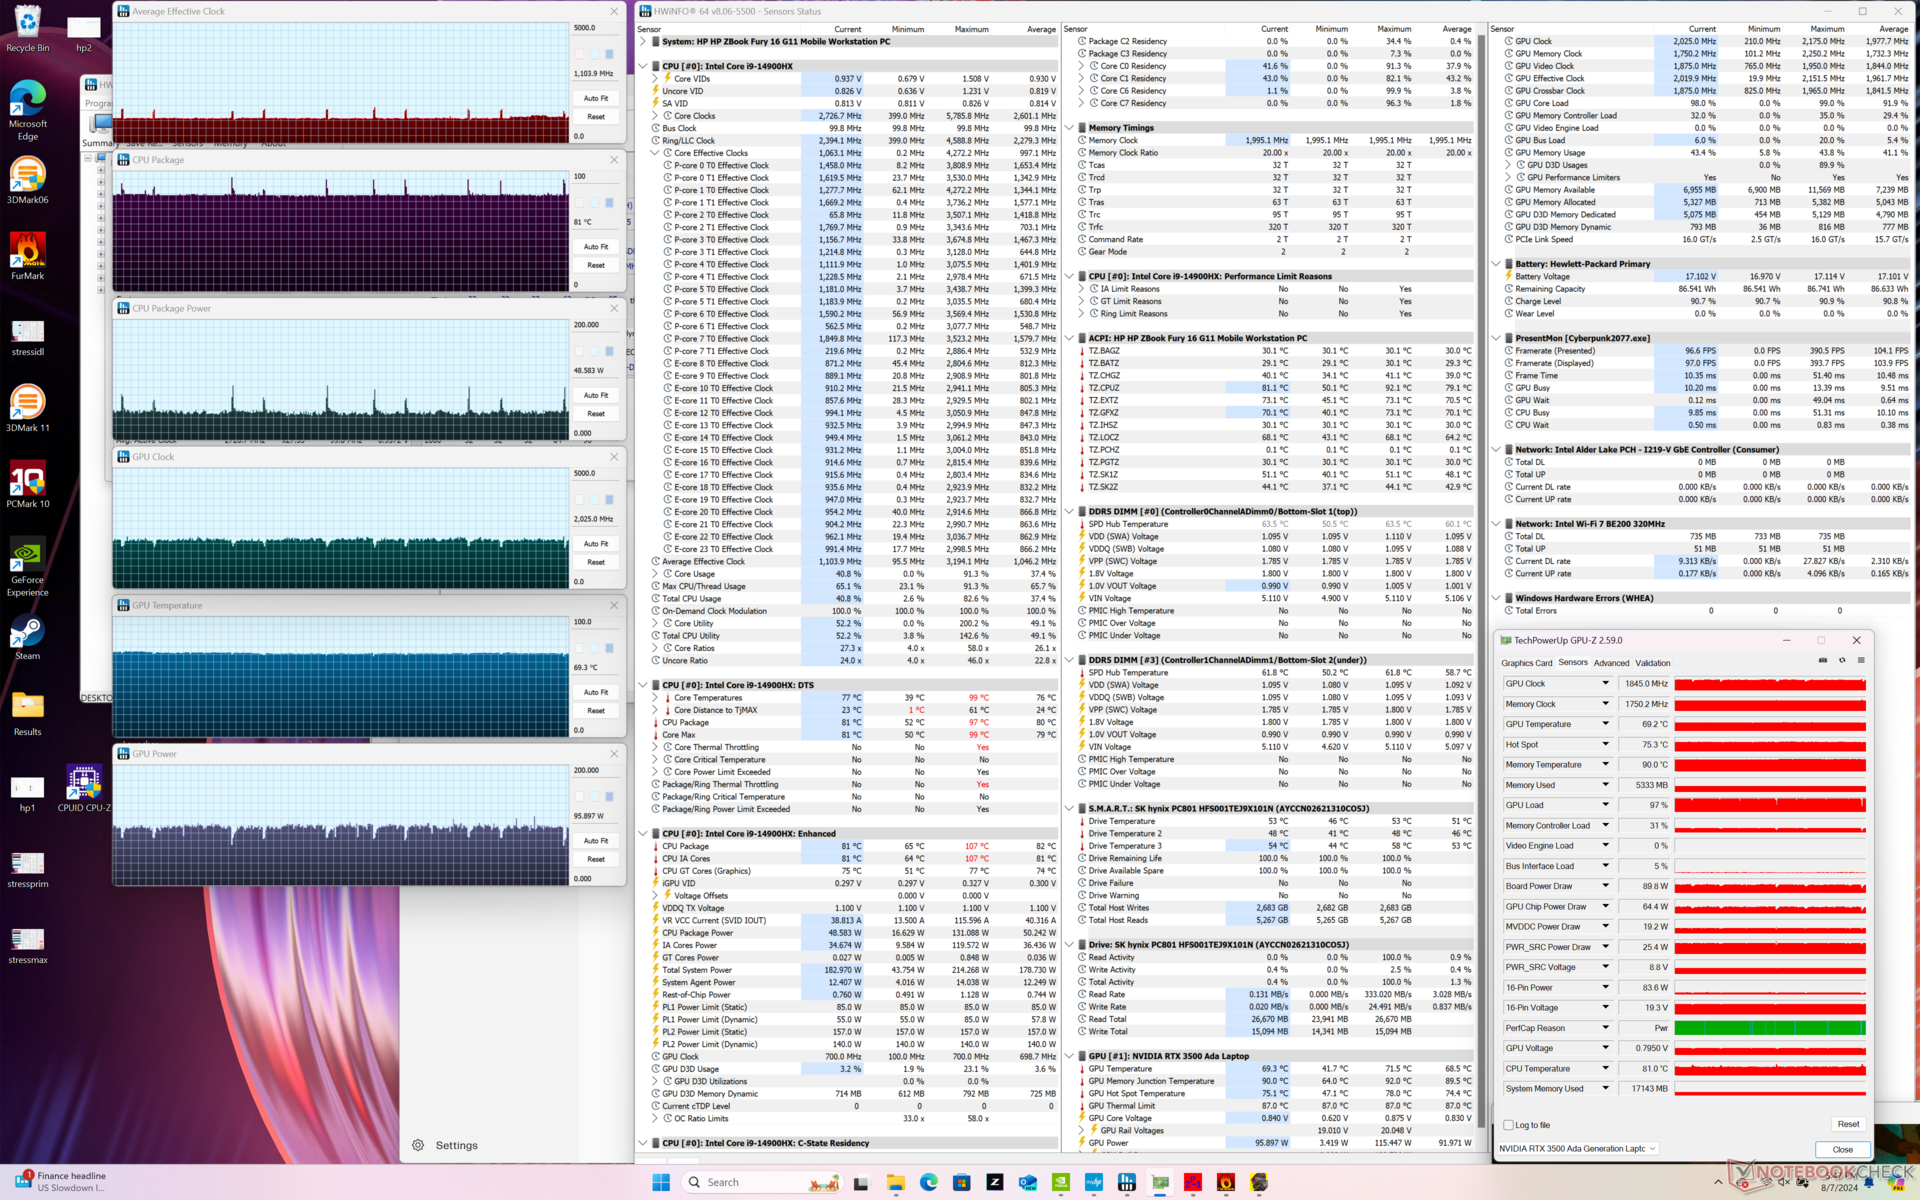
| Cyberpunk 2077 Stresstest | 1.1 | 1845 | 81 | 69 |
System Performance
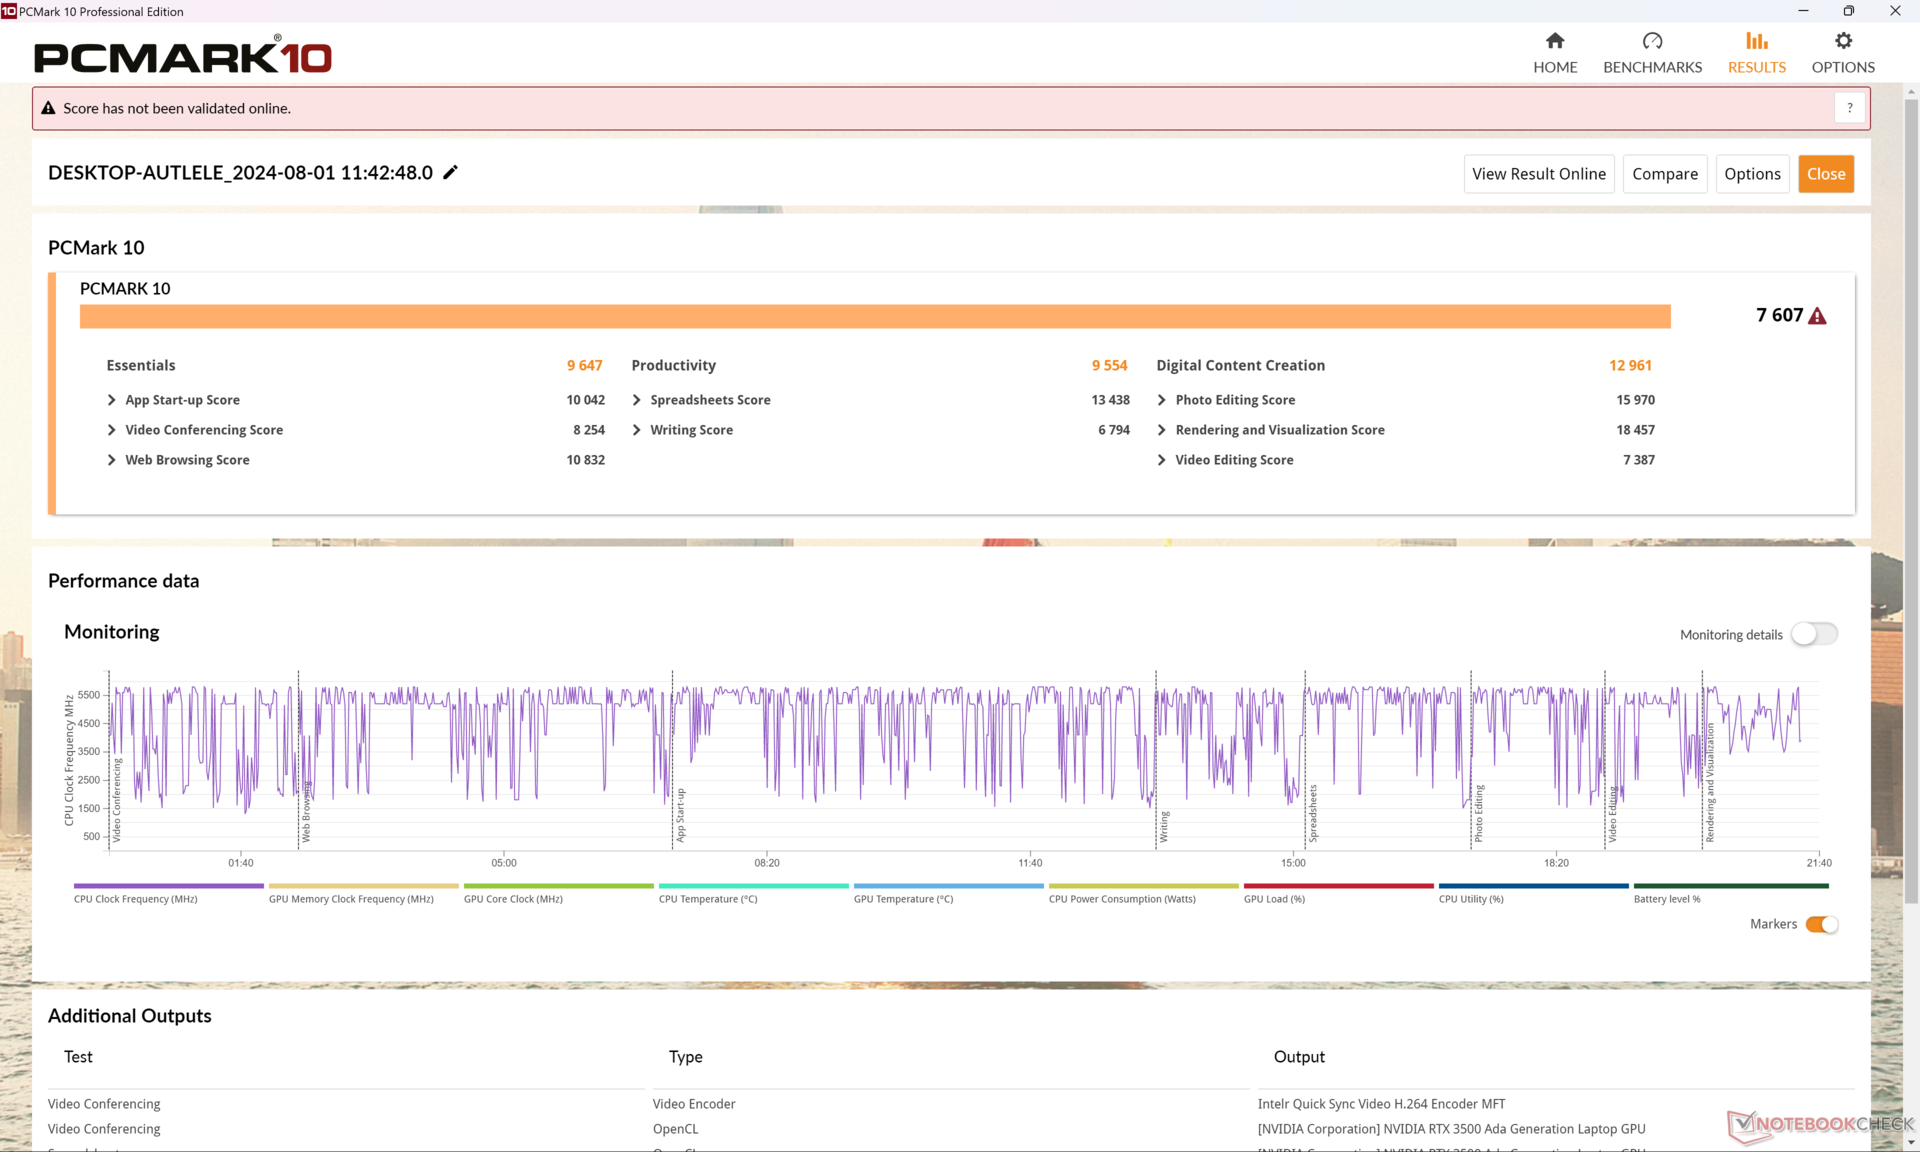
Die PCMark-Ergebnisse ähneln denen des ZBook Fury 16 G10 aus dem Vorjahr und deuten darauf hin, dass das ZBook Fury 16 G11 die meisten alltäglichen Aufgaben nicht schneller erledigen wird als sein Vorgänger.
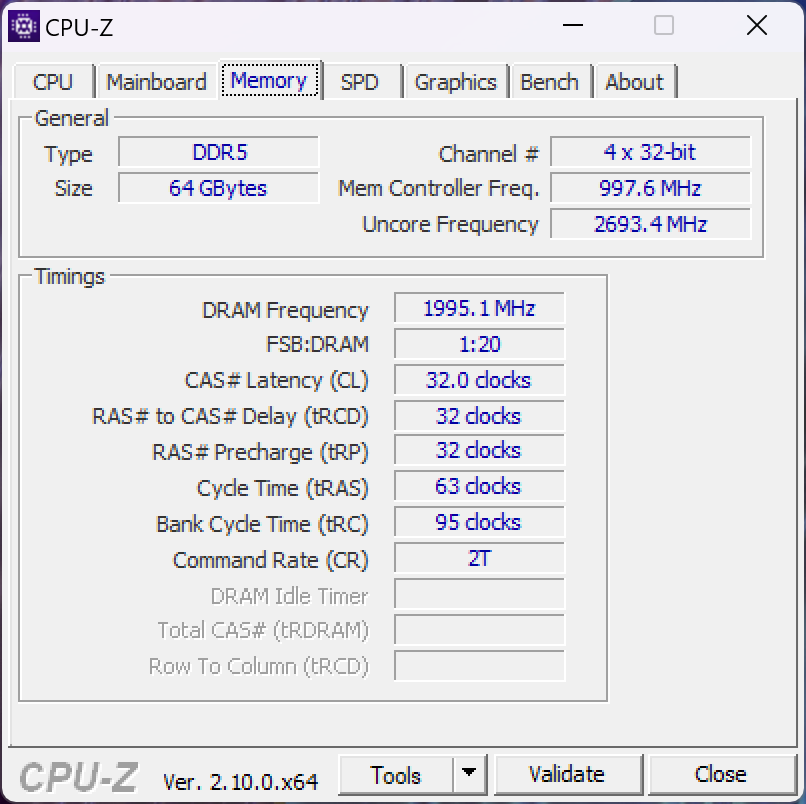
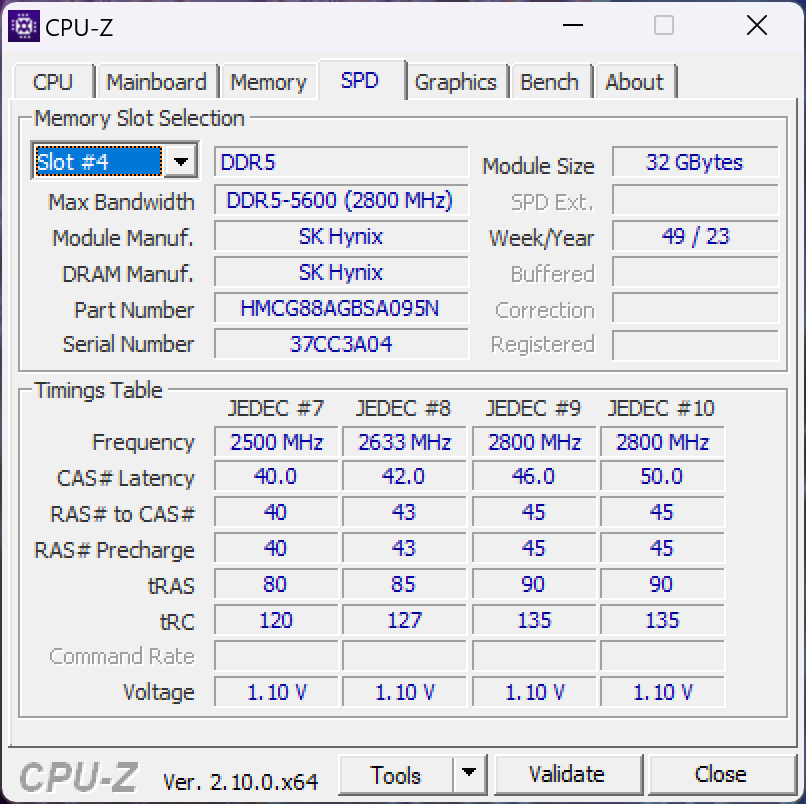
Beachten Sie, dass die maximale RAM-Geschwindigkeit bei einer Konfiguration mit 128 GB aufgrund der Beschränkungen des SODIMM-Standards auf lediglich 4000 MT/s begrenzt ist. Das Modell unterstützt sowohl ECC-RAM als auch Nicht-ECC-RAM.
CrossMark: Overall | Productivity | Creativity | Responsiveness
WebXPRT 3: Overall
WebXPRT 4: Overall
Mozilla Kraken 1.1: Total
| PCMark 10 / Score | |
| HP ZBook Fury 16 G10 | |
| Dell Precision 5690 | |
| Lenovo ThinkPad P1 G6 21FV001KUS | |
| HP ZBook Fury 16 G11 | |
| Durchschnittliche Intel Core i9-14900HX, NVIDIA RTX 3500 Ada Generation Laptop GPU (n=1) | |
| Asus ProArt Studiobook 16 OLED H7604 | |
| Lenovo ThinkPad P16 G2 21FA000FGE | |
| HP ZBook Fury 16 G9 | |
* ... kleinere Werte sind besser
| PCMark 10 Score | 7607 Punkte | |
Hilfe | ||
| AIDA64 / Memory Copy | |
| Dell Precision 5690 | |
| Durchschnittliche Intel Core i9-14900HX (38028 - 83392, n=36) | |
| Asus ProArt Studiobook 16 OLED H7604 | |
| HP ZBook Fury 16 G10 | |
| HP ZBook Fury 16 G9 | |
| HP ZBook Fury 16 G11 | |
| Lenovo ThinkPad P16 G2 21FA000FGE | |
| Lenovo ThinkPad P1 G6 21FV001KUS | |
* ... kleinere Werte sind besser
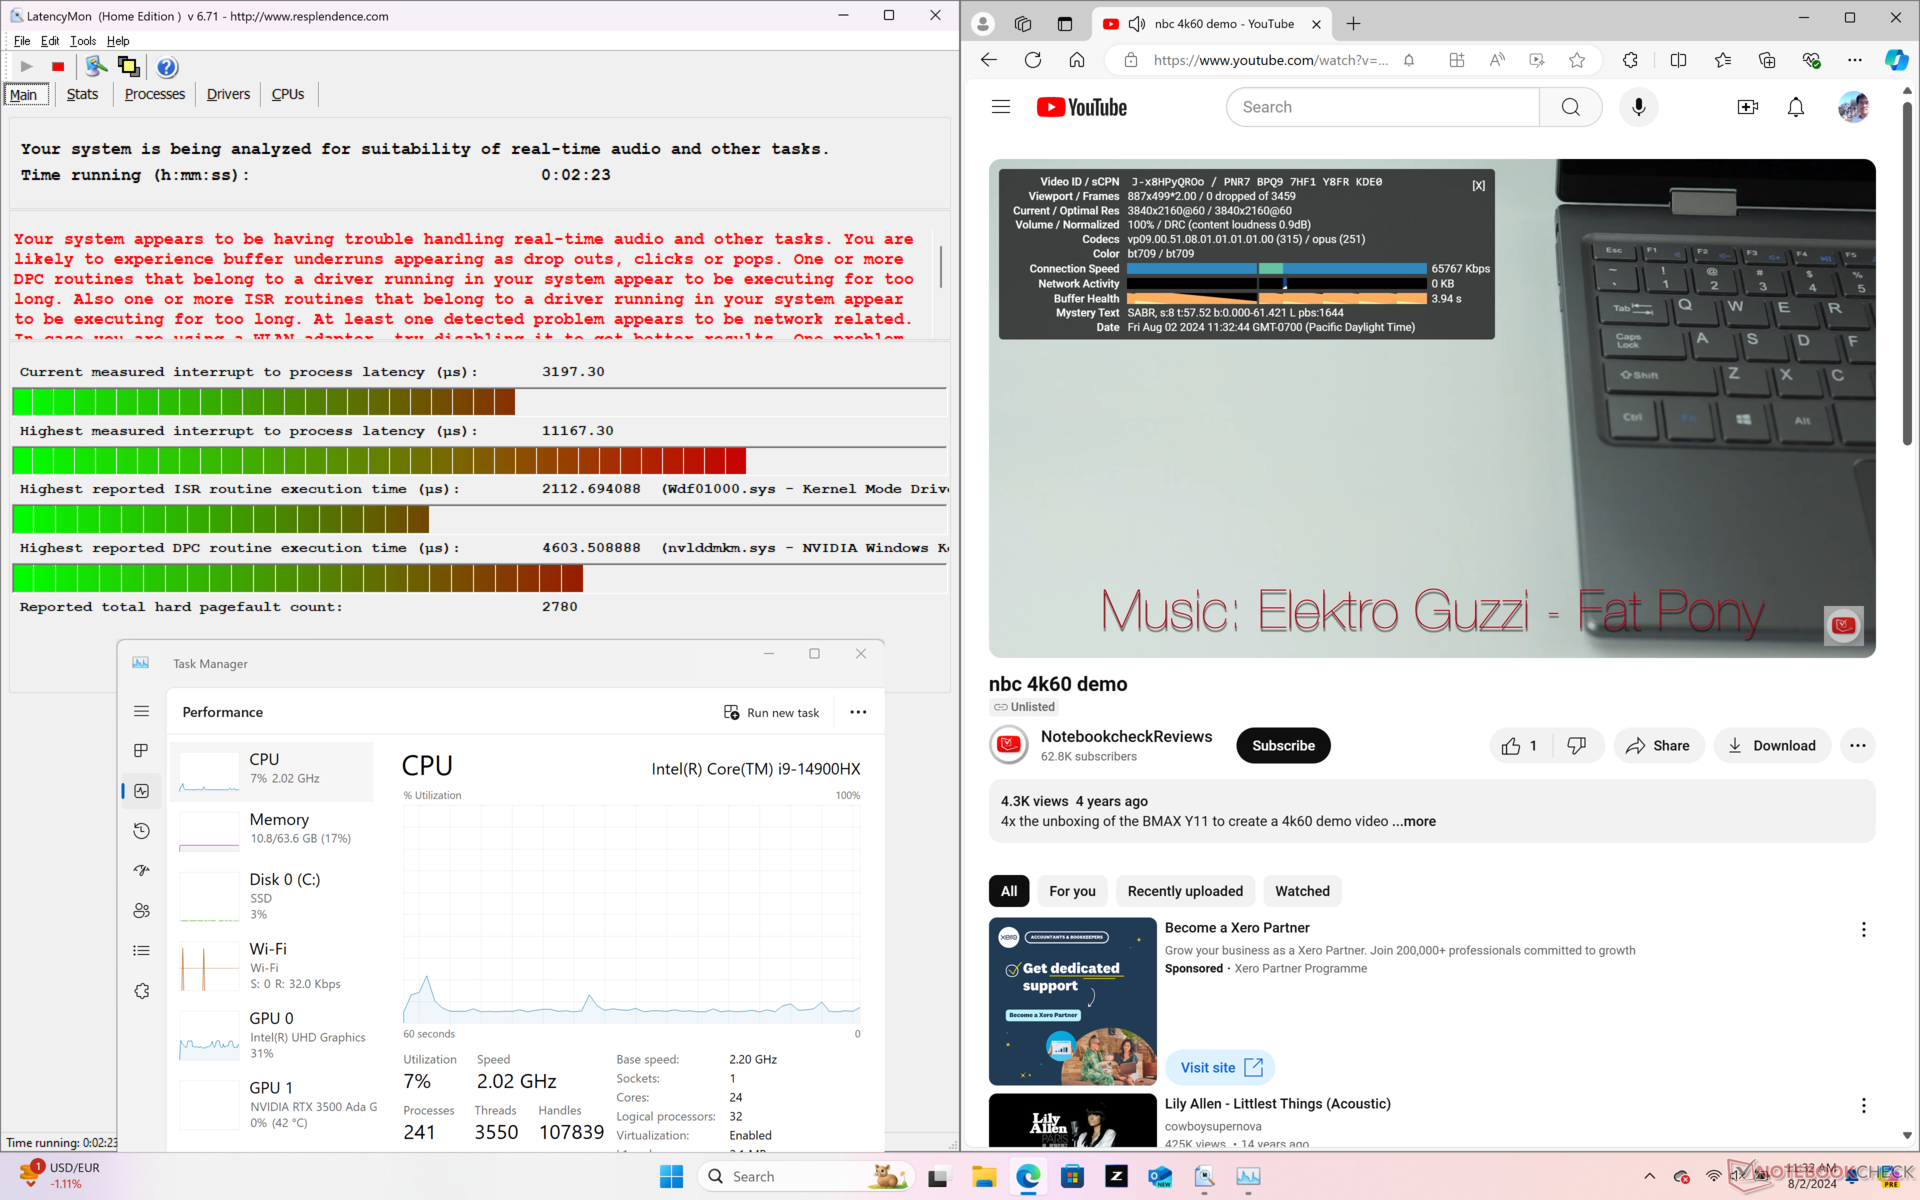
DPC-Latenzen
LatencyMon zeigt DPC-Probleme beim Öffnen mehrerer Browser-Tabs unserer Homepag. Die 4K-Videowiedergabe bei 60 FPS hingegen ist einwandfrei, und es wurden keine Bildaussetzer festgestellt.

| DPC Latencies / LatencyMon - interrupt to process latency (max), Web, Youtube, Prime95 | |
| HP ZBook Fury 16 G11 | |
| HP ZBook Fury 16 G10 | |
| HP ZBook Fury 16 G9 | |
| Asus ProArt Studiobook 16 OLED H7604 | |
| Lenovo ThinkPad P1 G6 21FV001KUS | |
| Lenovo ThinkPad P16 G2 21FA000FGE | |
| Dell Precision 5690 | |
* ... kleinere Werte sind besser
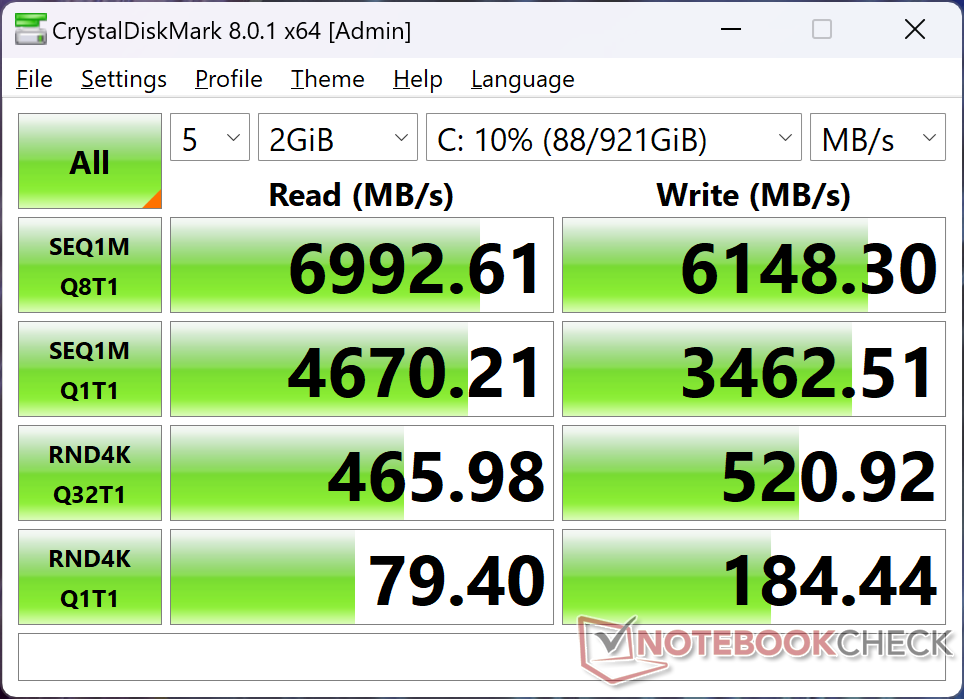
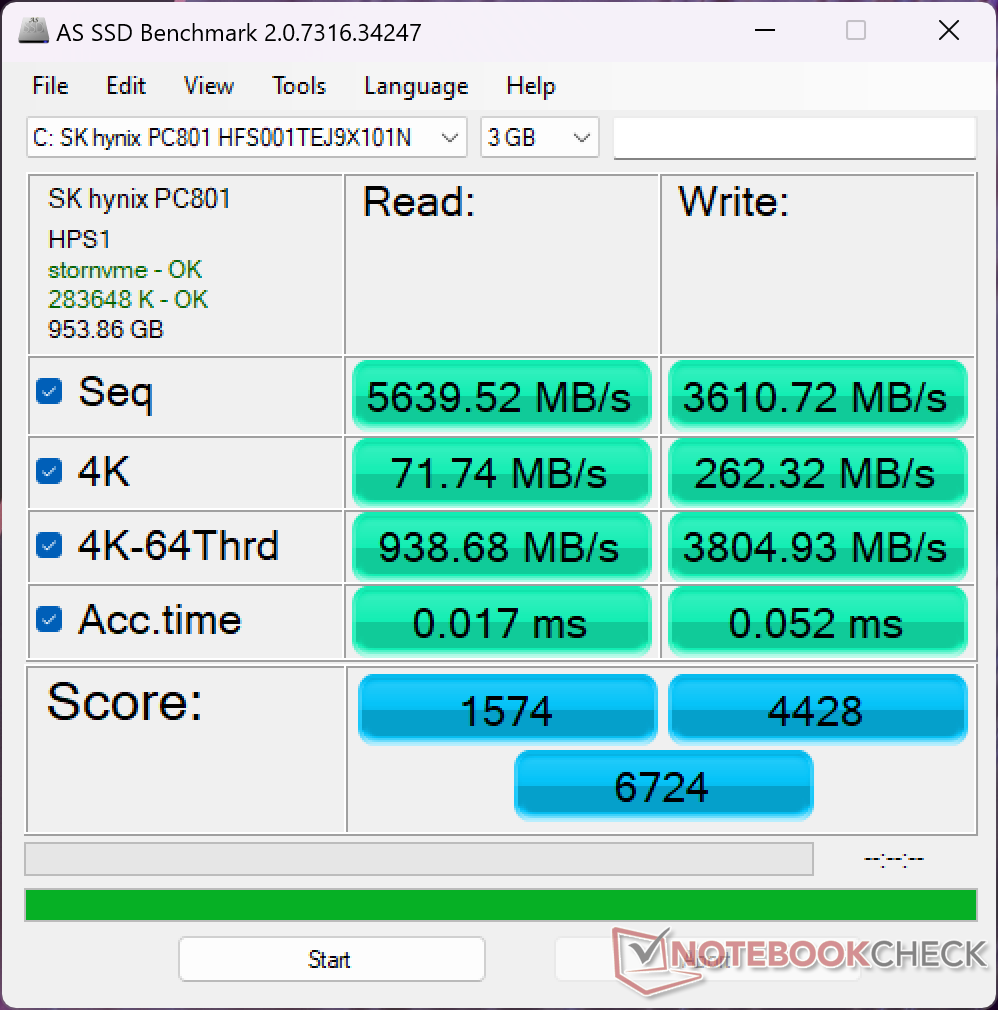
Massenspeicher
Unser Testgerät ist mit der gleichen 1 TB SK Hynix PC801 HFS001TEJ9X101N PCIe4 M.2 SSD ausgestattet, die bereits im ZBook Fury 16 G10 des letzten Jahres verbaut war. Leider zeigt das Laufwerk die gleichen Probleme mit der Leistungsdrosselung. Bei der Verwendung von DiskSpd in einer Schleife beginnen die Übertragungsraten sehr hoch bei fast 7000 MB/s, sinken jedoch bereits nach wenigen Minuten auf bis zu 3400 MB/s, wie in der folgenden Grafik zu sehen ist. Möglicherweise ist dies auf eine unzureichende Kühlung der Laufwerke zurückzuführen. Dies könnte ein Nachteil für die Unterstützung von mehr Laufwerken darstellen als bei den meisten anderen Laptops.

* ... kleinere Werte sind besser
Dauerleistung Lesen: DiskSpd Read Loop, Queue Depth 8
GPU Performance
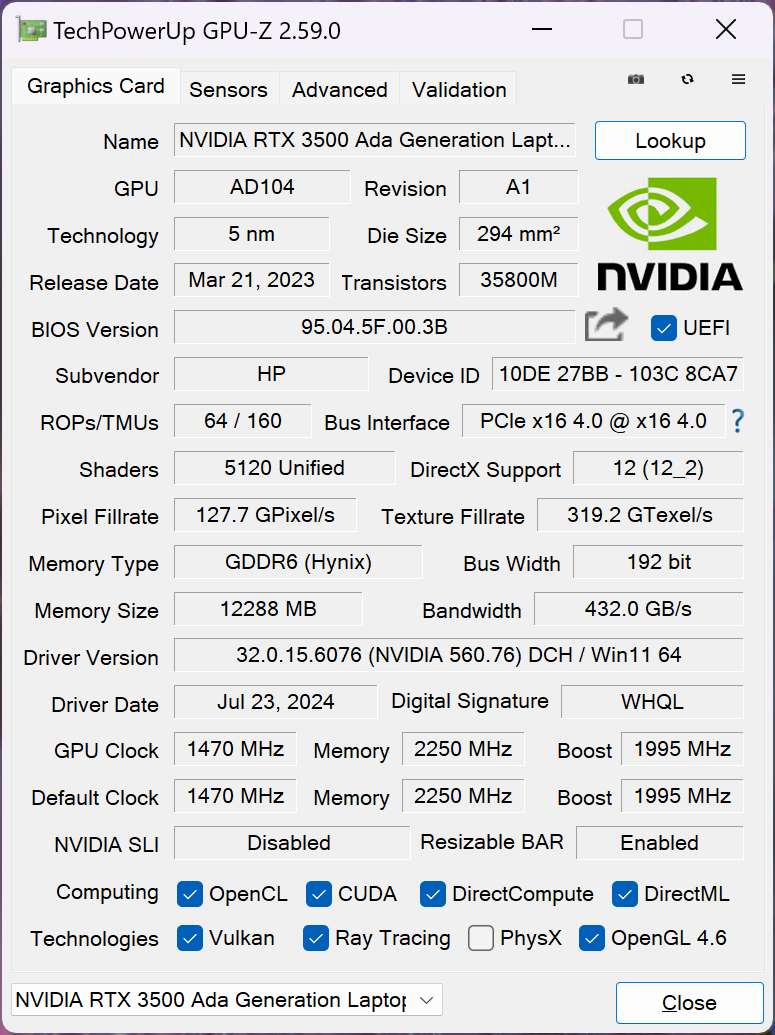
Benutzer können damit rechnen, dass die RTX 3500 Ada etwa 20 bis 30 Prozent langsamer ist als die RTX 5000 Ada. Da Nvidia bislang keine neue Generation mobiler Grafikprozessoren vorgestellt hat, wird das ZBook Fury 16 G11 mit identischen Grafikprozessoroptionen wie das Vorjahresmodell geliefert, ohne dass nennenswerte Leistungssteigerungen zu erwarten sind. Der RTX 5000 Ada bleibt nach wie vor der leistungsstärkste verfügbare Grafikprozessor für mobile Workstations
| Energieprofile | Grafikleistung | CPU-Leistung | Gesamtwert |
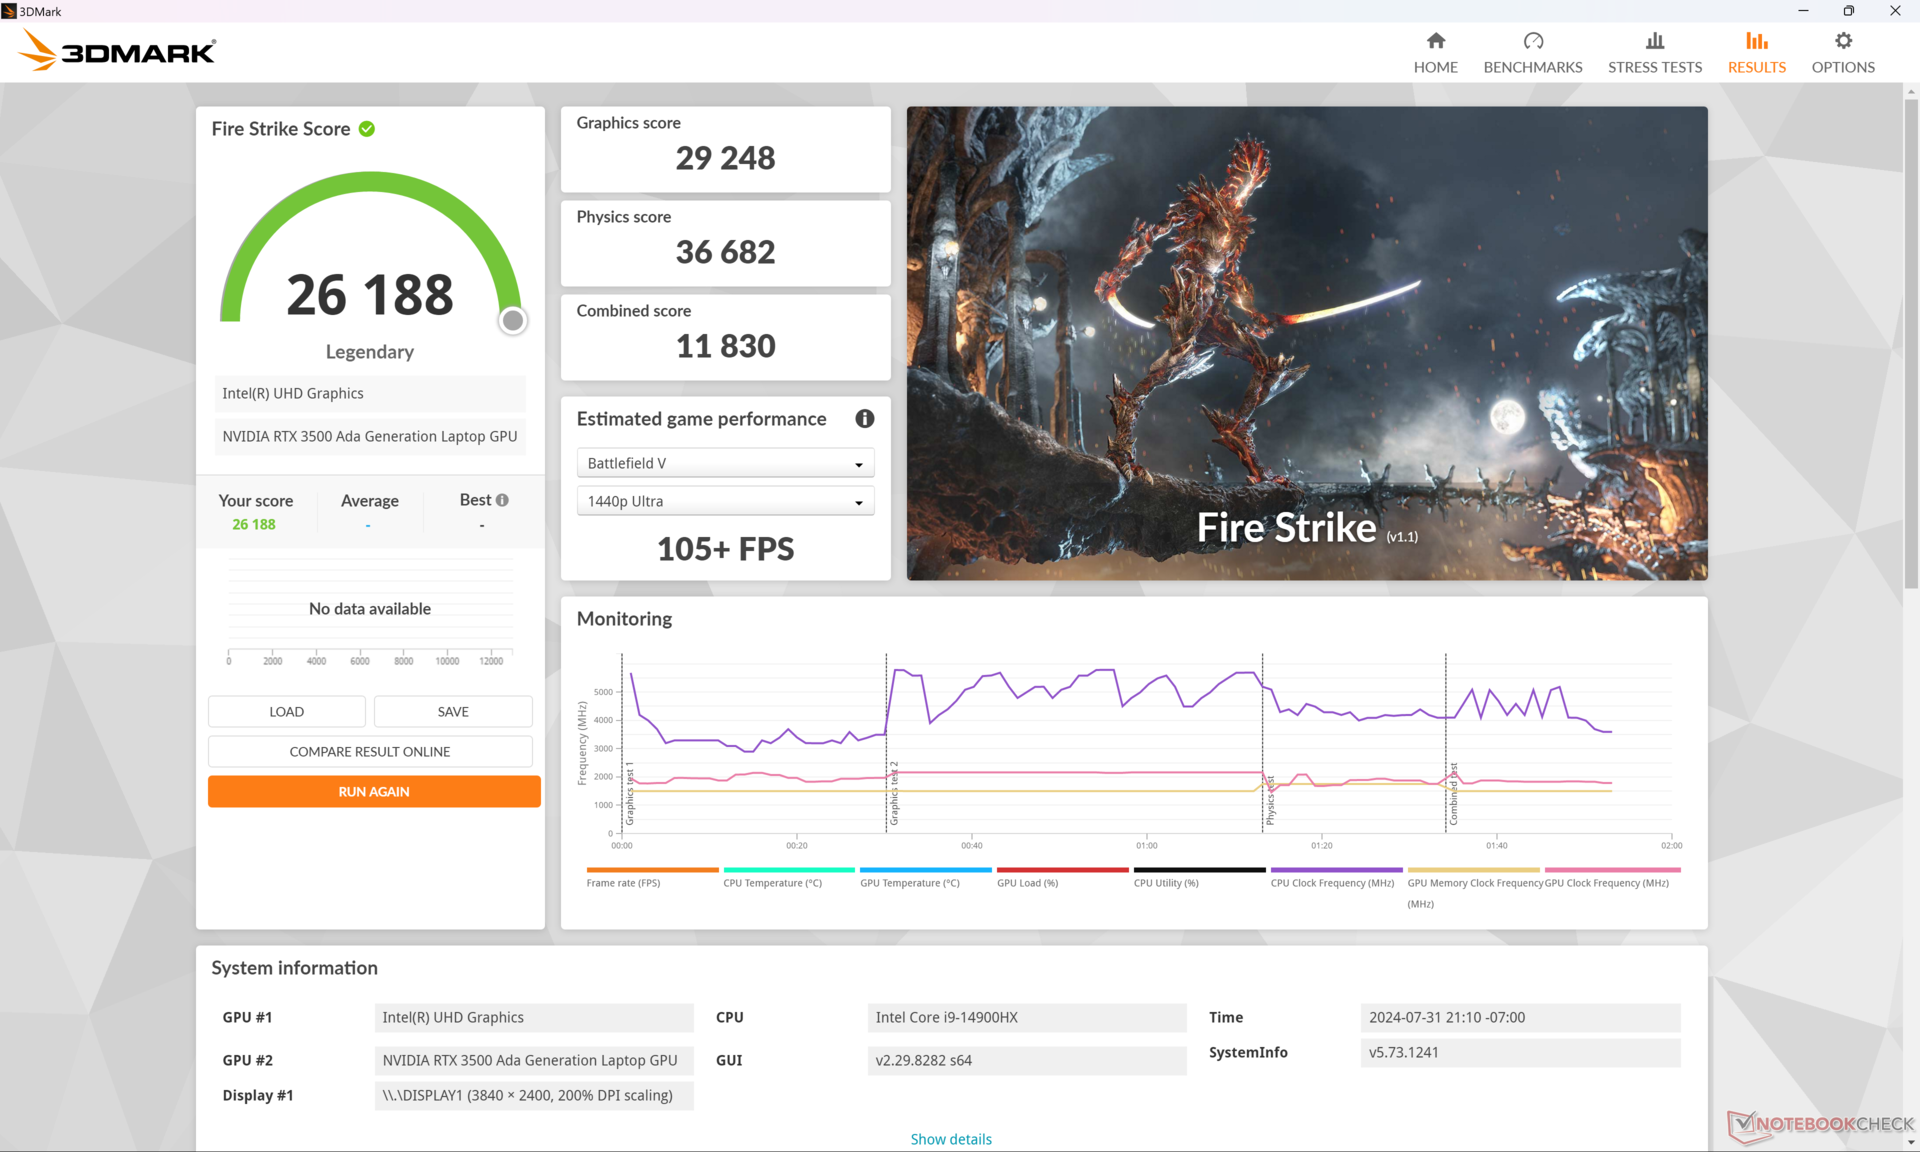
| Performance-Modus | 29248 | 36682 | 11830 |
| Balanced-Modus | 28214 (-4%) | 33094 (-10%) | 10246 (-13%) |
| Battery Power | 16618 (-43%) | 25118 (-32%) | 4101 (-65%) |
Der Betrieb im Balanced-Modus anstelle des Performance-Modus kann die Leistung um bis zu 10 bis 15 Prozent reduzieren, wie in unserer Fire-Strike-Tabelle oben dargestellt. Das Leistungsdefizit vergrößert sich sogar noch weiter, wenn das Notebook im Akkubetrieb läuft, was bei den meisten Hochleistungs-Laptops zu erwarten ist.
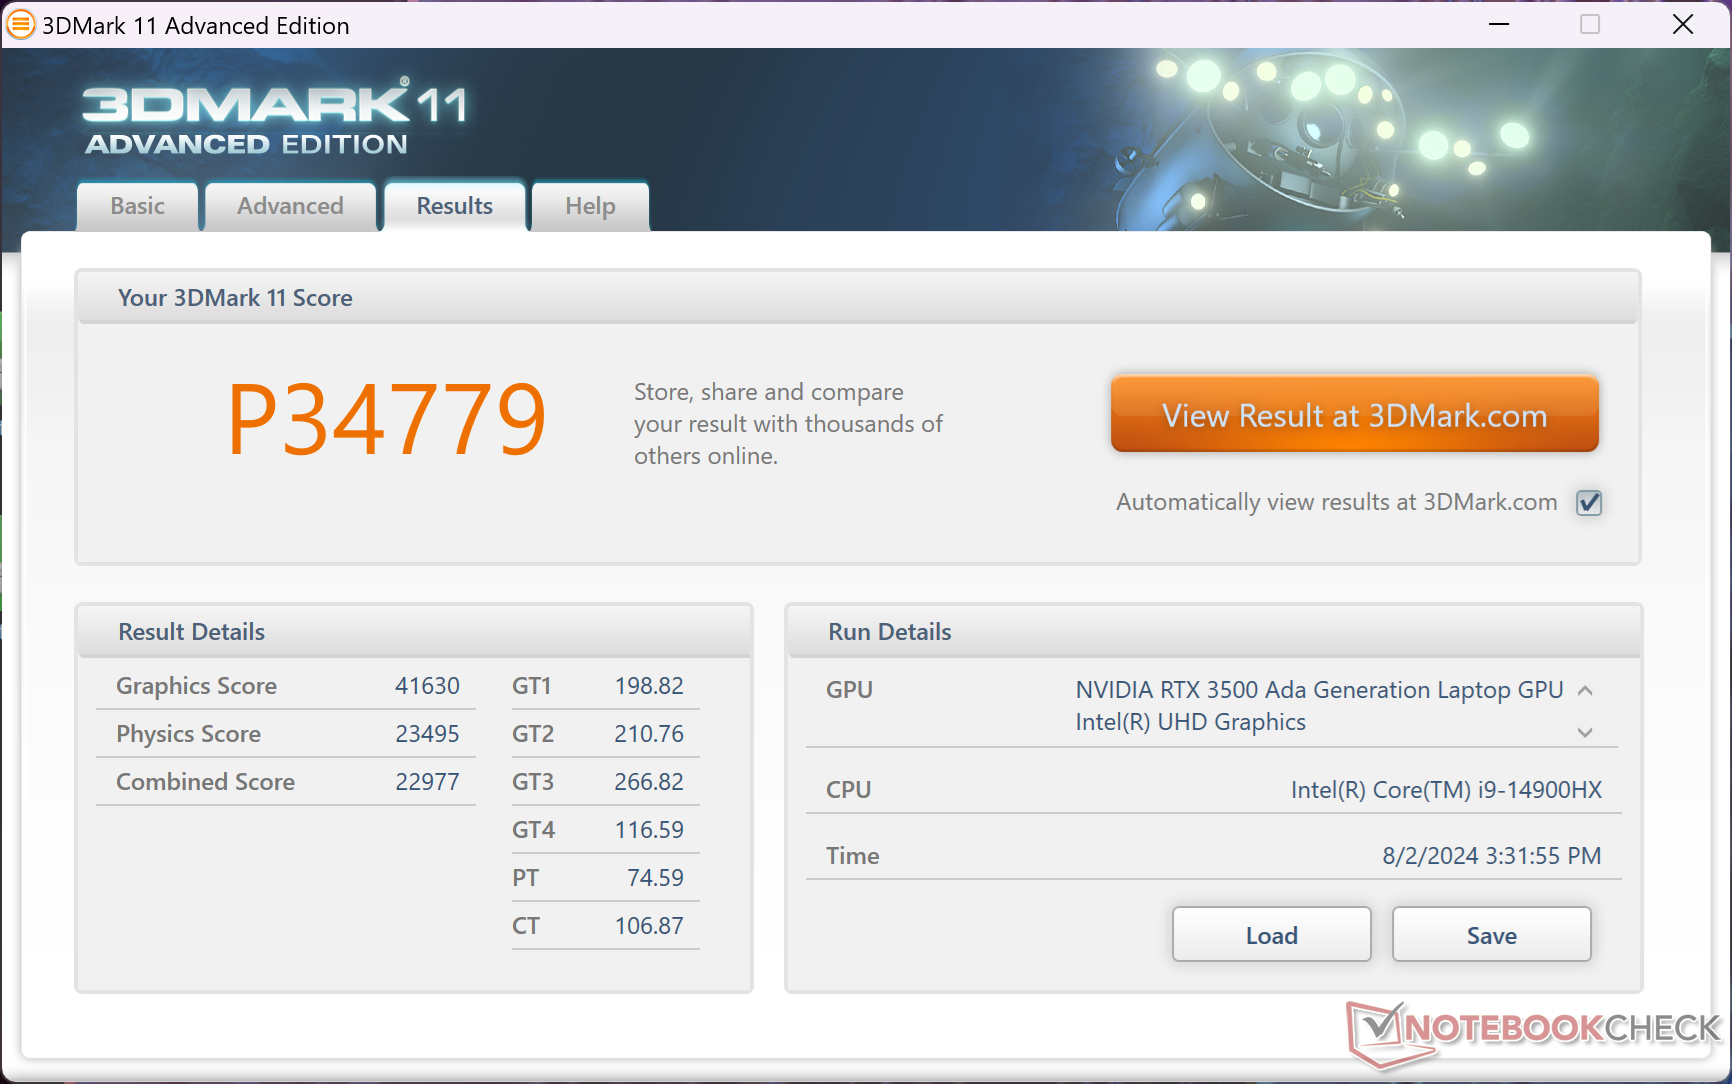
| 3DMark 11 Performance | 34779 Punkte | |
| 3DMark Fire Strike Score | 26188 Punkte | |
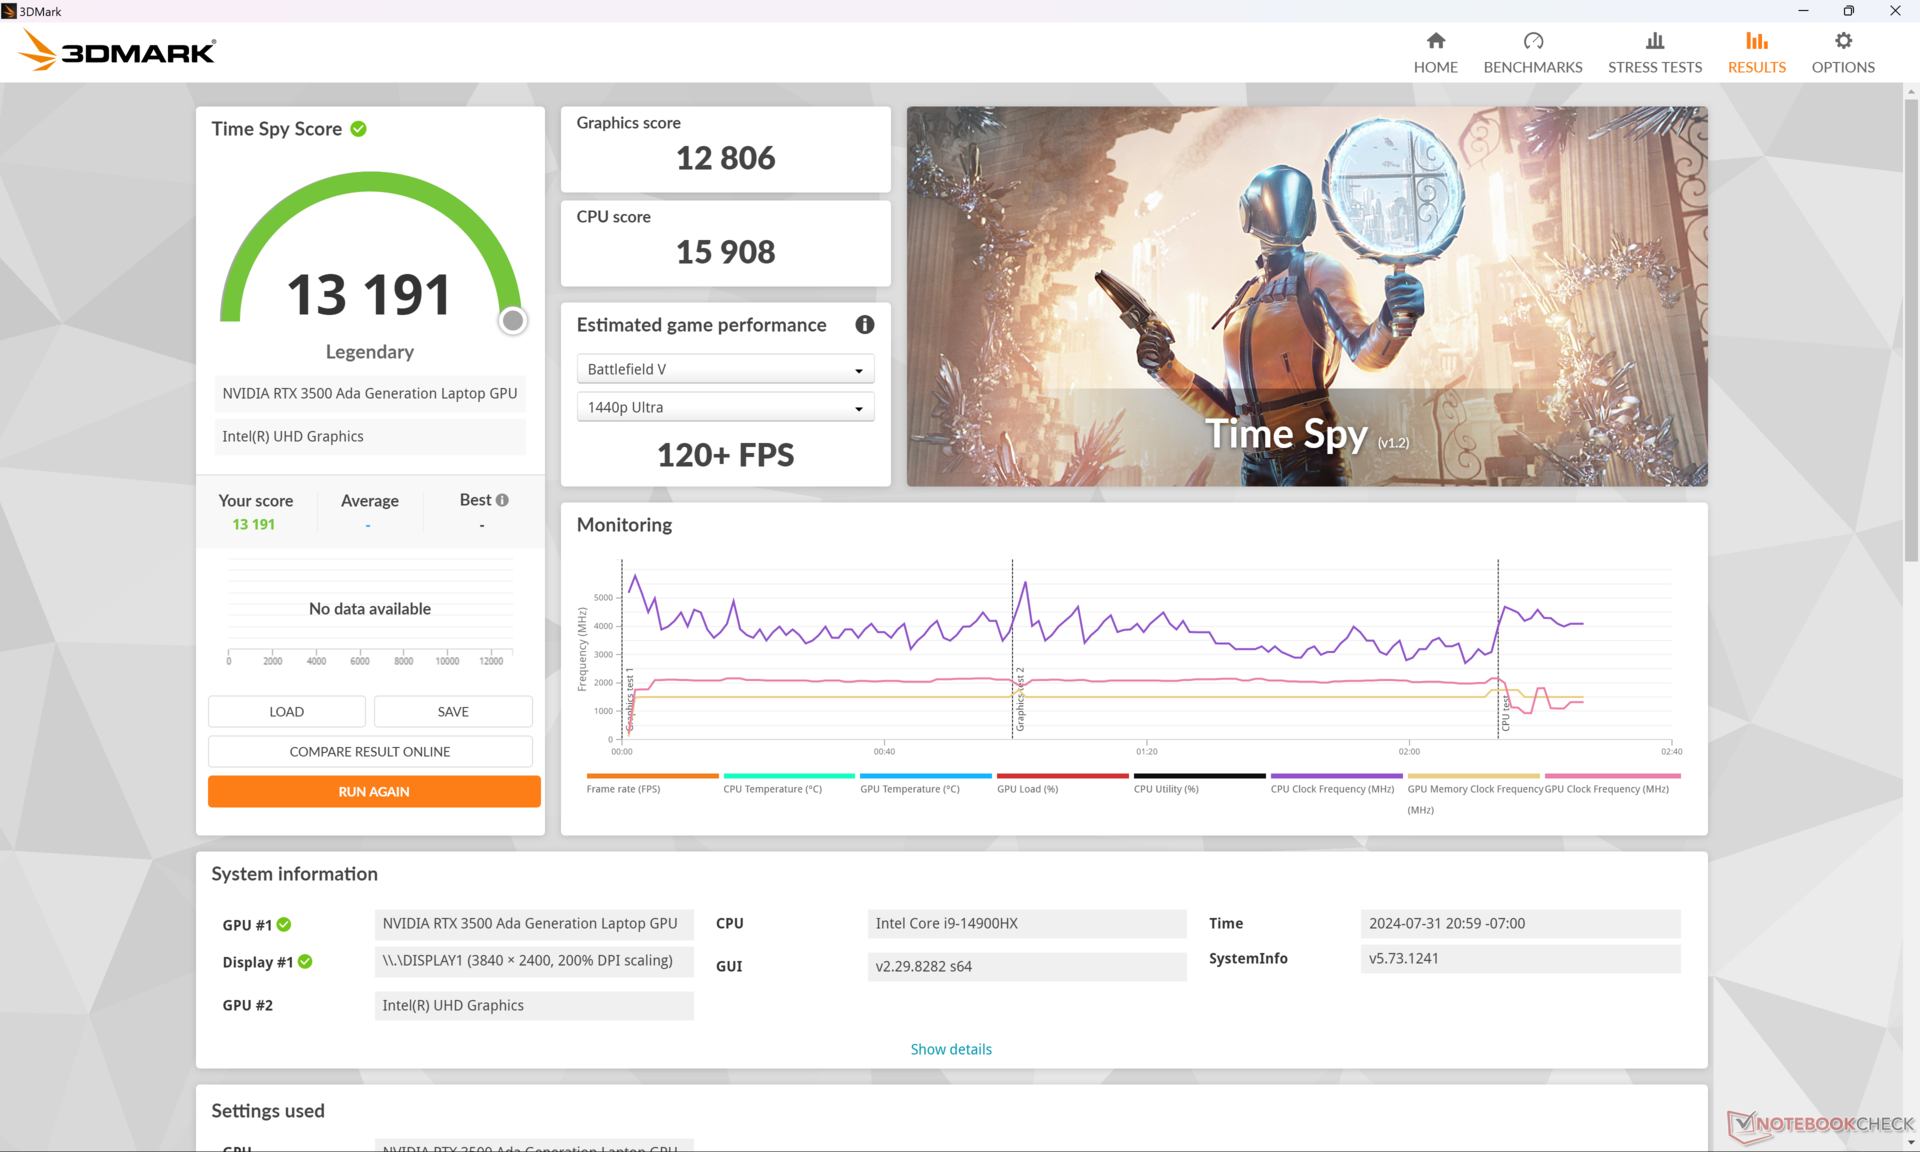
| 3DMark Time Spy Score | 13191 Punkte | |
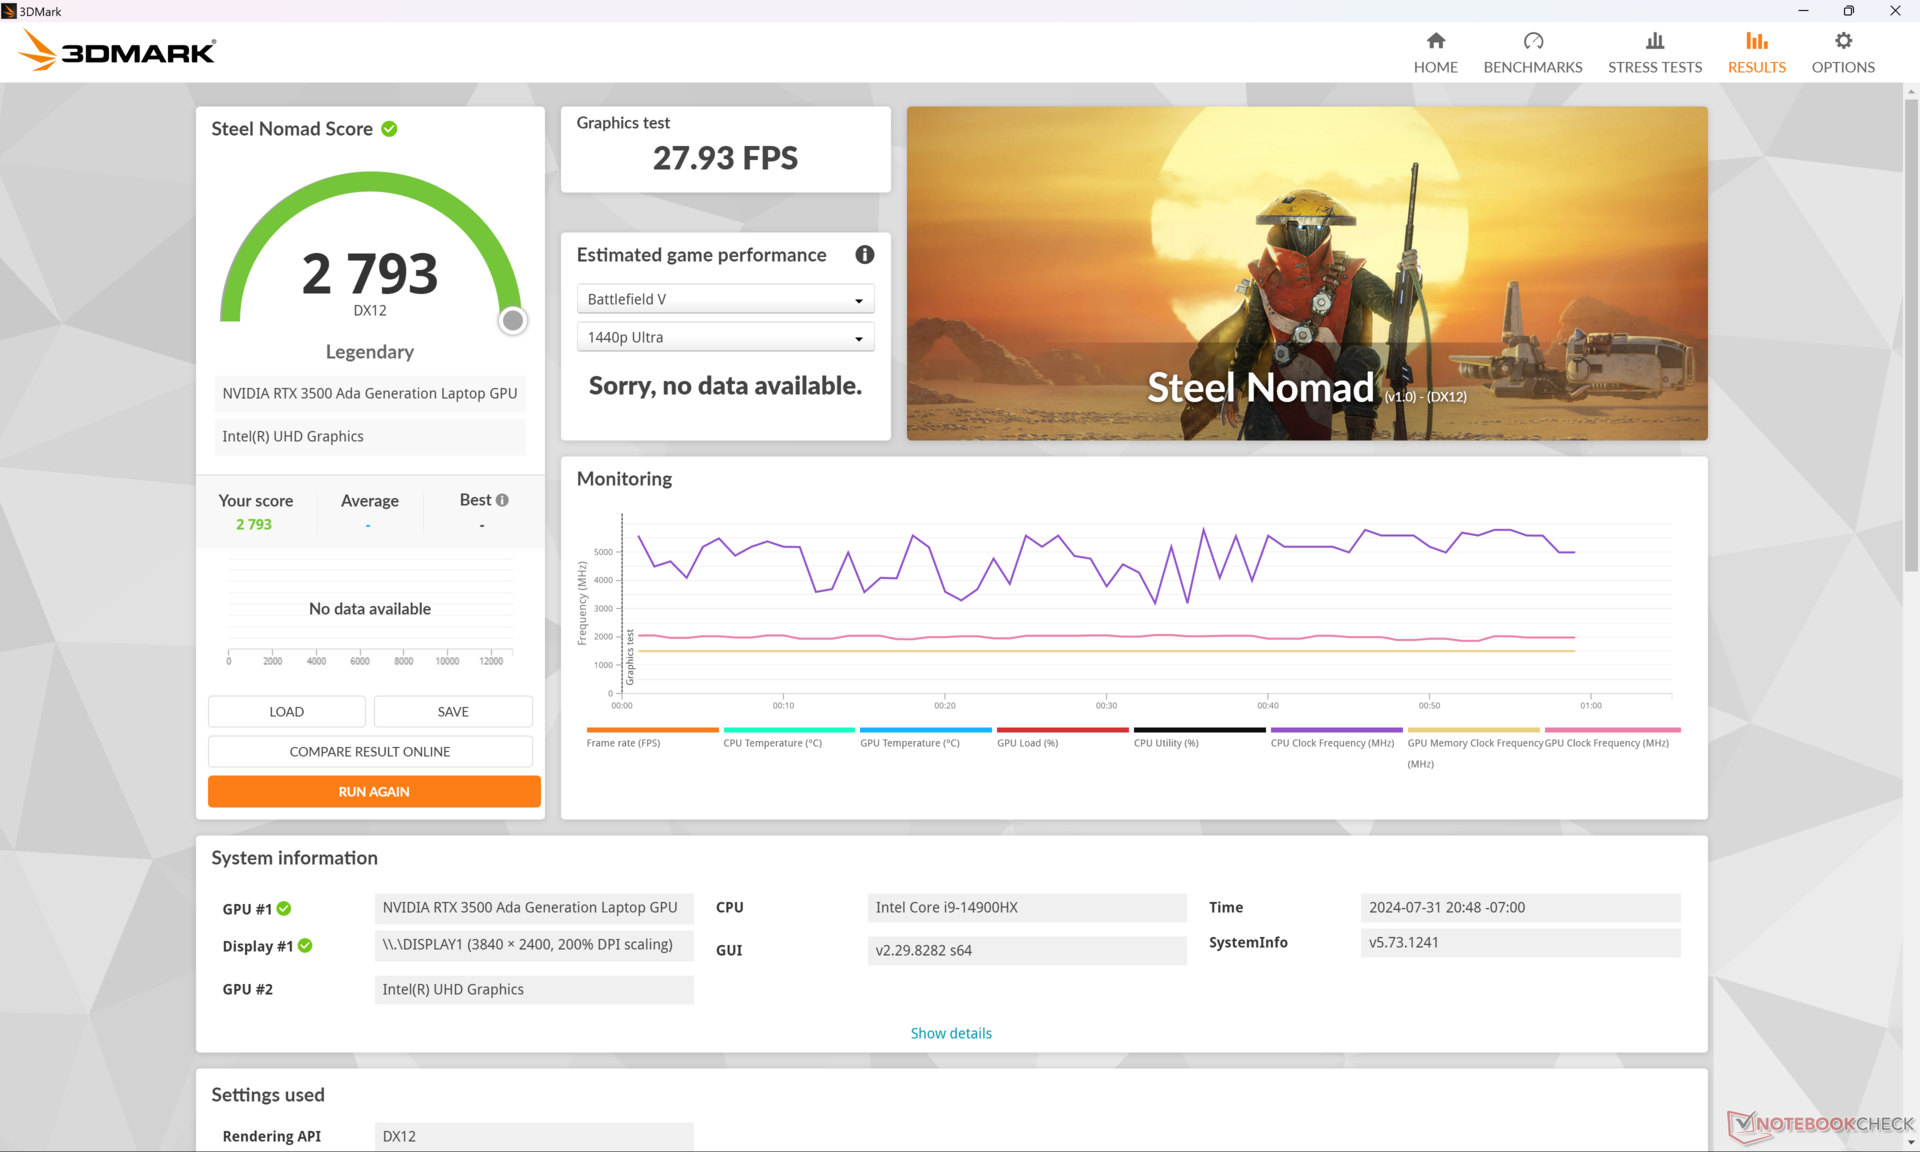
| 3DMark Steel Nomad Score | 2793 Punkte | |
Hilfe | ||
* ... kleinere Werte sind besser
Gaming Performance
Obwohl die RTX 3500 Ada nicht für Spiele entwickelt wurde, übertrifft sie leicht die mobile GeForce RTX 4070, liegt jedoch unter der mobilen RTX 4080, insbesondere wenn man die Anzahl der Unified Pipelines, Tensor-Kerne und die Speicherbandbreite berücksichtigt. Die Leistung kann sich jedoch im Laufe der Zeit verringern, wenn die GPU belastet wird, da die Boost-Geschwindigkeiten nicht unbegrenzt sind. Im Leerlauf von Cyberpunk 2077 bei 1080p Ultra-Einstellungen liegt die Leistung beispielsweise zunächst bei etwas über 70 FPS, bevor sie nach nur 30 Minuten allmählich in den niedrigen 60-FPS-Bereich absinkt, wie die unten stehende Grafik zeigt.
| Performance Rating - Percent | |
| HP ZBook Fury 16 G10 -2! | |
| Lenovo ThinkPad P1 G6 21FV001KUS -1! | |
| HP ZBook Fury 16 G11 | |
| Asus ProArt Studiobook 16 OLED H7604 -1! | |
| Dell Precision 5690 -1! | |
| HP ZBook Fury 16 G9 -1! | |
| Lenovo ThinkPad P16 G2 21FA000FGE -1! | |
Cyberpunk 2077 ultra FPS-Diagramm
| min. | mittel | hoch | max. | QHD | 4K | |
|---|---|---|---|---|---|---|
| GTA V (2015) | 184.3 | 181 | 170.1 | 115.5 | 97.5 | 59.6 |
| Dota 2 Reborn (2015) | 201 | 177.7 | 162.1 | 153.9 | 134.4 | |
| Final Fantasy XV Benchmark (2018) | 200 | 167.6 | 128.9 | 97.5 | 54.2 | |
| X-Plane 11.11 (2018) | 144.6 | 137.8 | 110.9 | 92.7 | ||
| Far Cry 5 (2018) | 133 | 135 | 127 | 109 | 62 | |
| Strange Brigade (2018) | 411 | 296 | 235 | 223 | 159.2 | 78.6 |
| Tiny Tina's Wonderlands (2022) | 232.5 | 195.4 | 137.9 | 109.3 | 74.4 | 41.6 |
| F1 22 (2022) | 228 | 223 | 182.8 | 72.9 | 48.3 | 24 |
| Baldur's Gate 3 (2023) | 164.8 | 136.2 | 118.6 | 117.3 | 80.2 | 41.2 |
| Cyberpunk 2077 2.2 Phantom Liberty (2023) | 121.2 | 113.1 | 101.8 | 90.3 | 60.2 | 21.3 |
Emissionen
Geräuschemissionen
Das Lüftergeräusch und -verhalten des ZBook Fury 16 G11 entspricht weitgehend dem des Vorjahresmodells, ist jedoch unter hoher Last möglicherweise etwas lauter. Die Lüfter neigen dazu, gelegentlich auch im Leerlauf auf dem Desktop zu pulsieren, selbst wenn der Balanced-Modus aktiviert ist und keine Anwendungen laufen. Darüber hinaus leidet unser Testgerät unter einem merklichen Spulenfiepen, das während des gesamten Testzeitraums kontinuierlich auftrat.
Lautstärkediagramm
| Idle |
| 23.2 / 23.2 / 29.5 dB(A) |
| Last |
| 43 / 48.2 dB(A) |
 | ||
30 dB leise 40 dB(A) deutlich hörbar 50 dB(A) störend |
||
min: | ||
| HP ZBook Fury 16 G11 NVIDIA RTX 3500 Ada Generation Laptop GPU, i9-14900HX, SK hynix PC801 HFS001TEJ9X101N | HP ZBook Fury 16 G10 NVIDIA RTX 5000 Ada Generation Laptop GPU, i9-13950HX, SK hynix PC801 HFS001TEJ9X101N | HP ZBook Fury 16 G9 RTX A5500 Laptop GPU, i9-12950HX, Micron 3400 1TB MTFDKBA1T0TFH | Dell Precision 5690 NVIDIA RTX 5000 Ada Generation Laptop GPU, Ultra 9 185H, 2x Samsung PM9A1 1TB (RAID 0) | Lenovo ThinkPad P16 G2 21FA000FGE NVIDIA RTX 2000 Ada Generation Laptop GPU, i7-13700HX, SK hynix PC801 HFS001TEJ9X162N | Lenovo ThinkPad P1 G6 21FV001KUS NVIDIA GeForce RTX 4080 Laptop GPU, i7-13800H, Kioxia XG8 KXG8AZNV1T02 | Asus ProArt Studiobook 16 OLED H7604 NVIDIA GeForce RTX 4070 Laptop GPU, i9-13980HX, Phison EM2804TBMTCB47 | |
|---|---|---|---|---|---|---|---|
| Geräuschentwicklung | 3% | 4% | -3% | -4% | 9% | -5% | |
| aus / Umgebung * | 23.2 | 22.9 1% | 22.6 3% | 23.4 -1% | 23.5 -1% | 22.5 3% | 24.5 -6% |
| Idle min * | 23.2 | 22.9 1% | 22.7 2% | 23.6 -2% | 23.5 -1% | 22.5 3% | 24.5 -6% |
| Idle avg * | 23.2 | 22.9 1% | 22.7 2% | 24.9 -7% | 29.2 -26% | 22.5 3% | 24.5 -6% |
| Idle max * | 29.5 | 28.5 3% | 28.8 2% | 30.9 -5% | 29.5 -0% | 22.5 24% | 24.5 17% |
| Last avg * | 43 | 40.6 6% | 36.2 16% | 40.4 6% | 32.7 24% | 28.7 33% | 47.6 -11% |
| Cyberpunk 2077 ultra * | 48.2 | ||||||
| Last max * | 48.2 | 45.8 5% | 49.3 -2% | 51.9 -8% | 56.6 -17% | 54.4 -13% | 56.7 -18% |
| Witcher 3 ultra * | 44.1 | 49.5 | 48.3 | 50.6 | 47.5 | 55.9 |
* ... kleinere Werte sind besser
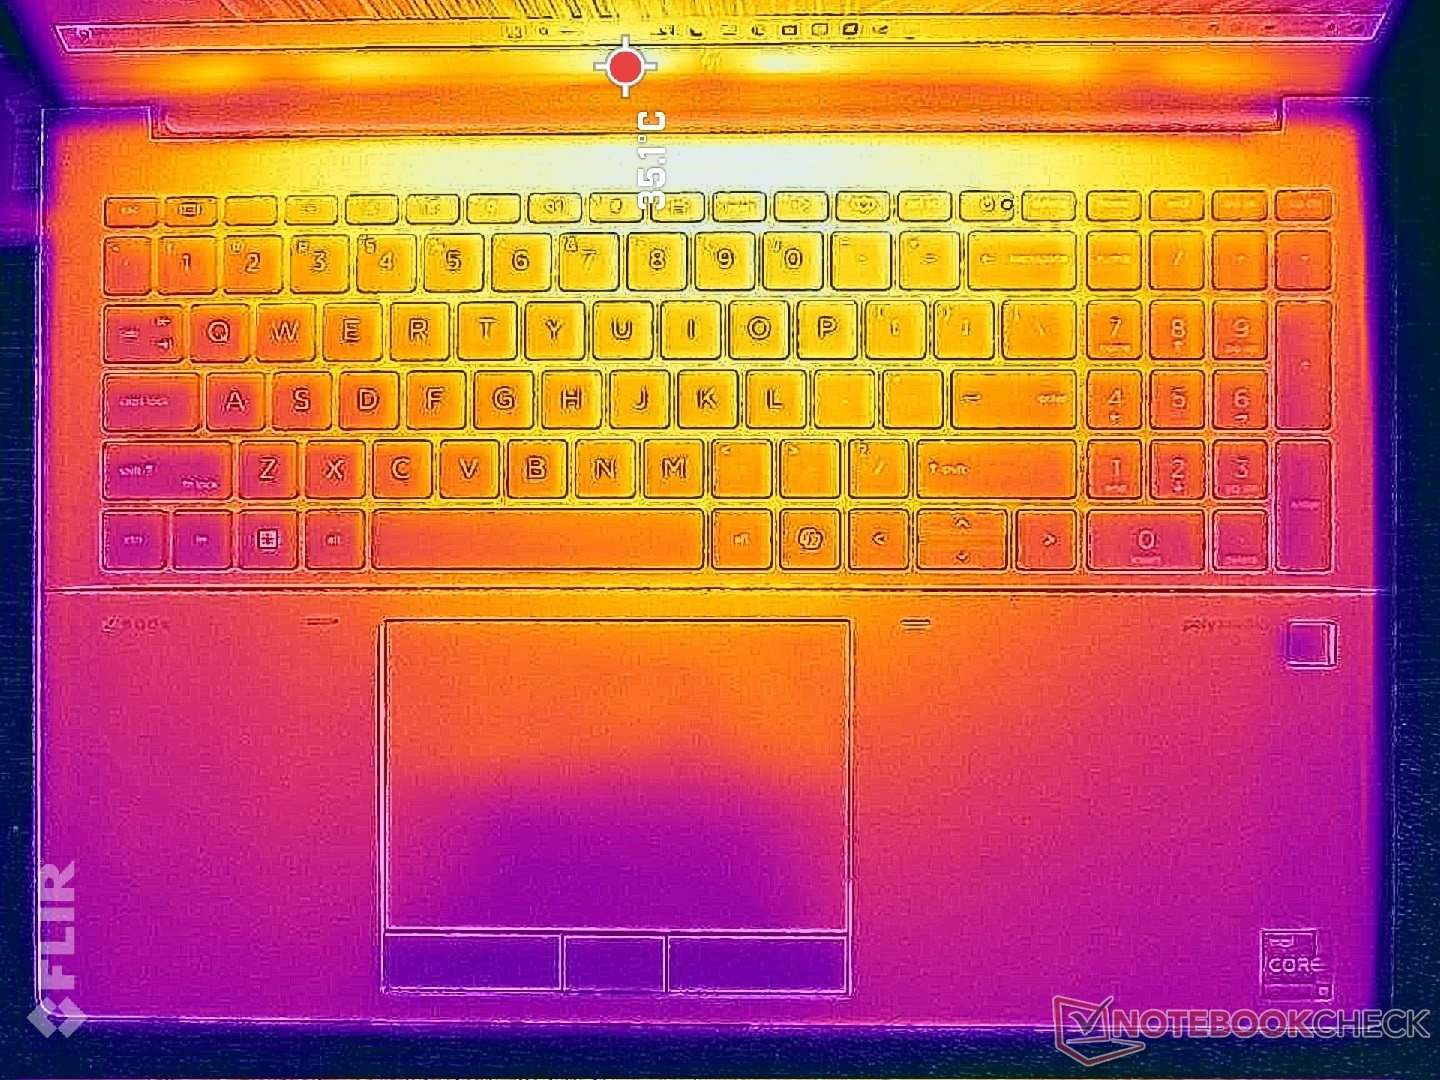
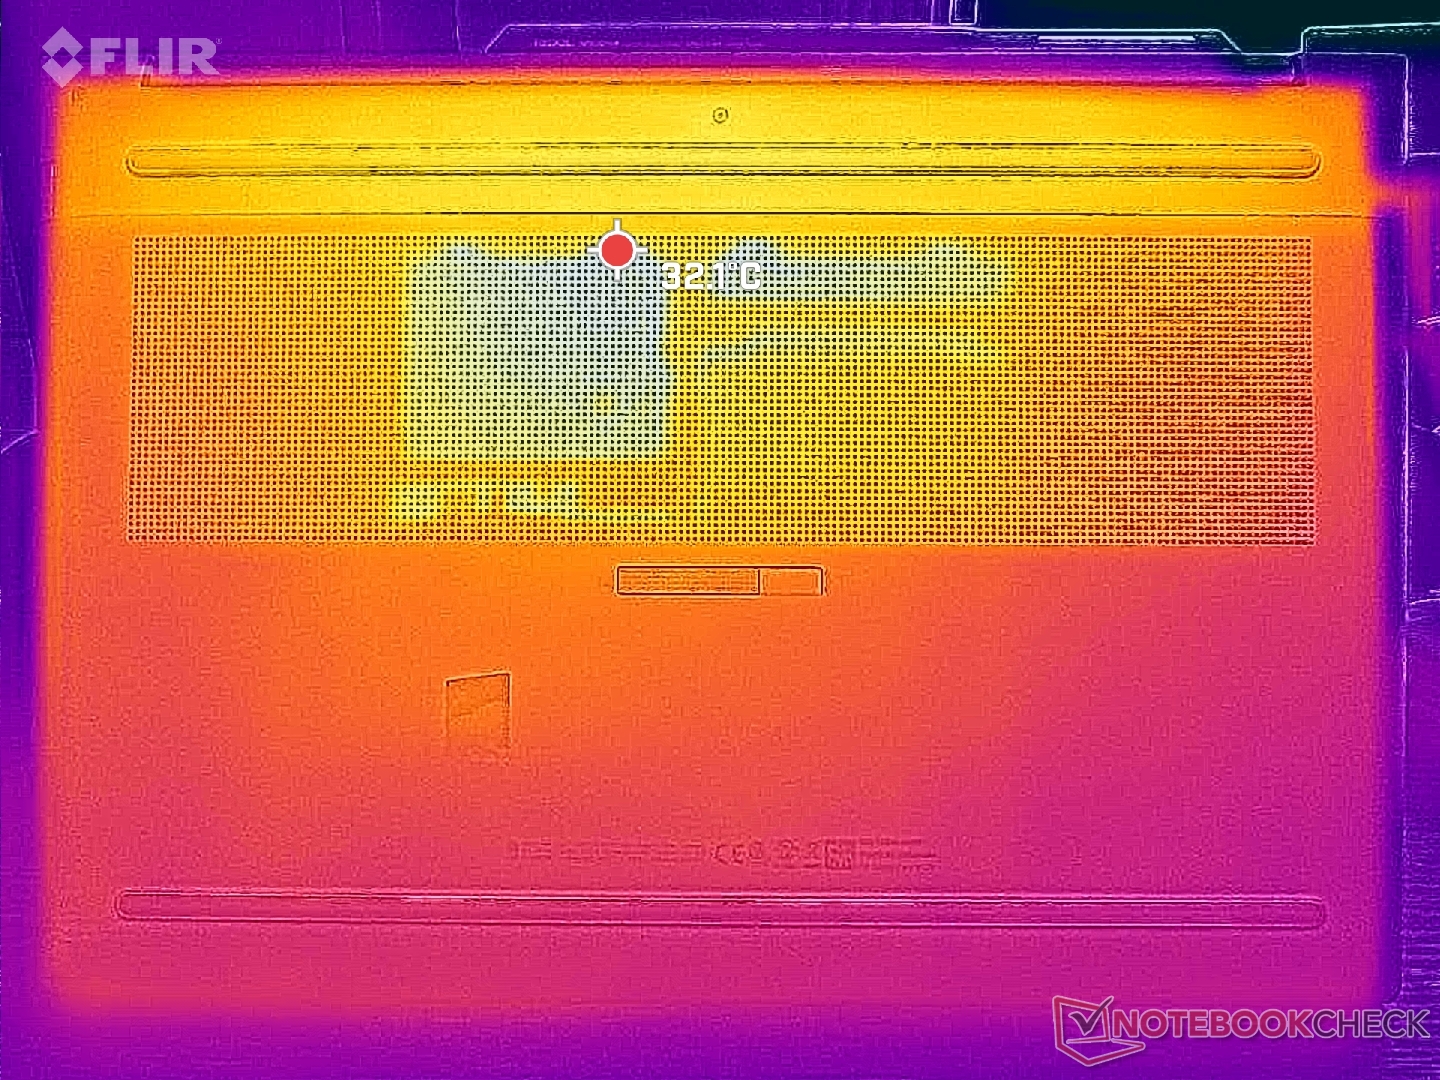
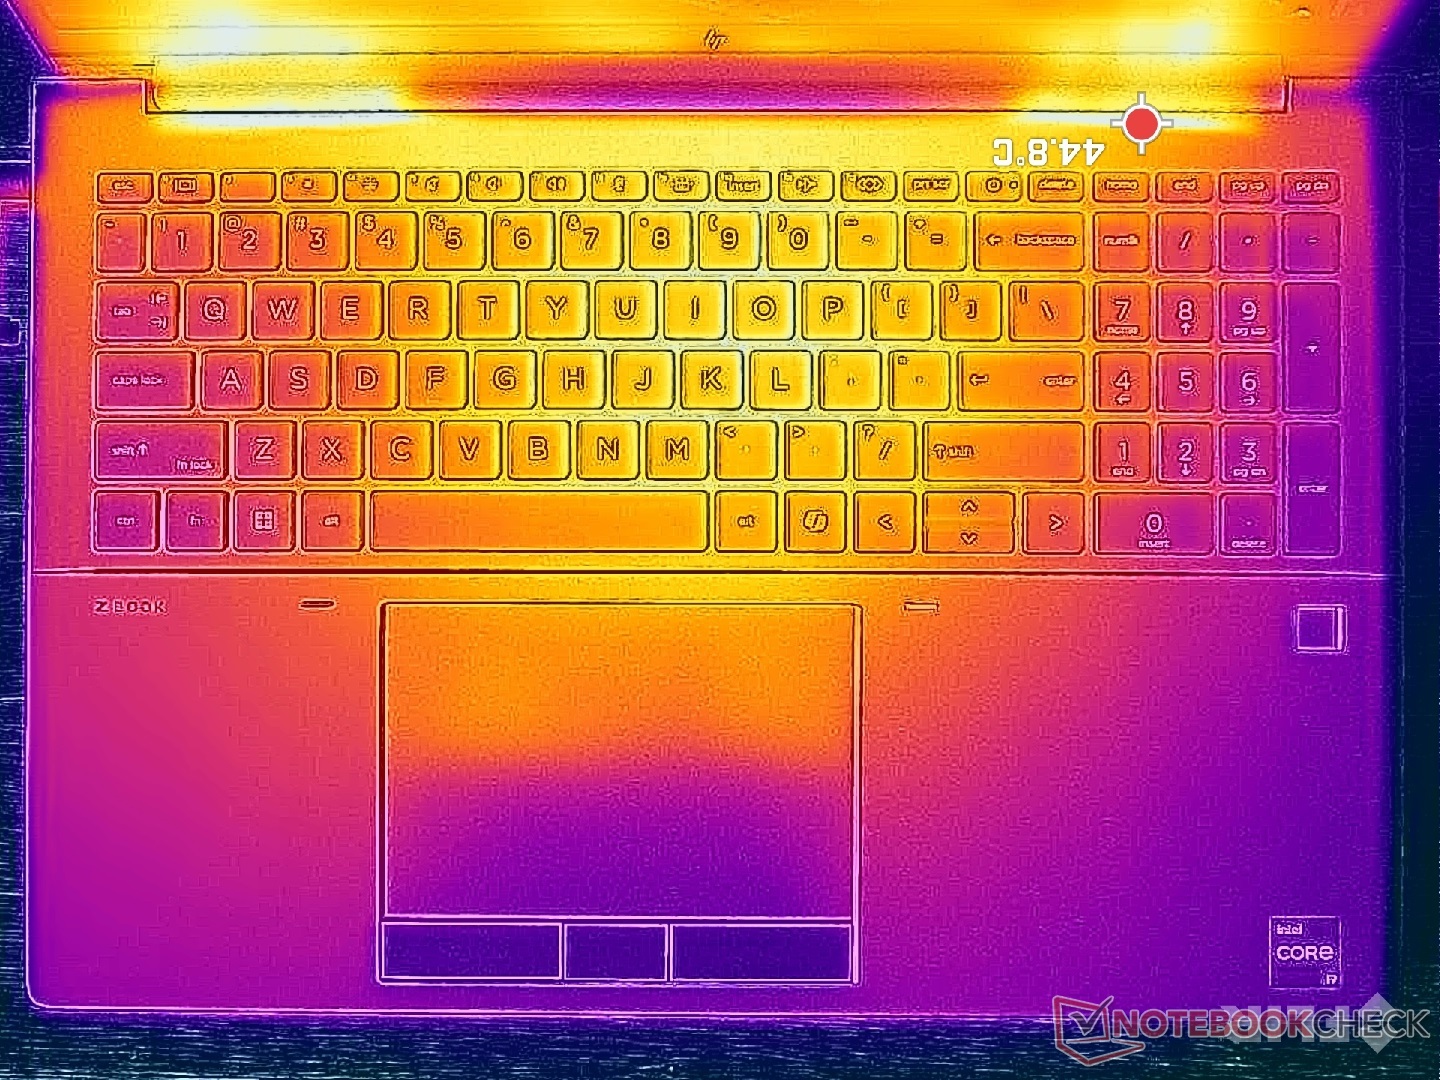
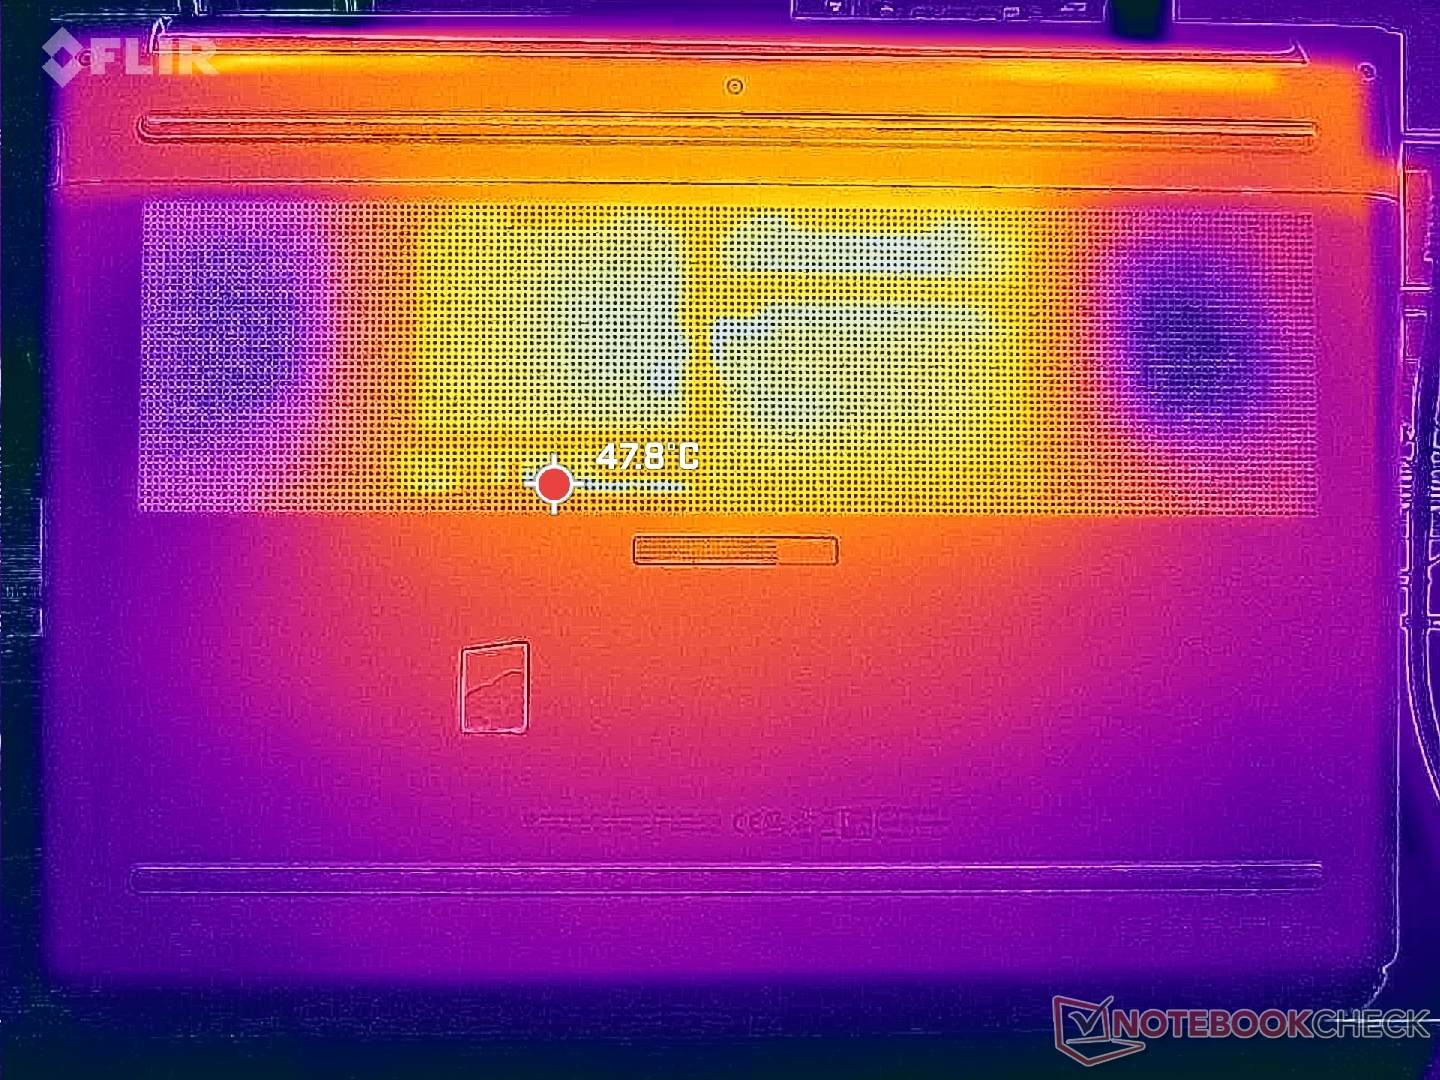
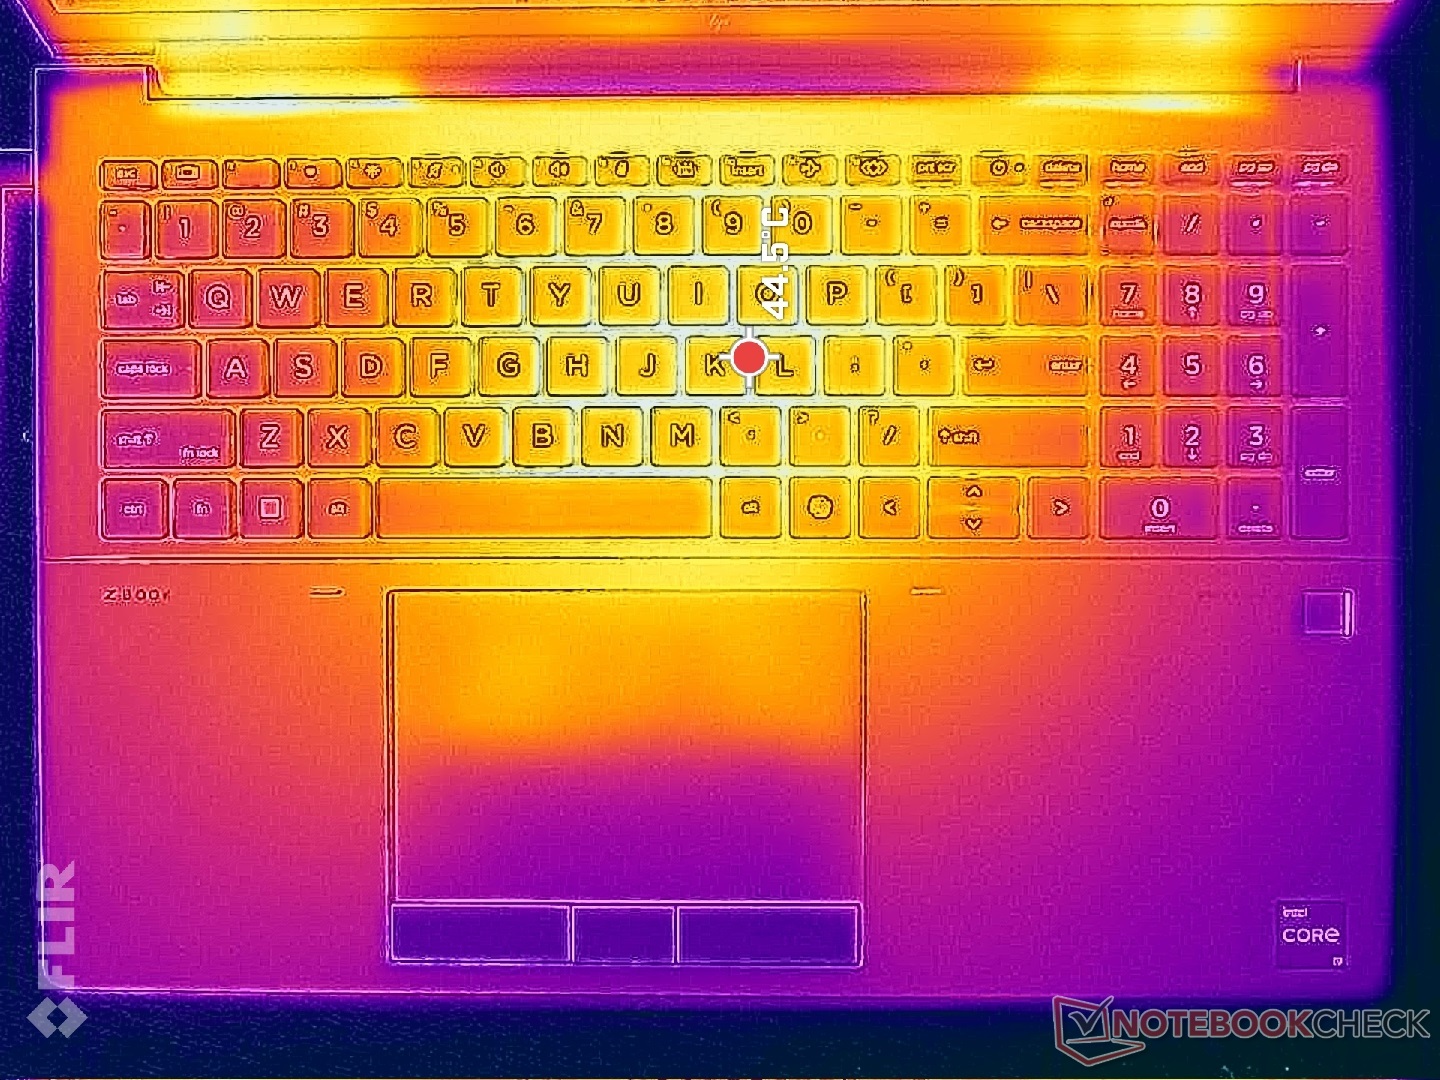
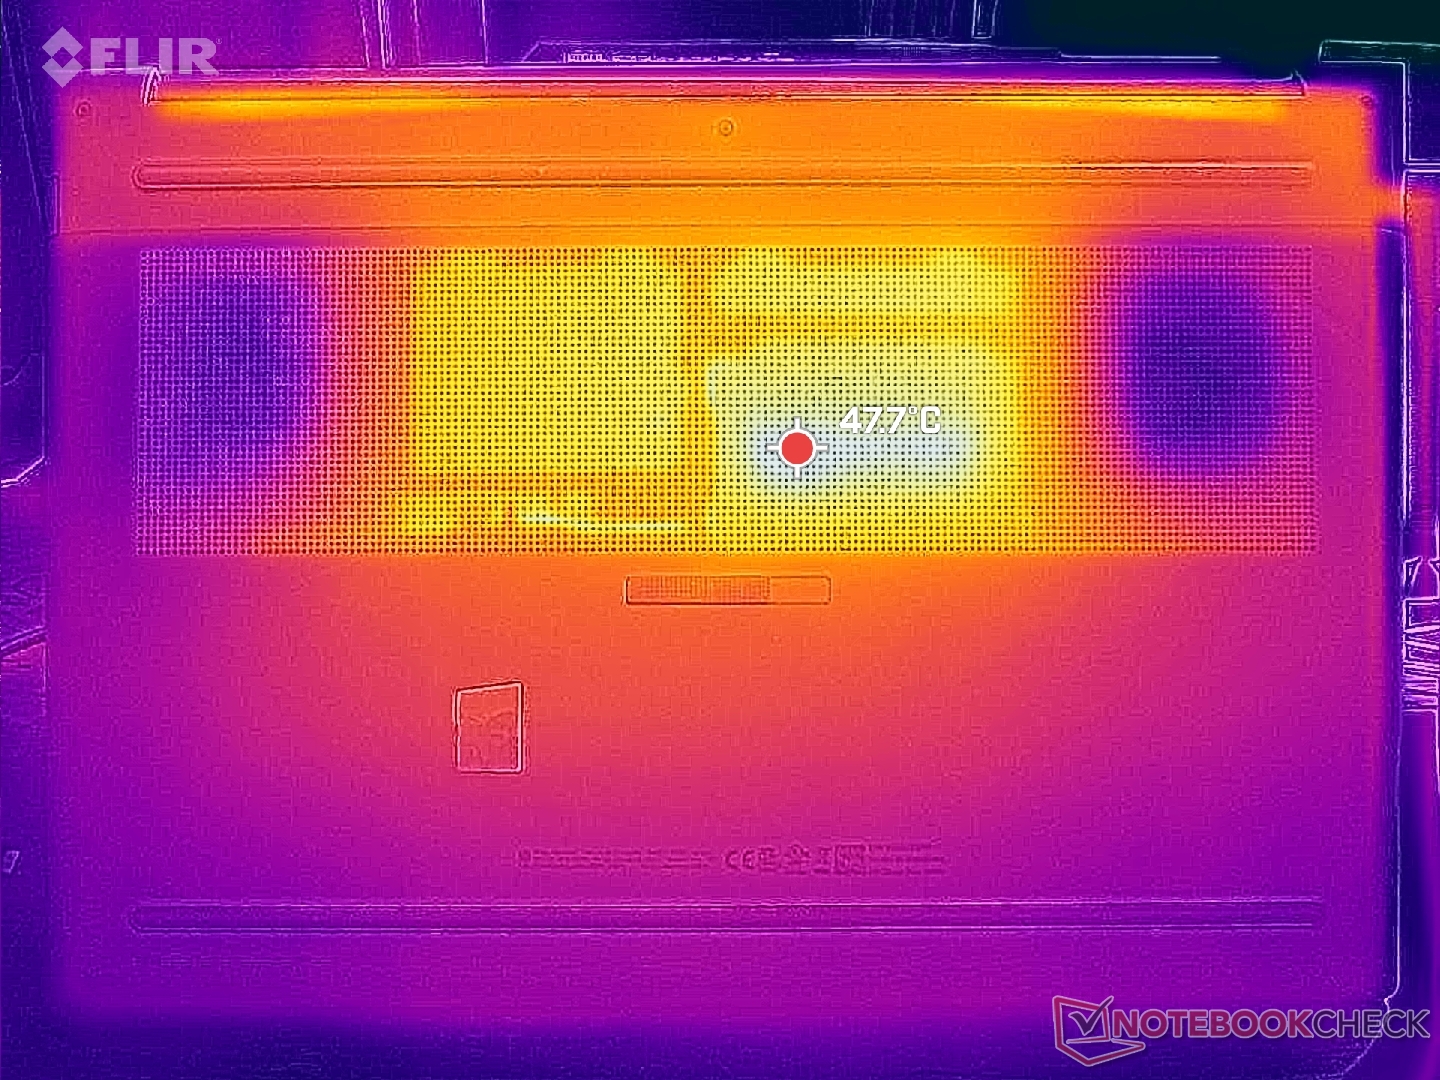
Temperatur
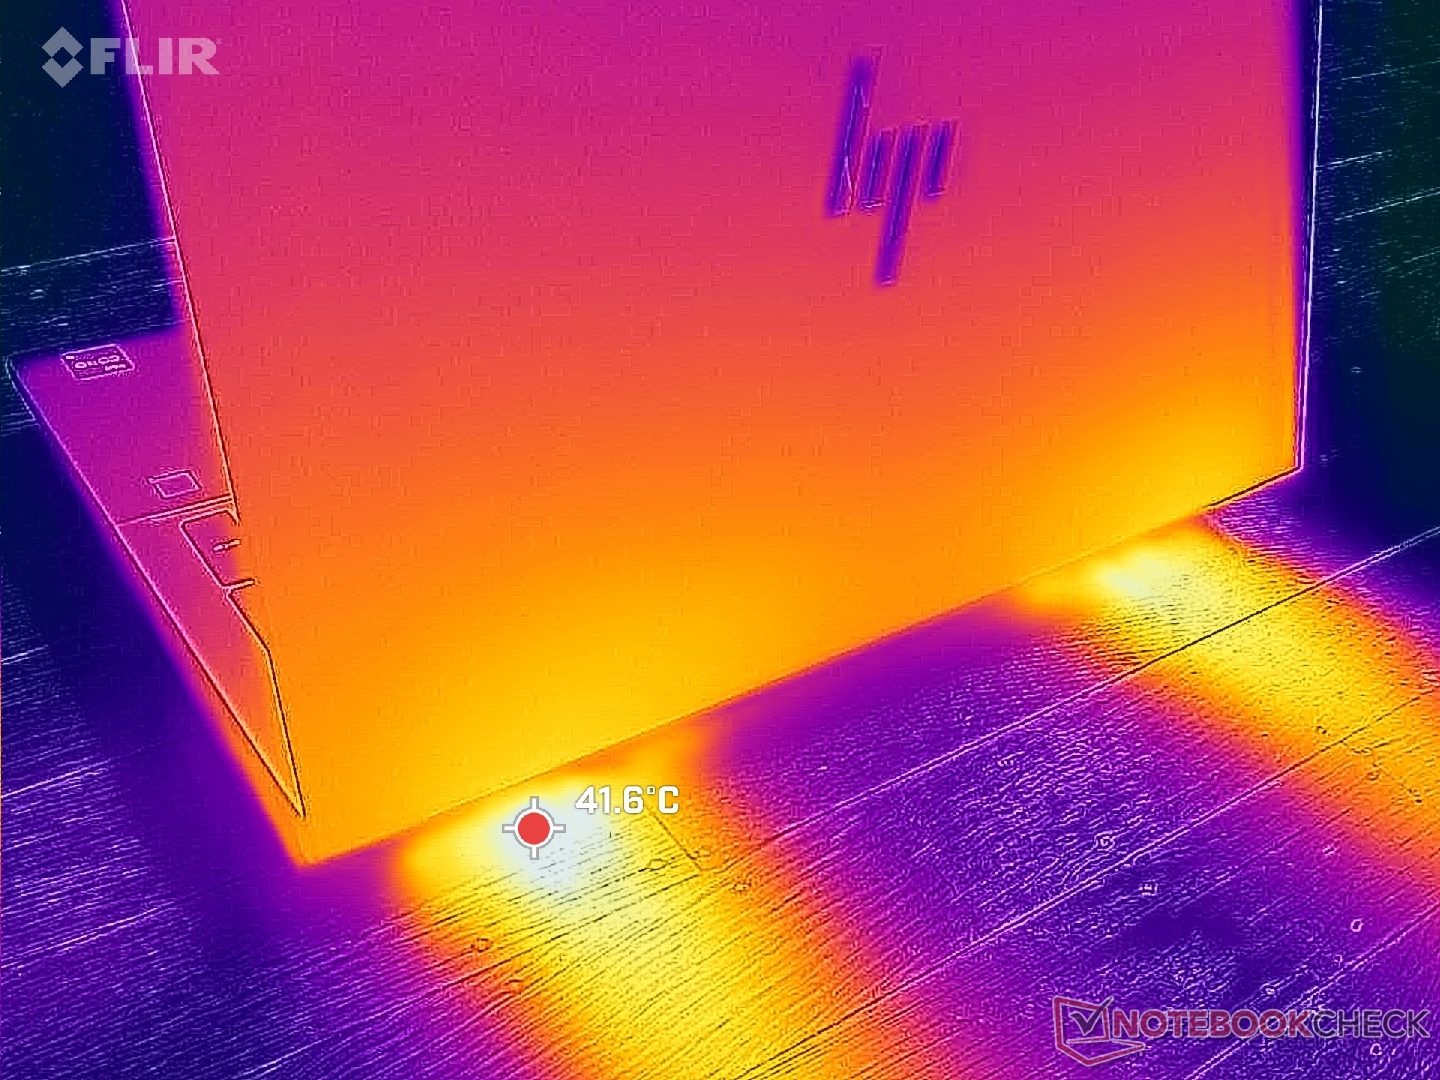
(±) Die maximale Temperatur auf der Oberseite ist 42.2 °C. Im Vergleich liegt der Klassendurchschnitt bei 38.2 °C (von 22.2 bis 69.8 °C für die Klasse Workstation).
(-) Auf der Unterseite messen wir eine maximalen Wert von 48 °C (im Vergleich zum Durchschnitt von 41.2 °C).
(±) Ohne Last messen wir eine durchschnittliche Temperatur von 33.8 °C auf der Oberseite. Der Klassendurchschnitt erreicht 32 °C.
(-) 3: The average temperature for the upper side is 38.5 °C / 101 F, compared to the average of 32 °C / 90 F for the class Workstation.
(±) Die Handballen und der Touchpad-Bereich können sehr heiß werden mit maximal 37.6 °C.
(-) Die durchschnittliche Handballen-Temperatur anderer getesteter Geräte war 27.8 °C (-9.8 °C).
| HP ZBook Fury 16 G11 Intel Core i9-14900HX, NVIDIA RTX 3500 Ada Generation Laptop GPU | HP ZBook Fury 16 G10 Intel Core i9-13950HX, Nvidia RTX 5000 Ada Generation Laptop GPU | HP ZBook Fury 16 G9 Intel Core i9-12950HX, NVIDIA RTX A5500 Laptop GPU | Dell Precision 5690 Intel Core Ultra 9 185H, Nvidia RTX 5000 Ada Generation Laptop GPU | Lenovo ThinkPad P16 G2 21FA000FGE Intel Core i7-13700HX, NVIDIA RTX 2000 Ada Generation Laptop GPU | Lenovo ThinkPad P1 G6 21FV001KUS Intel Core i7-13800H, NVIDIA GeForce RTX 4080 Laptop GPU | Asus ProArt Studiobook 16 OLED H7604 Intel Core i9-13980HX, NVIDIA GeForce RTX 4070 Laptop GPU | |
|---|---|---|---|---|---|---|---|
| Hitze | 3% | 10% | 13% | 15% | 4% | 3% | |
| Last oben max * | 42.2 | 44.8 -6% | 43.2 -2% | 46.6 -10% | 47.2 -12% | 42 -0% | 44.1 -5% |
| Last unten max * | 48 | 50 -4% | 50.4 -5% | 33 31% | 39.5 18% | 45.2 6% | 48 -0% |
| Idle oben max * | 37 | 34.4 7% | 28.6 23% | 32.4 12% | 28.1 24% | 33 11% | 32.7 12% |
| Idle unten max * | 36.8 | 31.8 14% | 28.2 23% | 29.4 20% | 25.3 31% | 37 -1% | 34.9 5% |
* ... kleinere Werte sind besser
Lautsprecher
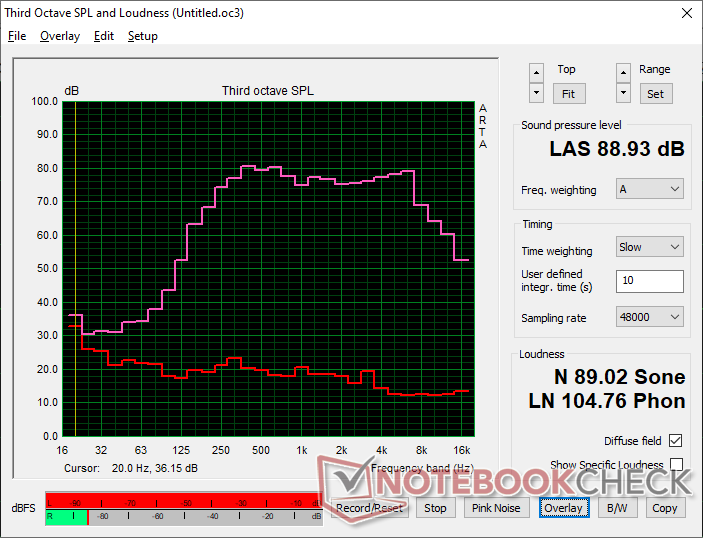
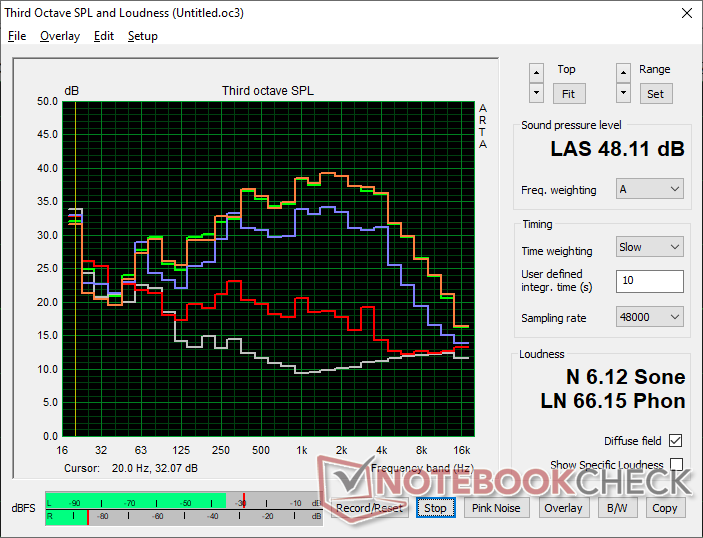
HP ZBook Fury 16 G11 Audio Analyse
(+) | Die Lautsprecher können relativ laut spielen (88.9 dB)
Bass 100 - 315 Hz
(±) | abgesenkter Bass - 13.3% geringer als der Median
(±) | durchschnittlich lineare Bass-Wiedergabe (11.2% Delta zum Vorgänger)
Mitteltöne 400 - 2000 Hz
(+) | ausgeglichene Mitten, vom Median nur 2.2% abweichend
(+) | lineare Mitten (3.2% Delta zum Vorgänger)
Hochtöne 2 - 16 kHz
(+) | ausgeglichene Hochtöne, vom Median nur 3.7% abweichend
(+) | sehr lineare Hochtöne (4.6% Delta zum Vorgänger)
Gesamt im hörbaren Bereich 100 - 16.000 Hz
(+) | hörbarer Bereich ist sehr linear (12.9% Abstand zum Median
Im Vergleich zu allen Geräten derselben Klasse
» 17% aller getesteten Geräte dieser Klasse waren besser, 6% vergleichbar, 76% schlechter
» Das beste Gerät hat einen Delta-Wert von 7%, durchschnittlich ist 18%, das schlechteste Gerät hat 35%
Im Vergleich zu allen Geräten im Test
» 11% aller getesteten Geräte waren besser, 3% vergleichbar, 87% schlechter
» Das beste Gerät hat einen Delta-Wert von 4%, durchschnittlich ist 24%, das schlechteste Gerät hat 134%
Apple MacBook Pro 16 2021 M1 Pro Audio Analyse
(+) | Die Lautsprecher können relativ laut spielen (84.7 dB)
Bass 100 - 315 Hz
(+) | guter Bass - nur 3.8% Abweichung vom Median
(+) | lineare Bass-Wiedergabe (5.2% Delta zum Vorgänger)
Mitteltöne 400 - 2000 Hz
(+) | ausgeglichene Mitten, vom Median nur 1.3% abweichend
(+) | lineare Mitten (2.1% Delta zum Vorgänger)
Hochtöne 2 - 16 kHz
(+) | ausgeglichene Hochtöne, vom Median nur 1.9% abweichend
(+) | sehr lineare Hochtöne (2.7% Delta zum Vorgänger)
Gesamt im hörbaren Bereich 100 - 16.000 Hz
(+) | hörbarer Bereich ist sehr linear (4.6% Abstand zum Median
Im Vergleich zu allen Geräten derselben Klasse
» 0% aller getesteten Geräte dieser Klasse waren besser, 0% vergleichbar, 100% schlechter
» Das beste Gerät hat einen Delta-Wert von 5%, durchschnittlich ist 18%, das schlechteste Gerät hat 45%
Im Vergleich zu allen Geräten im Test
» 0% aller getesteten Geräte waren besser, 0% vergleichbar, 100% schlechter
» Das beste Gerät hat einen Delta-Wert von 4%, durchschnittlich ist 24%, das schlechteste Gerät hat 134%
Energieverwaltung
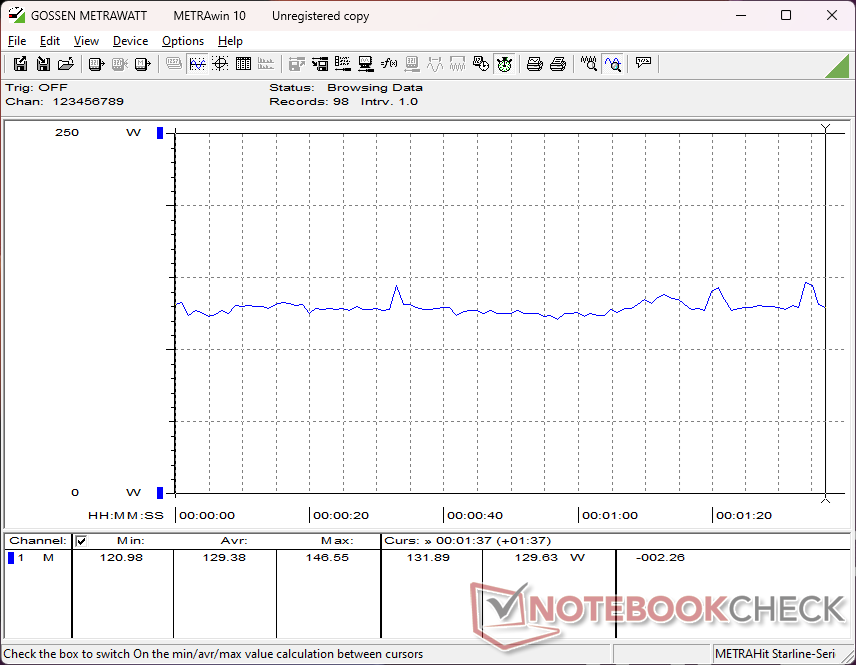
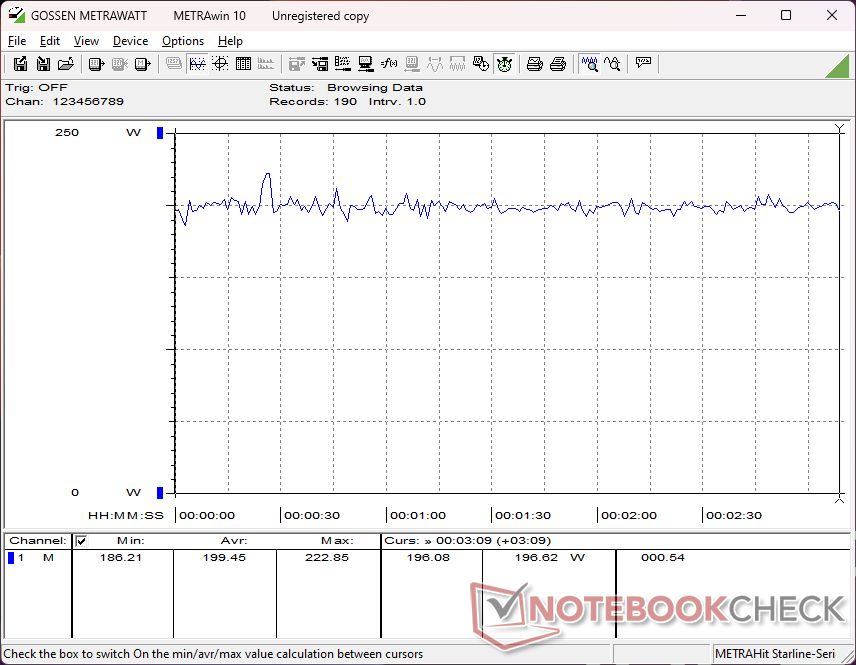
Energieaufnahme
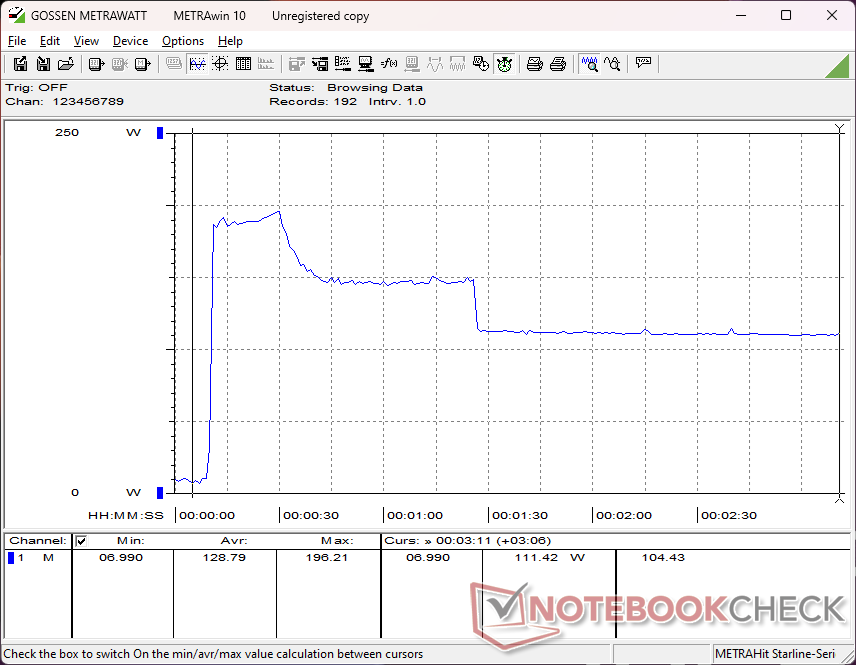
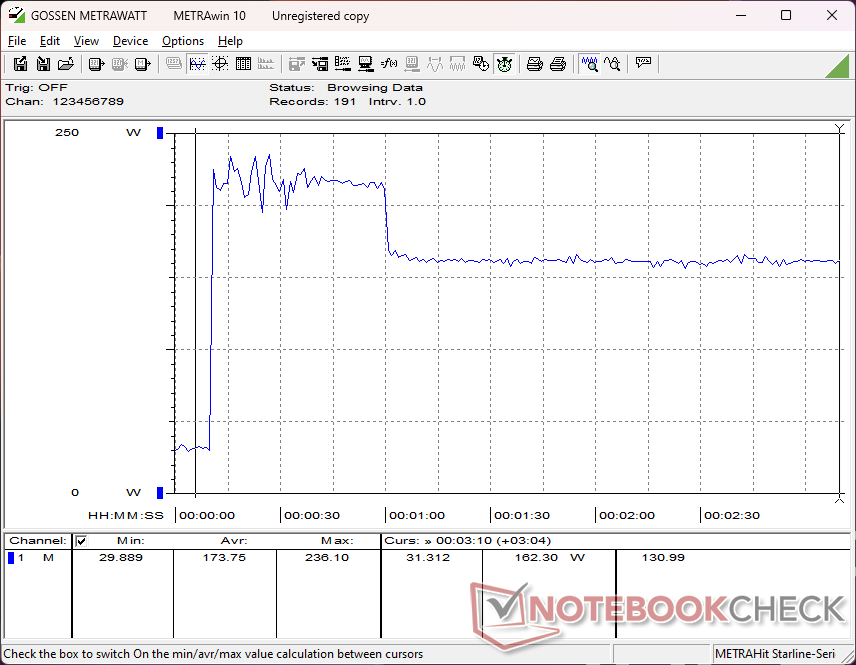
Im Vergleich zur ZBook Fury 16 G10-Konfiguration ist das System im Leerlauf auf dem Desktop effizienter. Bei anspruchsvolleren Lasten wie Spielen bleibt der Verbrauch jedoch nahezu gleich, obwohl die GPUs in unseren beiden Beispielen unterschiedlich konfiguriert sind. Die Leistung pro Watt verbessert sich daher, wenn man sich für eine High-End-GPU-Konfiguration im Vergleich zur mittleren RTX 3500 Ada entscheidet.
Der Energieverbrauch beim Ausführen von Prime95 oder CineBench R15 xT wäre bei unserem Gerät im Vergleich zum Vorjahresmodell aufgrund des höheren Turbo-Boost-Potenzials des Core i9-14900HX-Prozessors spürbar höher. Nach etwa einer Minute sinkt der Verbrauch jedoch und liegt fast auf dem Niveau, das wir beim Vorjahresmodell gemessen haben, wie die Vergleichsgrafik unten zeigt, die mit unseren Beobachtungen der CineBench R15 xT-Schleife übereinstimmt. Das höhere anfängliche Turbo-Boost-Potenzial ist also der wesentliche Vorteil des neueren Core i9-14900HX im Vergleich zum älteren Core i9-13950HX.
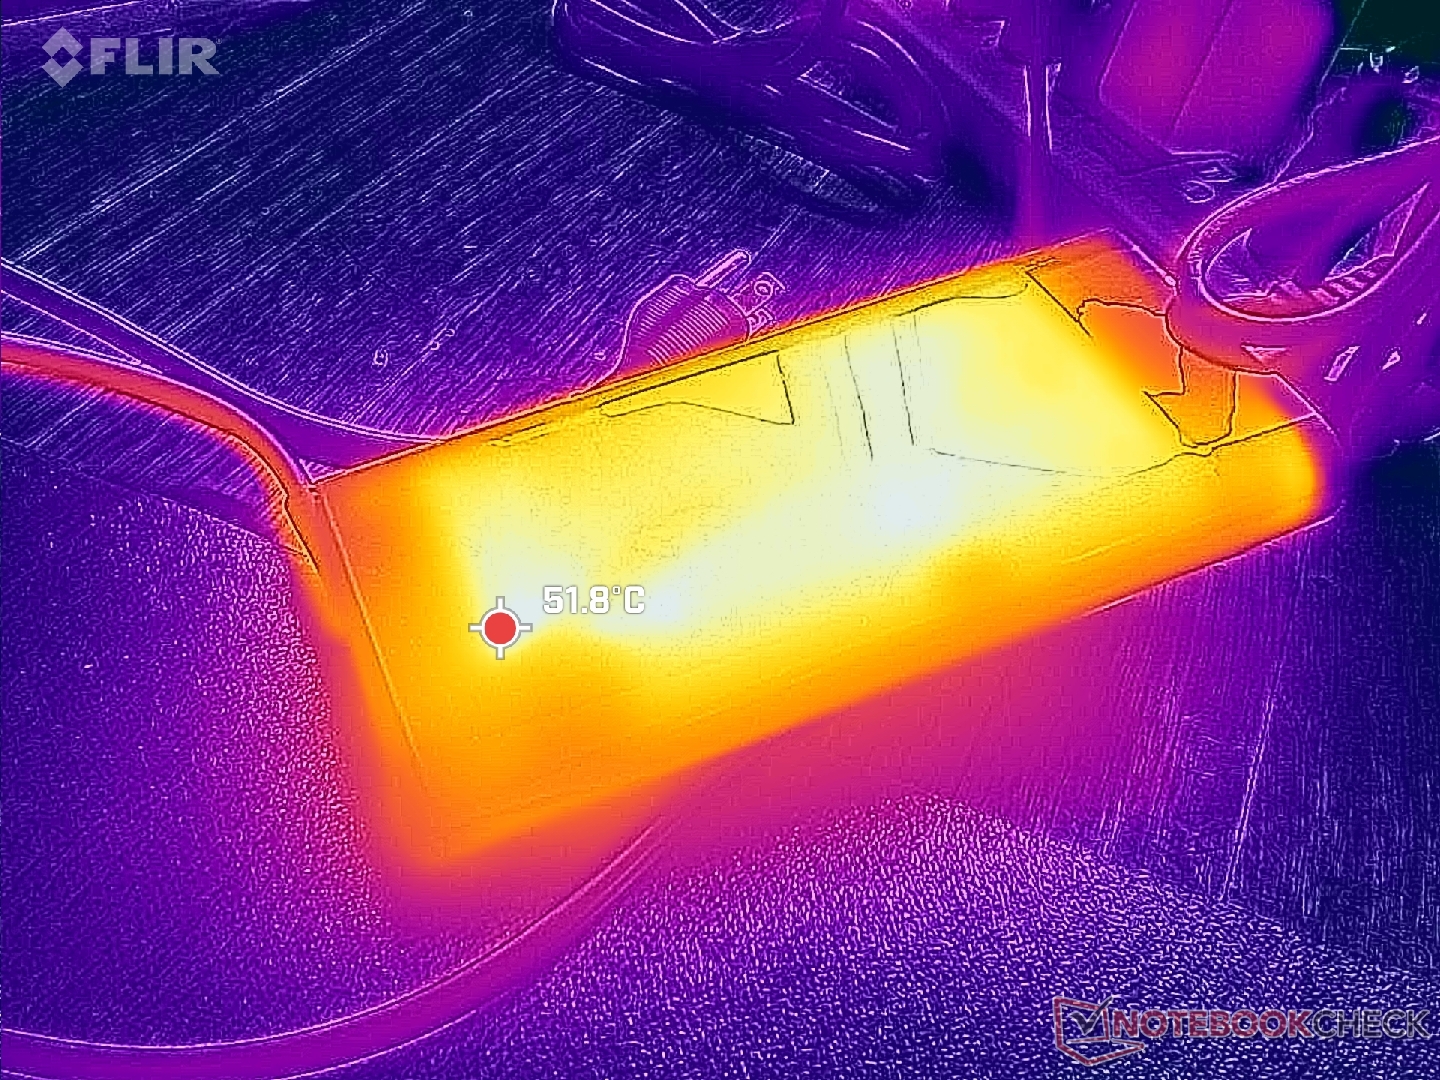
Wir konnten einen maximalen Verbrauch von 236 W vom großen (~18 x 8,8 x 2,5 cm) 230-W-Netzteil messen, als CPU und GPU jeweils zu 100 Prozent ausgelastet waren.
| Aus / Standby | |
| Idle | |
| Last |
|
Legende:
min: | |
| HP ZBook Fury 16 G11 i9-14900HX, NVIDIA RTX 3500 Ada Generation Laptop GPU, SK hynix PC801 HFS001TEJ9X101N, IPS, 3840x2400, 16" | HP ZBook Fury 16 G10 i9-13950HX, NVIDIA RTX 5000 Ada Generation Laptop GPU, SK hynix PC801 HFS001TEJ9X101N, IPS, 3840x2400, 16" | HP ZBook Fury 16 G9 i9-12950HX, RTX A5500 Laptop GPU, Micron 3400 1TB MTFDKBA1T0TFH, IPS, 3840x2400, 16" | Dell Precision 5690 Ultra 9 185H, NVIDIA RTX 5000 Ada Generation Laptop GPU, 2x Samsung PM9A1 1TB (RAID 0), OLED, 3840x2400, 16" | Lenovo ThinkPad P16 G2 21FA000FGE i7-13700HX, NVIDIA RTX 2000 Ada Generation Laptop GPU, SK hynix PC801 HFS001TEJ9X162N, IPS LED, 2560x1600, 16" | Lenovo ThinkPad P1 G6 21FV001KUS i7-13800H, NVIDIA GeForce RTX 4080 Laptop GPU, Kioxia XG8 KXG8AZNV1T02, OLED, 3480x2400, 16" | Asus ProArt Studiobook 16 OLED H7604 i9-13980HX, NVIDIA GeForce RTX 4070 Laptop GPU, Phison EM2804TBMTCB47, OLED, 3200x2000, 16" | |
|---|---|---|---|---|---|---|---|
| Stromverbrauch | -34% | -77% | -1% | 4% | 7% | -24% | |
| Idle min * | 8.6 | 15.3 -78% | 19.5 -127% | 7.9 8% | 9.3 -8% | 8 7% | 12.8 -49% |
| Idle avg * | 14.8 | 18.2 -23% | 29 -96% | 12 19% | 14.1 5% | 9.5 36% | 19.9 -34% |
| Idle max * | 15.7 | 28 -78% | 40.7 -159% | 28.6 -82% | 15.5 1% | 23.7 -51% | 20.3 -29% |
| Last avg * | 129.4 | 137.9 -7% | 142.1 -10% | 98.8 24% | 133.6 -3% | 97.2 25% | 131.4 -2% |
| Cyberpunk 2077 ultra external monitor * | 192.6 | ||||||
| Cyberpunk 2077 ultra * | 199.4 | ||||||
| Last max * | 236.1 | 202 14% | 224.4 5% | 174.8 26% | 179.6 24% | 197.2 16% | 246.8 -5% |
| Witcher 3 ultra * | 189.4 | 188.6 | 144.5 | 144.9 | 144 | 196.5 |
* ... kleinere Werte sind besser
Energieverbrauch Cyberpunk / Stresstest
Energieverbrauch externer Monitor
Akkulaufzeit
Die Akkulaufzeiten ähneln denen des letztjährigen ZBook Fury 16 G10, sind aber eventuell etwas kürzer, was wahrscheinlich an der höheren Turbo-Boost-Obergrenze der Raptor Lake-HX Refresh CPU liegt. Konkurrenzmodelle wie das Precision 5690 oder das ThinkPad P16 G2 halten im Vergleich jeweils mindestens eine Stunde länger durch.
Das Aufladen von leerer auf volle Kapazität erfolgt mit dem mitgelieferten Netzteil in etwas über 60 Minuten, was relativ schnell ist.
| HP ZBook Fury 16 G11 i9-14900HX, NVIDIA RTX 3500 Ada Generation Laptop GPU, 95 Wh | HP ZBook Fury 16 G10 i9-13950HX, NVIDIA RTX 5000 Ada Generation Laptop GPU, 95 Wh | HP ZBook Fury 16 G9 i9-12950HX, RTX A5500 Laptop GPU, 95 Wh | Dell Precision 5690 Ultra 9 185H, NVIDIA RTX 5000 Ada Generation Laptop GPU, 98 Wh | Lenovo ThinkPad P16 G2 21FA000FGE i7-13700HX, NVIDIA RTX 2000 Ada Generation Laptop GPU, 94 Wh | Lenovo ThinkPad P1 G6 21FV001KUS i7-13800H, NVIDIA GeForce RTX 4080 Laptop GPU, 90 Wh | Asus ProArt Studiobook 16 OLED H7604 i9-13980HX, NVIDIA GeForce RTX 4070 Laptop GPU, 90 Wh | |
|---|---|---|---|---|---|---|---|
| Akkulaufzeit | 8% | -10% | 37% | 28% | -37% | -17% | |
| WLAN | 402 | 435 8% | 360 -10% | 549 37% | 515 28% | 252 -37% | 334 -17% |
| Idle | 319 | ||||||
| Last | 71 | 65 | |||||
| H.264 | 358 |
Pro
Contra
Fazit — Ein begrenzter Turbo-Boost verhindert ein leistungsstarkes Design
Wir sind begeistert vom Design des ZBook Fury 16 G11. Auch wenn es dem Fury 16 G9 ähnelt, überzeugt es durch seine Wartungsfreundlichkeit, umfangreiche Konfigurationsmöglichkeiten, ECC-RAM-Unterstützung sowie eine komfortable Tastatur und ein präzises Touchpad, die alle Anforderungen von Workstation-Nutzern erfüllen.
Allerdings liegen die Schwächen des ZBook Fury 16 G11 in der Leistung. Wenn ein anderes Notebook wie das Lenovo Legion 9 16IRX9 die gleiche Core i9-14900HX-CPU um bis zu 20 Prozent schneller betreiben kann als unser ZBook, zeigt dies, dass die Kühllösung des HP-Notebooks ein Upgrade benötigt, um höhere Turbo-Boost-Geschwindigkeiten länger aufrechtzuerhalten. Auch die M.2-SSDs könnten von Wärmespreizern profitieren, da sie bei hoher Belastung ebenfalls gedrosselt werden. Diese Einschränkungen schmälern die Vorteile der leistungsstarken Core i9-CPU und der PCIe4-SSD, da diese Komponenten in konkurrierenden Geräten von Dell oder Lenovo potenziell schneller arbeiten können.
Das ZBook Fury 16 G11 stellt lediglich ein kleines Update zum ZBook Fury G10 vom letzten Jahr dar. Zwar bleibt das Design attraktiv und hochwertig, doch die Leistung wird bei intensiver Nutzung schnell gedrosselt.
Schließlich ist es etwas enttäuschend, dass das Modell keine Meteor Lake-Optionen für lokale KI-Beschleunigung bietet. Zugegeben, ein solches Feature wäre wahrscheinlich nur für eine kleine Untergruppe von Workstation-Nutzern relevant, aber es hätte dazu beitragen können, das Fury 16 G11 deutlicher vom Fury 16 G10 abzugrenzen. Im Wesentlichen bietet das knapp ein Jahr alte Fury 16 G10 die gleiche Leistung und die gleichen Funktionen wie das aktuelle Fury 16 G11.
Preis und Verfügbarkeit
Das ZBook Fury 16 G11 wird in der Konfiguration mit Core i9-14900HX und RTX 3500 Ada aktuell für etwa 3400 Euro angeboten. Bei einer maximalen Ausstattung mit der RTX 5000 Ada kann der Preis jedoch auf über 4000 Euro steigen.
HP ZBook Fury 16 G11
- 12.08.2024 v8
Allen Ngo
 Total Sustainability Score:
Transparenz
Die Auswahl der zu testenden Geräte erfolgt innerhalb der Redaktion. Das vorliegende Testmuster wurde dem Autor vom Hersteller oder einem Shop zu Testzwecken leihweise zur Verfügung gestellt. Eine Einflussnahme des Leihstellers auf den Testbericht gab es nicht, der Hersteller erhielt keine Version des Reviews vor der Veröffentlichung. Es bestand keine Verpflichtung zur Publikation. Unsere Reviews erfolgen stets ohne Gegenleistung oder Kompensationen. Als eigenständiges, unabhängiges Unternehmen unterliegt Notebookcheck keiner Diktion von Herstellern, Shops und Verlagen.
So testet Notebookcheck
Pro Jahr werden von Notebookcheck hunderte Laptops und Smartphones unabhängig in von uns standardisierten technischen Verfahren getestet, um eine Vergleichbarkeit aller Testergebnisse zu gewährleisten. Seit rund 20 Jahren entwickeln wir diese Testmethoden kontinuierlich weiter und setzen damit Branchenstandards. In unseren Testlaboren kommt ausschließlich hochwertiges Messequipment in die Hände erfahrener Techniker und Redakteure. Die Tests unterliegen einer mehrstufigen Kontrolle. Unsere komplexe Gesamtbewertung basiert auf hunderten fundierten Messergebnissen und Benchmarks, womit Ihnen Objektivität garantiert ist. Weitere Informationen zu unseren Testmethoden gibt es hier.
Preisvergleich

