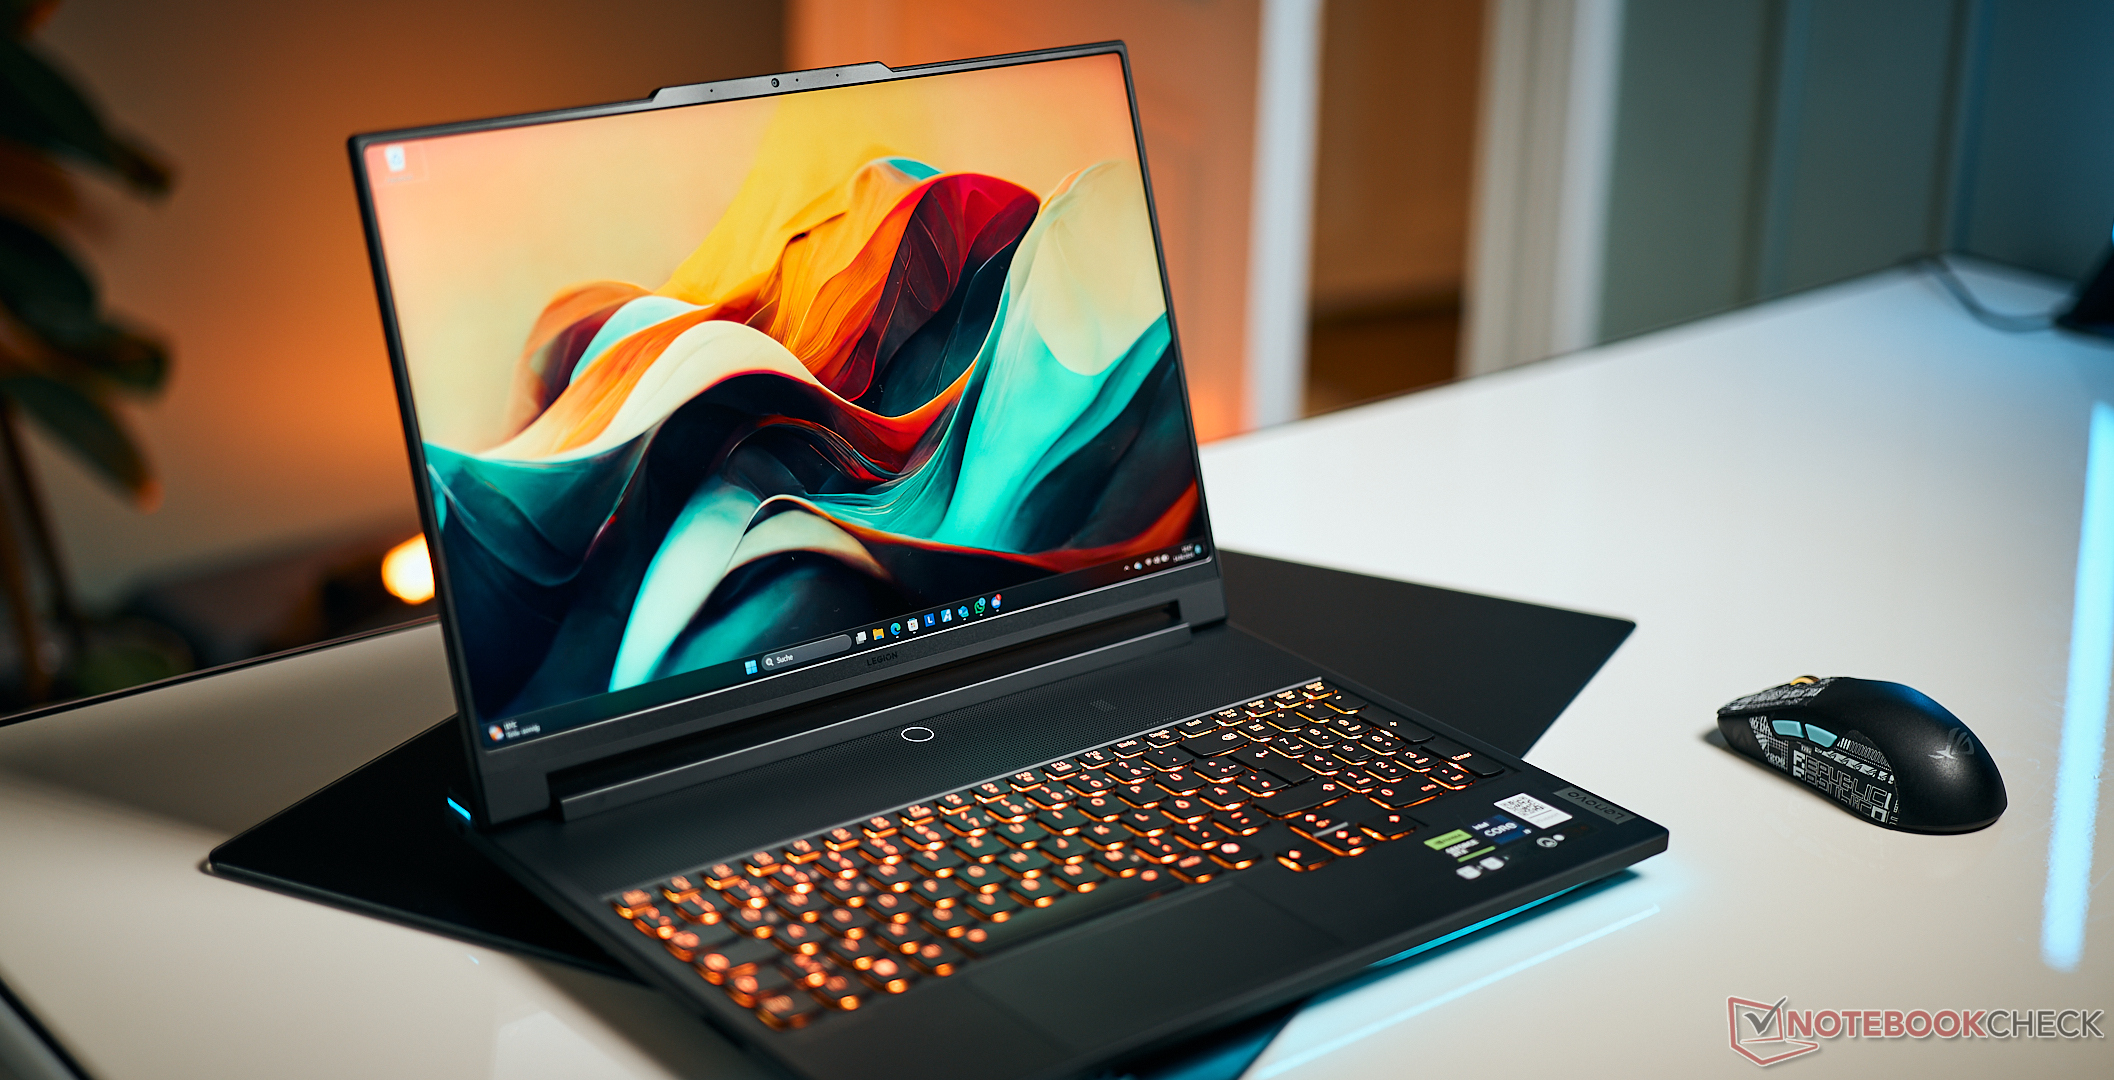
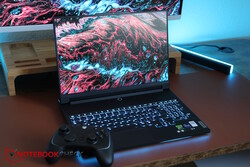
Letztes Jahr titelten wir "Lenovos bisher ambitioniertestes Gaming-Notebook" über das Legion 9i. Die nächste Generation ist nicht weniger ambitioniert, allerdings halten sich die Änderungen am High-End-Gamer doch arg in Grenzen. Lediglich die CPU wurde gegen die aktuelle 14. Intel-Generation getauscht, was den Laptop auch KI-fähiger macht.
Da 16-Zoll-Laptops eher selten mit einer RTX 4090 bestückt werden, vergleichen wir neben dem Vorgänger und dem Razer Blade 16 (2024) auch mit den 18-Zoll-Gamern Alienware m18 R2 und Asus ROG Strix Scar 18 (2024) sowie dem 17-Zoller Medion Erazer Beast X40 (2024).
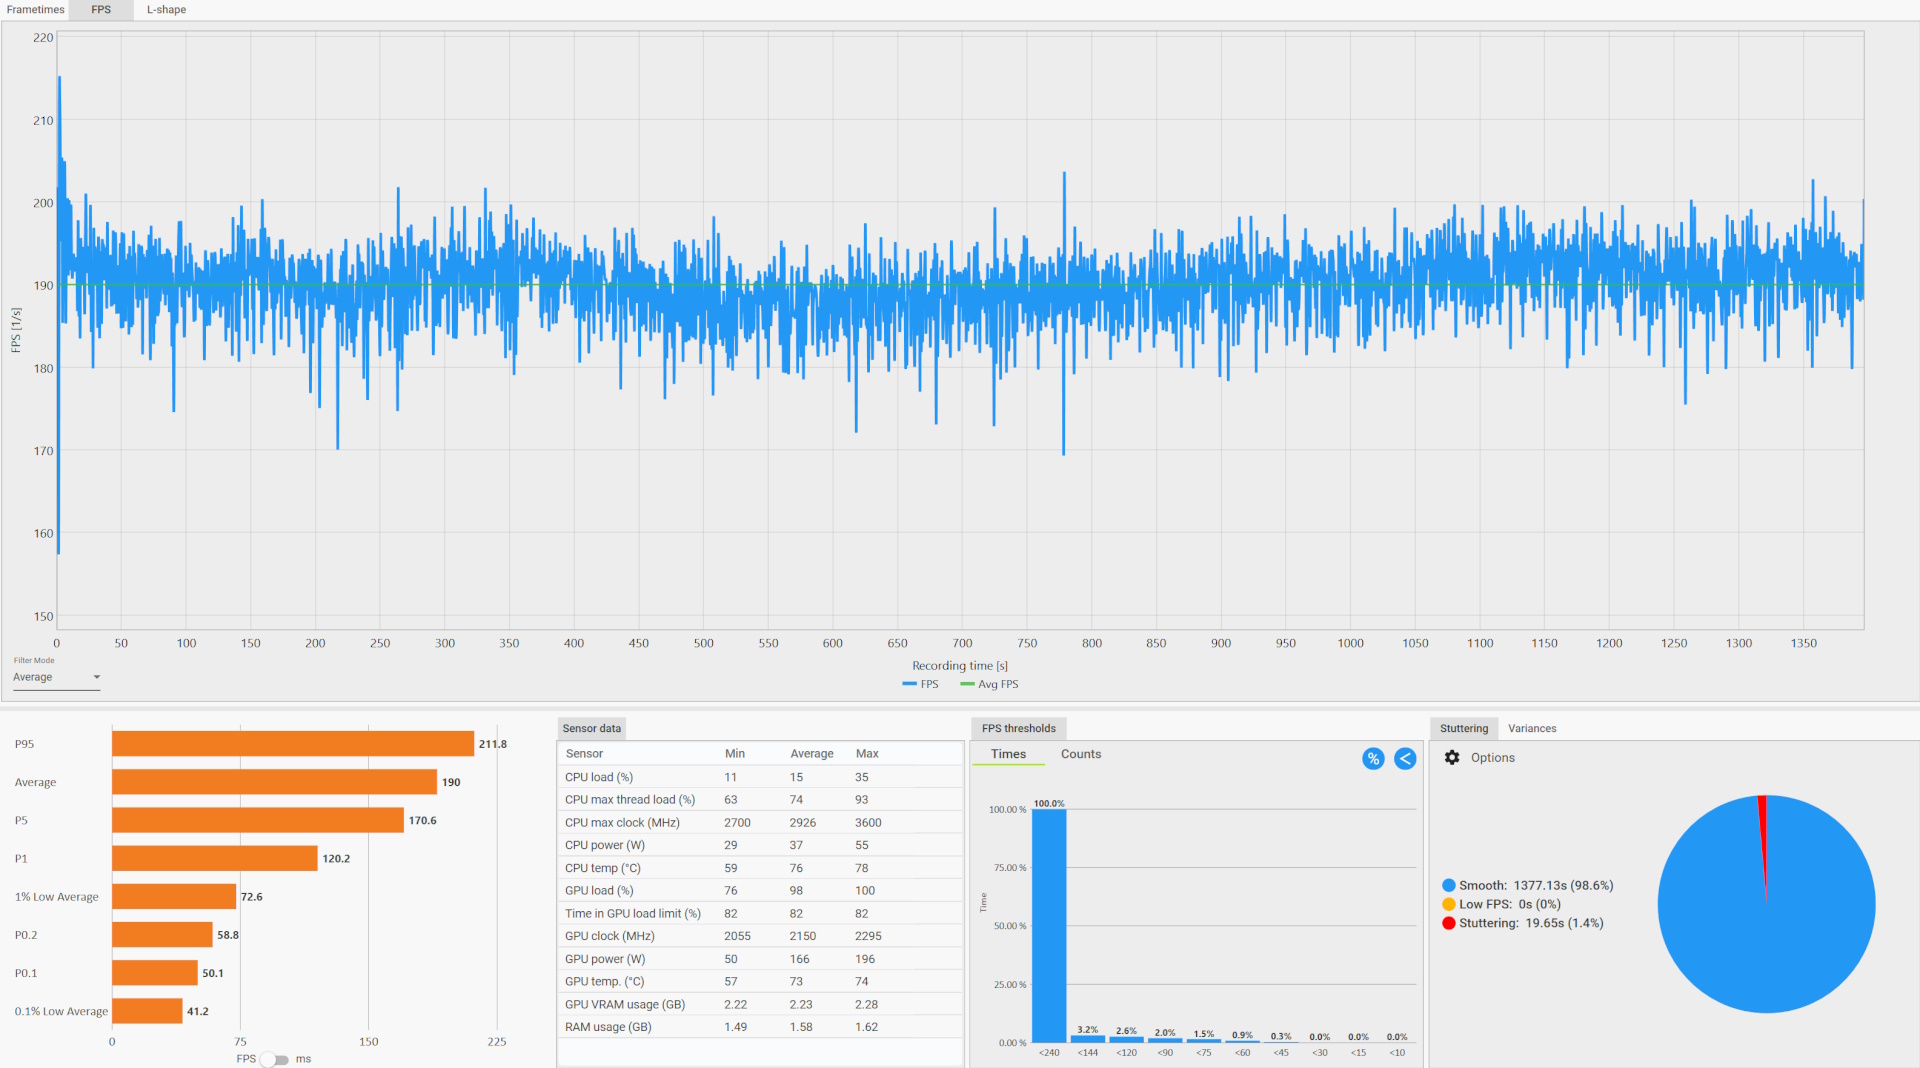
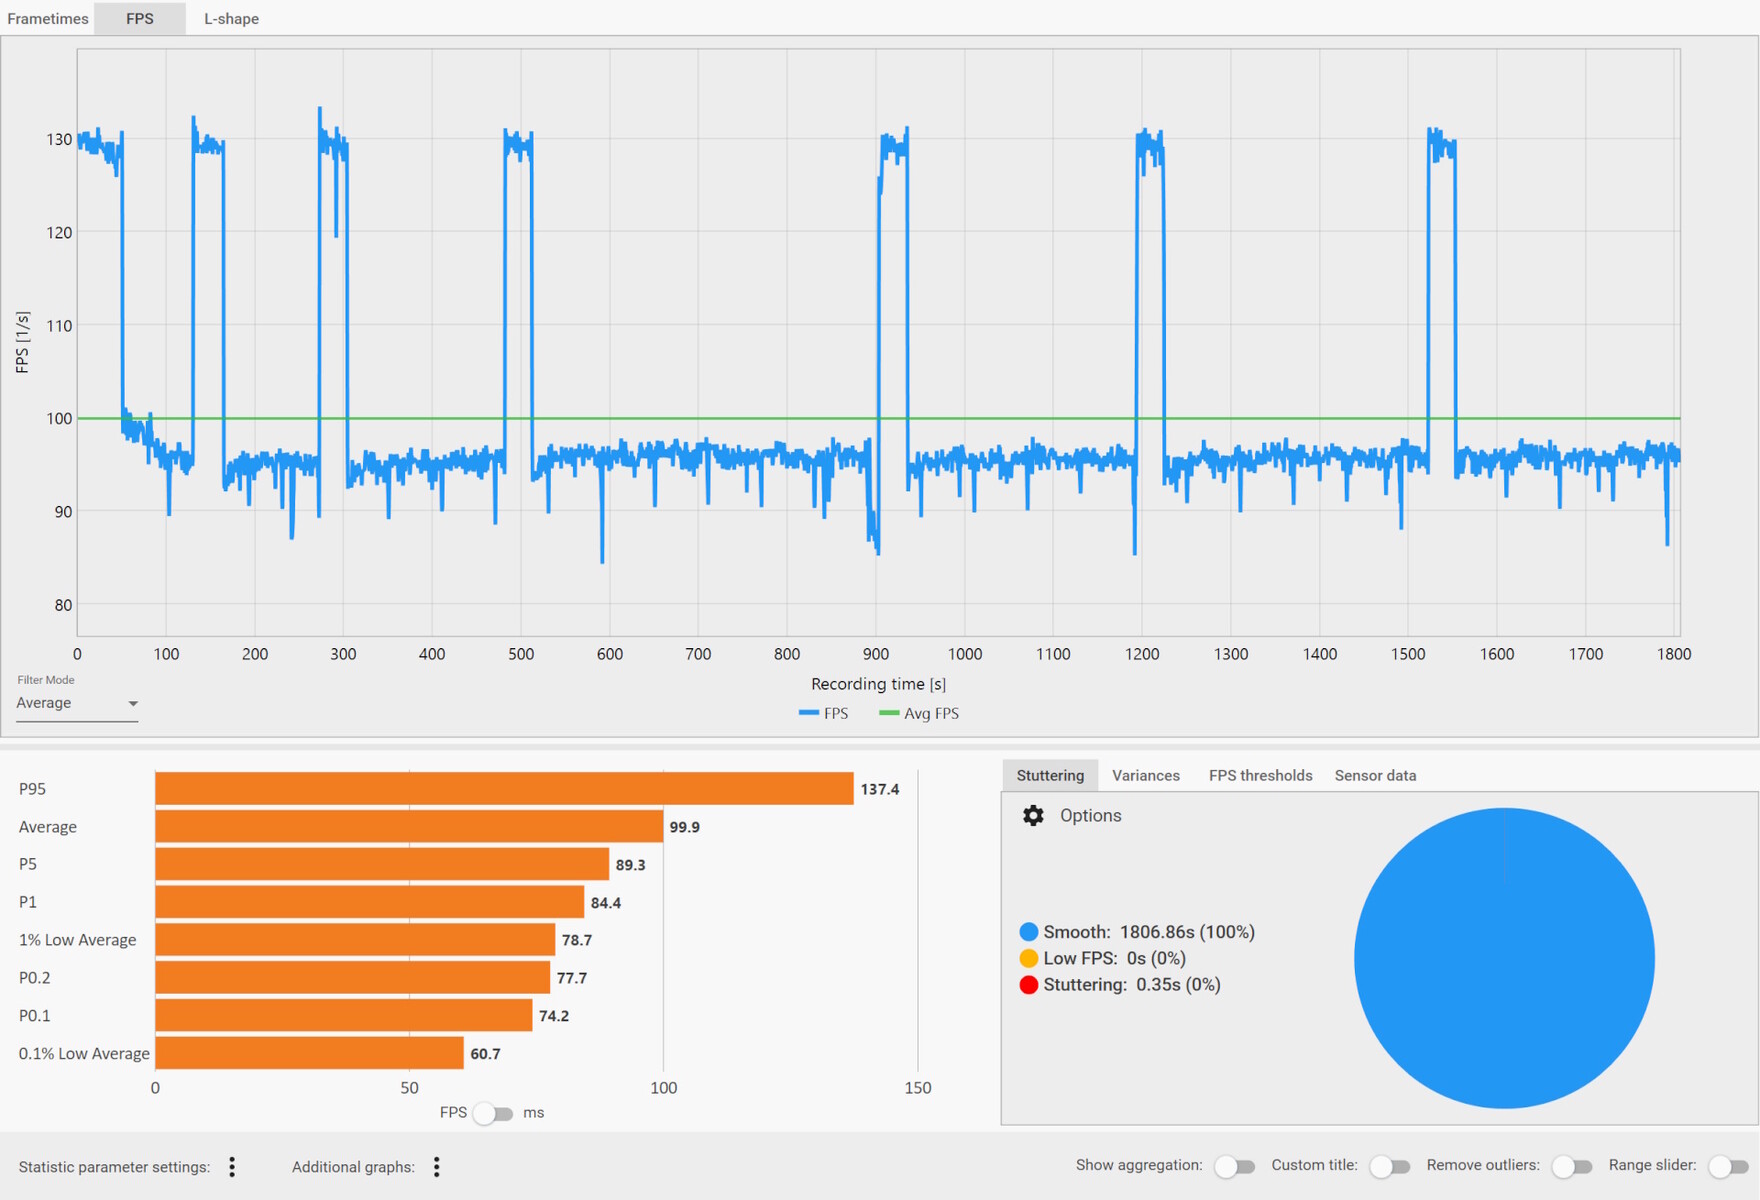
Update 26.09.2024: Wegen der hier aufgezeigten Probleme (Absacken der Framerate, niedriger Single-Core-Score) haben wir den Hersteller (bzw. dessen Agentur) befragt. Mittlerweile hat Lenovo reagiert. Ein neues BIOS-Update beseitigt das fehlerhafte Verhalten, siehe Framegraphen unten. Das Update kann hier über Lenovo heruntergeladen werden.
Mögliche Konkurrenten im Vergleich
Bew. | Version | Datum | Modell | Gewicht | Dicke | Größe | Auflösung | Preis ab |
|---|---|---|---|---|---|---|---|---|
| 83.9 % | v8 | 06 / 2024 | Lenovo Legion 9 16IRX9, RTX 4090 i9-14900HX, GeForce RTX 4090 Laptop GPU | 2.5 kg | 22.7 mm | 16.00" | 3200x2000 | |
| 90.2 % v7 (old) | v7 (old) | 10 / 2023 | Lenovo Legion 9 16IRX8 i9-13980HX, GeForce RTX 4090 Laptop GPU | 2.6 kg | 22.7 mm | 16.00" | 3200x2000 | |
| 91.1 % v7 (old) | v7 (old) | 02 / 2024 | Razer Blade 16 2024, RTX 4090 i9-14900HX, GeForce RTX 4090 Laptop GPU | 2.5 kg | 22 mm | 16.00" | 2560x1600 | |
| 89.5 % v7 (old) | v7 (old) | 03 / 2024 | Alienware m18 R2 i9-14900HX, GeForce RTX 4090 Laptop GPU | 4 kg | 26.7 mm | 18.00" | 2560x1600 | |
| 88.3 % v7 (old) | v7 (old) | 02 / 2024 | Asus ROG Strix Scar 18 G834JYR (2024) i9-14900HX, GeForce RTX 4090 Laptop GPU | 3.1 kg | 30.8 mm | 18.00" | 2560x1600 | |
| 89.2 % v7 (old) | v7 (old) | 02 / 2024 | Medion Erazer Beast X40 2024 i9-14900HX, GeForce RTX 4090 Laptop GPU | 2.9 kg | 36 mm | 17.00" | 2560x1600 |
Hinweis: Wir haben unser Rating-System kürzlich aktualisiert und die Ergebnisse von Version 8 sind nicht mit den Ergebnissen von Version 7 vergleichbar. Weitere Informationen dazu sind hier verfügbar.
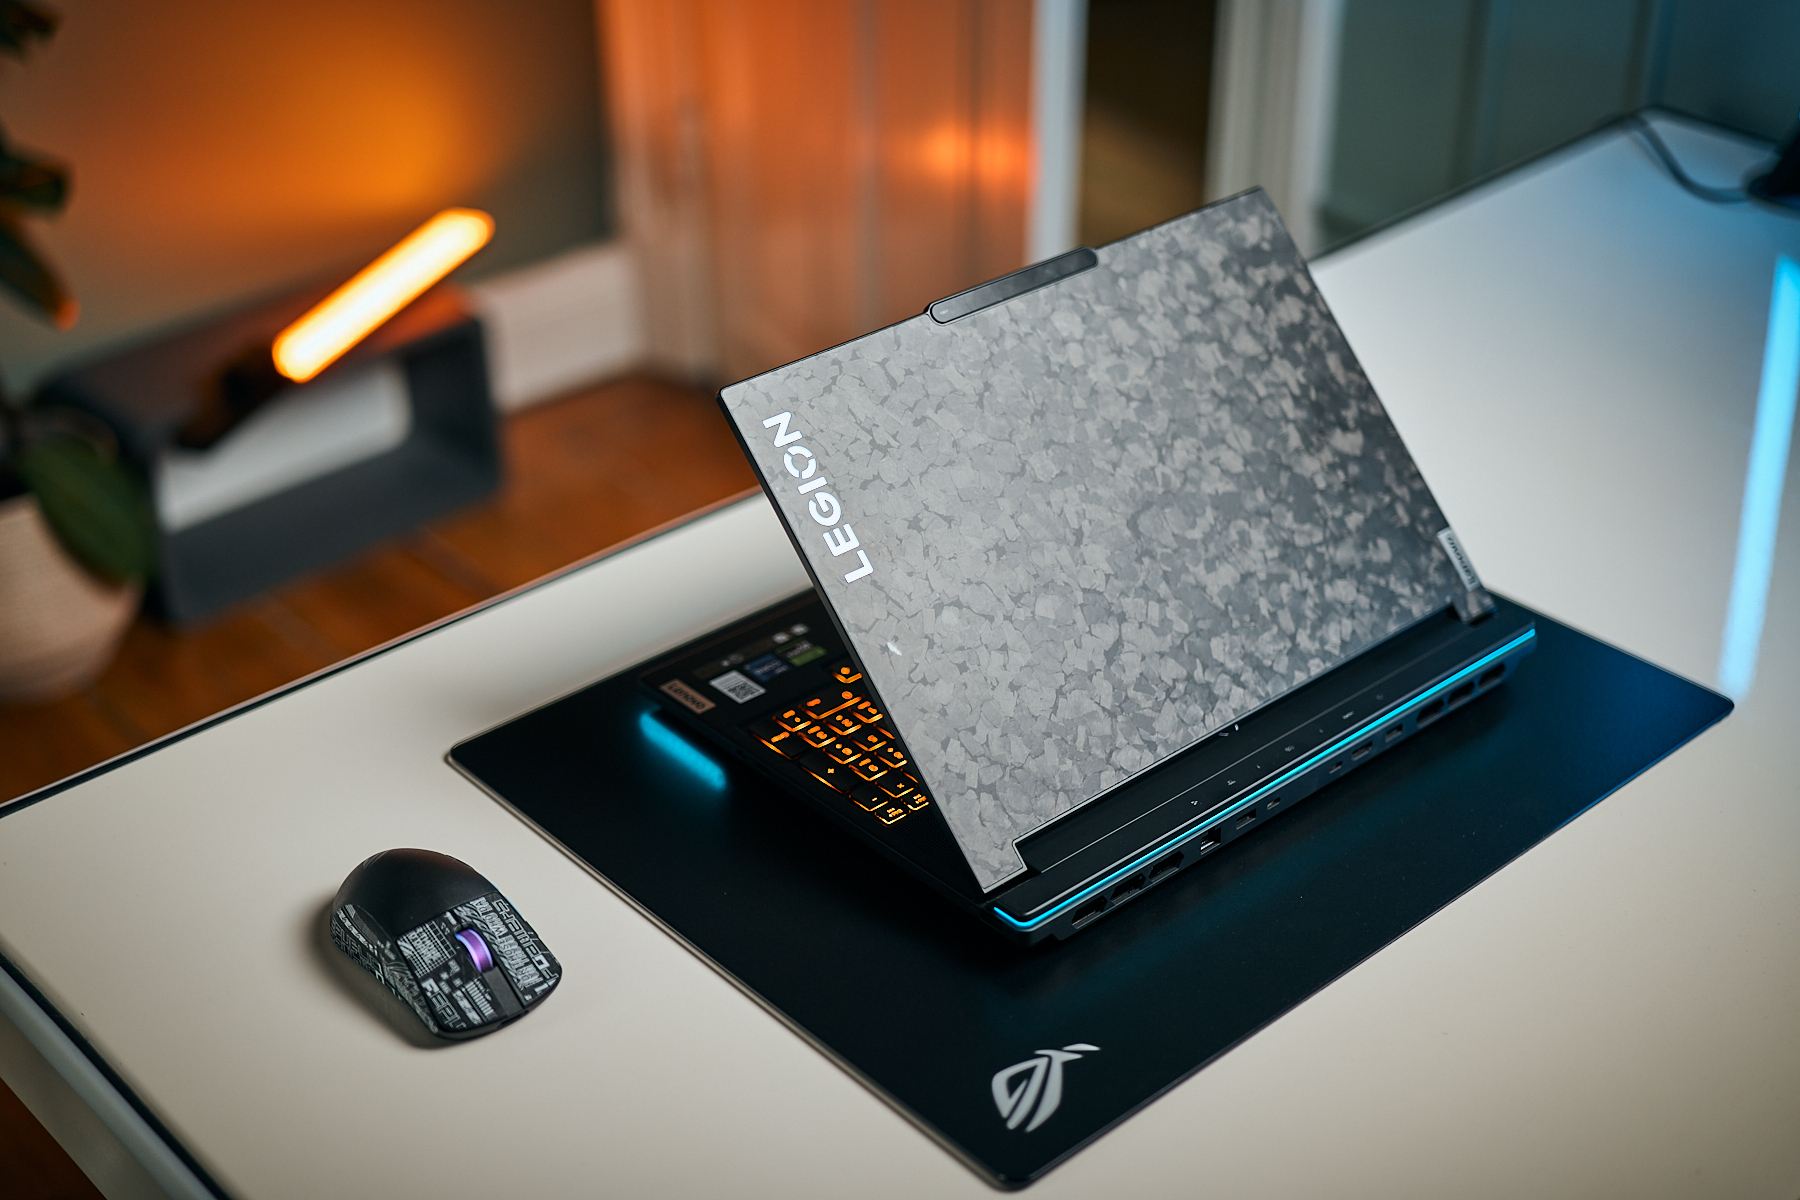
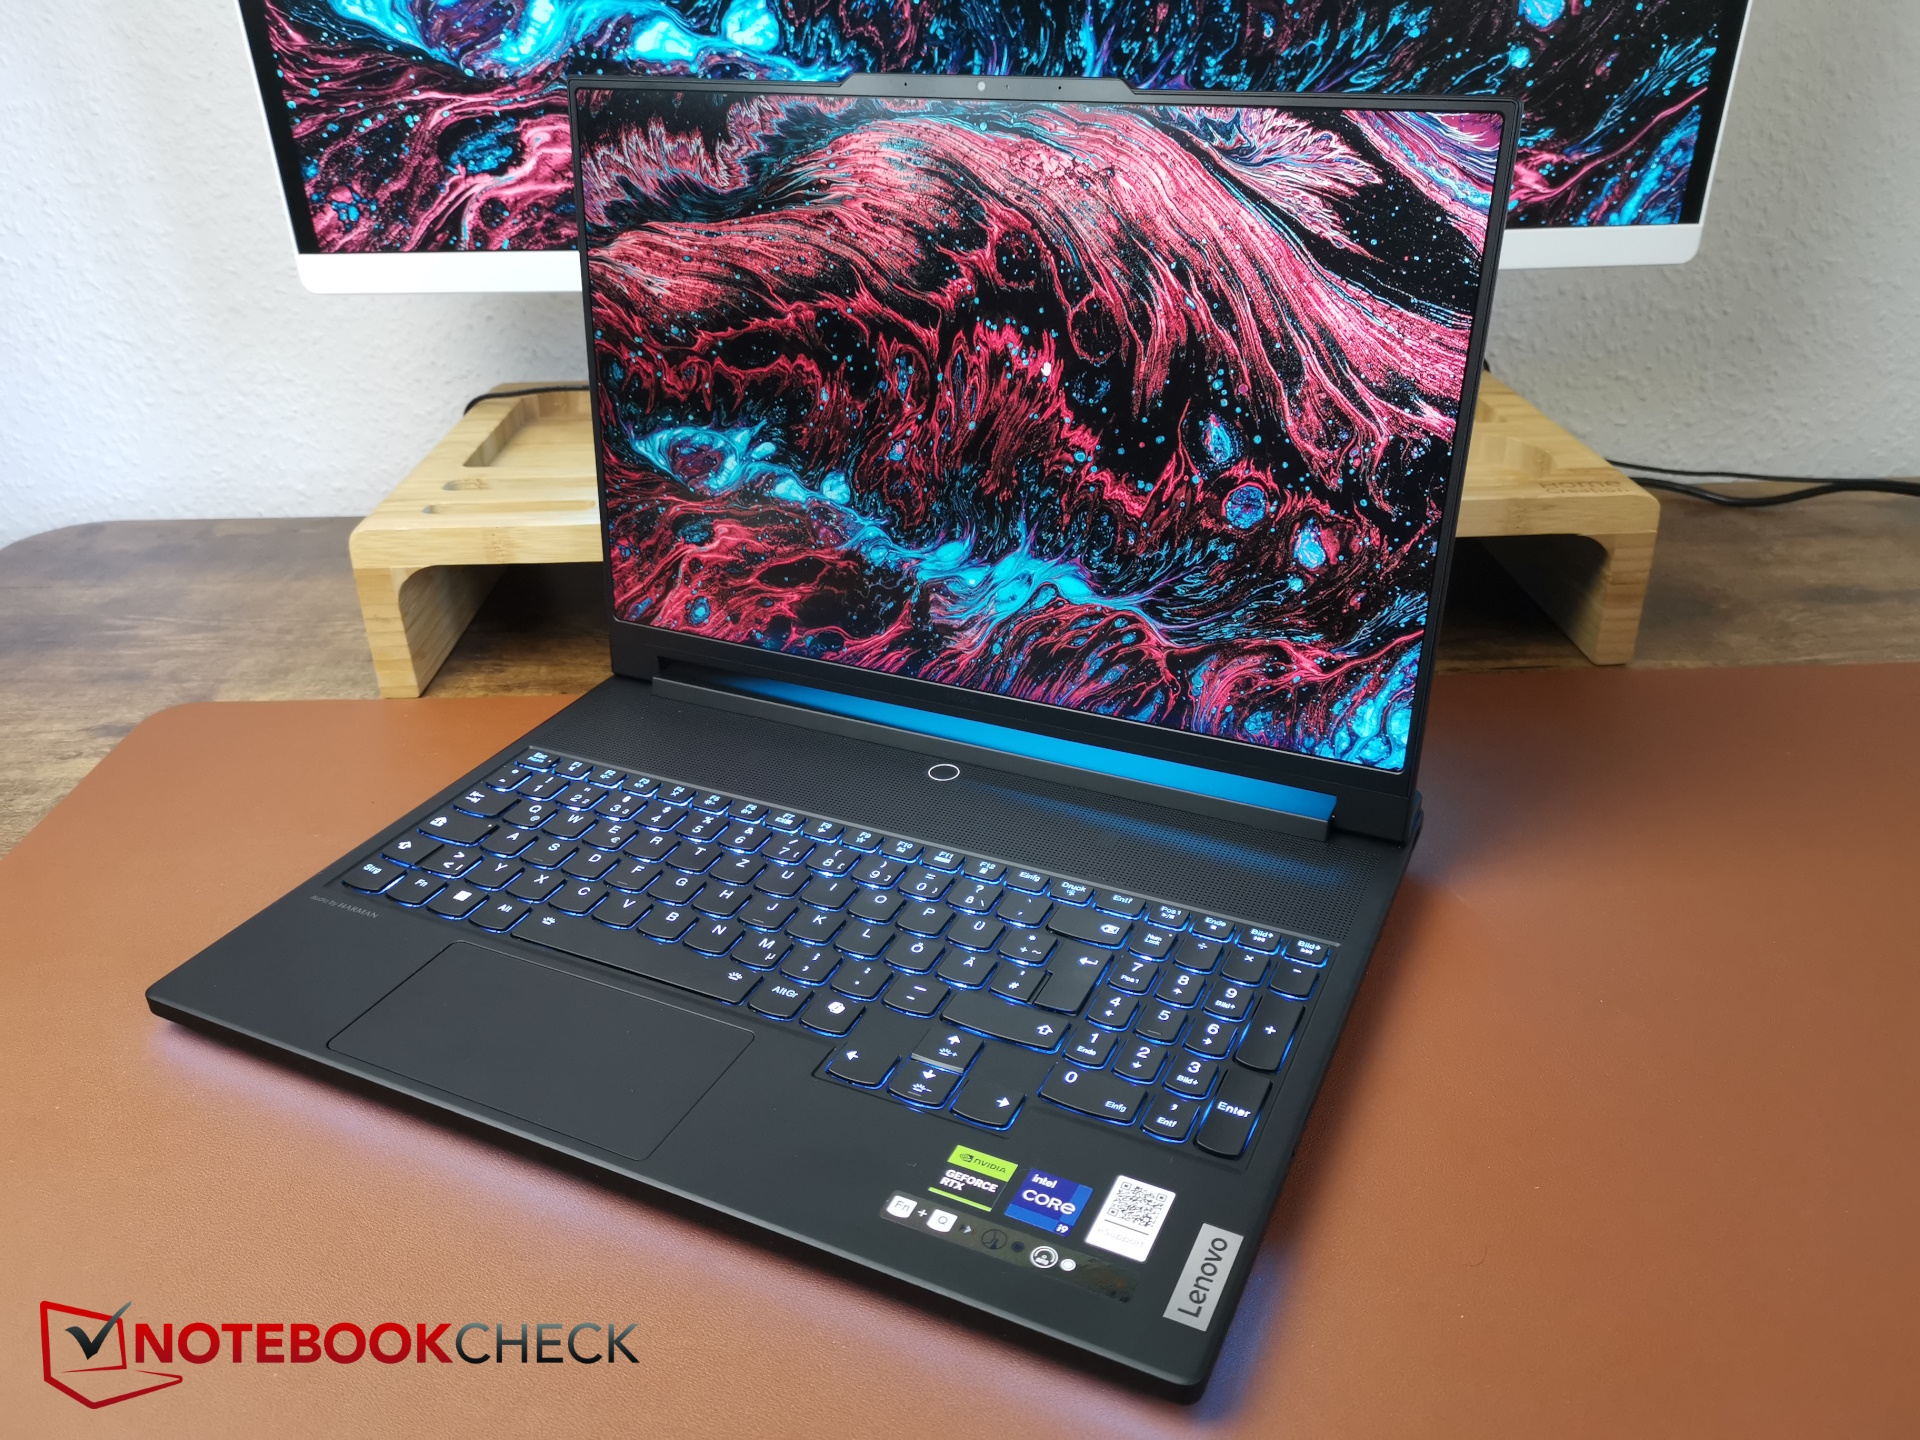
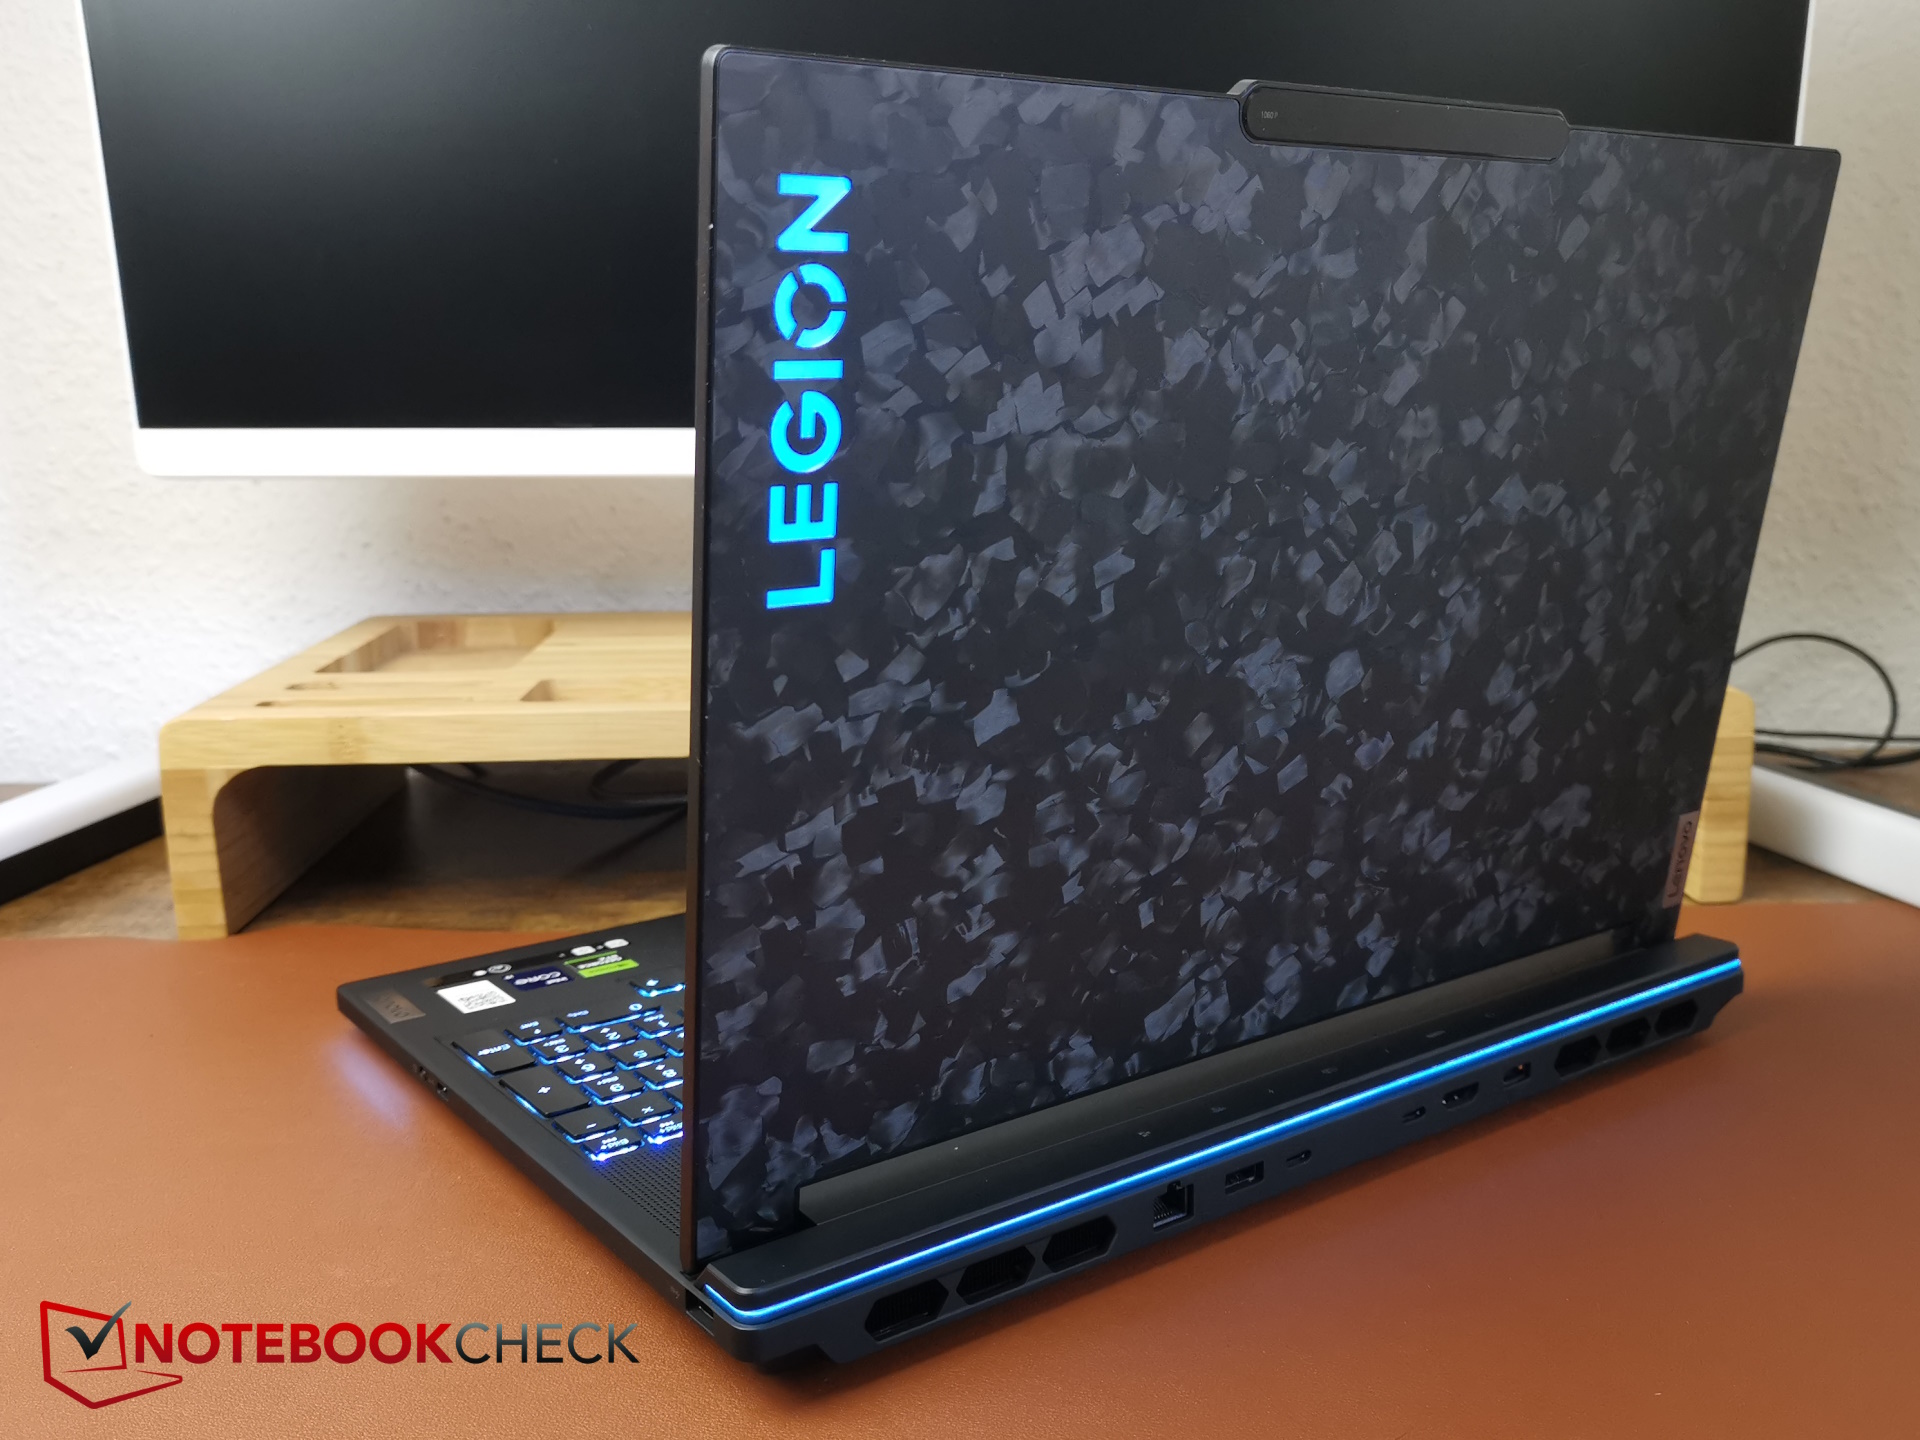
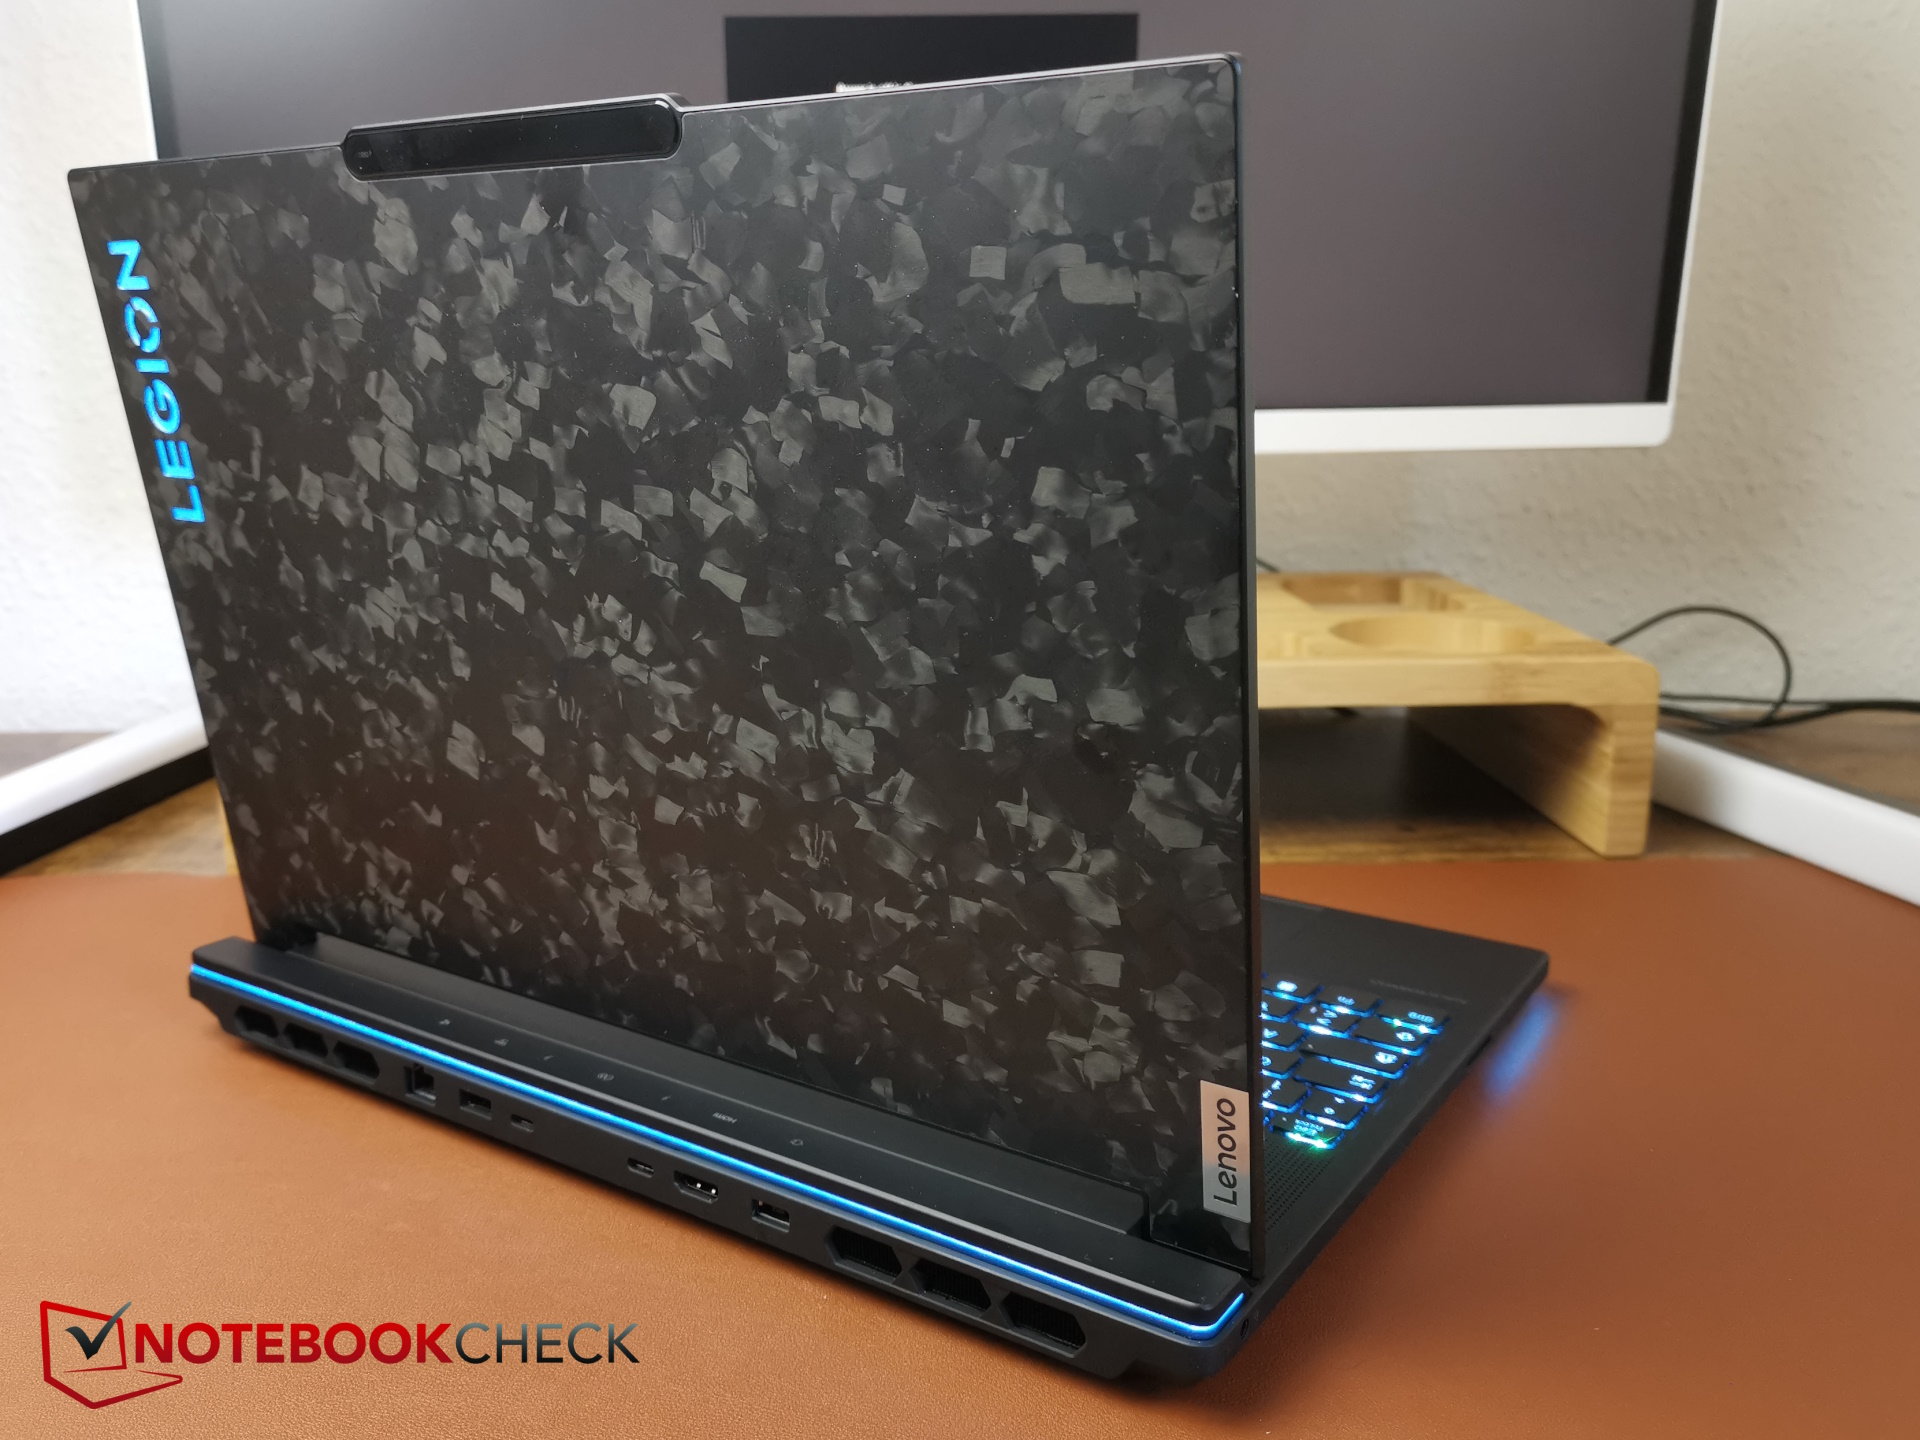
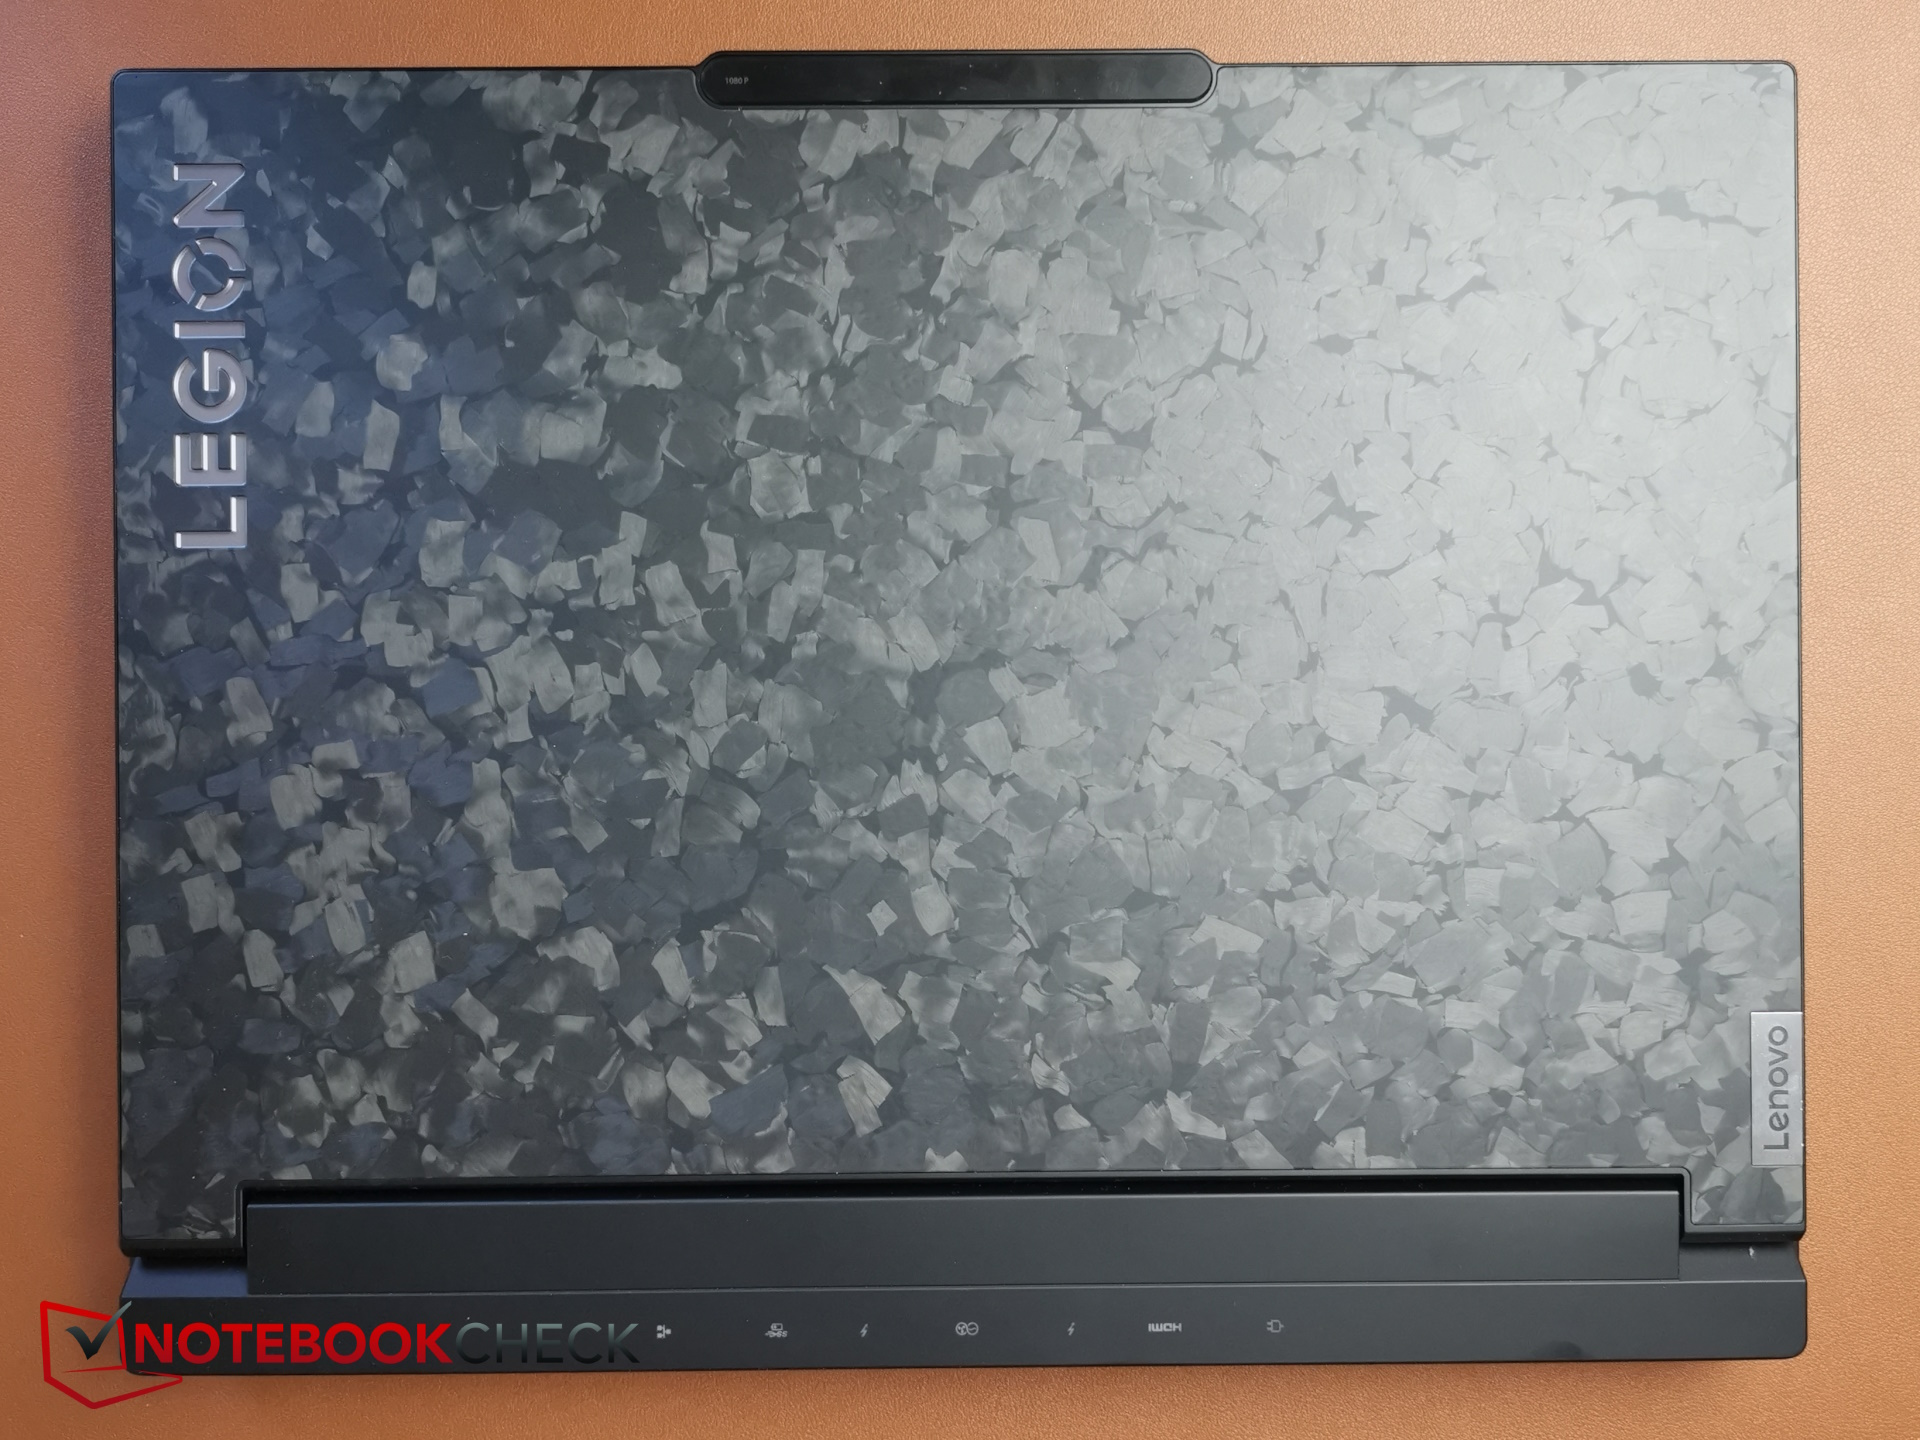
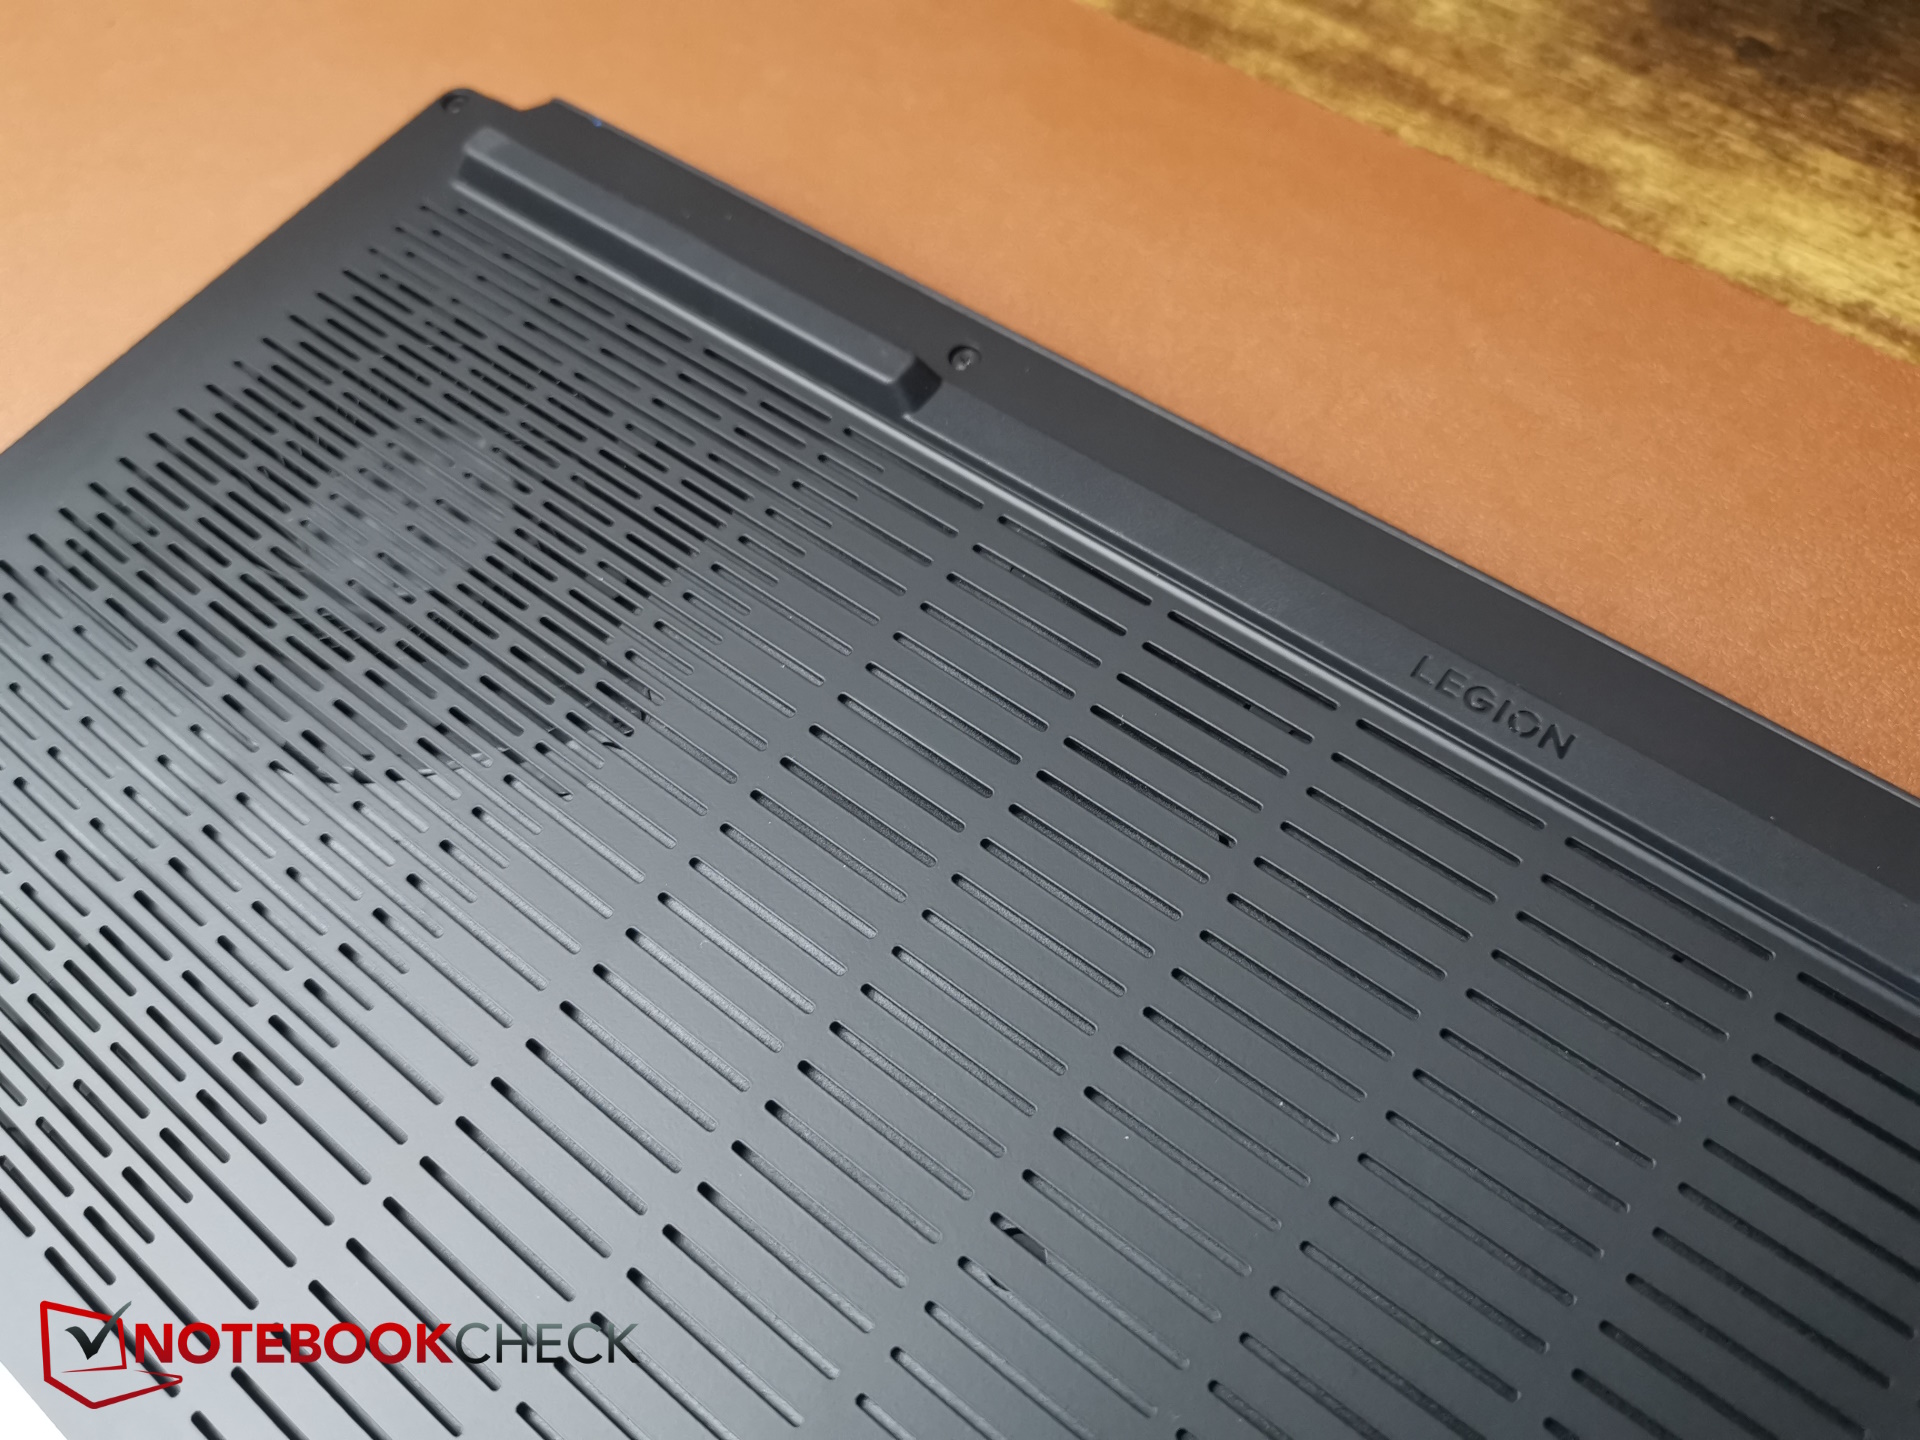
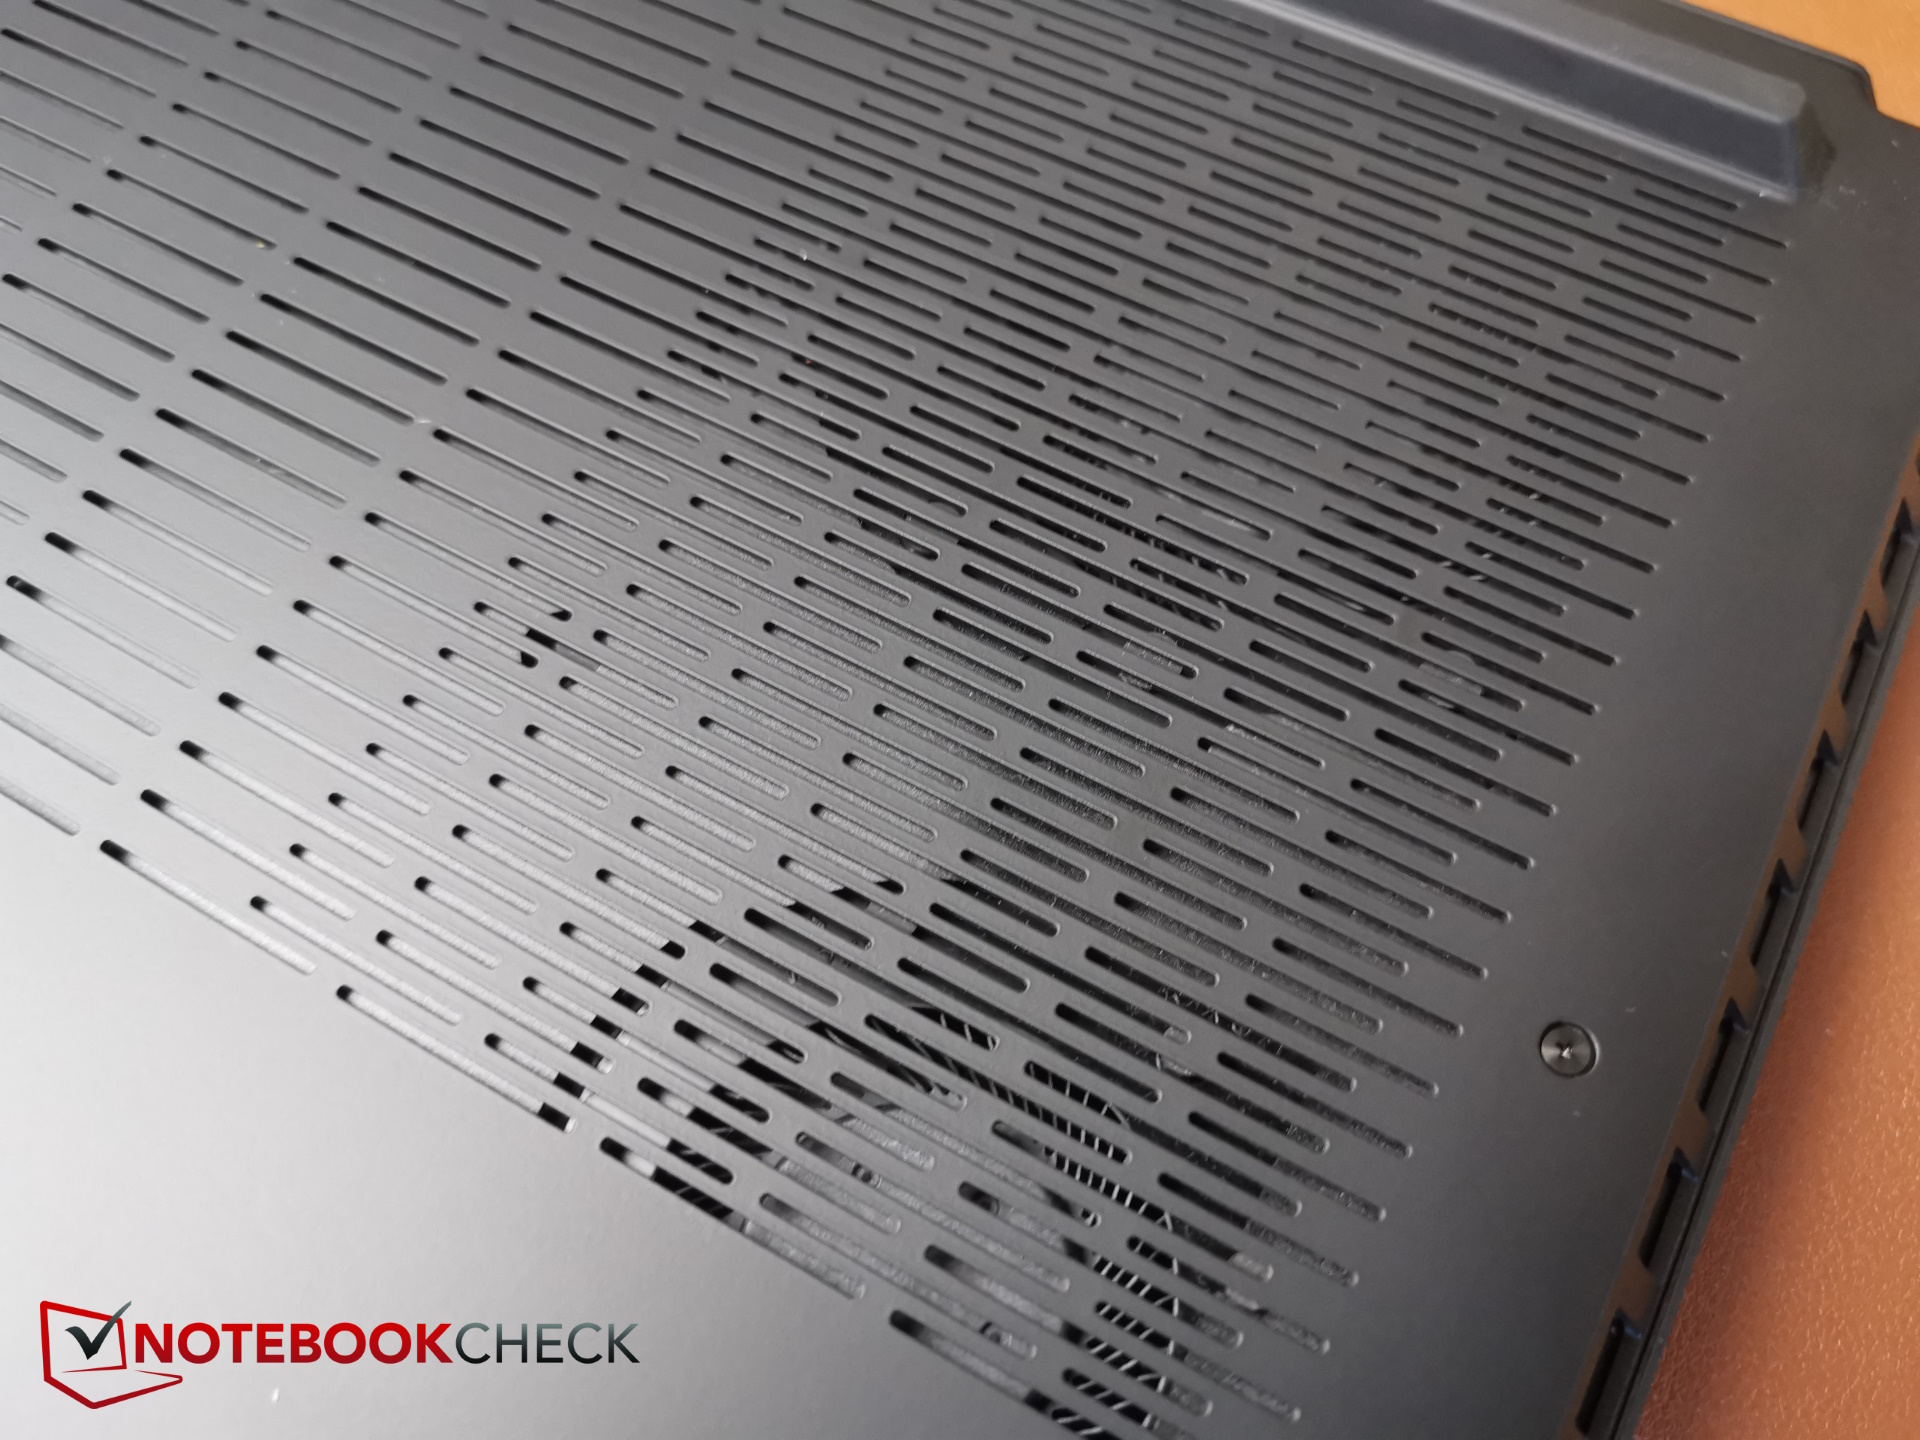
Gehäuse & Ausstattung - Geschmiedeter Kohlenstoff
Weil zumindest optisch alles beim Alten bleibt, empfehlen wir unseren Test des Lenovo Legion 9i Gen8 für Informationen zum Kohlenstoff-geschmiedeten Gehäuse, der Wartung und der Eingabegeräte.

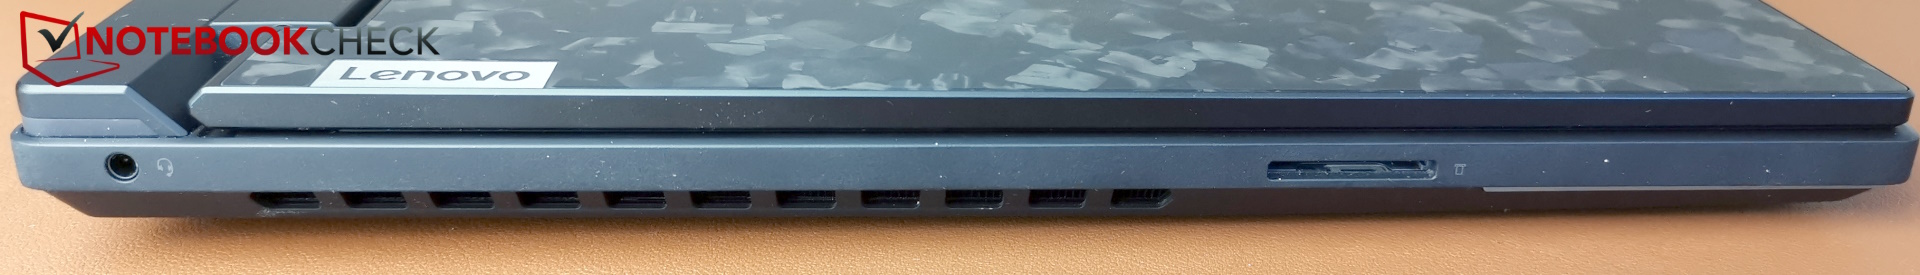

SD Card
Für einen High-End-Laptop sind die Übertragungswerte des SD Readers enttäuschend. Sie fallen nochmals etwas schlechter aus als im letzten Jahr und sind meilenweit von den Transferraten eines Razer Blade 16 oder auch Alienware m18 R2 entfernt.
| SD Card Reader | |
| average JPG Copy Test (av. of 3 runs) | |
| Alienware m18 R2 (Toshiba Exceria Pro SDXC 64 GB UHS-II) | |
| Razer Blade 16 2024, RTX 4090 | |
| Durchschnitt der Klasse Gaming (20 - 210, n=63, der letzten 2 Jahre) | |
| Lenovo Legion 9 16IRX8 (Toshiba Exceria Pro SDXC 64 GB UHS-II) | |
| Medion Erazer Beast X40 2024 (AV PRO microSD 128 GB V60) | |
| Lenovo Legion 9 16IRX9, RTX 4090 | |
| maximum AS SSD Seq Read Test (1GB) | |
| Alienware m18 R2 (Toshiba Exceria Pro SDXC 64 GB UHS-II) | |
| Razer Blade 16 2024, RTX 4090 | |
| Durchschnitt der Klasse Gaming (25.5 - 261, n=60, der letzten 2 Jahre) | |
| Medion Erazer Beast X40 2024 (AV PRO microSD 128 GB V60) | |
| Lenovo Legion 9 16IRX9, RTX 4090 | |
| Lenovo Legion 9 16IRX8 (Toshiba Exceria Pro SDXC 64 GB UHS-II) | |
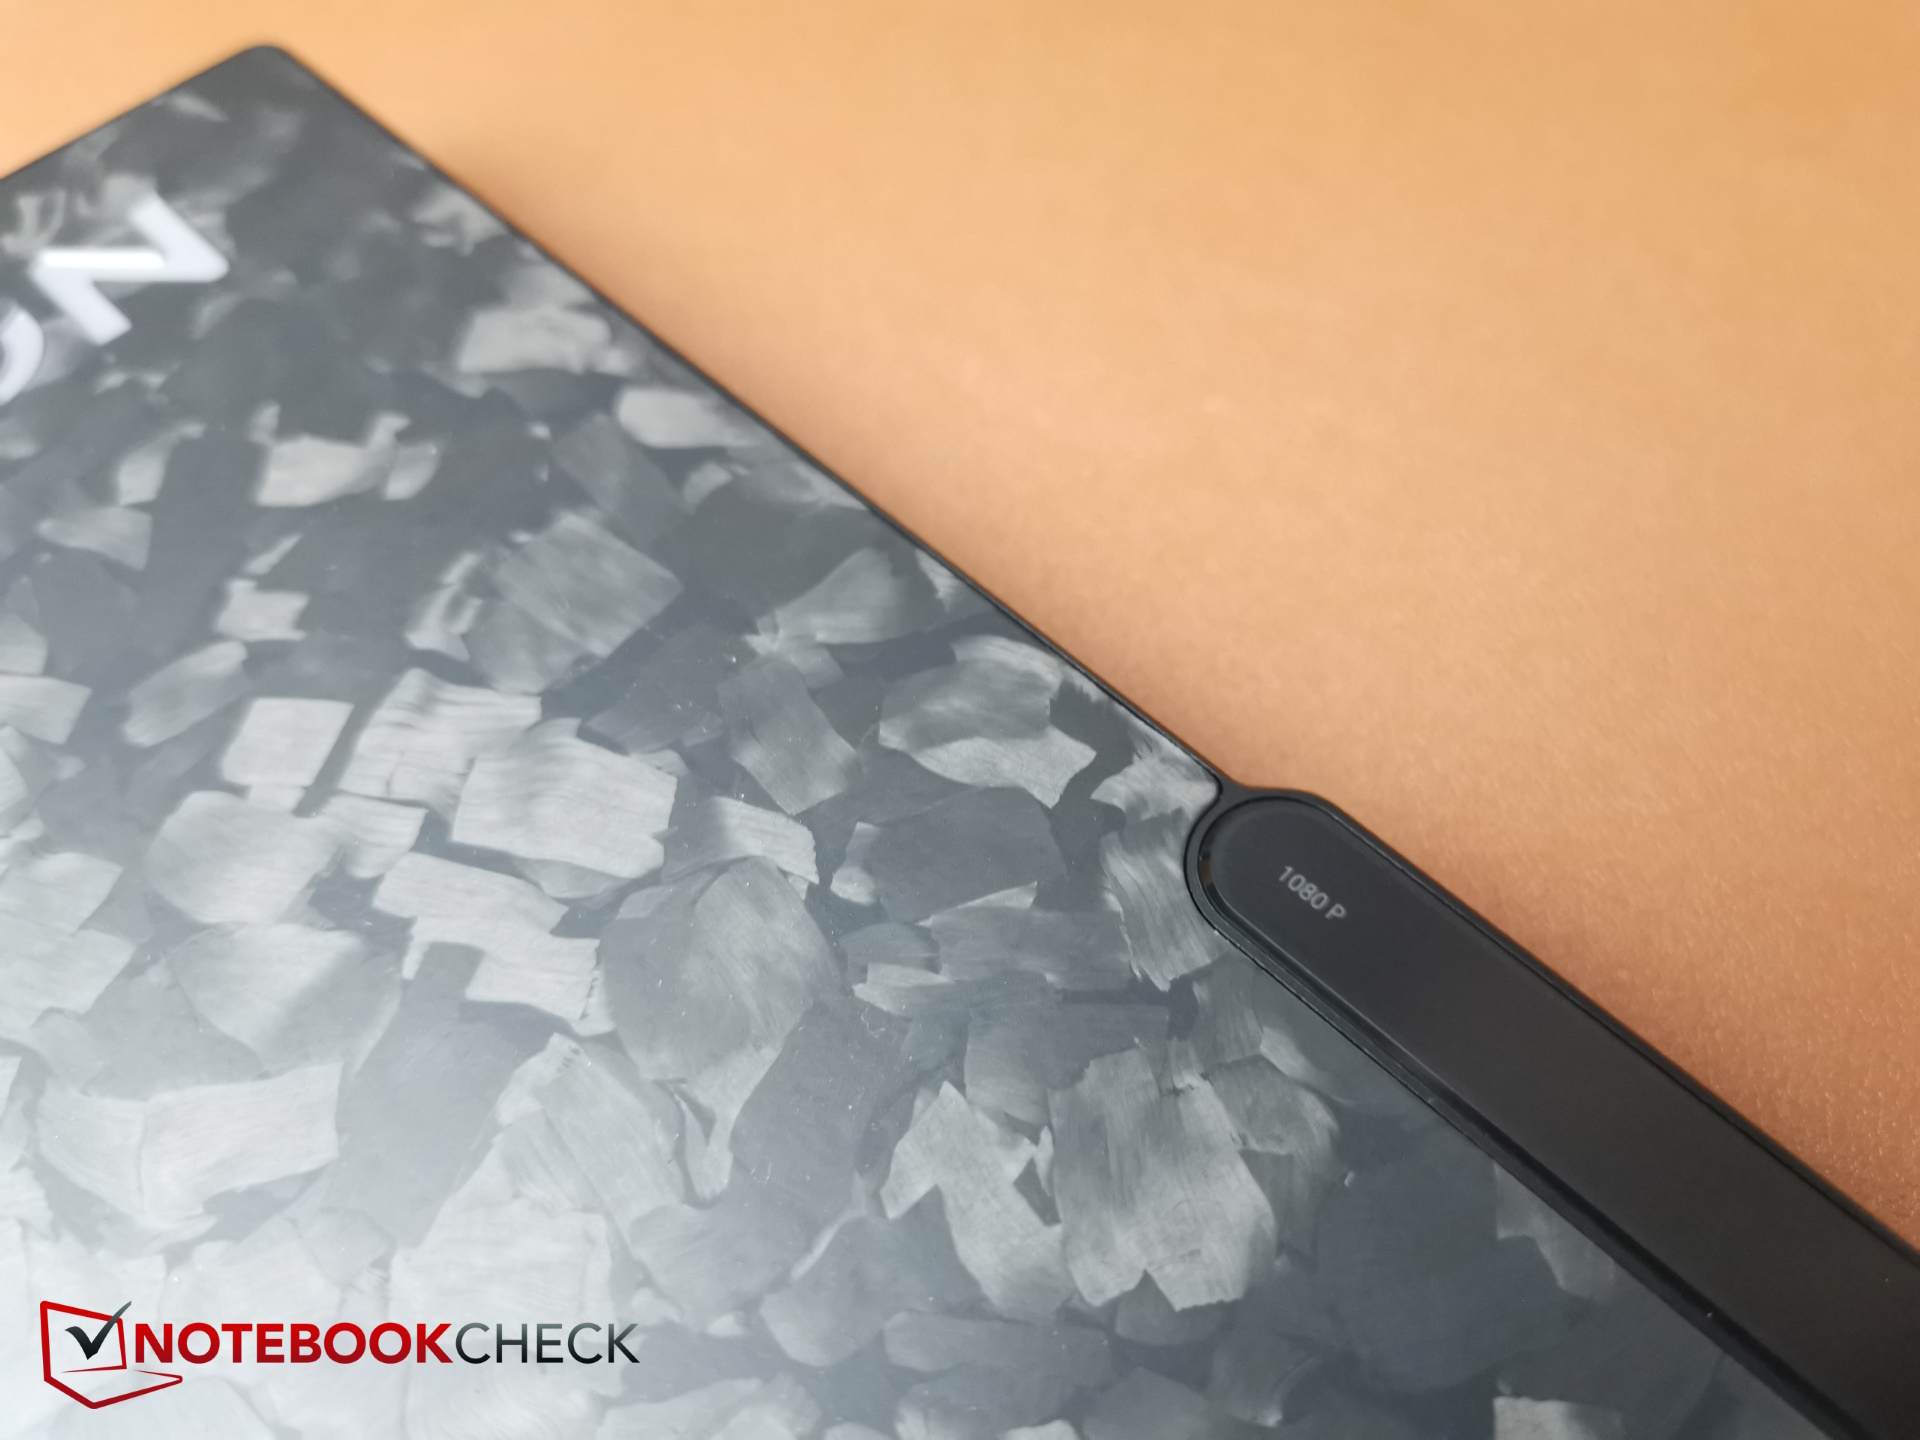
Webcam
Die 1.080p-Full-HD-Webcam hat mittlere bis hohe Farbabweichungen, die Bildschärfe geht in Ordnung.


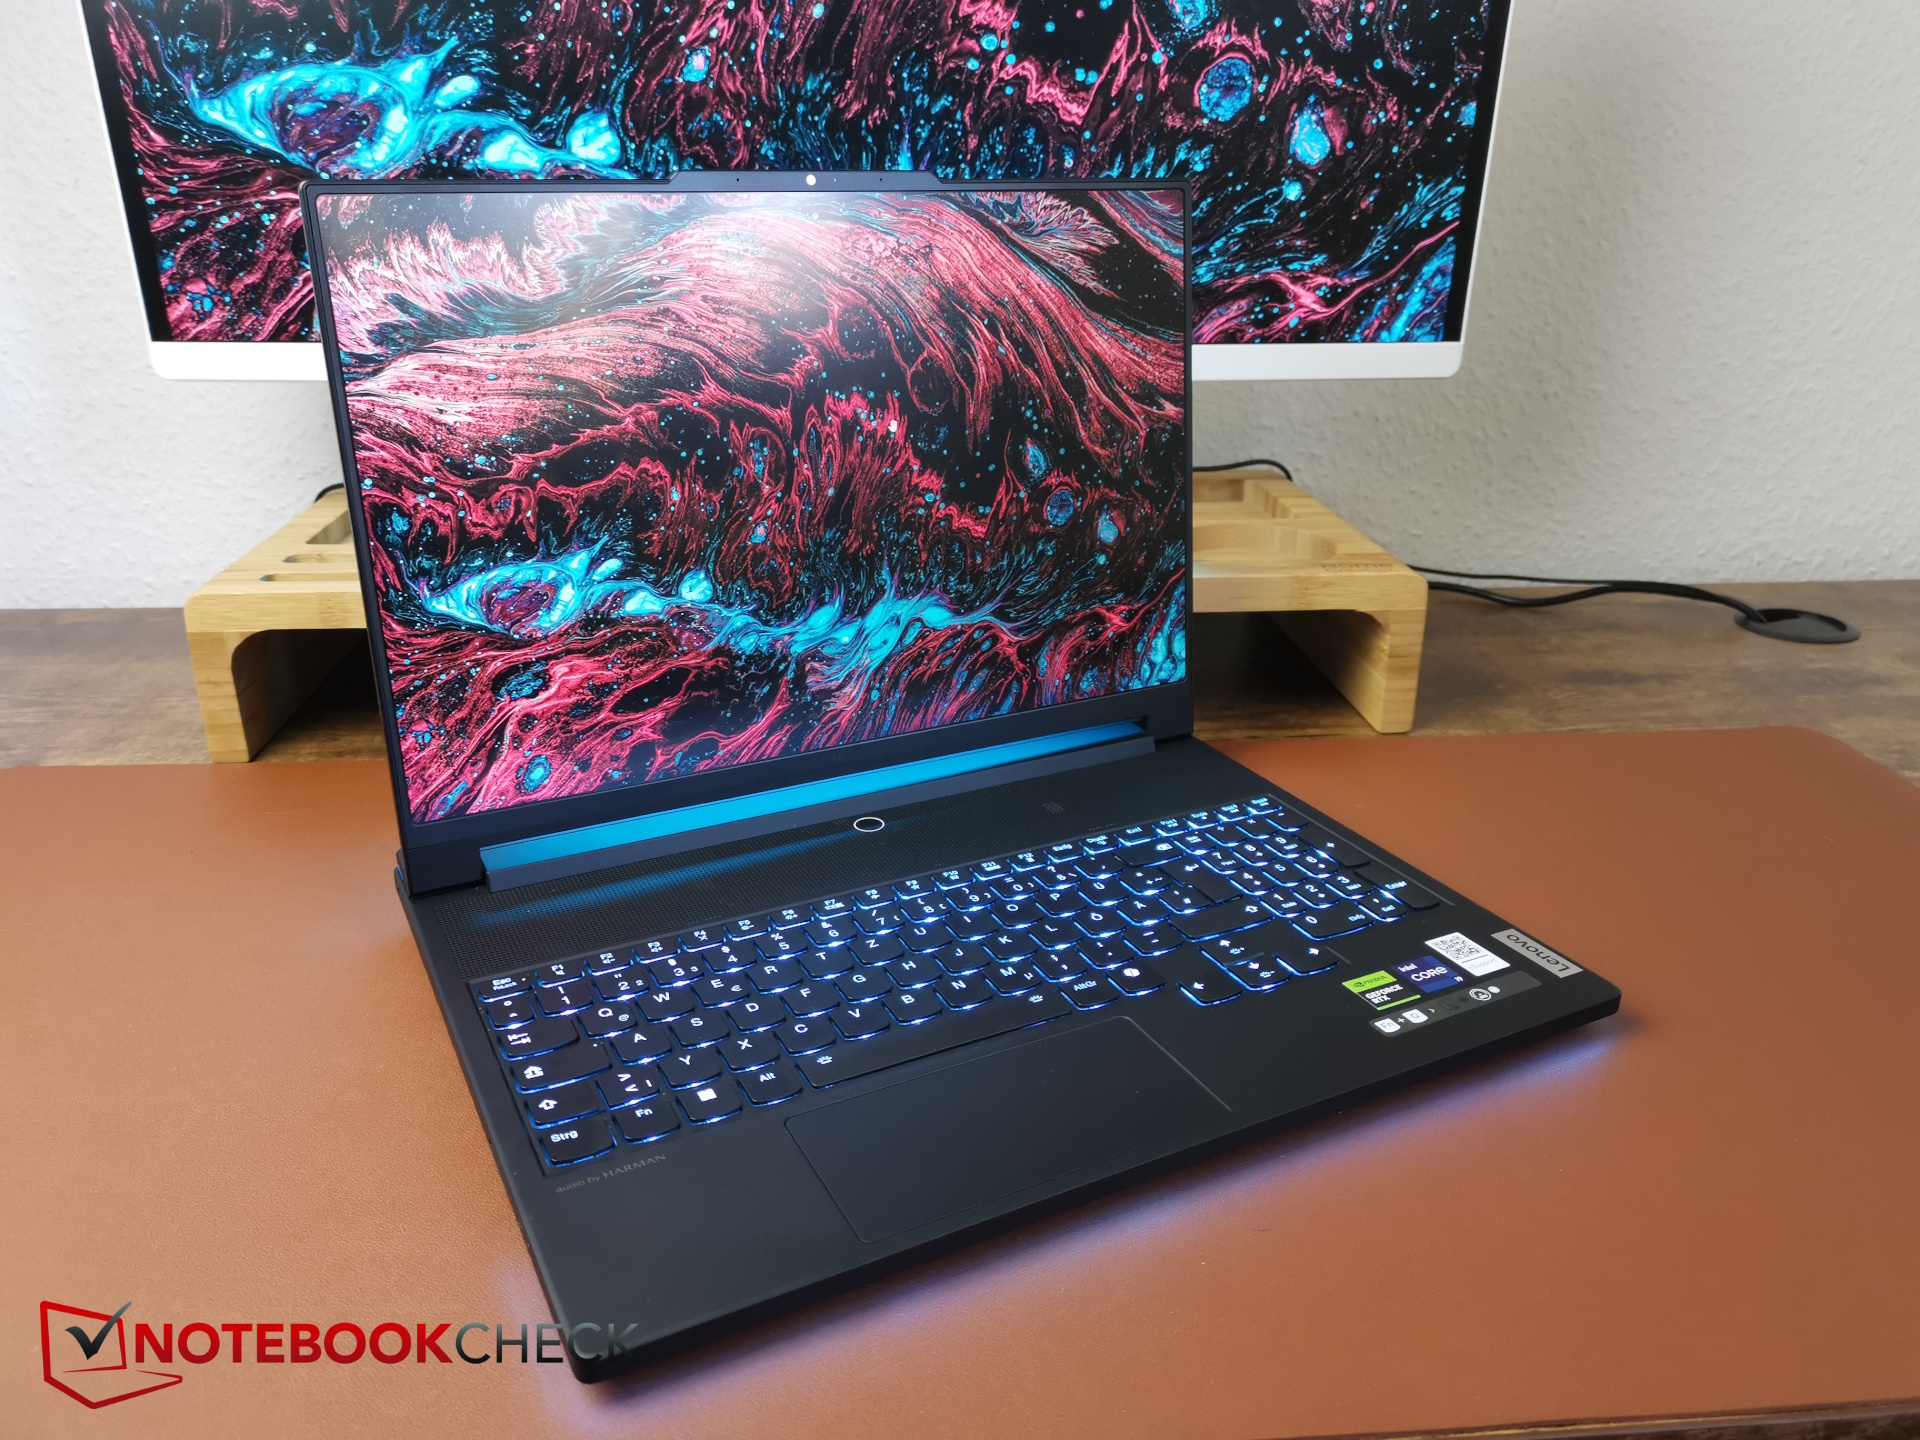
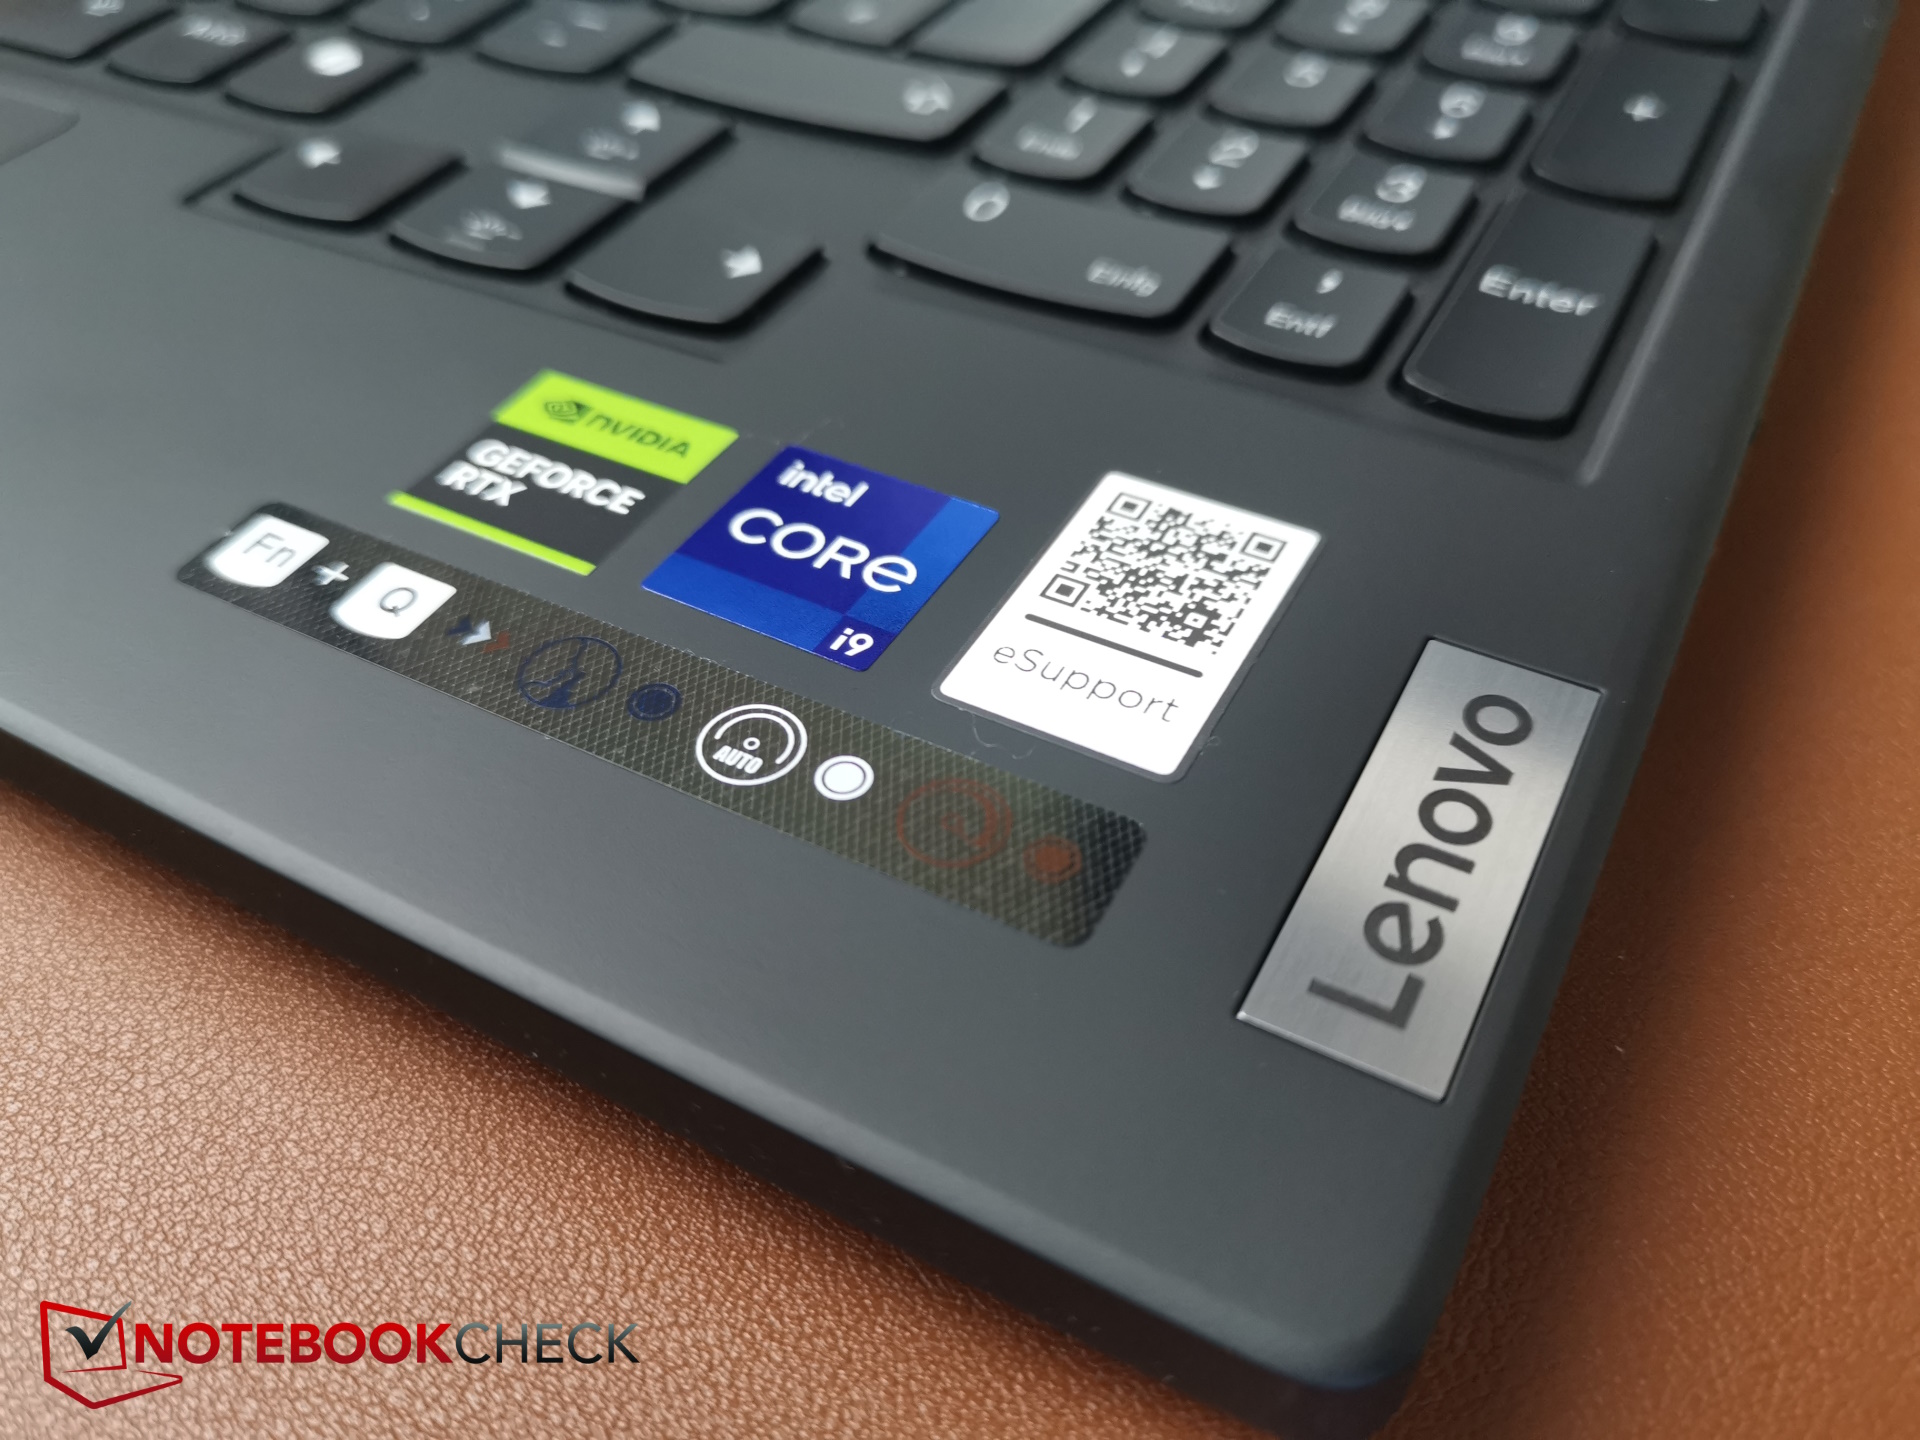
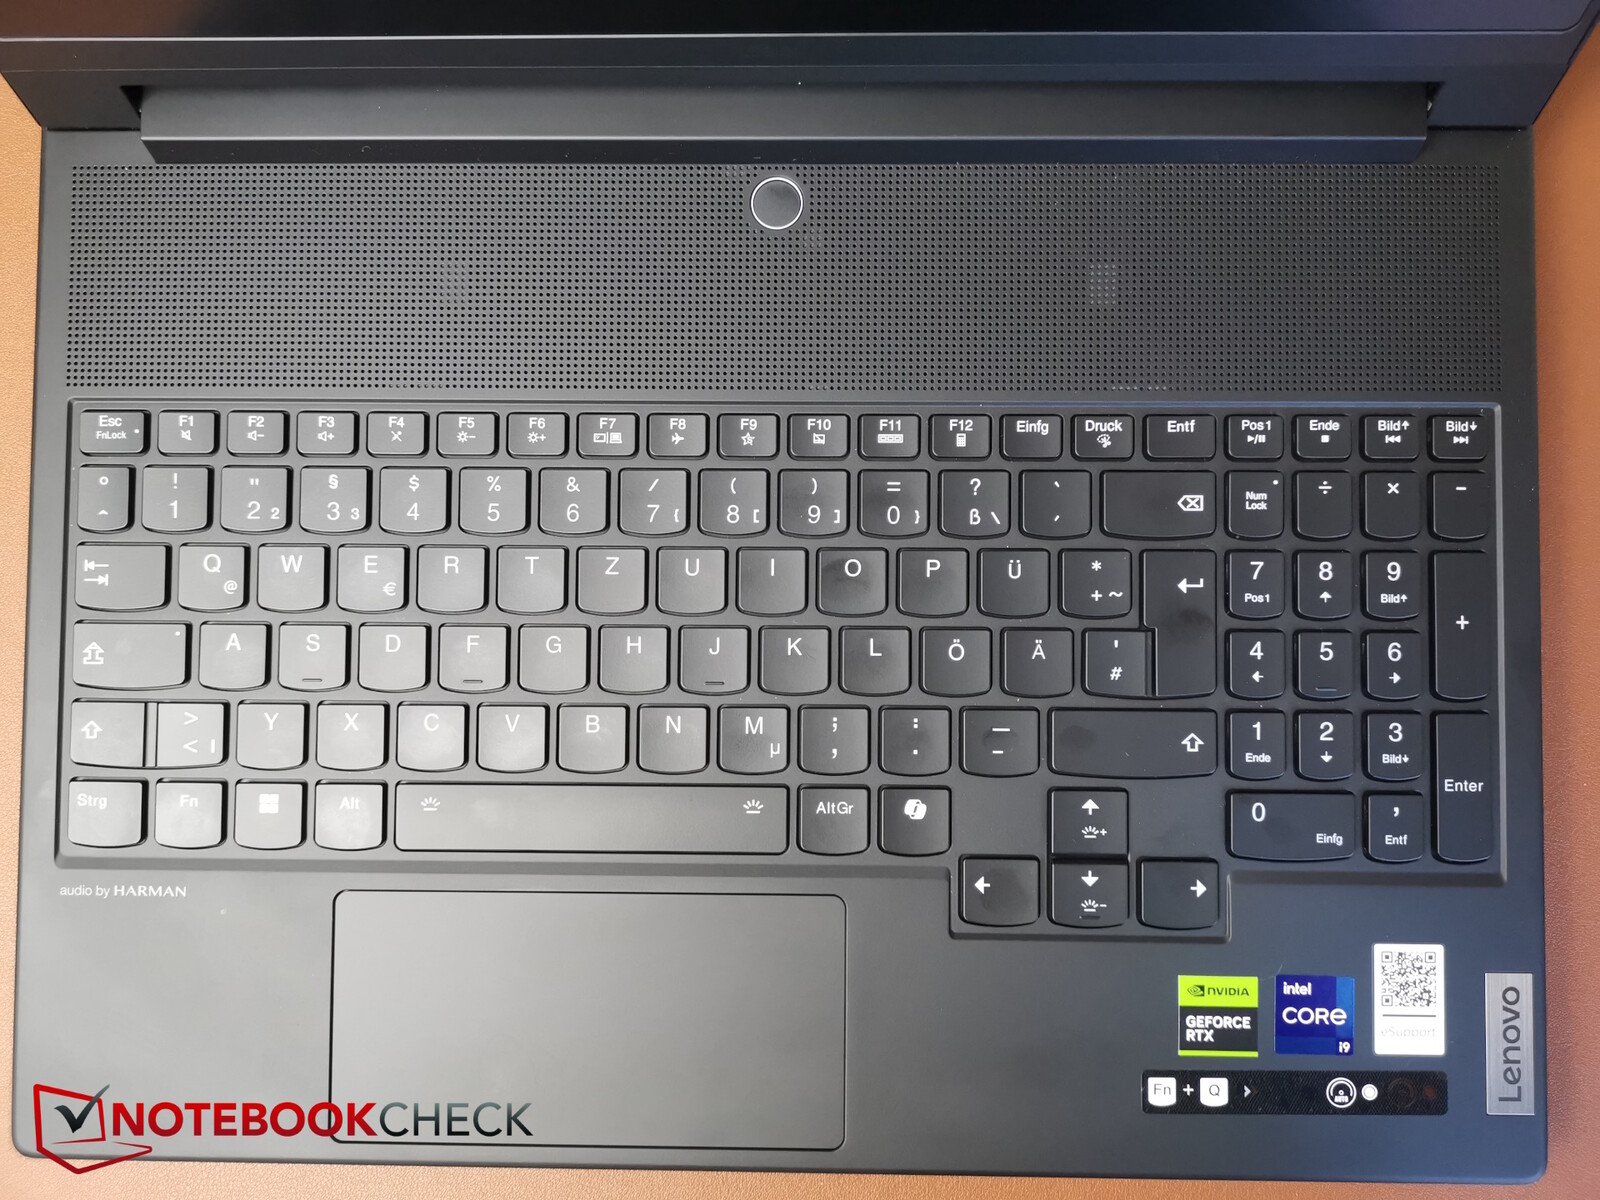
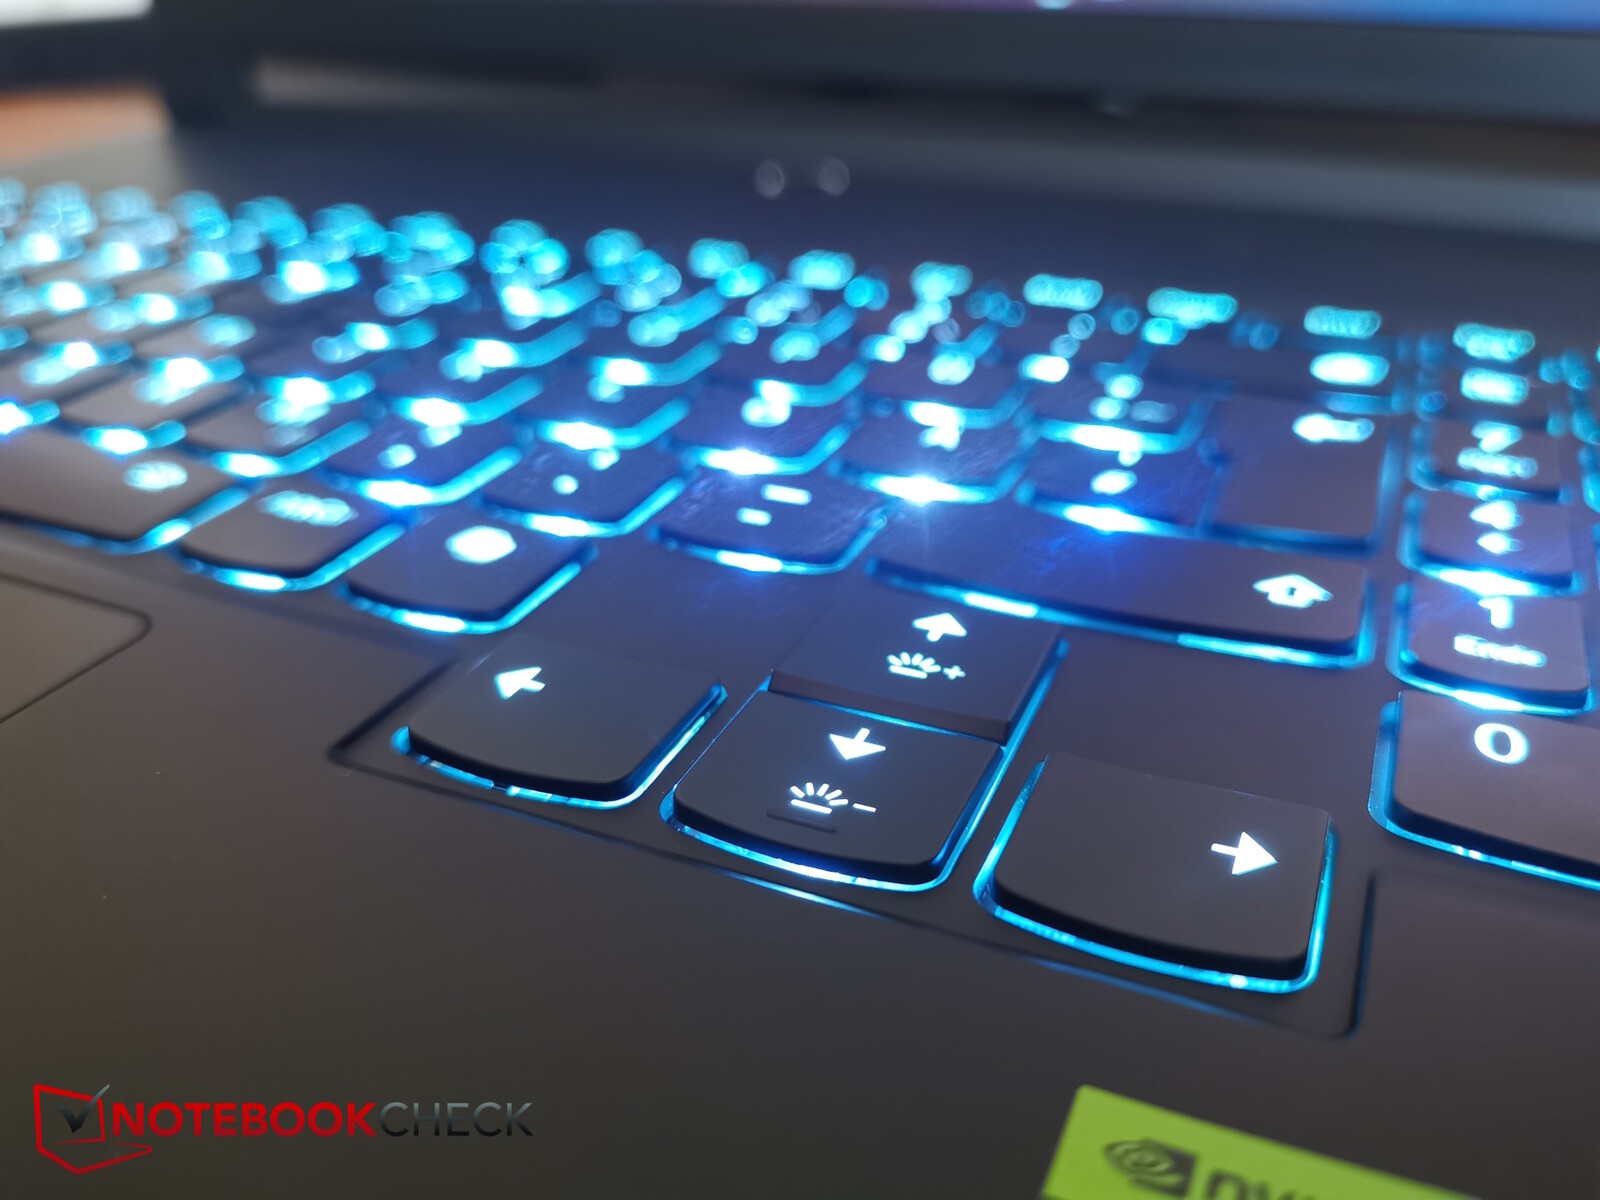
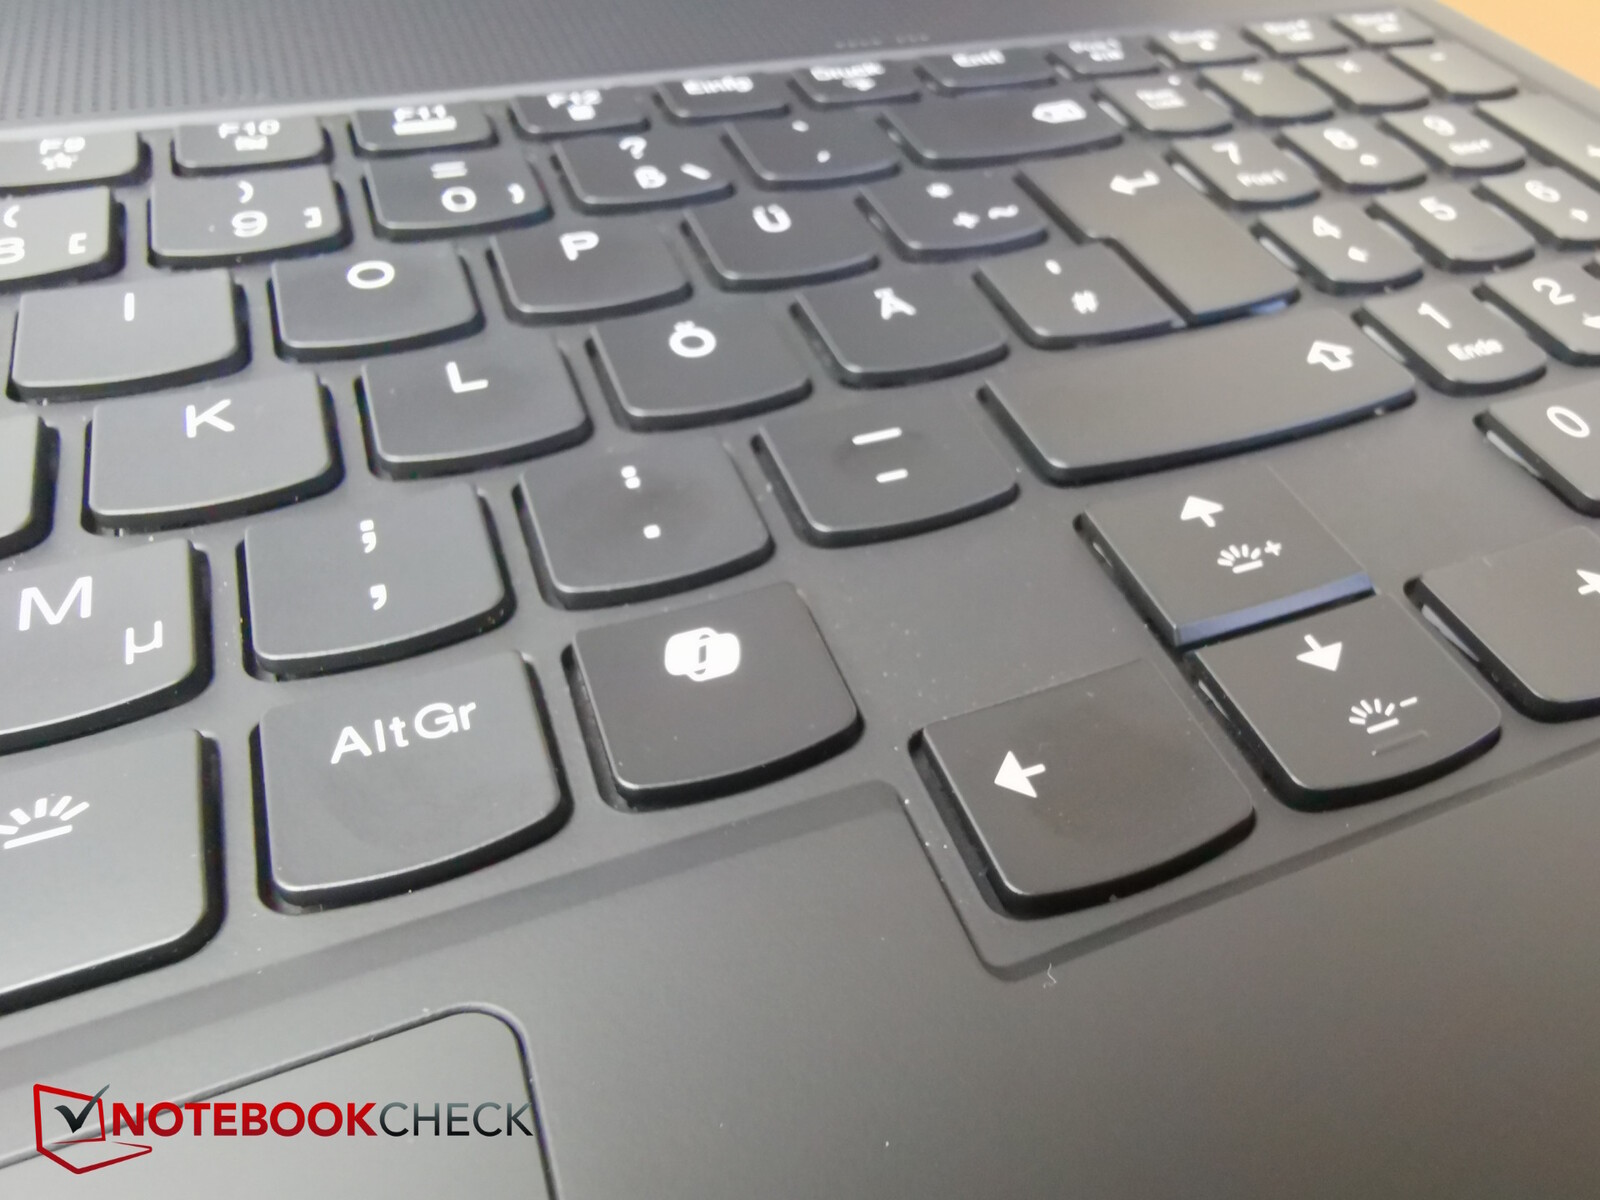
Eingabegeräte - Jetzt mit Co Pilot
Bei der angenehmen Membrantastatur und dem Touchpad bleibt größtenteils alles beim Alten. Letzteres ist mit nur 5,9 cm noch immer sehr schmal. Bei der Tastatur hat jetzt eine Taste für den Co Pilot Einzug gehalten. Dafür muss die rechte Strg-Taste weichen.

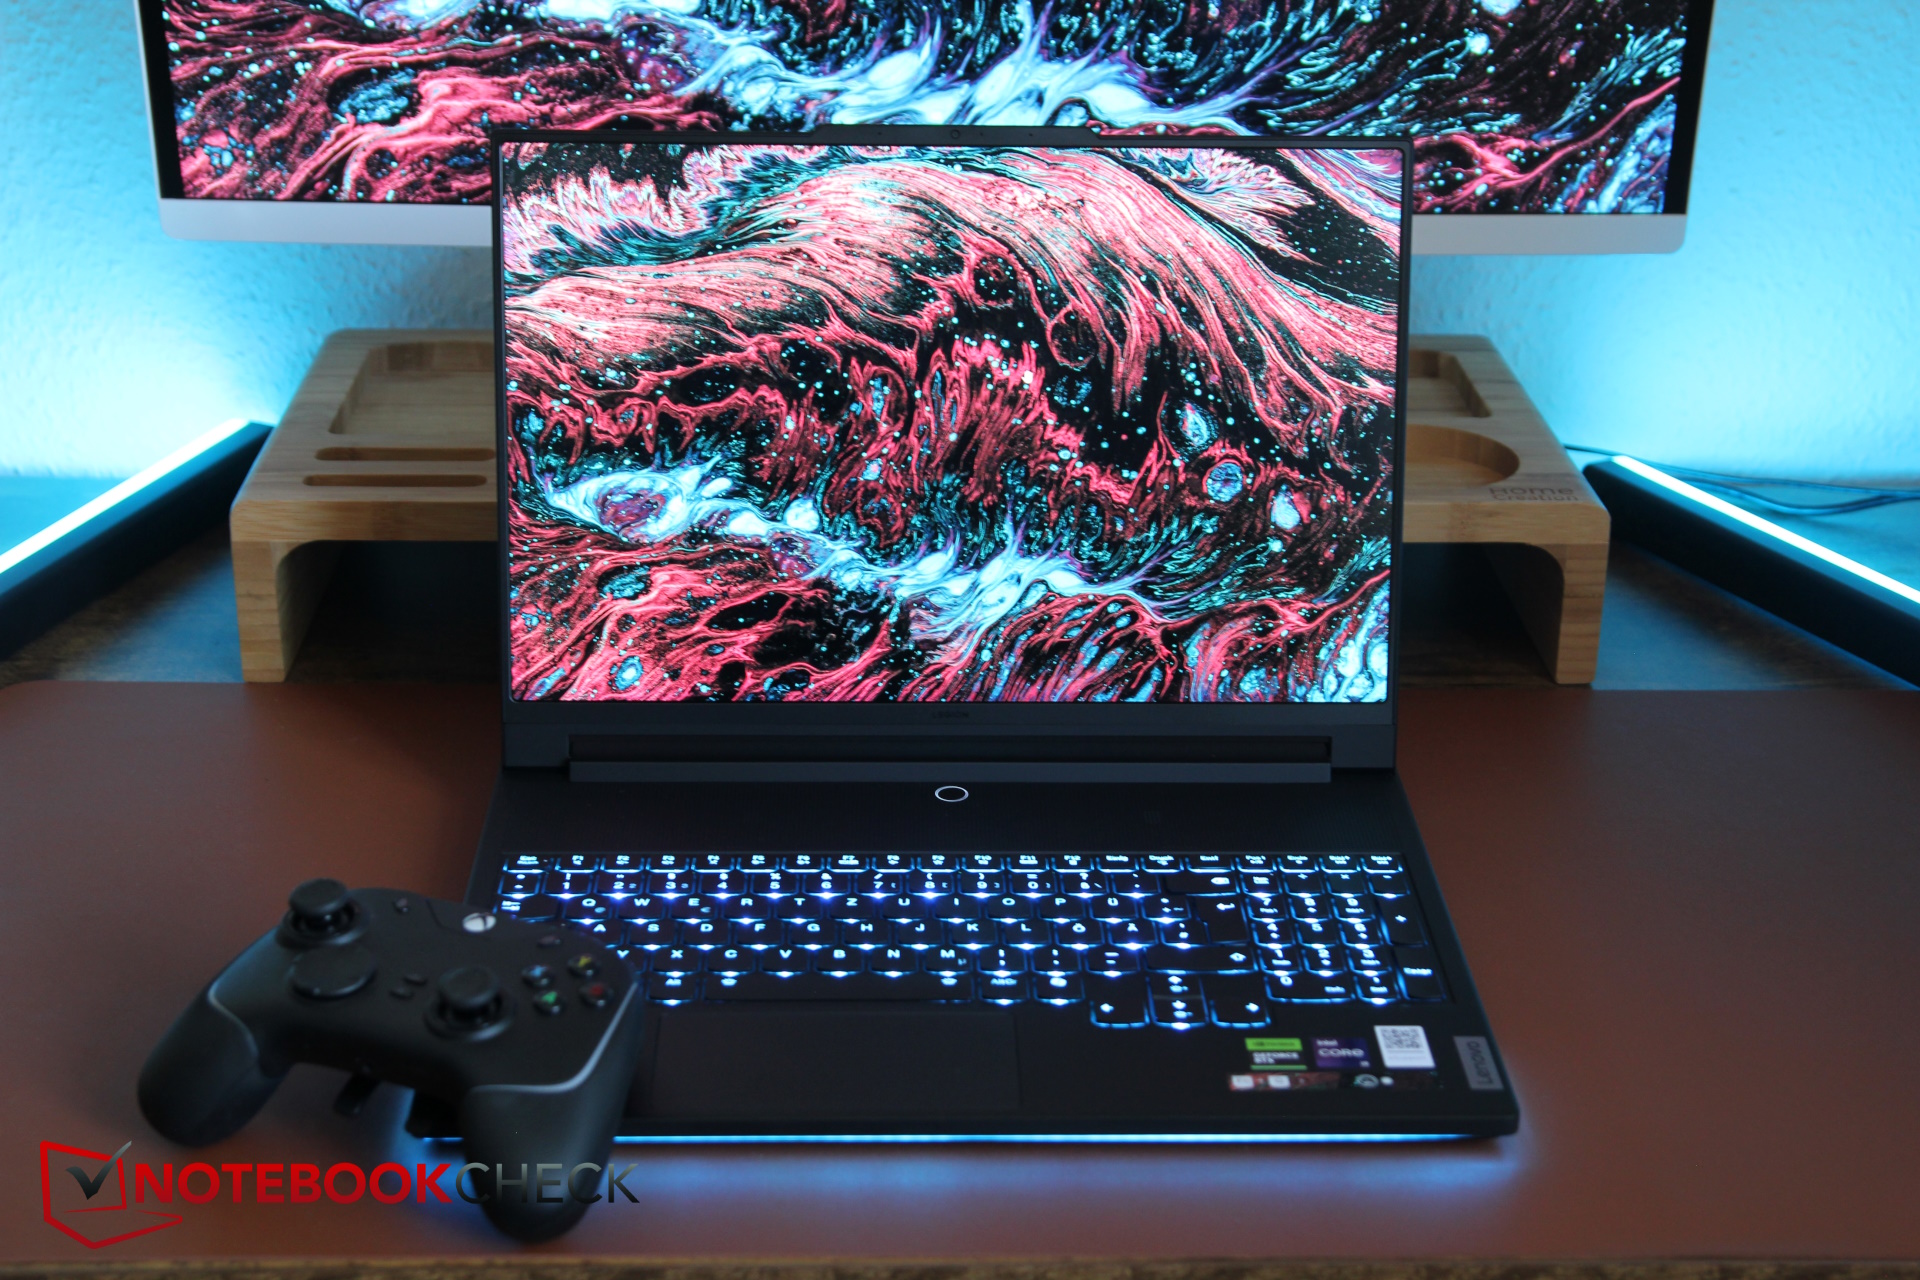
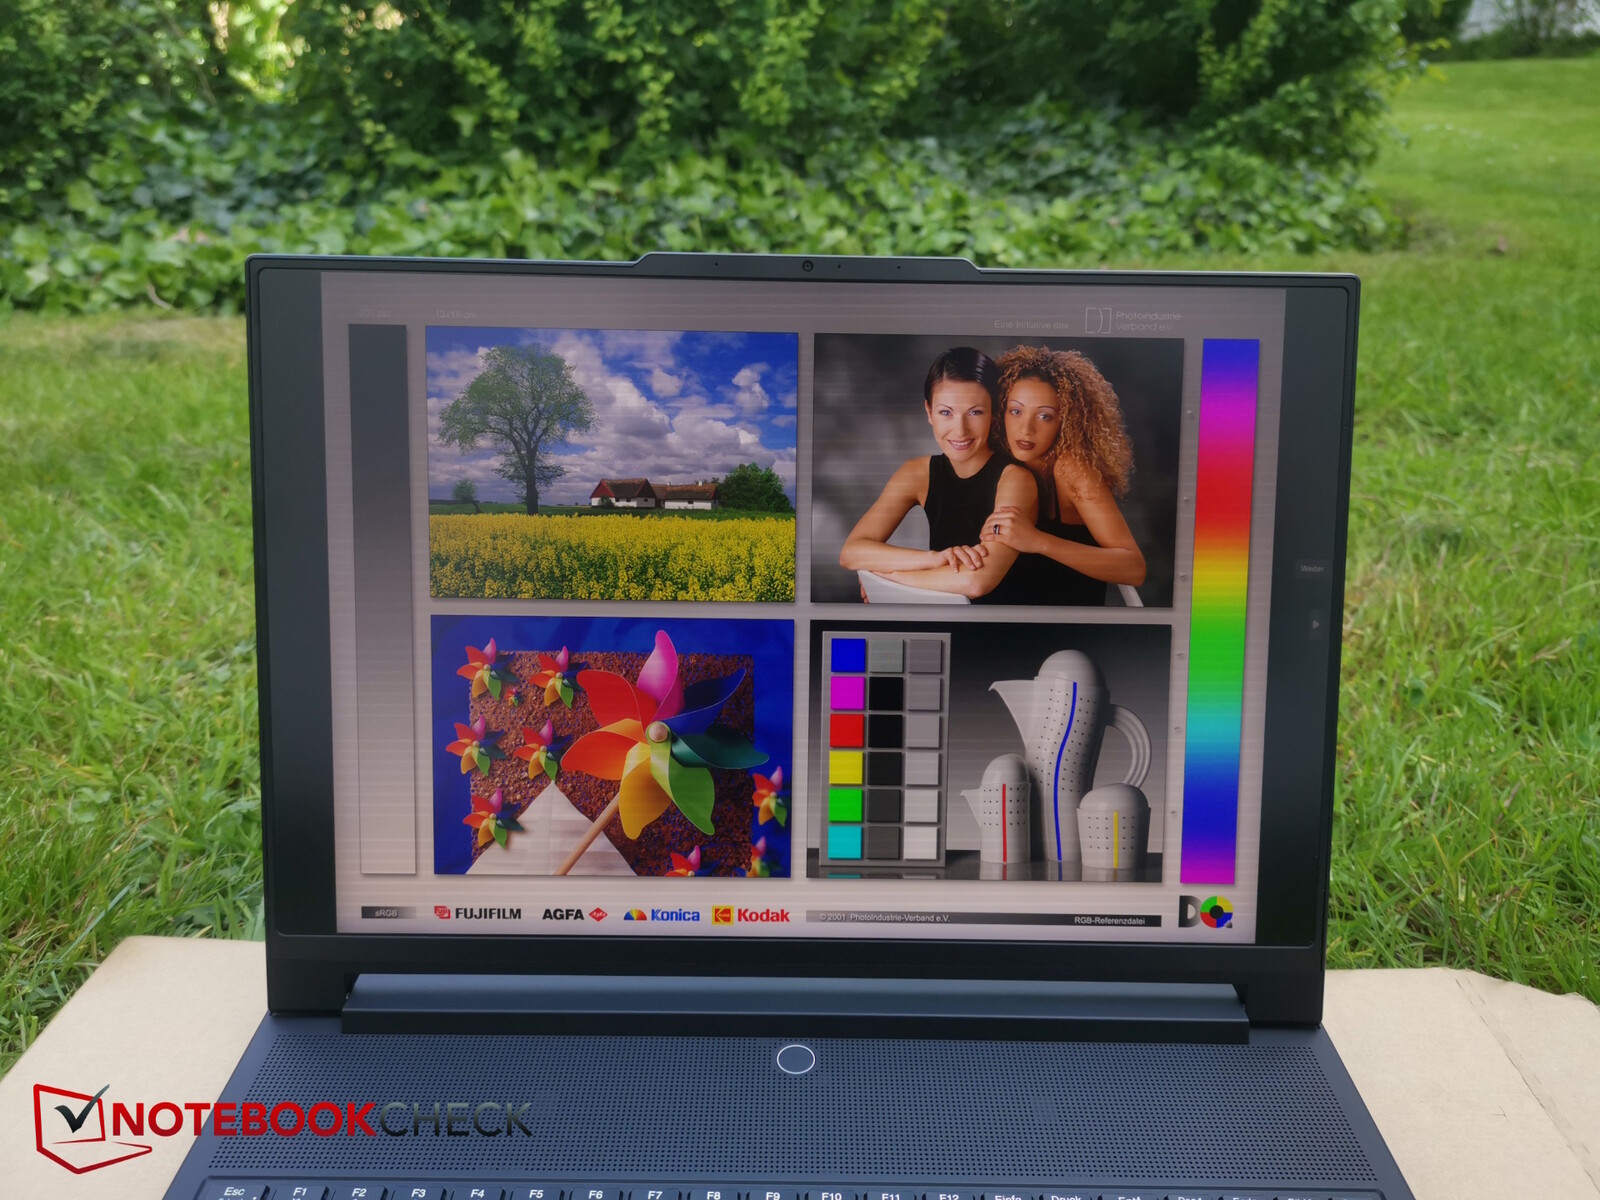
Display - 1.200 Nits MiniLED
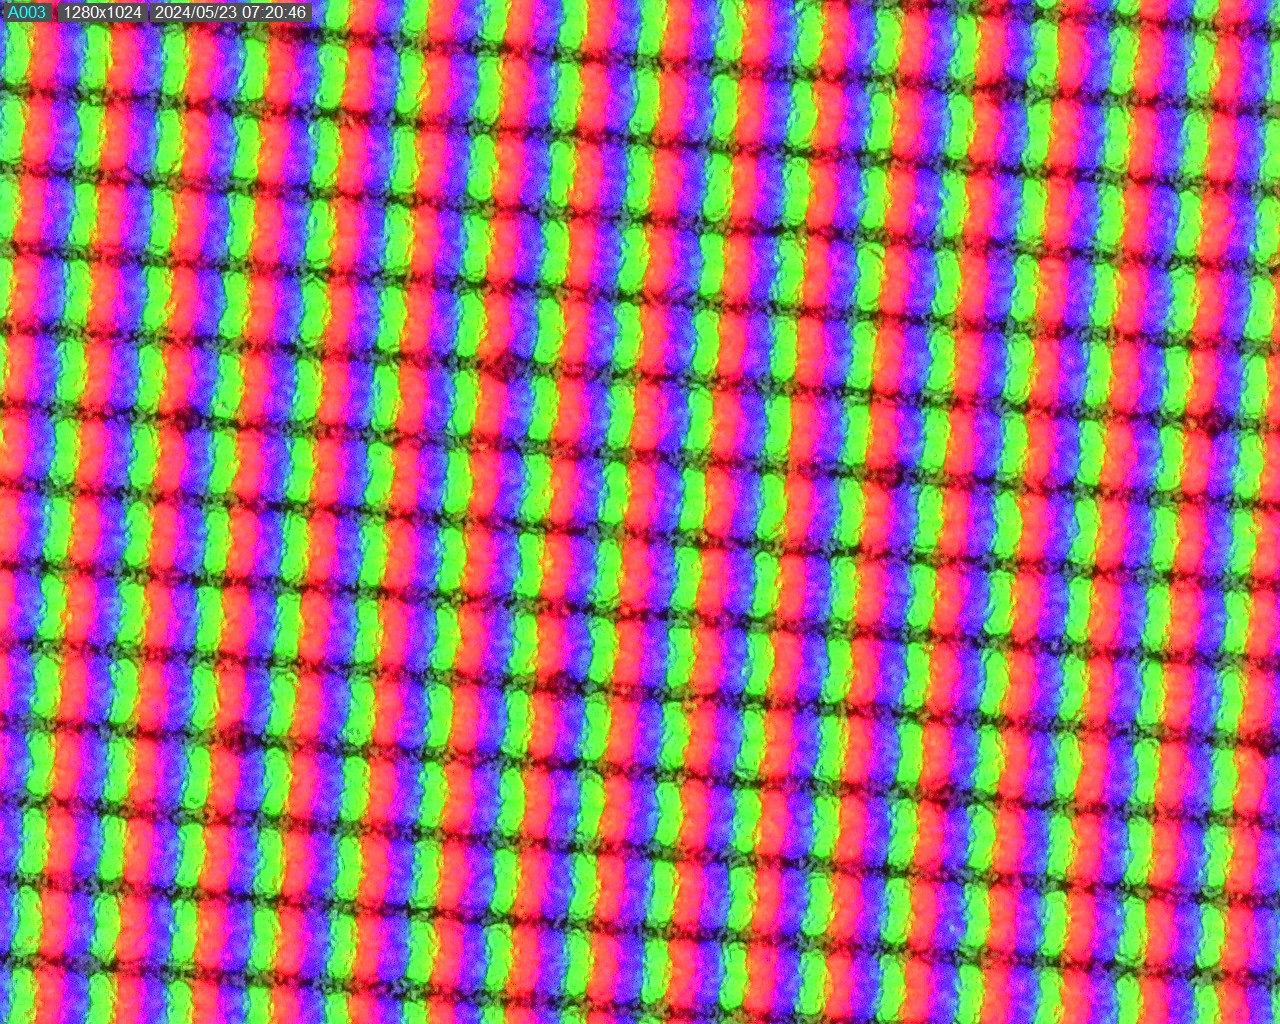
Das 16 Zoll große 3,2K-(3.200 x 2.000)-Mini-LED-Display mit Dolby Vision und G-Sync ist weiterhin eine der Hauptattraktionen im Legion 9. Es soll bis zu 1.200 Nits hell sein und erfüllt daher den HDR-1000-Standard. Tatsächlich messen wir im HDR-Modus mehr als 1.000 Nits.
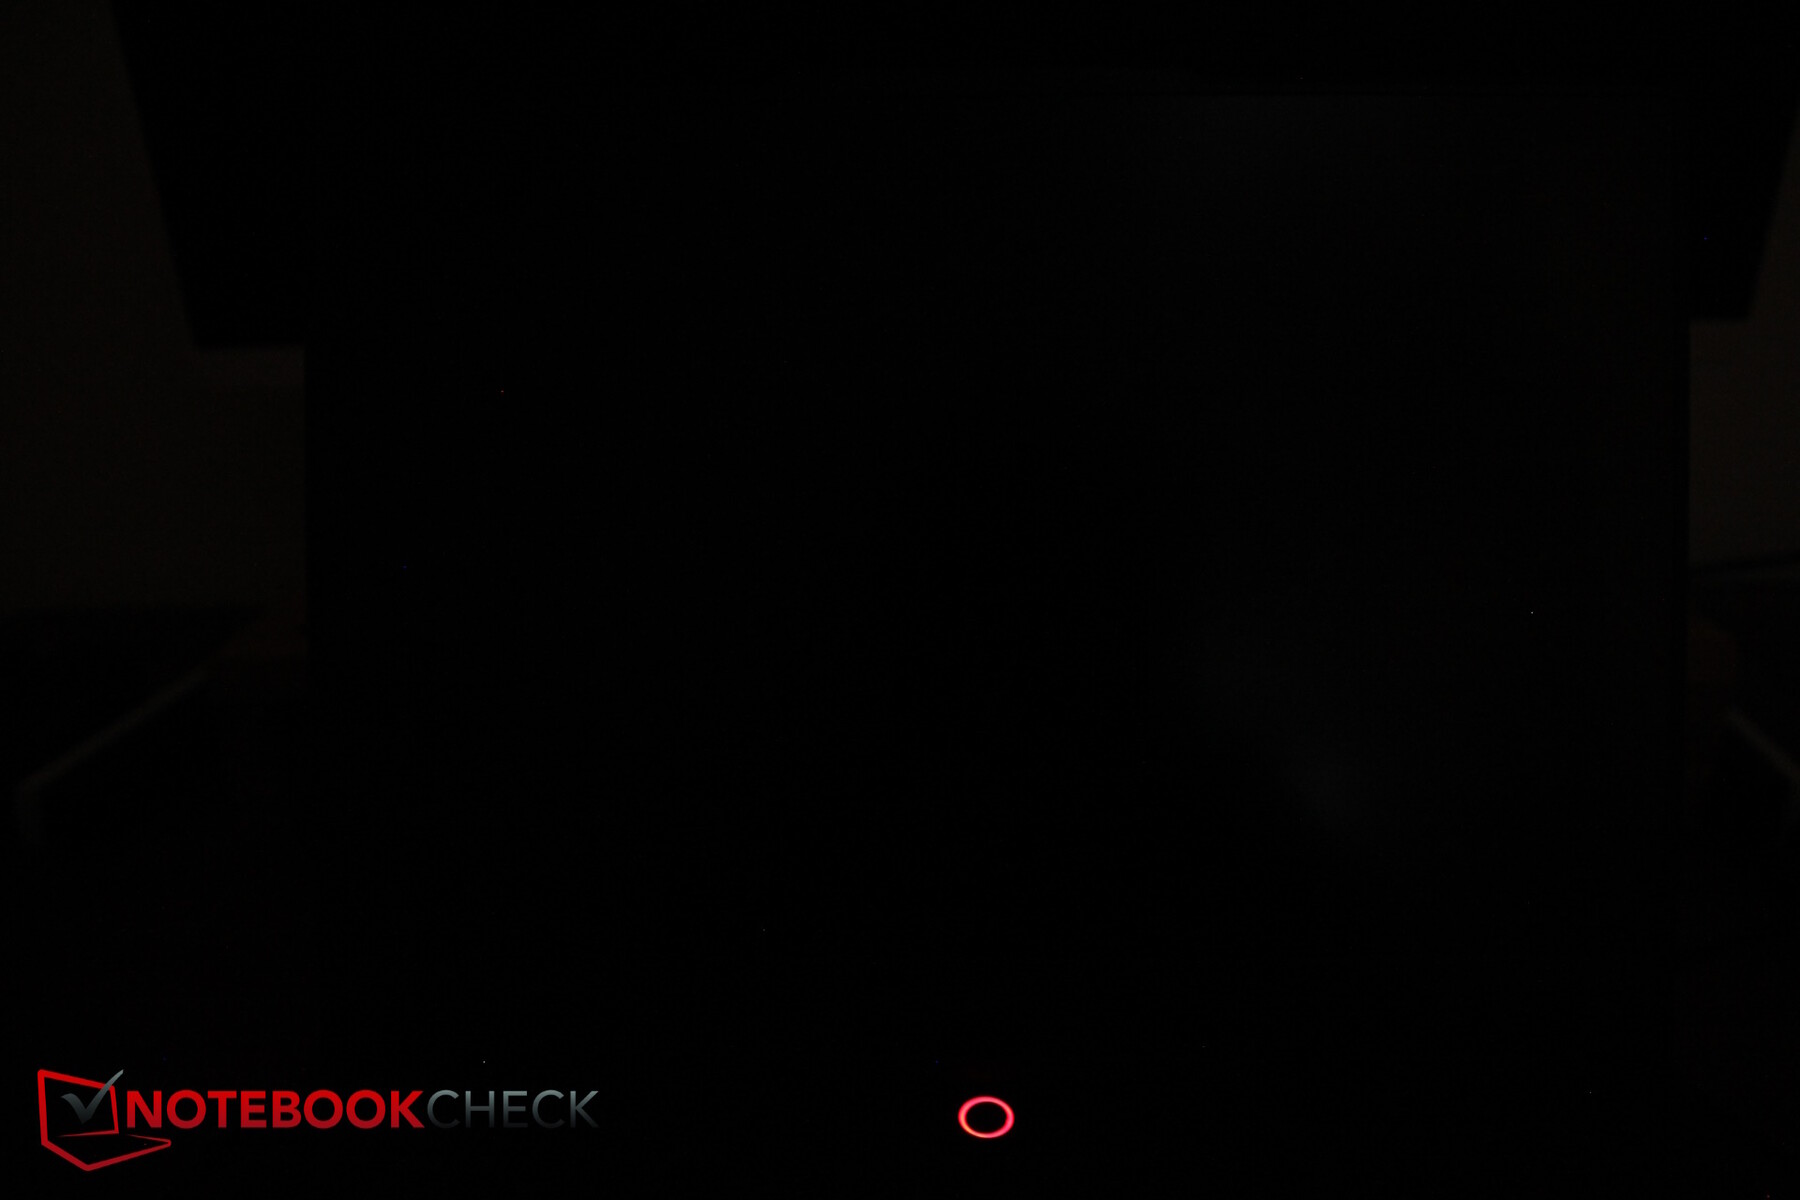
Im SD-Modus mit besserer Farbgenauigkeit leuchtet das Display noch immer mit durchschnittlich 664 Nits! Bei 43 Prozent Bildschirmhelligkeit liegt man bei etwa 150 Nits, ein Helligkeitswert mit dem wir einige unserer Akkutests durchführen. Der Schwarzwert ist durch die in vielen Zonen abschaltbaren Mini-LEDs ausgezeichnet, was zu sehr hohen Kontrasten führt.
Backlight Bleeding gibt es überhaupt nicht und auch die Reaktionszeiten ausreichend sind flott, wenn auch natürlich nicht auf OLED-Niveau. PWM ist messbar, allerdings mit einer recht hohen Frequenz von 5 kHz bis 40 kHz, was auch für empfindliche Personen unproblematisch sein sollte.
| |||||||||||||||||||||||||
Ausleuchtung: 91 %
Helligkeit Akku: 630 cd/m²
Kontrast: 21033:1 (Schwarzwert: 0.03 cd/m²)
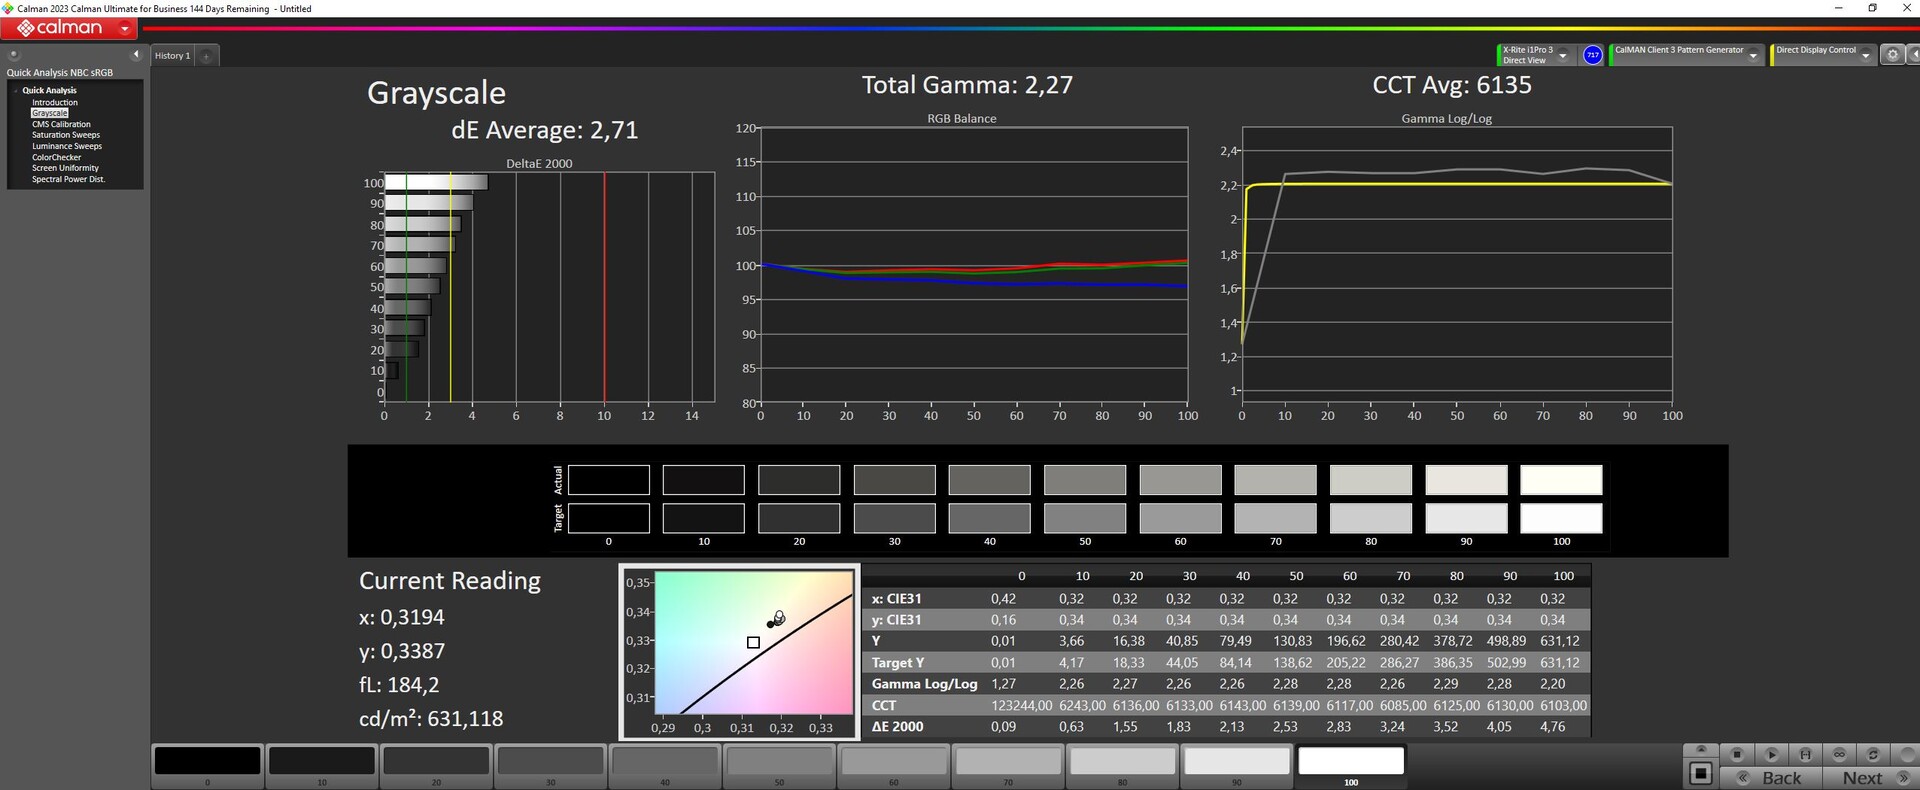
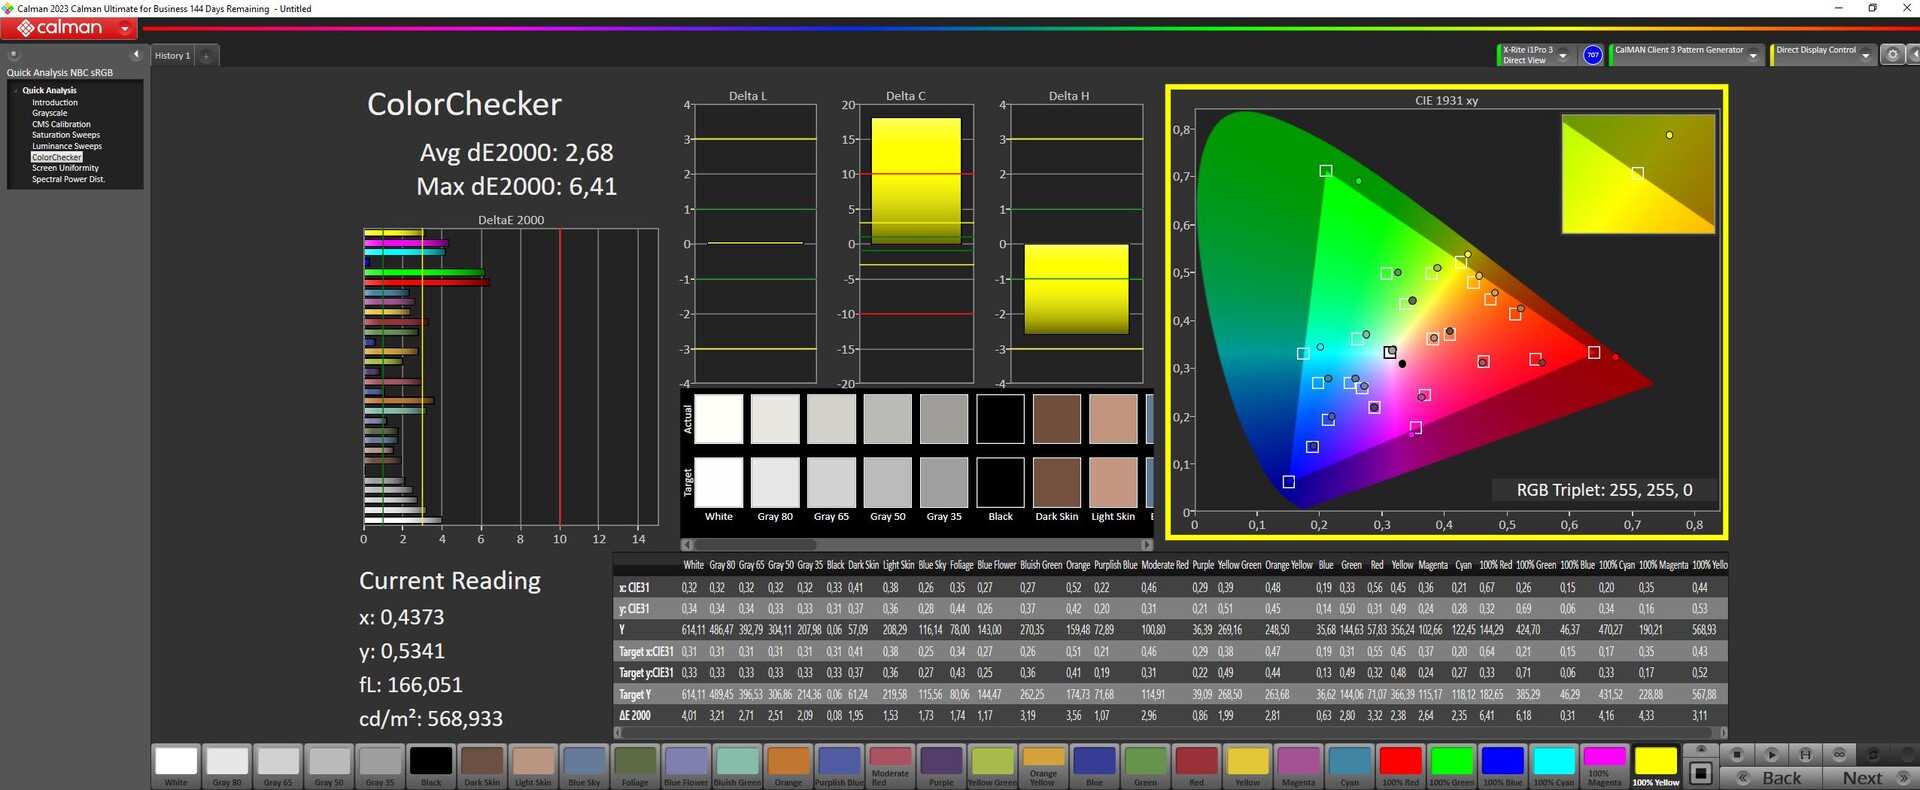
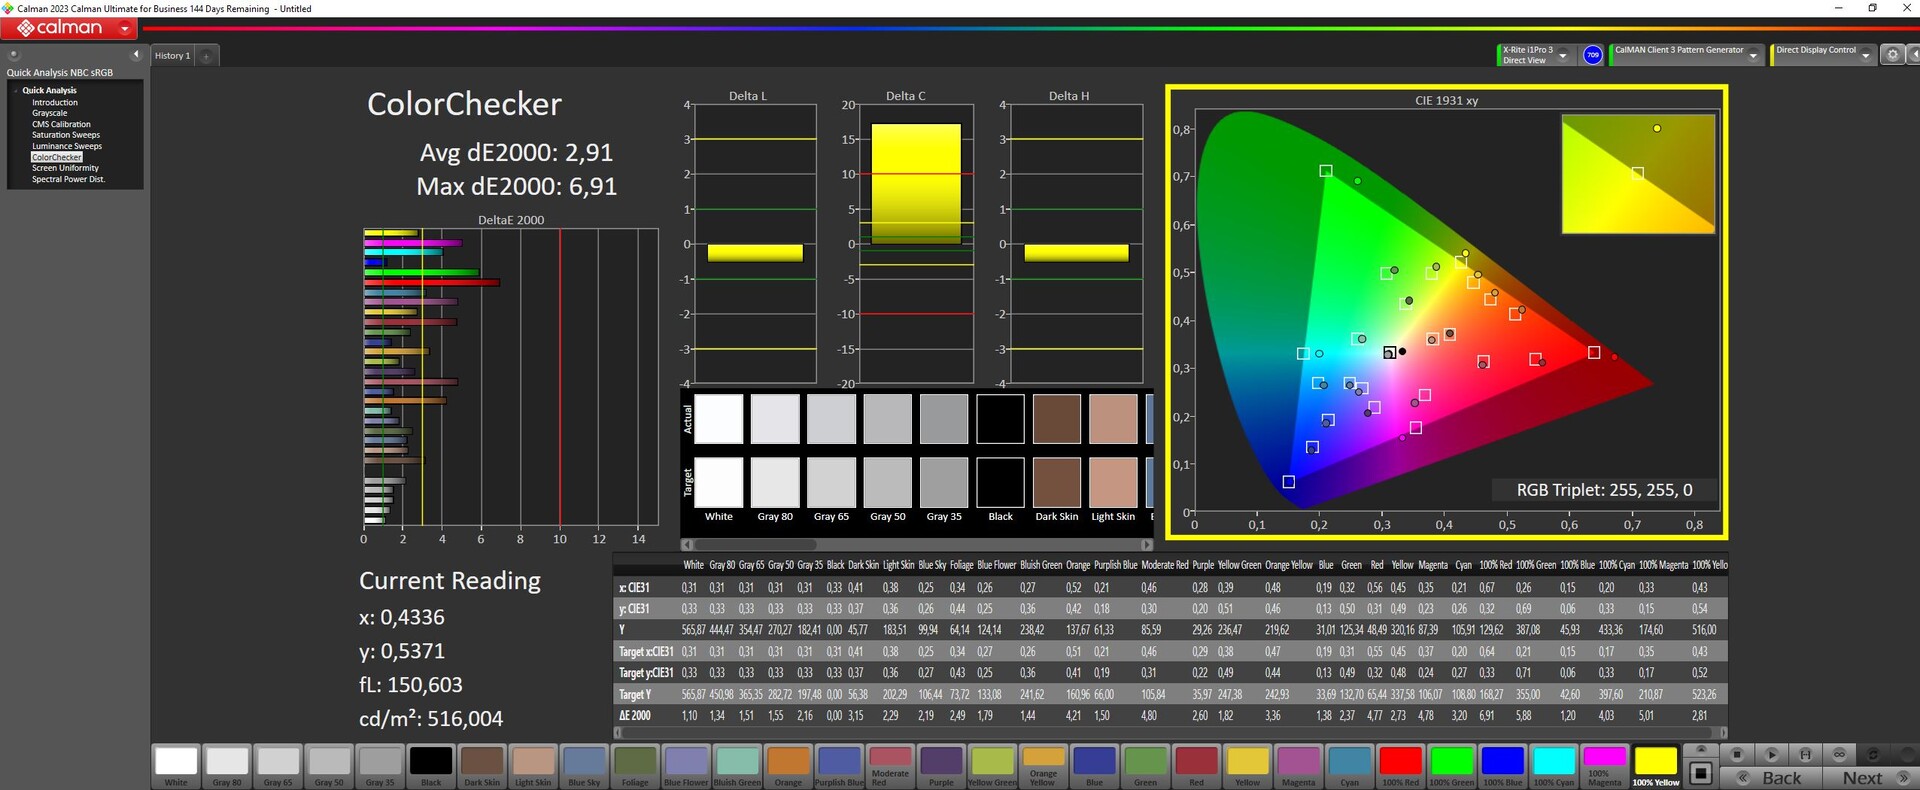
ΔE ColorChecker Calman: 2.68 | ∀{0.5-29.43 Ø4.76}
calibrated: 2.68
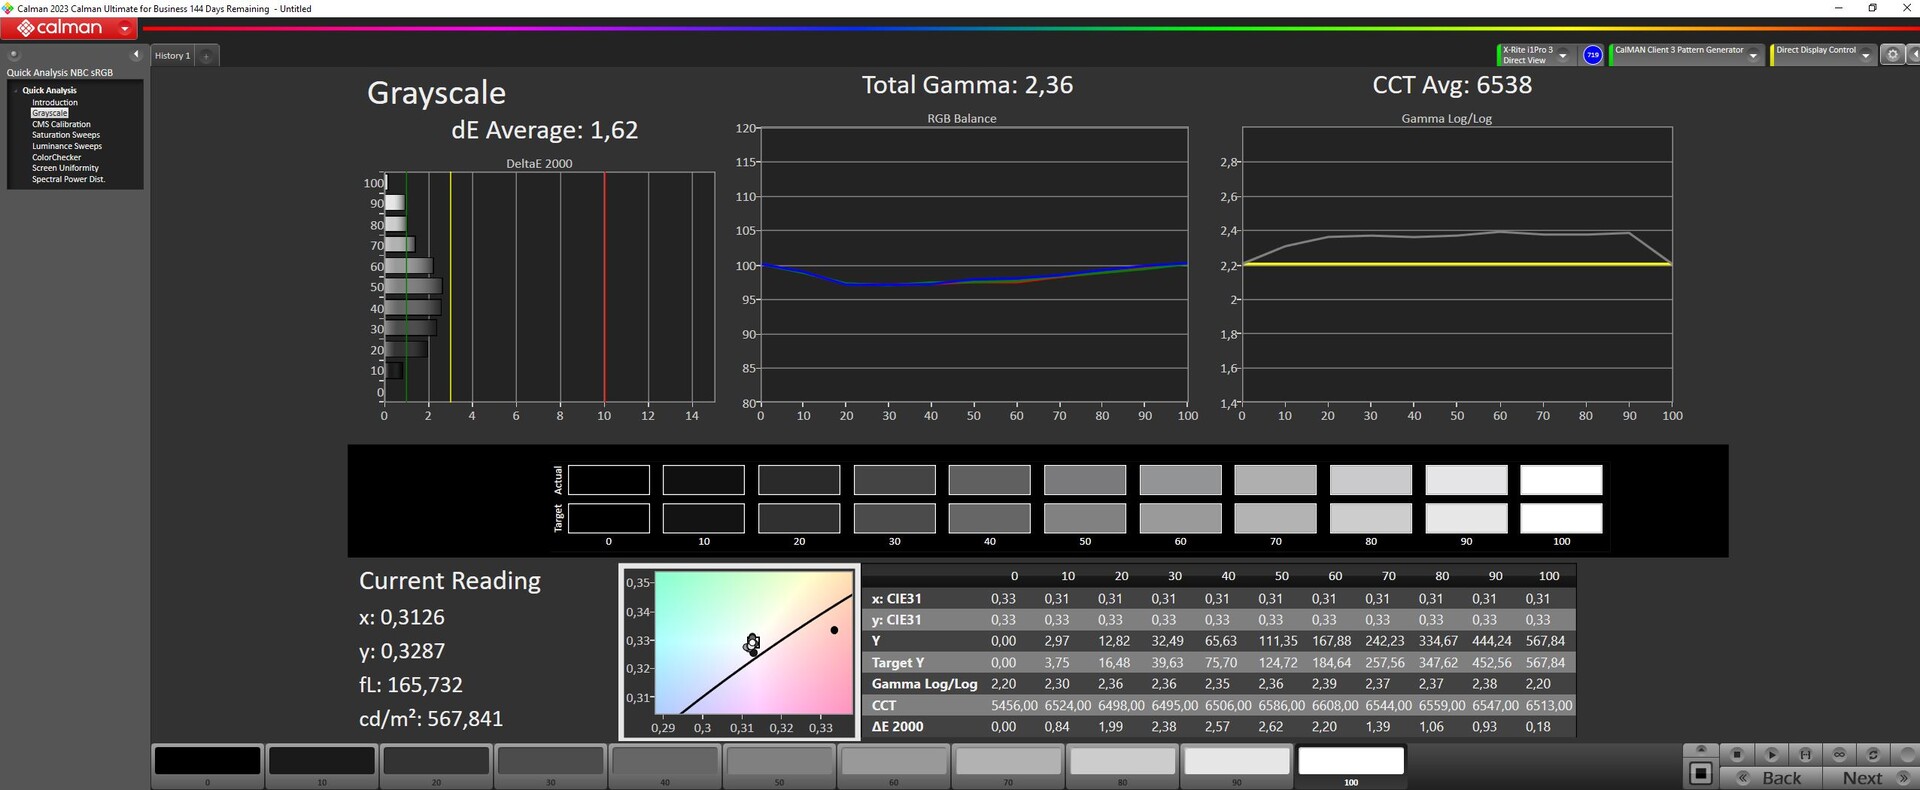
ΔE Greyscale Calman: 2.71 | ∀{0.09-98 Ø5}
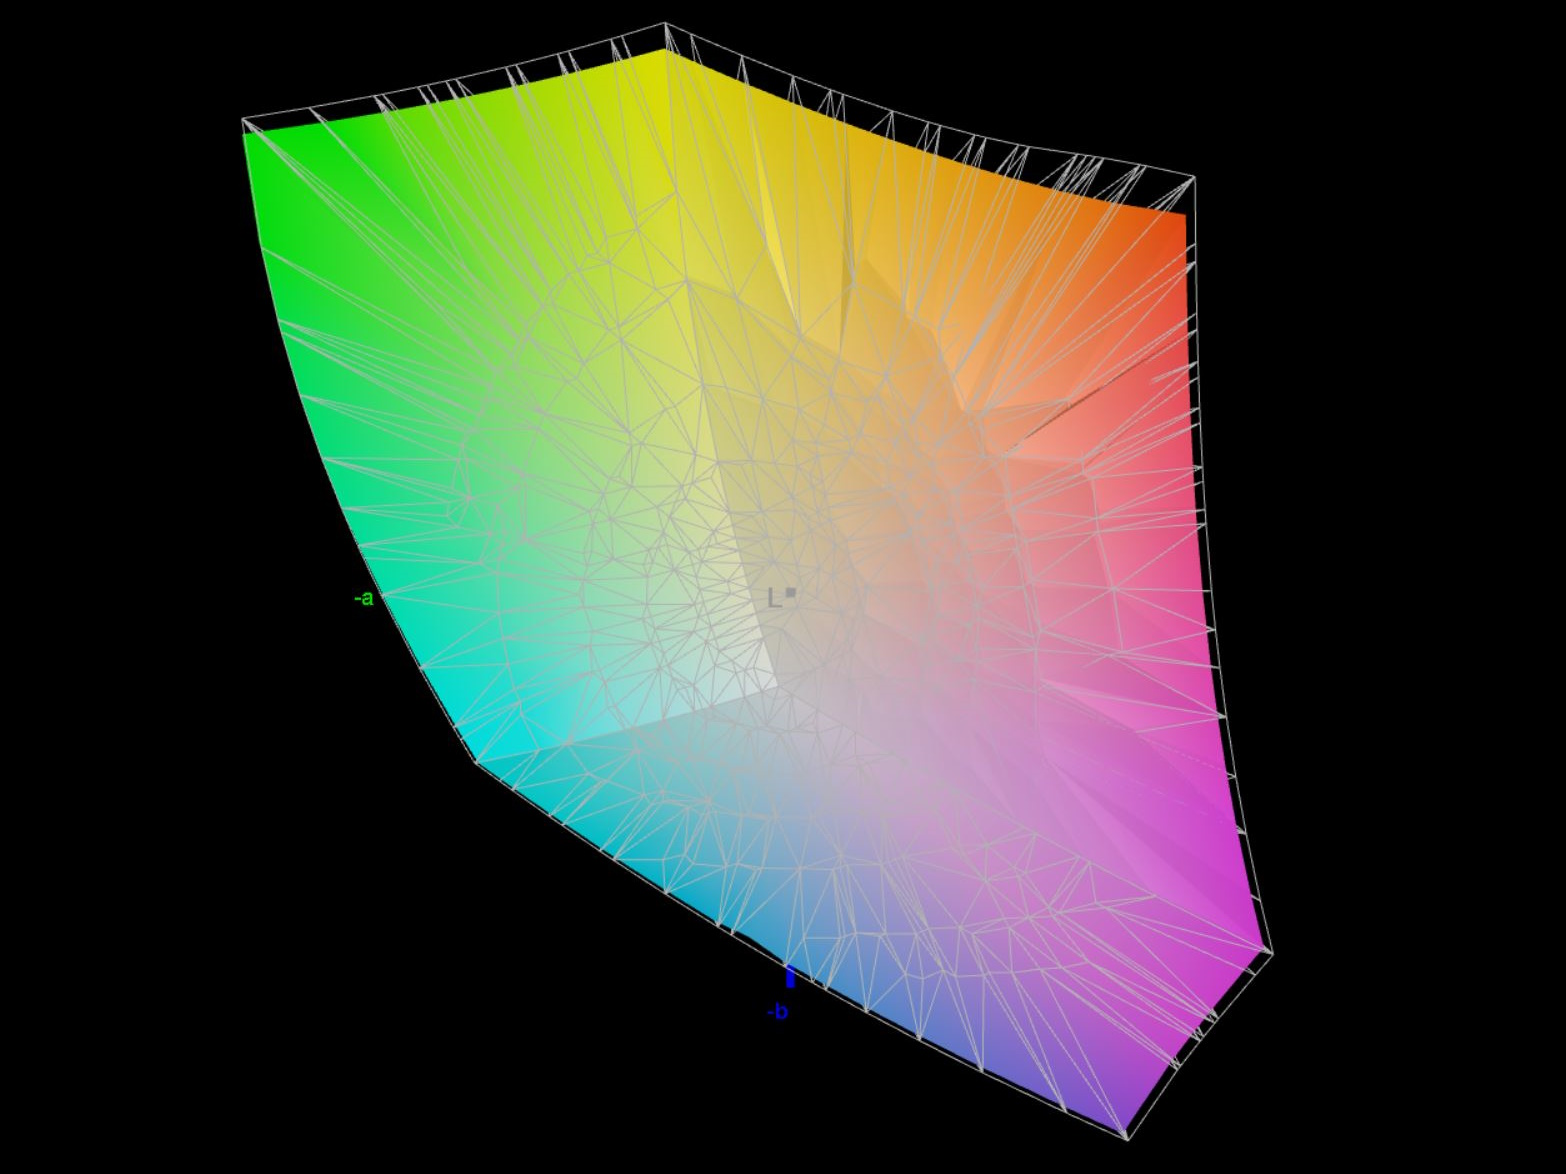
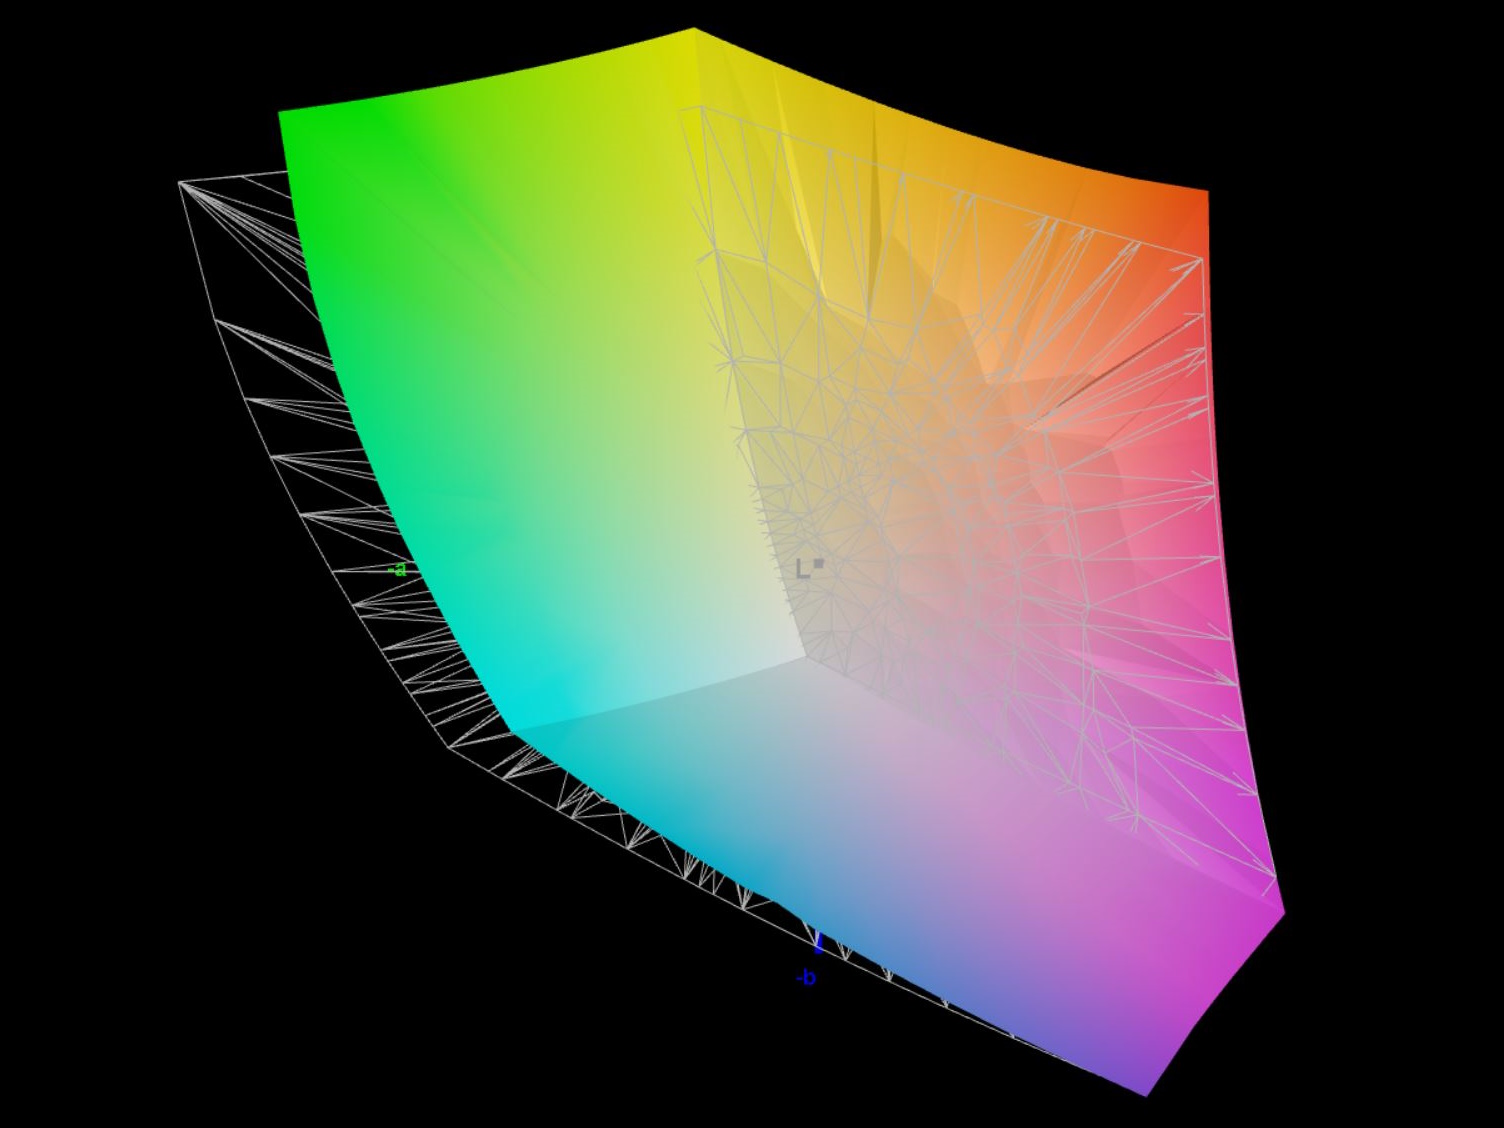
86.6% AdobeRGB 1998 (Argyll 3D)
99.9% sRGB (Argyll 3D)
95.3% Display P3 (Argyll 3D)
Gamma: 2.27
CCT: 6135 K
| Lenovo Legion 9 16IRX9, RTX 4090 CSOT T3 MNG007ZA2-2, MiniLED, 3200x2000, 16" | Lenovo Legion 9 16IRX8 CSOT T3 MNG007ZA2-2, Mini-LED, 3200x2000, 16" | Razer Blade 16 2024, RTX 4090 Samsung SDC41AB (ATNA60DL03-0), OLED, 2560x1600, 16" | Alienware m18 R2 BOE NE18NZ1, IPS, 2560x1600, 18" | Asus ROG Strix Scar 18 G834JYR (2024) BOE NE180QDM-NM1, Mini LED, 2560x1600, 18" | Medion Erazer Beast X40 2024 BOE NE170QDM-NZ1, IPS, 2560x1600, 17" | |
|---|---|---|---|---|---|---|
| Display | 1% | 5% | 2% | 3% | -16% | |
| Display P3 Coverage (%) | 95.3 | 97.2 2% | 99.1 4% | 97.8 3% | 99.9 5% | 68.1 -29% |
| sRGB Coverage (%) | 99.9 | 99.9 0% | 99.9 0% | 99.5 0% | 100 0% | 99.5 0% |
| AdobeRGB 1998 Coverage (%) | 86.6 | 87 0% | 95.6 10% | 88.9 3% | 90 4% | 69 -20% |
| Response Times | -11% | 97% | 27% | -1% | 19% | |
| Response Time Grey 50% / Grey 80% * (ms) | 12.6 ? | 13.3 ? -6% | 0.24 ? 98% | 5.3 ? 58% | 12 ? 5% | 11.7 ? 7% |
| Response Time Black / White * (ms) | 10 ? | 11.6 ? -16% | 0.4 ? 96% | 10.4 ? -4% | 10.7 ? -7% | 6.9 ? 31% |
| PWM Frequency (Hz) | 5430 | 4742 | 960 | 5733 ? | ||
| PWM Amplitude * (%) | 8 | |||||
| Bildschirm | -0% | 21% | -107% | 14% | -136% | |
| Helligkeit Bildmitte (cd/m²) | 631 | 674.9 7% | 418 -34% | 271.8 -57% | 937 48% | 422 -33% |
| Brightness (cd/m²) | 664 | 682 3% | 420 -37% | 275 -59% | 934 41% | 388 -42% |
| Brightness Distribution (%) | 91 | 96 5% | 98 8% | 78 -14% | 89 -2% | 87 -4% |
| Schwarzwert * (cd/m²) | 0.03 | 0.04 -33% | 0.02 33% | 0.27 -800% | 0.066 -120% | 0.42 -1300% |
| Kontrast (:1) | 21033 | 16873 -20% | 20900 -1% | 1007 -95% | 14197 -33% | 1005 -95% |
| Delta E Colorchecker * | 2.68 | 2.56 4% | 1.07 60% | 2.48 7% | 1.52 43% | 1.42 47% |
| Colorchecker dE 2000 max. * | 6.41 | 4.16 35% | 4.04 37% | 5.59 13% | 2.82 56% | 1.97 69% |
| Colorchecker dE 2000 calibrated * | 2.68 | 2.47 8% | 1.07 60% | 0.56 79% | 1.21 55% | 0.7 74% |
| Delta E Graustufen * | 2.71 | 3 -11% | 1.12 59% | 3.7 -37% | 1.7 37% | 1.2 56% |
| Gamma | 2.27 97% | 2.38 92% | 2.29 96% | 2.2 100% | 2.042 108% | 2.078 106% |
| CCT | 6135 106% | 6799 96% | 6417 101% | 6355 102% | 6578 99% | 6581 99% |
| Durchschnitt gesamt (Programm / Settings) | -3% /
-2% | 41% /
28% | -26% /
-65% | 5% /
9% | -44% /
-89% |
* ... kleinere Werte sind besser
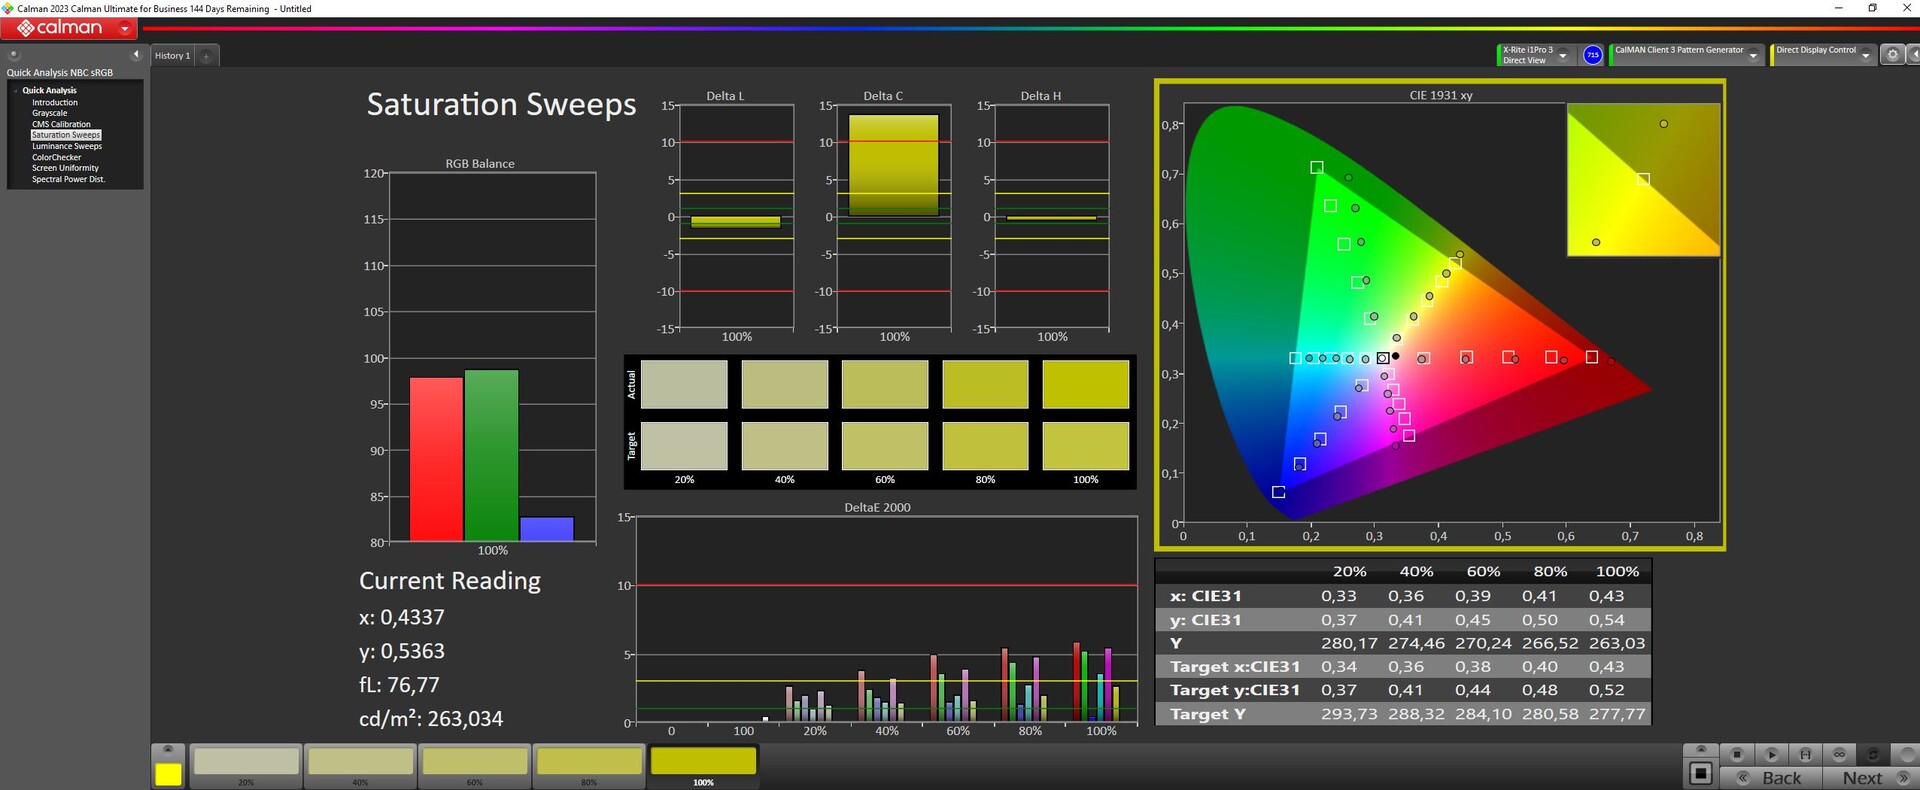
DisplayP3 wird zu etwa 95 Prozent abgebildet, sRGB komplett und AdobeRGB noch zu 86 bis 87 Prozent.
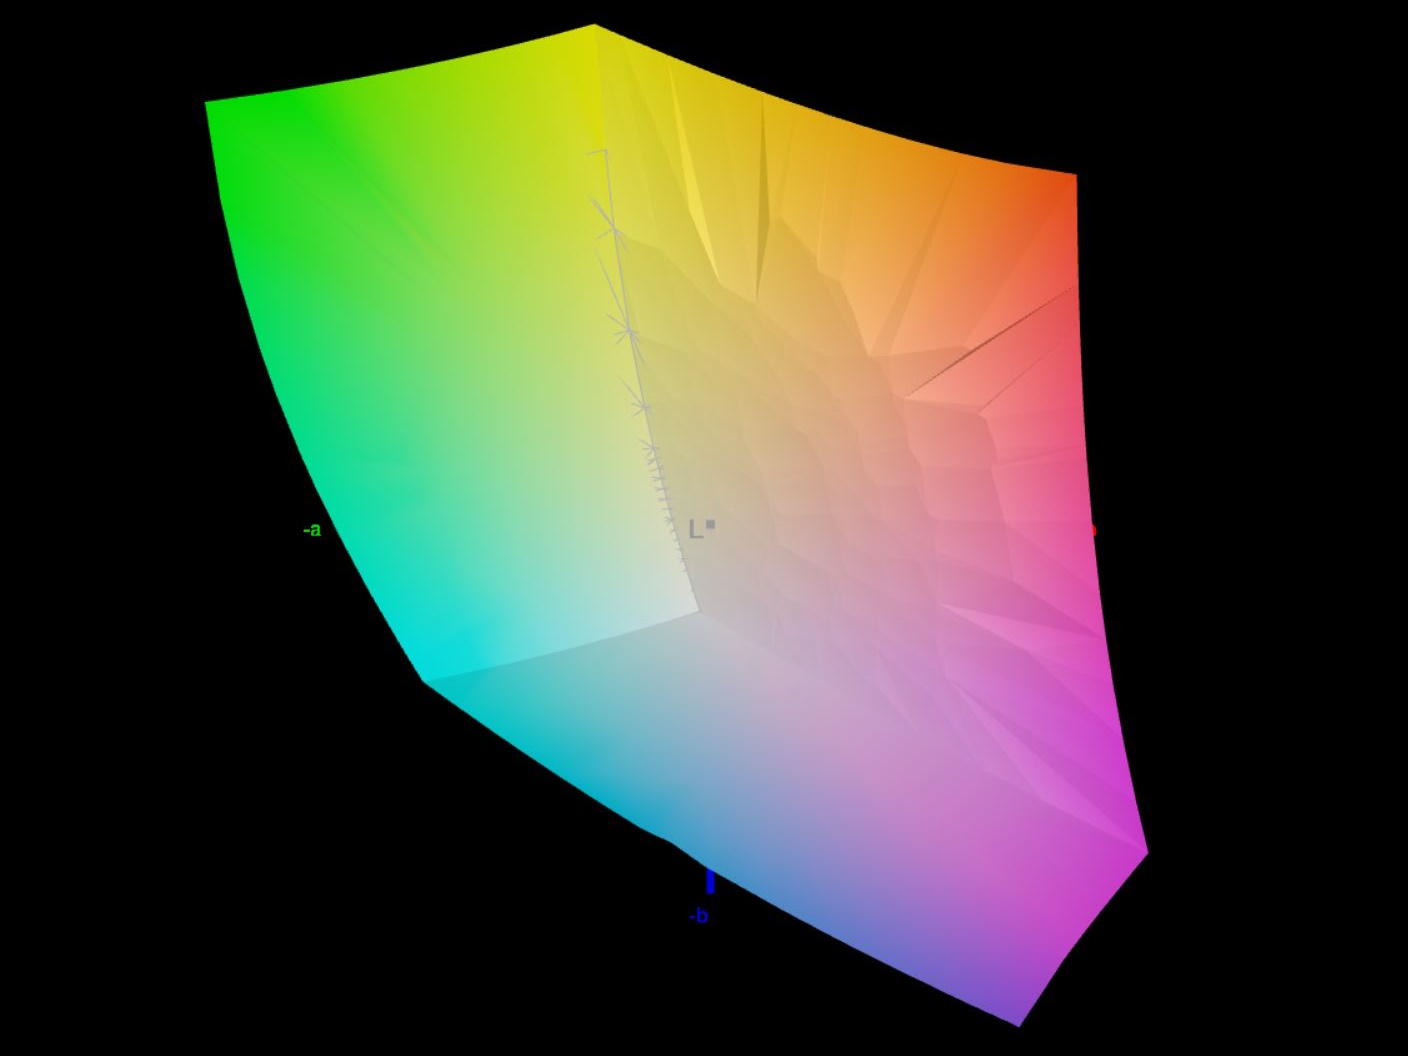
Ab Werk ist das Display ordentlich gegen den P3-Standard kalibriert. Eine erneute Kalibrierung verbessert zwar die DeltaE-Werte in den Graustufen, verschlimmbessert jedoch die DeltaE-Werte im ColorChecker, weshalb sich der Aufwand eher nicht lohnt. Optimal sind die Farbabweichungen mit durchschnittlich 2,68 und Ausreißern von bis zu 6,41 jedoch nicht.

Reaktionszeiten (Response Times) des Displays
| ↔ Reaktionszeiten Schwarz zu Weiß | ||
|---|---|---|
| 10 ms ... steigend ↗ und fallend ↘ kombiniert | ↗ 5.2 ms steigend | 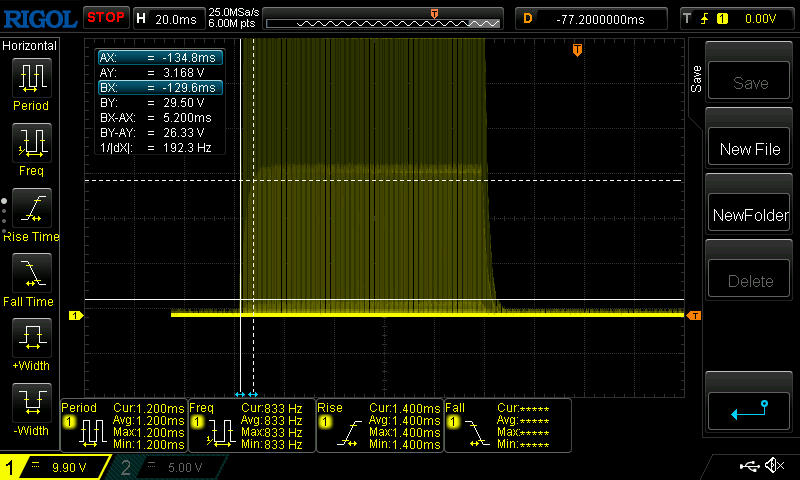 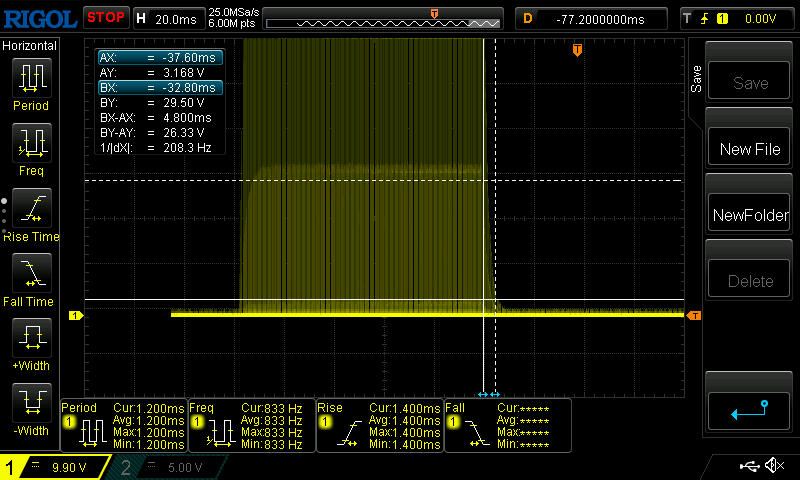 |
| ↘ 4.8 ms fallend | ||
| Die gemessenen Reaktionszeiten sind gut, für anspruchsvolle Spieler könnten der Bildschirm jedoch zu langsam sein. Im Vergleich rangierten die bei uns getesteten Geräte von 0.1 (Minimum) zu 240 (Maximum) ms. » 26 % aller Screens waren schneller als der getestete. Daher sind die gemessenen Reaktionszeiten besser als der Durchschnitt aller vermessenen Geräte (20.1 ms). | ||
| ↔ Reaktionszeiten 50% Grau zu 80% Grau | ||
| 12.6 ms ... steigend ↗ und fallend ↘ kombiniert | ↗ 6.6 ms steigend | 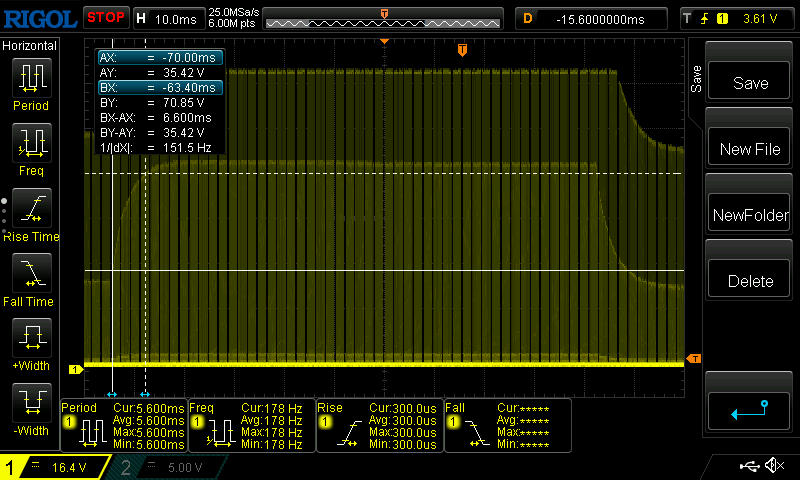 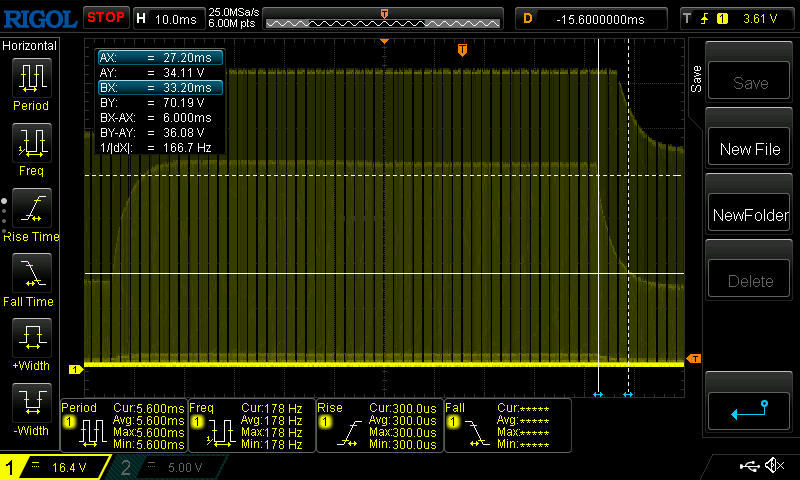 |
| ↘ 6 ms fallend | ||
| Die gemessenen Reaktionszeiten sind gut, für anspruchsvolle Spieler könnten der Bildschirm jedoch zu langsam sein. Im Vergleich rangierten die bei uns getesteten Geräte von 0.165 (Minimum) zu 636 (Maximum) ms. » 25 % aller Screens waren schneller als der getestete. Daher sind die gemessenen Reaktionszeiten besser als der Durchschnitt aller vermessenen Geräte (31.4 ms). | ||
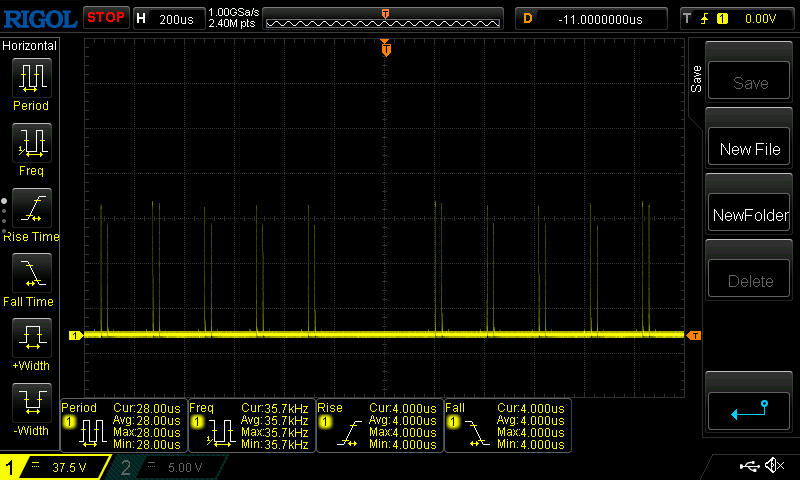
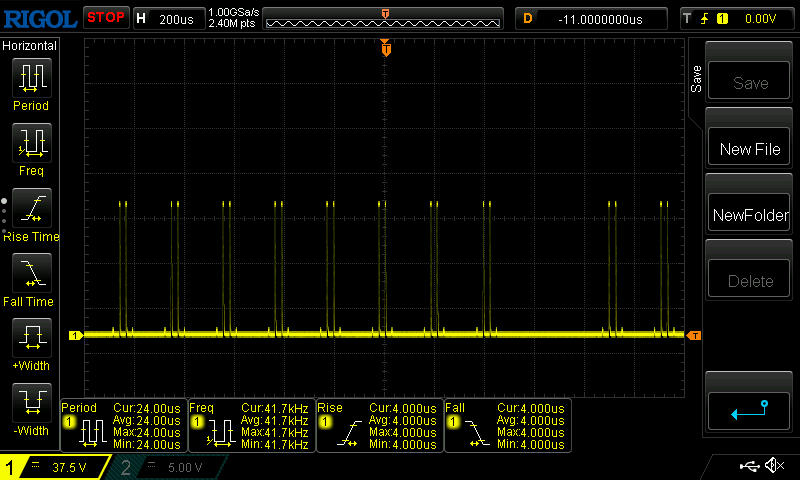
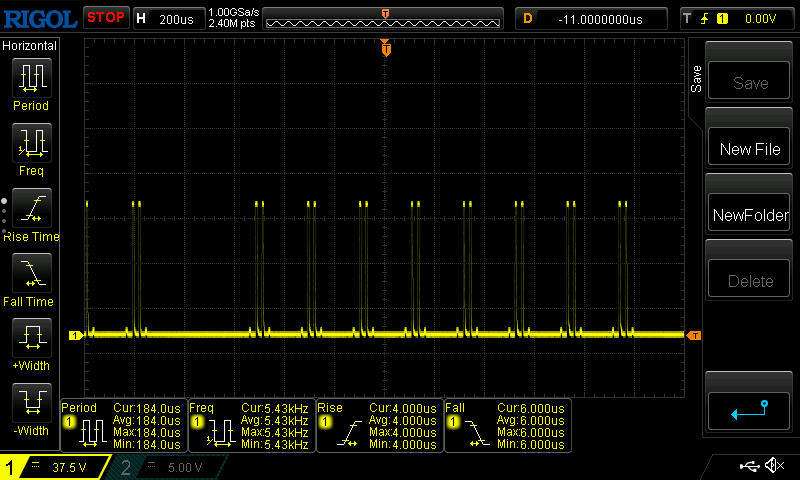
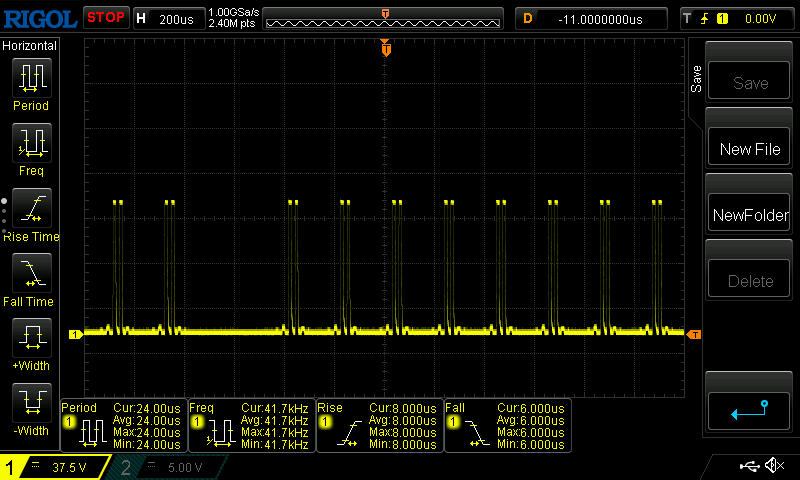
Bildschirm-Flackern / PWM (Pulse-Width Modulation)
| Flackern / PWM festgestellt | 5430 Hz Amplitude: 8 % | |
Das Display flackert mit 5430 Hz (im schlimmsten Fall, eventuell durch Pulsweitenmodulation PWM) . Die Frequenz von 5430 Hz ist sehr hoch und sollte daher auch bei empfindlichen Personen zu keinen Problemen führen. Im Vergleich: 53 % aller getesteten Geräte nutzten kein PWM um die Helligkeit zu reduzieren. Wenn PWM eingesetzt wurde, dann bei einer Frequenz von durchschnittlich 8016 (Minimum 5, Maximum 343500) Hz. | ||

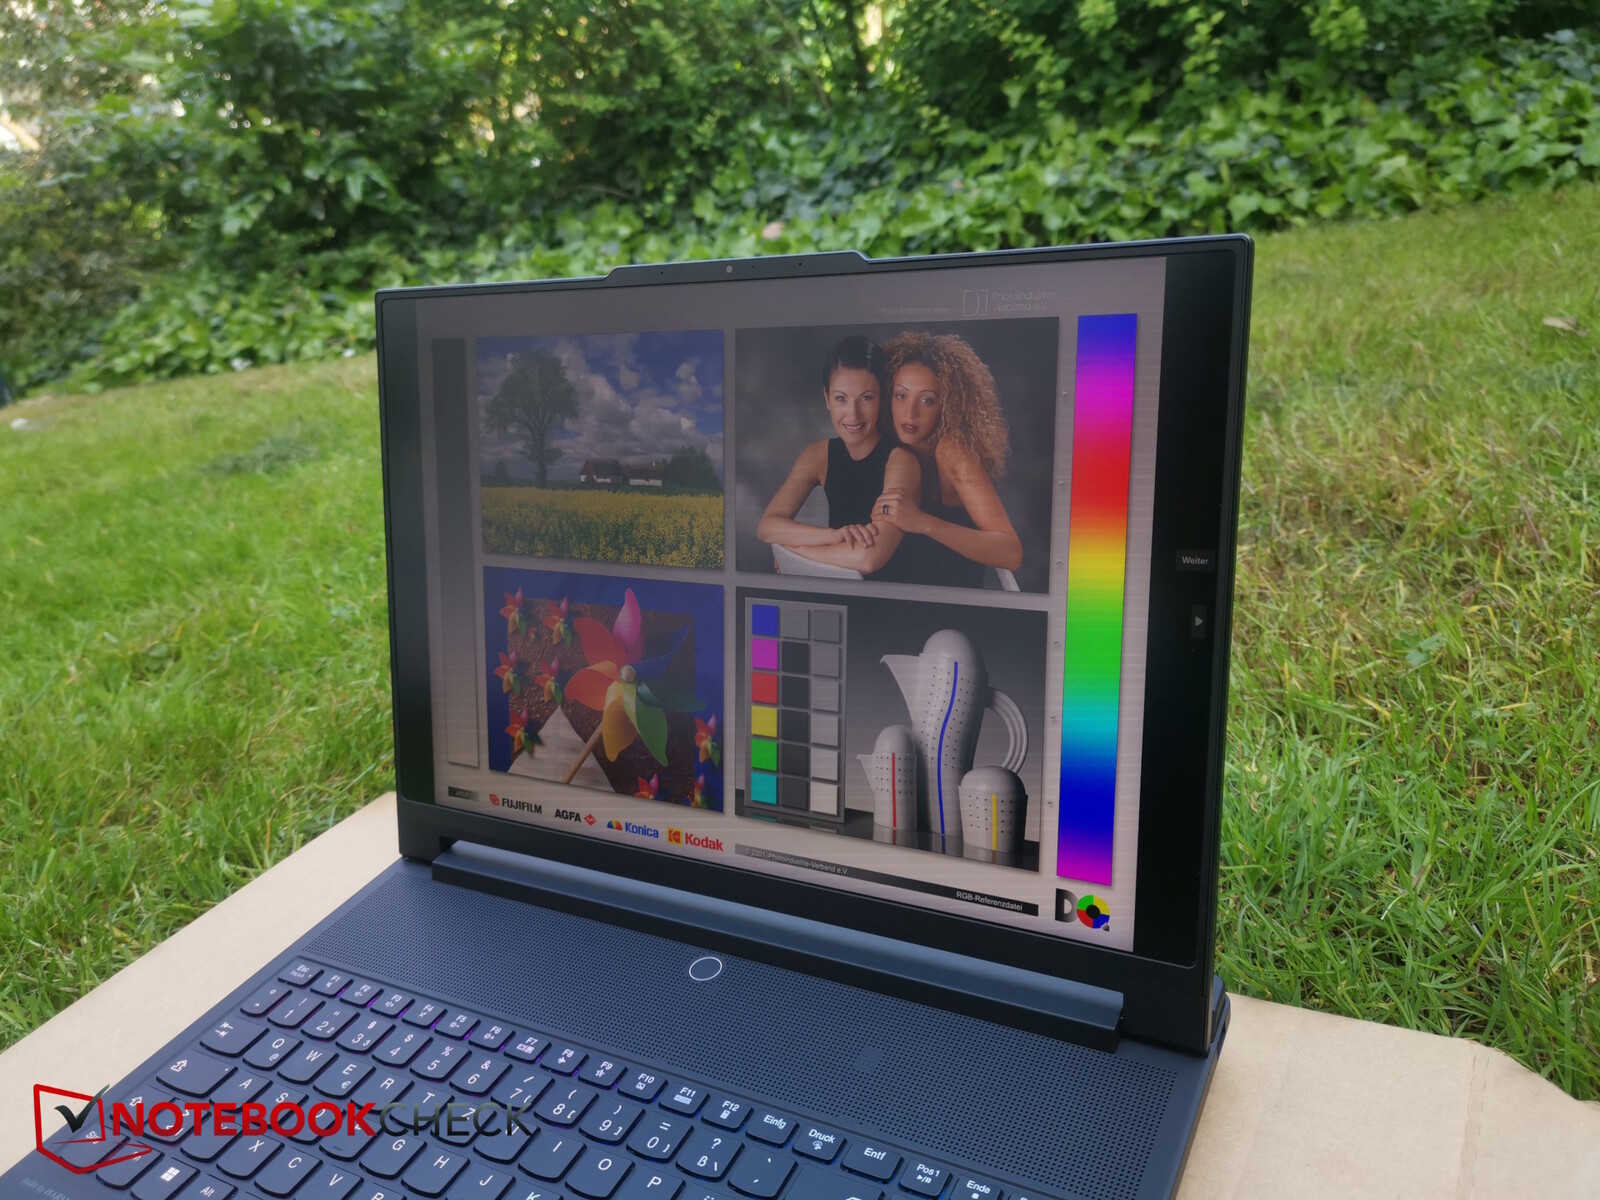
Im Freien ist die Sichtbarkeit dank der hohen Helligkeit und der matten Oberfläche recht gut. Direkte Sonneneinstrahlung gilt es dennoch zu vermeiden.

Leistung - Hoch, aber nicht ohne Probleme
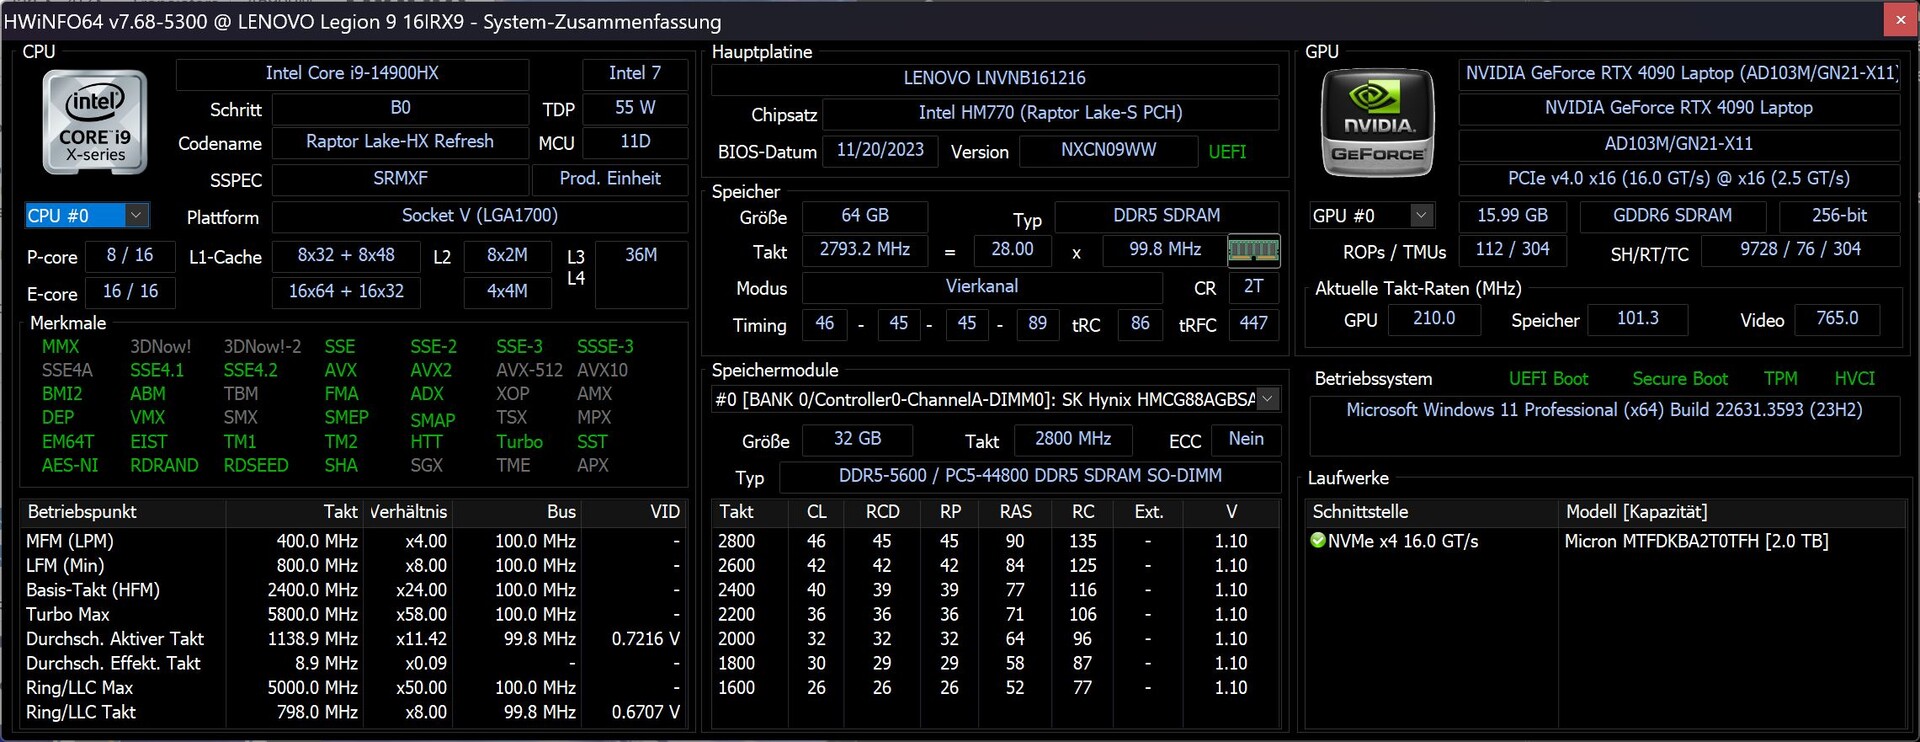
Der neue i9-14900HX in Kombination mit der starken RTX 4090 und 64 GB RAM verorten das Legion 9i eindeutig als High-End-Gamer. Das legt auch das nach hinten ausladende Design nahe, weshalb sich Creators trotz potentiell starker Leistung womöglich bei subtileren Alternativen umschauen.
Testbedingungen
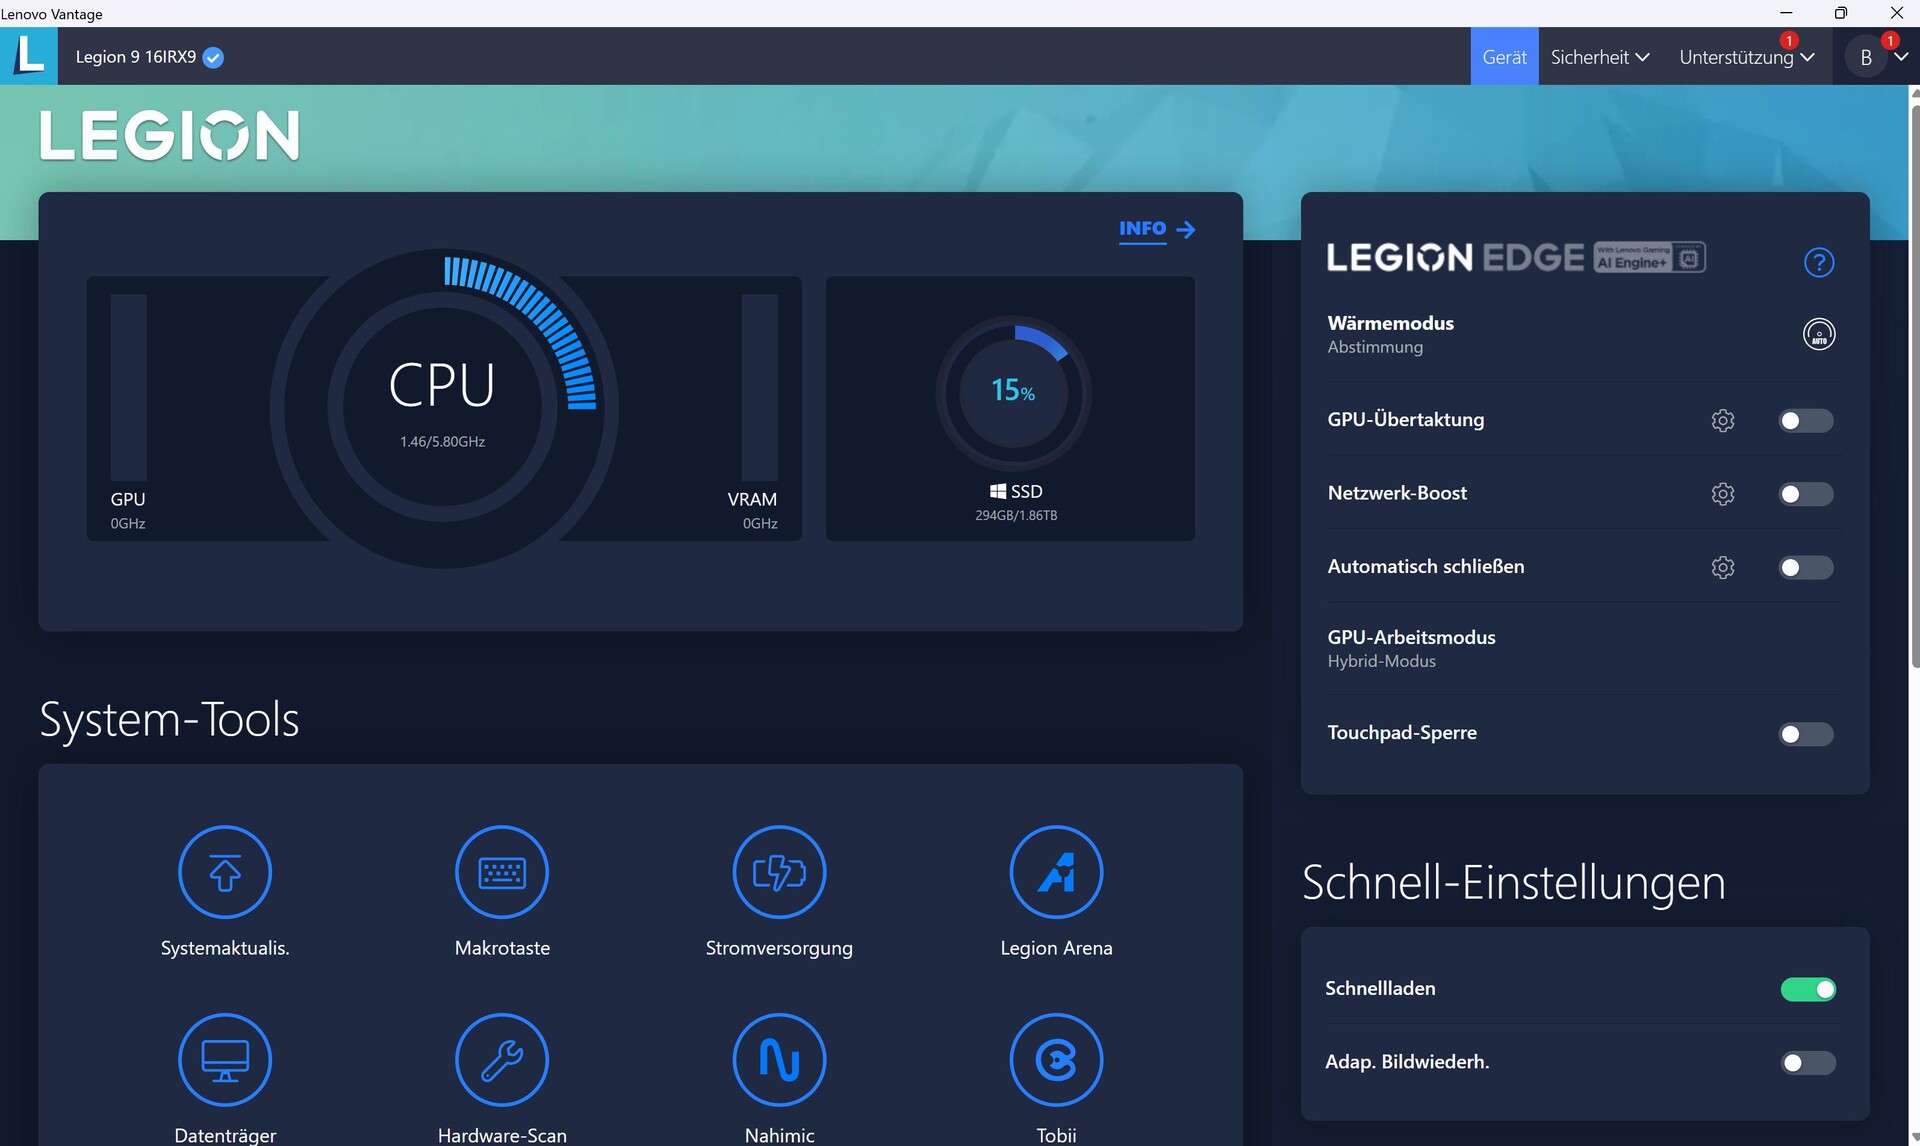
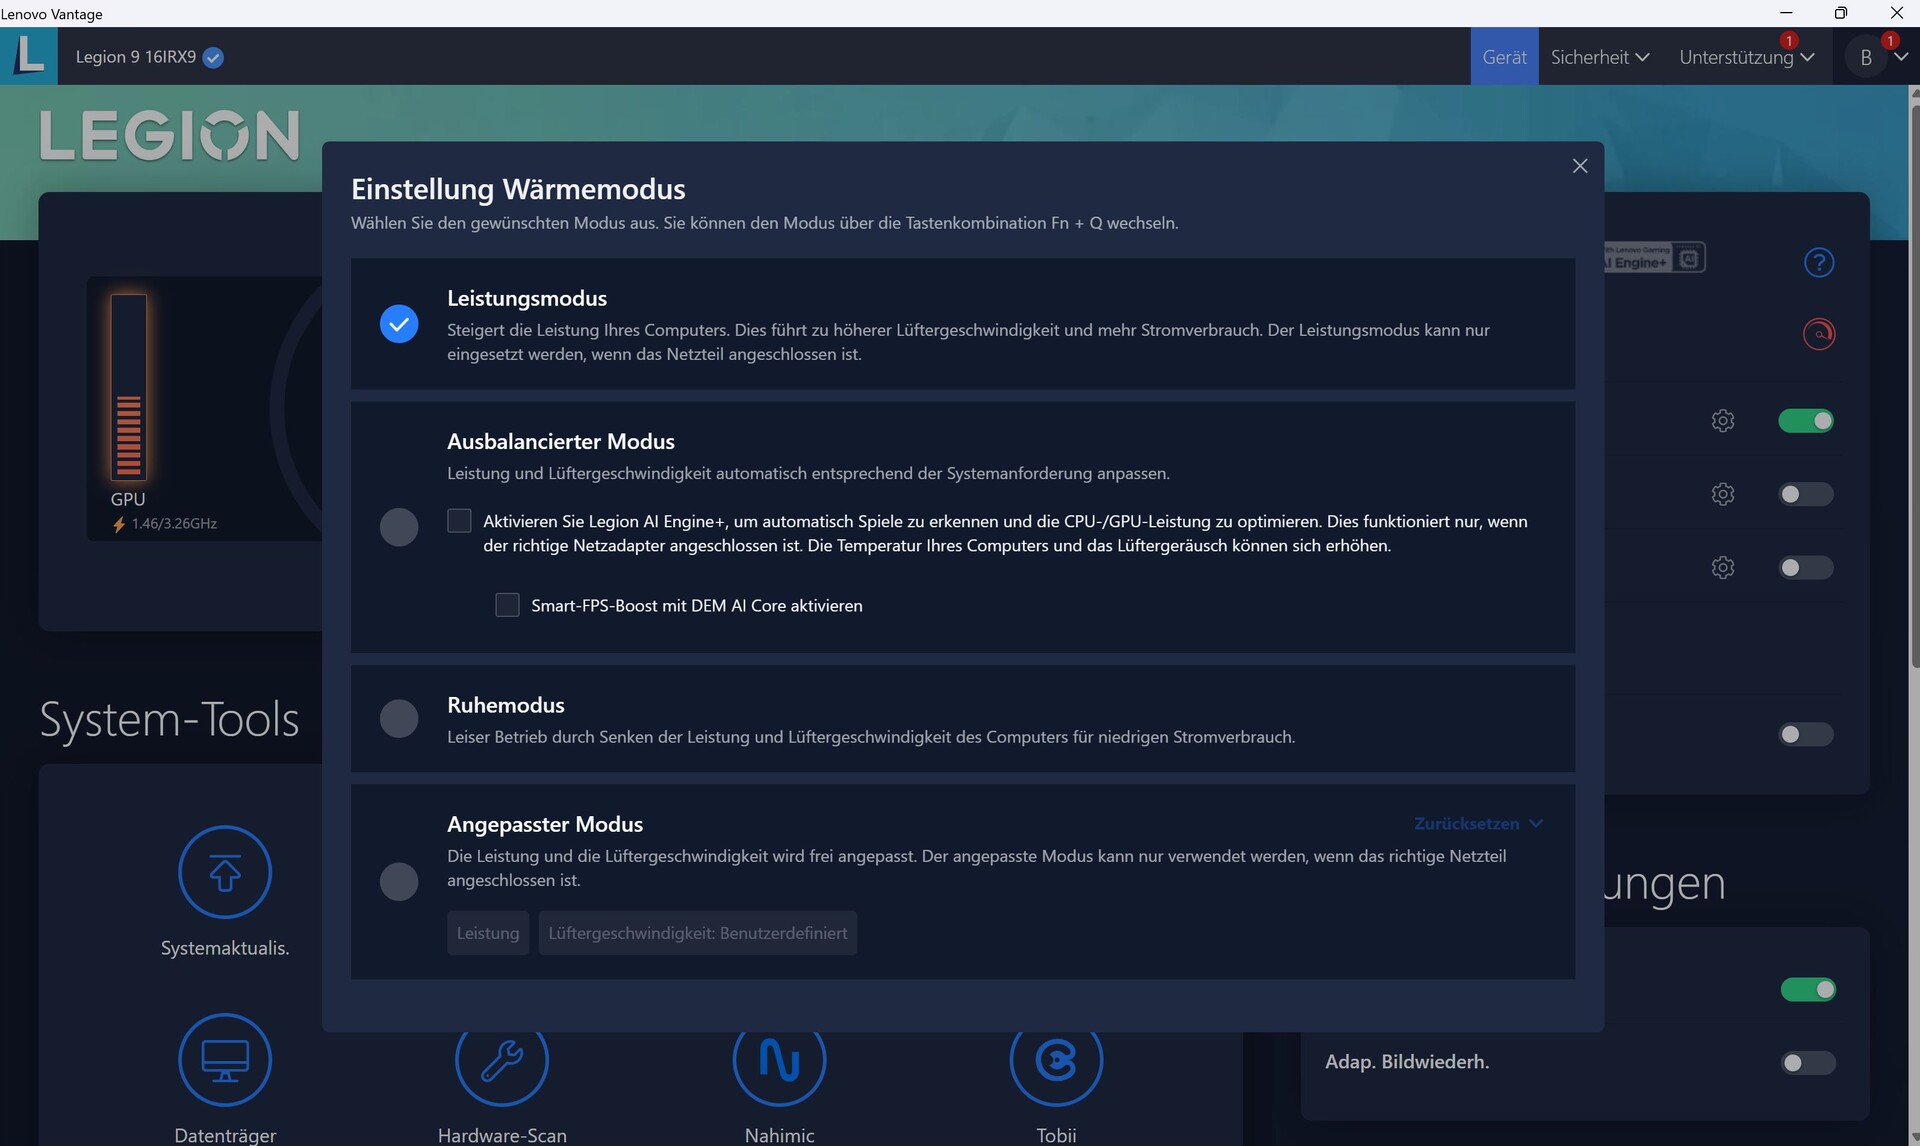
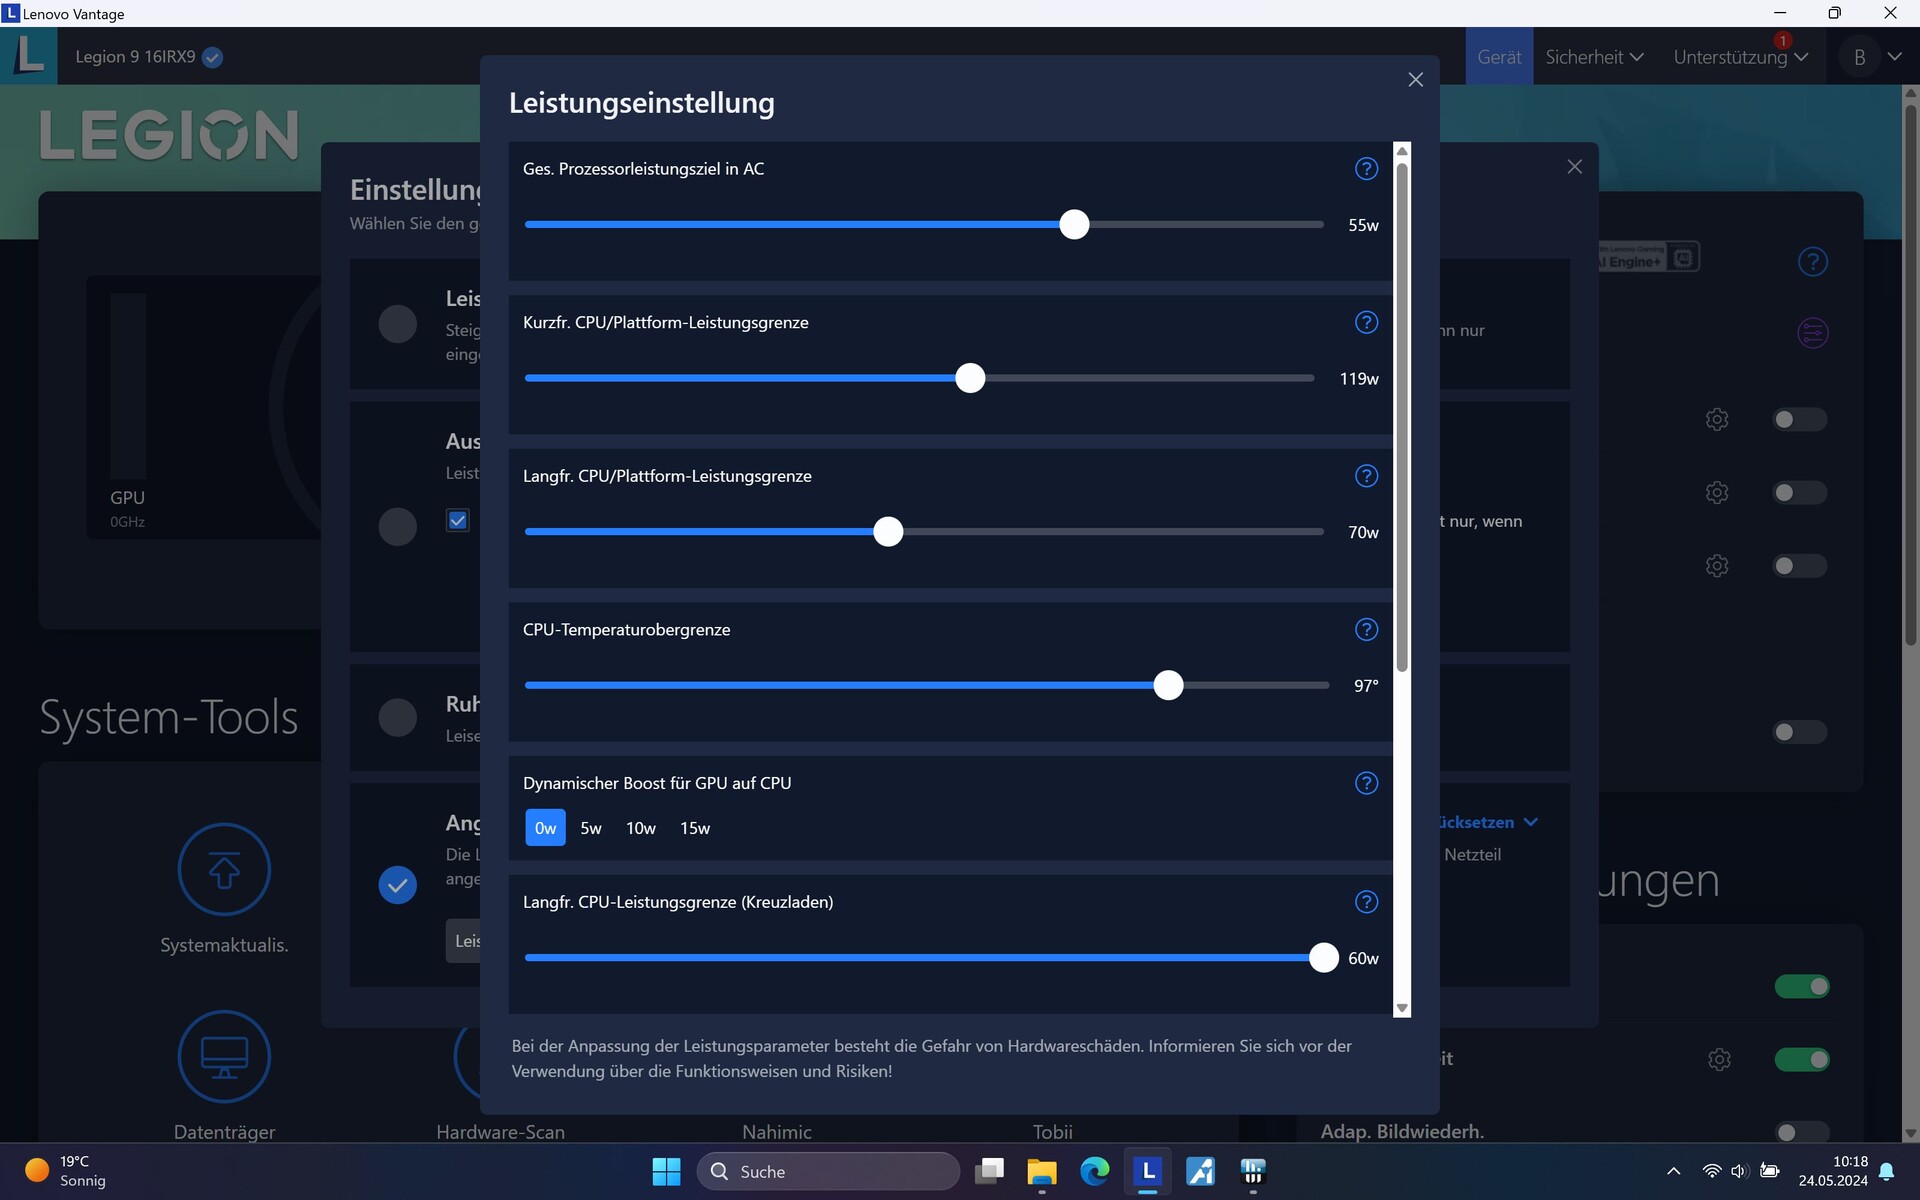
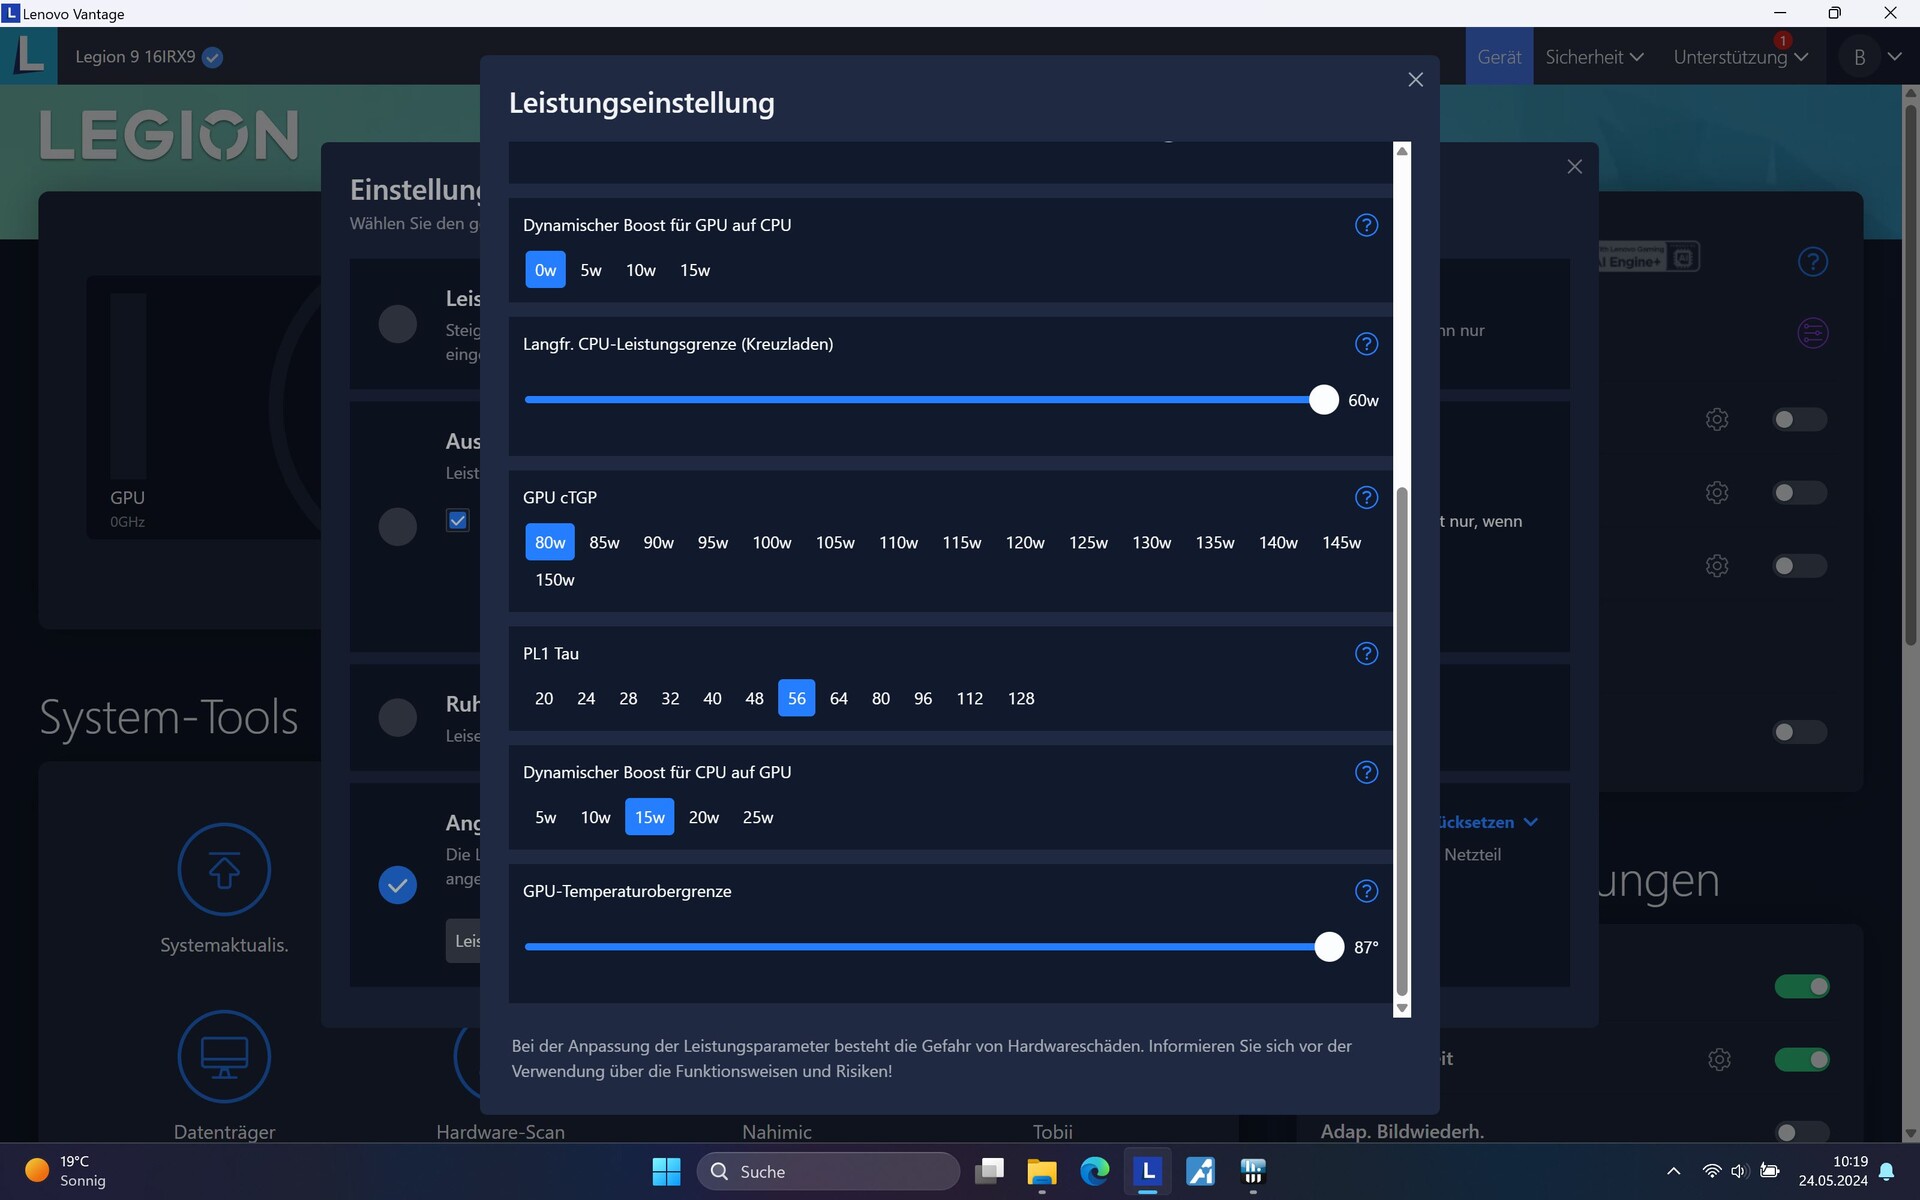
Lenovo Vantage heißt beim Legion 9 das Control Center und beinhaltet u.a. die Leistungsprofile "Leistungsmodus", Ausbalancierter Modus" (hier kann man zusätzlich eine KI zur Optimierung hinzuwählen) und Ruhemodus. Zusätzlich gibt es den "Angepasster Modus", indem man diverse Kennwerte manuell festlegen kann.
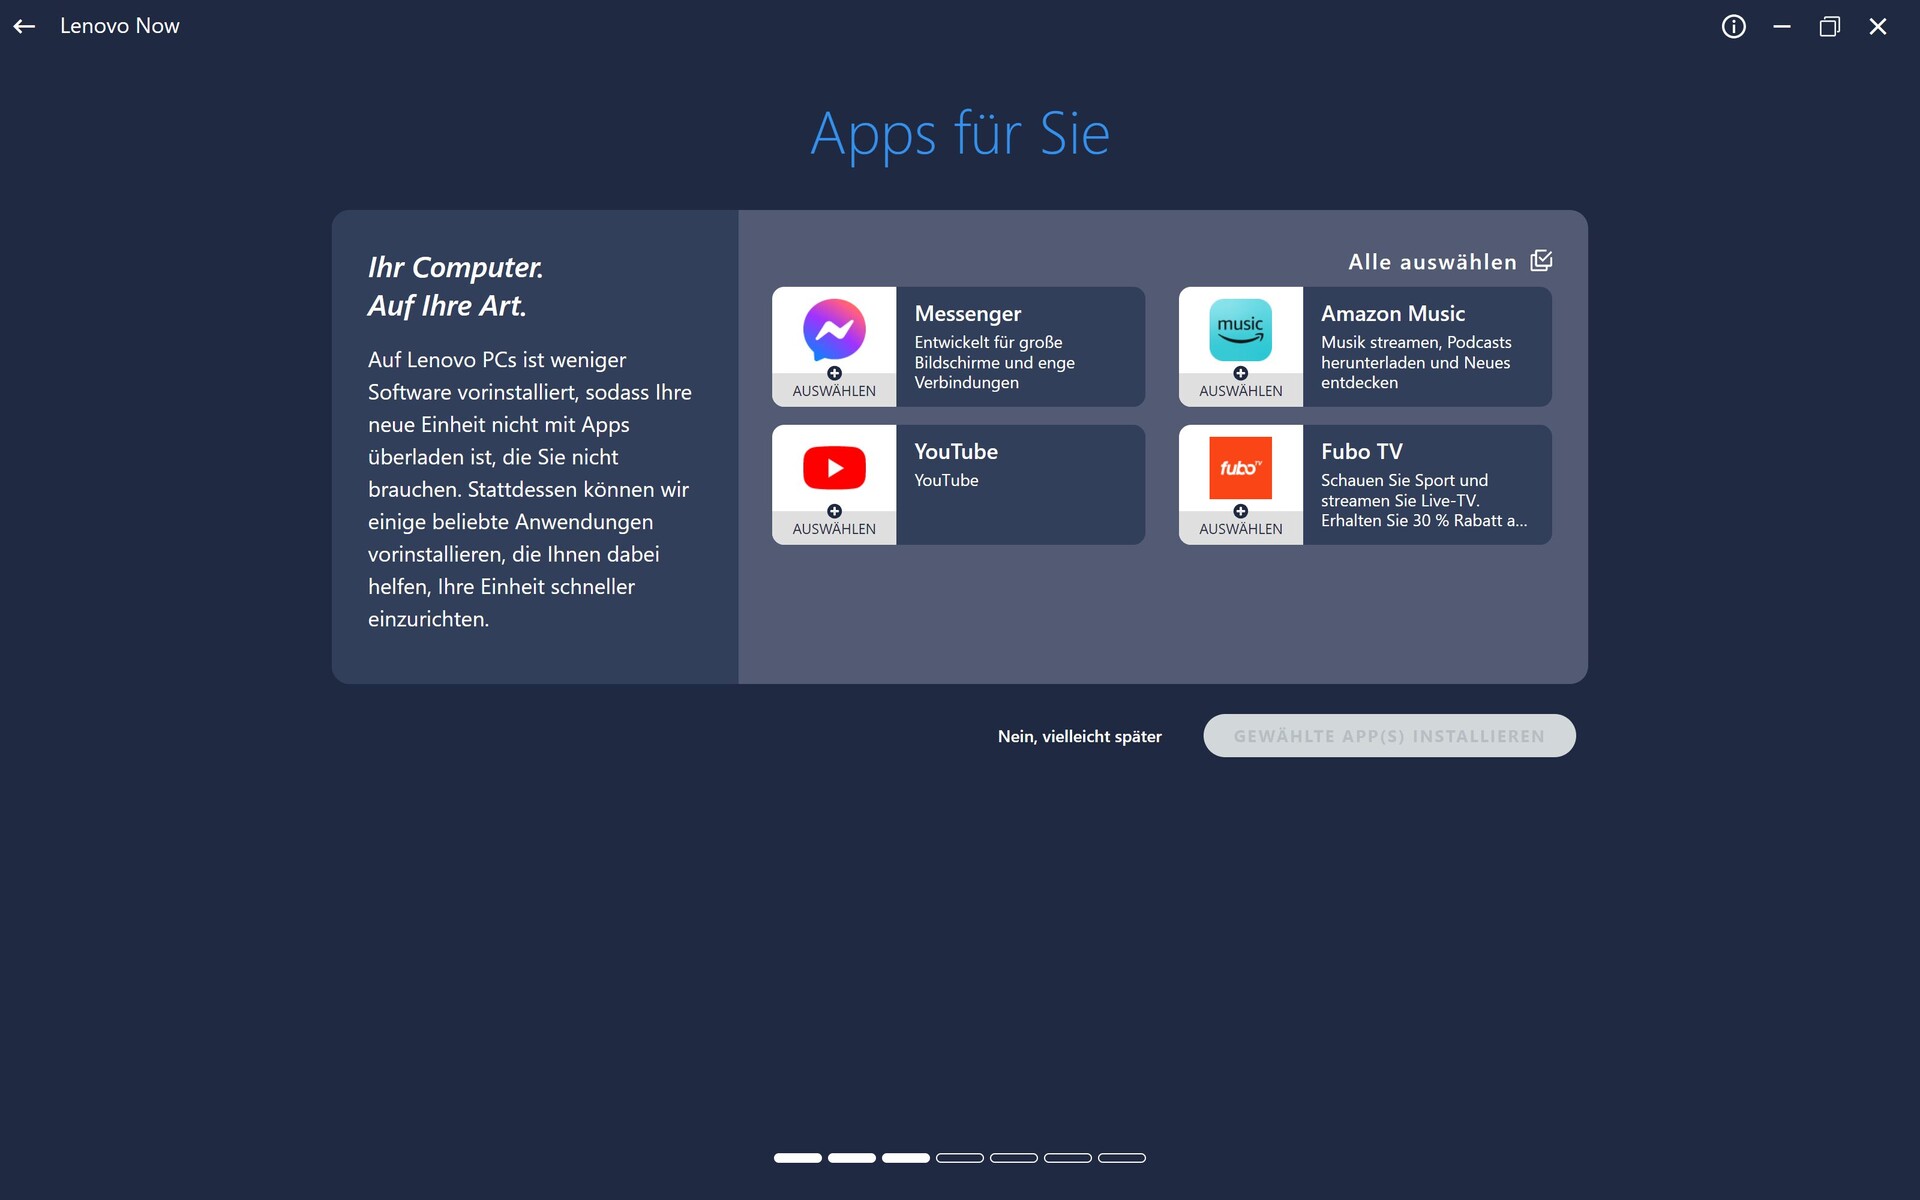
Leider belästigt uns Vantage teils mit Werbung, beispielsweise für Amazon Music, die Apps von YouTube usw. Denn Marketing-Nachrichten sind in Vantage standardmäßig aktiv, man muss sie erst ausstellen, um nicht mehr davon belästigt zu werden.
Wir wählen für unsere Benchmarks den Leistungsmodus, lassen den Schalter zur GPU-Übertaktung jedoch deaktiviert.

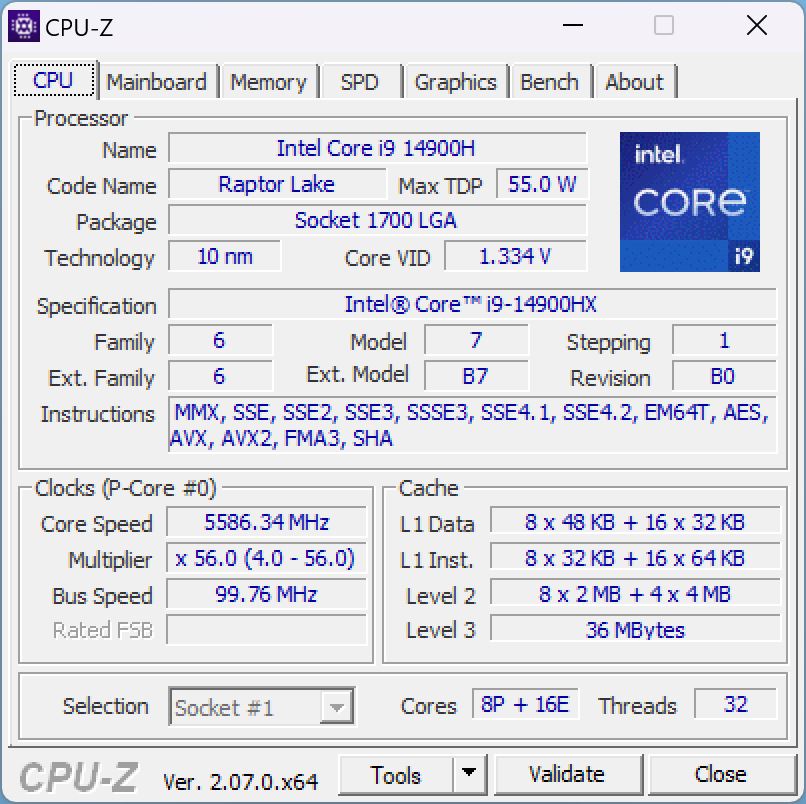
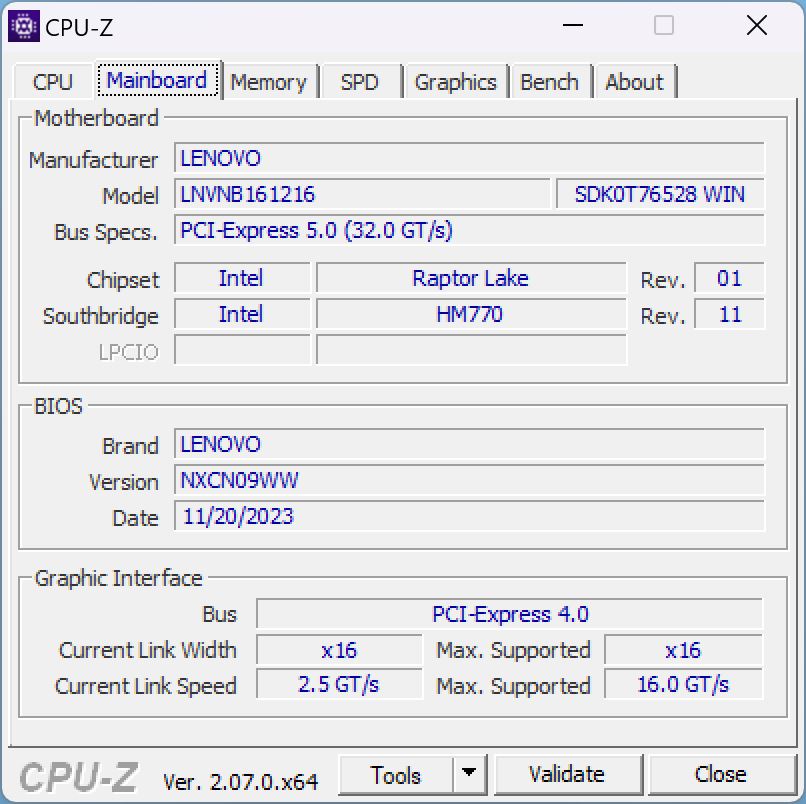
Prozessor
Der i9-14900HX ist eine High-End-CPU der aktuellen Raptor-Lake-Refresh-Serie von Intel. Die 8 P-Kerne takten mit bis zu 5,8 GHz, der Basistakt der 16 E-Kerne liegt bei 1,6 GHz. Zusammen können sie bis zu 32 Threads bearbeiten.
Im Cinebench-R15-Loop hat unser Legion 9i die höchste Ausgangsleistung, anders als die Konkurrenz mit gleicher CPU nimmt die Leistung über die Zeit jedoch kontinuierlich ab, nach einer halben Stunde um etwa 7,5 Prozent. Dann liegt die Leistung auch nur noch knapp oberhalb der des Vorgängers mit i9-13980HX. Aber auch dann gehört die CPU im Legion 9 noch mit zu den schnellsten im Vergleich, obwohl der Leistungssprung zum Vorgänger eher gering ist.
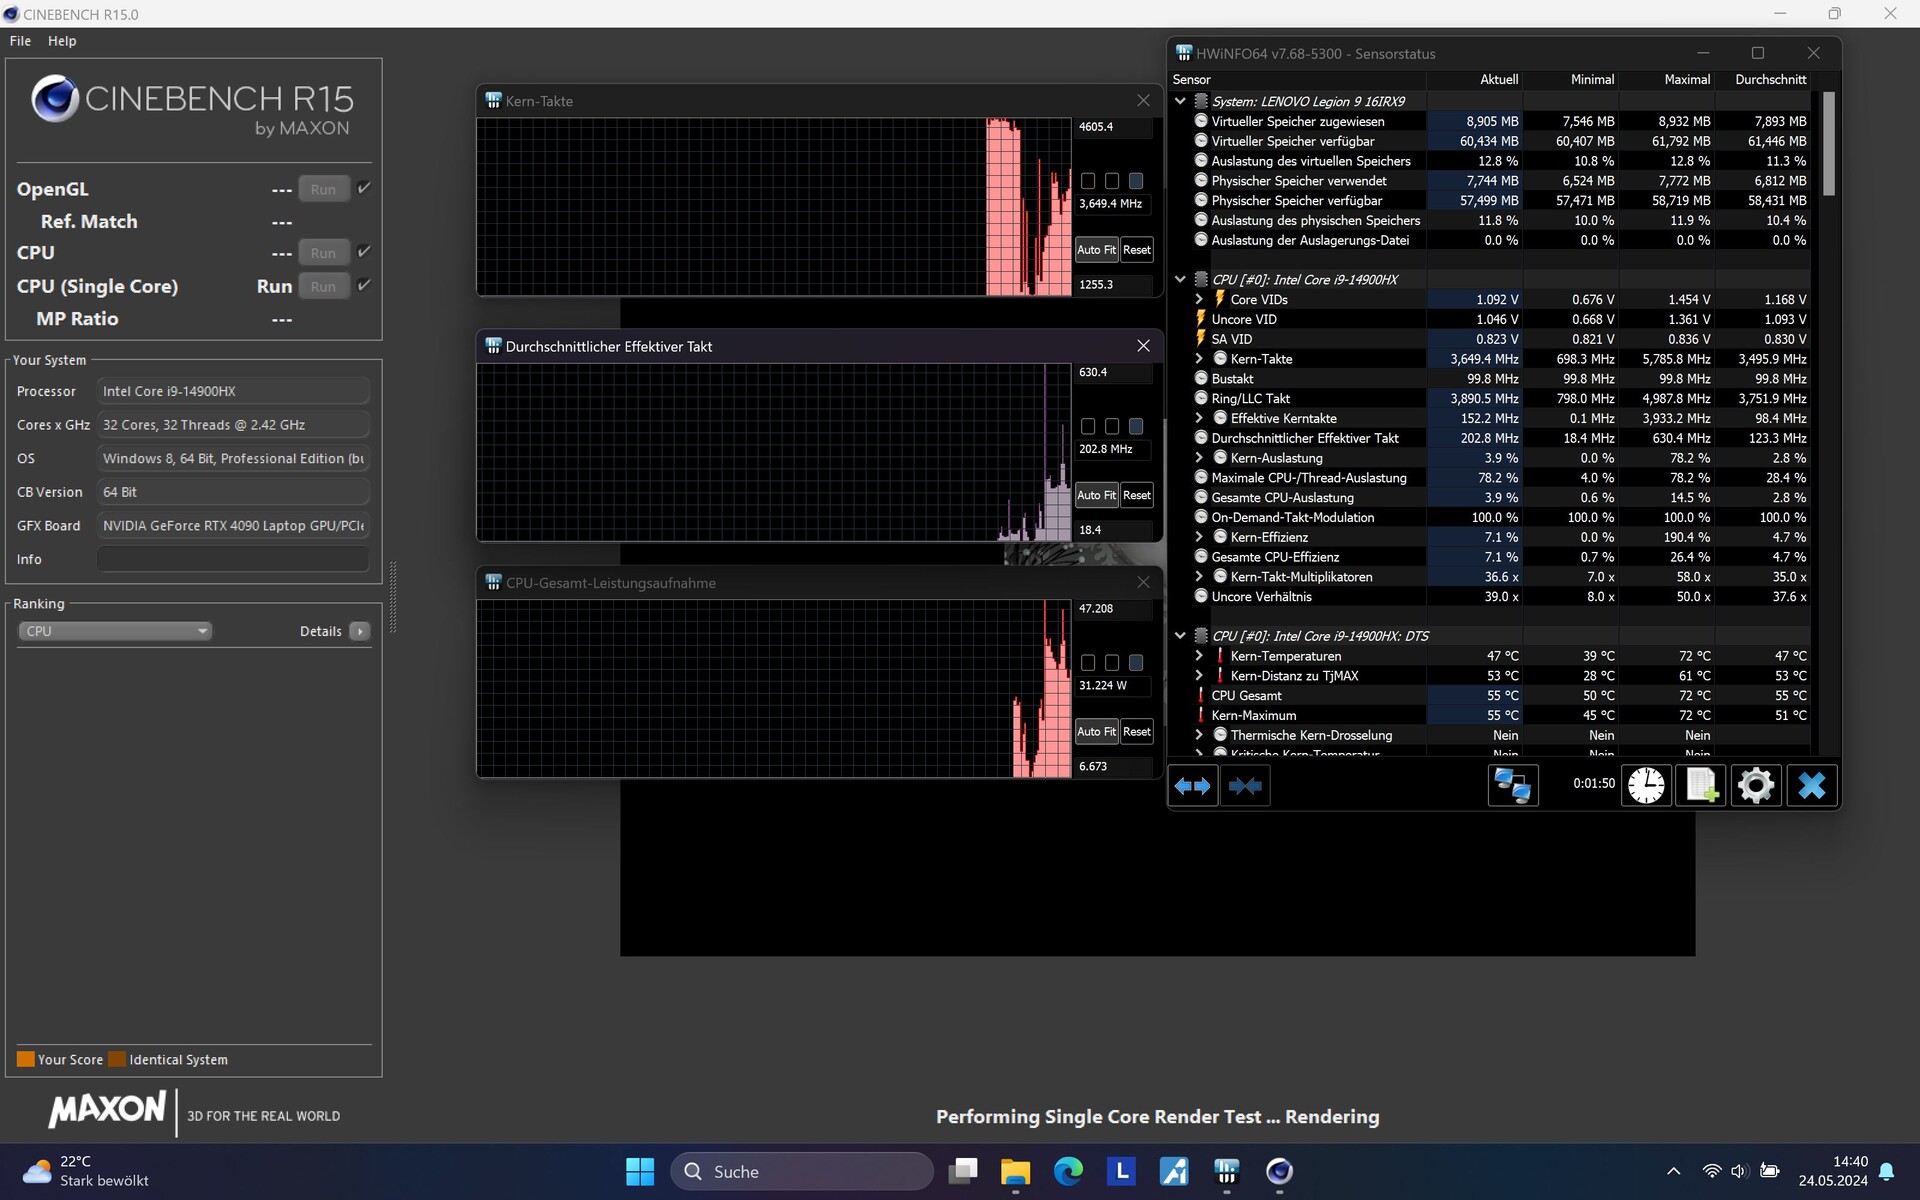
Während die Multi-Thread-Leistung über jeden Zweifel erhaben ist, schwächelt das Legion 9i eindeutig bei der Single-Core-Leistung in allen CPU-Benchmarks. Das ist reproduzierbar, offenbar werden die Single-Core-Leistungsreserven im Leistungsmodus nicht ausgeschöpft, dafür müsste man die Kennzahlen im Angepassten Modus manuell hochdrehen.
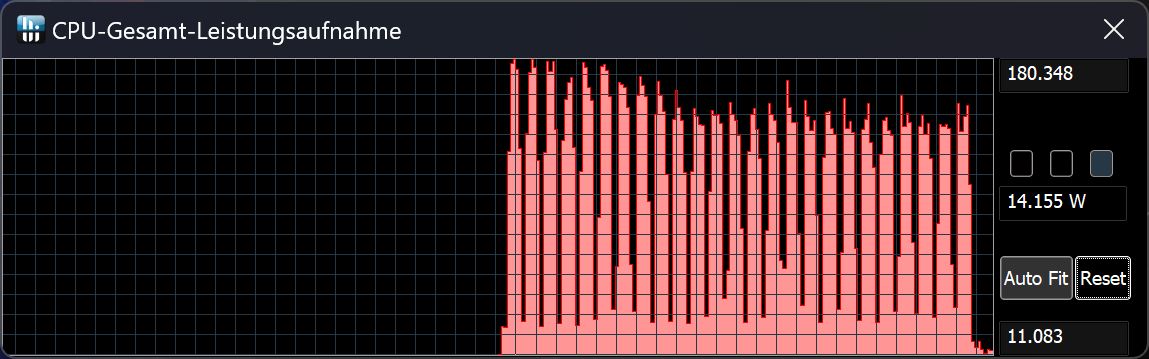
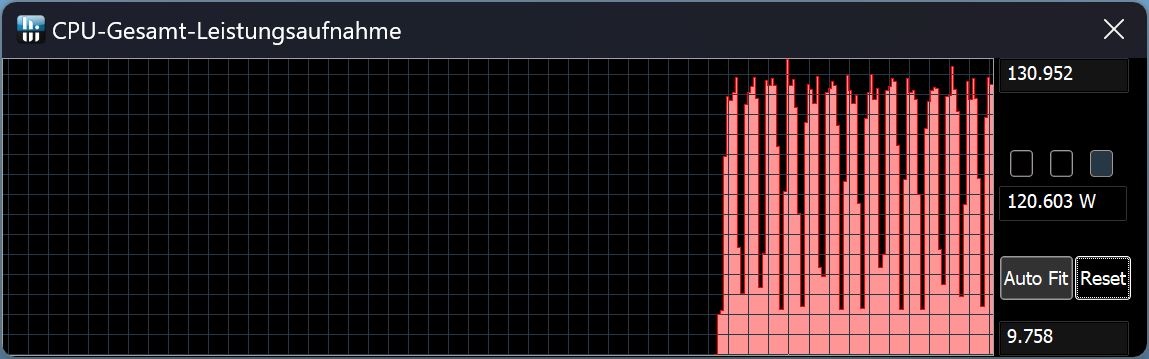
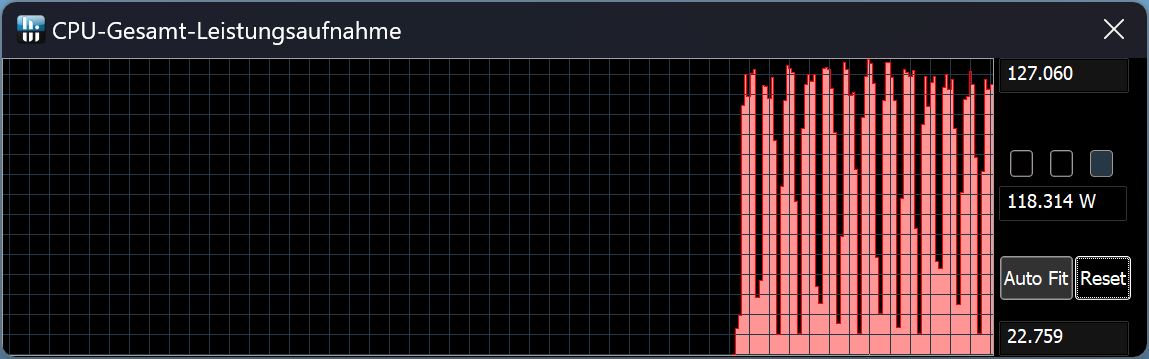
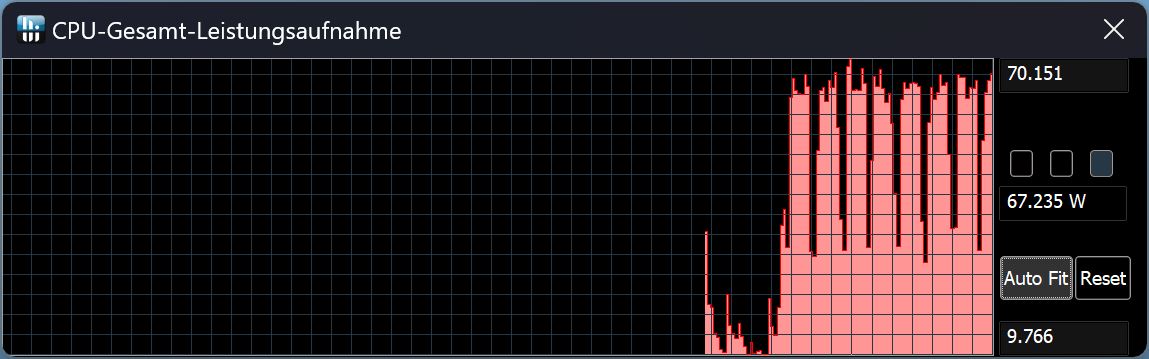
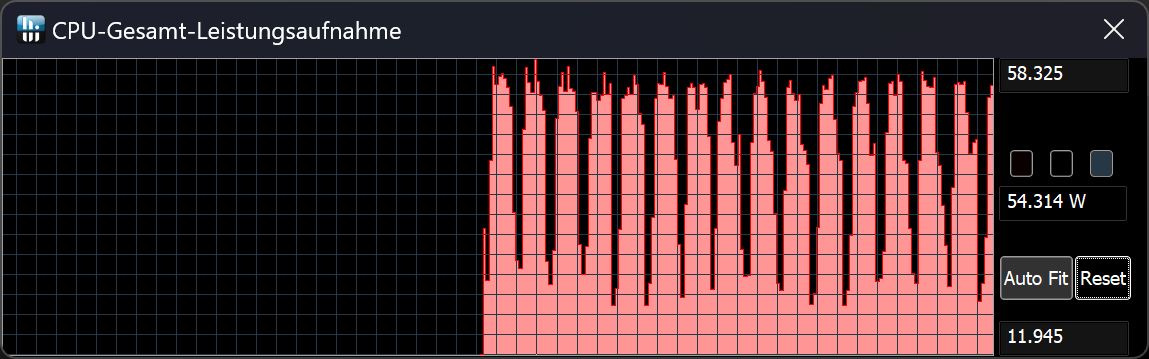
Wir haben uns daher die Kennzahlen angeschaut: Im Cinebench R15 Single Core taktet der Kern zunächst auf 4,6 GHz hoch. Nach ca. 50 Sekunden bricht der Kerntakt kurz auf nur noch 1,2 GHz zusammen und pendelt sich anschließend zwischen 3 und 3,5 GHz ein. Die TDP liegt bei rund 30 W. Bei einem weiteren Versuch war der Einbruch deutlich abgeschwächt.
Zieht man den Stromstecker, so sinkt die Multi-Thread-Leistung im Cinebench R15 um etwa 48,5 Prozent, also beinahe die Hälfte im Vergleich zum Leistungsmodus an der Steckdose!
| Leistungsprofil/Messwert | Cinebench-15-Score im 1. Durchgang | CPU-Leistungsaufnahme in W |
|---|---|---|
| Leistung ohne CPU-Übertaktung | 4.879 | 140 - 180 |
| Ausgeglichen mit KI | 4.115 | 120 - 130 |
| Ausgeglichen ohne KI | 4.091 | 115 - 127 |
| Ruhe | 2.938 | 65 - 70 |
| Akku | 2.516 | 40 - 58 |
Cinebench R15 Multi Dauertest
Cinebench R23: Multi Core | Single Core
Cinebench R20: CPU (Multi Core) | CPU (Single Core)
Cinebench R15: CPU Multi 64Bit | CPU Single 64Bit
Blender: v2.79 BMW27 CPU
7-Zip 18.03: 7z b 4 | 7z b 4 -mmt1
Geekbench 6.5: Multi-Core | Single-Core
Geekbench 5.5: Multi-Core | Single-Core
HWBOT x265 Benchmark v2.2: 4k Preset
LibreOffice : 20 Documents To PDF
R Benchmark 2.5: Overall mean
| CPU Performance Rating | |
| Alienware m18 R2 | |
| Lenovo Legion 9 16IRX8 | |
| Razer Blade 16 2024, RTX 4090 | |
| Asus ROG Strix Scar 18 G834JYR (2024) | |
| Durchschnittliche Intel Core i9-14900HX | |
| Lenovo Legion 9 16IRX9, RTX 4090 | |
| Medion Erazer Beast X40 2024 | |
| Durchschnitt der Klasse Gaming | |
| Cinebench R23 / Multi Core | |
| Lenovo Legion 9 16IRX9, RTX 4090 | |
| Alienware m18 R2 | |
| Lenovo Legion 9 16IRX8 | |
| Razer Blade 16 2024, RTX 4090 | |
| Durchschnittliche Intel Core i9-14900HX (17078 - 36249, n=37) | |
| Asus ROG Strix Scar 18 G834JYR (2024) | |
| Durchschnitt der Klasse Gaming (5668 - 40970, n=136, der letzten 2 Jahre) | |
| Medion Erazer Beast X40 2024 | |
| Cinebench R23 / Single Core | |
| Alienware m18 R2 | |
| Medion Erazer Beast X40 2024 | |
| Asus ROG Strix Scar 18 G834JYR (2024) | |
| Durchschnittliche Intel Core i9-14900HX (1720 - 2245, n=37) | |
| Lenovo Legion 9 16IRX8 | |
| Razer Blade 16 2024, RTX 4090 | |
| Durchschnitt der Klasse Gaming (1136 - 2267, n=136, der letzten 2 Jahre) | |
| Lenovo Legion 9 16IRX9, RTX 4090 | |
| Cinebench R20 / CPU (Multi Core) | |
| Lenovo Legion 9 16IRX9, RTX 4090 | |
| Alienware m18 R2 | |
| Lenovo Legion 9 16IRX8 | |
| Durchschnittliche Intel Core i9-14900HX (6579 - 13832, n=37) | |
| Razer Blade 16 2024, RTX 4090 | |
| Asus ROG Strix Scar 18 G834JYR (2024) | |
| Durchschnitt der Klasse Gaming (2179 - 16108, n=135, der letzten 2 Jahre) | |
| Medion Erazer Beast X40 2024 | |
| Cinebench R20 / CPU (Single Core) | |
| Medion Erazer Beast X40 2024 | |
| Alienware m18 R2 | |
| Asus ROG Strix Scar 18 G834JYR (2024) | |
| Durchschnittliche Intel Core i9-14900HX (657 - 859, n=37) | |
| Razer Blade 16 2024, RTX 4090 | |
| Durchschnitt der Klasse Gaming (439 - 870, n=135, der letzten 2 Jahre) | |
| Lenovo Legion 9 16IRX8 | |
| Lenovo Legion 9 16IRX9, RTX 4090 | |
| Cinebench R15 / CPU Multi 64Bit | |
| Lenovo Legion 9 16IRX9, RTX 4090 | |
| Alienware m18 R2 | |
| Lenovo Legion 9 16IRX8 | |
| Razer Blade 16 2024, RTX 4090 | |
| Durchschnittliche Intel Core i9-14900HX (3263 - 5589, n=38) | |
| Asus ROG Strix Scar 18 G834JYR (2024) | |
| Durchschnitt der Klasse Gaming (1537 - 6271, n=135, der letzten 2 Jahre) | |
| Medion Erazer Beast X40 2024 | |
| Cinebench R15 / CPU Single 64Bit | |
| Alienware m18 R2 | |
| Medion Erazer Beast X40 2024 | |
| Razer Blade 16 2024, RTX 4090 | |
| Durchschnittliche Intel Core i9-14900HX (247 - 323, n=37) | |
| Lenovo Legion 9 16IRX8 | |
| Asus ROG Strix Scar 18 G834JYR (2024) | |
| Durchschnitt der Klasse Gaming (188.8 - 343, n=134, der letzten 2 Jahre) | |
| Lenovo Legion 9 16IRX9, RTX 4090 | |
| Blender / v2.79 BMW27 CPU | |
| Durchschnitt der Klasse Gaming (80 - 517, n=132, der letzten 2 Jahre) | |
| Medion Erazer Beast X40 2024 | |
| Durchschnittliche Intel Core i9-14900HX (91 - 206, n=37) | |
| Asus ROG Strix Scar 18 G834JYR (2024) | |
| Razer Blade 16 2024, RTX 4090 | |
| Lenovo Legion 9 16IRX9, RTX 4090 | |
| Lenovo Legion 9 16IRX8 | |
| Alienware m18 R2 | |
| 7-Zip 18.03 / 7z b 4 | |
| Lenovo Legion 9 16IRX9, RTX 4090 | |
| Alienware m18 R2 | |
| Lenovo Legion 9 16IRX8 | |
| Razer Blade 16 2024, RTX 4090 | |
| Asus ROG Strix Scar 18 G834JYR (2024) | |
| Durchschnittliche Intel Core i9-14900HX (66769 - 136645, n=37) | |
| Medion Erazer Beast X40 2024 | |
| Durchschnitt der Klasse Gaming (23795 - 148086, n=133, der letzten 2 Jahre) | |
| 7-Zip 18.03 / 7z b 4 -mmt1 | |
| Medion Erazer Beast X40 2024 | |
| Asus ROG Strix Scar 18 G834JYR (2024) | |
| Alienware m18 R2 | |
| Durchschnittliche Intel Core i9-14900HX (5452 - 7545, n=37) | |
| Razer Blade 16 2024, RTX 4090 | |
| Lenovo Legion 9 16IRX8 | |
| Durchschnitt der Klasse Gaming (4199 - 7508, n=133, der letzten 2 Jahre) | |
| Lenovo Legion 9 16IRX9, RTX 4090 | |
| Geekbench 6.5 / Multi-Core | |
| Alienware m18 R2 | |
| Asus ROG Strix Scar 18 G834JYR (2024) | |
| Razer Blade 16 2024, RTX 4090 | |
| Lenovo Legion 9 16IRX9, RTX 4090 | |
| Lenovo Legion 9 16IRX8 | |
| Durchschnittliche Intel Core i9-14900HX (13158 - 19665, n=37) | |
| Medion Erazer Beast X40 2024 | |
| Durchschnitt der Klasse Gaming (5340 - 22104, n=134, der letzten 2 Jahre) | |
| Geekbench 6.5 / Single-Core | |
| Medion Erazer Beast X40 2024 | |
| Alienware m18 R2 | |
| Asus ROG Strix Scar 18 G834JYR (2024) | |
| Durchschnittliche Intel Core i9-14900HX (2419 - 3129, n=37) | |
| Razer Blade 16 2024, RTX 4090 | |
| Lenovo Legion 9 16IRX8 | |
| Durchschnitt der Klasse Gaming (1490 - 3259, n=134, der letzten 2 Jahre) | |
| Lenovo Legion 9 16IRX9, RTX 4090 | |
| Geekbench 5.5 / Multi-Core | |
| Lenovo Legion 9 16IRX9, RTX 4090 | |
| Alienware m18 R2 | |
| Lenovo Legion 9 16IRX8 | |
| Asus ROG Strix Scar 18 G834JYR (2024) | |
| Durchschnittliche Intel Core i9-14900HX (8618 - 23194, n=37) | |
| Razer Blade 16 2024, RTX 4090 | |
| Medion Erazer Beast X40 2024 | |
| Durchschnitt der Klasse Gaming (4557 - 27010, n=133, der letzten 2 Jahre) | |
| Geekbench 5.5 / Single-Core | |
| Alienware m18 R2 | |
| Medion Erazer Beast X40 2024 | |
| Lenovo Legion 9 16IRX8 | |
| Razer Blade 16 2024, RTX 4090 | |
| Asus ROG Strix Scar 18 G834JYR (2024) | |
| Durchschnittliche Intel Core i9-14900HX (1669 - 2210, n=37) | |
| Durchschnitt der Klasse Gaming (986 - 2474, n=133, der letzten 2 Jahre) | |
| Lenovo Legion 9 16IRX9, RTX 4090 | |
| HWBOT x265 Benchmark v2.2 / 4k Preset | |
| Alienware m18 R2 | |
| Lenovo Legion 9 16IRX8 | |
| Lenovo Legion 9 16IRX9, RTX 4090 | |
| Razer Blade 16 2024, RTX 4090 | |
| Durchschnittliche Intel Core i9-14900HX (16.8 - 38.9, n=37) | |
| Asus ROG Strix Scar 18 G834JYR (2024) | |
| Durchschnitt der Klasse Gaming (7.7 - 44.3, n=133, der letzten 2 Jahre) | |
| Medion Erazer Beast X40 2024 | |
| LibreOffice / 20 Documents To PDF | |
| Lenovo Legion 9 16IRX9, RTX 4090 | |
| Durchschnitt der Klasse Gaming (19 - 88.8, n=133, der letzten 2 Jahre) | |
| Razer Blade 16 2024, RTX 4090 | |
| Alienware m18 R2 | |
| Asus ROG Strix Scar 18 G834JYR (2024) | |
| Medion Erazer Beast X40 2024 | |
| Durchschnittliche Intel Core i9-14900HX (19 - 85.1, n=37) | |
| Lenovo Legion 9 16IRX8 | |
| R Benchmark 2.5 / Overall mean | |
| Lenovo Legion 9 16IRX9, RTX 4090 | |
| Durchschnitt der Klasse Gaming (0.3439 - 0.759, n=134, der letzten 2 Jahre) | |
| Asus ROG Strix Scar 18 G834JYR (2024) | |
| Durchschnittliche Intel Core i9-14900HX (0.3604 - 0.4859, n=37) | |
| Lenovo Legion 9 16IRX8 | |
| Razer Blade 16 2024, RTX 4090 | |
| Alienware m18 R2 | |
| Medion Erazer Beast X40 2024 | |
* ... kleinere Werte sind besser
AIDA64: FP32 Ray-Trace | FPU Julia | CPU SHA3 | CPU Queen | FPU SinJulia | FPU Mandel | CPU AES | CPU ZLib | FP64 Ray-Trace | CPU PhotoWorxx
| Performance Rating | |
| Alienware m18 R2 | |
| Lenovo Legion 9 16IRX9, RTX 4090 | |
| Lenovo Legion 9 16IRX8 | |
| Razer Blade 16 2024, RTX 4090 | |
| Asus ROG Strix Scar 18 G834JYR (2024) | |
| Durchschnittliche Intel Core i9-14900HX | |
| Durchschnitt der Klasse Gaming | |
| Medion Erazer Beast X40 2024 | |
| AIDA64 / FP32 Ray-Trace | |
| Alienware m18 R2 | |
| Durchschnitt der Klasse Gaming (7192 - 85542, n=133, der letzten 2 Jahre) | |
| Lenovo Legion 9 16IRX9, RTX 4090 | |
| Lenovo Legion 9 16IRX8 | |
| Razer Blade 16 2024, RTX 4090 | |
| Asus ROG Strix Scar 18 G834JYR (2024) | |
| Durchschnittliche Intel Core i9-14900HX (13098 - 33474, n=36) | |
| Medion Erazer Beast X40 2024 | |
| AIDA64 / FPU Julia | |
| Alienware m18 R2 | |
| Lenovo Legion 9 16IRX9, RTX 4090 | |
| Lenovo Legion 9 16IRX8 | |
| Durchschnitt der Klasse Gaming (35040 - 238426, n=133, der letzten 2 Jahre) | |
| Asus ROG Strix Scar 18 G834JYR (2024) | |
| Razer Blade 16 2024, RTX 4090 | |
| Durchschnittliche Intel Core i9-14900HX (67573 - 166040, n=36) | |
| Medion Erazer Beast X40 2024 | |
| AIDA64 / CPU SHA3 | |
| Alienware m18 R2 | |
| Lenovo Legion 9 16IRX9, RTX 4090 | |
| Lenovo Legion 9 16IRX8 | |
| Asus ROG Strix Scar 18 G834JYR (2024) | |
| Razer Blade 16 2024, RTX 4090 | |
| Durchschnittliche Intel Core i9-14900HX (3589 - 7979, n=36) | |
| Durchschnitt der Klasse Gaming (1728 - 9817, n=133, der letzten 2 Jahre) | |
| Medion Erazer Beast X40 2024 | |
| AIDA64 / CPU Queen | |
| Asus ROG Strix Scar 18 G834JYR (2024) | |
| Alienware m18 R2 | |
| Razer Blade 16 2024, RTX 4090 | |
| Durchschnittliche Intel Core i9-14900HX (118405 - 148966, n=36) | |
| Lenovo Legion 9 16IRX8 | |
| Medion Erazer Beast X40 2024 | |
| Lenovo Legion 9 16IRX9, RTX 4090 | |
| Durchschnitt der Klasse Gaming (49785 - 173351, n=133, der letzten 2 Jahre) | |
| AIDA64 / FPU SinJulia | |
| Alienware m18 R2 | |
| Lenovo Legion 9 16IRX9, RTX 4090 | |
| Asus ROG Strix Scar 18 G834JYR (2024) | |
| Razer Blade 16 2024, RTX 4090 | |
| Lenovo Legion 9 16IRX8 | |
| Durchschnittliche Intel Core i9-14900HX (10475 - 18517, n=36) | |
| Durchschnitt der Klasse Gaming (4424 - 33636, n=133, der letzten 2 Jahre) | |
| Medion Erazer Beast X40 2024 | |
| AIDA64 / FPU Mandel | |
| Alienware m18 R2 | |
| Lenovo Legion 9 16IRX9, RTX 4090 | |
| Lenovo Legion 9 16IRX8 | |
| Durchschnitt der Klasse Gaming (17585 - 128721, n=133, der letzten 2 Jahre) | |
| Razer Blade 16 2024, RTX 4090 | |
| Asus ROG Strix Scar 18 G834JYR (2024) | |
| Durchschnittliche Intel Core i9-14900HX (32543 - 83662, n=36) | |
| Medion Erazer Beast X40 2024 | |
| AIDA64 / CPU AES | |
| Durchschnittliche Intel Core i9-14900HX (86964 - 241777, n=36) | |
| Alienware m18 R2 | |
| Lenovo Legion 9 16IRX9, RTX 4090 | |
| Lenovo Legion 9 16IRX8 | |
| Razer Blade 16 2024, RTX 4090 | |
| Asus ROG Strix Scar 18 G834JYR (2024) | |
| Durchschnitt der Klasse Gaming (19065 - 247074, n=133, der letzten 2 Jahre) | |
| Medion Erazer Beast X40 2024 | |
| AIDA64 / CPU ZLib | |
| Alienware m18 R2 | |
| Lenovo Legion 9 16IRX9, RTX 4090 | |
| Lenovo Legion 9 16IRX8 | |
| Razer Blade 16 2024, RTX 4090 | |
| Durchschnittliche Intel Core i9-14900HX (1054 - 2292, n=36) | |
| Asus ROG Strix Scar 18 G834JYR (2024) | |
| Durchschnitt der Klasse Gaming (373 - 2531, n=133, der letzten 2 Jahre) | |
| Medion Erazer Beast X40 2024 | |
| AIDA64 / FP64 Ray-Trace | |
| Alienware m18 R2 | |
| Durchschnitt der Klasse Gaming (3856 - 45446, n=133, der letzten 2 Jahre) | |
| Lenovo Legion 9 16IRX8 | |
| Lenovo Legion 9 16IRX9, RTX 4090 | |
| Razer Blade 16 2024, RTX 4090 | |
| Asus ROG Strix Scar 18 G834JYR (2024) | |
| Durchschnittliche Intel Core i9-14900HX (6809 - 18349, n=36) | |
| Medion Erazer Beast X40 2024 | |
| AIDA64 / CPU PhotoWorxx | |
| Lenovo Legion 9 16IRX9, RTX 4090 | |
| Lenovo Legion 9 16IRX8 | |
| Alienware m18 R2 | |
| Asus ROG Strix Scar 18 G834JYR (2024) | |
| Razer Blade 16 2024, RTX 4090 | |
| Medion Erazer Beast X40 2024 | |
| Durchschnittliche Intel Core i9-14900HX (23903 - 54702, n=36) | |
| Durchschnitt der Klasse Gaming (10805 - 62916, n=133, der letzten 2 Jahre) | |
System Performance
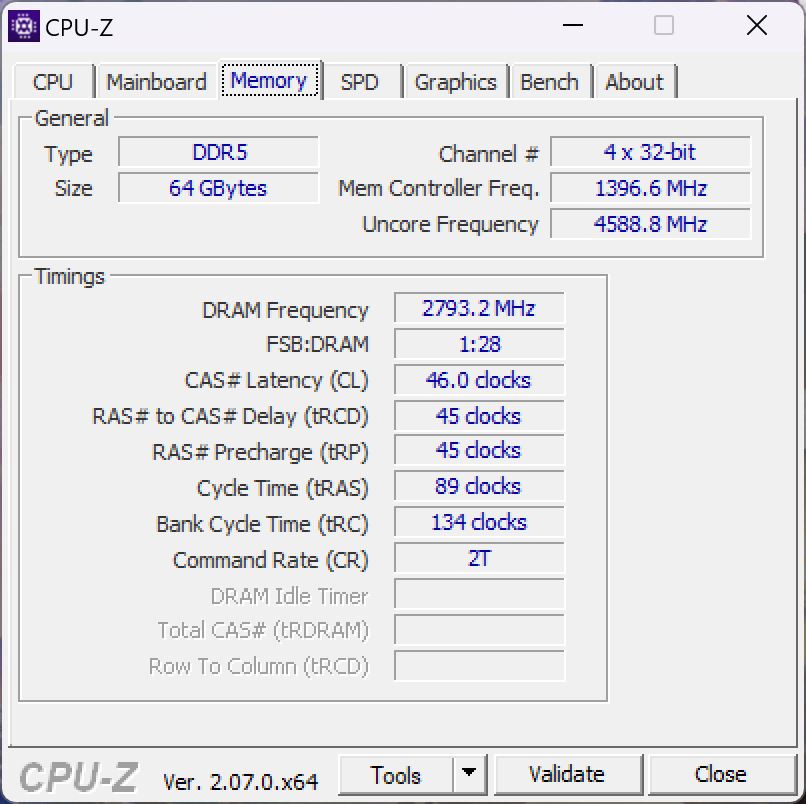
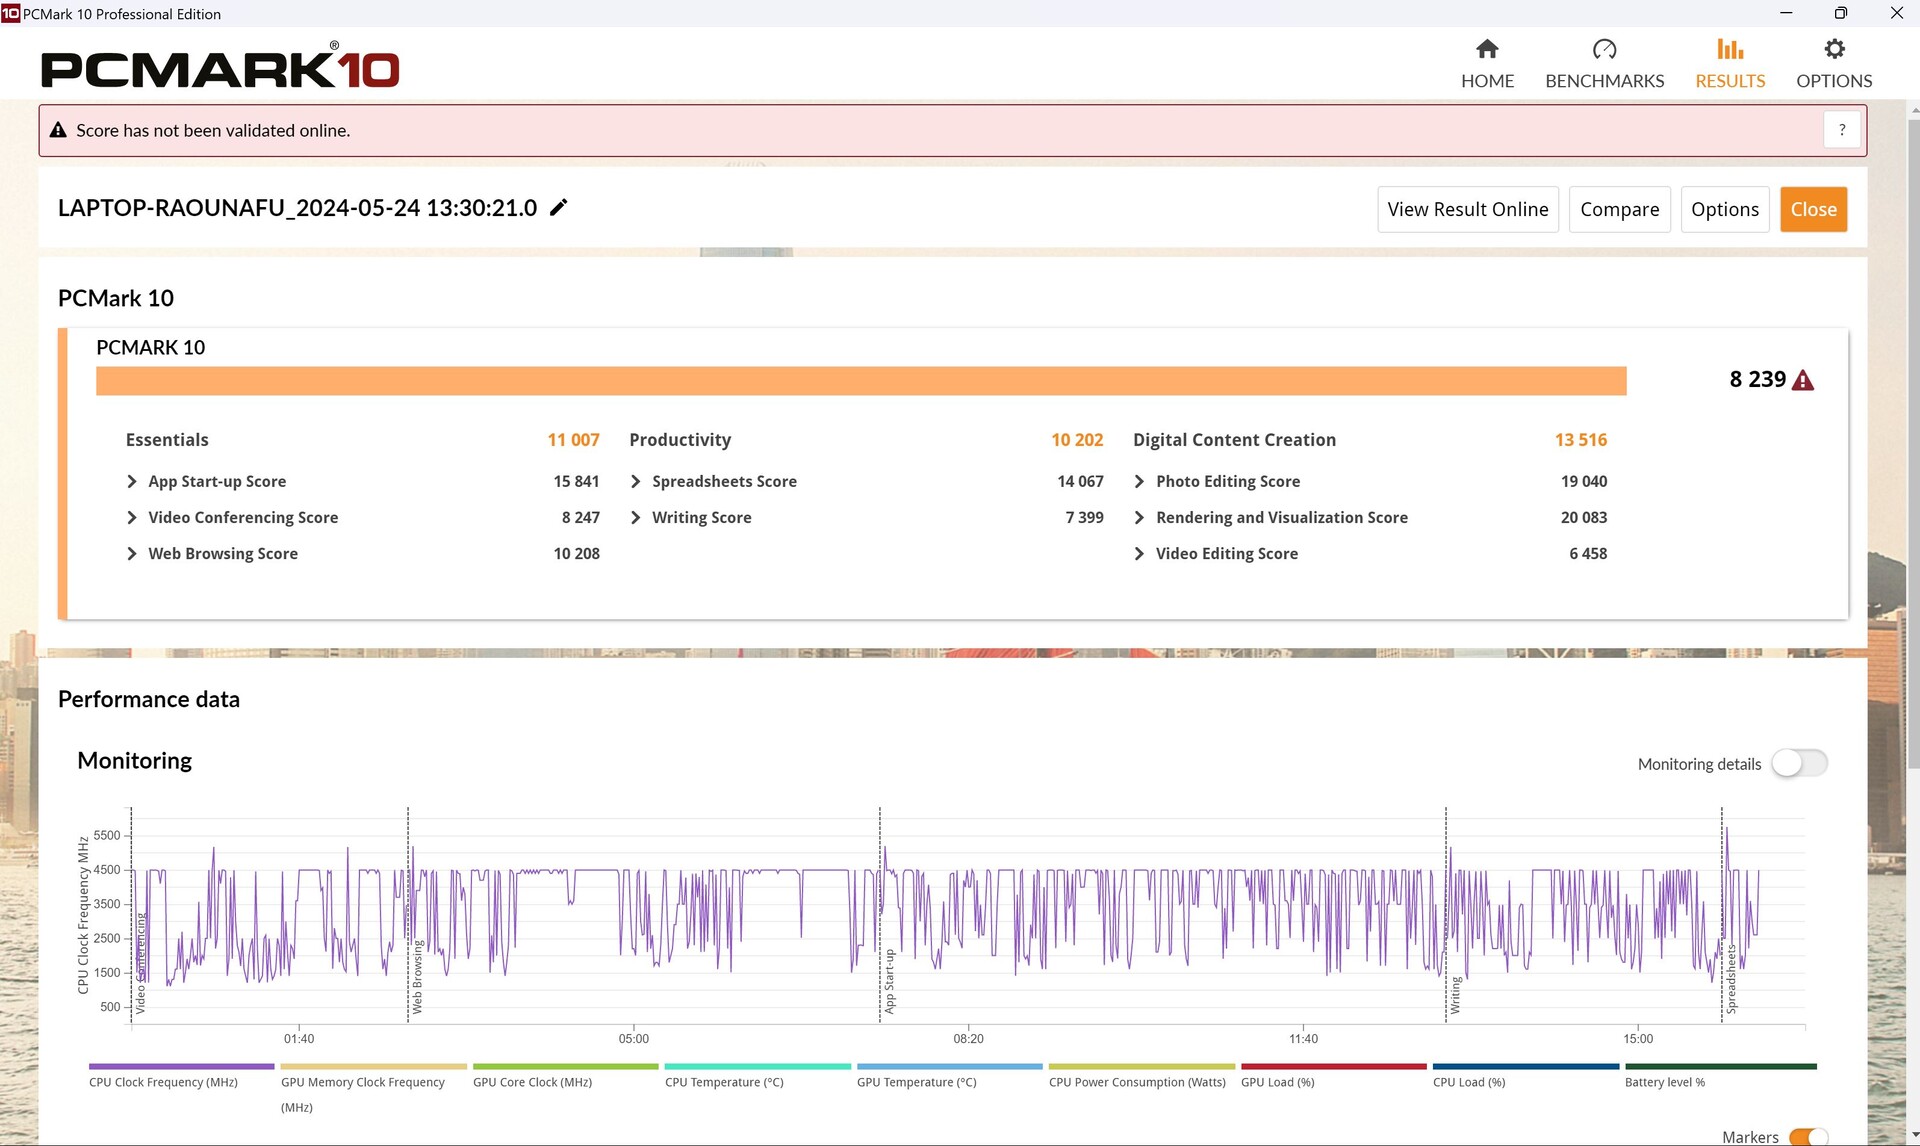
Die Leistung im PCMark 10 liegt etwa 5 Prozent unterhalb des durchschnittlichen Laptops mit der gleichen CPU/GPU-Kombination. Aida zeigt zudem auf, dass der Speicher zwar gute Lese- und Schreibraten bietet, die Speicherlatenz jedoch ungewöhnlich hoch ist, was in einigen Benchmarks wie hier für schlechtere Ergebnisse sorgt als erwartet.
Subjektiv ist uns aufgefallen, dass der Laptop zwar meistens flüssig läuft, aber es gerade in Spielen ab und zu kurz "hakt", was z.B. der Framerategraph in Far Cry 5 auch messwerttechnisch bestätigt, hier scheint die Framerate kurz einzubrechen, was öfter aufzutreten scheint. Auch die DPC Latenzen sind recht hoch, siehe nächster Abschnitt. Schwach sind zudem wiederholt die Ergebnisse in den Webanwendungen.
CrossMark: Overall | Productivity | Creativity | Responsiveness
WebXPRT 3: Overall
WebXPRT 4: Overall
Mozilla Kraken 1.1: Total
| PCMark 10 / Score | |
| Alienware m18 R2 | |
| Lenovo Legion 9 16IRX8 | |
| Medion Erazer Beast X40 2024 | |
| Asus ROG Strix Scar 18 G834JYR (2024) | |
| Durchschnittliche Intel Core i9-14900HX, NVIDIA GeForce RTX 4090 Laptop GPU (8230 - 9234, n=13) | |
| Razer Blade 16 2024, RTX 4090 | |
| Lenovo Legion 9 16IRX9, RTX 4090 | |
| Durchschnitt der Klasse Gaming (5776 - 10060, n=113, der letzten 2 Jahre) | |
| PCMark 10 / Essentials | |
| Lenovo Legion 9 16IRX8 | |
| Alienware m18 R2 | |
| Asus ROG Strix Scar 18 G834JYR (2024) | |
| Durchschnittliche Intel Core i9-14900HX, NVIDIA GeForce RTX 4090 Laptop GPU (10778 - 11628, n=13) | |
| Lenovo Legion 9 16IRX9, RTX 4090 | |
| Razer Blade 16 2024, RTX 4090 | |
| Medion Erazer Beast X40 2024 | |
| Durchschnitt der Klasse Gaming (8810 - 12600, n=117, der letzten 2 Jahre) | |
| PCMark 10 / Productivity | |
| Medion Erazer Beast X40 2024 | |
| Alienware m18 R2 | |
| Razer Blade 16 2024, RTX 4090 | |
| Lenovo Legion 9 16IRX8 | |
| Durchschnittliche Intel Core i9-14900HX, NVIDIA GeForce RTX 4090 Laptop GPU (9458 - 11759, n=13) | |
| Asus ROG Strix Scar 18 G834JYR (2024) | |
| Lenovo Legion 9 16IRX9, RTX 4090 | |
| Durchschnitt der Klasse Gaming (6662 - 16716, n=115, der letzten 2 Jahre) | |
| PCMark 10 / Digital Content Creation | |
| Alienware m18 R2 | |
| Lenovo Legion 9 16IRX8 | |
| Asus ROG Strix Scar 18 G834JYR (2024) | |
| Medion Erazer Beast X40 2024 | |
| Durchschnittliche Intel Core i9-14900HX, NVIDIA GeForce RTX 4090 Laptop GPU (13219 - 16462, n=13) | |
| Durchschnitt der Klasse Gaming (7440 - 19351, n=115, der letzten 2 Jahre) | |
| Lenovo Legion 9 16IRX9, RTX 4090 | |
| Razer Blade 16 2024, RTX 4090 | |
| CrossMark / Overall | |
| Asus ROG Strix Scar 18 G834JYR (2024) | |
| Razer Blade 16 2024, RTX 4090 | |
| Medion Erazer Beast X40 2024 | |
| Durchschnittliche Intel Core i9-14900HX, NVIDIA GeForce RTX 4090 Laptop GPU (1877 - 2344, n=10) | |
| Alienware m18 R2 | |
| Durchschnitt der Klasse Gaming (1247 - 2344, n=113, der letzten 2 Jahre) | |
| Lenovo Legion 9 16IRX9, RTX 4090 | |
| Lenovo Legion 9 16IRX8 | |
| CrossMark / Productivity | |
| Medion Erazer Beast X40 2024 | |
| Asus ROG Strix Scar 18 G834JYR (2024) | |
| Razer Blade 16 2024, RTX 4090 | |
| Durchschnittliche Intel Core i9-14900HX, NVIDIA GeForce RTX 4090 Laptop GPU (1738 - 2162, n=10) | |
| Alienware m18 R2 | |
| Durchschnitt der Klasse Gaming (1299 - 2211, n=113, der letzten 2 Jahre) | |
| Lenovo Legion 9 16IRX8 | |
| Lenovo Legion 9 16IRX9, RTX 4090 | |
| CrossMark / Creativity | |
| Asus ROG Strix Scar 18 G834JYR (2024) | |
| Razer Blade 16 2024, RTX 4090 | |
| Alienware m18 R2 | |
| Durchschnittliche Intel Core i9-14900HX, NVIDIA GeForce RTX 4090 Laptop GPU (2195 - 2660, n=10) | |
| Medion Erazer Beast X40 2024 | |
| Lenovo Legion 9 16IRX8 | |
| Durchschnitt der Klasse Gaming (1275 - 2729, n=113, der letzten 2 Jahre) | |
| Lenovo Legion 9 16IRX9, RTX 4090 | |
| CrossMark / Responsiveness | |
| Asus ROG Strix Scar 18 G834JYR (2024) | |
| Medion Erazer Beast X40 2024 | |
| Durchschnittliche Intel Core i9-14900HX, NVIDIA GeForce RTX 4090 Laptop GPU (1478 - 2327, n=10) | |
| Razer Blade 16 2024, RTX 4090 | |
| Alienware m18 R2 | |
| Lenovo Legion 9 16IRX9, RTX 4090 | |
| Durchschnitt der Klasse Gaming (1030 - 2330, n=113, der letzten 2 Jahre) | |
| Lenovo Legion 9 16IRX8 | |
| WebXPRT 3 / Overall | |
| Lenovo Legion 9 16IRX8 | |
| Razer Blade 16 2024, RTX 4090 | |
| Medion Erazer Beast X40 2024 | |
| Alienware m18 R2 | |
| Durchschnittliche Intel Core i9-14900HX, NVIDIA GeForce RTX 4090 Laptop GPU (279 - 339, n=10) | |
| Asus ROG Strix Scar 18 G834JYR (2024) | |
| Durchschnitt der Klasse Gaming (237 - 532, n=115, der letzten 2 Jahre) | |
| Lenovo Legion 9 16IRX9, RTX 4090 | |
| WebXPRT 4 / Overall | |
| Alienware m18 R2 | |
| Lenovo Legion 9 16IRX8 | |
| Asus ROG Strix Scar 18 G834JYR (2024) | |
| Medion Erazer Beast X40 2024 | |
| Durchschnittliche Intel Core i9-14900HX, NVIDIA GeForce RTX 4090 Laptop GPU (246 - 309, n=8) | |
| Durchschnitt der Klasse Gaming (176.4 - 345, n=114, der letzten 2 Jahre) | |
| Lenovo Legion 9 16IRX9, RTX 4090 | |
| Mozilla Kraken 1.1 / Total | |
| Lenovo Legion 9 16IRX9, RTX 4090 | |
| Durchschnitt der Klasse Gaming (397 - 674, n=124, der letzten 2 Jahre) | |
| Durchschnittliche Intel Core i9-14900HX, NVIDIA GeForce RTX 4090 Laptop GPU (428 - 535, n=11) | |
| Razer Blade 16 2024, RTX 4090 | |
| Asus ROG Strix Scar 18 G834JYR (2024) | |
| Lenovo Legion 9 16IRX8 | |
| Medion Erazer Beast X40 2024 | |
| Alienware m18 R2 | |
* ... kleinere Werte sind besser
| PCMark 10 Score | 8239 Punkte | |
Hilfe | ||
| AIDA64 / Memory Copy | |
| Asus ROG Strix Scar 18 G834JYR (2024) | |
| Lenovo Legion 9 16IRX9, RTX 4090 | |
| Alienware m18 R2 | |
| Razer Blade 16 2024, RTX 4090 | |
| Lenovo Legion 9 16IRX8 | |
| Medion Erazer Beast X40 2024 | |
| Durchschnittliche Intel Core i9-14900HX (38028 - 83392, n=36) | |
| Durchschnitt der Klasse Gaming (21750 - 108104, n=133, der letzten 2 Jahre) | |
| AIDA64 / Memory Read | |
| Asus ROG Strix Scar 18 G834JYR (2024) | |
| Razer Blade 16 2024, RTX 4090 | |
| Alienware m18 R2 | |
| Lenovo Legion 9 16IRX8 | |
| Medion Erazer Beast X40 2024 | |
| Lenovo Legion 9 16IRX9, RTX 4090 | |
| Durchschnittliche Intel Core i9-14900HX (43306 - 87568, n=36) | |
| Durchschnitt der Klasse Gaming (22956 - 104349, n=133, der letzten 2 Jahre) | |
| AIDA64 / Memory Write | |
| Lenovo Legion 9 16IRX9, RTX 4090 | |
| Asus ROG Strix Scar 18 G834JYR (2024) | |
| Medion Erazer Beast X40 2024 | |
| Alienware m18 R2 | |
| Lenovo Legion 9 16IRX8 | |
| Razer Blade 16 2024, RTX 4090 | |
| Durchschnitt der Klasse Gaming (22297 - 133486, n=133, der letzten 2 Jahre) | |
| Durchschnittliche Intel Core i9-14900HX (37146 - 80589, n=36) | |
| AIDA64 / Memory Latency | |
| Durchschnitt der Klasse Gaming (59.5 - 259, n=133, der letzten 2 Jahre) | |
| Lenovo Legion 9 16IRX9, RTX 4090 | |
| Alienware m18 R2 | |
| Durchschnittliche Intel Core i9-14900HX (76.1 - 105, n=36) | |
| Lenovo Legion 9 16IRX8 | |
| Razer Blade 16 2024, RTX 4090 | |
| Asus ROG Strix Scar 18 G834JYR (2024) | |
| Medion Erazer Beast X40 2024 | |
* ... kleinere Werte sind besser
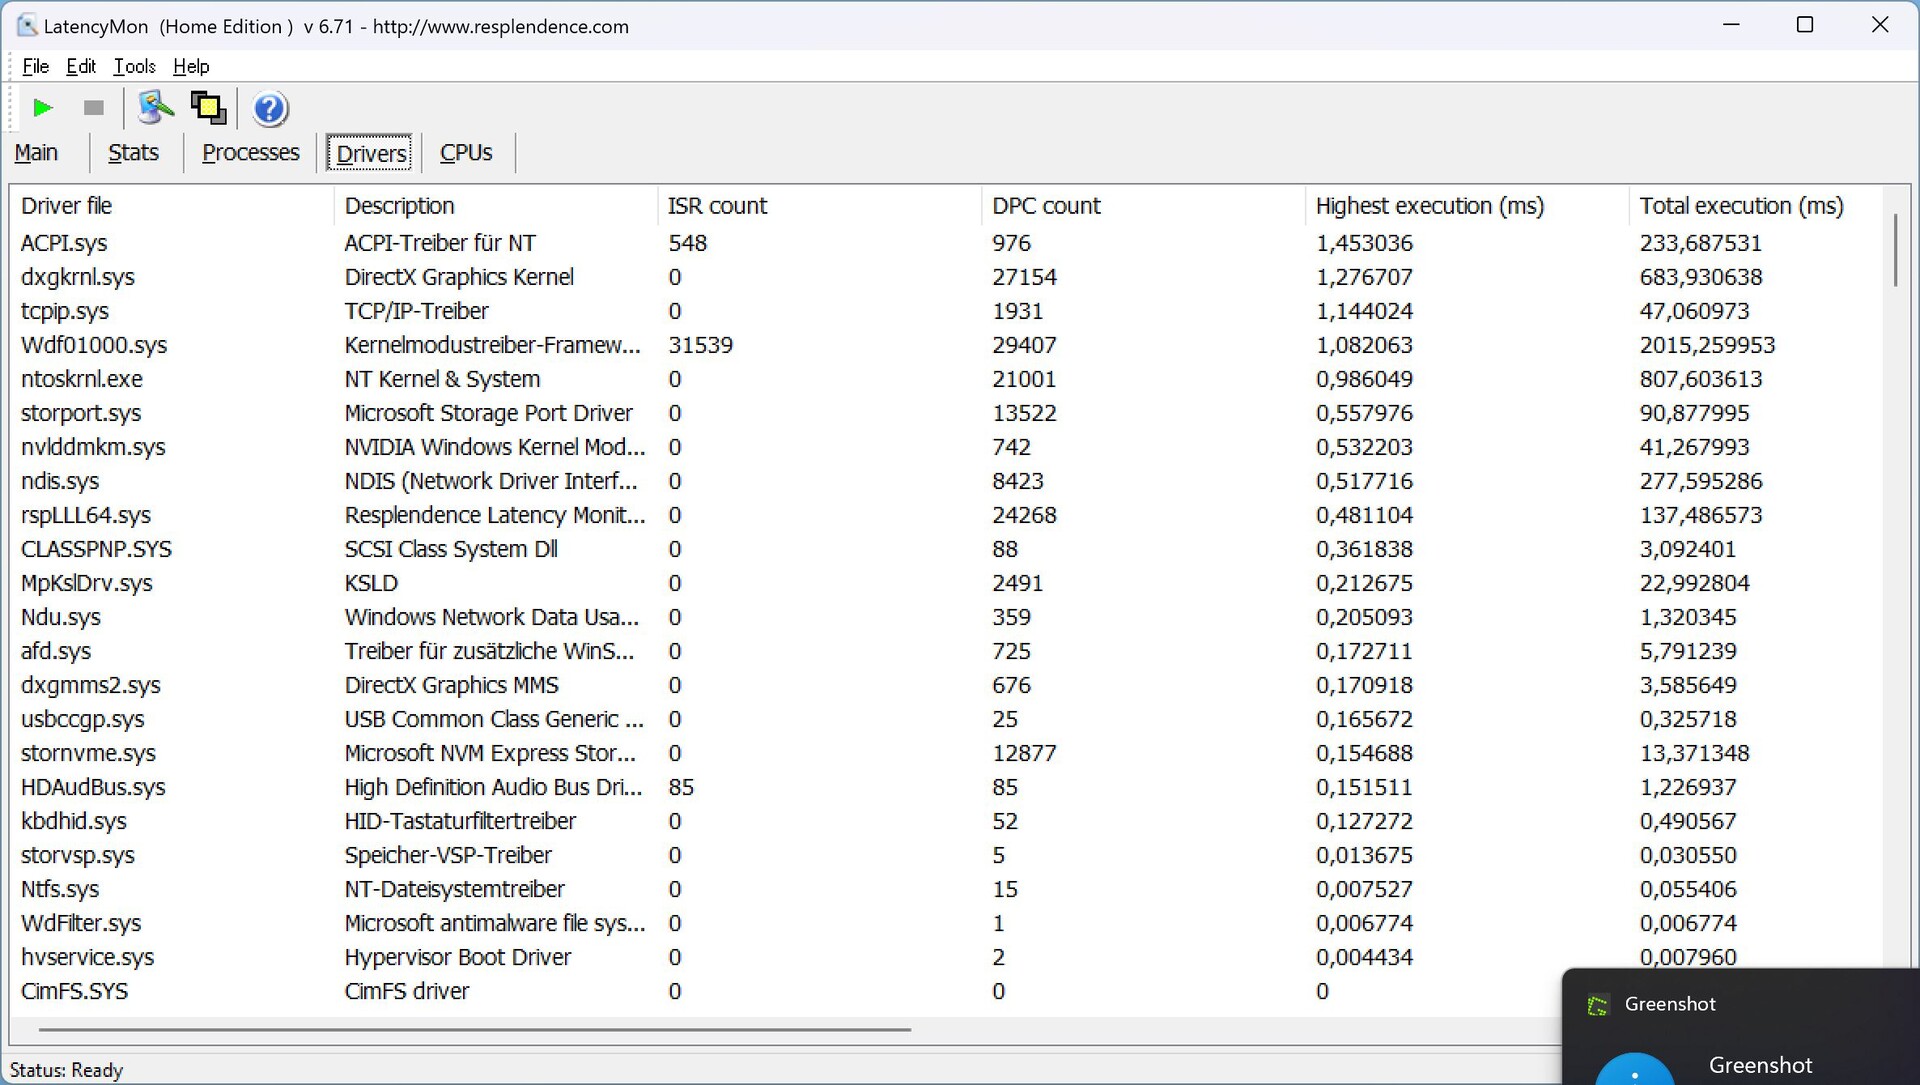
DPC-Latenzen
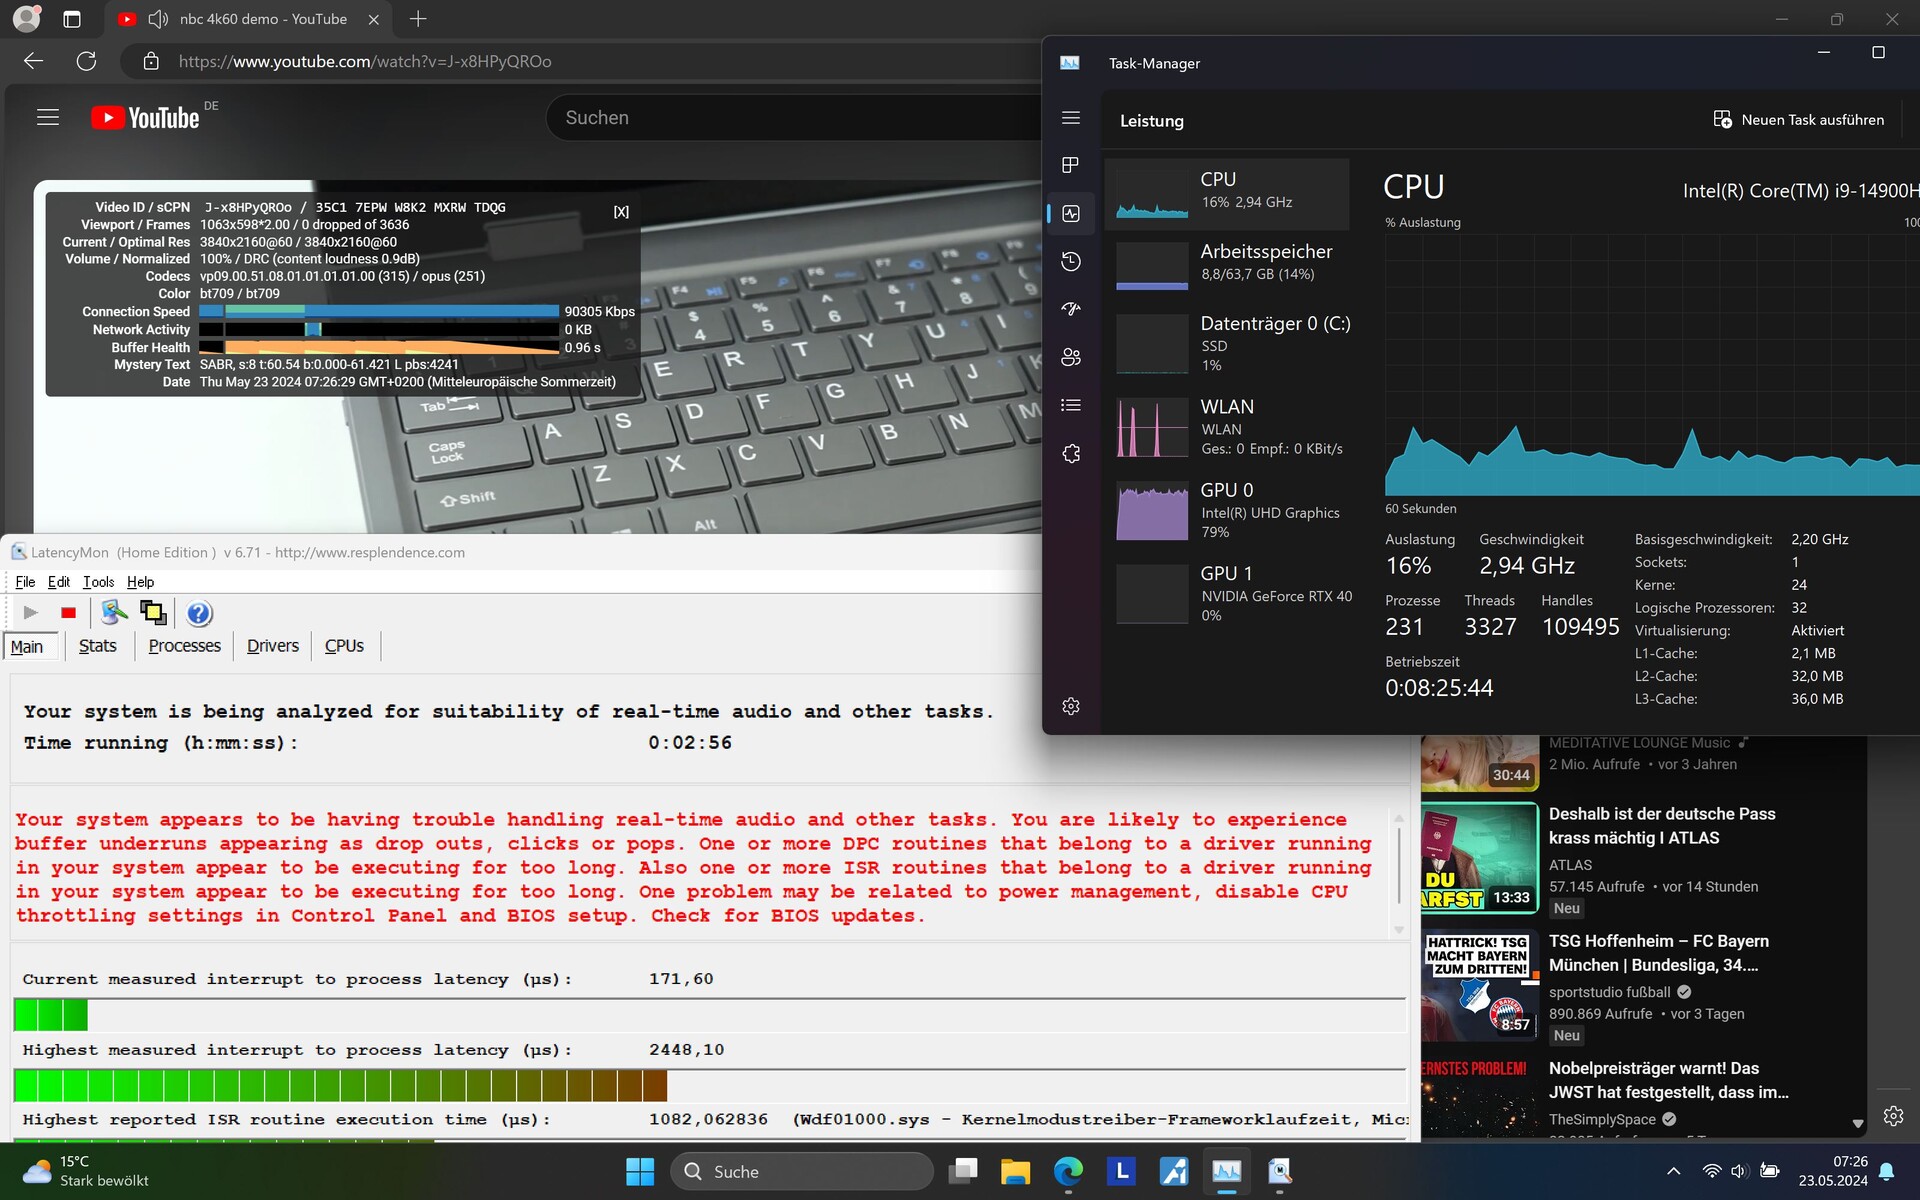
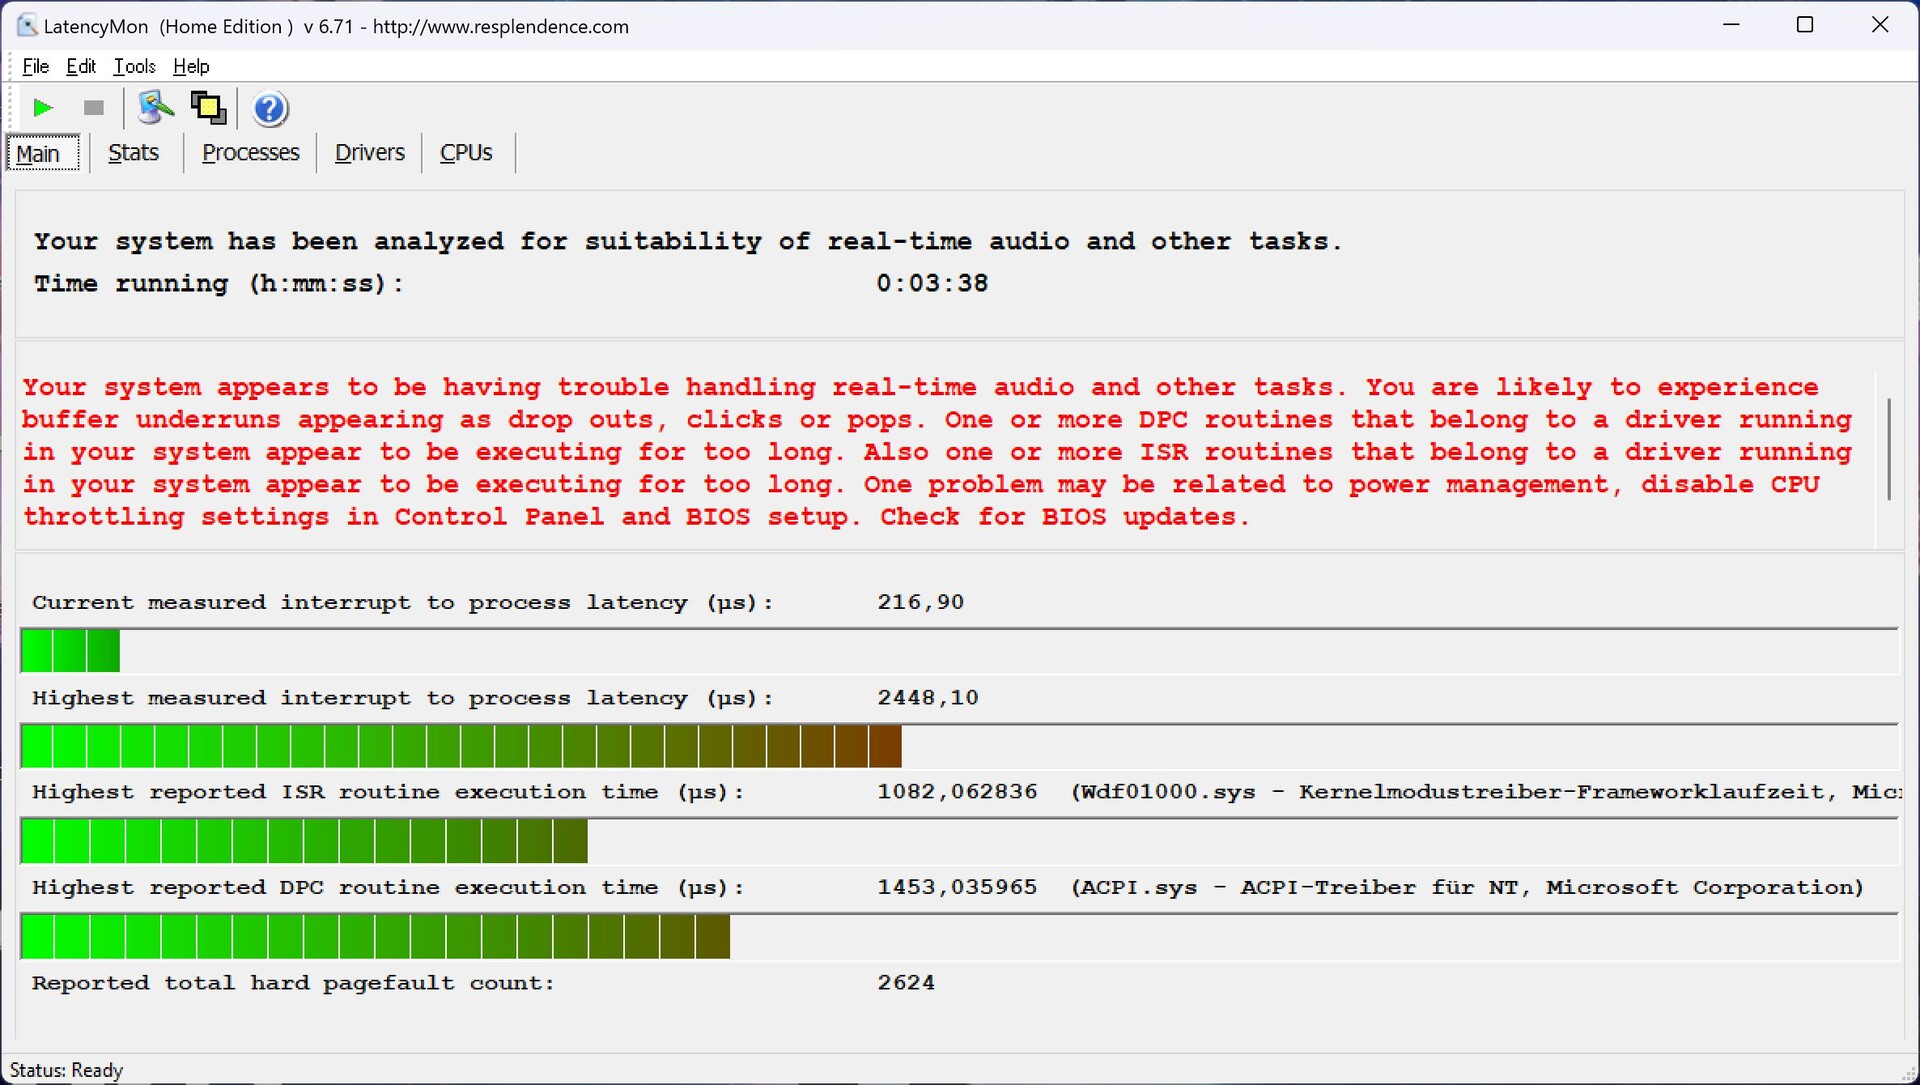
Schon beim Öffnen des Browsers stellen sich erste Latenzen ein. Der Wert steigt minimal beim Öffnen mehrerer Tabs auf unserer Homepage. Aber vor allem die Wiedergabe unseres 4K/60-fps-YouTubevideos lässt den Verzögerungswert nach oben schnellen.
Zudem liegt die Auslastung der in diesem Fall aktiven internen GPU konstant bei ungewöhnlich hohen 79 Prozent, üblich wären Werte um die 20 Prozent! Immerhin sind dennoch keine ausgelassenen Bilder zu beklagen.
| DPC Latencies / LatencyMon - interrupt to process latency (max), Web, Youtube, Prime95 | |
| Alienware m18 R2 | |
| Lenovo Legion 9 16IRX9, RTX 4090 | |
| Lenovo Legion 9 16IRX8 | |
| Razer Blade 16 2024, RTX 4090 | |
| Medion Erazer Beast X40 2024 | |
| Asus ROG Strix Scar 18 G834JYR (2024) | |
* ... kleinere Werte sind besser
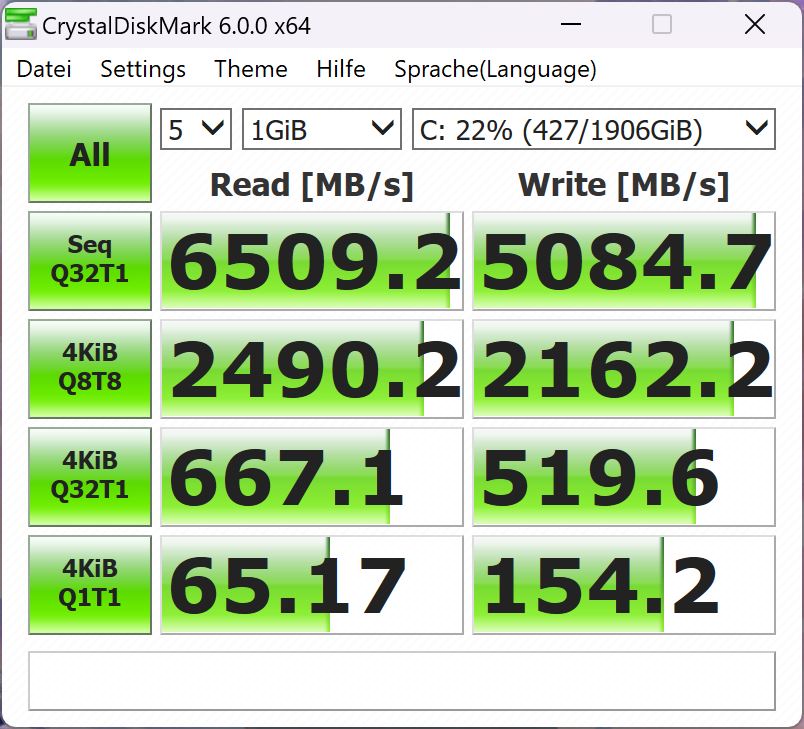
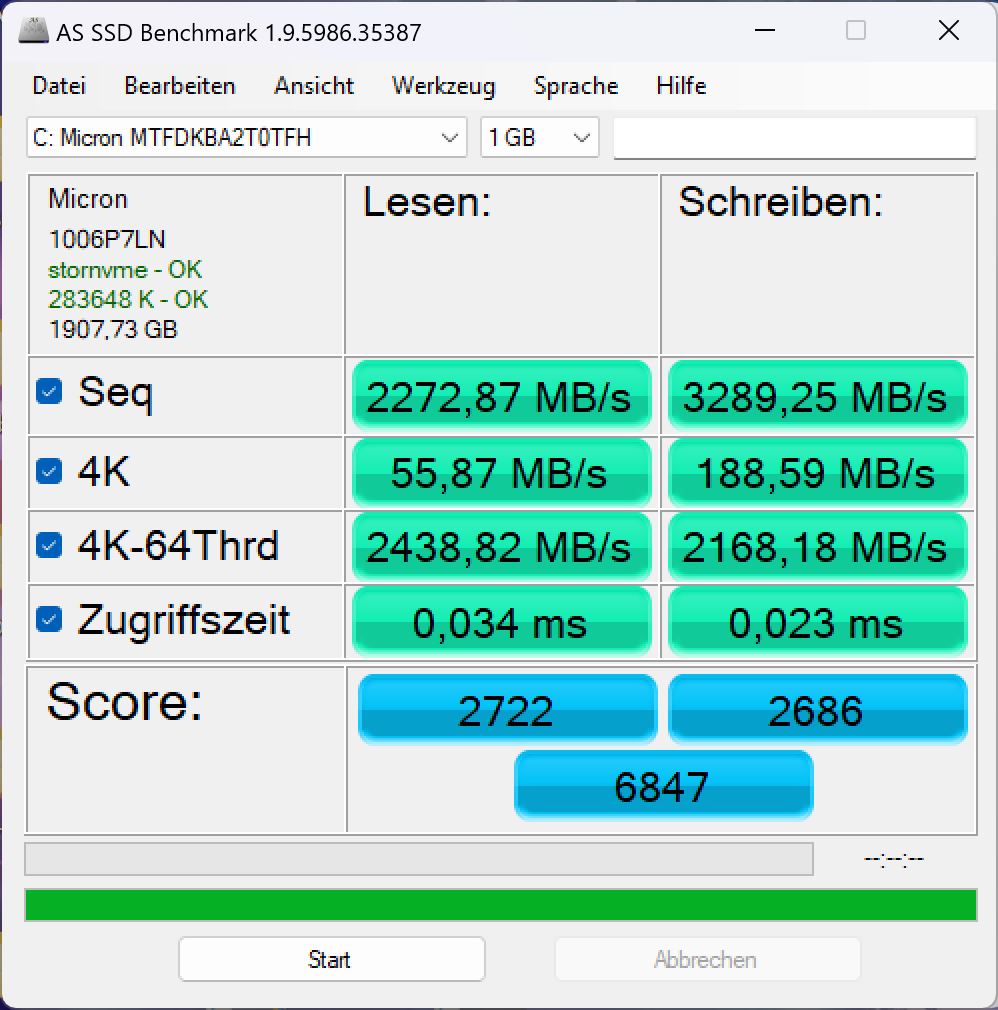
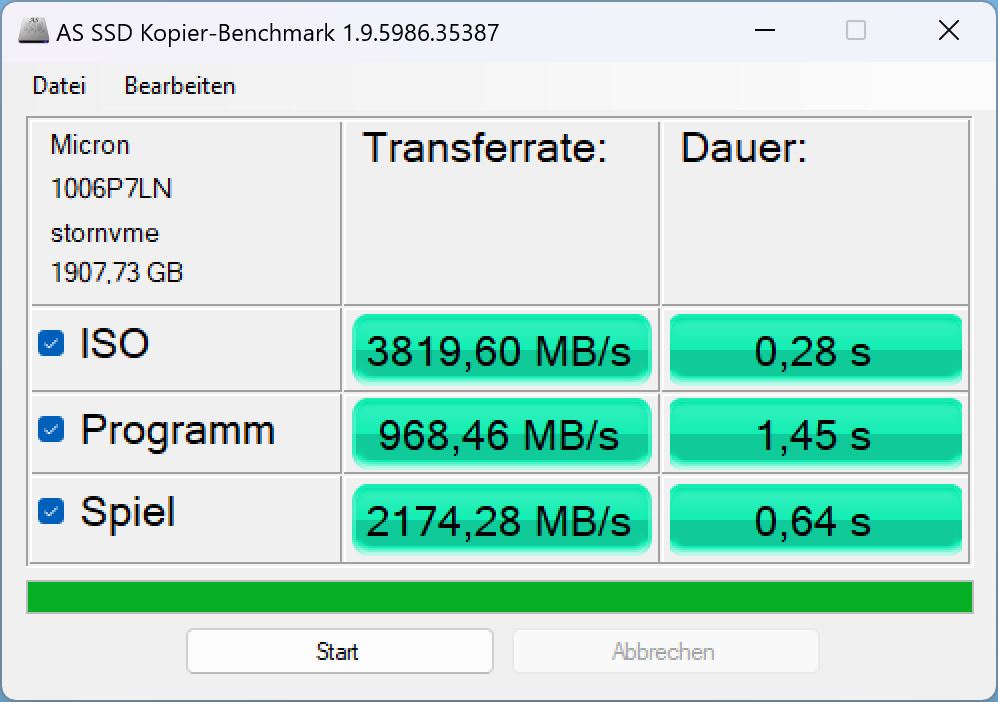
Massenspeicher
In unserer SKU verbaut Lenovo eine Micron 3400 mit 2 TB Speicher. In unserer SSD-Bestenliste belegt sie Rang 121, gehört also bestenfalls zur Mittelklasse. Laut Micron soll sie bis zu 6.600 MB/s im sequentiellen Lesen und 5.000 MB/s im sequentiellen Schreiben erreichen, davon ist unser Modell aber genauso entfernt wie der durchschnittliche Laptop mit der gleichen SSD in unserer Datenbank. Nur Crystaldiskmark kann hohe Werte bestätigen, DiskSpd und AS SSD messen deutlich geringere Datenraten.
Ungewöhnlich ist das Dauerlastverhalten: Während andere Modelle teils nach gewisser Zeit erhitzen und dann gedrosselt werden, verhält sich der Speicher im Legion 9 genau umgekehrt. Zu Beginn des Tests ist die Leistung sehr schwankend und bricht immer wieder ein. Die letzten zwei Testdrittel läuft die SSD dann aber konstant mit maximaler Geschwindigkeit. Womöglich ein Zeichen dafür, dass das Kühlsystem des Legion 9i etwas zu spät anspringt, beziehungsweise erst zu spät seine optimale Kühlleistung entfaltet.

* ... kleinere Werte sind besser
Dauerleistung Lesen: DiskSpd Read Loop, Queue Depth 8
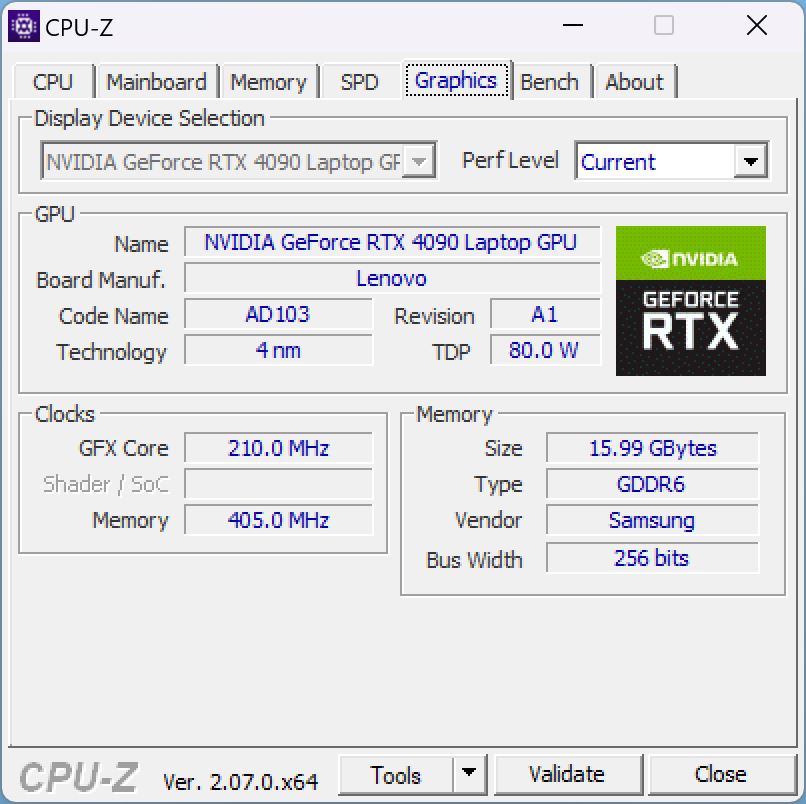
Grafikkarte
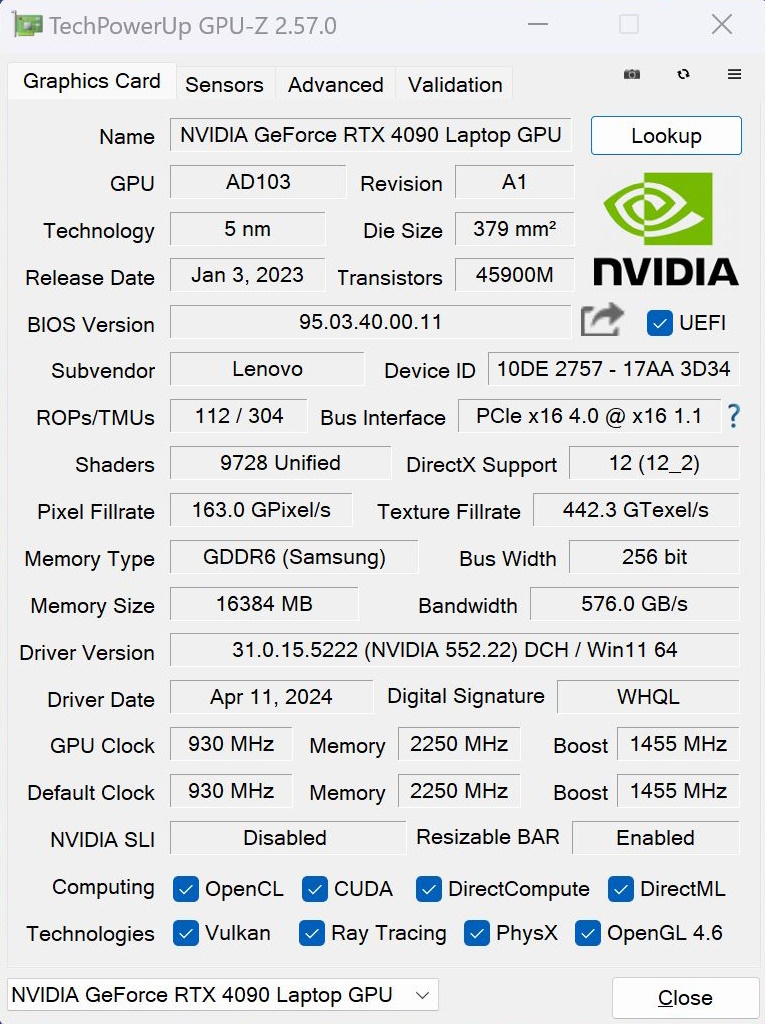
Mit der Nvidia Geforce RTX 4090 sitzt im Legion 9i die aktuelle Speerspitze der Laptopgrafik. Dementsprechend sollte sie alle aktuellen Spiele in hoher Auflösung und maximalen Details darstellen können.
In den synthetischen 3DMarks liegt die Performance in etwa auf Sollniveau, dort aber doch eher wieder auf den hinteren Rängen, die direkte Konkurrenz ist oft ein paar Prozentpunkte schneller, übrigens auch das deutlich kleinere und flachere Blade 16.
Trennt man den Laptop vom Stromnetz, so verliert der Fire-Strike-Score etwa 40 Prozent an 3D-Leistung.
Beim Gaming ist die Leistung in etwa mit der des Razer Blade 16 vergleichbar. Die Ergebnisse wären womöglich höher, wenn nicht die bereits erwähnten, kurzen Framerateneinbrüche auftreten würden. An der Framerate unseres 1-stündigen Witcher-3-Tests sieht man das Problem recht deutlich. Die Framerateneinbrüche treten vor allem in der Anfangszeit auf, danach läuft das System stabil, die Leistung ist auf dem Niveau der Konkurrenz.
Nur bei sehr aktuellen und anspruchsvollen Spielen wie Skull & Bones kann die Framerate in 4K manchmal unter die 60-fps-Marke rutschen, ansonsten laufen alle Spiele auch in 4K meist mit über 60 fps flüssig.
| Leistungsprofil/Messwerte | Witcher 3 fps Start | Witcher 3 fps nach 10 min | Verbrauch in W | GPU-Leistungaufnahme in W | Avg GPU-Takt in MHz | Lautstärke in dB |
|---|---|---|---|---|---|---|
| Leistung | 203 | 192 | 246 | 162 | 2.120 | 55.32 |
| Leistung mit GPU-Boost | 201 | 193 | 254 | 160.5 | 2.180 | 55.32 |
| Ausgeglichen mit KI | 197 | 182 | 254 | 159 | 2.080 | 54.81 |
| Ausgeglichen ohne KI | 161 | 145 | 184 | 103 | 1.530 | 47.98 |
| Ruhe | 108 | 60 | 101 | 43 | erst 1.000, nach 2 min 800 | 32.19 |
| 3DMark 11 Performance | 46826 Punkte | |
| 3DMark Cloud Gate Standard Score | 67697 Punkte | |
| 3DMark Fire Strike Score | 34686 Punkte | |
| 3DMark Time Spy Score | 20099 Punkte | |
Hilfe | ||
* ... kleinere Werte sind besser
| The Witcher 3 - 1920x1080 Ultra Graphics & Postprocessing (HBAO+) | |
| Lenovo Legion 9 16IRX8 | |
| Alienware m18 R2 | |
| Medion Erazer Beast X40 2024 | |
| Lenovo Legion 9 16IRX9, RTX 4090 | |
| Razer Blade 16 2024, RTX 4090 | |
| Asus ROG Strix Scar 18 G834JYR (2024) | |
| Durchschnitt der Klasse Gaming (80.2 - 240, n=35, der letzten 2 Jahre) | |
Witcher 3 FPS-Diagramm
| min. | mittel | hoch | max. | QHD | 4K DLSS | 4K FSR | 4K | |
|---|---|---|---|---|---|---|---|---|
| GTA V (2015) | 186.9 | 185.2 | 183.3 | 136.2 | 138.9 | 95 | ||
| The Witcher 3 (2015) | 540 | 494 | 370 | 203.4 | 165 | 104.5 | ||
| Dota 2 Reborn (2015) | 201 | 181.8 | 174.4 | 164.5 | 160.8 | |||
| Final Fantasy XV Benchmark (2018) | 228 | 194.9 | 165.1 | 142 | ||||
| X-Plane 11.11 (2018) | 193.5 | 166.3 | 125.6 | 109.6 | ||||
| Far Cry 5 (2018) | 201 | 173 | 166 | 155 | 146 | 104 | ||
| Strange Brigade (2018) | 499 | 403 | 387 | 369 | 290 | |||
| F1 23 (2023) | 151.5 | 149.2 | 144.6 | |||||
| Cyberpunk 2077 (2023) | 127 | 86 | ||||||
| Skull & Bones (2024) | 164 | 140 | 149 | 118 | 98 | 90 | 81 | 61 |
| F1 24 (2024) | 339 | 304 | 113.6 | 72.1 |
Emissionen & Energie - Laut und warm
Geräuschemissionen
Im Leerlauf auf dem Desktop sind die Lüfter meistens still. Gelegentlich können sie kurz hochtouren, beruhigen sich aber auch wieder. Sobald man aber auch nur eine Alltagslast wie Surfen anlegt, gehen die Lüfter ans Werk, selbst im "Lautlos"-Modus.
Im 3DMark06 touren die Lüfter erst kontinuierlich auf knapp über 40 dB hoch, beruhigen sich wieder auf 35 dB, um sich im letzten Drittel bei ca. 39 dB einzupendeln. Auch das ist womöglich ein Zeichen dafür, dass das System seine Kühlung und die Leistung zu spät an die thermischen Bedingungen anpasst und sich erst nach einiger Zeit auf die optimalen Werte einspielt.
Beim Gaming und im Leistungsmodus laufen die Lüfter bei etwa 55 dB am Maximalwert, was im Vergleich recht laut ist, das Blade 16 bleibt zum Beispiel leiser. Im Ausgeglichenen Modus (ohne KI) sinkt die Lautstärke auf moderatere 47 dB, die Gaming-Leistung nimmt dann aber spürbar ab, nämlich um 20 bis 25 Prozent.
Lautstärkediagramm
| Idle |
| 23 / 23 / 23 dB(A) |
| Last |
| 39 / 55.56 dB(A) |
 | ||
30 dB leise 40 dB(A) deutlich hörbar 50 dB(A) störend |
||
min: | ||
| Lenovo Legion 9 16IRX9, RTX 4090 GeForce RTX 4090 Laptop GPU, i9-14900HX, Micron 3400 2TB MTFDKBA2T0TFH | Lenovo Legion 9 16IRX8 GeForce RTX 4090 Laptop GPU, i9-13980HX, 2x SK Hynix HFS001TEJ9X115N (RAID 0) | Razer Blade 16 2024, RTX 4090 GeForce RTX 4090 Laptop GPU, i9-14900HX, Samsung PM9A1 MZVL22T0HBLB | Alienware m18 R2 GeForce RTX 4090 Laptop GPU, i9-14900HX, SK Hynix PC811 HFS002TEM9X152N | Asus ROG Strix Scar 18 G834JYR (2024) GeForce RTX 4090 Laptop GPU, i9-14900HX, Samsung PM9A1a MZVL22T0HDLB | Medion Erazer Beast X40 2024 GeForce RTX 4090 Laptop GPU, i9-14900HX, Phison E18-1TB-PHISON-SSD-BICS5 | |
|---|---|---|---|---|---|---|
| Geräuschentwicklung | -2% | -1% | -5% | -13% | -15% | |
| aus / Umgebung * (dB) | 23 | 23.7 -3% | 23 -0% | 23.6 -3% | 24 -4% | 25 -9% |
| Idle min * (dB) | 23 | 24 -4% | 23 -0% | 23.8 -3% | 27 -17% | 28 -22% |
| Idle avg * (dB) | 23 | 24 -4% | 23 -0% | 26.1 -13% | 28 -22% | 29 -26% |
| Idle max * (dB) | 23 | 30.4 -32% | 27.66 -20% | 31.5 -37% | 32 -39% | 32 -39% |
| Last avg * (dB) | 39 | 30.4 22% | 43.76 -12% | 31.5 19% | 50 -28% | 48 -23% |
| Witcher 3 ultra * (dB) | 55.32 | 52.2 6% | 46.81 15% | 52.1 6% | 50 10% | 50 10% |
| Last max * (dB) | 55.56 | 54.9 1% | 50.37 9% | 56.6 -2% | 52 6% | 52 6% |
* ... kleinere Werte sind besser
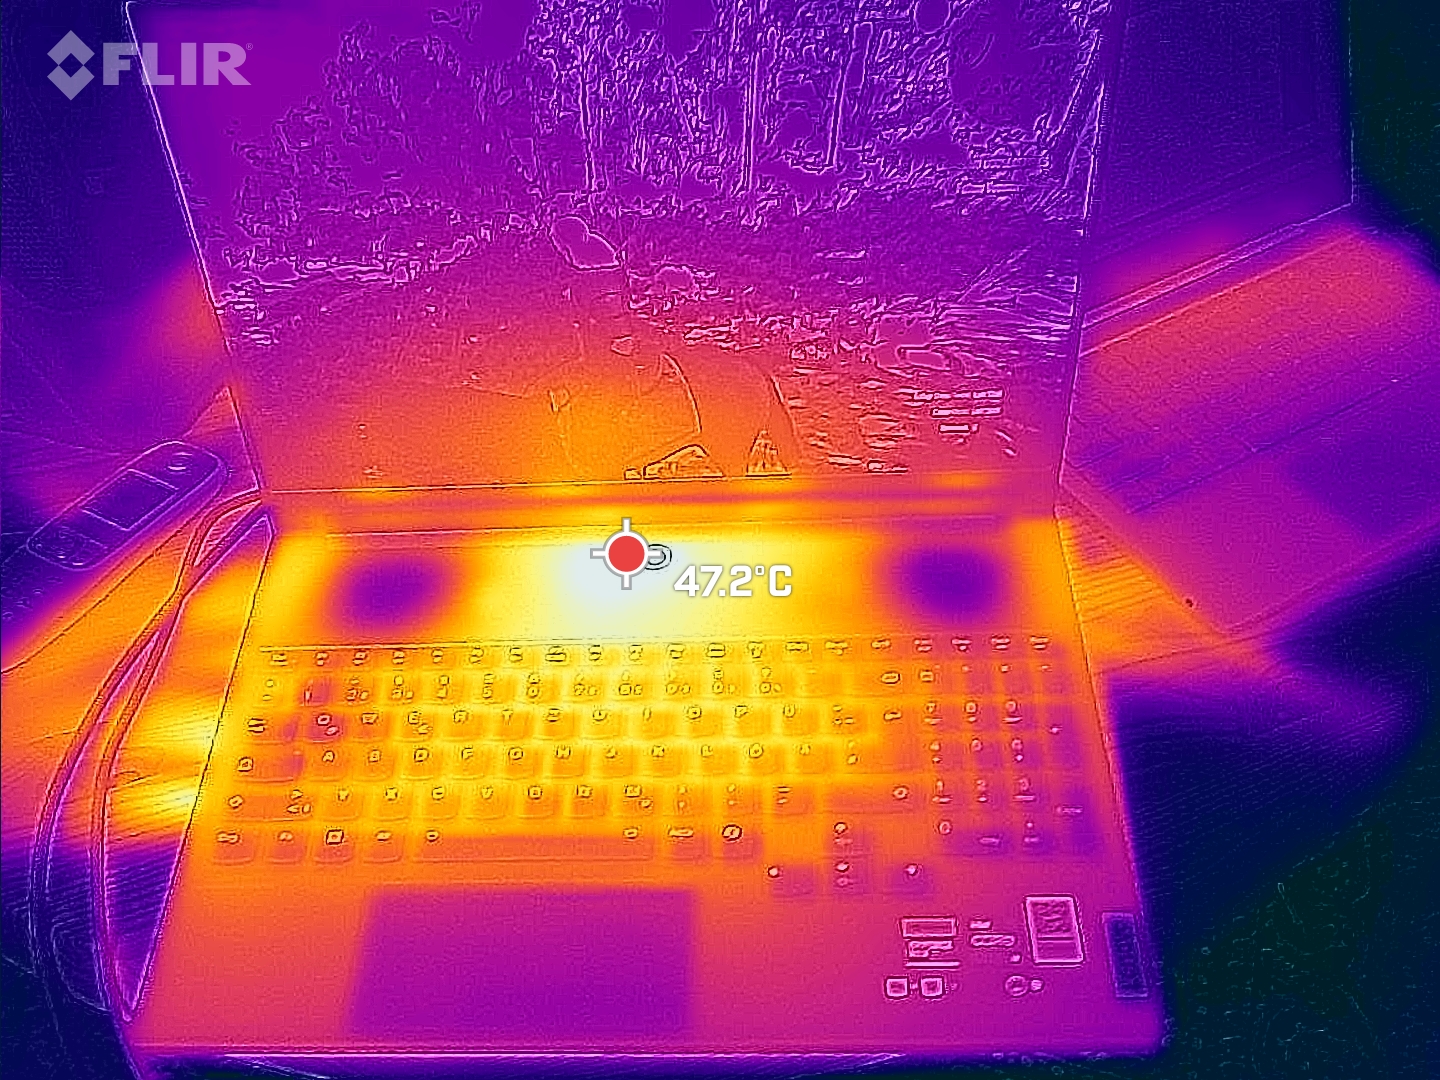
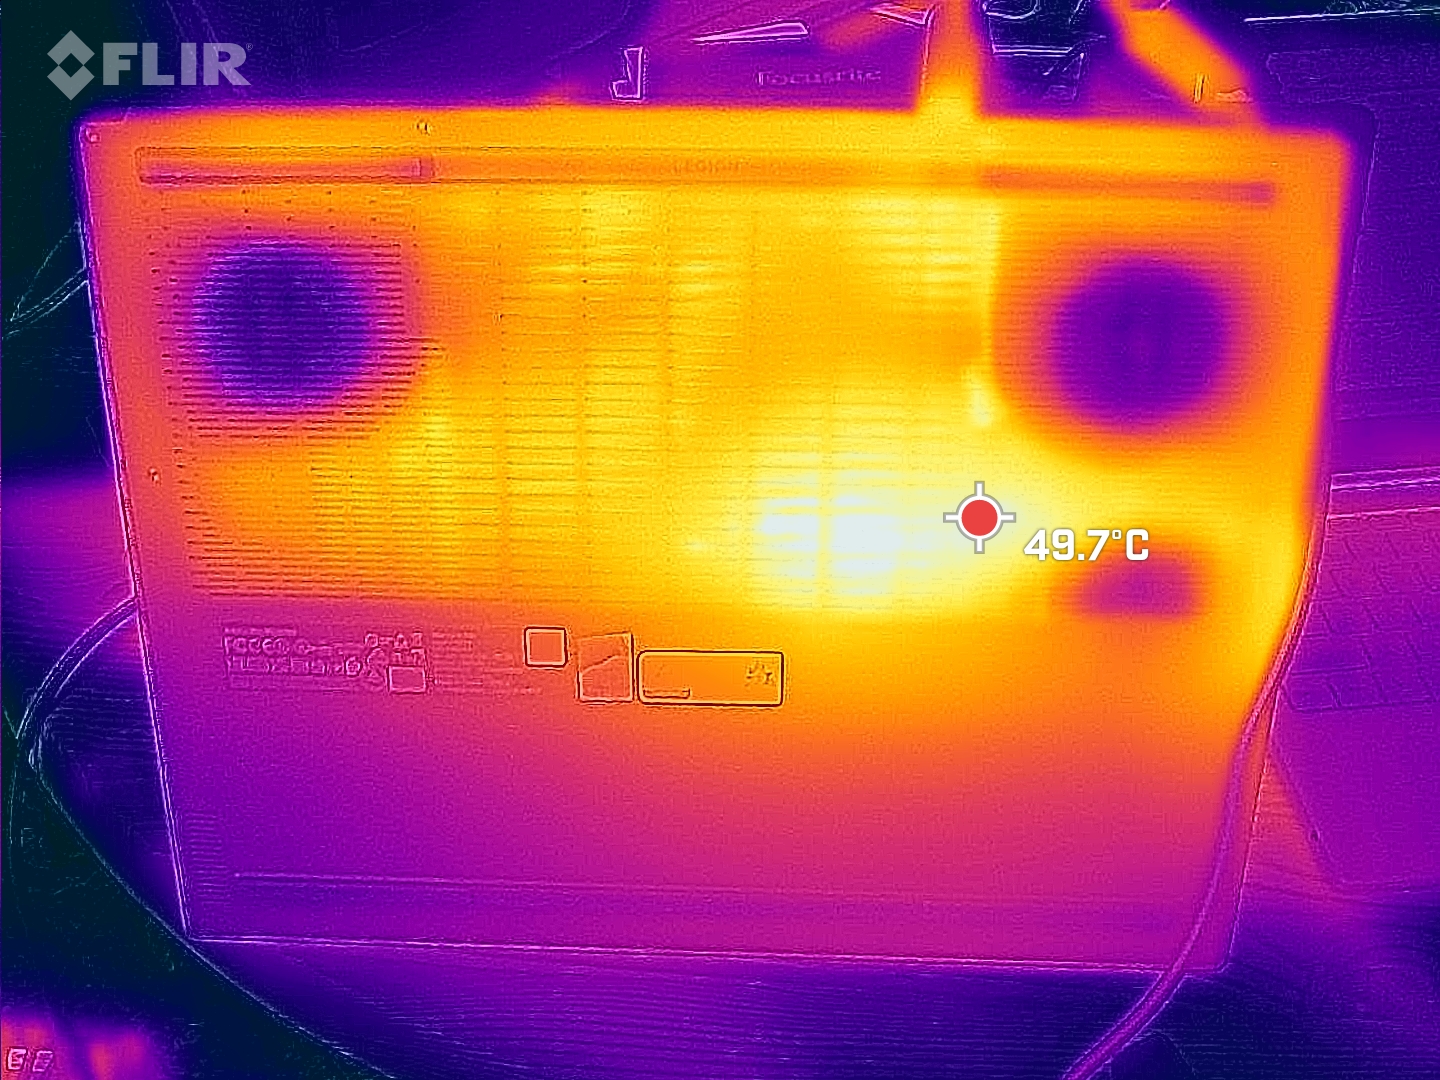
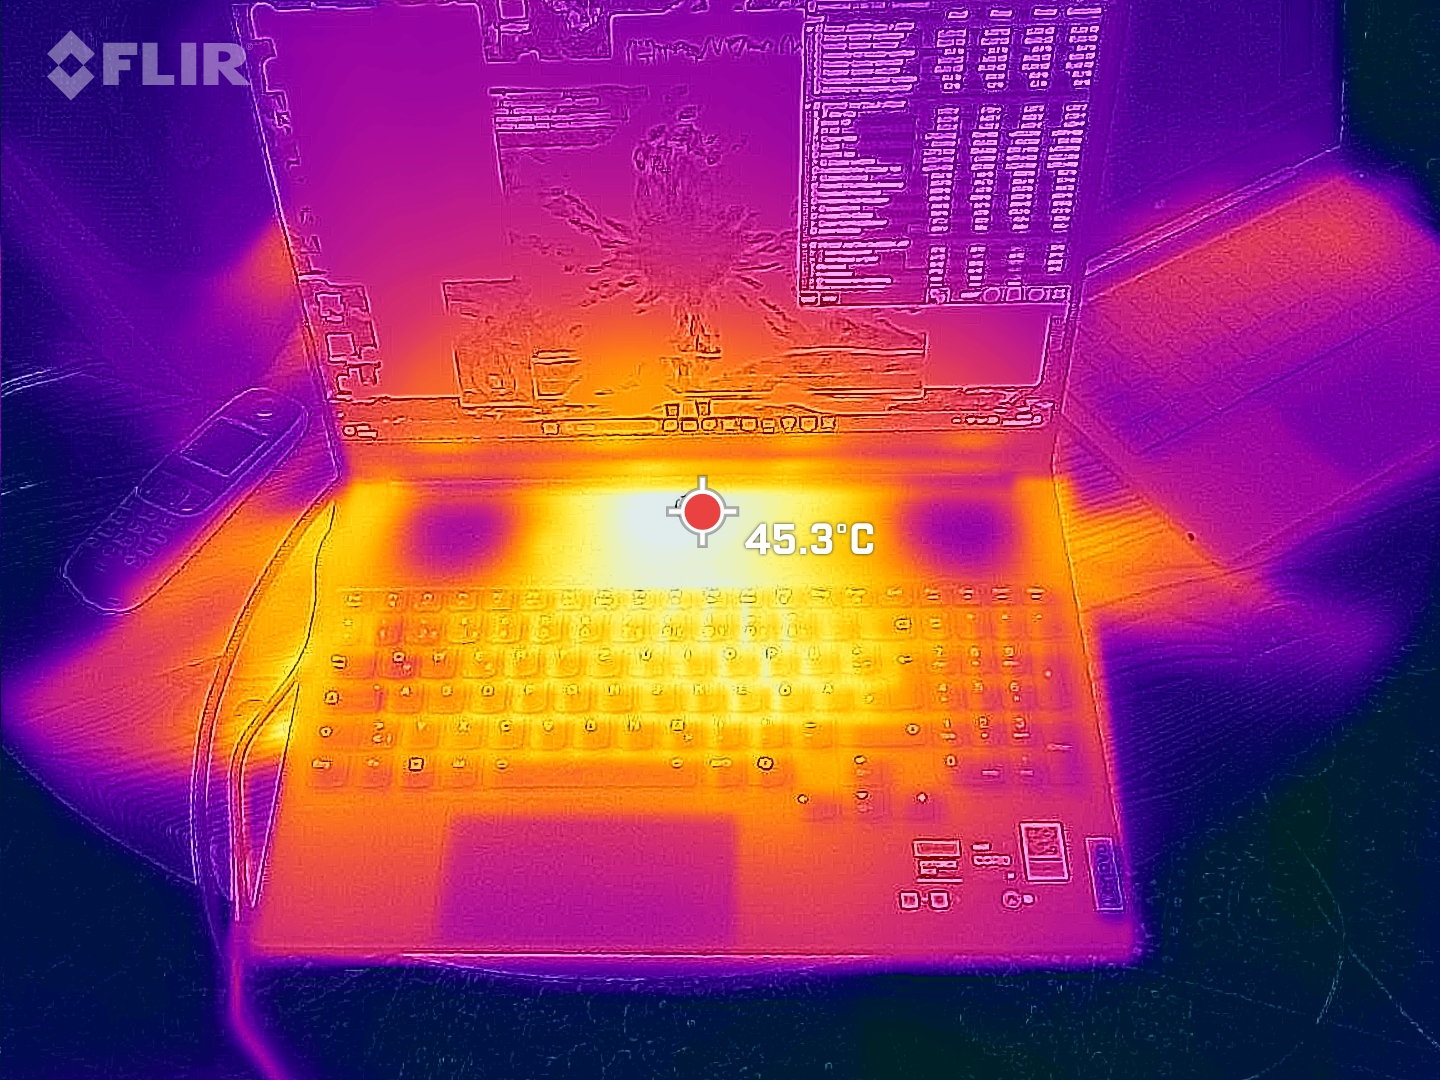
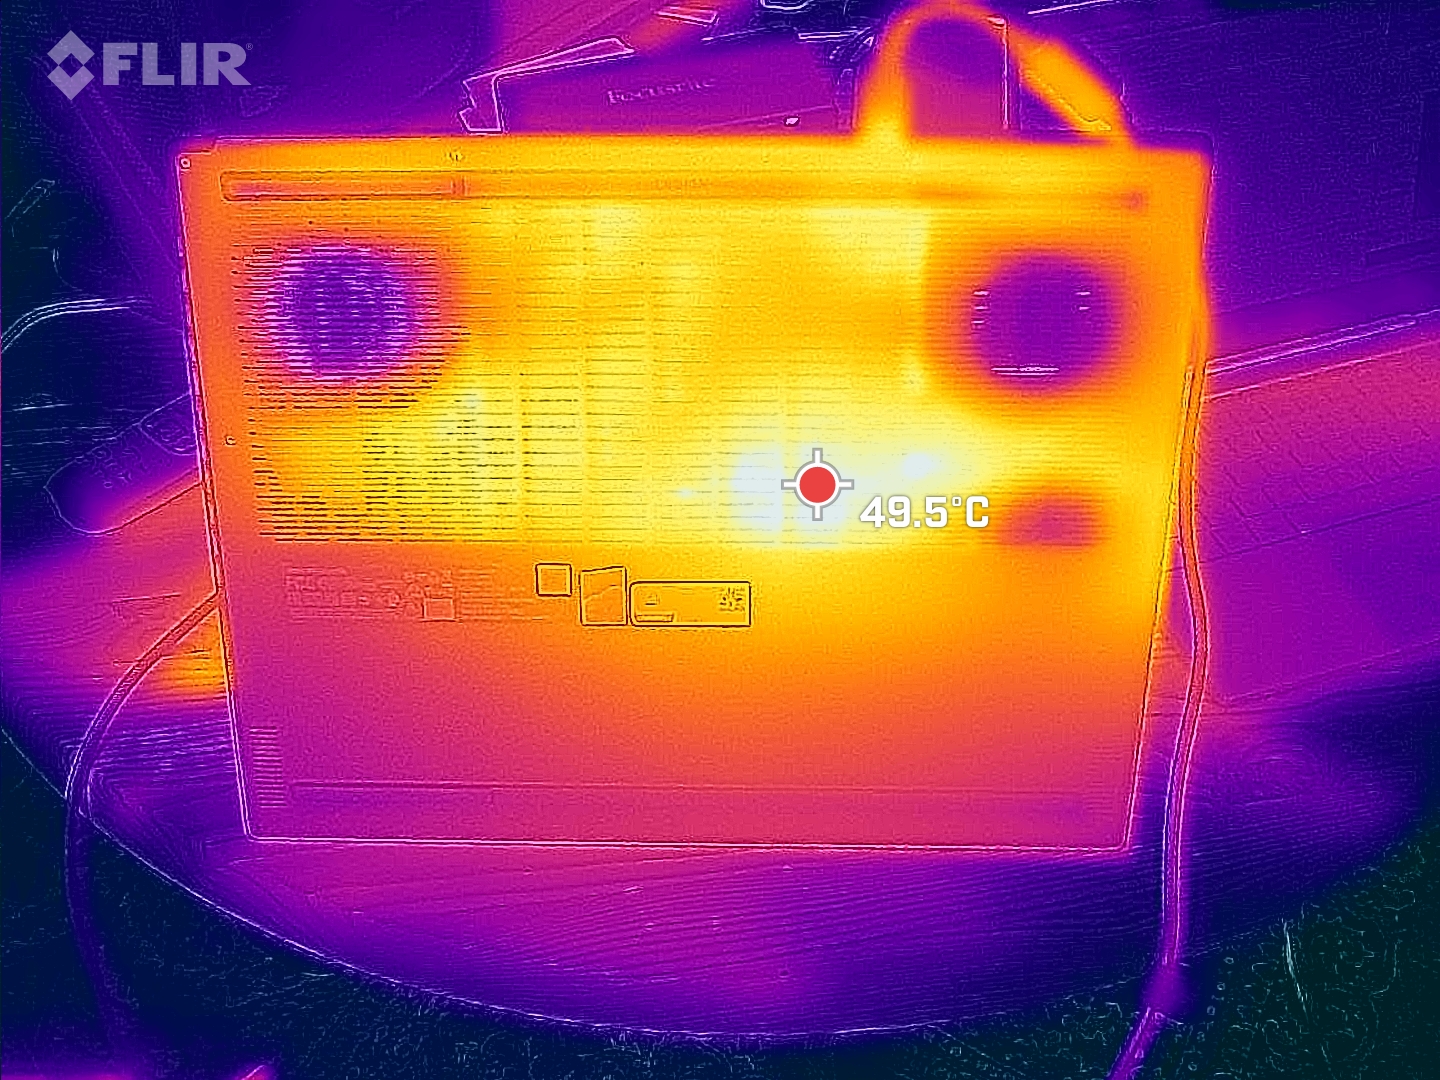
Temperatur
Trotz recht lautem Kühlsystem sind die Temperaturen im Vergleich eher hoch. Die Hot Spots beim Gaming und anderen starken Lasten liegen zentral und zum Bildschirm hin. Auch rund um die WASD-Tasten kann es mit 46 °C recht warm werden. Zumindest die Handballenauflagen bleiben im moderaten Bereich. Schon der Vorgänger agierte hier nicht optimal, aber offensichtlich hat Lenovo nicht nachgebessert.
(-) Die maximale Temperatur auf der Oberseite ist 56 °C. Im Vergleich liegt der Klassendurchschnitt bei 40.4 °C (von 21.2 bis 68.8 °C für die Klasse Gaming).
(-) Auf der Unterseite messen wir eine maximalen Wert von 53 °C (im Vergleich zum Durchschnitt von 43.3 °C).
(±) Ohne Last messen wir eine durchschnittliche Temperatur von 33.6 °C auf der Oberseite. Der Klassendurchschnitt erreicht 33.9 °C.
(-) Beim längeren Spielen von The Witcher 3 erhitzt sich das Gerät durchschnittlich auf 42.3 °C. Der Durchschnitt der Klasse ist derzeit 33.9 °C.
(±) Die Handballen und der Touchpad-Bereich können sehr heiß werden mit maximal 36 °C.
(-) Die durchschnittliche Handballen-Temperatur anderer getesteter Geräte war 28.8 °C (-7.2 °C).
| Lenovo Legion 9 16IRX9, RTX 4090 Intel Core i9-14900HX, NVIDIA GeForce RTX 4090 Laptop GPU | Lenovo Legion 9 16IRX8 Intel Core i9-13980HX, NVIDIA GeForce RTX 4090 Laptop GPU | Razer Blade 16 2024, RTX 4090 Intel Core i9-14900HX, NVIDIA GeForce RTX 4090 Laptop GPU | Alienware m18 R2 Intel Core i9-14900HX, NVIDIA GeForce RTX 4090 Laptop GPU | Asus ROG Strix Scar 18 G834JYR (2024) Intel Core i9-14900HX, NVIDIA GeForce RTX 4090 Laptop GPU | Medion Erazer Beast X40 2024 Intel Core i9-14900HX, NVIDIA GeForce RTX 4090 Laptop GPU | |
|---|---|---|---|---|---|---|
| Hitze | 11% | 21% | 9% | 17% | 13% | |
| Last oben max * (°C) | 56 | 49.6 11% | 45 20% | 41.2 26% | 49 12% | 47 16% |
| Last unten max * (°C) | 53 | 48.6 8% | 45 15% | 34.6 35% | 47 11% | 54 -2% |
| Idle oben max * (°C) | 38 | 33.2 13% | 29 24% | 42.8 -13% | 29 24% | 30 21% |
| Idle unten max * (°C) | 39 | 34.2 12% | 30 23% | 43.6 -12% | 31 21% | 32 18% |
* ... kleinere Werte sind besser
Lautsprecher
Der hörbare Bereich ist sehr linear, die Hoch- und Mitteltöne gut ausgeglichen. Die Basswiedergabe ist indes natürlich abgesenkt, aber immerhin wahrnehmbar. Zudem könnten die Lautsprecher noch etwas kräftiger, sprich lauter aufspielen.
Lenovo Legion 9 16IRX9, RTX 4090 Audio Analyse
(±) | Mittelmäßig laut spielende Lautsprecher (78.96 dB)
Bass 100 - 315 Hz
(±) | abgesenkter Bass - 13.2% geringer als der Median
(±) | durchschnittlich lineare Bass-Wiedergabe (8.9% Delta zum Vorgänger)
Mitteltöne 400 - 2000 Hz
(+) | ausgeglichene Mitten, vom Median nur 3.2% abweichend
(+) | lineare Mitten (3.4% Delta zum Vorgänger)
Hochtöne 2 - 16 kHz
(+) | ausgeglichene Hochtöne, vom Median nur 1.8% abweichend
(+) | sehr lineare Hochtöne (4% Delta zum Vorgänger)
Gesamt im hörbaren Bereich 100 - 16.000 Hz
(+) | hörbarer Bereich ist sehr linear (11.3% Abstand zum Median
Im Vergleich zu allen Geräten derselben Klasse
» 8% aller getesteten Geräte dieser Klasse waren besser, 4% vergleichbar, 88% schlechter
» Das beste Gerät hat einen Delta-Wert von 6%, durchschnittlich ist 18%, das schlechteste Gerät hat 132%
Im Vergleich zu allen Geräten im Test
» 7% aller getesteten Geräte waren besser, 2% vergleichbar, 91% schlechter
» Das beste Gerät hat einen Delta-Wert von 4%, durchschnittlich ist 24%, das schlechteste Gerät hat 134%
Razer Blade 16 2024, RTX 4090 Audio Analyse
(±) | Mittelmäßig laut spielende Lautsprecher (81.16 dB)
Bass 100 - 315 Hz
(±) | abgesenkter Bass - 8.2% geringer als der Median
(±) | durchschnittlich lineare Bass-Wiedergabe (7.4% Delta zum Vorgänger)
Mitteltöne 400 - 2000 Hz
(+) | ausgeglichene Mitten, vom Median nur 3.3% abweichend
(+) | lineare Mitten (5.9% Delta zum Vorgänger)
Hochtöne 2 - 16 kHz
(+) | ausgeglichene Hochtöne, vom Median nur 1.6% abweichend
(+) | sehr lineare Hochtöne (3.1% Delta zum Vorgänger)
Gesamt im hörbaren Bereich 100 - 16.000 Hz
(+) | hörbarer Bereich ist sehr linear (9.2% Abstand zum Median
Im Vergleich zu allen Geräten derselben Klasse
» 3% aller getesteten Geräte dieser Klasse waren besser, 1% vergleichbar, 96% schlechter
» Das beste Gerät hat einen Delta-Wert von 6%, durchschnittlich ist 18%, das schlechteste Gerät hat 132%
Im Vergleich zu allen Geräten im Test
» 3% aller getesteten Geräte waren besser, 1% vergleichbar, 96% schlechter
» Das beste Gerät hat einen Delta-Wert von 4%, durchschnittlich ist 24%, das schlechteste Gerät hat 134%
Energieaufnahme
Der Verbrauch konnte im Idle und auch sonst leicht zum Vorgänger verbessert werden. Allerdings eben nur auf geringem Niveau, selbst die 18-Zoll-Konkurrenz ist zumindest im Idle oftmals sparsamer.
Bei den Verbrauchsgraphen zeigt sich wieder das vermeintliche Problem des neuen Legion 9, denn immer mal wieder bricht der Verbrauch, und damit eben auch die Leistung, ganz kurz ein und zwar über diverse Tests hinweg. Was beim Cinebench 23 noch normal ist, ist es bei Witcher 3 oder Furmark nicht.
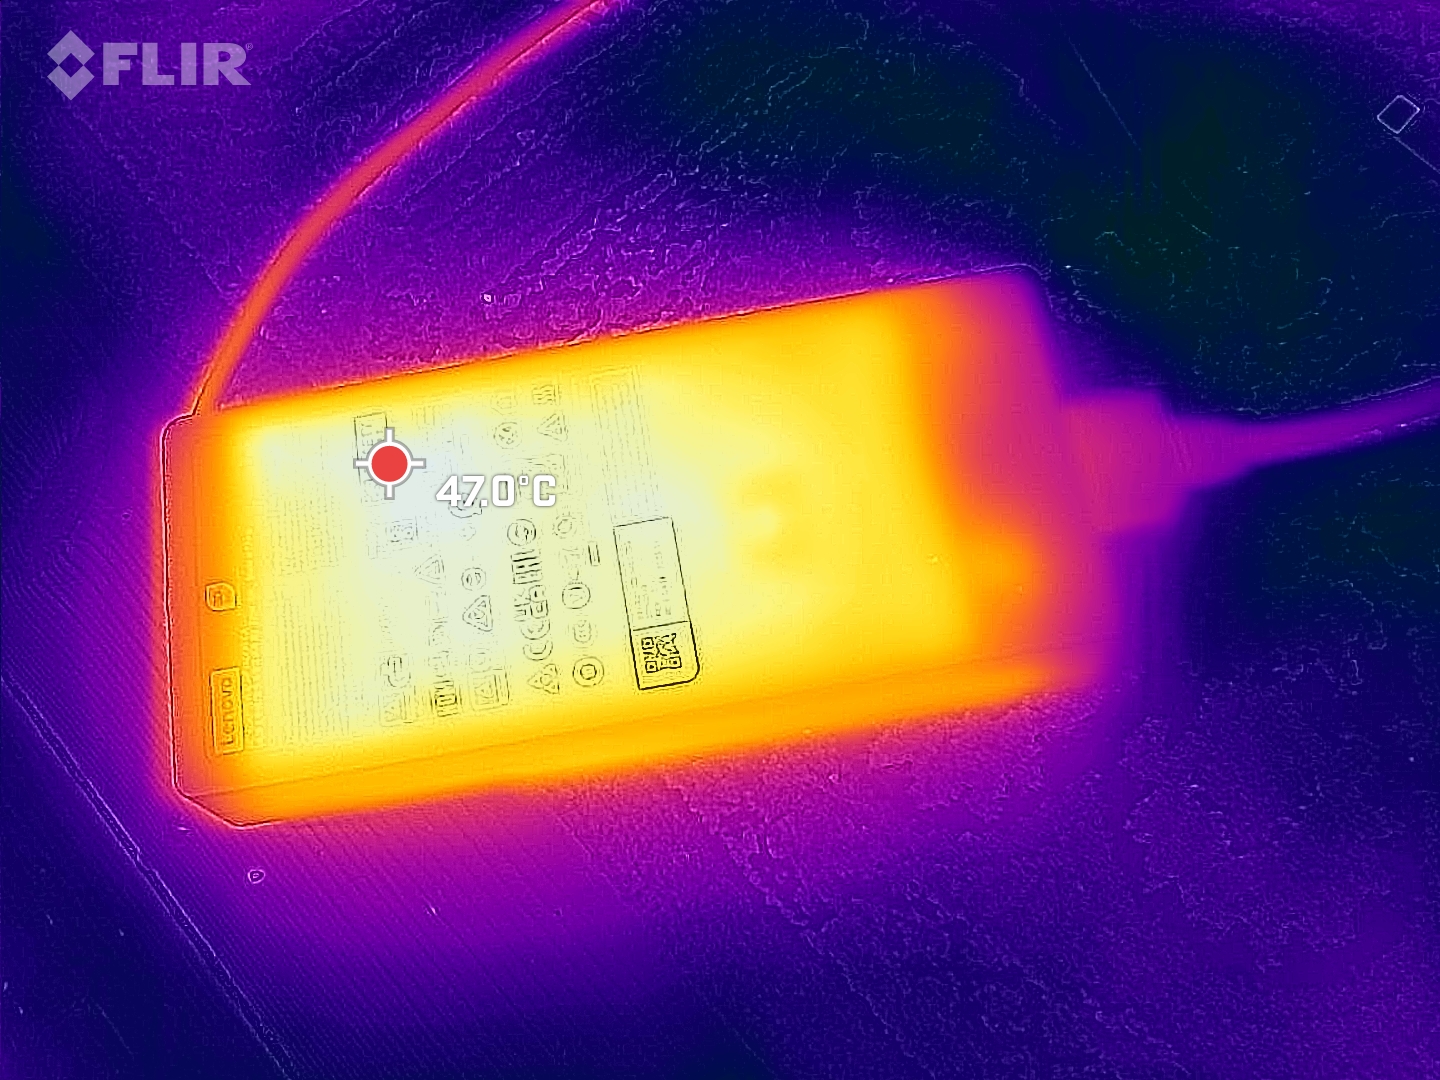
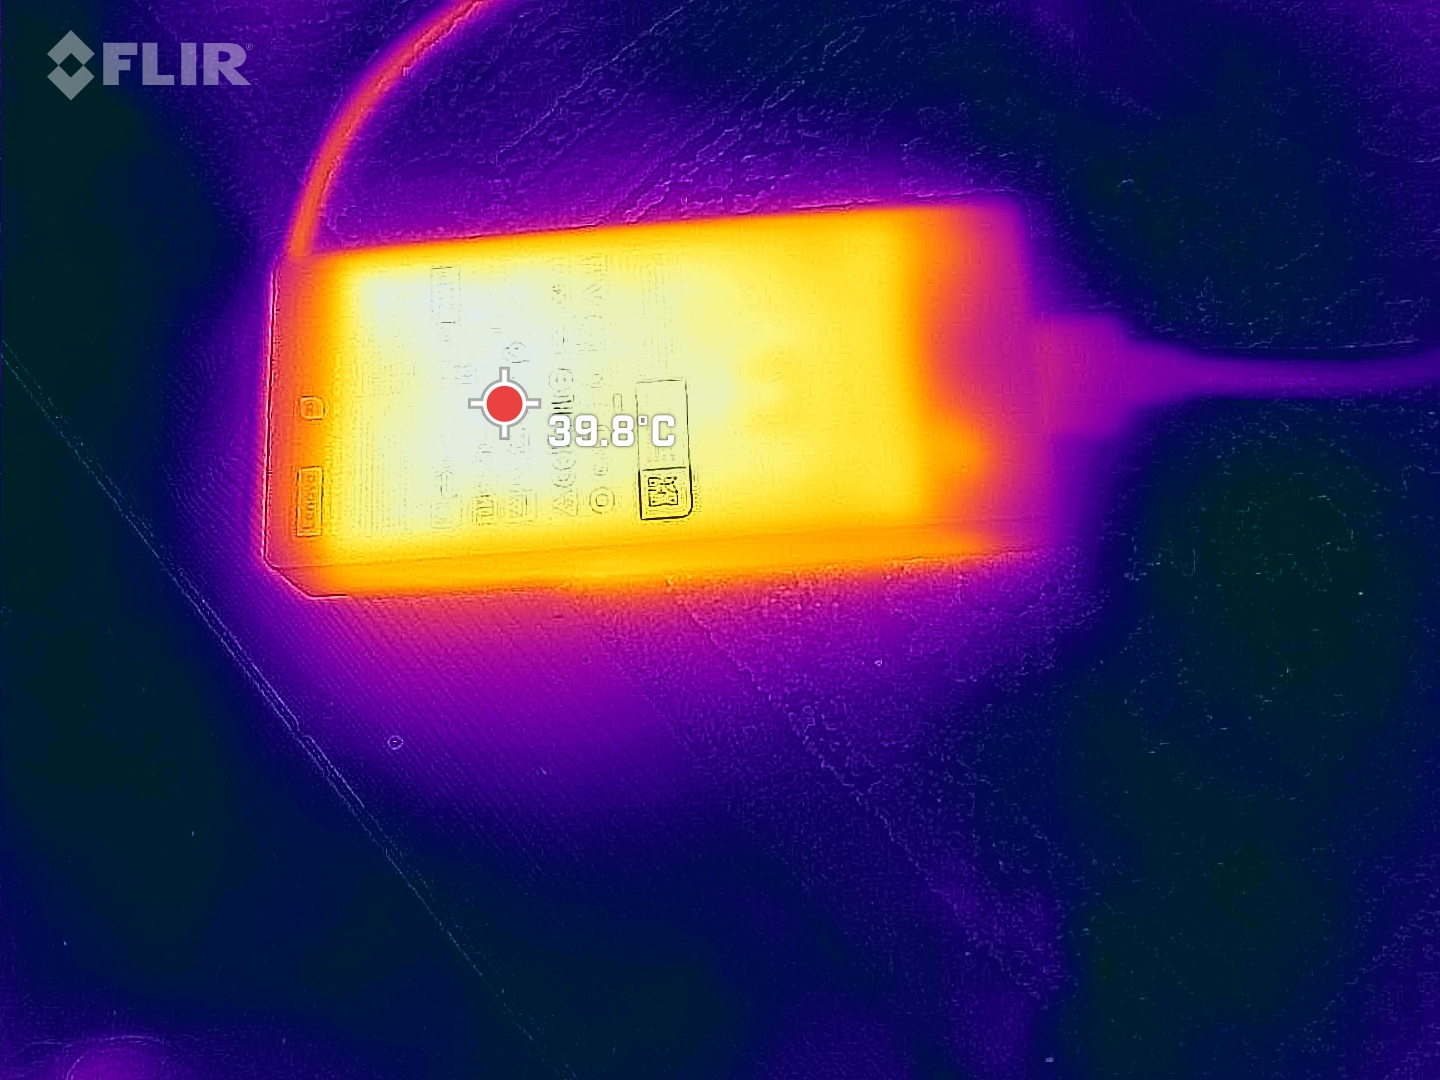
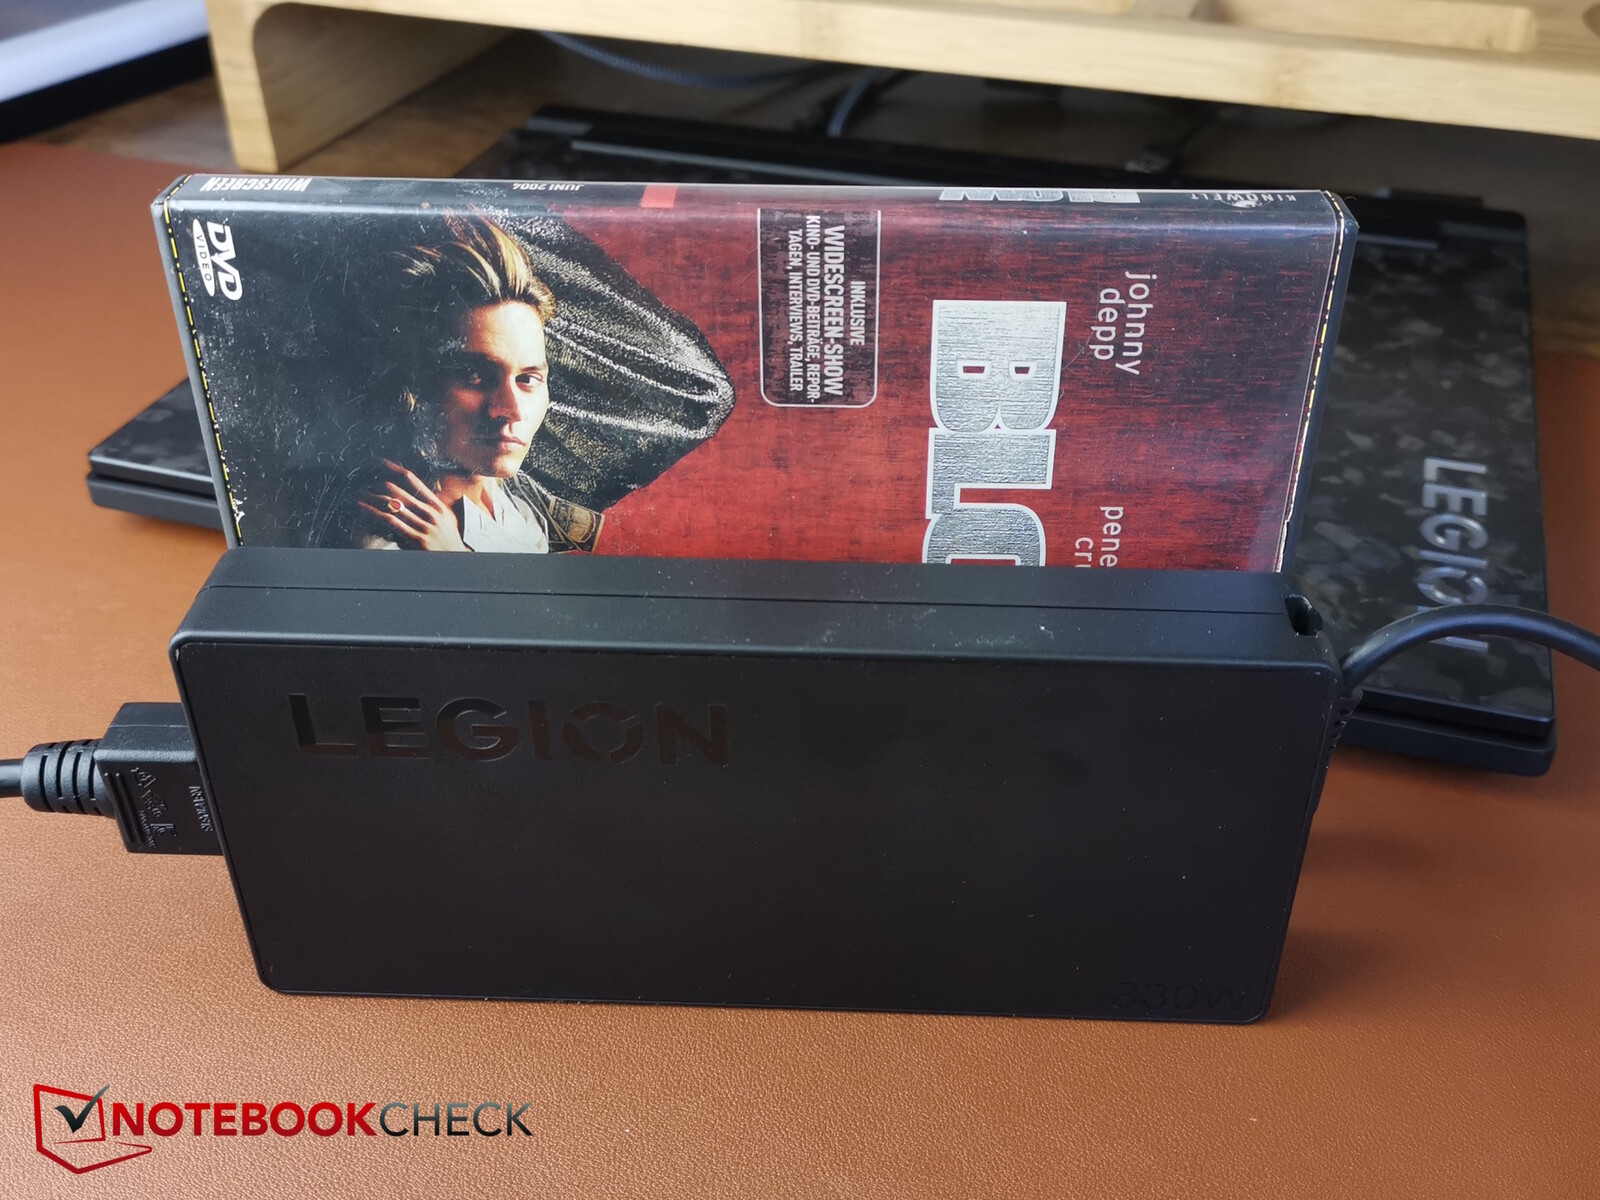
Wir messen einen kurzzeitigen Maximalverbrauch von 323 W aus dem flachen und vergleichsweise kleinen Netzteil. Letzteres ist auf 330 W ausgelegt und sollte somit keine Probleme haben den Laptop in allen Situationen gut mit Strom zu versorgen.
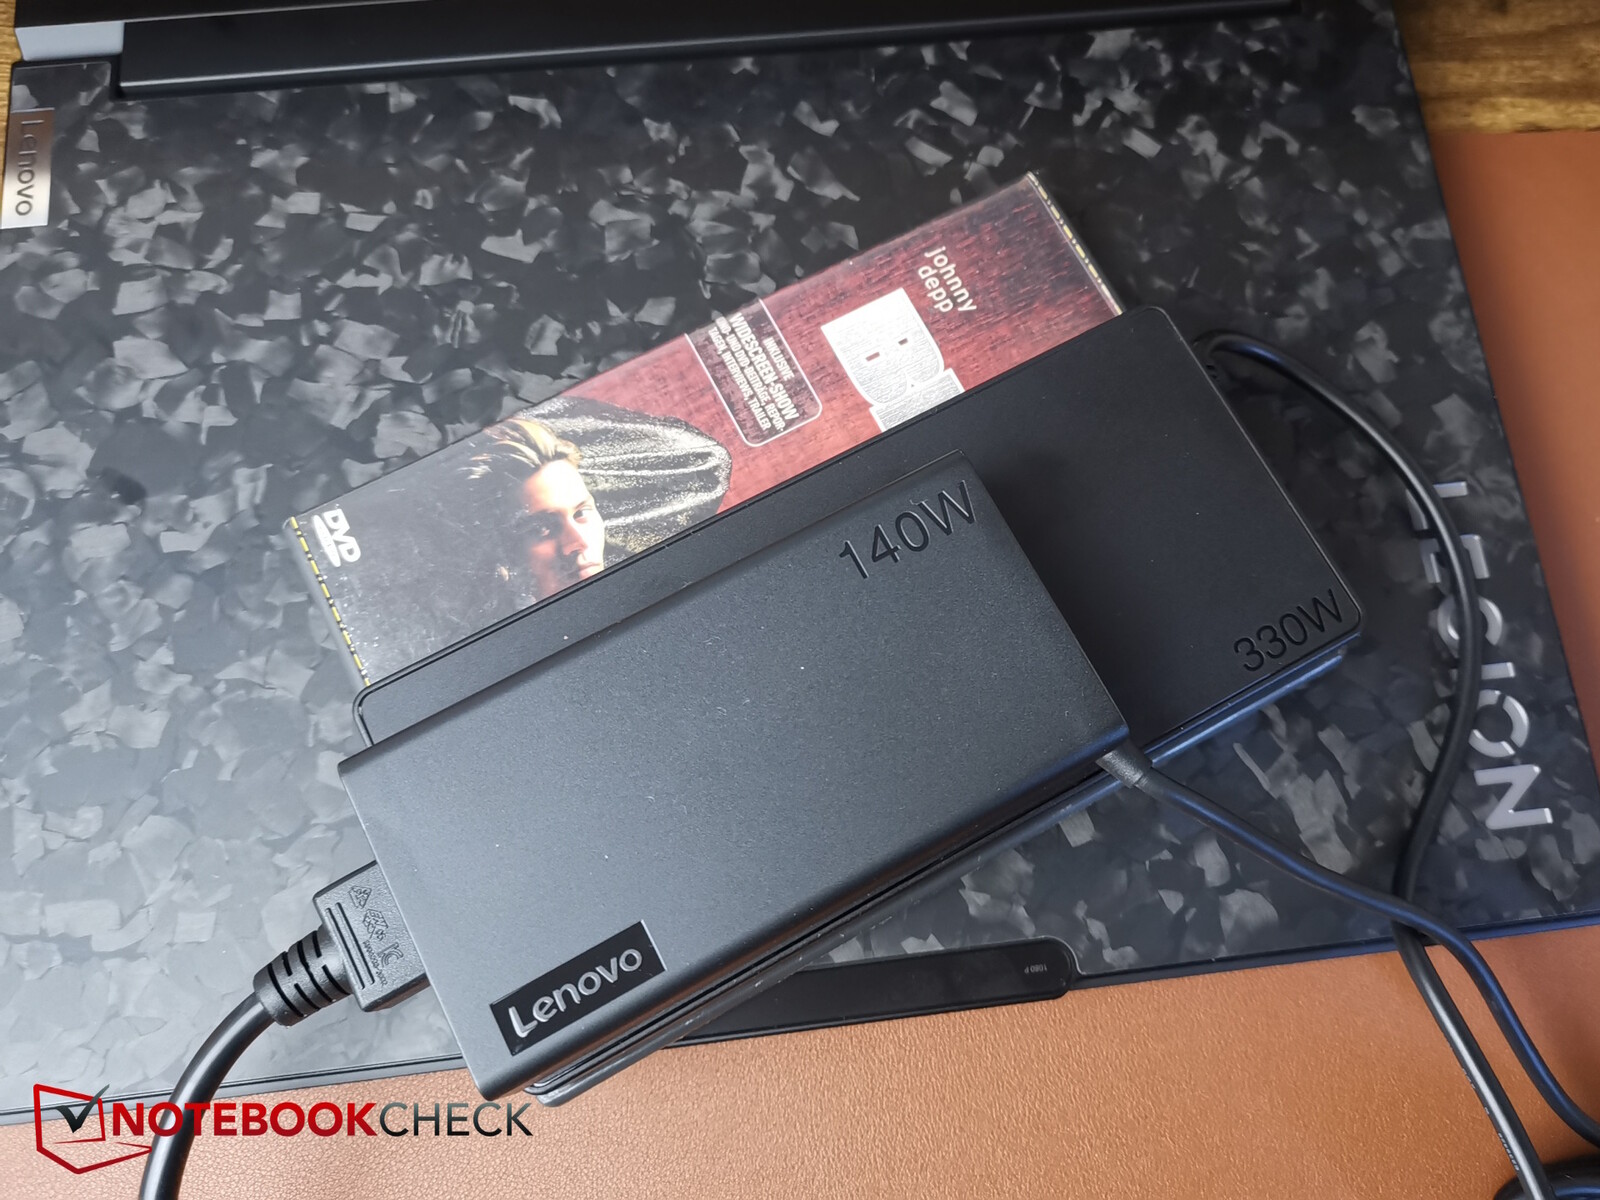
Ein Unikum: Als Beigabe liegt dem Legion 9 übrigens ein zweites Netzteil bei, ein nochmals deutlich kleineres USB-C-Netzteil mit 140 W. Wenn man nicht gerade am Gamen ist, ist der kleinere Adapter natürlich besonders für den mobilen Einsatz noch besser geeignet.
| Aus / Standby | |
| Idle | |
| Last |
|
Legende:
min: | |
| Lenovo Legion 9 16IRX9, RTX 4090 i9-14900HX, GeForce RTX 4090 Laptop GPU, Micron 3400 2TB MTFDKBA2T0TFH, MiniLED, 3200x2000, 16" | Lenovo Legion 9 16IRX8 i9-13980HX, GeForce RTX 4090 Laptop GPU, 2x SK Hynix HFS001TEJ9X115N (RAID 0), Mini-LED, 3200x2000, 16" | Razer Blade 16 2024, RTX 4090 i9-14900HX, GeForce RTX 4090 Laptop GPU, Samsung PM9A1 MZVL22T0HBLB, OLED, 2560x1600, 16" | Asus ROG Strix Scar 18 G834JYR (2024) i9-14900HX, GeForce RTX 4090 Laptop GPU, Samsung PM9A1a MZVL22T0HDLB, Mini LED, 2560x1600, 18" | Medion Erazer Beast X40 2024 i9-14900HX, GeForce RTX 4090 Laptop GPU, Phison E18-1TB-PHISON-SSD-BICS5, IPS, 2560x1600, 17" | Durchschnittliche NVIDIA GeForce RTX 4090 Laptop GPU | Durchschnitt der Klasse Gaming | |
|---|---|---|---|---|---|---|---|
| Stromverbrauch | -34% | 12% | 11% | 13% | 1% | 20% | |
| Idle min * (Watt) | 20.5 | 32.3 -58% | 16.9 18% | 14 32% | 7 66% | 16.2 ? 21% | 13.8 ? 33% |
| Idle avg * (Watt) | 27.7 | 42.6 -54% | 17.8 36% | 17 39% | 15 46% | 23.1 ? 17% | 19.5 ? 30% |
| Idle max * (Watt) | 32.1 | 57.9 -80% | 19.6 39% | 24 25% | 33 -3% | 34.2 ? -7% | 25.5 ? 21% |
| Last avg * (Watt) | 105 | 121 -15% | 128 -22% | 143 -36% | 134 -28% | 130.5 ? -24% | 110.6 ? -5% |
| Witcher 3 ultra * (Watt) | 246 | 254 -3% | 243 1% | 251 -2% | 280 -14% | ||
| Last max * (Watt) | 323 | 297.7 8% | 328 -2% | 302 7% | 294 9% | 324 ? -0% | 257 ? 20% |
* ... kleinere Werte sind besser
Energieaufnahme Witcher 3 / Stresstest
Energieaufnahme mit externem Monitor
Akkulaufzeit
Rund 100 Wh Kapazität weist der verbaute Akku auf, das ist ähnlich viel wie bei der Konkurrenz. Dennoch ist die Akkulaufzeit oftmals schwächer, ein Problem mit dem bereits der Vorgänger und auch andere Laptops mit MiniLED-Bildschirm zu kämpfen haben. Die Laufzeiten sind zwar verbessert worden, dennoch holen die Vergleichsgeräte, abgesehen vom Alienware, mehr Laufzeit aus ihren Akkus heraus. Das gilt z.B. auch für das Asus ROG Scar Strix, ebenfalls mit MiniLED-Display.
So reicht es aber immerhin noch für knapp unter 5 Stunden Video schauen oder Surfen bei auf 150 Nits reduzierter Helligkeit. Das Asus hält hier über 6 Stunden durch.
Beim Wiederaufladen unterstützt das Lenovo eine Schnellladefunktion, die zunächst in der Vantage-Software aktiviert werden will. Danach dauert eine Komplettladung nur rund eine Stunde.
| Lenovo Legion 9 16IRX9, RTX 4090 i9-14900HX, GeForce RTX 4090 Laptop GPU, 99.99 Wh | Lenovo Legion 9 16IRX8 i9-13980HX, GeForce RTX 4090 Laptop GPU, 99.9 Wh | Razer Blade 16 2024, RTX 4090 i9-14900HX, GeForce RTX 4090 Laptop GPU, 95.2 Wh | Alienware m18 R2 i9-14900HX, GeForce RTX 4090 Laptop GPU, 97 Wh | Asus ROG Strix Scar 18 G834JYR (2024) i9-14900HX, GeForce RTX 4090 Laptop GPU, 90 Wh | Medion Erazer Beast X40 2024 i9-14900HX, GeForce RTX 4090 Laptop GPU, 99.8 Wh | Durchschnitt der Klasse Gaming | |
|---|---|---|---|---|---|---|---|
| Akkulaufzeit | -50% | 10% | 0% | 24% | 29% | 23% | |
| H.264 (h) | 4.9 | 7.6 55% | 7.5 53% | 7.93 ? 62% | |||
| WLAN (h) | 4.8 | 2.7 -44% | 5.5 15% | 4.8 0% | 7.7 60% | 6.2 29% | 6.67 ? 39% |
| Last (h) | 2.2 | 1 -55% | 1.3 -41% | 1.3 -41% | 1.483 ? -33% | ||
| Idle (h) | 6.7 | 10.2 | 9.06 ? |
Pro
Contra
Fazit - Mehr Probleme als erwartet
Das Lenovo Legion 9i ist, auch vom Preis her, ein High-End-Gamer, hat ein ansprechendes Design, gute Materialien, eine gute Verarbeitung und besticht außerdem durch sein helles MiniLED-Display mit HDR1000. Auch das im Vergleich zur Konkurrenz flache Netzteil sowie das zusätzliche USB-C-Netzteil mit 140 W sind Pluspunkte.
Während aber die kleineren Legion-Modelle mit einer guten Systemoptimierung überzeugen, gibt es beim Topmodell deutlich mehr Schwächen und Probleme als erwartet. Allen voran stören die Latenzprobleme, die sich nicht nur bei LatencyMon zeigen, sondern auch bei der Speicherlatenz und sogar in Spielen sicht- und spürbar werden und sich als kurze Framerateneinbrüche bemerkbar machen. Dazu kommt die ungewöhnlich schwache Single-Core-Leistung. Ein weiteres, größeres Ärgernis ist das suboptimal eingestellte Kühlsystem. Offenbar kühlt es zu spät und teils auch zu wenig, sodass beispielsweise die SSD anfangs gedrosselt wird. Trotzdem wird es unter hoher Last sehr laut, verhindert aber besonders hohe Oberflächentemperaturen dennoch weniger gut als die Konkurrenz. Dazu gibt es zwar verbesserte, aber weiterhin schwache Akkulaufzeiten. Insgesamt also viel Verbesserungspotential.
Das Legion 9i ist ein stylischer High-End-Gamer, aber anders als die kleineren Legion-Modelle wird ausgerechnet das teure High-End-Modell von ärgerlichen Problemen wie ein suboptimales Kühlsystem und große Latenzprobleme geplagt.
Als Alternative empfiehlt sich beispielsweise das Razer Blade 16, das trotz seiner geringeren Abmaße nicht weniger leistet als das Legion 9i und an weniger Problemen leidet. Daneben wirkte der Vorgänger ausgereifter und kann durch die Probleme des Nachfolgers sogar mit einer eher höheren Leistung auftrumpfen. Aktuell ist das neue Legion 9i daher keinen Kauf wert.
Preis und Verfügbarkeit
Unsere Konfiguration des Lenovo Legion 9 16IRX9 oder Lenovo Legion 9i ist direkt bei Lenovo für 4.899 Euro zu haben.
Hinweis: Wir haben unser Rating-System kürzlich aktualisiert und die Ergebnisse von Version 8 sind nicht mit den Ergebnissen von Version 7 vergleichbar. Weitere Informationen dazu sind hier verfügbar.
Lenovo Legion 9 16IRX9, RTX 4090
- 27.09.2024 v8
Christian Hintze
 Total Sustainability Score:
 Transparenz
Die Auswahl der zu testenden Geräte erfolgt innerhalb der Redaktion. Das vorliegende Testmuster wurde dem Autor vom Hersteller oder einem Shop zu Testzwecken leihweise zur Verfügung gestellt. Eine Einflussnahme des Leihstellers auf den Testbericht gab es nicht, der Hersteller erhielt keine Version des Reviews vor der Veröffentlichung. Es bestand keine Verpflichtung zur Publikation. Als eigenständiges, unabhängiges Unternehmen unterliegt Notebookcheck keiner Diktion von Herstellern, Shops und Verlagen.
So testet Notebookcheck
Pro Jahr werden von Notebookcheck hunderte Laptops und Smartphones unabhängig in von uns standardisierten technischen Verfahren getestet, um eine Vergleichbarkeit aller Testergebnisse zu gewährleisten. Seit rund 20 Jahren entwickeln wir diese Testmethoden kontinuierlich weiter und setzen damit Branchenstandards. In unseren Testlaboren kommt ausschließlich hochwertiges Messequipment in die Hände erfahrener Techniker und Redakteure. Die Tests unterliegen einer mehrstufigen Kontrolle. Unsere komplexe Gesamtbewertung basiert auf hunderten fundierten Messergebnissen und Benchmarks, womit Ihnen Objektivität garantiert ist. Weitere Informationen zu unseren Testmethoden gibt es hier.
Preisvergleich
