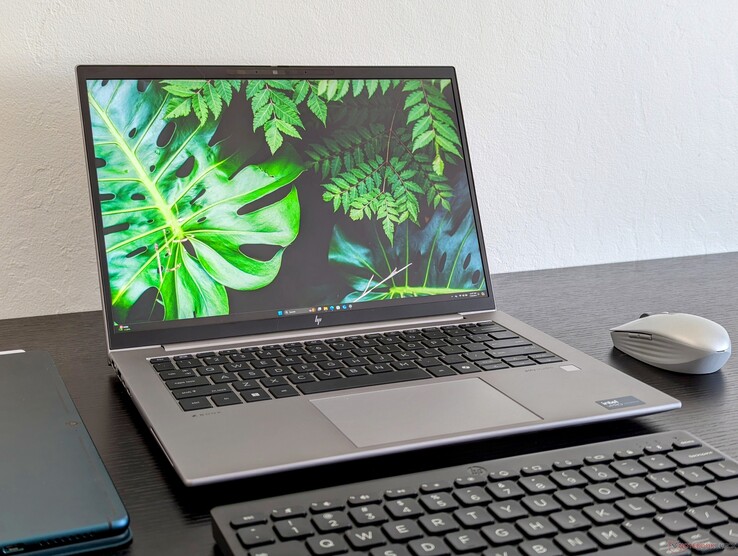
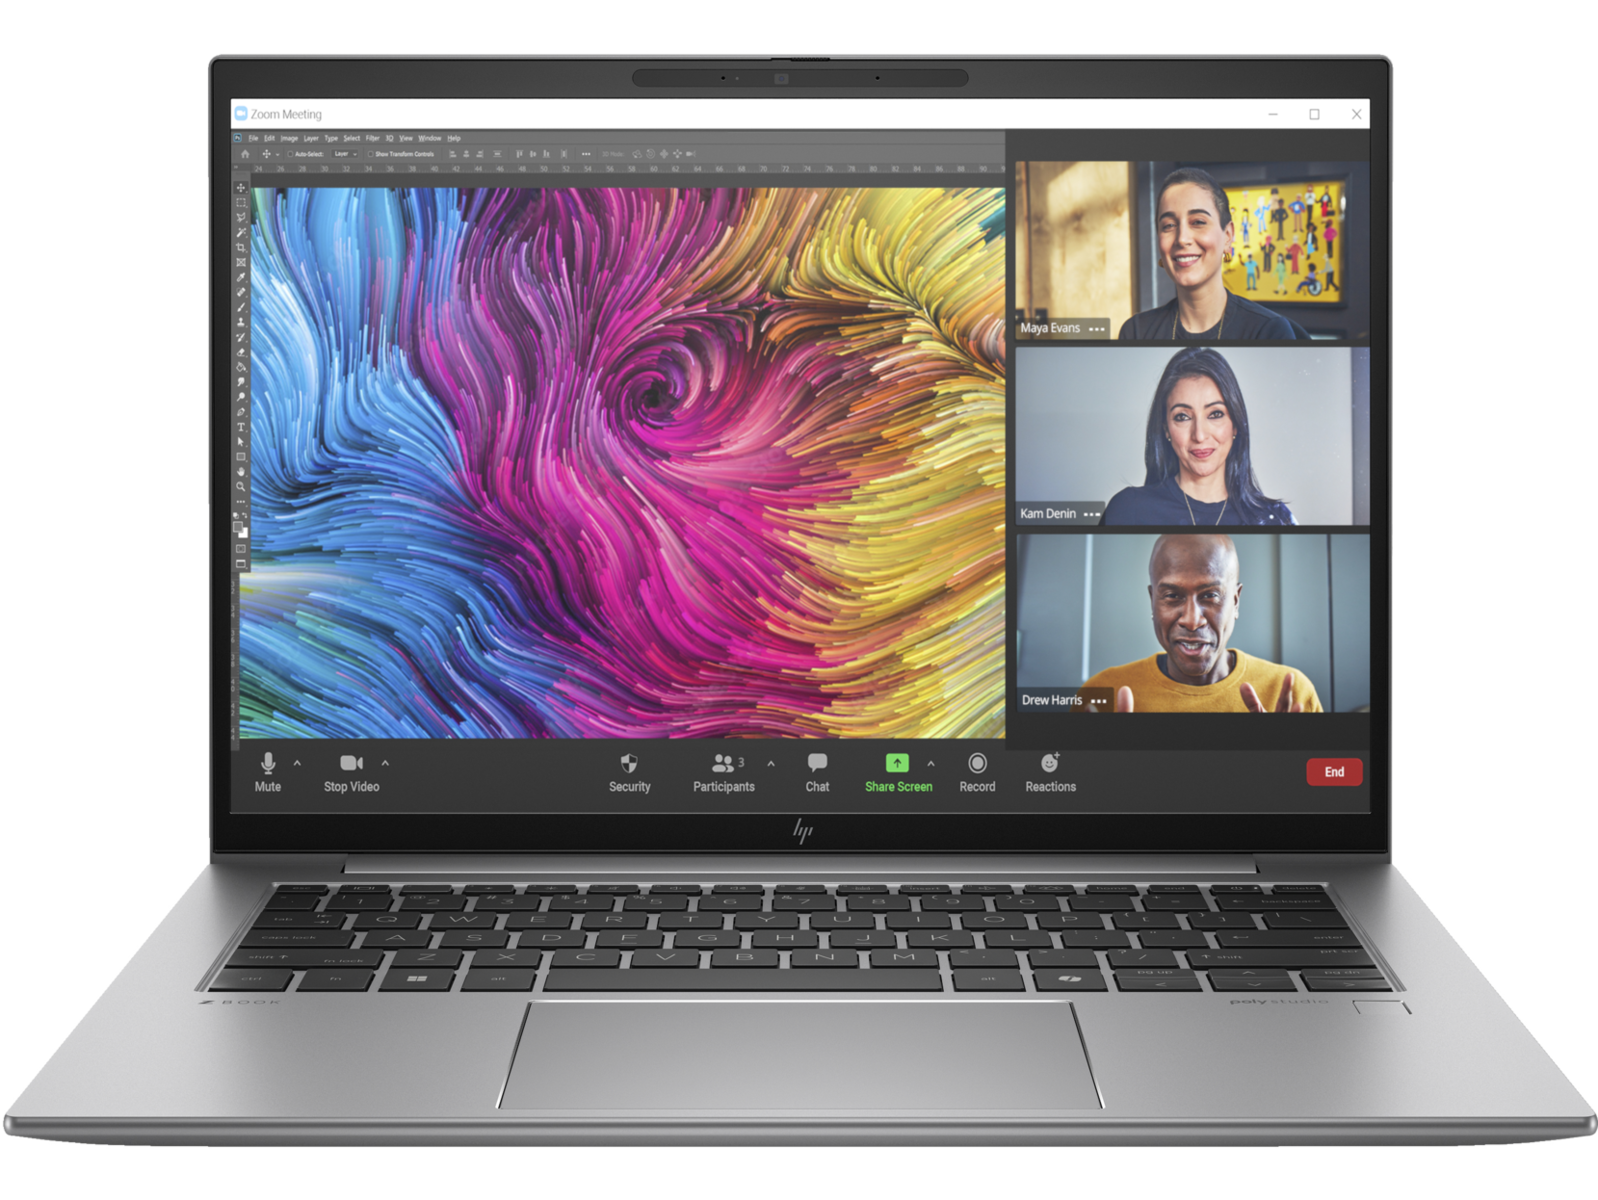
HP ZBook Firefly 14 G11 im Laptop-Test: Core-Ultra-Update mit Nvidia RTX A500
In diesem Jahr wird das ZBook Firefly 14 bereits zum 11. Mal in Folge aufgefrischt. Dementsprechend wird es als ZBook Firefly 14 G11 bezeichnet und beerbt den Vorgänger ZBook Firefly 14 G10, indem die CPU auf Intel Meteor Lake gebracht wird und die diskreten Grafikoptionen aufgefrischt werden. Auf der anderen Seite bleibt das Gehäuse unverändert, sodass wir unseren Test zum Firefly 14 G10 oder auch G9 empfehlen, um mehr über die physischen Merkmale des Modells zu erfahren.
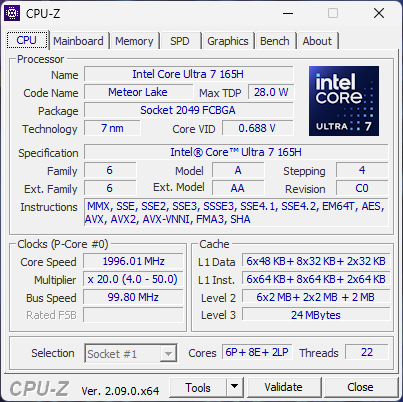
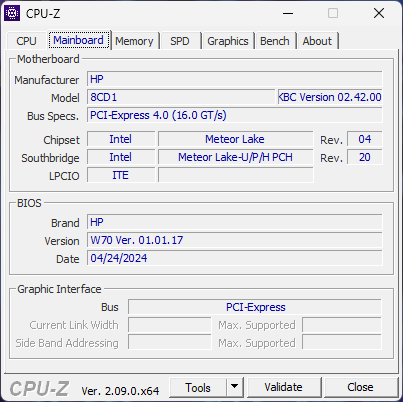
Bei unserer Testeinheit handelt es sich um eine der besser ausgestatteten Konfigurationen, sie beinhaltet den mit vPro-aktivierten Core Ultra 7 165H CPU, eine RTX A500 GPU sowie ein 2.560 x 1.600 Pixeln auflösendes IPS-Display zum Preis von rund 2.200 Euro. Wie bei den ZBooks üblich, sind die Konfigurationsmöglichkeiten vielseitiger als bei den meisten Consumermodellen, alleine die Spannweite bei den CPUs reicht vom Core Ultra 5 125U bis hinauf zum Core Ultra 7 165H, dazu gibt es entweder eine integrierte Grafik oder aber eine Nvidia RTX A500 graphics. Auch AMD-SKUs mit Ryzen Zen 4 sind verfügbar, dann unter der Bezeichnung ZBook Firefly 14 G11 A.
Alternativen zum ZBook Firefly 14 beinhalten andere dünne und mobile 14-Zoll-Workstations wie das Dell Precision 5490 oder das Lenovo ThinkPad P14s G4.
Weitere HP-Tests:
Preisvergleich
Potentielle Konkurrenten im Vergleich
Bew. | Version | Datum | Modell | Gewicht | Dicke | Größe | Auflösung | Preis ab |
|---|---|---|---|---|---|---|---|---|
| 80.3 % | v8 | 07 / 2024 | HP ZBook Firefly 14 G11 Ultra 7 165H, RTX A500 Laptop GPU | 1.5 kg | 19.2 mm | 14.00" | 2560x1600 | |
| 87.4 % v7 (old) | v7 (old) | 10 / 2023 | HP ZBook Firefly 14 G10 A R5 PRO 7640HS, Radeon 760M | 1.5 kg | 20 mm | 14.00" | 1920x1200 | |
| 83.6 % v7 (old) | v7 (old) | 10 / 2022 | HP ZBook Firefly 14 G9-6B8A2EA i7-1265U, T550 Laptop GPU | 1.5 kg | 19.9 mm | 14.00" | 1920x1200 | |
| 89.3 % v7 (old) | v7 (old) | 04 / 2024 | Dell Precision 5000 5490 Ultra 9 185H, RTX 3000 Ada Generation Laptop | 1.6 kg | 18.95 mm | 14.00" | 2560x1600 | |
| 81 % | v8 | 06 / 2024 | Lenovo ThinkPad P14s G4 21HF0017GE i7-1370P, RTX A500 Laptop GPU | 1.5 kg | 22.7 mm | 14.00" | 2880x1800 | |
| 84.3 % v7 (old) | v7 (old) | 04 / 2024 | Asus ExpertBook B3 B3404CVF i7-1355U, GeForce RTX 2050 Mobile | 1.7 kg | 23.9 mm | 14.00" | 1920x1200 |
Hinweis: Wir haben unser Rating-System kürzlich aktualisiert und die Ergebnisse von Version 8 sind nicht mit den Ergebnissen von Version 7 vergleichbar. Weitere Informationen dazu sind hier verfügbar.
Note: We have recently updated our rating system and the results of version 8 are not comparable with the results of version 7. More information is available here .
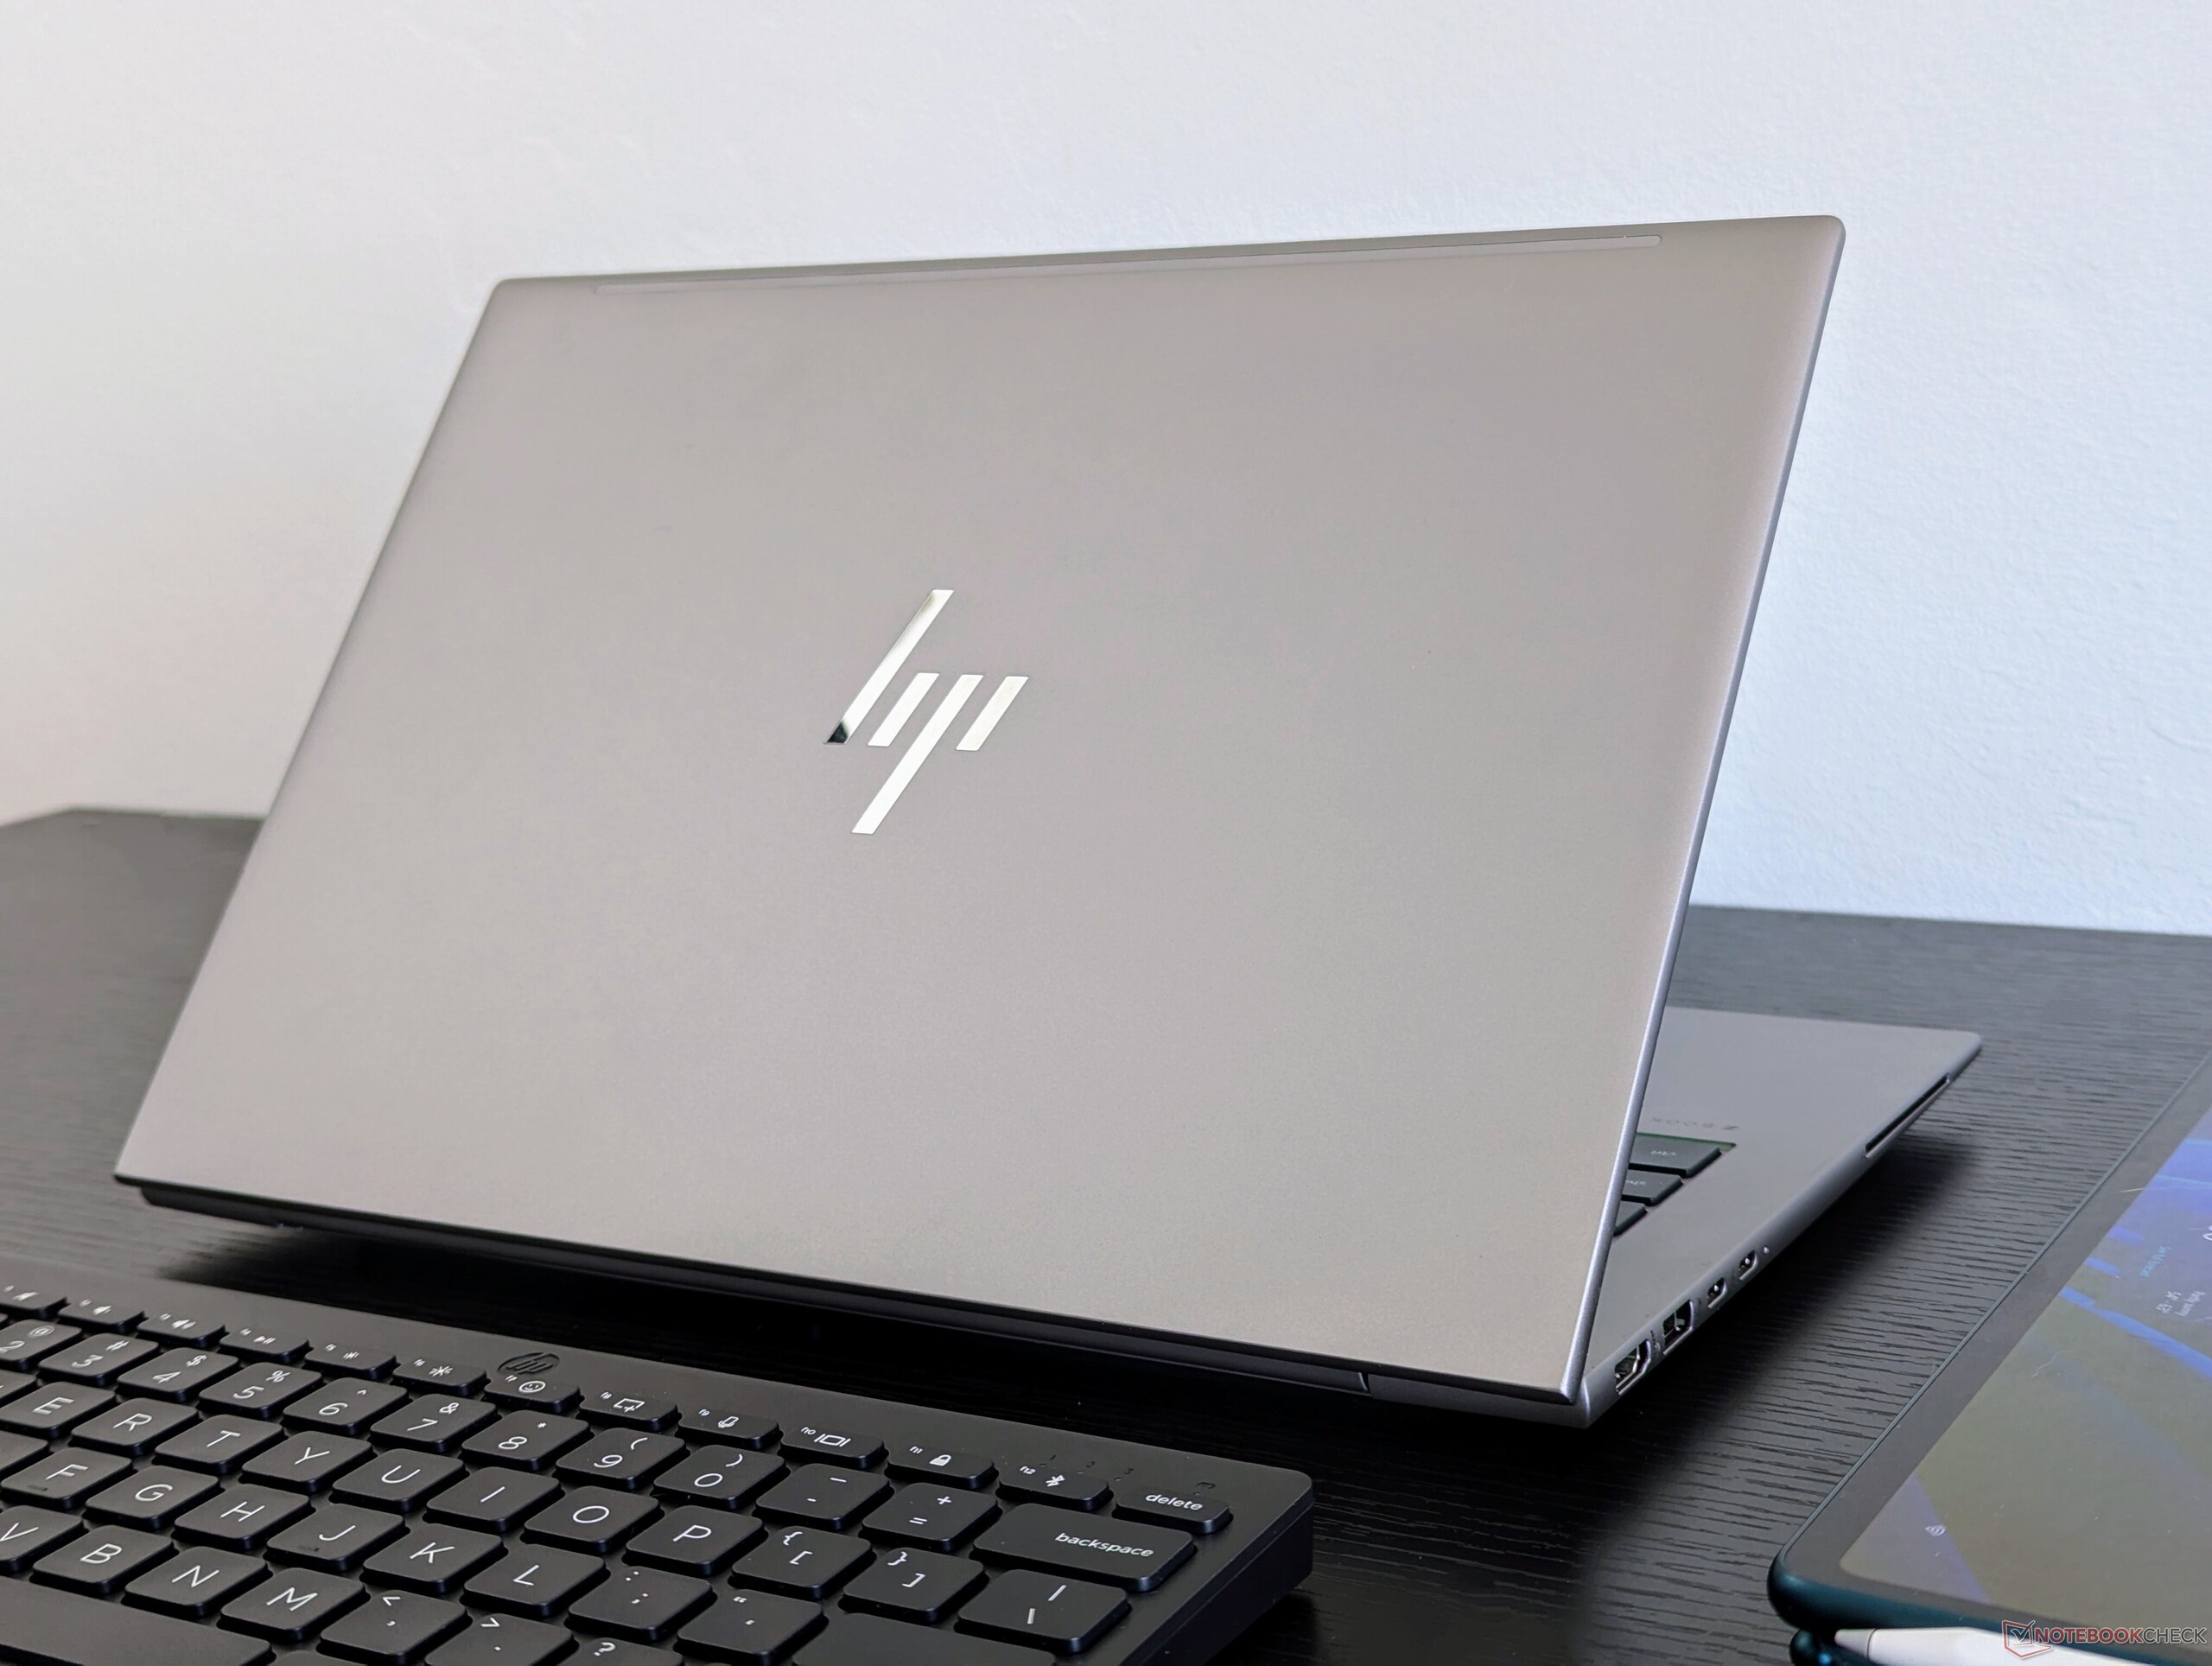
Gehäuse — Bekannter ZBook-Look
Zwar bleibt das Gehäuse unverändert, trotzdem lässt sich das neue ZBook Firefly 14 G11 durch einen Blick auf die neue Co-Pilot-Taste von seinen Vorgängern unterscheiden. Die meisten Windows-PCs auf Basis von Meteor Lake haben eine Co-Pilot-Taste integriert, es wird erwartet, dass diese mit zukünftigen KI-Funktionen kompatibel sein wird.
Konnektivität


Kommunikation
| Networking | |
| iperf3 transmit AX12 | |
| HP ZBook Firefly 14 G8 2C9Q2EA | |
| iperf3 receive AX12 | |
| HP ZBook Firefly 14 G8 2C9Q2EA | |
| iperf3 transmit AXE11000 | |
| HP ZBook Firefly 14 G11 | |
| Asus ExpertBook B3 B3404CVF | |
| Dell Precision 5000 5490 | |
| HP ZBook Firefly 14 G10 A | |
| Lenovo ThinkPad P14s G4 21HF0017GE | |
| iperf3 receive AXE11000 | |
| HP ZBook Firefly 14 G10 A | |
| Lenovo ThinkPad P14s G4 21HF0017GE | |
| HP ZBook Firefly 14 G11 | |
| Asus ExpertBook B3 B3404CVF | |
| Dell Precision 5000 5490 | |
| iperf3 transmit AXE11000 6GHz | |
| Asus ExpertBook B3 B3404CVF | |
| HP ZBook Firefly 14 G11 | |
| Dell Precision 5000 5490 | |
| Lenovo ThinkPad P14s G4 21HF0017GE | |
| iperf3 receive AXE11000 6GHz | |
| HP ZBook Firefly 14 G11 | |
| Lenovo ThinkPad P14s G4 21HF0017GE | |
| Dell Precision 5000 5490 | |
| Asus ExpertBook B3 B3404CVF | |
Webcam
Die 5-MP-Webcam hat sich seit dem 2023er Modell nicht verändert. Es ist sowohl ein IR-Sensor als auch ein physischer Shutter verbaut.


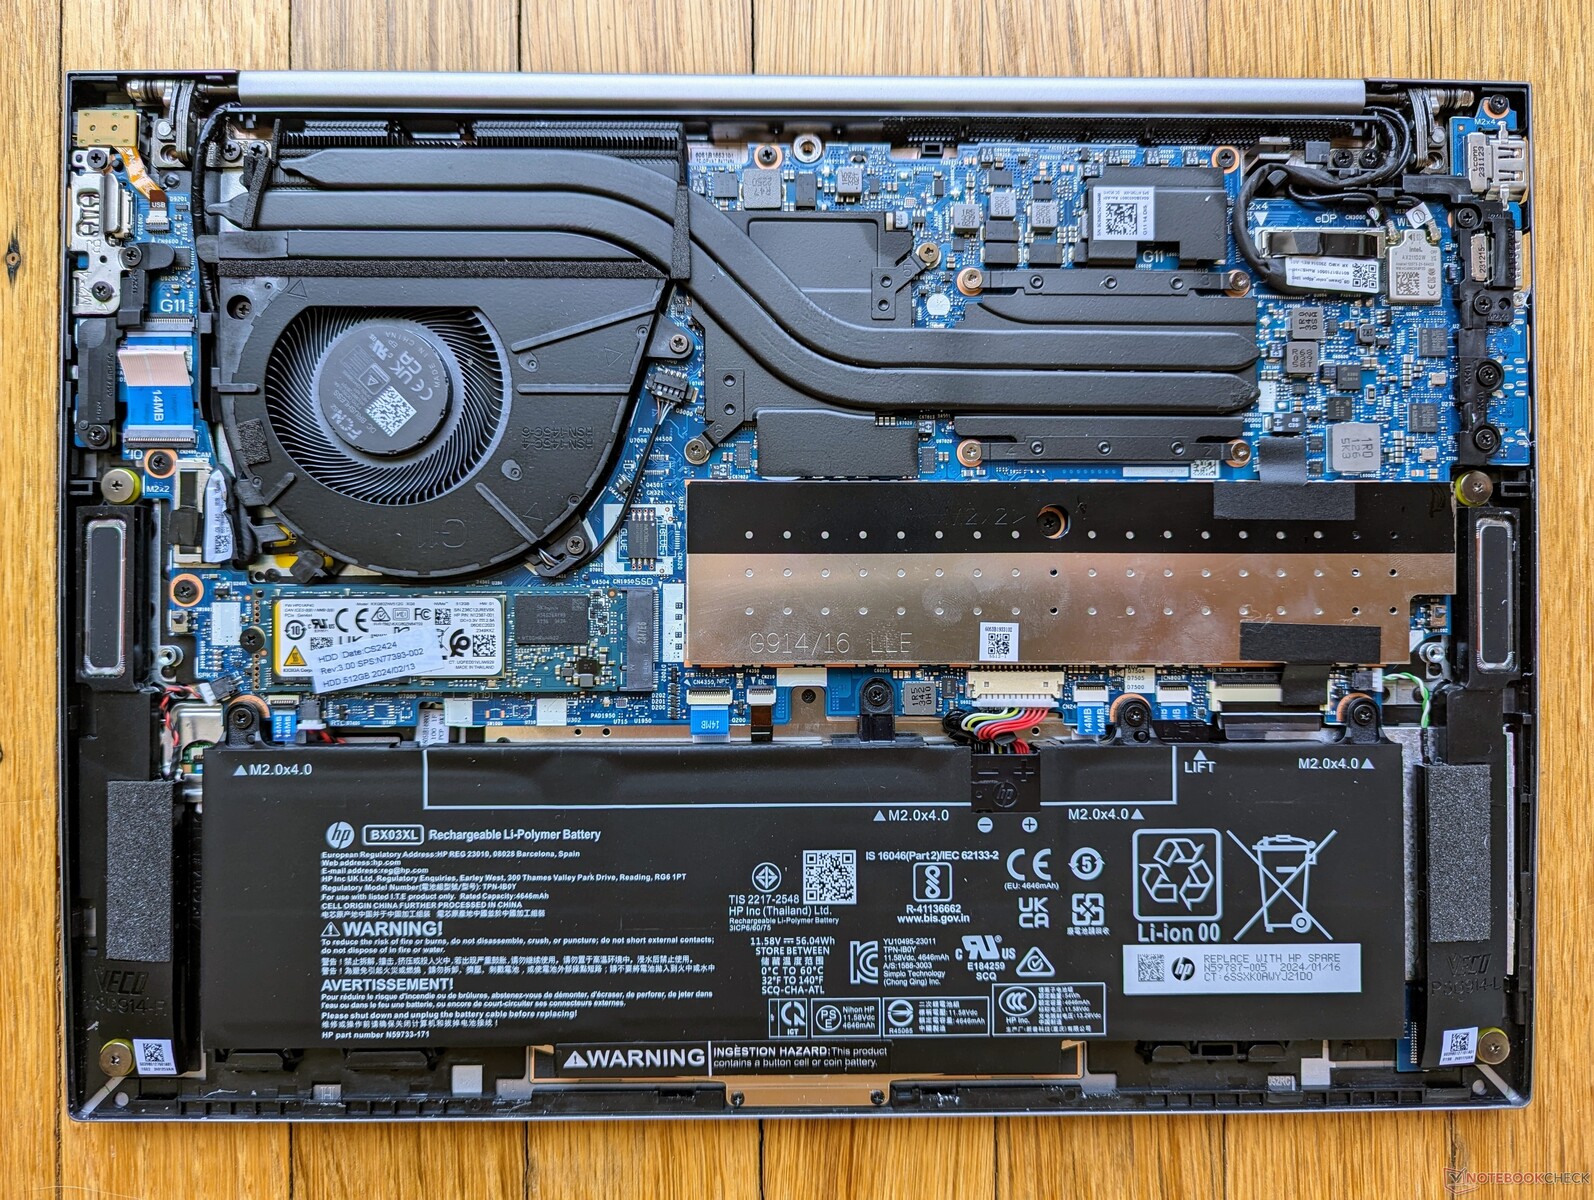
Wartung
Die Unterseite verlangt nur einen Kreuzschraubendreher, was für eine leichte Wartbarkeit sorgt. Im Inneren hat sich seit dem 2022er ZBook Firefly 14 G9 kaum etwas verändert.

Garantie
Die Garantie beträgt in Deutschland nur 1 Jahr, während größere ZBook-Modelle typischerweise drei Jahre Garantie bekommen.
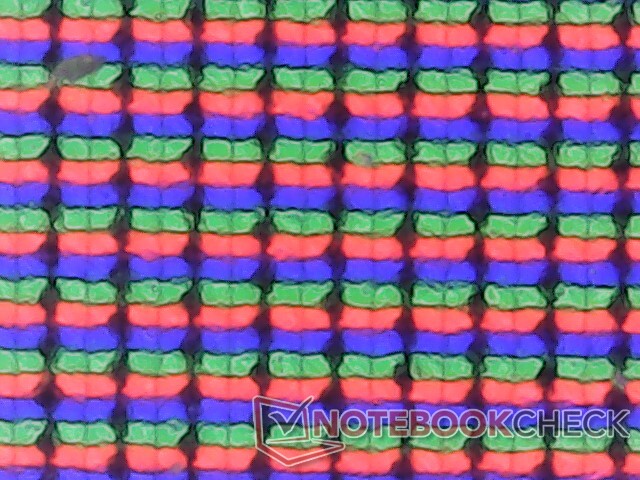
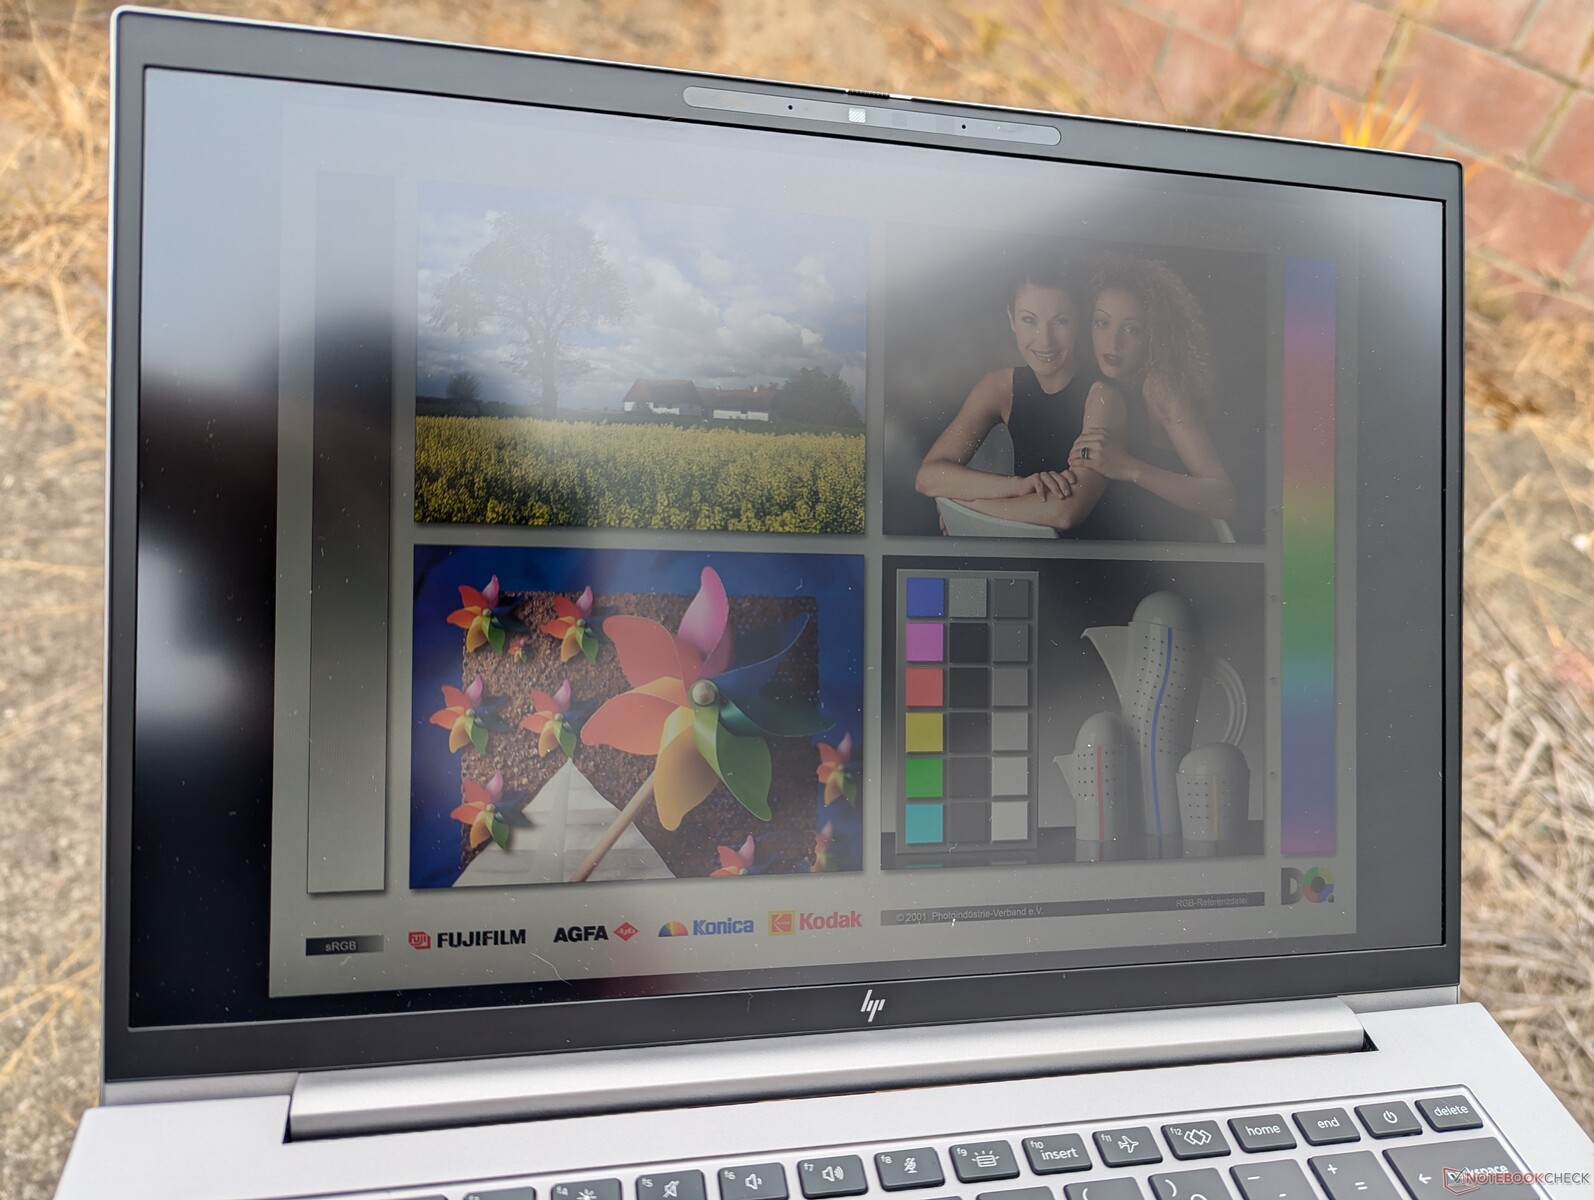
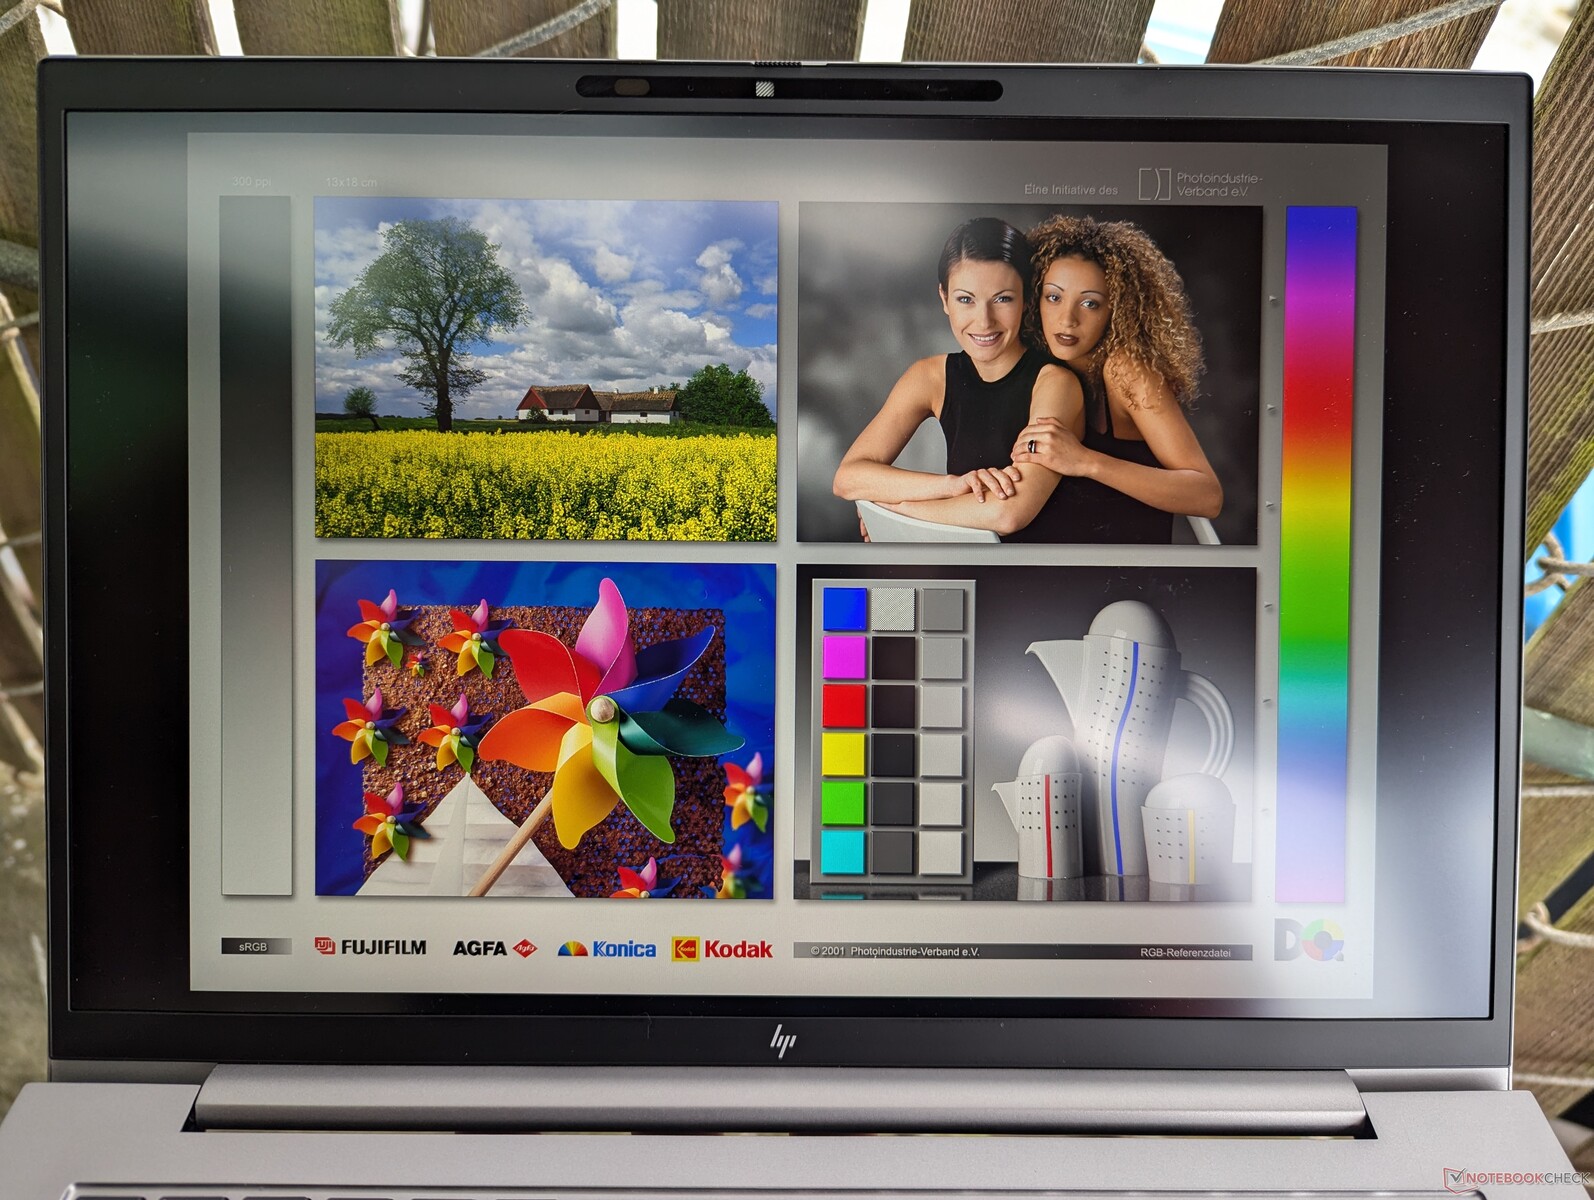
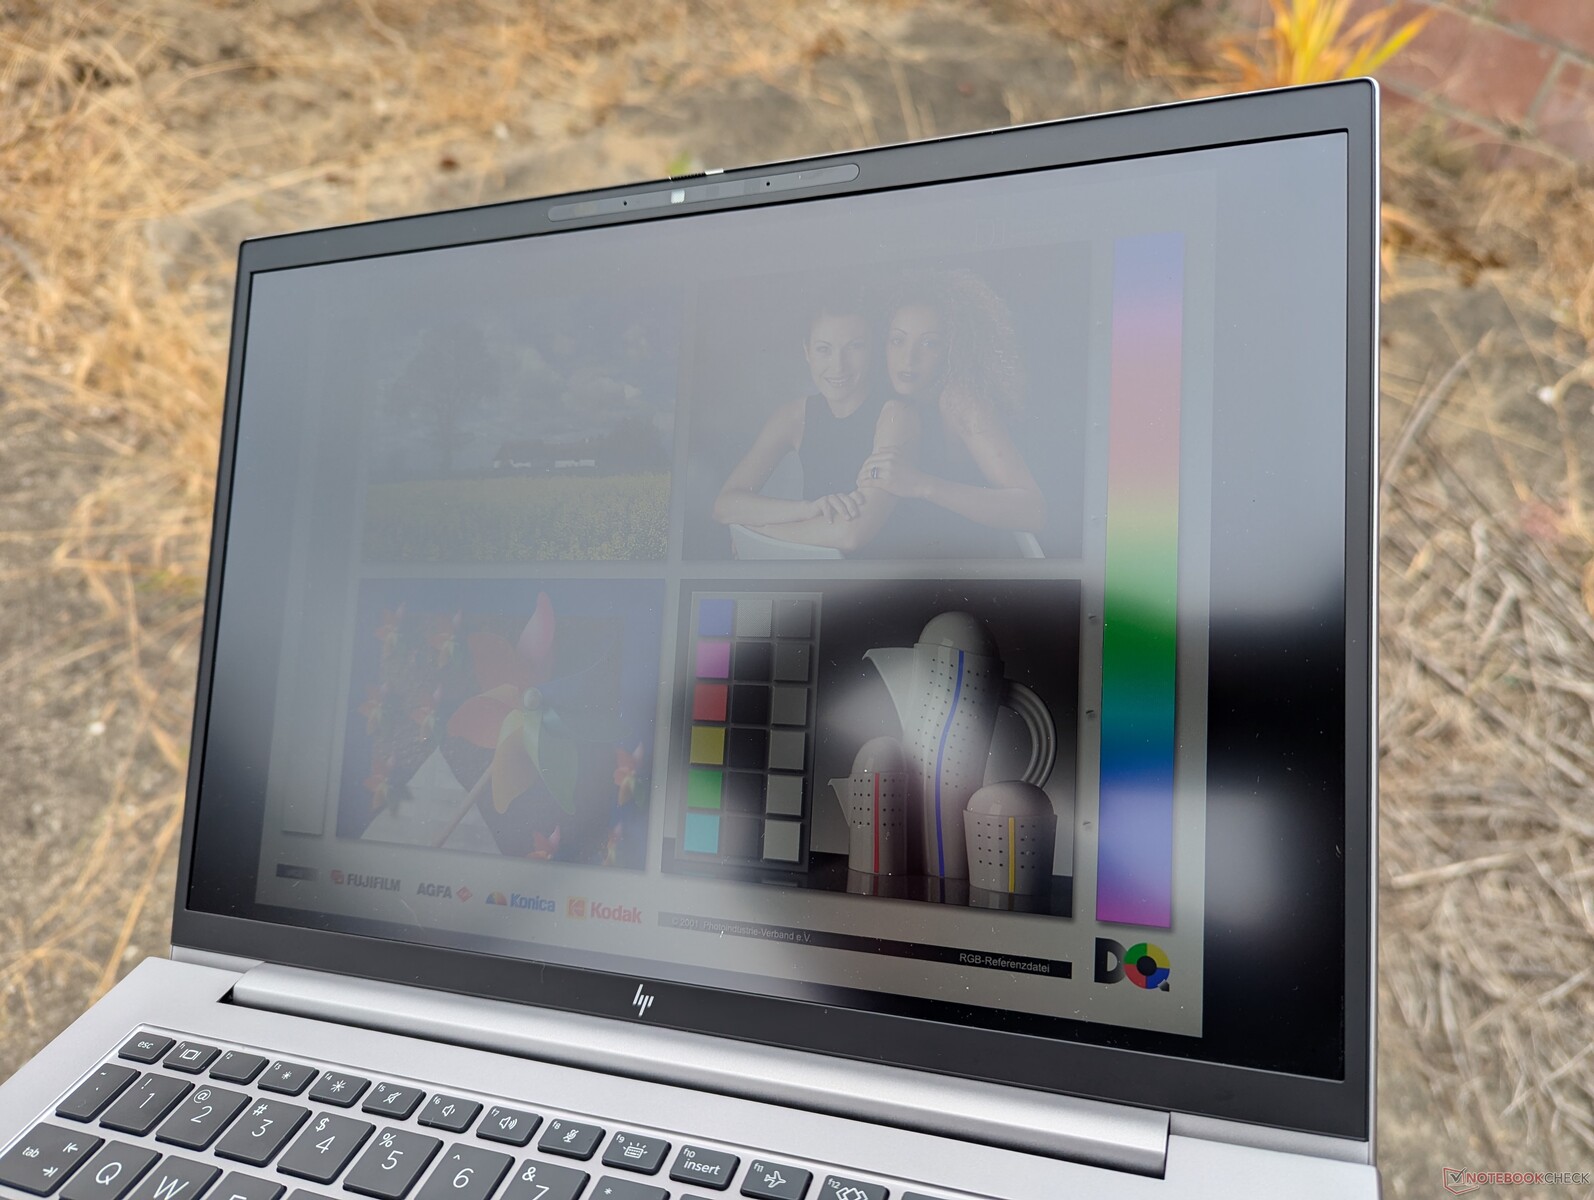
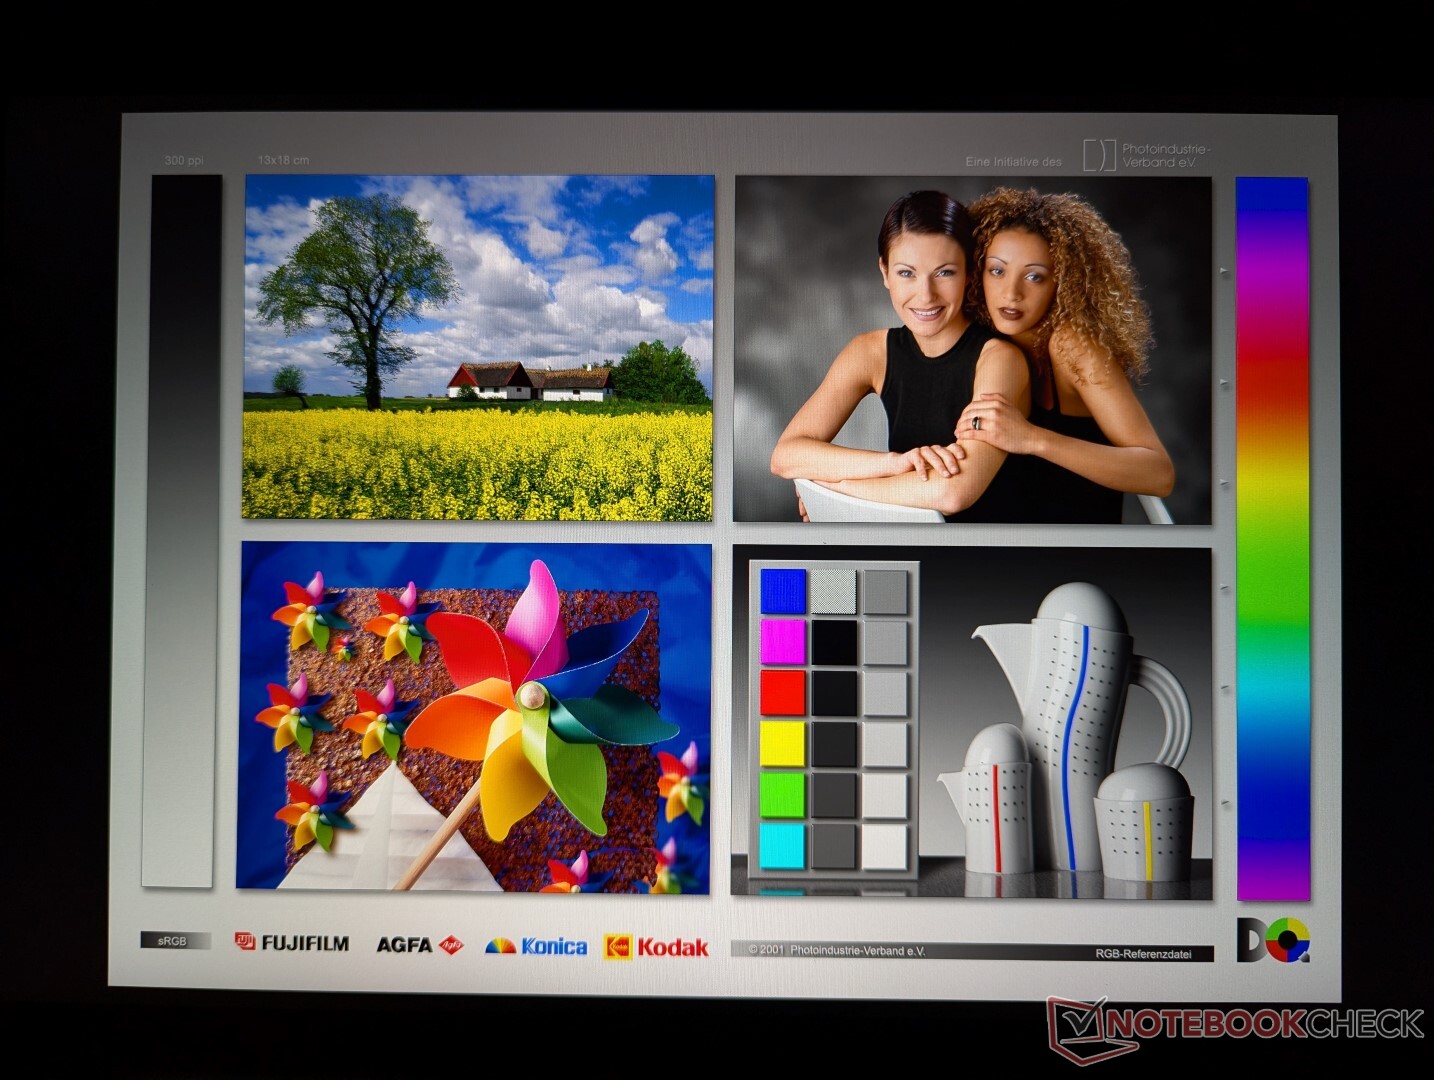
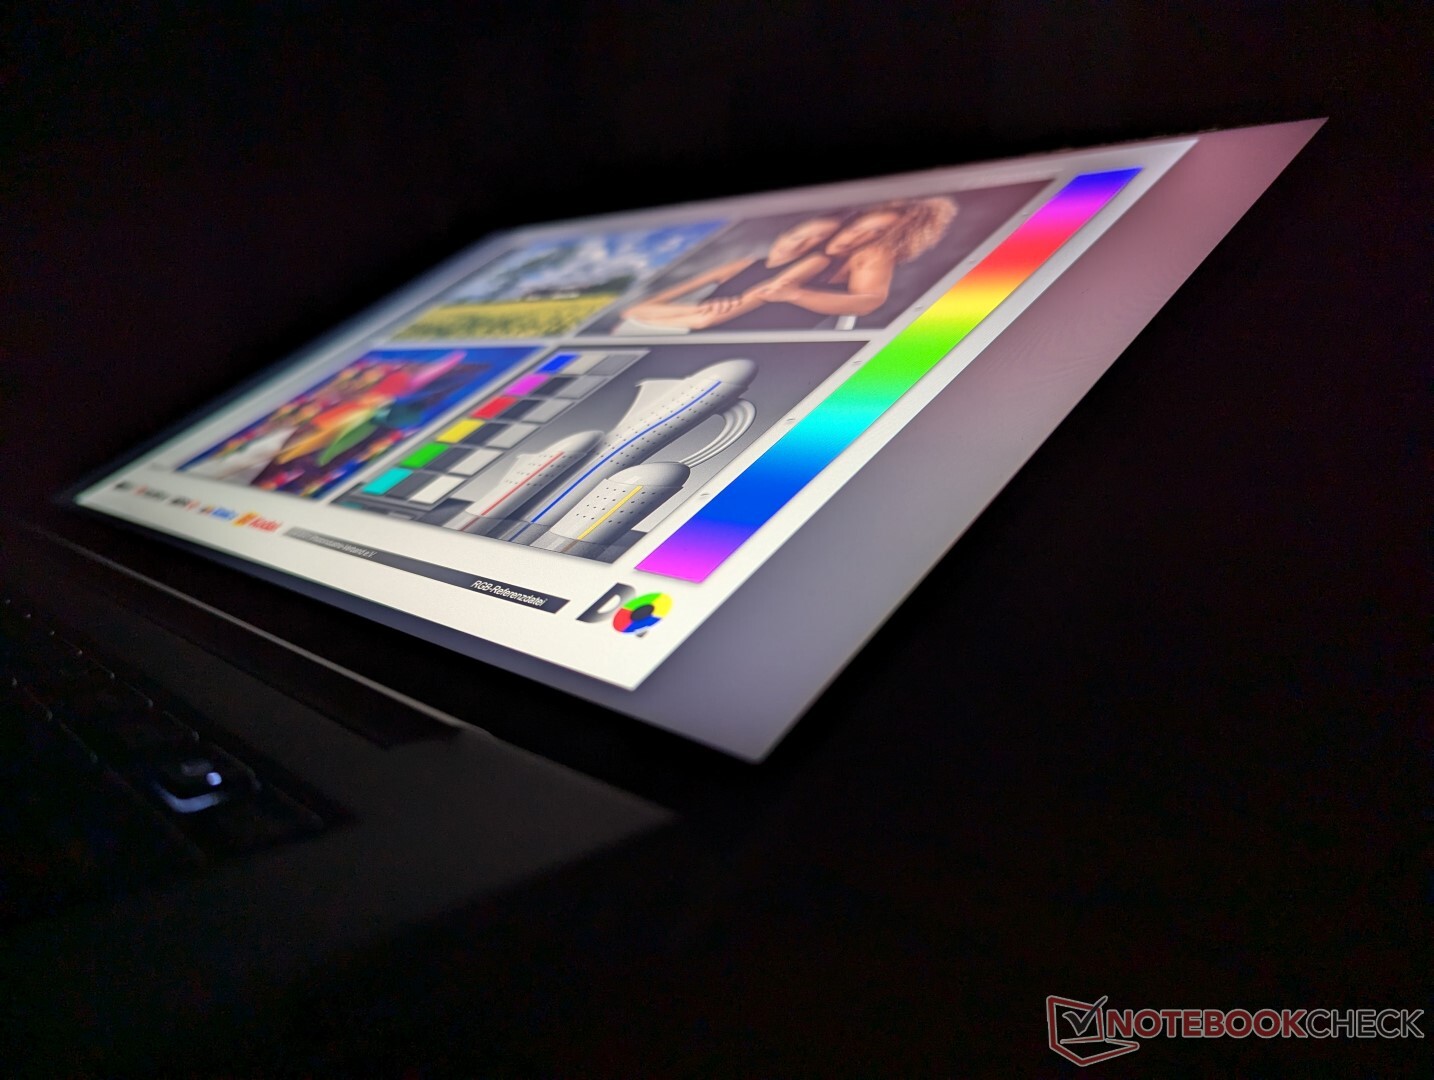
Display — Ein Traum in DreamColor
Ganze fünf Displayoptionen sind wählbar, unten von High-End zu Low-End geordnet. Allerdings gibt es nur eine einzige Option mit Touchscreen. Unser Testmodell ist mit der fett gedruckten Variante ausgestattet.
- 2.560 x 1600, 120 Hz, IPS, matt, 500 Nits, 100% DCI-P3, HP DreamColor
- 1.920 x 1.200, 60 Hz, IPS, matt, 400 Nits, 100% sRGB
- 1.920 x 1.200, 60 Hz IPS, matt, 1000 Nits, 100% sRGB, HP Sure View
- 1.920 x 1.200, 60 Hz, IPS, matt, 300 Nits, ~60% sRGB, Touchscreen
- 1.920 x 1.200, 60 Hz, IPS, matt, 300 Nits, ~60% sRGB
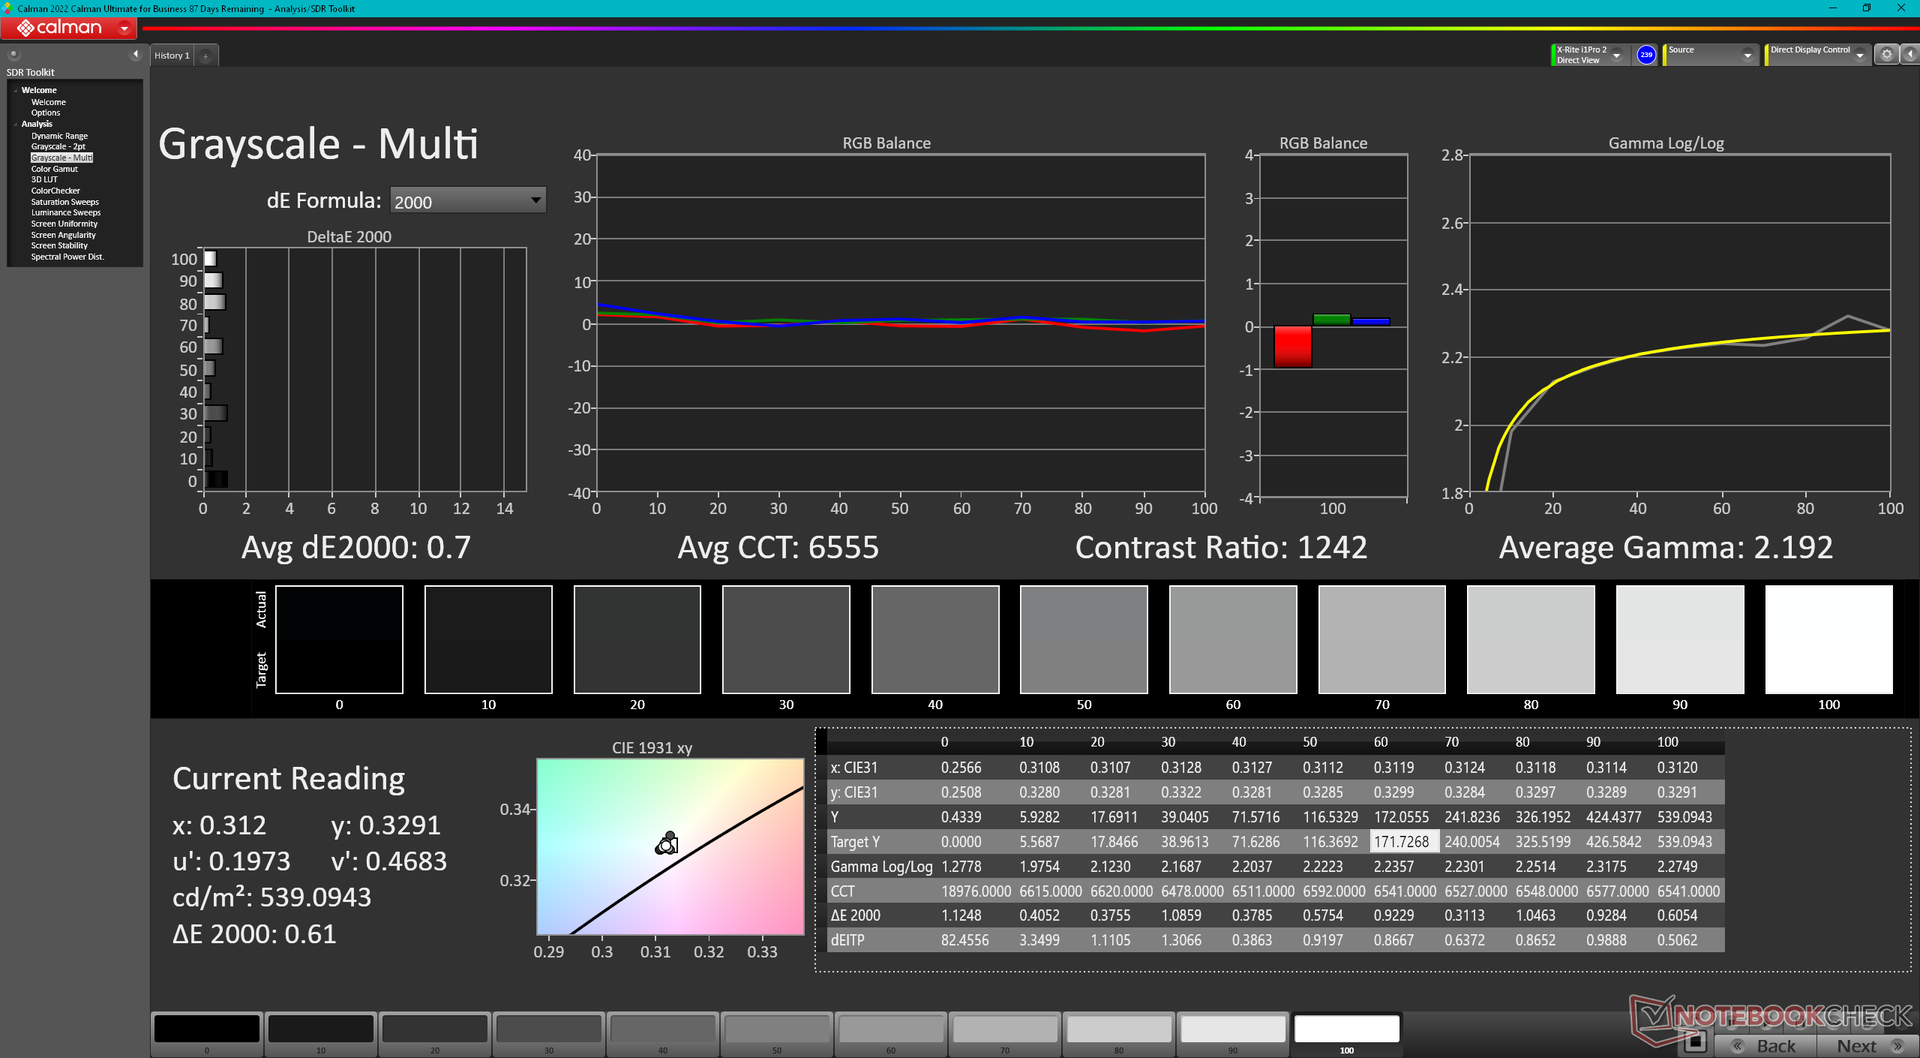
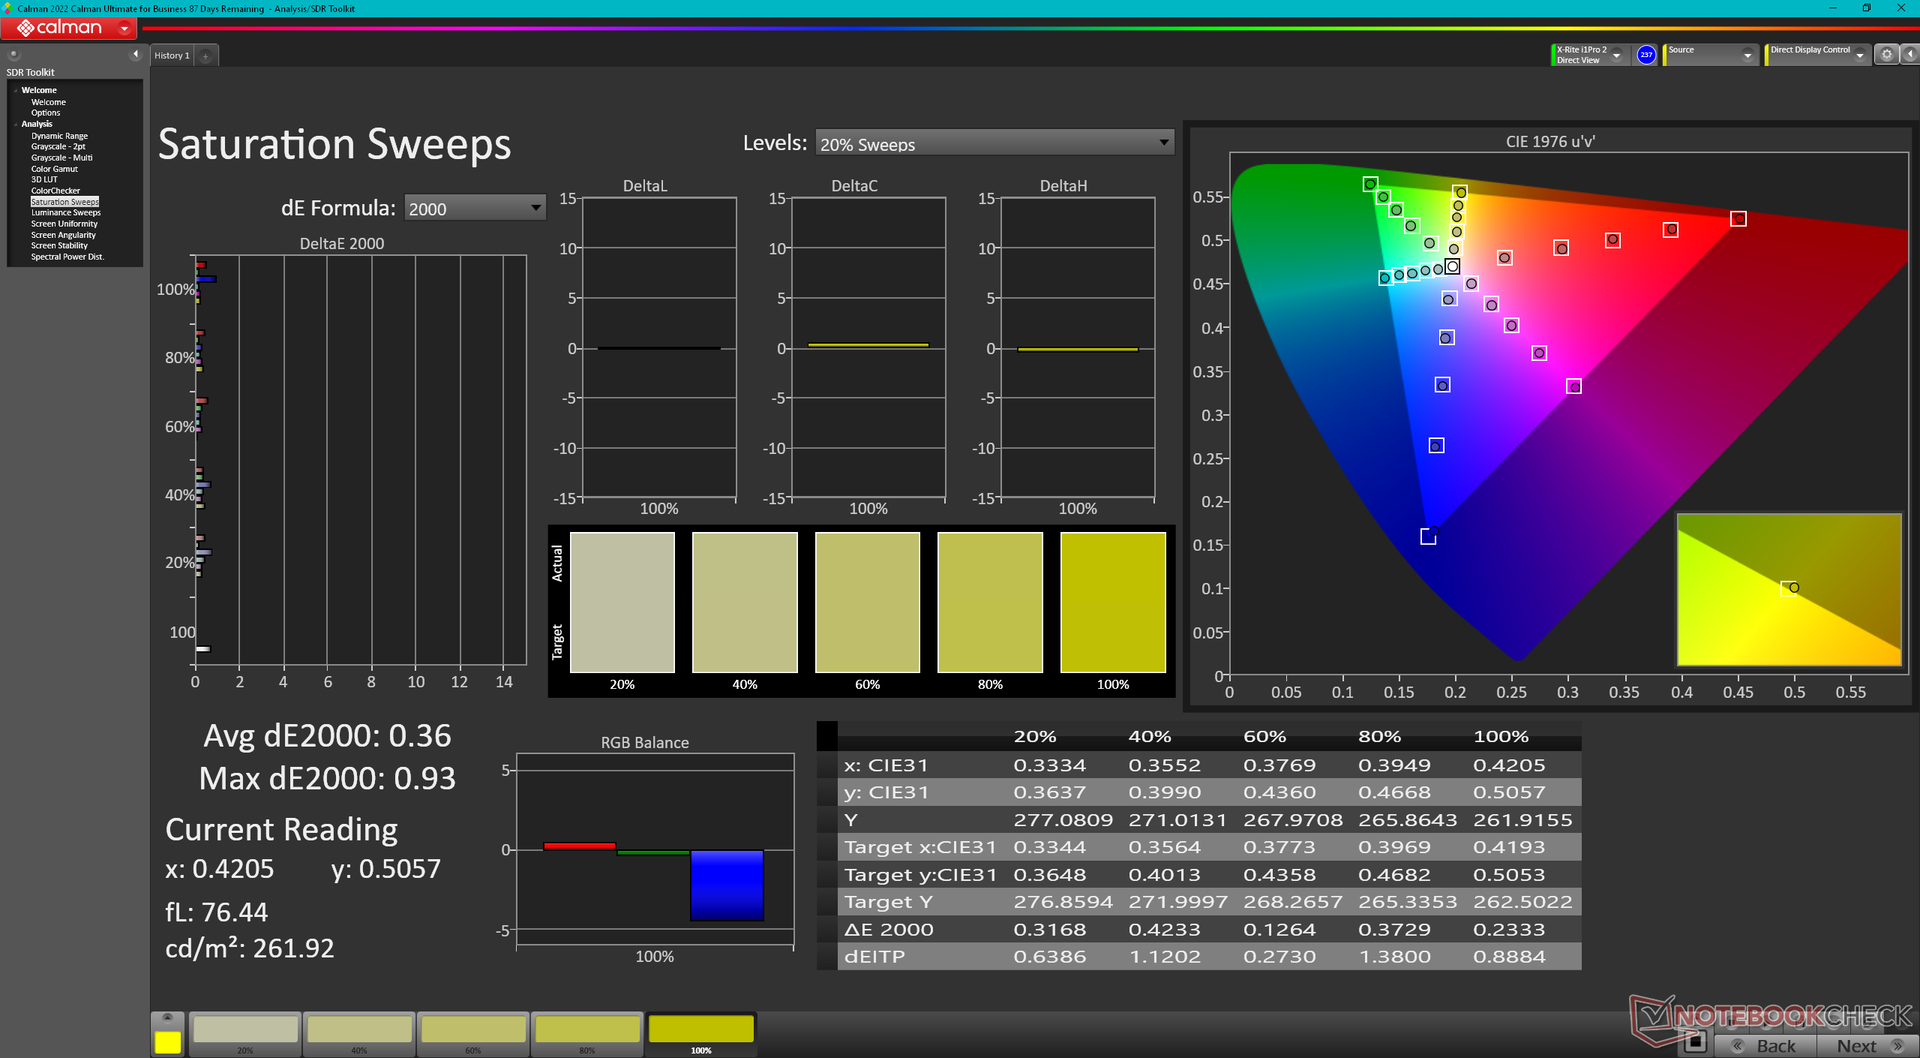
Das ZBook Firefly 14 G11 ist eine der wenigen 14-Zoll-Workstations mit einem 1.600p120-Display. Beispielsweise ist das 1.600p-Panel im Precision 5490 auf nur 60 Hz limitiert. Wir haben hier eines der besten 14-Zoll-2K-Displays was wir bislang gesehen haben, es bietet schnelle Bildwiederholraten, den vollen DCI-P3-Farbraum und sogar schnellere Reaktionszeiten als die meisten anderen Workstations, was Ghosting minimiert. Dennoch ist es schade, dass es keine OLED-Optionen gibt.
| |||||||||||||||||||||||||
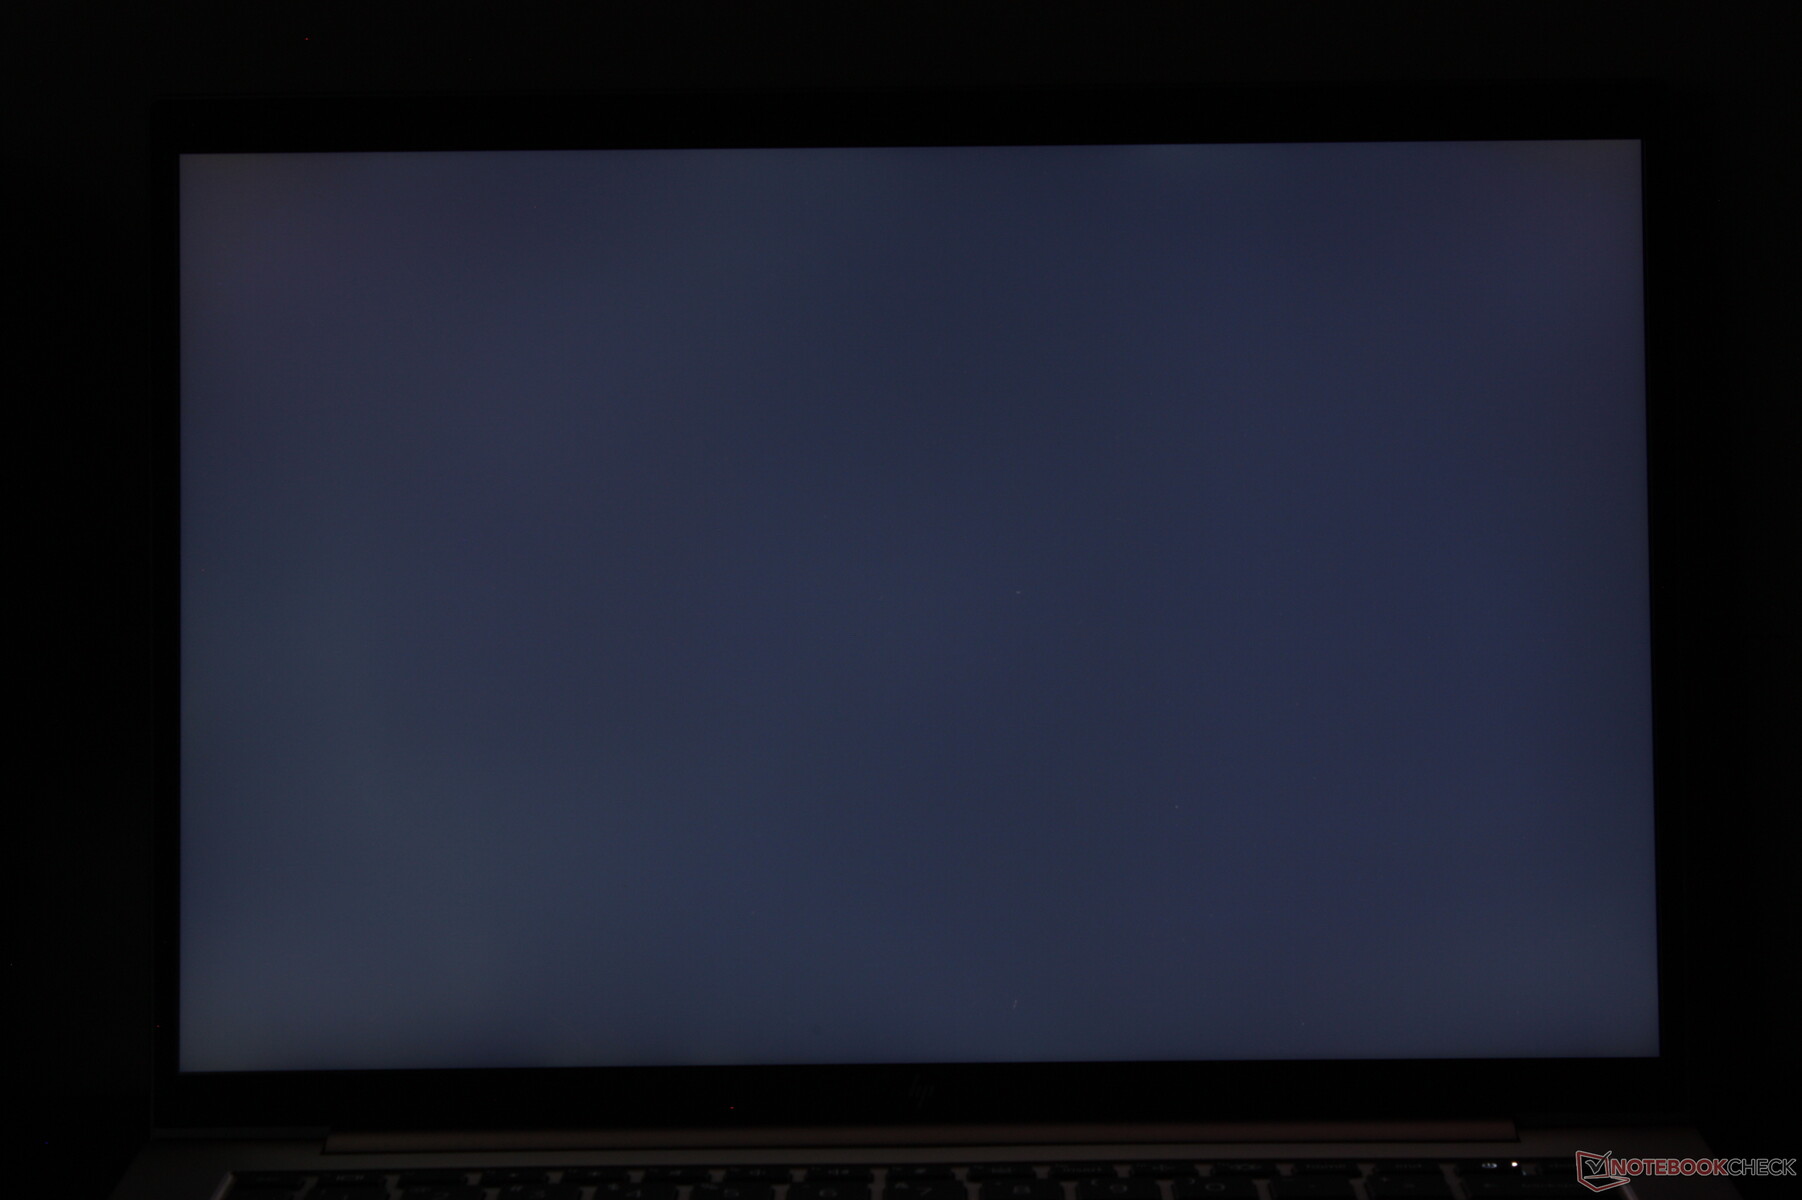
Ausleuchtung: 93 %
Helligkeit Akku: 554.1 cd/m²
Kontrast: 955:1 (Schwarzwert: 0.58 cd/m²)
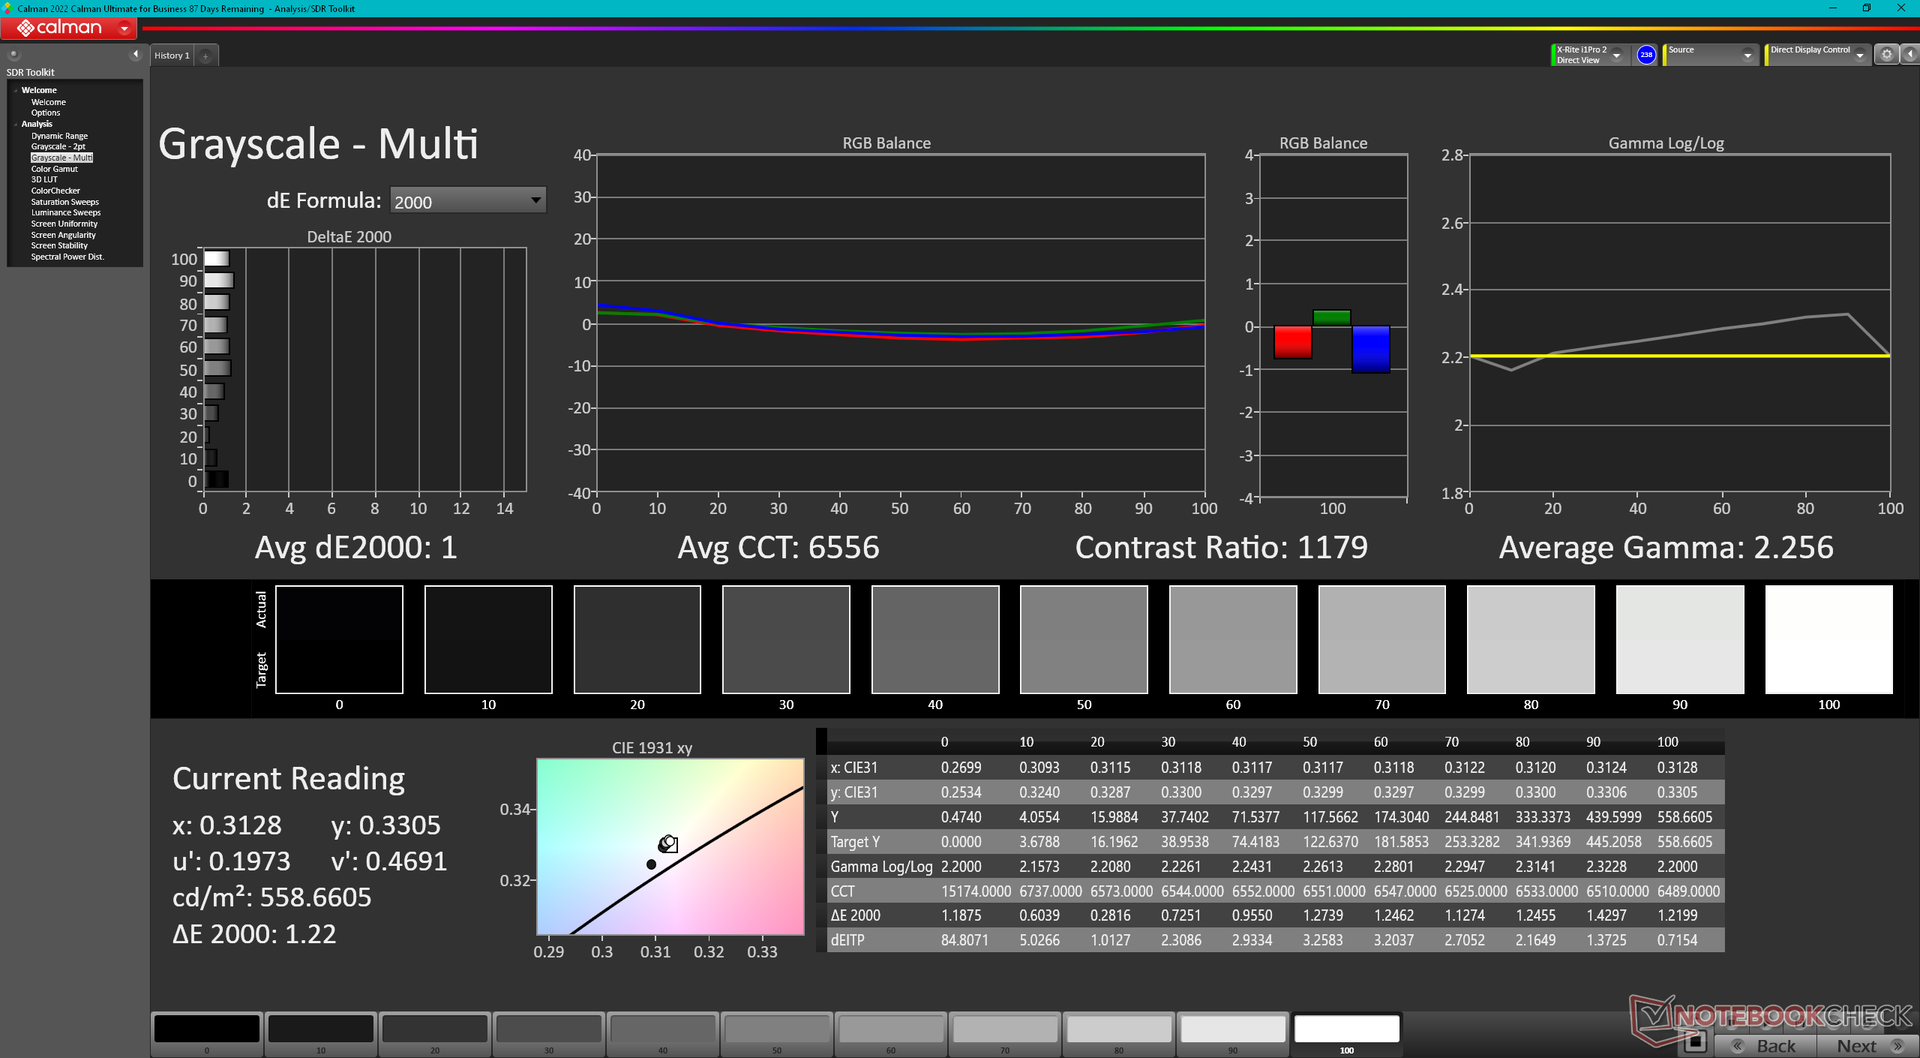
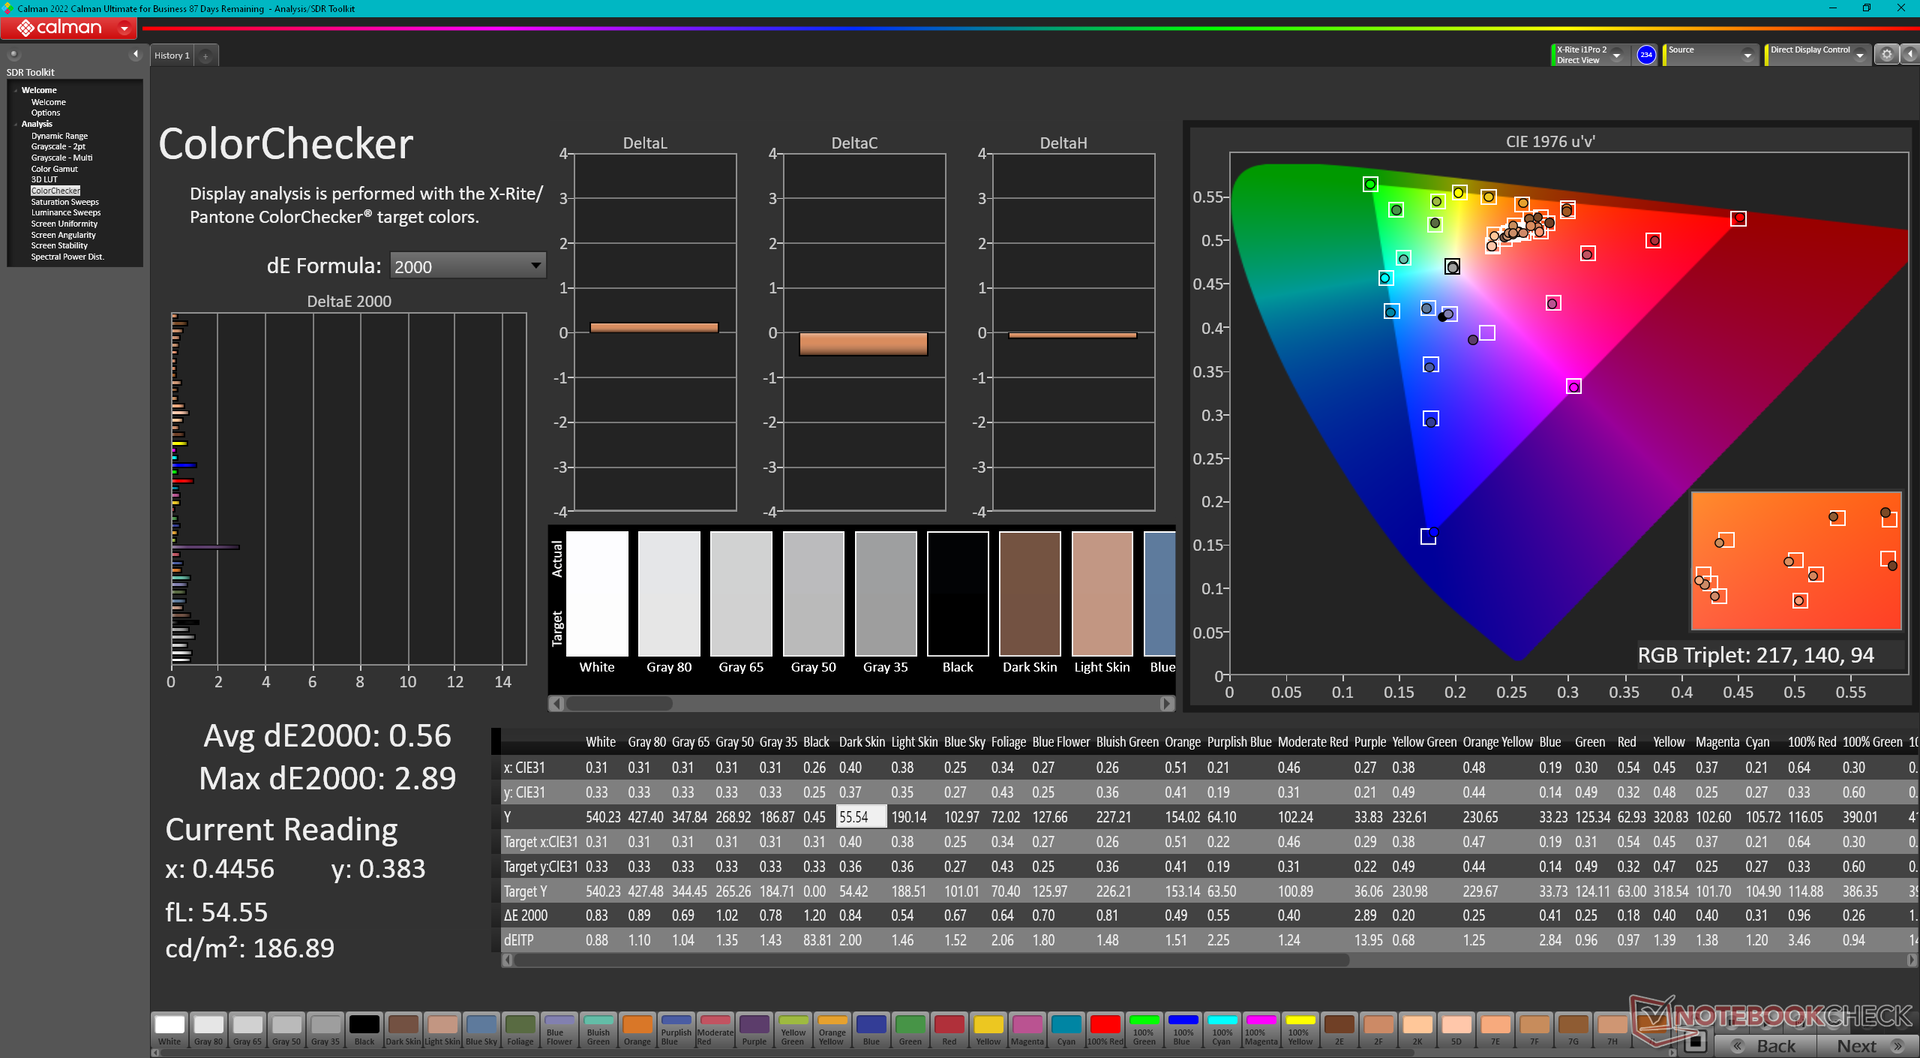
ΔE ColorChecker Calman: 2.54 | ∀{0.5-29.43 Ø4.78}
calibrated: 0.56
ΔE Greyscale Calman: 1 | ∀{0.09-98 Ø5}
86.6% AdobeRGB 1998 (Argyll 3D)
99.9% sRGB (Argyll 3D)
98.9% Display P3 (Argyll 3D)
Gamma: 2.3
CCT: 6556 K
| HP ZBook Firefly 14 G11 AUO6DA8, IPS, 2560x1600, 14" | HP ZBook Firefly 14 G10 A CMN1435, IPS, 1920x1200, 14" | HP ZBook Firefly 14 G8 2C9Q2EA AU Optronics AUO068B, IPS, 1920x1080, 14" | Dell Precision 5000 5490 AU Optronics B140QAN, IPS, 2560x1600, 14" | Lenovo ThinkPad P14s G4 21HF0017GE ATNA40YK15-0, OLED, 2880x1800, 14" | Asus ExpertBook B3 B3404CVF BOE NV140WUM-N43, IPS, 1920x1200, 14" | |
|---|---|---|---|---|---|---|
| Display | -17% | -16% | -9% | 4% | -52% | |
| Display P3 Coverage (%) | 98.9 | 68.7 -31% | 70 -29% | 79.7 -19% | 99.9 1% | 39.4 -60% |
| sRGB Coverage (%) | 99.9 | 98.2 -2% | 99.5 0% | 100 0% | 100 0% | 58.2 -42% |
| AdobeRGB 1998 Coverage (%) | 86.6 | 70.8 -18% | 71.4 -18% | 79.5 -8% | 97 12% | 40.7 -53% |
| Response Times | -281% | -338% | -313% | 75% | -114% | |
| Response Time Grey 50% / Grey 80% * (ms) | 12.3 ? | 56.2 ? -357% | 64.4 ? -424% | 52.3 ? -325% | 3 ? 76% | 23 ? -87% |
| Response Time Black / White * (ms) | 8.3 ? | 25.2 ? -204% | 29.2 ? -252% | 33.3 ? -301% | 2.2 ? 73% | 20 ? -141% |
| PWM Frequency (Hz) | 360 ? | |||||
| PWM Amplitude * (%) | 25 | |||||
| Bildschirm | -20% | -37% | -8% | -159% | -125% | |
| Helligkeit Bildmitte (cd/m²) | 554.1 | 397 -28% | 461 -17% | 485.1 -12% | 432 -22% | 319 -42% |
| Brightness (cd/m²) | 540 | 367 -32% | 439 -19% | 471 -13% | 432 -20% | 312 -42% |
| Brightness Distribution (%) | 93 | 86 -8% | 89 -4% | 90 -3% | 98 5% | 91 -2% |
| Schwarzwert * (cd/m²) | 0.58 | 0.25 57% | 0.24 59% | 0.38 34% | 0.3515 39% | |
| Kontrast (:1) | 955 | 1588 66% | 1921 101% | 1277 34% | 908 -5% | |
| Delta E Colorchecker * | 2.54 | 2.35 7% | 2.6 -2% | 2.15 15% | 4.8 -89% | 5.47 -115% |
| Colorchecker dE 2000 max. * | 4.99 | 4.68 6% | 5.8 -16% | 5.39 -8% | 9.2 -84% | 9.44 -89% |
| Colorchecker dE 2000 calibrated * | 0.56 | 1.15 -105% | 1.1 -96% | 0.67 -20% | 4.9 -775% | 3.89 -595% |
| Delta E Graustufen * | 1 | 2.4 -140% | 4.4 -340% | 2 -100% | 2.3 -130% | 3.7 -270% |
| Gamma | 2.3 96% | 2.067 106% | 2.29 96% | 2.3 96% | 2.23 99% | 1.97 112% |
| CCT | 6556 99% | 6409 101% | 6478 100% | 6826 95% | 6391 102% | 6712 97% |
| Farbraum (Prozent von AdobeRGB 1998) (%) | 65.2 | |||||
| Color Space (Percent of sRGB) (%) | 99.4 | |||||
| Durchschnitt gesamt (Programm / Settings) | -106% /
-56% | -130% /
-76% | -110% /
-52% | -27% /
-79% | -97% /
-107% |
* ... kleinere Werte sind besser

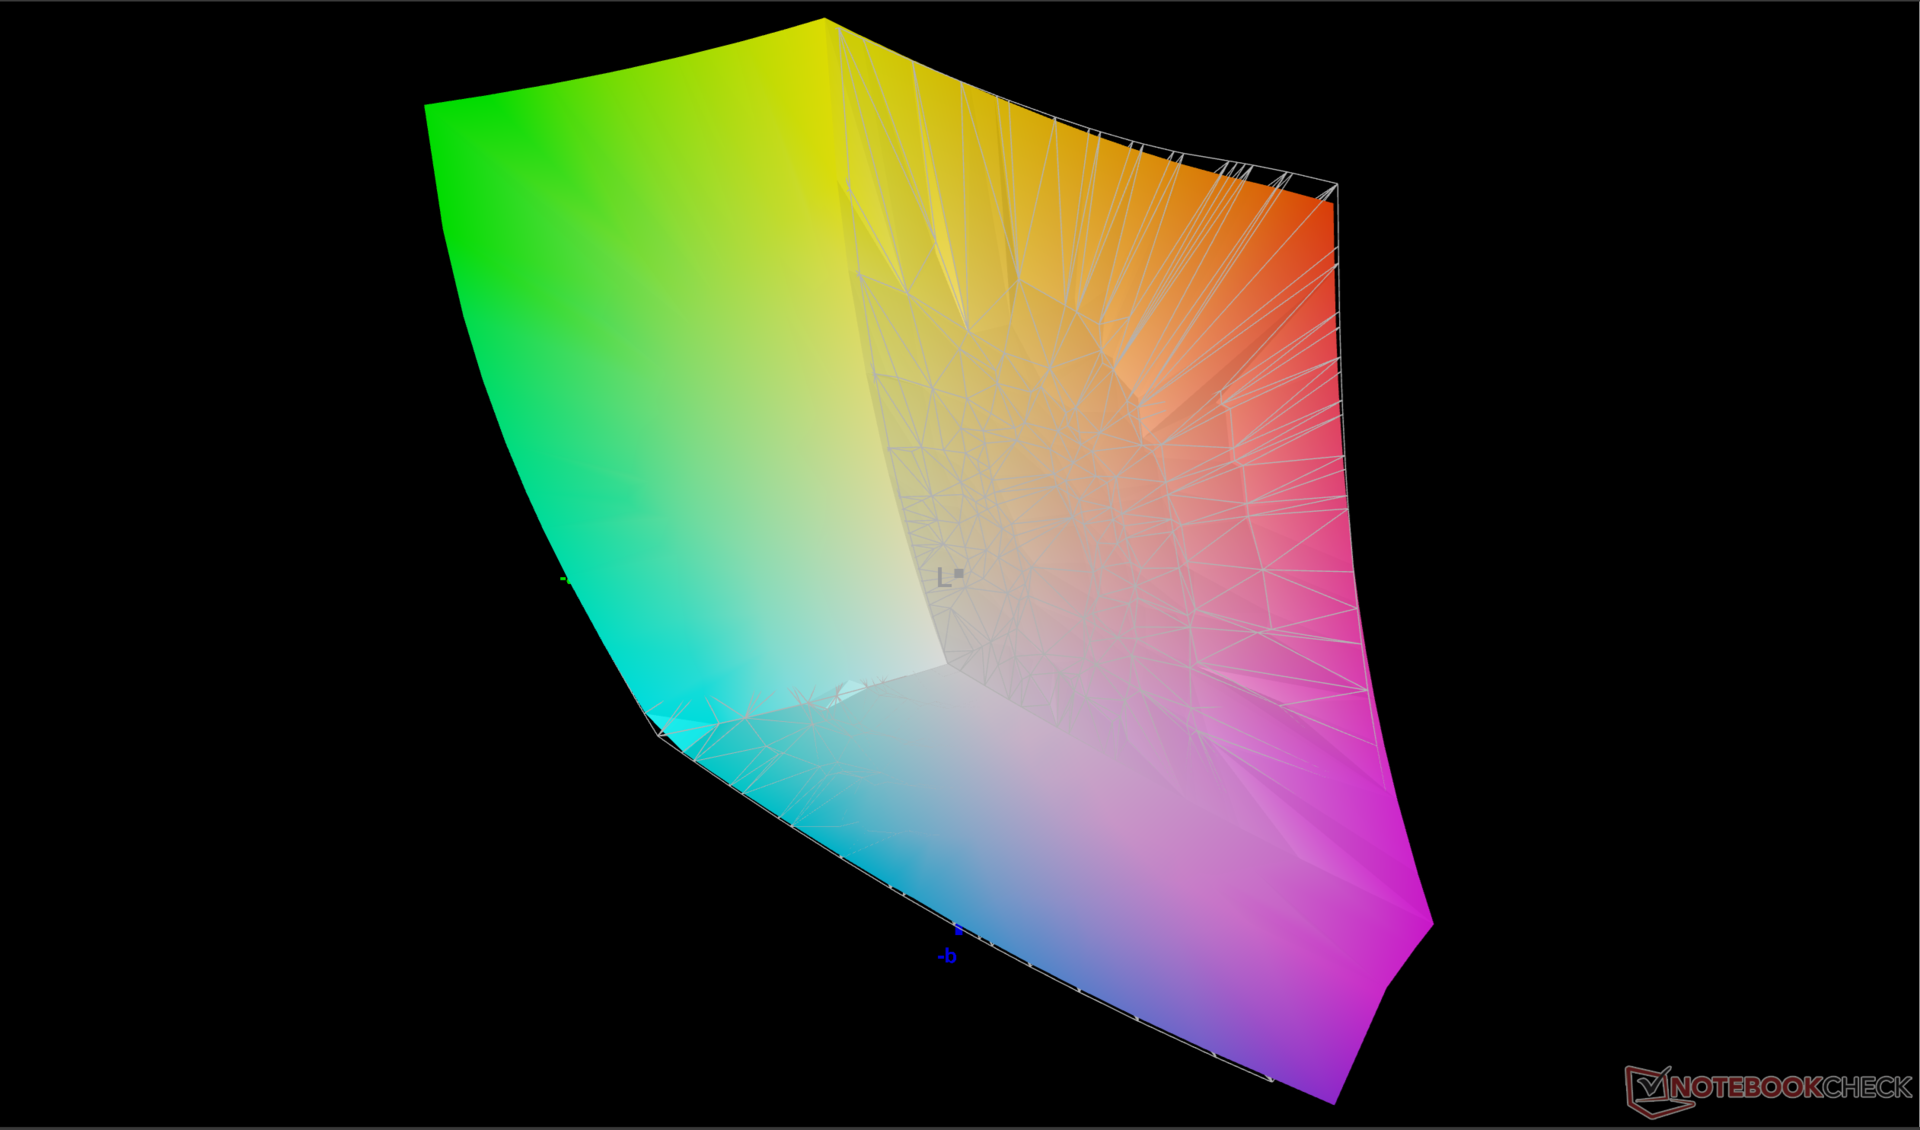
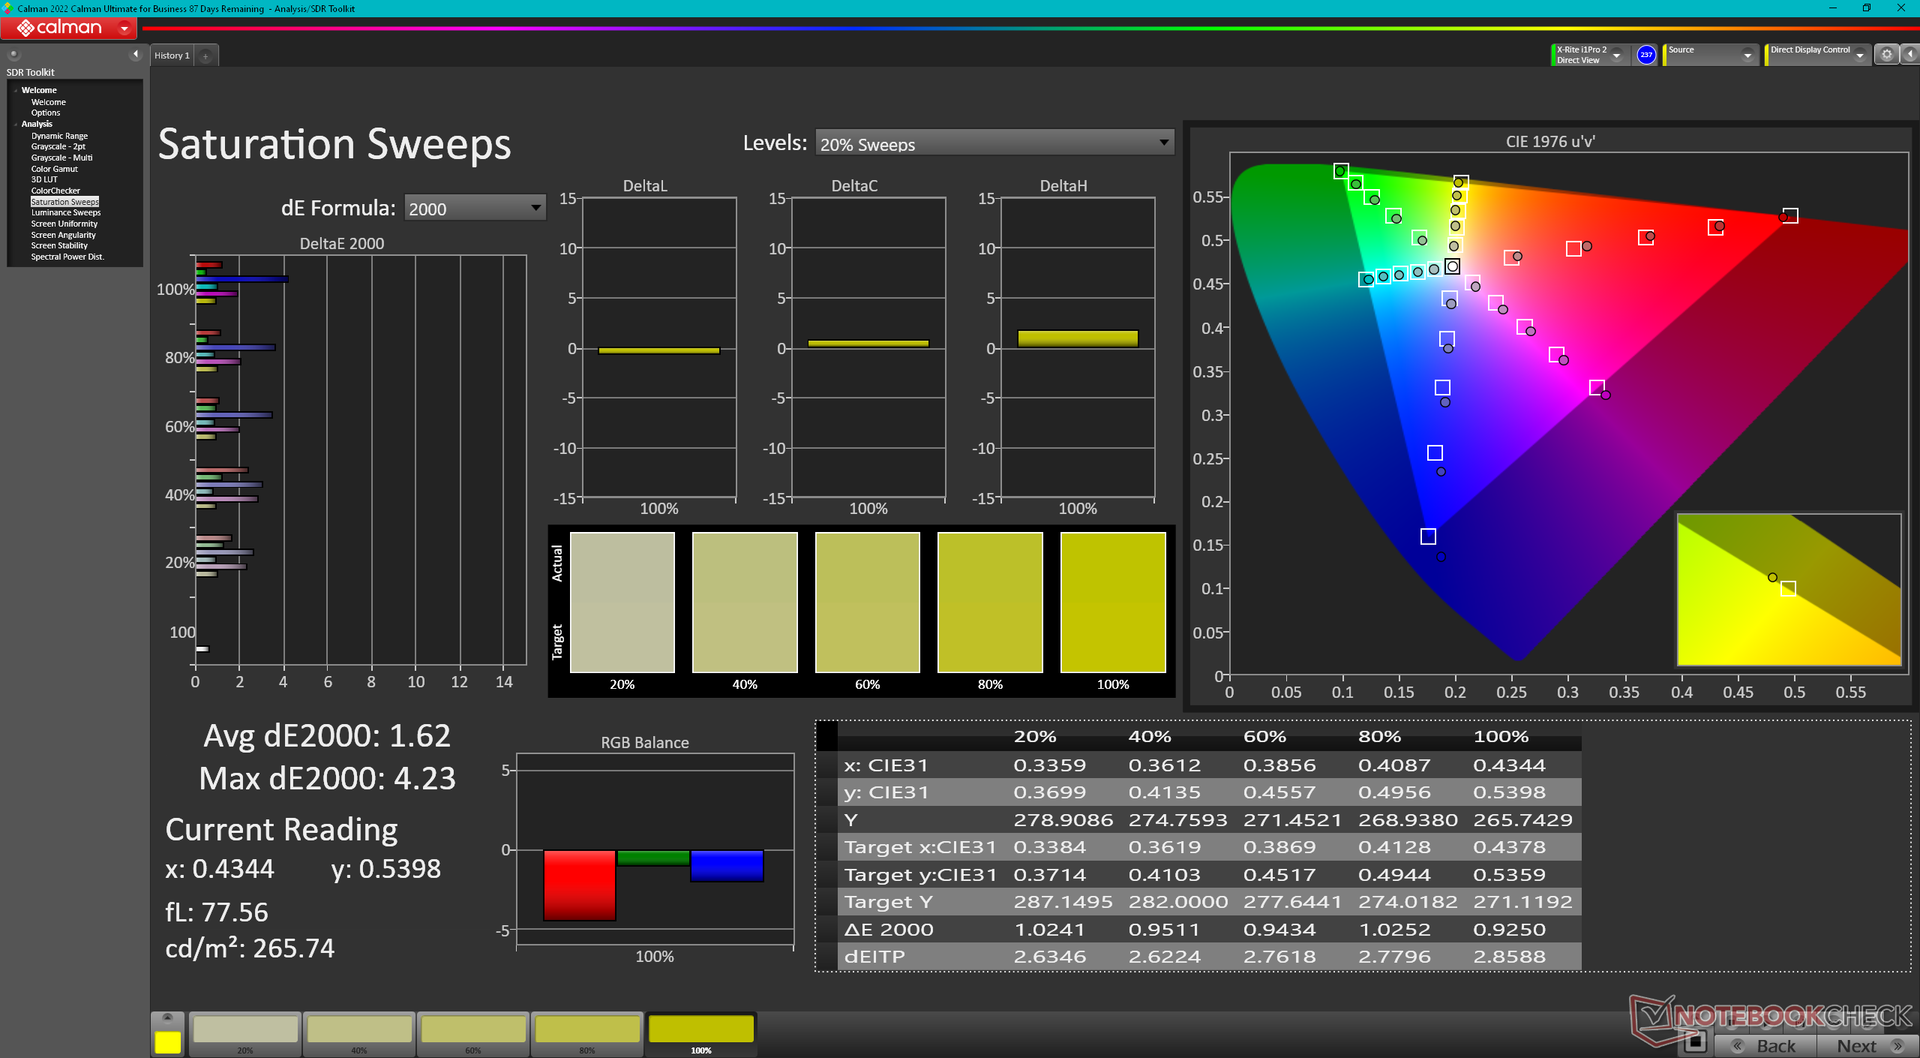
Das Display ist im DCI-P3-Standard vor-kalibriert und weist daher bereits ab Werk eine hohe Farbgenauigkeit auf. Die durchschnittlichen Graustufen- und Farb-DeltaE-Werte liegen nur bei 1,0 beziehungsweise 2,54, sodass für die meisten Endnutzer eine manuelle Kalibrierung nicht vonnöten ist.

Bildschirm-Flackern / PWM (Pulse-Width Modulation)
| Flackern / PWM nicht festgestellt | 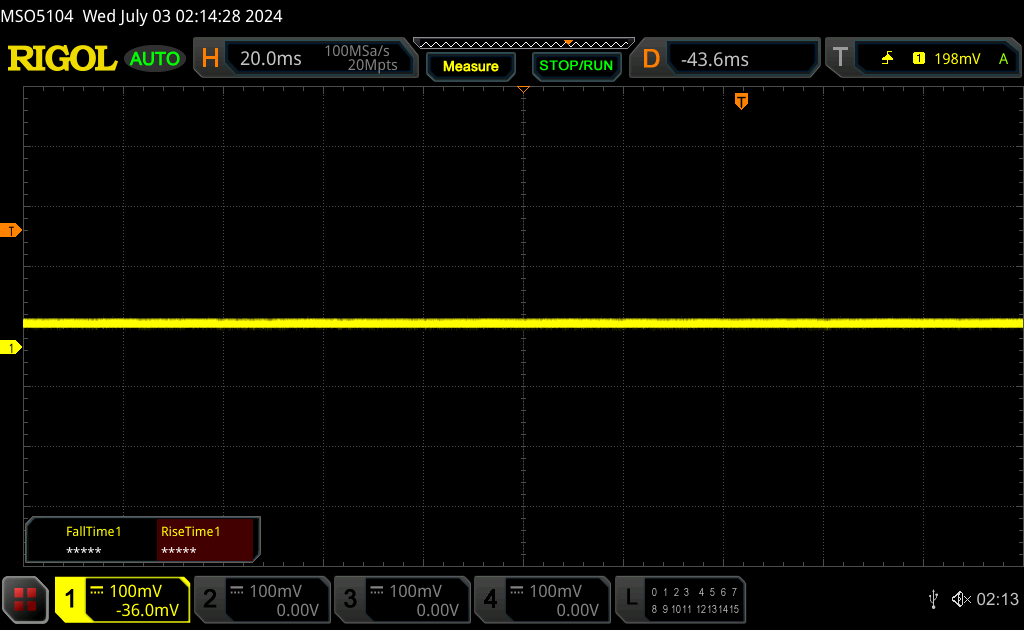 | ||
Im Vergleich: 53 % aller getesteten Geräte nutzten kein PWM um die Helligkeit zu reduzieren. Wenn PWM eingesetzt wurde, dann bei einer Frequenz von durchschnittlich 8108 (Minimum 5, Maximum 343500) Hz. | |||
Leistung — Boost durch Intel Gen14 Meteor Lake
Testbedingungen
Vor unserem Benchmarkparkour haben wir sowohl Windows als auch MyHP in den Leistungsmodus versetzt.

Prozessor
Der Core Ultra 7 165H ist grob 20 bis 25 Prozent schneller als der Ryzen 5 Pro 7640HS im letztjährigen Firefly G10 A, zumindest wenn es um Multi-Threat-Lasten geht. Leider wird die CPU in unserem Firefly G11 nach nur zwei Durchgängen in unserem CineBench-R15-xT-Stresstest stark gedrosselt, was auch der Graph unten verdeutlicht. Dadurch kann die Multi-Thread-Leistung über die Zeit um ganze 35 Prozent sinken, was einen eher stärkeren Abfall im Vergleich mit anderen Core-H-Laptops bedeutet. Der Leistungsunterschied zwischen dem Core Ultra 7 165H und dem Ryzen 5 Pro 7640HS wird deutlich geringer, wenn man das Drosselverhalten mit einbezieht.
Entscheidet man sich stattdessen für eine Lower-End-Core-U-CPU wie den Core Ultra 7 165U, so kann man mit einem Leistungsrückgang um 25 bis 30 Prozent rechnen, das zumindest haben wir mit dem Dell Latitude 9450 2-in-1 gemessen. Andererseits dürfte die Drosselproblematik spürbar geringer ausfallen, sodass der Leistungsunterschied zwischen unserem Core Ultra 7 165H und dem Core Ultra 7 165U in der Praxis womöglich weniger relevant ist als gedacht. Auf jeden Fall können die Leistungsvorteile des stärkeren Core Ultra 7 165H nicht über längere Zeit ausgekostet werden.
Cinebench R15 Multi Loop
Cinebench R23: Multi Core | Single Core
Cinebench R20: CPU (Multi Core) | CPU (Single Core)
Cinebench R15: CPU Multi 64Bit | CPU Single 64Bit
Blender: v2.79 BMW27 CPU
7-Zip 18.03: 7z b 4 | 7z b 4 -mmt1
Geekbench 6.5: Multi-Core | Single-Core
Geekbench 5.5: Multi-Core | Single-Core
HWBOT x265 Benchmark v2.2: 4k Preset
LibreOffice : 20 Documents To PDF
R Benchmark 2.5: Overall mean
* ... kleinere Werte sind besser
AIDA64: FP32 Ray-Trace | FPU Julia | CPU SHA3 | CPU Queen | FPU SinJulia | FPU Mandel | CPU AES | CPU ZLib | FP64 Ray-Trace | CPU PhotoWorxx
| Performance Rating | |
| Dell Precision 5000 5490 | |
| HP ZBook Firefly 14 G10 A | |
| Durchschnittliche Intel Core Ultra 7 165H | |
| Lenovo ThinkPad P14s G4 21HF0017GE | |
| HP ZBook Firefly 14 G11 | |
| Asus ExpertBook B3 B3404CVF | |
| HP ZBook Firefly 14 G8 2C9Q2EA | |
| AIDA64 / FP32 Ray-Trace | |
| HP ZBook Firefly 14 G10 A | |
| Dell Precision 5000 5490 | |
| Durchschnittliche Intel Core Ultra 7 165H (10658 - 14235, n=3) | |
| Lenovo ThinkPad P14s G4 21HF0017GE | |
| HP ZBook Firefly 14 G11 | |
| Asus ExpertBook B3 B3404CVF | |
| HP ZBook Firefly 14 G8 2C9Q2EA | |
| AIDA64 / FPU Julia | |
| HP ZBook Firefly 14 G10 A | |
| Dell Precision 5000 5490 | |
| Durchschnittliche Intel Core Ultra 7 165H (56664 - 75077, n=3) | |
| Lenovo ThinkPad P14s G4 21HF0017GE | |
| HP ZBook Firefly 14 G11 | |
| Asus ExpertBook B3 B3404CVF | |
| HP ZBook Firefly 14 G8 2C9Q2EA | |
| AIDA64 / CPU SHA3 | |
| Dell Precision 5000 5490 | |
| HP ZBook Firefly 14 G10 A | |
| Durchschnittliche Intel Core Ultra 7 165H (2608 - 3473, n=3) | |
| Lenovo ThinkPad P14s G4 21HF0017GE | |
| HP ZBook Firefly 14 G11 | |
| Asus ExpertBook B3 B3404CVF | |
| HP ZBook Firefly 14 G8 2C9Q2EA | |
| AIDA64 / CPU Queen | |
| Lenovo ThinkPad P14s G4 21HF0017GE | |
| Dell Precision 5000 5490 | |
| HP ZBook Firefly 14 G10 A | |
| HP ZBook Firefly 14 G11 | |
| Durchschnittliche Intel Core Ultra 7 165H (82058 - 86192, n=3) | |
| Asus ExpertBook B3 B3404CVF | |
| HP ZBook Firefly 14 G8 2C9Q2EA | |
| AIDA64 / FPU SinJulia | |
| HP ZBook Firefly 14 G10 A | |
| Dell Precision 5000 5490 | |
| Durchschnittliche Intel Core Ultra 7 165H (8232 - 9798, n=3) | |
| HP ZBook Firefly 14 G11 | |
| Lenovo ThinkPad P14s G4 21HF0017GE | |
| Asus ExpertBook B3 B3404CVF | |
| HP ZBook Firefly 14 G8 2C9Q2EA | |
| AIDA64 / FPU Mandel | |
| HP ZBook Firefly 14 G10 A | |
| Dell Precision 5000 5490 | |
| Durchschnittliche Intel Core Ultra 7 165H (27301 - 36957, n=3) | |
| Lenovo ThinkPad P14s G4 21HF0017GE | |
| HP ZBook Firefly 14 G11 | |
| Asus ExpertBook B3 B3404CVF | |
| HP ZBook Firefly 14 G8 2C9Q2EA | |
| AIDA64 / CPU AES | |
| Dell Precision 5000 5490 | |
| HP ZBook Firefly 14 G8 2C9Q2EA | |
| Durchschnittliche Intel Core Ultra 7 165H (56077 - 73297, n=3) | |
| HP ZBook Firefly 14 G10 A | |
| Lenovo ThinkPad P14s G4 21HF0017GE | |
| HP ZBook Firefly 14 G11 | |
| Asus ExpertBook B3 B3404CVF | |
| AIDA64 / CPU ZLib | |
| Dell Precision 5000 5490 | |
| Durchschnittliche Intel Core Ultra 7 165H (742 - 1018, n=3) | |
| Lenovo ThinkPad P14s G4 21HF0017GE | |
| HP ZBook Firefly 14 G10 A | |
| HP ZBook Firefly 14 G11 | |
| Asus ExpertBook B3 B3404CVF | |
| HP ZBook Firefly 14 G8 2C9Q2EA | |
| AIDA64 / FP64 Ray-Trace | |
| HP ZBook Firefly 14 G10 A | |
| Dell Precision 5000 5490 | |
| Durchschnittliche Intel Core Ultra 7 165H (5580 - 7521, n=3) | |
| Lenovo ThinkPad P14s G4 21HF0017GE | |
| HP ZBook Firefly 14 G11 | |
| Asus ExpertBook B3 B3404CVF | |
| HP ZBook Firefly 14 G8 2C9Q2EA | |
| AIDA64 / CPU PhotoWorxx | |
| Dell Precision 5000 5490 | |
| Durchschnittliche Intel Core Ultra 7 165H (44396 - 48762, n=3) | |
| Asus ExpertBook B3 B3404CVF | |
| HP ZBook Firefly 14 G11 | |
| Lenovo ThinkPad P14s G4 21HF0017GE | |
| HP ZBook Firefly 14 G10 A | |
| HP ZBook Firefly 14 G8 2C9Q2EA | |
Stresstest
Beim STressen mittels Prime95 boostet die CPU auf 2,9 GHz und 63 W hoch, bevor die Kerne nach wenigen Sekunden 93 °C erreichen. Danach fallen die Taktraten heftig ab und landen bei nur noch 1,2 GHz und 26 W. Damit wird eine kühlere Kerntemperatur von rund 78 °C gehalten. Dieses limitierte Turbo-Boost-Verhalten ist im Einklang mit unseren CineBench-R15-xT-Loop-Ergebnissen weiter oben.
Sowohl CPU als auch GPU tendieren dazu sich bei länger anhaltenden Lasten im mittleren 70 °C-Bereich einzupegeln. Für ein Subnotebook ist das durchaus üblich und nahe an dem, was wir auch schon beim Firefly 14 G10 A gemessen haben.
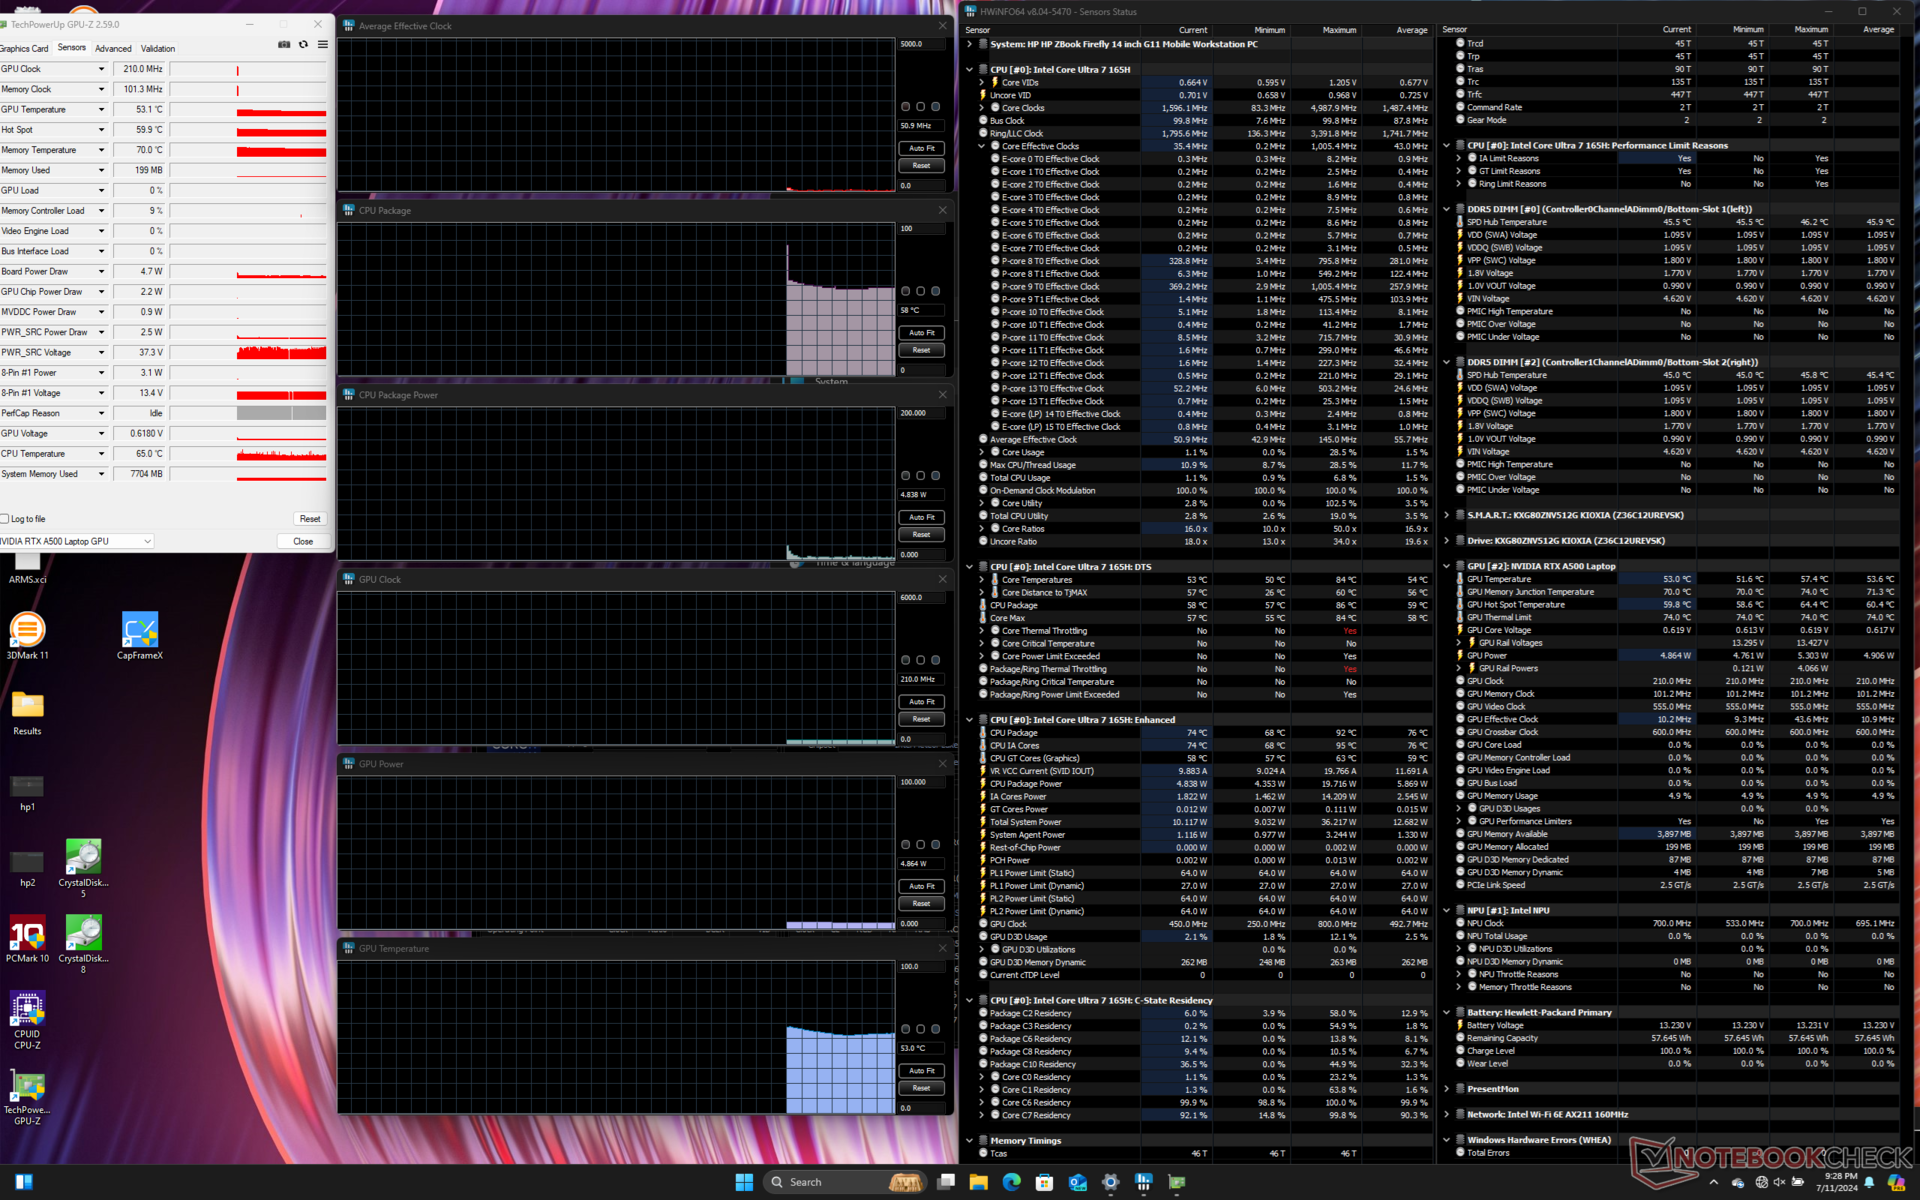
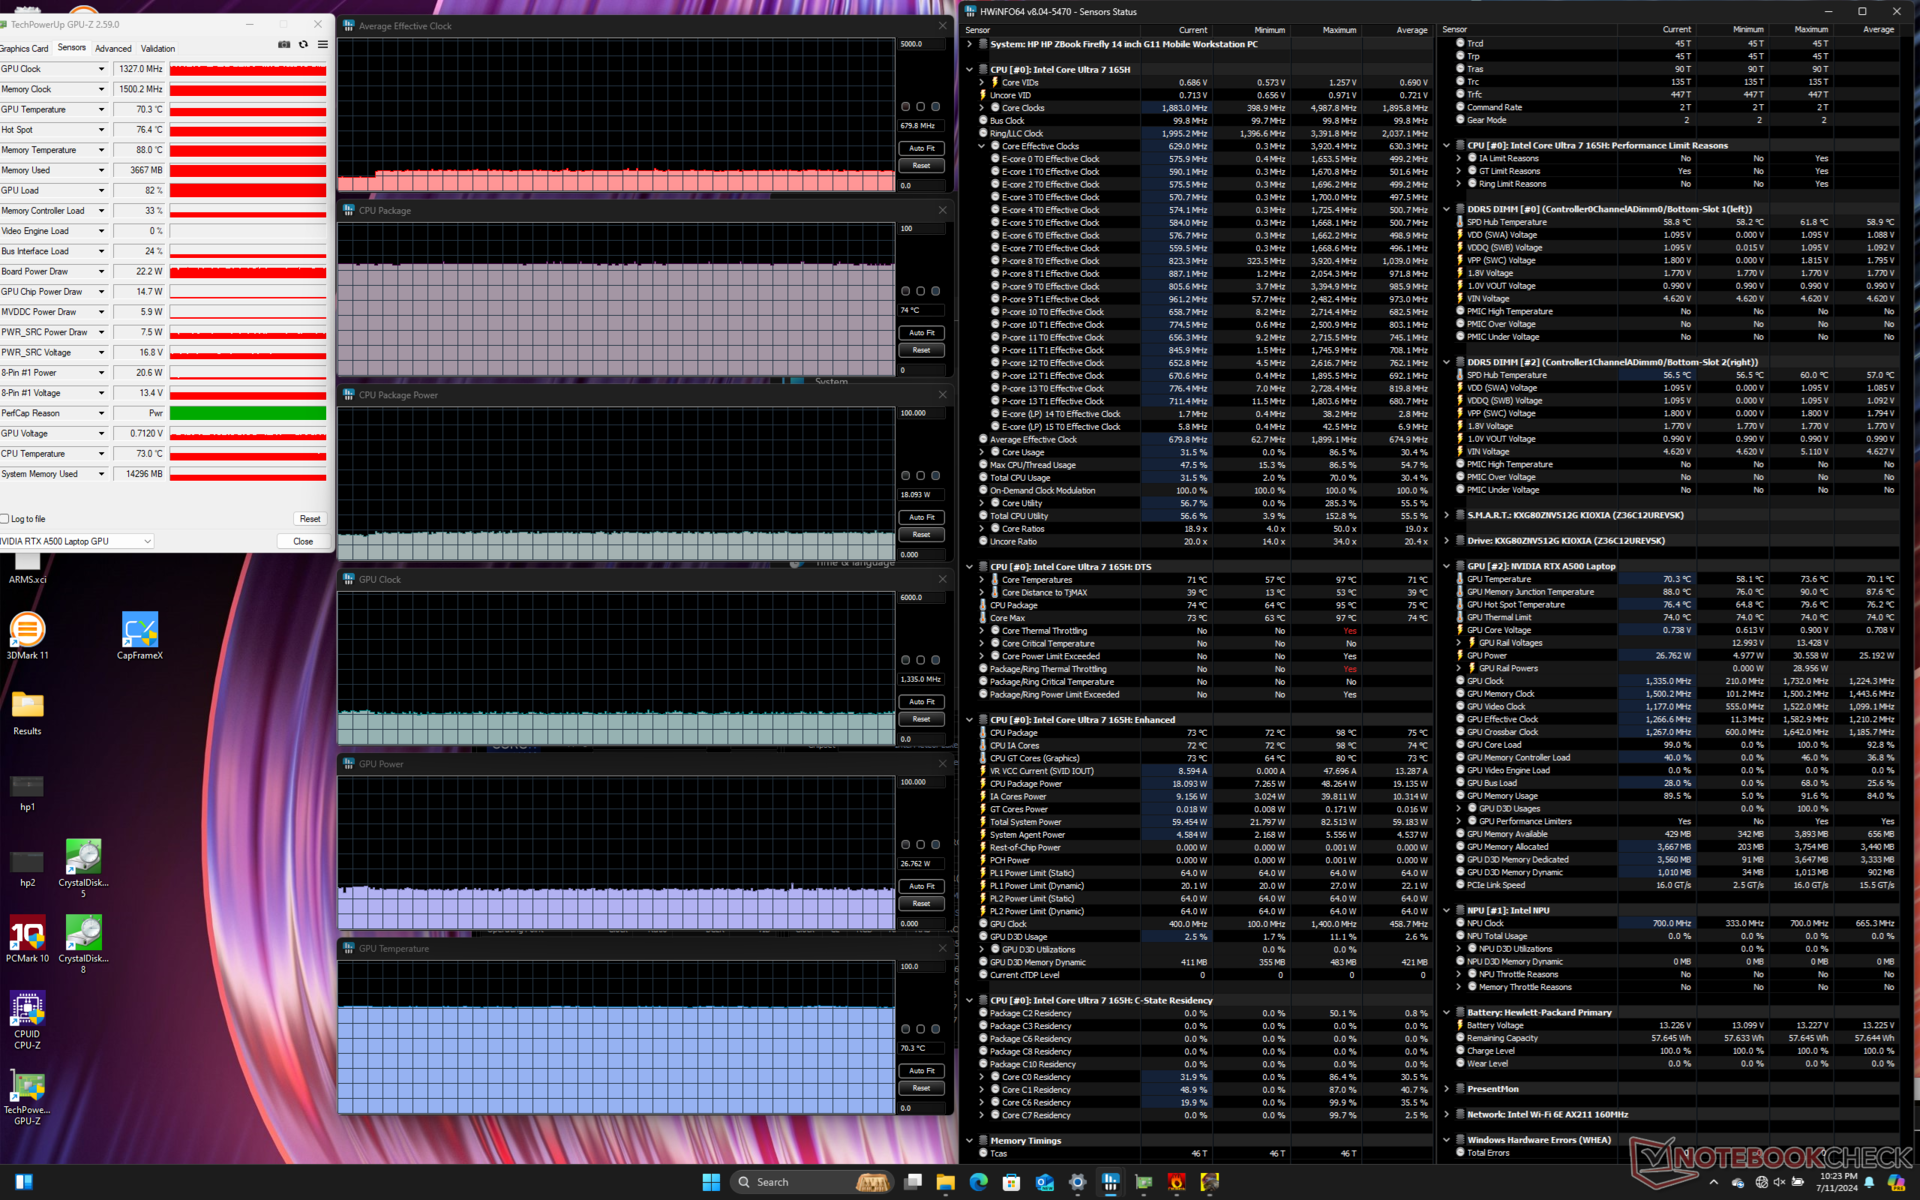
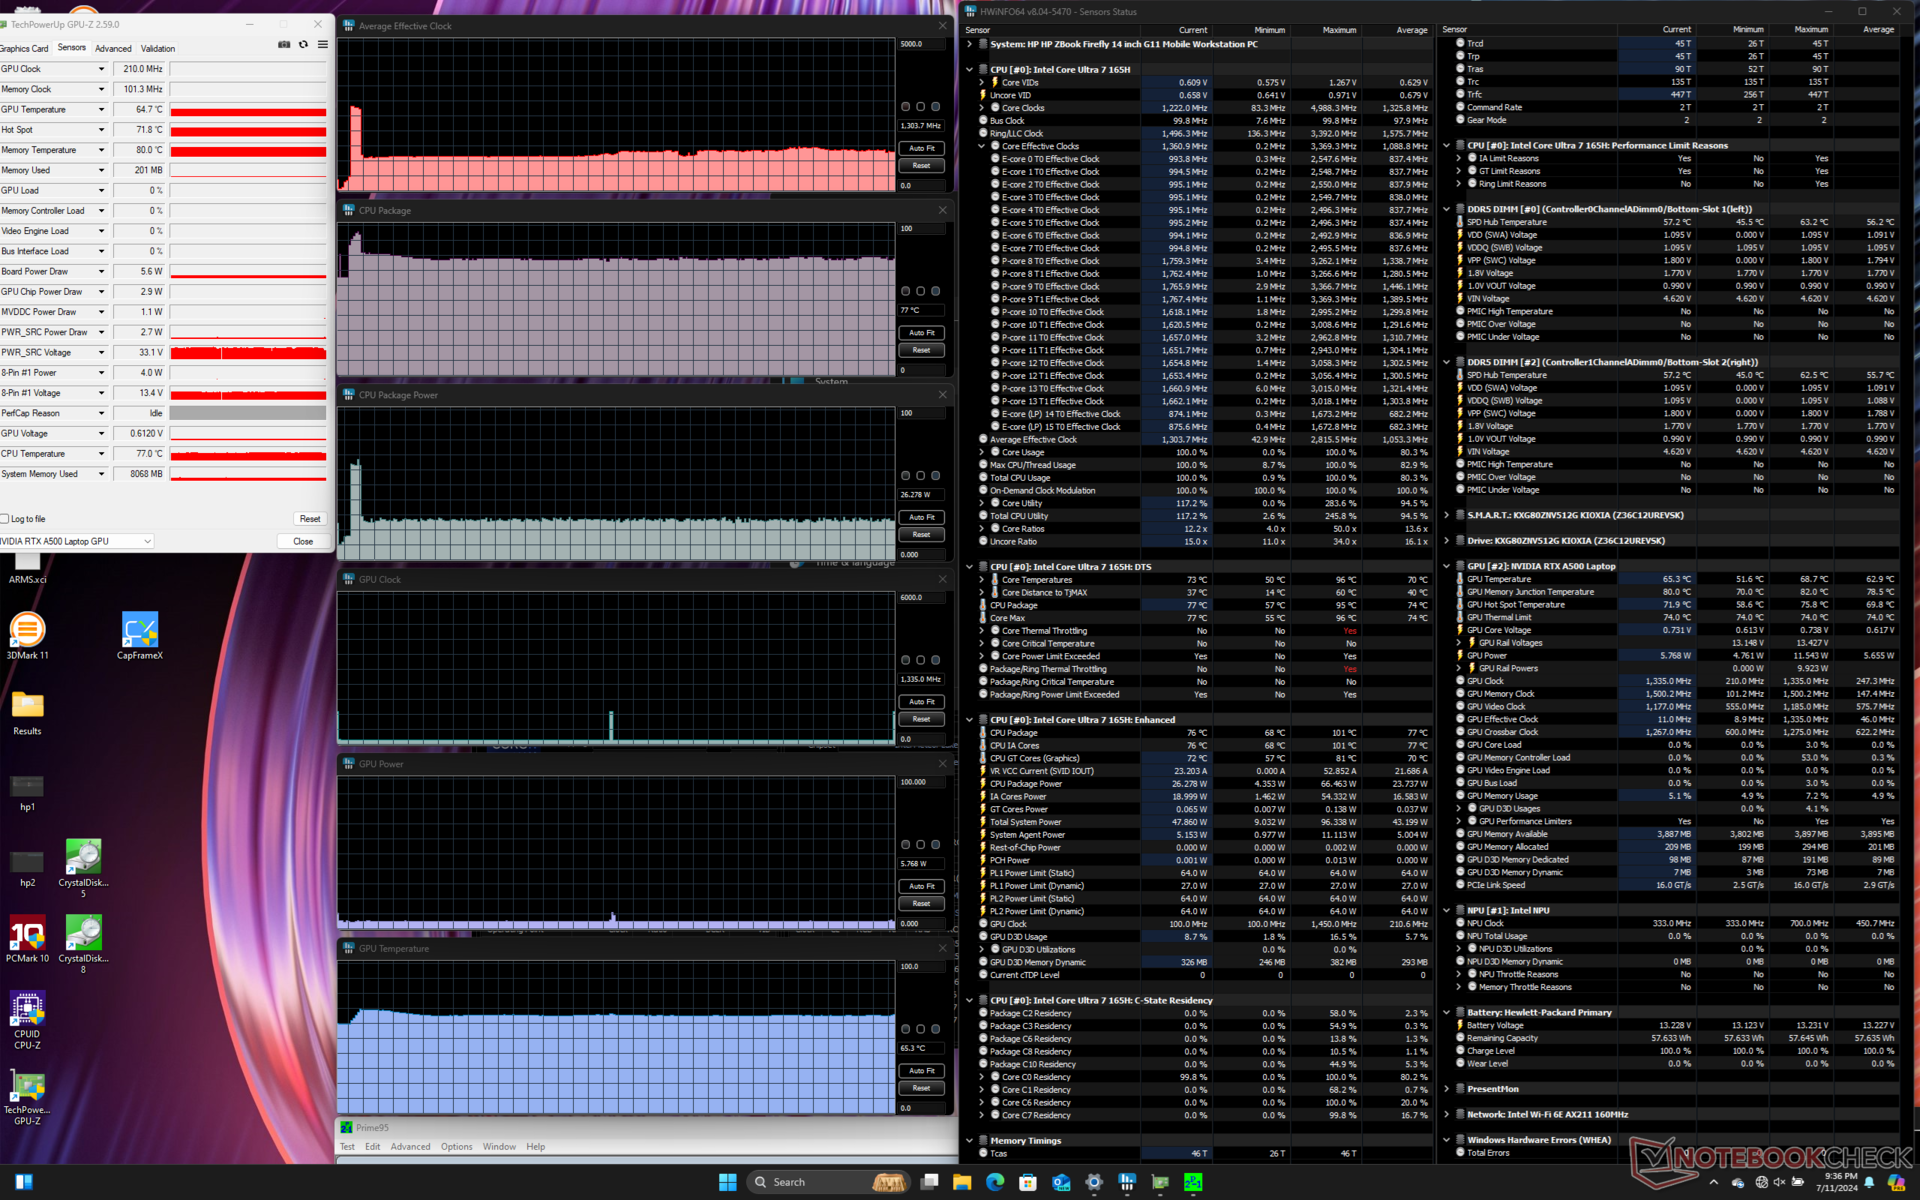
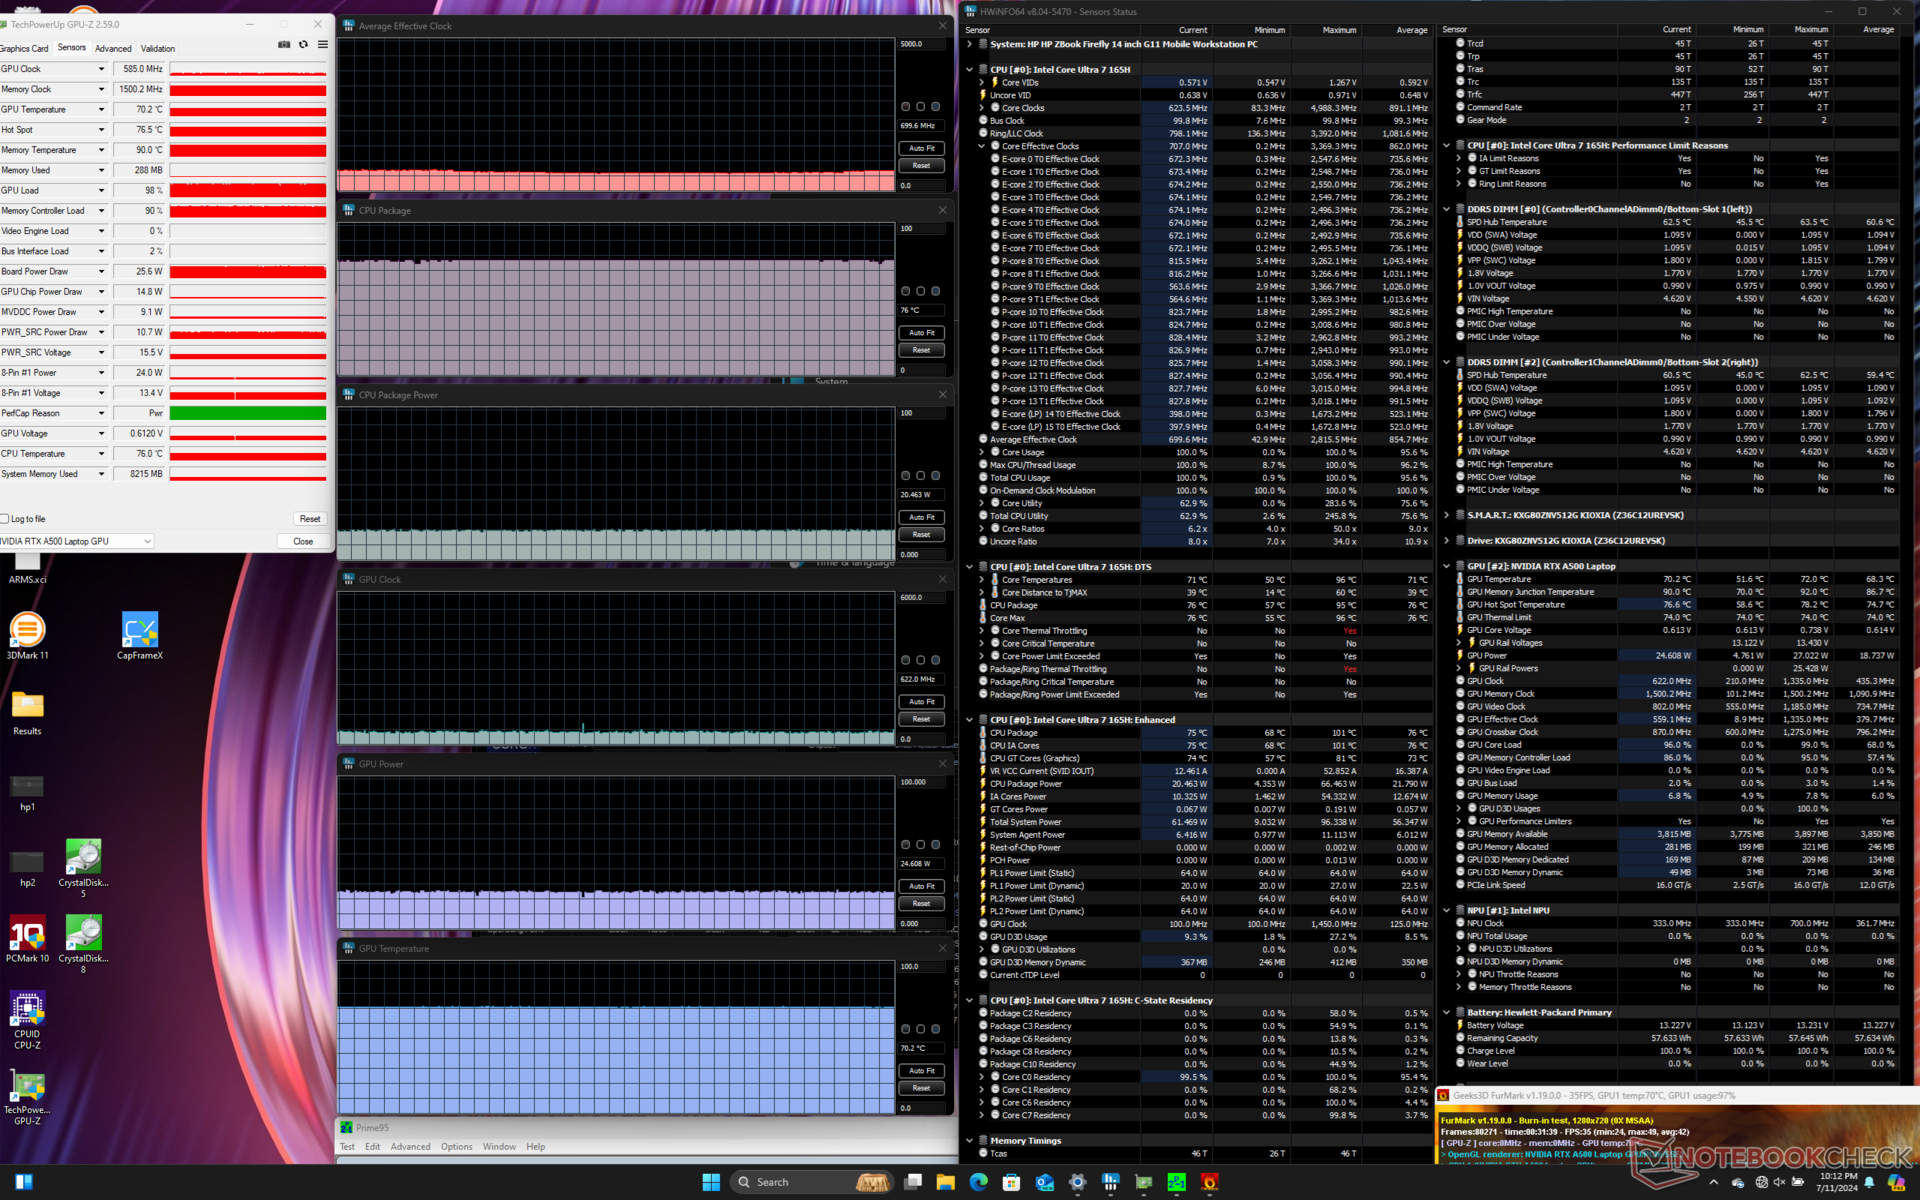
| durchschn. CPU-Takt (GHz) | GPU-Takt (MHz) | durchschn. CPU-Temperatur (°C) | durchschn. GPU-Temperatur (°C) | |
| Leerlauf | -- | -- | 58 | 53 |
| Prime95 Stress | 1,3 | -- | 77 | 65 |
| Prime95 + FurMark Stress | 0,7 | 622 | 76 | 70 |
| Cyberpunk 2077 Stress | ~0,7 | 1.335 | 74 | 70 |
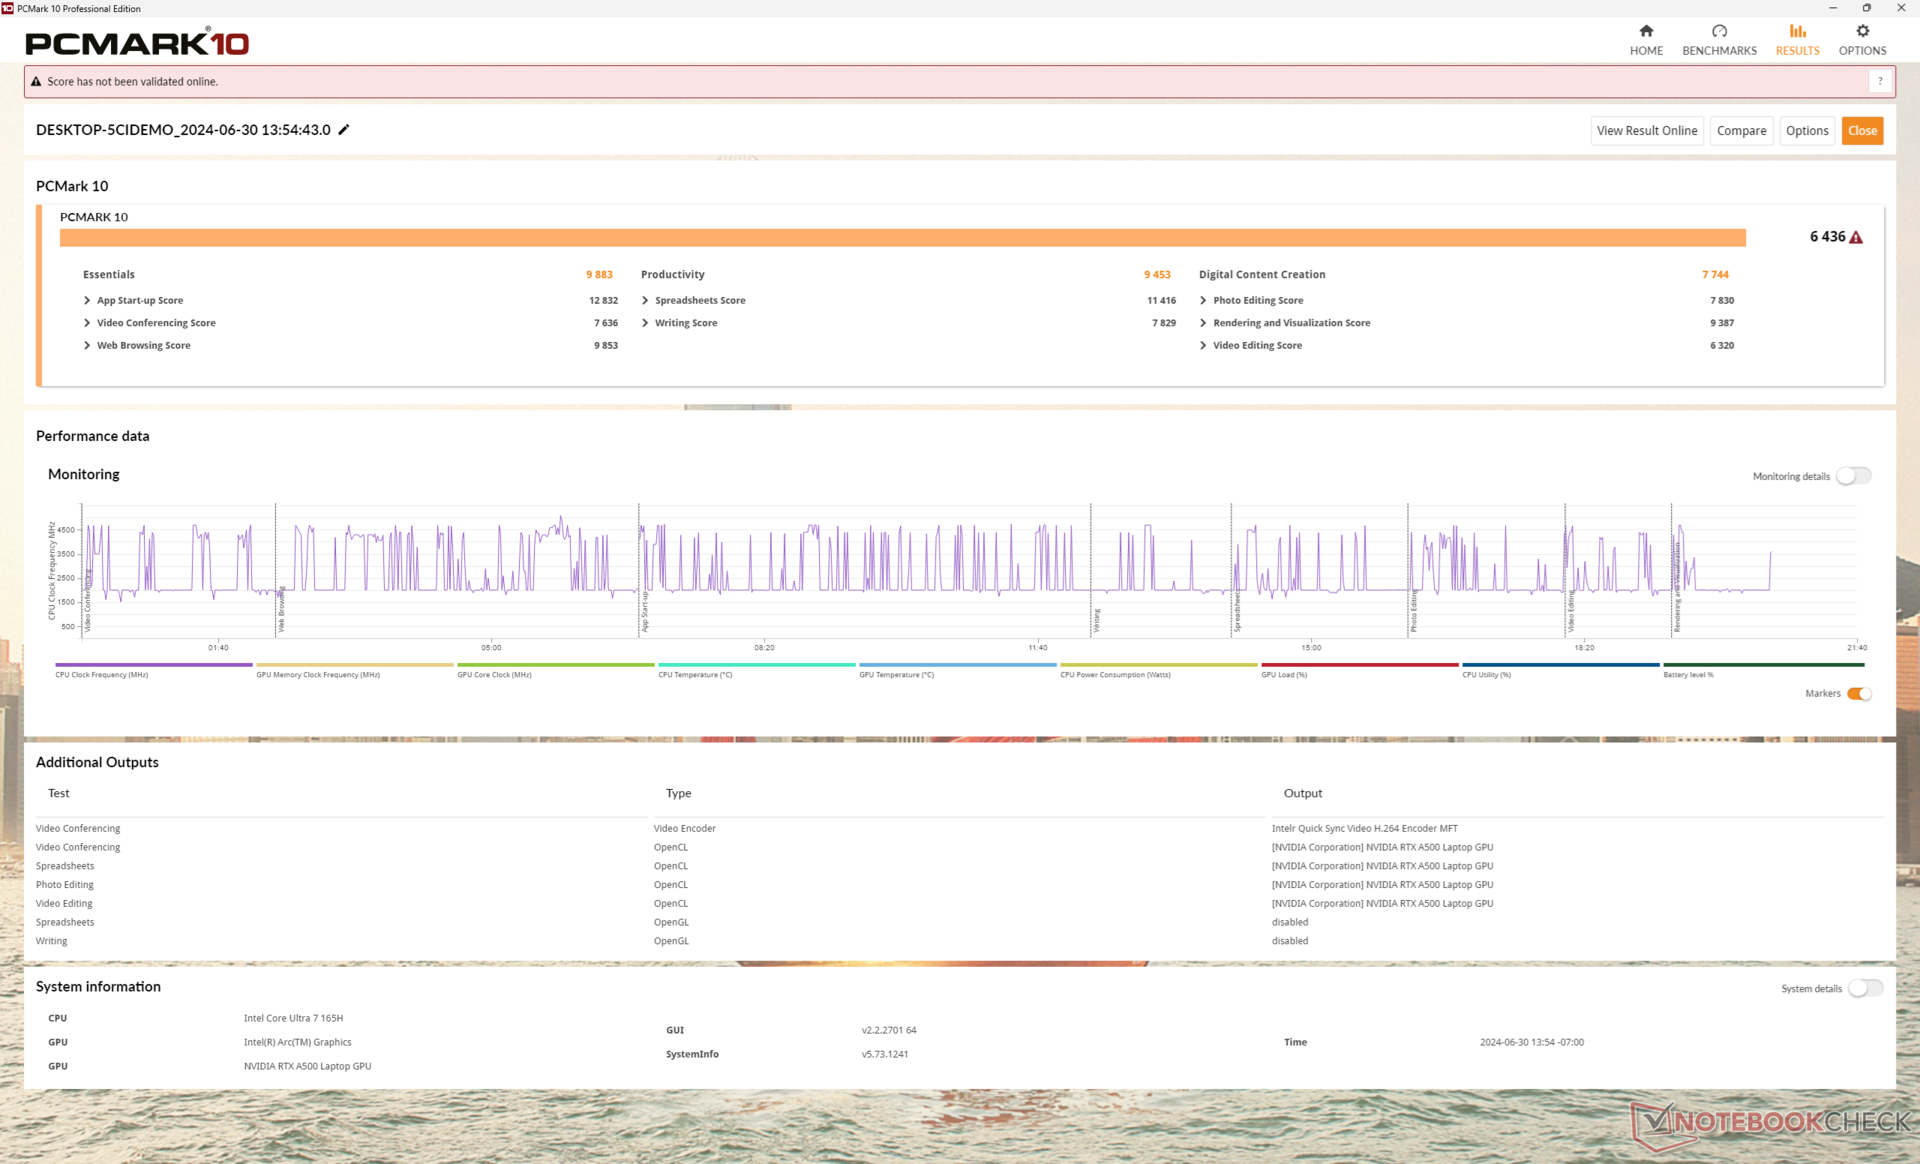
Systemleistung
Die PCMark-Ergebnisse fallen beinahe identisch zu denen im Firefly 14 G10 A aus, was zeigt, dass die üblichen Alltagsaufgaben auf dem aktuellen Modell kaum schneller laufen dürften. Anders sieht es bei sehr anspruchsvollen Lasten aus, hier gibt es durchaus einen Vorteil für das neue Firefly 14 G11, wie unser Grafikabschnitt zeigt.
CrossMark: Overall | Productivity | Creativity | Responsiveness
WebXPRT 3: Overall
WebXPRT 4: Overall
Mozilla Kraken 1.1: Total
| PCMark 10 / Score | |
| Dell Precision 5000 5490 | |
| Lenovo ThinkPad P14s G4 21HF0017GE | |
| HP ZBook Firefly 14 G11 | |
| Durchschnittliche Intel Core Ultra 7 165H, NVIDIA RTX A500 Laptop GPU (n=1) | |
| HP ZBook Firefly 14 G10 A | |
| Asus ExpertBook B3 B3404CVF | |
| HP ZBook Firefly 14 G8 2C9Q2EA | |
| PCMark 10 / Essentials | |
| Dell Precision 5000 5490 | |
| Asus ExpertBook B3 B3404CVF | |
| Lenovo ThinkPad P14s G4 21HF0017GE | |
| HP ZBook Firefly 14 G11 | |
| Durchschnittliche Intel Core Ultra 7 165H, NVIDIA RTX A500 Laptop GPU (n=1) | |
| HP ZBook Firefly 14 G10 A | |
| HP ZBook Firefly 14 G8 2C9Q2EA | |
| PCMark 10 / Productivity | |
| Lenovo ThinkPad P14s G4 21HF0017GE | |
| HP ZBook Firefly 14 G11 | |
| Durchschnittliche Intel Core Ultra 7 165H, NVIDIA RTX A500 Laptop GPU (n=1) | |
| HP ZBook Firefly 14 G10 A | |
| Dell Precision 5000 5490 | |
| Asus ExpertBook B3 B3404CVF | |
| HP ZBook Firefly 14 G8 2C9Q2EA | |
| PCMark 10 / Digital Content Creation | |
| Dell Precision 5000 5490 | |
| Lenovo ThinkPad P14s G4 21HF0017GE | |
| HP ZBook Firefly 14 G11 | |
| Durchschnittliche Intel Core Ultra 7 165H, NVIDIA RTX A500 Laptop GPU (n=1) | |
| HP ZBook Firefly 14 G10 A | |
| Asus ExpertBook B3 B3404CVF | |
| HP ZBook Firefly 14 G8 2C9Q2EA | |
| CrossMark / Overall | |
| Lenovo ThinkPad P14s G4 21HF0017GE | |
| Asus ExpertBook B3 B3404CVF | |
| Dell Precision 5000 5490 | |
| HP ZBook Firefly 14 G11 | |
| Durchschnittliche Intel Core Ultra 7 165H, NVIDIA RTX A500 Laptop GPU (n=1) | |
| CrossMark / Productivity | |
| Asus ExpertBook B3 B3404CVF | |
| Lenovo ThinkPad P14s G4 21HF0017GE | |
| Dell Precision 5000 5490 | |
| HP ZBook Firefly 14 G11 | |
| Durchschnittliche Intel Core Ultra 7 165H, NVIDIA RTX A500 Laptop GPU (n=1) | |
| CrossMark / Creativity | |
| Lenovo ThinkPad P14s G4 21HF0017GE | |
| Dell Precision 5000 5490 | |
| HP ZBook Firefly 14 G11 | |
| Durchschnittliche Intel Core Ultra 7 165H, NVIDIA RTX A500 Laptop GPU (n=1) | |
| Asus ExpertBook B3 B3404CVF | |
| CrossMark / Responsiveness | |
| Asus ExpertBook B3 B3404CVF | |
| Lenovo ThinkPad P14s G4 21HF0017GE | |
| Dell Precision 5000 5490 | |
| HP ZBook Firefly 14 G11 | |
| Durchschnittliche Intel Core Ultra 7 165H, NVIDIA RTX A500 Laptop GPU (n=1) | |
| WebXPRT 3 / Overall | |
| Lenovo ThinkPad P14s G4 21HF0017GE | |
| HP ZBook Firefly 14 G11 | |
| Durchschnittliche Intel Core Ultra 7 165H, NVIDIA RTX A500 Laptop GPU (n=1) | |
| Dell Precision 5000 5490 | |
| Asus ExpertBook B3 B3404CVF | |
| HP ZBook Firefly 14 G10 A | |
| HP ZBook Firefly 14 G10 A | |
| WebXPRT 4 / Overall | |
| Lenovo ThinkPad P14s G4 21HF0017GE | |
| Lenovo ThinkPad P14s G4 21HF0017GE | |
| Dell Precision 5000 5490 | |
| Asus ExpertBook B3 B3404CVF | |
| HP ZBook Firefly 14 G11 | |
| Durchschnittliche Intel Core Ultra 7 165H, NVIDIA RTX A500 Laptop GPU (n=1) | |
| Mozilla Kraken 1.1 / Total | |
| HP ZBook Firefly 14 G8 2C9Q2EA | |
| HP ZBook Firefly 14 G10 A | |
| HP ZBook Firefly 14 G10 A | |
| Dell Precision 5000 5490 | |
| HP ZBook Firefly 14 G11 | |
| Durchschnittliche Intel Core Ultra 7 165H, NVIDIA RTX A500 Laptop GPU (n=1) | |
| Asus ExpertBook B3 B3404CVF | |
| Lenovo ThinkPad P14s G4 21HF0017GE | |
* ... kleinere Werte sind besser
| PCMark 10 Score | 6436 Punkte | |
Hilfe | ||
| AIDA64 / Memory Copy | |
| Dell Precision 5000 5490 | |
| Durchschnittliche Intel Core Ultra 7 165H (72539 - 88831, n=3) | |
| HP ZBook Firefly 14 G11 | |
| Asus ExpertBook B3 B3404CVF | |
| HP ZBook Firefly 14 G10 A | |
| Lenovo ThinkPad P14s G4 21HF0017GE | |
| HP ZBook Firefly 14 G8 2C9Q2EA | |
| AIDA64 / Memory Read | |
| Dell Precision 5000 5490 | |
| Durchschnittliche Intel Core Ultra 7 165H (73908 - 87187, n=3) | |
| HP ZBook Firefly 14 G11 | |
| Asus ExpertBook B3 B3404CVF | |
| HP ZBook Firefly 14 G10 A | |
| Lenovo ThinkPad P14s G4 21HF0017GE | |
| HP ZBook Firefly 14 G8 2C9Q2EA | |
| AIDA64 / Memory Write | |
| Dell Precision 5000 5490 | |
| HP ZBook Firefly 14 G10 A | |
| Durchschnittliche Intel Core Ultra 7 165H (72057 - 75839, n=3) | |
| HP ZBook Firefly 14 G11 | |
| Asus ExpertBook B3 B3404CVF | |
| Lenovo ThinkPad P14s G4 21HF0017GE | |
| HP ZBook Firefly 14 G8 2C9Q2EA | |
| AIDA64 / Memory Latency | |
| Dell Precision 5000 5490 | |
| Durchschnittliche Intel Core Ultra 7 165H (120.8 - 145.6, n=3) | |
| HP ZBook Firefly 14 G11 | |
| HP ZBook Firefly 14 G10 A | |
| Lenovo ThinkPad P14s G4 21HF0017GE | |
| Asus ExpertBook B3 B3404CVF | |
| HP ZBook Firefly 14 G8 2C9Q2EA | |
* ... kleinere Werte sind besser
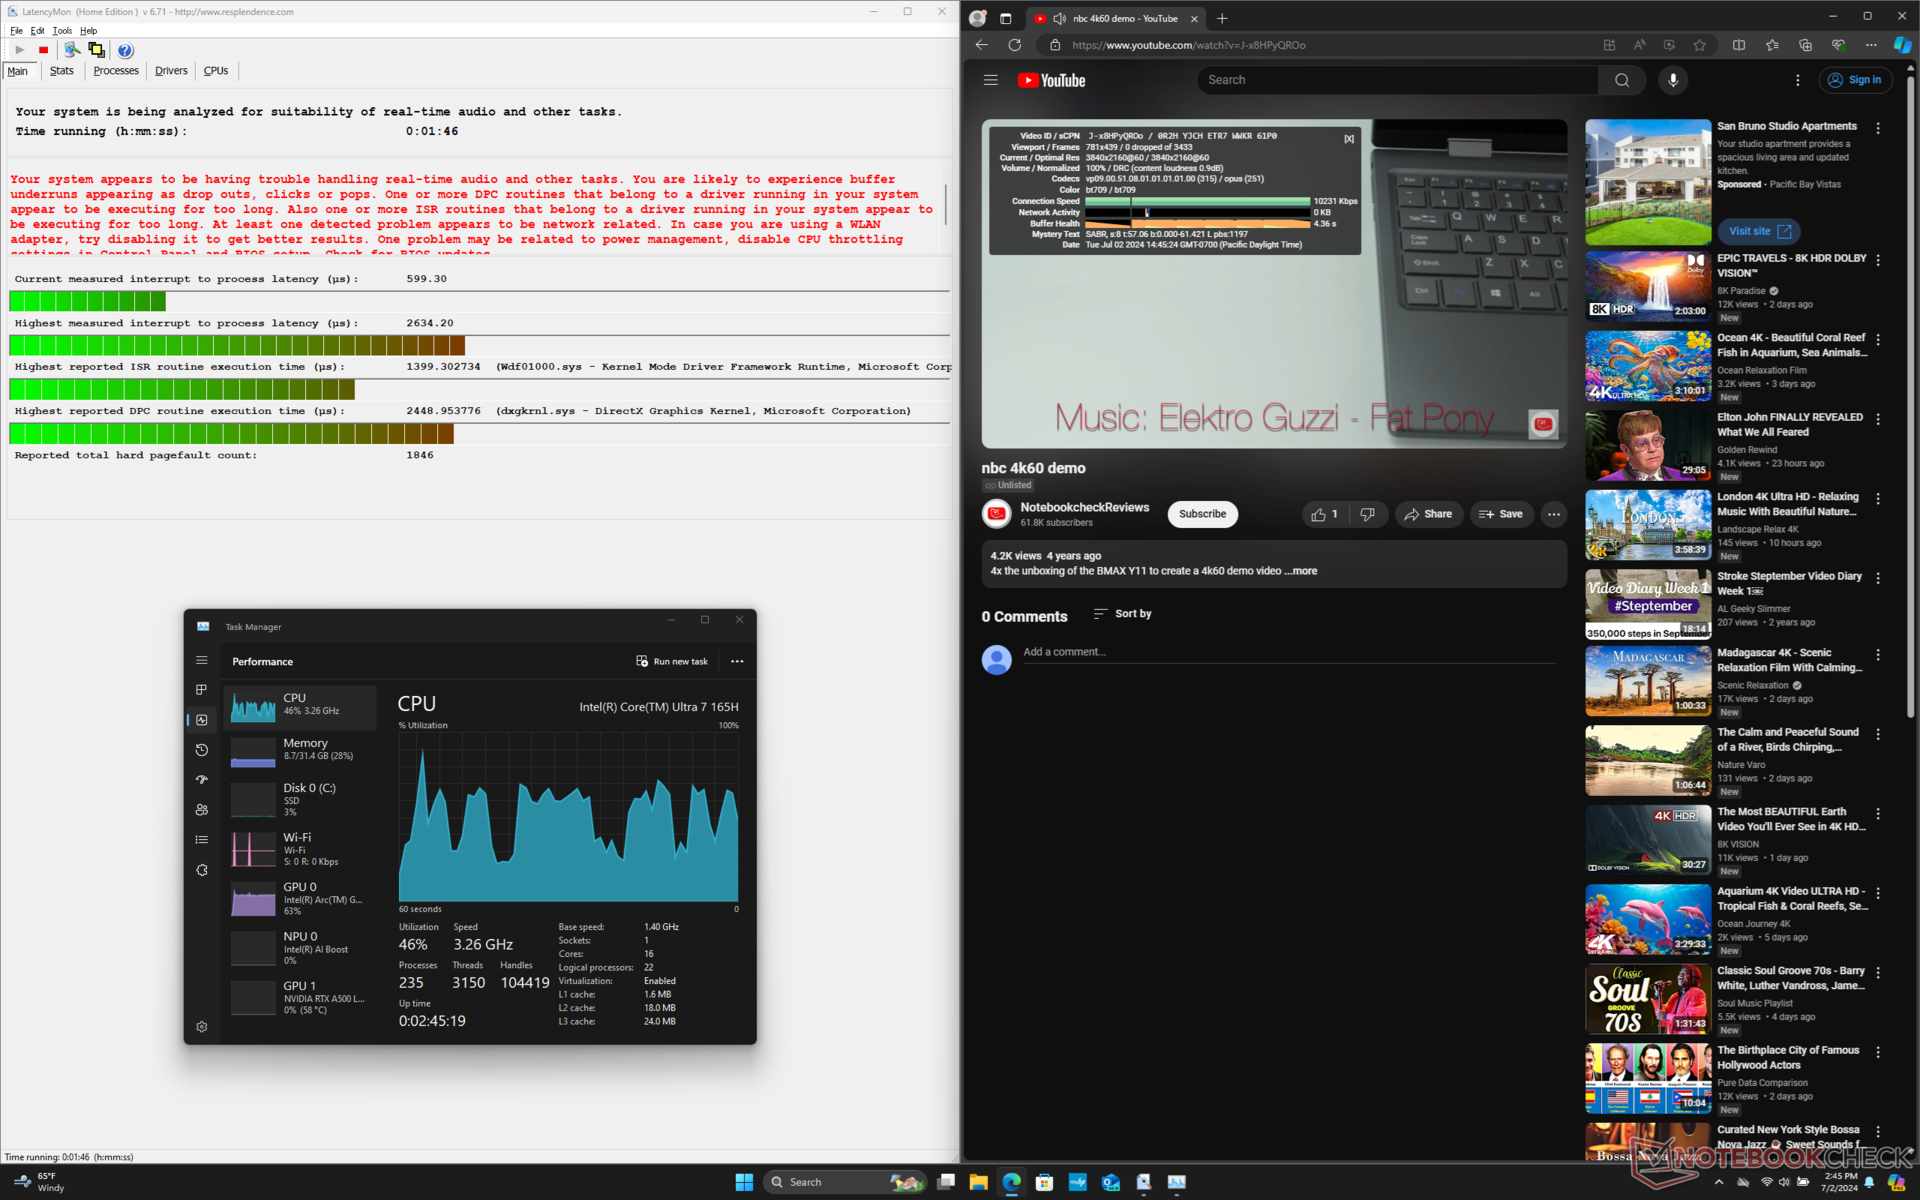
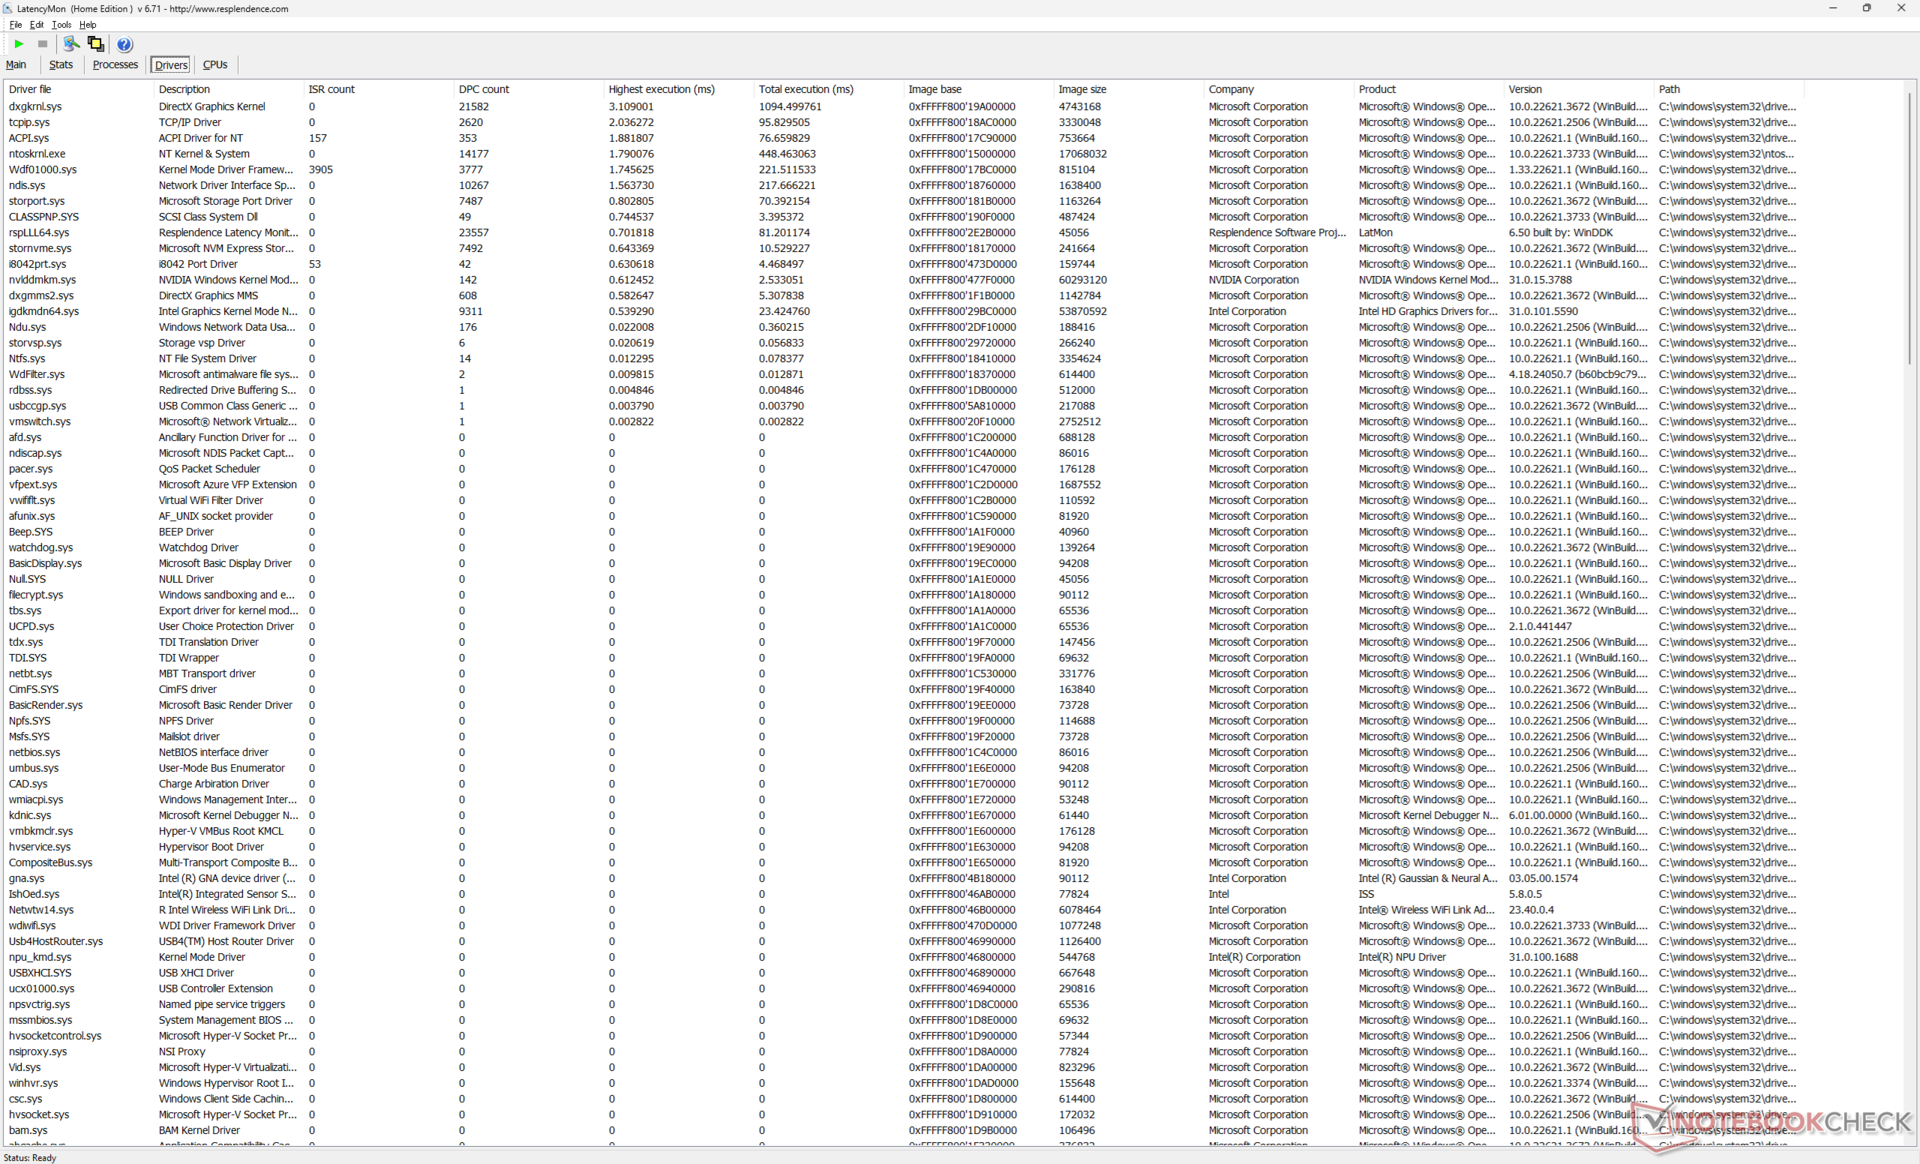
DPC Latency
LatencyMon deckt DPC-Probleme beim Öffnen mehrerer Browsertabs auf unserer Homepage auf. Die Wiedergabe unseres 4K/60-fps-YouTubevideos läuft ansonsten aber perfekt und ohne ausgelassene Frames ab. Allerdings fällt die CPU-Auslastung mit Spitzen von um die 50 Prozent über den gesamten Test ungewöhnlich hoch aus.
| DPC Latencies / LatencyMon - interrupt to process latency (max), Web, Youtube, Prime95 | |
| HP ZBook Firefly 14 G8 2C9Q2EA | |
| HP ZBook Firefly 14 G11 | |
| Dell Precision 5000 5490 | |
| Lenovo ThinkPad P14s G4 21HF0017GE | |
| HP ZBook Firefly 14 G10 A | |
| Asus ExpertBook B3 B3404CVF | |
* ... kleinere Werte sind besser
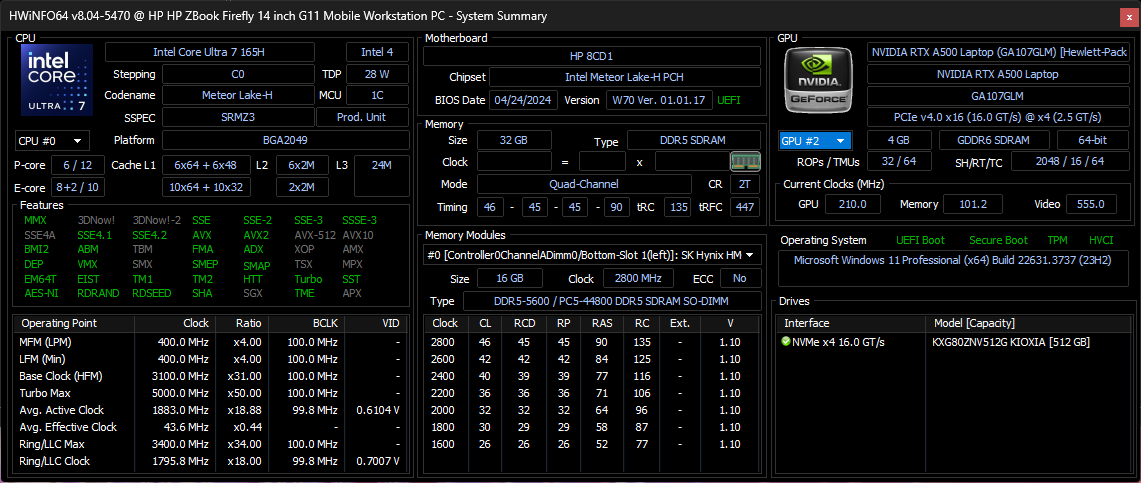
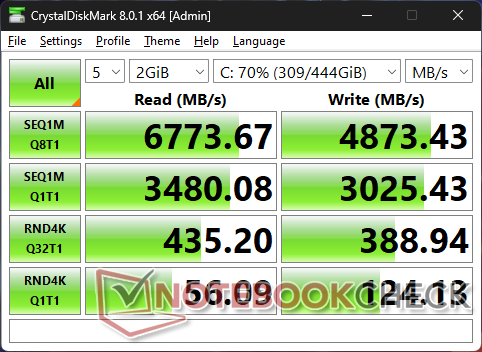
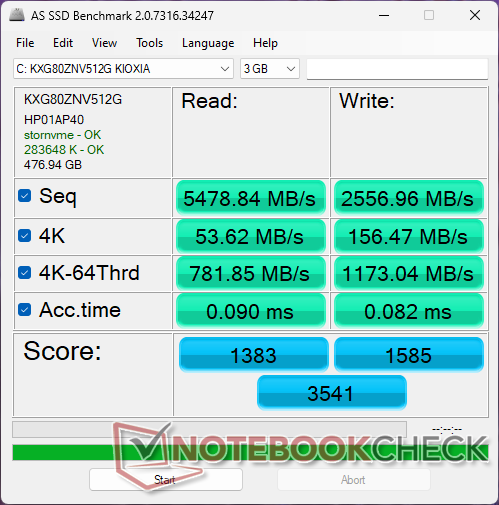
Massenspeicher
HP scheint für seine Firefly-14-Serie weiterhin entweder auf Kioxia oder Samsung zu setzen. In unserem System ist die gleiche Kioxia XG8 KXG80ZNV512G verbaut wie im drei Jahre alten Firefly 14 G8. Der PCIe4-x4-Speicher bietet Übertragungsraten von bis zu 6.700 MB/s, drosselt aber leider auch nach etwa einer Minute Diskspd-Loop auf 3.600 MB/s herunter, wie der Graph unten zeigt.

| Drive Performance Rating - Percent | |
| Lenovo ThinkPad P14s G4 21HF0017GE | |
| Asus ExpertBook B3 B3404CVF | |
| Dell Precision 5000 5490 | |
| HP ZBook Firefly 14 G11 | |
| HP ZBook Firefly 14 G8 2C9Q2EA | |
| HP ZBook Firefly 14 G10 A | |
* ... kleinere Werte sind besser
Disk Throttling: DiskSpd Read Loop, Queue Depth 8
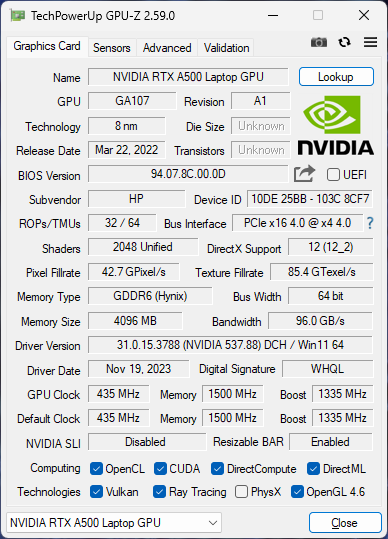
Grafikleistung — Ältere Nvidia RTX A500
Die RTX A500 ist die langsamste, dedizierte professionelle GPU, basiert noch auf der älteren Ampere-Architektur und ist leider die einzige dedizierte Grafikoption für das Firefly 14 G11. Die GPU zeigt so langsam ihr Alter, immerhin können die aktuellsten integrierten GPUs wie Arc 8 oder Radeon 780M in 3DMark-Benchmarks oder Games nahezu mit der RTX A500 gleichziehen. Allerdings überrundet die Nvidia GPU noch immer Intels und AMDs iGPUs, wenn es um professionelle Anwendungen wie Blender oder denen im SPECviewperf geht.
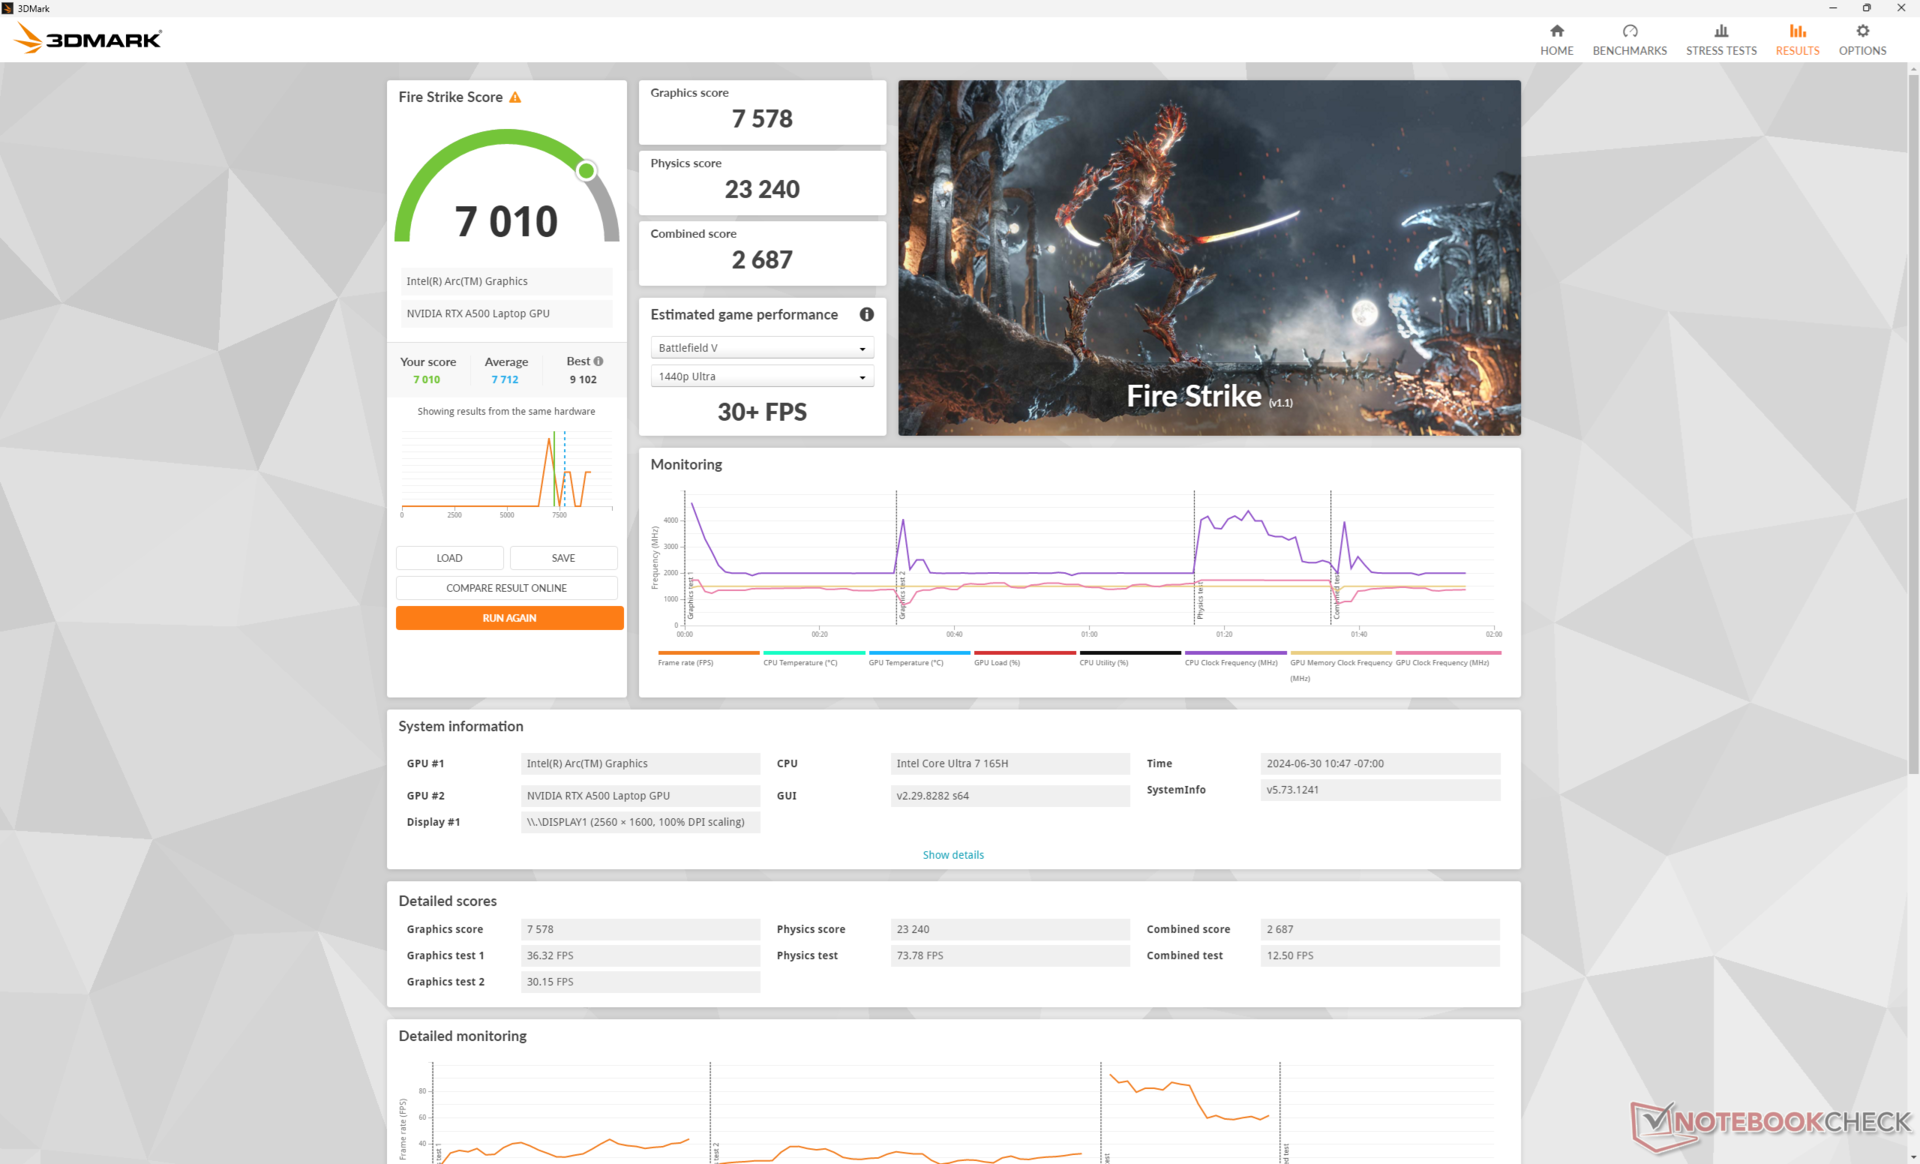
| Leistungsprofil | Graphics Score | Physics Score | Combined Score |
| Leistungsmodus | 7.578 | 23.240 | 2.687 |
| Ausbalancierter Modus | 7.554 (-0%) | 22.308 (-4%) | 2.695 (-0%) |
| Akkumodus | 5.706 (-25%) | 16.248 (-30%) | 2.120 (-21%) |
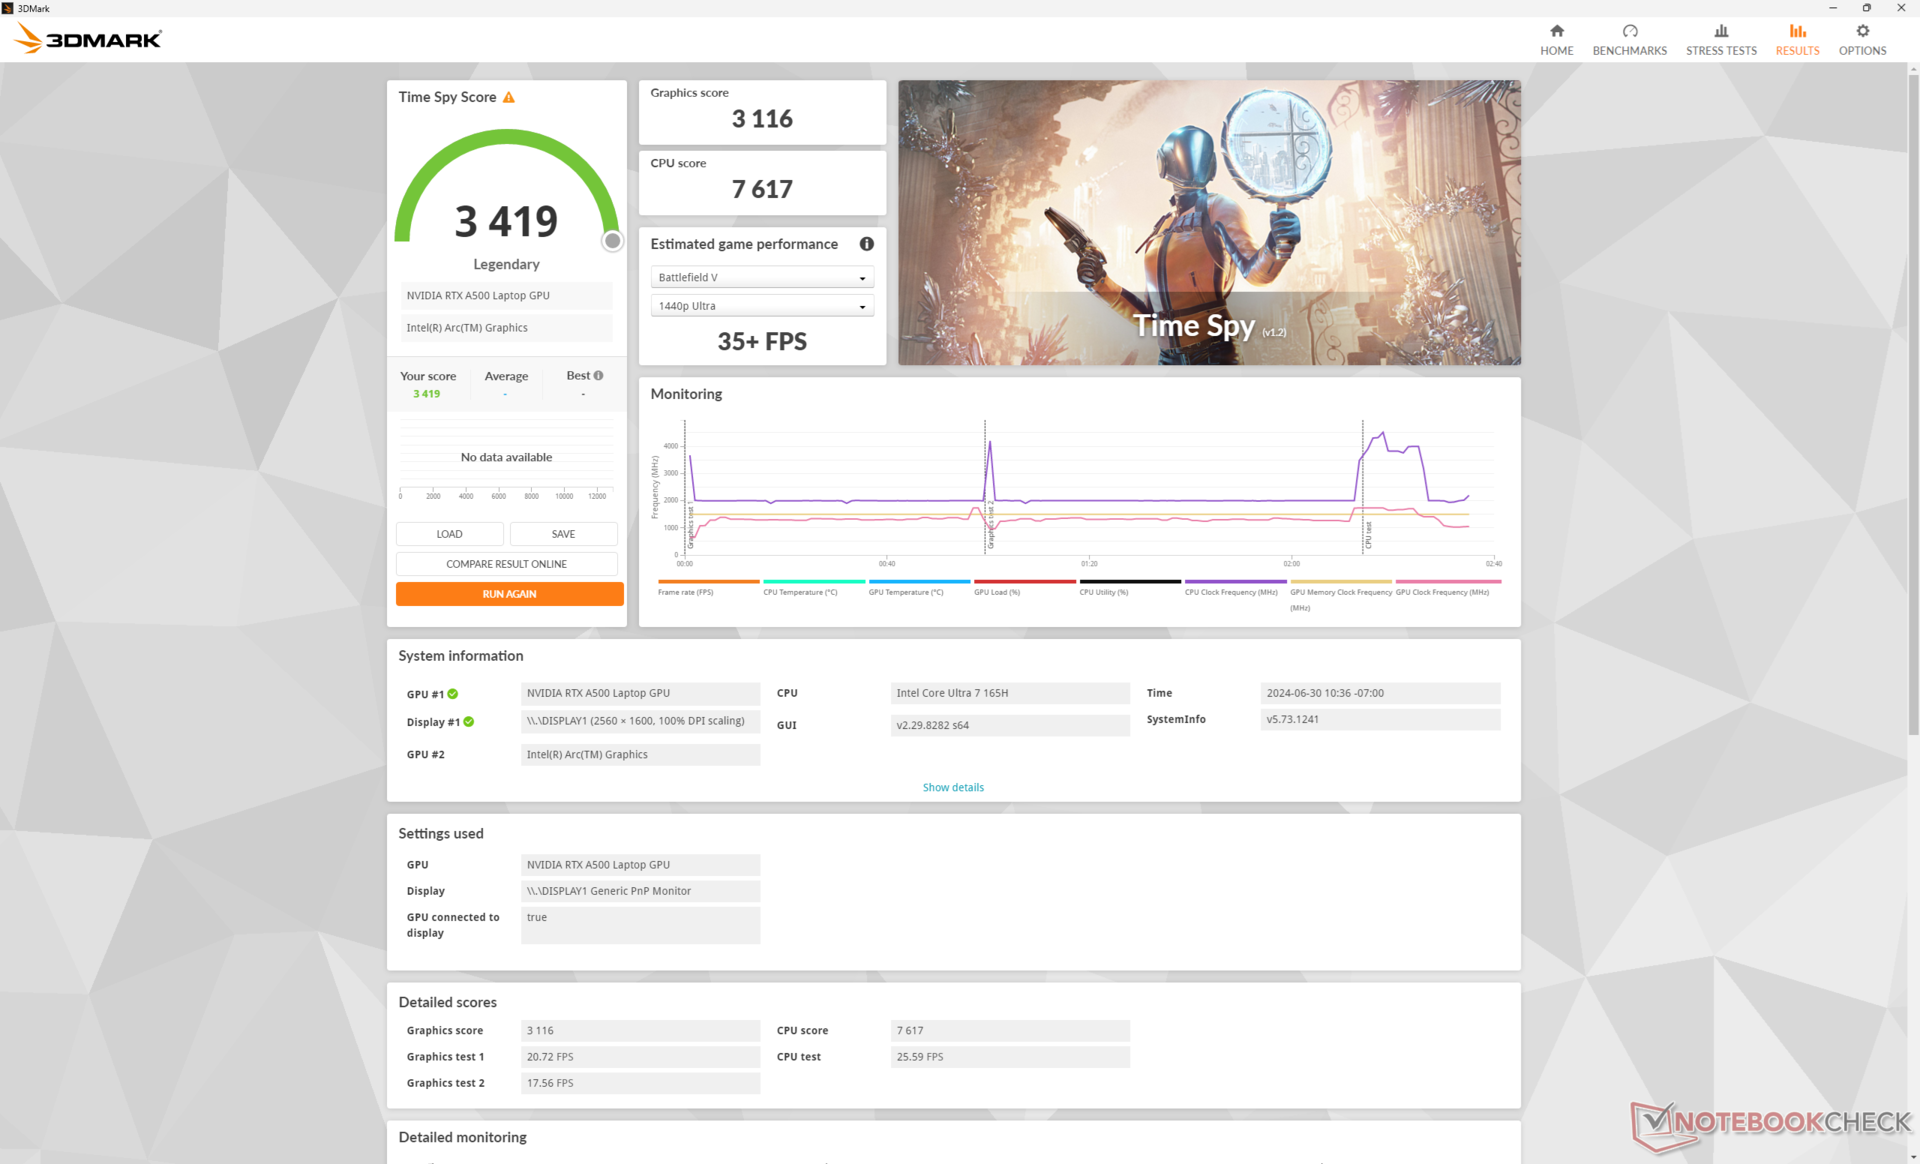
Es scheint keinen Unterschied zu machen, ob wir das System im Leistungs- oder Ausbalancierten Modus betreiben, wie unsere Fire-Strike-Ergebnisse in der Tabelle unten verdeutlichen. Im Akkumodus werden hingegen sowohl CPU als auch GPU stark in ihrer Leistung beschnitten.
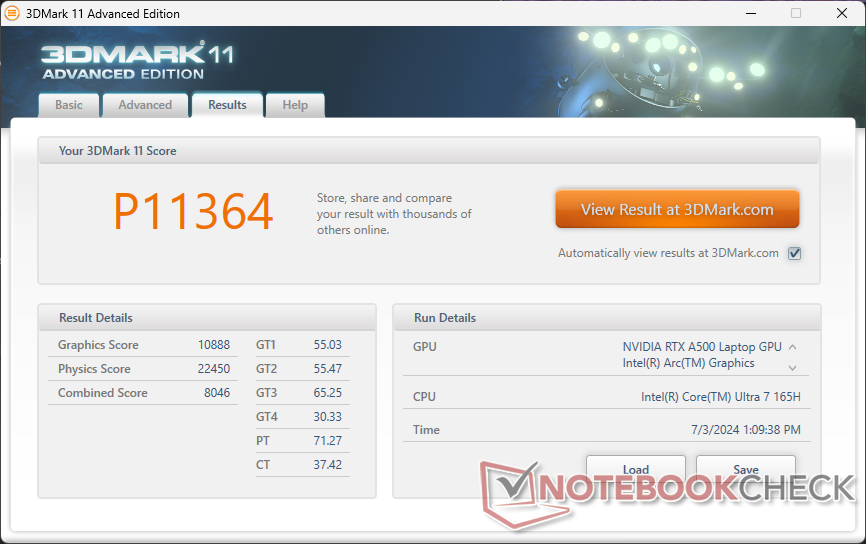
| 3DMark 11 Performance | 11364 Punkte | |
| 3DMark Cloud Gate Standard Score | 30528 Punkte | |
| 3DMark Fire Strike Score | 7010 Punkte | |
| 3DMark Time Spy Score | 3419 Punkte | |
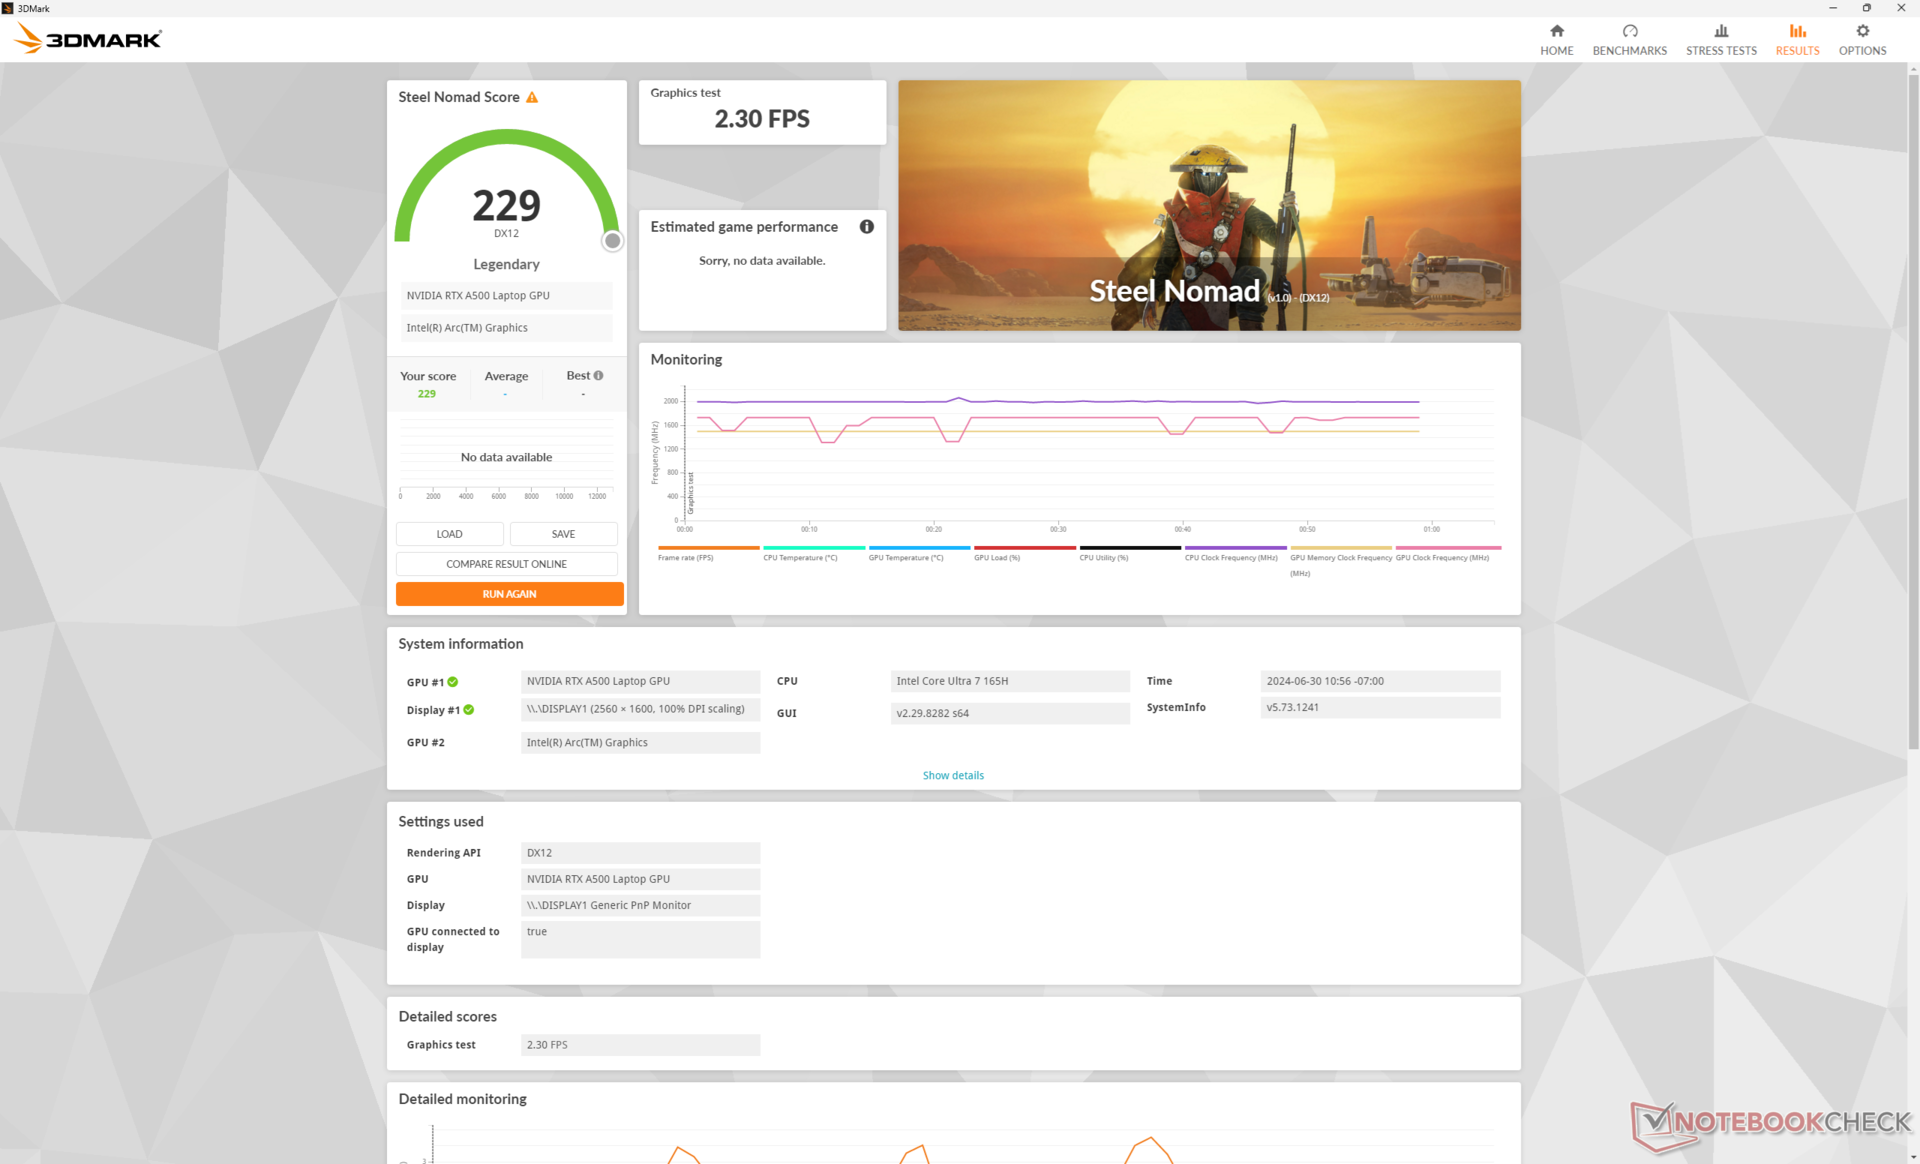
| 3DMark Steel Nomad Score | 229 Punkte | |
Hilfe | ||
* ... kleinere Werte sind besser
| Performance Rating - Percent | |
| Dell Precision 5000 5490 | |
| Asus ExpertBook B3 B3404CVF -1! | |
| Lenovo ThinkPad P14s G4 21HF0017GE | |
| HP ZBook Firefly 14 G11 | |
| HP ZBook Firefly 14 G8 2C9Q2EA -1! | |
| HP ZBook Firefly 14 G10 A -1! | |
| The Witcher 3 - 1920x1080 Ultra Graphics & Postprocessing (HBAO+) | |
| Dell Precision 5000 5490 | |
| Asus ExpertBook B3 B3404CVF | |
| Lenovo ThinkPad P14s G4 21HF0017GE | |
| HP ZBook Firefly 14 G11 | |
| HP ZBook Firefly 14 G10 A | |
| HP ZBook Firefly 14 G8 2C9Q2EA | |
| Final Fantasy XV Benchmark - 1920x1080 High Quality | |
| Dell Precision 5000 5490 | |
| Asus ExpertBook B3 B3404CVF | |
| Lenovo ThinkPad P14s G4 21HF0017GE | |
| HP ZBook Firefly 14 G11 | |
| HP ZBook Firefly 14 G10 A | |
| HP ZBook Firefly 14 G8 2C9Q2EA | |
| Strange Brigade - 1920x1080 ultra AA:ultra AF:16 | |
| Dell Precision 5000 5490 | |
| Asus ExpertBook B3 B3404CVF | |
| HP ZBook Firefly 14 G11 | |
| Lenovo ThinkPad P14s G4 21HF0017GE | |
| HP ZBook Firefly 14 G10 A | |
| Dota 2 Reborn - 1920x1080 ultra (3/3) best looking | |
| Dell Precision 5000 5490 | |
| Asus ExpertBook B3 B3404CVF | |
| Lenovo ThinkPad P14s G4 21HF0017GE | |
| HP ZBook Firefly 14 G11 | |
| HP ZBook Firefly 14 G8 2C9Q2EA | |
| HP ZBook Firefly 14 G10 A | |
| X-Plane 11.11 - 1920x1080 high (fps_test=3) | |
| Asus ExpertBook B3 B3404CVF | |
| HP ZBook Firefly 14 G11 | |
| Dell Precision 5000 5490 | |
| Lenovo ThinkPad P14s G4 21HF0017GE | |
| HP ZBook Firefly 14 G8 2C9Q2EA | |
| HP ZBook Firefly 14 G10 A | |
| Far Cry 5 - 1920x1080 Ultra Preset AA:T | |
| Dell Precision 5000 5490 | |
| Lenovo ThinkPad P14s G4 21HF0017GE | |
| HP ZBook Firefly 14 G11 | |
| HP ZBook Firefly 14 G8 2C9Q2EA | |
| Tiny Tina's Wonderlands | |
| 1920x1080 Low Preset (DX12) | |
| Dell Precision 5480 | |
| Dell Precision 5000 5490 | |
| HP ZBook Firefly 14 G11 | |
| Durchschnittliche NVIDIA RTX A500 Laptop GPU (n=1) | |
| 1920x1080 Medium Preset (DX12) | |
| Dell Precision 5480 | |
| Dell Precision 5000 5490 | |
| HP ZBook Firefly 14 G11 | |
| Durchschnittliche NVIDIA RTX A500 Laptop GPU (n=1) | |
| 1920x1080 High Preset (DX12) | |
| Dell Precision 5000 5490 | |
| Dell Precision 5480 | |
| HP ZBook Firefly 14 G11 | |
| Durchschnittliche NVIDIA RTX A500 Laptop GPU (n=1) | |
| 1920x1080 Badass Preset (DX12) | |
| Dell Precision 5000 5490 | |
| Dell Precision 5480 | |
| HP ZBook Firefly 14 G11 | |
| Durchschnittliche NVIDIA RTX A500 Laptop GPU (n=1) | |
Cyberpunk 2077 ultra FPS Chart
| min. | mittel | hoch | max. | |
|---|---|---|---|---|
| The Witcher 3 (2015) | 134.6 | 81.6 | 53.4 | 26.3 |
| Dota 2 Reborn (2015) | 160.4 | 130.5 | 96.2 | 91.6 |
| Final Fantasy XV Benchmark (2018) | 78.6 | 44.2 | 31.4 | |
| X-Plane 11.11 (2018) | 113.3 | 98 | 81.6 | |
| Far Cry 5 (2018) | 81 | 51 | 46 | 44 |
| Strange Brigade (2018) | 168.9 | 74.9 | 62.5 | 54.5 |
| Tiny Tina's Wonderlands (2022) | 66.2 | 53.5 | 36.2 | 27.6 |
| F1 22 (2022) | 92.5 | 85.2 | 57.8 | 16.9 |
| Baldur's Gate 3 (2023) | 39.9 | 34.5 | 31.2 | 30.2 |
| Cyberpunk 2077 (2023) | 39.8 | 31.1 | 23.6 | 19.6 |
Emissionen
Systemlautstärke
Es braucht nicht viel, um den Lüfter auf Touren zu bekommen, was zu pulsierendem Wechsel zwischen höheren und niedrigeren Umdrehungen führt. Beispielsweise führt der Leerlauf auf dem Desktop zum Pendeln der Lüfterlautstärke zwischen 24 und 29 dB(A). Sobald höhere Lasten anliegen, drehen die Lüfter schnell auf, sodass das System beim Arbeiten nie lange ruhig ist. Das Maximum ist mit 46 dB (A) gleich hoch wie im langsameren ZBook Firefly 14 G10 A, da sich das Kühlsystem nicht verändert an.
Lautstärkediagramm
| Idle |
| 24.6 / 25.2 / 26.8 dB(A) |
| Last |
| 38.9 / 45.8 dB(A) |
 | ||
30 dB leise 40 dB(A) deutlich hörbar 50 dB(A) störend |
||
min: | ||
| HP ZBook Firefly 14 G11 RTX A500 Laptop GPU, Ultra 7 165H, Kioxia XG8 KXG80ZNV512G | HP ZBook Firefly 14 G10 A Radeon 760M, R5 PRO 7640HS, Samsung PM9B1 512GB MZVL4512HBLU | HP ZBook Firefly 14 G8 2C9Q2EA T500 Laptop GPU, i7-1165G7, Toshiba XG6 KXG60ZNV1T02 | Dell Precision 5000 5490 RTX 3000 Ada Generation Laptop, Ultra 9 185H, Kioxia XG8 KXG80ZNV1T02 | Lenovo ThinkPad P14s G4 21HF0017GE RTX A500 Laptop GPU, i7-1370P, SK Hynix HFS002TEJ9X162N | Asus ExpertBook B3 B3404CVF GeForce RTX 2050 Mobile, i7-1355U, Micron 2400 MTFDKBA1T0QFM | |
|---|---|---|---|---|---|---|
| Geräuschentwicklung | -4% | -5% | 2% | -1% | -4% | |
| aus / Umgebung * (dB) | 24.3 | 25 -3% | 28.7 -18% | 22.8 6% | 24.6 -1% | 24.5 -1% |
| Idle min * (dB) | 24.6 | 25 -2% | 28.7 -17% | 23.8 3% | 24.6 -0% | 25.5 -4% |
| Idle avg * (dB) | 25.2 | 26 -3% | 28.7 -14% | 23.8 6% | 24.6 2% | 25.5 -1% |
| Idle max * (dB) | 26.8 | 27 -1% | 28.7 -7% | 24.7 8% | 25.9 3% | 27.5 -3% |
| Last avg * (dB) | 38.9 | 45 -16% | 34 13% | 38.9 -0% | 41.3 -6% | 42.3 -9% |
| Cyberpunk 2077 ultra * (dB) | 41.8 | 44.2 -6% | ||||
| Last max * (dB) | 45.8 | 46 -0% | 40.1 12% | 51.4 -12% | 46.2 -1% | 49.3 -8% |
| Witcher 3 ultra * (dB) | 45 | 40.1 | 49.9 | 46 |
* ... kleinere Werte sind besser
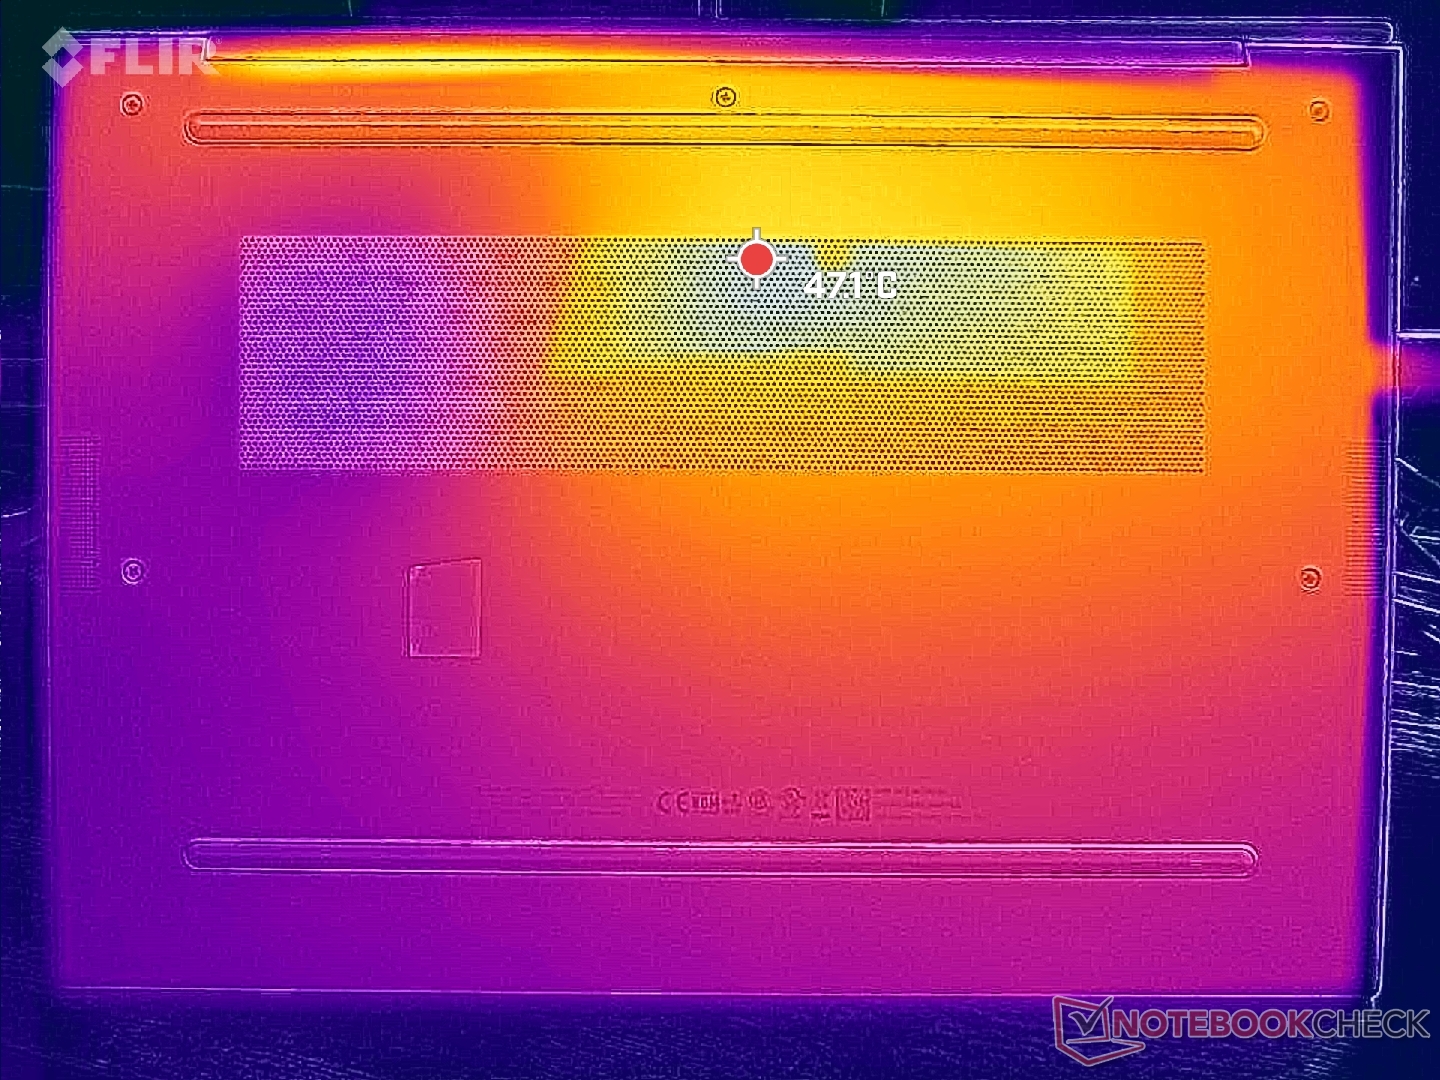
Temperatur
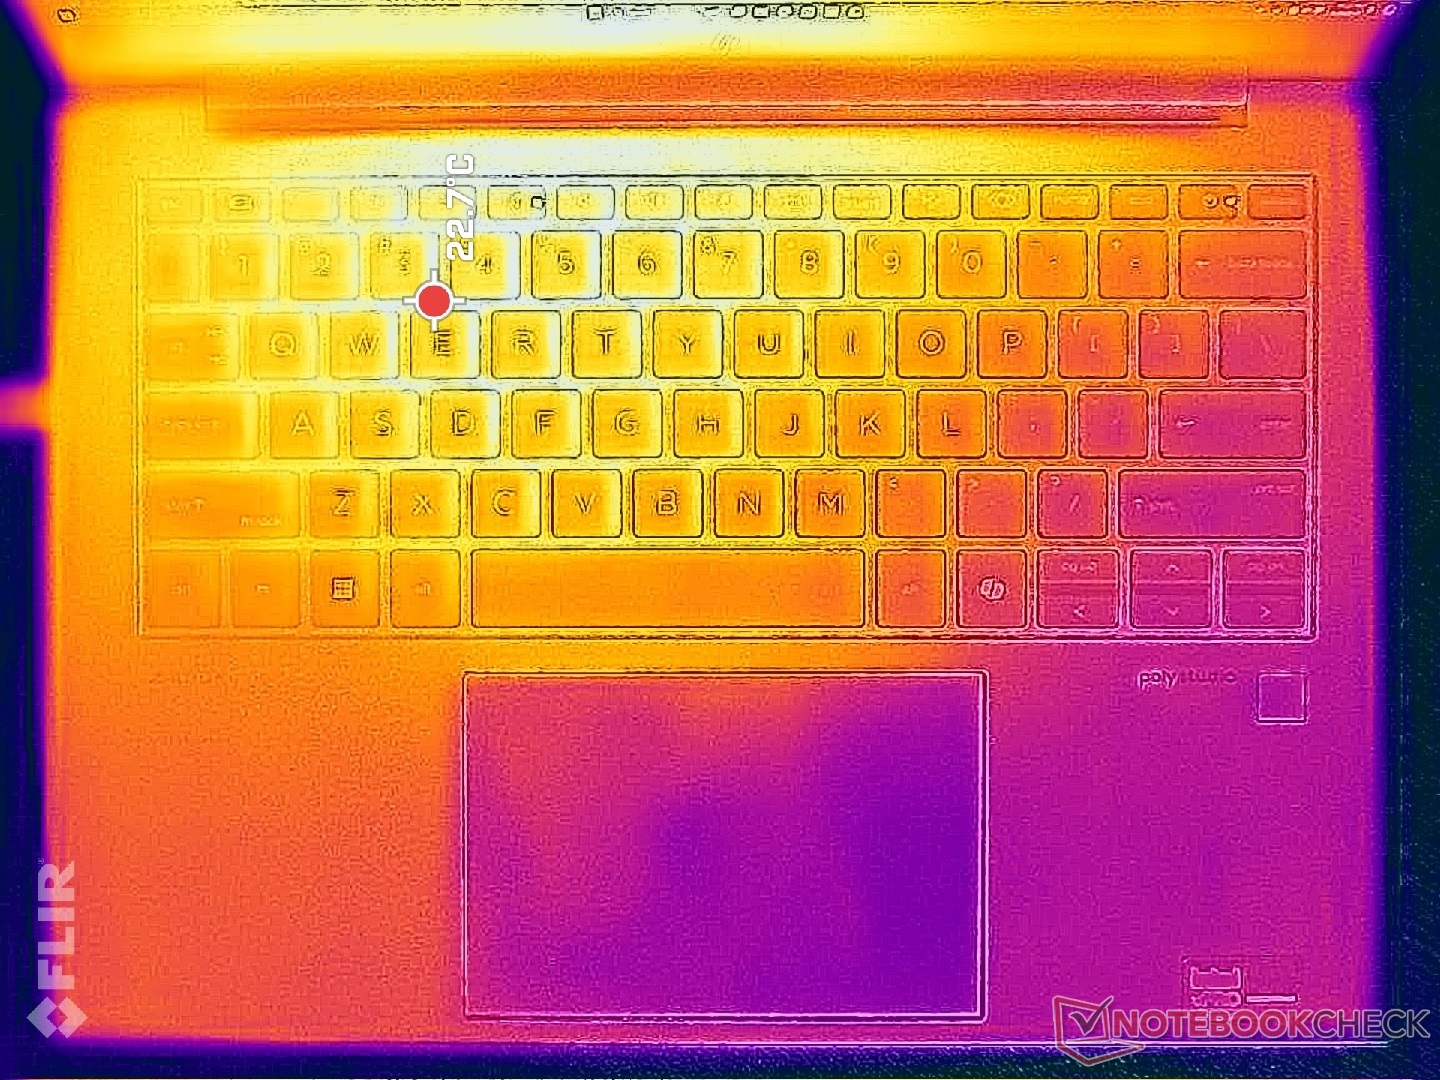
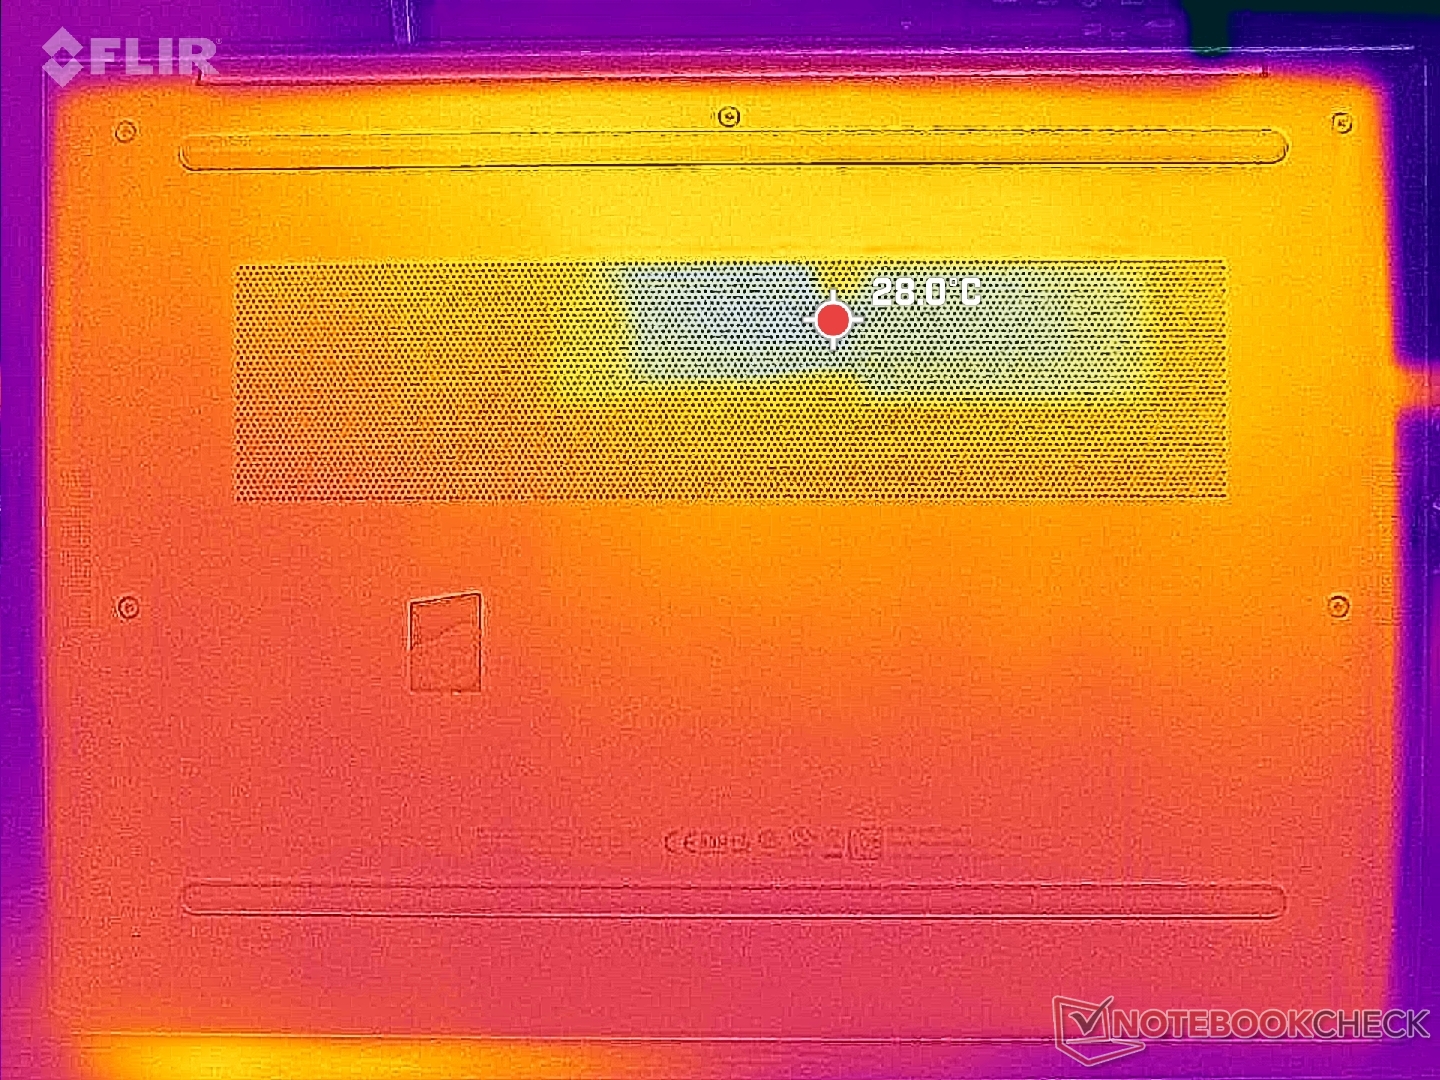
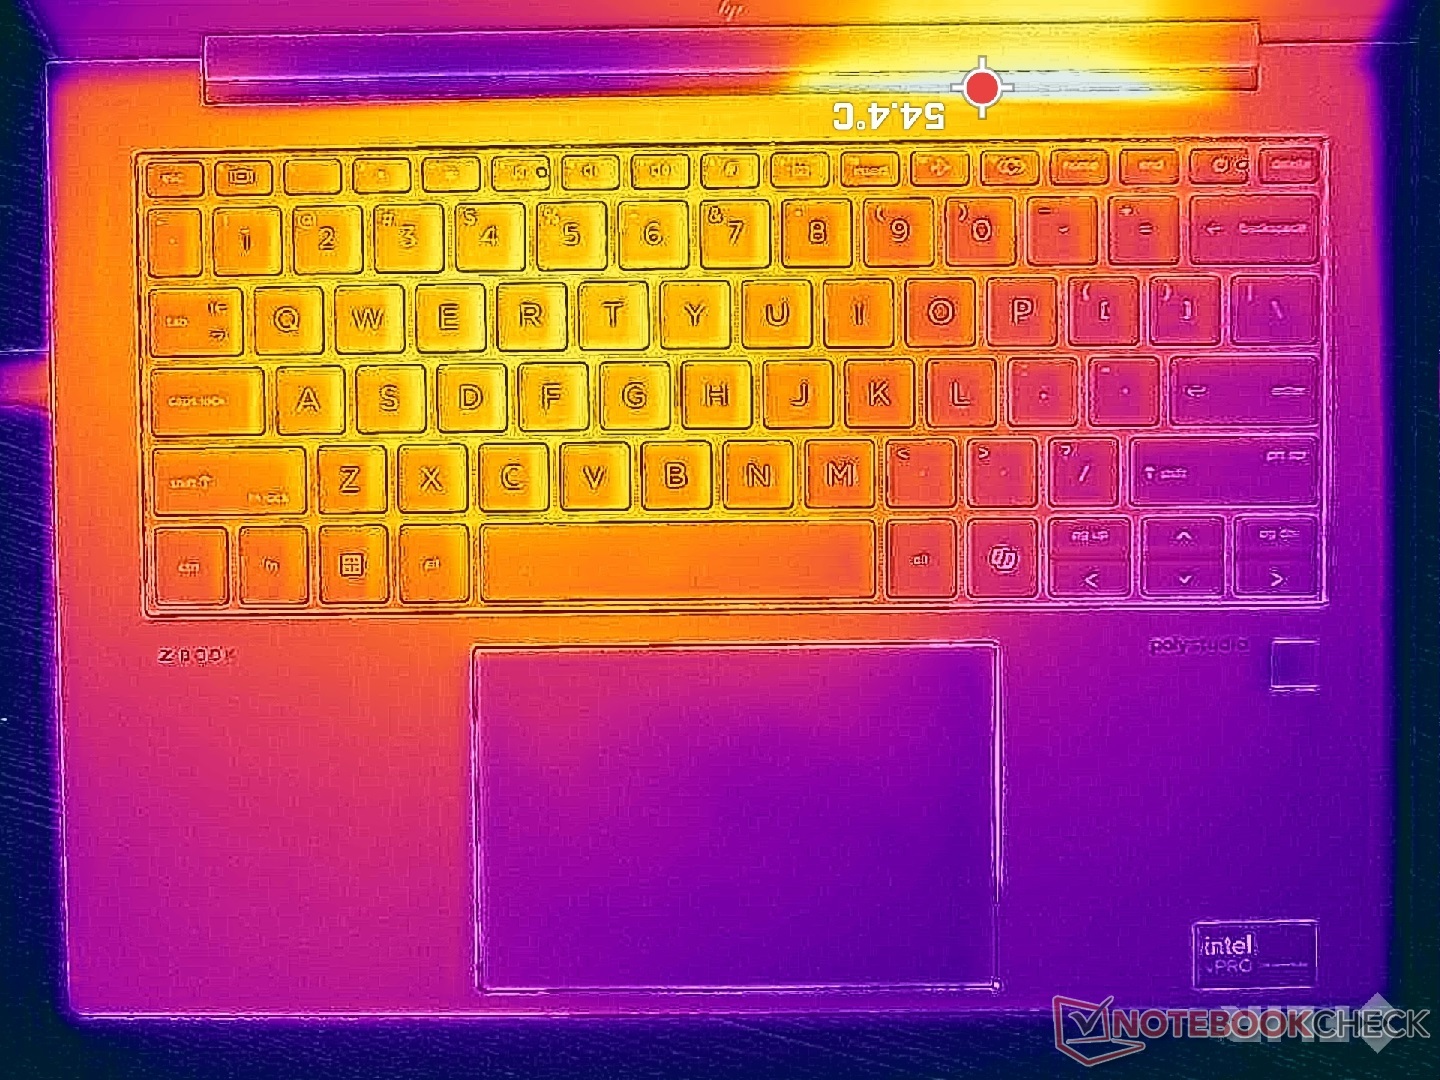
Trotz der dedizierten GPU sind die Oberflächentemperaturen nicht wärmer als beim ZBook Firefly 14 G10 A. Im Durchschnitt messen wir sogar leicht niedrigere Temperaturen. Das kann auch auf das aggressivere Drosselverhalten unter Stress beim Firefly 14 G11 attribuiert werden, was zu einem niedrigeren Verbrauch und zu kontrollierteren Temperaturen führt. Diese Beobachtung deckt sich mit usneren Ergebnissen im CineBench-R15-xT--Loop oben und den Verbrauchsmessungen unten.
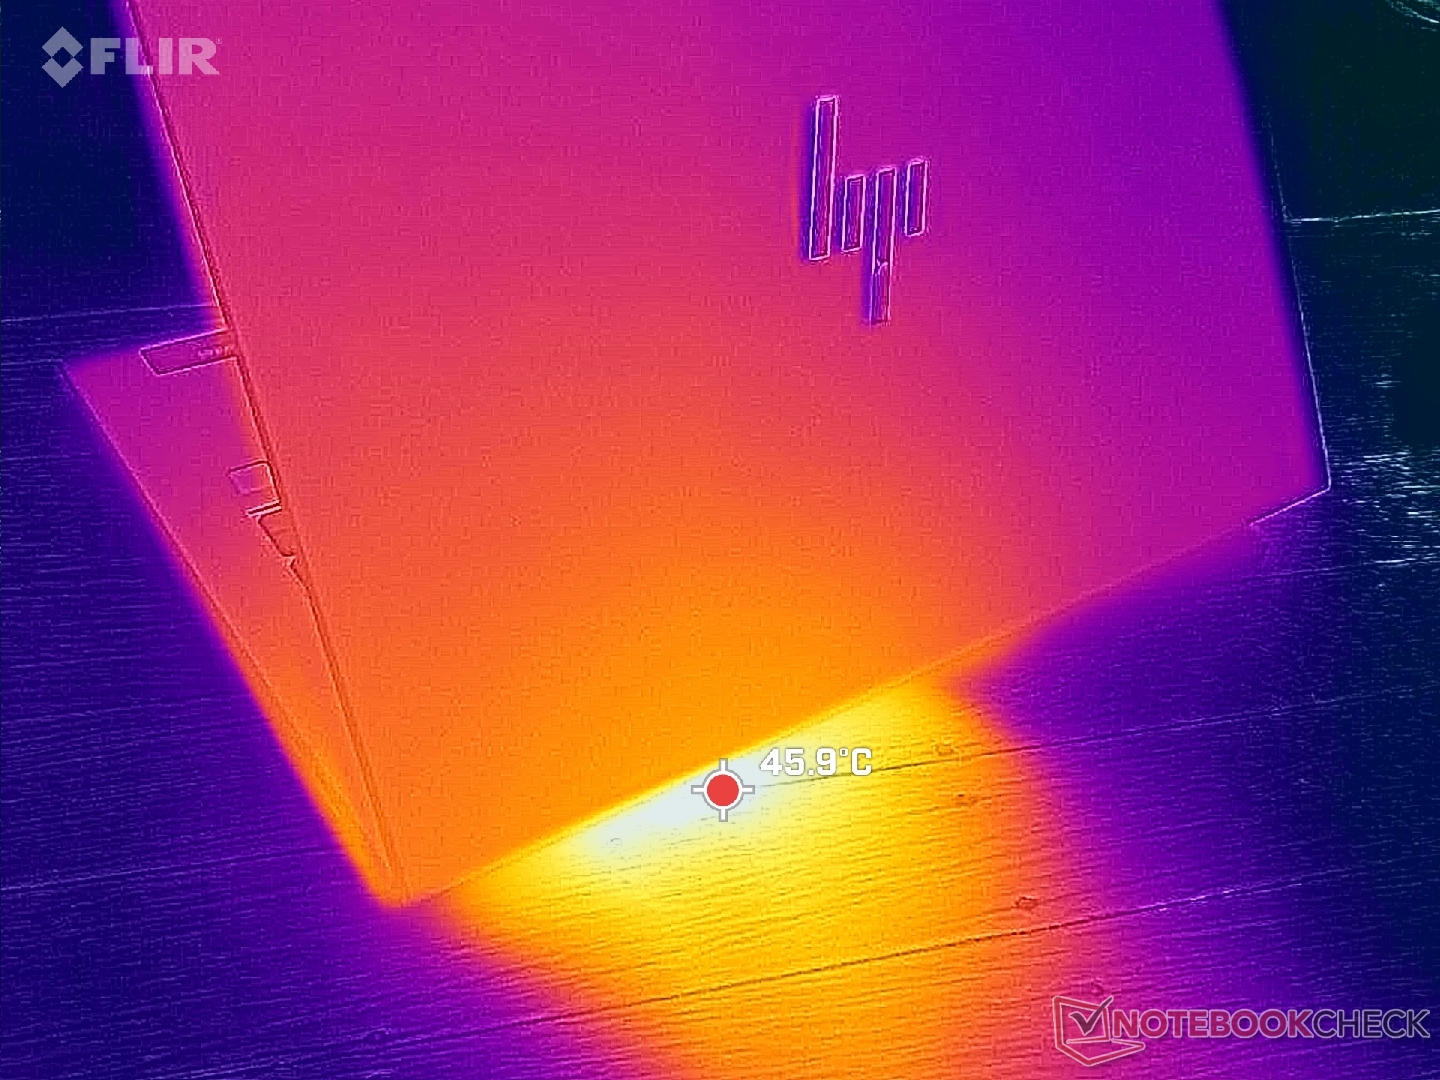
(±) Die maximale Temperatur auf der Oberseite ist 42.8 °C. Im Vergleich liegt der Klassendurchschnitt bei 38.2 °C (von 22.2 bis 69.8 °C für die Klasse Workstation).
(±) Auf der Unterseite messen wir eine maximalen Wert von 44 °C (im Vergleich zum Durchschnitt von 41.1 °C).
(+) Ohne Last messen wir eine durchschnittliche Temperatur von 28.5 °C auf der Oberseite. Der Klassendurchschnitt erreicht 32 °C.
(+) Die Handballen und der Touchpad-Bereich erreichen maximal 33.2 °C und damit die typische Hauttemperatur und fühlen sich daher nicht heiß an.
(-) Die durchschnittliche Handballen-Temperatur anderer getesteter Geräte war 27.8 °C (-5.4 °C).
| HP ZBook Firefly 14 G11 Intel Core Ultra 7 165H, NVIDIA RTX A500 Laptop GPU | HP ZBook Firefly 14 G10 A AMD Ryzen 5 PRO 7640HS, AMD Radeon 760M | HP ZBook Firefly 14 G8 2C9Q2EA Intel Core i7-1165G7, NVIDIA T500 Laptop GPU | Dell Precision 5000 5490 Intel Core Ultra 9 185H, NVIDIA RTX 3000 Ada Generation Laptop | Lenovo ThinkPad P14s G4 21HF0017GE Intel Core i7-1370P, NVIDIA RTX A500 Laptop GPU | Asus ExpertBook B3 B3404CVF Intel Core i7-1355U, NVIDIA GeForce RTX 2050 Mobile | |
|---|---|---|---|---|---|---|
| Hitze | -0% | 8% | 3% | -9% | 12% | |
| Last oben max * (°C) | 42.8 | 50 -17% | 42.6 -0% | 43.2 -1% | 55.3 -29% | 33.2 22% |
| Last unten max * (°C) | 44 | 51 -16% | 49.4 -12% | 38.4 13% | 48.7 -11% | 40.4 8% |
| Idle oben max * (°C) | 30.6 | 25 18% | 24.2 21% | 31.6 -3% | 31 -1% | 28.3 8% |
| Idle unten max * (°C) | 31.4 | 27 14% | 24.6 22% | 30.6 3% | 29.9 5% | 28 11% |
* ... kleinere Werte sind besser
Lautsprecher
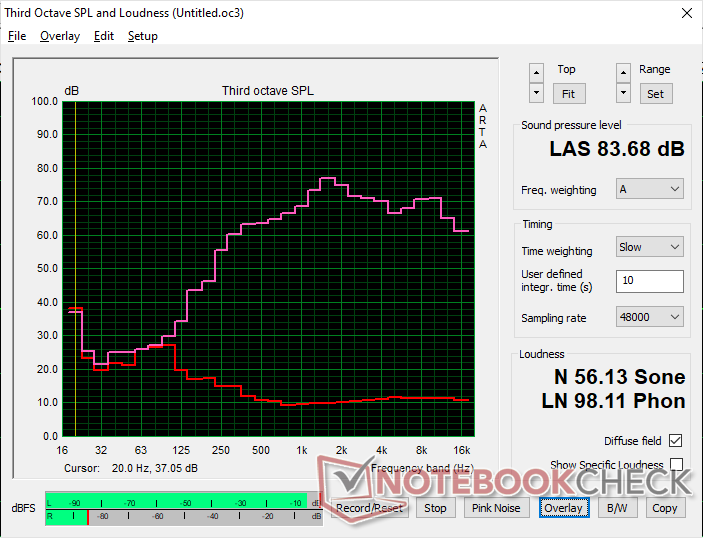
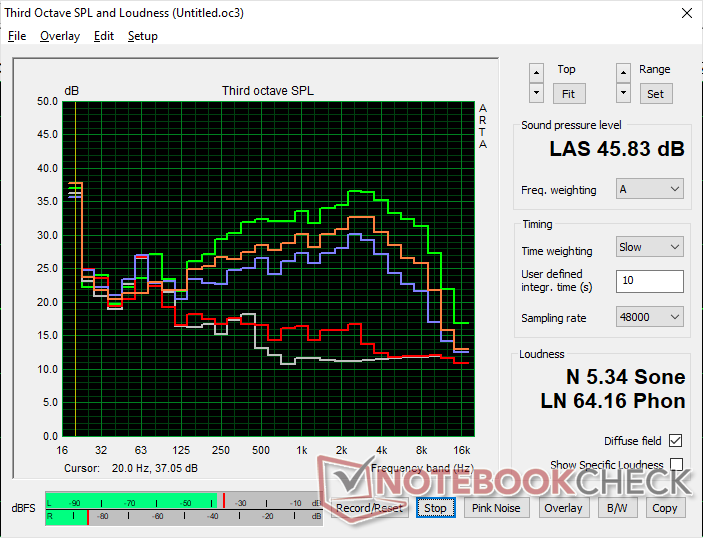
HP ZBook Firefly 14 G11 Audio Analyse
(+) | Die Lautsprecher können relativ laut spielen (83.7 dB)
Bass 100 - 315 Hz
(-) | kaum Bass - 21.6% niedriger als der Median
(±) | durchschnittlich lineare Bass-Wiedergabe (10% Delta zum Vorgänger)
Mitteltöne 400 - 2000 Hz
(+) | ausgeglichene Mitten, vom Median nur 4.5% abweichend
(+) | lineare Mitten (4.3% Delta zum Vorgänger)
Hochtöne 2 - 16 kHz
(+) | ausgeglichene Hochtöne, vom Median nur 3.4% abweichend
(+) | sehr lineare Hochtöne (3.2% Delta zum Vorgänger)
Gesamt im hörbaren Bereich 100 - 16.000 Hz
(±) | hörbarer Bereich ist durchschnittlich linear (16.2% Abstand zum Median)
Im Vergleich zu allen Geräten derselben Klasse
» 42% aller getesteten Geräte dieser Klasse waren besser, 7% vergleichbar, 51% schlechter
» Das beste Gerät hat einen Delta-Wert von 7%, durchschnittlich ist 17%, das schlechteste Gerät hat 35%
Im Vergleich zu allen Geräten im Test
» 25% aller getesteten Geräte waren besser, 5% vergleichbar, 69% schlechter
» Das beste Gerät hat einen Delta-Wert von 4%, durchschnittlich ist 24%, das schlechteste Gerät hat 134%
Apple MacBook Pro 16 2021 M1 Pro Audio Analyse
(+) | Die Lautsprecher können relativ laut spielen (84.7 dB)
Bass 100 - 315 Hz
(+) | guter Bass - nur 3.8% Abweichung vom Median
(+) | lineare Bass-Wiedergabe (5.2% Delta zum Vorgänger)
Mitteltöne 400 - 2000 Hz
(+) | ausgeglichene Mitten, vom Median nur 1.3% abweichend
(+) | lineare Mitten (2.1% Delta zum Vorgänger)
Hochtöne 2 - 16 kHz
(+) | ausgeglichene Hochtöne, vom Median nur 1.9% abweichend
(+) | sehr lineare Hochtöne (2.7% Delta zum Vorgänger)
Gesamt im hörbaren Bereich 100 - 16.000 Hz
(+) | hörbarer Bereich ist sehr linear (4.6% Abstand zum Median
Im Vergleich zu allen Geräten derselben Klasse
» 0% aller getesteten Geräte dieser Klasse waren besser, 0% vergleichbar, 100% schlechter
» Das beste Gerät hat einen Delta-Wert von 5%, durchschnittlich ist 17%, das schlechteste Gerät hat 45%
Im Vergleich zu allen Geräten im Test
» 0% aller getesteten Geräte waren besser, 0% vergleichbar, 100% schlechter
» Das beste Gerät hat einen Delta-Wert von 4%, durchschnittlich ist 24%, das schlechteste Gerät hat 134%
Energiemanagement — Fordernder als zuvor
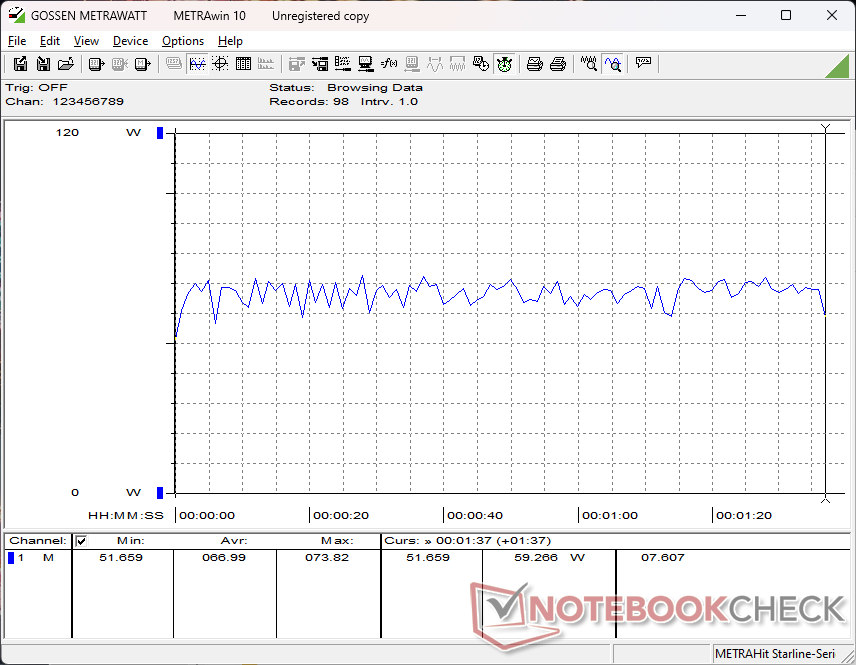
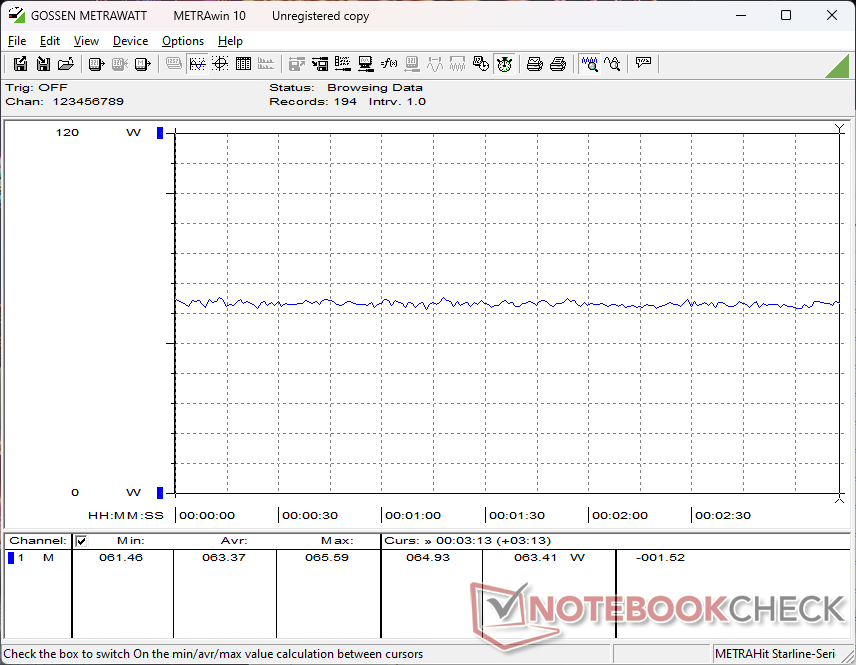
Energieverbrauch
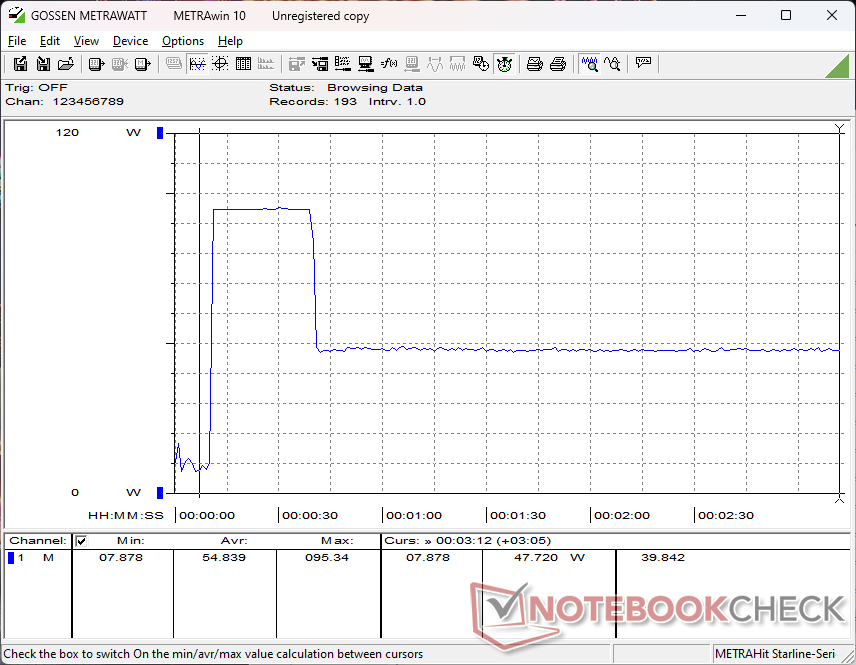
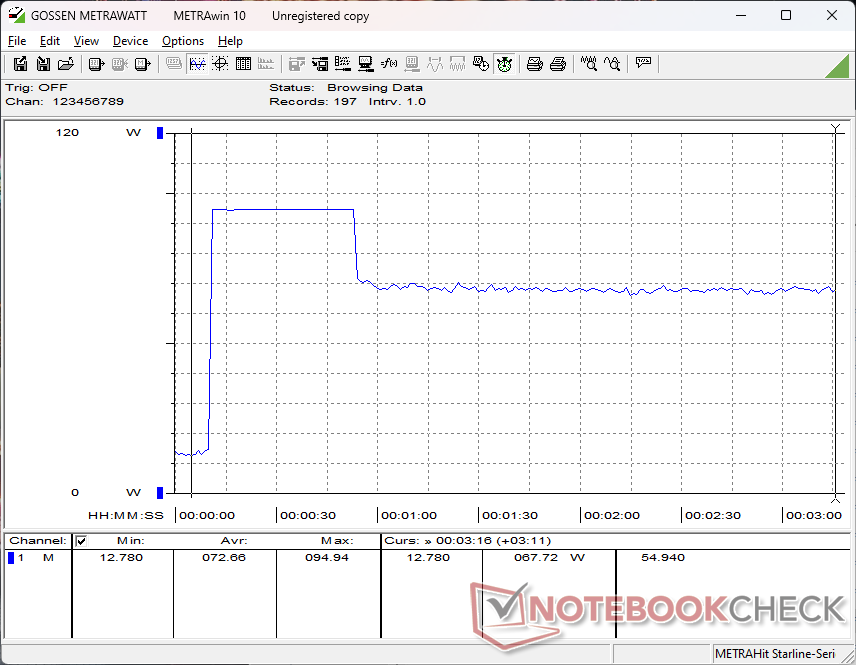
Der Leerlauf auf dem Desktop verbraucht durch die dedizierte GPU, die höhere Displayauflösung und die schnellere Bildwiederholrate nun beinahe zweimal so viel wie noch im ZBook Firefly 14 G10 A. Zwar liegt der Unterschied nur in wenigen Watt, der Einfluss auf die Akkulaufzeit könnte aber über mehrere Stunden hinweg signifikant sein. Mehr dazu weiter unten. Unter stärkeren Lasten wie Cyberpunk 2077 ist der Verbrauch unseres Intel-ZBook-Firefly-14-G11 ebenfalls um mehrere Watt höher.
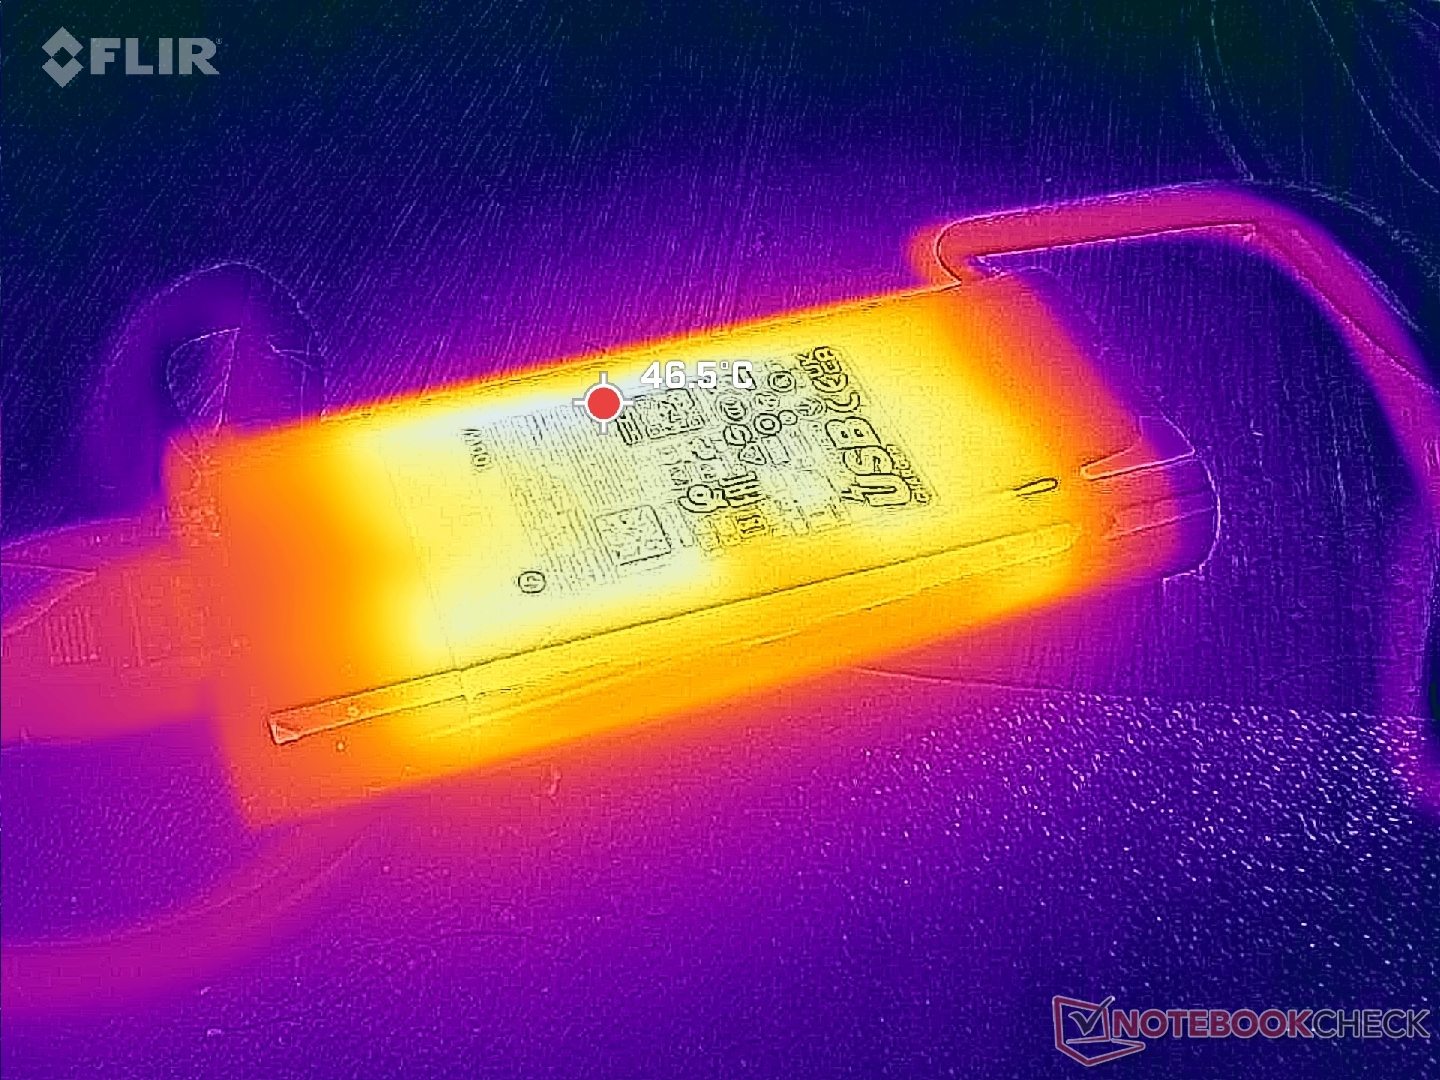
Unsere Testeinheit wurde mit einem größeren (~13,5 x 6 x 2,3 cm) 100-W-USB-C-Netzteil versendet, beim ZBook Firefly 14 G10 A kam noch ein kleineres 65-W-USB-C-Netzteil zum Einsatz, was an den gestiegenen Hardwarevoraussetzungen liegt. Wir messen ein temporäres Maximum von 95 W wenn CPU und GPU maximal gestresst sind.
| Aus / Standby | |
| Idle | |
| Last |
|
Legende:
min: | |
| HP ZBook Firefly 14 G11 Ultra 7 165H, RTX A500 Laptop GPU, Kioxia XG8 KXG80ZNV512G, IPS, 2560x1600, 14" | HP ZBook Firefly 14 G10 A R5 PRO 7640HS, Radeon 760M, Samsung PM9B1 512GB MZVL4512HBLU, IPS, 1920x1200, 14" | HP ZBook Firefly 14 G8 2C9Q2EA i7-1165G7, T500 Laptop GPU, Toshiba XG6 KXG60ZNV1T02, IPS, 1920x1080, 14" | Dell Precision 5000 5490 Ultra 9 185H, RTX 3000 Ada Generation Laptop, Kioxia XG8 KXG80ZNV1T02, IPS, 2560x1600, 14" | Lenovo ThinkPad P14s G4 21HF0017GE i7-1370P, RTX A500 Laptop GPU, SK Hynix HFS002TEJ9X162N, OLED, 2880x1800, 14" | Asus ExpertBook B3 B3404CVF i7-1355U, GeForce RTX 2050 Mobile, Micron 2400 MTFDKBA1T0QFM, IPS, 1920x1200, 14" | |
|---|---|---|---|---|---|---|
| Stromverbrauch | 42% | 36% | -32% | 12% | 21% | |
| Idle min * (Watt) | 6.6 | 3 55% | 3.1 53% | 11.1 -68% | 6.3 5% | 4.95 25% |
| Idle avg * (Watt) | 12.7 | 4 69% | 4.7 63% | 14.8 -17% | 7 45% | 5.5 57% |
| Idle max * (Watt) | 13.3 | 8 40% | 8.6 35% | 16.5 -24% | 8.1 39% | 8.2 38% |
| Last avg * (Watt) | 67 | 56 16% | 64.8 3% | 70.1 -5% | 84.6 -26% | 77.9 -16% |
| Cyberpunk 2077 ultra * (Watt) | 63.4 | |||||
| Cyberpunk 2077 ultra external monitor * (Watt) | 58.1 | |||||
| Last max * (Watt) | 94.9 | 66 30% | 68.5 28% | 137.5 -45% | 98.3 -4% | 95 -0% |
| Witcher 3 ultra * (Watt) | 58.2 | 59.6 | 93.1 | 56.5 | 59.1 |
* ... kleinere Werte sind besser
Energieverbrauch Cyberpunk / Stresstest
Energieverbrauch mit externem Monitor
Akkulaufzeit
Die WLAN-Laufzeit fällt jetzt über 4 Stunden kürzer aus als im letztjährigen AMD-betriebenen ZBook Firefly 14 G10 A. Das liegt sicher auch an der GPU und den Displayunterschieden, die wir oben erwähnt haben. Dennoch sind 8,5 Stunden Surfen noch immer ein recht guter Wert für ein ZBook mit CPU der H-Serie und Nvidia-RTX-Grafik.
Eine komplette Aufladung geht recht schnell vonstatten und dauert etwa 80 Minuten.
| HP ZBook Firefly 14 G11 Ultra 7 165H, RTX A500 Laptop GPU, 56 Wh | HP ZBook Firefly 14 G10 A R5 PRO 7640HS, Radeon 760M, 51 Wh | HP ZBook Firefly 14 G8 2C9Q2EA i7-1165G7, T500 Laptop GPU, 53 Wh | Dell Precision 5000 5490 Ultra 9 185H, RTX 3000 Ada Generation Laptop, 72 Wh | Lenovo ThinkPad P14s G4 21HF0017GE i7-1370P, RTX A500 Laptop GPU, 52.5 Wh | Asus ExpertBook B3 B3404CVF i7-1355U, GeForce RTX 2050 Mobile, 63 Wh | |
|---|---|---|---|---|---|---|
| Akkulaufzeit | 51% | 49% | 28% | -29% | 27% | |
| WLAN (h) | 8.6 | 13 51% | 12.8 49% | 11 28% | 6.1 -29% | 10.9 27% |
| Last (h) | 4.3 | 1 |
Pro
Contra
Fazit — Am besten mit Core-Ultra-U-Optionen
Wenn es um Konfigurationen geht, setzen die meisten Laptopmodelle eher auf eine einzige Prozessorfamilie, was zu einer besseren Optimierung führen kann. Beim Firefly 14 G11 können Nutzer hingegen zwischen Core-Ultra-U- und Core-Ultra-H-Prozessoren sowie integrierter oder dedizierter Grafik wählen. Da H-Serien-CPUs und dGPUs deutlich mehr Anforderungen stellen, sollte das Kühlsystem daran angepasst sein.
Im Falle des Firefly 14 G11 bedeutet dies leider, dass CPU-Drosselung in unserer High-End-Konfiguration recht häufig auftritt, was zumindest darauf hindeutet, dass das Kühlsystem und das Gehäuse eher für die Core-U-Serie designt wurden. Die Wahl einer Higher-End-H-Serien-SKU bringt zwar einen kurzen Leistungsboost, bei länger anhaltenden Lasten setzt aber ein starkes Drosseln ein. Das führt dazu, dass die Prozessoren von Intels H-Serie deutlich schwieriger für das FireFly 14 G11 zu empfehlen sind, da Nutzer das Potential der High-End-CPU nicht lange ausschöpfen können.
Das Firefly 14 G11 sieht nach Spitzenklasse aus und fühlt sich auch so an, besonders wenn man das neue 120-Hz-Display auswählt. Die Optionen bei der Leistungshardware werden jedoch durch das veraltete Kühlsystem und Gehäusedesign limitiert.
Neben den CPU-Komplikationen fühlt sich die ältere RTX A500 GPU langsam etwas untermotorisiert an, insbesondere wenn andere 14-Zoll-Workstations wie das Dell Precision 5490 deutlich schnellere RTX-GPUs der neueren Ada-Lovelace-Generation verbaut haben.
Noch immer fühlt sich das Firefly 14 G11 im Gebrauch großartig an, was am mobilen Formfaktor, dem respektablen 120-Hz-Display und der komfortablen Tastatur beziehungsweise auch dem Touchpad liegt. Seine GPU-Options sowie seine Leistungsbalance sollte hingegen optimiert werden.
Preis und Verfügbarkeit
Auf der HP-Homepage starten die Preise bei 1.729,01 Euro für die Variante mit Core Ultra 7 155H, 16 GB RAM, 500 GB SSD, 1.200p-Display ohne Touch und RTX-GPU. Möchte man 32 GB RAM und einen 1.200p-Touchscreen, so werden 1.859 Euro fällig. Für unser Modell mit Core Ultra 7 165H, 64 GB RAM, 1.600p120-Hz-Display und RTX-GPU zahlt man 2.329,00 Euro. Auch auf Amazon werden diverse Konfigurationen angeboten.
Hinweis: Wir haben unser Rating-System kürzlich aktualisiert und die Ergebnisse von Version 8 sind nicht mit den Ergebnissen von Version 7 vergleichbar. Weitere Informationen dazu sind hier verfügbar.
Note: We have recently updated our rating system and the results of version 8 are not comparable with the results of version 7. More information is available here .
HP ZBook Firefly 14 G11
- 16.07.2024 v8
Allen Ngo
 Total Sustainability Score:
 Transparenz
Die Auswahl der zu testenden Geräte erfolgt innerhalb der Redaktion. Das vorliegende Testmuster wurde dem Autor vom Hersteller oder einem Shop zu Testzwecken leihweise zur Verfügung gestellt. Eine Einflussnahme des Leihstellers auf den Testbericht gab es nicht, der Hersteller erhielt keine Version des Reviews vor der Veröffentlichung. Es bestand keine Verpflichtung zur Publikation. Als eigenständiges, unabhängiges Unternehmen unterliegt Notebookcheck keiner Diktion von Herstellern, Shops und Verlagen.
So testet Notebookcheck
Pro Jahr werden von Notebookcheck hunderte Laptops und Smartphones unabhängig in von uns standardisierten technischen Verfahren getestet, um eine Vergleichbarkeit aller Testergebnisse zu gewährleisten. Seit rund 20 Jahren entwickeln wir diese Testmethoden kontinuierlich weiter und setzen damit Branchenstandards. In unseren Testlaboren kommt ausschließlich hochwertiges Messequipment in die Hände erfahrener Techniker und Redakteure. Die Tests unterliegen einer mehrstufigen Kontrolle. Unsere komplexe Gesamtbewertung basiert auf hunderten fundierten Messergebnissen und Benchmarks, womit Ihnen Objektivität garantiert ist. Weitere Informationen zu unseren Testmethoden gibt es hier.
Preisvergleich

