Notebookcheck Logo
Teaser

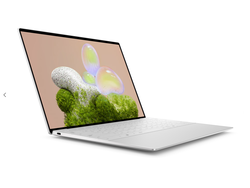
Dell XPS 13 9350 Laptop im Test: Intel Lunar Lake macht den Unterschied

Das bisher erfolgreichste XPS 13 Modell.

Die neue Intel-CPU ermöglicht eine gleichmäßigere Prozessorleistung als im XPS 13 9340 und verbessert gleichzeitig sowohl die Akkulaufzeit als auch die Grafikleistung erheblich. Diese Änderungen machen das XPS 13 zu einem noch stärkeren Konkurrenten für die MacBook-Air-13-Serie.
Allen Ngo, 👁 Allen Ngo (übersetzt von Carmen Pol) Veröffentlicht am 🇺🇸 🇷🇺 ...
Lunar Lake Laptop / Notebook XPS Intel Evo

Fazit

Im Test: Dell XPS 13 9350

Das Gehäusedesign des XPS 13 mag Geschmackssache sein, doch die neue Lunar-Lake-CPU bringt das System auf ein ganz neues Niveau. Sie bietet eine konsistentere Leistung und eine deutlich längere Akkulaufzeit als frühere Modelle. Die frühere Core-H-Serie im XPS 13 9340 war für das schlanke Design des Laptops oft zu leistungsstark und führte zu thermischen Einschränkungen. Der effizientere Core Ultra 7 256V adressiert dieses Problem gezielt und erhöht gleichzeitig die Grafikleistung – eine wesentliche Verbesserung für Reisende und Content-Creator. Diese Gruppen profitieren direkt von der gesteigerten Akkulaufzeit und den schnelleren Grafikfähigkeiten, wodurch das XPS 13 eine sehr interessante Alternative zum MacBook Air 13 darstellt.

Die Turbo-Boost-Leistung leidet ein wenig im Vergleich zum XPS 13 9340. Der Gewinn an Grafikleistung und Akkulaufzeit durch den Wechsel zur neuen Lunar-Lake-Plattform wiegt den Nachteil bei der Multi-Thread-Leistung jedoch mehr als auf.

Pro

+ hochwertiges 120 Hz IPS-Display mit vollen sRGB-Farben
+ gute Grafikleistung für ein XPS 13
+ gleichmäßige Prozessorleistung
+ sehr lange Akkulaufzeit
+ sehr schmale Ränder

Contra

- schwächere Turbo-Boost-Leistung als beim XPS 13 9340
- die 2 MP-Webcam ist in die Jahre gekommen
- keine Unterstützung für variable Bildwiederholraten
- Gehäusedesign, das polarisieren kann
- keine weiteren Display-Optionen

Preis und Verfügbarkeit

Dell bietet das getestete XPS 13 9350 jetzt für 1.699 Euro an.

Mögliche Konkurrenten im Vergleich

Bild
Modell / Test
Preis ab
Gewicht
Dicke
Display
1.
85.3%
Dell XPS 13 9350
Dell XPS 13 9350
Intel Core Ultra 7 256V ⎘
Intel Arc Graphics 140V ⎘
16 GB RAM, 512 GB SSD
1.2 kg15.3 mm13.40"
1920x1200
169 PPI
IPS
2.
87.3% v7 (old)
Dell XPS 13 Plus 9320 i7-1280P OLED
Intel Core i7-1280P ⎘
Intel Iris Xe Graphics G7 96EUs ⎘
16 GB RAM, 512 GB SSD
1.3 kg15.28 mm13.40"
3456x2160
304 PPI
OLED
3.
90.1% v7 (old)
Lenovo ThinkBook 13x G4 21KR0008GE
Intel Core Ultra 5 125H ⎘
Intel Arc 7-Core iGPU ⎘
16 GB RAM, 512 GB SSD
1.2 kg12.9 mm13.50"
2880x1920
256 PPI
IPS
4.
91.9% v7 (old)
HP Dragonfly G4
HP Dragonfly G4
Intel Core i7-1365U ⎘
Intel Iris Xe Graphics G7 96EUs ⎘
16 GB RAM, 512 GB SSD
1.1 kg16.3 mm13.50"
1920x1280
171 PPI
IPS
5.
85.4% v7 (old)
Asus ZenBook S13 OLED UX5304
Intel Core i7-1355U ⎘
Intel Iris Xe Graphics G7 96EUs ⎘
16 GB RAM, 1024 GB SSD
1 kg11.8 mm13.30"
2880x1800
255 PPI
OLED
6.
86.6% v7 (old)
MSI Prestige 13 AI Evo
Intel Core Ultra 7 155H ⎘
Intel Arc 8-Core iGPU ⎘
32 GB RAM, 1024 GB SSD
967 g16.9 mm13.30"
2880x1800
OLED

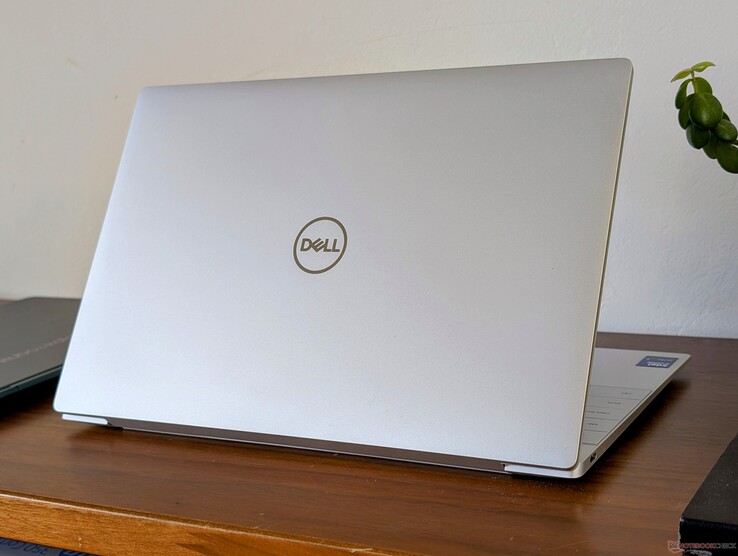
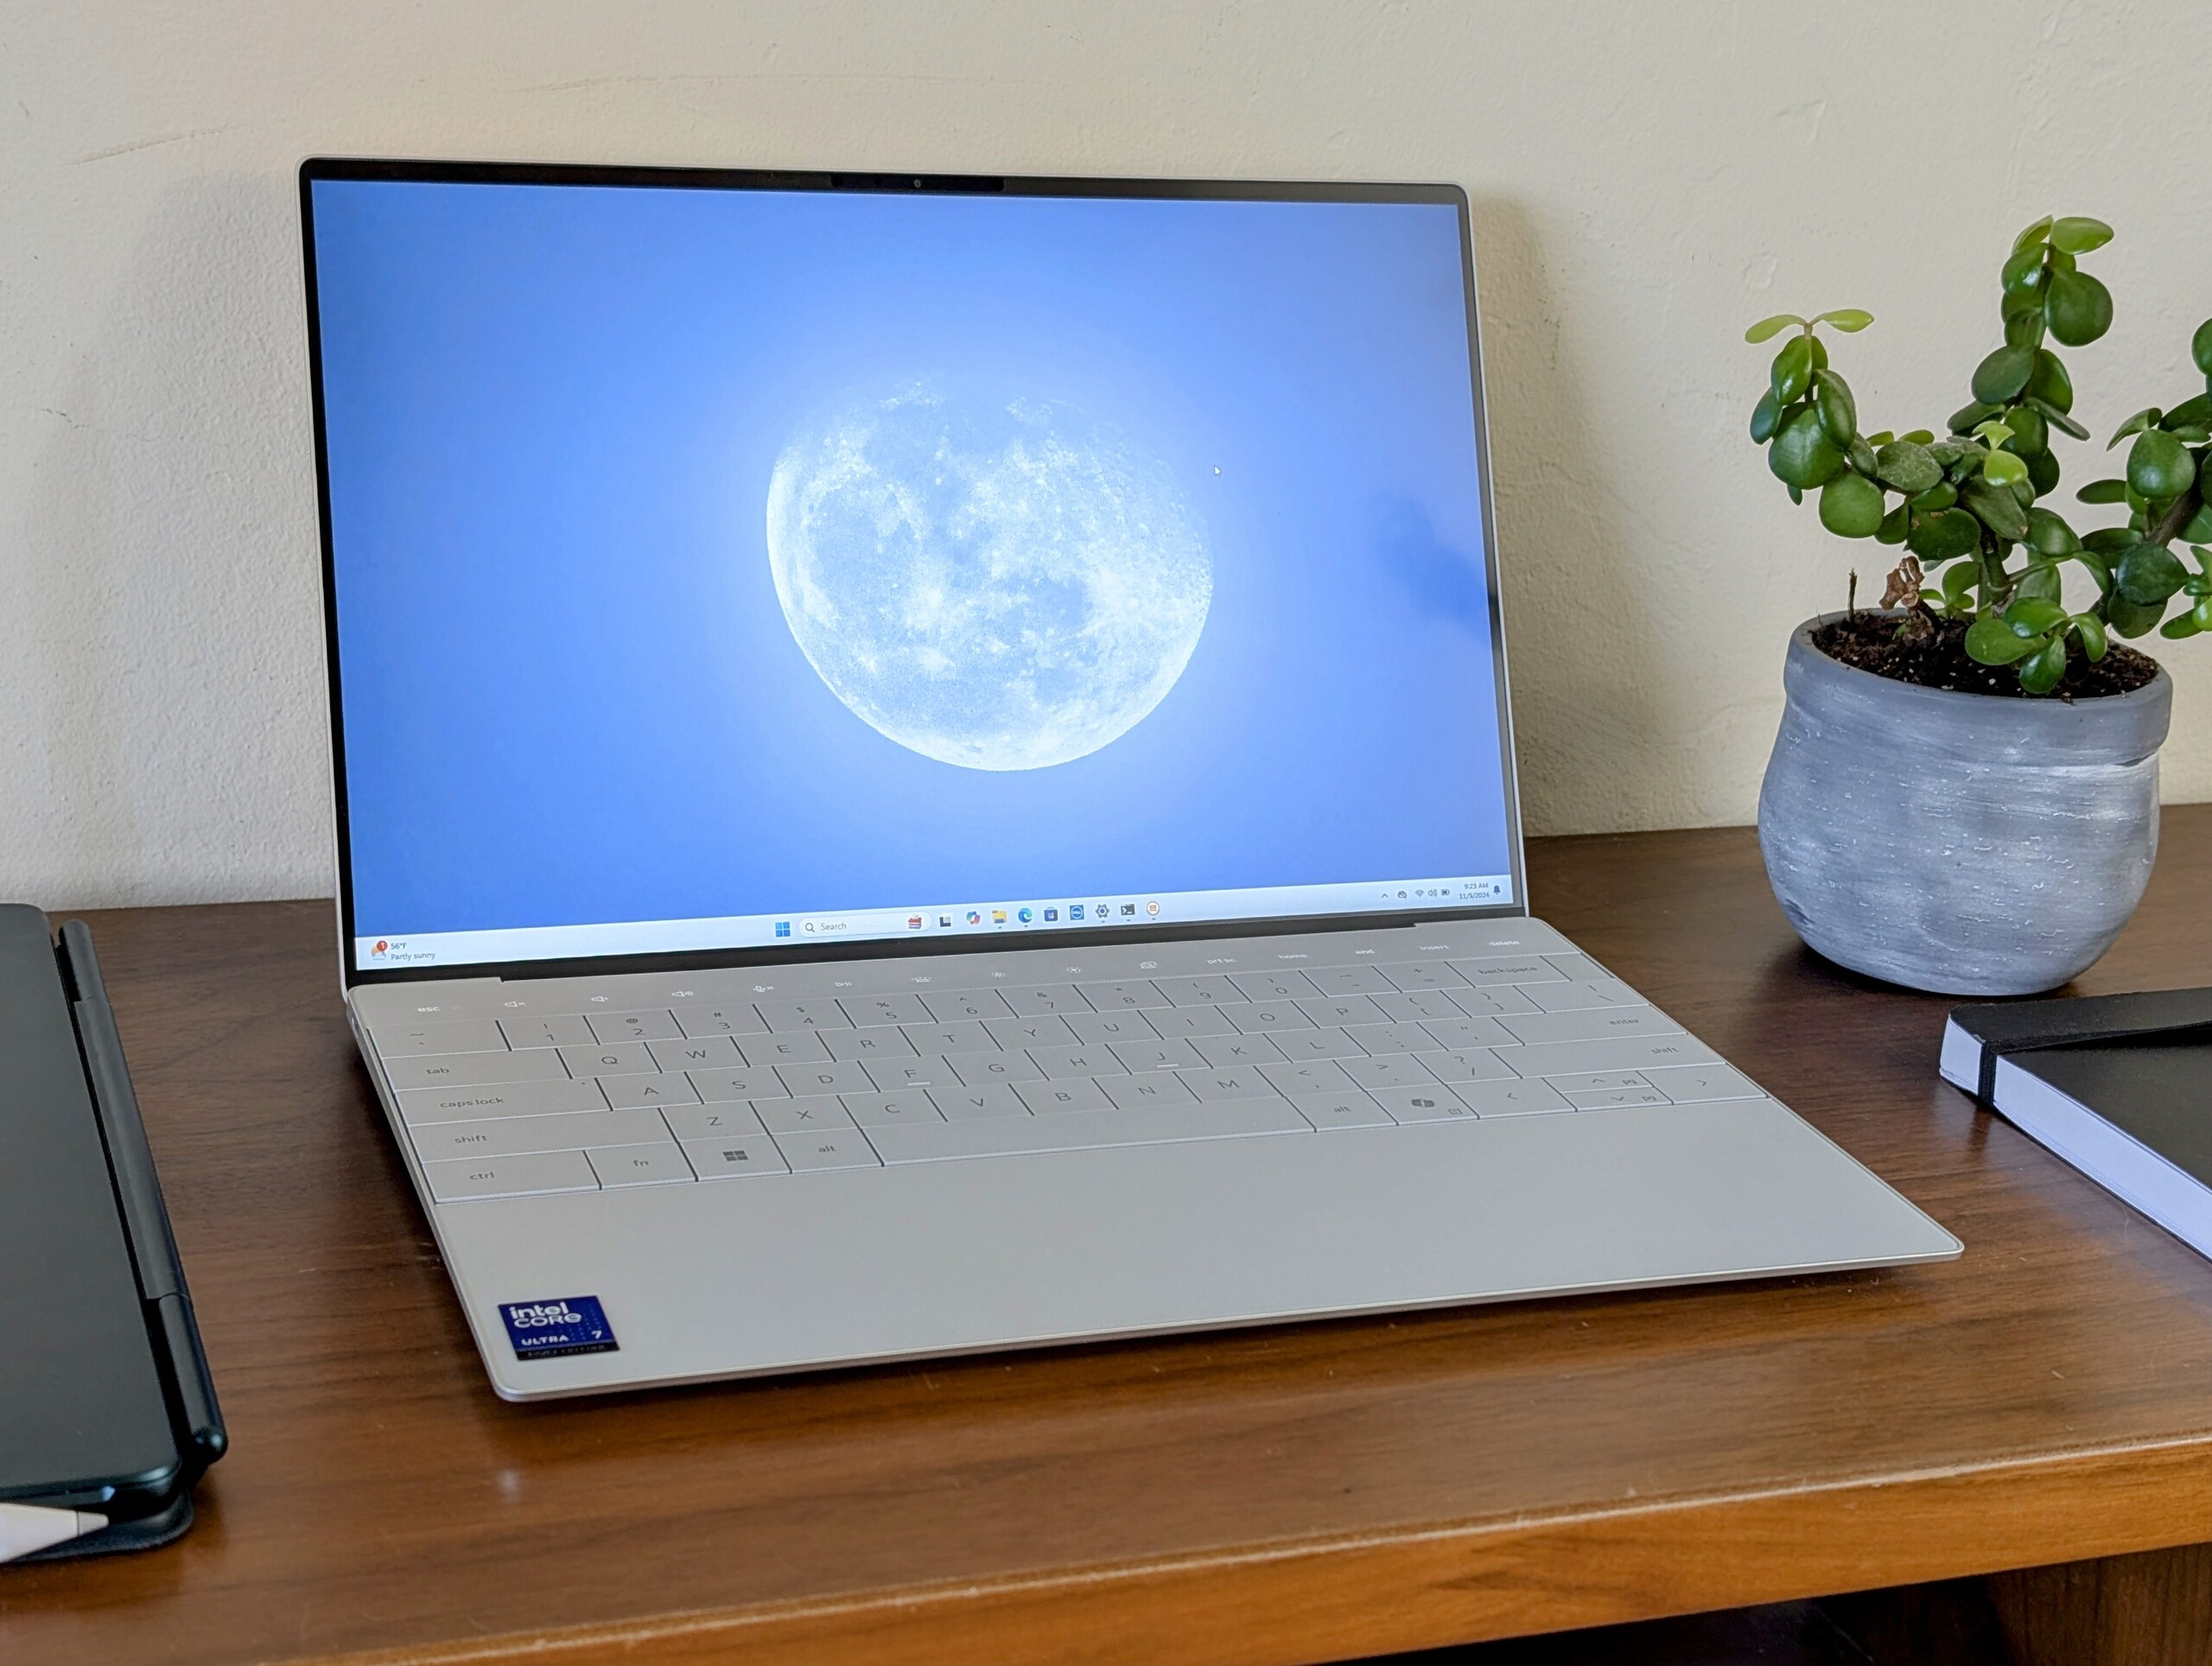
Dell hat sein XPS 13-Lineup in dieser Saison mit der Intel-Lunar-Lake-Prozessorreihe aufgefrischt. Das XPS 13 9350 tritt die Nachfolge des XPS 13 9340 mit dessen Meteor-Lake-H-Optionen an. Die physischen Eigenschaften des Systems sind ansonsten identisch mit dem 9340, weshalb wir empfehlen, einen Blick auf unsere Tests des XPS 13 9340 und 9320 zu werfen, um mehr über das Gehäuse und das äußere Design des Modells zu erfahren.

Unser Testgerät ist mit dem Core Ultra 7 256V, 16 GB schnellem LPDDR5x-8533 RAM, einer 512 GB NVMe-SSD und einem 1200p-IPS-Display ausgestattet und kostet etwa 1.699 Euro. Es stehen derzeit keine zusätzlichen Konfigurationen zur Verfügung, aber es sind SKUs mit 1800p-Touchscreen geplant.

Alternativen zum XPS 13 sind andere High-End-Subnotebooks wie das MSI Prestige 13 AI Evo, das Asus ZenBook S13 OLEDHP Dragonfly G4, oder die MacBook-Air-13-Serie von Apple.

Weitere Dell Bewertungen:

Spezifikationen

Dell XPS 13 9350 (XPS 13 Serie)
Prozessor
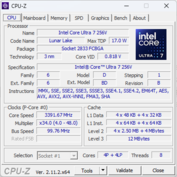
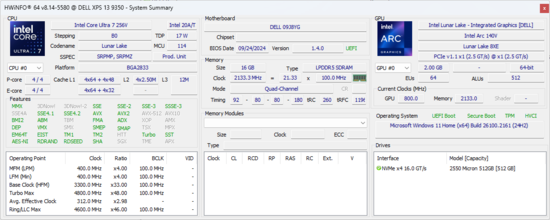
Intel Core Ultra 7 256V 8 x 2.2 - 4.8 GHz, 39 W PL2 / Short Burst, 32 W PL1 / Sustained, Lunar Lake
Grafikkarte
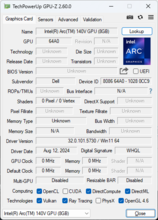
Intel Arc Graphics 140V, Kerntakt: 1850 MHz, LPDDR5x, 32.0.101.5730
RAM
16 GB 
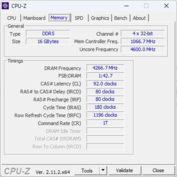
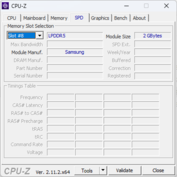
, Dual-Channel, LPDDR5x, 8533 MT/s, Soldered
Bildschirm
13.40 Zoll 16:10, 1920 x 1200 Pixel 169 PPI, LG Philips 134WU2, IPS, ID: LGD078B, Dell P/N: PF71N, spiegelnd: nein, 120 Hz
Massenspeicher
Micron 2550 512GB, 512 GB 
Soundkarte
Intel Lunar Lake SOC - cAVS (Audio, Voice, Speech)
Anschlüsse
2 USB 4.0 40 Gbps, 2 Thunderbolt, USB-C Power Delivery (PD), 2 DisplayPort, 1 Fingerprint Reader, Helligkeitssensor
Netzwerk
Intel BE201 320MHz (a/b/g/h/n = Wi-Fi 4/ac = Wi-Fi 5/ax = Wi-Fi 6/ Wi-Fi 6E 6 GHz be = Wi-Fi 7), Bluetooth 5.4
Abmessungen
Höhe x Breite x Tiefe (in mm): 15.3 x 295.3 x 199.1
Akku
55 Wh Lithium-Polymer
Betriebssystem
Microsoft Windows 11 Home
Kamera
Webcam: 1080p + IR
Primary Camera: 2 MPix
Sonstiges
Lautsprecher: quad speakers, Tastatur-Beleuchtung: ja, MyDell, 12 Monate Garantie
Gewicht
1.21 kg, Netzteil: 291 g
Preis
1400 USD
Hinweis: Der Hersteller kann abweichende Bauteile wie Bildschirme, Laufwerke und Speicherriegel mit ähnlichen Spezifikationen unter dem gleichen Modellnamen einsetzen.


Gehäuse — Eine attraktive Mischung

Das Gehäuse des XPS 13 9350 bleibt seit der Einführung des XPS 13 9320 im Jahr 2022 unverändert. Das Design wurde von Anfang an kritisch betrachtet, da es häufig als Beispiel dafür genannt wurde, wie ästhetische Überlegungen in manchen Fällen über funktionale Aspekte gestellt werden. Insbesondere die Touch Bar und das kantenlose Clickpad, die zwar elegant und modern wirken, bieten nicht das gleiche haptische Feedback wie die meisten anderen Laptops.

Trotz dieser Designentscheidungen kann das XPS 13 weiterhin mit neueren Konkurrenten mithalten. Geräte wie das HP Dragonfly G4 und das Lenovo ThinkBook 13x G4 sind zwar ebenfalls mit 13-Zoll-Bildschirmen ausgestattet, fallen jedoch durch ihre größeren Gehäuse und dickeren Ränder auf.

2x USB-C mit Thunderbolt 4

Größenvergleich

299 mm 210 mm 16.9 mm 967 g297 mm 220 mm 16.3 mm 1.1 kg295.3 mm 199.1 mm 15.3 mm 1.2 kg295.3 mm 199.04 mm 15.28 mm 1.3 kg296.2 mm 216.3 mm 11.8 mm 1 kg292.9 mm 205 mm 12.9 mm 1.2 kg297 mm 210 mm 1 mm 5.7 g

Kommunikation

Das Intel BE201 unterstützt standardmäßig Wi-Fi 7 und Bluetooth 5.4. Dennoch ist es wahrscheinlich, dass die meisten Nutzer weiterhin Wi-Fi 6 oder 6E für die Internetverbindung verwenden, da Wi-Fi 7 in den meisten Haushalten noch nicht weit verbreitet ist.

Networking
iperf3 transmit AXE11000
Lenovo ThinkBook 13x G4 21KR0008GE
Intel Wi-Fi 6E AX211
1666 (1537min, 1551.79P1 - 1751max) MBit/s +90%
MSI Prestige 13 AI Evo
Intel Killer Wi-Fi 7 BE1750W 320 MHz (BE200NGW)
1609 (1535min, 1544.86P1 - 1649max) MBit/s +84%
Asus ZenBook S13 OLED UX5304
Intel Wi-Fi 6E AX211
1555 (1319min - 1613max) MBit/s +78%
HP Dragonfly G4
Intel Wi-Fi 6E AX211
973 (879min - 1016max) MBit/s +11%
Dell XPS 13 9350
Intel BE201 320MHz
875 (599min - 1034max) MBit/s
iperf3 receive AXE11000
Lenovo ThinkBook 13x G4 21KR0008GE
Intel Wi-Fi 6E AX211
1709 (1689min, 1690.74P1 - 1723max) MBit/s +106%
MSI Prestige 13 AI Evo
Intel Killer Wi-Fi 7 BE1750W 320 MHz (BE200NGW)
1644 (1579min, 1581.03P1 - 1671max) MBit/s +99%
Asus ZenBook S13 OLED UX5304
Intel Wi-Fi 6E AX211
1439 (1353min - 1469max) MBit/s +74%
HP Dragonfly G4
Intel Wi-Fi 6E AX211
1200 (1059min - 1247max) MBit/s +45%
Dell XPS 13 9350
Intel BE201 320MHz
828 (763min - 865max) MBit/s
iperf3 transmit AXE11000 6GHz
HP Dragonfly G4
Intel Wi-Fi 6E AX211
1243 (776min - 1326max) MBit/s +10%
Dell XPS 13 9350
Intel BE201 320MHz
1127 (1037min - 1292max) MBit/s
iperf3 receive AXE11000 6GHz
Dell XPS 13 9350
Intel BE201 320MHz
1620 (1578min - 1652max) MBit/s
HP Dragonfly G4
Intel Wi-Fi 6E AX211
1234 (1042min - 1336max) MBit/s -24%
05010015020025030035040045050055060065070075080085090095010001050110011501200125013001350140014501500155016001650Tooltip
Dell XPS 13 9350; iperf3 transmit AXE11000 6GHz; iperf 3.1.3: Ø1127 (1037-1292)
Dell XPS 13 9350; iperf3 receive AXE11000 6GHz; iperf 3.1.3: Ø1620 (1578-1652)

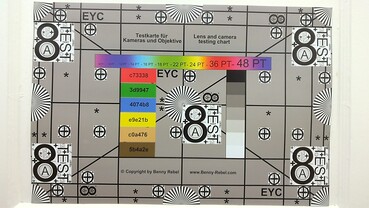
Webcam

Die 1080p-Webcam gehört zu den unteren Enden des Auflösungsspektrums, vor allem im Vergleich zu den 5 MP oder höheren Kameras, die viele Modelle von Lenovo und HP mittlerweile bieten. Ein weiterer Nachteil ist das Fehlen eines Schiebereglers, ein Feature, das bei vielen anderen Laptops inzwischen Standard ist, unabhängig von der Preisklasse. 
ColorChecker
9.6 ∆E
9.7 ∆E
11.7 ∆E
16.6 ∆E
12.4 ∆E
12.1 ∆E
11.4 ∆E
8.4 ∆E
11.9 ∆E
8.9 ∆E
10.4 ∆E
7.1 ∆E
4.3 ∆E
12.5 ∆E
13 ∆E
5 ∆E
12.7 ∆E
11.3 ∆E
9.5 ∆E
8.4 ∆E
11.4 ∆E
10.3 ∆E
8 ∆E
0.7 ∆E
ColorChecker Dell XPS 13 9350: 9.89 ∆E min: 0.7 - max: 16.58 ∆E

Wartung

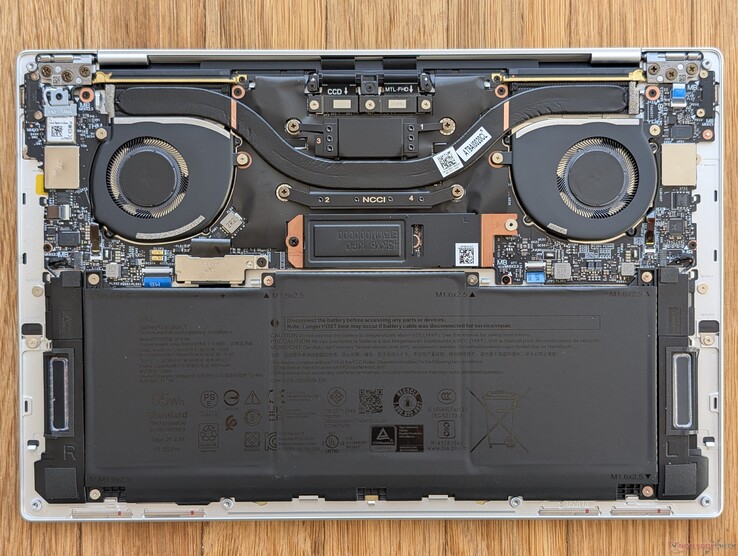
Im Vergleich zum XPS 13 9340 der vorherigen Generation oder dem Snapdragon-betriebenen XPS 13 9345 gibt es keine größeren internen Änderungen. WLAN und RAM sind weiterhin fest verlötet, und nur die einzelne M.2 2280 SSD ist aufrüstbar.

Dell XPS 13 9350 Innereien

Nachhaltigkeit

Das Modell wird unter Verwendung erneuerbarer Energiequellen aus Wasserkraft hergestellt, um den CO2-Fußabdruck zu reduzieren. Dell behauptet zudem, dass das System zu 100 Prozent recycelbar ist.

Die Verpackung besteht zu 100 Prozent aus recyceltem Papier und Karton und ist frei von Plastik.

Zubehör und Garantie

Die Verkaufsverpackung enthält nur den Papierkram und das Netzteil, jedoch keinen USB-C-auf-3,5-mm-Audio-Buchse-Adapter. Älteren XPS-Modellen lag dieser Adapter noch bei, aber Dell könnte ihn möglicherweise ganz abschaffen.

Die Garantie erstreckt sich in Deutschland über 24 Monate.

Display — Für ein IPS-Panel durchaus stabil

Die einzige Display-Option, die zum Zeitpunkt der Erstellung dieses Artikels verfügbar ist, ist die 120 Hz 1200p-Konfiguration. Diese war zwar auch bei den Vorgängermodellen verfügbar, jedoch hat Dell den Panel-Anbieter von Sharp zu LG Philips gewechselt. Das Kontrastverhältnis wurde verbessert, sodass die Farben besser zur Geltung kommen, während alle anderen Spezifikationen nahezu unverändert bleiben, einschließlich der vollen sRGB-Abdeckung, der Bildwiederholfrequenz und der durchschnittlichen Schwarz-Weiß-Reaktionszeit.

Was wir bei zukünftigen Modellen gerne sehen würden, ist die Unterstützung der variablen Bildwiederholrate (VRR) von Windows. Derzeit können Benutzer nur zwischen einer festen Bildwiederholfrequenz von 60 Hz oder 120 Hz wählen, während einige Displays, wie beim Framework Laptop 16, dynamisch auf weniger als 60 Hz umschalten können. Dies würde dem XPS 13 helfen, im Akkubetrieb noch mehr Strom zu sparen.

Mattes Panel ohne Touchscreen-Unterstützung
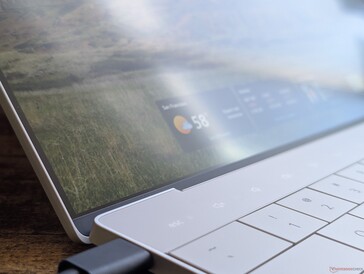
Es gehört zu den Subnotebooks mit den schmalsten Rändern
Die Anzeige ist für ein mattes Panel sehr scharf; das Pixelraster befindet sich nahe an der Oberfläche des Bildschirms, um die Körnigkeit zu reduzieren
Leichte ungleichmäßige Hintergrundbeleuchtung entlang der Oberkante
428
cd/m²
440.5
cd/m²
446.5
cd/m²
422.9
cd/m²
462.8
cd/m²
458.4
cd/m²
402.5
cd/m²
418
cd/m²
436.3
cd/m²
Ausleuchtung des Bildschirms
LG Philips 134WU2 getestet mit X-Rite i1Pro 2
Maximal: 462.8 cd/m² (Nits) Durchschnitt: 435.1 cd/m² Minimum: 22.3 cd/m²
Ausleuchtung: 87 %
Helligkeit Akku: 462.8 cd/m²
Kontrast: 2436:1 (Schwarzwert: 0.19 cd/m²)
ΔE Color 1.92 | 0.5-29.43 Ø4.92, calibrated: 0.48
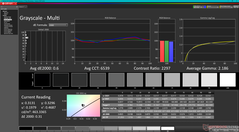
ΔE Greyscale 0.6 | 0.5-98 Ø5.2
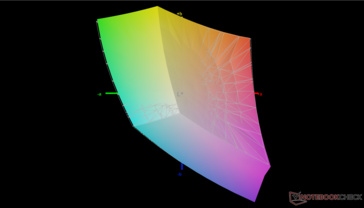
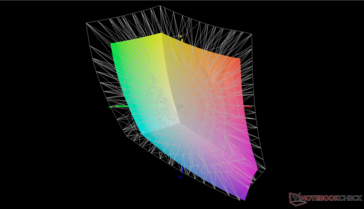
68.6% AdobeRGB 1998 (Argyll 2.2.0 3D)
99% sRGB (Argyll 2.2.0 3D)
67.3% Display P3 (Argyll 2.2.0 3D)
Gamma: 2.19
Dell XPS 13 9350
LG Philips 134WU2, IPS, 1920x1200, 13.4", 120 Hz
Dell XPS 13 Plus 9320 i7-1280P OLED
Samsung 134XK04, OLED, 3456x2160, 13.4", 60 Hz
Lenovo ThinkBook 13x G4 21KR0008GE
LEN135WQ+, IPS, 2880x1920, 13.5", 120 Hz
HP Dragonfly G4
Chi Mei CMN13C0, IPS, 1920x1280, 13.5", 60 Hz
Asus ZenBook S13 OLED UX5304
SDC417B, OLED, 2880x1800, 13.3", 60 Hz
MSI Prestige 13 AI Evo
ATNA33AA07-0, OLED, 2880x1800, 13.3", 60 Hz
Display
31%
-2%
1%
30%
31%
Display P3 Coverage
67.3
99.5
48%
65.5
-3%
68.4
2%
99.7
48%
99.9
48%
sRGB Coverage
99
100
1%
97.3
-2%
98.3
-1%
100
1%
100
1%
AdobeRGB 1998 Coverage
68.6
98.4
43%
67.7
-1%
70.4
3%
96.9
41%
97.8
43%
Response Times
93%
39%
-26%
95%
95%
Response Time Grey 50% / Grey 80% *
37.3 ?(17, 20.3)
2.6 ?(1.3, 1.3)
93%
27.3 ?(12.8, 14.5)
27%
48.8 ?(22.9, 25.9)
-31%
2 ?(1.1, 0.9)
95%
1.54 ?(0.79, 0.75)
96%
Response Time Black / White *
25.9 ?(12.5, 13.4)
2.1 ?(0.8, 1.3)
92%
12.8 ?(4.4, 8.4)
51%
31.3 ?(16.3, 15)
-21%
1.6 ?(0.8, 0.8)
94%
1.44 ?(0.73, 0.71)
94%
PWM Frequency
59.5
240 ?(57, 88)
240 ?(42)
Bildschirm
-59%
-44%
-51%
-7%
-23%
Helligkeit Bildmitte
462.8
371.8
-20%
539
16%
408.8
-12%
361
-22%
404
-13%
Brightness
435
374
-14%
513
18%
399
-8%
365
-16%
407
-6%
Brightness Distribution
87
98
13%
89
2%
90
3%
98
13%
98
13%
Schwarzwert *
0.19
0.38
-100%
0.32
-68%
Kontrast
2436
1418
-42%
1278
-48%
Delta E Colorchecker *
1.92
2.37
-23%
1.4
27%
2.02
-5%
1.2
37%
2.1
-9%
Colorchecker dE 2000 max. *
3.45
6.1
-77%
3.5
-1%
3.84
-11%
1.9
45%
4.3
-25%
Colorchecker dE 2000 calibrated *
0.48
0.7
-46%
0.61
-27%
Delta E Graustufen *
0.6
2
-233%
2.2
-267%
2.3
-283%
1.2
-100%
1.2
-100%
Gamma
2.19 100%
2.29 96%
2.19 100%
2.2 100%
2.27 97%
2.16 102%
CCT
6539 99%
6261 104%
6710 97%
6203 105%
6486 100%
6465 101%
Durchschnitt gesamt (Programm / Settings)
22% / -7%
-2% / -23%
-25% / -36%
39% / 21%
34% / 13%

* ... kleinere Werte sind besser

vs. sRGB
vs. sRGB
vs. P3
vs. P3

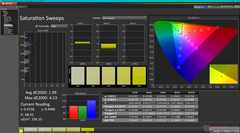
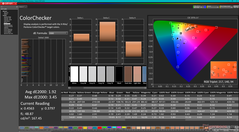
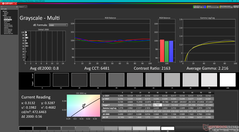
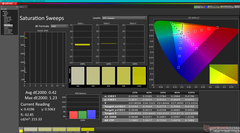
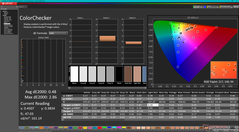
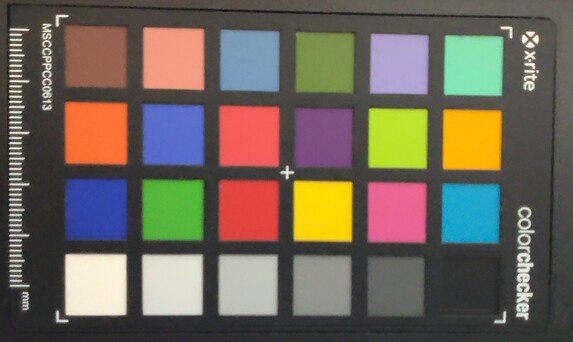
Das Display wird vorkalibriert geliefert und weist durchschnittliche Graustufen- und Farb-DeltaE-Werte von nur 0,6 bzw. 1,92 auf. Wenn wir pingelig sein wollen, könnten die Farben bei höheren Sättigungsstufen genauer sein, da DeltaE für bestimmte Farben 3 oder 4 erreichen kann, wie unsere Screenshots unten zeigen. Eine Kalibrierung des Panels mit einem X-Rite-Kolorimeter würde dieses kleine Manko verbessern, aber eine Endbenutzerkalibrierung sollte in diesem Fall für die Mehrheit der Benutzer nicht notwendig sein.

Graustufen vor der Kalibrierung
Sättigungsverläufe vor der Kalibrierung
ColorChecker vor der Kalibrierung
Graustufen nach der Kalibrierung
Sättigungsverläufe nach der Kalibrierung
ColorChecker nach der Kalibrierung

Reaktionszeiten (Response Times) des Displays

Die Reaktionszeiten (Response Times) beschreiben wie schnell zwischen zwei Farben eines Pixels umgeschaltet werden kann. Langsame Response Times können zu einer verschwommenen Darstellung, Schlieren und Geisterbilder führen. Besonders bei schnellen 3D-Spielen sind kurze Umschaltzeiten wichtig.
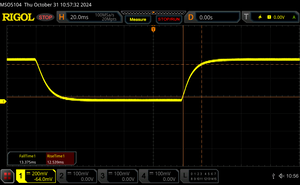
       Reaktionszeiten Schwarz zu Weiß
25.9 ms ... steigend ↗ und fallend ↘ kombiniert↗ 12.5 ms steigend
↘ 13.4 ms fallend
Die gemessenen Reaktionszeiten sind mittelmäßig und dadurch für Spieler eventuell zu langsam.
Im Vergleich rangierten die bei uns getesteten Geräte von 0.1 (Minimum) zu 240 (Maximum) ms. » 59 % aller Screens waren schneller als der getestete.
Daher sind die gemessenen Reaktionszeiten schlechter als der Durchschnitt aller vermessenen Geräte (21 ms).
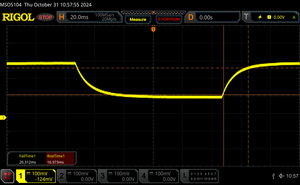
       Reaktionszeiten 50% Grau zu 80% Grau
37.3 ms ... steigend ↗ und fallend ↘ kombiniert↗ 17 ms steigend
↘ 20.3 ms fallend
Die gemessenen Reaktionszeiten sind langsam und dadurch für viele Spieler wahrscheinlich zu langsam.
Im Vergleich rangierten die bei uns getesteten Geräte von 0.165 (Minimum) zu 636 (Maximum) ms. » 50 % aller Screens waren schneller als der getestete.
Daher sind die gemessenen Reaktionszeiten schlechter als der Durchschnitt aller vermessenen Geräte (32.9 ms).

Bildschirm-Flackern / PWM (Pulse-Width Modulation)

Eine günstige Methode um die Helligkeit eines Bildschirms zu steuern, ist die Beleuchtung periodisch ein- und auszuschalten. Dies nennt sich PWM (Pulsweitenmodulation) Diese Umschaltung sollte mit einer hohen Frequenz stattfinden damit das menschliche Auge kein Flimmern wahrnimmt. Wenn die Frequenz zu niedrig ist, kann dies zu Ermüdungserscheinungen, Augenbrennen, Kopfweh und auch sichtbaren Flackern führen.
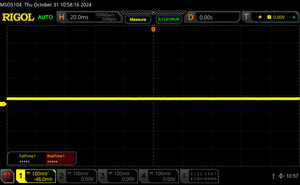
Flackern / PWM nicht festgestellt

Im Vergleich: 53 % aller getesteten Geräte nutzten kein PWM um die Helligkeit zu reduzieren. Wenn PWM eingesetzt wurde, dann bei einer Frequenz von durchschnittlich 8752 (Minimum 5, Maximum 343500) Hz.

Die Sichtbarkeit im Freien ist nicht schlecht, aber immer noch etwas schlechter als beim MacBook Air 13, das knapp über 500 Nits erreicht, verglichen mit etwa 435 Nits bei unserem Dell. Die Blendung auf unserem matten Panel ist viel weniger störend als bei der OLED-Konfiguration, aber die Farben wirken immer noch verwaschen, wenn man unter hellen Bedingungen arbeitet.

Draußen bei Sonnenlicht
Draußen bei Sonnenlicht im Schatten
Draußen bei Sonnenlicht
Weiter IPS-Betrachtungswinkel

Performance — Stabiler und zuverlässiger


Testbedingungen

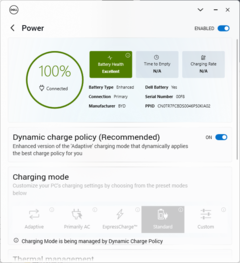
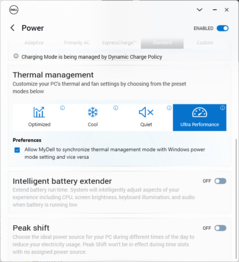
Wir haben das MyDell auf den Ultra-Performance-Modus eingestellt, bevor wir die folgenden Benchmarks durchgeführt haben. Im Gegensatz zu den meisten anderen Notebooks können die Energieeinstellungen des MyDell bequem mit den Windows-Energieeinstellungen synchronisiert werden. Dadurch werden unangenehme Szenarien vermieden, bei denen Windows auf Energiesparen eingestellt ist, während die Energieeinstellungen des Herstellers auf Performance-Modus gesetzt sind.

MyDell-Startbildschirm
Menü Energie-Einstellungen zeigt das Ladeverhalten an
Dell Energieprofil-Einstellungen

Prozessor

Im Vergleich zum XPS 13 9340 und seinem Core Ultra 7 155H ist die Leistung des Prozessors besonders interessant. Unser Core Ultra 7 256V ist bei den meisten Multi-Thread-Benchmarks erwartungsgemäß um 20 bis 30 Prozent langsamer, da sowohl das Turbo-Boost-Potenzial als auch die Kernanzahl geringer sind als beim Core Ultra 7 155H. Allerdings würde unser Core Ultra 7 256V auch deutlich weniger drosseln als der Core Ultra 7 155H im XPS 9340. Sobald die Drosselung berücksichtigt wird, ist die Multi-Thread-Leistung zwischen dem XPS 13 9340 und 9350 fast gleich, wie unsere CineBench R15 xT-Schleifentest-Ergebnisse unten zeigen.

Es ist erwähnenswert, dass es mindestens ein Dutzend Durchläufe von CineBench R15 xT braucht, bevor der Core Ultra 7 155H gedrosselt wird und die Leistung eher der unseres Core Ultra 7 256V entspricht. Der Leistungsvorteil des Meteor Lake-H ist daher kurz- bis mittelfristig immer noch signifikant.

Cinebench R15 Multi Dauertest

011523034546057569080592010351150126513801495161017251840195520702185Tooltip
Dell XPS 13 9350 Intel Core Ultra 7 256V: Ø1415 (1369.16-1569.86)
Dell XPS 13 Plus 9320 i7-1280P OLED Intel Core i7-1280P: Ø1467 (1369.16-1905.49)
Lenovo ThinkBook 13x G4 21KR0008GE Intel Core Ultra 5 125H: Ø1373 (1247-1702.49)
HP Dragonfly G4 Intel Core i7-1365U: Ø1060 (1014.74-1347.89)
Asus ZenBook S13 OLED UX5304 Intel Core i7-1355U: Ø1024 (989.63-1358.19)
MSI Prestige 13 AI Evo Intel Core Ultra 7 155H: Ø1302 (1245.56-2032.83)
Dell XPS 13 9340 Core Ultra 7 Intel Core Ultra 7 155H: Ø1635 (1358.56-2230.28)
CPU Performance Rating: Percent
Cinebench R23: Multi Core | Single Core
Cinebench R20: CPU (Multi Core) | CPU (Single Core)
Cinebench R15: CPU Multi 64Bit | CPU Single 64Bit
Blender: v2.79 BMW27 CPU
7-Zip 18.03: 7z b 4 | 7z b 4 -mmt1
Geekbench 6.3: Multi-Core | Single-Core
Geekbench 5.5: Multi-Core | Single-Core
HWBOT x265 Benchmark v2.2: 4k Preset
LibreOffice : 20 Documents To PDF
R Benchmark 2.5: Overall mean
CPU Performance Rating
Framework Laptop 13.5 Ryzen 7 7840U
AMD Ryzen 7 7840U
82.1 pt
HP EliteBook x360 1040 G11
Intel Core Ultra 7 165H
81.3 pt
Dell XPS 13 9340 Core Ultra 7
Intel Core Ultra 7 155H
79 pt
Dell XPS 13 Plus 9320 Core i7-1360P -2!
Intel Core i7-1360P
73.4 pt
Dell XPS 13 9350
Intel Core Ultra 7 256V
72.3 pt
Durchschnittliche Intel Core Ultra 7 256V
 
72.3 pt
Dell XPS 13 Plus 9320 i7-1280P OLED -2!
Intel Core i7-1280P
70.6 pt
MSI Prestige 13 AI Evo
Intel Core Ultra 7 155H
69.6 pt
Asus Zenbook S 14 UX5406
Intel Core Ultra 7 258V
66.3 pt
Dell XPS 13 Plus 9320 4K -2!
Intel Core i7-1260P
66.3 pt
Lenovo ThinkBook 13x G4 21KR0008GE -1!
Intel Core Ultra 5 125H
66.1 pt
Asus Zenbook S 13 OLED -2!
AMD Ryzen 7 6800U
62.9 pt
HP Dragonfly G4 -2!
Intel Core i7-1365U
61.8 pt
Asus ZenBook S13 OLED UX5304 -2!
Intel Core i7-1355U
58.1 pt
Dell XPS 13 Plus 9320 i5-1240p -2!
Intel Core i5-1240P
56.6 pt
Lenovo ThinkBook 13s G3 20YA0005GE -2!
AMD Ryzen 7 5800U
56.2 pt
Lenovo Yoga 6 13 83B2001SGE -2!
AMD Ryzen 7 7730U
55.2 pt
Dell XPS 13 9315 2-in-1 Core i5-1230U -2!
Intel Core i5-1230U
51.8 pt
Dell XPS 13 9315, i5-1230U -6!
Intel Core i5-1230U
51 pt
Cinebench R23 / Multi Core
HP EliteBook x360 1040 G11
Intel Core Ultra 7 165H
14551 (13047.9min - 14551max) Points +40%
Framework Laptop 13.5 Ryzen 7 7840U
AMD Ryzen 7 7840U
13981 (12822.5min - 13981.2max) Points +35%
Dell XPS 13 9340 Core Ultra 7
Intel Core Ultra 7 155H
13511 Points +30%
Dell XPS 13 Plus 9320 i7-1280P OLED
Intel Core i7-1280P
11852 (9209.64min - 11852max) Points +14%
Dell XPS 13 Plus 9320 Core i7-1360P
Intel Core i7-1360P
11503 (9427.43min - 11502.9max) Points +11%
Durchschnittliche Intel Core Ultra 7 256V
  (10391 - 10768, n=2)
10580 Points +2%
Asus Zenbook S 13 OLED
AMD Ryzen 7 6800U
10468 Points +1%
Dell XPS 13 9350
Intel Core Ultra 7 256V
10391 (9371.44min - 10390.8max) Points
MSI Prestige 13 AI Evo
Intel Core Ultra 7 155H
9769 Points -6%
Dell XPS 13 Plus 9320 4K
Intel Core i7-1260P
9743 Points -6%
Dell XPS 13 Plus 9320 i5-1240p
Intel Core i5-1240P
9392 Points -10%
Lenovo ThinkBook 13x G4 21KR0008GE
Intel Core Ultra 5 125H
9194 Points -12%
Asus Zenbook S 14 UX5406
Intel Core Ultra 7 258V
9114 Points -12%
Lenovo ThinkBook 13s G3 20YA0005GE
AMD Ryzen 7 5800U
8068 Points -22%
HP Dragonfly G4
Intel Core i7-1365U
7532 (5307.67min - 7531.78max) Points -28%
Lenovo Yoga 6 13 83B2001SGE
AMD Ryzen 7 7730U
7286 Points -30%
Dell XPS 13 9315 2-in-1 Core i5-1230U
Intel Core i5-1230U
7264 (4444.94min - 7264.12max) Points -30%
Asus ZenBook S13 OLED UX5304
Intel Core i7-1355U
7015 Points -32%
Dell XPS 13 9315, i5-1230U
Intel Core i5-1230U
4402 Points -58%
Cinebench R23 / Single Core
HP Dragonfly G4
Intel Core i7-1365U
1891 Points +1%
Durchschnittliche Intel Core Ultra 7 256V
  (1875 - 1902, n=2)
1889 Points +1%
Dell XPS 13 9350
Intel Core Ultra 7 256V
1875 Points
Asus Zenbook S 14 UX5406
Intel Core Ultra 7 258V
1865 Points -1%
Dell XPS 13 Plus 9320 Core i7-1360P
Intel Core i7-1360P
1848 Points -1%
HP EliteBook x360 1040 G11
Intel Core Ultra 7 165H
1759 Points -6%
Asus ZenBook S13 OLED UX5304
Intel Core i7-1355U
1730 Points -8%
Dell XPS 13 9340 Core Ultra 7
Intel Core Ultra 7 155H
1685 Points -10%
Dell XPS 13 Plus 9320 4K
Intel Core i7-1260P
1678 Points -11%
MSI Prestige 13 AI Evo
Intel Core Ultra 7 155H
1671 Points -11%
Framework Laptop 13.5 Ryzen 7 7840U
AMD Ryzen 7 7840U
1647 Points -12%
Dell XPS 13 Plus 9320 i5-1240p
Intel Core i5-1240P
1621 Points -14%
Dell XPS 13 Plus 9320 i7-1280P OLED
Intel Core i7-1280P
1615 Points -14%
Lenovo ThinkBook 13x G4 21KR0008GE
Intel Core Ultra 5 125H
1549 Points -17%
Dell XPS 13 9315 2-in-1 Core i5-1230U
Intel Core i5-1230U
1512 Points -19%
Asus Zenbook S 13 OLED
AMD Ryzen 7 6800U
1488 Points -21%
Lenovo ThinkBook 13s G3 20YA0005GE
AMD Ryzen 7 5800U
1430 Points -24%
Lenovo Yoga 6 13 83B2001SGE
AMD Ryzen 7 7730U
1335 Points -29%
Dell XPS 13 9315, i5-1230U
Intel Core i5-1230U
1310 Points -30%
Cinebench R20 / CPU (Multi Core)
HP EliteBook x360 1040 G11
Intel Core Ultra 7 165H
5545 Points +37%
Framework Laptop 13.5 Ryzen 7 7840U
AMD Ryzen 7 7840U
5425 Points +34%
Dell XPS 13 9340 Core Ultra 7
Intel Core Ultra 7 155H
5181 Points +28%
Dell XPS 13 Plus 9320 i7-1280P OLED
Intel Core i7-1280P
4571 Points +13%
Dell XPS 13 Plus 9320 Core i7-1360P
Intel Core i7-1360P
4424 Points +10%
Durchschnittliche Intel Core Ultra 7 256V
  (4038 - 4162, n=2)
4100 Points +2%
Asus Zenbook S 13 OLED
AMD Ryzen 7 6800U
4060 Points +1%
Dell XPS 13 9350
Intel Core Ultra 7 256V
4038 Points
Dell XPS 13 Plus 9320 4K
Intel Core i7-1260P
3909 Points -3%
MSI Prestige 13 AI Evo
Intel Core Ultra 7 155H
3798 Points -6%
Lenovo ThinkBook 13x G4 21KR0008GE
Intel Core Ultra 5 125H
3673 Points -9%
Asus Zenbook S 14 UX5406
Intel Core Ultra 7 258V
3530 Points -13%
Dell XPS 13 Plus 9320 i5-1240p
Intel Core i5-1240P
3424 Points -15%
Lenovo ThinkBook 13s G3 20YA0005GE
AMD Ryzen 7 5800U
2995 Points -26%
HP Dragonfly G4
Intel Core i7-1365U
2902 Points -28%
Lenovo Yoga 6 13 83B2001SGE
AMD Ryzen 7 7730U
2849 Points -29%
Asus ZenBook S13 OLED UX5304
Intel Core i7-1355U
2849 Points -29%
Dell XPS 13 9315 2-in-1 Core i5-1230U
Intel Core i5-1230U
2802 Points -31%
Dell XPS 13 9315, i5-1230U
Intel Core i5-1230U
1653 Points -59%
Cinebench R20 / CPU (Single Core)
Durchschnittliche Intel Core Ultra 7 256V
  (720 - 727, n=2)
724 Points +1%
Dell XPS 13 9350
Intel Core Ultra 7 256V
720 Points
Dell XPS 13 Plus 9320 Core i7-1360P
Intel Core i7-1360P
707 Points -2%
HP Dragonfly G4
Intel Core i7-1365U
703 Points -2%
HP EliteBook x360 1040 G11
Intel Core Ultra 7 165H
683 Points -5%
Asus ZenBook S13 OLED UX5304
Intel Core i7-1355U
679 Points -6%
Dell XPS 13 9340 Core Ultra 7
Intel Core Ultra 7 155H
656 Points -9%
Lenovo ThinkBook 13x G4 21KR0008GE
Intel Core Ultra 5 125H
655 Points -9%
Framework Laptop 13.5 Ryzen 7 7840U
AMD Ryzen 7 7840U
651 Points -10%
Dell XPS 13 Plus 9320 4K
Intel Core i7-1260P
648 Points -10%
Asus Zenbook S 14 UX5406
Intel Core Ultra 7 258V
643 Points -11%
MSI Prestige 13 AI Evo
Intel Core Ultra 7 155H
632 Points -12%
Dell XPS 13 Plus 9320 i7-1280P OLED
Intel Core i7-1280P
622 Points -14%
Dell XPS 13 Plus 9320 i5-1240p
Intel Core i5-1240P
616 Points -14%
Dell XPS 13 9315 2-in-1 Core i5-1230U
Intel Core i5-1230U
580 Points -19%
Asus Zenbook S 13 OLED
AMD Ryzen 7 6800U
564 Points -22%
Lenovo ThinkBook 13s G3 20YA0005GE
AMD Ryzen 7 5800U
560 Points -22%
Lenovo Yoga 6 13 83B2001SGE
AMD Ryzen 7 7730U
533 Points -26%
Dell XPS 13 9315, i5-1230U
Intel Core i5-1230U
469 Points -35%
Cinebench R15 / CPU Multi 64Bit
HP EliteBook x360 1040 G11
Intel Core Ultra 7 165H
2467 (1713.06min - 2466.7max) Points +57%
Dell XPS 13 9340 Core Ultra 7
Intel Core Ultra 7 155H
2230 (1358.56min - 2230.28max) Points +42%
Framework Laptop 13.5 Ryzen 7 7840U
AMD Ryzen 7 7840U
2205 (2124.16min - 2204.83max) Points +40%
MSI Prestige 13 AI Evo
Intel Core Ultra 7 155H
2033 (1245.56min - 2032.83max) Points +29%
Dell XPS 13 Plus 9320 Core i7-1360P
Intel Core i7-1360P
1951 (1397.72min - 1950.55max) Points +24%
Lenovo ThinkBook 13s G3 20YA0005GE
AMD Ryzen 7 5800U
1925 Points +23%
Lenovo ThinkBook 13s G3 20YA0005GE
AMD Ryzen 7 5800U
1691 Points +8%
Dell XPS 13 Plus 9320 i7-1280P OLED
Intel Core i7-1280P
1905 (1369.16min - 1905.49max) Points +21%
Asus Zenbook S 13 OLED
AMD Ryzen 7 6800U
1742 Points +11%
Lenovo ThinkBook 13x G4 21KR0008GE
Intel Core Ultra 5 125H
1702 (1247min - 1702.49max) Points +8%
Dell XPS 13 Plus 9320 4K
Intel Core i7-1260P
1677 (1481.98min - 1677.36max) Points +7%
Dell XPS 13 Plus 9320 4K
Intel Core i7-1260P
1626 (983.94min - 1625.95max) Points +4%
Dell XPS 13 Plus 9320 i5-1240p
Intel Core i5-1240P
1592 Points +1%
Lenovo Yoga 6 13 83B2001SGE
AMD Ryzen 7 7730U
1588 (1265.06min - 1588.12max) Points +1%
Dell XPS 13 9350
Intel Core Ultra 7 256V
1570 (1369.16min - 1569.86max) Points
Durchschnittliche Intel Core Ultra 7 256V
  ()
1570 Points 0%
Asus Zenbook S 14 UX5406
Intel Core Ultra 7 258V
1550 (1108.49min - 1550.27max) Points -1%
Asus ZenBook S13 OLED UX5304
Intel Core i7-1355U
1358 (989.63min - 1358.19max) Points -14%
HP Dragonfly G4
Intel Core i7-1365U
1348 (1014.74min - 1347.89max) Points -14%
Dell XPS 13 9315 2-in-1 Core i5-1230U
Intel Core i5-1230U
1254 (632min - 1254.35max) Points -20%
Dell XPS 13 9315, i5-1230U
Intel Core i5-1230U
514 (482min - 513.59max) Points -67%
Cinebench R15 / CPU Single 64Bit
Dell XPS 13 9350
Intel Core Ultra 7 256V
285 Points
Durchschnittliche Intel Core Ultra 7 256V
  ()
285 Points 0%
Dell XPS 13 Plus 9320 Core i7-1360P
Intel Core i7-1360P
263 Points -8%
HP Dragonfly G4
Intel Core i7-1365U
261 Points -8%
Asus Zenbook S 14 UX5406
Intel Core Ultra 7 258V
258 Points -9%
HP EliteBook x360 1040 G11
Intel Core Ultra 7 165H
257 Points -10%
Dell XPS 13 9340 Core Ultra 7
Intel Core Ultra 7 155H
253 Points -11%
Framework Laptop 13.5 Ryzen 7 7840U
AMD Ryzen 7 7840U
249 Points -13%
Lenovo ThinkBook 13x G4 21KR0008GE
Intel Core Ultra 5 125H
247 Points -13%
Asus ZenBook S13 OLED UX5304
Intel Core i7-1355U
245 Points -14%
MSI Prestige 13 AI Evo
Intel Core Ultra 7 155H
242 Points -15%
Dell XPS 13 Plus 9320 4K
Intel Core i7-1260P
240 Points -16%
Asus Zenbook S 13 OLED
AMD Ryzen 7 6800U
237 Points -17%
Lenovo ThinkBook 13s G3 20YA0005GE
AMD Ryzen 7 5800U
229 Points -20%
Dell XPS 13 Plus 9320 i7-1280P OLED
Intel Core i7-1280P
229 Points -20%
Dell XPS 13 Plus 9320 i5-1240p
Intel Core i5-1240P
226 Points -21%
Dell XPS 13 9315 2-in-1 Core i5-1230U
Intel Core i5-1230U
221 Points -22%
Lenovo Yoga 6 13 83B2001SGE
AMD Ryzen 7 7730U
221 Points -22%
Dell XPS 13 9315, i5-1230U
Intel Core i5-1230U
186.8 Points -34%
Blender / v2.79 BMW27 CPU
Dell XPS 13 9315 2-in-1 Core i5-1230U
Intel Core i5-1230U
503 Seconds * -48%
Asus ZenBook S13 OLED UX5304
Intel Core i7-1355U
450 Seconds * -33%
Asus ZenBook S13 OLED UX5304
Intel Core i7-1355U
448 Seconds * -32%
HP Dragonfly G4
Intel Core i7-1365U
430 Seconds * -27%
Asus Zenbook S 14 UX5406
Intel Core Ultra 7 258V
414 Seconds * -22%
Lenovo ThinkBook 13s G3 20YA0005GE
AMD Ryzen 7 5800U
391 Seconds * -15%
Lenovo Yoga 6 13 83B2001SGE
AMD Ryzen 7 7730U
374 Seconds * -10%
Dell XPS 13 Plus 9320 i5-1240p
Intel Core i5-1240P
369 Seconds * -9%
Lenovo ThinkBook 13x G4 21KR0008GE
Intel Core Ultra 5 125H
357 Seconds * -5%
MSI Prestige 13 AI Evo
Intel Core Ultra 7 155H
349 Seconds * -3%
Dell XPS 13 9350
Intel Core Ultra 7 256V
339 Seconds *
Durchschnittliche Intel Core Ultra 7 256V
  (324 - 339, n=2)
332 Seconds * +2%
Dell XPS 13 Plus 9320 4K
Intel Core i7-1260P
319 Seconds * +6%
Asus Zenbook S 13 OLED
AMD Ryzen 7 6800U
310 Seconds * +9%
Dell XPS 13 Plus 9320 Core i7-1360P
Intel Core i7-1360P
279 Seconds * +18%
Dell XPS 13 Plus 9320 i7-1280P OLED
Intel Core i7-1280P
268 Seconds * +21%
Dell XPS 13 9340 Core Ultra 7
Intel Core Ultra 7 155H
243 Seconds * +28%
HP EliteBook x360 1040 G11
Intel Core Ultra 7 165H
231 Seconds * +32%
Framework Laptop 13.5 Ryzen 7 7840U
AMD Ryzen 7 7840U
230 Seconds * +32%
7-Zip 18.03 / 7z b 4
Framework Laptop 13.5 Ryzen 7 7840U
AMD Ryzen 7 7840U
61902 MIPS +72%
Dell XPS 13 9340 Core Ultra 7
Intel Core Ultra 7 155H
58233 MIPS +62%
HP EliteBook x360 1040 G11
Intel Core Ultra 7 165H
56997 MIPS +59%
Dell XPS 13 Plus 9320 i7-1280P OLED
Intel Core i7-1280P
49572 MIPS +38%
Dell XPS 13 Plus 9320 Core i7-1360P
Intel Core i7-1360P
47737 MIPS +33%
Asus Zenbook S 13 OLED
AMD Ryzen 7 6800U
47500 MIPS +32%
Dell XPS 13 Plus 9320 4K
Intel Core i7-1260P
43056 MIPS +20%
MSI Prestige 13 AI Evo
Intel Core Ultra 7 155H
42601 MIPS +19%
Dell XPS 13 Plus 9320 i5-1240p
Intel Core i5-1240P
40777 MIPS +13%
Lenovo Yoga 6 13 83B2001SGE
AMD Ryzen 7 7730U
40263 MIPS +12%
Lenovo ThinkBook 13s G3 20YA0005GE
AMD Ryzen 7 5800U
39618 MIPS +10%
Durchschnittliche Intel Core Ultra 7 256V
  (35950 - 35978, n=2)
35964 MIPS 0%
Dell XPS 13 9350
Intel Core Ultra 7 256V
35950 MIPS
Dell XPS 13 9315 2-in-1 Core i5-1230U
Intel Core i5-1230U
34505 MIPS -4%
HP Dragonfly G4
Intel Core i7-1365U
33476 MIPS -7%
Asus Zenbook S 14 UX5406
Intel Core Ultra 7 258V
32198 MIPS -10%
Asus ZenBook S13 OLED UX5304
Intel Core i7-1355U
31233 MIPS -13%
Dell XPS 13 9315, i5-1230U
Intel Core i5-1230U
20092 MIPS -44%
7-Zip 18.03 / 7z b 4 -mmt1
Framework Laptop 13.5 Ryzen 7 7840U
AMD Ryzen 7 7840U
6408 MIPS +12%
HP Dragonfly G4
Intel Core i7-1365U
5835 MIPS +2%
Dell XPS 13 9350
Intel Core Ultra 7 256V
5727 MIPS
Asus ZenBook S13 OLED UX5304
Intel Core i7-1355U
5689 MIPS -1%
Durchschnittliche Intel Core Ultra 7 256V
  (5616 - 5727, n=2)
5672 MIPS -1%
Asus Zenbook S 14 UX5406
Intel Core Ultra 7 258V
5551 MIPS -3%
Dell XPS 13 Plus 9320 Core i7-1360P
Intel Core i7-1360P
5526 MIPS -4%
MSI Prestige 13 AI Evo
Intel Core Ultra 7 155H
5458 MIPS -5%
Asus Zenbook S 13 OLED
AMD Ryzen 7 6800U
5431 MIPS -5%
Dell XPS 13 9340 Core Ultra 7
Intel Core Ultra 7 155H
5410 MIPS -6%
Dell XPS 13 Plus 9320 4K
Intel Core i7-1260P
5325 MIPS -7%
Lenovo ThinkBook 13s G3 20YA0005GE
AMD Ryzen 7 5800U
5285 MIPS -8%
HP EliteBook x360 1040 G11
Intel Core Ultra 7 165H
5273 MIPS -8%
Lenovo Yoga 6 13 83B2001SGE
AMD Ryzen 7 7730U
5222 MIPS -9%
Lenovo ThinkBook 13x G4 21KR0008GE
Intel Core Ultra 5 125H
5082 MIPS -11%
Dell XPS 13 Plus 9320 i7-1280P OLED
Intel Core i7-1280P
4995 MIPS -13%
Dell XPS 13 9315 2-in-1 Core i5-1230U
Intel Core i5-1230U
4870 MIPS -15%
Dell XPS 13 Plus 9320 i5-1240p
Intel Core i5-1240P
4791 MIPS -16%
Dell XPS 13 9315, i5-1230U
Intel Core i5-1230U
3873 MIPS -32%
Geekbench 6.3 / Multi-Core
HP EliteBook x360 1040 G11
Intel Core Ultra 7 165H
12265 Points +12%
Dell XPS 13 9340 Core Ultra 7
Intel Core Ultra 7 155H
11982 Points +9%
Framework Laptop 13.5 Ryzen 7 7840U
AMD Ryzen 7 7840U
11489 Points +5%
Lenovo ThinkBook 13x G4 21KR0008GE
Intel Core Ultra 5 125H
11192 Points +2%
Dell XPS 13 9350
Intel Core Ultra 7 256V
10972 Points
Asus Zenbook S 14 UX5406
Intel Core Ultra 7 258V
10730 Points -2%
MSI Prestige 13 AI Evo
Intel Core Ultra 7 155H
10696 Points -3%
Durchschnittliche Intel Core Ultra 7 256V
  (9852 - 10972, n=3)
10592 Points -3%
Geekbench 6.3 / Single-Core
Dell XPS 13 9350
Intel Core Ultra 7 256V
2778 Points
Durchschnittliche Intel Core Ultra 7 256V
  (2680 - 2784, n=3)
2747 Points -1%
Asus Zenbook S 14 UX5406
Intel Core Ultra 7 258V
2679 Points -4%
Framework Laptop 13.5 Ryzen 7 7840U
AMD Ryzen 7 7840U
2553 Points -8%
MSI Prestige 13 AI Evo
Intel Core Ultra 7 155H
2441 Points -12%
HP EliteBook x360 1040 G11
Intel Core Ultra 7 165H
2437 Points -12%
Dell XPS 13 9340 Core Ultra 7
Intel Core Ultra 7 155H
2408 Points -13%
Lenovo ThinkBook 13x G4 21KR0008GE
Intel Core Ultra 5 125H
2279 Points -18%
Geekbench 5.5 / Multi-Core
HP EliteBook x360 1040 G11
Intel Core Ultra 7 165H
12204 Points +31%
Dell XPS 13 Plus 9320 i7-1280P OLED
Intel Core i7-1280P
11434 Points +23%
Dell XPS 13 9340 Core Ultra 7
Intel Core Ultra 7 155H
11279 Points +21%
Dell XPS 13 Plus 9320 Core i7-1360P
Intel Core i7-1360P
10817 Points +16%
Framework Laptop 13.5 Ryzen 7 7840U
AMD Ryzen 7 7840U
10558 Points +14%
Lenovo ThinkBook 13x G4 21KR0008GE
Intel Core Ultra 5 125H
10309 Points +11%
MSI Prestige 13 AI Evo
Intel Core Ultra 7 155H
10017 Points +8%
Dell XPS 13 Plus 9320 4K
Intel Core i7-1260P
9817 Points +6%
Durchschnittliche Intel Core Ultra 7 256V
  (9302 - 9618, n=2)
9460 Points +2%
Asus Zenbook S 14 UX5406
Intel Core Ultra 7 258V
9330 Points 0%
Dell XPS 13 9350
Intel Core Ultra 7 256V
9302 Points
HP Dragonfly G4
Intel Core i7-1365U
8778 Points -6%
Asus ZenBook S13 OLED UX5304
Intel Core i7-1355U
8117 Points -13%
Asus Zenbook S 13 OLED
AMD Ryzen 7 6800U
7613 Points -18%
Lenovo Yoga 6 13 83B2001SGE
AMD Ryzen 7 7730U
7423 Points -20%
Dell XPS 13 9315 2-in-1 Core i5-1230U
Intel Core i5-1230U
7309 Points -21%
Lenovo ThinkBook 13s G3 20YA0005GE
AMD Ryzen 7 5800U
6995 Points -25%
Dell XPS 13 9315, i5-1230U
Intel Core i5-1230U
6755 Points -27%
Dell XPS 13 Plus 9320 i5-1240p
Intel Core i5-1240P
4286 Points -54%
Geekbench 5.5 / Single-Core
Dell XPS 13 9350
Intel Core Ultra 7 256V
2010 Points
Durchschnittliche Intel Core Ultra 7 256V
  (1972 - 2010, n=2)
1991 Points -1%
Asus Zenbook S 14 UX5406
Intel Core Ultra 7 258V
1956 Points -3%
Framework Laptop 13.5 Ryzen 7 7840U
AMD Ryzen 7 7840U
1912 Points -5%
HP Dragonfly G4
Intel Core i7-1365U
1902 Points -5%
Dell XPS 13 Plus 9320 Core i7-1360P
Intel Core i7-1360P
1825 Points -9%
HP EliteBook x360 1040 G11
Intel Core Ultra 7 165H
1806 Points -10%
Dell XPS 13 Plus 9320 i7-1280P OLED
Intel Core i7-1280P
1802 Points -10%
Asus ZenBook S13 OLED UX5304
Intel Core i7-1355U
1775 Points -12%
Dell XPS 13 9340 Core Ultra 7
Intel Core Ultra 7 155H
1775 Points -12%
MSI Prestige 13 AI Evo
Intel Core Ultra 7 155H
1771 Points -12%
Dell XPS 13 Plus 9320 4K
Intel Core i7-1260P
1723 Points -14%
Lenovo ThinkBook 13x G4 21KR0008GE
Intel Core Ultra 5 125H
1684 Points -16%
Dell XPS 13 9315, i5-1230U
Intel Core i5-1230U
1640 Points -18%
Dell XPS 13 Plus 9320 i5-1240p
Intel Core i5-1240P
1588 Points -21%
Dell XPS 13 9315 2-in-1 Core i5-1230U
Intel Core i5-1230U
1529 Points -24%
Asus Zenbook S 13 OLED
AMD Ryzen 7 6800U
1514 Points -25%
Lenovo Yoga 6 13 83B2001SGE
AMD Ryzen 7 7730U
1471 Points -27%
Lenovo ThinkBook 13s G3 20YA0005GE
AMD Ryzen 7 5800U
1436 Points -29%
HWBOT x265 Benchmark v2.2 / 4k Preset
Framework Laptop 13.5 Ryzen 7 7840U
AMD Ryzen 7 7840U
17.4 fps +33%
HP EliteBook x360 1040 G11
Intel Core Ultra 7 165H
16 fps +22%
Dell XPS 13 9340 Core Ultra 7
Intel Core Ultra 7 155H
15.5 fps +18%
Dell XPS 13 Plus 9320 i7-1280P OLED
Intel Core i7-1280P
13.8 fps +5%
Durchschnittliche Intel Core Ultra 7 256V
  (13.1 - 13.5, n=2)
13.3 fps +2%
Dell XPS 13 Plus 9320 Core i7-1360P
Intel Core i7-1360P
13.2 fps +1%
Dell XPS 13 9350
Intel Core Ultra 7 256V
13.1 fps
Asus Zenbook S 13 OLED
AMD Ryzen 7 6800U
12.6 fps -4%
Dell XPS 13 Plus 9320 4K
Intel Core i7-1260P
11.8 fps -10%
Dell XPS 13 Plus 9320 i5-1240p
Intel Core i5-1240P
11.5 fps -12%
Asus Zenbook S 14 UX5406
Intel Core Ultra 7 258V
10.5 fps -20%
MSI Prestige 13 AI Evo
Intel Core Ultra 7 155H
10.4 fps -21%
Lenovo Yoga 6 13 83B2001SGE
AMD Ryzen 7 7730U
9.91 fps -24%
Lenovo ThinkBook 13x G4 21KR0008GE
Intel Core Ultra 5 125H
9.7 fps -26%
Lenovo ThinkBook 13s G3 20YA0005GE
AMD Ryzen 7 5800U
9.68 fps -26%
HP Dragonfly G4
Intel Core i7-1365U
8.61 fps -34%
Dell XPS 13 9315 2-in-1 Core i5-1230U
Intel Core i5-1230U
8.33 fps -36%
Asus ZenBook S13 OLED UX5304
Intel Core i7-1355U
7.83 fps -40%
LibreOffice / 20 Documents To PDF
Dell XPS 13 Plus 9320 i5-1240p
Intel Core i5-1240P
61.8 s * -16%
Asus Zenbook S 14 UX5406
Intel Core Ultra 7 258V
59.3 s * -11%
HP EliteBook x360 1040 G11
Intel Core Ultra 7 165H
54.8 s * -3%
Durchschnittliche Intel Core Ultra 7 256V
  (53.2 - 55.6, n=2)
54.4 s * -2%
Asus Zenbook S 13 OLED
AMD Ryzen 7 6800U
54.1 s * -2%
Dell XPS 13 9350
Intel Core Ultra 7 256V
53.2 s *
Dell XPS 13 9315 2-in-1 Core i5-1230U
Intel Core i5-1230U
51.2 s * +4%
Lenovo ThinkBook 13s G3 20YA0005GE
AMD Ryzen 7 5800U
50.9 s * +4%
Dell XPS 13 Plus 9320 i7-1280P OLED
Intel Core i7-1280P
49.2 s * +8%
Lenovo ThinkBook 13x G4 21KR0008GE
Intel Core Ultra 5 125H
49.2 s * +8%
Lenovo Yoga 6 13 83B2001SGE
AMD Ryzen 7 7730U
48.4 s * +9%
Dell XPS 13 9340 Core Ultra 7
Intel Core Ultra 7 155H
47.8 s * +10%
Asus ZenBook S13 OLED UX5304
Intel Core i7-1355U
47.5 s * +11%
Dell XPS 13 Plus 9320 Core i7-1360P
Intel Core i7-1360P
46.5 s * +13%
HP Dragonfly G4
Intel Core i7-1365U
45.3 s * +15%
Dell XPS 13 Plus 9320 4K
Intel Core i7-1260P
44.6 s * +16%
Framework Laptop 13.5 Ryzen 7 7840U
AMD Ryzen 7 7840U
44.1 s * +17%
MSI Prestige 13 AI Evo
Intel Core Ultra 7 155H
43.5 s * +18%
R Benchmark 2.5 / Overall mean
Lenovo ThinkBook 13s G3 20YA0005GE
AMD Ryzen 7 5800U
0.546 sec * -19%
Lenovo Yoga 6 13 83B2001SGE
AMD Ryzen 7 7730U
0.543 sec * -19%
Asus Zenbook S 13 OLED
AMD Ryzen 7 6800U
0.529 sec * -16%
Dell XPS 13 9315 2-in-1 Core i5-1230U
Intel Core i5-1230U
0.527 sec * -15%
Dell XPS 13 Plus 9320 i5-1240p
Intel Core i5-1240P
0.524 sec * -14%
Lenovo ThinkBook 13x G4 21KR0008GE
Intel Core Ultra 5 125H
0.503 sec * -10%
Dell XPS 13 Plus 9320 i7-1280P OLED
Intel Core i7-1280P
0.4998 sec * -9%
Dell XPS 13 Plus 9320 4K
Intel Core i7-1260P
0.4928 sec * -8%
Dell XPS 13 9340 Core Ultra 7
Intel Core Ultra 7 155H
0.4829 sec * -5%
Asus ZenBook S13 OLED UX5304
Intel Core i7-1355U
0.469 sec * -2%
HP EliteBook x360 1040 G11
Intel Core Ultra 7 165H
0.4686 sec * -2%
Dell XPS 13 Plus 9320 Core i7-1360P
Intel Core i7-1360P
0.4675 sec * -2%
MSI Prestige 13 AI Evo
Intel Core Ultra 7 155H
0.4629 sec * -1%
Durchschnittliche Intel Core Ultra 7 256V
  (0.4578 - 0.4645, n=2)
0.4612 sec * -1%
Asus Zenbook S 14 UX5406
Intel Core Ultra 7 258V
0.4593 sec * -0%
HP Dragonfly G4
Intel Core i7-1365U
0.4586 sec * -0%
Dell XPS 13 9350
Intel Core Ultra 7 256V
0.4578 sec *
Framework Laptop 13.5 Ryzen 7 7840U
AMD Ryzen 7 7840U
0.456 sec * -0%
CPU Performance Rating: Percent
Cinebench R23: Multi Core | Single Core
Cinebench R20: CPU (Multi Core) | CPU (Single Core)
Cinebench R15: CPU Multi 64Bit | CPU Single 64Bit
Blender: v2.79 BMW27 CPU
7-Zip 18.03: 7z b 4 | 7z b 4 -mmt1
Geekbench 6.3: Multi-Core | Single-Core
Geekbench 5.5: Multi-Core | Single-Core
HWBOT x265 Benchmark v2.2: 4k Preset
LibreOffice : 20 Documents To PDF
R Benchmark 2.5: Overall mean

* ... kleinere Werte sind besser

Cinebench R15 CPU Multi 64Bit
1570 Points
Cinebench R15 OpenGL 64Bit
170.5 fps
Cinebench R15 Ref. Match 64Bit
97.8 %
Cinebench R15 CPU Single 64Bit
285 Points
Cinebench R20 CPU (Multi Core)
4038 Points
Cinebench R20 CPU (Single Core)
720 Points
Cinebench R23 Single Core
1875 Points
Cinebench R23 Multi Core
10391 Points
Cinebench 2024 CPU Multi Core
582 Points
Cinebench 2024 CPU Single Core
117.4 Points
Hilfe
Performance Rating
Dell XPS 13 Plus 9320 i7-1280P OLED
Intel Core i7-1280P, Iris Xe G7 96EUs
93.9 pt
Durchschnittliche Intel Core Ultra 7 256V
 
86.6 pt
Dell XPS 13 9350
Intel Core Ultra 7 256V, Arc 140V
85.4 pt
Lenovo ThinkBook 13x G4 21KR0008GE
Intel Core Ultra 5 125H, Arc 7-Core
78.3 pt
MSI Prestige 13 AI Evo
Intel Core Ultra 7 155H, Arc 8-Core
71.2 pt
HP Dragonfly G4
Intel Core i7-1365U, Iris Xe G7 96EUs
62.1 pt
Asus ZenBook S13 OLED UX5304
Intel Core i7-1355U, Iris Xe G7 96EUs
58 pt
AIDA64 / FP32 Ray-Trace
Durchschnittliche Intel Core Ultra 7 256V
  (12287 - 12812, n=2)
12550 KRay/s +2%
Dell XPS 13 9350
Intel Core Ultra 7 256V, Arc 140V
12287 KRay/s
Dell XPS 13 Plus 9320 i7-1280P OLED
Intel Core i7-1280P, Iris Xe G7 96EUs
10787 KRay/s -12%
Lenovo ThinkBook 13x G4 21KR0008GE
Intel Core Ultra 5 125H, Arc 7-Core
8430 KRay/s -31%
HP Dragonfly G4
Intel Core i7-1365U, Iris Xe G7 96EUs
6720 KRay/s -45%
MSI Prestige 13 AI Evo
Intel Core Ultra 7 155H, Arc 8-Core
6670 KRay/s -46%
Asus ZenBook S13 OLED UX5304
Intel Core i7-1355U, Iris Xe G7 96EUs
5981 KRay/s -51%
AIDA64 / FPU Julia
Dell XPS 13 9350
Intel Core Ultra 7 256V, Arc 140V
61131 Points
Durchschnittliche Intel Core Ultra 7 256V
  (60345 - 61131, n=2)
60738 Points -1%
Dell XPS 13 Plus 9320 i7-1280P OLED
Intel Core i7-1280P, Iris Xe G7 96EUs
56649 Points -7%
MSI Prestige 13 AI Evo
Intel Core Ultra 7 155H, Arc 8-Core
45123 Points -26%
Lenovo ThinkBook 13x G4 21KR0008GE
Intel Core Ultra 5 125H, Arc 7-Core
44947 Points -26%
HP Dragonfly G4
Intel Core i7-1365U, Iris Xe G7 96EUs
33777 Points -45%
Asus ZenBook S13 OLED UX5304
Intel Core i7-1355U, Iris Xe G7 96EUs
31092 Points -49%
AIDA64 / CPU SHA3
Durchschnittliche Intel Core Ultra 7 256V
  (2713 - 2814, n=2)
2764 MB/s +2%
Dell XPS 13 9350
Intel Core Ultra 7 256V, Arc 140V
2713 MB/s
Dell XPS 13 Plus 9320 i7-1280P OLED
Intel Core i7-1280P, Iris Xe G7 96EUs
2683 MB/s -1%
Lenovo ThinkBook 13x G4 21KR0008GE
Intel Core Ultra 5 125H, Arc 7-Core
2047 MB/s -25%
MSI Prestige 13 AI Evo
Intel Core Ultra 7 155H, Arc 8-Core
2039 MB/s -25%
HP Dragonfly G4
Intel Core i7-1365U, Iris Xe G7 96EUs
1754 MB/s -35%
Asus ZenBook S13 OLED UX5304
Intel Core i7-1355U, Iris Xe G7 96EUs
1632 MB/s -40%
AIDA64 / CPU Queen
Dell XPS 13 Plus 9320 i7-1280P OLED
Intel Core i7-1280P, Iris Xe G7 96EUs
94234 Points +90%
Lenovo ThinkBook 13x G4 21KR0008GE
Intel Core Ultra 5 125H, Arc 7-Core
79986 Points +61%
HP Dragonfly G4
Intel Core i7-1365U, Iris Xe G7 96EUs
69991 Points +41%
Asus ZenBook S13 OLED UX5304
Intel Core i7-1355U, Iris Xe G7 96EUs
66531 Points +34%
MSI Prestige 13 AI Evo
Intel Core Ultra 7 155H, Arc 8-Core
64698 Points +30%
Durchschnittliche Intel Core Ultra 7 256V
  (49622 - 49794, n=2)
49708 Points 0%
Dell XPS 13 9350
Intel Core Ultra 7 256V, Arc 140V
49622 Points
AIDA64 / FPU SinJulia
Dell XPS 13 Plus 9320 i7-1280P OLED
Intel Core i7-1280P, Iris Xe G7 96EUs
7547 Points +70%
Lenovo ThinkBook 13x G4 21KR0008GE
Intel Core Ultra 5 125H, Arc 7-Core
6588 Points +49%
MSI Prestige 13 AI Evo
Intel Core Ultra 7 155H, Arc 8-Core
5639 Points +27%
HP Dragonfly G4
Intel Core i7-1365U, Iris Xe G7 96EUs
4589 Points +4%
Dell XPS 13 9350
Intel Core Ultra 7 256V, Arc 140V
4428 Points
Durchschnittliche Intel Core Ultra 7 256V
  (4425 - 4428, n=2)
4427 Points 0%
Asus ZenBook S13 OLED UX5304
Intel Core i7-1355U, Iris Xe G7 96EUs
4216 Points -5%
AIDA64 / FPU Mandel
Dell XPS 13 9350
Intel Core Ultra 7 256V, Arc 140V
32410 Points
Durchschnittliche Intel Core Ultra 7 256V
  (32020 - 32410, n=2)
32215 Points -1%
Dell XPS 13 Plus 9320 i7-1280P OLED
Intel Core i7-1280P, Iris Xe G7 96EUs
26694 Points -18%
MSI Prestige 13 AI Evo
Intel Core Ultra 7 155H, Arc 8-Core
21671 Points -33%
Lenovo ThinkBook 13x G4 21KR0008GE
Intel Core Ultra 5 125H, Arc 7-Core
21210 Points -35%
HP Dragonfly G4
Intel Core i7-1365U, Iris Xe G7 96EUs
16808 Points -48%
Asus ZenBook S13 OLED UX5304
Intel Core i7-1355U, Iris Xe G7 96EUs
15222 Points -53%
AIDA64 / CPU AES
Dell XPS 13 Plus 9320 i7-1280P OLED
Intel Core i7-1280P, Iris Xe G7 96EUs
54261 MB/s +33%
Lenovo ThinkBook 13x G4 21KR0008GE
Intel Core Ultra 5 125H, Arc 7-Core
48373 MB/s +18%
MSI Prestige 13 AI Evo
Intel Core Ultra 7 155H, Arc 8-Core
46211 MB/s +13%
Dell XPS 13 9350
Intel Core Ultra 7 256V, Arc 140V
40828 MB/s
Durchschnittliche Intel Core Ultra 7 256V
  (40415 - 40828, n=2)
40622 MB/s -1%
HP Dragonfly G4
Intel Core i7-1365U, Iris Xe G7 96EUs
34968 MB/s -14%
Asus ZenBook S13 OLED UX5304
Intel Core i7-1355U, Iris Xe G7 96EUs
32647 MB/s -20%
AIDA64 / CPU ZLib
Dell XPS 13 Plus 9320 i7-1280P OLED
Intel Core i7-1280P, Iris Xe G7 96EUs
725 MB/s +35%
Lenovo ThinkBook 13x G4 21KR0008GE
Intel Core Ultra 5 125H, Arc 7-Core
612 MB/s +14%
Durchschnittliche Intel Core Ultra 7 256V
  (536 - 632, n=2)
584 MB/s +9%
MSI Prestige 13 AI Evo
Intel Core Ultra 7 155H, Arc 8-Core
582 MB/s +9%
Dell XPS 13 9350
Intel Core Ultra 7 256V, Arc 140V
536 MB/s
HP Dragonfly G4
Intel Core i7-1365U, Iris Xe G7 96EUs
519 MB/s -3%
Asus ZenBook S13 OLED UX5304
Intel Core i7-1355U, Iris Xe G7 96EUs
488 MB/s -9%
AIDA64 / FP64 Ray-Trace
Durchschnittliche Intel Core Ultra 7 256V
  (6506 - 6832, n=2)
6669 KRay/s +3%
Dell XPS 13 9350
Intel Core Ultra 7 256V, Arc 140V
6506 KRay/s
Dell XPS 13 Plus 9320 i7-1280P OLED
Intel Core i7-1280P, Iris Xe G7 96EUs
5993 KRay/s -8%
Lenovo ThinkBook 13x G4 21KR0008GE
Intel Core Ultra 5 125H, Arc 7-Core
4421 KRay/s -32%
MSI Prestige 13 AI Evo
Intel Core Ultra 7 155H, Arc 8-Core
3569 KRay/s -45%
HP Dragonfly G4
Intel Core i7-1365U, Iris Xe G7 96EUs
3513 KRay/s -46%
Asus ZenBook S13 OLED UX5304
Intel Core i7-1355U, Iris Xe G7 96EUs
3134 KRay/s -52%
AIDA64 / CPU PhotoWorxx
Durchschnittliche Intel Core Ultra 7 256V
  (51767 - 52282, n=2)
52025 MPixel/s 0%
Dell XPS 13 9350
Intel Core Ultra 7 256V, Arc 140V
51767 MPixel/s
Dell XPS 13 Plus 9320 i7-1280P OLED
Intel Core i7-1280P, Iris Xe G7 96EUs
47506 MPixel/s -8%
Lenovo ThinkBook 13x G4 21KR0008GE
Intel Core Ultra 5 125H, Arc 7-Core
47353 MPixel/s -9%
MSI Prestige 13 AI Evo
Intel Core Ultra 7 155H, Arc 8-Core
42674 MPixel/s -18%
Asus ZenBook S13 OLED UX5304
Intel Core i7-1355U, Iris Xe G7 96EUs
38665 MPixel/s -25%
HP Dragonfly G4
Intel Core i7-1365U, Iris Xe G7 96EUs
37846 MPixel/s -27%

Stresstest

System im Leerlauf
System im Leerlauf

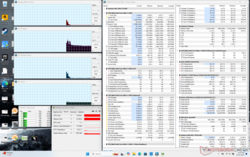
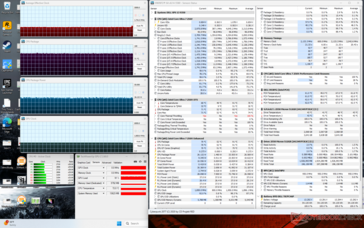
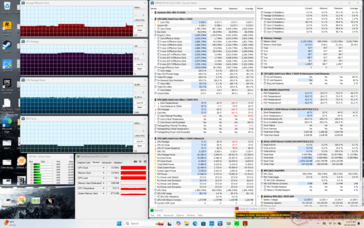
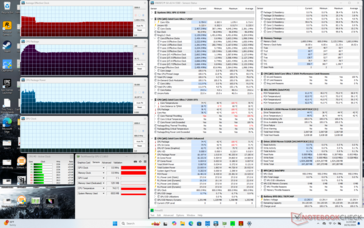
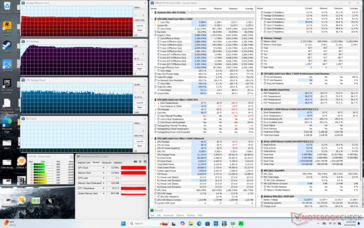
Wenn wir den Prime95-Stresstest starten, erhöht sich die CPU für etwa eine Minute auf 3,4 GHz und 38 W, bis sie eine Kerntemperatur von 100 °C erreicht. Danach stabilisiert sie sich bei 3,2 GHz und 32 W, um eine etwas kühlere Kerntemperatur von 90 °C aufrechtzuerhalten. Wenn wir stattdessen den Balanced-Modus wählen, stabilisiert sich die CPU bei viel niedrigeren Werten von 2,5 GHz, 76 °C und 18 W, was mit unserer langsameren Prozessorleistung korreliert, wie in unserem Abschnitt zur GPU-Leistung weiter unten erwähnt.

Die Kerntemperatur bei der Ausführung von Prime95 im Performance-Modus ist höher als das, was wir auf dem älteren XPS 13 9320 bei der Ausführung desselben Stresstests gemessen haben. Auf der anderen Seite scheint die Kerntemperatur bei der Ausführung von Spielen auf unserem neueren XPS 13 9350 um fast 10 °C kühler zu sein.

Cyberpunk 2077 Stresstest
Prime95+FurMark Stresstest
Prime95 Stresstest (Balanced-Modus)
Prime95 Stresstest (Performance-Modus)
Durchschnittlicher CPU-Takt (GHz) GPU-Takt (MHz) Durchschnittliche CPU-Temperatur (°C)
System im Leerlauf -- -- 29
Prime95 Stresstest (Performance-Modus) 3,2 -- 90
Prime95 Stresstest (Balanced-Modus) 2,5 -- 76
Prime95 + FurMark Stresstest ~1.8 ~1400 72
Cyberpunk 2077 Stresstest 1,7 1850 71

System Performance

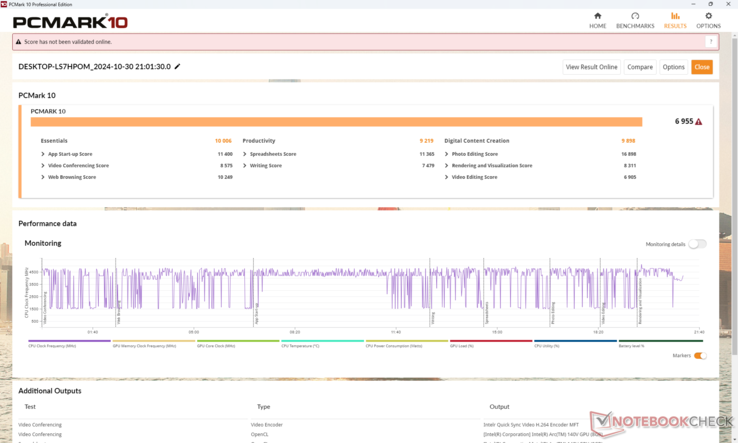
Die durchschnittlichen PCMark-Ergebnisse sind deutlich höher als bei allen vorherigen XPS 13-Konfigurationen, trotz der langsameren CPU-Benchmark-Ergebnisse im Vergleich zum Core Ultra 7 155H (siehe oben). Dies kann sowohl auf den schnelleren Arbeitsspeicher als auch auf die integrierte GPU zurückgeführt werden, die das Defizit des Prozessors ausgleichen. Die AIDA64-Speicherergebnisse sind beispielsweise deutlich schneller als bei den meisten anderen Subnotebooks, da RAM-Leistung und -Effizienz bei der Entwicklung von Lunar Lake im Vordergrund standen.

PCMark 10 Standard
PCMark 10 Standard
PCMark 10 / Score
Dell XPS 13 9350
Arc 140V, Core Ultra 7 256V, Micron 2550 512GB
6955 Points
Durchschnittliche Intel Core Ultra 7 256V, Intel Arc Graphics 140V
  (6771 - 6955, n=2)
6863 Points -1%
Dell XPS 13 9340 Core Ultra 7
Arc 8-Core, Ultra 7 155H, Micron 2550 512GB
6555 Points -6%
Lenovo ThinkBook 13x G4 21KR0008GE
Arc 7-Core, Ultra 5 125H, Samsung PM9C1a MZAL8512HDLU
6293 Points -10%
MSI Prestige 13 AI Evo
Arc 8-Core, Ultra 7 155H, Samsung PM9A1 MZVL21T0HCLR
5952 Points -14%
HP Dragonfly G4
Iris Xe G7 96EUs, i7-1365U, Micron 3400 MTFDKBA512TFH 512GB
5690 Points -18%
Dell XPS 13 Plus 9320 i7-1280P OLED
Iris Xe G7 96EUs, i7-1280P, WDC PC SN810 512GB
5644 Points -19%
Asus ZenBook S13 OLED UX5304
Iris Xe G7 96EUs, i7-1355U, Samsung PM9A1 MZVL21T0HCLR
5576 Points -20%
PCMark 10 / Essentials
HP Dragonfly G4
Iris Xe G7 96EUs, i7-1365U, Micron 3400 MTFDKBA512TFH 512GB
10853 Points +8%
Dell XPS 13 9340 Core Ultra 7
Arc 8-Core, Ultra 7 155H, Micron 2550 512GB
10752 Points +7%
Asus ZenBook S13 OLED UX5304
Iris Xe G7 96EUs, i7-1355U, Samsung PM9A1 MZVL21T0HCLR
10605 Points +6%
Dell XPS 13 Plus 9320 i7-1280P OLED
Iris Xe G7 96EUs, i7-1280P, WDC PC SN810 512GB
10435 Points +4%
Lenovo ThinkBook 13x G4 21KR0008GE
Arc 7-Core, Ultra 5 125H, Samsung PM9C1a MZAL8512HDLU
10159 Points +2%
Dell XPS 13 9350
Arc 140V, Core Ultra 7 256V, Micron 2550 512GB
10006 Points
MSI Prestige 13 AI Evo
Arc 8-Core, Ultra 7 155H, Samsung PM9A1 MZVL21T0HCLR
9833 Points -2%
Durchschnittliche Intel Core Ultra 7 256V, Intel Arc Graphics 140V
  (9627 - 10006, n=2)
9817 Points -2%
PCMark 10 / Productivity
Dell XPS 13 9350
Arc 140V, Core Ultra 7 256V, Micron 2550 512GB
9219 Points
Durchschnittliche Intel Core Ultra 7 256V, Intel Arc Graphics 140V
  (8997 - 9219, n=2)
9108 Points -1%
MSI Prestige 13 AI Evo
Arc 8-Core, Ultra 7 155H, Samsung PM9A1 MZVL21T0HCLR
8643 Points -6%
Dell XPS 13 9340 Core Ultra 7
Arc 8-Core, Ultra 7 155H, Micron 2550 512GB
8440 Points -8%
Lenovo ThinkBook 13x G4 21KR0008GE
Arc 7-Core, Ultra 5 125H, Samsung PM9C1a MZAL8512HDLU
8000 Points -13%
HP Dragonfly G4
Iris Xe G7 96EUs, i7-1365U, Micron 3400 MTFDKBA512TFH 512GB
7206 Points -22%
Asus ZenBook S13 OLED UX5304
Iris Xe G7 96EUs, i7-1355U, Samsung PM9A1 MZVL21T0HCLR
7182 Points -22%
Dell XPS 13 Plus 9320 i7-1280P OLED
Iris Xe G7 96EUs, i7-1280P, WDC PC SN810 512GB
6698 Points -27%
PCMark 10 / Digital Content Creation
Dell XPS 13 9350
Arc 140V, Core Ultra 7 256V, Micron 2550 512GB
9898 Points
Durchschnittliche Intel Core Ultra 7 256V, Intel Arc Graphics 140V
  (9727 - 9898, n=2)
9813 Points -1%
Dell XPS 13 9340 Core Ultra 7
Arc 8-Core, Ultra 7 155H, Micron 2550 512GB
8423 Points -15%
Lenovo ThinkBook 13x G4 21KR0008GE
Arc 7-Core, Ultra 5 125H, Samsung PM9C1a MZAL8512HDLU
8321 Points -16%
Dell XPS 13 Plus 9320 i7-1280P OLED
Iris Xe G7 96EUs, i7-1280P, WDC PC SN810 512GB
6983 Points -29%
MSI Prestige 13 AI Evo
Arc 8-Core, Ultra 7 155H, Samsung PM9A1 MZVL21T0HCLR
6735 Points -32%
HP Dragonfly G4
Iris Xe G7 96EUs, i7-1365U, Micron 3400 MTFDKBA512TFH 512GB
6392 Points -35%
Asus ZenBook S13 OLED UX5304
Iris Xe G7 96EUs, i7-1355U, Samsung PM9A1 MZVL21T0HCLR
6177 Points -38%
CrossMark / Overall
Dell XPS 13 Plus 9320 i7-1280P OLED
Iris Xe G7 96EUs, i7-1280P, WDC PC SN810 512GB
1747 Points +1%
Dell XPS 13 9350
Arc 140V, Core Ultra 7 256V, Micron 2550 512GB
1736 Points
Durchschnittliche Intel Core Ultra 7 256V, Intel Arc Graphics 140V
  (1663 - 1736, n=2)
1700 Points -2%
Dell XPS 13 9340 Core Ultra 7
Arc 8-Core, Ultra 7 155H, Micron 2550 512GB
1680 Points -3%
HP Dragonfly G4
Iris Xe G7 96EUs, i7-1365U, Micron 3400 MTFDKBA512TFH 512GB
1628 Points -6%
Asus ZenBook S13 OLED UX5304
Iris Xe G7 96EUs, i7-1355U, Samsung PM9A1 MZVL21T0HCLR
1592 Points -8%
Lenovo ThinkBook 13x G4 21KR0008GE
Arc 7-Core, Ultra 5 125H, Samsung PM9C1a MZAL8512HDLU
1548 Points -11%
MSI Prestige 13 AI Evo
Arc 8-Core, Ultra 7 155H, Samsung PM9A1 MZVL21T0HCLR
1455 Points -16%
CrossMark / Productivity
Dell XPS 13 9350
Arc 140V, Core Ultra 7 256V, Micron 2550 512GB
1682 Points
Dell XPS 13 Plus 9320 i7-1280P OLED
Iris Xe G7 96EUs, i7-1280P, WDC PC SN810 512GB
1658 Points -1%
Durchschnittliche Intel Core Ultra 7 256V, Intel Arc Graphics 140V
  (1612 - 1682, n=2)
1647 Points -2%
HP Dragonfly G4
Iris Xe G7 96EUs, i7-1365U, Micron 3400 MTFDKBA512TFH 512GB
1620 Points -4%
Dell XPS 13 9340 Core Ultra 7
Arc 8-Core, Ultra 7 155H, Micron 2550 512GB
1618 Points -4%
Asus ZenBook S13 OLED UX5304
Iris Xe G7 96EUs, i7-1355U, Samsung PM9A1 MZVL21T0HCLR
1566 Points -7%
Lenovo ThinkBook 13x G4 21KR0008GE
Arc 7-Core, Ultra 5 125H, Samsung PM9C1a MZAL8512HDLU
1483 Points -12%
MSI Prestige 13 AI Evo
Arc 8-Core, Ultra 7 155H, Samsung PM9A1 MZVL21T0HCLR
1454 Points -14%
CrossMark / Creativity
Dell XPS 13 9350
Arc 140V, Core Ultra 7 256V, Micron 2550 512GB
1953 Points
Dell XPS 13 Plus 9320 i7-1280P OLED
Iris Xe G7 96EUs, i7-1280P, WDC PC SN810 512GB
1928 Points -1%
Durchschnittliche Intel Core Ultra 7 256V, Intel Arc Graphics 140V
  (1862 - 1953, n=2)
1908 Points -2%
Dell XPS 13 9340 Core Ultra 7
Arc 8-Core, Ultra 7 155H, Micron 2550 512GB
1854 Points -5%
HP Dragonfly G4
Iris Xe G7 96EUs, i7-1365U, Micron 3400 MTFDKBA512TFH 512GB
1731 Points -11%
Lenovo ThinkBook 13x G4 21KR0008GE
Arc 7-Core, Ultra 5 125H, Samsung PM9C1a MZAL8512HDLU
1727 Points -12%
Asus ZenBook S13 OLED UX5304
Iris Xe G7 96EUs, i7-1355U, Samsung PM9A1 MZVL21T0HCLR
1696 Points -13%
MSI Prestige 13 AI Evo
Arc 8-Core, Ultra 7 155H, Samsung PM9A1 MZVL21T0HCLR
1519 Points -22%
CrossMark / Responsiveness
Dell XPS 13 Plus 9320 i7-1280P OLED
Iris Xe G7 96EUs, i7-1280P, WDC PC SN810 512GB
1520 Points +13%
Dell XPS 13 9340 Core Ultra 7
Arc 8-Core, Ultra 7 155H, Micron 2550 512GB
1397 Points +4%
Asus ZenBook S13 OLED UX5304
Iris Xe G7 96EUs, i7-1355U, Samsung PM9A1 MZVL21T0HCLR
1386 Points +3%
HP Dragonfly G4
Iris Xe G7 96EUs, i7-1365U, Micron 3400 MTFDKBA512TFH 512GB
1373 Points +2%
Dell XPS 13 9350
Arc 140V, Core Ultra 7 256V, Micron 2550 512GB
1343 Points
Durchschnittliche Intel Core Ultra 7 256V, Intel Arc Graphics 140V
  (1301 - 1343, n=2)
1322 Points -2%
MSI Prestige 13 AI Evo
Arc 8-Core, Ultra 7 155H, Samsung PM9A1 MZVL21T0HCLR
1283 Points -4%
Lenovo ThinkBook 13x G4 21KR0008GE
Arc 7-Core, Ultra 5 125H, Samsung PM9C1a MZAL8512HDLU
1270 Points -5%
WebXPRT 3 / Overall
Dell XPS 13 9350
Arc 140V, Core Ultra 7 256V, Micron 2550 512GB
310 Points
Durchschnittliche Intel Core Ultra 7 256V, Intel Arc Graphics 140V
  (306 - 310, n=2)
308 Points -1%
HP Dragonfly G4
Iris Xe G7 96EUs, i7-1365U, Micron 3400 MTFDKBA512TFH 512GB
305 Points -2%
Asus ZenBook S13 OLED UX5304
Iris Xe G7 96EUs, i7-1355U, Samsung PM9A1 MZVL21T0HCLR
291 Points -6%
Dell XPS 13 Plus 9320 i7-1280P OLED
Iris Xe G7 96EUs, i7-1280P, WDC PC SN810 512GB
288 Points -7%
Dell XPS 13 9340 Core Ultra 7
Arc 8-Core, Ultra 7 155H, Micron 2550 512GB
272 Points -12%
MSI Prestige 13 AI Evo
Arc 8-Core, Ultra 7 155H, Samsung PM9A1 MZVL21T0HCLR
261 Points -16%
Lenovo ThinkBook 13x G4 21KR0008GE
Arc 7-Core, Ultra 5 125H, Samsung PM9C1a MZAL8512HDLU
250 Points -19%
WebXPRT 4 / Overall
Dell XPS 13 9350
Arc 140V, Core Ultra 7 256V, Micron 2550 512GB
286 Points
Durchschnittliche Intel Core Ultra 7 256V, Intel Arc Graphics 140V
  (284 - 286, n=2)
285 Points 0%
HP Dragonfly G4
Iris Xe G7 96EUs, i7-1365U, Micron 3400 MTFDKBA512TFH 512GB
266 Points -7%
Dell XPS 13 9340 Core Ultra 7
Arc 8-Core, Ultra 7 155H, Micron 2550 512GB
257 Points -10%
Asus ZenBook S13 OLED UX5304
Iris Xe G7 96EUs, i7-1355U, Samsung PM9A1 MZVL21T0HCLR
252 Points -12%
Dell XPS 13 Plus 9320 i7-1280P OLED
Iris Xe G7 96EUs, i7-1280P, WDC PC SN810 512GB
251 Points -12%
MSI Prestige 13 AI Evo
Arc 8-Core, Ultra 7 155H, Samsung PM9A1 MZVL21T0HCLR
241 Points -16%
Lenovo ThinkBook 13x G4 21KR0008GE
Arc 7-Core, Ultra 5 125H, Samsung PM9C1a MZAL8512HDLU
240 Points -16%
Mozilla Kraken 1.1 / Total
Lenovo ThinkBook 13x G4 21KR0008GE
Arc 7-Core, Ultra 5 125H, Samsung PM9C1a MZAL8512HDLU
560 ms * -19%
MSI Prestige 13 AI Evo
Arc 8-Core, Ultra 7 155H, Samsung PM9A1 MZVL21T0HCLR
542 ms * -15%
Dell XPS 13 Plus 9320 i7-1280P OLED
Iris Xe G7 96EUs, i7-1280P, WDC PC SN810 512GB
538 ms * -14%
Dell XPS 13 9340 Core Ultra 7
Arc 8-Core, Ultra 7 155H, Micron 2550 512GB
528 ms * -12%
Asus ZenBook S13 OLED UX5304
Iris Xe G7 96EUs, i7-1355U, Samsung PM9A1 MZVL21T0HCLR
515 ms * -9%
HP Dragonfly G4
Iris Xe G7 96EUs, i7-1365U, Micron 3400 MTFDKBA512TFH 512GB
494 ms * -5%
Durchschnittliche Intel Core Ultra 7 256V, Intel Arc Graphics 140V
  (472 - 474, n=2)
473 ms * -0%
Dell XPS 13 9350
Arc 140V, Core Ultra 7 256V, Micron 2550 512GB
472 ms *

* ... kleinere Werte sind besser

PCMark 10 Score
6955 Punkte
Hilfe
AIDA64 / Memory Copy
Durchschnittliche Intel Core Ultra 7 256V
  (101642 - 104459, n=2)
103051 MB/s +1%
Dell XPS 13 9350
Intel Core Ultra 7 256V, Arc 140V
101642 MB/s
Lenovo ThinkBook 13x G4 21KR0008GE
Intel Core Ultra 5 125H, Arc 7-Core
87473 MB/s -14%
MSI Prestige 13 AI Evo
Intel Core Ultra 7 155H, Arc 8-Core
81600 MB/s -20%
Dell XPS 13 Plus 9320 i7-1280P OLED
Intel Core i7-1280P, Iris Xe G7 96EUs
72478 MB/s -29%
Asus ZenBook S13 OLED UX5304
Intel Core i7-1355U, Iris Xe G7 96EUs
59942 MB/s -41%
HP Dragonfly G4
Intel Core i7-1365U, Iris Xe G7 96EUs
58331 MB/s -43%
AIDA64 / Memory Read
Durchschnittliche Intel Core Ultra 7 256V
  (88013 - 89144, n=2)
88579 MB/s +1%
Dell XPS 13 9350
Intel Core Ultra 7 256V, Arc 140V
88013 MB/s
Lenovo ThinkBook 13x G4 21KR0008GE
Intel Core Ultra 5 125H, Arc 7-Core
76803 MB/s -13%
MSI Prestige 13 AI Evo
Intel Core Ultra 7 155H, Arc 8-Core
74299 MB/s -16%
Dell XPS 13 Plus 9320 i7-1280P OLED
Intel Core i7-1280P, Iris Xe G7 96EUs
73719 MB/s -16%
Asus ZenBook S13 OLED UX5304
Intel Core i7-1355U, Iris Xe G7 96EUs
49758 MB/s -43%
HP Dragonfly G4
Intel Core i7-1365U, Iris Xe G7 96EUs
49203 MB/s -44%
AIDA64 / Memory Write
Durchschnittliche Intel Core Ultra 7 256V
  (112340 - 117933, n=2)
115137 MB/s +2%
Dell XPS 13 9350
Intel Core Ultra 7 256V, Arc 140V
112340 MB/s
MSI Prestige 13 AI Evo
Intel Core Ultra 7 155H, Arc 8-Core
75825 MB/s -33%
Asus ZenBook S13 OLED UX5304
Intel Core i7-1355U, Iris Xe G7 96EUs
72418 MB/s -36%
HP Dragonfly G4
Intel Core i7-1365U, Iris Xe G7 96EUs
70434 MB/s -37%
Lenovo ThinkBook 13x G4 21KR0008GE
Intel Core Ultra 5 125H, Arc 7-Core
69575 MB/s -38%
Dell XPS 13 Plus 9320 i7-1280P OLED
Intel Core i7-1280P, Iris Xe G7 96EUs
63969 MB/s -43%
AIDA64 / Memory Latency
MSI Prestige 13 AI Evo
Intel Core Ultra 7 155H, Arc 8-Core
146.1 ns * -47%
Lenovo ThinkBook 13x G4 21KR0008GE
Intel Core Ultra 5 125H, Arc 7-Core
133.4 ns * -34%
Dell XPS 13 Plus 9320 i7-1280P OLED
Intel Core i7-1280P, Iris Xe G7 96EUs
103 ns * -3%
Dell XPS 13 9350
Intel Core Ultra 7 256V, Arc 140V
99.6 ns *
Durchschnittliche Intel Core Ultra 7 256V
  (99.6 - 99.6, n=2)
99.6 ns * -0%
HP Dragonfly G4
Intel Core i7-1365U, Iris Xe G7 96EUs
90.2 ns * +9%
Asus ZenBook S13 OLED UX5304
Intel Core i7-1355U, Iris Xe G7 96EUs
90.1 ns * +10%

* ... kleinere Werte sind besser

DPC-Latenzen

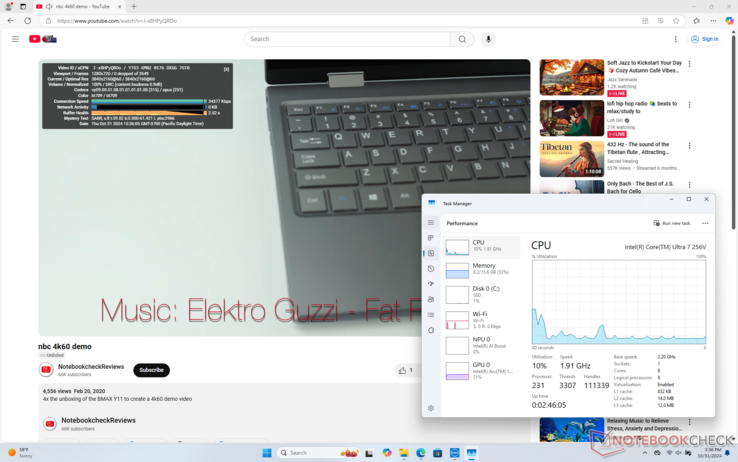
LatencyMon ist mit dem Modell und seiner neuen Lunar-Lake-CPU nicht kompatibel. Die 4K-Videowiedergabe bei 60 FPS ist ansonsten perfekt, es gibt keine Bildaussetzer.

4K60-Wiedergabetest
4K60-Wiedergabetest

Massenspeicher

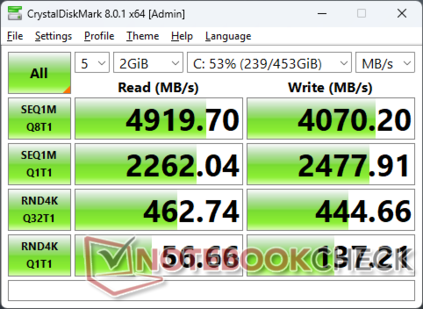
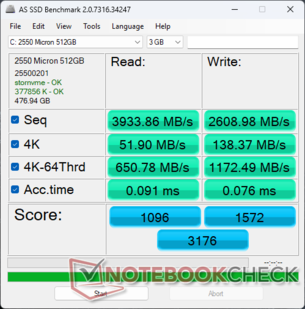
Das System wird mit der gleichen Micron 2550 PCIe4 NVMe SSD ausgeliefert, die auch in der XPS 13 9340- und 9345-Serie zu finden ist. Die Transferraten erreichen Spitzenwerte von etwa 5000 MB/s, ohne Anzeichen von Drosselung unter Last. Dennoch werden etwas größere Laptops wie das Lenovo ThinkPad T14s mit der Samsung PM9A1a ausgeliefert, die Geschwindigkeiten von über 7000 MB/s erreichen kann.

CDM 8
CDM 8
AS SSD
AS SSD
Micron 2550 512GB
CDM 5/6 Read Seq Q32T1: 5036 MB/s
CDM 5/6 Write Seq Q32T1: 4060 MB/s
CDM 5/6 Read 4K Q32T1: 467.7 MB/s
CDM 5/6 Write 4K Q32T1: 452.4 MB/s
CDM 5 Read Seq: 2284 MB/s
CDM 5 Write Seq: 2548 MB/s
CDM 5/6 Read 4K: 55.42 MB/s
CDM 5/6 Write 4K: 133 MB/s
Drive Performance Rating - Percent
MSI Prestige 13 AI Evo
Samsung PM9A1 MZVL21T0HCLR
95.1 pt
Dell XPS 13 Plus 9320 i7-1280P OLED
WDC PC SN810 512GB
72.6 pt
Asus ZenBook S13 OLED UX5304
Samsung PM9A1 MZVL21T0HCLR
71.8 pt
Lenovo ThinkBook 13x G4 21KR0008GE
Samsung PM9C1a MZAL8512HDLU
66.2 pt
HP Dragonfly G4
Micron 3400 MTFDKBA512TFH 512GB
63.6 pt
Dell XPS 13 9350
Micron 2550 512GB
50.4 pt
DiskSpd
seq read
MSI Prestige 13 AI Evo
Samsung PM9A1 MZVL21T0HCLR
4501 (4492.31min - 4501.34max) MB/s +86%
Asus ZenBook S13 OLED UX5304
Samsung PM9A1 MZVL21T0HCLR
4001 (3943.69min - 4000.53max) MB/s +66%
Dell XPS 13 Plus 9320 i7-1280P OLED
WDC PC SN810 512GB
3747 (3711.67min - 3747.4max) MB/s +55%
HP Dragonfly G4
Micron 3400 MTFDKBA512TFH 512GB
3312 (3304.27min - 3312.03max) MB/s +37%
Lenovo ThinkBook 13x G4 21KR0008GE
Samsung PM9C1a MZAL8512HDLU
2565 (1389.73min - 2564.61max) MB/s +6%
Dell XPS 13 9350
Micron 2550 512GB
2416 (2299.74min - 2415.91max) MB/s
seq write
MSI Prestige 13 AI Evo
Samsung PM9A1 MZVL21T0HCLR
4460 (4450.9min - 4460.43max) MB/s +80%
Dell XPS 13 Plus 9320 i7-1280P OLED
WDC PC SN810 512GB
3470 (3416.05min - 3470.37max) MB/s +40%
HP Dragonfly G4
Micron 3400 MTFDKBA512TFH 512GB
3342 (3270.72min - 3341.6max) MB/s +35%
Asus ZenBook S13 OLED UX5304
Samsung PM9A1 MZVL21T0HCLR
3321 (3143.21min - 3321.26max) MB/s +34%
Lenovo ThinkBook 13x G4 21KR0008GE
Samsung PM9C1a MZAL8512HDLU
2983 (2793.48min - 2982.57max) MB/s +20%
Dell XPS 13 9350
Micron 2550 512GB
2477 (2281.75min - 2476.53max) MB/s
seq q8 t1 read
MSI Prestige 13 AI Evo
Samsung PM9A1 MZVL21T0HCLR
7100 (6554.33min - 7100.12max) MB/s +40%
Asus ZenBook S13 OLED UX5304
Samsung PM9A1 MZVL21T0HCLR
7036 (6223.64min - 7035.55max) MB/s +39%
Dell XPS 13 Plus 9320 i7-1280P OLED
WDC PC SN810 512GB
6656 (5809.03min - 6655.73max) MB/s +32%
HP Dragonfly G4
Micron 3400 MTFDKBA512TFH 512GB
6628 (6115.78min - 6627.63max) MB/s +31%
Lenovo ThinkBook 13x G4 21KR0008GE
Samsung PM9C1a MZAL8512HDLU
6068 (5239.11min - 6068.32max) MB/s +20%
Dell XPS 13 9350
Micron 2550 512GB
5057 (4337.25min - 5057.07max) MB/s
seq q8 t1 write
MSI Prestige 13 AI Evo
Samsung PM9A1 MZVL21T0HCLR
5281 (5261.13min - 5280.63max) MB/s +30%
Asus ZenBook S13 OLED UX5304
Samsung PM9A1 MZVL21T0HCLR
5179 (4831.64min - 5178.79max) MB/s +27%
Lenovo ThinkBook 13x G4 21KR0008GE
Samsung PM9C1a MZAL8512HDLU
4715 (4689.23min - 4715.24max) MB/s +16%
Dell XPS 13 Plus 9320 i7-1280P OLED
WDC PC SN810 512GB
4468 (4431.23min - 4467.85max) MB/s +10%
Dell XPS 13 9350
Micron 2550 512GB
4062 (3975.8min - 4061.61max) MB/s
HP Dragonfly G4
Micron 3400 MTFDKBA512TFH 512GB
3965 (3820.5min - 3965.05max) MB/s -2%
4k q1 t1 read
MSI Prestige 13 AI Evo
Samsung PM9A1 MZVL21T0HCLR
85.9 (85.31min - 85.9max) MB/s +61%
Asus ZenBook S13 OLED UX5304
Samsung PM9A1 MZVL21T0HCLR
83.3 (77.84min - 83.26max) MB/s +57%
Dell XPS 13 Plus 9320 i7-1280P OLED
WDC PC SN810 512GB
67.5 (65.71min - 67.48max) MB/s +27%
HP Dragonfly G4
Micron 3400 MTFDKBA512TFH 512GB
67.2 (66.32min - 67.16max) MB/s +26%
Lenovo ThinkBook 13x G4 21KR0008GE
Samsung PM9C1a MZAL8512HDLU
63 (61.94min - 62.98max) MB/s +18%
Dell XPS 13 9350
Micron 2550 512GB
53.2 (50.58min - 53.24max) MB/s
4k q1 t1 write
MSI Prestige 13 AI Evo
Samsung PM9A1 MZVL21T0HCLR
204 (200.8min - 203.91max) MB/s +47%
Dell XPS 13 Plus 9320 i7-1280P OLED
WDC PC SN810 512GB
170.9 (165.47min - 170.92max) MB/s +23%
Asus ZenBook S13 OLED UX5304
Samsung PM9A1 MZVL21T0HCLR
140.8 (131.23min - 140.77max) MB/s +1%
Dell XPS 13 9350
Micron 2550 512GB
139.2 (136.33min - 139.15max) MB/s
HP Dragonfly G4
Micron 3400 MTFDKBA512TFH 512GB
138.9 (137.35min - 138.92max) MB/s 0%
Lenovo ThinkBook 13x G4 21KR0008GE
Samsung PM9C1a MZAL8512HDLU
119.2 (114.62min - 119.17max) MB/s -14%
4k q32 t16 read
MSI Prestige 13 AI Evo
Samsung PM9A1 MZVL21T0HCLR
3215 (2358.16min - 3214.63max) MB/s +402%
Lenovo ThinkBook 13x G4 21KR0008GE
Samsung PM9C1a MZAL8512HDLU
703 (627.88min - 703.14max) MB/s +10%
HP Dragonfly G4
Micron 3400 MTFDKBA512TFH 512GB
690 (550.07min - 689.62max) MB/s +8%
Dell XPS 13 9350
Micron 2550 512GB
640 (630.5min - 640.27max) MB/s
Dell XPS 13 Plus 9320 i7-1280P OLED
WDC PC SN810 512GB
540 (532.43min - 540.23max) MB/s -16%
Asus ZenBook S13 OLED UX5304
Samsung PM9A1 MZVL21T0HCLR
494 (392.19min - 494.04max) MB/s -23%
4k q32 t16 write
MSI Prestige 13 AI Evo
Samsung PM9A1 MZVL21T0HCLR
2288 (1575.7min - 2287.8max) MB/s +512%
Dell XPS 13 Plus 9320 i7-1280P OLED
WDC PC SN810 512GB
416 (398.57min - 416.29max) MB/s +11%
Lenovo ThinkBook 13x G4 21KR0008GE
Samsung PM9C1a MZAL8512HDLU
397 (338.3min - 396.83max) MB/s +6%
HP Dragonfly G4
Micron 3400 MTFDKBA512TFH 512GB
389 (345.44min - 388.55max) MB/s +4%
Dell XPS 13 9350
Micron 2550 512GB
374 (359.04min - 373.65max) MB/s
Asus ZenBook S13 OLED UX5304
Samsung PM9A1 MZVL21T0HCLR
372 (323.75min - 372.35max) MB/s -1%
AS SSD
Score Total
MSI Prestige 13 AI Evo
Samsung PM9A1 MZVL21T0HCLR
5770 Points +82%
Dell XPS 13 Plus 9320 i7-1280P OLED
WDC PC SN810 512GB
5114 Points +61%
Lenovo ThinkBook 13x G4 21KR0008GE
Samsung PM9C1a MZAL8512HDLU
4180 Points +32%
HP Dragonfly G4
Micron 3400 MTFDKBA512TFH 512GB
4171 Points +31%
Asus ZenBook S13 OLED UX5304
Samsung PM9A1 MZVL21T0HCLR
4048 Points +27%
Dell XPS 13 9350
Micron 2550 512GB
3176 Points
Score Read
MSI Prestige 13 AI Evo
Samsung PM9A1 MZVL21T0HCLR
1756 Points +60%
Dell XPS 13 Plus 9320 i7-1280P OLED
WDC PC SN810 512GB
1451 Points +32%
Lenovo ThinkBook 13x G4 21KR0008GE
Samsung PM9C1a MZAL8512HDLU
1211 Points +10%
HP Dragonfly G4
Micron 3400 MTFDKBA512TFH 512GB
1169 Points +7%
Dell XPS 13 9350
Micron 2550 512GB
1096 Points
Asus ZenBook S13 OLED UX5304
Samsung PM9A1 MZVL21T0HCLR
1040 Points -5%
Score Write
MSI Prestige 13 AI Evo
Samsung PM9A1 MZVL21T0HCLR
3156 Points +101%
Dell XPS 13 Plus 9320 i7-1280P OLED
WDC PC SN810 512GB
3046 Points +94%
Asus ZenBook S13 OLED UX5304
Samsung PM9A1 MZVL21T0HCLR
2568 Points +63%
HP Dragonfly G4
Micron 3400 MTFDKBA512TFH 512GB
2506 Points +59%
Lenovo ThinkBook 13x G4 21KR0008GE
Samsung PM9C1a MZAL8512HDLU
2426 Points +54%
Dell XPS 13 9350
Micron 2550 512GB
1572 Points
Seq Read
MSI Prestige 13 AI Evo
Samsung PM9A1 MZVL21T0HCLR
5470 MB/s +39%
Dell XPS 13 Plus 9320 i7-1280P OLED
WDC PC SN810 512GB
5411.56 MB/s +38%
Asus ZenBook S13 OLED UX5304
Samsung PM9A1 MZVL21T0HCLR
5107 MB/s +30%
HP Dragonfly G4
Micron 3400 MTFDKBA512TFH 512GB
4510.61 MB/s +15%
Lenovo ThinkBook 13x G4 21KR0008GE
Samsung PM9C1a MZAL8512HDLU
4488 MB/s +14%
Dell XPS 13 9350
Micron 2550 512GB
3933.86 MB/s
Seq Write
MSI Prestige 13 AI Evo
Samsung PM9A1 MZVL21T0HCLR
4344 MB/s +67%
Asus ZenBook S13 OLED UX5304
Samsung PM9A1 MZVL21T0HCLR
2849 MB/s +9%
Dell XPS 13 9350
Micron 2550 512GB
2608.98 MB/s
Lenovo ThinkBook 13x G4 21KR0008GE
Samsung PM9C1a MZAL8512HDLU
2595 MB/s -1%
Dell XPS 13 Plus 9320 i7-1280P OLED
WDC PC SN810 512GB
2530.01 MB/s -3%
HP Dragonfly G4
Micron 3400 MTFDKBA512TFH 512GB
2127.08 MB/s -18%
4K Read
MSI Prestige 13 AI Evo
Samsung PM9A1 MZVL21T0HCLR
72 MB/s +39%
Dell XPS 13 Plus 9320 i7-1280P OLED
WDC PC SN810 512GB
70.31 MB/s +35%
Lenovo ThinkBook 13x G4 21KR0008GE
Samsung PM9C1a MZAL8512HDLU
65.3 MB/s +26%
Asus ZenBook S13 OLED UX5304
Samsung PM9A1 MZVL21T0HCLR
64.1 MB/s +24%
HP Dragonfly G4
Micron 3400 MTFDKBA512TFH 512GB
61.53 MB/s +19%
Dell XPS 13 9350
Micron 2550 512GB
51.9 MB/s
4K Write
Dell XPS 13 Plus 9320 i7-1280P OLED
WDC PC SN810 512GB
232.86 MB/s +68%
Asus ZenBook S13 OLED UX5304
Samsung PM9A1 MZVL21T0HCLR
198.7 MB/s +44%
HP Dragonfly G4
Micron 3400 MTFDKBA512TFH 512GB
185.58 MB/s +34%
MSI Prestige 13 AI Evo
Samsung PM9A1 MZVL21T0HCLR
179.9 MB/s +30%
Lenovo ThinkBook 13x G4 21KR0008GE
Samsung PM9C1a MZAL8512HDLU
156.9 MB/s +13%
Dell XPS 13 9350
Micron 2550 512GB
138.37 MB/s
4K-64 Read
MSI Prestige 13 AI Evo
Samsung PM9A1 MZVL21T0HCLR
1137 MB/s +75%
Dell XPS 13 Plus 9320 i7-1280P OLED
WDC PC SN810 512GB
839.87 MB/s +29%
Lenovo ThinkBook 13x G4 21KR0008GE
Samsung PM9C1a MZAL8512HDLU
697 MB/s +7%
HP Dragonfly G4
Micron 3400 MTFDKBA512TFH 512GB
656.17 MB/s +1%
Dell XPS 13 9350
Micron 2550 512GB
650.78 MB/s
Asus ZenBook S13 OLED UX5304
Samsung PM9A1 MZVL21T0HCLR
466 MB/s -28%
4K-64 Write
Dell XPS 13 Plus 9320 i7-1280P OLED
WDC PC SN810 512GB
2560.31 MB/s +118%
MSI Prestige 13 AI Evo
Samsung PM9A1 MZVL21T0HCLR
2542 MB/s +117%
HP Dragonfly G4
Micron 3400 MTFDKBA512TFH 512GB
2107.89 MB/s +80%
Asus ZenBook S13 OLED UX5304
Samsung PM9A1 MZVL21T0HCLR
2084 MB/s +78%
Lenovo ThinkBook 13x G4 21KR0008GE
Samsung PM9C1a MZAL8512HDLU
2010 MB/s +71%
Dell XPS 13 9350
Micron 2550 512GB
1172.49 MB/s
Access Time Read
Dell XPS 13 9350
Micron 2550 512GB
0.091 ms *
Dell XPS 13 Plus 9320 i7-1280P OLED
WDC PC SN810 512GB
0.082 ms * +10%
HP Dragonfly G4
Micron 3400 MTFDKBA512TFH 512GB
0.055 ms * +40%
Lenovo ThinkBook 13x G4 21KR0008GE
Samsung PM9C1a MZAL8512HDLU
0.036 ms * +60%
MSI Prestige 13 AI Evo
Samsung PM9A1 MZVL21T0HCLR
0.033 ms * +64%
Asus ZenBook S13 OLED UX5304
Samsung PM9A1 MZVL21T0HCLR
0.025 ms * +73%
Access Time Write
Dell XPS 13 9350
Micron 2550 512GB
0.076 ms *
HP Dragonfly G4
Micron 3400 MTFDKBA512TFH 512GB
0.067 ms * +12%
Dell XPS 13 Plus 9320 i7-1280P OLED
WDC PC SN810 512GB
0.049 ms * +36%
Asus ZenBook S13 OLED UX5304
Samsung PM9A1 MZVL21T0HCLR
0.025 ms * +67%
MSI Prestige 13 AI Evo
Samsung PM9A1 MZVL21T0HCLR
0.025 ms * +67%
Lenovo ThinkBook 13x G4 21KR0008GE
Samsung PM9C1a MZAL8512HDLU
0.023 ms * +70%

* ... kleinere Werte sind besser

Dauerleistung Lesen: DiskSpd Read Loop, Queue Depth 8

02605207801040130015601820208023402600286031203380364039004160442046804940Tooltip
Dell XPS 13 9350 Micron 2550 512GB; diskspd 2.0.17 f: Ø5043 (4553.97-5060.22)
Dell XPS 13 9345  ; diskspd 2.0.17 f: Ø5089 (4590.46-5102.16)

GPU Performance

Die 3DMark-Ergebnisse unseres Arc Graphics 140V sind besonders beeindruckend für ein Subnotebook. Unser Gerät übertrifft die meisten, wenn nicht sogar alle anderen Subnotebooks der U-Serie, die derzeit mit integrierter Grafik ausgestattet sind, einschließlich derjenigen mit der konkurrierenden Radeon 780M GPU. Bemerkenswert ist, dass die Ergebnisse zwischen 20 und 40 Prozent höher ausfallen als die des Arc 8 im knapp 6 Monate alten XPS 13 9340. Dies ist besonders überraschend, wenn man bedenkt, dass die XPS 13-Serie in der Vergangenheit in Bezug auf die Grafikleistung eher schwach abgeschnitten hat.

EnergieprofileGrafikleistungCPU-LeistungGesamtwert
Performance-Modus9492222573474
Balanced-Modus9555 (-0%)19598 (-12%)2932 (-16%)
Battery Power9200 (-3%)17818 (-20%)2754 (-21%)

Wenn man vom Performance-Modus in den Balanced-Modus oder in den Battery Power wechseln, wirkt sich dies stärker auf die CPU-Leistung als auf die Grafikleistung aus, wie unsere Fire-Strike-Ergebnistabelle oben zeigt. Daher sollte man den Performance-Modus verwenden, wenn anspruchsvolle Anwendungen ausgeführt werden, um das Beste aus dem System herauszuholen.

3DMark 11
3DMark 11
Fire Strike
Fire Strike
Steel Nomad
Steel Nomad
Time Spy
Time Spy
3DMark Performance Rating - Percent
Dell XPS 13 9350
Intel Arc Graphics 140V, Intel Core Ultra 7 256V
96.4 pt
Durchschnittliche Intel Arc Graphics 140V
 
91.6 pt
HP EliteBook x360 1040 G11
Intel Arc 8-Core iGPU, Intel Core Ultra 7 165H
91.5 pt
Asus Zenbook S 14 UX5406
Intel Arc Graphics 140V, Intel Core Ultra 7 258V
90.7 pt
Lenovo ThinkBook 13x G4 21KR0008GE
Intel Arc 7-Core iGPU, Intel Core Ultra 5 125H
85.2 pt
Dell XPS 13 9340 Core Ultra 7
Intel Arc 8-Core iGPU, Intel Core Ultra 7 155H
77.8 pt
Framework Laptop 13.5 Ryzen 7 7840U
AMD Radeon 780M, AMD Ryzen 7 7840U
75.3 pt
Asus Zenbook S 13 OLED
AMD Radeon 680M, AMD Ryzen 7 6800U
64.4 pt
MSI Prestige 13 AI Evo
Intel Arc 8-Core iGPU, Intel Core Ultra 7 155H
55.6 pt
Dell XPS 13 Plus 9320 Core i7-1360P
Intel Iris Xe Graphics G7 96EUs, Intel Core i7-1360P
51.9 pt
Dell XPS 13 Plus 9320 i7-1280P OLED
Intel Iris Xe Graphics G7 96EUs, Intel Core i7-1280P
50.4 pt
Dell XPS 13 Plus 9320 4K
Intel Iris Xe Graphics G7 96EUs, Intel Core i7-1260P
50.3 pt
HP Dragonfly G4
Intel Iris Xe Graphics G7 96EUs, Intel Core i7-1365U
46.3 pt
Asus ZenBook S13 OLED UX5304
Intel Iris Xe Graphics G7 96EUs, Intel Core i7-1355U
45 pt
Lenovo Yoga 6 13 83B2001SGE
AMD Radeon RX Vega 8 (Ryzen 4000/5000), AMD Ryzen 7 7730U
38.4 pt
Dell XPS 13 Plus 9320 i5-1240p
Intel Iris Xe Graphics G7 80EUs, Intel Core i5-1240P
35.3 pt
Lenovo ThinkBook 13s G3 20YA0005GE
AMD Radeon RX Vega 8 (Ryzen 4000/5000), AMD Ryzen 7 5800U
34.6 pt
Dell XPS 13 9315, i5-1230U
Intel Iris Xe Graphics G7 80EUs, Intel Core i5-1230U
28.1 pt
Dell XPS 13 9315 2-in-1 Core i5-1230U
Intel Iris Xe Graphics G7 80EUs, Intel Core i5-1230U
28 pt
3DMark 11 - 1280x720 Performance GPU
HP EliteBook x360 1040 G11
Intel Arc 8-Core iGPU, Intel Core Ultra 7 165H
12457 Points +17%
Framework Laptop 13.5 Ryzen 7 7840U
AMD Radeon 780M, AMD Ryzen 7 7840U
11695 Points +10%
Lenovo ThinkBook 13x G4 21KR0008GE
Intel Arc 7-Core iGPU, Intel Core Ultra 5 125H
11467 Points +8%
Durchschnittliche Intel Arc Graphics 140V
  (10599 - 11102, n=5)
10752 Points +1%
Asus Zenbook S 14 UX5406
Intel Arc Graphics 140V, Intel Core Ultra 7 258V
10722 Points +1%
Dell XPS 13 9350
Intel Arc Graphics 140V, Intel Core Ultra 7 256V
10651 Points
Dell XPS 13 9340 Core Ultra 7
Intel Arc 8-Core iGPU, Intel Core Ultra 7 155H
10624 Points 0%
Asus Zenbook S 13 OLED
AMD Radeon 680M, AMD Ryzen 7 6800U
9095 Points -15%
MSI Prestige 13 AI Evo
Intel Arc 8-Core iGPU, Intel Core Ultra 7 155H
8064 Points -24%
Dell XPS 13 Plus 9320 i7-1280P OLED
Intel Iris Xe Graphics G7 96EUs, Intel Core i7-1280P
7016 Points -34%
Dell XPS 13 Plus 9320 4K
Intel Iris Xe Graphics G7 96EUs, Intel Core i7-1260P
6956 Points -35%
Dell XPS 13 Plus 9320 Core i7-1360P
Intel Iris Xe Graphics G7 96EUs, Intel Core i7-1360P
6815 Points -36%
HP Dragonfly G4
Intel Iris Xe Graphics G7 96EUs, Intel Core i7-1365U
6440 Points -40%
Asus ZenBook S13 OLED UX5304
Intel Iris Xe Graphics G7 96EUs, Intel Core i7-1355U
6334 Points -41%
Lenovo ThinkBook 13s G3 20YA0005GE
AMD Radeon RX Vega 8 (Ryzen 4000/5000), AMD Ryzen 7 5800U
6174 Points -42%
Lenovo Yoga 6 13 83B2001SGE
AMD Radeon RX Vega 8 (Ryzen 4000/5000), AMD Ryzen 7 7730U
5656 Points -47%
Dell XPS 13 Plus 9320 i5-1240p
Intel Iris Xe Graphics G7 80EUs, Intel Core i5-1240P
5104 Points -52%
Dell XPS 13 9315, i5-1230U
Intel Iris Xe Graphics G7 80EUs, Intel Core i5-1230U
3847 Points -64%
Dell XPS 13 9315 2-in-1 Core i5-1230U
Intel Iris Xe Graphics G7 80EUs, Intel Core i5-1230U
3844 Points -64%
3DMark
1920x1080 Fire Strike Graphics
Dell XPS 13 9350
Intel Arc Graphics 140V, Intel Core Ultra 7 256V
9492 Points
Asus Zenbook S 14 UX5406
Intel Arc Graphics 140V, Intel Core Ultra 7 258V
9414 Points -1%
HP EliteBook x360 1040 G11
Intel Arc 8-Core iGPU, Intel Core Ultra 7 165H
8961 Points -6%
Durchschnittliche Intel Arc Graphics 140V
  (6790 - 9831, n=6)
8922 Points -6%
Lenovo ThinkBook 13x G4 21KR0008GE
Intel Arc 7-Core iGPU, Intel Core Ultra 5 125H
8503 Points -10%
Dell XPS 13 9340 Core Ultra 7
Intel Arc 8-Core iGPU, Intel Core Ultra 7 155H
7946 Points -16%
Framework Laptop 13.5 Ryzen 7 7840U
AMD Radeon 780M, AMD Ryzen 7 7840U
7455 Points -21%
Asus Zenbook S 13 OLED
AMD Radeon 680M, AMD Ryzen 7 6800U
6683 Points -30%
Dell XPS 13 Plus 9320 Core i7-1360P
Intel Iris Xe Graphics G7 96EUs, Intel Core i7-1360P
5981 Points -37%
MSI Prestige 13 AI Evo
Intel Arc 8-Core iGPU, Intel Core Ultra 7 155H
5568 Points -41%
Dell XPS 13 Plus 9320 4K
Intel Iris Xe Graphics G7 96EUs, Intel Core i7-1260P
5421 Points -43%
Dell XPS 13 Plus 9320 i7-1280P OLED
Intel Iris Xe Graphics G7 96EUs, Intel Core i7-1280P
5393 Points -43%
HP Dragonfly G4
Intel Iris Xe Graphics G7 96EUs, Intel Core i7-1365U
5175 Points -45%
Asus ZenBook S13 OLED UX5304
Intel Iris Xe Graphics G7 96EUs, Intel Core i7-1355U
5101 Points -46%
Lenovo Yoga 6 13 83B2001SGE
AMD Radeon RX Vega 8 (Ryzen 4000/5000), AMD Ryzen 7 7730U
4147 Points -56%
Dell XPS 13 Plus 9320 i5-1240p
Intel Iris Xe Graphics G7 80EUs, Intel Core i5-1240P
4086 Points -57%
Lenovo ThinkBook 13s G3 20YA0005GE
AMD Radeon RX Vega 8 (Ryzen 4000/5000), AMD Ryzen 7 5800U
3335 Points -65%
Dell XPS 13 9315, i5-1230U
Intel Iris Xe Graphics G7 80EUs, Intel Core i5-1230U
3247 Points -66%
Dell XPS 13 9315 2-in-1 Core i5-1230U
Intel Iris Xe Graphics G7 80EUs, Intel Core i5-1230U
3227 Points -66%
2560x1440 Time Spy Graphics
Dell XPS 13 9350
Intel Arc Graphics 140V, Intel Core Ultra 7 256V
4115 Points
Durchschnittliche Intel Arc Graphics 140V
  (2955 - 4227, n=9)
3803 Points -8%
Asus Zenbook S 14 UX5406
Intel Arc Graphics 140V, Intel Core Ultra 7 258V
3669 Points -11%
HP EliteBook x360 1040 G11
Intel Arc 8-Core iGPU, Intel Core Ultra 7 165H
3458 Points -16%
Lenovo ThinkBook 13x G4 21KR0008GE
Intel Arc 7-Core iGPU, Intel Core Ultra 5 125H
3248 Points -21%
Dell XPS 13 9340 Core Ultra 7
Intel Arc 8-Core iGPU, Intel Core Ultra 7 155H
2911 Points -29%
Framework Laptop 13.5 Ryzen 7 7840U
AMD Radeon 780M, AMD Ryzen 7 7840U
2575 Points -37%
Asus Zenbook S 13 OLED
AMD Radeon 680M, AMD Ryzen 7 6800U
2287 Points -44%
MSI Prestige 13 AI Evo
Intel Arc 8-Core iGPU, Intel Core Ultra 7 155H
2018 Points -51%
Dell XPS 13 Plus 9320 Core i7-1360P
Intel Iris Xe Graphics G7 96EUs, Intel Core i7-1360P
1791 Points -56%
Dell XPS 13 Plus 9320 i7-1280P OLED
Intel Iris Xe Graphics G7 96EUs, Intel Core i7-1280P
1760 Points -57%
Dell XPS 13 Plus 9320 4K
Intel Iris Xe Graphics G7 96EUs, Intel Core i7-1260P
1758 Points -57%
HP Dragonfly G4
Intel Iris Xe Graphics G7 96EUs, Intel Core i7-1365U
1579 Points -62%
Asus ZenBook S13 OLED UX5304
Intel Iris Xe Graphics G7 96EUs, Intel Core i7-1355U
1505 Points -63%
Lenovo Yoga 6 13 83B2001SGE
AMD Radeon RX Vega 8 (Ryzen 4000/5000), AMD Ryzen 7 7730U
1283 Points -69%
Dell XPS 13 Plus 9320 i5-1240p
Intel Iris Xe Graphics G7 80EUs, Intel Core i5-1240P
1134 Points -72%
Lenovo ThinkBook 13s G3 20YA0005GE
AMD Radeon RX Vega 8 (Ryzen 4000/5000), AMD Ryzen 7 5800U
1066 Points -74%
Dell XPS 13 9315, i5-1230U
Intel Iris Xe Graphics G7 80EUs, Intel Core i5-1230U
945 Points -77%
Dell XPS 13 9315 2-in-1 Core i5-1230U
Intel Iris Xe Graphics G7 80EUs, Intel Core i5-1230U
936 Points -77%
2560x1440 Time Spy Score
Dell XPS 13 9350
Intel Arc Graphics 140V, Intel Core Ultra 7 256V
4354 Points
Durchschnittliche Intel Arc Graphics 140V
  (3336 - 4502, n=6)
4083 Points -6%
Asus Zenbook S 14 UX5406
Intel Arc Graphics 140V, Intel Core Ultra 7 258V
3857 Points -11%
HP EliteBook x360 1040 G11
Intel Arc 8-Core iGPU, Intel Core Ultra 7 165H
3807 Points -13%
Lenovo ThinkBook 13x G4 21KR0008GE
Intel Arc 7-Core iGPU, Intel Core Ultra 5 125H
3498 Points -20%
Dell XPS 13 9340 Core Ultra 7
Intel Arc 8-Core iGPU, Intel Core Ultra 7 155H
3106 Points -29%
Framework Laptop 13.5 Ryzen 7 7840U
AMD Radeon 780M, AMD Ryzen 7 7840U
2891 Points -34%
Asus Zenbook S 13 OLED
AMD Radeon 680M, AMD Ryzen 7 6800U
2548 Points -41%
MSI Prestige 13 AI Evo
Intel Arc 8-Core iGPU, Intel Core Ultra 7 155H
2178 Points -50%
Dell XPS 13 Plus 9320 Core i7-1360P
Intel Iris Xe Graphics G7 96EUs, Intel Core i7-1360P
2021 Points -54%
Dell XPS 13 Plus 9320 i7-1280P OLED
Intel Iris Xe Graphics G7 96EUs, Intel Core i7-1280P
1986 Points -54%
Dell XPS 13 Plus 9320 4K
Intel Iris Xe Graphics G7 96EUs, Intel Core i7-1260P
1974 Points -55%
HP Dragonfly G4
Intel Iris Xe Graphics G7 96EUs, Intel Core i7-1365U
1768 Points -59%
Asus ZenBook S13 OLED UX5304
Intel Iris Xe Graphics G7 96EUs, Intel Core i7-1355U
1683 Points -61%
Lenovo Yoga 6 13 83B2001SGE
AMD Radeon RX Vega 8 (Ryzen 4000/5000), AMD Ryzen 7 7730U
1456 Points -67%
Dell XPS 13 Plus 9320 i5-1240p
Intel Iris Xe Graphics G7 80EUs, Intel Core i5-1240P
1290 Points -70%
Lenovo ThinkBook 13s G3 20YA0005GE
AMD Radeon RX Vega 8 (Ryzen 4000/5000), AMD Ryzen 7 5800U
1212 Points -72%
Dell XPS 13 9315 2-in-1 Core i5-1230U
Intel Iris Xe Graphics G7 80EUs, Intel Core i5-1230U
1055 Points -76%
Dell XPS 13 9315, i5-1230U
Intel Iris Xe Graphics G7 80EUs, Intel Core i5-1230U
1053 Points -76%
3DMark 11 Performance
11161 Punkte
3DMark Cloud Gate Standard Score
33853 Punkte
3DMark Fire Strike Score
8730 Punkte
3DMark Time Spy Score
4354 Punkte
3DMark Steel Nomad Score
580 Punkte
Hilfe
Blender
v3.3 Classroom HIP/AMD
Lenovo Yoga 6 13 83B2001SGE
AMD Radeon RX Vega 8 (Ryzen 4000/5000), AMD Ryzen 7 7730U
634 Seconds *
v3.3 Classroom CPU
Dell XPS 13 9315 2-in-1 Core i5-1230U
Intel Iris Xe Graphics G7 80EUs, Intel Core i5-1230U
1023 Seconds * -76%
Asus ZenBook S13 OLED UX5304
Intel Iris Xe Graphics G7 96EUs, Intel Core i7-1355U
839 Seconds * -45%
HP Dragonfly G4
Intel Iris Xe Graphics G7 96EUs, Intel Core i7-1365U
796 Seconds * -37%
Asus Zenbook S 14 UX5406
Intel Arc Graphics 140V, Intel Core Ultra 7 258V
700 Seconds * -21%
Lenovo ThinkBook 13x G4 21KR0008GE
Intel Arc 7-Core iGPU, Intel Core Ultra 5 125H
667 Seconds * -15%
Lenovo Yoga 6 13 83B2001SGE
AMD Radeon RX Vega 8 (Ryzen 4000/5000), AMD Ryzen 7 7730U
648 Seconds * -12%
MSI Prestige 13 AI Evo
Intel Arc 8-Core iGPU, Intel Core Ultra 7 155H
637 Seconds * -10%
Dell XPS 13 Plus 9320 4K
Intel Iris Xe Graphics G7 96EUs, Intel Core i7-1260P
598 Seconds * -3%
Durchschnittliche Intel Arc Graphics 140V
  (533 - 700, n=4)
595 Seconds * -3%
Dell XPS 13 9350
Intel Arc Graphics 140V, Intel Core Ultra 7 256V
580 Seconds *
Dell XPS 13 Plus 9320 i7-1280P OLED
Intel Iris Xe Graphics G7 96EUs, Intel Core i7-1280P
537 Seconds * +7%
Dell XPS 13 Plus 9320 Core i7-1360P
Intel Iris Xe Graphics G7 96EUs, Intel Core i7-1360P
531 Seconds * +8%
Dell XPS 13 9340 Core Ultra 7
Intel Arc 8-Core iGPU, Intel Core Ultra 7 155H
481 Seconds * +17%
HP EliteBook x360 1040 G11
Intel Arc 8-Core iGPU, Intel Core Ultra 7 165H
406 Seconds * +30%
Framework Laptop 13.5 Ryzen 7 7840U
AMD Radeon 780M, AMD Ryzen 7 7840U
371 Seconds * +36%
v3.3 Classroom oneAPI/Intel
HP EliteBook x360 1040 G11
Intel Arc 8-Core iGPU, Intel Core Ultra 7 165H
213 Seconds * -1%
Dell XPS 13 9350
Intel Arc Graphics 140V, Intel Core Ultra 7 256V
211 Seconds *
Durchschnittliche Intel Arc Graphics 140V
  (210 - 211, n=2)
211 Seconds * -0%

* ... kleinere Werte sind besser

Gaming Performance

Die Leistung in Spielen hat sich gegenüber dem XPS 13 9340 und seiner Core Ultra H-Serie CPU mit Arc 8 Grafik mehr als erwartet verbessert. In diesem Fall würde unser Arc 140V das XPS 13 9340 fast durchgängig um bis zu 10 Prozent oder bis zu 85 Prozent übertreffen, je nach Titel und Einstellungen. Höhere Deltas lassen sich beobachten, wenn Spiele wie GTA V oder F1 22 auf höheren Einstellungen laufen, während kleinere Deltas bei Titeln wie DOTA 2 Reborn oder Baldur’s Gate 3 sichtbar sind. Die durchschnittlichen Ergebnisse sind vergleichbar mit denen der konkurrierenden Radeon 780M und stellen einen großen Fortschritt für alle dar, die von einem älteren Iris Xe 96 EUs Laptop aufrüsten.

Allerdings laufen nicht alle Spiele perfekt. Unser System stürzte immer ab, wenn wir Tiny Tina’s Wonderlands oder F1 22 mit bestimmten grafischen Einstellungen spielten.

Performance Rating - Percent
Dell XPS 13 9350
Intel Core Ultra 7 256V, Intel Arc Graphics 140V
96.7 pt
Lenovo ThinkBook 13x G4 21KR0008GE -1!
Intel Core Ultra 5 125H, Intel Arc 7-Core iGPU
77.1 pt
Dell XPS 13 Plus 9320 i7-1280P OLED -1!
Intel Core i7-1280P, Intel Iris Xe Graphics G7 96EUs
64.9 pt
MSI Prestige 13 AI Evo -1!
Intel Core Ultra 7 155H, Intel Arc 8-Core iGPU
59.9 pt
HP Dragonfly G4 -1!
Intel Core i7-1365U, Intel Iris Xe Graphics G7 96EUs
55.5 pt
Asus ZenBook S13 OLED UX5304 -1!
Intel Core i7-1355U, Intel Iris Xe Graphics G7 96EUs
52.1 pt
Baldur's Gate 3 - 1920x1080 Ultra Preset
Dell XPS 13 9350
Intel Core Ultra 7 256V, Intel Arc Graphics 140V
25.7 fps
GTA V - 1920x1080 Highest Settings possible AA:4xMSAA + FX AF:16x
Dell XPS 13 9350
Intel Core Ultra 7 256V, Intel Arc Graphics 140V
25.6 (2.46min, 19.6P1) fps
Lenovo ThinkBook 13x G4 21KR0008GE
Intel Core Ultra 5 125H, Intel Arc 7-Core iGPU
14.8 (1.279min, 5.78P1) fps -42%
Dell XPS 13 Plus 9320 i7-1280P OLED
Intel Core i7-1280P, Intel Iris Xe Graphics G7 96EUs
11.5 (4.27min, 7.69P1) fps -55%
HP Dragonfly G4
Intel Core i7-1365U, Intel Iris Xe Graphics G7 96EUs
10.1 (4.85min, 6.29P1) fps -61%
MSI Prestige 13 AI Evo
Intel Core Ultra 7 155H, Intel Arc 8-Core iGPU
9.97 (1.989min, 4.98P1) fps -61%
Asus ZenBook S13 OLED UX5304
Intel Core i7-1355U, Intel Iris Xe Graphics G7 96EUs
9.42 (3.26min, 5.92P1) fps -63%
Final Fantasy XV Benchmark - 1920x1080 High Quality
Dell XPS 13 9350
Intel Core Ultra 7 256V, Intel Arc Graphics 140V
31.5 fps
Lenovo ThinkBook 13x G4 21KR0008GE
Intel Core Ultra 5 125H, Intel Arc 7-Core iGPU
25.3 fps -20%
Dell XPS 13 Plus 9320 i7-1280P OLED
Intel Core i7-1280P, Intel Iris Xe Graphics G7 96EUs
17.6 fps -44%
MSI Prestige 13 AI Evo
Intel Core Ultra 7 155H, Intel Arc 8-Core iGPU
17 fps -46%
HP Dragonfly G4
Intel Core i7-1365U, Intel Iris Xe Graphics G7 96EUs
16.4 fps -48%
Asus ZenBook S13 OLED UX5304
Intel Core i7-1355U, Intel Iris Xe Graphics G7 96EUs
14.9 fps -53%
Strange Brigade - 1920x1080 ultra AA:ultra AF:16
Dell XPS 13 9350
Intel Core Ultra 7 256V, Intel Arc Graphics 140V
58 (24.7min, 30.7P1) fps
Lenovo ThinkBook 13x G4 21KR0008GE
Intel Core Ultra 5 125H, Intel Arc 7-Core iGPU
44 fps -24%
MSI Prestige 13 AI Evo
Intel Core Ultra 7 155H, Intel Arc 8-Core iGPU
32 fps -45%
Dell XPS 13 Plus 9320 i7-1280P OLED
Intel Core i7-1280P, Intel Iris Xe Graphics G7 96EUs
29.6 (9min, 10.7P1) fps -49%
HP Dragonfly G4
Intel Core i7-1365U, Intel Iris Xe Graphics G7 96EUs
24.7 (5.3min, 6.86P1) fps -57%
Asus ZenBook S13 OLED UX5304
Intel Core i7-1355U, Intel Iris Xe Graphics G7 96EUs
23.6 (5min, 6.37P1) fps -59%
Dota 2 Reborn - 1920x1080 ultra (3/3) best looking
Dell XPS 13 9350
Intel Core Ultra 7 256V, Intel Arc Graphics 140V
80.7 (52.1min) fps
Lenovo ThinkBook 13x G4 21KR0008GE
Intel Core Ultra 5 125H, Intel Arc 7-Core iGPU
64.9 (45.5min) fps -20%
Dell XPS 13 Plus 9320 i7-1280P OLED
Intel Core i7-1280P, Intel Iris Xe Graphics G7 96EUs
58.7 (50.7min) fps -27%
HP Dragonfly G4
Intel Core i7-1365U, Intel Iris Xe Graphics G7 96EUs
53.3 (44.9min) fps -34%
MSI Prestige 13 AI Evo
Intel Core Ultra 7 155H, Intel Arc 8-Core iGPU
53.3 (34.3min) fps -34%
Asus ZenBook S13 OLED UX5304
Intel Core i7-1355U, Intel Iris Xe Graphics G7 96EUs
51.1 (42.7min) fps -37%
X-Plane 11.11 - 1920x1080 high (fps_test=3)
Dell XPS 13 Plus 9320 i7-1280P OLED
Intel Core i7-1280P, Intel Iris Xe Graphics G7 96EUs
37.6 fps +25%
Lenovo ThinkBook 13x G4 21KR0008GE
Intel Core Ultra 5 125H, Intel Arc 7-Core iGPU
34.2 fps +14%
MSI Prestige 13 AI Evo
Intel Core Ultra 7 155H, Intel Arc 8-Core iGPU
32.1 fps +7%
Dell XPS 13 9350
Intel Core Ultra 7 256V, Intel Arc Graphics 140V
30.1 fps
HP Dragonfly G4
Intel Core i7-1365U, Intel Iris Xe Graphics G7 96EUs
29.1 fps -3%
Asus ZenBook S13 OLED UX5304
Intel Core i7-1355U, Intel Iris Xe Graphics G7 96EUs
27.3 fps -9%
Baldur's Gate 3
1280x720 Low Preset
Durchschnittliche Intel Arc Graphics 140V
  (49.3 - 66.4, n=3)
55.8 fps +8%
Dell XPS 13 9350
Intel Core Ultra 7 256V, Intel Arc Graphics 140V
51.7 fps
HP EliteBook x360 1040 G11
Intel Core Ultra 7 165H, Intel Arc 8-Core iGPU
42.2 fps -18%
1920x1080 Low Preset
Dell XPS 13 9350
Intel Core Ultra 7 256V, Intel Arc Graphics 140V
36.6 fps
Durchschnittliche Intel Arc Graphics 140V
  (23.7 - 43, n=9)
36.1 fps -1%
Asus Zenbook S 14 UX5406
Intel Core Ultra 7 258V, Intel Arc Graphics 140V
34.2 fps -7%
HP EliteBook x360 1040 G11
Intel Core Ultra 7 165H, Intel Arc 8-Core iGPU
29.3 fps -20%
1920x1080 Medium Preset
Dell XPS 13 9350
Intel Core Ultra 7 256V, Intel Arc Graphics 140V
30.5 fps
Durchschnittliche Intel Arc Graphics 140V
  (19.6 - 33.6, n=9)
28.9 fps -5%
Asus Zenbook S 14 UX5406
Intel Core Ultra 7 258V, Intel Arc Graphics 140V
26.3 fps -14%
HP EliteBook x360 1040 G11
Intel Core Ultra 7 165H, Intel Arc 8-Core iGPU
24.2 fps -21%
1920x1080 High Preset
Dell XPS 13 9350
Intel Core Ultra 7 256V, Intel Arc Graphics 140V
25.8 fps
Durchschnittliche Intel Arc Graphics 140V
  (17 - 29.9, n=9)
25.8 fps 0%
Asus Zenbook S 14 UX5406
Intel Core Ultra 7 258V, Intel Arc Graphics 140V
23.6 fps -9%
HP EliteBook x360 1040 G11
Intel Core Ultra 7 165H, Intel Arc 8-Core iGPU
21.4 fps -17%
1920x1080 Ultra Preset
Dell XPS 13 9350
Intel Core Ultra 7 256V, Intel Arc Graphics 140V
25.7 fps
Durchschnittliche Intel Arc Graphics 140V
  (16.6 - 28.9, n=9)
24.8 fps -4%
Asus Zenbook S 14 UX5406
Intel Core Ultra 7 258V, Intel Arc Graphics 140V
23 fps -11%
HP EliteBook x360 1040 G11
Intel Core Ultra 7 165H, Intel Arc 8-Core iGPU
20.4 fps -21%
GTA V
1024x768 Lowest Settings possible
HP EliteBook x360 1040 G11
Intel Core Ultra 7 165H, Intel Arc 8-Core iGPU
162.9 (4.68min, 83.3P1) fps +5%
Dell XPS 13 9340 Core Ultra 7
Intel Core Ultra 7 155H, Intel Arc 8-Core iGPU
157.8 (4.43min, 83.3P1) fps +2%
Dell XPS 13 9350
Intel Core Ultra 7 256V, Intel Arc Graphics 140V
154.9 (4.26min, 83.3P1) fps
Durchschnittliche Intel Arc Graphics 140V
  (110.5 - 158.8, n=10)
143.7 fps -7%
Asus Zenbook S 13 OLED
AMD Ryzen 7 6800U, AMD Radeon 680M
136.1 (7.35min, 90.9P1) fps -12%
Dell XPS 13 Plus 9320 Core i7-1360P
Intel Core i7-1360P, Intel Iris Xe Graphics G7 96EUs
130.6 (21.7min, 71.4P1) fps -16%
Dell XPS 13 Plus 9320 i7-1280P OLED
Intel Core i7-1280P, Intel Iris Xe Graphics G7 96EUs
123.7 (11.7min, 76.9P1) fps -20%
Lenovo ThinkBook 13x G4 21KR0008GE
Intel Core Ultra 5 125H, Intel Arc 7-Core iGPU
116.9 (6min, 62.5P1) fps -25%
Dell XPS 13 Plus 9320 4K
Intel Core i7-1260P, Intel Iris Xe Graphics G7 96EUs
115.1 (17.6min, 76.9P1) fps -26%
Asus Zenbook S 14 UX5406
Intel Core Ultra 7 258V, Intel Arc Graphics 140V
114.4 (22.8min, 83.3P1) fps -26%
Lenovo Yoga 6 13 83B2001SGE
AMD Ryzen 7 7730U, AMD Radeon RX Vega 8 (Ryzen 4000/5000)
100.2 (6.7min, 66.7P1) fps -35%
HP Dragonfly G4
Intel Core i7-1365U, Intel Iris Xe Graphics G7 96EUs
99.8 (27min, 62.5P1) fps -36%
MSI Prestige 13 AI Evo
Intel Core Ultra 7 155H, Intel Arc 8-Core iGPU
99.1 (6.8min, 27.8P1) fps -36%
Asus ZenBook S13 OLED UX5304
Intel Core i7-1355U, Intel Iris Xe Graphics G7 96EUs
94.8 (19.3min, 55.6P1) fps -39%
Dell XPS 13 9315 2-in-1 Core i5-1230U
Intel Core i5-1230U, Intel Iris Xe Graphics G7 80EUs
60.9 (8.61min, 28.6P1) fps -61%
1920x1080 Lowest Settings possible
Dell XPS 13 9350
Intel Core Ultra 7 256V, Intel Arc Graphics 140V
146.7 (4.88min, 90.9P1) fps
HP EliteBook x360 1040 G11
Intel Core Ultra 7 165H, Intel Arc 8-Core iGPU
142.8 (5.23min, 76.9P1) fps -3%
Durchschnittliche Intel Arc Graphics 140V
  (135.2 - 146.7, n=3)
141.6 fps -3%
Dell XPS 13 Plus 9320 i7-1280P OLED
Intel Core i7-1280P, Intel Iris Xe Graphics G7 96EUs
101.7 (13.1min, 66.7P1) fps -31%
Dell XPS 13 Plus 9320 Core i7-1360P
Intel Core i7-1360P, Intel Iris Xe Graphics G7 96EUs
95.6 (11.2min, 52.6P1) fps -35%
HP Dragonfly G4
Intel Core i7-1365U, Intel Iris Xe Graphics G7 96EUs
78.8 (12.6min, 52.6P1) fps -46%
Lenovo Yoga 6 13 83B2001SGE
AMD Ryzen 7 7730U, AMD Radeon RX Vega 8 (Ryzen 4000/5000)
55.7 (11.4min, 40P1) fps -62%
Dell XPS 13 9315 2-in-1 Core i5-1230U
Intel Core i5-1230U, Intel Iris Xe Graphics G7 80EUs
36.2 (8.37min, 16.9P1) fps -75%
1366x768 Normal/Off AF:4x
HP EliteBook x360 1040 G11
Intel Core Ultra 7 165H, Intel Arc 8-Core iGPU
151.9 (4.24min, 71.4P1) fps +2%
Dell XPS 13 9350
Intel Core Ultra 7 256V, Intel Arc Graphics 140V
149.4 (4.38min, 90.9P1) fps
Dell XPS 13 9340 Core Ultra 7
Intel Core Ultra 7 155H, Intel Arc 8-Core iGPU
129.8 (4.39min, 58.8P1) fps -13%
Durchschnittliche Intel Arc Graphics 140V
  (91.1 - 152.4, n=9)
129.8 fps -13%
Asus Zenbook S 13 OLED
AMD Ryzen 7 6800U, AMD Radeon 680M
120.4 (8.21min, 76.9P1) fps -19%
Dell XPS 13 Plus 9320 i7-1280P OLED
Intel Core i7-1280P, Intel Iris Xe Graphics G7 96EUs
108.7 (12.4min, 62.5P1) fps -27%
Lenovo ThinkBook 13x G4 21KR0008GE
Intel Core Ultra 5 125H, Intel Arc 7-Core iGPU
106.4 (7.63min, 50P1) fps -29%
Dell XPS 13 Plus 9320 Core i7-1360P
Intel Core i7-1360P, Intel Iris Xe Graphics G7 96EUs
105.3 (6.65min, 55.6P1) fps -30%
Dell XPS 13 Plus 9320 4K
Intel Core i7-1260P, Intel Iris Xe Graphics G7 96EUs
102.1 (18.6min, 66.7P1) fps -32%
MSI Prestige 13 AI Evo
Intel Core Ultra 7 155H, Intel Arc 8-Core iGPU
93.8 (12.8min, 41.7P1) fps -37%
Asus Zenbook S 14 UX5406
Intel Core Ultra 7 258V, Intel Arc Graphics 140V
91.1 (10.1min, 66.7P1) fps -39%
Dell XPS 13 Plus 9320 i5-1240p
Intel Core i5-1240P, Intel Iris Xe Graphics G7 80EUs
91 fps -39%
Lenovo Yoga 6 13 83B2001SGE
AMD Ryzen 7 7730U, AMD Radeon RX Vega 8 (Ryzen 4000/5000)
86.3 (23.7min, 55.6P1) fps -42%
HP Dragonfly G4
Intel Core i7-1365U, Intel Iris Xe Graphics G7 96EUs
84.1 (9min, 47.6P1) fps -44%
Asus ZenBook S13 OLED UX5304
Intel Core i7-1355U, Intel Iris Xe Graphics G7 96EUs
81 (16.8min, 45.5P1) fps -46%
Dell XPS 13 9315 2-in-1 Core i5-1230U
Intel Core i5-1230U, Intel Iris Xe Graphics G7 80EUs
38.4 (8.67min, 21.3P1) fps -74%
Dell XPS 13 9315, i5-1230U
Intel Core i5-1230U, Intel Iris Xe Graphics G7 80EUs
31 fps -79%
1920x1080 Normal/Off AF:4x
Dell XPS 13 9350
Intel Core Ultra 7 256V, Intel Arc Graphics 140V
134.2 (5.63min, 83.3P1) fps
Durchschnittliche Intel Arc Graphics 140V
  (120.6 - 134.2, n=3)
129.2 fps -4%
HP EliteBook x360 1040 G11
Intel Core Ultra 7 165H, Intel Arc 8-Core iGPU
124.3 (10.4min, 58.8P1) fps -7%
Dell XPS 13 Plus 9320 i7-1280P OLED
Intel Core i7-1280P, Intel Iris Xe Graphics G7 96EUs
90.7 (13min, 55.6P1) fps -32%
Dell XPS 13 Plus 9320 Core i7-1360P
Intel Core i7-1360P, Intel Iris Xe Graphics G7 96EUs
90.3 (13.3min, 52.6P1) fps -33%
HP Dragonfly G4
Intel Core i7-1365U, Intel Iris Xe Graphics G7 96EUs
70.6 (16.1min, 43.5P1) fps -47%
Lenovo Yoga 6 13 83B2001SGE
AMD Ryzen 7 7730U, AMD Radeon RX Vega 8 (Ryzen 4000/5000)
55.2 (15.5min, 38.5P1) fps -59%
Dell XPS 13 9315 2-in-1 Core i5-1230U
Intel Core i5-1230U, Intel Iris Xe Graphics G7 80EUs
30 (8.55min, 15.4P1) fps -78%
1920x1080 High/On (Advanced Graphics Off) AA:2xMSAA + FX AF:8x
Dell XPS 13 9350
Intel Core Ultra 7 256V, Intel Arc Graphics 140V
60.8 (2.26min, 43.5P1) fps
Durchschnittliche Intel Arc Graphics 140V
  (32 - 66.3, n=9)
56.6 fps -7%
Asus Zenbook S 14 UX5406
Intel Core Ultra 7 258V, Intel Arc Graphics 140V
47.1 (3.06min, 25.6P1) fps -23%
Asus Zenbook S 13 OLED
AMD Ryzen 7 6800U, AMD Radeon 680M
47 (6.64min, 31.3P1) fps -23%
HP EliteBook x360 1040 G11
Intel Core Ultra 7 165H, Intel Arc 8-Core iGPU
43.2 (2.29min, 25.6P1) fps -29%
Dell XPS 13 9340 Core Ultra 7
Intel Core Ultra 7 155H, Intel Arc 8-Core iGPU
32.8 (2.29min, 20.8P1) fps -46%
Lenovo ThinkBook 13x G4 21KR0008GE
Intel Core Ultra 5 125H, Intel Arc 7-Core iGPU
32.4 (1.526min, 12P1) fps -47%
Dell XPS 13 Plus 9320 i5-1240p
Intel Core i5-1240P, Intel Iris Xe Graphics G7 80EUs
32 fps -47%
Dell XPS 13 Plus 9320 i7-1280P OLED
Intel Core i7-1280P, Intel Iris Xe Graphics G7 96EUs
27.6 (7.19min, 18.5P1) fps -55%
Lenovo Yoga 6 13 83B2001SGE
AMD Ryzen 7 7730U, AMD Radeon RX Vega 8 (Ryzen 4000/5000)
26.9 (9.64min, 19.2P1) fps -56%
Dell XPS 13 Plus 9320 Core i7-1360P
Intel Core i7-1360P, Intel Iris Xe Graphics G7 96EUs
26.6 (7.8min, 18.5P1) fps -56%
Dell XPS 13 Plus 9320 4K
Intel Core i7-1260P, Intel Iris Xe Graphics G7 96EUs
26.2 (8.16min, 20P1) fps -57%
MSI Prestige 13 AI Evo
Intel Core Ultra 7 155H, Intel Arc 8-Core iGPU
26.2 (5.31min, 15.6P1) fps -57%
HP Dragonfly G4
Intel Core i7-1365U, Intel Iris Xe Graphics G7 96EUs
23.4 (10.4min, 16.1P1) fps -62%
Asus ZenBook S13 OLED UX5304
Intel Core i7-1355U, Intel Iris Xe Graphics G7 96EUs
22.5 (6.83min, 13.9P1) fps -63%
Dell XPS 13 9315 2-in-1 Core i5-1230U
Intel Core i5-1230U, Intel Iris Xe Graphics G7 80EUs
11.7 (3.09min, 5.59P1) fps -81%
Dell XPS 13 9315, i5-1230U
Intel Core i5-1230U, Intel Iris Xe Graphics G7 80EUs
10 fps -84%
1920x1080 Highest Settings possible AA:4xMSAA + FX AF:16x
Dell XPS 13 9350
Intel Core Ultra 7 256V, Intel Arc Graphics 140V
25.6 (2.46min, 19.6P1) fps
Durchschnittliche Intel Arc Graphics 140V
  (15.4 - 28.4, n=9)
24.6 fps -4%
Asus Zenbook S 14 UX5406
Intel Core Ultra 7 258V, Intel Arc Graphics 140V
23.4 (2.44min, 13.3P1) fps -9%
Asus Zenbook S 13 OLED
AMD Ryzen 7 6800U, AMD Radeon 680M
21.3 (3.35min, 14.5P1) fps -17%
HP EliteBook x360 1040 G11
Intel Core Ultra 7 165H, Intel Arc 8-Core iGPU
17.1 (1.72min, 12.3P1) fps -33%
Lenovo ThinkBook 13x G4 21KR0008GE
Intel Core Ultra 5 125H, Intel Arc 7-Core iGPU
14.8 (1.279min, 5.78P1) fps -42%
Dell XPS 13 9340 Core Ultra 7
Intel Core Ultra 7 155H, Intel Arc 8-Core iGPU
14.7 (2.21min, 10.8P1) fps -43%
Lenovo Yoga 6 13 83B2001SGE
AMD Ryzen 7 7730U, AMD Radeon RX Vega 8 (Ryzen 4000/5000)
12.3 (1.009min, 8.2P1) fps -52%
Dell XPS 13 Plus 9320 Core i7-1360P
Intel Core i7-1360P, Intel Iris Xe Graphics G7 96EUs
11.6 (4.4min, 6.99P1) fps -55%
Dell XPS 13 Plus 9320 i7-1280P OLED
Intel Core i7-1280P, Intel Iris Xe Graphics G7 96EUs
11.5 (4.27min, 7.69P1) fps -55%
Dell XPS 13 Plus 9320 4K
Intel Core i7-1260P, Intel Iris Xe Graphics G7 96EUs
11 (4.3min, 8.62P1) fps -57%
HP Dragonfly G4
Intel Core i7-1365U, Intel Iris Xe Graphics G7 96EUs
10.1 (4.85min, 6.29P1) fps -61%
MSI Prestige 13 AI Evo
Intel Core Ultra 7 155H, Intel Arc 8-Core iGPU
9.97 (1.989min, 4.98P1) fps -61%
Asus ZenBook S13 OLED UX5304
Intel Core i7-1355U, Intel Iris Xe Graphics G7 96EUs
9.42 (3.26min, 5.92P1) fps -63%
Dell XPS 13 9315 2-in-1 Core i5-1230U
Intel Core i5-1230U, Intel Iris Xe Graphics G7 80EUs
6.06 (1.275min, 2.14P1) fps -76%
Dota 2 Reborn
1280x720 min (0/3) fastest
Framework Laptop 13.5 Ryzen 7 7840U
AMD Ryzen 7 7840U, AMD Radeon 780M
154.1 (129.7min) fps +61%
Dell XPS 13 Plus 9320 i5-1240p
Intel Core i5-1240P, Intel Iris Xe Graphics G7 80EUs
134.4 (81.4min) fps +40%
Dell XPS 13 Plus 9320 Core i7-1360P
Intel Core i7-1360P, Intel Iris Xe Graphics G7 96EUs
125.6 (99.1min) fps +31%
Lenovo ThinkBook 13s G3 20YA0005GE
AMD Ryzen 7 5800U, AMD Radeon RX Vega 8 (Ryzen 4000/5000)
113 (99.1min) fps +18%
Asus Zenbook S 13 OLED
AMD Ryzen 7 6800U, AMD Radeon 680M
111.2 (95.4min) fps +16%
Dell XPS 13 Plus 9320 i7-1280P OLED
Intel Core i7-1280P, Intel Iris Xe Graphics G7 96EUs
110.3 (87.2min) fps +15%
Dell XPS 13 Plus 9320 4K
Intel Core i7-1260P, Intel Iris Xe Graphics G7 96EUs
109.9 (88.7min) fps +15%
Dell XPS 13 9340 Core Ultra 7
Intel Core Ultra 7 155H, Intel Arc 8-Core iGPU
106.2 (58min) fps +11%
Lenovo Yoga 6 13 83B2001SGE
AMD Ryzen 7 7730U, AMD Radeon RX Vega 8 (Ryzen 4000/5000)
103.2 (89.7min) fps +8%
HP Dragonfly G4
Intel Core i7-1365U, Intel Iris Xe Graphics G7 96EUs
101.4 (80.9min) fps +6%
Dell XPS 13 9315 2-in-1 Core i5-1230U
Intel Core i5-1230U, Intel Iris Xe Graphics G7 80EUs
101.2 (80.9min) fps +6%
HP EliteBook x360 1040 G11
Intel Core Ultra 7 165H, Intel Arc 8-Core iGPU
100.3 (58.7min) fps +5%
Durchschnittliche Intel Arc Graphics 140V
  (89.8 - 105.4, n=9)
98.8 fps +3%
Dell XPS 13 9350
Intel Core Ultra 7 256V, Intel Arc Graphics 140V
95.8 (61.3min) fps
Lenovo ThinkBook 13x G4 21KR0008GE
Intel Core Ultra 5 125H, Intel Arc 7-Core iGPU
93.8 (59.9min) fps -2%
Asus Zenbook S 14 UX5406
Intel Core Ultra 7 258V, Intel Arc Graphics 140V
93.1 (52.1min) fps -3%
MSI Prestige 13 AI Evo
Intel Core Ultra 7 155H, Intel Arc 8-Core iGPU
89.9 (53min) fps -6%
Asus ZenBook S13 OLED UX5304
Intel Core i7-1355U, Intel Iris Xe Graphics G7 96EUs
84.8 (65.2min) fps -11%
1366x768 med (1/3)
Dell XPS 13 Plus 9320 i5-1240p
Intel Core i5-1240P, Intel Iris Xe Graphics G7 80EUs
119.5 (103.4min) fps +37%
Framework Laptop 13.5 Ryzen 7 7840U
AMD Ryzen 7 7840U, AMD Radeon 780M
119.3 (97.9min) fps +37%
Dell XPS 13 Plus 9320 Core i7-1360P
Intel Core i7-1360P, Intel Iris Xe Graphics G7 96EUs
97.7 (75.8min) fps +12%
Asus Zenbook S 13 OLED
AMD Ryzen 7 6800U, AMD Radeon 680M
96.9 (79.9min) fps +11%
HP EliteBook x360 1040 G11
Intel Core Ultra 7 165H, Intel Arc 8-Core iGPU
94 (34.1min) fps +8%
Dell XPS 13 9340 Core Ultra 7
Intel Core Ultra 7 155H, Intel Arc 8-Core iGPU
89.8 (52.9min) fps +3%
Lenovo ThinkBook 13s G3 20YA0005GE
AMD Ryzen 7 5800U, AMD Radeon RX Vega 8 (Ryzen 4000/5000)
88.4 (72.2min) fps +2%
Dell XPS 13 9350
Intel Core Ultra 7 256V, Intel Arc Graphics 140V
87 (55.1min) fps
Dell XPS 13 Plus 9320 i7-1280P OLED
Intel Core i7-1280P, Intel Iris Xe Graphics G7 96EUs
86.8 (68min) fps 0%
Lenovo Yoga 6 13 83B2001SGE
AMD Ryzen 7 7730U, AMD Radeon RX Vega 8 (Ryzen 4000/5000)
86.3 (76.6min) fps -1%
Durchschnittliche Intel Arc Graphics 140V
  (59.7 - 99.9, n=9)
86.2 fps -1%
Dell XPS 13 Plus 9320 4K
Intel Core i7-1260P, Intel Iris Xe Graphics G7 96EUs
85.2 (68min) fps -2%
Lenovo ThinkBook 13x G4 21KR0008GE
Intel Core Ultra 5 125H, Intel Arc 7-Core iGPU
83 (55.2min) fps -5%
HP Dragonfly G4
Intel Core i7-1365U, Intel Iris Xe Graphics G7 96EUs
76.3 (60.7min) fps -12%
MSI Prestige 13 AI Evo
Intel Core Ultra 7 155H, Intel Arc 8-Core iGPU
75.9 (14.5min) fps -13%
Dell XPS 13 9315 2-in-1 Core i5-1230U
Intel Core i5-1230U, Intel Iris Xe Graphics G7 80EUs
75.8 (62.3min) fps -13%
Asus ZenBook S13 OLED UX5304
Intel Core i7-1355U, Intel Iris Xe Graphics G7 96EUs
66.7 (50.3min) fps -23%
Asus Zenbook S 14 UX5406
Intel Core Ultra 7 258V, Intel Arc Graphics 140V
59.7 (31.7min) fps -31%
1920x1080 high (2/3)
Dell XPS 13 9350
Intel Core Ultra 7 256V, Intel Arc Graphics 140V
83 (35.8min) fps
HP EliteBook x360 1040 G11
Intel Core Ultra 7 165H, Intel Arc 8-Core iGPU
77.9 (45min) fps -6%
Durchschnittliche Intel Arc Graphics 140V
  (48.4 - 88.2, n=9)
77.3 fps -7%
Framework Laptop 13.5 Ryzen 7 7840U
AMD Ryzen 7 7840U, AMD Radeon 780M
76.2 (63.3min) fps -8%
Asus Zenbook S 13 OLED
AMD Ryzen 7 6800U, AMD Radeon 680M
72.3 (62.7min) fps -13%
Dell XPS 13 9340 Core Ultra 7
Intel Core Ultra 7 155H, Intel Arc 8-Core iGPU
72 (49.5min) fps -13%
Dell XPS 13 Plus 9320 i5-1240p
Intel Core i5-1240P, Intel Iris Xe Graphics G7 80EUs
70.9 (59.6min) fps -15%
Dell XPS 13 Plus 9320 Core i7-1360P
Intel Core i7-1360P, Intel Iris Xe Graphics G7 96EUs
68.7 (58.6min) fps -17%
Lenovo ThinkBook 13x G4 21KR0008GE
Intel Core Ultra 5 125H, Intel Arc 7-Core iGPU
68.4 (46.3min) fps -18%
Dell XPS 13 Plus 9320 4K
Intel Core i7-1260P, Intel Iris Xe Graphics G7 96EUs
68.2 (59.4min) fps -18%
Dell XPS 13 Plus 9320 i7-1280P OLED
Intel Core i7-1280P, Intel Iris Xe Graphics G7 96EUs
68.1 (57.9min) fps -18%
Asus Zenbook S 14 UX5406
Intel Core Ultra 7 258V, Intel Arc Graphics 140V
67.2 (29.2min) fps -19%
HP Dragonfly G4
Intel Core i7-1365U, Intel Iris Xe Graphics G7 96EUs
60.2 (49.5min) fps -27%
MSI Prestige 13 AI Evo
Intel Core Ultra 7 155H, Intel Arc 8-Core iGPU
57.7 (35.7min) fps -30%
Lenovo Yoga 6 13 83B2001SGE
AMD Ryzen 7 7730U, AMD Radeon RX Vega 8 (Ryzen 4000/5000)
56.4 (47.8min) fps -32%
Asus ZenBook S13 OLED UX5304
Intel Core i7-1355U, Intel Iris Xe Graphics G7 96EUs
54.9 (44.7min) fps -34%
Lenovo ThinkBook 13s G3 20YA0005GE
AMD Ryzen 7 5800U, AMD Radeon RX Vega 8 (Ryzen 4000/5000)
51.1 (46.2min) fps -38%
Dell XPS 13 9315 2-in-1 Core i5-1230U
Intel Core i5-1230U, Intel Iris Xe Graphics G7 80EUs
37.6 (35min) fps -55%
1920x1080 ultra (3/3) best looking
Dell XPS 13 9350
Intel Core Ultra 7 256V, Intel Arc Graphics 140V
80.7 (52.1min) fps
Durchschnittliche Intel Arc Graphics 140V
  (54.8 - 81.1, n=9)
75.1 fps -7%
HP EliteBook x360 1040 G11
Intel Core Ultra 7 165H, Intel Arc 8-Core iGPU
74.4 (47.1min) fps -8%
Framework Laptop 13.5 Ryzen 7 7840U
AMD Ryzen 7 7840U, AMD Radeon 780M
71.2 (59.4min) fps -12%
Dell XPS 13 Plus 9320 i5-1240p
Intel Core i5-1240P, Intel Iris Xe Graphics G7 80EUs
66.1 (49.7min) fps -18%
Dell XPS 13 9340 Core Ultra 7
Intel Core Ultra 7 155H, Intel Arc 8-Core iGPU
65.2 (48.8min) fps -19%
Lenovo ThinkBook 13x G4 21KR0008GE
Intel Core Ultra 5 125H, Intel Arc 7-Core iGPU
64.9 (45.5min) fps -20%
Asus Zenbook S 14 UX5406
Intel Core Ultra 7 258V, Intel Arc Graphics 140V
62.9 fps -22%
Asus Zenbook S 13 OLED
AMD Ryzen 7 6800U, AMD Radeon 680M
62.7 (53.2min) fps -22%
Dell XPS 13 Plus 9320 Core i7-1360P
Intel Core i7-1360P, Intel Iris Xe Graphics G7 96EUs
61.6 (52.9min) fps -24%
Dell XPS 13 Plus 9320 4K
Intel Core i7-1260P, Intel Iris Xe Graphics G7 96EUs
60.6 (52.5min) fps -25%
Dell XPS 13 Plus 9320 i7-1280P OLED
Intel Core i7-1280P, Intel Iris Xe Graphics G7 96EUs
58.7 (50.7min) fps -27%
HP Dragonfly G4
Intel Core i7-1365U, Intel Iris Xe Graphics G7 96EUs
53.3 (44.9min) fps -34%
MSI Prestige 13 AI Evo
Intel Core Ultra 7 155H, Intel Arc 8-Core iGPU
53.3 (34.3min) fps -34%
Asus ZenBook S13 OLED UX5304
Intel Core i7-1355U, Intel Iris Xe Graphics G7 96EUs
51.1 (42.7min) fps -37%
Lenovo Yoga 6 13 83B2001SGE
AMD Ryzen 7 7730U, AMD Radeon RX Vega 8 (Ryzen 4000/5000)
50.4 (44.6min) fps -38%
Lenovo ThinkBook 13s G3 20YA0005GE
AMD Ryzen 7 5800U, AMD Radeon RX Vega 8 (Ryzen 4000/5000)
47.5 (42.7min) fps -41%
Dell XPS 13 9315 2-in-1 Core i5-1230U
Intel Core i5-1230U, Intel Iris Xe Graphics G7 80EUs
34.2 (31.2min) fps -58%
Final Fantasy XV Benchmark
1280x720 Lite Quality
Dell XPS 13 9350
Intel Core Ultra 7 256V, Intel Arc Graphics 140V
79.4 fps
Durchschnittliche Intel Arc Graphics 140V
  (54.1 - 91, n=9)
78.7 fps -1%
Asus Zenbook S 14 UX5406
Intel Core Ultra 7 258V, Intel Arc Graphics 140V
75.6 fps -5%
HP EliteBook x360 1040 G11
Intel Core Ultra 7 165H, Intel Arc 8-Core iGPU
73.6 fps -7%
Framework Laptop 13.5 Ryzen 7 7840U
AMD Ryzen 7 7840U, AMD Radeon 780M
66.6 fps -16%
Dell XPS 13 9340 Core Ultra 7
Intel Core Ultra 7 155H, Intel Arc 8-Core iGPU
61.3 fps -23%
Asus Zenbook S 13 OLED
AMD Ryzen 7 6800U, AMD Radeon 680M
59.8 fps -25%
Lenovo ThinkBook 13x G4 21KR0008GE
Intel Core Ultra 5 125H, Intel Arc 7-Core iGPU
59.8 fps -25%
Dell XPS 13 Plus 9320 i7-1280P OLED
Intel Core i7-1280P, Intel Iris Xe Graphics G7 96EUs
46.1 fps -42%
Dell XPS 13 Plus 9320 4K
Intel Core i7-1260P, Intel Iris Xe Graphics G7 96EUs
44.7 fps -44%
Dell XPS 13 Plus 9320 Core i7-1360P
Intel Core i7-1360P, Intel Iris Xe Graphics G7 96EUs
44.5 fps -44%
MSI Prestige 13 AI Evo
Intel Core Ultra 7 155H, Intel Arc 8-Core iGPU
43.8 fps -45%
HP Dragonfly G4
Intel Core i7-1365U, Intel Iris Xe Graphics G7 96EUs
40.9 fps -48%
Lenovo ThinkBook 13s G3 20YA0005GE
AMD Ryzen 7 5800U, AMD Radeon RX Vega 8 (Ryzen 4000/5000)
39.1 fps -51%
Lenovo Yoga 6 13 83B2001SGE
AMD Ryzen 7 7730U, AMD Radeon RX Vega 8 (Ryzen 4000/5000)
38.7 fps -51%
Asus ZenBook S13 OLED UX5304
Intel Core i7-1355U, Intel Iris Xe Graphics G7 96EUs
37.4 fps -53%
Dell XPS 13 Plus 9320 i5-1240p
Intel Core i5-1240P, Intel Iris Xe Graphics G7 80EUs
36.3 fps -54%
Dell XPS 13 9315 2-in-1 Core i5-1230U
Intel Core i5-1230U, Intel Iris Xe Graphics G7 80EUs
27 fps -66%
Dell XPS 13 9315, i5-1230U
Intel Core i5-1230U, Intel Iris Xe Graphics G7 80EUs
18.9 fps -76%
1920x1080 Standard Quality
Dell XPS 13 9350
Intel Core Ultra 7 256V, Intel Arc Graphics 140V
46.1 fps
Durchschnittliche Intel Arc Graphics 140V
  (31.6 - 49.3, n=10)
43.5 fps -6%
Asus Zenbook S 14 UX5406
Intel Core Ultra 7 258V, Intel Arc Graphics 140V
40.9 fps -11%
HP EliteBook x360 1040 G11
Intel Core Ultra 7 165H, Intel Arc 8-Core iGPU
40.3 fps -13%
Dell XPS 13 9340 Core Ultra 7
Intel Core Ultra 7 155H, Intel Arc 8-Core iGPU
36.2 fps -21%
Framework Laptop 13.5 Ryzen 7 7840U
AMD Ryzen 7 7840U, AMD Radeon 780M
34.4 fps -25%
Lenovo ThinkBook 13x G4 21KR0008GE
Intel Core Ultra 5 125H, Intel Arc 7-Core iGPU
33.4 fps -28%
Asus Zenbook S 13 OLED
AMD Ryzen 7 6800U, AMD Radeon 680M
31.6 fps -31%
MSI Prestige 13 AI Evo
Intel Core Ultra 7 155H, Intel Arc 8-Core iGPU
28 fps -39%
Dell XPS 13 Plus 9320 4K
Intel Core i7-1260P, Intel Iris Xe Graphics G7 96EUs
25.3 fps -45%
Dell XPS 13 Plus 9320 i7-1280P OLED
Intel Core i7-1280P, Intel Iris Xe Graphics G7 96EUs
25.3 fps -45%
Dell XPS 13 Plus 9320 Core i7-1360P
Intel Core i7-1360P, Intel Iris Xe Graphics G7 96EUs
25.2 fps -45%
HP Dragonfly G4
Intel Core i7-1365U, Intel Iris Xe Graphics G7 96EUs
23.2 fps -50%
Asus ZenBook S13 OLED UX5304
Intel Core i7-1355U, Intel Iris Xe Graphics G7 96EUs
20.5 fps -56%
Dell XPS 13 Plus 9320 i5-1240p
Intel Core i5-1240P, Intel Iris Xe Graphics G7 80EUs
19.7 fps -57%
Lenovo ThinkBook 13s G3 20YA0005GE
AMD Ryzen 7 5800U, AMD Radeon RX Vega 8 (Ryzen 4000/5000)
18.8 fps -59%
Lenovo Yoga 6 13 83B2001SGE
AMD Ryzen 7 7730U, AMD Radeon RX Vega 8 (Ryzen 4000/5000)
17.7 fps -62%
Dell XPS 13 9315, i5-1230U
Intel Core i5-1230U, Intel Iris Xe Graphics G7 80EUs
10.8 fps -77%
1920x1080 High Quality
Dell XPS 13 9350
Intel Core Ultra 7 256V, Intel Arc Graphics 140V
31.5 fps
Durchschnittliche Intel Arc Graphics 140V
  (23 - 34.2, n=9)
30.8 fps -2%
Asus Zenbook S 14 UX5406
Intel Core Ultra 7 258V, Intel Arc Graphics 140V
30 fps -5%
HP EliteBook x360 1040 G11
Intel Core Ultra 7 165H, Intel Arc 8-Core iGPU
27.5 fps -13%
Dell XPS 13 9340 Core Ultra 7
Intel Core Ultra 7 155H, Intel Arc 8-Core iGPU
26.4 fps -16%
Framework Laptop 13.5 Ryzen 7 7840U
AMD Ryzen 7 7840U, AMD Radeon 780M
25.7 fps -18%
Dell XPS 13 Plus 9320 4K
Intel Core i7-1260P, Intel Iris Xe Graphics G7 96EUs
25.3 fps -20%
Lenovo ThinkBook 13x G4 21KR0008GE
Intel Core Ultra 5 125H, Intel Arc 7-Core iGPU
25.3 fps -20%
Asus Zenbook S 13 OLED
AMD Ryzen 7 6800U, AMD Radeon 680M
21.9 fps -30%
Dell XPS 13 Plus 9320 i7-1280P OLED
Intel Core i7-1280P, Intel Iris Xe Graphics G7 96EUs
17.6 fps -44%
Dell XPS 13 Plus 9320 Core i7-1360P
Intel Core i7-1360P, Intel Iris Xe Graphics G7 96EUs
17.5 fps -44%
MSI Prestige 13 AI Evo
Intel Core Ultra 7 155H, Intel Arc 8-Core iGPU
17 fps -46%
HP Dragonfly G4
Intel Core i7-1365U, Intel Iris Xe Graphics G7 96EUs
16.4 fps -48%
Asus ZenBook S13 OLED UX5304
Intel Core i7-1355U, Intel Iris Xe Graphics G7 96EUs
14.9 fps -53%
Lenovo Yoga 6 13 83B2001SGE
AMD Ryzen 7 7730U, AMD Radeon RX Vega 8 (Ryzen 4000/5000)
12.9 fps -59%
Lenovo ThinkBook 13s G3 20YA0005GE
AMD Ryzen 7 5800U, AMD Radeon RX Vega 8 (Ryzen 4000/5000)
12.7 fps -60%
Dell XPS 13 Plus 9320 i5-1240p
Intel Core i5-1240P, Intel Iris Xe Graphics G7 80EUs
11.7 fps -63%
Dell XPS 13 9315, i5-1230U
Intel Core i5-1230U, Intel Iris Xe Graphics G7 80EUs
5.24 fps -83%
X-Plane 11.11
1280x720 low (fps_test=1)
Framework Laptop 13.5 Ryzen 7 7840U
AMD Ryzen 7 7840U, AMD Radeon 780M
60 fps +27%
HP EliteBook x360 1040 G11
Intel Core Ultra 7 165H, Intel Arc 8-Core iGPU
58.7 fps +25%
Dell XPS 13 Plus 9320 4K
Intel Core i7-1260P, Intel Iris Xe Graphics G7 96EUs
55.5 fps +18%
Dell XPS 13 Plus 9320 i7-1280P OLED
Intel Core i7-1280P, Intel Iris Xe Graphics G7 96EUs
55.2 fps +17%
Dell XPS 13 9340 Core Ultra 7
Intel Core Ultra 7 155H, Intel Arc 8-Core iGPU
53 fps +13%
Lenovo ThinkBook 13x G4 21KR0008GE
Intel Core Ultra 5 125H, Intel Arc 7-Core iGPU
52 fps +10%
Durchschnittliche Intel Arc Graphics 140V
  (38.9 - 57, n=9)
50 fps +6%
MSI Prestige 13 AI Evo
Intel Core Ultra 7 155H, Intel Arc 8-Core iGPU
47.4 fps +1%
Dell XPS 13 9350
Intel Core Ultra 7 256V, Intel Arc Graphics 140V
47.1 fps
Asus Zenbook S 13 OLED
AMD Ryzen 7 6800U, AMD Radeon 680M
46.9 fps 0%
Lenovo ThinkBook 13s G3 20YA0005GE
AMD Ryzen 7 5800U, AMD Radeon RX Vega 8 (Ryzen 4000/5000)
44.1 fps -6%
Dell XPS 13 Plus 9320 Core i7-1360P
Intel Core i7-1360P, Intel Iris Xe Graphics G7 96EUs
42.7 fps -9%
Lenovo Yoga 6 13 83B2001SGE
AMD Ryzen 7 7730U, AMD Radeon RX Vega 8 (Ryzen 4000/5000)
39.5 fps -16%
Asus Zenbook S 14 UX5406
Intel Core Ultra 7 258V, Intel Arc Graphics 140V
38.9 fps -17%
HP Dragonfly G4
Intel Core i7-1365U, Intel Iris Xe Graphics G7 96EUs
37.6 fps -20%
Asus ZenBook S13 OLED UX5304
Intel Core i7-1355U, Intel Iris Xe Graphics G7 96EUs
34.6 fps -27%
Dell XPS 13 9315 2-in-1 Core i5-1230U
Intel Core i5-1230U, Intel Iris Xe Graphics G7 80EUs
31.2 fps -34%
Dell XPS 13 Plus 9320 i5-1240p
Intel Core i5-1240P, Intel Iris Xe Graphics G7 80EUs
28.5 fps -39%
1920x1080 med (fps_test=2)
HP EliteBook x360 1040 G11
Intel Core Ultra 7 165H, Intel Arc 8-Core iGPU
47.6 fps +32%
Framework Laptop 13.5 Ryzen 7 7840U
AMD Ryzen 7 7840U, AMD Radeon 780M
44.4 fps +23%
Dell XPS 13 Plus 9320 4K
Intel Core i7-1260P, Intel Iris Xe Graphics G7 96EUs
42.9 fps +19%
Dell XPS 13 Plus 9320 i7-1280P OLED
Intel Core i7-1280P, Intel Iris Xe Graphics G7 96EUs
40.7 fps +13%
Dell XPS 13 9340 Core Ultra 7
Intel Core Ultra 7 155H, Intel Arc 8-Core iGPU
40.7 fps +13%
Lenovo ThinkBook 13x G4 21KR0008GE
Intel Core Ultra 5 125H, Intel Arc 7-Core iGPU
40.1 fps +11%
Asus Zenbook S 13 OLED
AMD Ryzen 7 6800U, AMD Radeon 680M
39.7 fps +10%
Durchschnittliche Intel Arc Graphics 140V
  (34.4 - 43.8, n=9)
39.4 fps +9%
MSI Prestige 13 AI Evo
Intel Core Ultra 7 155H, Intel Arc 8-Core iGPU
37.7 fps +4%
Dell XPS 13 Plus 9320 Core i7-1360P
Intel Core i7-1360P, Intel Iris Xe Graphics G7 96EUs
36.2 fps 0%
Dell XPS 13 9350
Intel Core Ultra 7 256V, Intel Arc Graphics 140V
36.1 fps
Asus Zenbook S 14 UX5406
Intel Core Ultra 7 258V, Intel Arc Graphics 140V
35.1 fps -3%
Lenovo ThinkBook 13s G3 20YA0005GE
AMD Ryzen 7 5800U, AMD Radeon RX Vega 8 (Ryzen 4000/5000)
34.1 fps -6%
Asus ZenBook S13 OLED UX5304
Intel Core i7-1355U, Intel Iris Xe Graphics G7 96EUs
32.1 fps -11%
HP Dragonfly G4
Intel Core i7-1365U, Intel Iris Xe Graphics G7 96EUs
31.8 fps -12%
Lenovo Yoga 6 13 83B2001SGE
AMD Ryzen 7 7730U, AMD Radeon RX Vega 8 (Ryzen 4000/5000)
30.4 fps -16%
Dell XPS 13 9315 2-in-1 Core i5-1230U
Intel Core i5-1230U, Intel Iris Xe Graphics G7 80EUs
25.1 fps -30%
Dell XPS 13 Plus 9320 i5-1240p
Intel Core i5-1240P, Intel Iris Xe Graphics G7 80EUs
23.7 fps -34%
1920x1080 high (fps_test=3)
HP EliteBook x360 1040 G11
Intel Core Ultra 7 165H, Intel Arc 8-Core iGPU
40.5 fps +35%
Dell XPS 13 Plus 9320 i7-1280P OLED
Intel Core i7-1280P, Intel Iris Xe Graphics G7 96EUs
37.6 fps +25%
Framework Laptop 13.5 Ryzen 7 7840U
AMD Ryzen 7 7840U, AMD Radeon 780M
37.5 fps +25%
Dell XPS 13 Plus 9320 4K
Intel Core i7-1260P, Intel Iris Xe Graphics G7 96EUs
36.9 fps +23%
Lenovo ThinkBook 13x G4 21KR0008GE
Intel Core Ultra 5 125H, Intel Arc 7-Core iGPU
34.2 fps +14%
Durchschnittliche Intel Arc Graphics 140V
  (28.5 - 37.7, n=9)
34.1 fps +13%
Asus Zenbook S 13 OLED
AMD Ryzen 7 6800U, AMD Radeon 680M
33.6 fps +12%
Dell XPS 13 Plus 9320 Core i7-1360P
Intel Core i7-1360P, Intel Iris Xe Graphics G7 96EUs
33.2 fps +10%
MSI Prestige 13 AI Evo
Intel Core Ultra 7 155H, Intel Arc 8-Core iGPU
32.1 fps +7%
Dell XPS 13 9340 Core Ultra 7
Intel Core Ultra 7 155H, Intel Arc 8-Core iGPU
30.8 fps +2%
Dell XPS 13 9350
Intel Core Ultra 7 256V, Intel Arc Graphics 140V
30.1 fps
Asus Zenbook S 14 UX5406
Intel Core Ultra 7 258V, Intel Arc Graphics 140V
29.8 fps -1%
Lenovo ThinkBook 13s G3 20YA0005GE
AMD Ryzen 7 5800U, AMD Radeon RX Vega 8 (Ryzen 4000/5000)
29.5 fps -2%
HP Dragonfly G4
Intel Core i7-1365U, Intel Iris Xe Graphics G7 96EUs
29.1 fps -3%
Dell XPS 13 Plus 9320 i5-1240p
Intel Core i5-1240P, Intel Iris Xe Graphics G7 80EUs
28.8 fps -4%
Asus ZenBook S13 OLED UX5304
Intel Core i7-1355U, Intel Iris Xe Graphics G7 96EUs
27.3 fps -9%
Lenovo Yoga 6 13 83B2001SGE
AMD Ryzen 7 7730U, AMD Radeon RX Vega 8 (Ryzen 4000/5000)
26.7 fps -11%
Dell XPS 13 9315 2-in-1 Core i5-1230U
Intel Core i5-1230U, Intel Iris Xe Graphics G7 80EUs
22 fps -27%
Far Cry 5
1280x720 Low Preset AA:T
Durchschnittliche Intel Arc Graphics 140V
  (47 - 99, n=9)
82.2 fps +3%
Dell XPS 13 9350
Intel Core Ultra 7 256V, Intel Arc Graphics 140V
80 (42min) fps
Asus Zenbook S 14 UX5406
Intel Core Ultra 7 258V, Intel Arc Graphics 140V
76 fps -5%
Framework Laptop 13.5 Ryzen 7 7840U
AMD Ryzen 7 7840U, AMD Radeon 780M
74 (63min) fps -7%
Lenovo ThinkBook 13x G4 21KR0008GE
Intel Core Ultra 5 125H, Intel Arc 7-Core iGPU
64 fps -20%
Dell XPS 13 Plus 9320 i5-1240p
Intel Core i5-1240P, Intel Iris Xe Graphics G7 80EUs
61 fps -24%
Dell XPS 13 Plus 9320 4K
Intel Core i7-1260P, Intel Iris Xe Graphics G7 96EUs
59 fps -26%
Asus Zenbook S 13 OLED
AMD Ryzen 7 6800U, AMD Radeon 680M
57 fps -29%
Dell XPS 13 9340 Core Ultra 7
Intel Core Ultra 7 155H, Intel Arc 8-Core iGPU
57 fps -29%
HP EliteBook x360 1040 G11
Intel Core Ultra 7 165H, Intel Arc 8-Core iGPU
51 (17min) fps -36%
Lenovo Yoga 6 13 83B2001SGE
AMD Ryzen 7 7730U, AMD Radeon RX Vega 8 (Ryzen 4000/5000)
47 (24min) fps -41%
MSI Prestige 13 AI Evo
Intel Core Ultra 7 155H, Intel Arc 8-Core iGPU
47 fps -41%
Asus ZenBook S13 OLED UX5304
Intel Core i7-1355U, Intel Iris Xe Graphics G7 96EUs
42 fps -47%
Dell XPS 13 9315, i5-1230U
Intel Core i5-1230U, Intel Iris Xe Graphics G7 80EUs
22 (12min) fps -72%
1920x1080 Medium Preset AA:T
Dell XPS 13 9350
Intel Core Ultra 7 256V, Intel Arc Graphics 140V
52 (40min) fps
Durchschnittliche Intel Arc Graphics 140V
  (31 - 59, n=9)
48.7 fps -6%
Asus Zenbook S 14 UX5406
Intel Core Ultra 7 258V, Intel Arc Graphics 140V
46 fps -12%
Framework Laptop 13.5 Ryzen 7 7840U
AMD Ryzen 7 7840U, AMD Radeon 780M
39 (21min) fps -25%
Lenovo ThinkBook 13x G4 21KR0008GE
Intel Core Ultra 5 125H, Intel Arc 7-Core iGPU
37 fps -29%
Asus Zenbook S 13 OLED
AMD Ryzen 7 6800U, AMD Radeon 680M
36 fps -31%
HP EliteBook x360 1040 G11
Intel Core Ultra 7 165H, Intel Arc 8-Core iGPU
36 (2min) fps -31%
MSI Prestige 13 AI Evo
Intel Core Ultra 7 155H, Intel Arc 8-Core iGPU
33 fps -37%
Dell XPS 13 9340 Core Ultra 7
Intel Core Ultra 7 155H, Intel Arc 8-Core iGPU
33 fps -37%
Dell XPS 13 Plus 9320 4K
Intel Core i7-1260P, Intel Iris Xe Graphics G7 96EUs
32 fps -38%
Dell XPS 13 Plus 9320 i5-1240p
Intel Core i5-1240P, Intel Iris Xe Graphics G7 80EUs
28 fps -46%
Asus ZenBook S13 OLED UX5304
Intel Core i7-1355U, Intel Iris Xe Graphics G7 96EUs
25 fps -52%
Lenovo Yoga 6 13 83B2001SGE
AMD Ryzen 7 7730U, AMD Radeon RX Vega 8 (Ryzen 4000/5000)
23 (14min) fps -56%
Dell XPS 13 9315, i5-1230U
Intel Core i5-1230U, Intel Iris Xe Graphics G7 80EUs
14 (11min) fps -73%
1920x1080 High Preset AA:T
Dell XPS 13 9350
Intel Core Ultra 7 256V, Intel Arc Graphics 140V
45 (35min) fps
Durchschnittliche Intel Arc Graphics 140V
  (28 - 54, n=9)
43.9 fps -2%
Asus Zenbook S 14 UX5406
Intel Core Ultra 7 258V, Intel Arc Graphics 140V
42 fps -7%
Framework Laptop 13.5 Ryzen 7 7840U
AMD Ryzen 7 7840U, AMD Radeon 780M
37 (33min) fps -18%
Lenovo ThinkBook 13x G4 21KR0008GE
Intel Core Ultra 5 125H, Intel Arc 7-Core iGPU
35 fps -22%
HP EliteBook x360 1040 G11
Intel Core Ultra 7 165H, Intel Arc 8-Core iGPU
34 (14min) fps -24%
Asus Zenbook S 13 OLED
AMD Ryzen 7 6800U, AMD Radeon 680M
33 fps -27%
MSI Prestige 13 AI Evo
Intel Core Ultra 7 155H, Intel Arc 8-Core iGPU
31 fps -31%
Dell XPS 13 9340 Core Ultra 7
Intel Core Ultra 7 155H, Intel Arc 8-Core iGPU
30 fps -33%
Dell XPS 13 Plus 9320 4K
Intel Core i7-1260P, Intel Iris Xe Graphics G7 96EUs
29 fps -36%
Asus ZenBook S13 OLED UX5304
Intel Core i7-1355U, Intel Iris Xe Graphics G7 96EUs
24 fps -47%
Lenovo Yoga 6 13 83B2001SGE
AMD Ryzen 7 7730U, AMD Radeon RX Vega 8 (Ryzen 4000/5000)
21 (3min) fps -53%
1920x1080 Ultra Preset AA:T
Dell XPS 13 9350
Intel Core Ultra 7 256V, Intel Arc Graphics 140V
42 (32min) fps
Durchschnittliche Intel Arc Graphics 140V
  (26 - 49, n=9)
40.4 fps -4%
Asus Zenbook S 14 UX5406
Intel Core Ultra 7 258V, Intel Arc Graphics 140V
38 fps -10%
Framework Laptop 13.5 Ryzen 7 7840U
AMD Ryzen 7 7840U, AMD Radeon 780M
35 (29min) fps -17%
HP EliteBook x360 1040 G11
Intel Core Ultra 7 165H, Intel Arc 8-Core iGPU
32 (16min) fps -24%
Asus Zenbook S 13 OLED
AMD Ryzen 7 6800U, AMD Radeon 680M
31 fps -26%
Lenovo ThinkBook 13x G4 21KR0008GE
Intel Core Ultra 5 125H, Intel Arc 7-Core iGPU
31 fps -26%
MSI Prestige 13 AI Evo
Intel Core Ultra 7 155H, Intel Arc 8-Core iGPU
28 fps -33%
Dell XPS 13 9340 Core Ultra 7
Intel Core Ultra 7 155H, Intel Arc 8-Core iGPU
28 fps -33%
Dell XPS 13 Plus 9320 4K
Intel Core i7-1260P, Intel Iris Xe Graphics G7 96EUs
26 fps -38%
Asus ZenBook S13 OLED UX5304
Intel Core i7-1355U, Intel Iris Xe Graphics G7 96EUs
22 fps -48%
Lenovo Yoga 6 13 83B2001SGE
AMD Ryzen 7 7730U, AMD Radeon RX Vega 8 (Ryzen 4000/5000)
20 (5min) fps -52%
Strange Brigade
1280x720 lowest AF:1
Durchschnittliche Intel Arc Graphics 140V
  (138.1 - 236, n=8)
203 fps +1%
Dell XPS 13 9350
Intel Core Ultra 7 256V, Intel Arc Graphics 140V
201 (47.5min, 157.9P1) fps
Asus Zenbook S 14 UX5406
Intel Core Ultra 7 258V, Intel Arc Graphics 140V
196.8 (81.1min, 132.4P1) fps -2%
HP EliteBook x360 1040 G11
Intel Core Ultra 7 165H, Intel Arc 8-Core iGPU
178 (42.7min, 127.4P1) fps -11%
Dell XPS 13 9340 Core Ultra 7
Intel Core Ultra 7 155H, Intel Arc 8-Core iGPU
156 fps -22%
Lenovo ThinkBook 13x G4 21KR0008GE
Intel Core Ultra 5 125H, Intel Arc 7-Core iGPU
141 fps -30%
Framework Laptop 13.5 Ryzen 7 7840U
AMD Ryzen 7 7840U, AMD Radeon 780M
139.8 (37.5min, 114.3P1) fps -30%
Asus Zenbook S 13 OLED
AMD Ryzen 7 6800U, AMD Radeon 680M
125.1 (80.9min, 106.8P1) fps -38%
MSI Prestige 13 AI Evo
Intel Core Ultra 7 155H, Intel Arc 8-Core iGPU
121 fps -40%
Dell XPS 13 Plus 9320 i7-1280P OLED
Intel Core i7-1280P, Intel Iris Xe Graphics G7 96EUs
100.2 (22.5min, 36.9P1) fps -50%
Dell XPS 13 Plus 9320 4K
Intel Core i7-1260P, Intel Iris Xe Graphics G7 96EUs
95.2 (21min, 33.1P1) fps -53%
Dell XPS 13 Plus 9320 Core i7-1360P
Intel Core i7-1360P, Intel Iris Xe Graphics G7 96EUs
93.9 (20.3min, 37.7P1) fps -53%
HP Dragonfly G4
Intel Core i7-1365U, Intel Iris Xe Graphics G7 96EUs
88.8 (19.5min, 29.6P1) fps -56%
Asus ZenBook S13 OLED UX5304
Intel Core i7-1355U, Intel Iris Xe Graphics G7 96EUs
88.4 (19.8min, 31.6P1) fps -56%
Lenovo Yoga 6 13 83B2001SGE
AMD Ryzen 7 7730U, AMD Radeon RX Vega 8 (Ryzen 4000/5000)
86.4 (40.5min, 74.7P1) fps -57%
Dell XPS 13 Plus 9320 i5-1240p
Intel Core i5-1240P, Intel Iris Xe Graphics G7 80EUs
67.7 (15.5min, 23.7P1) fps -66%
Dell XPS 13 9315, i5-1230U
Intel Core i5-1230U, Intel Iris Xe Graphics G7 80EUs
47.5 (10.8min, 14.4P1) fps -76%
1920x1080 medium AA:medium AF:4
Dell XPS 13 9350
Intel Core Ultra 7 256V, Intel Arc Graphics 140V
84.4 (36.1min, 70.5P1) fps
HP EliteBook x360 1040 G11
Intel Core Ultra 7 165H, Intel Arc 8-Core iGPU
77.4 (25.7min, 64.2P1) fps -8%
Asus Zenbook S 14 UX5406
Intel Core Ultra 7 258V, Intel Arc Graphics 140V
77.4 (58.1min, 66.4P1) fps -8%
Durchschnittliche Intel Arc Graphics 140V
  (55.5 - 84.4, n=8)
75.4 fps -11%
Dell XPS 13 9340 Core Ultra 7
Intel Core Ultra 7 155H, Intel Arc 8-Core iGPU
68 fps -19%
Lenovo ThinkBook 13x G4 21KR0008GE
Intel Core Ultra 5 125H, Intel Arc 7-Core iGPU
68 fps -19%
Framework Laptop 13.5 Ryzen 7 7840U
AMD Ryzen 7 7840U, AMD Radeon 780M
59.7 (18.3min, 51.4P1) fps -29%
Asus Zenbook S 13 OLED
AMD Ryzen 7 6800U, AMD Radeon 680M
54.7 (25.4min, 48.7P1) fps -35%
MSI Prestige 13 AI Evo
Intel Core Ultra 7 155H, Intel Arc 8-Core iGPU
53 fps -37%
Dell XPS 13 Plus 9320 4K
Intel Core i7-1260P, Intel Iris Xe Graphics G7 96EUs
45.9 (21.6min, 25.1P1) fps -46%
Dell XPS 13 Plus 9320 i7-1280P OLED
Intel Core i7-1280P, Intel Iris Xe Graphics G7 96EUs
45.4 (16.6min, 25.1P1) fps -46%
Dell XPS 13 Plus 9320 Core i7-1360P
Intel Core i7-1360P, Intel Iris Xe Graphics G7 96EUs
43.8 (15.4min, 25.5P1) fps -48%
HP Dragonfly G4
Intel Core i7-1365U, Intel Iris Xe Graphics G7 96EUs
38.4 (17.6min, 22.1P1) fps -55%
Asus ZenBook S13 OLED UX5304
Intel Core i7-1355U, Intel Iris Xe Graphics G7 96EUs
37.8 (13.2min, 21.5P1) fps -55%
Lenovo Yoga 6 13 83B2001SGE
AMD Ryzen 7 7730U, AMD Radeon RX Vega 8 (Ryzen 4000/5000)
33.8 (18min, 29.4P1) fps -60%
Dell XPS 13 Plus 9320 i5-1240p
Intel Core i5-1240P, Intel Iris Xe Graphics G7 80EUs
30.7 (10.4min, 16.6P1) fps -64%
Dell XPS 13 9315, i5-1230U
Intel Core i5-1230U, Intel Iris Xe Graphics G7 80EUs
6 (5min, 5P1) fps -93%
1920x1080 high AA:high AF:8
Dell XPS 13 9350
Intel Core Ultra 7 256V, Intel Arc Graphics 140V
65.2 (28.3min, 51P1) fps
Asus Zenbook S 14 UX5406
Intel Core Ultra 7 258V, Intel Arc Graphics 140V
65.1 (39.9min, 50.6P1) fps 0%
Durchschnittliche Intel Arc Graphics 140V
  (45.3 - 68.8, n=8)
62.4 fps -4%
HP EliteBook x360 1040 G11
Intel Core Ultra 7 165H, Intel Arc 8-Core iGPU
61.7 (7min, 34.8P1) fps -5%
Dell XPS 13 9340 Core Ultra 7
Intel Core Ultra 7 155H, Intel Arc 8-Core iGPU
54 fps -17%
Lenovo ThinkBook 13x G4 21KR0008GE
Intel Core Ultra 5 125H, Intel Arc 7-Core iGPU
54 fps -17%
Framework Laptop 13.5 Ryzen 7 7840U
AMD Ryzen 7 7840U, AMD Radeon 780M
50.5 (17.2min, 27.8P1) fps -23%
Asus Zenbook S 13 OLED
AMD Ryzen 7 6800U, AMD Radeon 680M
46.6 (33.8min, 36.4P1) fps -29%
MSI Prestige 13 AI Evo
Intel Core Ultra 7 155H, Intel Arc 8-Core iGPU
41 fps -37%
Dell XPS 13 Plus 9320 i7-1280P OLED
Intel Core i7-1280P, Intel Iris Xe Graphics G7 96EUs
36.5 (18min, 19.9P1) fps -44%
Dell XPS 13 Plus 9320 4K
Intel Core i7-1260P, Intel Iris Xe Graphics G7 96EUs
36.4 (9.7min, 20.1P1) fps -44%
Dell XPS 13 Plus 9320 Core i7-1360P
Intel Core i7-1360P, Intel Iris Xe Graphics G7 96EUs
35.4 (5.4min, 17.4P1) fps -46%
HP Dragonfly G4
Intel Core i7-1365U, Intel Iris Xe Graphics G7 96EUs
30.4 (8.5min, 15.4P1) fps -53%
Asus ZenBook S13 OLED UX5304
Intel Core i7-1355U, Intel Iris Xe Graphics G7 96EUs
29.1 (8.4min, 14.7P1) fps -55%
Lenovo Yoga 6 13 83B2001SGE
AMD Ryzen 7 7730U, AMD Radeon RX Vega 8 (Ryzen 4000/5000)
27 (5.5min, 8.17P1) fps -59%
Dell XPS 13 Plus 9320 i5-1240p
Intel Core i5-1240P, Intel Iris Xe Graphics G7 80EUs
24.4 (8.4min, 13.2P1) fps -63%
Dell XPS 13 9315, i5-1230U
Intel Core i5-1230U, Intel Iris Xe Graphics G7 80EUs
17.8 (6.6min, 9.19P1) fps -73%
1920x1080 ultra AA:ultra AF:16
Dell XPS 13 9350
Intel Core Ultra 7 256V, Intel Arc Graphics 140V
58 (24.7min, 30.7P1) fps
Durchschnittliche Intel Arc Graphics 140V
  (39 - 60.6, n=8)
54.2 fps -7%
Asus Zenbook S 14 UX5406
Intel Core Ultra 7 258V, Intel Arc Graphics 140V
54 (32min, 42.8P1) fps -7%
HP EliteBook x360 1040 G11
Intel Core Ultra 7 165H, Intel Arc 8-Core iGPU
47.3 (5.3min, 10.1P1) fps -18%
Lenovo ThinkBook 13x G4 21KR0008GE
Intel Core Ultra 5 125H, Intel Arc 7-Core iGPU
44 fps -24%
Framework Laptop 13.5 Ryzen 7 7840U
AMD Ryzen 7 7840U, AMD Radeon 780M
43 (13.6min, 21.3P1) fps -26%
Dell XPS 13 9340 Core Ultra 7
Intel Core Ultra 7 155H, Intel Arc 8-Core iGPU
41 fps -29%
Asus Zenbook S 13 OLED
AMD Ryzen 7 6800U, AMD Radeon 680M
40.2 (17.3min, 27.4P1) fps -31%
MSI Prestige 13 AI Evo
Intel Core Ultra 7 155H, Intel Arc 8-Core iGPU
32 fps -45%
Dell XPS 13 Plus 9320 i7-1280P OLED
Intel Core i7-1280P, Intel Iris Xe Graphics G7 96EUs
29.6 (9min, 10.7P1) fps -49%
Dell XPS 13 Plus 9320 4K
Intel Core i7-1260P, Intel Iris Xe Graphics G7 96EUs
29.5 (8.2min, 10.5P1) fps -49%
Dell XPS 13 Plus 9320 Core i7-1360P
Intel Core i7-1360P, Intel Iris Xe Graphics G7 96EUs
27.5 (5.6min, 7.31P1) fps -53%
HP Dragonfly G4
Intel Core i7-1365U, Intel Iris Xe Graphics G7 96EUs
24.7 (5.3min, 6.86P1) fps -57%
Asus ZenBook S13 OLED UX5304
Intel Core i7-1355U, Intel Iris Xe Graphics G7 96EUs
23.6 (5min, 6.37P1) fps -59%
Lenovo Yoga 6 13 83B2001SGE
AMD Ryzen 7 7730U, AMD Radeon RX Vega 8 (Ryzen 4000/5000)
22.7 (5min, 5.54P1) fps -61%
Tiny Tina's Wonderlands - 1280x720 Lowest Preset (DX12)
Framework Laptop 13.5 Ryzen 7 7840U
AMD Ryzen 7 7840U, AMD Radeon 780M
111.8 fps +15%
Durchschnittliche Intel Arc Graphics 140V
  (96.9 - 100.3, n=2)
98.6 fps +2%
Dell XPS 13 9350
Intel Core Ultra 7 256V, Intel Arc Graphics 140V
96.9 fps
HP EliteBook x360 1040 G11
Intel Core Ultra 7 165H, Intel Arc 8-Core iGPU
80 fps -17%
Dell XPS 13 Plus 9320 Core i7-1360P
Intel Core i7-1360P, Intel Iris Xe Graphics G7 96EUs
53.5 fps -45%
HP Dragonfly G4
Intel Core i7-1365U, Intel Iris Xe Graphics G7 96EUs
53.2 fps -45%
F1 22
1280x720 Ultra Low Preset AA:T AF:16x
Framework Laptop 13.5 Ryzen 7 7840U
AMD Ryzen 7 7840U, AMD Radeon 780M
133.2 (110min, 87P1) fps +1%
Durchschnittliche Intel Arc Graphics 140V
  (132.4 - 132.5, n=2)
132.5 fps 0%
Dell XPS 13 9350
Intel Core Ultra 7 256V, Intel Arc Graphics 140V
132.4 (101min, 88P1) fps
HP EliteBook x360 1040 G11
Intel Core Ultra 7 165H, Intel Arc 8-Core iGPU
104.5 (86min, 78P1) fps -21%
MSI Prestige 13 AI Evo
Intel Core Ultra 7 155H, Intel Arc 8-Core iGPU
86.6 (72min, 63P1) fps -35%
Dell XPS 13 Plus 9320 Core i7-1360P
Intel Core i7-1360P, Intel Iris Xe Graphics G7 96EUs
81.5 (61min, 60P1) fps -38%
HP Dragonfly G4
Intel Core i7-1365U, Intel Iris Xe Graphics G7 96EUs
75.8 (55min, 56P1) fps -43%
Asus ZenBook S13 OLED UX5304
Intel Core i7-1355U, Intel Iris Xe Graphics G7 96EUs
71.8 (54min, 54P1) fps -46%
1920x1080 Low Preset AA:T AF:16x
Durchschnittliche Intel Arc Graphics 140V
  (79.1 - 85.3, n=2)
82.2 fps +4%
Framework Laptop 13.5 Ryzen 7 7840U
AMD Ryzen 7 7840U, AMD Radeon 780M
80.6 (70min, 55P1) fps +2%
Dell XPS 13 9350
Intel Core Ultra 7 256V, Intel Arc Graphics 140V
79.1 (63min, 61P1) fps
HP EliteBook x360 1040 G11
Intel Core Ultra 7 165H, Intel Arc 8-Core iGPU
71 (57min, 52P1) fps -10%
MSI Prestige 13 AI Evo
Intel Core Ultra 7 155H, Intel Arc 8-Core iGPU
59.1 (46min, 44P1) fps -25%
Dell XPS 13 Plus 9320 Core i7-1360P
Intel Core i7-1360P, Intel Iris Xe Graphics G7 96EUs
47.5 (40min, 37P1) fps -40%
HP Dragonfly G4
Intel Core i7-1365U, Intel Iris Xe Graphics G7 96EUs
43.6 (34min, 31P1) fps -45%
Asus ZenBook S13 OLED UX5304
Intel Core i7-1355U, Intel Iris Xe Graphics G7 96EUs
41.6 (33min, 31P1) fps -47%
Lenovo Yoga 6 13 83B2001SGE
AMD Ryzen 7 7730U, AMD Radeon RX Vega 8 (Ryzen 4000/5000)
35.1 (29min, 25P1) fps -56%
1920x1080 Medium Preset AA:T AF:16x
Dell XPS 13 9350
Intel Core Ultra 7 256V, Intel Arc Graphics 140V
78.8 (37min, 40P1) fps
Durchschnittliche Intel Arc Graphics 140V
  (75.7 - 78.8, n=2)
77.3 fps -2%
Framework Laptop 13.5 Ryzen 7 7840U
AMD Ryzen 7 7840U, AMD Radeon 780M
72.5 (58min, 45P1) fps -8%
HP EliteBook x360 1040 G11
Intel Core Ultra 7 165H, Intel Arc 8-Core iGPU
57.5 (49min, 37P1) fps -27%
MSI Prestige 13 AI Evo
Intel Core Ultra 7 155H, Intel Arc 8-Core iGPU
49.6 (41min, 37P1) fps -37%
Dell XPS 13 Plus 9320 Core i7-1360P
Intel Core i7-1360P, Intel Iris Xe Graphics G7 96EUs
42.8 (37min, 36P1) fps -46%
HP Dragonfly G4
Intel Core i7-1365U, Intel Iris Xe Graphics G7 96EUs
39.4 (33min, 30P1) fps -50%
Asus ZenBook S13 OLED UX5304
Intel Core i7-1355U, Intel Iris Xe Graphics G7 96EUs
36.6 (31min, 28P1) fps -54%
Lenovo Yoga 6 13 83B2001SGE
AMD Ryzen 7 7730U, AMD Radeon RX Vega 8 (Ryzen 4000/5000)
32.5 (26min, 24P1) fps -59%
1920x1080 High Preset AA:T AF:16x
Dell XPS 13 9350
Intel Core Ultra 7 256V, Intel Arc Graphics 140V
64.5 (45min, 43P1) fps
Durchschnittliche Intel Arc Graphics 140V
  (54.8 - 64.5, n=2)
59.7 fps -7%
Framework Laptop 13.5 Ryzen 7 7840U
AMD Ryzen 7 7840U, AMD Radeon 780M
54.2 (44min, 35P1) fps -16%
HP EliteBook x360 1040 G11
Intel Core Ultra 7 165H, Intel Arc 8-Core iGPU
43.5 (30min, 27P1) fps -33%
MSI Prestige 13 AI Evo
Intel Core Ultra 7 155H, Intel Arc 8-Core iGPU
36.8 (30min, 29P1) fps -43%
Dell XPS 13 Plus 9320 Core i7-1360P
Intel Core i7-1360P, Intel Iris Xe Graphics G7 96EUs
31.9 (24min, 26P1) fps -51%
Asus ZenBook S13 OLED UX5304
Intel Core i7-1355U, Intel Iris Xe Graphics G7 96EUs
27.6 (21min, 21P1) fps -57%
HP Dragonfly G4
Intel Core i7-1365U, Intel Iris Xe Graphics G7 96EUs
27.4 (22min, 22P1) fps -58%
Lenovo Yoga 6 13 83B2001SGE
AMD Ryzen 7 7730U, AMD Radeon RX Vega 8 (Ryzen 4000/5000)
23.6 (21min, 19P1) fps -63%
Cyberpunk 2077 2.1 Phantom Liberty
1280x720 Low Preset (FSR off)
Dell XPS 13 9350
Intel Core Ultra 7 256V, Intel Arc Graphics 140V
66.6 (50.2min) fps
Durchschnittliche Intel Arc Graphics 140V
  (58.8 - 67.7, n=3)
64.4 fps -3%
HP EliteBook x360 1040 G11
Intel Core Ultra 7 165H, Intel Arc 8-Core iGPU
48.9 (41min) fps -27%
1920x1080 Low Preset (FSR off)
Dell XPS 13 9350
Intel Core Ultra 7 256V, Intel Arc Graphics 140V
45.7 (36.4min) fps
Durchschnittliche Intel Arc Graphics 140V
  (30.5 - 47.3, n=9)
41.4 fps -9%
Asus Zenbook S 14 UX5406
Intel Core Ultra 7 258V, Intel Arc Graphics 140V
39.6 (31.4min) fps -13%
HP EliteBook x360 1040 G11
Intel Core Ultra 7 165H, Intel Arc 8-Core iGPU
31.5 (26.7min) fps -31%
Lenovo ThinkBook 13x G4 21KR0008GE
Intel Core Ultra 5 125H, Intel Arc 7-Core iGPU
23.2 (13.7min) fps -49%
1920x1080 Medium Preset (FSR off)
Dell XPS 13 9350
Intel Core Ultra 7 256V, Intel Arc Graphics 140V
37 (30.1min) fps
Durchschnittliche Intel Arc Graphics 140V
  (24.3 - 39.3, n=9)
34.3 fps -7%
Asus Zenbook S 14 UX5406
Intel Core Ultra 7 258V, Intel Arc Graphics 140V
31.7 (26.7min) fps -14%
HP EliteBook x360 1040 G11
Intel Core Ultra 7 165H, Intel Arc 8-Core iGPU
25.7 (22.2min) fps -31%
Lenovo ThinkBook 13x G4 21KR0008GE
Intel Core Ultra 5 125H, Intel Arc 7-Core iGPU
19.8 (11.5min) fps -46%
1920x1080 High Preset (FSR off)
Dell XPS 13 9350
Intel Core Ultra 7 256V, Intel Arc Graphics 140V
32 (26.2min) fps
Durchschnittliche Intel Arc Graphics 140V
  (20 - 34.4, n=9)
29.1 fps -9%
Asus Zenbook S 14 UX5406
Intel Core Ultra 7 258V, Intel Arc Graphics 140V
27.7 (22.8min) fps -13%
HP EliteBook x360 1040 G11
Intel Core Ultra 7 165H, Intel Arc 8-Core iGPU
23.9 (20.8min) fps -25%
Lenovo ThinkBook 13x G4 21KR0008GE
Intel Core Ultra 5 125H, Intel Arc 7-Core iGPU
16.6 (8.88min) fps -48%
1920x1080 Ultra Preset (FSR off)
Asus Zenbook S 14 UX5406
Intel Core Ultra 7 258V, Intel Arc Graphics 140V
24.3 (19.9min) fps +27%
Durchschnittliche Intel Arc Graphics 140V
  (17.5 - 30.1, n=9)
23.9 fps +25%
HP EliteBook x360 1040 G11
Intel Core Ultra 7 165H, Intel Arc 8-Core iGPU
21.6 (18.5min) fps +13%
Dell XPS 13 9350
Intel Core Ultra 7 256V, Intel Arc Graphics 140V
19.1 (15.5min) fps
Lenovo ThinkBook 13x G4 21KR0008GE
Intel Core Ultra 5 125H, Intel Arc 7-Core iGPU
14.8 (7.18min) fps -23%

Cyberpunk 2077 ultra FPS-Diagramm

05101520Tooltip
Dell XPS 13 9350 Core Ultra 7 256V, Arc 140V: Ø22.2 (18.3-23.3)
min.mittelhochmax.
GTA V (2015) 154.9 149.4 60.8 25.6
Dota 2 Reborn (2015) 95.8 87 83 80.7
Final Fantasy XV Benchmark (2018) 79.4 46.1 31.5
X-Plane 11.11 (2018) 47.1 36.1 30.1
Far Cry 5 (2018) 80 52 45 42
Strange Brigade (2018) 201 84.4 65.2 58
Tiny Tina's Wonderlands (2022)
F1 22 (2022) 79.1 78.8 64.5
Baldur's Gate 3 (2023) 36.6 30.5 25.8 25.7
Cyberpunk 2077 2.1 Phantom Liberty (2023) 45.7 37 32 19.1

Emissionen

Geräuschemissionen

Die internen Lüfter sind sogar noch leiser als zuvor, da sie bei höherer Last viel länger im Leerlauf bleiben. Zum Beispiel erreicht das Lüftergeräusch nach der ersten Benchmark-Szene im 3DMark 06 nur 26,2 dB(A), verglichen mit 35 dB(A) bzw. 37 dB(A) beim älteren XPS 13 9320 bzw. XPS 13 9340.

Bei Spielen beträgt das Lüftergeräusch selbst im Performance-Modus nur 34 dB(A), kann aber auf bis zu 45 dB(A) ansteigen, wenn die CPU zu 100 Prozent ausgelastet ist, wie z. B. bei Prime95-Stresstests. Im Balanced-Modus anstelle des Performance-Modus würde die Geräuschgrenze des Lüfters auf 33 bis 38 dB(A) sinken.

Lüftergeräuschprofil (Weiß: Hintergrund, Rot: System im Leerlauf, Blau: 3DMark 06, Orange: Cyberpunk 2077, Grün: Prime95 Stresstest)

Lautstärkediagramm

Idle
24.4 / 24.4 / 24.4 dB(A)
Last
26.2 / 45.2 dB(A)
  red to green bar
 
 
30 dB
leise
40 dB(A)
deutlich hörbar
50 dB(A)
störend
 
min: dark, med: mid, max: light   Earthworks M23R, Arta (aus 15 cm gemessen)   Umgebungsgeräusche: 24.1 dB(A)
dB(A) 0102030405060708090Deep BassMiddle BassHigh BassLower RangeMidsHigher MidsLower HighsMid HighsUpper HighsSuper Highs2039.836.835.936.638.22527.427.224.927.325.73124.826.422.123.724.44021.722.220.118.821.65025.924.221.222.724.16324.424232424.38028.428.726.226.327.810024.424.222.922.623.712520.919.41918.32416020.12018.617.421.920021.12019.717.322.325021.218.718.317.62631523.62321.62126.940023.219.218.11730.4500231715.814.23163021.515.213.613.632.180020.311.811.210.732.2100022.910.59.89.731.9125022.79.79.49.533.3160022.39.89.69.534.7200022.710.39.89.934.5250022.910.91010.134.8315023.812.310.510.634.6400024.21410.81134.7500021.515.311.511.633.4630019.51511.411.432.7800018.314.711.711.529.71000013.614.311.811.527.71250013.113.512.611.924.61600012.512.612.51119.2SPL34.226.224.424.145.2N20.80.60.65.1median 21.5median 14.7median 11.8median 11.5median 31Delta1.94.14.13.14.5hearing rangehide median Fan NoiseDell XPS 13 9350
Dell XPS 13 9350
Arc 140V, Core Ultra 7 256V, Micron 2550 512GB
Dell XPS 13 Plus 9320 i7-1280P OLED
Iris Xe G7 96EUs, i7-1280P, WDC PC SN810 512GB
Lenovo ThinkBook 13x G4 21KR0008GE
Arc 7-Core, Ultra 5 125H, Samsung PM9C1a MZAL8512HDLU
HP Dragonfly G4
Iris Xe G7 96EUs, i7-1365U, Micron 3400 MTFDKBA512TFH 512GB
Asus ZenBook S13 OLED UX5304
Iris Xe G7 96EUs, i7-1355U, Samsung PM9A1 MZVL21T0HCLR
MSI Prestige 13 AI Evo
Arc 8-Core, Ultra 7 155H, Samsung PM9A1 MZVL21T0HCLR
Geräuschentwicklung
-1%
-5%
3%
-3%
-4%
aus / Umgebung *
24.1
23.4
3%
24.5
-2%
23.3
3%
23.3
3%
23.4
3%
Idle min *
24.4
23.4
4%
24.5
-0%
23.5
4%
23.3
5%
23.4
4%
Idle avg *
24.4
23.4
4%
24.5
-0%
23.5
4%
23.3
5%
26.9
-10%
Idle max *
24.4
23.4
4%
27.1
-11%
26.8
-10%
23.3
5%
26.9
-10%
Last avg *
26.2
35
-34%
33.3
-27%
27.2
-4%
37.7
-44%
32
-22%
Cyberpunk 2077 ultra *
34.2
Last max *
45.2
39.9
12%
40.7
10%
35
23%
40.1
11%
40.3
11%
Witcher 3 ultra *
41.6
36.8
32.7
40.1
32

* ... kleinere Werte sind besser

Temperatur

Die Oberflächentemperaturen sind eine bemerkenswerte Verbesserung gegenüber älteren Optionen, einschließlich des aktuellen XPS 13 9340. Heiße Stellen auf der Tastatur und der unteren Abdeckung erreichen nur 35 °C bzw. 38 °C, verglichen mit 41 °C und 44 °C beim XPS 13 9340 bei ähnlich anspruchsvoller Belastung. Einer unserer Kritikpunkte am neuen XPS 13 Design waren die relativ hohen Oberflächentemperaturen, aber das XPS 13 9350 ist definitiv eine der kühleren Iterationen bis jetzt.

Das Netzteil erreicht bei anspruchsvollen Lasten über 35 °C
Zwei Lüftungsschächte hinten
Max. Last
 28 °C34.8 °C34.2 °C 
 23.6 °C28 °C26.8 °C 
 26.2 °C26.6 °C27.6 °C 
Maximal: 34.8 °C
Durchschnitt: 28.4 °C
35.8 °C37.4 °C34.4 °C
31.2 °C35.8 °C32.6 °C
29.2 °C30.8 °C29.2 °C
Maximal: 37.4 °C
Durchschnitt: 32.9 °C
Netzteil (max.)  37.4 °C | Raumtemperatur 20 °C | Fluke 62 Mini IR Thermometer
(+) Die Durchschnittstemperatur auf der Oberseite unter extremer Last ist 28.4 °C. Im Vergleich erhitzte sich der Durchschnitt der Geräteklasse Subnotebook auf 30.8 °C.
(+) Die maximale Temperatur auf der Oberseite ist 34.8 °C. Im Vergleich liegt der Klassendurchschnitt bei 36.1 °C (von 21.4 bis 281 °C für die Klasse Subnotebook).
(+) Auf der Unterseite messen wir eine maximalen Wert von 37.4 °C (im Vergleich zum Durchschnitt von 39.4 °C).
(+) Ohne Last messen wir eine durchschnittliche Temperatur von 24.9 °C auf der Oberseite. Der Klassendurchschnitt erreicht 30.8 °C.
(+) Die Handballen und der Touchpad-Bereich sind mit gemessenen 27.6 °C kühler als die typische Hauttemperatur und fühlen sich dadurch kühl an.
(±) Die durchschnittliche Handballen-Temperatur anderer getesteter Geräte war 28.3 °C (+0.7 °C).
System im Leerlauf (Abdeckung-C)
System im Leerlauf (Abdeckung-D)
Prime95+FurMark Stresstest (Abdeckung-C)
Prime95+FurMark Stresstest (Abdeckung-D)
Dell XPS 13 9350
Intel Core Ultra 7 256V, Intel Arc Graphics 140V
Dell XPS 13 9340 Core Ultra 7
Intel Core Ultra 7 155H, Intel Arc 8-Core iGPU
Lenovo ThinkBook 13x G4 21KR0008GE
Intel Core Ultra 5 125H, Intel Arc 7-Core iGPU
HP Dragonfly G4
Intel Core i7-1365U, Intel Iris Xe Graphics G7 96EUs
Asus ZenBook S13 OLED UX5304
Intel Core i7-1355U, Intel Iris Xe Graphics G7 96EUs
MSI Prestige 13 AI Evo
Intel Core Ultra 7 155H, Intel Arc 8-Core iGPU
Hitze
-8%
-12%
-10%
-14%
-5%
Last oben max *
34.8
41
-18%
43.1
-24%
38.6
-11%
43.1
-24%
40.9
-18%
Last unten max *
37.4
43.5
-16%
39.2
-5%
40.4
-8%
45
-20%
40.4
-8%
Idle oben max *
25.4
25.3
-0%
28.3
-11%
28.2
-11%
27.3
-7%
25
2%
Idle unten max *
26.2
25.5
3%
28
-7%
29
-11%
27.8
-6%
25.5
3%

* ... kleinere Werte sind besser

Lautsprecher

Pink noise zeigt eine ordentliche maximale Lautstärke für die Größe, aber mit schwacher Basswiedergabe. Die HP Spectre-Serie bietet sowohl eine breitere als auch lautere Audiowiedergabe
dB(A) 0102030405060708090Deep BassMiddle BassHigh BassLower RangeMidsHigher MidsLower HighsMid HighsUpper HighsSuper Highs2036.135.936.12527.624.927.63125.122.125.14020.320.120.35023.921.223.96328.82328.88039.926.239.910049.422.949.412552.11952.116059.818.659.820061.419.761.425058.218.358.231556.621.656.640056.518.156.550064.115.864.163068.213.668.280071.611.271.6100073.39.873.3125069.99.469.9160073.89.673.82000739.873250072.91072.9315072.710.572.7400067.110.867.1500066.111.566.1630067.411.467.4800057.111.757.11000057.511.857.51250059.612.659.61600064.812.564.8SPL82.624.482.6N53.60.653.6median 64.8median 11.8median 64.8Delta6.94.16.926.325.821.422.12624.925.127.622.532.523.448.72655.818.860.922.167.2267019.372.317.674.217.774.319.575.31571.711.871.311.27410.574.21072.710.17210.67210.97511.374.811.671.71269.71269.612.371.112.669.61270.111.269.824.784.70.666.6median 12median 71.73.42.2hearing rangehide median Pink NoiseDell XPS 13 9350Apple MacBook Pro 16 2021 M1 Pro
Frequenzdiagramm (für Vergleiche die Checkboxen oben an-/abwählen)
Dell XPS 13 9350 Audio Analyse

(+) | Die Lautsprecher können relativ laut spielen (82.6 dB)
Bass 100 - 315 Hz
(±) | abgesenkter Bass - 8.5% geringer als der Median
(±) | durchschnittlich lineare Bass-Wiedergabe (8.3% Delta zum Vorgänger)
Mitteltöne 400 - 2000 Hz
(±) | zu hohe Mitten, vom Median 6.2% abweichend
(+) | lineare Mitten (5.9% Delta zum Vorgänger)
Hochtöne 2 - 16 kHz
(±) | zu hohe Hochtöne, vom Median nur 5.3% abweichend
(+) | sehr lineare Hochtöne (5.1% Delta zum Vorgänger)
Gesamt im hörbaren Bereich 100 - 16.000 Hz
(+) | hörbarer Bereich ist sehr linear (13% Abstand zum Median
Im Vergleich zu allen Geräten derselben Klasse
» 18% aller getesteten Geräte dieser Klasse waren besser, 3% vergleichbar, 79% schlechter
» Das beste Gerät hat einen Delta-Wert von 5%, durchschnittlich ist 19%, das schlechteste Gerät hat 53%
Im Vergleich zu allen Geräten im Test
» 11% aller getesteten Geräte waren besser, 2% vergleichbar, 87% schlechter
» Das beste Gerät hat einen Delta-Wert von 4%, durchschnittlich ist 25%, das schlechteste Gerät hat 134%

Apple MacBook Pro 16 2021 M1 Pro Audio Analyse

(+) | Die Lautsprecher können relativ laut spielen (84.7 dB)
Bass 100 - 315 Hz
(+) | guter Bass - nur 3.8% Abweichung vom Median
(+) | lineare Bass-Wiedergabe (5.2% Delta zum Vorgänger)
Mitteltöne 400 - 2000 Hz
(+) | ausgeglichene Mitten, vom Median nur 1.3% abweichend
(+) | lineare Mitten (2.1% Delta zum Vorgänger)
Hochtöne 2 - 16 kHz
(+) | ausgeglichene Hochtöne, vom Median nur 1.9% abweichend
(+) | sehr lineare Hochtöne (2.7% Delta zum Vorgänger)
Gesamt im hörbaren Bereich 100 - 16.000 Hz
(+) | hörbarer Bereich ist sehr linear (4.6% Abstand zum Median
Im Vergleich zu allen Geräten derselben Klasse
» 0% aller getesteten Geräte dieser Klasse waren besser, 0% vergleichbar, 100% schlechter
» Das beste Gerät hat einen Delta-Wert von 5%, durchschnittlich ist 18%, das schlechteste Gerät hat 45%
Im Vergleich zu allen Geräten im Test
» 0% aller getesteten Geräte waren besser, 0% vergleichbar, 100% schlechter
» Das beste Gerät hat einen Delta-Wert von 4%, durchschnittlich ist 25%, das schlechteste Gerät hat 134%

Energieverwaltung

Energieaufnahme

Der Verbrauch liegt bei nur <1,4 W bei der niedrigsten Helligkeitseinstellung und steigt auf bis zu 5 W bei maximaler Helligkeit im Performance-Modus. Die niedrigen Leerlaufwerte sind wahrscheinlich für die sehr lange WLAN-Laufzeit in unserem Abschnitt zur Akkulaufzeit verantwortlich. Alternative 13-Zoll-Notebooks wie das Lenovo ThinkBook 13x oder das HP Dragonfly G4 haben vergleichsweise um einige Watt höhere Minimal- und Maximalwerte.

Beim Spielen benötigt das System 46 W, was fast 10 W mehr ist als bei konkurrierenden 13-Zoll-Subnotebooks wie den oben genannten. Allerdings bietet das Dell-System eine deutlich schnellere Grafikleistung, wie in unserem Abschnitt über die GPU-Leistung erwähnt, und daher ist der höhere Verbrauch aus Sicht der Leistung pro Watt wohl gerechtfertigt.

Das besonders kleine (~6,5 x 5,5 x 2,2 cm) 60-W-USB-C-Netzteil kann gleichzeitig anspruchsvolle Lasten und Akkuladung unterstützen. Der Verbrauch kann über 55 W erreichen, wenn die CPU zu 100 Prozent ausgelastet ist, aber dieser Wert ist nur vorübergehend, wie die Screenshots unten zeigen.

3DMark 06, Verbrauch
Cyberpunk 2077 1080p Ultra, Verbrauch
Beim Starten von Prime95 Stresstest steigt der Verbrauch auf 54 W, bevor er nach 60 Sekunden auf 42 W sinkt, da das maximale Turbo-Boost-Potenzial begrenzt wird
Prime95+FurMark Stresstest wird bei 10 Sekunden gestartet
Stromverbrauch
Aus / Standbydarklight 0.35 / 0.56 Watt
Idledarkmidlight 1.3 / 2.5 / 4.1 Watt
Last midlight 40.1 / 57.3 Watt
 color bar
Legende: min: dark, med: mid, max: light        Metrahit Energy
Dell XPS 13 9350
Core Ultra 7 256V, Arc 140V, Micron 2550 512GB, IPS, 1920x1200, 13.4"
Dell XPS 13 Plus 9320 i7-1280P OLED
i7-1280P, Iris Xe G7 96EUs, WDC PC SN810 512GB, OLED, 3456x2160, 13.4"
Lenovo ThinkBook 13x G4 21KR0008GE
Ultra 5 125H, Arc 7-Core, Samsung PM9C1a MZAL8512HDLU, IPS, 2880x1920, 13.5"
HP Dragonfly G4
i7-1365U, Iris Xe G7 96EUs, Micron 3400 MTFDKBA512TFH 512GB, IPS, 1920x1280, 13.5"
Asus ZenBook S13 OLED UX5304
i7-1355U, Iris Xe G7 96EUs, Samsung PM9A1 MZVL21T0HCLR, OLED, 2880x1800, 13.3"
MSI Prestige 13 AI Evo
Ultra 7 155H, Arc 8-Core, Samsung PM9A1 MZVL21T0HCLR, OLED, 2880x1800, 13.3"
Stromverbrauch
-176%
-137%
-104%
-139%
-116%
Idle min *
1.3
6.5
-400%
5.4
-315%
4.1
-215%
5.8
-346%
4.5
-246%
Idle avg *
2.5
7.8
-212%
7.8
-212%
7.5
-200%
8.5
-240%
8
-220%
Idle max *
4.1
13
-217%
8.9
-117%
8.2
-100%
8.8
-115%
8.7
-112%
Last avg *
40.1
56.6
-41%
49.4
-23%
35.5
11%
35.1
12%
36.1
10%
Cyberpunk 2077 ultra external monitor *
43.1
Cyberpunk 2077 ultra *
46.1
Last max *
57.3
63
-10%
68.8
-20%
66.5
-16%
59.5
-4%
65
-13%
Witcher 3 ultra *
49.2
44.4
37.5
27.6
29.7

* ... kleinere Werte sind besser

Energieaufnahme Cyberpunk / Stresstest

051015202530354045505560Tooltip
Dell XPS 13 9350 Core Ultra 7 256V, Arc 140V; 1280x720 Prime95 28.10 and Furmark 1.25: Ø49.1 (41.9-57.2)
Dell XPS 13 9340 Core Ultra 7 Ultra 7 155H, Arc 8-Core; 1280x720 Prime95 28.10 and Furmark 1.25: Ø45.9 (36.1-62.7)
Dell XPS 13 9350 Core Ultra 7 256V, Arc 140V; Idle 150cd/m2: Ø1.954 (1.813-3.29)
Dell XPS 13 9340 Core Ultra 7 Ultra 7 155H, Arc 8-Core; Idle 150cd/m2: Ø5.65 (4.77-8.8)
Dell XPS 13 9350 Core Ultra 7 256V, Arc 140V; Cyberpunk 2077 FHD ultra no FSR 150cd: Ø46.1 (45.1-50.7)

Energieaufnahme externer Monitor

051015202530354045505560Tooltip
Dell XPS 13 9350 Core Ultra 7 256V, Arc 140V; Prime95 V2810 Stress (external Monitor): Ø46.1 (42.2-54.3)
Dell XPS 13 9340 Core Ultra 7 Ultra 7 155H, Arc 8-Core; Prime95 V2810 Stress (external Monitor): Ø47.3 (35.8-62.4)
Dell XPS 13 9350 Core Ultra 7 256V, Arc 140V; Cinebench R15 Multi (external Monitor): Ø50.9 (49.9-51.9)
Dell XPS 13 9340 Core Ultra 7 Ultra 7 155H, Arc 8-Core; Cinebench R15 Multi (external Monitor): Ø60.7 (56.8-61.4)
Dell XPS 13 9350 Core Ultra 7 256V, Arc 140V; 1280x720 FurMark 1.19 GPU Stress Test (external Monitor): Ø35.2 (32.7-44.8)
Dell XPS 13 9340 Core Ultra 7 Ultra 7 155H, Arc 8-Core; 1280x720 FurMark 1.19 GPU Stress Test (external Monitor): Ø40.3 (32.6-57.5)
Dell XPS 13 9350 Core Ultra 7 256V, Arc 140V; Idle 1min (external Monitor): Ø1.596 (1.324-3.63)
Dell XPS 13 9340 Core Ultra 7 Ultra 7 155H, Arc 8-Core; Idle 1min (external Monitor): Ø6.88 (5.99-8.6)
Dell XPS 13 9350 Core Ultra 7 256V, Arc 140V; Cyberpunk 2077 FHD ultra no FSR - external Monitor: Ø43.1 (39.3-47.2)

Akkulaufzeit

Die Laufzeiten haben sich deutlich verbessert, wie wir es auch bei anderen Lunar-Lake-Notebooks festgestellt haben. Wir konnten mehr als 20 Stunden WLAN-Browsing unter realen Bedingungen aufzeichnen und damit jede frühere XPS 13-Konfiguration und die meisten anderen 13-Zoll-Subnotebooks übertreffen. Noch überraschender ist, dass die Akkukapazität trotz des Laufzeitvorteils kleiner ist als bei vielen der gleichen Konkurrenten.

Das Aufladen vom leeren auf den vollen Akku mit dem mitgelieferten Netzteil dauert mit etwa 140 Minuten etwas länger als erwartet.

Akkulaufzeit
Idle (ohne WLAN, min Helligkeit)
56h 47min
WiFi Websurfing
20h 36min
Last (volle Helligkeit)
2h 22min
Dell XPS 13 9350
Core Ultra 7 256V, Arc 140V, 55 Wh
Dell XPS 13 Plus 9320 i7-1280P OLED
i7-1280P, Iris Xe G7 96EUs, 55 Wh
Lenovo ThinkBook 13x G4 21KR0008GE
Ultra 5 125H, Arc 7-Core, 74 Wh
HP Dragonfly G4
i7-1365U, Iris Xe G7 96EUs, 68 Wh
Asus ZenBook S13 OLED UX5304
i7-1355U, Iris Xe G7 96EUs, 63 Wh
MSI Prestige 13 AI Evo
Ultra 7 155H, Arc 8-Core, 75 Wh
Akkulaufzeit
-72%
-32%
-4%
-21%
-13%
Idle
3407
2550
-25%
WLAN
1236
346
-72%
684
-45%
954
-23%
678
-45%
694
-44%
Last
142
116
-18%
192
35%
146
3%
169
19%
H.264
1229
829
1002

Notebookcheck Gesamtbewertung

Lunar Lake hat das XPS 13 zu einem stärkeren Konkurrenten der MacBook Air 13-Serie gemacht.

Dell XPS 13 9350 - 05.11.2024 v8
Allen Ngo

Gehäuse
87 / 98 → 88%
Tastatur
78%
Pointing Device
83%
Konnektivität
60 / 74 → 81%
Gewicht
73 / 20-77 → 92%
Akkulaufzeit
92%
Display
86%
Leistung Spiele
52 / 75 → 70%
Leistung Anwendungen
82 / 92 → 89%
AI Performance
89%
Temperatur
94%
Lautstärke
89%
Audio
77 / 91 → 84%
Kamera
32 / 75 → 42%
Durchschnitt
71%
85%
Subnotebook - gewichteter Durchschnitt
Weitere Informationen über unsere Bewertung finden Sie hier.
CO2 Emissions
No Data
Materials
100%
Packaging
100%
Power Use
88%
Repairability
40%
Software Updates
22.3%
Recycle Logo Total Sustainability Score: 58.4%

Transparenz

Die Auswahl der zu testenden Geräte erfolgt innerhalb der Redaktion. Das vorliegende Testmuster wurde dem Autor vom Hersteller oder einem Shop zu Testzwecken leihweise zur Verfügung gestellt. Eine Einflussnahme des Leihstellers auf den Testbericht gab es nicht, der Hersteller erhielt keine Version des Reviews vor der Veröffentlichung. Es bestand keine Verpflichtung zur Publikation. Unsere Reviews erfolgen stets ohne Gegenleistung oder Kompensationen. Als eigenständiges, unabhängiges Unternehmen unterliegt Notebookcheck keiner Diktion von Herstellern, Shops und Verlagen.

So testet Notebookcheck

Pro Jahr werden von Notebookcheck hunderte Laptops und Smartphones unabhängig in von uns standardisierten technischen Verfahren getestet, um eine Vergleichbarkeit aller Testergebnisse zu gewährleisten. Seit rund 20 Jahren entwickeln wir diese Testmethoden kontinuierlich weiter und setzen damit Branchenstandards. In unseren Testlaboren kommt ausschließlich hochwertiges Messequipment in die Hände erfahrener Techniker und Redakteure. Die Tests unterliegen einer mehrstufigen Kontrolle. Unsere komplexe Gesamtbewertung basiert auf hunderten fundierten Messergebnissen und Benchmarks, womit Ihnen Objektivität garantiert ist. Weitere Informationen zu unseren Testmethoden gibt es hier.

Alle 3 Beträge lesen / Antworten
static version load dynamic
Loading Comments
Diesen Artikel kommentieren / Antworten
Teilen Sie diesen Artikel, um uns zu unterstützen. Jeder Link hilft!
> Notebook Test, Laptop Test und News > Tests > Notebook Testberichte > Dell XPS 13 9350 Laptop im Test: Intel Lunar Lake macht den Unterschied
Autor: Allen Ngo,  7.11.2024 (Update:  7.11.2024)