Dell XPS 13 9345 Snapdragon X Elite im Test: Unterbietung des Intel Core Ultra 7

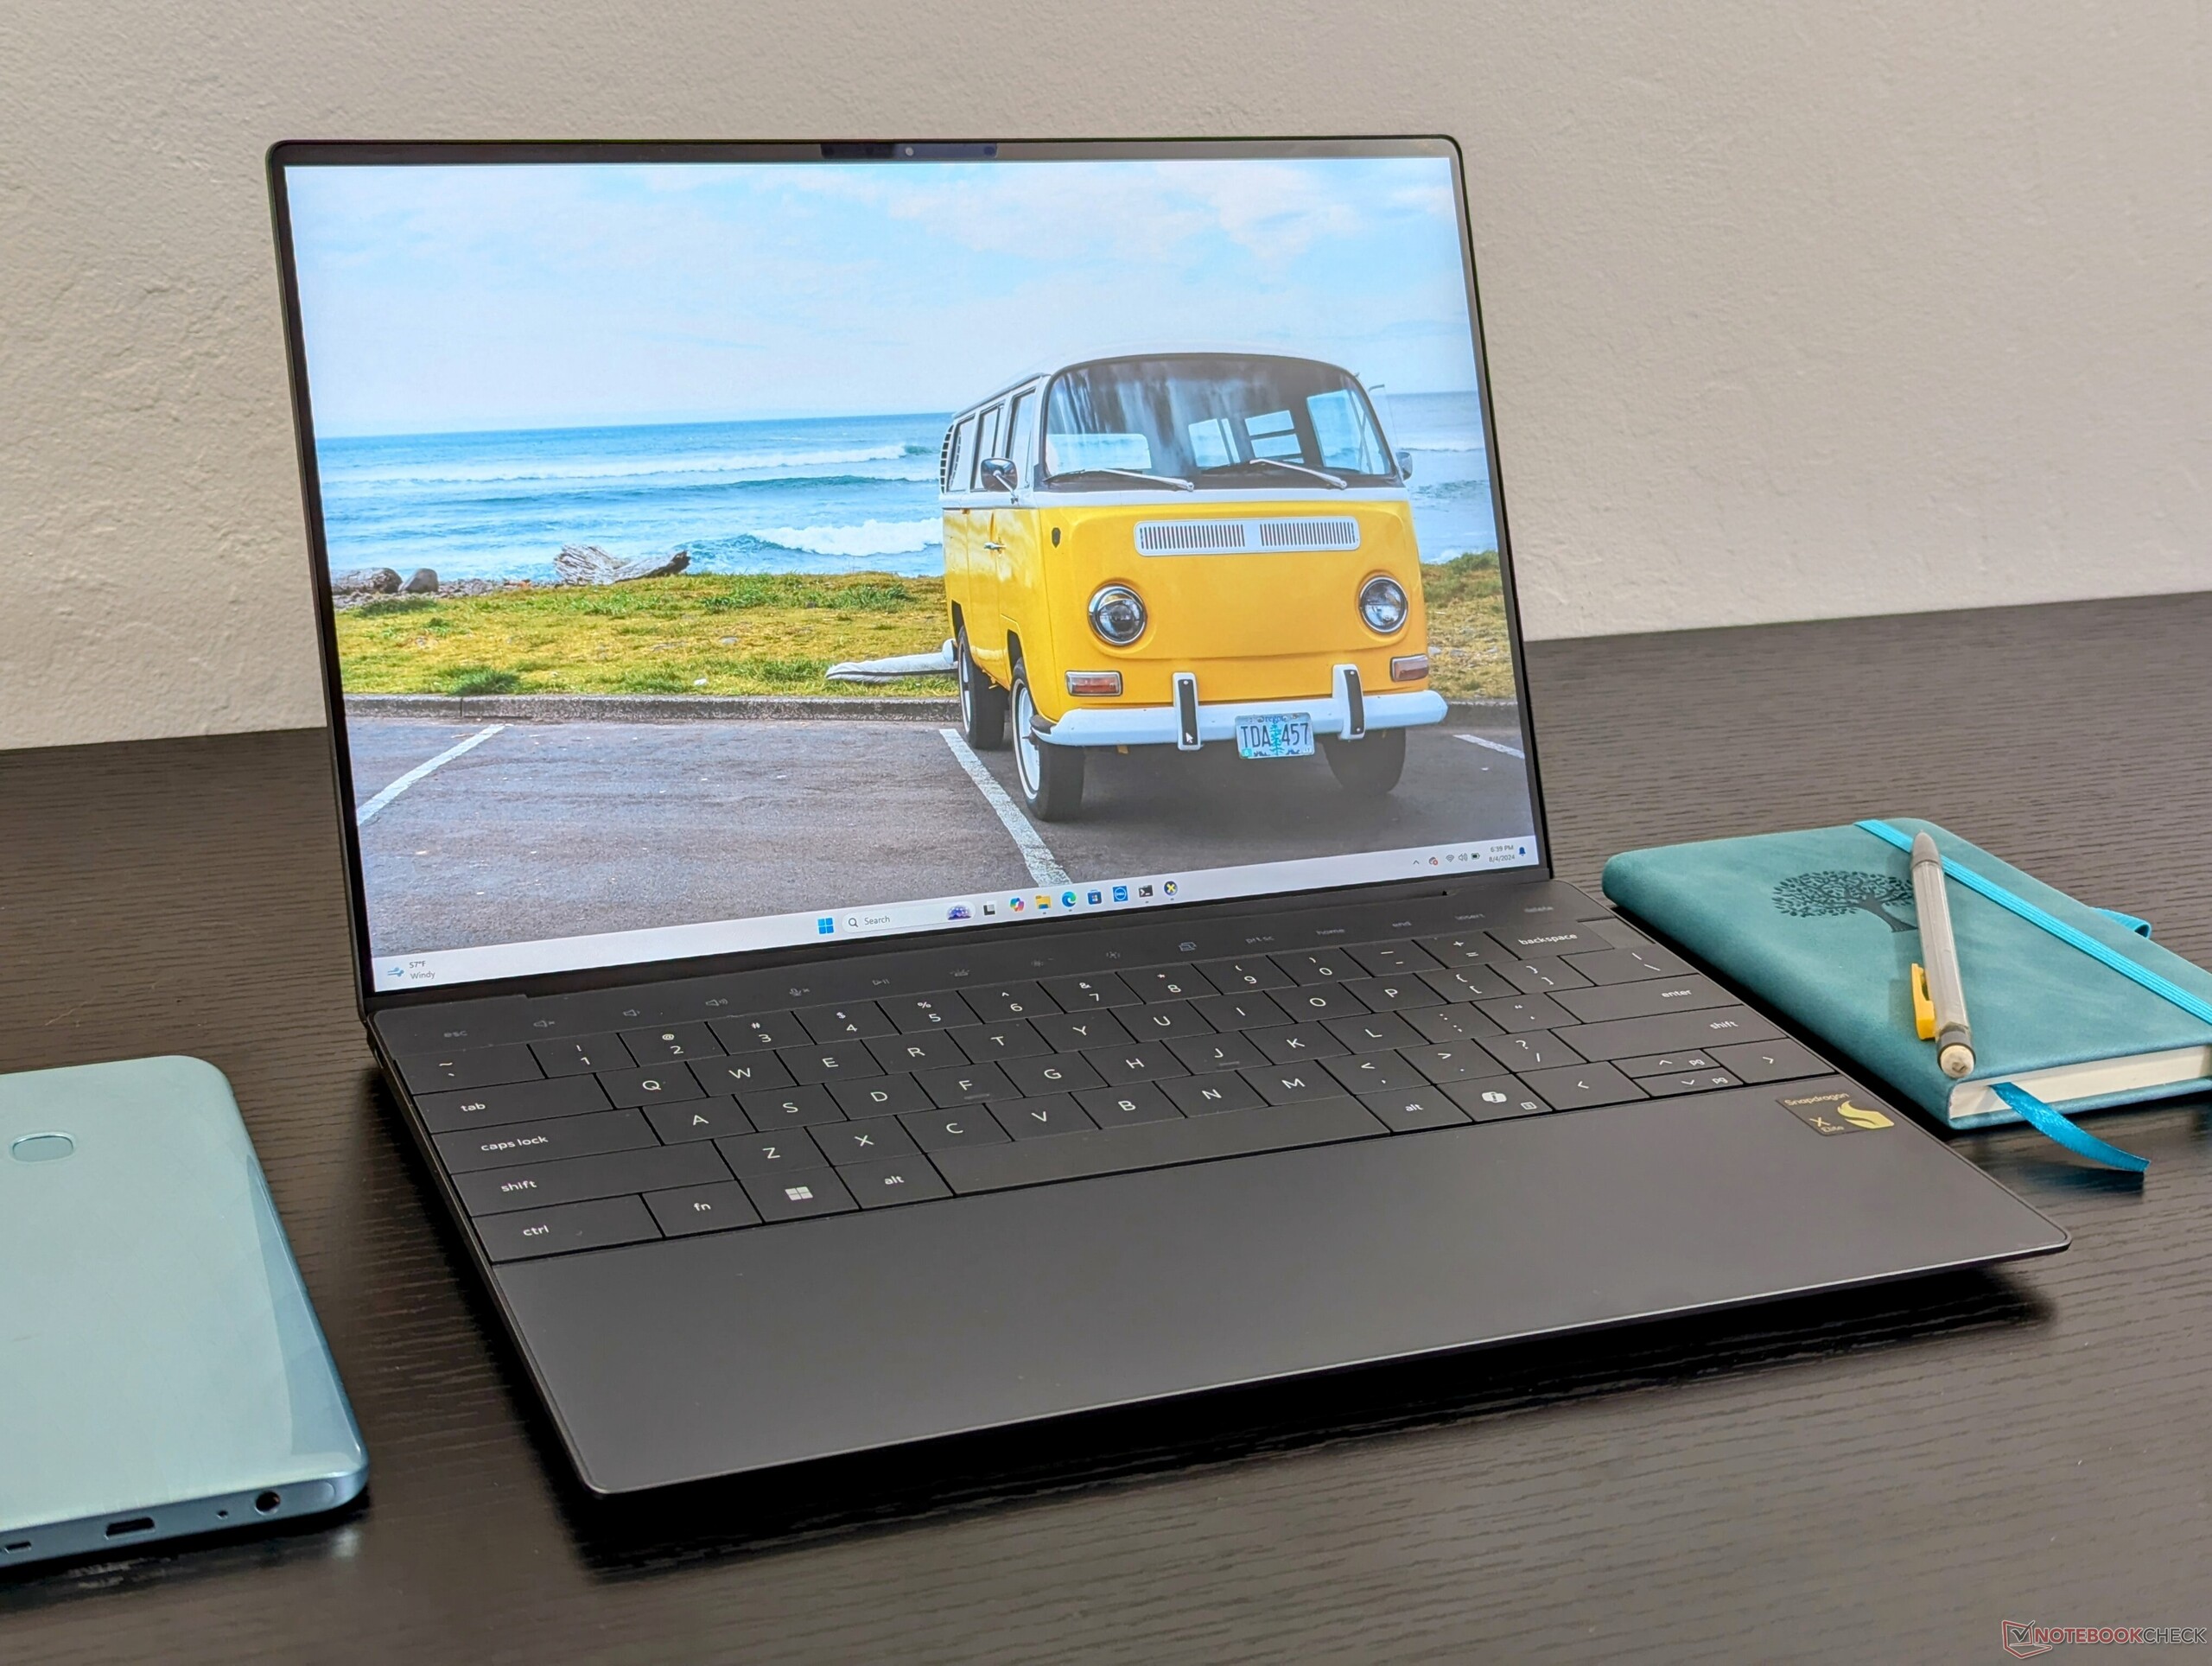
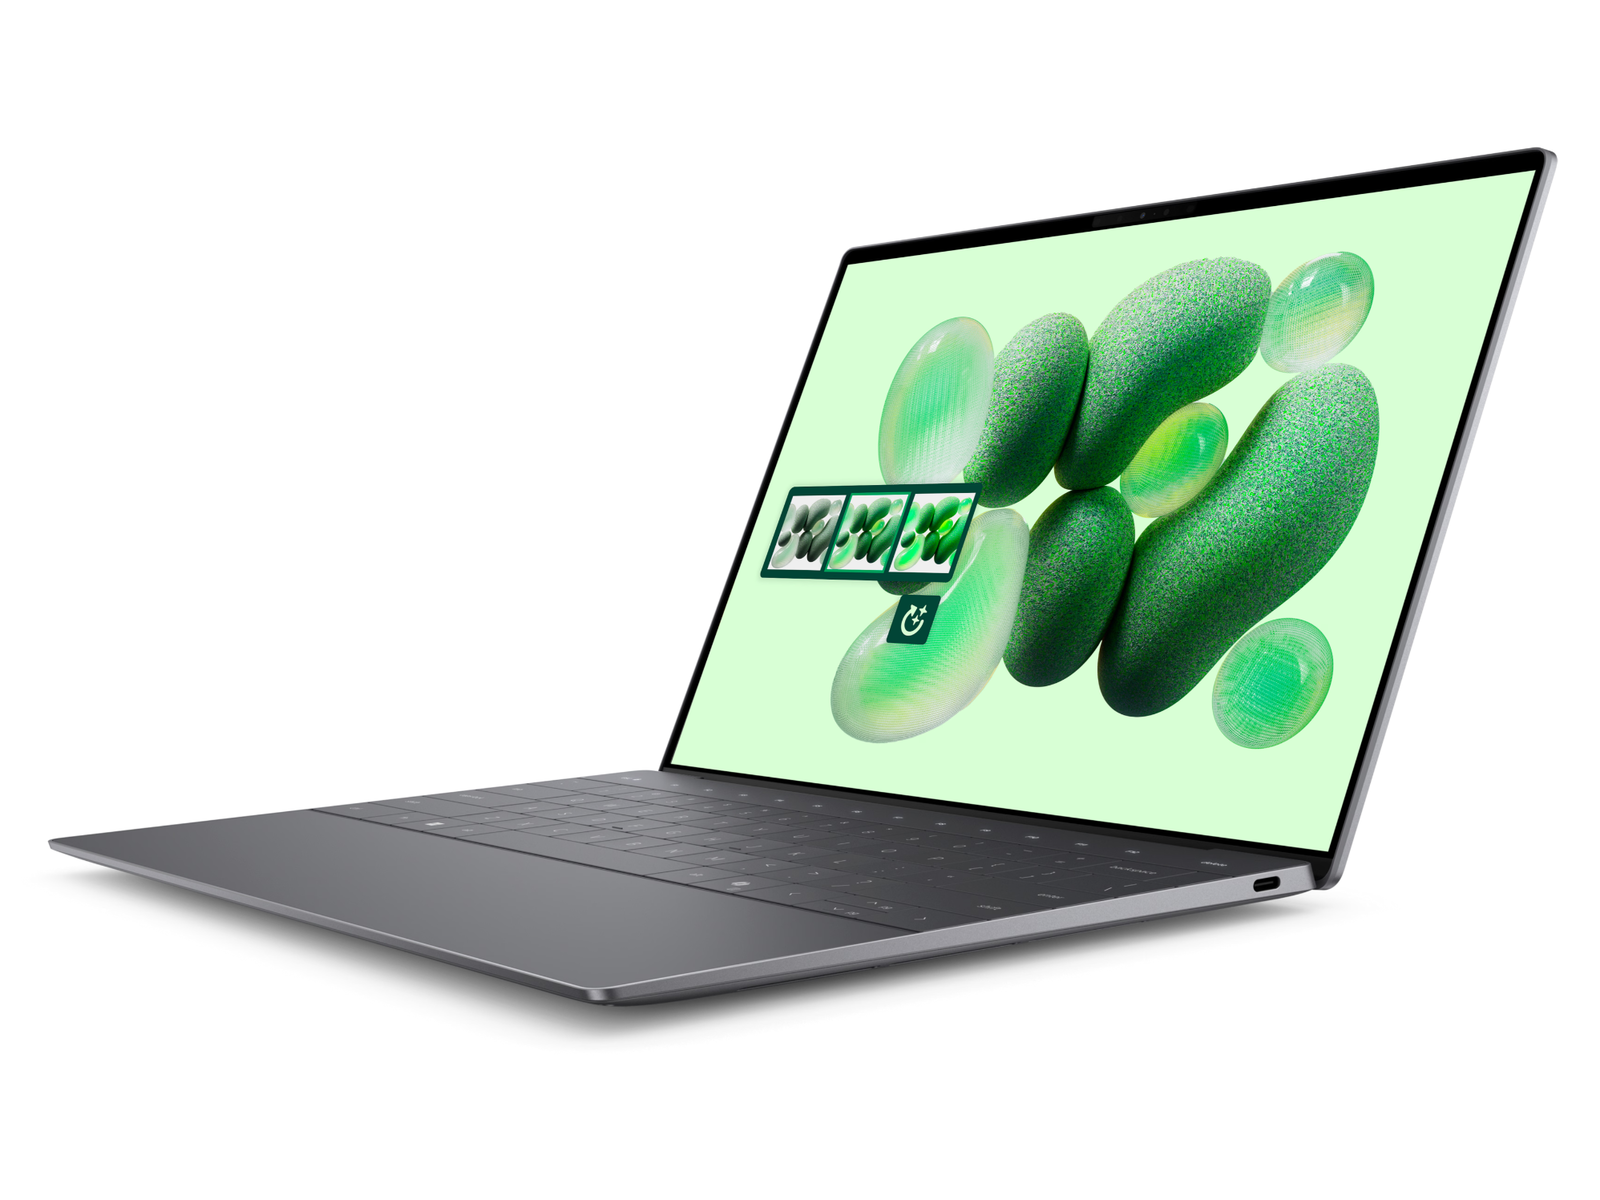
Was gibt es Besseres, als den eigenen Prozessor in einem der beliebtesten Consumer-Notebooks von Dell vorzustellen? Das XPS 13 Plus 9320/9340-Gehäuse wurde mit der neuesten Snapdragon X Elite-CPU ausgestattet, um zu den wenigen Qualcomm-betriebenen Windows-Laptops zu gehören, die in diesem Jahr auf den Markt kommen. Das XPS 13 9345 genannte Snapdragon-Modell ist ansonsten optisch identisch mit den bestehenden XPS 13 Plus 9320 oder 9340 mit herkömmlichen Intel-CPUs.
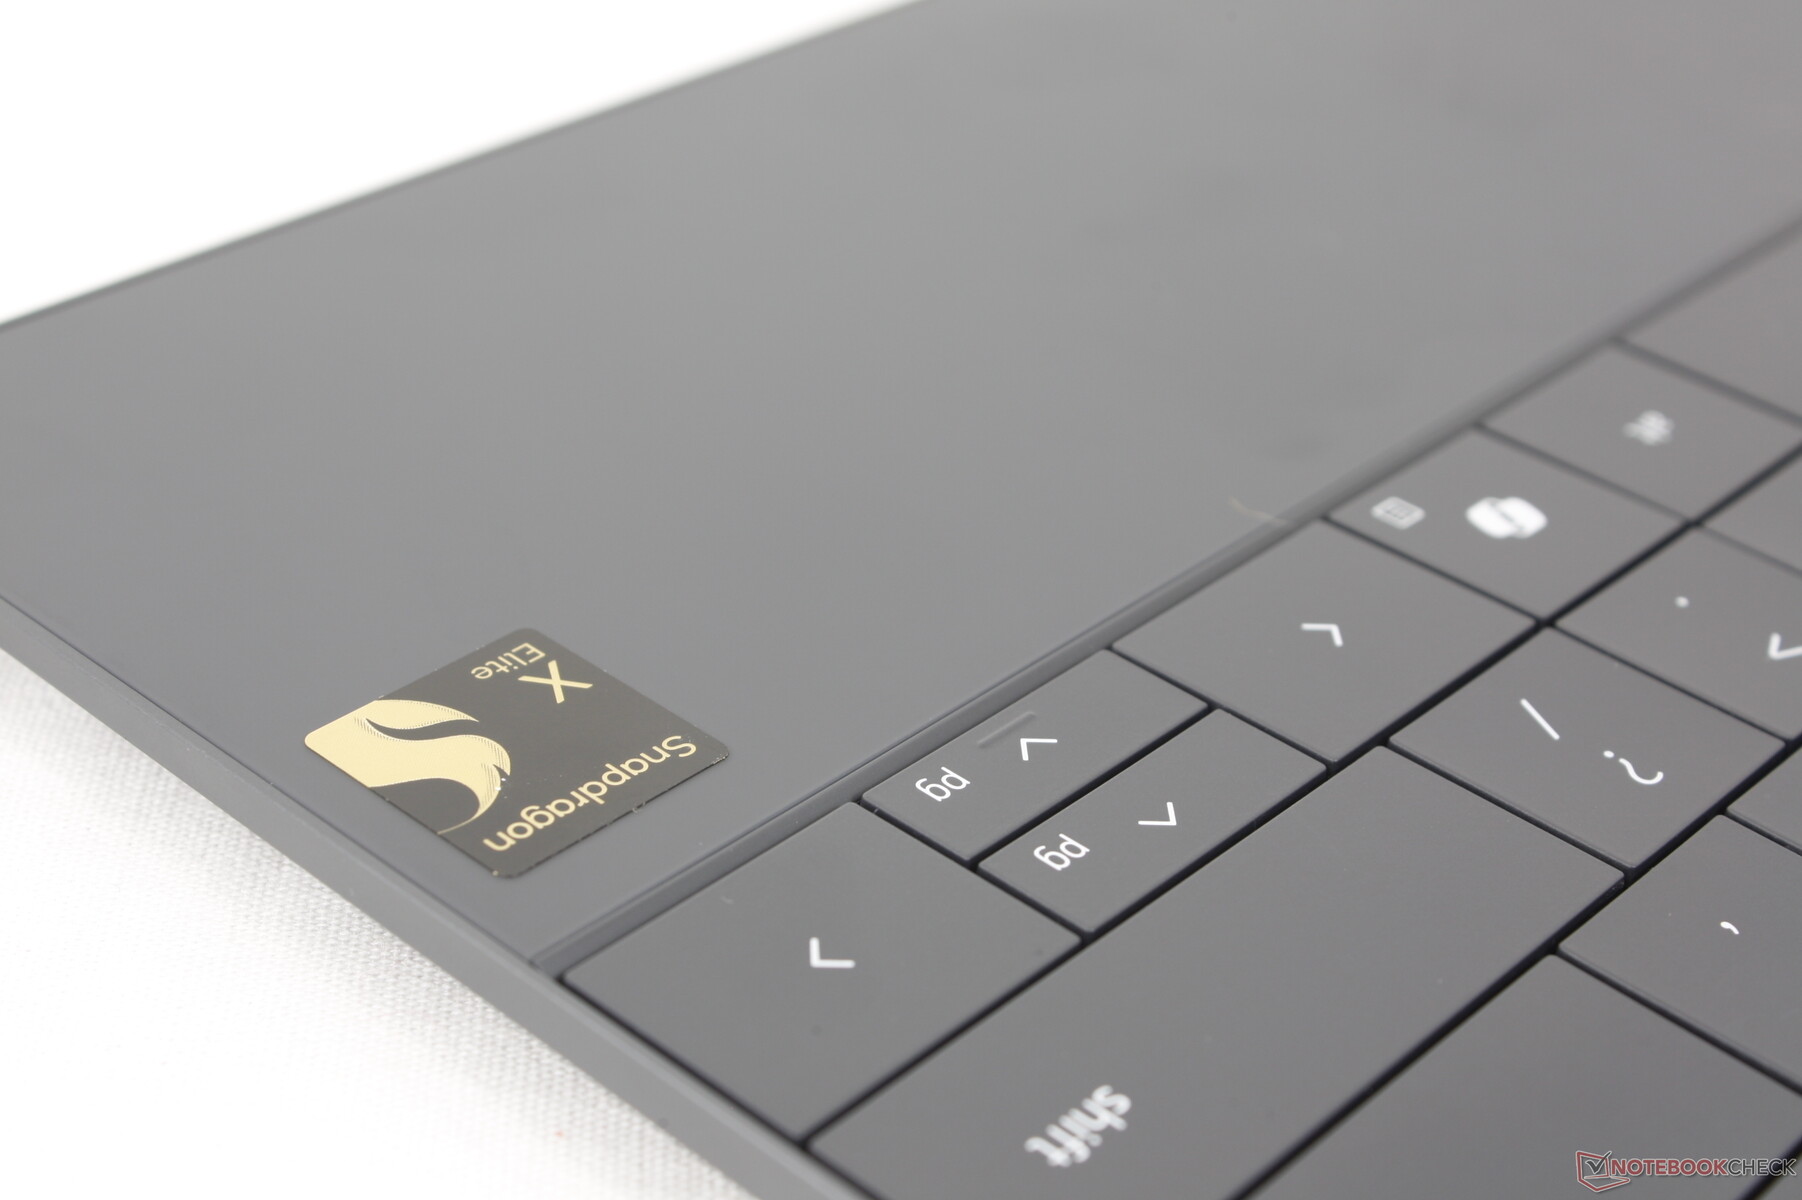
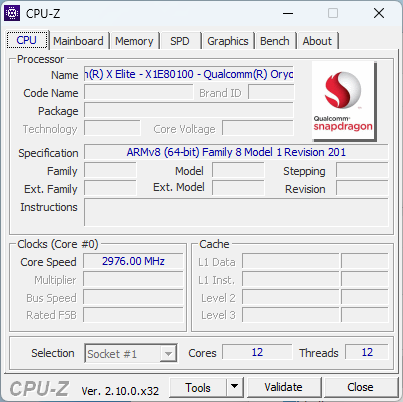
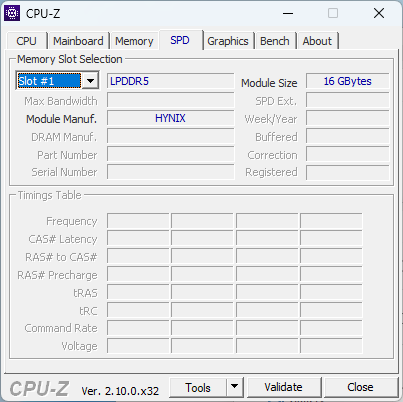
Unsere Testkonfiguration ist mit dem Snapdragon X1 Elite X1E-80-100, 16 GB LPDDR5X-8448 RAM und einem 1200p 120 Hz IPS-Display ausgestattet und kostet etwa 1.400 Euro. Höherwertige OLED-Panels sind verfügbar, und in einigen Regionen ist ein zweiter Snapdragon X1 Plus X1P-Prozessor erhältlich, aber die integrierte GPU bleibt überall gleich.
Mit dem gleichen Snapdragon X1 Elite X1E-80-100-Prozessor verfügen das Microsoft Surface Pro oder das Samsung Galaxy Book4 Edge 16 als Alternativen zum XPS 13 9345. Natürlich konkurriert es auch direkt mit konventionelleren 13- und 14-Zoll-Büro-Subnotebooks wie dem Lenovo ThinkBook 13x G4, dem Asus ZenBook S13 oder Dells eigenem XPS 13 9340.
Weitere Dell Bewertungen:
Mögliche Konkurrenten im Vergleich
Bew. | Version | Datum | Modell | Gewicht | Dicke | Größe | Auflösung | Preis ab |
|---|---|---|---|---|---|---|---|---|
| 84.5 % | v8 | 08 / 2024 | Dell XPS 13 9345 SD X Elite X1E-80-100, Adreno X1-85 3.8 TFLOPS | 1.2 kg | 15.3 mm | 13.40" | 1920x1200 | |
| 86.5 % v7 (old) | v7 (old) | 05 / 2024 | Dell XPS 13 9340 Core Ultra 7 Ultra 7 155H, Arc 8-Core | 1.2 kg | 15.3 mm | 13.40" | 1920x1200 | |
| 86.2 % | v8 | 07 / 2024 | Microsoft Surface Laptop 7 13.8 Copilot+ SD X Elite X1E-80-100, Adreno X1-85 3.8 TFLOPS | 1.3 kg | 17.5 mm | 13.80" | 2304x1536 | |
| 90.1 % v7 (old) | v7 (old) | 05 / 2024 | Lenovo ThinkBook 13x G4 21KR0008GE Ultra 5 125H, Arc 7-Core | 1.2 kg | 12.9 mm | 13.50" | 2880x1920 | |
| 82.3 % | v8 | 07 / 2024 | HP EliteBook Ultra G1q 14 SD X Elite X1E-78-100, Adreno X1-85 3.8 TFLOPS | 1.3 kg | 11.2 mm | 14.00" | 2240x1400 | |
| 85.4 % v7 (old) | v7 (old) | 04 / 2023 | Asus ZenBook S13 OLED UX5304 i7-1355U, Iris Xe G7 96EUs | 1 kg | 11.8 mm | 13.30" | 2880x1800 |
Hinweis: Wir haben unser Rating-System kürzlich aktualisiert und die Ergebnisse von Version 8 sind nicht mit den Ergebnissen von Version 7 vergleichbar. Weitere Informationen dazu sind hier verfügbar.
Note: We have recently updated our rating system and the results of version 8 are not comparable with the results of version 7. More information is available here .
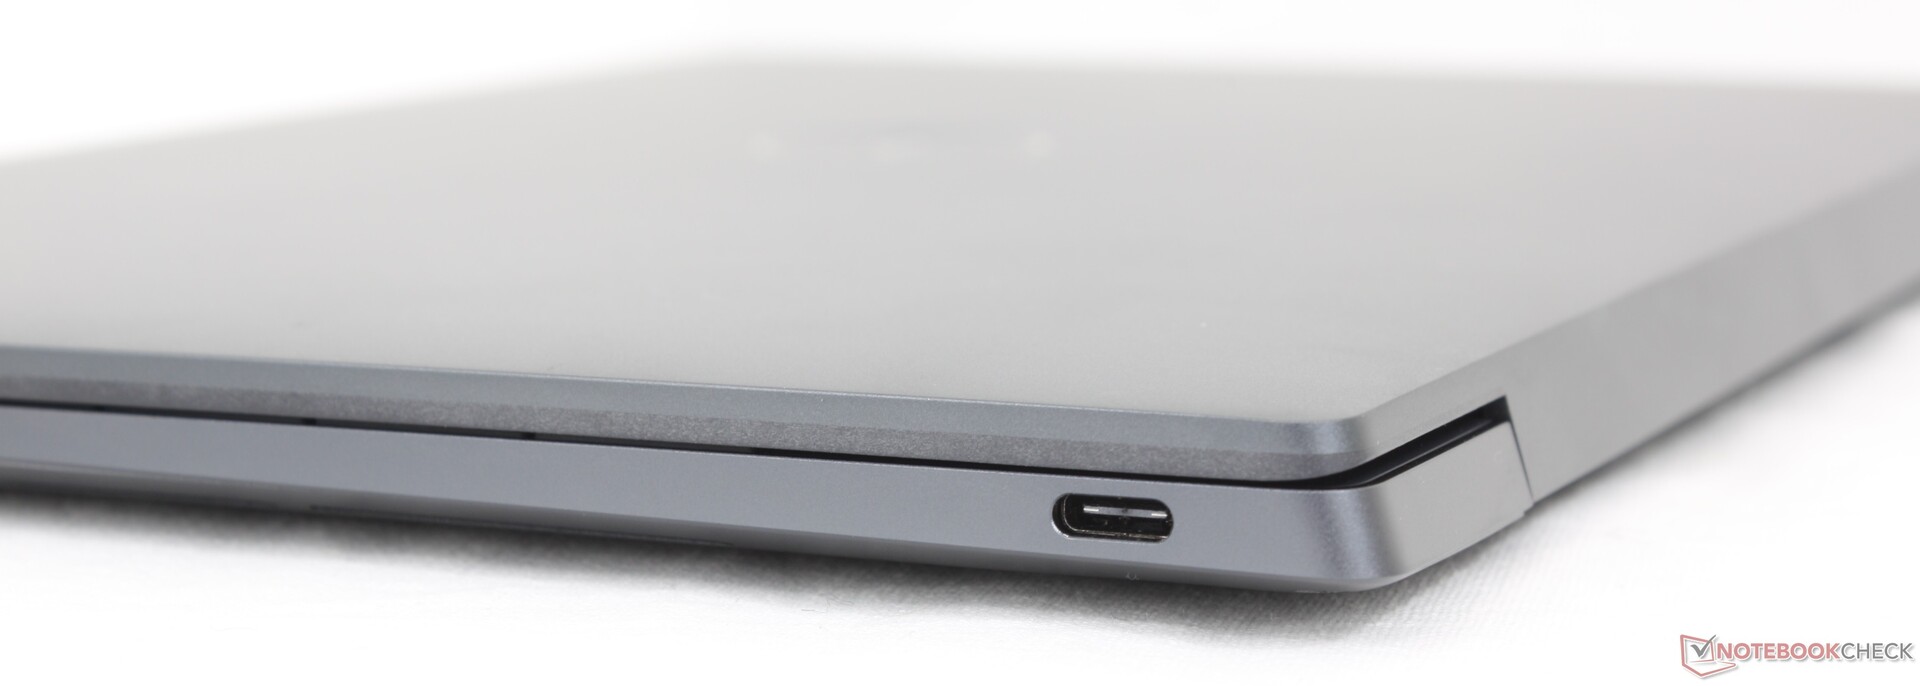
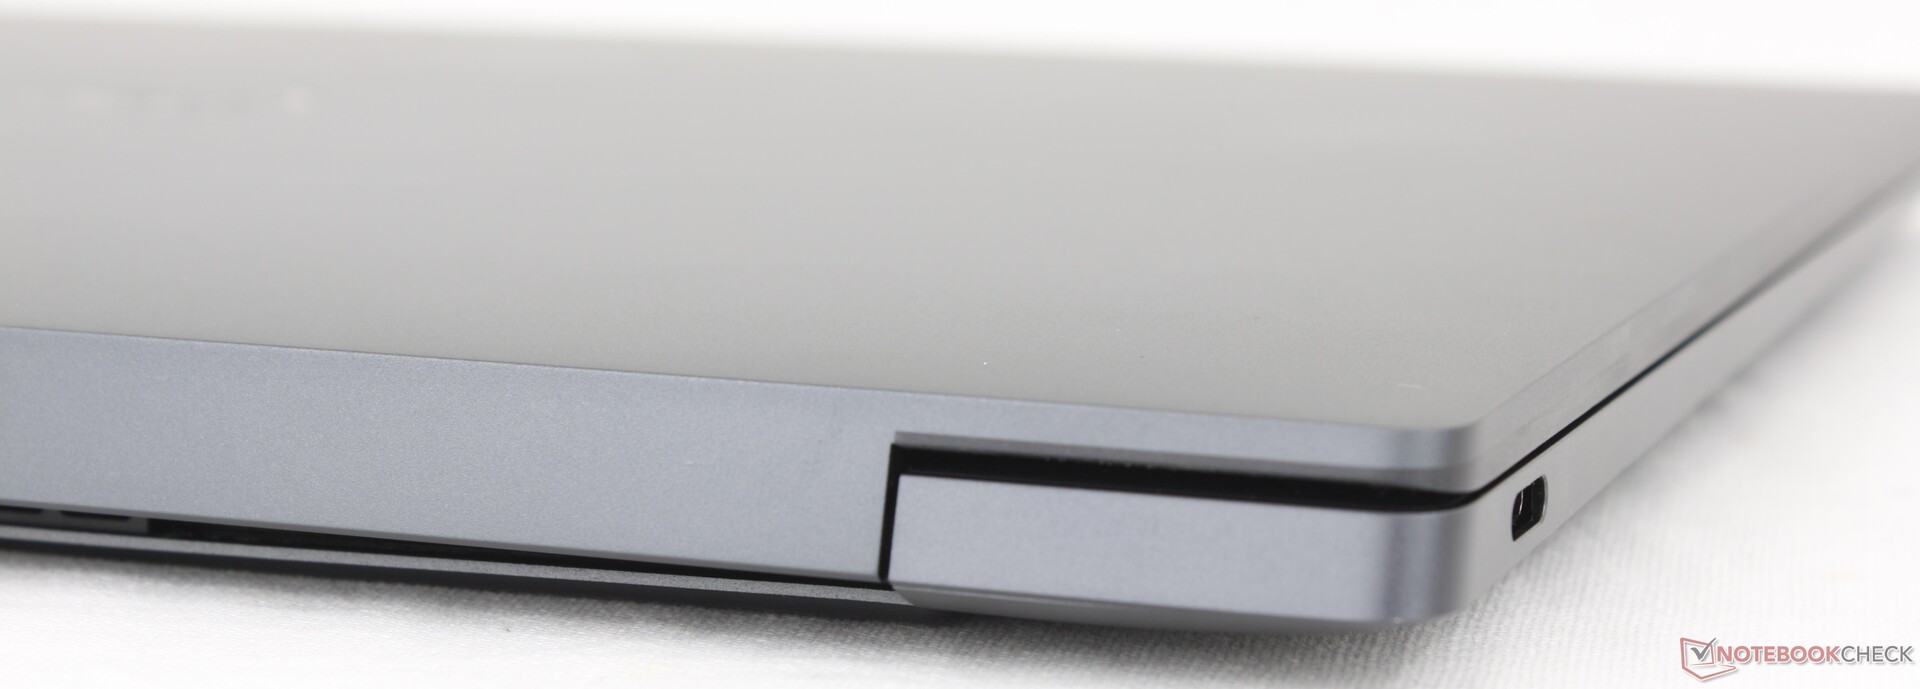
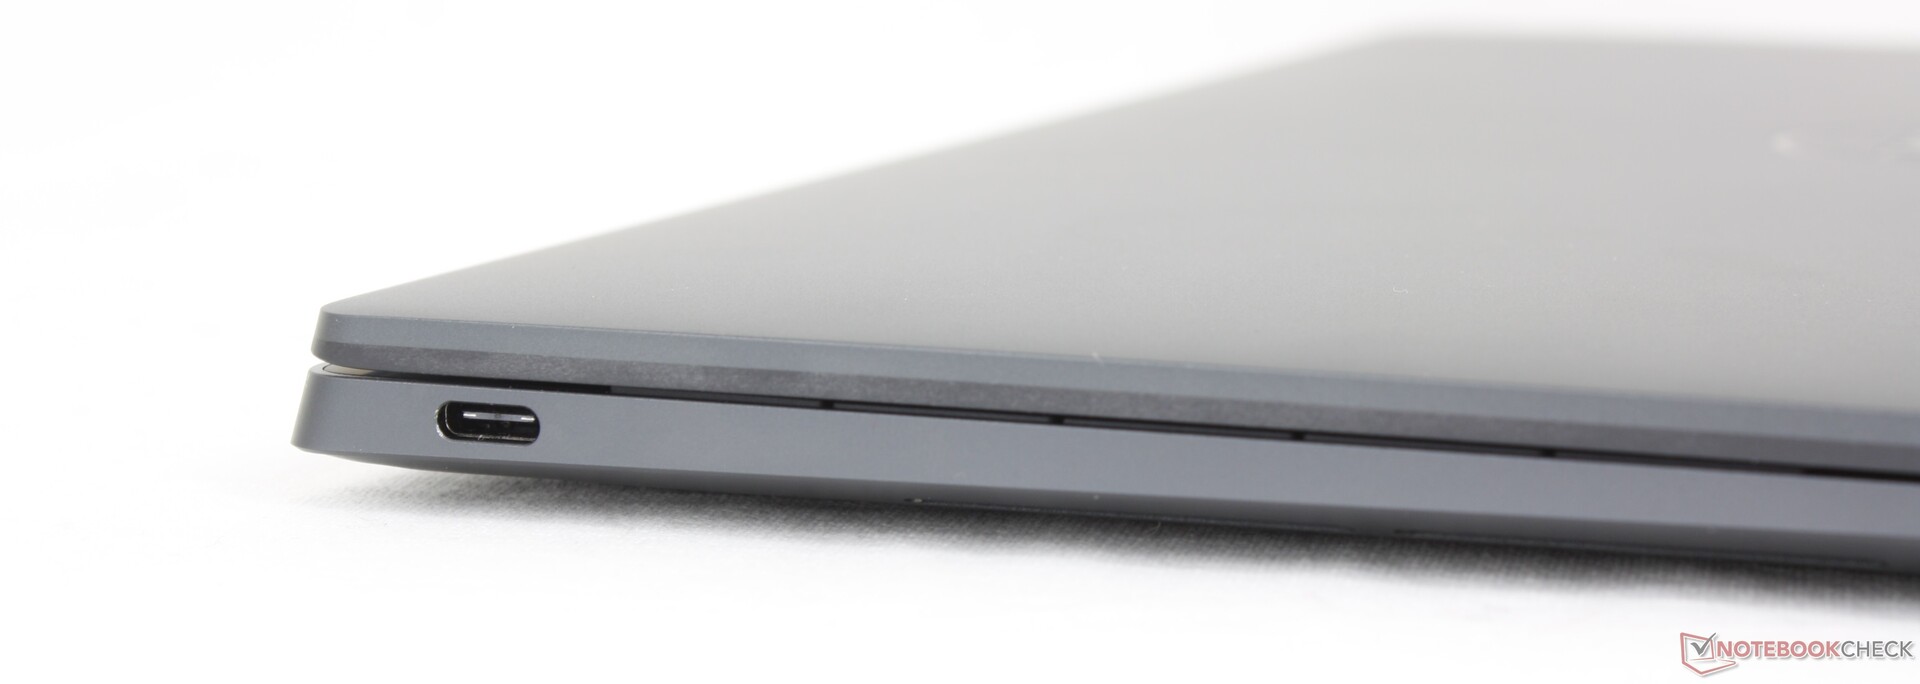
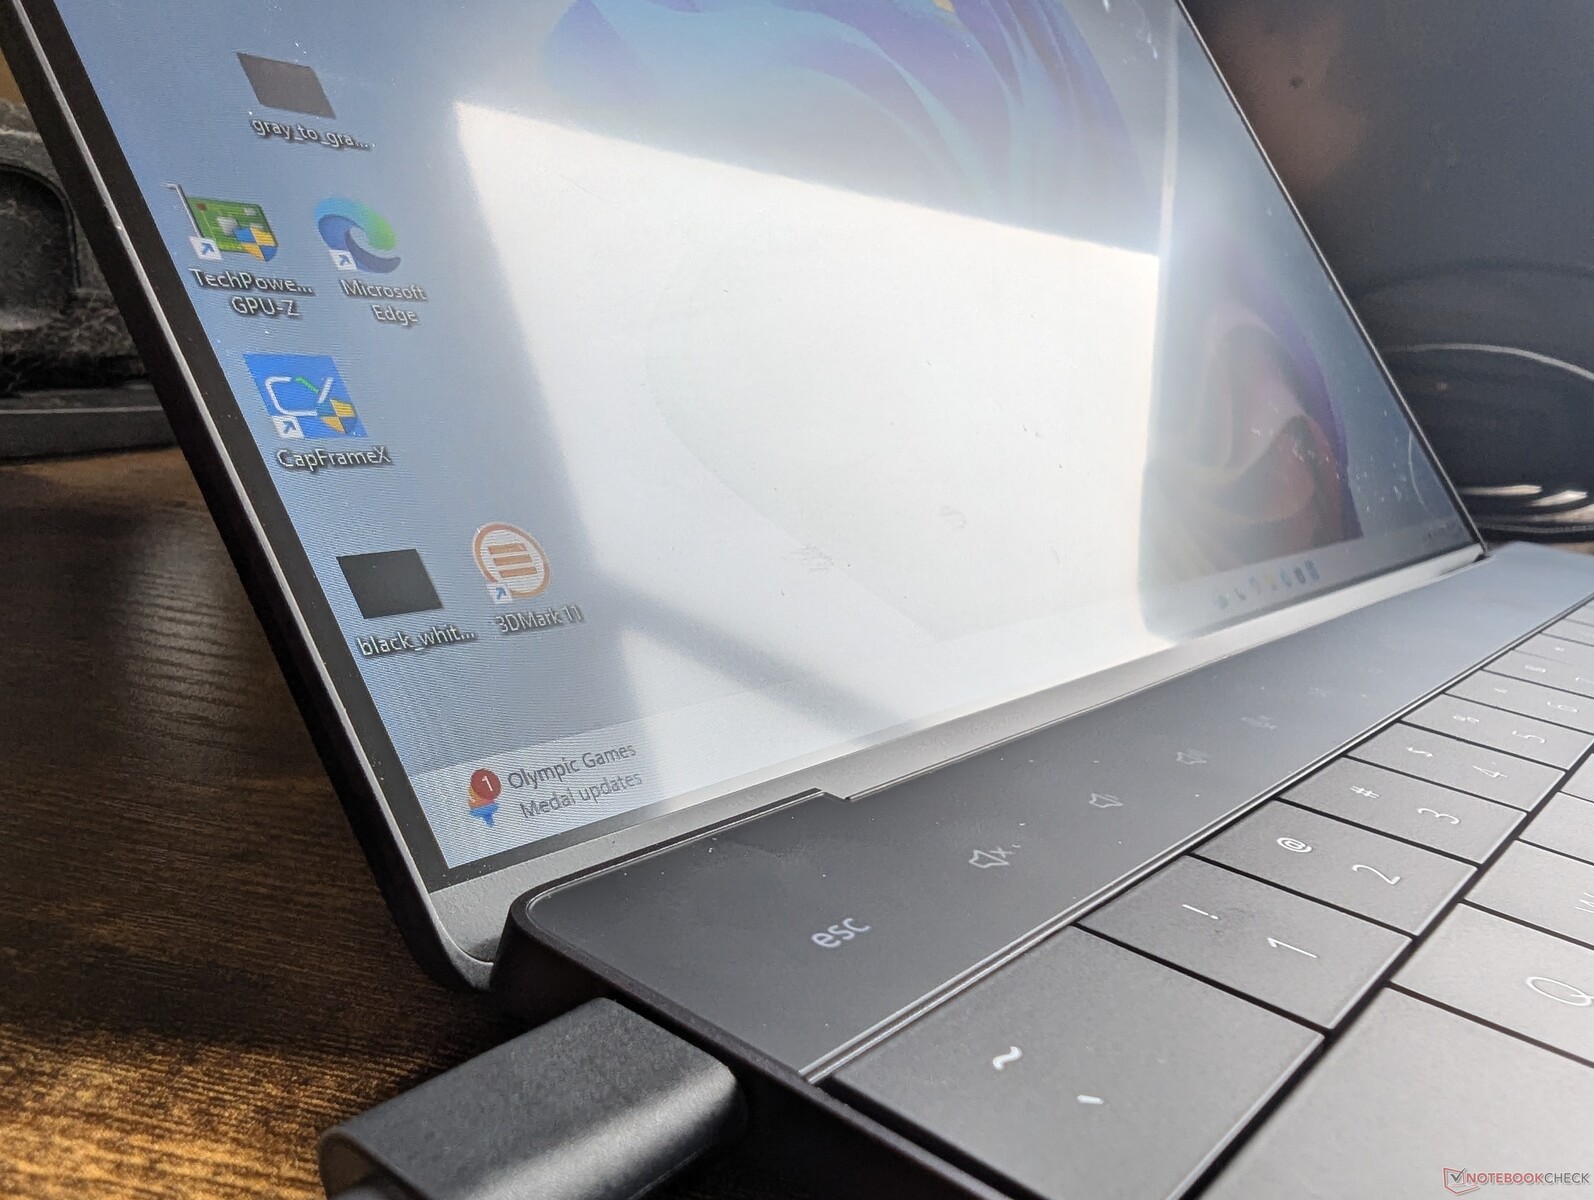
Gehäuse — Familiäres Aussehen und Gefühl
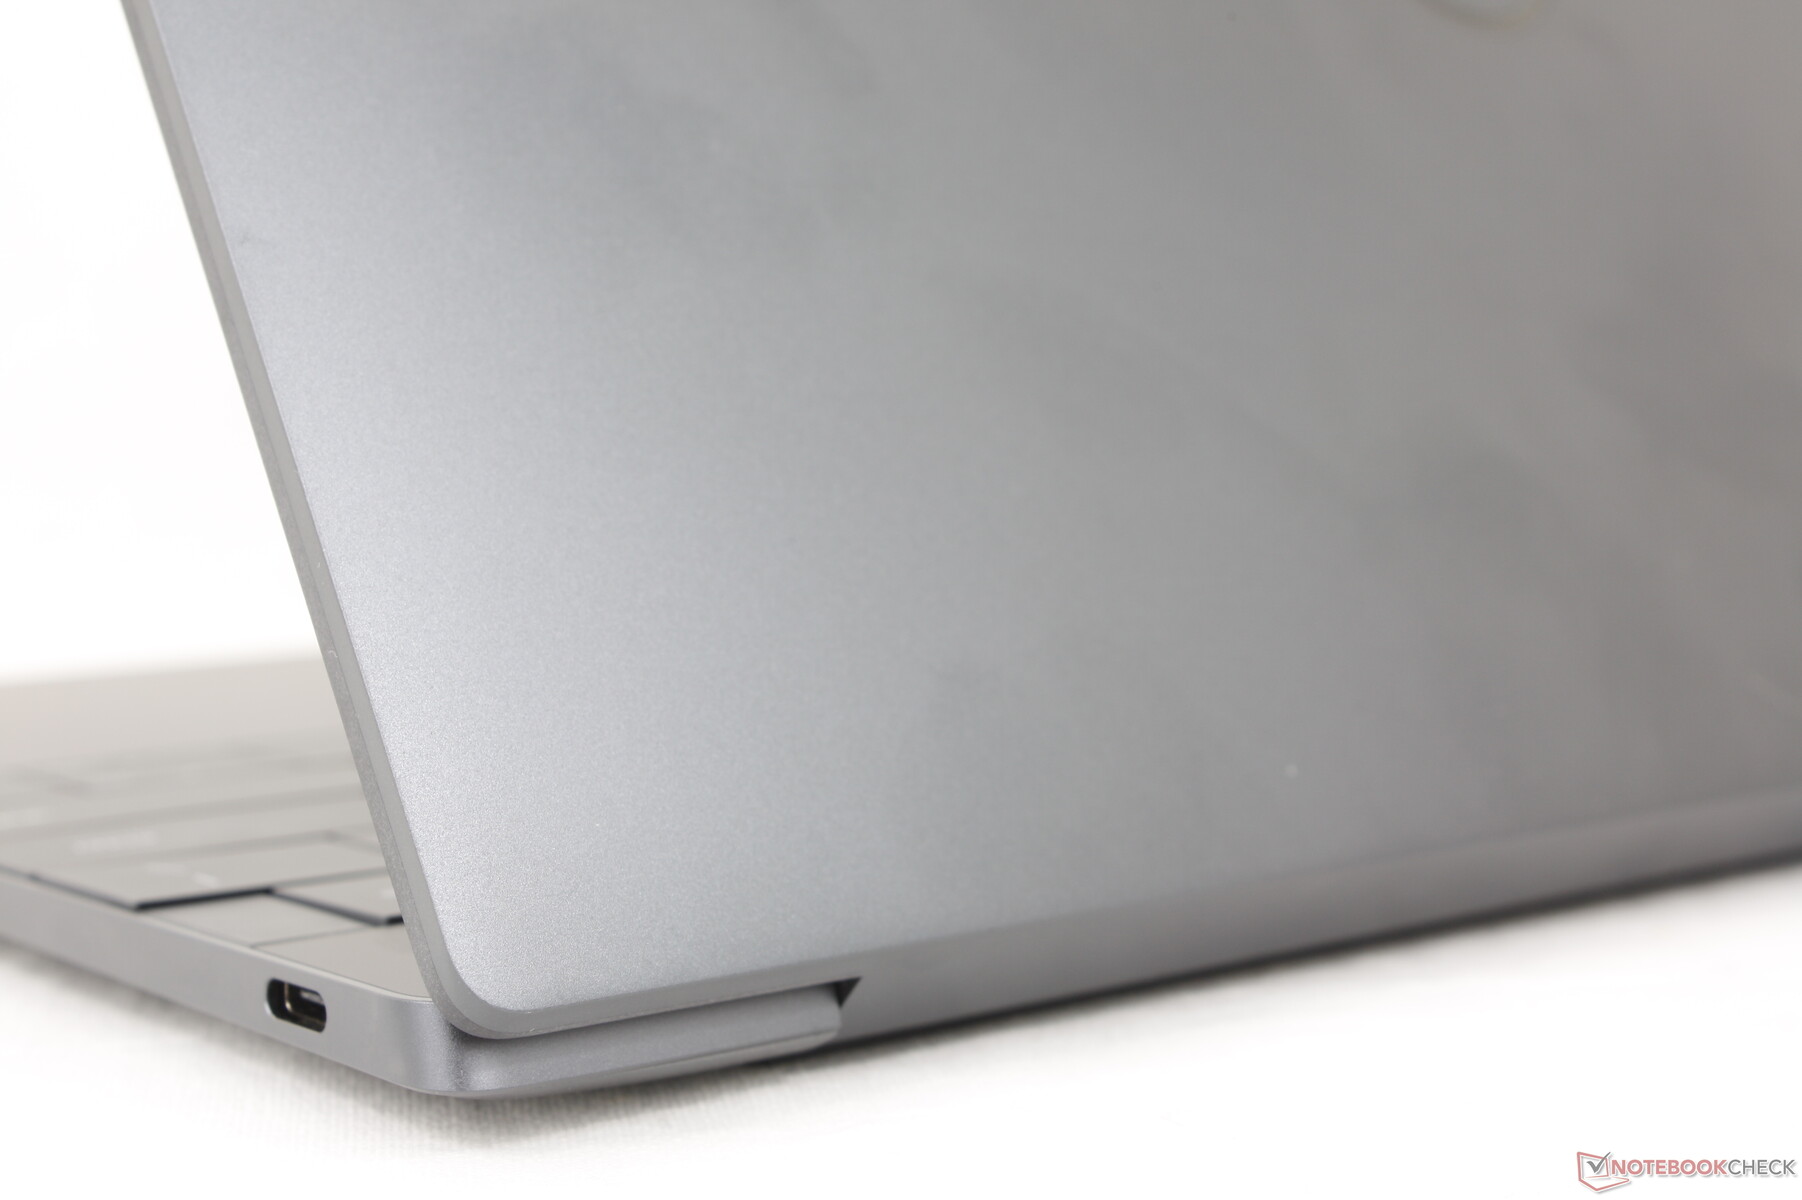
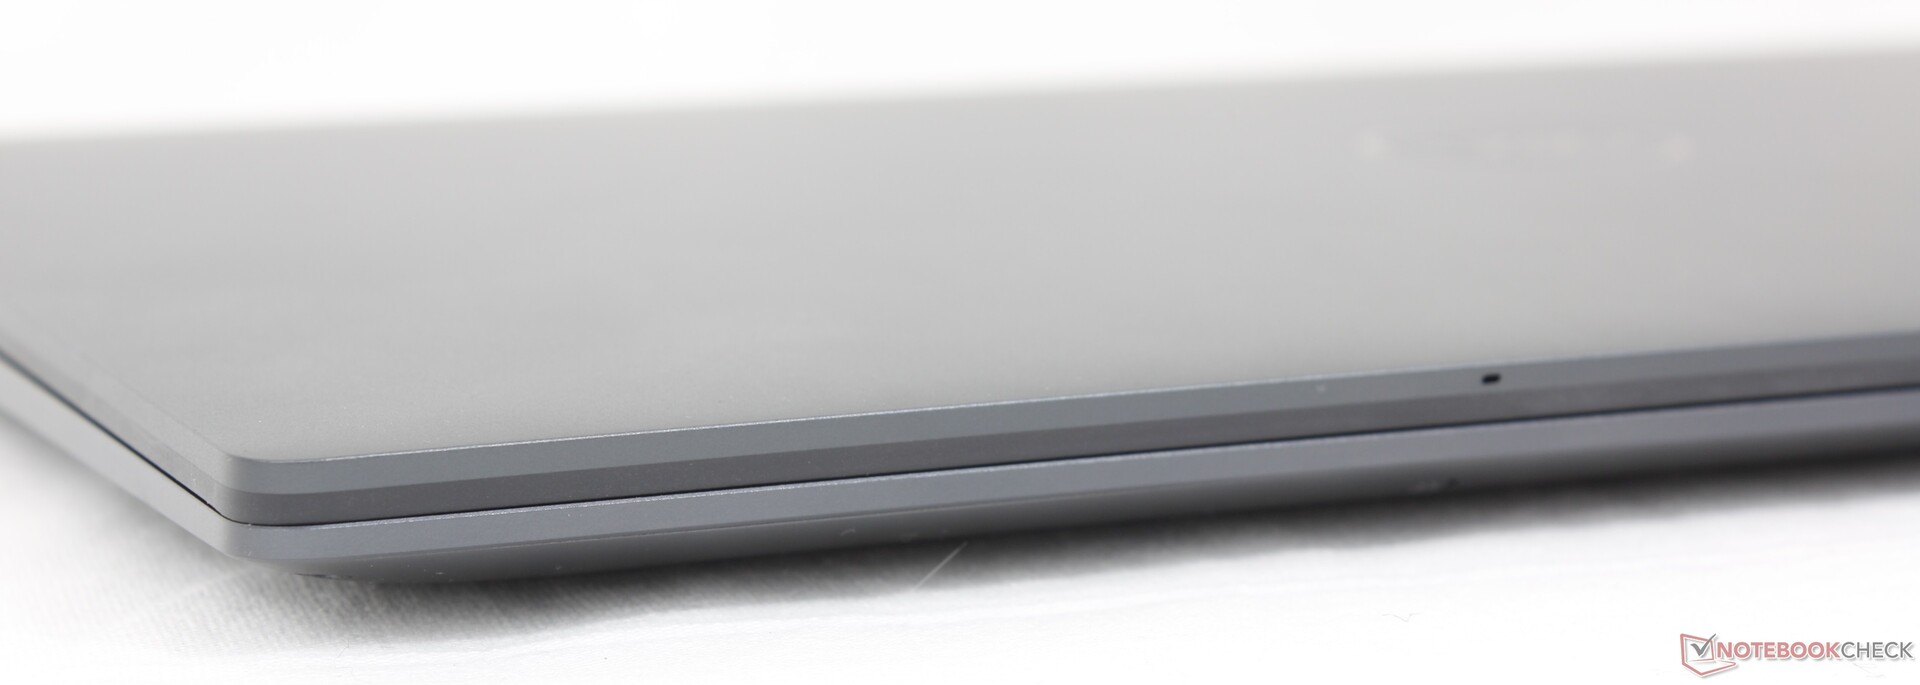
Äußerlich gibt es keine Unterschiede zwischen dem Qualcomm- und dem Intel-Modell, sodass unsere Anmerkungen zum Intel-Modell auch hier gelten. Ein paar neue Farboptionen wären schön gewesen, aber es gelten die gleichen Optionen Platin und Graphit. Wir bevorzugen leicht die Platin-Option, da die helle weiße Farbe Fingerabdrücke besser verdeckt als die dunklere Graphit-Option unseres Qualcomm-Testgeräts, insbesondere an den Handballenablagen und dem äußeren Deckel.
Ausstattung
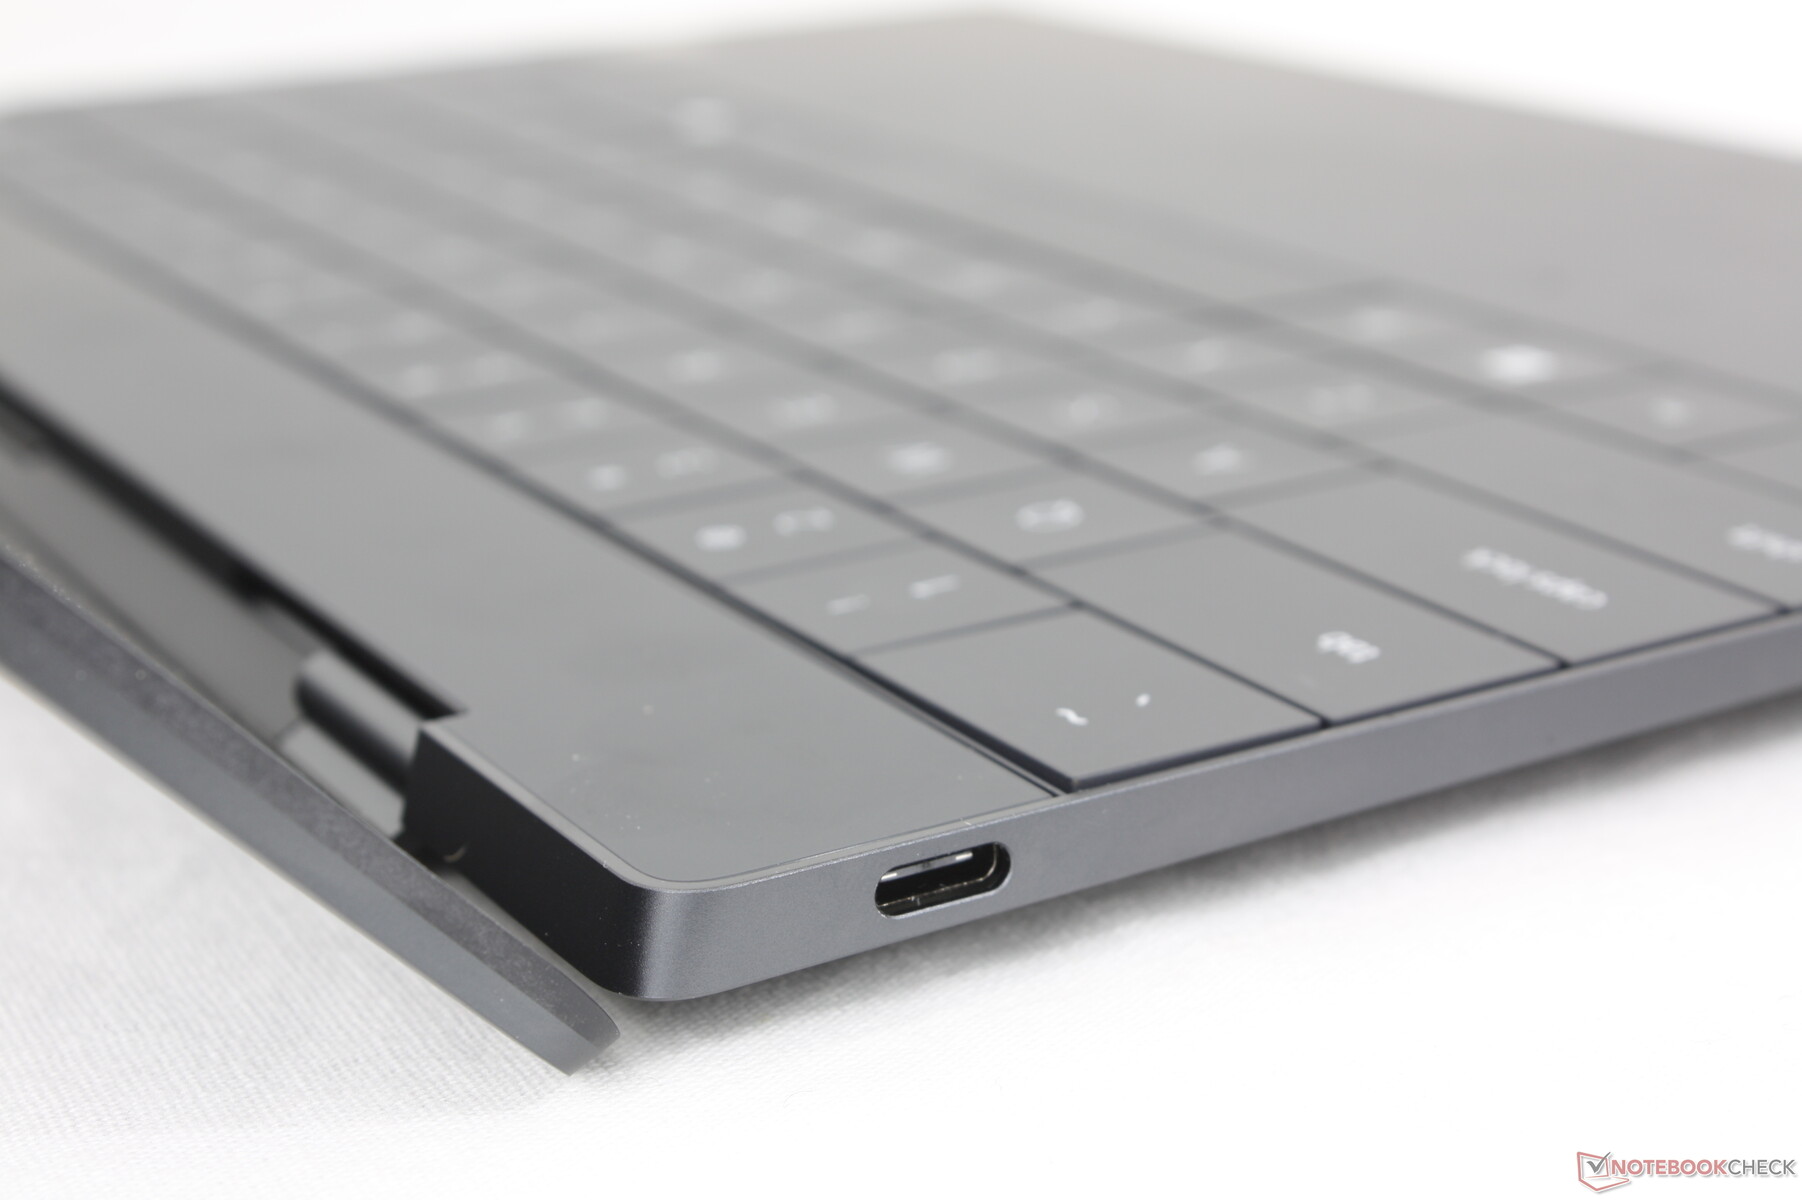
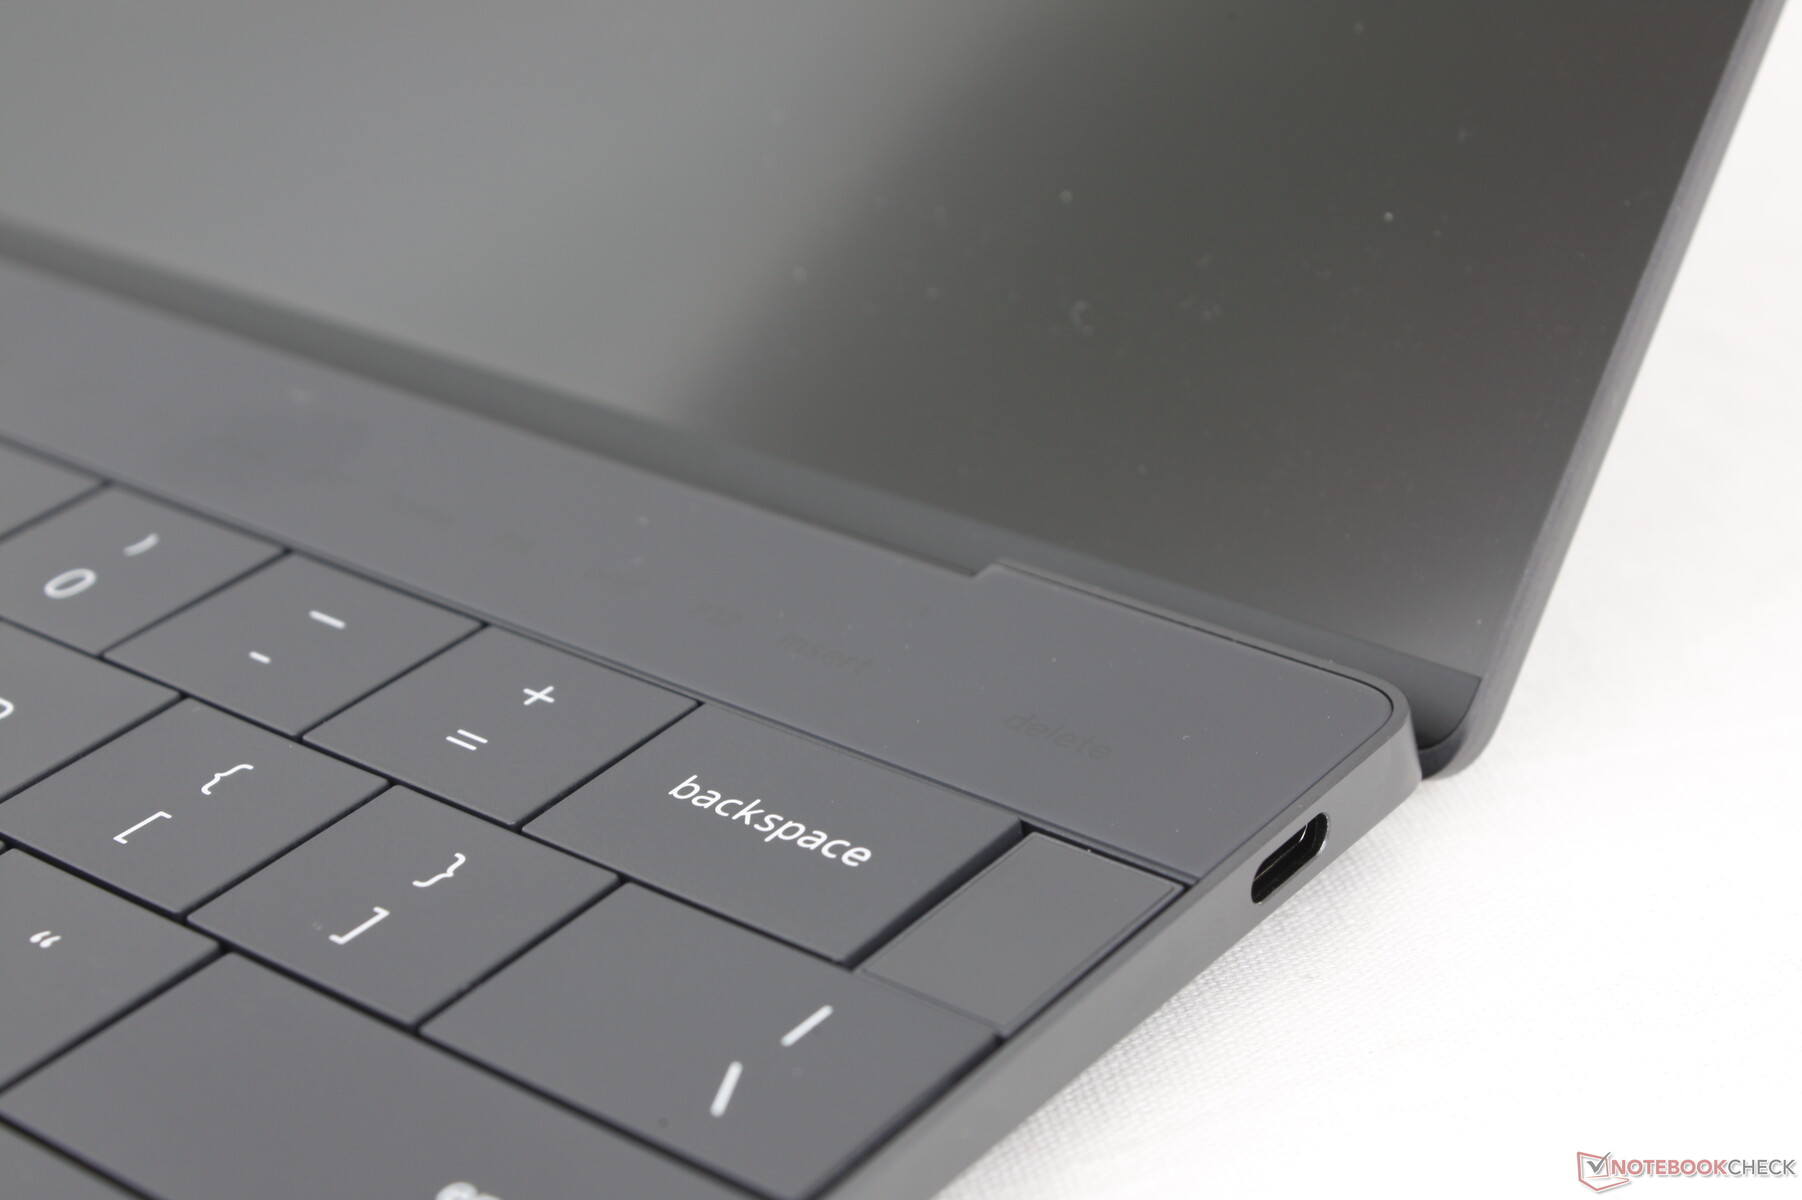
Es gibt zwei USB-C-4.0-Anschlüsse, genau wie bei der Intel-Version des XPS 13. Allerdings fehlt den Anschlüssen hier die Thunderbolt-Unterstützung, sodass die eGPU-Kompatibilität nicht gewährleistet ist. Beim Versuch, unsere Aorus RTX 2080 Ti Gaming Box anzuschließen, konnte das Qualcomm-Notebook die eGPU beispielsweise nicht erkennen, während ein Thunderbolt-fähiger PC sie automatisch über den Gerätemanager erkennen würde. Qualcomm hat erklärt, dass jegliche Unterstützung und anwendbare Treiber von den einzelnen eGPU-Herstellern abhängen, was für bestehende eGPU-Besitzer nicht vielversprechend ist.
Kommunikation
Dell hat das BE200-Modul aus dem Intel XPS 13 gegen das FastConnect 7800-Modul im Qualcomm XPS 13 ausgetauscht. Dieses Modul unterstützt Wi-Fi 7-Konnektivität, die in den meisten Haushalten noch unüblich ist. In Verbindung mit unserem Wi-Fi 6E AXE11000-Test-Router ist die Leistung dennoch stabil.
Webcam
Das Modell ist standardmäßig mit der gleichen 2-MP-Webcam ausgestattet wie das XPS 13 9340 und nicht mit der 1-MP-Webcam des ursprünglichen XPS 13 9320. IR ist ebenfalls integriert, um die Windows Hello-Gesichtserkennung zu unterstützen. Allerdings fehlt nach wie vor eine Kameraabdeckung oder ein Kill-Switch.


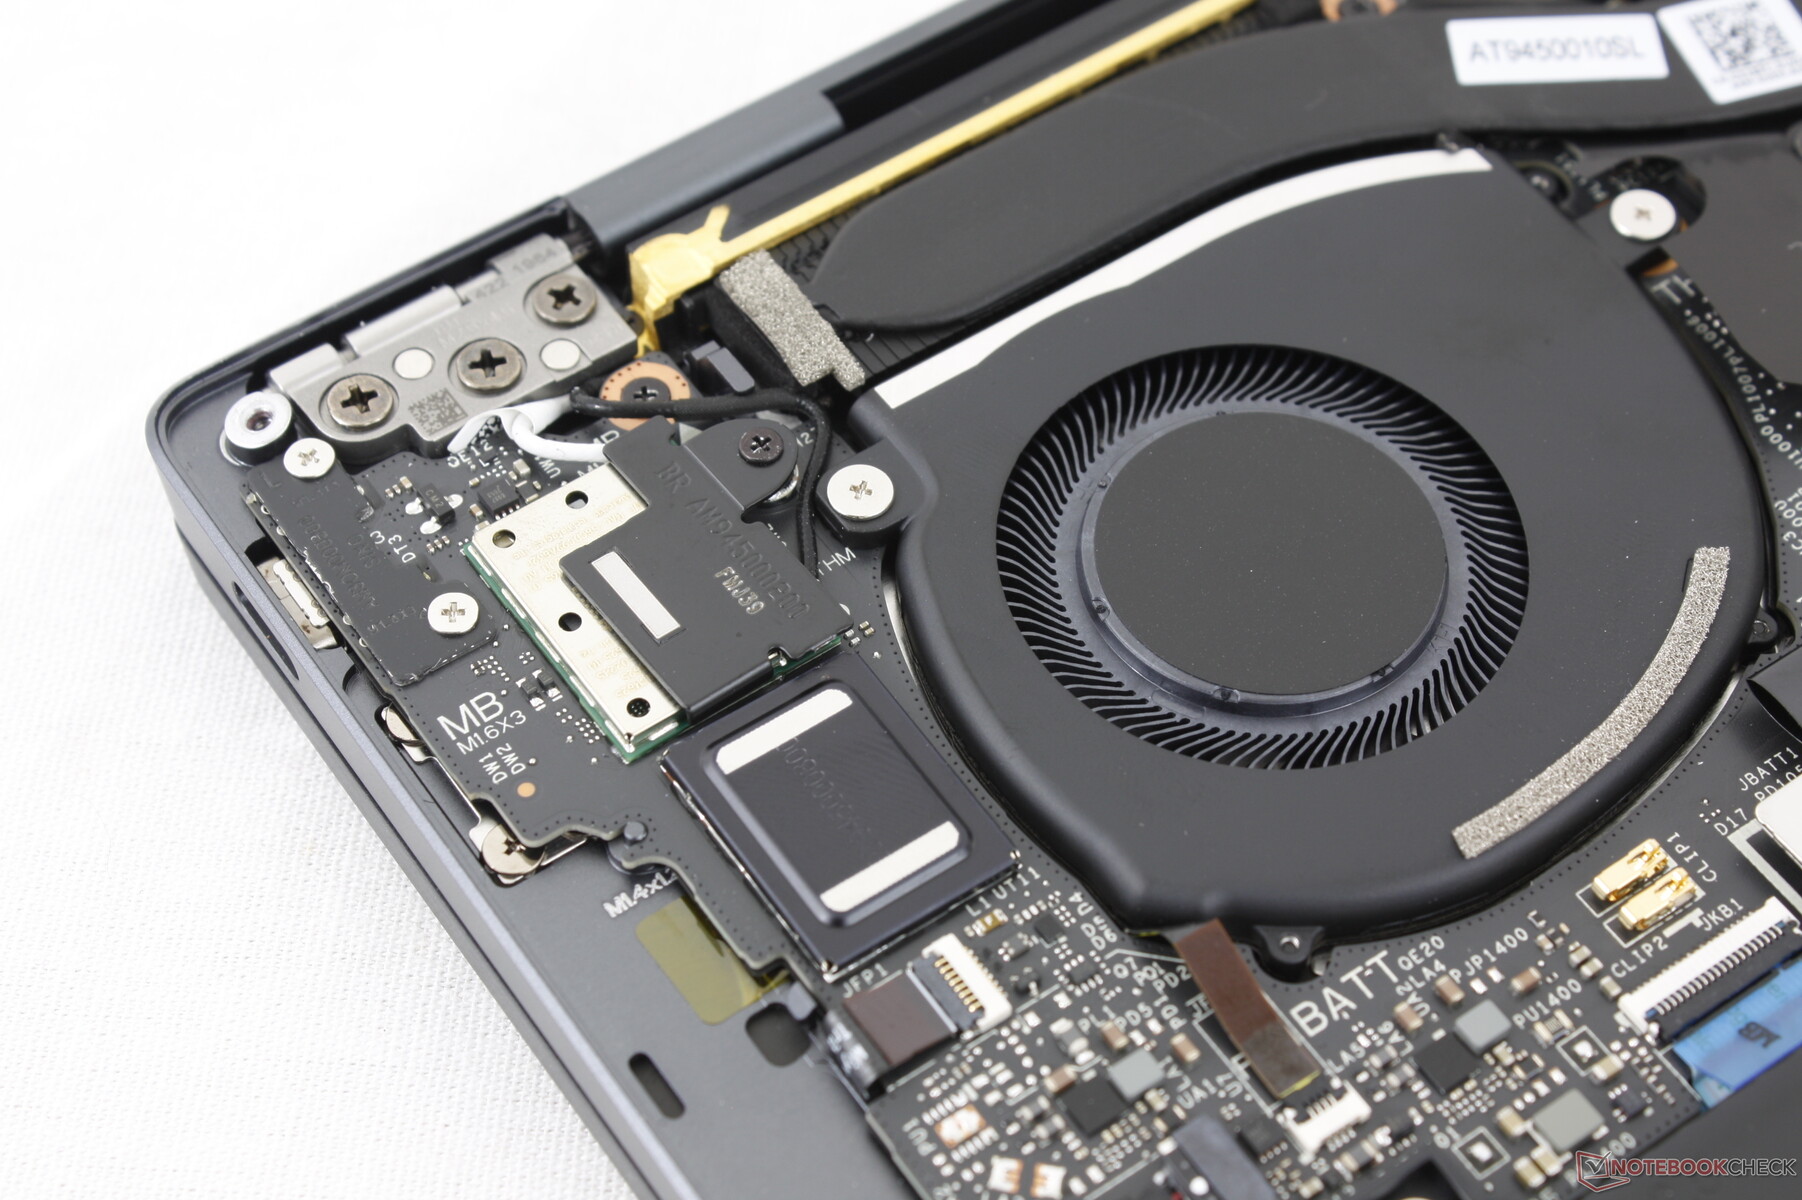
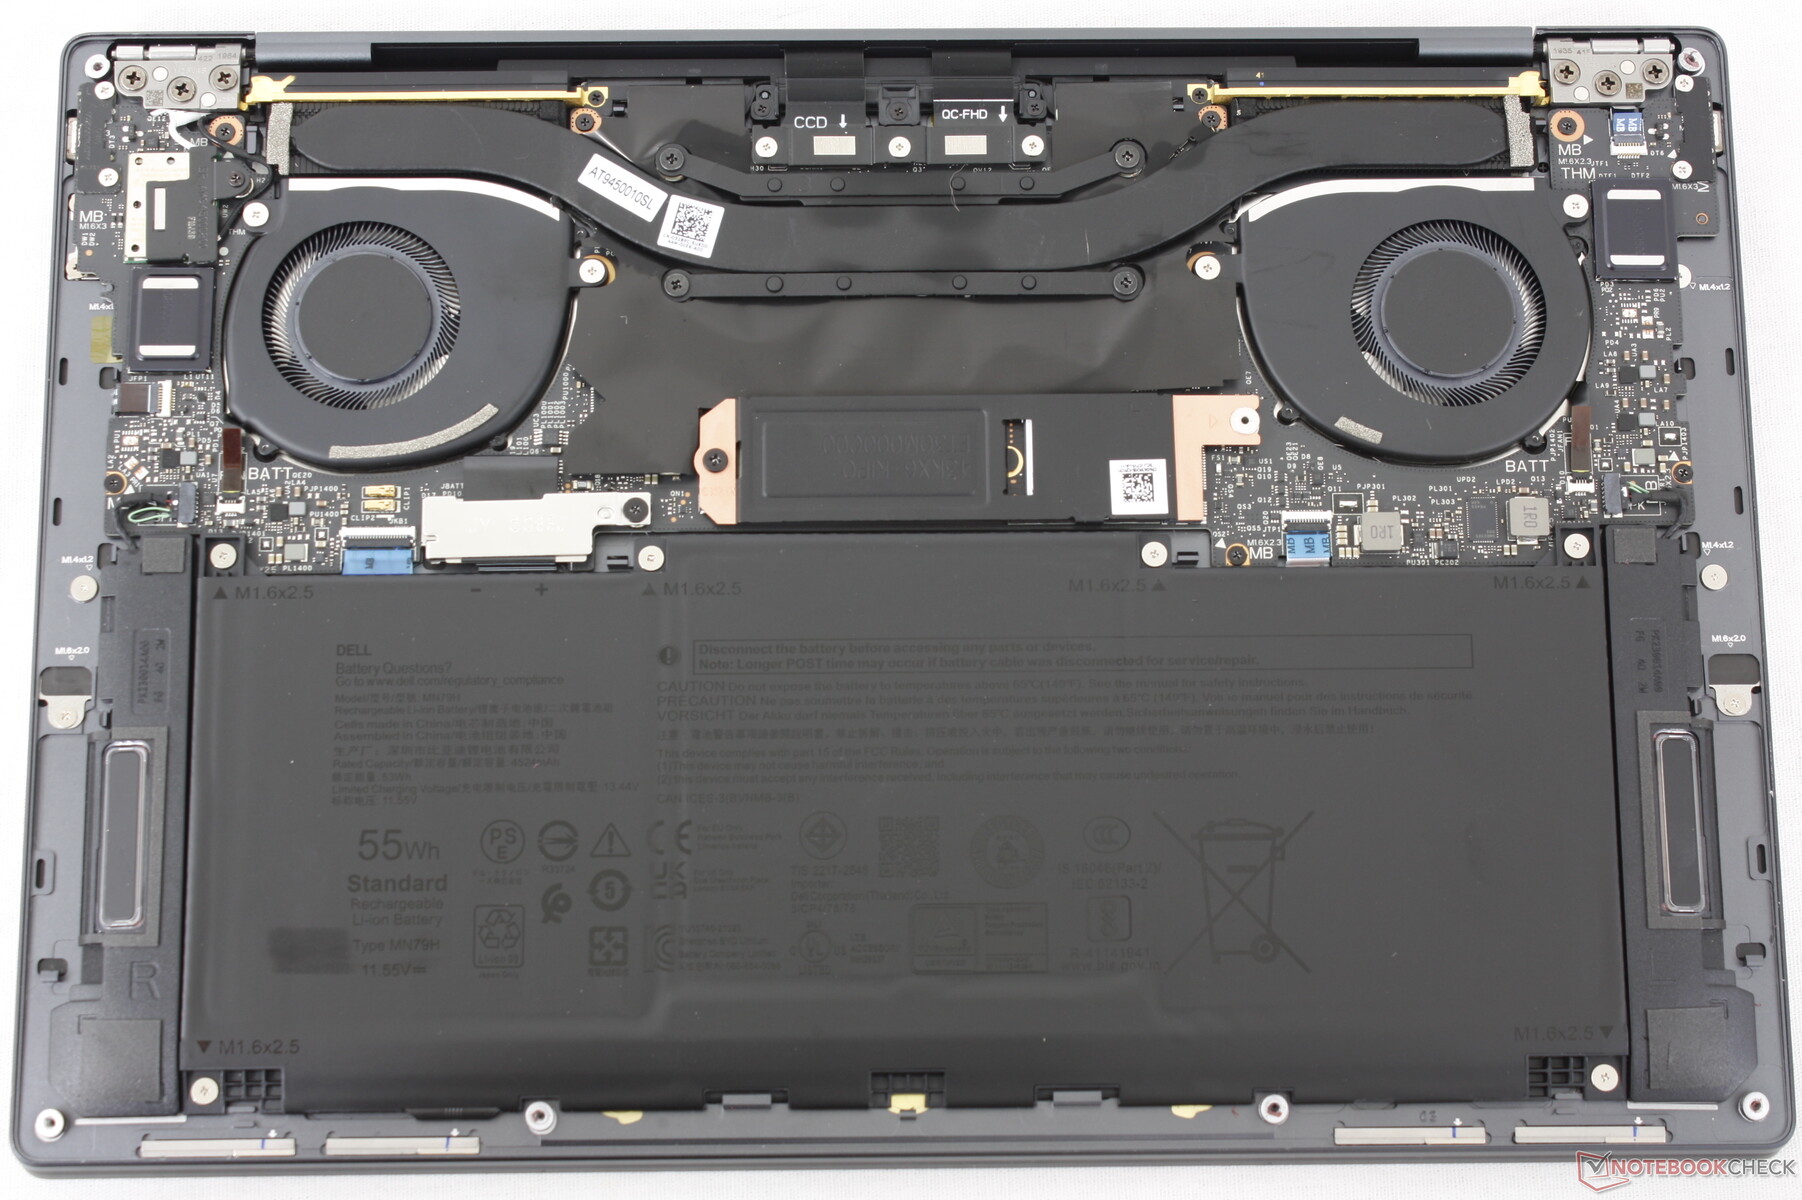
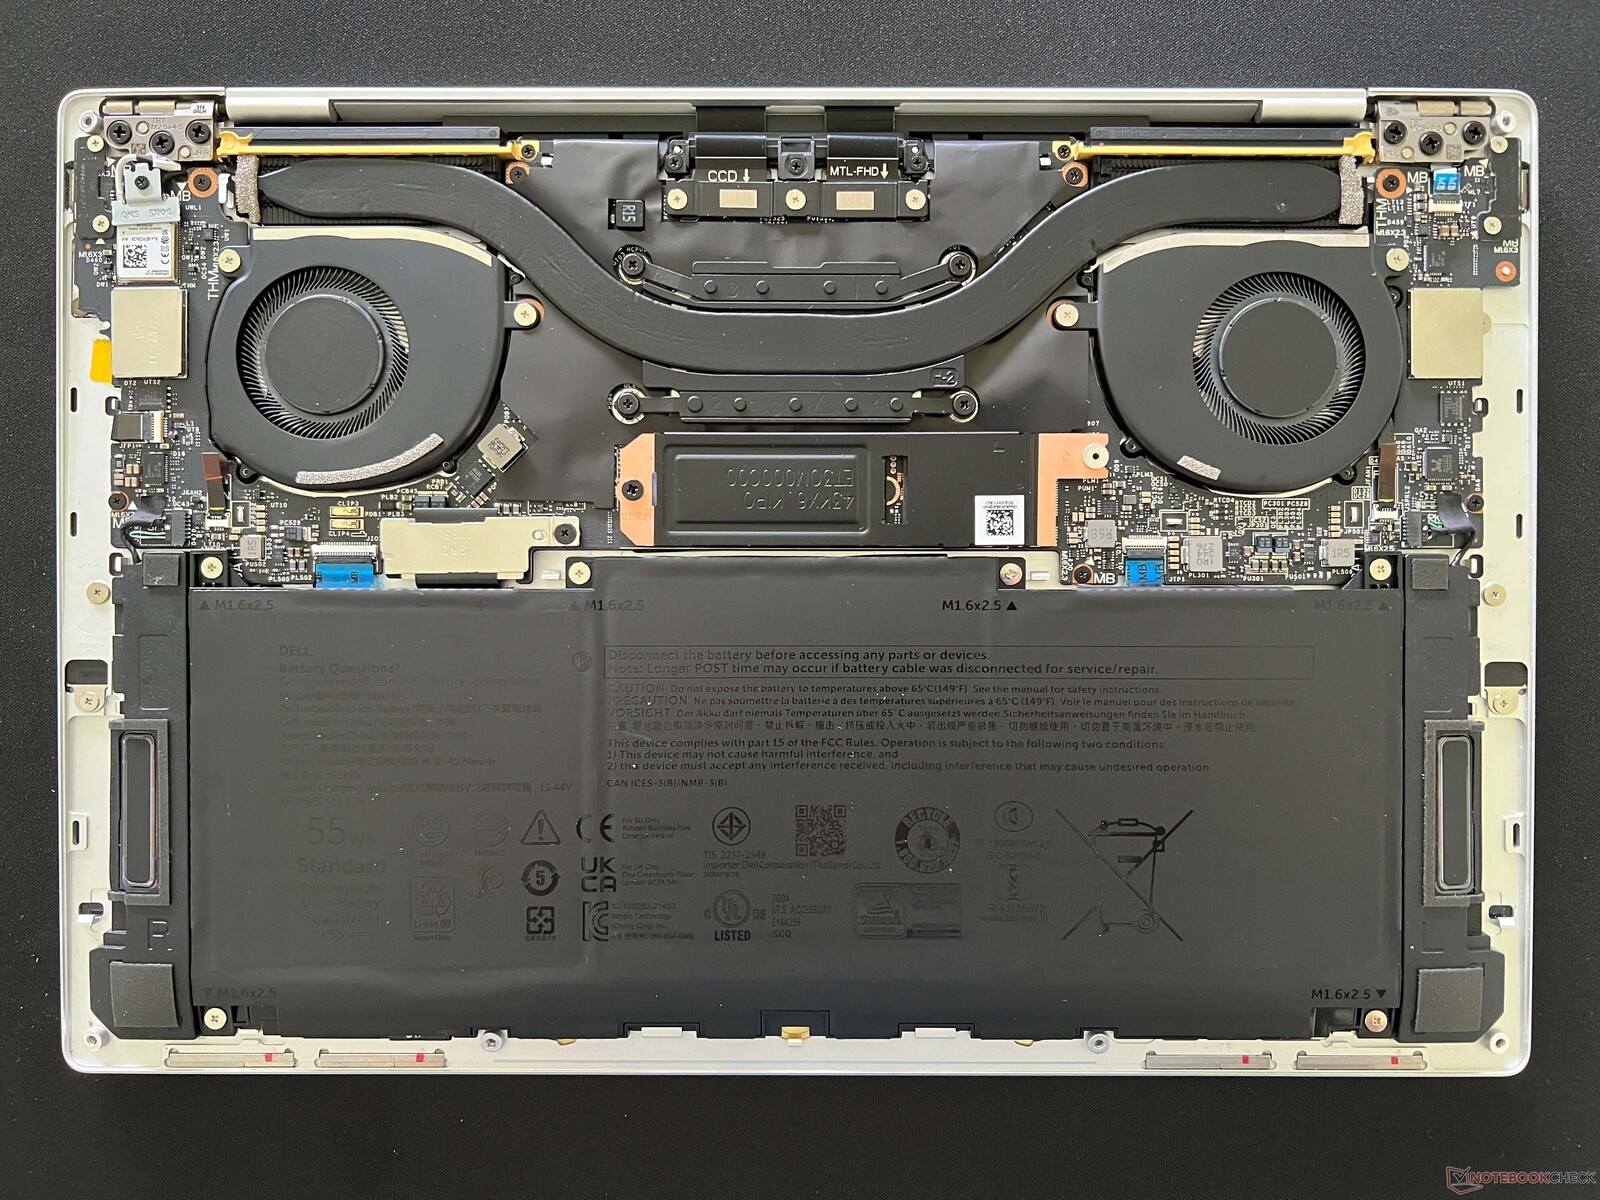
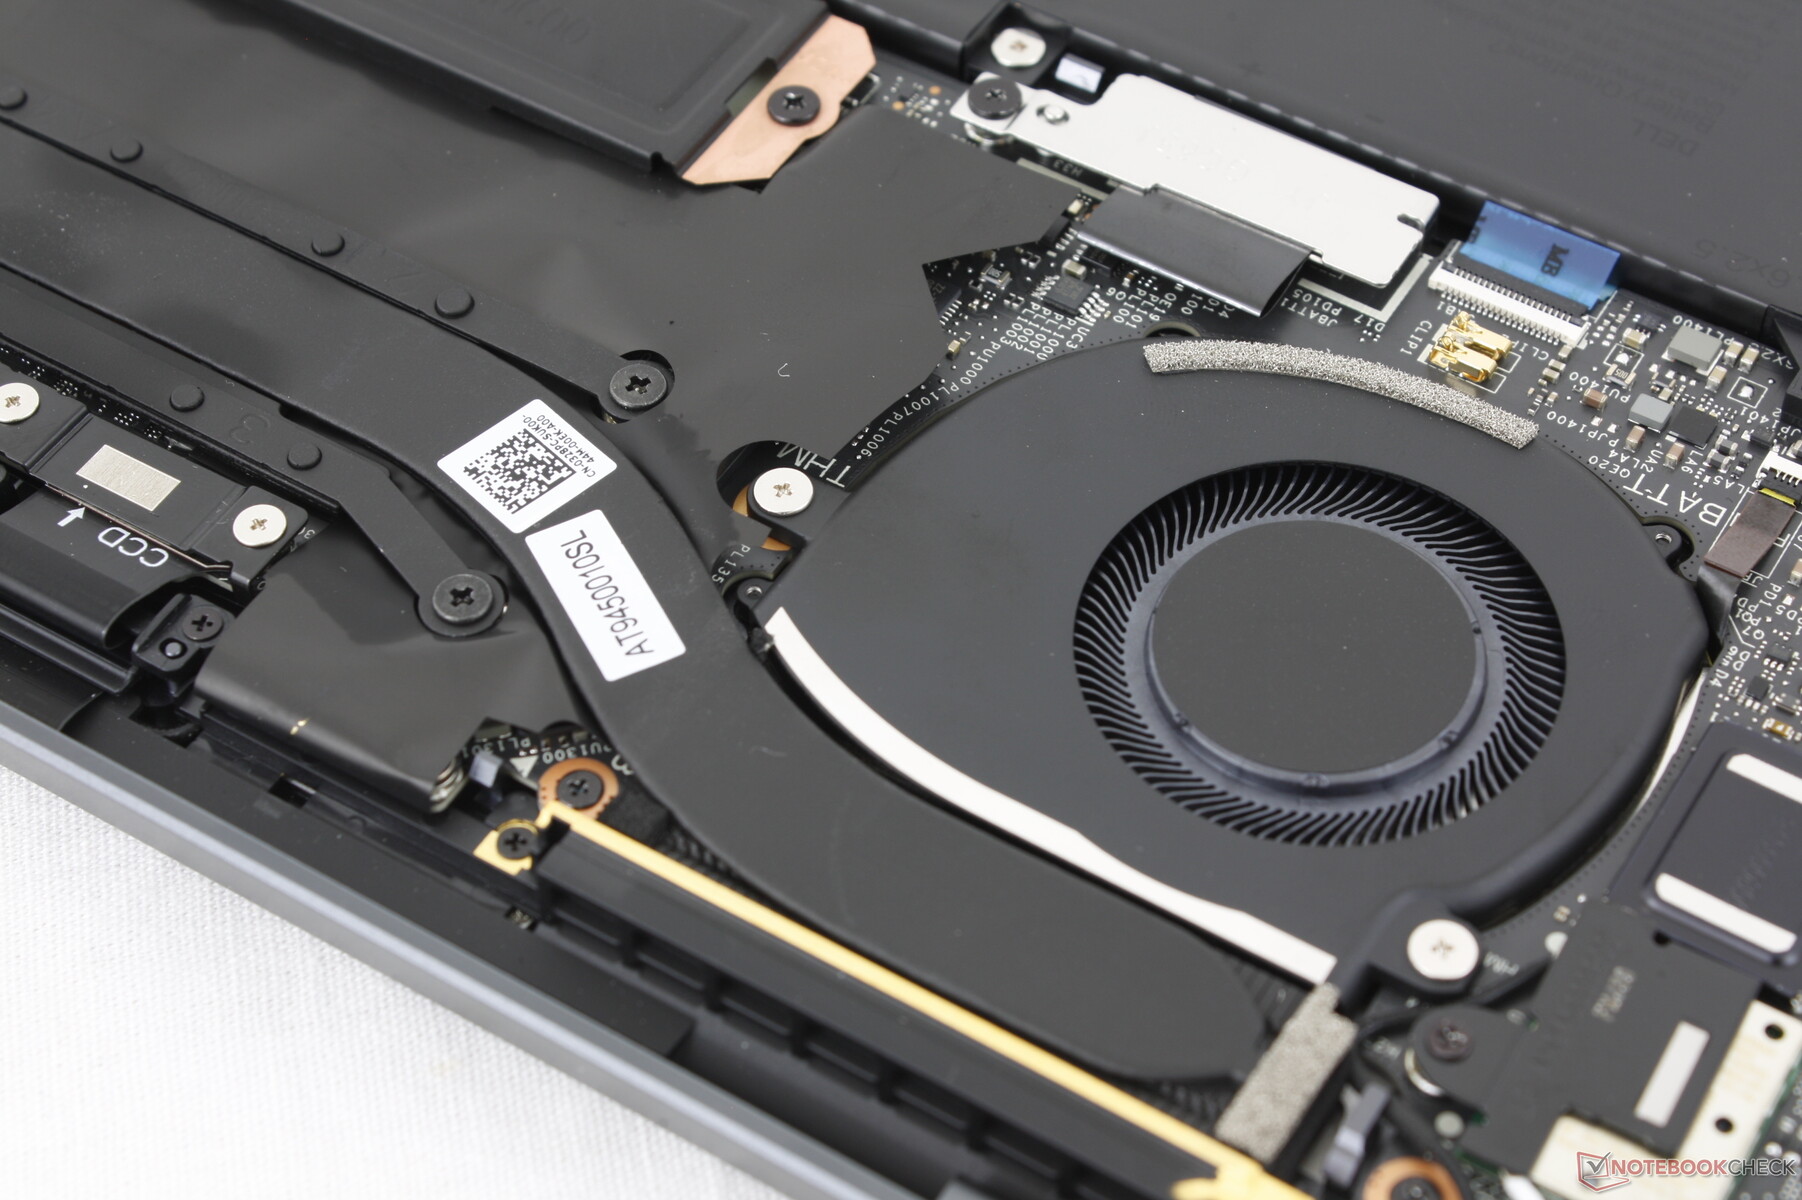
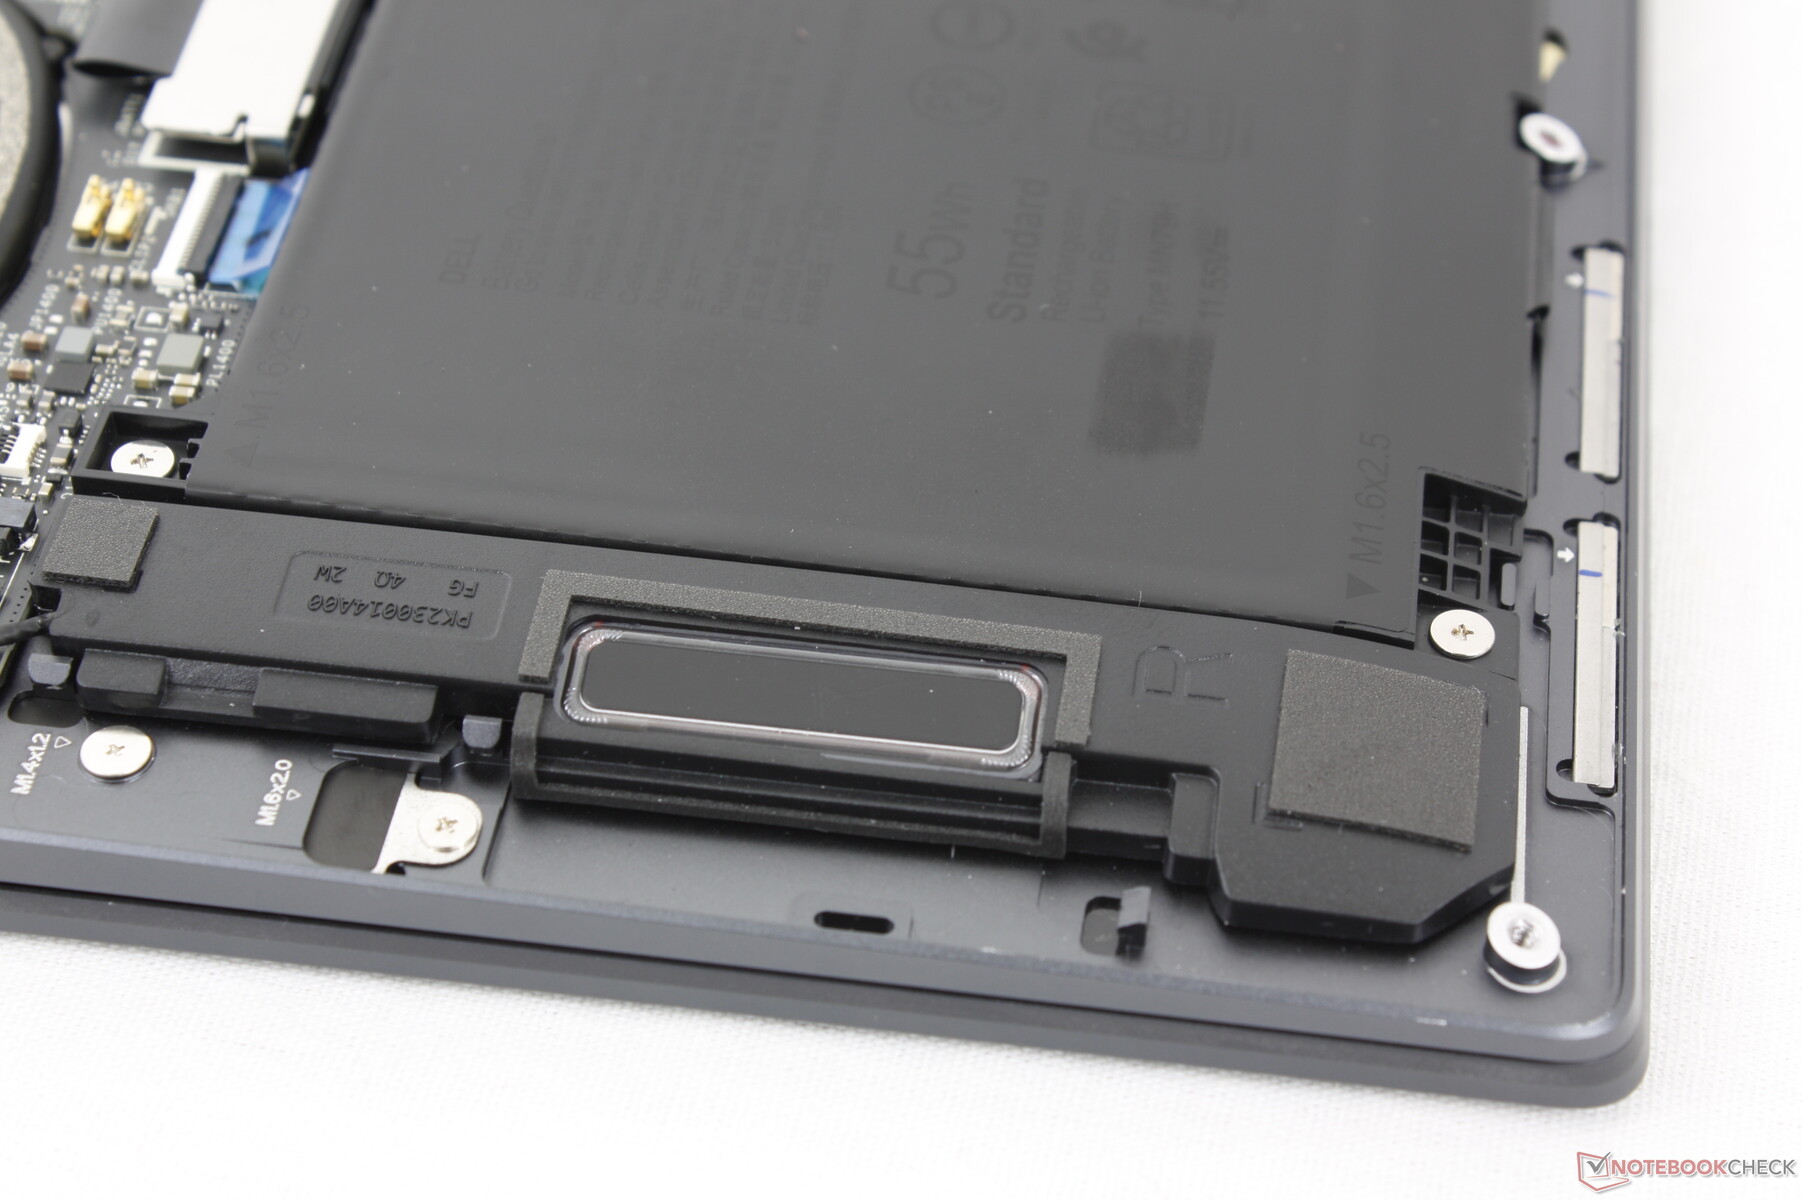
Wartung
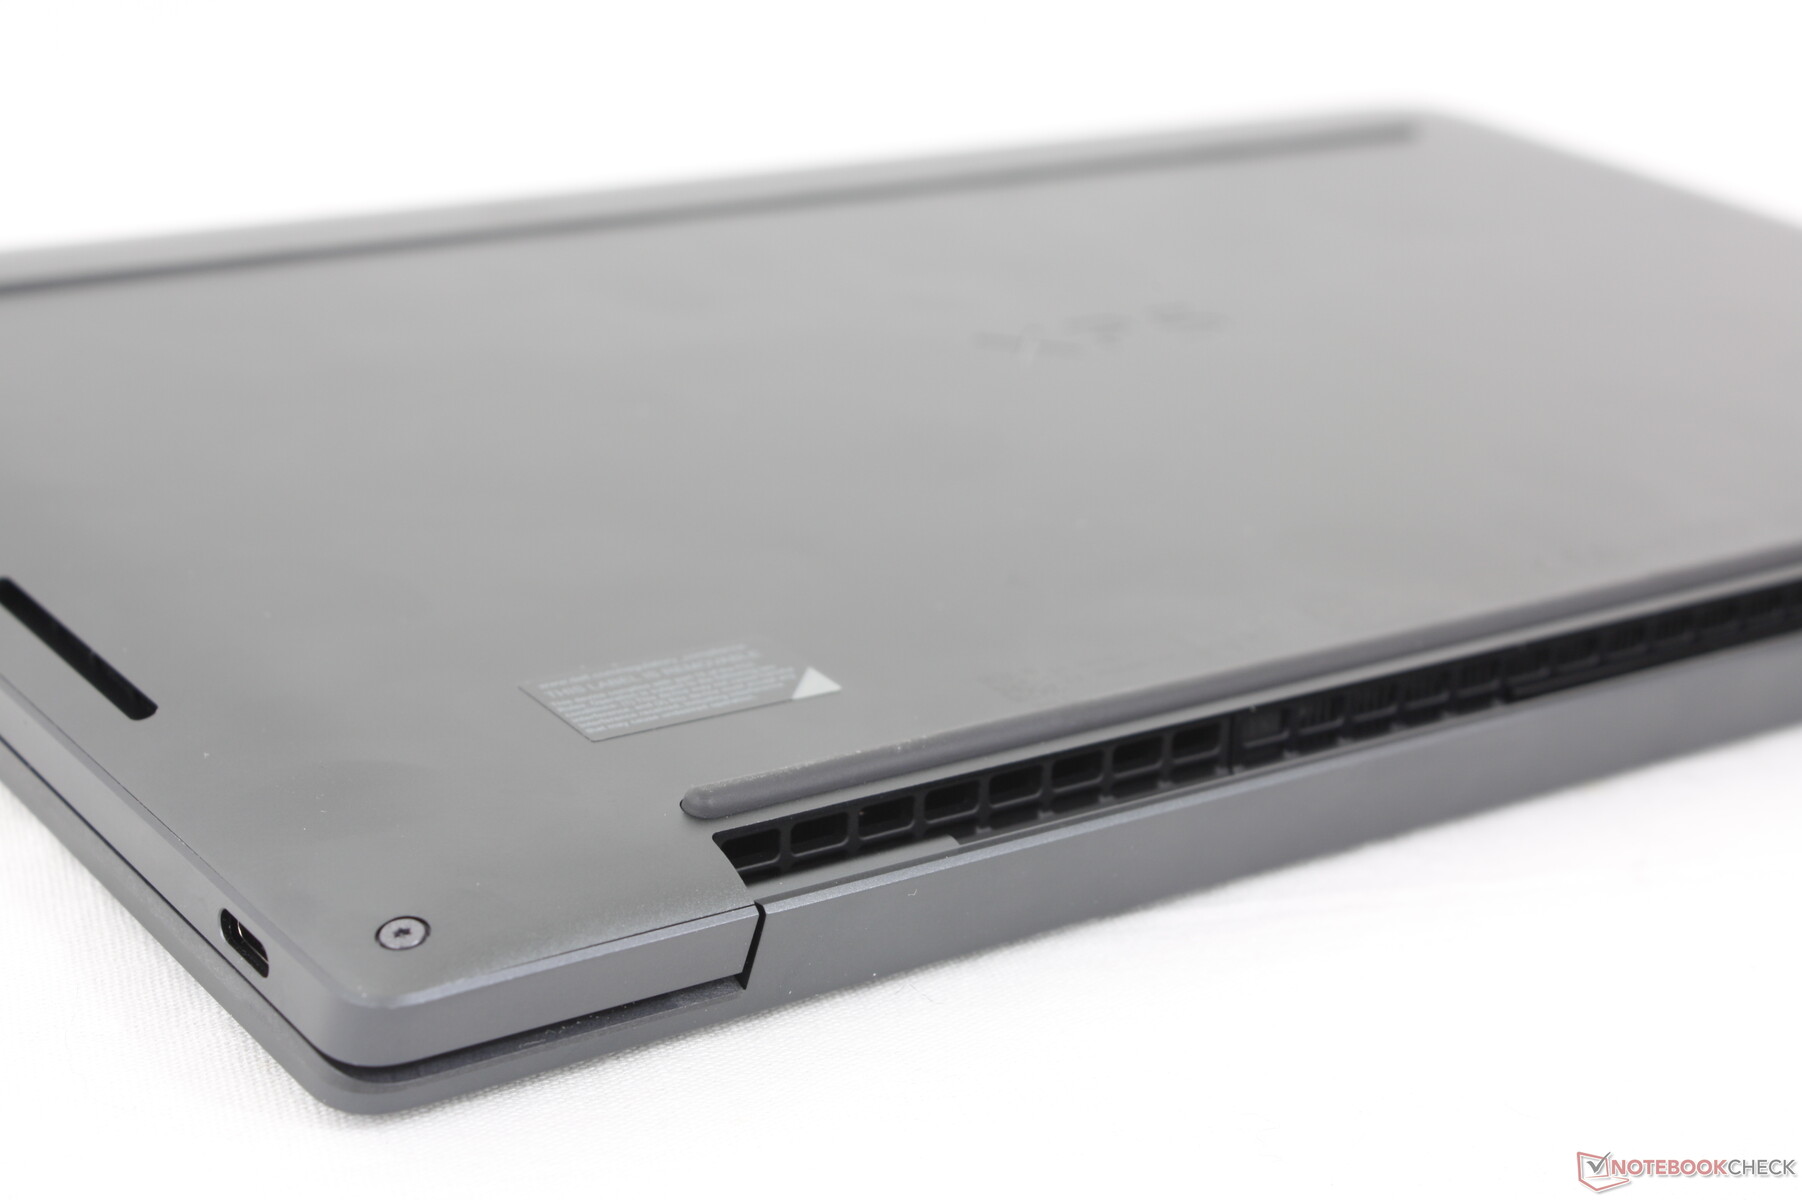
Zum Entfernen der Bodenplatte ist lediglich ein Torx-Schraubendreher erforderlich. Abgesehen von der einzelnen M.2-SSD gibt es jedoch keine weiteren Aufrüstmöglichkeiten, da sowohl der RAM als auch das WLAN-Modul verlötet sind.
Nachhaltigkeit
Die Verpackung besteht zu 75 Prozent aus recyceltem und zu 25 Prozent aus erneuerbarem Material, um vollständig recycelbar zu sein. Der Laptop selbst wurde zu mindestens 20 Prozent aus recyceltem Aluminium und Glas hergestellt.
Zubehör und Garantie
Außer dem Netzteil und dem Papierkram befinden sich keine weiteren Extras im Karton, während bei den Intel-basierten XPS-Modellen oft ein USB-C-auf-USB-A-Adapter kostenlos mitgeliefert wird.
Es gilt die übliche zweijährige eingeschränkte Herstellergarantie.
Eingabegeräte — Übersichtlicheres Design auf Kosten der Benutzerfreundlichkeit
Tastatur
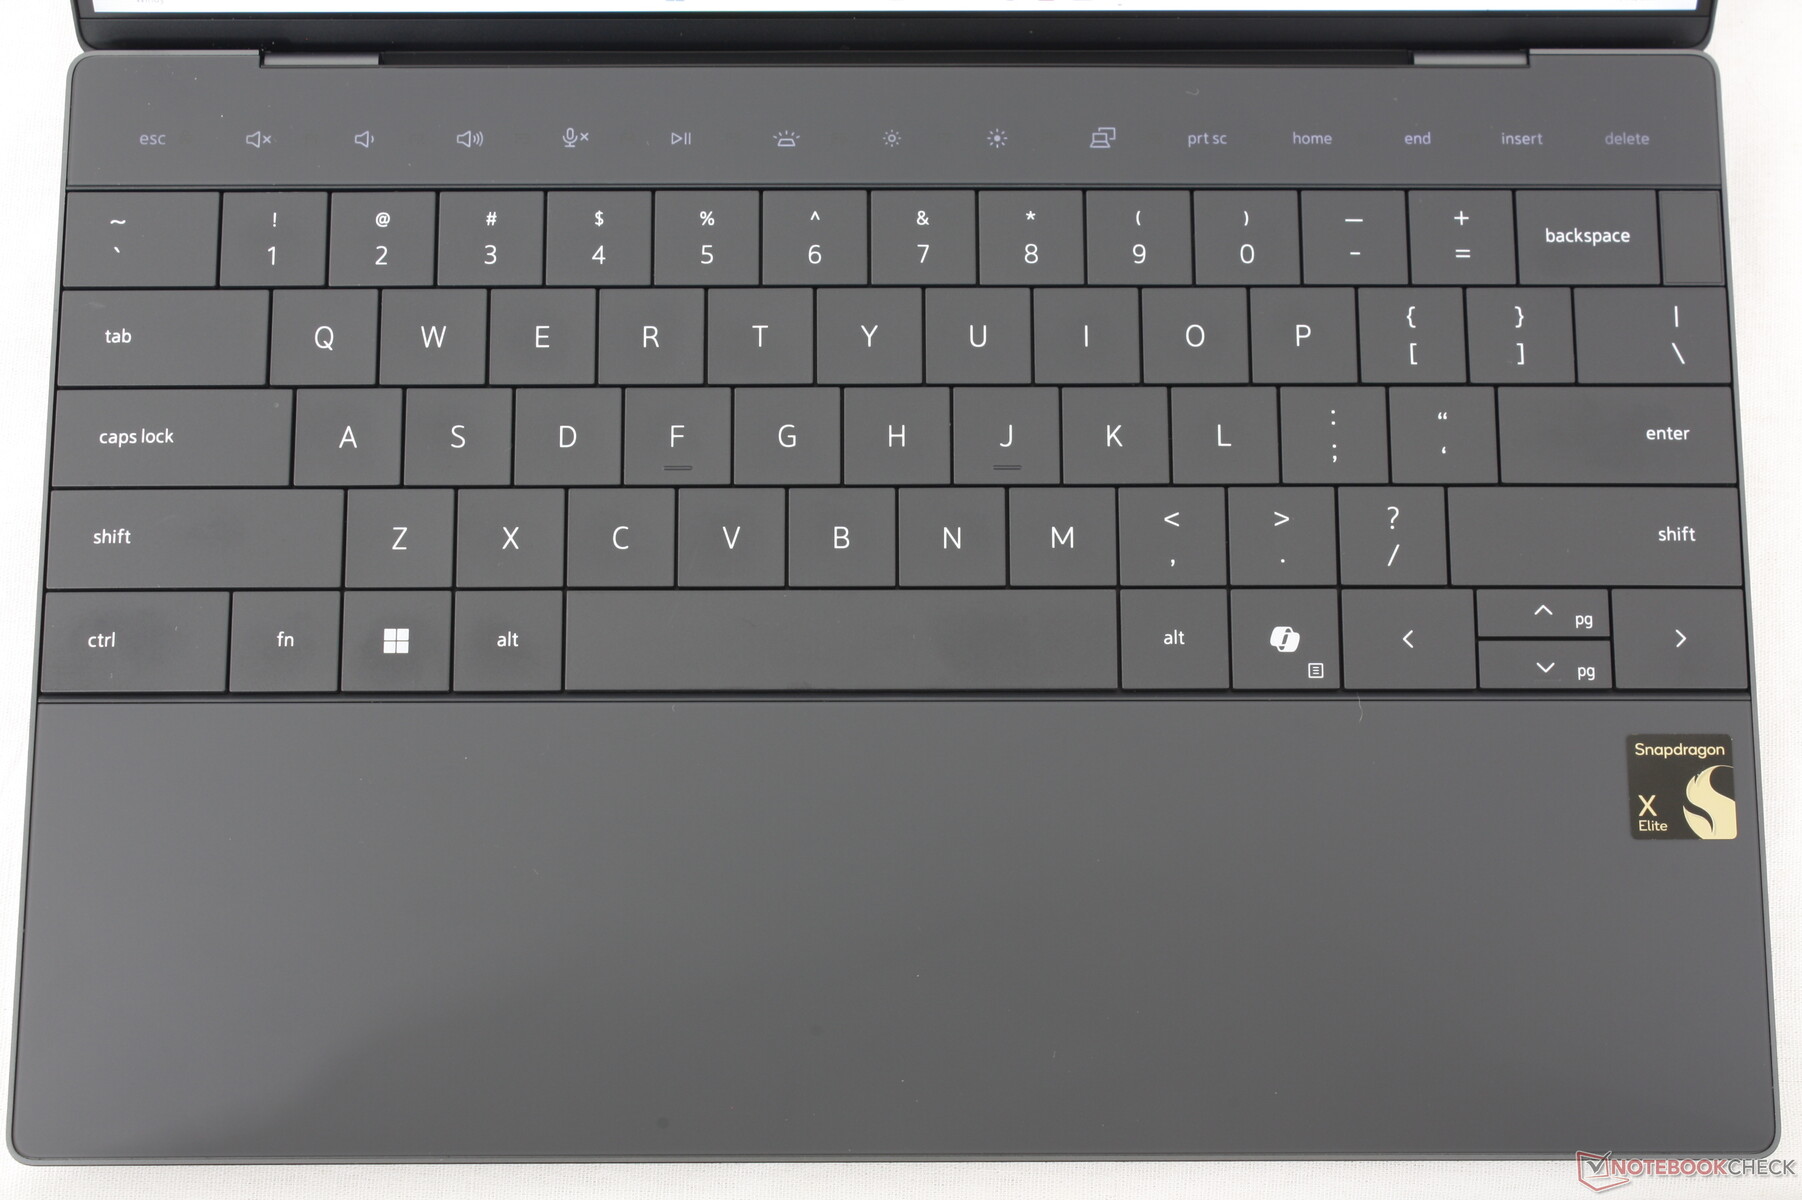
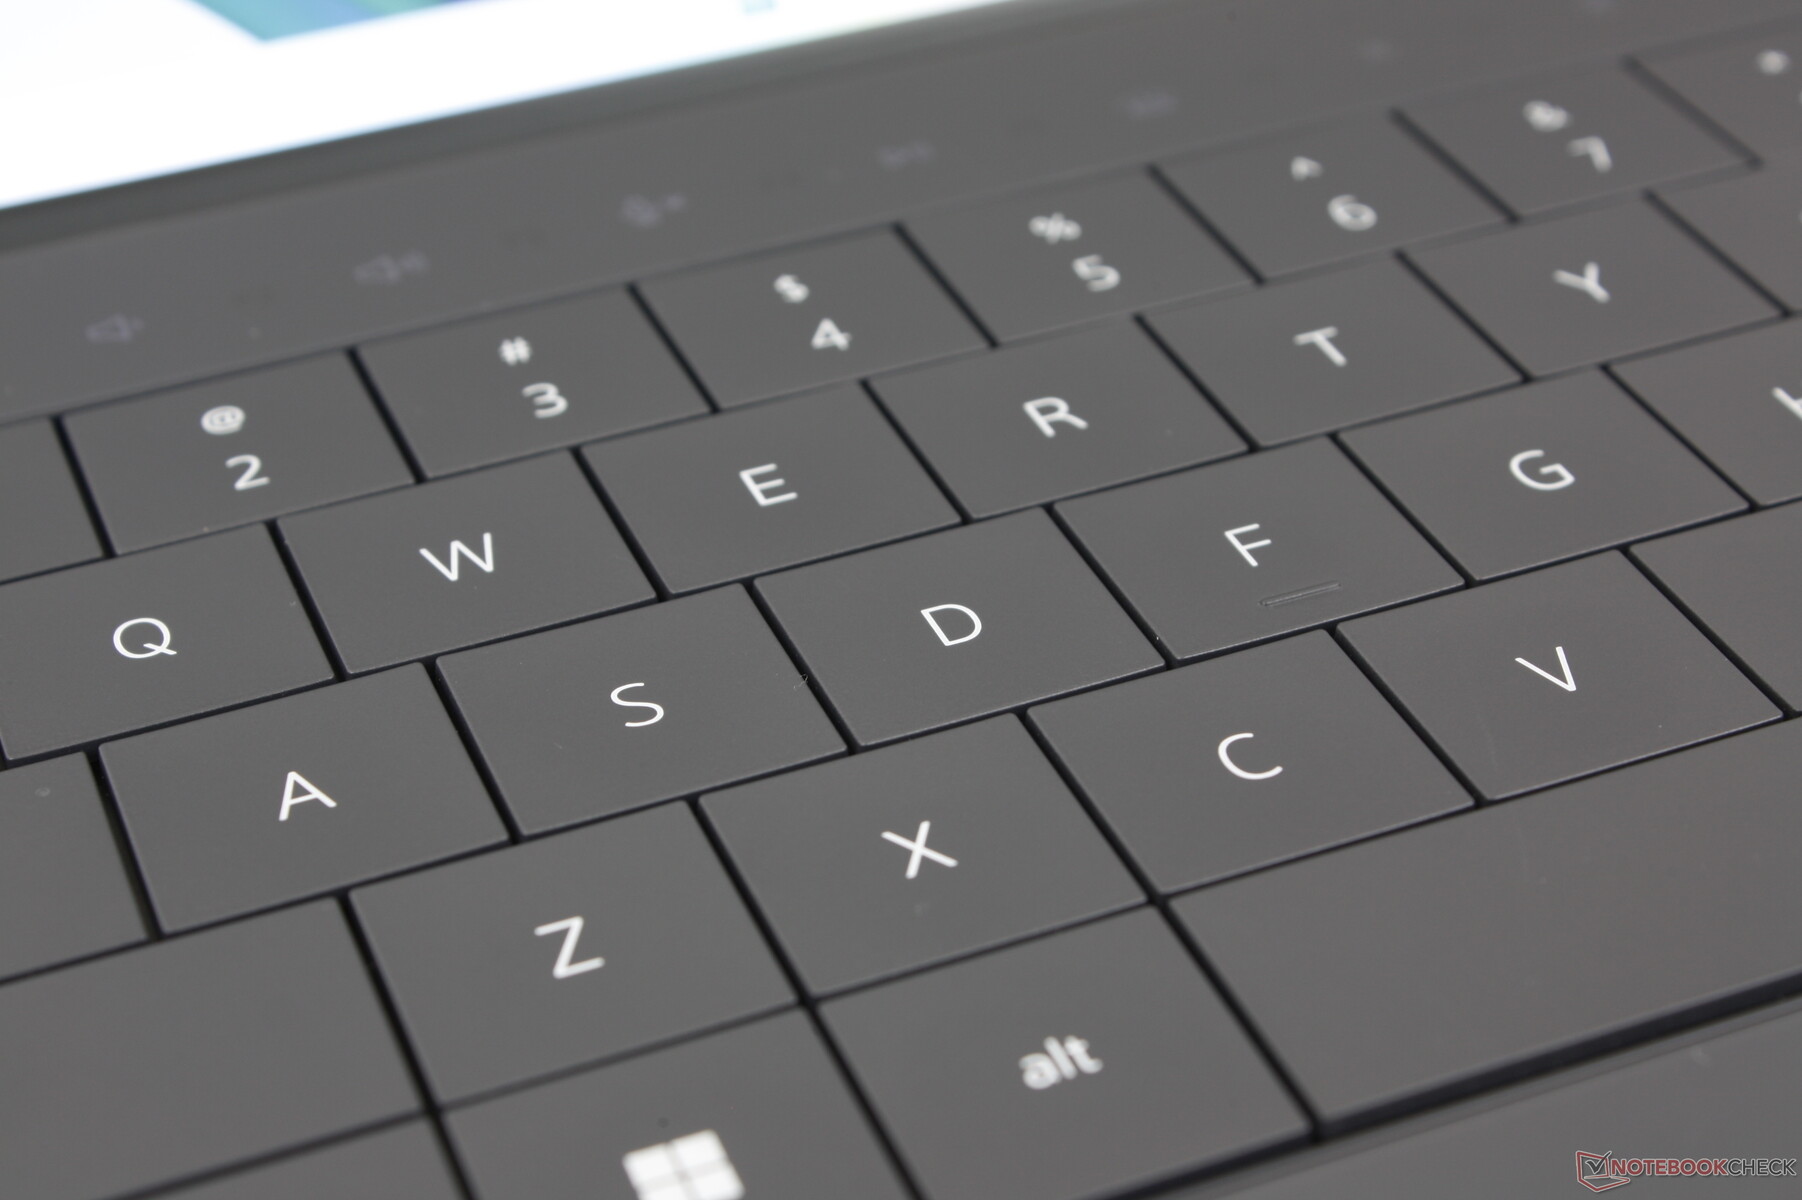
Die Zero-Lattice-Tastatur ist im Vergleich zu den traditionellen Tastaturen der meisten anderen Subnotebooks etwas gewöhnungsbedürftig. Der Tastenhub ist mit nur 1,0 mm noch flacher als üblich, und das Feedback ist relativ weich, was zu einem schwammigeren Tipperlebnis führt. Der Unterschied ist wie Tag und Nacht, wenn man zwischen dem XPS 13 9345 und den festeren Tasten des HP Spectre x360 14 wechselt.
Berührungsaktivierte Funktionstasten sind ebenfalls eine gemischte Sache. Lenovo hat etwas Ähnliches vor einigen Jahren in seine ThinkPad-Serie eingebaut, bevor es wieder eingestellt wurde, und so ist es etwas überraschend, dass sie bei einem konkurrierenden Hersteller wieder auftauchen. Das Hauptproblem ist, dass die Tasten selbst auf die kleinsten Berührungen empfindlich reagieren, was zu versehentlichen Eingaben führen kann.
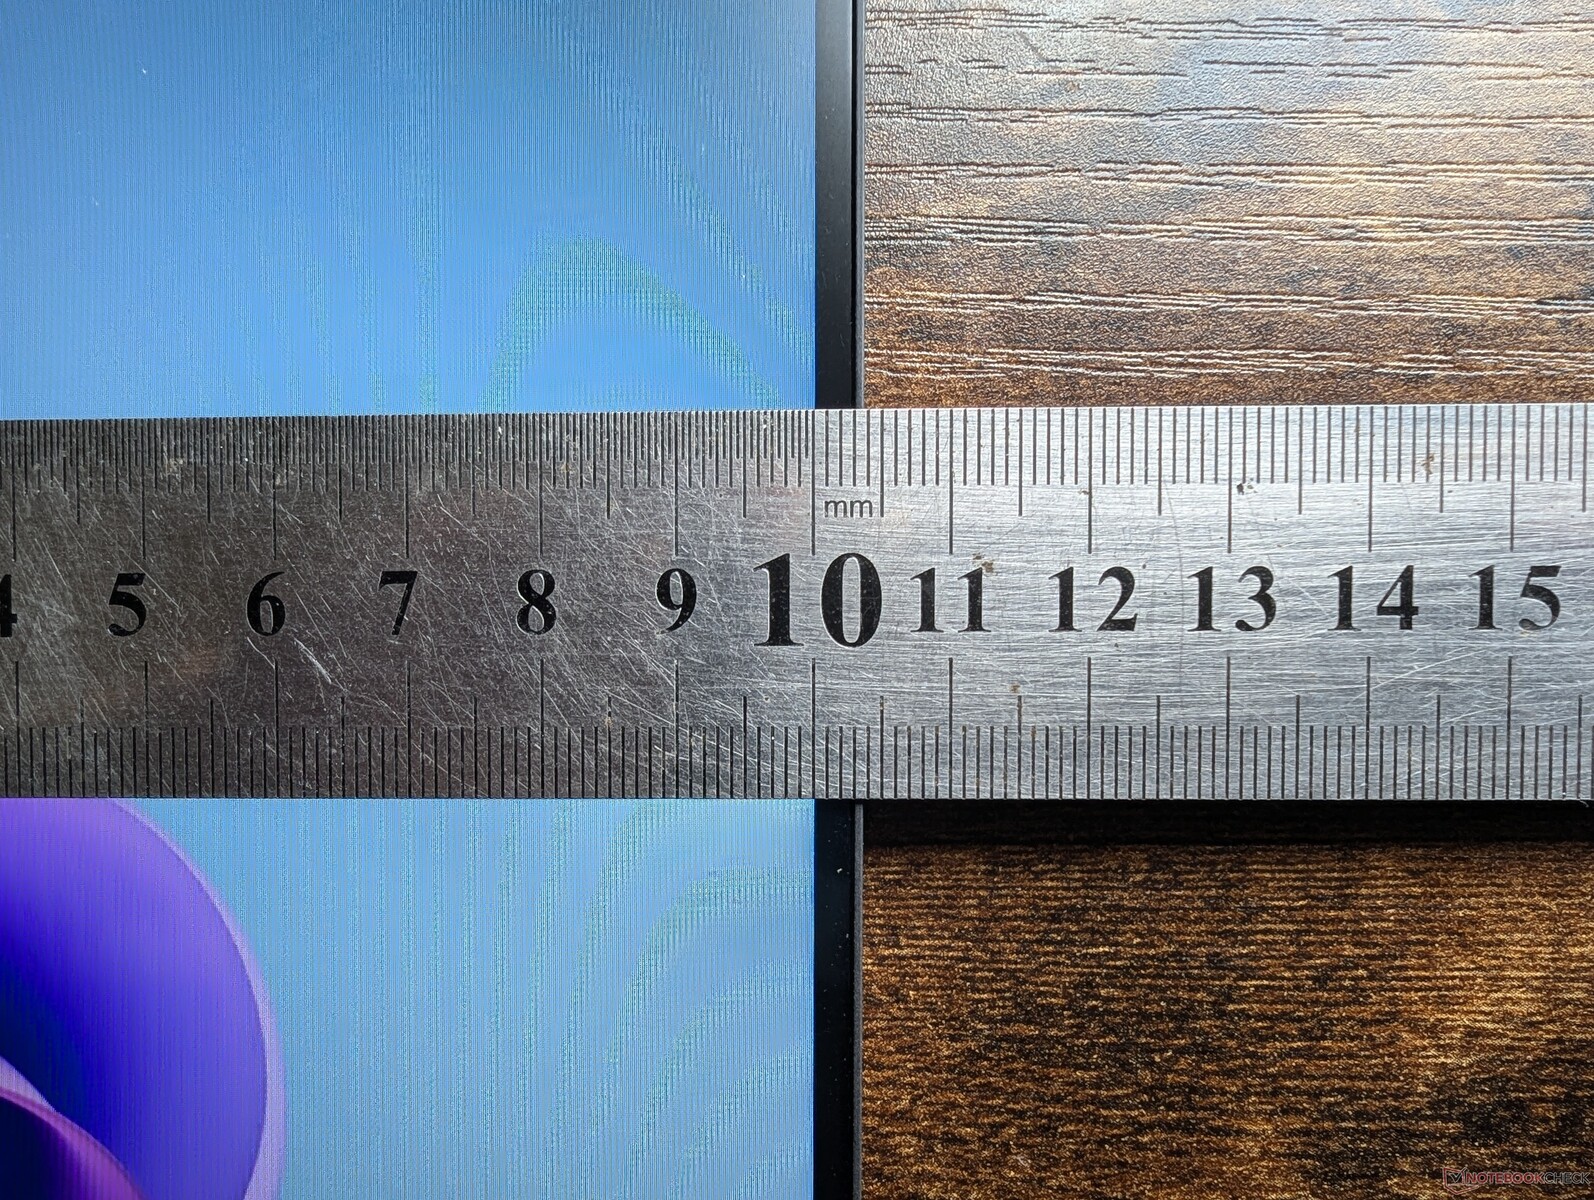
Touchpad
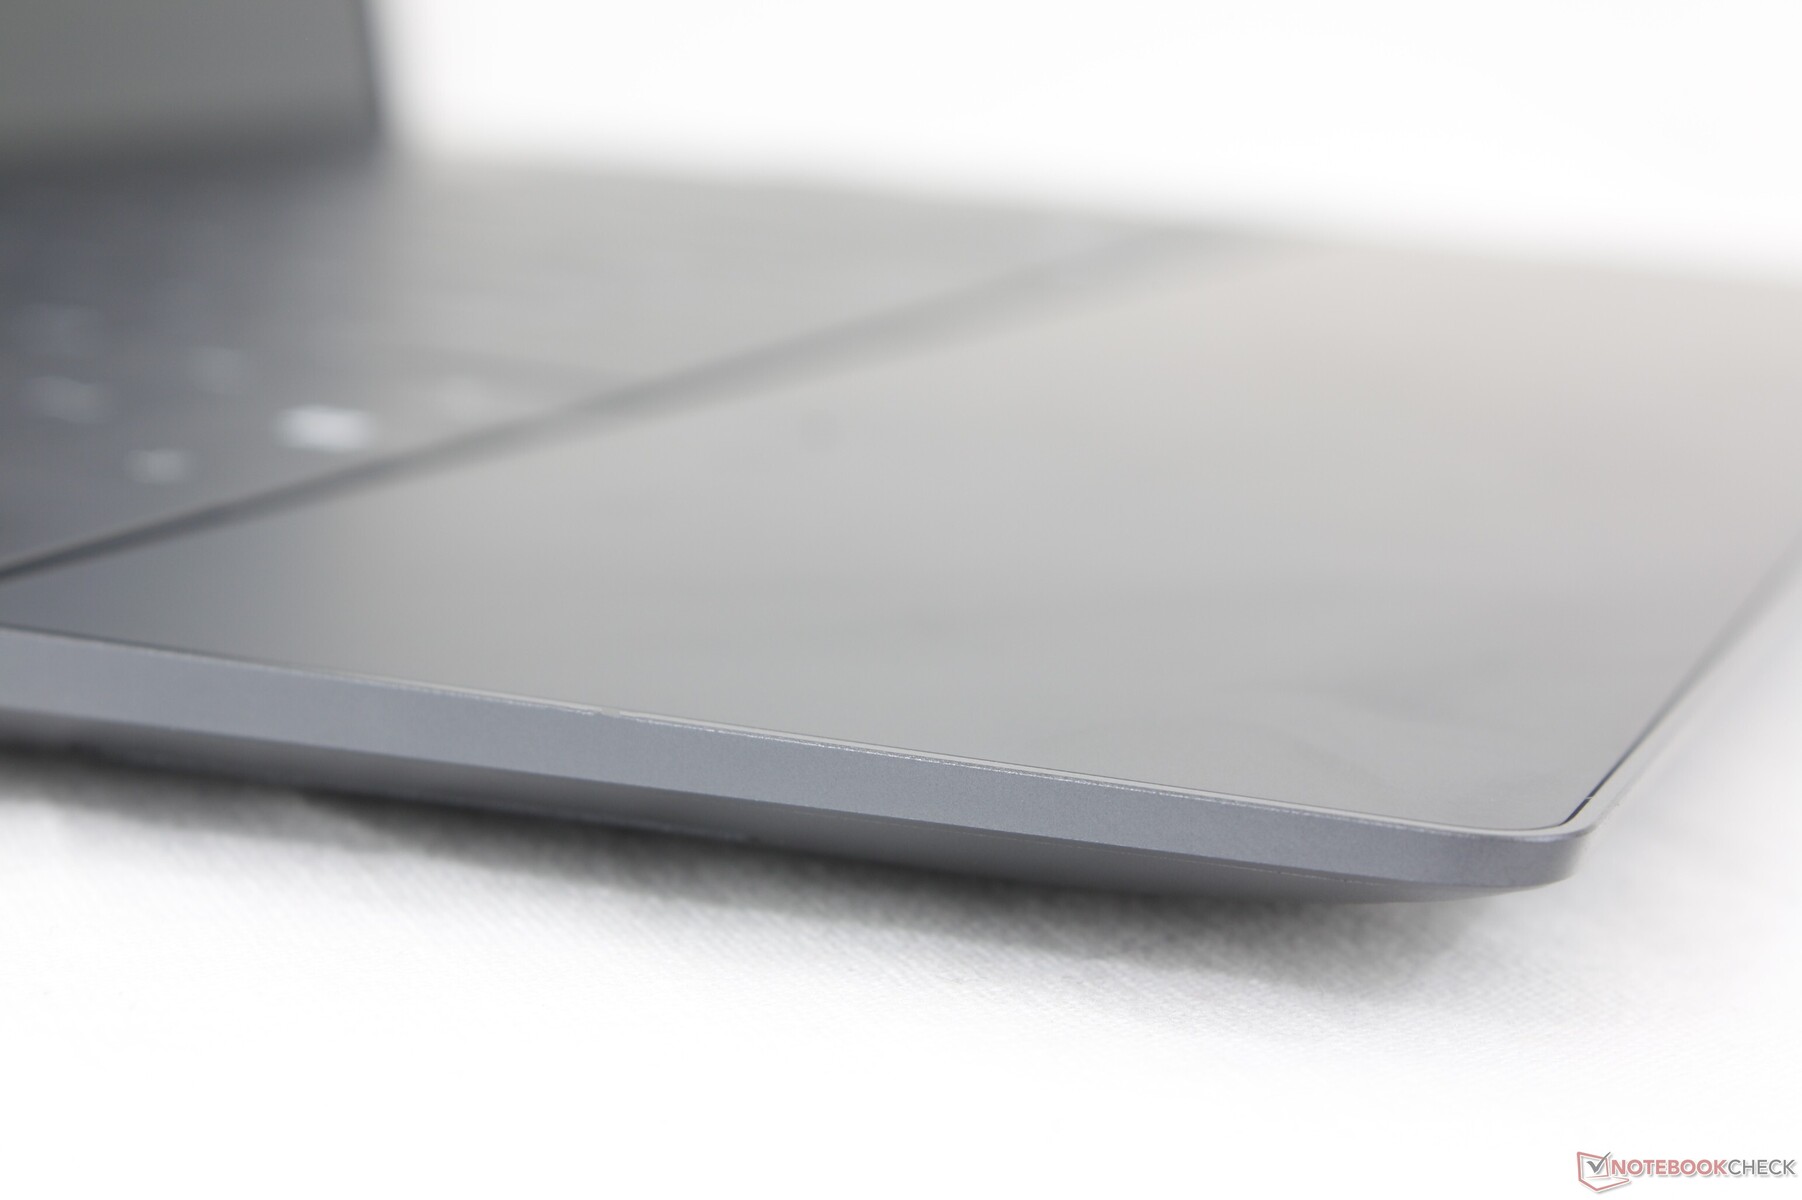
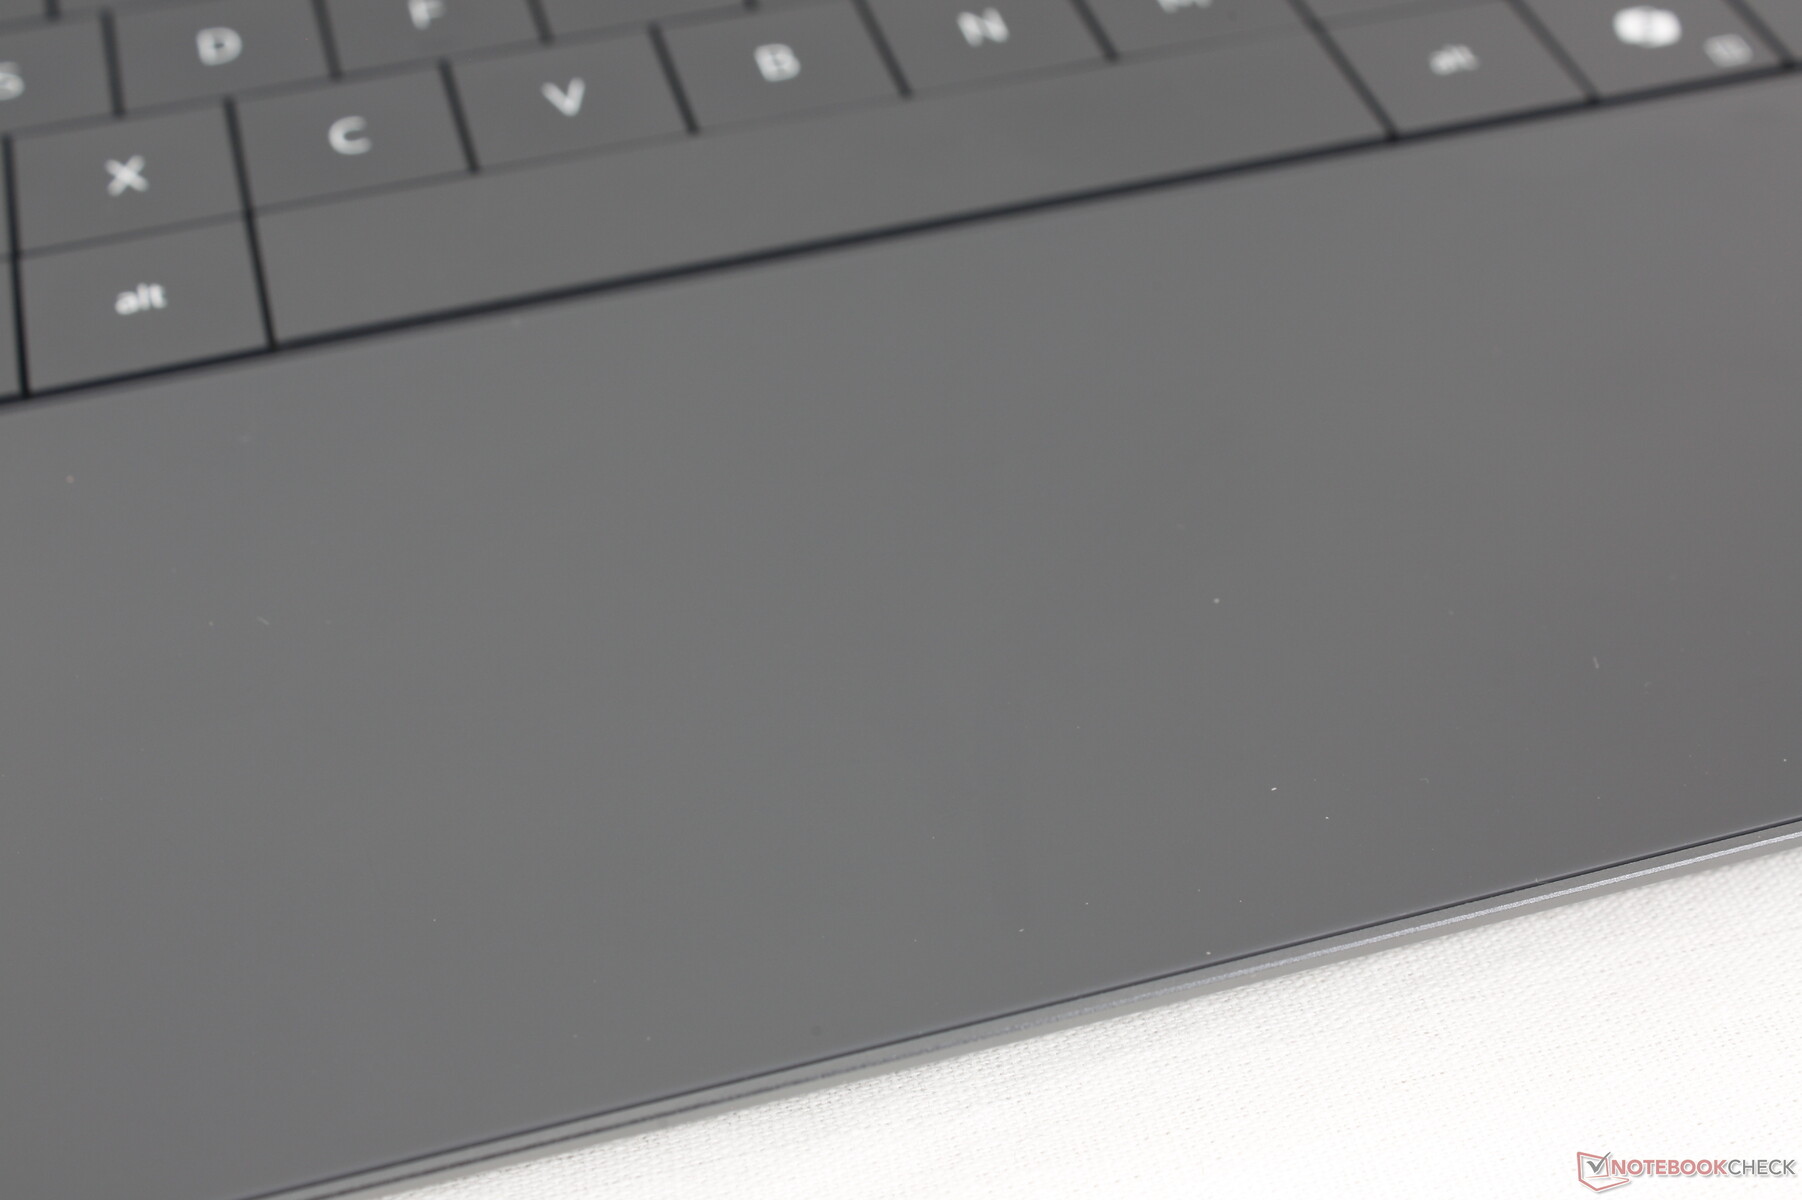
Das unsichtbare XPS-Clickpad ist für seine Benutzerunfreundlichkeit berüchtigt, und dieser Trend setzt sich auch beim Snapdragon-Modell fort. Obwohl die nutzbare Fläche mit ca. 11,5 x 7,5 cm für einen 13-Zoll-Formfaktor recht groß ist, ist das Klicken aufgrund des schwachen Feedbacks unbefriedigend. Schlimmer noch, die erforderliche Kraft für die Eingabe eines Klicks ist viel geringer als bei den meisten anderen Laptops, was zu vielen versehentlichen Klicks und Ziehen führt, wenn man einfach nur versucht, den Cursor zu bewegen. Nach zwei Jahren mit diesem Design hatten wir auf Verbesserungen in dieser Hinsicht gehofft, aber das ist leider nicht der Fall.

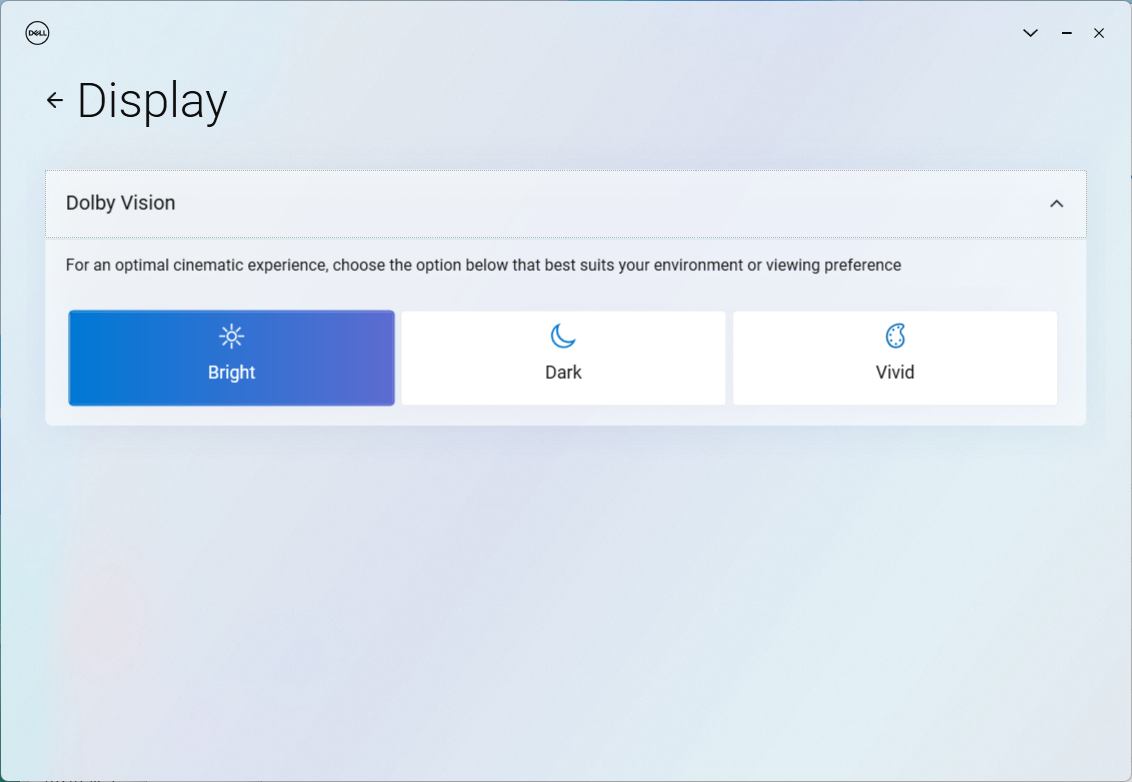
Display
Es stehen drei Anzeigeoptionen zur Verfügung, die wie folgt aussehen. Unsere Testkonfiguration ist mit der fettgedruckten Option ausgestattet:
- 1920 x 1200, IPS, 120 Hz, Non-Touch, matt
- 2560 x 1600, IPS, 120 Hz, Touch, glänzend
- 2880 x 1800, OLED, 60 Hz, Touch, glänzend
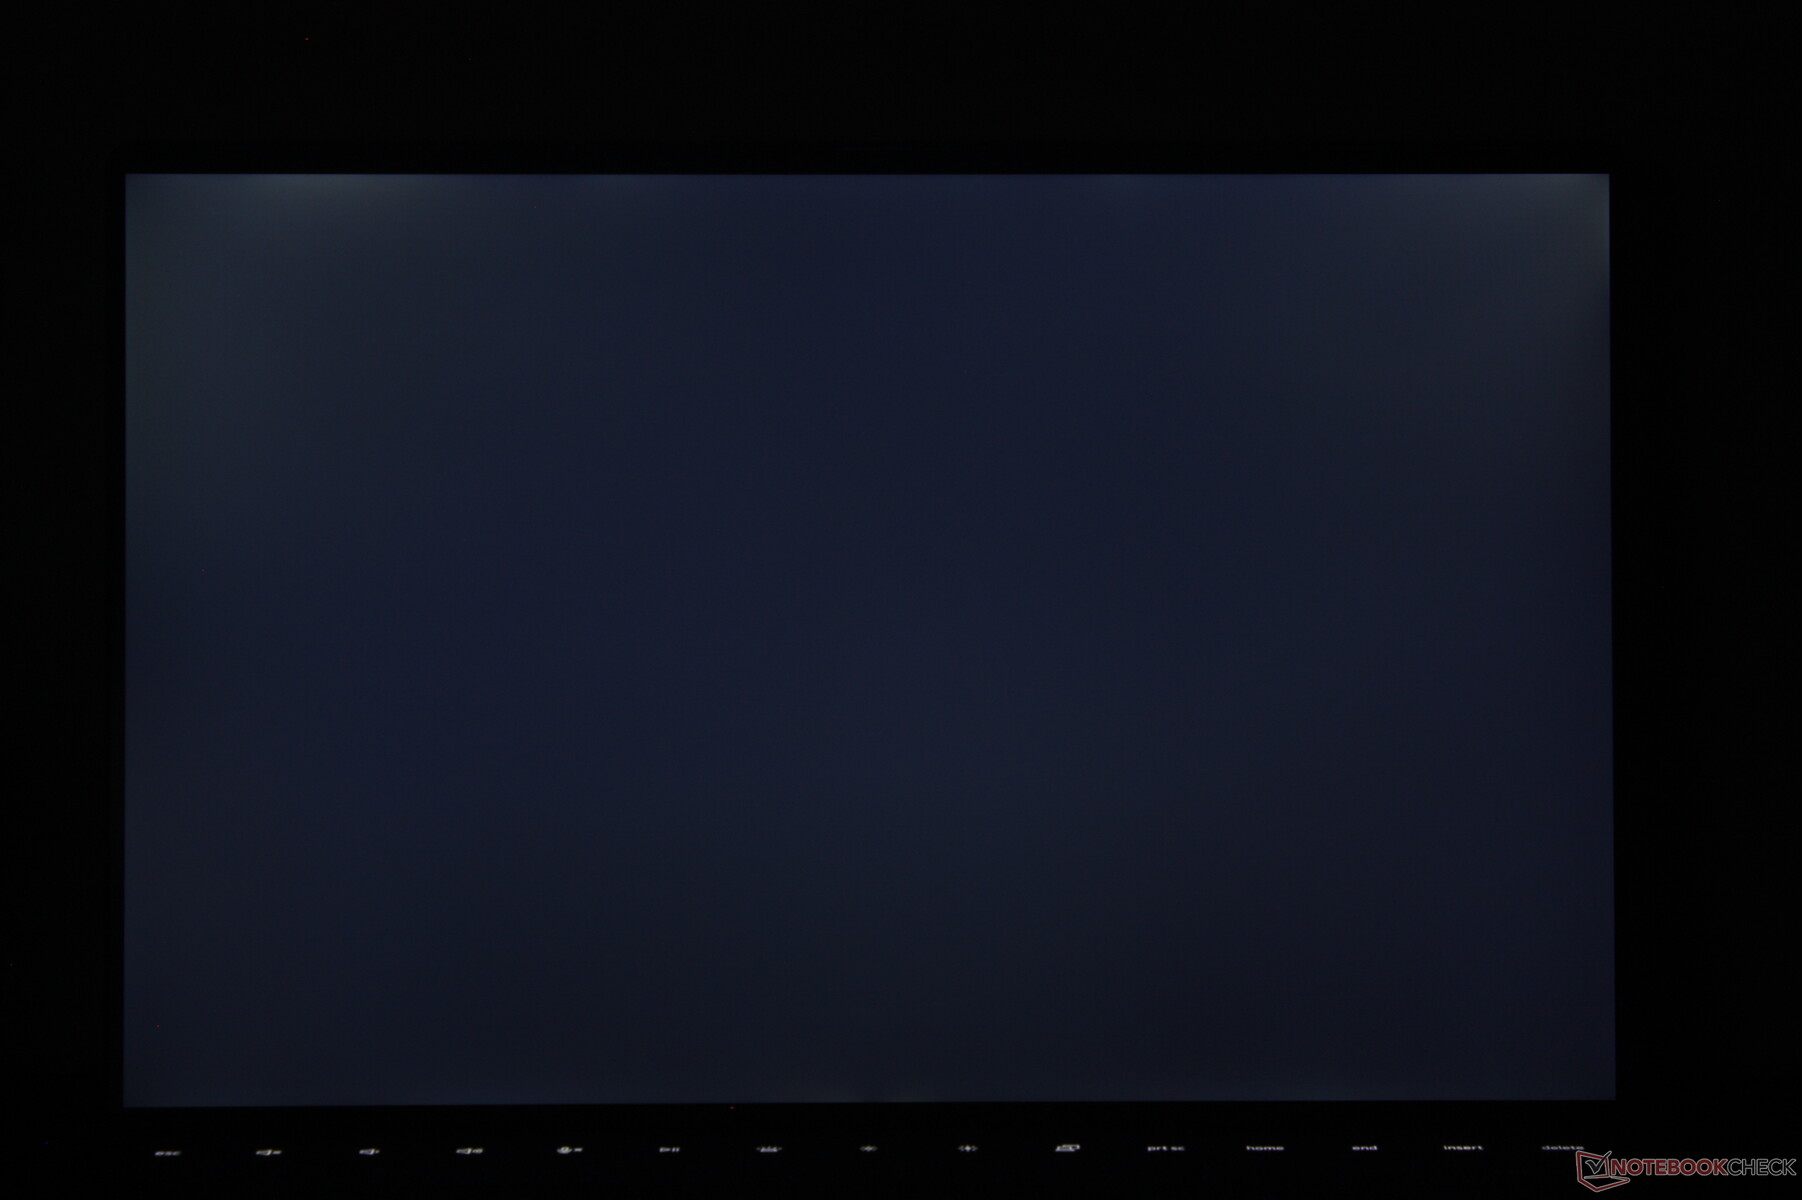
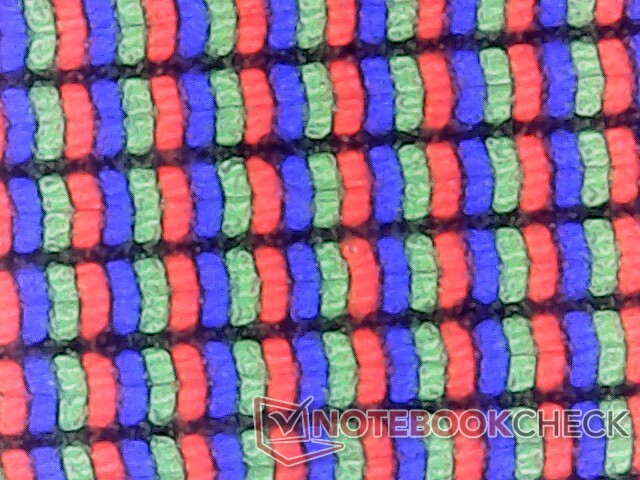
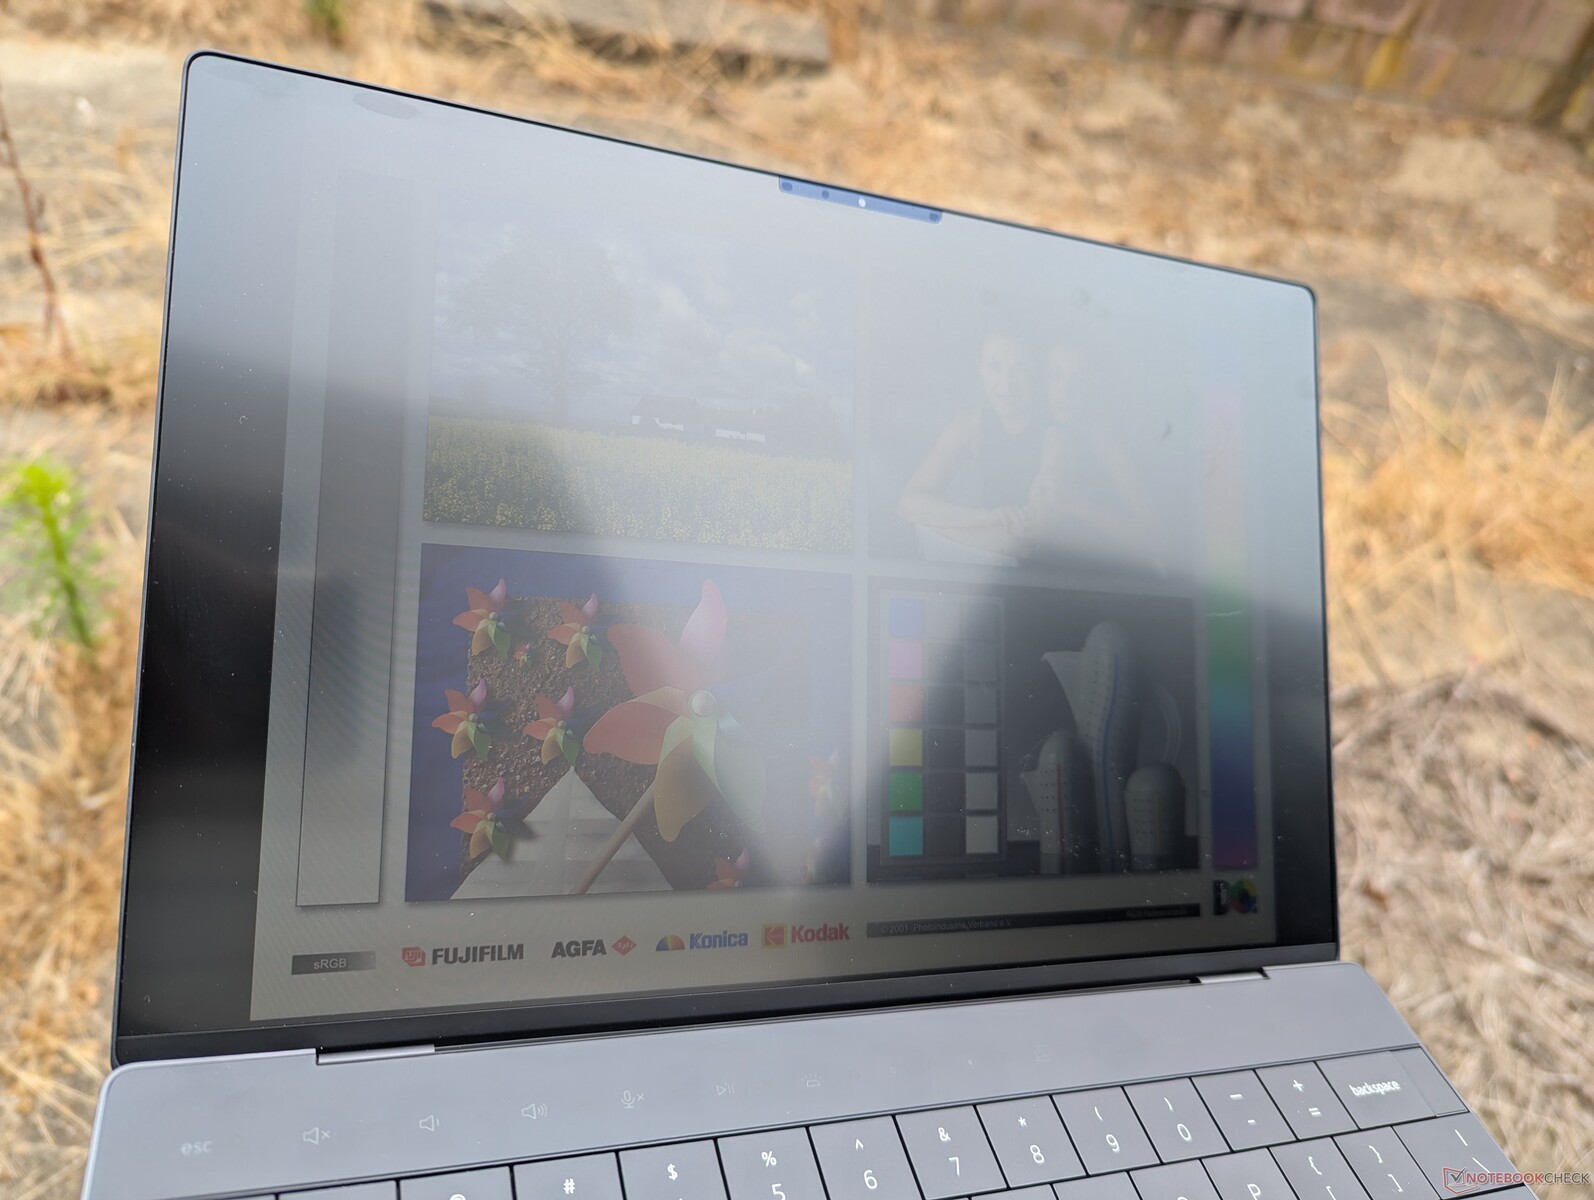
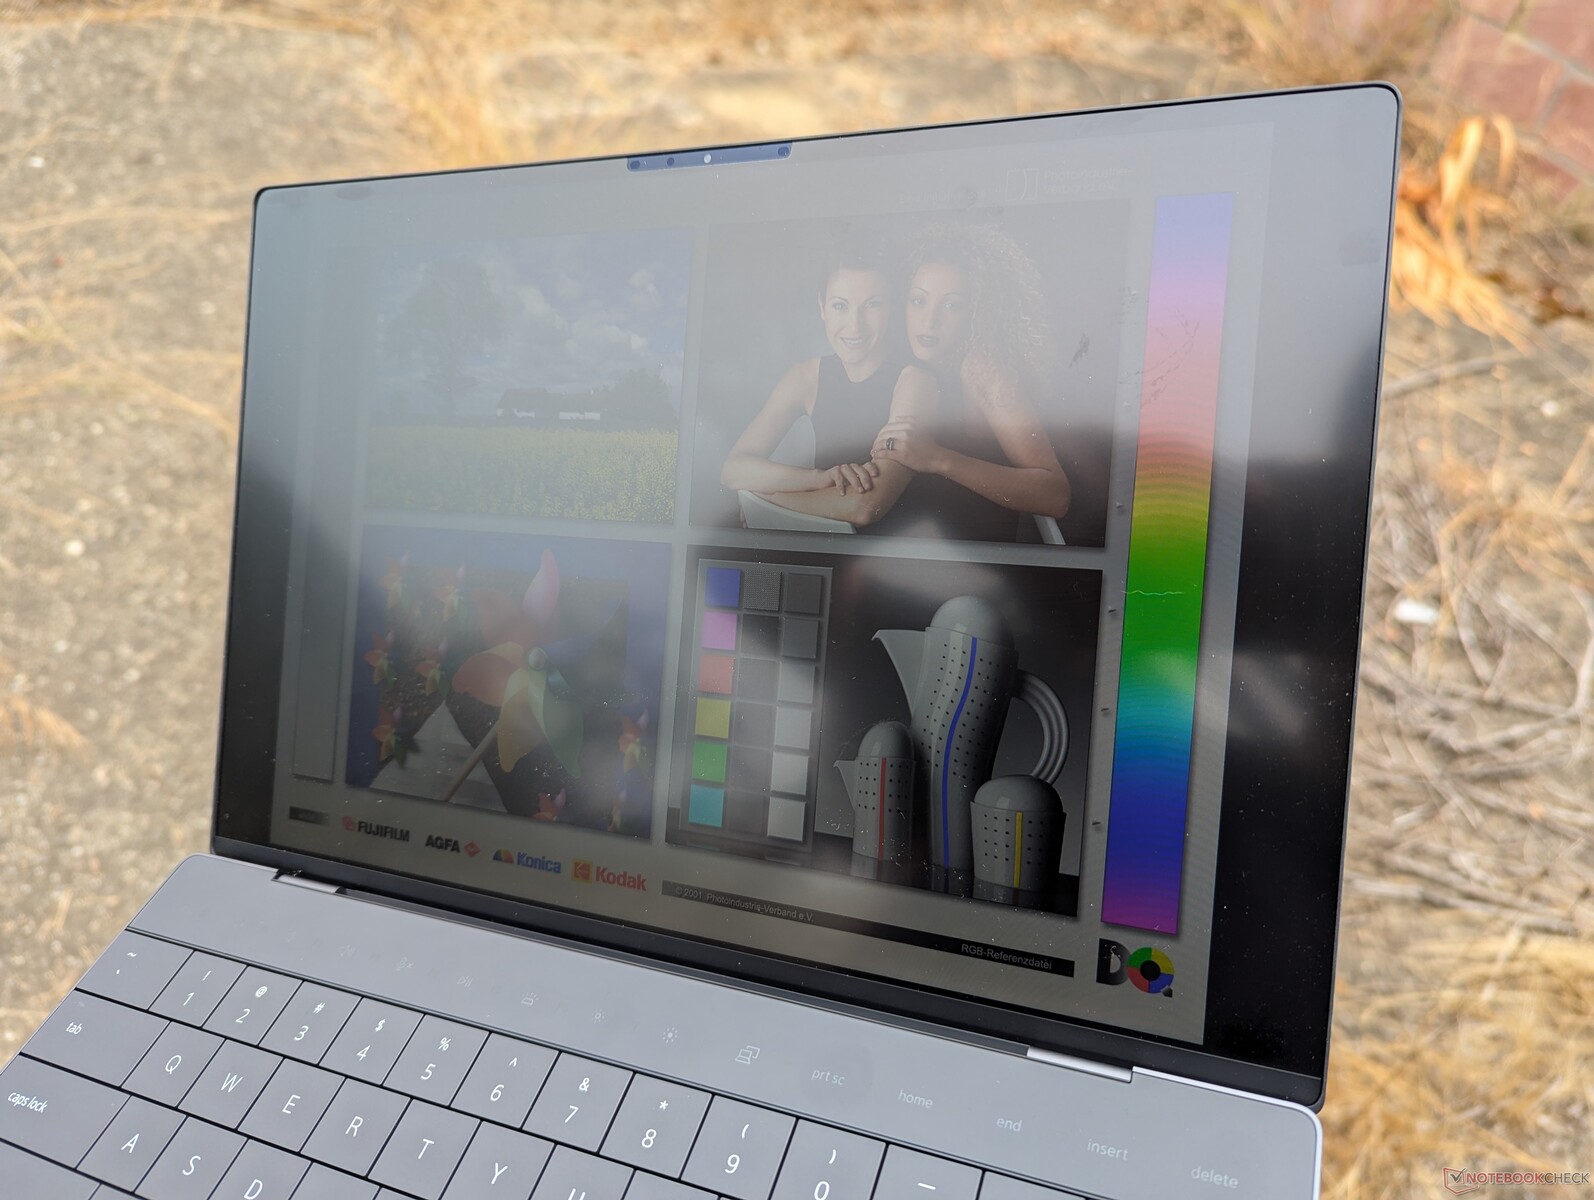
Alles deutet darauf hin, dass es sich bei unserem 120-Hz-Panel um genau das gleiche Panel handelt, das auch beim Intel-basierten XPS 13 zum Einsatz kommt. Die VRR-Unterstützung bis hinunter zu 30 Hz, die zufriedenstellenden Reaktionszeiten und die maximale Helligkeit von 500 cd/m² sind vergleichbar mit den Merkmalen unseres letzten Core Ultra 7 XPS 13 Testgeräts. Am bemerkenswertesten ist das hohe Kontrastverhältnis von fast 2000:1 im Vergleich zu 1000:1 bei den meisten IPS-Panels, die in anderen Laptops zu finden sind. Die Displays der XPS-Modelle gehören seit jeher zu den besten ihrer Klasse, sodass selbst die billigste IPS-Option immer noch fantastisch aussieht.
Die Farbabdeckung ist auf >95 % sRGB beschränkt, wenn die Basisoption konfiguriert ist, während DCI-P3-Farben für die teureren 1600p IPS- und 1800p OLED-Panels reserviert sind. Es empfiehlt sich, Adaptive Color zu deaktivieren, um winzige Farbveränderungen bei der Fotobearbeitung zu vermeiden.
Erwähnenswert an diesem Panel ist die relativ hohe Mindesthelligkeit von 49 nits, die wir auch bei unserem Core i7-Modell festgestellt haben. Im Vergleich dazu erreichen die Displays der meisten anderen Laptops in der Regel 15 nits oder weniger, wenn sie auf die minimale Helligkeit eingestellt sind. Die höhere Helligkeitsstufe des Dell kann in dunklen Umgebungen zu einer Ermüdung der Augen führen. Dieses potenzielle Problem tritt bei der OLED-Konfiguration nicht auf, die viel geringere Helligkeitsstufen erreichen kann.
| |||||||||||||||||||||||||
Ausleuchtung: 86 %
Helligkeit Akku: 518.3 cd/m²
Kontrast: 1993:1 (Schwarzwert: 0.26 cd/m²)
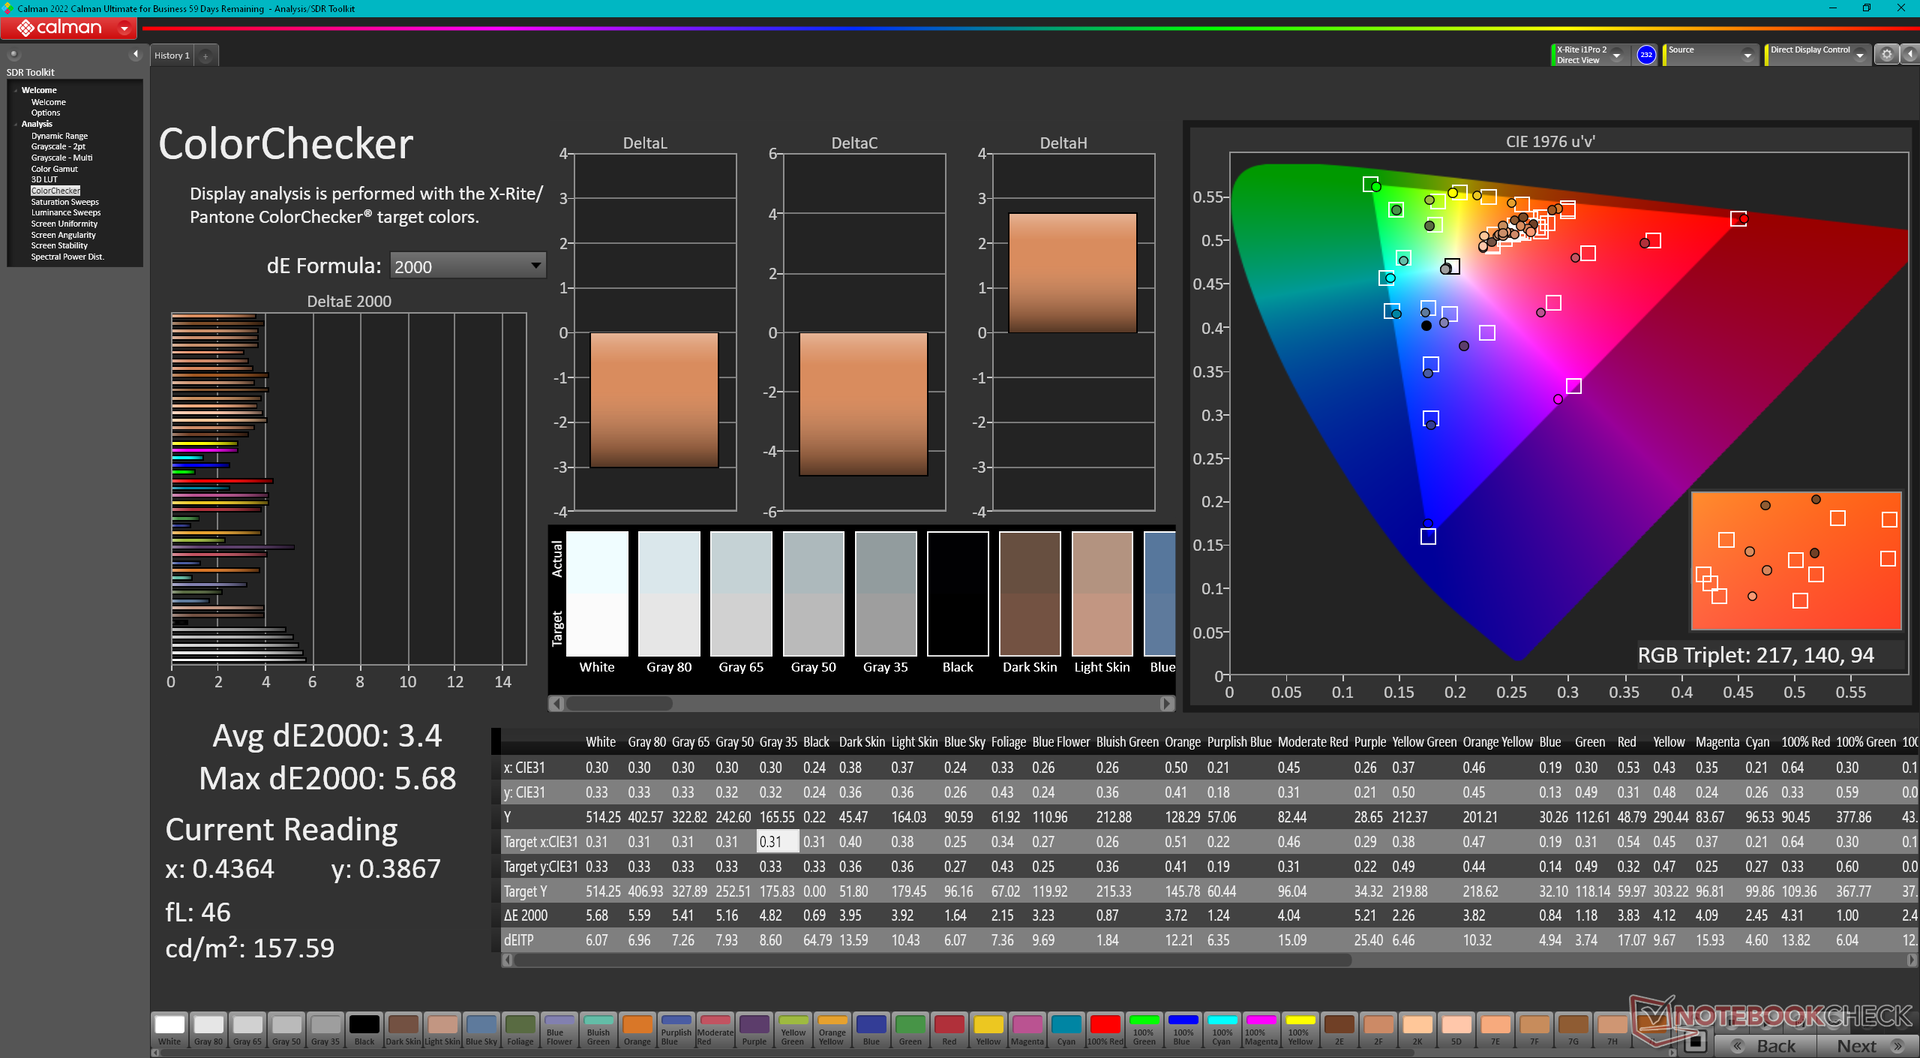
ΔE ColorChecker Calman: 3.4 | ∀{0.5-29.43 Ø4.77}
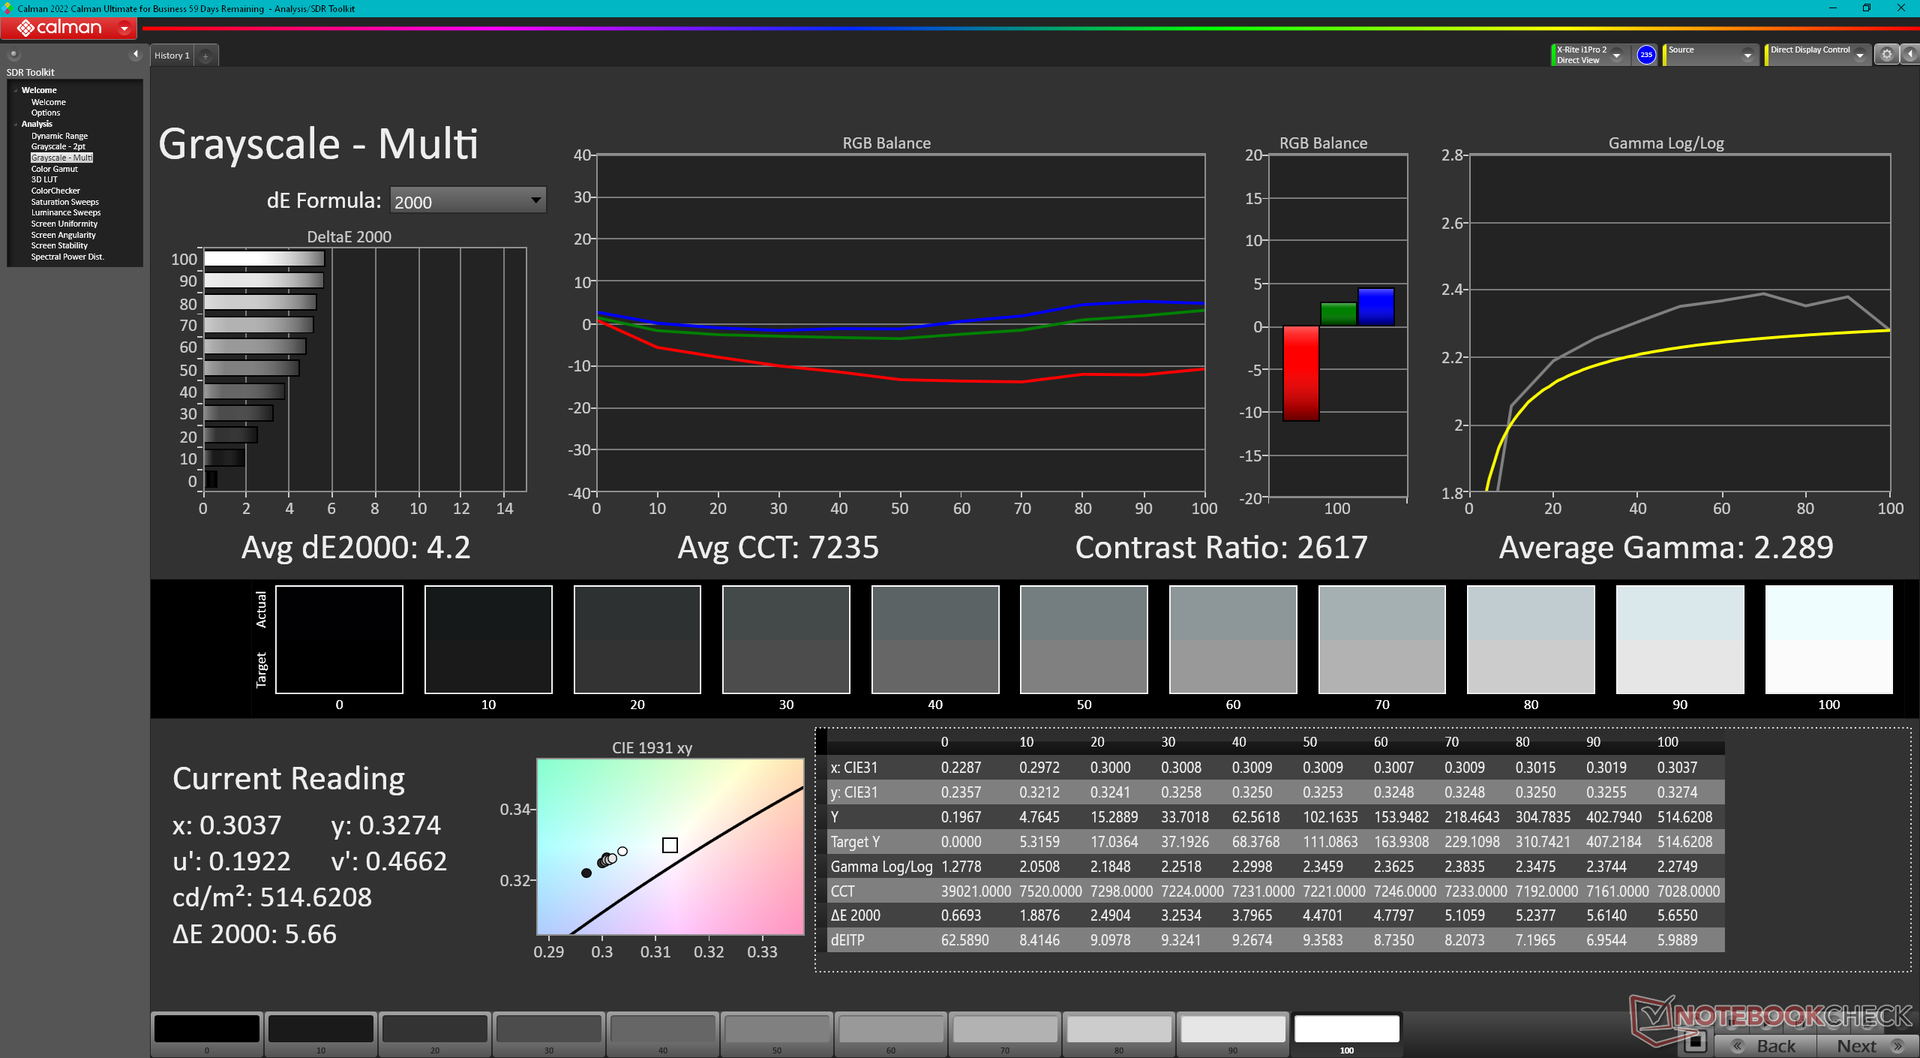
ΔE Greyscale Calman: 4.2 | ∀{0.09-98 Ø5}
71.7% AdobeRGB 1998 (Argyll 3D)
97.8% sRGB (Argyll 3D)
69.4% Display P3 (Argyll 3D)
Gamma: 2.29
CCT: 7235 K
| Dell XPS 13 9345 IPS, 1920x1200, 13.4", 120 Hz | Dell XPS 13 9340 Core Ultra 7 SHP1593, IPS, 1920x1200, 13.4", 120 Hz | Microsoft Surface Laptop 7 13.8 Copilot+ LQ138P1JX61, IPS, 2304x1536, 13.8", 120 Hz | Lenovo ThinkBook 13x G4 21KR0008GE LEN135WQ+, IPS, 2880x1920, 13.5", 120 Hz | HP EliteBook Ultra G1q 14 IPS, 2240x1400, 14", 60 Hz | Asus ZenBook S13 OLED UX5304 SDC417B, OLED, 2880x1800, 13.3", 60 Hz | |
|---|---|---|---|---|---|---|
| Display | 0% | 21% | -4% | 27% | ||
| Display P3 Coverage (%) | 69.4 | 69.4 0% | 97.8 41% | 65.5 -6% | 99.7 44% | |
| sRGB Coverage (%) | 97.8 | 97.8 0% | 98.2 0% | 97.3 -1% | 100 2% | |
| AdobeRGB 1998 Coverage (%) | 71.7 | 71.7 0% | 87.3 22% | 67.7 -6% | 96.9 35% | |
| Response Times | -25% | 5% | 32% | 27% | 94% | |
| Response Time Grey 50% / Grey 80% * (ms) | 35.2 ? | 43.2 ? -23% | 38.9 ? -11% | 27.3 ? 22% | 22.8 ? 35% | 2 ? 94% |
| Response Time Black / White * (ms) | 21.8 ? | 27.6 ? -27% | 17.4 ? 20% | 12.8 ? 41% | 17.9 ? 18% | 1.6 ? 93% |
| PWM Frequency (Hz) | 240 ? | |||||
| Bildschirm | -6% | 16% | 10% | -58% | 27% | |
| Helligkeit Bildmitte (cd/m²) | 518.3 | 429 -17% | 606 17% | 539 4% | 341.4 -34% | 361 -30% |
| Brightness (cd/m²) | 487 | 407 -16% | 592 22% | 513 5% | 315 -35% | 365 -25% |
| Brightness Distribution (%) | 86 | 90 5% | 94 9% | 89 3% | 87 1% | 98 14% |
| Schwarzwert * (cd/m²) | 0.26 | 0.28 -8% | 0.43 -65% | 0.38 -46% | 0.39 -50% | |
| Kontrast (:1) | 1993 | 1532 -23% | 1409 -29% | 1418 -29% | 875 -56% | |
| Delta E Colorchecker * | 3.4 | 2.6 24% | 1.3 62% | 1.4 59% | 5.63 -66% | 1.2 65% |
| Colorchecker dE 2000 max. * | 5.68 | 6.6 -16% | 2.1 63% | 3.5 38% | 11.94 -110% | 1.9 67% |
| Delta E Graustufen * | 4.2 | 4 5% | 2.1 50% | 2.2 48% | 8.8 -110% | 1.2 71% |
| Gamma | 2.29 96% | 2.23 99% | 2.16 102% | 2.19 100% | 2.14 103% | 2.27 97% |
| CCT | 7235 90% | 7332 89% | 6842 95% | 6710 97% | 6034 108% | 6486 100% |
| Colorchecker dE 2000 calibrated * | 1.4 | 0.7 | ||||
| Durchschnitt gesamt (Programm / Settings) | -10% /
-7% | 14% /
15% | 13% /
10% | -16% /
-41% | 49% /
39% |
* ... kleinere Werte sind besser
Unser X-Rite-Kolorimeter zeigt, dass der Bildschirm die sRGB-Farbraumabdeckung mit durchschnittlichen DeltaE-Werten für Graustufen und Farben von 4,2 bzw. 3,4 erreicht. Allerdings ist die Farbtemperatur mit 7235 etwas zu kühl, was die Farbgenauigkeit bei niedrigeren Sättigungsstufen beeinträchtigt. Es ist bedauerlich, dass Dell das Panel nicht ab Werk kalibriert, da viele Kalibrierungssoftware, einschließlich i1Profiler, derzeit nicht mit ARM kompatibel sind.

Reaktionszeiten (Response Times) des Displays
| ↔ Reaktionszeiten Schwarz zu Weiß | ||
|---|---|---|
| 21.8 ms ... steigend ↗ und fallend ↘ kombiniert | ↗ 10.5 ms steigend | 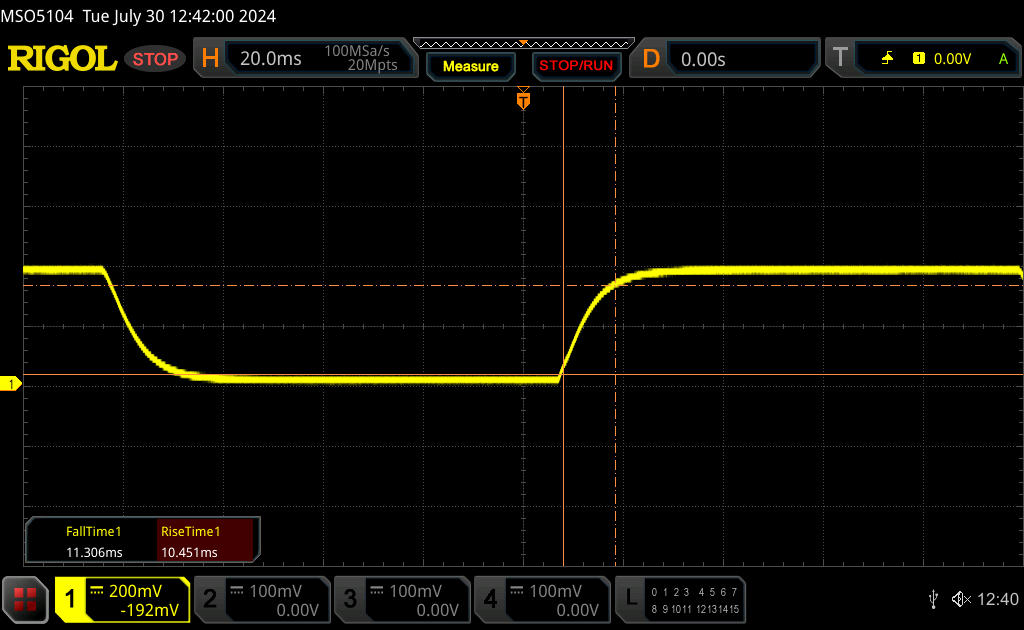 |
| ↘ 11.3 ms fallend | ||
| Die gemessenen Reaktionszeiten sind gut, für anspruchsvolle Spieler könnten der Bildschirm jedoch zu langsam sein. Im Vergleich rangierten die bei uns getesteten Geräte von 0.1 (Minimum) zu 240 (Maximum) ms. » 47 % aller Screens waren schneller als der getestete. Daher sind die gemessenen Reaktionszeiten durchschnittlich (20.1 ms). | ||
| ↔ Reaktionszeiten 50% Grau zu 80% Grau | ||
| 35.2 ms ... steigend ↗ und fallend ↘ kombiniert | ↗ 15.2 ms steigend | 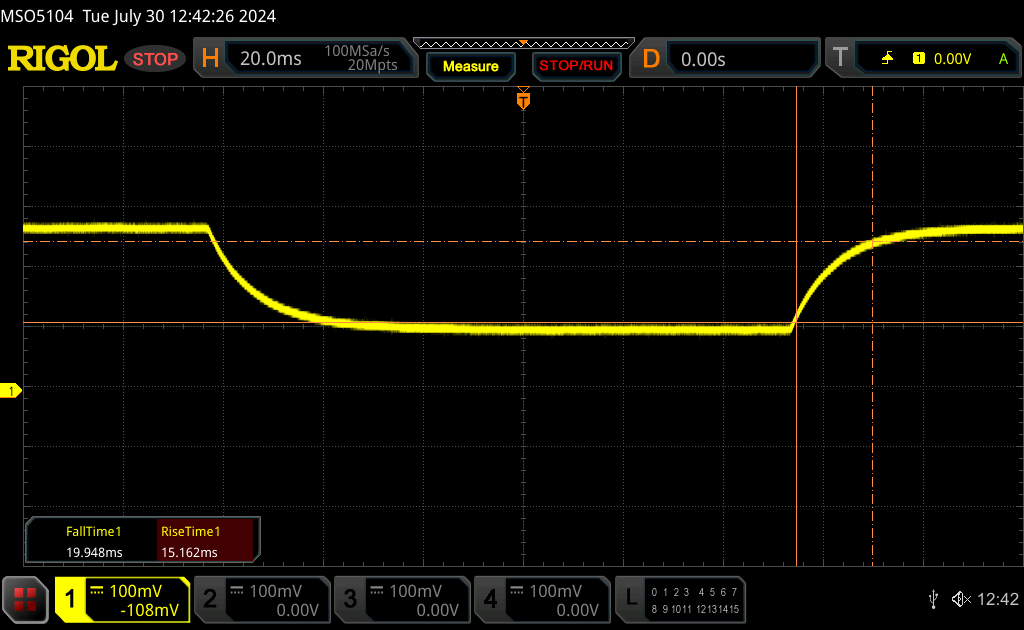 |
| ↘ 20 ms fallend | ||
| Die gemessenen Reaktionszeiten sind langsam und dadurch für viele Spieler wahrscheinlich zu langsam. Im Vergleich rangierten die bei uns getesteten Geräte von 0.165 (Minimum) zu 636 (Maximum) ms. » 48 % aller Screens waren schneller als der getestete. Daher sind die gemessenen Reaktionszeiten schlechter als der Durchschnitt aller vermessenen Geräte (31.5 ms). | ||
Bildschirm-Flackern / PWM (Pulse-Width Modulation)
| Flackern / PWM nicht festgestellt | 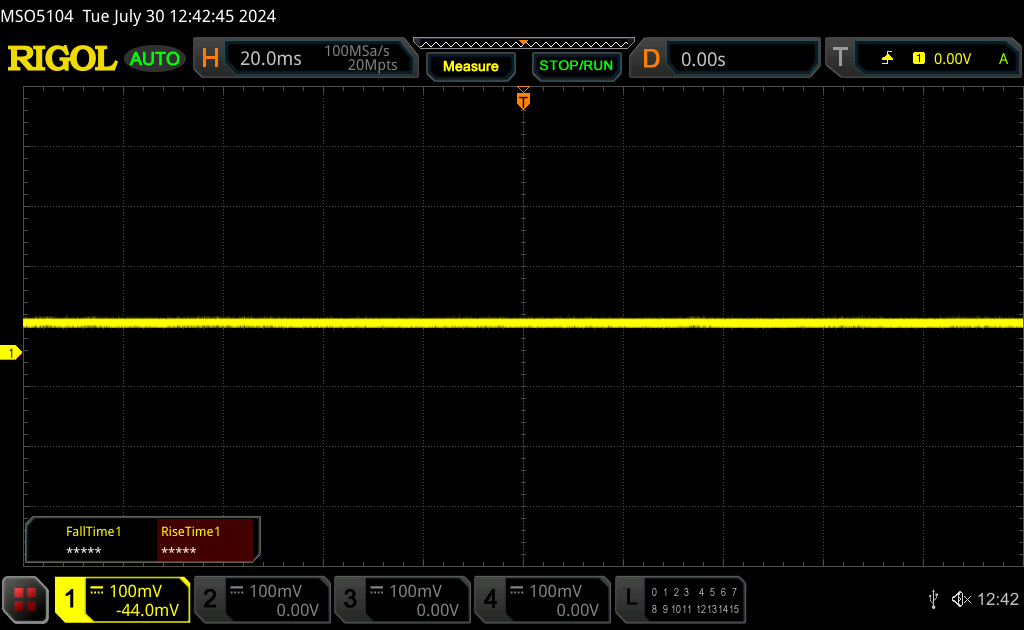 | ||
Im Vergleich: 53 % aller getesteten Geräte nutzten kein PWM um die Helligkeit zu reduzieren. Wenn PWM eingesetzt wurde, dann bei einer Frequenz von durchschnittlich 8042 (Minimum 5, Maximum 343500) Hz. | |||


Performance
Testbedingungen
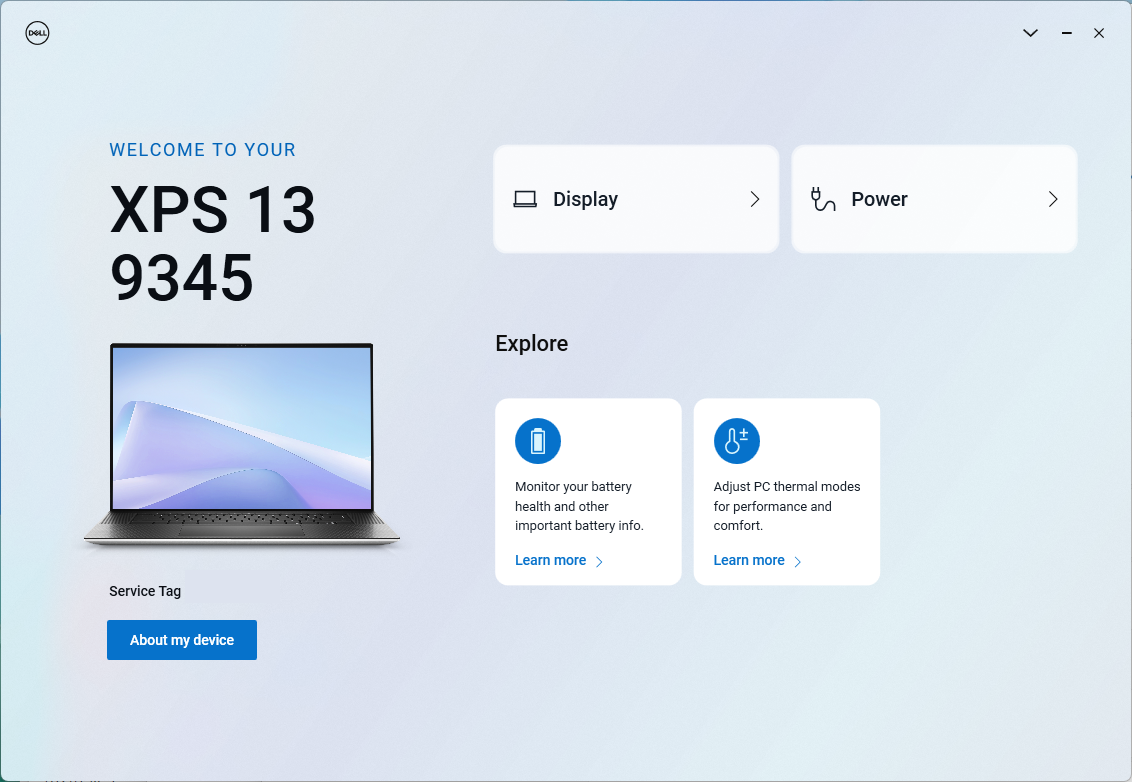
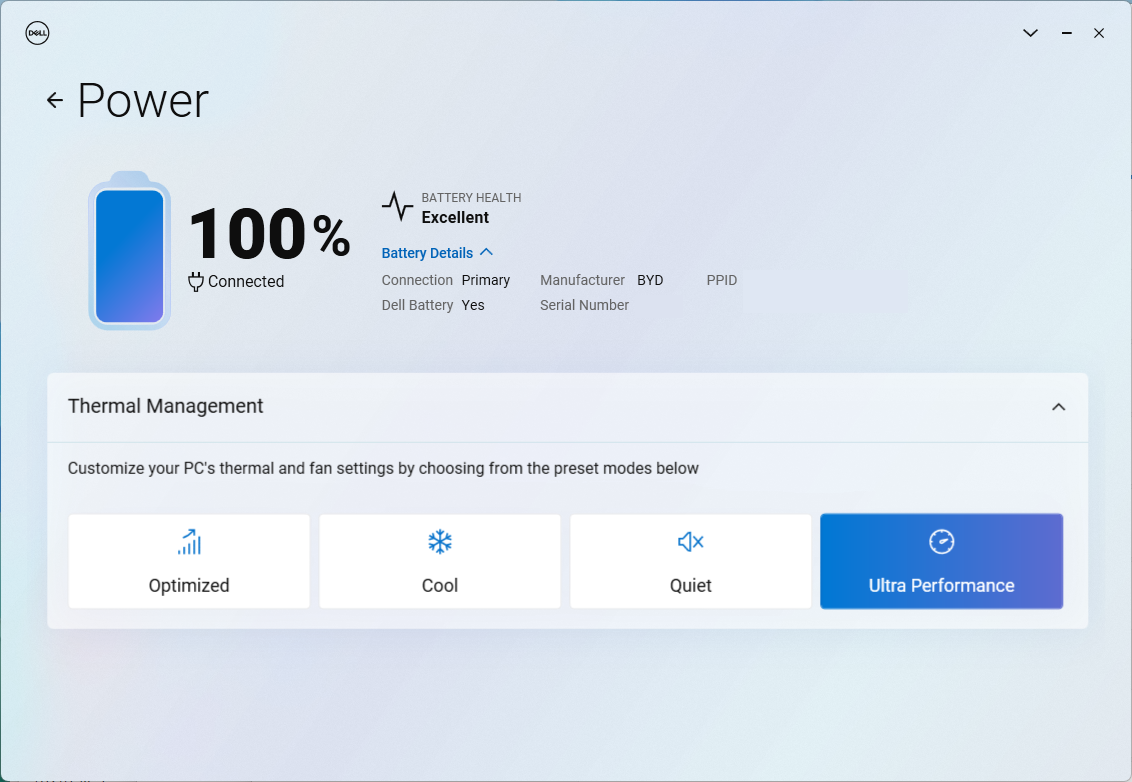
Wir haben Windows und MyDell auf den Performance-Modus eingestellt, bevor wir die folgenden Benchmarks durchgeführt haben. MyDell wurde auf dem Snapdragon-Modell überarbeitet, um die Benutzererfahrung im Vergleich zur Intel-basierten Version des XPS 13 zu verbessern. Einige Funktionen, die zuvor in der Software zu finden waren, wie beispielsweise die Anwesenheitserkennung, wurden nun in das Windows-Menü „Energie und Akku“ integriert.
Prozessor
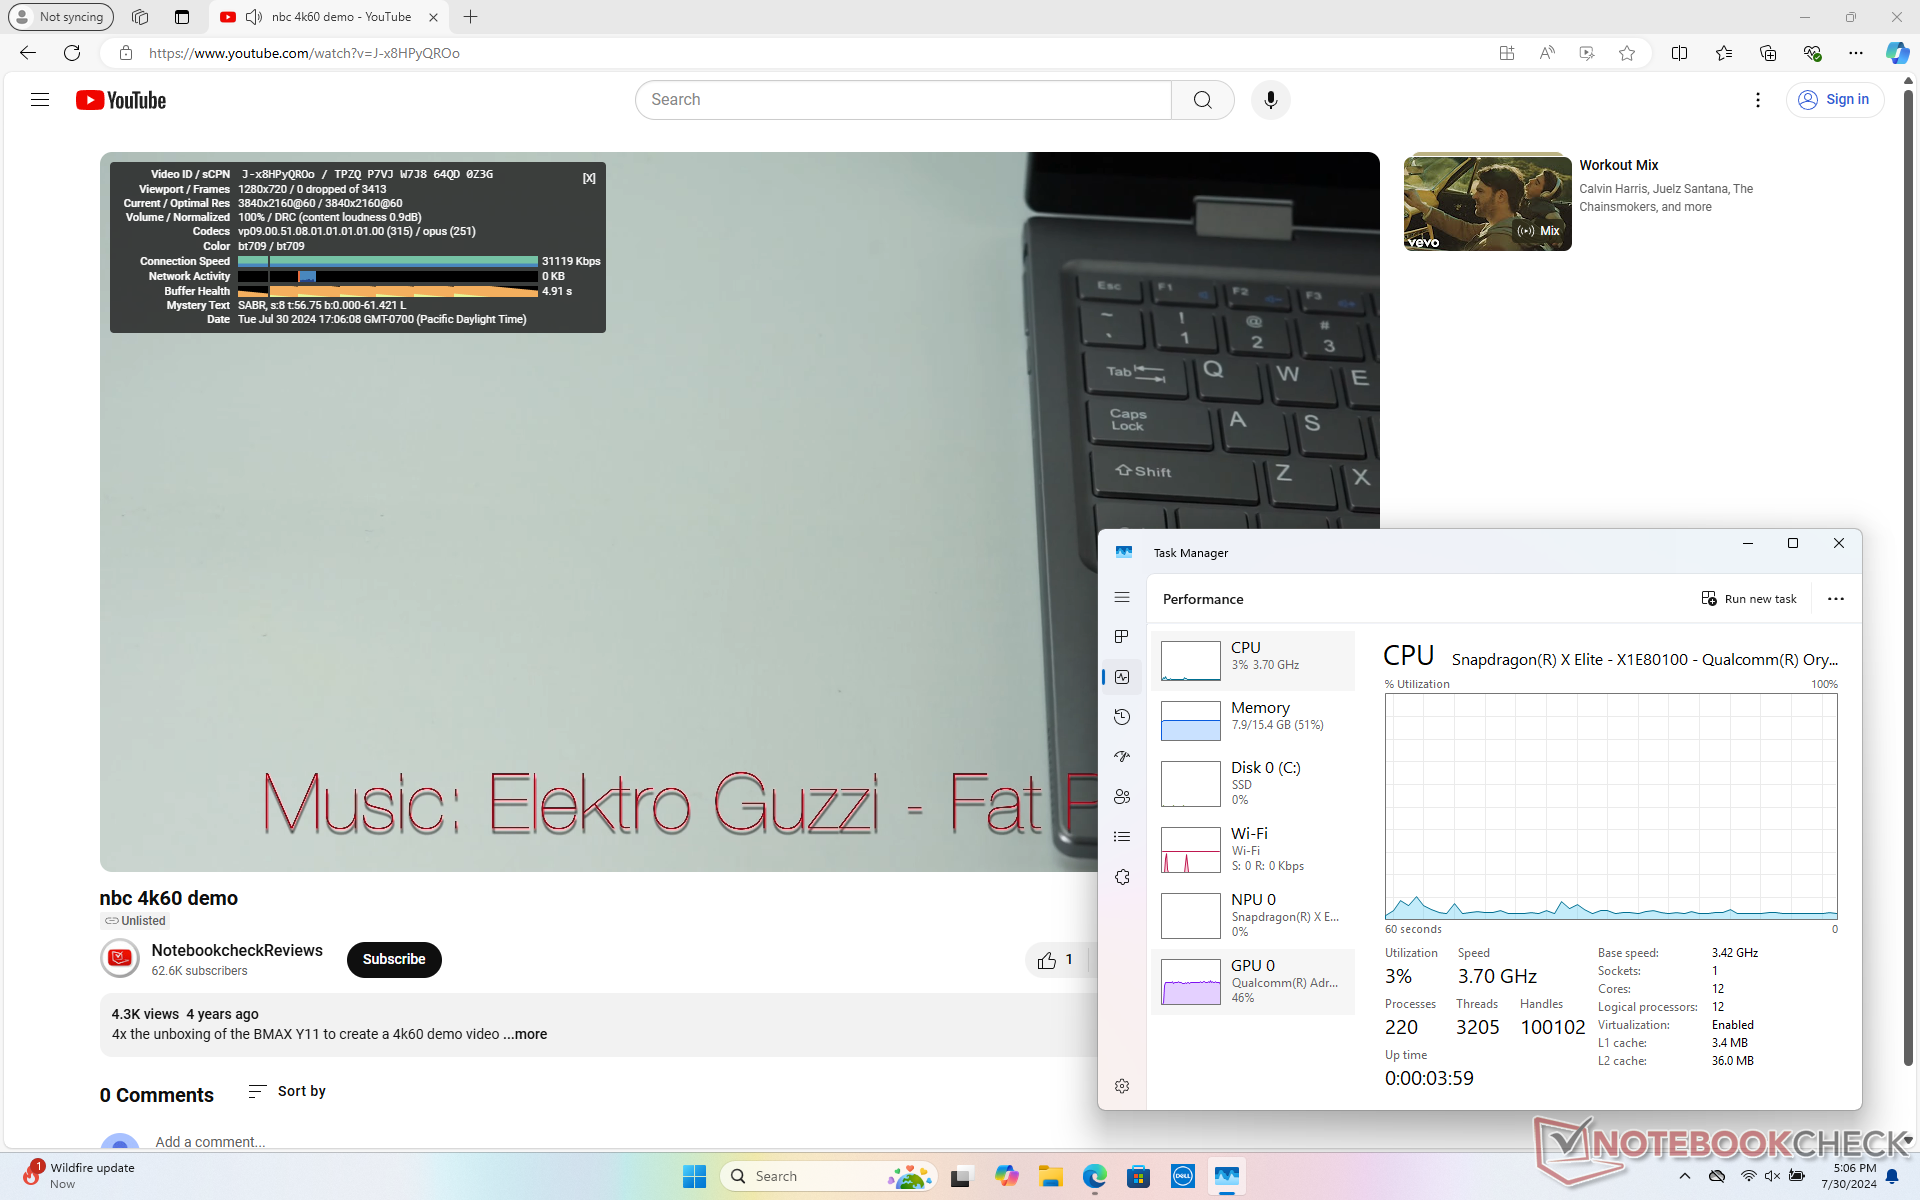
Die Leistung hängt stark davon ab, ob die Anwendung nativ oder emuliert läuft. Der Prozessor zeigt seine Stärken in Benchmarks wie CineBench 2024 und GeekBench 6, da beide für eine ARM-Umgebung optimiert sind. Unter diesen Bedingungen würde unser Snapdragon X Elite X1E-80-100 sowohl bei Multi-Thread- als auch bei Single-Thread-Operationen den Core Ultra 7 155H übertreffen. Bei emulierten Benchmarks hingegen erreicht die Snapdragon-CPU nur ein Leistungsniveau, das eher mit dem älteren Core i5-1240P oder Core i7-1260P vergleichbar ist. Mit anderen Worten: Die Qualcomm-CPU kann mit dem Core Ultra 7 155H konkurrieren, wie der Hersteller behauptet, aber die Bedingungen und Anwendungen müssen genau passen, damit diese Vorteile zur Geltung kommen.
Die Leistungskonstanz zwischen den Snapdragon-CPUs ist ebenfalls schwer zu bewerten. In unserem Test würde der Snapdragon X Elite X1E-80-100 den Snapdragon X Elite X1E-78-100 im EliteBook Ultra G1q 14 im CineBench 2024 deutlich übertreffen. Im CineBench R23 und R15 ist jedoch das Gegenteil der Fall.
Cinebench R15 Multi Dauertest
Cinebench 2024: CPU Multi Core | CPU Single Core
Cinebench R23: Multi Core | Single Core
Cinebench R20: CPU (Multi Core) | CPU (Single Core)
Cinebench R15: CPU Multi 64Bit | CPU Single 64Bit
Blender: v2.79 BMW27 CPU
7-Zip 18.03: 7z b 4 | 7z b 4 -mmt1
Geekbench 6.5: Multi-Core | Single-Core
HWBOT x265 Benchmark v2.2: 4k Preset
LibreOffice : 20 Documents To PDF
R Benchmark 2.5: Overall mean
| CPU Performance Rating | |
| Dell XPS 14 2024 OLED | |
| Dell XPS 13 9340 Core Ultra 7 | |
| Dell XPS 13 Plus 9320 Core i7-1360P -4! | |
| Dell XPS 13 Plus 9320 i7-1280P OLED -4! | |
| Dell XPS 13 Plus 9320 4K -4! | |
| Microsoft Surface Laptop 7 13.8 Copilot+ | |
| Dell XPS 13 9345 | |
| Durchschnittliche Qualcomm Snapdragon X Elite X1E-80-100 | |
| HP EliteBook Ultra G1q 14 | |
| Medion SPRCHRGD 14 S1 Elite | |
| Dell XPS 13 Plus 9320 i5-1240p -4! | |
| Lenovo ThinkPad T14s Gen 6 21N10007GE | |
| Dell XPS 13 9315 2-in-1 Core i5-1230U -4! | |
| Dell XPS 13 9315, i5-1230U -8! | |
| Dell XPS 13 9310 Core i7 4K -4! | |
| Dell XPS 13 9310 OLED -4! | |
| Dell XPS 13 9310 2-in-1 -5! | |
| Dell XPS 13 9305 Core i5 FHD -6! | |
| Cinebench 2024 / CPU Multi Core | |
| Dell XPS 13 9345 | |
| Microsoft Surface Laptop 7 13.8 Copilot+ | |
| Durchschnittliche Qualcomm Snapdragon X Elite X1E-80-100 (621 - 927, n=7) | |
| Medion SPRCHRGD 14 S1 Elite | |
| HP EliteBook Ultra G1q 14 | |
| Lenovo ThinkPad T14s Gen 6 21N10007GE | |
| Dell XPS 13 9340 Core Ultra 7 | |
| Dell XPS 14 2024 OLED | |
| Cinebench 2024 / CPU Single Core | |
| Microsoft Surface Laptop 7 13.8 Copilot+ | |
| Durchschnittliche Qualcomm Snapdragon X Elite X1E-80-100 (122 - 123, n=7) | |
| Dell XPS 13 9345 | |
| Lenovo ThinkPad T14s Gen 6 21N10007GE | |
| Medion SPRCHRGD 14 S1 Elite | |
| HP EliteBook Ultra G1q 14 | |
| Dell XPS 14 2024 OLED | |
| Dell XPS 13 9340 Core Ultra 7 | |
| Geekbench 6.5 / Multi-Core | |
| Lenovo ThinkPad T14s Gen 6 21N10007GE | |
| Dell XPS 13 9345 | |
| Medion SPRCHRGD 14 S1 Elite | |
| Microsoft Surface Laptop 7 13.8 Copilot+ | |
| Dell XPS 14 2024 OLED | |
| HP EliteBook Ultra G1q 14 | |
| Durchschnittliche Qualcomm Snapdragon X Elite X1E-80-100 (7596 - 14998, n=9) | |
| Dell XPS 13 9340 Core Ultra 7 | |
| Geekbench 6.5 / Single-Core | |
| Dell XPS 13 9345 | |
| Microsoft Surface Laptop 7 13.8 Copilot+ | |
| Durchschnittliche Qualcomm Snapdragon X Elite X1E-80-100 (1896 - 2845, n=9) | |
| Lenovo ThinkPad T14s Gen 6 21N10007GE | |
| Medion SPRCHRGD 14 S1 Elite | |
| Dell XPS 14 2024 OLED | |
| Dell XPS 13 9340 Core Ultra 7 | |
| HP EliteBook Ultra G1q 14 | |
Cinebench 2024: CPU Multi Core | CPU Single Core
Cinebench R23: Multi Core | Single Core
Cinebench R20: CPU (Multi Core) | CPU (Single Core)
Cinebench R15: CPU Multi 64Bit | CPU Single 64Bit
Blender: v2.79 BMW27 CPU
7-Zip 18.03: 7z b 4 | 7z b 4 -mmt1
Geekbench 6.5: Multi-Core | Single-Core
HWBOT x265 Benchmark v2.2: 4k Preset
LibreOffice : 20 Documents To PDF
R Benchmark 2.5: Overall mean
* ... kleinere Werte sind besser
AIDA64: FP32 Ray-Trace | FPU Julia | CPU SHA3 | CPU Queen | FPU SinJulia | FPU Mandel | CPU AES | CPU ZLib | FP64 Ray-Trace | CPU PhotoWorxx
| Performance Rating | |
| Dell XPS 13 9340 Core Ultra 7 | |
| Lenovo ThinkBook 13x G4 21KR0008GE | |
| Microsoft Surface Laptop 7 13.8 Copilot+ | |
| Dell XPS 13 9345 | |
| HP EliteBook Ultra G1q 14 | |
| Durchschnittliche Qualcomm Snapdragon X Elite X1E-80-100 | |
| Asus ZenBook S13 OLED UX5304 | |
| AIDA64 / FP32 Ray-Trace | |
| Dell XPS 13 9340 Core Ultra 7 | |
| Lenovo ThinkBook 13x G4 21KR0008GE | |
| HP EliteBook Ultra G1q 14 | |
| Microsoft Surface Laptop 7 13.8 Copilot+ | |
| Dell XPS 13 9345 | |
| Durchschnittliche Qualcomm Snapdragon X Elite X1E-80-100 (2184 - 7469, n=7) | |
| Asus ZenBook S13 OLED UX5304 | |
| AIDA64 / FPU Julia | |
| Dell XPS 13 9340 Core Ultra 7 | |
| Lenovo ThinkBook 13x G4 21KR0008GE | |
| Asus ZenBook S13 OLED UX5304 | |
| Microsoft Surface Laptop 7 13.8 Copilot+ | |
| Dell XPS 13 9345 | |
| HP EliteBook Ultra G1q 14 | |
| Durchschnittliche Qualcomm Snapdragon X Elite X1E-80-100 (5687 - 26391, n=7) | |
| AIDA64 / CPU SHA3 | |
| HP EliteBook Ultra G1q 14 | |
| Microsoft Surface Laptop 7 13.8 Copilot+ | |
| Dell XPS 13 9340 Core Ultra 7 | |
| Dell XPS 13 9345 | |
| Durchschnittliche Qualcomm Snapdragon X Elite X1E-80-100 (2607 - 3122, n=7) | |
| Lenovo ThinkBook 13x G4 21KR0008GE | |
| Asus ZenBook S13 OLED UX5304 | |
| AIDA64 / CPU Queen | |
| Lenovo ThinkBook 13x G4 21KR0008GE | |
| Dell XPS 13 9340 Core Ultra 7 | |
| Microsoft Surface Laptop 7 13.8 Copilot+ | |
| Durchschnittliche Qualcomm Snapdragon X Elite X1E-80-100 (67219 - 69762, n=7) | |
| Dell XPS 13 9345 | |
| HP EliteBook Ultra G1q 14 | |
| Asus ZenBook S13 OLED UX5304 | |
| AIDA64 / FPU SinJulia | |
| Dell XPS 13 9340 Core Ultra 7 | |
| Lenovo ThinkBook 13x G4 21KR0008GE | |
| Asus ZenBook S13 OLED UX5304 | |
| Microsoft Surface Laptop 7 13.8 Copilot+ | |
| Dell XPS 13 9345 | |
| Durchschnittliche Qualcomm Snapdragon X Elite X1E-80-100 (1521 - 2357, n=7) | |
| HP EliteBook Ultra G1q 14 | |
| AIDA64 / FPU Mandel | |
| Dell XPS 13 9340 Core Ultra 7 | |
| Lenovo ThinkBook 13x G4 21KR0008GE | |
| Asus ZenBook S13 OLED UX5304 | |
| HP EliteBook Ultra G1q 14 | |
| Microsoft Surface Laptop 7 13.8 Copilot+ | |
| Durchschnittliche Qualcomm Snapdragon X Elite X1E-80-100 (10117 - 15669, n=7) | |
| Dell XPS 13 9345 | |
| AIDA64 / CPU AES | |
| HP EliteBook Ultra G1q 14 | |
| Dell XPS 13 9340 Core Ultra 7 | |
| Microsoft Surface Laptop 7 13.8 Copilot+ | |
| Durchschnittliche Qualcomm Snapdragon X Elite X1E-80-100 (39956 - 71089, n=7) | |
| Dell XPS 13 9345 | |
| Lenovo ThinkBook 13x G4 21KR0008GE | |
| Asus ZenBook S13 OLED UX5304 | |
| AIDA64 / CPU ZLib | |
| Dell XPS 13 9340 Core Ultra 7 | |
| HP EliteBook Ultra G1q 14 | |
| Microsoft Surface Laptop 7 13.8 Copilot+ | |
| Dell XPS 13 9345 | |
| Durchschnittliche Qualcomm Snapdragon X Elite X1E-80-100 (398 - 802, n=7) | |
| Lenovo ThinkBook 13x G4 21KR0008GE | |
| Asus ZenBook S13 OLED UX5304 | |
| AIDA64 / FP64 Ray-Trace | |
| Dell XPS 13 9340 Core Ultra 7 | |
| Lenovo ThinkBook 13x G4 21KR0008GE | |
| Microsoft Surface Laptop 7 13.8 Copilot+ | |
| Dell XPS 13 9345 | |
| Durchschnittliche Qualcomm Snapdragon X Elite X1E-80-100 (2581 - 4044, n=7) | |
| Asus ZenBook S13 OLED UX5304 | |
| HP EliteBook Ultra G1q 14 | |
| AIDA64 / CPU PhotoWorxx | |
| Dell XPS 13 9340 Core Ultra 7 | |
| Lenovo ThinkBook 13x G4 21KR0008GE | |
| Asus ZenBook S13 OLED UX5304 | |
| Microsoft Surface Laptop 7 13.8 Copilot+ | |
| Dell XPS 13 9345 | |
| Durchschnittliche Qualcomm Snapdragon X Elite X1E-80-100 (28474 - 38707, n=7) | |
| HP EliteBook Ultra G1q 14 | |
System Performance
WebXPRT und Kraken, die nativ auf dem für ARM optimierten Edge-Browser laufen, bewerten unser Qualcomm XPS mit einem deutlichen Vorsprung gegenüber dem Intel XPS.
WebXPRT 3: Overall
WebXPRT 4: Overall
Mozilla Kraken 1.1: Total
| CrossMark / Overall | |
| Dell XPS 13 9340 Core Ultra 7 | |
| Asus ZenBook S13 OLED UX5304 | |
| Lenovo ThinkBook 13x G4 21KR0008GE | |
| Microsoft Surface Laptop 7 13.8 Copilot+ | |
| Durchschnittliche Qualcomm Snapdragon X Elite X1E-80-100, Qualcomm SD X Adreno X1-85 3.8 TFLOPS (1356 - 1443, n=7) | |
| Dell XPS 13 9345 | |
| HP EliteBook Ultra G1q 14 | |
| CrossMark / Productivity | |
| Dell XPS 13 9340 Core Ultra 7 | |
| Asus ZenBook S13 OLED UX5304 | |
| Lenovo ThinkBook 13x G4 21KR0008GE | |
| Microsoft Surface Laptop 7 13.8 Copilot+ | |
| Durchschnittliche Qualcomm Snapdragon X Elite X1E-80-100, Qualcomm SD X Adreno X1-85 3.8 TFLOPS (1271 - 1375, n=7) | |
| Dell XPS 13 9345 | |
| HP EliteBook Ultra G1q 14 | |
| CrossMark / Creativity | |
| Dell XPS 13 9340 Core Ultra 7 | |
| Lenovo ThinkBook 13x G4 21KR0008GE | |
| Asus ZenBook S13 OLED UX5304 | |
| Microsoft Surface Laptop 7 13.8 Copilot+ | |
| Durchschnittliche Qualcomm Snapdragon X Elite X1E-80-100, Qualcomm SD X Adreno X1-85 3.8 TFLOPS (1402 - 1537, n=7) | |
| Dell XPS 13 9345 | |
| HP EliteBook Ultra G1q 14 | |
| CrossMark / Responsiveness | |
| Dell XPS 13 9340 Core Ultra 7 | |
| Asus ZenBook S13 OLED UX5304 | |
| Microsoft Surface Laptop 7 13.8 Copilot+ | |
| Durchschnittliche Qualcomm Snapdragon X Elite X1E-80-100, Qualcomm SD X Adreno X1-85 3.8 TFLOPS (1237 - 1401, n=7) | |
| Lenovo ThinkBook 13x G4 21KR0008GE | |
| Dell XPS 13 9345 | |
| HP EliteBook Ultra G1q 14 | |
| WebXPRT 3 / Overall | |
| Durchschnittliche Qualcomm Snapdragon X Elite X1E-80-100, Qualcomm SD X Adreno X1-85 3.8 TFLOPS (430 - 455, n=7) | |
| Microsoft Surface Laptop 7 13.8 Copilot+ | |
| Dell XPS 13 9345 | |
| HP EliteBook Ultra G1q 14 | |
| Asus ZenBook S13 OLED UX5304 | |
| Dell XPS 13 9340 Core Ultra 7 | |
| Lenovo ThinkBook 13x G4 21KR0008GE | |
| WebXPRT 4 / Overall | |
| Dell XPS 13 9345 | |
| Durchschnittliche Qualcomm Snapdragon X Elite X1E-80-100, Qualcomm SD X Adreno X1-85 3.8 TFLOPS (295 - 324, n=7) | |
| Microsoft Surface Laptop 7 13.8 Copilot+ | |
| HP EliteBook Ultra G1q 14 | |
| Dell XPS 13 9340 Core Ultra 7 | |
| Asus ZenBook S13 OLED UX5304 | |
| Lenovo ThinkBook 13x G4 21KR0008GE | |
| Mozilla Kraken 1.1 / Total | |
| Lenovo ThinkBook 13x G4 21KR0008GE | |
| Dell XPS 13 9340 Core Ultra 7 | |
| Asus ZenBook S13 OLED UX5304 | |
| HP EliteBook Ultra G1q 14 | |
| Dell XPS 13 9345 | |
| Durchschnittliche Qualcomm Snapdragon X Elite X1E-80-100, Qualcomm SD X Adreno X1-85 3.8 TFLOPS (391 - 422, n=7) | |
| Microsoft Surface Laptop 7 13.8 Copilot+ | |
* ... kleinere Werte sind besser
| AIDA64 / Memory Copy | |
| Dell XPS 13 9340 Core Ultra 7 | |
| Lenovo ThinkBook 13x G4 21KR0008GE | |
| Dell XPS 13 9345 | |
| Microsoft Surface Laptop 7 13.8 Copilot+ | |
| Asus ZenBook S13 OLED UX5304 | |
| Durchschnittliche Qualcomm Snapdragon X Elite X1E-80-100 (44795 - 63495, n=7) | |
| HP EliteBook Ultra G1q 14 | |
| AIDA64 / Memory Read | |
| Dell XPS 13 9345 | |
| Microsoft Surface Laptop 7 13.8 Copilot+ | |
| Durchschnittliche Qualcomm Snapdragon X Elite X1E-80-100 (58855 - 125604, n=7) | |
| Dell XPS 13 9340 Core Ultra 7 | |
| Lenovo ThinkBook 13x G4 21KR0008GE | |
| HP EliteBook Ultra G1q 14 | |
| Asus ZenBook S13 OLED UX5304 | |
| AIDA64 / Memory Write | |
| Dell XPS 13 9340 Core Ultra 7 | |
| Asus ZenBook S13 OLED UX5304 | |
| Lenovo ThinkBook 13x G4 21KR0008GE | |
| Dell XPS 13 9345 | |
| Microsoft Surface Laptop 7 13.8 Copilot+ | |
| Durchschnittliche Qualcomm Snapdragon X Elite X1E-80-100 (37270 - 45265, n=7) | |
| HP EliteBook Ultra G1q 14 | |
| AIDA64 / Memory Latency | |
| Lenovo ThinkBook 13x G4 21KR0008GE | |
| Dell XPS 13 9340 Core Ultra 7 | |
| Asus ZenBook S13 OLED UX5304 | |
| Durchschnittliche Qualcomm Snapdragon X Elite X1E-80-100 (7.4 - 8.8, n=5) | |
| HP EliteBook Ultra G1q 14 | |
| Dell XPS 13 9345 | |
| Microsoft Surface Laptop 7 13.8 Copilot+ | |
* ... kleinere Werte sind besser
Massenspeicher
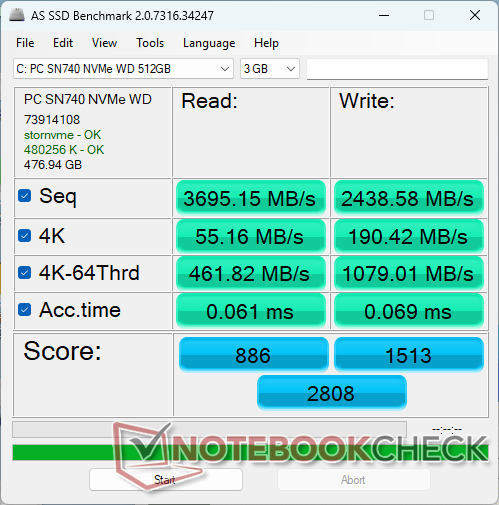
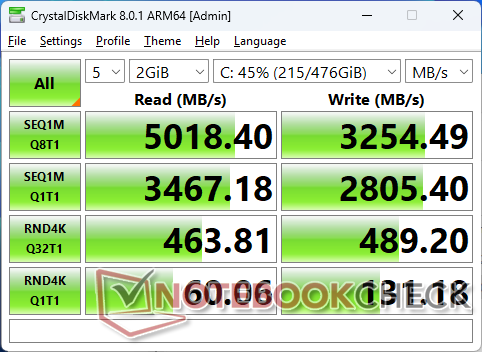
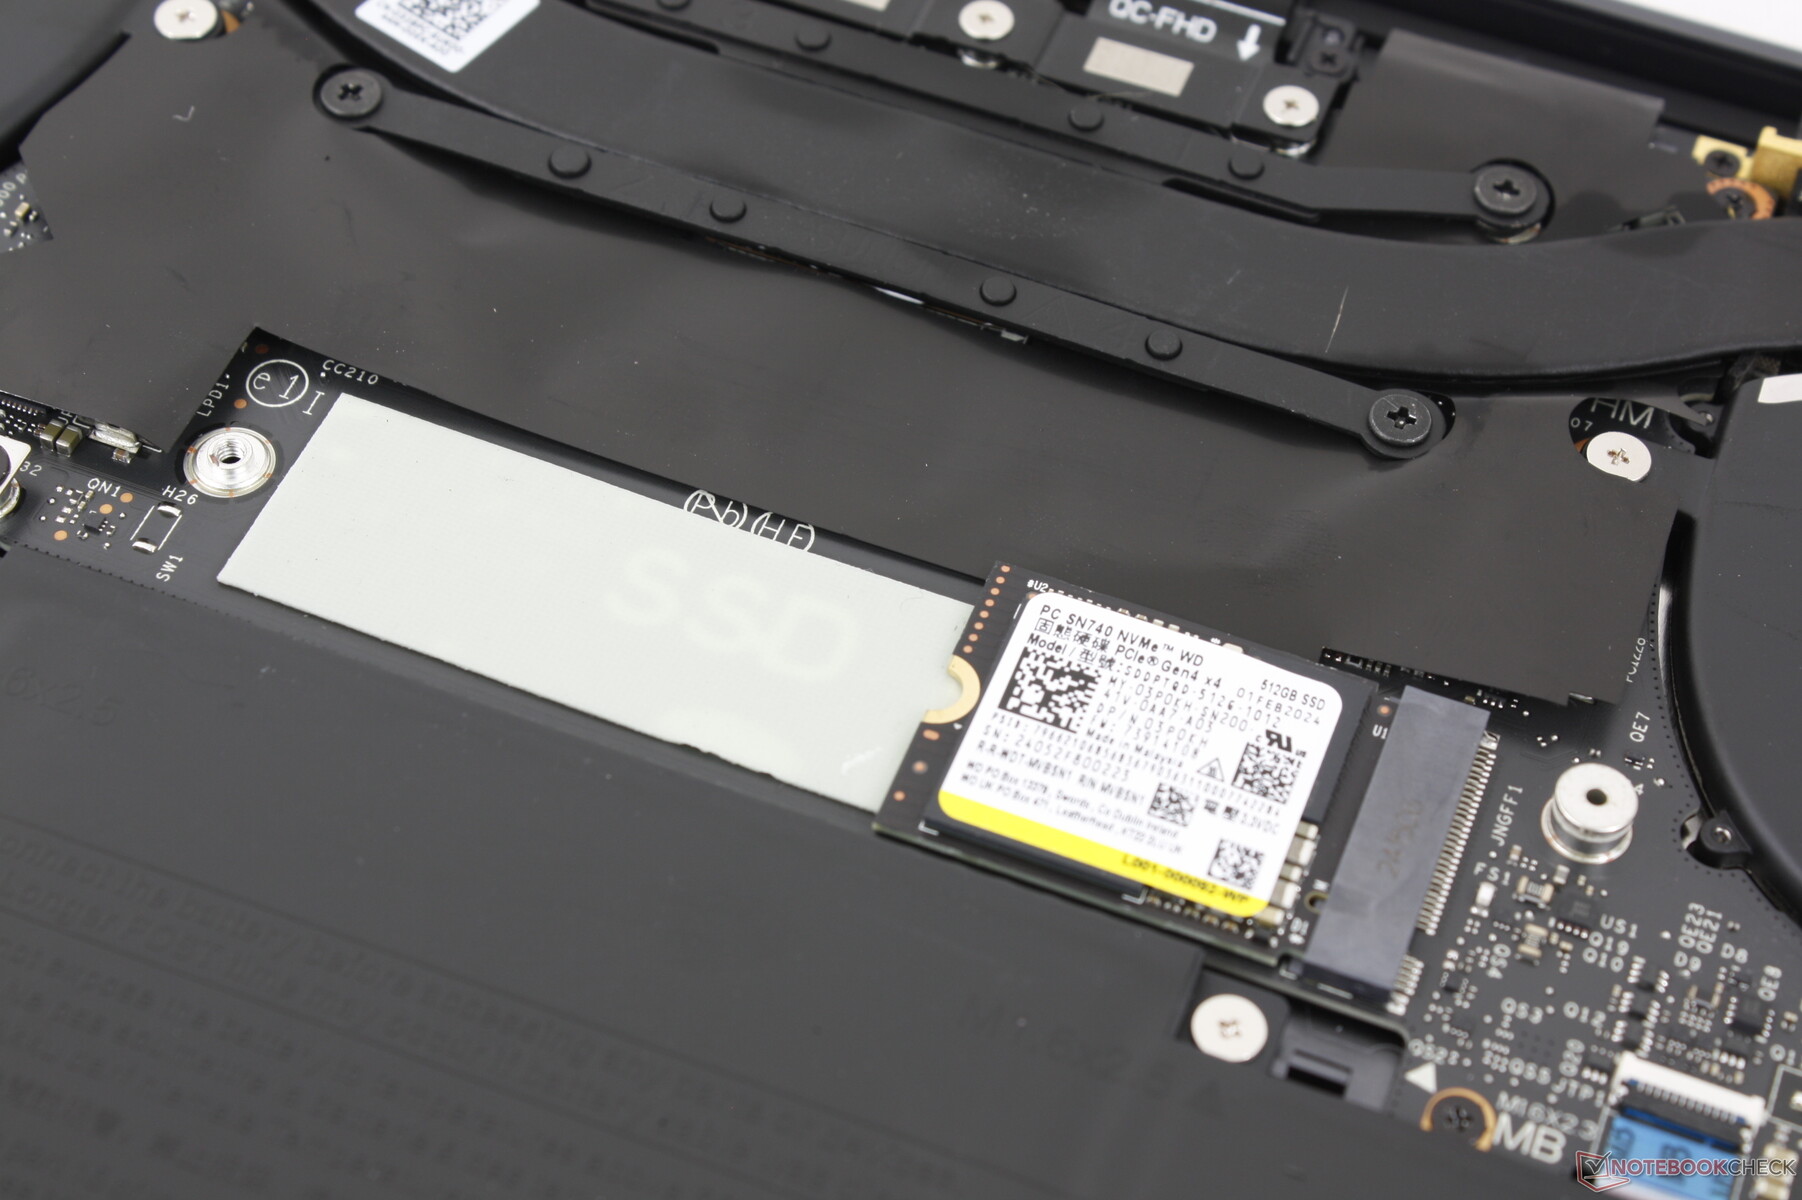
Dell bezieht seine SSDs von verschiedenen Herstellern, sodass es vor dem Kauf schwierig ist, genau zu wissen, welches Laufwerk man erhält. In mehr als 10 verschiedenen XPS 13-Geräten haben wir bereits Laufwerke von Micron, Samsung, WD, Toshiba und SK Hynix im Einsatz. Unser spezifisches Qualcomm-Gerät ist mit dem Mittelklasse-Laufwerk WD SN740 ausgestattet, das stabile Übertragungsraten von bis zu 5000 MB/s bietet. Trotz der kompakten Größe von 42 mm konnten wir kein Throttling beobachten, was vermutlich zum Teil dem mitgelieferten SSD-Wärmespreizer zu verdanken ist.

* ... kleinere Werte sind besser
Dauerleistung Lesen: DiskSpd Read Loop, Queue Depth 8
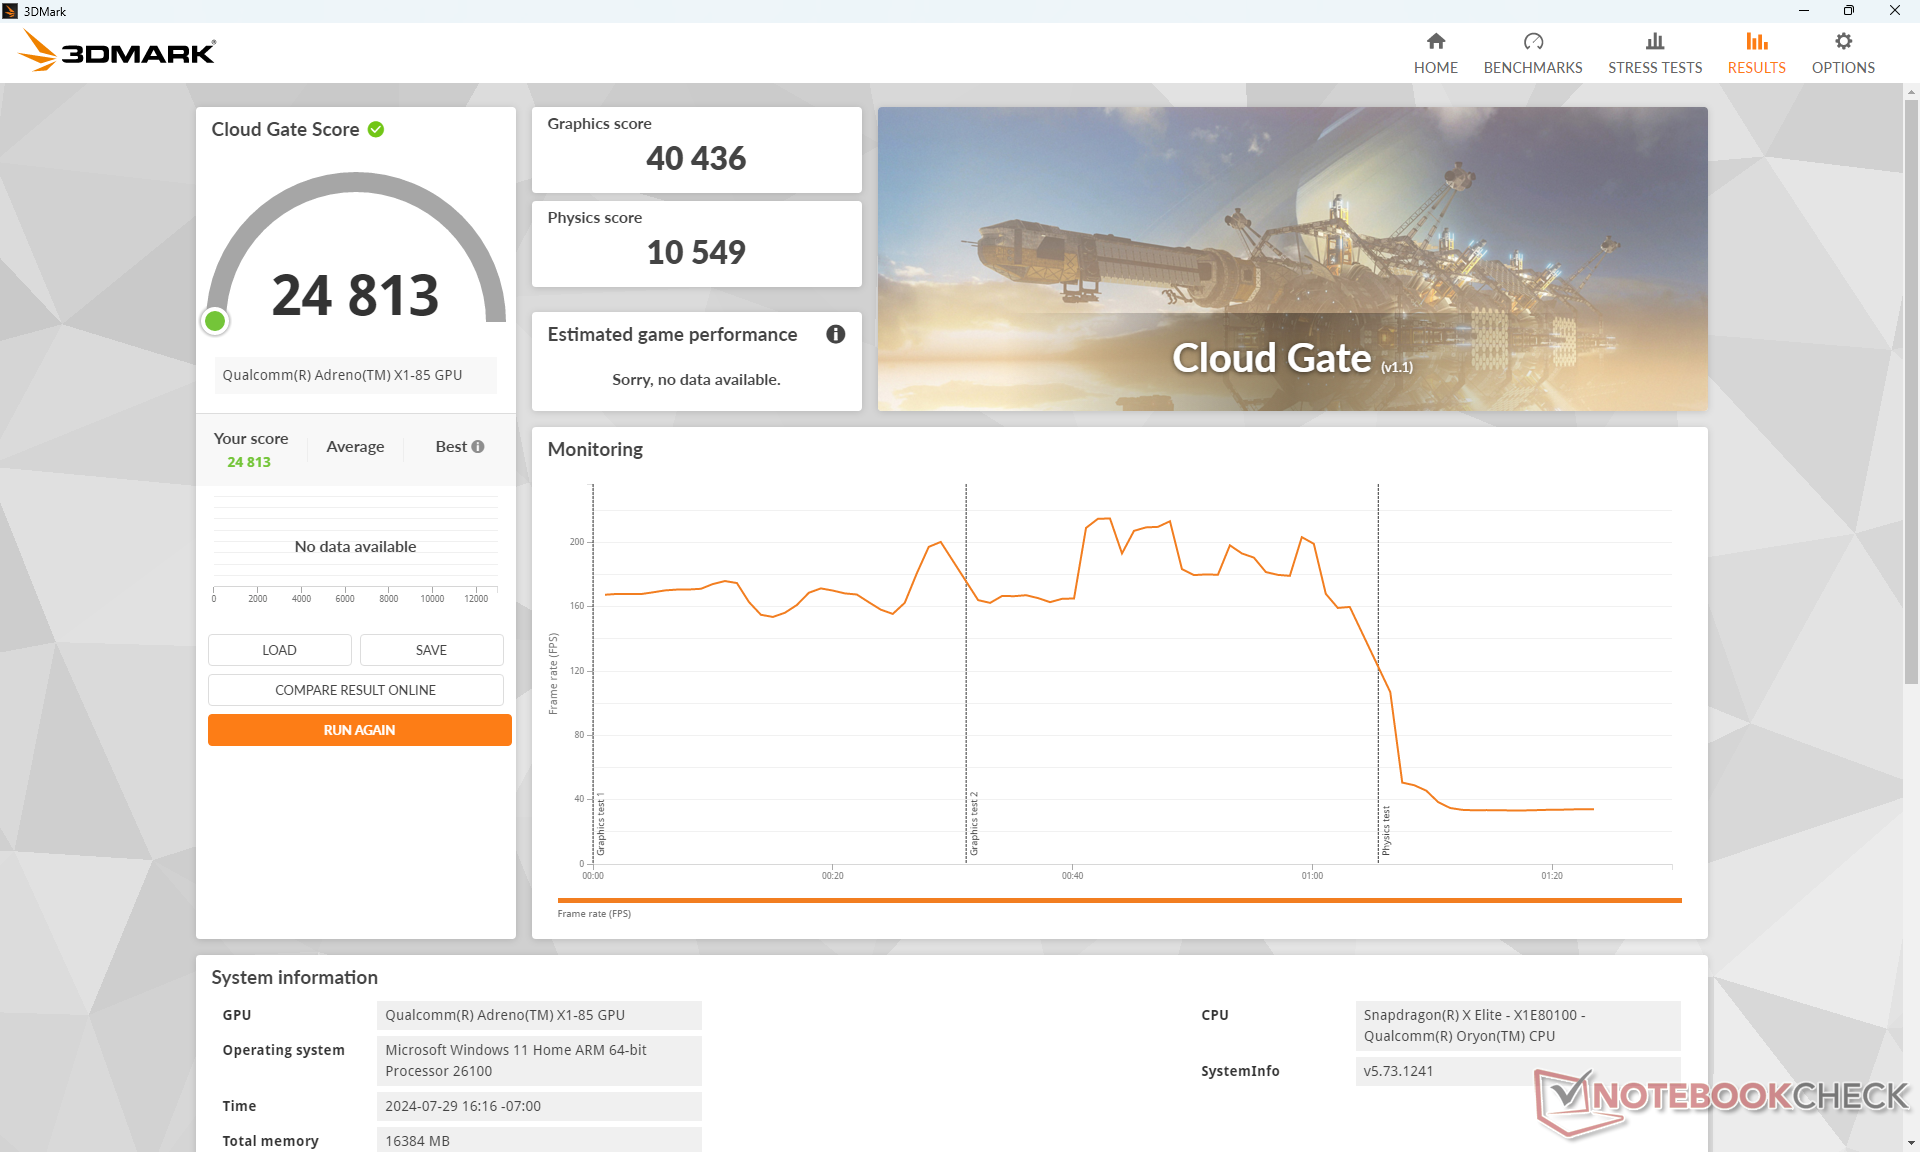
GPU Performance
Die Grafikleistung liegt laut dem emulierten 3DMark auf einem Niveau mit den Iris Xe 96 EUs, bleibt jedoch deutlich hinter der Arc 8 sowie der Radeon 680M/780M-Serie zurück, mit einem Rückstand von bis zu 20 bis 40 Prozent. Dennoch sind die Ergebnisse durchweg besser als die des HP EliteBook Ultra G1q 14, auch wenn die Abweichungen im Durchschnitt gering sind.
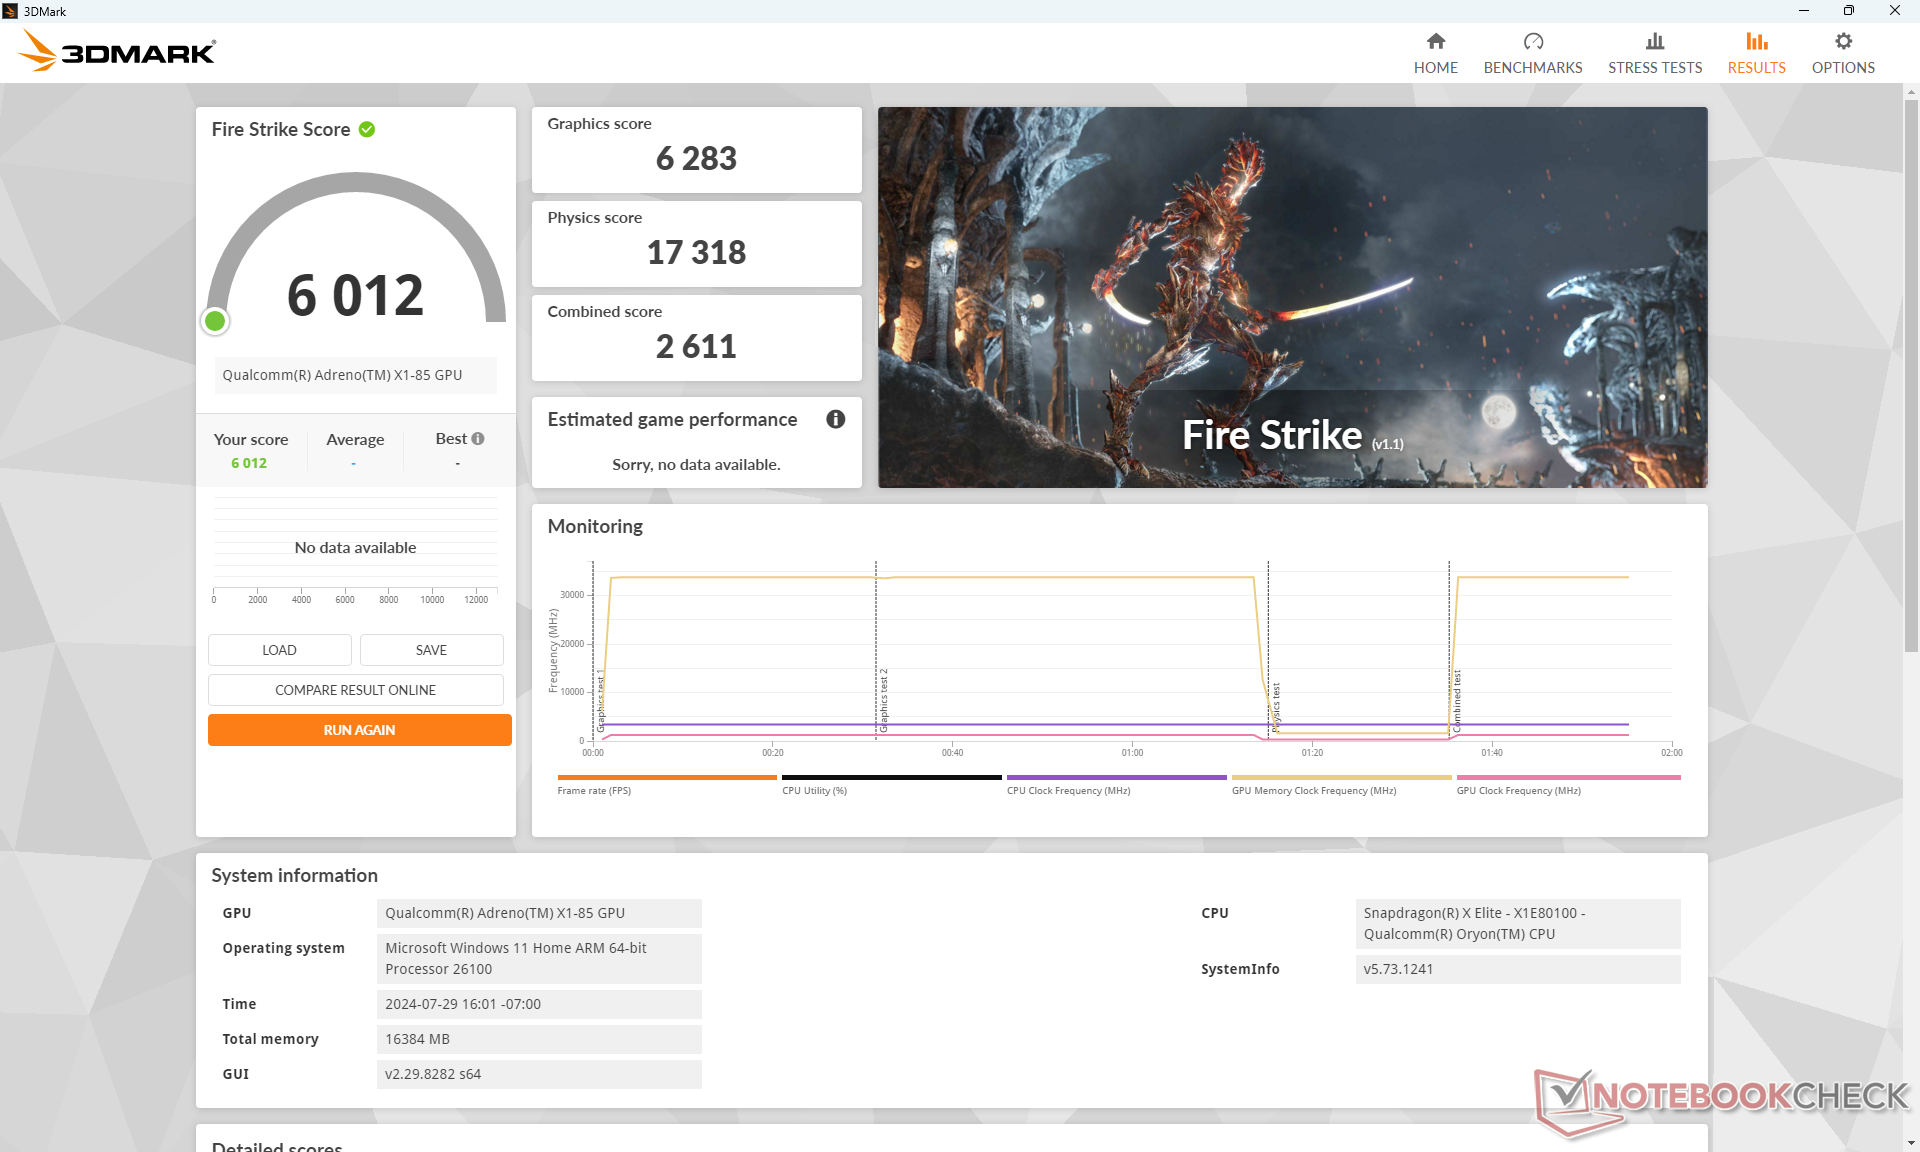
| Energieprofile | Grafikleistung | CPU-Leistung | Gesamtwert |
|---|---|---|---|
| Performance-Modus | 6283 | 17318 | 2611 |
| Balanced-Modus | 6209 | 18348 | 2643 |
| Battery Power | 6287 | 18156 | 2687 |
Es gibt keine signifikanten Leistungseinbußen beim Wechsel zwischen den Modi Performance, Balanced oder Battery Power, wie die obige Tabelle der Fire Strike-Ergebnisse zeigt.
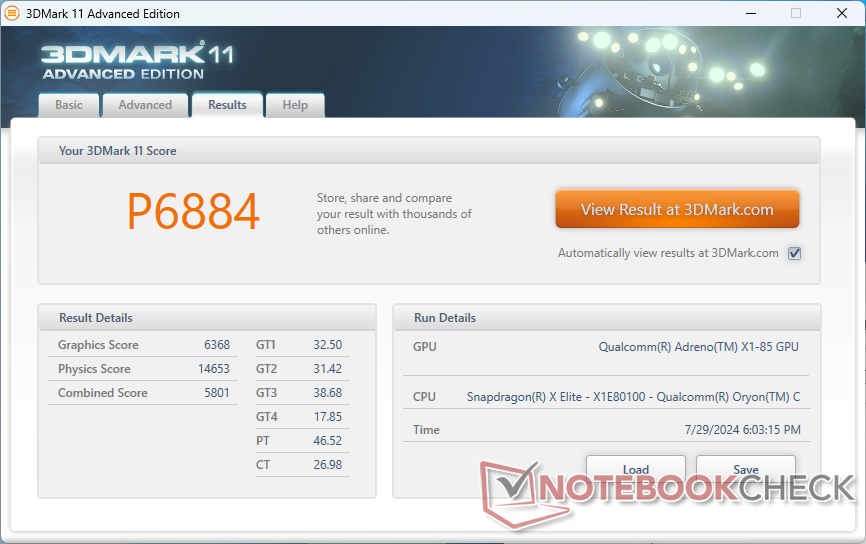
| 3DMark 11 Performance | 6884 Punkte | |
| 3DMark Cloud Gate Standard Score | 24813 Punkte | |
| 3DMark Fire Strike Score | 6012 Punkte | |
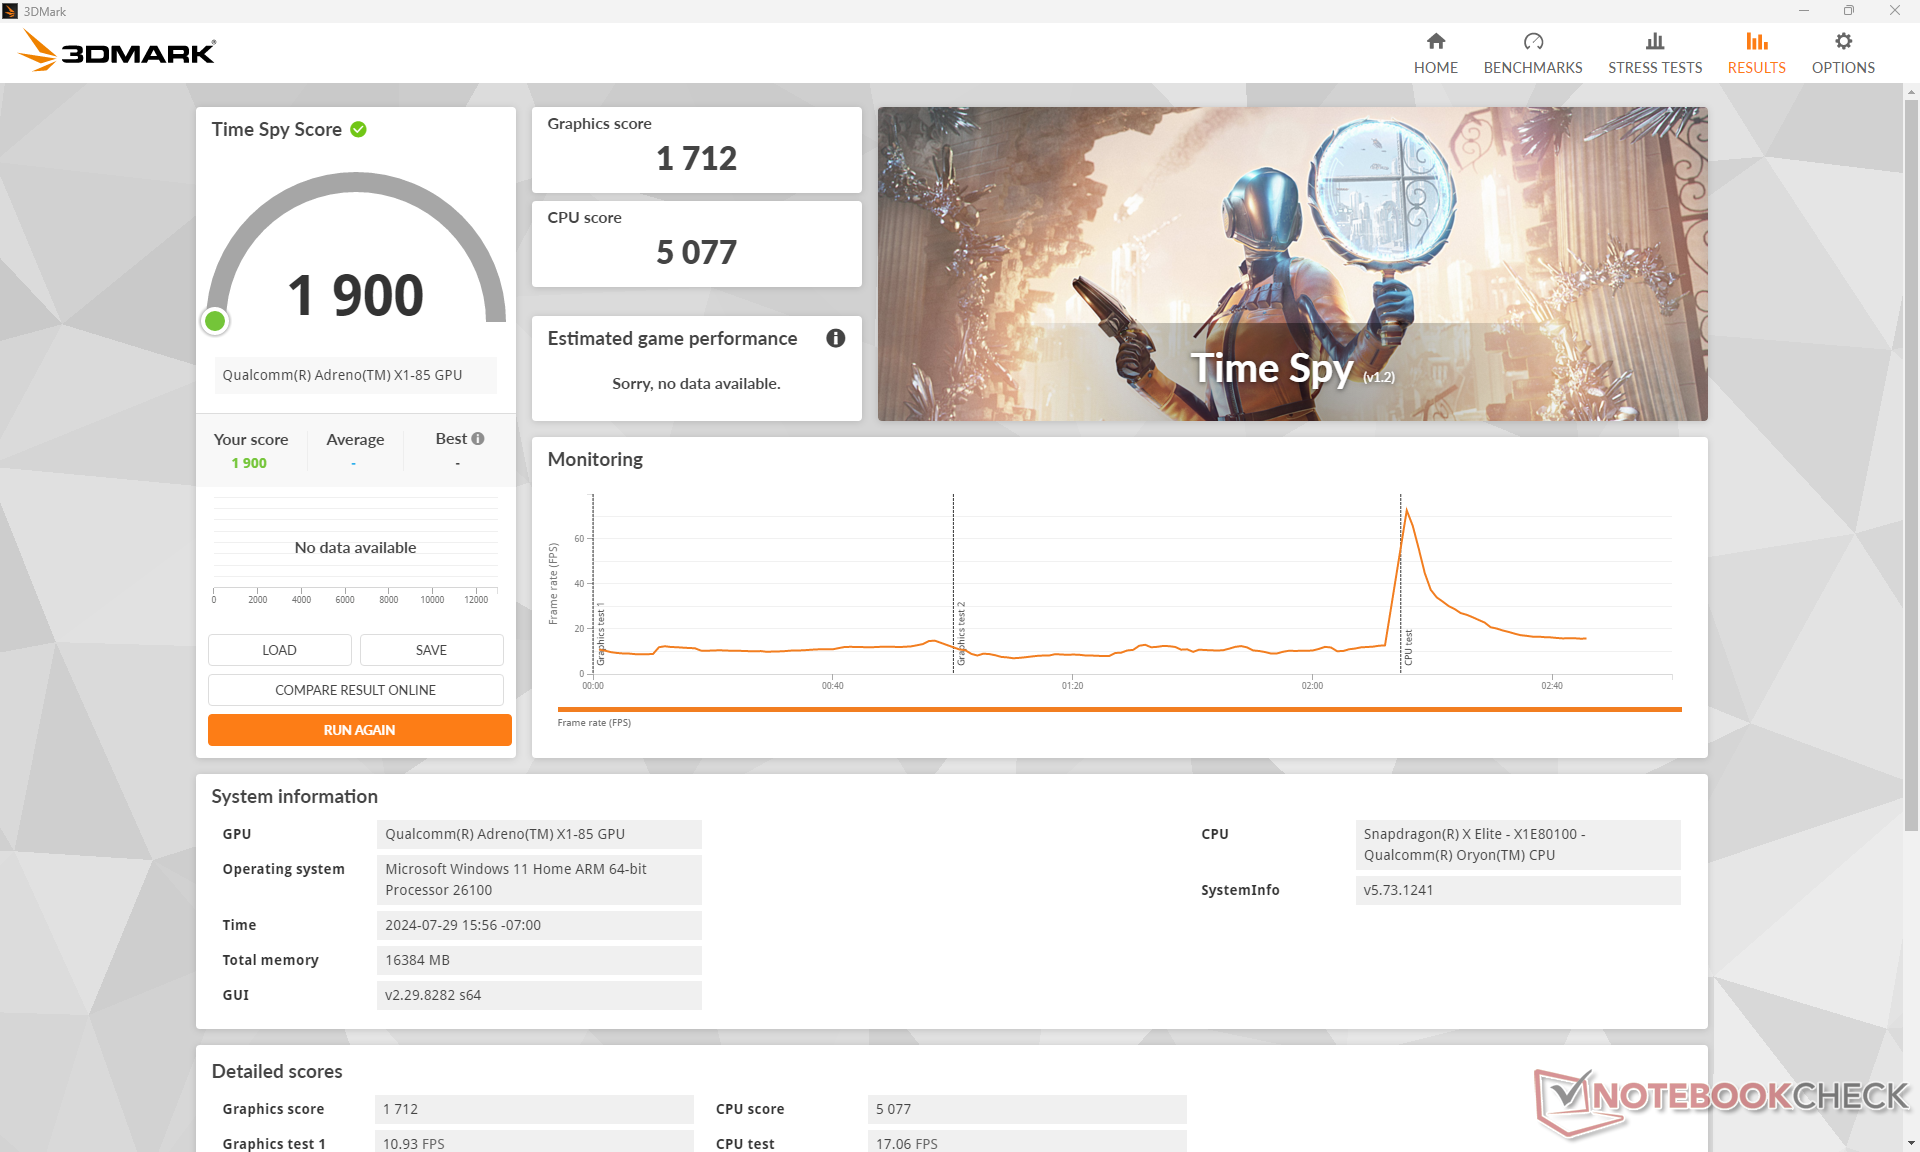
| 3DMark Time Spy Score | 1900 Punkte | |
Hilfe | ||
* ... kleinere Werte sind besser
Gaming Performance
Unsere leicht höheren 3DMark-Ergebnisse im Vergleich zum EliteBook Ultra G1q 14 führen zu einer etwas schnelleren Leistung bei den unten getesteten Titeln. Interessanterweise liefen einige Titel auf unserem Dell-Gerät, aber nicht auf unserem HP-Gerät und umgekehrt. Zum Beispiel lief Far Cry 5 auf unserem Dell, aber nicht auf dem HP, während Baldur's Gate 3 auf dem HP, aber nicht auf dem Dell lief, egal in welchem DirectX-Modus. Diese Diskrepanz könnte auf Treiberunterschiede zwischen den beiden Modellen zurückzuführen sein und zeigt, dass hinsichtlich der Grafiktreiber noch mehr Arbeit notwendig ist.
| Performance Rating - Percent | |
| Lenovo ThinkBook 13x G4 21KR0008GE -2! | |
| Dell XPS 13 9340 Core Ultra 7 -2! | |
| Dell XPS 13 9345 | |
| Microsoft Surface Laptop 7 13.8 Copilot+ -2! | |
| HP EliteBook Ultra G1q 14 -1! | |
| Asus ZenBook S13 OLED UX5304 -1! | |
| The Witcher 3 - 1920x1080 Ultra Graphics & Postprocessing (HBAO+) | |
| Lenovo ThinkBook 13x G4 21KR0008GE | |
| Dell XPS 13 9340 Core Ultra 7 | |
| Dell XPS 13 9345 | |
| HP EliteBook Ultra G1q 14 | |
| Asus ZenBook S13 OLED UX5304 | |
| GTA V - 1920x1080 Highest AA:4xMSAA + FX AF:16x | |
| Microsoft Surface Laptop 7 13.8 Copilot+ | |
| Dell XPS 13 9345 | |
| Lenovo ThinkBook 13x G4 21KR0008GE | |
| Dell XPS 13 9340 Core Ultra 7 | |
| Asus ZenBook S13 OLED UX5304 | |
| Final Fantasy XV Benchmark - 1920x1080 High Quality | |
| Dell XPS 13 9340 Core Ultra 7 | |
| Lenovo ThinkBook 13x G4 21KR0008GE | |
| Microsoft Surface Laptop 7 13.8 Copilot+ | |
| Dell XPS 13 9345 | |
| Asus ZenBook S13 OLED UX5304 | |
| HP EliteBook Ultra G1q 14 | |
| Strange Brigade - 1920x1080 ultra AA:ultra AF:16 | |
| Lenovo ThinkBook 13x G4 21KR0008GE | |
| Dell XPS 13 9340 Core Ultra 7 | |
| Microsoft Surface Laptop 7 13.8 Copilot+ | |
| Dell XPS 13 9345 | |
| HP EliteBook Ultra G1q 14 | |
| Asus ZenBook S13 OLED UX5304 | |
| Dota 2 Reborn - 1920x1080 ultra (3/3) best looking | |
| Dell XPS 13 9340 Core Ultra 7 | |
| Lenovo ThinkBook 13x G4 21KR0008GE | |
| Microsoft Surface Laptop 7 13.8 Copilot+ | |
| Asus ZenBook S13 OLED UX5304 | |
| Dell XPS 13 9345 | |
| HP EliteBook Ultra G1q 14 | |
| Tiny Tina's Wonderlands - 1920x1080 Badass Preset (DX12) | |
| Dell XPS 13 9345 | |
| HP EliteBook Ultra G1q 14 | |
| F1 22 - 1920x1080 High Preset AA:T AF:16x | |
| Dell XPS 13 9345 | |
| Microsoft Surface Laptop 7 13.8 Copilot+ | |
| HP EliteBook Ultra G1q 14 | |
| Asus ZenBook S13 OLED UX5304 | |
Cyberpunk 2077 ultra FPS Diagramm
| min. | mittel | hoch | max. | |
|---|---|---|---|---|
| GTA V (2015) | 96.3 | 94.2 | 49.5 | 21.2 |
| The Witcher 3 (2015) | 104 | 74.5 | 43.7 | 19.2 |
| Dota 2 Reborn (2015) | 80 | 60.7 | 57.4 | 50.7 |
| Final Fantasy XV Benchmark (2018) | 56.1 | 25 | 15.8 | |
| X-Plane 11.11 (2018) | 38 | |||
| Far Cry 5 (2018) | 42 | 33 | 31 | 28 |
| Strange Brigade (2018) | 123.9 | 50.8 | 41.8 | 33.9 |
| Tiny Tina's Wonderlands (2022) | 44.5 | 33.6 | 22.4 | 18 |
| F1 22 (2022) | 62.9 | 55.4 | 38.5 | |
| Cyberpunk 2077 (2023) | 24.1 | 19.5 | 16.9 | 14.7 |
Emissionen
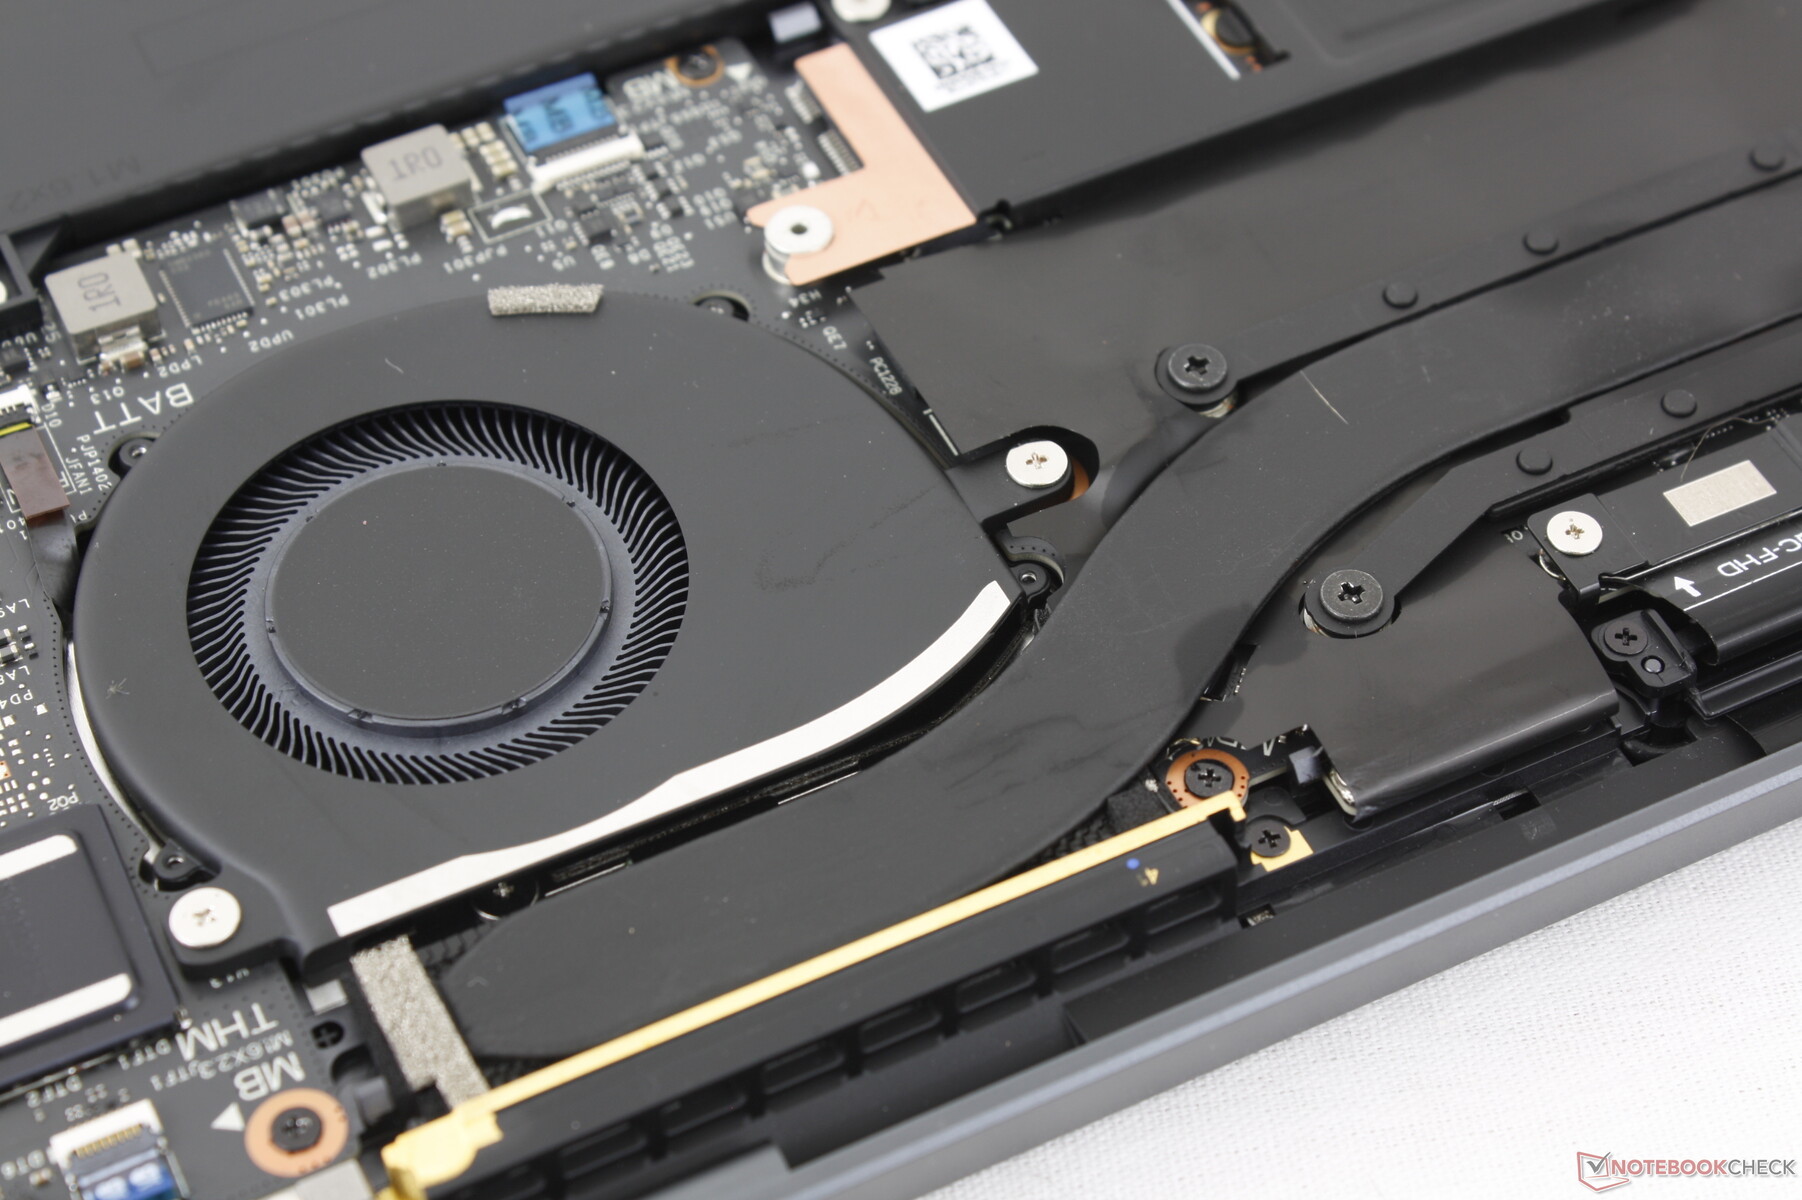
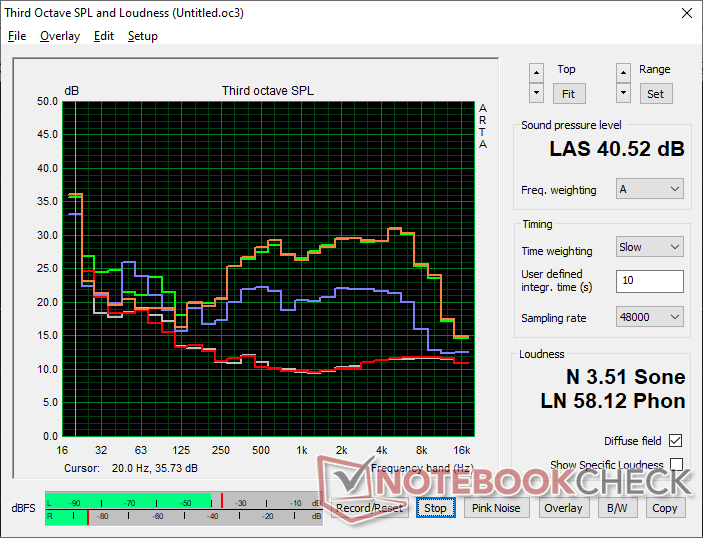
Geräuschemissionen — Ruhigere Lüfteraktivität
Die Lüftergeräusche sind etwas leiser als beim Intel Core Ultra 7-Modell, da die internen Lüfter bei höherer Last langsamer hochfahren. Andernfalls würden sich die Lüfter bei beiden Modellen bei ähnlichen maximalen Drehzahlen einpendeln, wenn sie über längere Zeiträume hinweg anspruchsvolle Lasten ausführen. Beispielsweise erreichte das Lüftergeräusch gegen Ende der ersten 90-Sekunden-Benchmark-Szene im 3DMark 06 einen Höchstwert von 32,8 dB(A), verglichen mit 37,4 dB(A) beim Intel-Modell unter ähnlichen Bedingungen. Bei Spielen wie Cyberpunk 2077 pendelten sich beide Modelle jedoch jeweils im niedrigen 40-dB(A)-Bereich ein. Das Qualcomm-System ist bei hoher Last nicht unbedingt leiser, aber beim Surfen im Internet oder beim Videostreaming ist die Wahrscheinlichkeit geringer, dass man die Lüfteraktivität bemerkt.
Lautstärkediagramm
| Idle |
| 22.9 / 22.9 / 22.9 dB(A) |
| Last |
| 32.8 / 40.6 dB(A) |
 | ||
30 dB leise 40 dB(A) deutlich hörbar 50 dB(A) störend |
||
min: | ||
| Dell XPS 13 9345 Adreno X1-85 3.8 TFLOPS, SD X Elite X1E-80-100 | Dell XPS 13 9340 Core Ultra 7 Arc 8-Core, Ultra 7 155H, Micron 2550 512GB | Microsoft Surface Laptop 7 13.8 Copilot+ Adreno X1-85 3.8 TFLOPS, SD X Elite X1E-80-100, Samsung MZ9L4512HBLU-00BMV | Lenovo ThinkBook 13x G4 21KR0008GE Arc 7-Core, Ultra 5 125H, Samsung PM9C1a MZAL8512HDLU | HP EliteBook Ultra G1q 14 Adreno X1-85 3.8 TFLOPS, SD X Elite X1E-78-100, SK hynix PC801 HFS512GEJ9X101N BF | Asus ZenBook S13 OLED UX5304 Iris Xe G7 96EUs, i7-1355U, Samsung PM9A1 MZVL21T0HCLR | |
|---|---|---|---|---|---|---|
| Geräuschentwicklung | -10% | 4% | -7% | 4% | -4% | |
| aus / Umgebung * (dB) | 22.9 | 25.1 -10% | 23.8 -4% | 24.5 -7% | 23.4 -2% | 23.3 -2% |
| Idle min * (dB) | 22.9 | 25.1 -10% | 23.8 -4% | 24.5 -7% | 23.4 -2% | 23.3 -2% |
| Idle avg * (dB) | 22.9 | 25.1 -10% | 23.8 -4% | 24.5 -7% | 23.4 -2% | 23.3 -2% |
| Idle max * (dB) | 22.9 | 25.1 -10% | 23.8 -4% | 27.1 -18% | 24.3 -6% | 23.3 -2% |
| Last avg * (dB) | 32.8 | 37.4 -14% | 26 21% | 33.3 -2% | 25 24% | 37.7 -15% |
| Cyberpunk 2077 ultra * (dB) | 40.6 | 31.5 22% | ||||
| Last max * (dB) | 40.6 | 42.5 -5% | 40.3 1% | 40.7 -0% | 34.8 14% | 40.1 1% |
| Witcher 3 ultra * (dB) | 42.5 | 36.8 | 30.6 | 40.1 |
* ... kleinere Werte sind besser
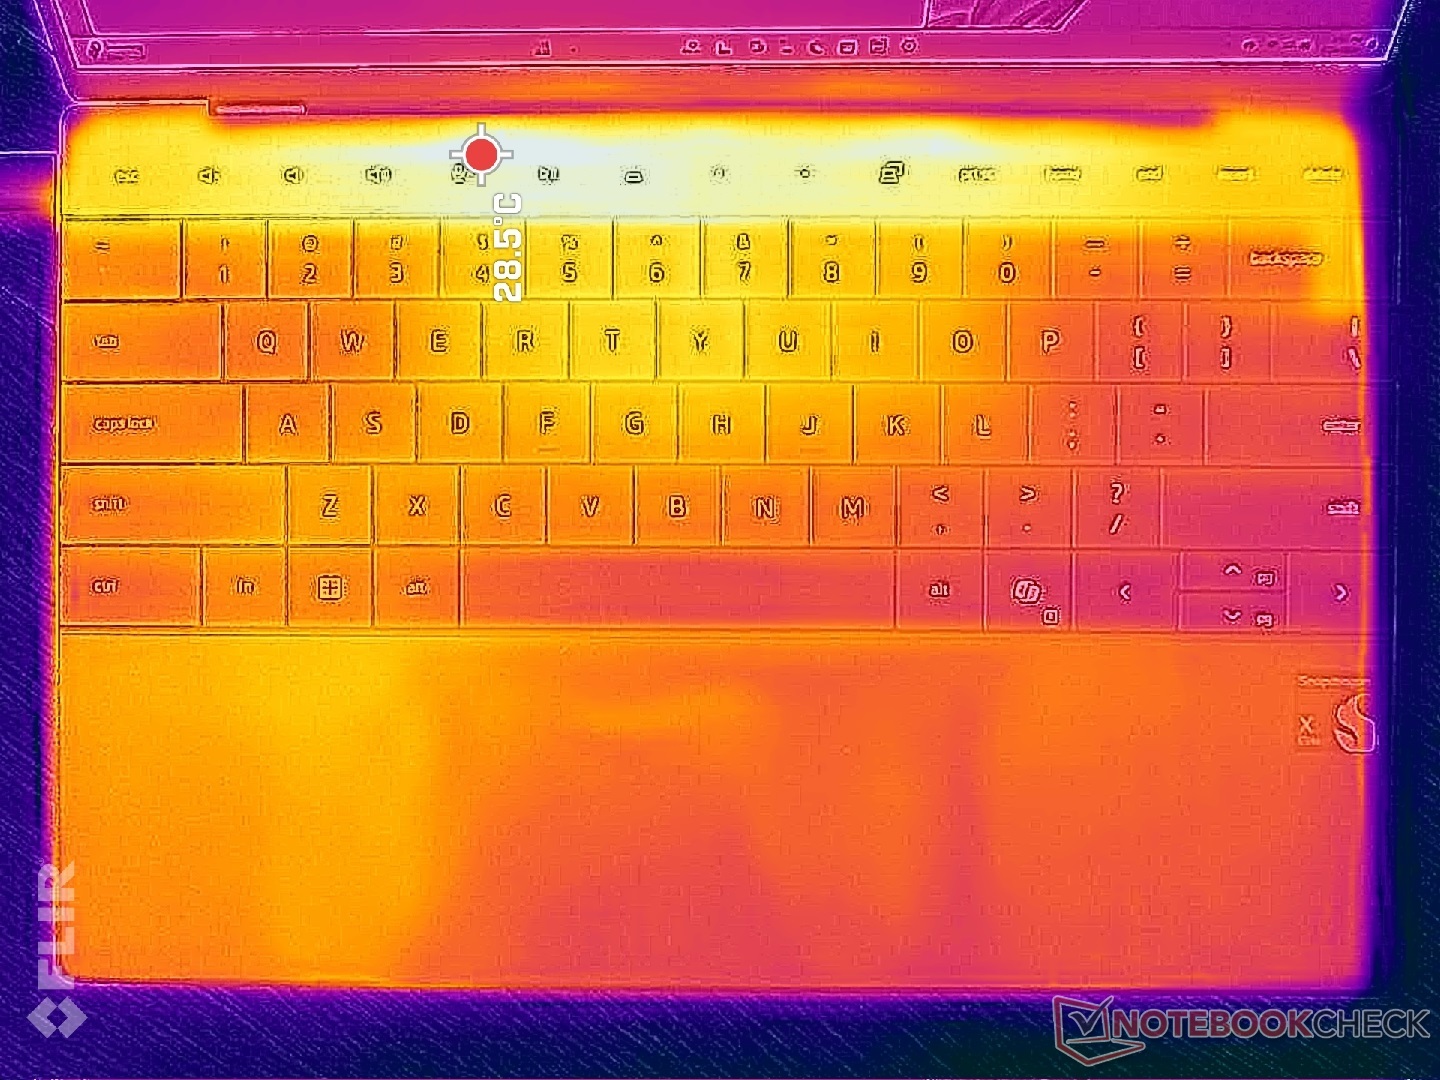
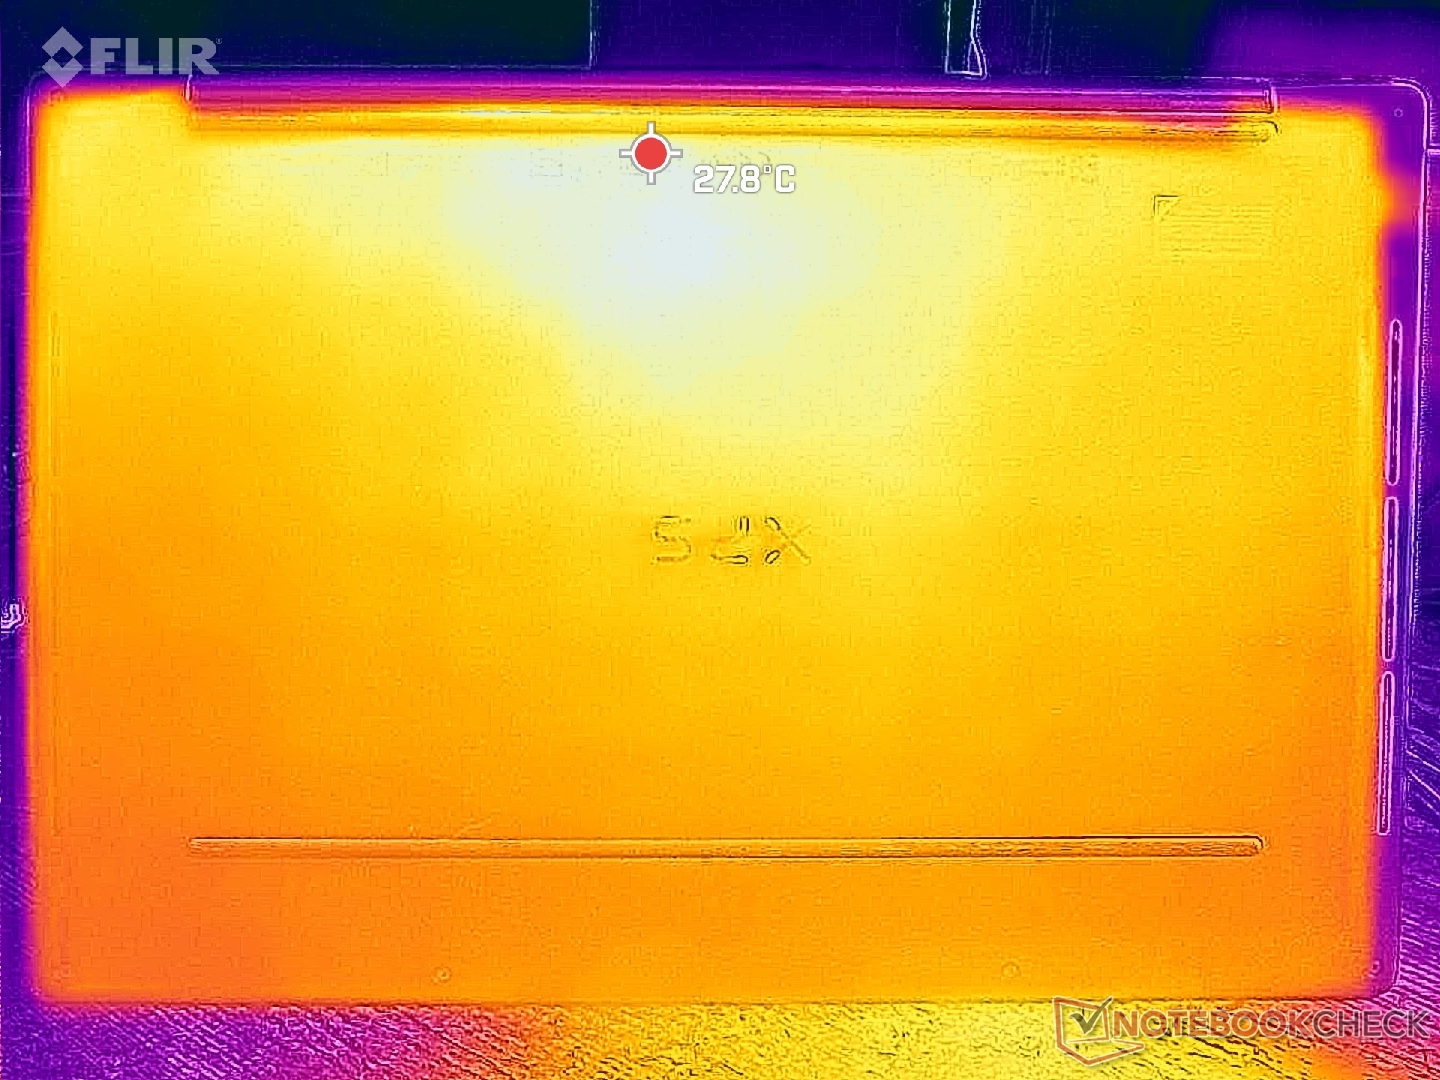
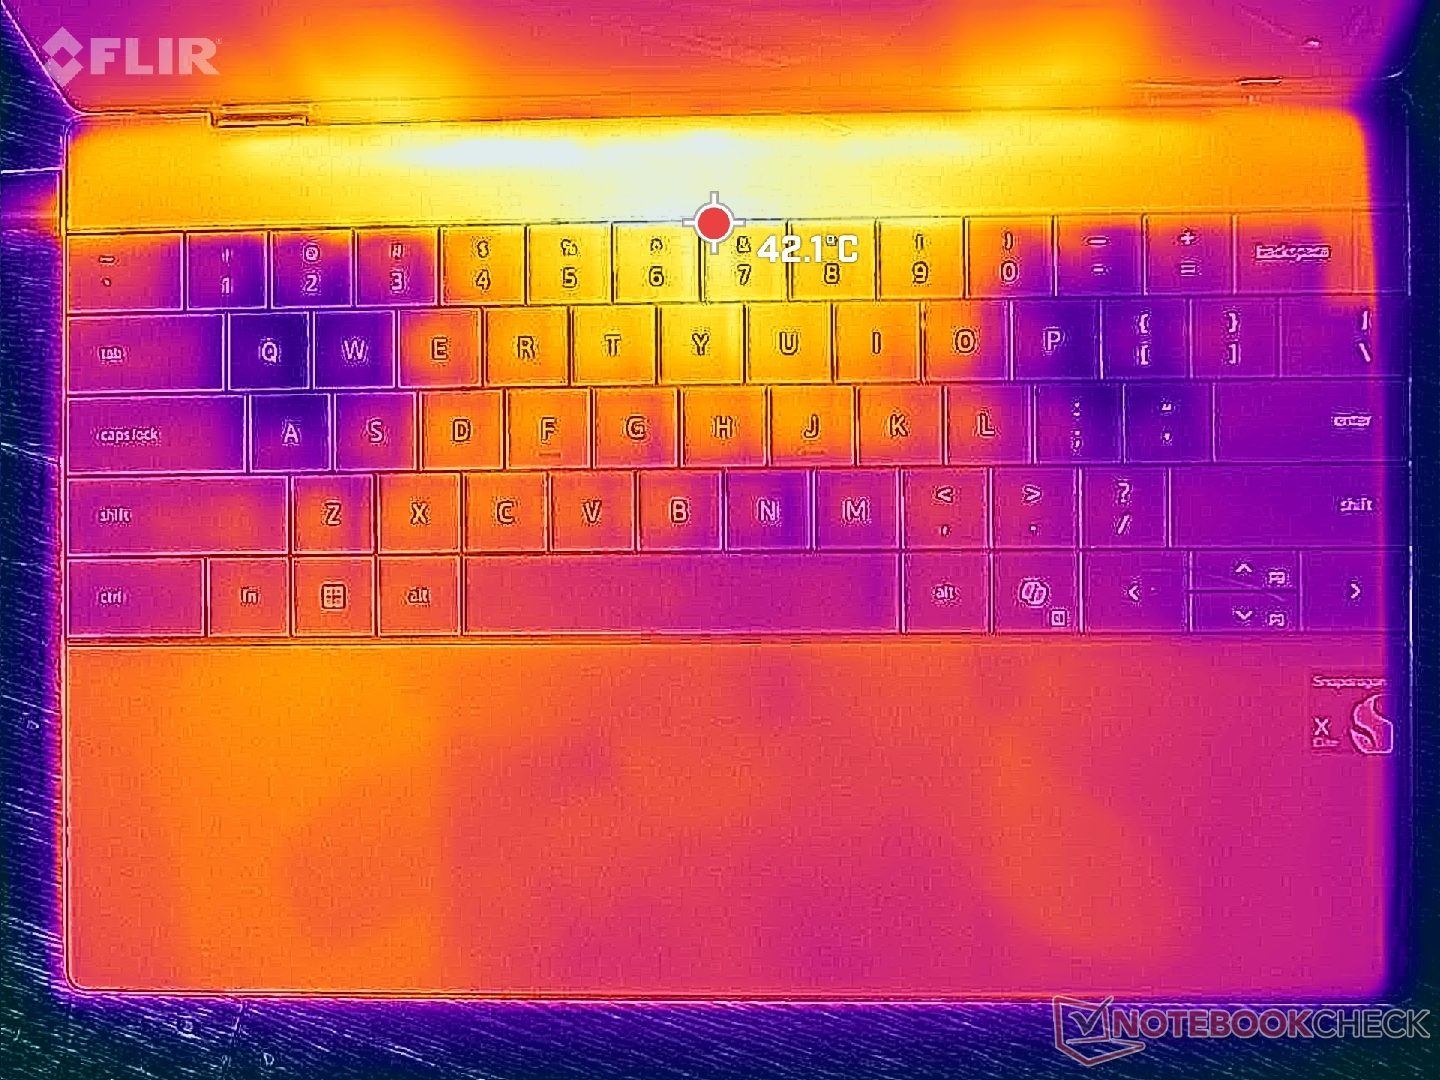
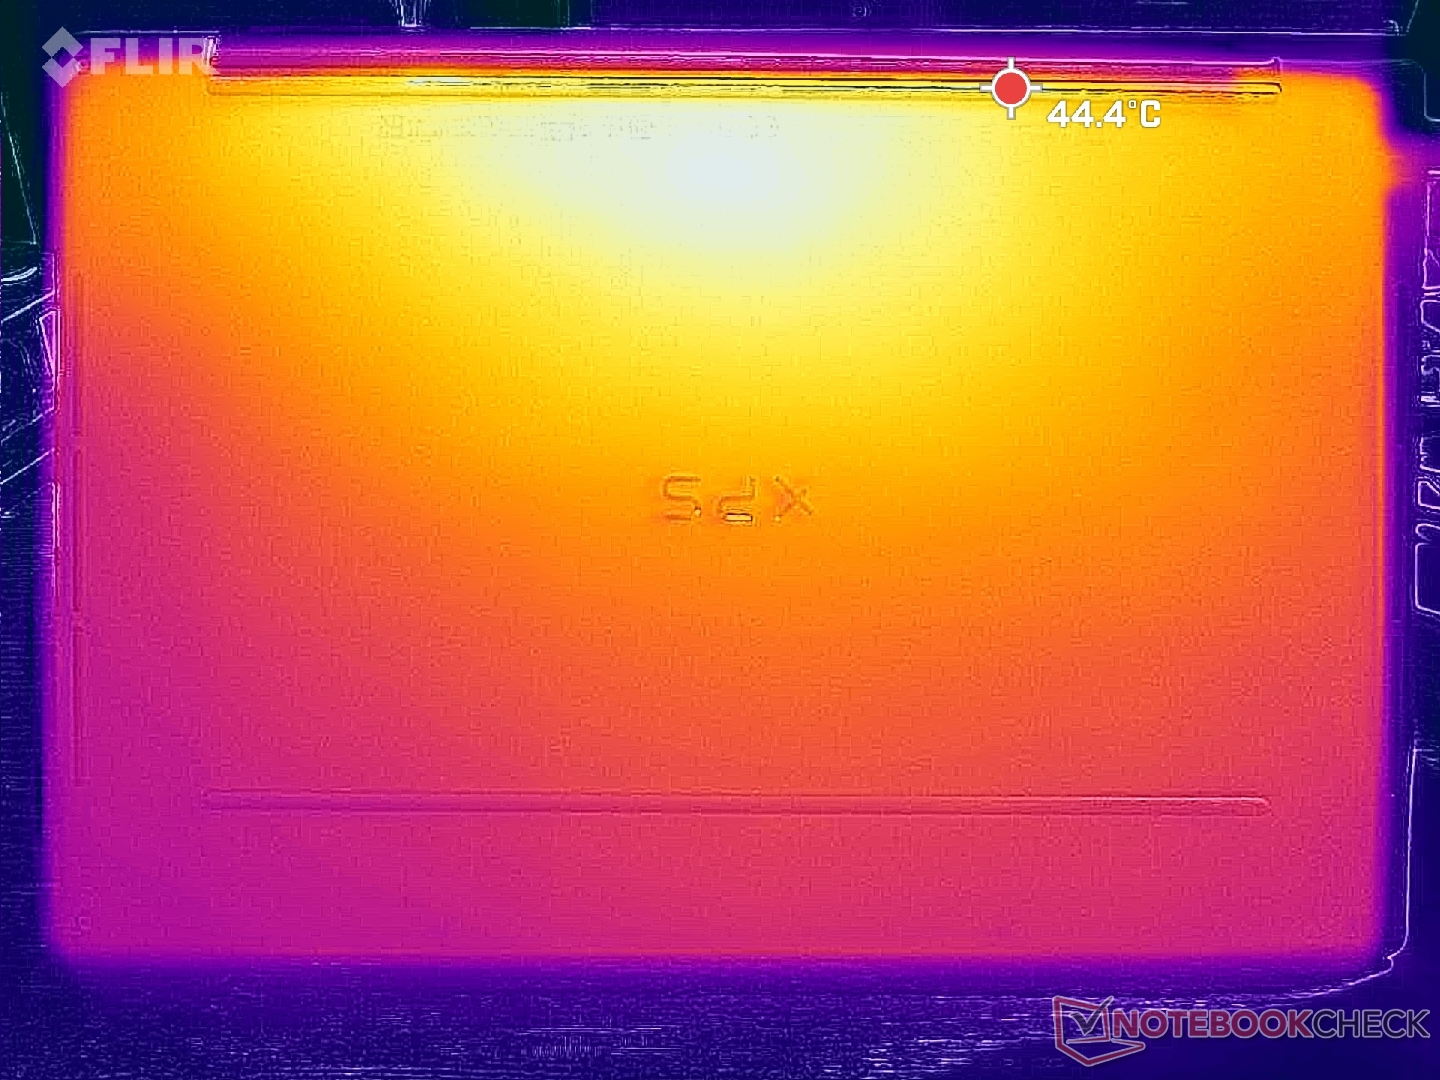
Temperatur
Die Oberflächentemperaturen des Qualcomm-Modells liegen sehr nahe an denen des Intel XPS 13 9340. Dies zeigt, dass der Austausch des Prozessors keine signifikanten Unterschiede in der Wärmeentwicklung bewirkt. Heiße Stellen in der Mitte des Systems können bis zu 45 °C erreichen, ähnlich wie beim Intel-Modell, wenn beide über längere Zeit unter anspruchsvoller Last laufen. Die durchschnittlichen Temperaturen sind kühler als beim Microsoft Surface Laptop 7 13.8, aber wärmer als beim HP EliteBook Ultra G1q 14, beide ebenfalls mit ähnlichen Snapdragon Elite CPUs ausgestattet.
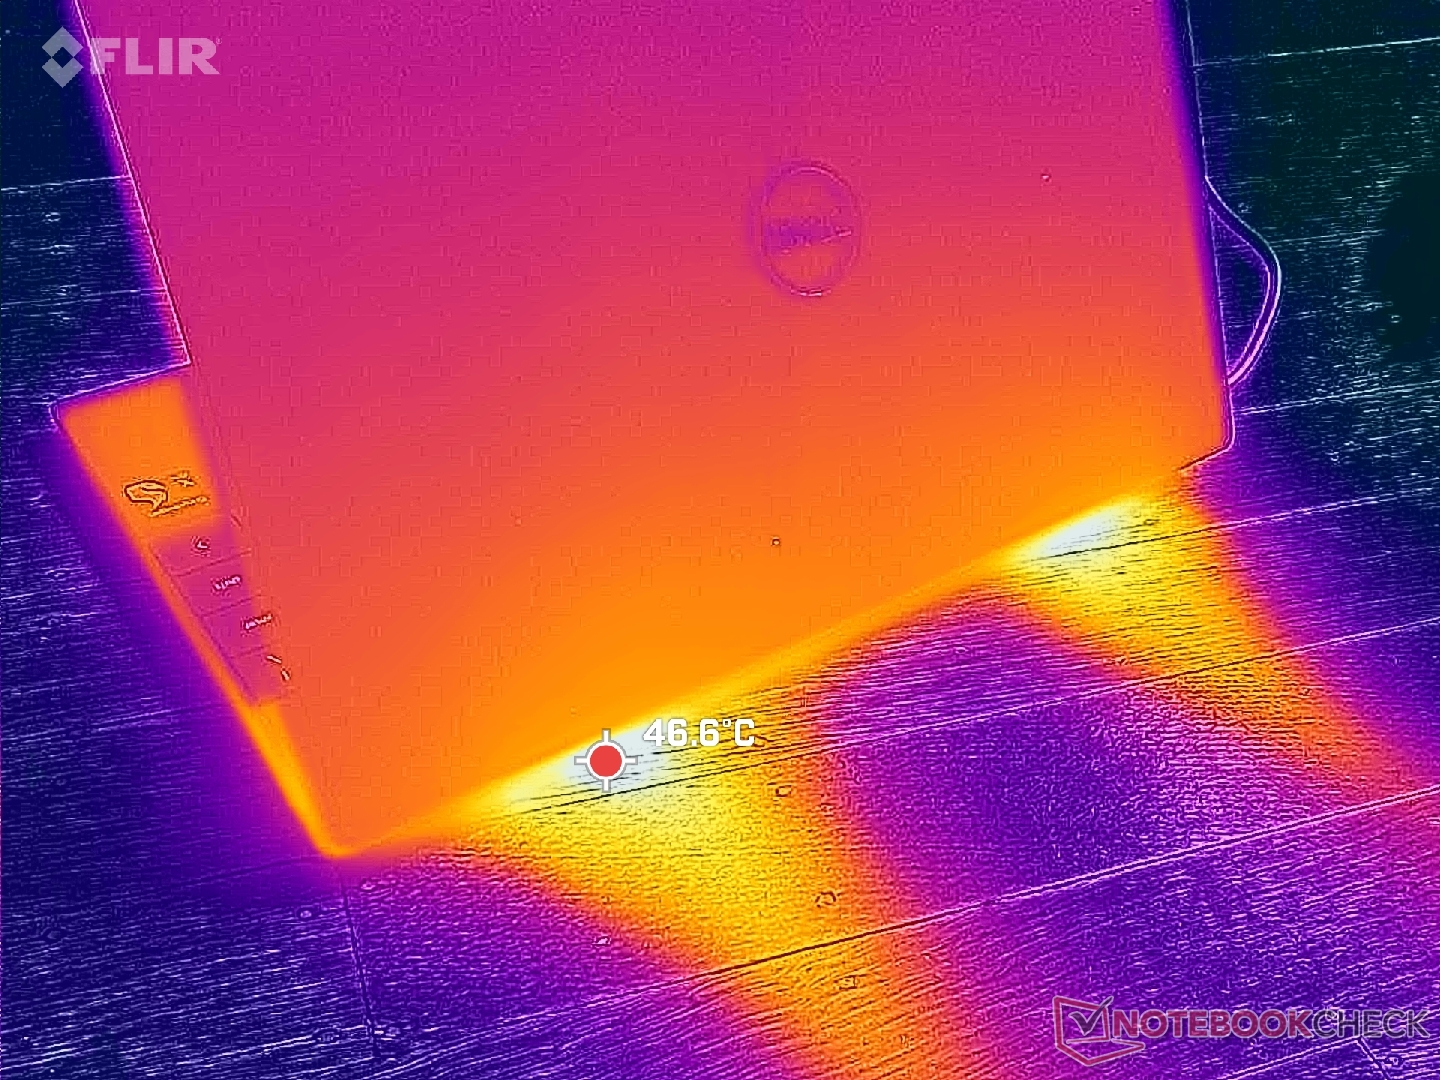
(-) Die maximale Temperatur auf der Oberseite ist 45.2 °C. Im Vergleich liegt der Klassendurchschnitt bei 35.9 °C (von 21.4 bis 59 °C für die Klasse Subnotebook).
(±) Auf der Unterseite messen wir eine maximalen Wert von 44.2 °C (im Vergleich zum Durchschnitt von 39.3 °C).
(+) Ohne Last messen wir eine durchschnittliche Temperatur von 29.1 °C auf der Oberseite. Der Klassendurchschnitt erreicht 30.8 °C.
(+) Die Handballen und der Touchpad-Bereich erreichen maximal 34.4 °C und damit die typische Hauttemperatur und fühlen sich daher nicht heiß an.
(-) Die durchschnittliche Handballen-Temperatur anderer getesteter Geräte war 28.2 °C (-6.2 °C).
| Dell XPS 13 9345 Qualcomm Snapdragon X Elite X1E-80-100, Qualcomm SD X Adreno X1-85 3.8 TFLOPS | Dell XPS 13 9340 Core Ultra 7 Intel Core Ultra 7 155H, Intel Arc 8-Core iGPU | Microsoft Surface Laptop 7 13.8 Copilot+ Qualcomm Snapdragon X Elite X1E-80-100, Qualcomm SD X Adreno X1-85 3.8 TFLOPS | Lenovo ThinkBook 13x G4 21KR0008GE Intel Core Ultra 5 125H, Intel Arc 7-Core iGPU | HP EliteBook Ultra G1q 14 Qualcomm Snapdragon X Elite X1E-78-100, Qualcomm SD X Adreno X1-85 3.8 TFLOPS | Asus ZenBook S13 OLED UX5304 Intel Core i7-1355U, Intel Iris Xe Graphics G7 96EUs | |
|---|---|---|---|---|---|---|
| Hitze | 12% | 9% | 9% | 4% | 6% | |
| Last oben max * (°C) | 45.2 | 41 9% | 47.1 -4% | 43.1 5% | 40.8 10% | 43.1 5% |
| Last unten max * (°C) | 44.2 | 43.5 2% | 44.6 -1% | 39.2 11% | 40.4 9% | 45 -2% |
| Idle oben max * (°C) | 30.4 | 25.3 17% | 24.7 19% | 28.3 7% | 32.2 -6% | 27.3 10% |
| Idle unten max * (°C) | 31.6 | 25.5 19% | 24.5 22% | 28 11% | 31.2 1% | 27.8 12% |
* ... kleinere Werte sind besser
Lautsprecher
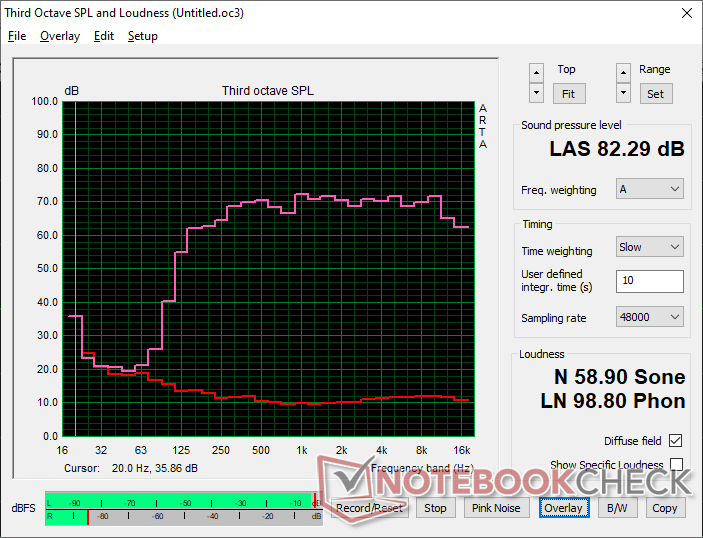
Dell XPS 13 9345 Audio Analyse
(+) | Die Lautsprecher können relativ laut spielen (82.3 dB)
Bass 100 - 315 Hz
(±) | abgesenkter Bass - 9.9% geringer als der Median
(±) | durchschnittlich lineare Bass-Wiedergabe (12.4% Delta zum Vorgänger)
Mitteltöne 400 - 2000 Hz
(+) | ausgeglichene Mitten, vom Median nur 1.9% abweichend
(+) | lineare Mitten (3.2% Delta zum Vorgänger)
Hochtöne 2 - 16 kHz
(+) | ausgeglichene Hochtöne, vom Median nur 1.5% abweichend
(+) | sehr lineare Hochtöne (3% Delta zum Vorgänger)
Gesamt im hörbaren Bereich 100 - 16.000 Hz
(+) | hörbarer Bereich ist sehr linear (8.2% Abstand zum Median
Im Vergleich zu allen Geräten derselben Klasse
» 2% aller getesteten Geräte dieser Klasse waren besser, 1% vergleichbar, 97% schlechter
» Das beste Gerät hat einen Delta-Wert von 5%, durchschnittlich ist 18%, das schlechteste Gerät hat 53%
Im Vergleich zu allen Geräten im Test
» 1% aller getesteten Geräte waren besser, 1% vergleichbar, 98% schlechter
» Das beste Gerät hat einen Delta-Wert von 4%, durchschnittlich ist 24%, das schlechteste Gerät hat 134%
Apple MacBook Pro 16 2021 M1 Pro Audio Analyse
(+) | Die Lautsprecher können relativ laut spielen (84.7 dB)
Bass 100 - 315 Hz
(+) | guter Bass - nur 3.8% Abweichung vom Median
(+) | lineare Bass-Wiedergabe (5.2% Delta zum Vorgänger)
Mitteltöne 400 - 2000 Hz
(+) | ausgeglichene Mitten, vom Median nur 1.3% abweichend
(+) | lineare Mitten (2.1% Delta zum Vorgänger)
Hochtöne 2 - 16 kHz
(+) | ausgeglichene Hochtöne, vom Median nur 1.9% abweichend
(+) | sehr lineare Hochtöne (2.7% Delta zum Vorgänger)
Gesamt im hörbaren Bereich 100 - 16.000 Hz
(+) | hörbarer Bereich ist sehr linear (4.6% Abstand zum Median
Im Vergleich zu allen Geräten derselben Klasse
» 0% aller getesteten Geräte dieser Klasse waren besser, 0% vergleichbar, 100% schlechter
» Das beste Gerät hat einen Delta-Wert von 5%, durchschnittlich ist 17%, das schlechteste Gerät hat 45%
Im Vergleich zu allen Geräten im Test
» 0% aller getesteten Geräte waren besser, 0% vergleichbar, 100% schlechter
» Das beste Gerät hat einen Delta-Wert von 4%, durchschnittlich ist 24%, das schlechteste Gerät hat 134%
Energieverwaltung
Energieaufnahme
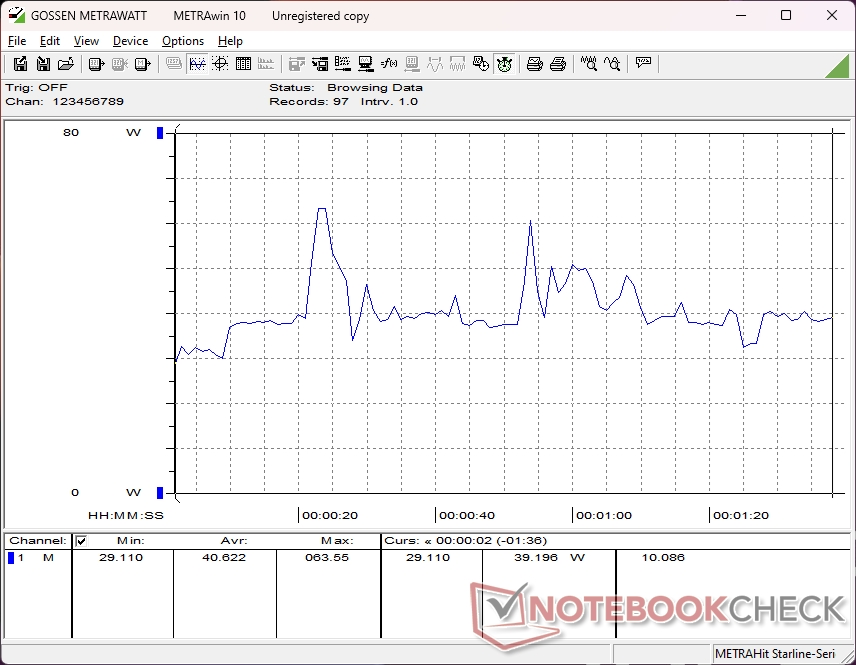
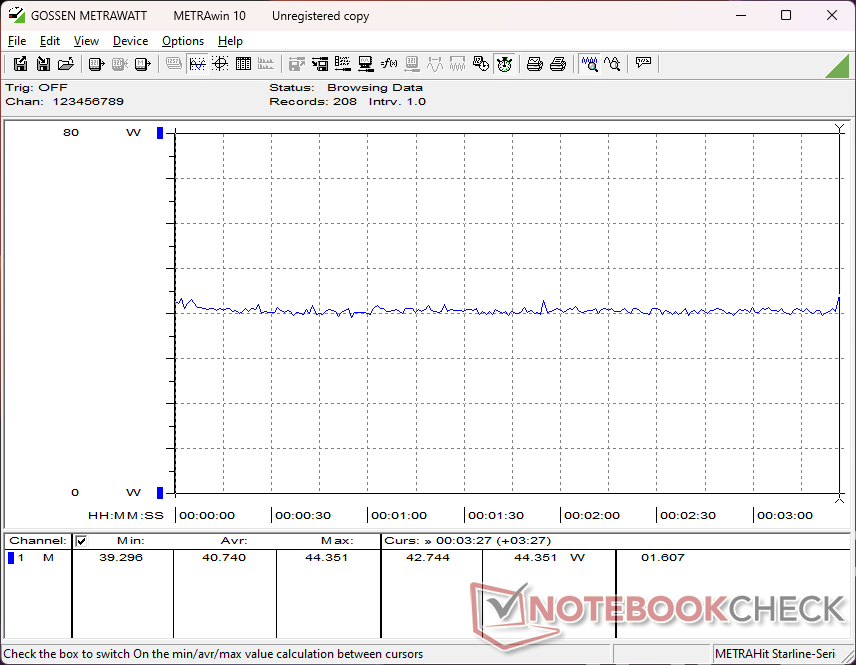
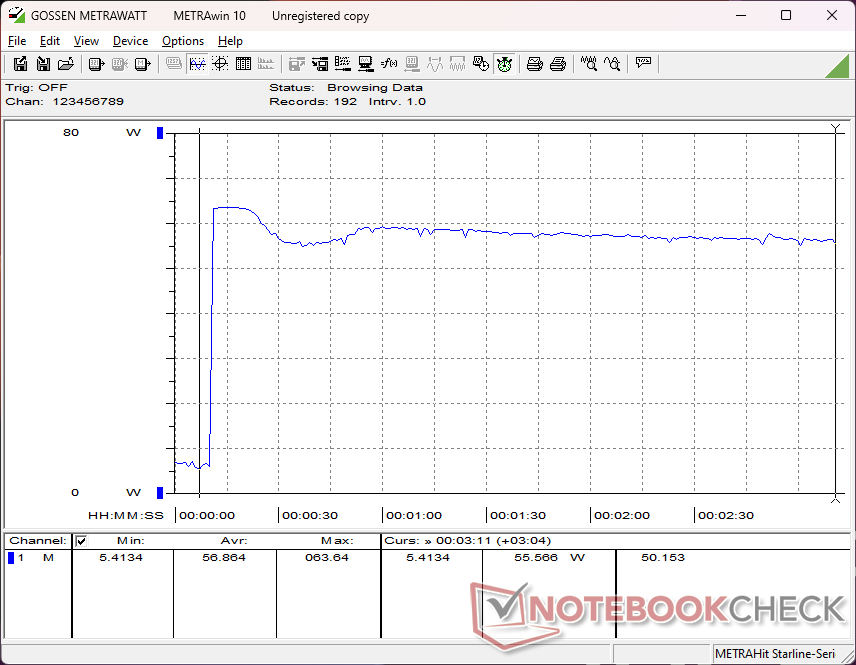
Die Stromverbrauchsmessungen zeigen einige interessante Ergebnisse im Vergleich zum Core Ultra 7 XPS 13. Bei mittlerer oder geringer Last benötigt unser Snapdragon XPS 13 durchweg weniger Strom als die Intel-Version, was den Weg für eine längere Akkulaufzeit ebnet, wie im nächsten Abschnitt erläutert wird. Bei anspruchsvolleren Aufgaben wie Spielen ist der durchschnittliche Verbrauch mit jeweils rund 40 W jedoch ungefähr gleich, obwohl der Core Ultra 7 im Allgemeinen eine schnellere Grafikleistung bietet.
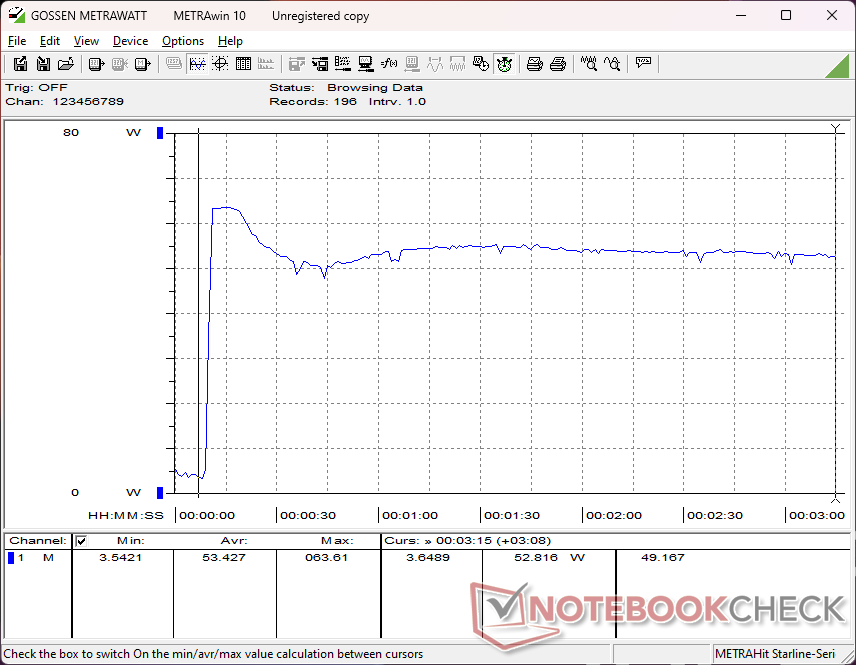
Der Verbrauch bei der Ausführung von Prime95 zur Belastung der CPU zeigt, dass das Snapdragon-Modell im Durchschnitt mehr Strom benötigt als das Intel-Modell, da letzteres mit der Zeit stärker gedrosselt wird. Andererseits liegt der Verbrauch bei der Ausführung von FurMark zur Beanspruchung der GPU im Durchschnitt bei nur 18 W, verglichen mit 34 W oder mehr beim Intel-Modell. Dies deutet darauf hin, dass Qualcomm möglicherweise weniger Fläche oder Siliziumbudget für sein integriertes GPU-Design verwendet als die konkurrierende Arc 8-Serie, die im Durchschnitt sowohl leistungsstärker als auch anspruchsvoller ist.
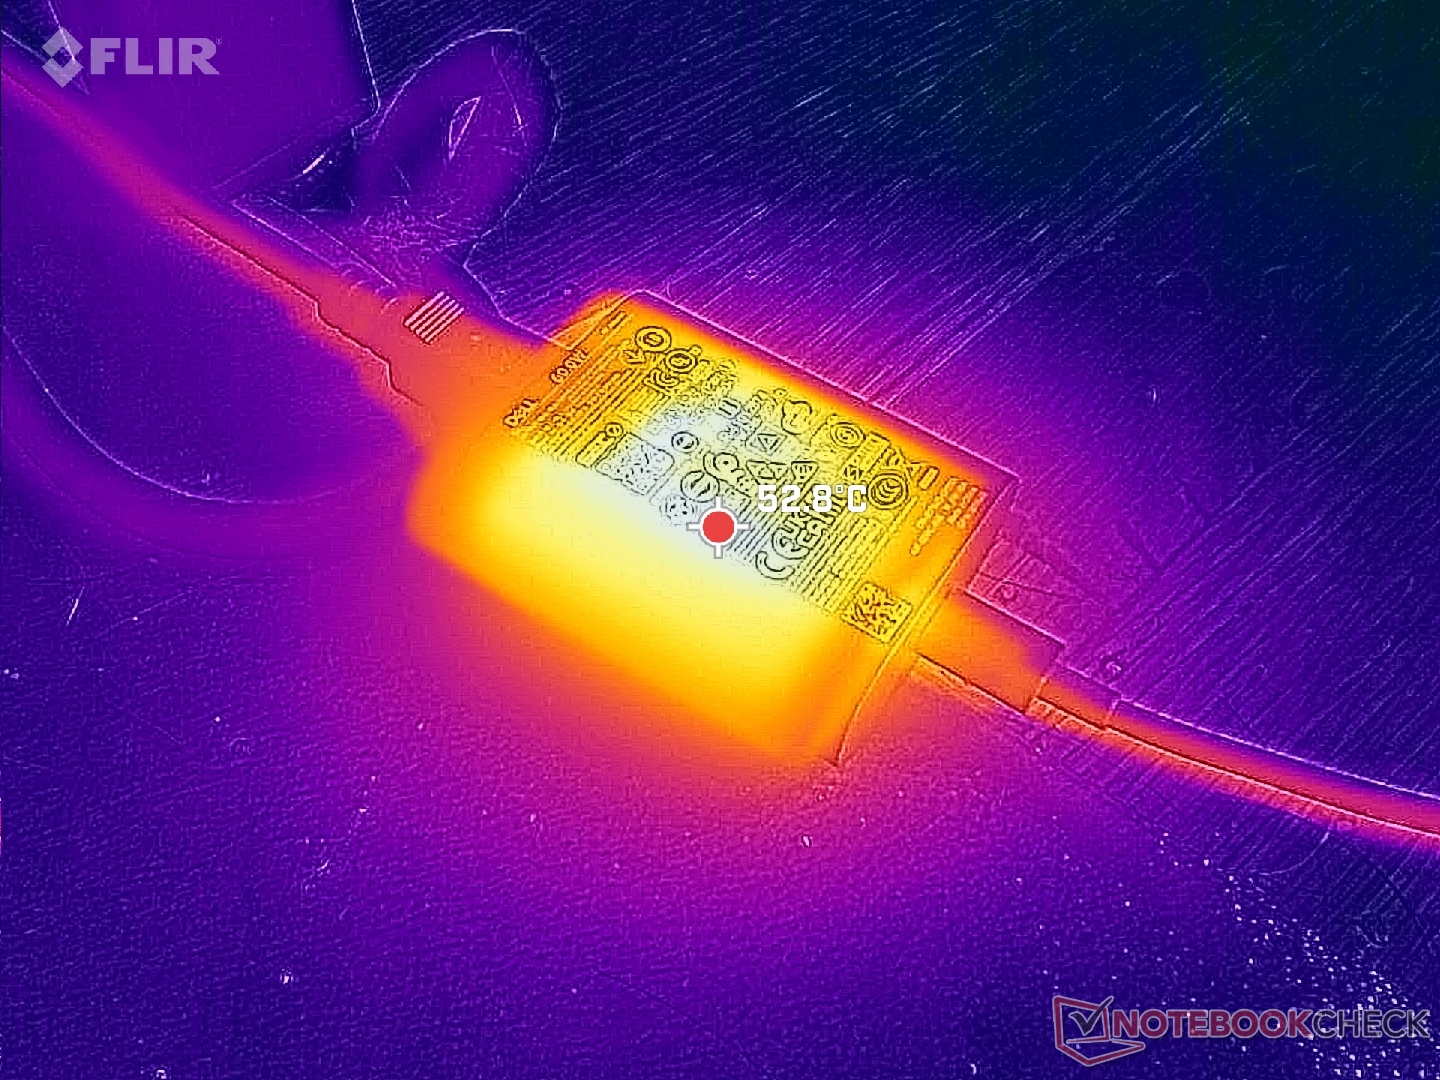
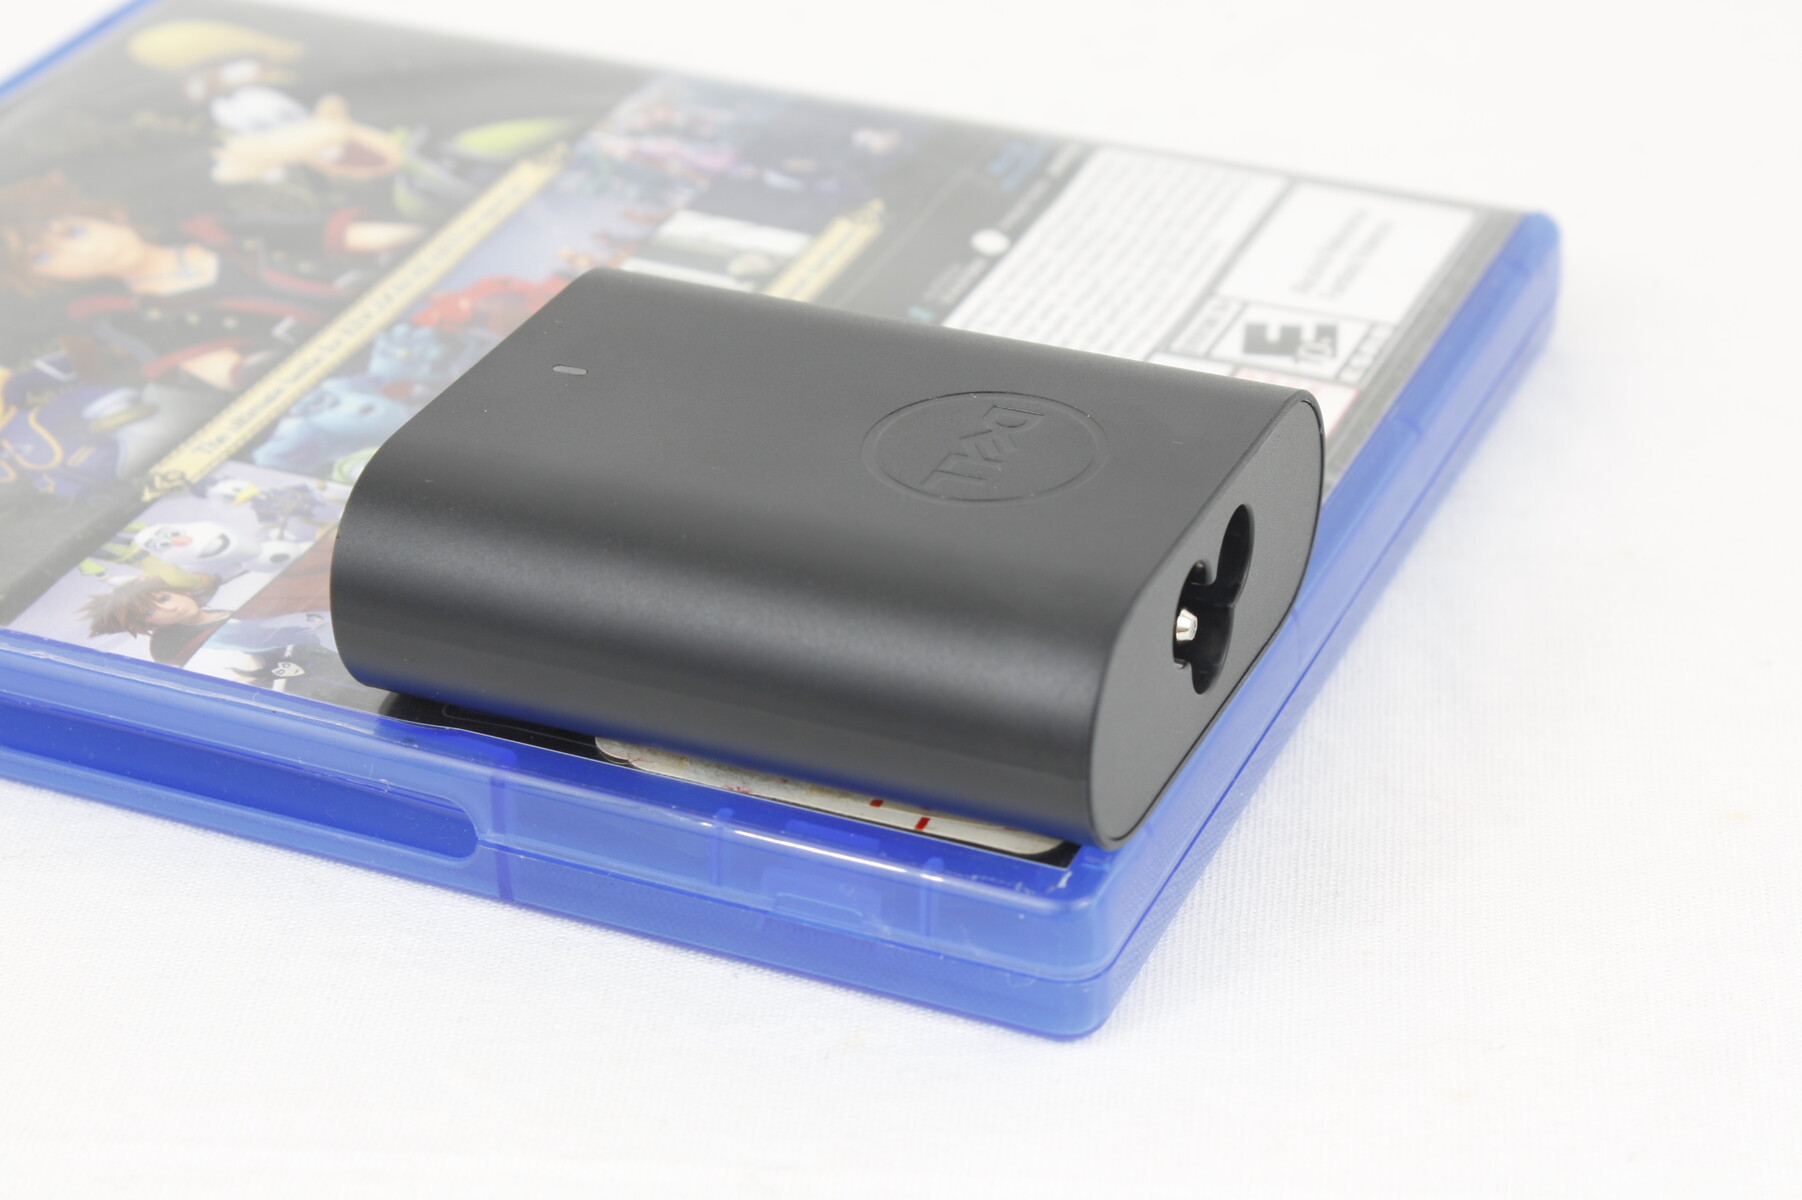
Das besonders kleine (~6,5 x 5,5 x 2,3 cm) 65-W-USB-C-Netzteil wie beim Intel-Modell kann den maximalen Verbrauch von 64 W erreichen.
| Aus / Standby | |
| Idle | |
| Last |
|
Legende:
min: | |
| Dell XPS 13 9345 SD X Elite X1E-80-100, Adreno X1-85 3.8 TFLOPS, , IPS, 1920x1200, 13.4" | Dell XPS 13 9340 Core Ultra 7 Ultra 7 155H, Arc 8-Core, Micron 2550 512GB, IPS, 1920x1200, 13.4" | Microsoft Surface Laptop 7 13.8 Copilot+ SD X Elite X1E-80-100, Adreno X1-85 3.8 TFLOPS, Samsung MZ9L4512HBLU-00BMV, IPS, 2304x1536, 13.8" | Lenovo ThinkBook 13x G4 21KR0008GE Ultra 5 125H, Arc 7-Core, Samsung PM9C1a MZAL8512HDLU, IPS, 2880x1920, 13.5" | HP EliteBook Ultra G1q 14 SD X Elite X1E-78-100, Adreno X1-85 3.8 TFLOPS, SK hynix PC801 HFS512GEJ9X101N BF, IPS, 2240x1400, 14" | Asus ZenBook S13 OLED UX5304 i7-1355U, Iris Xe G7 96EUs, Samsung PM9A1 MZVL21T0HCLR, OLED, 2880x1800, 13.3" | |
|---|---|---|---|---|---|---|
| Stromverbrauch | -27% | 11% | -48% | 11% | -43% | |
| Idle min * (Watt) | 2.8 | 3.8 -36% | 1.4 50% | 5.4 -93% | 2.5 11% | 5.8 -107% |
| Idle avg * (Watt) | 4.9 | 7 -43% | 6.3 -29% | 7.8 -59% | 5.7 -16% | 8.5 -73% |
| Idle max * (Watt) | 5.7 | 7.3 -28% | 7.6 -33% | 8.9 -56% | 5.8 -2% | 8.8 -54% |
| Last avg * (Watt) | 40.6 | 52.6 -30% | 26.9 34% | 49.4 -22% | 24.2 40% | 35.1 14% |
| Cyberpunk 2077 ultra external monitor * (Watt) | 39.4 | 26.8 32% | ||||
| Cyberpunk 2077 ultra * (Watt) | 40.7 | 38.5 5% | 33.5 18% | |||
| Last max * (Watt) | 64 | 62.7 2% | 40.7 36% | 68.8 -8% | 66.4 -4% | 59.5 7% |
| Witcher 3 ultra * (Watt) | 38.3 | 44.4 | 23.1 | 27.6 |
* ... kleinere Werte sind besser
Energieverbrauch Cyberpunk / Stresstest
Energieverbrauch externer Monitor
Akkulaufzeit
Wenn es eine Sache gibt, in der das System eindeutig glänzt, dann ist es die Akkulaufzeit. Wir konnten eine reale WLAN-Browsing-Laufzeit von fast 26,5 Stunden messen. Das ist mehr als doppelt so lang wie beim XPS 13 9340 mit dem Core Ultra 7 155H und dem identischen 1200p-IPS-Display. Auch wenn die Laufzeiten bei Verwendung des OLED-Panels kürzer ausfallen werden, bleiben sie dennoch außergewöhnlich lang und zählen zu den besten aller 13-Zoll-Subnotebooks, sogar im Vergleich zur MacBook Air-Serie.
Unser Test wurde nach der Anwendung des neuesten BIOS-Updates von Dell durchgeführt, das speziell zur Verbesserung der Akkulaufzeit des Snapdragon-Modells entwickelt wurde. Wir empfehlen, das Update hier zu installieren.
Der Ladevorgang von leer auf 100 % dauert etwas mehr als 90 Minuten, was bei den meisten Laptops üblich ist.
| Dell XPS 13 9345 SD X Elite X1E-80-100, Adreno X1-85 3.8 TFLOPS, 55 Wh | Dell XPS 13 9340 Core Ultra 7 Ultra 7 155H, Arc 8-Core, 55 Wh | Microsoft Surface Laptop 7 13.8 Copilot+ SD X Elite X1E-80-100, Adreno X1-85 3.8 TFLOPS, 54 Wh | Lenovo ThinkBook 13x G4 21KR0008GE Ultra 5 125H, Arc 7-Core, 74 Wh | HP EliteBook Ultra G1q 14 SD X Elite X1E-78-100, Adreno X1-85 3.8 TFLOPS, 59 Wh | Asus ZenBook S13 OLED UX5304 i7-1355U, Iris Xe G7 96EUs, 63 Wh | |
|---|---|---|---|---|---|---|
| Akkulaufzeit | 34% | -8% | 17% | 1% | 42% | |
| Idle (h) | 46.4 | 20.4 -56% | ||||
| WLAN (h) | 26.4 | 12.8 -52% | 14.2 -46% | 11.4 -57% | 13.2 -50% | 11.3 -57% |
| Last (h) | 1 | 2.2 120% | 1.3 30% | 1.9 90% | 2.1 110% | 2.4 140% |
| H.264 (h) | 17.6 | 19.7 | 20.5 | 13.8 |
Pro
Contra
Fazit — Solide Alternative zum Intel XPS 13
Das 1.300 Euro Snapdragon XPS 13 ist etwas günstiger als das Core Ultra 7 XPS 13, bietet aber eine deutlich längere Akkulaufzeit, Co-Pilot+ Integration und identische Hardwarefunktionen. Allerdings ist die tatsächliche Nutzererfahrung stark von der Art der Benutzung und den genutzten Anwendungen abhängig. Wird das Notebook hauptsächlich für Websurfen, Textverarbeitung, Videos und Streaming verwendet, erweist sich das Snapdragon XPS 13 als tendenziell effizienter, insbesondere wenn die Programme nativ auf ARM laufen können. Anspruchsvollere Aufgaben wie Grafikbearbeitung, Videokodierung, Thunderbolt-Docking oder spezielle Anwendungen, die auf ARM emuliert werden müssen, sind hingegen besser für das traditionelle Intel XPS 13 geeignet. Das Intel-Modell bietet ein vorhersehbareres Leistungsniveau in allen Einsatzszenarien, was die wenigen Situationen, in denen das Snapdragon-Modell Vorteile haben könnte, wohl aufwiegt.
The Snapdragon XPS 13 stellt eine attraktive Alternative zum Intel XPS 13 dar, insbesondere im Hinblick auf das Preis-Leistungs-Verhältnis. Das Benutzererlebnis hängt jedoch stark davon ab, welche Anwendungen und Aufgaben Sie mit dem System durchführen möchten.
Die Vorteile in Bezug auf Akkulaufzeit und die Integration von Co-Pilot+ könnten möglicherweise nicht ausreichen, um Käufer zu überzeugen, wenn die Akkulaufzeit des Intel XPS 13 bereits gut ist und Co-Pilot+ in Zukunft auch für Intel- und AMD-CPUs verfügbar sein wird. Nutzer, die jedoch die Laufzeiten maximieren und die neuesten KI-Funktionen von Microsoft nutzen möchten, könnten das Snapdragon XPS 13 als produktivere Option ansehen.
Preis und Verfügbarkeit
Dell bietet das XPS 13 9345 jetzt in Konfigurationen an, die von 1.400 Euro bis über 1.800 Euro reichen, abhängig davon, ob es mit dem OLED-Panel ausgestattet ist.
Hinweis: Wir haben unser Rating-System kürzlich aktualisiert und die Ergebnisse von Version 8 sind nicht mit den Ergebnissen von Version 7 vergleichbar. Weitere Informationen dazu sind hier verfügbar.
Note: We have recently updated our rating system and the results of version 8 are not comparable with the results of version 7. More information is available here .
Dell XPS 13 9345
- 04.08.2024 v8
Allen Ngo
 Total Sustainability Score:
 Transparenz
Die Auswahl der zu testenden Geräte erfolgt innerhalb der Redaktion. Das vorliegende Testmuster wurde dem Autor vom Hersteller oder einem Shop zu Testzwecken leihweise zur Verfügung gestellt. Eine Einflussnahme des Leihstellers auf den Testbericht gab es nicht, der Hersteller erhielt keine Version des Reviews vor der Veröffentlichung. Es bestand keine Verpflichtung zur Publikation. Als eigenständiges, unabhängiges Unternehmen unterliegt Notebookcheck keiner Diktion von Herstellern, Shops und Verlagen.
So testet Notebookcheck
Pro Jahr werden von Notebookcheck hunderte Laptops und Smartphones unabhängig in von uns standardisierten technischen Verfahren getestet, um eine Vergleichbarkeit aller Testergebnisse zu gewährleisten. Seit rund 20 Jahren entwickeln wir diese Testmethoden kontinuierlich weiter und setzen damit Branchenstandards. In unseren Testlaboren kommt ausschließlich hochwertiges Messequipment in die Hände erfahrener Techniker und Redakteure. Die Tests unterliegen einer mehrstufigen Kontrolle. Unsere komplexe Gesamtbewertung basiert auf hunderten fundierten Messergebnissen und Benchmarks, womit Ihnen Objektivität garantiert ist. Weitere Informationen zu unseren Testmethoden gibt es hier.
Preisvergleich

