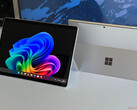
Microsoft Surface Pro OLED Copilot+ im Test - High-End-Convertible jetzt mit Snapdragon X Elite
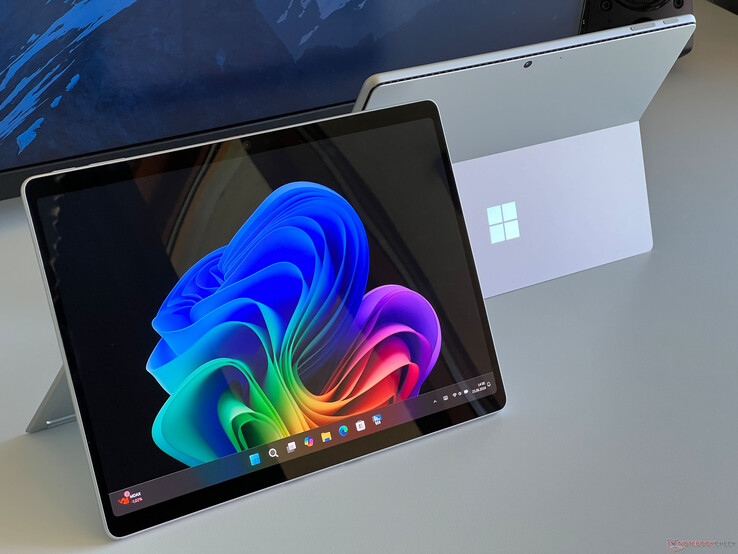
Microsoft hat sein High-End-Convertible Surface Pro aktualisiert und stattet es in der nun 11. Generation mit den Snapdragon-X-SoCs von Qualcomm aus. Grundsätzlich ist ein Surface Pro mit einem ARM-Prozessor nicht neues und seit dem Surface Pro 9 wurden Intel- und ARM-Modelle parallel angeboten. Das ist nun nicht mehr der Fall, denn das neue Surface Pro Copilot+ ist nicht mehr mit Intel-Chips verfügbar. Ein wichtiger Unterschied zum alten ARM-Modell ist allerdings, dass die neuen Snapdragon-X-Modelle nicht passiv gekühlt werden können.
Es gibt zwei Grundvarianten des neuen Surface Pro Copilot+, wobei die Basisversion mit Snapdragon X Plus in Verbindung mit einem IPS-Panel ausgestattet ist und mit 16 GB RAM sowie einer 512 GB großen SSD für 1.199 Euro angeboten wird. Ab 1.799 Euro gibt es den schnelleren Snapdragon X Elite (X1E-80-100) in Kombination mit einem hochauflösenden OLED-Touchscreen, die Speicherausstattung liegt aber weiter bei 16 GB RAM sowie einer 512-GB-SSD. Für 1.999 Euro gibt es dann eine größere 1-TB-SSD und für 2.449 Euro eine Verdoppelung des Arbeitsspeichers auf 32 GB RAM.
Preisvergleich
Mögliche Konkurrenten im Vergleich
Bew. | Version | Datum | Modell | Gewicht | Dicke | Größe | Auflösung | Preis ab |
|---|---|---|---|---|---|---|---|---|
| 82.5 % | v8 | 06 / 2024 | Microsoft Surface Pro OLED Copilot+ SD X Elite X1E-80-100, Adreno X1-85 3.8 TFLOPS | 870 g | 9.3 mm | 13.00" | 2880x1920 | |
| 85.7 % v7 (old) | v7 (old) | 04 / 2024 | Minisforum V3 R7 8840U, Radeon 780M | 928 g | 9.8 mm | 14.00" | 2560x1600 | |
| 88.2 % v7 (old) | v7 (old) | 10 / 2023 | Asus ROG Flow X13 GV302XV R9 7940HS, GeForce RTX 4060 Laptop GPU | 1.3 kg | 18.7 mm | 13.40" | 2560x1600 | |
| 88.3 % v7 (old) | v7 (old) | 04 / 2024 | Dell Latitude 9450 2-in-1 Ultra 7 165U, Graphics 4-Core iGPU (Arrow Lake) | 1.6 kg | 16.28 mm | 14.00" | 2560x1600 | |
| 90.5 % v7 (old) | v7 (old) | 04 / 2024 | Lenovo Yoga 9 2-in-1 14IMH9 Ultra 7 155H, Arc 8-Core | 1.3 kg | 15.9 mm | 14.00" | 2880x1800 | |
| 87.8 % v7 (old) | v7 (old) | 03 / 2024 | Samsung Galaxy Book4 Pro 360 Ultra 5 125H, Arc 7-Core | 1.7 kg | 13 mm | 16.00" | 2880x1800 |
Hinweis: Wir haben unser Rating-System aktualisiert und die Ergebnisse von Version 8 sind nicht vergleichbar mit den Ergebnissen von Version 7. Weitere Informationen dazu sind hier verfügbar.
Gehäuse - Surface Pro mit bekannter Metall-Hülle
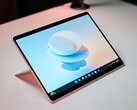
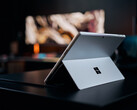
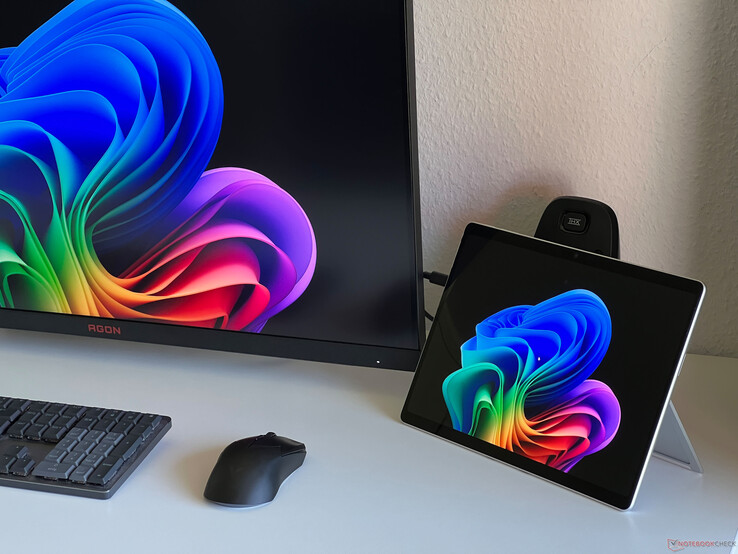
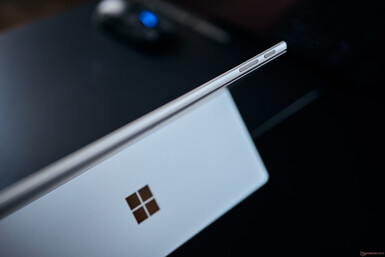
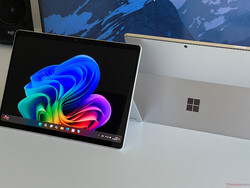
Microsoft hat das Gehäuse des Surface Pro nicht verändert. nach wie vor kommt eine sehr hochwertige und stabile Metallhülle zum Einsatz. Die Kombination aus silberfarbener Hülle und dem schwarzen Bildschirm (samt Bildschirmrändern) ergibt einen ansehnlichen Kontrast. Zusätzlich steht das Convertible noch in den Farben Schwarz, Graubeige oder Saphirblau zur Verfügung.
Qualitativ ist das Convertible nach wie vor sehr gut, vor allem die Stabilität ist sehr gut. Es gibt keinerlei Knarzgeräusche und Bildfehler sind aufgrund des eingesetzten OLED-Panels sowieso kein Thema (bei der IPS-Variante gibt es aber auch keine Probleme diesbezüglich). Mit dem integrierten Kickstand sind wir nach wie vor nicht vollkommen zufrieden. Einerseits ist das Material sehr dünn, weshalb man es sogar win wenig verformen kann. Zudem stört die dünne Kante auch schnell, wenn man das Convertible beispielsweise auf den Oberschenkeln abstellt. In den Scharnieren ist auch nach wie vor noch etwas Spiel, was aber schon immer ein Problem des Surface Pro war.
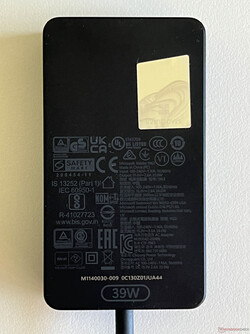
Das Tablet allein wiegt 870 Gramm und ist 9,3 mm dünn, was natürlich ein Vorteil gegenüber Convertibles mit festen Tastaturen darstellt. Wenn man allerdings eine Tastatur (~350 Gramm) ansteckt, ist dieser Vorteil nicht mehr so groß. Das kompakte 39-Watt-Netzteil bringt 213 Gramm auf die Waage.
Ausstattung - ARM-Surface mit USB 4
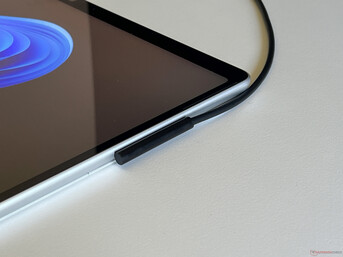
Bei den Anschlüssen kommen zwei USB-C-Anschlüsse (4.0) auf der linken Seite sowie der bekannte Surface-Connect-Anschluss auf der rechten Seite, über den das Convertible auch standardmäßig geladen wird (Laden via USB-C ist natürlich auch möglich). Auf der Unterseite stehen dann noch die Anschlüsse für die optionalen Tastaturcover zur Verfügung. Einen SD-Kartenleser bietet das Surface Pro nicht.
Wir haben das neue Surface Pro zwischendurch auch an einem Monitor mit KVM-Switch genutzt und konnten hier problemlos die verbundenen Eingabegeräte sowie USB-Geräte verwenden.
Kommunikation
Der Qualcomm-SoC bietet standardmäßig ein modernes Wi-Fi-7-Modul (Fast Connect 7800) inklusive Bluetooth 5.4. Die Transferraten in Verbindung mit unserem Referenzrouter von Asus sind die Transferraten sehr hoch und stabil. Wir hatten im Alltag auch keine Probleme mit der Signalqualität. 5G-Modelle des neuen Surface Pro sind laut Microsoft im Laufe des Jahres erhältlich.
| Networking | |
| Microsoft Surface Pro OLED Copilot+ | |
| iperf3 transmit AXE11000 | |
| iperf3 receive AXE11000 | |
| Minisforum V3 | |
| iperf3 transmit AXE11000 | |
| iperf3 receive AXE11000 | |
| iperf3 transmit AXE11000 6GHz | |
| iperf3 receive AXE11000 6GHz | |
| Asus ROG Flow X13 GV302XV | |
| iperf3 transmit AXE11000 | |
| iperf3 receive AXE11000 | |
| iperf3 transmit AXE11000 6GHz | |
| iperf3 receive AXE11000 6GHz | |
| Dell Latitude 9450 2-in-1 | |
| iperf3 transmit AXE11000 | |
| iperf3 receive AXE11000 | |
| iperf3 transmit AXE11000 6GHz | |
| iperf3 receive AXE11000 6GHz | |
| Lenovo Yoga 9 2-in-1 14IMH9 | |
| iperf3 transmit AXE11000 | |
| iperf3 receive AXE11000 | |
| iperf3 transmit AXE11000 6GHz | |
| iperf3 receive AXE11000 6GHz | |
| Samsung Galaxy Book4 Pro 360 | |
| iperf3 transmit AXE11000 | |
| iperf3 receive AXE11000 | |
| Microsoft Surface Pro 9, i7-1255U | |
| iperf3 transmit AXE11000 6GHz | |
| iperf3 receive AXE11000 6GHz | |
| Microsoft Surface Pro 9, ARM | |
| iperf3 transmit AXE11000 6GHz | |
| iperf3 receive AXE11000 6GHz | |
Webcam
Das Surface Pro war schon immer mit guten Kameras ausgestattet und auch die 11. Generation macht hier keine Ausnahme. Auf der Vorderseite ist eine 12,2-MP-Kamera verbaut, die Bilder mit 4.032 x 3.024 Pixeln im Format 4:3 oder aber mit 8,3 MP im Format 16:9 aufnimmt (3.840 x 2.160 Pixel). Videos können hier maximal in der 1440p-Auflösung mit 30 Bildern pro Sekunde aufgenommen werden.
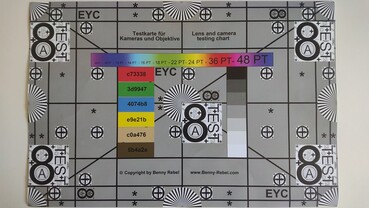
Auf der Rückseite befindet sich zudem eine 10,5-MP-Kamera mit der maximalen Auflösung von 3.736 x 2.802 Pixeln im Format 4:3 bzw. 9,3 MP im Format 16:9 (4.046 x 2.286 Pixel). Die Videoaufnahme ist maximal in 4K bei 30 Bildern pro Sekunde möglich. Die Qualität der beiden Kameras ist sehr gut und allen anderen aktuellen Laptops deutlich überlegen. Die Bilder sind sehr scharf, zudem werden auch die Farben akkurat abgebildet. Die bereits bekannten Studio-Effekte für die Webcam stehen natürlich auch auf dem Surface Pro Copilot+ zur Verfügung.
Wartung
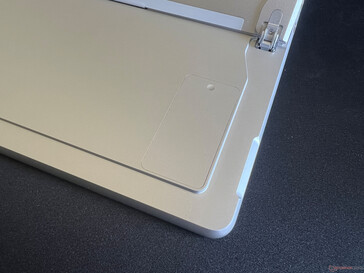
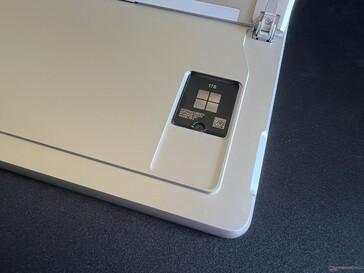
Auf der Rückseite befindet sich weiterhin eine kleine Abdeckung, über die man sehr leicht an die verbaute M.2-2230-SSD herankommt und diese auch austauschen kann. Für den Zugang zu den weiteren Komponenten muss aber das geklebte Display entfernt werden, grundsätzlich kann der verschraubte Akku im Bedarfsfall aber getauscht werden. Der Lüfter lässt sich dann ebenfalls reinigen, doch das ist natürlich recht viel Aufwand.
Garantie
Die Herstellergarantie liegt bei 12 Monaten, zusätzlich gilt in Deutschland natürlich die zweijährige gesetzliche Gewährleistung. Unter der Bezeichnung Microsoft Complete bietet der Hersteller eine Garantieverlängerung auf zwei, drei oder vier Jahre an (+149, 219 bzw. 299 Euro). Hier sind auch versehentliche Beschädigungen inkludiert. Ein Vor-Ort-Service ist nicht enthalten, das Gerät muss also eingeschickt werden.
Eingabegeräte - Neues Surface Pro Flex Keyboard
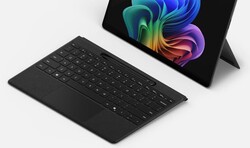
Grundsätzlich wird auch das neue Surface Pro OLED Copilot+ ohne ein Tastaturcover bzw. Stylus verkauft und bei unserem Testgerät waren auch keine Exemplare dabei. Hier ist man also auf den kapazitiven Touchscreen angewiesen, der hervorragend funktioniert. Microsoft bietet nach wie das bekannte Surface Pro Keyboard samt Slim Pen in verschiedenen Farben an, das wir auch schon in Verbindung mit dem alten Surface Pro 9 testen konnten. Der Preis für die Kombination aus Tastaturcover und Stift liegt bei 310 Euro.
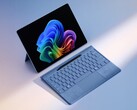
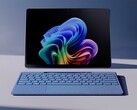
Neu ist das Surface Pro Flex Keyboard, welches stabiler sein soll und jetzt zudem auch funktioniert, ohne mechanisch mit dem Surface Pro verbunden zu sein. Das lässt sich Microsoft aber auch gut bezahlen, denn das Paket aus Tastatur (in Schwarz oder Hellblau) sowie dem Slim Pen kostet satte 530 Euro.
Display - OLED mit 120 Hz
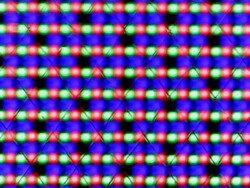
Die beiden verfügbaren Panels teilen sich viele Eigenschaften, denn es handelt sich um spiegelnde 13-Zoll-Touchscreens (Corning Gorilla Glass 5) mit einer Auflösung von 2.880 x 1.920 Pixel im Format 3:2. Das IPS-Panel ist mit einer Helligkeit von 600 Nits angegeben, was auch fast der SDR-Helligkeit des OLED-Panels in unserem Testgerät entsprechen soll. Beide Panel-Varianten sind laut Hersteller individuell kalibriert, zudem können sowohl die Helligkeit als auch die Farbtemperatur via Sensor an die Umgebung angepasst werden. Der subjektive Bildeindruck des OLED-Panels von Samsung ist grundsätzlich sehr gut und Bewegungen profitieren von der erhöhten Frequenz (120 Hz), bei hellen Flächen gibt es aber einen leichten Rastereffekt.
Unsere Messung ergibt eine maximale SDR-Helligkeit von 580 cd/m², womit die Herstellerangabe nur minimal verfehlt wird. Dennoch ist es eine deutliche Steigerung gegenüber dem alten Modell (~450 cd/m²). Zusammen mit dem geringen Schwarzwert ergibt sich zudem ein hervorragendes Kontrastverhältnis, was typisch für OLED-Panels ist. Im HDR-Betrieb messen wir bei einem kleinen Bildausschnitt bis zu 918 cd/m² bzw. bis zu 770 cd/m² bei einem fast vollständig weißen Bild. Damit hat das Surface Pro einen Vorteil gegenüber vielen anderen aktuellen OLED-Geräten, die im SDR-Betrieb oftmals nur um die 400 Nits (HDR: max. 650 Nits) erreichen. Allerdings muss der HDR-Modus bei Windows nach wie vor manuell aktiviert werden. Die Reaktionszeiten des OLED-Panels sind sehr schnell und es gibt keine technologiebedingt keine Probleme mit Lichthöfen bzw. Screen-Bleeding.
| |||||||||||||||||||||||||
Ausleuchtung: 99 %
Helligkeit Akku: 578 cd/m²
Kontrast: 14500:1 (Schwarzwert: 0.04 cd/m²)
ΔE ColorChecker Calman: 0.7 | ∀{0.5-29.43 Ø4.78}
ΔE Greyscale Calman: 0.6 | ∀{0.09-98 Ø5}
89.5% AdobeRGB 1998 (Argyll 3D)
99.4% sRGB (Argyll 3D)
98.9% Display P3 (Argyll 3D)
Gamma: 2.16
CCT: 6484 K
| Microsoft Surface Pro OLED Copilot+ ATNA30DW01-1, OLED, 2880x1920, 13" | Minisforum V3 BOE, NE140QDM-NY1, IPS, 2560x1600, 14" | Asus ROG Flow X13 GV302XV TL134ADXP01-0, IPS, 2560x1600, 13.4" | Dell Latitude 9450 2-in-1 AU Optronics B140QAN, IPS, 2560x1600, 14" | Lenovo Yoga 9 2-in-1 14IMH9 LEN140WQ+, OLED, 2880x1800, 14" | Samsung Galaxy Book4 Pro 360 ATNA60CL09-0, OLED, 2880x1800, 16" | Microsoft Surface Pro 9, i7-1255U LP129WT2-SPA6, IPS, 2880x1920, 13" | |
|---|---|---|---|---|---|---|---|
| Display | -2% | -3% | -10% | 4% | 3% | -20% | |
| Display P3 Coverage (%) | 98.9 | 97.7 -1% | 95.1 -4% | 80.6 -19% | 99.8 1% | 99.9 1% | 65.6 -34% |
| sRGB Coverage (%) | 99.4 | 99.8 0% | 99.7 0% | 100 1% | 100 1% | 100 1% | 97.7 -2% |
| AdobeRGB 1998 Coverage (%) | 89.5 | 85.4 -5% | 84.4 -6% | 80.1 -11% | 97.3 9% | 96.6 8% | 67.7 -24% |
| Response Times | -2152% | -1202% | -12282% | -111% | -35% | -3604% | |
| Response Time Grey 50% / Grey 80% * (ms) | 0.32 ? | 10 ? -3025% | 4.79 ? -1397% | 59.6 ? -18525% | 0.8 ? -150% | 0.49 ? -53% | 13 ? -3963% |
| Response Time Black / White * (ms) | 0.58 ? | 8 ? -1279% | 6.42 ? -1007% | 35.6 ? -6038% | 1 ? -72% | 0.67 ? -16% | 19.4 ? -3245% |
| PWM Frequency (Hz) | 480 ? | 240.5 ? | 240 ? | 29896 ? | |||
| PWM Amplitude * (%) | 25 | ||||||
| Bildschirm | -323% | -314% | -199% | -206% | -47% | -171% | |
| Helligkeit Bildmitte (cd/m²) | 580 | 512 -12% | 473 -18% | 501.4 -14% | 371.6 -36% | 387 -33% | 455 -22% |
| Brightness (cd/m²) | 581 | 495 -15% | 445 -23% | 491 -15% | 373 -36% | 392 -33% | 453 -22% |
| Brightness Distribution (%) | 99 | 91 -8% | 89 -10% | 88 -11% | 99 0% | 98 -1% | 94 -5% |
| Schwarzwert * (cd/m²) | 0.04 | 0.48 -1100% | 0.39 -875% | 0.32 -700% | 0.38 -850% | ||
| Kontrast (:1) | 14500 | 1067 -93% | 1213 -92% | 1567 -89% | 1197 -92% | ||
| Delta E Colorchecker * | 0.7 | 4.32 -517% | 3.3 -371% | 2.52 -260% | 4.91 -601% | 1 -43% | 1.7 -143% |
| Colorchecker dE 2000 max. * | 2.1 | 7.04 -235% | 8.93 -325% | 4.87 -132% | 8.33 -297% | 1.9 10% | 3.8 -81% |
| Delta E Graustufen * | 0.6 | 4.22 -603% | 5.4 -800% | 2.8 -367% | 2.2 -267% | 1.7 -183% | 1.5 -150% |
| Gamma | 2.16 102% | 2.31 95% | 2.11 104% | 2.17 101% | 2.25 98% | 2.25 98% | 2.17 101% |
| CCT | 6484 100% | 6770 96% | 7540 86% | 6270 104% | 6120 106% | 6325 103% | 6761 96% |
| Colorchecker dE 2000 calibrated * | 4.17 | 1.09 | 0.45 | 1.59 | 1.5 | ||
| Durchschnitt gesamt (Programm / Settings) | -826% /
-530% | -506% /
-379% | -4164% /
-2014% | -104% /
-132% | -26% /
-31% | -1265% /
-664% |
* ... kleinere Werte sind besser
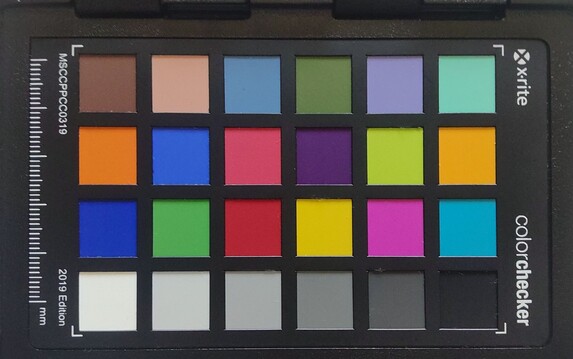
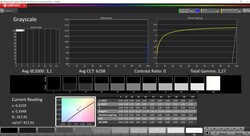
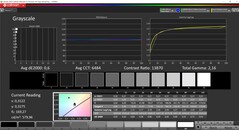
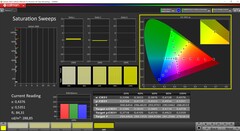
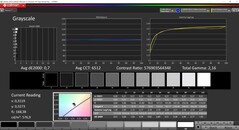
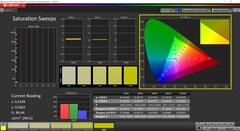
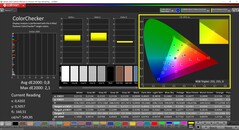
Wir haben das Panel mit der professionellen CalMAN-Software analysiert und standardmäßig ist das Profil Vivid aktiv, welches den P3-Farbraum abdeckt. Zusätzlich steht aber auch noch ein sRGB-Profil zur Verfügung und beide Profile sind erfreulicherweise bereits sehr gut kalibriert, denn es gibt weder einen Farbstich noch einzelne Farben, die den wichtigen Zielwert von 3 überschreiten. Zusammen mit der fast vollständigen Abdeckung der beiden Farbräume lässt sich das neue Surface Pro OLED bedenkenlos für die Bearbeitung von Bildern/Videos nutzen. Wir konnten das Display nicht kalibrieren, da unsere Kalibrierungssoftware (i1 Profiler) derzeit nicht mit der ARM-Version von Windows kompatibel ist.
Reaktionszeiten (Response Times) des Displays
| ↔ Reaktionszeiten Schwarz zu Weiß | ||
|---|---|---|
| 0.58 ms ... steigend ↗ und fallend ↘ kombiniert | ↗ 0.29 ms steigend | |
| ↘ 0.29 ms fallend | ||
| Die gemessenen Reaktionszeiten sind sehr kurz, wodurch sich der Bildschirm auch für schnelle 3D Spiele eignen sollte. Im Vergleich rangierten die bei uns getesteten Geräte von 0.1 (Minimum) zu 240 (Maximum) ms. » 1 % aller Screens waren schneller als der getestete. Daher sind die gemessenen Reaktionszeiten besser als der Durchschnitt aller vermessenen Geräte (20.2 ms). | ||
| ↔ Reaktionszeiten 50% Grau zu 80% Grau | ||
| 0.32 ms ... steigend ↗ und fallend ↘ kombiniert | ↗ 0.17 ms steigend | |
| ↘ 0.15 ms fallend | ||
| Die gemessenen Reaktionszeiten sind sehr kurz, wodurch sich der Bildschirm auch für schnelle 3D Spiele eignen sollte. Im Vergleich rangierten die bei uns getesteten Geräte von 0.165 (Minimum) zu 636 (Maximum) ms. » 0 % aller Screens waren schneller als der getestete. Daher sind die gemessenen Reaktionszeiten besser als der Durchschnitt aller vermessenen Geräte (31.6 ms). | ||
Bildschirm-Flackern / PWM (Pulse-Width Modulation)
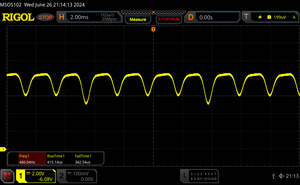
| Flackern / PWM festgestellt | 480 Hz Amplitude: 25 % | ≤ 69 % Helligkeit | |
Das Display flackert mit 480 Hz (im schlimmsten Fall, eventuell durch Pulsweitenmodulation PWM) bei einer eingestellten Helligkeit von 69 % und darunter. Darüber sollte es zu keinem Flackern kommen. Die Frequenz von 480 Hz ist relativ hoch und sollte daher auch bei den meisten Personen zu keinen Problemen führen. Empfindliche User sollen laut Berichten aber sogar noch bei 500 Hz und darüber ein Flackern wahrnehmen. Im Vergleich: 53 % aller getesteten Geräte nutzten kein PWM um die Helligkeit zu reduzieren. Wenn PWM eingesetzt wurde, dann bei einer Frequenz von durchschnittlich 8111 (Minimum 5, Maximum 343500) Hz. | |||
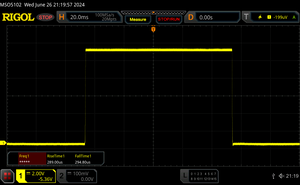
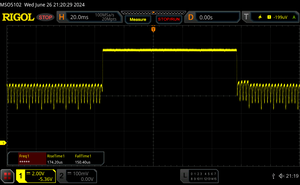
Bei der OLED-Variante des neuen Surface Pro kommt PWM-Flackern zum Einsatz. Bei der maximalen Helligkeit können wir es nicht messen, im Bereich von 70-99 % ermitteln wir DC-Dimming mit einer Frequenz von 120 Hz, welches potenziell weniger schädlich ist als traditionelles PWM. Dieses kommt dann mit einer Frequenz von 480 Hz bei Helligkeitswerten von 69 % und weniger zum Einsatz. Wer sensibel auf PWM-Flackern reagiert sollte daher lieber zur IPS-Variante des Surface Pro Copilot+ greifen.
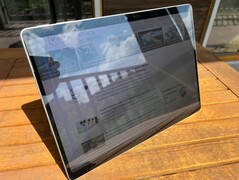
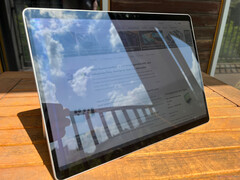
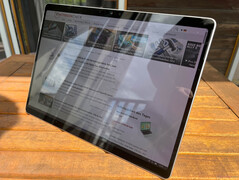
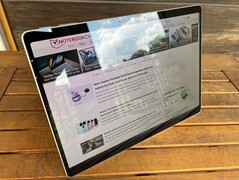
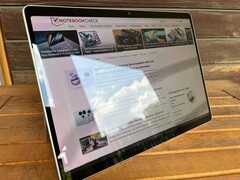
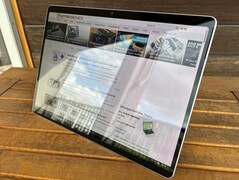
Der Bildschirm des Surface Pro spiegelt sehr stark und auch in Innenräumen kann es schnell zu störenden Reflexionen kommen. Die gesteigerte Helligkeit in Verbindung mit dem hohen Kontrastverhältnis des OLED-Panels helfen ein wenig, an sonnigen bzw. sehr hellen Tagen wird es aber dennoch schwierig, komfortabel im Freien zu arbeiten. Bei der Blickwinkelstabilität gibt es - abgesehen von dem leichten Blauschleier bei großen Winkeln (typisch für OLEDs) - keine Einschränkungen.
Leistung - Snapdragon X Elite mit Dual-Core Turbo
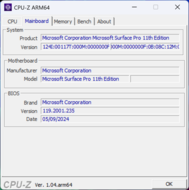
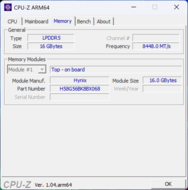
Das IPS-Modell des neuen Surface Pro Copilot+ ist mit dem Snapdragon X Plus (X1P-64-100) ausgestattet, bei der OLED-Variante kommt immer der stärkere Snapdragon X Elite (X1E-80-100) samt Dual-Core-Turbo zum Einsatz. Beim RAM stehen entweder 16 oder 32 GB des schnellen LPDDR5x-8448-Speichers zur Verfügung.
Wir haben versucht, unseren üblichen Testparcours durchzuführen, mit der ARM-Version von Windows gibt es aber Kompatibilitätsprobleme bei einigen Programmen. Im Task-Manager wird unter der Rubrik Details ebenfalls angezeigt, ob es sich um eine native ARM-App oder eine emulierte App handelt.
Testbedingungen
Die Surface-Geräte bieten grundsätzlich keine eigenen Energieprofile, sondern lediglich die Windows-Profile. Diese haben bei den Microsoft-Geräten aber eine andere Bezeichnung im Vergleich zu anderen Windows-Laptops. Neben Beste Leistung stehen noch Bessere Leistung (entspricht Ausbalanciert) sowie Empfohlen (entspricht Beste Energieeffizienz) zur Verfügung. Wir haben die nachfolgenden Benchmarks und Tests im Modus Beste Leistung durchgeführt. Offizielle TDP-Angaben für das neue Surface Pro 11 gibt es nicht, basierend auf unseren Verbrauchsmessungen gehen wir aber von 23 bis maximal 30 Watt aus.
Prozessor - Snapdragon X1E-80-100
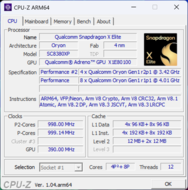
In unserem Testgerät ist der Snapdragon X Elite X1E-80-100 verbaut, der 12 Kerne mit einem Takt von 3,4 GHz sowie einem Dual-Core Turbo von 4,0 GHz bietet. Weitere technische Details sowie Effizienzmessungen zum neuen ARM-Prozessor stehen in unserem Analyse-Artikel zur Verfügung.
Am wichtigsten sind natürlich die beiden nativen Benchmarks Geekbench sowie Cinebench 2024, wir haben aber auch die anderen CPU-Tests aus unserem üblichen Testparcours durchgeführt, damit man einen Eindruck von der Leistung bei emulierten Apps erhält. Die Multi-Core-Leistung hängt (wie auch schon bei AMD- und Intel-Geräten) vor allem von den Power Limits ab und das Surface Pro mit dem X1E-80-100 ist beispielsweise etwas langsamer als das Vivobook S 15 mit dem X1E-78-100. In den Single-Core-Tests profitiert das Convertible allerdings von dem Dual-Core-Turbo und biete eine Mehrleistung von rund 15 %. Auch der aktuelle AMD Ryzen 7 8840U im Minisforum V3 wird sowohl in den Single- als auch Multi-Core-Tests deutlich klar geschlagen.
Cinebench R15 Multi Dauertest
Im Vergleich zum alten Surface Pro mit dem Intel Core i7-1255U ist die Leistung selbst in den emulierten Tests besser und die alte ARM-Variante mit dem Snapdragon 8cx Gen3 hat überhaupt keine Chance gegen den neuen Snapdragon X Elite. Bei dauerhafter Belastung bleibt die CPU-Leistung nicht vollkommen stabil, wobei das in längeren Tests wie Cinebench 2024 bereits bei einem Durchlauf zum Tragen kommt. Der kurze R15-Test zeigt aber schon im zweiten Durchlauf eine deutliche Reduzierung um rund 20 %. Im Akkubetrieb gibt es keine zusätzliche Leistungsreduzierung.
Geekbench 6.5: Multi-Core | Single-Core
Cinebench R23: Multi Core | Single Core
Cinebench R20: CPU (Multi Core) | CPU (Single Core)
Cinebench R15: CPU Multi 64Bit | CPU Single 64Bit
Blender: v2.79 BMW27 CPU
7-Zip 18.03: 7z b 4 | 7z b 4 -mmt1
Geekbench 5.5: Multi-Core | Single-Core
HWBOT x265 Benchmark v2.2: 4k Preset
LibreOffice : 20 Documents To PDF
R Benchmark 2.5: Overall mean
| Cinebench 2024 / CPU Multi Core | |
| Asus Vivobook S 15 OLED Snapdragon | |
| Microsoft Surface Pro OLED Copilot+ | |
| Durchschnittliche Qualcomm Snapdragon X Elite X1E-80-100 (621 - 927, n=7) | |
| Durchschnitt der Klasse Tablet (619 - 893, n=3, der letzten 2 Jahre) | |
| Minisforum V3 | |
| Samsung Galaxy Book4 Pro 360 | |
| Cinebench 2024 / CPU Single Core | |
| Microsoft Surface Pro OLED Copilot+ | |
| Durchschnittliche Qualcomm Snapdragon X Elite X1E-80-100 (122 - 123, n=7) | |
| Durchschnitt der Klasse Tablet (109 - 124.9, n=3, der letzten 2 Jahre) | |
| Asus Vivobook S 15 OLED Snapdragon | |
| Samsung Galaxy Book4 Pro 360 | |
| Minisforum V3 | |
| Geekbench 6.5 / Multi-Core | |
| Microsoft Surface Pro OLED Copilot+ | |
| Asus Vivobook S 15 OLED Snapdragon | |
| Durchschnittliche Qualcomm Snapdragon X Elite X1E-80-100 (7596 - 14998, n=9) | |
| Lenovo Yoga 9 2-in-1 14IMH9 | |
| Asus ROG Flow X13 GV302XV | |
| Samsung Galaxy Book4 Pro 360 | |
| Minisforum V3 | |
| Dell Latitude 9450 2-in-1 | |
| Durchschnitt der Klasse Tablet (848 - 16544, n=97, der letzten 2 Jahre) | |
| Geekbench 6.5 / Single-Core | |
| Microsoft Surface Pro OLED Copilot+ | |
| Durchschnittliche Qualcomm Snapdragon X Elite X1E-80-100 (1896 - 2845, n=9) | |
| Asus ROG Flow X13 GV302XV | |
| Minisforum V3 | |
| Asus Vivobook S 15 OLED Snapdragon | |
| Lenovo Yoga 9 2-in-1 14IMH9 | |
| Dell Latitude 9450 2-in-1 | |
| Samsung Galaxy Book4 Pro 360 | |
| Durchschnitt der Klasse Tablet (185 - 4128, n=97, der letzten 2 Jahre) | |
| Cinebench R23 / Multi Core | |
| Asus ROG Flow X13 GV302XV | |
| Lenovo Yoga 9 2-in-1 14IMH9 | |
| Minisforum V3 | |
| Asus Vivobook S 15 OLED Snapdragon | |
| Dell Latitude 9450 2-in-1 | |
| Samsung Galaxy Book4 Pro 360 | |
| Microsoft Surface Pro OLED Copilot+ | |
| Durchschnitt der Klasse Tablet (8644 - 10868, n=3, der letzten 2 Jahre) | |
| Microsoft Surface Pro 9, i7-1255U | |
| Durchschnittliche Qualcomm Snapdragon X Elite X1E-80-100 (6772 - 10792, n=7) | |
| Microsoft Surface Pro 9, ARM | |
| Cinebench R23 / Single Core | |
| Lenovo Yoga 9 2-in-1 14IMH9 | |
| Asus ROG Flow X13 GV302XV | |
| Samsung Galaxy Book4 Pro 360 | |
| Dell Latitude 9450 2-in-1 | |
| Minisforum V3 | |
| Microsoft Surface Pro 9, i7-1255U | |
| Durchschnitt der Klasse Tablet (1129 - 1921, n=3, der letzten 2 Jahre) | |
| Microsoft Surface Pro OLED Copilot+ | |
| Durchschnittliche Qualcomm Snapdragon X Elite X1E-80-100 (1273 - 1321, n=7) | |
| Asus Vivobook S 15 OLED Snapdragon | |
| Microsoft Surface Pro 9, ARM | |
| Cinebench R20 / CPU (Multi Core) | |
| Asus ROG Flow X13 GV302XV | |
| Lenovo Yoga 9 2-in-1 14IMH9 | |
| Minisforum V3 | |
| Dell Latitude 9450 2-in-1 | |
| Asus Vivobook S 15 OLED Snapdragon | |
| Samsung Galaxy Book4 Pro 360 | |
| Durchschnitt der Klasse Tablet (3252 - 4255, n=3, der letzten 2 Jahre) | |
| Microsoft Surface Pro OLED Copilot+ | |
| Microsoft Surface Pro 9, i7-1255U | |
| Durchschnittliche Qualcomm Snapdragon X Elite X1E-80-100 (2539 - 4107, n=7) | |
| Microsoft Surface Pro 9, ARM | |
| Cinebench R20 / CPU (Single Core) | |
| Asus ROG Flow X13 GV302XV | |
| Lenovo Yoga 9 2-in-1 14IMH9 | |
| Minisforum V3 | |
| Dell Latitude 9450 2-in-1 | |
| Samsung Galaxy Book4 Pro 360 | |
| Microsoft Surface Pro 9, i7-1255U | |
| Durchschnitt der Klasse Tablet (420 - 739, n=3, der letzten 2 Jahre) | |
| Microsoft Surface Pro OLED Copilot+ | |
| Durchschnittliche Qualcomm Snapdragon X Elite X1E-80-100 (470 - 495, n=7) | |
| Asus Vivobook S 15 OLED Snapdragon | |
| Microsoft Surface Pro 9, ARM | |
| Cinebench R15 / CPU Multi 64Bit | |
| Asus ROG Flow X13 GV302XV | |
| Lenovo Yoga 9 2-in-1 14IMH9 | |
| Microsoft Surface Pro OLED Copilot+ | |
| Minisforum V3 | |
| Asus Vivobook S 15 OLED Snapdragon | |
| Durchschnitt der Klasse Tablet (1651 - 2249, n=3, der letzten 2 Jahre) | |
| Durchschnittliche Qualcomm Snapdragon X Elite X1E-80-100 (1476 - 2249, n=7) | |
| Samsung Galaxy Book4 Pro 360 | |
| Dell Latitude 9450 2-in-1 | |
| Microsoft Surface Pro 9, i7-1255U | |
| Microsoft Surface Pro 9, ARM | |
| Cinebench R15 / CPU Single 64Bit | |
| Asus ROG Flow X13 GV302XV | |
| Lenovo Yoga 9 2-in-1 14IMH9 | |
| Minisforum V3 | |
| Dell Latitude 9450 2-in-1 | |
| Durchschnitt der Klasse Tablet (209 - 299, n=3, der letzten 2 Jahre) | |
| Microsoft Surface Pro OLED Copilot+ | |
| Samsung Galaxy Book4 Pro 360 | |
| Durchschnittliche Qualcomm Snapdragon X Elite X1E-80-100 (230 - 248, n=7) | |
| Microsoft Surface Pro 9, i7-1255U | |
| Asus Vivobook S 15 OLED Snapdragon | |
| Microsoft Surface Pro 9, ARM | |
| Blender / v2.79 BMW27 CPU | |
| Microsoft Surface Pro 9, ARM | |
| Microsoft Surface Pro 9, i7-1255U | |
| Durchschnittliche Qualcomm Snapdragon X Elite X1E-80-100 (331 - 510, n=7) | |
| Samsung Galaxy Book4 Pro 360 | |
| Durchschnitt der Klasse Tablet (337 - 402, n=3, der letzten 2 Jahre) | |
| Microsoft Surface Pro OLED Copilot+ | |
| Asus Vivobook S 15 OLED Snapdragon | |
| Dell Latitude 9450 2-in-1 | |
| Minisforum V3 | |
| Lenovo Yoga 9 2-in-1 14IMH9 | |
| Asus ROG Flow X13 GV302XV | |
| 7-Zip 18.03 / 7z b 4 | |
| Asus ROG Flow X13 GV302XV | |
| Minisforum V3 | |
| Lenovo Yoga 9 2-in-1 14IMH9 | |
| Asus Vivobook S 15 OLED Snapdragon | |
| Microsoft Surface Pro OLED Copilot+ | |
| Dell Latitude 9450 2-in-1 | |
| Durchschnittliche Qualcomm Snapdragon X Elite X1E-80-100 (34299 - 46146, n=7) | |
| Durchschnitt der Klasse Tablet (36610 - 44404, n=3, der letzten 2 Jahre) | |
| Microsoft Surface Pro 9, i7-1255U | |
| Microsoft Surface Pro 9, ARM | |
| 7-Zip 18.03 / 7z b 4 -mmt1 | |
| Asus ROG Flow X13 GV302XV | |
| Minisforum V3 | |
| Lenovo Yoga 9 2-in-1 14IMH9 | |
| Microsoft Surface Pro OLED Copilot+ | |
| Durchschnitt der Klasse Tablet (4652 - 5991, n=3, der letzten 2 Jahre) | |
| Durchschnittliche Qualcomm Snapdragon X Elite X1E-80-100 (5242 - 5359, n=7) | |
| Microsoft Surface Pro 9, i7-1255U | |
| Samsung Galaxy Book4 Pro 360 | |
| Dell Latitude 9450 2-in-1 | |
| Asus Vivobook S 15 OLED Snapdragon | |
| Microsoft Surface Pro 9, ARM | |
| HWBOT x265 Benchmark v2.2 / 4k Preset | |
| Asus ROG Flow X13 GV302XV | |
| Minisforum V3 | |
| Lenovo Yoga 9 2-in-1 14IMH9 | |
| Dell Latitude 9450 2-in-1 | |
| Samsung Galaxy Book4 Pro 360 | |
| Microsoft Surface Pro 9, i7-1255U | |
| Durchschnitt der Klasse Tablet (6.54 - 12.9, n=3, der letzten 2 Jahre) | |
| Asus Vivobook S 15 OLED Snapdragon | |
| Microsoft Surface Pro OLED Copilot+ | |
| Durchschnittliche Qualcomm Snapdragon X Elite X1E-80-100 (4.74 - 7.53, n=7) | |
| Microsoft Surface Pro 9, ARM | |
| LibreOffice / 20 Documents To PDF | |
| Microsoft Surface Pro 9, ARM | |
| Asus Vivobook S 15 OLED Snapdragon | |
| Durchschnittliche Qualcomm Snapdragon X Elite X1E-80-100 (50.9 - 98.5, n=7) | |
| Durchschnitt der Klasse Tablet (48.3 - 58.3, n=3, der letzten 2 Jahre) | |
| Minisforum V3 | |
| Microsoft Surface Pro OLED Copilot+ | |
| Microsoft Surface Pro 9, i7-1255U | |
| Asus ROG Flow X13 GV302XV | |
| Lenovo Yoga 9 2-in-1 14IMH9 | |
| Dell Latitude 9450 2-in-1 | |
| Samsung Galaxy Book4 Pro 360 | |
| R Benchmark 2.5 / Overall mean | |
| Microsoft Surface Pro 9, ARM | |
| Asus Vivobook S 15 OLED Snapdragon | |
| Durchschnittliche Qualcomm Snapdragon X Elite X1E-80-100 (0.63 - 0.67, n=7) | |
| Microsoft Surface Pro OLED Copilot+ | |
| Durchschnitt der Klasse Tablet (0.4361 - 0.738, n=3, der letzten 2 Jahre) | |
| Microsoft Surface Pro 9, i7-1255U | |
| Samsung Galaxy Book4 Pro 360 | |
| Dell Latitude 9450 2-in-1 | |
| Minisforum V3 | |
| Lenovo Yoga 9 2-in-1 14IMH9 | |
| Asus ROG Flow X13 GV302XV | |
* ... kleinere Werte sind besser
AIDA64: FP32 Ray-Trace | FPU Julia | CPU SHA3 | CPU Queen | FPU SinJulia | FPU Mandel | CPU AES | CPU ZLib | FP64 Ray-Trace | CPU PhotoWorxx
| Performance Rating | |
| Asus ROG Flow X13 GV302XV | |
| Minisforum V3 | |
| Lenovo Yoga 9 2-in-1 14IMH9 | |
| Dell Latitude 9450 2-in-1 | |
| Samsung Galaxy Book4 Pro 360 | |
| Microsoft Surface Pro 9, i7-1255U | |
| Durchschnitt der Klasse Tablet | |
| Durchschnittliche Qualcomm Snapdragon X Elite X1E-80-100 | |
| Microsoft Surface Pro OLED Copilot+ | |
| Microsoft Surface Pro 9, ARM | |
| AIDA64 / FP32 Ray-Trace | |
| Asus ROG Flow X13 GV302XV | |
| Minisforum V3 | |
| Lenovo Yoga 9 2-in-1 14IMH9 | |
| Dell Latitude 9450 2-in-1 | |
| Samsung Galaxy Book4 Pro 360 | |
| Microsoft Surface Pro 9, i7-1255U | |
| Durchschnitt der Klasse Tablet (2184 - 12759, n=3, der letzten 2 Jahre) | |
| Durchschnittliche Qualcomm Snapdragon X Elite X1E-80-100 (2184 - 7469, n=7) | |
| Microsoft Surface Pro 9, ARM | |
| Microsoft Surface Pro OLED Copilot+ | |
| AIDA64 / FPU Julia | |
| Asus ROG Flow X13 GV302XV | |
| Minisforum V3 | |
| Lenovo Yoga 9 2-in-1 14IMH9 | |
| Dell Latitude 9450 2-in-1 | |
| Samsung Galaxy Book4 Pro 360 | |
| Microsoft Surface Pro 9, i7-1255U | |
| Durchschnitt der Klasse Tablet (5315 - 62102, n=3, der letzten 2 Jahre) | |
| Durchschnittliche Qualcomm Snapdragon X Elite X1E-80-100 (5687 - 26391, n=7) | |
| Microsoft Surface Pro 9, ARM | |
| Microsoft Surface Pro OLED Copilot+ | |
| AIDA64 / CPU SHA3 | |
| Asus ROG Flow X13 GV302XV | |
| Minisforum V3 | |
| Durchschnittliche Qualcomm Snapdragon X Elite X1E-80-100 (2607 - 3122, n=7) | |
| Microsoft Surface Pro OLED Copilot+ | |
| Lenovo Yoga 9 2-in-1 14IMH9 | |
| Dell Latitude 9450 2-in-1 | |
| Durchschnitt der Klasse Tablet (1668 - 2784, n=3, der letzten 2 Jahre) | |
| Microsoft Surface Pro 9, i7-1255U | |
| Samsung Galaxy Book4 Pro 360 | |
| Microsoft Surface Pro 9, ARM | |
| AIDA64 / CPU Queen | |
| Asus ROG Flow X13 GV302XV | |
| Minisforum V3 | |
| Lenovo Yoga 9 2-in-1 14IMH9 | |
| Samsung Galaxy Book4 Pro 360 | |
| Microsoft Surface Pro OLED Copilot+ | |
| Durchschnittliche Qualcomm Snapdragon X Elite X1E-80-100 (67219 - 69762, n=7) | |
| Microsoft Surface Pro 9, i7-1255U | |
| Durchschnitt der Klasse Tablet (49630 - 69762, n=3, der letzten 2 Jahre) | |
| Dell Latitude 9450 2-in-1 | |
| Microsoft Surface Pro 9, ARM | |
| AIDA64 / FPU SinJulia | |
| Asus ROG Flow X13 GV302XV | |
| Minisforum V3 | |
| Lenovo Yoga 9 2-in-1 14IMH9 | |
| Samsung Galaxy Book4 Pro 360 | |
| Dell Latitude 9450 2-in-1 | |
| Microsoft Surface Pro 9, i7-1255U | |
| Durchschnitt der Klasse Tablet (1969 - 4429, n=3, der letzten 2 Jahre) | |
| Microsoft Surface Pro OLED Copilot+ | |
| Durchschnittliche Qualcomm Snapdragon X Elite X1E-80-100 (1521 - 2357, n=7) | |
| Microsoft Surface Pro 9, ARM | |
| AIDA64 / FPU Mandel | |
| Asus ROG Flow X13 GV302XV | |
| Minisforum V3 | |
| Lenovo Yoga 9 2-in-1 14IMH9 | |
| Dell Latitude 9450 2-in-1 | |
| Samsung Galaxy Book4 Pro 360 | |
| Durchschnitt der Klasse Tablet (13050 - 31836, n=3, der letzten 2 Jahre) | |
| Microsoft Surface Pro 9, i7-1255U | |
| Microsoft Surface Pro OLED Copilot+ | |
| Durchschnittliche Qualcomm Snapdragon X Elite X1E-80-100 (10117 - 15669, n=7) | |
| Microsoft Surface Pro 9, ARM | |
| AIDA64 / CPU AES | |
| Asus ROG Flow X13 GV302XV | |
| Microsoft Surface Pro OLED Copilot+ | |
| Minisforum V3 | |
| Durchschnittliche Qualcomm Snapdragon X Elite X1E-80-100 (39956 - 71089, n=7) | |
| Durchschnitt der Klasse Tablet (38941 - 71089, n=3, der letzten 2 Jahre) | |
| Lenovo Yoga 9 2-in-1 14IMH9 | |
| Dell Latitude 9450 2-in-1 | |
| Samsung Galaxy Book4 Pro 360 | |
| Microsoft Surface Pro 9, i7-1255U | |
| Microsoft Surface Pro 9, ARM | |
| AIDA64 / CPU ZLib | |
| Asus ROG Flow X13 GV302XV | |
| Minisforum V3 | |
| Microsoft Surface Pro OLED Copilot+ | |
| Lenovo Yoga 9 2-in-1 14IMH9 | |
| Dell Latitude 9450 2-in-1 | |
| Durchschnitt der Klasse Tablet (631 - 802, n=3, der letzten 2 Jahre) | |
| Durchschnittliche Qualcomm Snapdragon X Elite X1E-80-100 (398 - 802, n=7) | |
| Samsung Galaxy Book4 Pro 360 | |
| Microsoft Surface Pro 9, i7-1255U | |
| Microsoft Surface Pro 9, ARM | |
| AIDA64 / FP64 Ray-Trace | |
| Asus ROG Flow X13 GV302XV | |
| Minisforum V3 | |
| Lenovo Yoga 9 2-in-1 14IMH9 | |
| Dell Latitude 9450 2-in-1 | |
| Microsoft Surface Pro 9, i7-1255U | |
| Samsung Galaxy Book4 Pro 360 | |
| Durchschnitt der Klasse Tablet (2826 - 6803, n=3, der letzten 2 Jahre) | |
| Durchschnittliche Qualcomm Snapdragon X Elite X1E-80-100 (2581 - 4044, n=7) | |
| Microsoft Surface Pro OLED Copilot+ | |
| Microsoft Surface Pro 9, ARM | |
| AIDA64 / CPU PhotoWorxx | |
| Dell Latitude 9450 2-in-1 | |
| Lenovo Yoga 9 2-in-1 14IMH9 | |
| Samsung Galaxy Book4 Pro 360 | |
| Microsoft Surface Pro 9, i7-1255U | |
| Durchschnitt der Klasse Tablet (36689 - 54886, n=3, der letzten 2 Jahre) | |
| Microsoft Surface Pro OLED Copilot+ | |
| Minisforum V3 | |
| Durchschnittliche Qualcomm Snapdragon X Elite X1E-80-100 (28474 - 38707, n=7) | |
| Asus ROG Flow X13 GV302XV | |
| Microsoft Surface Pro 9, ARM | |
System Performance
Das Surface Pro mit dem Snapdragon-Prozessor ist im Alltag ein sehr reaktionsschneller Begleiter und wir hatten auch keine Probleme mit der Systemstabilität, allerdings liefen nicht alle Apps und wenn man nicht nur die alltäglichen Apps verwendet (Office, Browser, Video-Streaming etc.), dann sollte man im Vorfeld etwas recherchieren, um unschöne Überraschungen zu vermeiden.
Im systemübergreifenden CrossMark schneidet das Surface Pro Copilot+ deutlich besser ab als das kürzlich getestete Vivobook S 15, allerdings immer noch leicht hinter den direkten Konkurrenten. In den Browser-Tests liegt das Snapdragon-Convertible deutlich vor den Rivalen.
WebXPRT 3: Overall
WebXPRT 4: Overall
Mozilla Kraken 1.1: Total
| CrossMark / Overall | |
| Asus ROG Flow X13 GV302XV | |
| Lenovo Yoga 9 2-in-1 14IMH9 | |
| Samsung Galaxy Book4 Pro 360 | |
| Minisforum V3 | |
| Dell Latitude 9450 2-in-1 | |
| Microsoft Surface Pro 9, i7-1255U | |
| Microsoft Surface Pro OLED Copilot+ | |
| Durchschnittliche Qualcomm Snapdragon X Elite X1E-80-100, Qualcomm SD X Adreno X1-85 3.8 TFLOPS (1356 - 1443, n=7) | |
| Durchschnitt der Klasse Tablet (227 - 2155, n=54, der letzten 2 Jahre) | |
| CrossMark / Productivity | |
| Asus ROG Flow X13 GV302XV | |
| Samsung Galaxy Book4 Pro 360 | |
| Lenovo Yoga 9 2-in-1 14IMH9 | |
| Minisforum V3 | |
| Dell Latitude 9450 2-in-1 | |
| Microsoft Surface Pro 9, i7-1255U | |
| Microsoft Surface Pro OLED Copilot+ | |
| Durchschnittliche Qualcomm Snapdragon X Elite X1E-80-100, Qualcomm SD X Adreno X1-85 3.8 TFLOPS (1271 - 1375, n=7) | |
| Durchschnitt der Klasse Tablet (243 - 2036, n=53, der letzten 2 Jahre) | |
| CrossMark / Creativity | |
| Asus ROG Flow X13 GV302XV | |
| Lenovo Yoga 9 2-in-1 14IMH9 | |
| Samsung Galaxy Book4 Pro 360 | |
| Minisforum V3 | |
| Dell Latitude 9450 2-in-1 | |
| Microsoft Surface Pro 9, i7-1255U | |
| Microsoft Surface Pro OLED Copilot+ | |
| Durchschnittliche Qualcomm Snapdragon X Elite X1E-80-100, Qualcomm SD X Adreno X1-85 3.8 TFLOPS (1402 - 1537, n=7) | |
| Durchschnitt der Klasse Tablet (195 - 2620, n=53, der letzten 2 Jahre) | |
| CrossMark / Responsiveness | |
| Durchschnitt der Klasse Tablet (289 - 12671, n=53, der letzten 2 Jahre) | |
| Asus ROG Flow X13 GV302XV | |
| Samsung Galaxy Book4 Pro 360 | |
| Microsoft Surface Pro OLED Copilot+ | |
| Lenovo Yoga 9 2-in-1 14IMH9 | |
| Dell Latitude 9450 2-in-1 | |
| Durchschnittliche Qualcomm Snapdragon X Elite X1E-80-100, Qualcomm SD X Adreno X1-85 3.8 TFLOPS (1237 - 1401, n=7) | |
| Microsoft Surface Pro 9, i7-1255U | |
| Minisforum V3 | |
| WebXPRT 3 / Overall | |
| Durchschnittliche Qualcomm Snapdragon X Elite X1E-80-100, Qualcomm SD X Adreno X1-85 3.8 TFLOPS (430 - 455, n=7) | |
| Microsoft Surface Pro OLED Copilot+ | |
| Asus ROG Flow X13 GV302XV | |
| Minisforum V3 | |
| Dell Latitude 9450 2-in-1 | |
| Lenovo Yoga 9 2-in-1 14IMH9 | |
| Microsoft Surface Pro 9, i7-1255U | |
| Samsung Galaxy Book4 Pro 360 | |
| Durchschnitt der Klasse Tablet (39 - 480, n=25, der letzten 2 Jahre) | |
| Microsoft Surface Pro 9, ARM | |
| WebXPRT 4 / Overall | |
| Durchschnittliche Qualcomm Snapdragon X Elite X1E-80-100, Qualcomm SD X Adreno X1-85 3.8 TFLOPS (295 - 324, n=7) | |
| Microsoft Surface Pro OLED Copilot+ | |
| Asus ROG Flow X13 GV302XV | |
| Dell Latitude 9450 2-in-1 | |
| Minisforum V3 | |
| Lenovo Yoga 9 2-in-1 14IMH9 | |
| Samsung Galaxy Book4 Pro 360 | |
| Microsoft Surface Pro 9, i7-1255U | |
| Durchschnitt der Klasse Tablet (26 - 376, n=71, der letzten 2 Jahre) | |
| Microsoft Surface Pro 9, ARM | |
| Mozilla Kraken 1.1 / Total | |
| Durchschnitt der Klasse Tablet (243 - 27101, n=80, der letzten 2 Jahre) | |
| Microsoft Surface Pro 9, ARM | |
| Samsung Galaxy Book4 Pro 360 | |
| Microsoft Surface Pro 9, i7-1255U | |
| Lenovo Yoga 9 2-in-1 14IMH9 | |
| Dell Latitude 9450 2-in-1 | |
| Minisforum V3 | |
| Asus ROG Flow X13 GV302XV | |
| Durchschnittliche Qualcomm Snapdragon X Elite X1E-80-100, Qualcomm SD X Adreno X1-85 3.8 TFLOPS (391 - 422, n=7) | |
| Microsoft Surface Pro OLED Copilot+ | |
* ... kleinere Werte sind besser
| AIDA64 / Memory Copy | |
| Lenovo Yoga 9 2-in-1 14IMH9 | |
| Samsung Galaxy Book4 Pro 360 | |
| Dell Latitude 9450 2-in-1 | |
| Durchschnitt der Klasse Tablet (63007 - 108317, n=3, der letzten 2 Jahre) | |
| Asus ROG Flow X13 GV302XV | |
| Microsoft Surface Pro 9, i7-1255U | |
| Minisforum V3 | |
| Microsoft Surface Pro OLED Copilot+ | |
| Durchschnittliche Qualcomm Snapdragon X Elite X1E-80-100 (44795 - 63495, n=7) | |
| Microsoft Surface Pro 9, ARM | |
| AIDA64 / Memory Read | |
| Microsoft Surface Pro OLED Copilot+ | |
| Durchschnitt der Klasse Tablet (87747 - 124555, n=3, der letzten 2 Jahre) | |
| Durchschnittliche Qualcomm Snapdragon X Elite X1E-80-100 (58855 - 125604, n=7) | |
| Lenovo Yoga 9 2-in-1 14IMH9 | |
| Samsung Galaxy Book4 Pro 360 | |
| Microsoft Surface Pro 9, i7-1255U | |
| Dell Latitude 9450 2-in-1 | |
| Asus ROG Flow X13 GV302XV | |
| Minisforum V3 | |
| Microsoft Surface Pro 9, ARM | |
| AIDA64 / Memory Write | |
| Minisforum V3 | |
| Asus ROG Flow X13 GV302XV | |
| Lenovo Yoga 9 2-in-1 14IMH9 | |
| Samsung Galaxy Book4 Pro 360 | |
| Durchschnitt der Klasse Tablet (44742 - 117859, n=3, der letzten 2 Jahre) | |
| Dell Latitude 9450 2-in-1 | |
| Microsoft Surface Pro 9, i7-1255U | |
| Microsoft Surface Pro 9, ARM | |
| Microsoft Surface Pro OLED Copilot+ | |
| Durchschnittliche Qualcomm Snapdragon X Elite X1E-80-100 (37270 - 45265, n=7) | |
| AIDA64 / Memory Latency | |
| Lenovo Yoga 9 2-in-1 14IMH9 | |
| Dell Latitude 9450 2-in-1 | |
| Samsung Galaxy Book4 Pro 360 | |
| Minisforum V3 | |
| Asus ROG Flow X13 GV302XV | |
| Microsoft Surface Pro 9, i7-1255U | |
| Durchschnitt der Klasse Tablet (7.5 - 94.4, n=2, der letzten 2 Jahre) | |
| Microsoft Surface Pro 9, ARM | |
| Durchschnittliche Qualcomm Snapdragon X Elite X1E-80-100 (7.4 - 8.8, n=5) | |
* ... kleinere Werte sind besser
DPC-Latenzen
Unseren standardisierten Latency-Test können wir nicht durchführen, da die Anwendung LatencyMon nicht auf dem ARM-System gestartet werden kann. Bei der Wiedergabe eines 4K-YouTube-Videos gab es zumindest keine Probleme mit übersprungenen Einzelbildern (Dropped Frames).
Massenspeicher
Die kompakte M.2-2230-SSD stammt von Samsung (PM9B1) und bietet eine Speicherkapazität von 1 TB, wovon nach der ersten Inbetriebnahme 890 GB zur freien Verfügung stehen. Es handelt sich um eine PCIe-4.0-SSD der Mittelklasse mit maximalen Transferraten von ~3,5 GB/s. Hier wäre mehr möglich, aber die Leistung reicht im Alltag vollkommen aus. Zudem bleiben die Transferraten auch bei längerer Belastung stabil. Weitere SSD-Benchmarks sind hier gelistet.
* ... kleinere Werte sind besser
Dauerleistung Lesen: DiskSpd Read Loop, Queue Depth 8
Grafikkarte
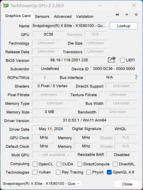
Der Snapdragon X Elite bietet eine Adreno-GPU, die sich um die Grafikberechnungen kümmert. Der X1E-80-100 ist mit der langsameren der beiden derzeit verfügbaren Varianten GPUs ausgestattet, die mit 1,2 GHz arbeitet. In unserem Analyse-Artikel haben wir uns bereits ausführlich mit der GPU-Leistung beschäftigt und die neue GPU ordnet sich in den nativen Tests zwischen der Radeon 780M sowie der Intel Arc Graphics ein. Im normalen Windows-Alltag macht die iGPU einen guten Job und auch die Wiedergabe von hochauflösenden Videos ist kein Problem.
Schwieriger wird es, wenn man Spielen möchte. Manche Titel starten überhaupt nicht (beispielsweise F1 23) oder es gibt bei hohen Einstellungen Bildfehler (Total War: Pharao oder Shadow of the Tomb Raider). In Cyberpunk 2077 gab es zudem mehrere Abstürze. Die Funktion Super Resolution, bei der es sich um Upscaling handelt, wird von den allermeisten Titeln nicht unterstützt und wir konnten es beispielsweise nur bei The Witcher 3 nutzen. Hier wurde die Leistung auch gesteigert (z. B. 1080p High von 40 auf 57 FPS), ohne dass die Bildqualität deutlich schlechter wurde.
Bei längerer Belastung bleibt die Gaming-Performance stabil, was auch für den Akkubetrieb gilt. Weitere GPU-benchmarks stehen in unserer Techniksektion zur Verfügung.
| 3DMark 11 Performance | 6846 Punkte | |
| 3DMark Fire Strike Score | 5911 Punkte | |
| 3DMark Time Spy Score | 1893 Punkte | |
| 3DMark Steel Nomad Score | 477 Punkte | |
| 3DMark Steel Nomad Light Score | 2012 Punkte | |
| 3DMark Steel Nomad Light Unlimited Score | 1972 Punkte | |
Hilfe | ||
| Blender / v3.3 Classroom OPTIX/RTX | |
| Asus ROG Flow X13 GV302XV | |
| Blender / v3.3 Classroom CUDA | |
| Asus ROG Flow X13 GV302XV | |
| Blender / v3.3 Classroom CPU | |
| Microsoft Surface Pro 9, i7-1255U | |
| Samsung Galaxy Book4 Pro 360 | |
| Durchschnittliche Qualcomm SD X Adreno X1-85 3.8 TFLOPS (545 - 899, n=12) | |
| Durchschnitt der Klasse Tablet (564 - 751, n=3, der letzten 2 Jahre) | |
| Microsoft Surface Pro OLED Copilot+ | |
| Dell Latitude 9450 2-in-1 | |
| Lenovo Yoga 9 2-in-1 14IMH9 | |
| Minisforum V3 | |
| Asus ROG Flow X13 GV302XV | |
* ... kleinere Werte sind besser
| The Witcher 3 - 1920x1080 Ultra Graphics & Postprocessing (HBAO+) | |
| Asus ROG Flow X13 GV302XV | |
| Minisforum V3 | |
| Lenovo Yoga 9 2-in-1 14IMH9 | |
| Durchschnitt der Klasse Tablet (18.8 - 20, n=2, der letzten 2 Jahre) | |
| Microsoft Surface Pro OLED Copilot+ | |
| Samsung Galaxy Book4 Pro 360 | |
| Dell Latitude 9450 2-in-1 | |
| Microsoft Surface Pro 9, i7-1255U | |
| GTA V - 1920x1080 High/On (Advanced Graphics Off) AA:2xMSAA + FX AF:8x | |
| Asus ROG Flow X13 GV302XV | |
| Minisforum V3 | |
| Durchschnitt der Klasse Tablet (46.8 - 68.9, n=3, der letzten 2 Jahre) | |
| Microsoft Surface Pro OLED Copilot+ | |
| Lenovo Yoga 9 2-in-1 14IMH9 | |
| Samsung Galaxy Book4 Pro 360 | |
| Microsoft Surface Pro 9, i7-1255U | |
Cyberpunk 2077 Phantom Liberty FPS-Diagramm
| min. | mittel | hoch | max. | |
|---|---|---|---|---|
| GTA V (2015) | 86.3 | 82.9 | 46.8 | |
| The Witcher 3 (2015) | 112 | 68 | 40 | 18.8 |
| Dota 2 Reborn (2015) | 72.4 | 55.9 | 55.1 | 51.6 |
| Final Fantasy XV Benchmark (2018) | 53.6 | 25 | 15.4 | |
| X-Plane 11.11 (2018) | 29.5 | |||
| Strange Brigade (2018) | 68 | 49 | 42 | 37 |
| Shadow of the Tomb Raider (2018) | 57 | 25 | 23 | |
| F1 22 (2022) | 54.7 | 49.6 | 37 | 28.2 |
| Baldur's Gate 3 (2023) | 23.2 | 19.3 | 16.5 | 16.3 |
| Cyberpunk 2077 (2023) | 21 | 17.7 | 15 | 13.2 |
| Total War Pharaoh (2023) | 85.1 | 51.9 |
Emissionen - Laut und heiß bei Belastung
Geräuschemissionen
Das neue Surface Pro 11 mit dem Qualcomm-SoC ist nach wie vor mit einem Lüfter ausgestattet. Im Leerlauf und bei einfachen, alltäglichen Aufgaben bleibt dieser aber in der Regel deaktiviert bzw. es gibt nur ein ganz leises Rauschen bei 25 dB(A). Unter Last kommt es dann darauf an, ob man vor allem die GPU oder die CPU belastet. Bei reiner GPU-Last in nativen Apps bleibt das Gerät zum Beispiel ebenfalls bei 25 dB(A), sobald man jedoch den Prozessor fordert, wird es schnell laut. Bei reiner CPU-Last messen wir 39 dB(A), was auch beim Spielen der Fall ist. Im Stresstest mit kombinierter CPU/GPU-Last sind es sogar laute 44,8 dB(A). In den anderen beiden Profilen bleibt das Gerät etwas leiser (Bessere Leistung: max. 40,2 dB(A), Empfohlen: 37,8 dB(A)). Sonstige elektronische Geräusche gab es bei unserem Testgerät nicht.
Insgesamt ist das neue ARM-Modell damit sogar lauter als die Intel-Variante des Surface Pro 9 und natürlich auch im Nachteil gegenüber der passiv gekühlten ARM-Variante des Surface Pro 9.
Lautstärkediagramm
| Idle |
| 23.6 / 23.6 / 25.2 dB(A) |
| Last |
| 39 / 44.8 dB(A) |
 | ||
30 dB leise 40 dB(A) deutlich hörbar 50 dB(A) störend |
||
min: | ||
| Microsoft Surface Pro OLED Copilot+ Adreno X1-85 3.8 TFLOPS, SD X Elite X1E-80-100, Samsung PM9B1 1024GB MZVL41T0HBLB | Minisforum V3 Radeon 780M, R7 8840U, Kingston OM8PGP41024Q-A0 | Asus ROG Flow X13 GV302XV GeForce RTX 4060 Laptop GPU, R9 7940HS, Micron 2400 MTFDKBK1T0QFM | Dell Latitude 9450 2-in-1 Graphics 4-Core iGPU (Arrow Lake), Ultra 7 165U | Lenovo Yoga 9 2-in-1 14IMH9 Arc 8-Core, Ultra 7 155H, Samsung PM9C1a MZAL81T0HDLB | Samsung Galaxy Book4 Pro 360 Arc 7-Core, Ultra 5 125H, Samsung PM9B1 512GB MZVL4512HBLU | Microsoft Surface Pro 9, i7-1255U Iris Xe G7 96EUs, i7-1255U, Samsung MZ9L4512HBLU-00BMV | Microsoft Surface Pro 9, ARM Adreno 690, SD 8cx Gen 3 | |
|---|---|---|---|---|---|---|---|---|
| Geräuschentwicklung | -7% | -12% | 2% | 2% | 2% | 1% | ||
| aus / Umgebung * (dB) | 23.6 | 25.4 -8% | 21.42 9% | 23.9 -1% | 23.2 2% | 24.1 -2% | 24.3 -3% | |
| Idle min * (dB) | 23.6 | 26.7 -13% | 29.07 -23% | 23.9 -1% | 23.6 -0% | 24.1 -2% | 24.3 -3% | |
| Idle avg * (dB) | 23.6 | 31.6 -34% | 29.07 -23% | 23.9 -1% | 23.6 -0% | 24.1 -2% | 24.3 -3% | |
| Idle max * (dB) | 25.2 | 32.5 -29% | 29.07 -15% | 23.9 5% | 25 1% | 26.4 -5% | 24.3 4% | |
| Last avg * (dB) | 39 | 32.7 16% | 44.54 -14% | 36.4 7% | 34.8 11% | 35.2 10% | 37.9 3% | |
| Cyberpunk 2077 ultra * (dB) | 39 | |||||||
| Last max * (dB) | 44.8 | 34 24% | 47.08 -5% | 44.7 -0% | 46.2 -3% | 39.2 12% | 41.8 7% | |
| Witcher 3 ultra * (dB) | 33.2 | 45.1 | 44.7 | 37.7 | 38.5 | 39.6 |
* ... kleinere Werte sind besser
Temperatur
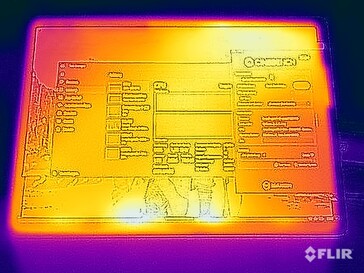
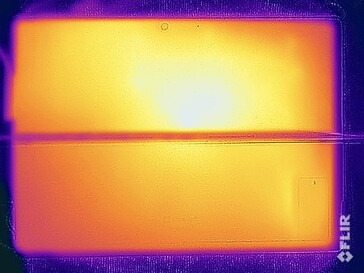
Das neue Surface Pro 11 bleibt bei einfachen Aufgaben sehr kühl, problematischer wird es aber bei höherer Belastung. Hier können wir an der Metallrückseite Werte von 45-46 °C im oberen Bereich messen, was bereits sehr unangenehm ist. Problematisch ist dabei, dass man das Convertible in der Regel hier auch berührt, wenn man beispielsweise den Aufstellwinkel verändert, es woanders hinstellt oder das Convertible vom Tastaturcover löst. Das war aber bereits beim alten Intel-Modell (Surface Pro 9) ein Problem.
(±) Die maximale Temperatur auf der Oberseite ist 43.1 °C. Im Vergleich liegt der Klassendurchschnitt bei 33.7 °C (von 20.7 bis 53.2 °C für die Klasse Tablet).
(-) Auf der Unterseite messen wir eine maximalen Wert von 46.3 °C (im Vergleich zum Durchschnitt von 33.2 °C).
(+) Ohne Last messen wir eine durchschnittliche Temperatur von 26.6 °C auf der Oberseite. Der Klassendurchschnitt erreicht 30 °C.
(-) 3: The average temperature for the upper side is 40.9 °C / 106 F, compared to the average of 30 °C / 86 F for the class Tablet.
| Microsoft Surface Pro OLED Copilot+ Qualcomm Snapdragon X Elite X1E-80-100, Qualcomm SD X Adreno X1-85 3.8 TFLOPS | Minisforum V3 AMD Ryzen 7 8840U, AMD Radeon 780M | Asus ROG Flow X13 GV302XV AMD Ryzen 9 7940HS, NVIDIA GeForce RTX 4060 Laptop GPU | Dell Latitude 9450 2-in-1 Intel Core Ultra 7 165U, Intel Graphics 4-Core iGPU (Arrow Lake) | Lenovo Yoga 9 2-in-1 14IMH9 Intel Core Ultra 7 155H, Intel Arc 8-Core iGPU | Samsung Galaxy Book4 Pro 360 Intel Core Ultra 5 125H, Intel Arc 7-Core iGPU | Microsoft Surface Pro 9, i7-1255U Intel Core i7-1255U, Intel Iris Xe Graphics G7 96EUs | Microsoft Surface Pro 9, ARM Qualcomm Snapdragon 8cx Gen 3, Qualcomm Adreno 690 | |
|---|---|---|---|---|---|---|---|---|
| Hitze | -24% | -12% | 8% | -8% | 9% | 4% | 11% | |
| Last oben max * (°C) | 43.1 | 50.5 -17% | 45.6 -6% | 35.4 18% | 40 7% | 38.6 10% | 44.6 -3% | 40.8 5% |
| Last unten max * (°C) | 46.3 | 54.8 -18% | 44.2 5% | 37.8 18% | 43 7% | 39.2 15% | 45.9 1% | 43.4 6% |
| Idle oben max * (°C) | 27.5 | 34.9 -27% | 33.8 -23% | 27.2 1% | 32 -16% | 25.2 8% | 24.8 10% | 23.2 16% |
| Idle unten max * (°C) | 26.8 | 36.3 -35% | 32.8 -22% | 28.2 -5% | 35.2 -31% | 25.7 4% | 25.3 6% | 22.6 16% |
* ... kleinere Werte sind besser
Lautsprecher
Microsoft verbaut weiterhin zwei Lautsprecher mit jeweils 2 Watt, die Qualität hat sich im Vergleich zum alten Surface Pro 9 nicht wirklich verändert und insgesamt ist der Klang auf einem guten Niveau. Das Galaxy Book4 Pro 360 mit vier Lautsprechern schneidet ebenfalls nicht viel besser ab und das Minisforum V3 ist deutlich abgeschlagen.
Microsoft Surface Pro OLED Copilot+ Audio Analyse
(+) | Die Lautsprecher können relativ laut spielen (82.4 dB)
Bass 100 - 315 Hz
(±) | abgesenkter Bass - 8.9% geringer als der Median
(±) | durchschnittlich lineare Bass-Wiedergabe (9.3% Delta zum Vorgänger)
Mitteltöne 400 - 2000 Hz
(±) | zu hohe Mitten, vom Median 6.4% abweichend
(+) | lineare Mitten (3.3% Delta zum Vorgänger)
Hochtöne 2 - 16 kHz
(+) | ausgeglichene Hochtöne, vom Median nur 3.9% abweichend
(+) | sehr lineare Hochtöne (3.2% Delta zum Vorgänger)
Gesamt im hörbaren Bereich 100 - 16.000 Hz
(+) | hörbarer Bereich ist sehr linear (13.5% Abstand zum Median
Im Vergleich zu allen Geräten derselben Klasse
» 26% aller getesteten Geräte dieser Klasse waren besser, 4% vergleichbar, 70% schlechter
» Das beste Gerät hat einen Delta-Wert von 7%, durchschnittlich ist 20%, das schlechteste Gerät hat 129%
Im Vergleich zu allen Geräten im Test
» 14% aller getesteten Geräte waren besser, 4% vergleichbar, 83% schlechter
» Das beste Gerät hat einen Delta-Wert von 4%, durchschnittlich ist 24%, das schlechteste Gerät hat 134%
Minisforum V3 Audio Analyse
(±) | Mittelmäßig laut spielende Lautsprecher (74.8 dB)
Bass 100 - 315 Hz
(±) | abgesenkter Bass - 13.5% geringer als der Median
(±) | durchschnittlich lineare Bass-Wiedergabe (10.2% Delta zum Vorgänger)
Mitteltöne 400 - 2000 Hz
(+) | ausgeglichene Mitten, vom Median nur 3.2% abweichend
(±) | Linearität der Mitten ist durchschnittlich (8.2% Delta zum Vorgänger)
Hochtöne 2 - 16 kHz
(+) | ausgeglichene Hochtöne, vom Median nur 4.6% abweichend
(±) | durchschnittlich lineare Hochtöne (7.8% Delta zum Vorgänger)
Gesamt im hörbaren Bereich 100 - 16.000 Hz
(±) | hörbarer Bereich ist durchschnittlich linear (21.3% Abstand zum Median)
Im Vergleich zu allen Geräten derselben Klasse
» 56% aller getesteten Geräte dieser Klasse waren besser, 12% vergleichbar, 32% schlechter
» Das beste Gerät hat einen Delta-Wert von 6%, durchschnittlich ist 20%, das schlechteste Gerät hat 57%
Im Vergleich zu allen Geräten im Test
» 59% aller getesteten Geräte waren besser, 7% vergleichbar, 34% schlechter
» Das beste Gerät hat einen Delta-Wert von 4%, durchschnittlich ist 24%, das schlechteste Gerät hat 134%
Samsung Galaxy Book4 Pro 360 Audio Analyse
(±) | Mittelmäßig laut spielende Lautsprecher (81.5 dB)
Bass 100 - 315 Hz
(±) | abgesenkter Bass - 11.1% geringer als der Median
(±) | durchschnittlich lineare Bass-Wiedergabe (10.1% Delta zum Vorgänger)
Mitteltöne 400 - 2000 Hz
(+) | ausgeglichene Mitten, vom Median nur 4.7% abweichend
(+) | lineare Mitten (5.4% Delta zum Vorgänger)
Hochtöne 2 - 16 kHz
(+) | ausgeglichene Hochtöne, vom Median nur 3% abweichend
(+) | sehr lineare Hochtöne (6.8% Delta zum Vorgänger)
Gesamt im hörbaren Bereich 100 - 16.000 Hz
(+) | hörbarer Bereich ist sehr linear (12.3% Abstand zum Median
Im Vergleich zu allen Geräten derselben Klasse
» 13% aller getesteten Geräte dieser Klasse waren besser, 3% vergleichbar, 84% schlechter
» Das beste Gerät hat einen Delta-Wert von 6%, durchschnittlich ist 20%, das schlechteste Gerät hat 57%
Im Vergleich zu allen Geräten im Test
» 10% aller getesteten Geräte waren besser, 2% vergleichbar, 88% schlechter
» Das beste Gerät hat einen Delta-Wert von 4%, durchschnittlich ist 24%, das schlechteste Gerät hat 134%
Microsoft Surface Pro 9, i7-1255U Audio Analyse
(±) | Mittelmäßig laut spielende Lautsprecher (79.4 dB)
Bass 100 - 315 Hz
(±) | abgesenkter Bass - 11.7% geringer als der Median
(±) | durchschnittlich lineare Bass-Wiedergabe (8.8% Delta zum Vorgänger)
Mitteltöne 400 - 2000 Hz
(±) | zu hohe Mitten, vom Median 5.1% abweichend
(+) | lineare Mitten (3% Delta zum Vorgänger)
Hochtöne 2 - 16 kHz
(+) | ausgeglichene Hochtöne, vom Median nur 4% abweichend
(+) | sehr lineare Hochtöne (3.4% Delta zum Vorgänger)
Gesamt im hörbaren Bereich 100 - 16.000 Hz
(+) | hörbarer Bereich ist sehr linear (14.9% Abstand zum Median
Im Vergleich zu allen Geräten derselben Klasse
» 23% aller getesteten Geräte dieser Klasse waren besser, 4% vergleichbar, 73% schlechter
» Das beste Gerät hat einen Delta-Wert von 6%, durchschnittlich ist 20%, das schlechteste Gerät hat 57%
Im Vergleich zu allen Geräten im Test
» 19% aller getesteten Geräte waren besser, 4% vergleichbar, 77% schlechter
» Das beste Gerät hat einen Delta-Wert von 4%, durchschnittlich ist 24%, das schlechteste Gerät hat 134%
Energieverwaltung - Verbesserte Laufzeit
Energieaufnahme
Das neue Surface Pro mit dem Snapdragon X Elite ist in unseren Idle-Energiemessungen überaus sparsam, vor allem angesichts des hochauflösenden OLED-Panels. Hier hilft natürlich das dunkle Hintergrundbild, aber dennoch sind knapp 5 Watt bei einer Helligkeit von 580 cd/m² sehr wenig. Beim Spielen messen wir rund 35 Watt und im Stresstest sind es maximal 41 Watt, wobei sich dieser Wert schnell bei rund 38 Watt einpendelt. Das 39-Watt-Netzteil reicht dafür gerade noch so aus, Reserven bietet es aber nicht. Das stärkere 60-Watt-Netzteil des Vorgängers wäre hier die bessere Wahl gewesen.
| Aus / Standby | |
| Idle | |
| Last |
|
Legende:
min: | |
| Microsoft Surface Pro OLED Copilot+ SD X Elite X1E-80-100, Adreno X1-85 3.8 TFLOPS, Samsung PM9B1 1024GB MZVL41T0HBLB, OLED, 2880x1920, 13" | Minisforum V3 R7 8840U, Radeon 780M, Kingston OM8PGP41024Q-A0, IPS, 2560x1600, 14" | Asus ROG Flow X13 GV302XV R9 7940HS, GeForce RTX 4060 Laptop GPU, Micron 2400 MTFDKBK1T0QFM, IPS, 2560x1600, 13.4" | Dell Latitude 9450 2-in-1 Ultra 7 165U, Graphics 4-Core iGPU (Arrow Lake), , IPS, 2560x1600, 14" | Lenovo Yoga 9 2-in-1 14IMH9 Ultra 7 155H, Arc 8-Core, Samsung PM9C1a MZAL81T0HDLB, OLED, 2880x1800, 14" | Samsung Galaxy Book4 Pro 360 Ultra 5 125H, Arc 7-Core, Samsung PM9B1 512GB MZVL4512HBLU, OLED, 2880x1800, 16" | Microsoft Surface Pro 9, i7-1255U i7-1255U, Iris Xe G7 96EUs, Samsung MZ9L4512HBLU-00BMV, IPS, 2880x1920, 13" | Microsoft Surface Pro 9, ARM SD 8cx Gen 3, Adreno 690, , IPS, 2880x1920, 13" | Durchschnittliche Qualcomm SD X Adreno X1-85 3.8 TFLOPS | Durchschnitt der Klasse Tablet | |
|---|---|---|---|---|---|---|---|---|---|---|
| Stromverbrauch | -203% | -346% | -65% | -86% | -41% | -94% | -21% | -41% | 36% | |
| Idle min * (Watt) | 2.8 | 10.1 -261% | 16.63 -494% | 3.2 -14% | 4.2 -50% | 3 -7% | 5.1 -82% | 2.8 -0% | 3.61 ? -29% | 2.04 ? 27% |
| Idle avg * (Watt) | 3.9 | 16.9 -333% | 20.68 -430% | 6.4 -64% | 7.1 -82% | 6.3 -62% | 9.8 -151% | 6.8 -74% | 6.9 ? -77% | 3.94 ? -1% |
| Idle max * (Watt) | 4.9 | 20.6 -320% | 29.88 -510% | 10.8 -120% | 12.9 -163% | 6.5 -33% | 11.3 -131% | 8.1 -65% | 7.87 ? -61% | 4.29 ? 12% |
| Last avg * (Watt) | 34.3 | 51.7 -51% | 75.5 -120% | 54.6 -59% | 58.9 -72% | 49.3 -44% | 47.5 -38% | 23.8 31% | 30.2 ? 12% | 9.24 ? 73% |
| Cyberpunk 2077 ultra * (Watt) | 35.8 | |||||||||
| Cyberpunk 2077 ultra external monitor * (Watt) | 36 | |||||||||
| Last max * (Watt) | 41.2 | 61.2 -49% | 113.3 -175% | 70.2 -70% | 66.7 -62% | 65.5 -59% | 68.5 -66% | 40.2 2% | 61 ? -48% | 13.5 ? 67% |
| Witcher 3 ultra * (Watt) | 55.4 | 92.6 | 35.5 | 49.5 | 45.9 | 36 |
* ... kleinere Werte sind besser
Energieaufnahme Cyberpunk 2077 / Stresstest
Energieaufnahme mit externem Monitor
Akkulaufzeit
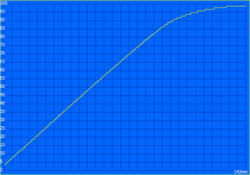
Microsoft hat die Akkukapazität von 47,7 auf 53 Wh erhöht und insgesamt fallen die Akkulaufzeiten (trotzt dem hellen OLED) besser aus, vor allem gegenüber der alten Intel-Version. Im WLAN-Test bei 150 cd/m² (entspricht beim Testgerät 58 % der maximalen SDR-Helligkeit) und 60 Hz ermitteln wir 11 Stunden (10 Stunden bei 120 Hz) und damit rund eine Stunde mehr als beim ARM-Modell sowie 3,5 Stunden mehr als beim alten Intel-Modell. Wenn wir den WLAN-Test mit der maximalen SDR-Helligkeit durchführen sind es bei 60 Hz noch etwas mehr als 6 Stunden bzw. etwas mehr als 5,5 Stunden bei 120 Hz. Hier macht sich einfach die hohe Helligkeit bemerkbar. Der Videotest bei 150 cd/m² läuft für fast 16 Stunden und ein HDR-Video bei maximaler Helligkeit für 6:45 Stunden. Unter Last kann man den Akku nach rund 1:45 Stunden leeren. Ein vollständiger Ladevorgang bei eingeschaltetem Gerät benötigt 142 Minuten; 80 % der Kapazität stehen nach 85 Minuten wieder zur Verfügung.
Alles in allem ermöglicht der Snapdragon X Elite deutlich längere Laufzeiten als beim alten Intel-Modell des Surface Pro 9 und auch im Vergleich mit den direkten Konkurrenten fallen die Ergebnisse ordentlich aus.
| Microsoft Surface Pro OLED Copilot+ SD X Elite X1E-80-100, Adreno X1-85 3.8 TFLOPS, 53 Wh | Minisforum V3 R7 8840U, Radeon 780M, 50.82 Wh | Asus ROG Flow X13 GV302XV R9 7940HS, GeForce RTX 4060 Laptop GPU, 75 Wh | Dell Latitude 9450 2-in-1 Ultra 7 165U, Graphics 4-Core iGPU (Arrow Lake), 60 Wh | Lenovo Yoga 9 2-in-1 14IMH9 Ultra 7 155H, Arc 8-Core, 75 Wh | Samsung Galaxy Book4 Pro 360 Ultra 5 125H, Arc 7-Core, 76 Wh | Microsoft Surface Pro 9, i7-1255U i7-1255U, Iris Xe G7 96EUs, 47.7 Wh | Microsoft Surface Pro 9, ARM SD 8cx Gen 3, Adreno 690, 47.7 Wh | Durchschnitt der Klasse Tablet | |
|---|---|---|---|---|---|---|---|---|---|
| Akkulaufzeit | -15% | -11% | 32% | -8% | -5% | -30% | -9% | 60% | |
| H.264 (h) | 15.9 | 11.4 -28% | 14.7 -8% | 9.4 -41% | 16.1 ? 1% | ||||
| WLAN (h) | 11.1 | 5.9 -47% | 11.9 7% | 13.6 23% | 10 -10% | 8.9 -20% | 7.5 -32% | 10.1 -9% | 15 ? 35% |
| Last (h) | 1.7 | 2 18% | 2.4 41% | 1.6 -6% | 1.9 12% | 1.4 -18% | 4.17 ? 145% | ||
| Witcher 3 ultra (h) | 1.5 |
Pro
Contra
Fazit - Surface Pro mit Snapdragon und OLED ist ein gutes Convertible
Das neue Surface Pro OLED Copilot+ mit dem Snapdragon-X-Elite-Prozessor hat in unserem Test insgesamt einen guten Eindruck hinterlassen. Von der Geschwindigkeit her gibt es keinen fühlbaren Unterschied zu den bisherigen Intel-Modellen und es ist deutlich besser als die alte ARM-Version (die allerdings passiv gekühlt werden konnte). Das neue Surface Pro der elften generation lässt sich ohne Einschränkungen wie ein "normales" Windows-Gerät verwenden, solange man kompatible Apps verwendet und nicht viel Wert auf die Gaming-Performance legt. Allerdings lässt Microsoft dem Kunden auch gar keine Wahl, denn eine Intel-Variante gibt es nicht mehr.
Der neue Qualcomm-Prozessor bietet ausreichend Leistung und die Adreno-GPU hat keine Probleme mit alltäglichen Aufgaben. Allerdings erfordert der Snapdragon-Chip eine aktive Kühlung und vor allem bei höherer CPU-Last wird das Convertible auch dementsprechend laut. Zudem bleiben die hohen Oberflächentemperaturen unter Last wie schon beim alten Intel-Modell problematisch, da der Hautkontakt unangenehm ist.
Das neue Surface Pro OLED Copilot+ ist ein gutes Convertible, solange man keine speziellen Anwendungen benötigt oder viel Wert auf die Gaming-Leistung legt. Die Akkulaufzeiten profitieren von dem ARM-Chip und auch das neue OLED-Panel kann abgesehen von dem leichten Rastereffekt überzeugen.
Das neue OLED-Panel ist sehr hell und bietet mit den 120 Hz sowie der hohen Auflösung eine sehr gute Bildqualität, lediglich auf hellen Inhalten sieht man einen leichten Rastereffekt. Allerdings ist der 3:2-Bildschirm nicht ideal für den Medienkonsum und beim Arbeiten kann vor allem das PWM-Flackern zum Problem werden. Hier könnte die günstigere IPS-Variante (aktuell ebenfalls im Test) besser abschneiden, zumal der kleinere Snapdragon X Plus nicht viel langsamer ist. Ein weiteres Problem ist der Preis, denn 2.000 Euro sind schon happig, wenn man bedenkt, dass sowohl die Tastatur als auch der Eingabestift noch separat gekauft werden müssen.
Preis und Verfügbarkeit
Unser Testgerät des Surface Pro ist bei Notebooksbilliger für 1.999 Euro sofort verfügbar. Das OLED-Modell mit 16 GB RAM und der kleineren 512-GB-SSD kostet bei Amazon 1.759 Euro.
Hinweis: Wir haben unser Rating-System aktualisiert und die Ergebnisse von Version 8 sind nicht vergleichbar mit den Ergebnissen von Version 7. Weitere Informationen dazu sind hier verfügbar.
Microsoft Surface Pro OLED Copilot+
- 10.08.2024 v8
Andreas Osthoff
Transparenz
Die Auswahl der zu testenden Geräte erfolgt innerhalb der Redaktion. Das vorliegende Testmuster wurde dem Autor vom Hersteller oder einem Shop zu Testzwecken leihweise zur Verfügung gestellt. Eine Einflussnahme des Leihstellers auf den Testbericht gab es nicht, der Hersteller erhielt keine Version des Reviews vor der Veröffentlichung. Es bestand keine Verpflichtung zur Publikation. Als eigenständiges, unabhängiges Unternehmen unterliegt Notebookcheck keiner Diktion von Herstellern, Shops und Verlagen.
So testet Notebookcheck
Pro Jahr werden von Notebookcheck hunderte Laptops und Smartphones unabhängig in von uns standardisierten technischen Verfahren getestet, um eine Vergleichbarkeit aller Testergebnisse zu gewährleisten. Seit rund 20 Jahren entwickeln wir diese Testmethoden kontinuierlich weiter und setzen damit Branchenstandards. In unseren Testlaboren kommt ausschließlich hochwertiges Messequipment in die Hände erfahrener Techniker und Redakteure. Die Tests unterliegen einer mehrstufigen Kontrolle. Unsere komplexe Gesamtbewertung basiert auf hunderten fundierten Messergebnissen und Benchmarks, womit Ihnen Objektivität garantiert ist. Weitere Informationen zu unseren Testmethoden gibt es hier.














 Total Sustainability Score: