Notebookcheck Logo

Leistungsdebut des Core Ultra 5 135U: Superleichtes Dell Latitude 13 7350 im Laptop-Test
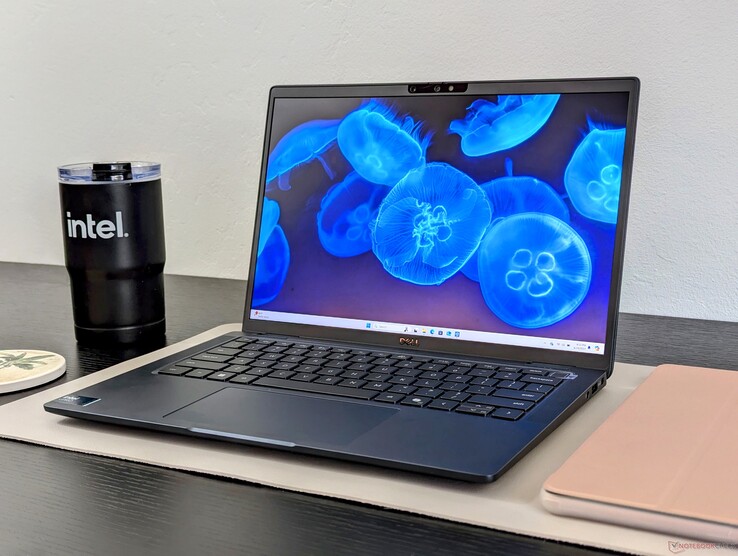
Weltweit leichtester, kommerzieller 13,3-Zoll-Premium-Laptop.

Die superleichte Latitude-13-Serie bekommt Gen14-Meteor-Lake-U-Prozessoren mit KI und Co-Pilot spendiert. Ein zusätzliches Update betrifft die nun höher auflösende 5-MP-Webcam, die sich einen der Schwachpunkte des originalen Latitude-13-7340-Designs vorknöpft.
Dell Latitude 13 7350

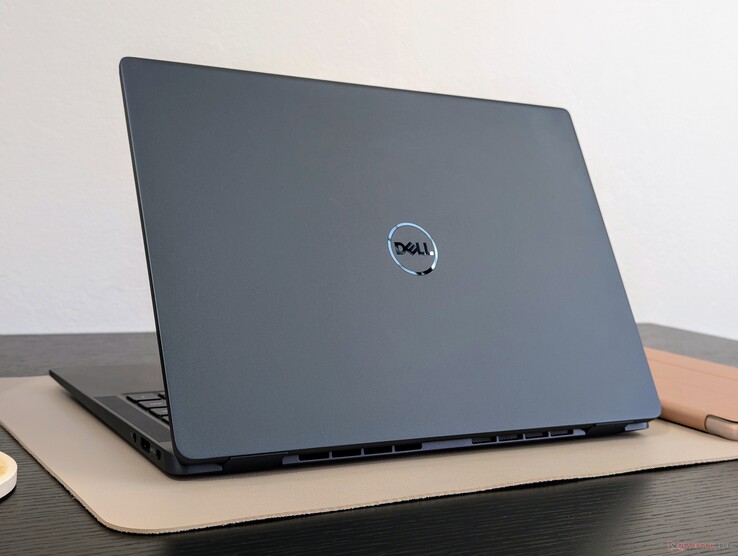
Das Latitude 13 7350 beerbt das letztjährige Latitude 13 7340 und ersetzt die Prozessoren der ehemaligen Raptor-Lake-U- mit denen der Meteor-Lake-U-Serie. Das Gehäusedesign bleibt indes gleich, sodass wir unseren Test des Latitude 13 7340 empfehlen, um mehr über die physischen Merkmale des Laptops zu erfahren.

Unsere Testeinheit stellt eine der unteren Konfigurationen (SKUs) das, sie ist mit einem Core Ultra 5 135U, 32 GB LPDDR5x 6400 MT/s RAM sowie einem matten 1-200p-Display ausgestattet und kostet rund 2.000 Euro. Andere SKUs gibt es mit einem Core Ultra 7 165U plus Touchscreen, aber die integrierte Grafik sowie die Auflösung von 1.200p ist in allen Konfigurationen fix.

Achtung: Es gibt auch eine Convertible-Version des Modells mit der Bezeichnung Latitude 13 7350 2-in-1, die mit einem exklusiven 2560 x 1600-Touchscreen ausgestattet ist. Ansonsten teilt es das allgemeine Design und die CPU-Optionen unserer Clamshell-Testversion.

Wir lassen das Latitude 13 7350 gegen andere High-End-Business-Subnotebooks antreten, darunter das Lenovo ThinkBook 13x, den Framework Laptop 13.5 sowie das HP EliteBook 1040. Unser Dell ist eines der wenigen Modelle, die noch im 13,3-Zoll-Formfaktor ausgeliefert werden, 13,5- und 14-Zoll-Modelle setzen sich in dieser Kategorie immer mehr durch.

Weitere Dell-Tests:

Dell Latitude 13 7350 (Latitude Serie)
Prozessor
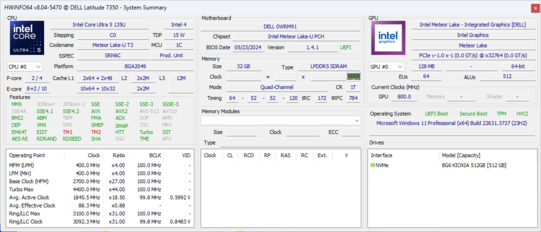
Intel Core Ultra 5 135U 12 x 3.6 - 4.4 GHz, 59 W PL2 / Short Burst, 18 W PL1 / Sustained, Meteor Lake-P
Grafikkarte
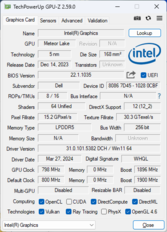
Intel Graphics 4-Cores iGPU (Arc), Kerntakt: 1900 MHz, LPDDR5x, 31.0.101.5382
RAM
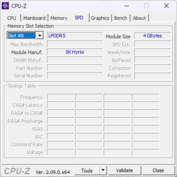
32 GB 
, LPDDR5x, 6400 MT/s, Dual-Channel
Bildschirm
13.30 Zoll 16:10, 1920 x 1200 Pixel 170 PPI, Chi Mei 133JCG, IPS, Dell P/N: 23WVW, spiegelnd: nein, 60 Hz
Mainboard
Intel Meteor Lake-U/P/H PCH
Massenspeicher
Kioxia BG6 KBG60ZNS512G, 512 GB 
Soundkarte
Intel Meteor Lake-U/P/H PCH - cAVS (Audio, Voice, Speech)
Anschlüsse
1 USB 3.0 / 3.1 Gen1, 2 USB 3.2 Gen 2x2 20Gbps, 2 Thunderbolt, USB-C Power Delivery (PD), 1 HDMI, 2 DisplayPort, 1 Kensington Lock, Audio Anschlüsse: 3.5 mm combo, 1 Fingerprint Reader
Netzwerk
Intel Wi-Fi 7 BE200 320MHz (a/b/g/n = Wi-Fi 4/ac = Wi-Fi 5/ax = Wi-Fi 6/ Wi-Fi 6E 6 GHz be = Wi-Fi 7), Bluetooth 5.4
Abmessungen
Höhe x Breite x Tiefe (in mm): 18.2 x 295 x 211
Akku
57 Wh Lithium-Polymer
Betriebssystem
Microsoft Windows 11 Pro
Kamera
Webcam: 1440p30
Primary Camera: 4.9 MPix
Sonstiges
Lautsprecher: Quad speakers, Tastatur: Chiclet, Tastatur-Beleuchtung: ja, Dell Optimizer, Command, Pair, Digital Delivery, 36 Monate Garantie
Gewicht
1.074 kg, Netzteil: 303 g
Preis
1800 USD
Hinweis: Der Hersteller kann abweichende Bauteile wie Bildschirme, Laufwerke und Speicherriegel mit ähnlichen Spezifikationen unter dem gleichen Modellnamen einsetzen.


Potentielle Konkurrenten im Vergleich

Bew.
Version
Datum
Modell
Gewicht
Dicke
Größe
Auflösung
Preis ab
86.2 %v8
07 / 2024
Dell Latitude 13 7350
Ultra 5 135U, Graphics 4-Core
1.1 kg18.2 mm13.30"1920x1200
90.2 %
v7 (old)
v7 (old)
10 / 2023
Dell Latitude 13 7340 i5-1345U
i5-1345U, Iris Xe G7 80EUs
1.1 kg18.2 mm13.30"1920x1200
89 %
v7 (old)
v7 (old)
07 / 2022
Dell Latitude 13 7330
i7-1265U, Iris Xe G7 96EUs
1 kg16.96 mm13.30"1920x1080
85.7 %v8
06 / 2024
Apple iPad Air 13 2024
M2, M2 10-Core GPU
617 g6.1 mm13.00"2732x2048
90.1 %
v7 (old)
v7 (old)
05 / 2024
Lenovo ThinkBook 13x G4 21KR0008GE
Ultra 5 125H, Arc 7-Core
1.2 kg12.9 mm13.50"2880x1920
87.5 %
v7 (old)
v7 (old)
10 / 2023
Framework Laptop 13.5 Ryzen 7 7840U
R7 7840U, Radeon 780M
1.3 kg15.85 mm13.50"2256x1504

Hinweis: Wir haben unser Rating-System aktualisiert und die Ergebnisse von Version 8 sind nicht vergleichbar mit den Ergebnissen von Version 7. Weitere Informationen dazu sind hier verfügbar.

Gehäuse — Besteht die MIL-STD-810H-Tests

Der einfachste Weg, um das neue Latitude 7350 von seinem Vorgänger zu unterscheiden, besteht in einem Blick auf die Tastatur und die neue Co-Pilot-Taste darauf, welche die rechte Strg-Taste verdrängt. Ansonsten sind das 2023er- und das 2024er-Modell optisch identisch.

Größenvergleich

306.5 mm 199.95 mm 16.96 mm 1 kg295 mm 211 mm 18.2 mm 1.1 kg295 mm 211 mm 18.2 mm 1.1 kg296.63 mm 228.98 mm 15.85 mm 1.3 kg292.9 mm 205 mm 12.9 mm 1.2 kg280.6 mm 214.9 mm 6.1 mm 617 g297 mm 210 mm 1 mm 5.7 g

Kommunikation

Dell hat das Wi-Fi-Modul von einem Intel AX211 auf das Intel BE700 verbessert, Letzteres beherrscht Wi-Fi 7 und Bluetooth 5.4. Eine Unterstützung von WAN bleibt optional.

Networking
iperf3 transmit AXE11000
Lenovo ThinkBook 13x G4 21KR0008GE
Intel Wi-Fi 6E AX211
1666 (1537min, 1551.79P1 - 1751max) MBit/s +89%
Framework Laptop 13.5 Ryzen 7 7840U
MediaTek Wi-Fi 6E MT7922 160MHz Wireless LAN Card
1364 (1196min - 1508max) MBit/s +54%
Dell Latitude 13 7340 i5-1345U
Intel Wi-Fi 6E AX211
920 (626min - 1000max) MBit/s +4%
Dell Latitude 13 7350
Intel Wi-Fi 7 BE200 320MHz
883 (648min - 1079max) MBit/s
Apple iPad Air 13 2024
Wi-Fi 6E
823 (583min - 873max) MBit/s -7%
iperf3 receive AXE11000
Lenovo ThinkBook 13x G4 21KR0008GE
Intel Wi-Fi 6E AX211
1709 (1689min, 1690.74P1 - 1723max) MBit/s +21%
Dell Latitude 13 7350
Intel Wi-Fi 7 BE200 320MHz
1416 (1345min - 1454max) MBit/s
Framework Laptop 13.5 Ryzen 7 7840U
MediaTek Wi-Fi 6E MT7922 160MHz Wireless LAN Card
1403 (1292min - 1492max) MBit/s -1%
Dell Latitude 13 7340 i5-1345U
Intel Wi-Fi 6E AX211
826 (601min - 939max) MBit/s -42%
Apple iPad Air 13 2024
Wi-Fi 6E
801 (769min - 816max) MBit/s -43%
iperf3 transmit AXE11000 6GHz
Dell Latitude 13 7340 i5-1345U
Intel Wi-Fi 6E AX211
1605 (1456min - 1676max) MBit/s +70%
Framework Laptop 13.5 Ryzen 7 7840U
MediaTek Wi-Fi 6E MT7922 160MHz Wireless LAN Card
1514 (1238min - 1724max) MBit/s +61%
Apple iPad Air 13 2024
Wi-Fi 6E
1482 (1401min - 1547max) MBit/s +57%
Dell Latitude 13 7330
Intel Wi-Fi 6E AX211
1453 (943min - 1600max) MBit/s +54%
Dell Latitude 13 7350
Intel Wi-Fi 7 BE200 320MHz
943 (903min - 983max) MBit/s
iperf3 receive AXE11000 6GHz
Dell Latitude 13 7340 i5-1345U
Intel Wi-Fi 6E AX211
1481 (972min - 1687max) MBit/s +20%
Apple iPad Air 13 2024
Wi-Fi 6E
1336 (1285min - 1369max) MBit/s +8%
Dell Latitude 13 7330
Intel Wi-Fi 6E AX211
1277 (1165min - 1323max) MBit/s +4%
Framework Laptop 13.5 Ryzen 7 7840U
MediaTek Wi-Fi 6E MT7922 160MHz Wireless LAN Card
1246 (1020min - 1386max) MBit/s +1%
Dell Latitude 13 7350
Intel Wi-Fi 7 BE200 320MHz
1233 (1166min - 1277max) MBit/s
050100150200250300350400450500550600650700750800850900950100010501100115012001250Tooltip
Dell Latitude 13 7350; iperf3 transmit AXE11000 6GHz; iperf 3.1.3: Ø944 (903-983)
Dell Latitude 13 7350; iperf3 receive AXE11000 6GHz; iperf 3.1.3: Ø1232 (1166-1277)

Webcam

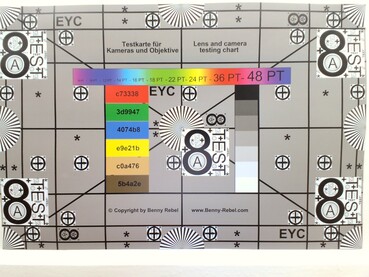
Endlich gibt es 5-MP-Options bei der Webcam, ähnlich wie bei den konkurrierenden HP-Modellen. Allerdings gibt es die nur in einigen spezifischen Non-Touch-Clamshell-Konfigurationen, sodass alle Touchscreen-Varianten weiterhin auf nur 2-MP-Webcams limitiert sind.
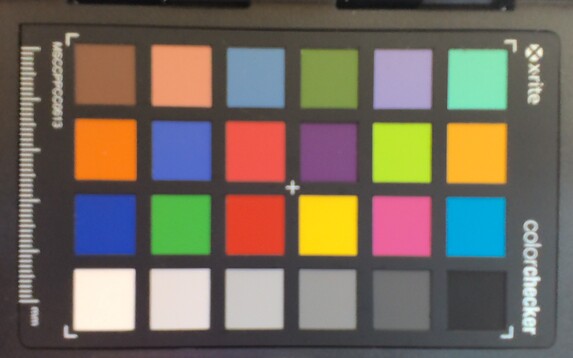
ColorChecker
12.3 ∆E
9.8 ∆E
11 ∆E
18.6 ∆E
12.5 ∆E
12 ∆E
7 ∆E
7.3 ∆E
12.6 ∆E
9.1 ∆E
11 ∆E
6.2 ∆E
5.6 ∆E
12.5 ∆E
15.1 ∆E
5 ∆E
11.4 ∆E
14 ∆E
8.3 ∆E
7.5 ∆E
11.3 ∆E
13.5 ∆E
10.9 ∆E
4.5 ∆E
ColorChecker Dell Latitude 13 7350: 10.37 ∆E min: 4.49 - max: 18.62 ∆E

Wartung

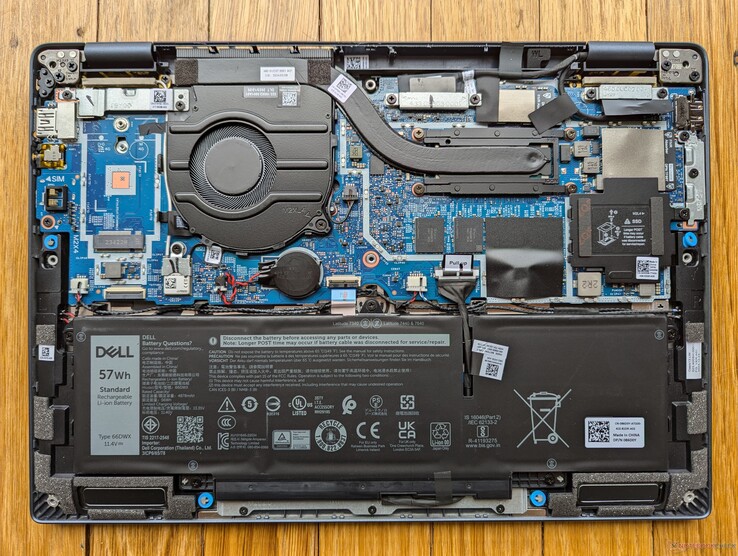
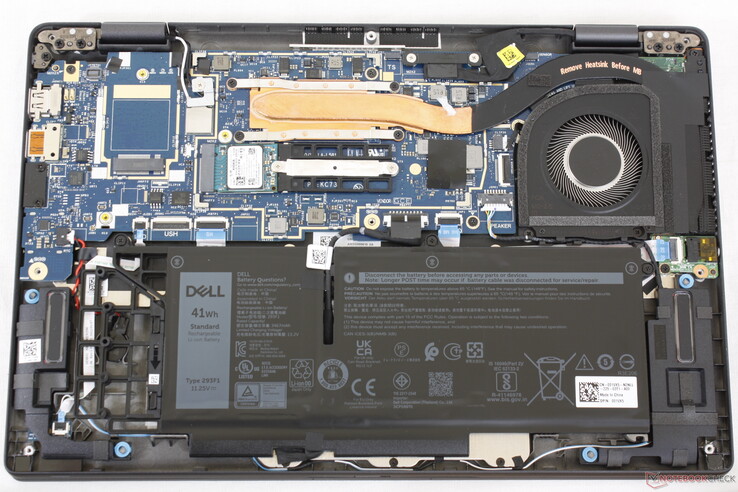
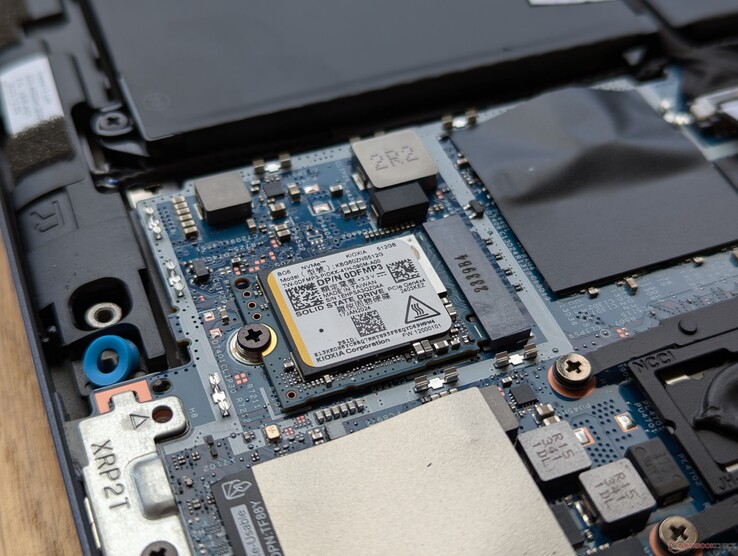
Für die Unterseite wird nur ein Kreuzschraubendreher benötigt. RAM und WLAN-Modul sind verlötet, während der Akku, der WAN-Slot sowie der M.2-Speicher zugänglich sind. Beachten sollte man, dass normalgroße 80-mm-M.2-SSDs nicht unterstützt werden.

Dell Latitude 13 7350
Das Latitude 13 7330 zum Vergleich

Nachhaltigkeit

Der Akku besteht aus zu 50 Prozent recycletem Kobalt während für das Gehäuse bis zu 90 Prozent recycletes Magnesium und 50 Prozent recycles Aluminum zum Einsatz kommt.

Garantie

Außer dem Netzteil und etwas Papierkram befinden sich keine Extras in der Verpackung. Es greift eine 3-Jahres-Garantie mit On-Site-Support am nächsten Tag, sofern man direkt bei Dell ordert.

Display — Standard 60-Hz-IPS

Dell verwendet das gleiche Chi-Mei-133JCG-Panel wie im Vorgänger, sodass sich die visuelle Erfahrung in diesem Jahr nicht verändert. Für ein IPS-Display erhält man zwar großartige Farben und Kontraste, trotzdem fühlt sich der Bildschirm etwas veraltet an, was vor allem an der niedrigen Bildwiederholrate von nur 60 Hz und dem Fehlen von Windows VRR liegt. Auch die Reaktionszeiten sind eher schwach, was zu wahrnehmbaren Ghosting beim Streaming oder Gaming führt.

Die matten Subpixel sind nur minimal körniger als eine spiegelnde Alternative
435.3
cd/m²
437
cd/m²
441.9
cd/m²
443.6
cd/m²
470.7
cd/m²
438.9
cd/m²
449.2
cd/m²
458.6
cd/m²
454.3
cd/m²
Ausleuchtung des Bildschirms
Chi Mei 133JCG getestet mit X-Rite i1Pro 2
Maximal: 470.7 cd/m² (Nits) Durchschnitt: 447.7 cd/m² Minimum: 25.53 cd/m²
Ausleuchtung: 92 %
Helligkeit Akku: 470.7 cd/m²
Kontrast: 1743:1 (Schwarzwert: 0.27 cd/m²)
ΔE Color 3.31 | 0.5-29.43 Ø4.92, calibrated: 0.8
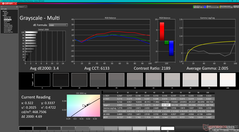
ΔE Greyscale 3.4 | 0.5-98 Ø5.2
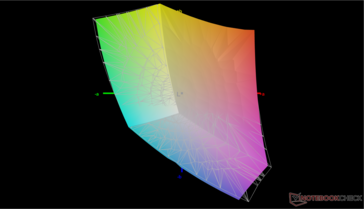
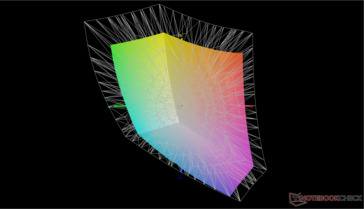
68.6% AdobeRGB 1998 (Argyll 2.2.0 3D)
96.9% sRGB (Argyll 2.2.0 3D)
66.5% Display P3 (Argyll 2.2.0 3D)
Gamma: 2
Dell Latitude 13 7350
Chi Mei 133JCG, IPS, 1920x1200, 13.3"
Dell Latitude 13 7340 i5-1345U
Chi Mei 133JCG, IPS, 1920x1200, 13.3"
Dell Latitude 13 7330
LG Philips 133WF9, IPS, 1920x1080, 13.3"
Apple iPad Air 13 2024
Liquid Retina Display, IPS, 2732x2048, 13"
Lenovo ThinkBook 13x G4 21KR0008GE
LEN135WQ+, IPS, 2880x1920, 13.5"
Framework Laptop 13.5 Ryzen 7 7840U
BOE CQ NE135FBM-N41, IPS, 2256x1504, 13.5"
Display
-1%
-2%
-1%
3%
Display P3 Coverage
66.5
65.9
-1%
66.1
-1%
65.5
-2%
69
4%
sRGB Coverage
96.9
96.8
0%
93.5
-4%
97.3
0%
99.1
2%
AdobeRGB 1998 Coverage
68.6
67.8
-1%
68.2
-1%
67.7
-1%
71.1
4%
Response Times
8%
10%
-5%
55%
5%
Response Time Grey 50% / Grey 80% *
53 ?(24.8, 28.2)
51 ?(22.8, 28.2)
4%
48.4 ?(23.6, 24.8)
9%
54.3 ?(25.04, 29.26)
-2%
27.3 ?(12.8, 14.5)
48%
50.4 ?(23.8, 26.6)
5%
Response Time Black / White *
32.9 ?(16.1, 16.8)
29.04 ?(14.6, 14.75)
12%
29.6 ?(14.8, 14.8)
10%
35.21 ?(18.76, 16.45)
-7%
12.8 ?(4.4, 8.4)
61%
31.5 ?(17.7, 13.8)
4%
PWM Frequency
Bildschirm
-6%
6%
3%
12%
3%
Helligkeit Bildmitte
470.7
471
0%
460.1
-2%
631
34%
539
15%
436
-7%
Brightness
448
437
-2%
445
-1%
589
31%
513
15%
416
-7%
Brightness Distribution
92
87
-5%
89
-3%
88
-4%
89
-3%
89
-3%
Schwarzwert *
0.27
0.2033
25%
0.31
-15%
0.62
-130%
0.38
-41%
0.36
-33%
Kontrast
1743
2317
33%
1484
-15%
1018
-42%
1418
-19%
1211
-31%
Delta E Colorchecker *
3.31
3.24
2%
2.42
27%
1.5
55%
1.4
58%
1.81
45%
Colorchecker dE 2000 max. *
5.16
7.19
-39%
3.97
23%
3
42%
3.5
32%
4.73
8%
Colorchecker dE 2000 calibrated *
0.8
1.08
-35%
0.77
4%
0.7
12%
0.45
44%
Delta E Graustufen *
3.4
4.6
-35%
2.3
32%
2.2
35%
2.2
35%
2.9
15%
Gamma
2 110%
2.23 99%
2.24 98%
2.19 100%
2.27 97%
CCT
6133 106%
6520 100%
6262 104%
6918 94%
6710 97%
6784 96%
Durchschnitt gesamt (Programm / Settings)
0% / -3%
5% / 5%
-1% / 1%
22% / 15%
4% / 4%

* ... kleinere Werte sind besser

vs. sRGB
vs. sRGB
vs. P3
vs. P3

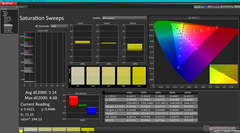
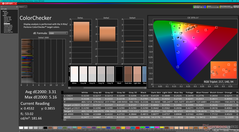
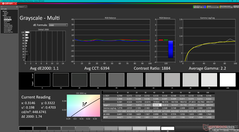
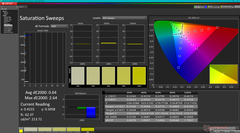
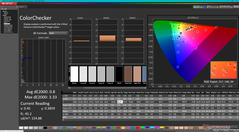
Leider kommt das Panel ohne Werkskalibrierung und die Farbtemperatur ist etwas zu warm eingestellt. Unsere eigene Kalibrierung verbessert die durchschnittlichen Graustufen- und Farb-DeltaE-Werte von 3,4 auf 1,1 und von 3,31 auf 0,8. Wir empfehlen daher unser kalibriertes ICM-Profile, welches weiter oben kostenfrei heruntergeladen werden kann.

Graustufen
Graustufen
Sättigung
Sättigung
ColorChecker
ColorChecker
Graustufen nach Kalibrierung
Sättigung nach Kalibrierung
ColorChecker nach Kalibrierung

Reaktionszeiten (Response Times) des Displays

Die Reaktionszeiten (Response Times) beschreiben wie schnell zwischen zwei Farben eines Pixels umgeschaltet werden kann. Langsame Response Times können zu einer verschwommenen Darstellung, Schlieren und Geisterbilder führen. Besonders bei schnellen 3D-Spielen sind kurze Umschaltzeiten wichtig.
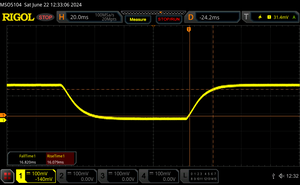
       Reaktionszeiten Schwarz zu Weiß
32.9 ms ... steigend ↗ und fallend ↘ kombiniert↗ 16.1 ms steigend
↘ 16.8 ms fallend
Die gemessenen Reaktionszeiten sind langsam und dadurch für viele Spieler wahrscheinlich zu langsam.
Im Vergleich rangierten die bei uns getesteten Geräte von 0.1 (Minimum) zu 240 (Maximum) ms. » 88 % aller Screens waren schneller als der getestete.
Daher sind die gemessenen Reaktionszeiten schlechter als der Durchschnitt aller vermessenen Geräte (21 ms).
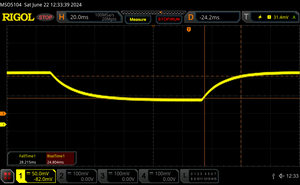
       Reaktionszeiten 50% Grau zu 80% Grau
53 ms ... steigend ↗ und fallend ↘ kombiniert↗ 24.8 ms steigend
↘ 28.2 ms fallend
Die gemessenen Reaktionszeiten sind langsam und dadurch für viele Spieler wahrscheinlich zu langsam.
Im Vergleich rangierten die bei uns getesteten Geräte von 0.165 (Minimum) zu 636 (Maximum) ms. » 89 % aller Screens waren schneller als der getestete.
Daher sind die gemessenen Reaktionszeiten schlechter als der Durchschnitt aller vermessenen Geräte (32.9 ms).

Bildschirm-Flackern / PWM (Pulse-Width Modulation)

Eine günstige Methode um die Helligkeit eines Bildschirms zu steuern, ist die Beleuchtung periodisch ein- und auszuschalten. Dies nennt sich PWM (Pulsweitenmodulation) Diese Umschaltung sollte mit einer hohen Frequenz stattfinden damit das menschliche Auge kein Flimmern wahrnimmt. Wenn die Frequenz zu niedrig ist, kann dies zu Ermüdungserscheinungen, Augenbrennen, Kopfweh und auch sichtbaren Flackern führen.
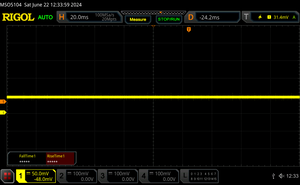
Flackern / PWM nicht festgestellt

Im Vergleich: 53 % aller getesteten Geräte nutzten kein PWM um die Helligkeit zu reduzieren. Wenn PWM eingesetzt wurde, dann bei einer Frequenz von durchschnittlich 8743 (Minimum 5, Maximum 343500) Hz.

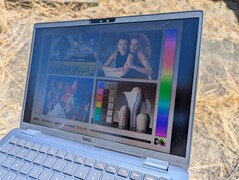
Draussen bei Sonnenschein
Draussen im Schatten
Draussen bei Sonnenschein
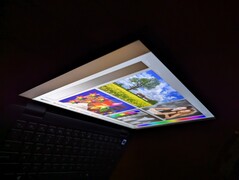
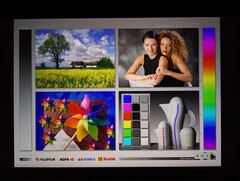
Weite IPS-Betrachtungswinkel

Leistung — Intel-Gen14-Upgrade


Testbedingungen

Vor allen Benchmarktests haben wir sowohl Windows als auch den Dell Optimizer in den Performance-Modus versetzt. 

Prozessor

Der Core Ultra 5 135U bietet einen respektablen Multi-Thread-Leistungsgewinn von etwa 20 bis 25 Prozent gegenüber dem Core i5-1345U im letztjährigen Latitude 7340. Zudem ist er schneller als der enttäuschende Core i7-1355U. Wählt man stattdessen den schnelleren Core Ultra 7 165U, so kann man sich auf einen zusätzlichen Leistungsgewinn von etwa 15 Prozent einstellen, wie unsere Erfahrungen mit dem Latitude 9450 2-in-1 zeigen.

Einer der Hauptvorteile des Core Ultra 5 135U gegenüber dem Core Ultra 5 125H ist die schlechtere Leistungskonstant des Letzteren über die Zeit. Läuft CineBench R15 xT in der Schleife, so sinkt die Leistung unserer U-Serien-CPU im Verlauf um ganze 30 Prozent, während die CPU der H-Serie ihre schnellere Leistung deutlich länger aufrecht erhalten kann. 

Cinebench R15 Multi Loop

011523034546057569080592010351150126513801495161017251840195520702185Tooltip
Dell Latitude 13 7350 Intel Core Ultra 5 135U: Ø1183 (1124.76-1633.59)
Dell Latitude 13 7340 i5-1345U Intel Core i5-1345U: Ø927 (879.93-1311.17)
Dell Latitude 13 7330 Intel Core i7-1265U: Ø1068 (1010.48-1420.35)
Lenovo ThinkBook 13x G4 21KR0008GE Intel Core Ultra 5 125H: Ø1373 (1247-1702.49)
Framework Laptop 13.5 Ryzen 7 7840U AMD Ryzen 7 7840U: Ø2158 (2124.16-2204.83)
CPU Performance Rating: Percent
Cinebench R23: Multi Core | Single Core
Cinebench R20: CPU (Multi Core) | CPU (Single Core)
Cinebench R15: CPU Multi 64Bit | CPU Single 64Bit
Blender: v2.79 BMW27 CPU
7-Zip 18.03: 7z b 4 | 7z b 4 -mmt1
Geekbench 6.3: Multi-Core | Single-Core
Geekbench 5.5: Multi-Core | Single-Core
HWBOT x265 Benchmark v2.2: 4k Preset
LibreOffice : 20 Documents To PDF
R Benchmark 2.5: Overall mean
CPU Performance Rating
Apple iPad Air 13 2024 -14!
Apple M2
92.2 pt
Framework Laptop 13.5 Ryzen 7 7840U
AMD Ryzen 7 7840U
85.8 pt
Dell XPS 13 9340 Core Ultra 7
Intel Core Ultra 7 155H
82.6 pt
Dell Latitude 9450 2-in-1
Intel Core Ultra 7 165U
72.5 pt
Lenovo ThinkBook 13x G4 21KR0008GE -1!
Intel Core Ultra 5 125H
69.5 pt
Lenovo Yoga Book 9 13IMU9
Intel Core Ultra 7 155U
67.3 pt
Lenovo ThinkPad L13 Yoga G4 i7-1355U
Intel Core i7-1355U
64.6 pt
Dell Latitude 13 7350
Intel Core Ultra 5 135U
64.5 pt
Durchschnittliche Intel Core Ultra 5 135U
 
64.5 pt
Dell Latitude 13 7330 -2!
Intel Core i7-1265U
62.2 pt
Dell Latitude 13 7340 i5-1345U -2!
Intel Core i5-1345U
59.1 pt
Lenovo Yoga 6 13 83B2001SGE -2!
AMD Ryzen 7 7730U
57.8 pt
HP ProBook 445 G10
AMD Ryzen 5 7530U
57.5 pt
HP EliteBook x360 830 G10 7L7U1ET
Intel Core i5-1335U
56.1 pt
Cinebench R23 / Multi Core
Framework Laptop 13.5 Ryzen 7 7840U
AMD Ryzen 7 7840U
13981 (12822.5min - 13981.2max) Points +50%
Dell XPS 13 9340 Core Ultra 7
Intel Core Ultra 7 155H
13511 Points +45%
Dell Latitude 9450 2-in-1
Intel Core Ultra 7 165U
10797 (9637.37min - 10796.8max) Points +16%
Lenovo Yoga Book 9 13IMU9
Intel Core Ultra 7 155U
9385 (8670.97min - 9384.63max) Points +1%
Dell Latitude 13 7350
Intel Core Ultra 5 135U
9315 (7452.65min - 9315.13max) Points
Durchschnittliche Intel Core Ultra 5 135U
  ()
9315 Points 0%
Lenovo ThinkBook 13x G4 21KR0008GE
Intel Core Ultra 5 125H
9194 Points -1%
Lenovo ThinkPad L13 Yoga G4 i7-1355U
Intel Core i7-1355U
8121 (5726.57min - 8120.5max) Points -13%
Dell Latitude 13 7330
Intel Core i7-1265U
8108 (6277.1min - 8107.56max) Points -13%
HP ProBook 445 G10
AMD Ryzen 5 7530U
7859 Points -16%
Dell Latitude 13 7340 i5-1345U
Intel Core i5-1345U
7724 (6035.35min - 7724.34max) Points -17%
Lenovo Yoga 6 13 83B2001SGE
AMD Ryzen 7 7730U
7286 Points -22%
HP EliteBook x360 830 G10 7L7U1ET
Intel Core i5-1335U
7273 Points -22%
Cinebench R23 / Single Core
Dell Latitude 13 7330
Intel Core i7-1265U
1738 Points +11%
Lenovo ThinkPad L13 Yoga G4 i7-1355U
Intel Core i7-1355U
1726 Points +10%
Dell Latitude 13 7340 i5-1345U
Intel Core i5-1345U
1724 Points +10%
Dell Latitude 9450 2-in-1
Intel Core Ultra 7 165U
1709 Points +9%
Dell XPS 13 9340 Core Ultra 7
Intel Core Ultra 7 155H
1685 Points +8%
Lenovo Yoga Book 9 13IMU9
Intel Core Ultra 7 155U
1675 Points +7%
Framework Laptop 13.5 Ryzen 7 7840U
AMD Ryzen 7 7840U
1647 Points +5%
HP EliteBook x360 830 G10 7L7U1ET
Intel Core i5-1335U
1645 Points +5%
Dell Latitude 13 7350
Intel Core Ultra 5 135U
1563 Points
Durchschnittliche Intel Core Ultra 5 135U
  ()
1563 Points 0%
Lenovo ThinkBook 13x G4 21KR0008GE
Intel Core Ultra 5 125H
1549 Points -1%
HP ProBook 445 G10
AMD Ryzen 5 7530U
1452 Points -7%
Lenovo Yoga 6 13 83B2001SGE
AMD Ryzen 7 7730U
1335 Points -15%
Cinebench R20 / CPU (Multi Core)
Framework Laptop 13.5 Ryzen 7 7840U
AMD Ryzen 7 7840U
5425 Points +49%
Dell XPS 13 9340 Core Ultra 7
Intel Core Ultra 7 155H
5181 Points +42%
Dell Latitude 9450 2-in-1
Intel Core Ultra 7 165U
4176 Points +15%
Lenovo ThinkBook 13x G4 21KR0008GE
Intel Core Ultra 5 125H
3673 Points +1%
Dell Latitude 13 7350
Intel Core Ultra 5 135U
3641 Points
Durchschnittliche Intel Core Ultra 5 135U
  ()
3641 Points 0%
Lenovo Yoga Book 9 13IMU9
Intel Core Ultra 7 155U
3613 Points -1%
Dell Latitude 13 7330
Intel Core i7-1265U
3195 Points -12%
Lenovo ThinkPad L13 Yoga G4 i7-1355U
Intel Core i7-1355U
3109 Points -15%
HP ProBook 445 G10
AMD Ryzen 5 7530U
3043 Points -16%
Dell Latitude 13 7340 i5-1345U
Intel Core i5-1345U
2951 Points -19%
Lenovo Yoga 6 13 83B2001SGE
AMD Ryzen 7 7730U
2849 Points -22%
HP EliteBook x360 830 G10 7L7U1ET
Intel Core i5-1335U
2602 Points -29%
Cinebench R20 / CPU (Single Core)
Dell Latitude 13 7340 i5-1345U
Intel Core i5-1345U
661 Points +9%
Dell Latitude 9450 2-in-1
Intel Core Ultra 7 165U
661 Points +9%
Dell XPS 13 9340 Core Ultra 7
Intel Core Ultra 7 155H
656 Points +8%
Lenovo ThinkBook 13x G4 21KR0008GE
Intel Core Ultra 5 125H
655 Points +8%
Lenovo ThinkPad L13 Yoga G4 i7-1355U
Intel Core i7-1355U
654 Points +8%
Dell Latitude 13 7330
Intel Core i7-1265U
651 Points +8%
Framework Laptop 13.5 Ryzen 7 7840U
AMD Ryzen 7 7840U
651 Points +8%
Lenovo Yoga Book 9 13IMU9
Intel Core Ultra 7 155U
646 Points +7%
HP EliteBook x360 830 G10 7L7U1ET
Intel Core i5-1335U
624 Points +3%
Dell Latitude 13 7350
Intel Core Ultra 5 135U
605 Points
Durchschnittliche Intel Core Ultra 5 135U
  ()
605 Points 0%
HP ProBook 445 G10
AMD Ryzen 5 7530U
566 Points -6%
Lenovo Yoga 6 13 83B2001SGE
AMD Ryzen 7 7730U
533 Points -12%
Cinebench R15 / CPU Multi 64Bit
Dell XPS 13 9340 Core Ultra 7
Intel Core Ultra 7 155H
2230 (1358.56min - 2230.28max) Points +36%
Framework Laptop 13.5 Ryzen 7 7840U
AMD Ryzen 7 7840U
2205 (2124.16min - 2204.83max) Points +35%
Lenovo ThinkBook 13x G4 21KR0008GE
Intel Core Ultra 5 125H
1702 (1247min - 1702.49max) Points +4%
Dell Latitude 9450 2-in-1
Intel Core Ultra 7 165U
1667 (1433.95min - 1667.01max) Points +2%
Dell Latitude 13 7350
Intel Core Ultra 5 135U
1634 (1124.76min - 1633.59max) Points
Durchschnittliche Intel Core Ultra 5 135U
  ()
1634 Points 0%
Lenovo Yoga 6 13 83B2001SGE
AMD Ryzen 7 7730U
1588 (1265.06min - 1588.12max) Points -3%
Lenovo Yoga Book 9 13IMU9
Intel Core Ultra 7 155U
1505 (1278.32min - 1504.72max) Points -8%
Dell Latitude 13 7330
Intel Core i7-1265U
1420 (1010.48min - 1420.35max) Points -13%
HP ProBook 445 G10
AMD Ryzen 5 7530U
1328 (1245.87min - 1328.42max) Points -19%
Dell Latitude 13 7340 i5-1345U
Intel Core i5-1345U
1311 (879.93min - 1311.17max) Points -20%
Lenovo ThinkPad L13 Yoga G4 i7-1355U
Intel Core i7-1355U
1274 (821.2min - 1273.6max) Points -22%
HP EliteBook x360 830 G10 7L7U1ET
Intel Core i5-1335U
1109 (847.35min - 1109.32max) Points -32%
Cinebench R15 / CPU Single 64Bit
Dell XPS 13 9340 Core Ultra 7
Intel Core Ultra 7 155H
253 Points +11%
Dell Latitude 9450 2-in-1
Intel Core Ultra 7 165U
252 Points +11%
Dell Latitude 13 7330
Intel Core i7-1265U
250 Points +10%
Framework Laptop 13.5 Ryzen 7 7840U
AMD Ryzen 7 7840U
249 Points +9%
Lenovo ThinkBook 13x G4 21KR0008GE
Intel Core Ultra 5 125H
247 Points +8%
Dell Latitude 13 7340 i5-1345U
Intel Core i5-1345U
240 Points +5%
Lenovo ThinkPad L13 Yoga G4 i7-1355U
Intel Core i7-1355U
237 Points +4%
HP ProBook 445 G10
AMD Ryzen 5 7530U
234 Points +3%
HP EliteBook x360 830 G10 7L7U1ET
Intel Core i5-1335U
234 Points +3%
Lenovo Yoga Book 9 13IMU9
Intel Core Ultra 7 155U
230 Points +1%
Dell Latitude 13 7350
Intel Core Ultra 5 135U
228 Points
Durchschnittliche Intel Core Ultra 5 135U
  ()
228 Points 0%
Lenovo Yoga 6 13 83B2001SGE
AMD Ryzen 7 7730U
221 Points -3%
Blender / v2.79 BMW27 CPU
Dell Latitude 13 7340 i5-1345U
Intel Core i5-1345U
495 Seconds * -38%
Lenovo ThinkPad L13 Yoga G4 i7-1355U
Intel Core i7-1355U
470 Seconds * -31%
HP EliteBook x360 830 G10 7L7U1ET
Intel Core i5-1335U
469 Seconds * -31%
Dell Latitude 13 7330
Intel Core i7-1265U
413 Seconds * -15%
HP ProBook 445 G10
AMD Ryzen 5 7530U
384 Seconds * -7%
Lenovo Yoga 6 13 83B2001SGE
AMD Ryzen 7 7730U
374 Seconds * -4%
Dell Latitude 13 7350
Intel Core Ultra 5 135U
358 Seconds *
Durchschnittliche Intel Core Ultra 5 135U
  ()
358 Seconds * -0%
Lenovo ThinkBook 13x G4 21KR0008GE
Intel Core Ultra 5 125H
357 Seconds * -0%
Lenovo Yoga Book 9 13IMU9
Intel Core Ultra 7 155U
353 Seconds * +1%
Dell Latitude 9450 2-in-1
Intel Core Ultra 7 165U
310 Seconds * +13%
Dell XPS 13 9340 Core Ultra 7
Intel Core Ultra 7 155H
243 Seconds * +32%
Framework Laptop 13.5 Ryzen 7 7840U
AMD Ryzen 7 7840U
230 Seconds * +36%
7-Zip 18.03 / 7z b 4
Framework Laptop 13.5 Ryzen 7 7840U
AMD Ryzen 7 7840U
61902 MIPS +61%
Dell XPS 13 9340 Core Ultra 7
Intel Core Ultra 7 155H
58233 MIPS +52%
Dell Latitude 9450 2-in-1
Intel Core Ultra 7 165U
43441 MIPS +13%
Lenovo Yoga 6 13 83B2001SGE
AMD Ryzen 7 7730U
40263 MIPS +5%
Lenovo Yoga Book 9 13IMU9
Intel Core Ultra 7 155U
38645 MIPS +1%
Dell Latitude 13 7350
Intel Core Ultra 5 135U
38415 MIPS
Durchschnittliche Intel Core Ultra 5 135U
  ()
38415 MIPS 0%
HP ProBook 445 G10
AMD Ryzen 5 7530U
37983 MIPS -1%
Lenovo ThinkPad L13 Yoga G4 i7-1355U
Intel Core i7-1355U
34105 MIPS -11%
Dell Latitude 13 7330
Intel Core i7-1265U
31869 MIPS -17%
HP EliteBook x360 830 G10 7L7U1ET
Intel Core i5-1335U
30429 MIPS -21%
Dell Latitude 13 7340 i5-1345U
Intel Core i5-1345U
30098 MIPS -22%
7-Zip 18.03 / 7z b 4 -mmt1
Framework Laptop 13.5 Ryzen 7 7840U
AMD Ryzen 7 7840U
6408 MIPS +38%
Dell Latitude 13 7330
Intel Core i7-1265U
5615 MIPS +21%
HP ProBook 445 G10
AMD Ryzen 5 7530U
5434 MIPS +17%
Dell XPS 13 9340 Core Ultra 7
Intel Core Ultra 7 155H
5410 MIPS +16%
Lenovo ThinkPad L13 Yoga G4 i7-1355U
Intel Core i7-1355U
5405 MIPS +16%
Lenovo Yoga 6 13 83B2001SGE
AMD Ryzen 7 7730U
5222 MIPS +12%
Dell Latitude 13 7340 i5-1345U
Intel Core i5-1345U
5212 MIPS +12%
Lenovo ThinkBook 13x G4 21KR0008GE
Intel Core Ultra 5 125H
5082 MIPS +9%
Dell Latitude 9450 2-in-1
Intel Core Ultra 7 165U
4938 MIPS +6%
HP EliteBook x360 830 G10 7L7U1ET
Intel Core i5-1335U
4872 MIPS +5%
Lenovo Yoga Book 9 13IMU9
Intel Core Ultra 7 155U
4855 MIPS +4%
Dell Latitude 13 7350
Intel Core Ultra 5 135U
4649 MIPS
Durchschnittliche Intel Core Ultra 5 135U
  ()
4649 MIPS 0%
Geekbench 6.3 / Multi-Core
Dell XPS 13 9340 Core Ultra 7
Intel Core Ultra 7 155H
11982 Points +26%
Framework Laptop 13.5 Ryzen 7 7840U
AMD Ryzen 7 7840U
11489 Points +21%
Lenovo ThinkBook 13x G4 21KR0008GE
Intel Core Ultra 5 125H
11192 Points +18%
Apple iPad Air 13 2024
Apple M2
10120 Points +6%
Dell Latitude 9450 2-in-1
Intel Core Ultra 7 165U
9944 Points +5%
Dell Latitude 13 7350
Intel Core Ultra 5 135U
9514 Points
Durchschnittliche Intel Core Ultra 5 135U
  ()
9514 Points 0%
Lenovo Yoga Book 9 13IMU9
Intel Core Ultra 7 155U
9448 Points -1%
Lenovo ThinkPad L13 Yoga G4 i7-1355U
Intel Core i7-1355U
8908 Points -6%
HP EliteBook x360 830 G10 7L7U1ET
Intel Core i5-1335U
8615 Points -9%
HP ProBook 445 G10
AMD Ryzen 5 7530U
6099 Points -36%
Geekbench 6.3 / Single-Core
Apple iPad Air 13 2024
Apple M2
2605 Points +20%
Framework Laptop 13.5 Ryzen 7 7840U
AMD Ryzen 7 7840U
2553 Points +17%
Lenovo ThinkPad L13 Yoga G4 i7-1355U
Intel Core i7-1355U
2550 Points +17%
Dell XPS 13 9340 Core Ultra 7
Intel Core Ultra 7 155H
2408 Points +11%
Dell Latitude 9450 2-in-1
Intel Core Ultra 7 165U
2356 Points +8%
Lenovo Yoga Book 9 13IMU9
Intel Core Ultra 7 155U
2324 Points +7%
Lenovo ThinkBook 13x G4 21KR0008GE
Intel Core Ultra 5 125H
2279 Points +5%
HP EliteBook x360 830 G10 7L7U1ET
Intel Core i5-1335U
2243 Points +3%
Dell Latitude 13 7350
Intel Core Ultra 5 135U
2176 Points
Durchschnittliche Intel Core Ultra 5 135U
  ()
2176 Points 0%
HP ProBook 445 G10
AMD Ryzen 5 7530U
1913 Points -12%
Geekbench 5.5 / Multi-Core
Dell XPS 13 9340 Core Ultra 7
Intel Core Ultra 7 155H
11279 Points +32%
Framework Laptop 13.5 Ryzen 7 7840U
AMD Ryzen 7 7840U
10558 Points +24%
Lenovo ThinkBook 13x G4 21KR0008GE
Intel Core Ultra 5 125H
10309 Points +21%
Dell Latitude 9450 2-in-1
Intel Core Ultra 7 165U
8719 Points +2%
Dell Latitude 13 7350
Intel Core Ultra 5 135U
8533 Points
Durchschnittliche Intel Core Ultra 5 135U
  ()
8533 Points 0%
Lenovo Yoga Book 9 13IMU9
Intel Core Ultra 7 155U
8409 Points -1%
Lenovo ThinkPad L13 Yoga G4 i7-1355U
Intel Core i7-1355U
7783 Points -9%
Dell Latitude 13 7340 i5-1345U
Intel Core i5-1345U
7738 Points -9%
Lenovo Yoga 6 13 83B2001SGE
AMD Ryzen 7 7730U
7423 Points -13%
Dell Latitude 13 7330
Intel Core i7-1265U
6937 Points -19%
HP ProBook 445 G10
AMD Ryzen 5 7530U
5608 Points -34%
HP EliteBook x360 830 G10 7L7U1ET
Intel Core i5-1335U
5459 Points -36%
Geekbench 5.5 / Single-Core
Framework Laptop 13.5 Ryzen 7 7840U
AMD Ryzen 7 7840U
1912 Points +22%
Lenovo ThinkPad L13 Yoga G4 i7-1355U
Intel Core i7-1355U
1829 Points +17%
Dell Latitude 13 7330
Intel Core i7-1265U
1778 Points +13%
Dell XPS 13 9340 Core Ultra 7
Intel Core Ultra 7 155H
1775 Points +13%
Dell Latitude 9450 2-in-1
Intel Core Ultra 7 165U
1735 Points +11%
Lenovo Yoga Book 9 13IMU9
Intel Core Ultra 7 155U
1691 Points +8%
Lenovo ThinkBook 13x G4 21KR0008GE
Intel Core Ultra 5 125H
1684 Points +7%
Dell Latitude 13 7340 i5-1345U
Intel Core i5-1345U
1613 Points +3%
Dell Latitude 13 7350
Intel Core Ultra 5 135U
1568 Points
Durchschnittliche Intel Core Ultra 5 135U
  ()
1568 Points 0%
HP EliteBook x360 830 G10 7L7U1ET
Intel Core i5-1335U
1506 Points -4%
Lenovo Yoga 6 13 83B2001SGE
AMD Ryzen 7 7730U
1471 Points -6%
HP ProBook 445 G10
AMD Ryzen 5 7530U
1462 Points -7%
HWBOT x265 Benchmark v2.2 / 4k Preset
Framework Laptop 13.5 Ryzen 7 7840U
AMD Ryzen 7 7840U
17.4 fps +69%
Dell XPS 13 9340 Core Ultra 7
Intel Core Ultra 7 155H
15.5 fps +50%
Dell Latitude 9450 2-in-1
Intel Core Ultra 7 165U
12.3 fps +19%
Lenovo Yoga Book 9 13IMU9
Intel Core Ultra 7 155U
10.7 fps +4%
Dell Latitude 13 7350
Intel Core Ultra 5 135U
10.3 fps
Durchschnittliche Intel Core Ultra 5 135U
  ()
10.3 fps 0%
HP ProBook 445 G10
AMD Ryzen 5 7530U
9.95 fps -3%
Lenovo Yoga 6 13 83B2001SGE
AMD Ryzen 7 7730U
9.91 fps -4%
Lenovo ThinkBook 13x G4 21KR0008GE
Intel Core Ultra 5 125H
9.7 fps -6%
Dell Latitude 13 7330
Intel Core i7-1265U
9.37 fps -9%
Lenovo ThinkPad L13 Yoga G4 i7-1355U
Intel Core i7-1355U
9.28 fps -10%
HP EliteBook x360 830 G10 7L7U1ET
Intel Core i5-1335U
8.1 fps -21%
Dell Latitude 13 7340 i5-1345U
Intel Core i5-1345U
7.46 fps -28%
LibreOffice / 20 Documents To PDF
HP EliteBook x360 830 G10 7L7U1ET
Intel Core i5-1335U
58.7 s * -12%
HP ProBook 445 G10
AMD Ryzen 5 7530U
54.4 s * -4%
Dell Latitude 13 7350
Intel Core Ultra 5 135U
52.2 s *
Durchschnittliche Intel Core Ultra 5 135U
  ()
52.2 s * -0%
Lenovo ThinkBook 13x G4 21KR0008GE
Intel Core Ultra 5 125H
49.2 s * +6%
Dell Latitude 13 7330
Intel Core i7-1265U
49.1 s * +6%
Lenovo Yoga 6 13 83B2001SGE
AMD Ryzen 7 7730U
48.4 s * +7%
Dell XPS 13 9340 Core Ultra 7
Intel Core Ultra 7 155H
47.8 s * +8%
Lenovo ThinkPad L13 Yoga G4 i7-1355U
Intel Core i7-1355U
46.6 s * +11%
Lenovo Yoga Book 9 13IMU9
Intel Core Ultra 7 155U
44.3 s * +15%
Framework Laptop 13.5 Ryzen 7 7840U
AMD Ryzen 7 7840U
44.1 s * +16%
Dell Latitude 9450 2-in-1
Intel Core Ultra 7 165U
43.5 s * +17%
Dell Latitude 13 7340 i5-1345U
Intel Core i5-1345U
40.3 s * +23%
R Benchmark 2.5 / Overall mean
Dell Latitude 13 7350
Intel Core Ultra 5 135U
0.544 sec *
Durchschnittliche Intel Core Ultra 5 135U
  ()
0.544 sec * -0%
Lenovo Yoga 6 13 83B2001SGE
AMD Ryzen 7 7730U
0.543 sec * -0%
HP ProBook 445 G10
AMD Ryzen 5 7530U
0.528 sec * +3%
HP EliteBook x360 830 G10 7L7U1ET
Intel Core i5-1335U
0.521 sec * +4%
Lenovo Yoga Book 9 13IMU9
Intel Core Ultra 7 155U
0.508 sec * +7%
Lenovo ThinkBook 13x G4 21KR0008GE
Intel Core Ultra 5 125H
0.503 sec * +8%
Dell Latitude 13 7340 i5-1345U
Intel Core i5-1345U
0.4999 sec * +8%
Dell Latitude 9450 2-in-1
Intel Core Ultra 7 165U
0.4881 sec * +10%
Dell XPS 13 9340 Core Ultra 7
Intel Core Ultra 7 155H
0.4829 sec * +11%
Dell Latitude 13 7330
Intel Core i7-1265U
0.4772 sec * +12%
Lenovo ThinkPad L13 Yoga G4 i7-1355U
Intel Core i7-1355U
0.47 sec * +14%
Framework Laptop 13.5 Ryzen 7 7840U
AMD Ryzen 7 7840U
0.456 sec * +16%
CPU Performance Rating: Percent
Cinebench R23: Multi Core | Single Core
Cinebench R20: CPU (Multi Core) | CPU (Single Core)
Cinebench R15: CPU Multi 64Bit | CPU Single 64Bit
Blender: v2.79 BMW27 CPU
7-Zip 18.03: 7z b 4 | 7z b 4 -mmt1
Geekbench 6.3: Multi-Core | Single-Core
Geekbench 5.5: Multi-Core | Single-Core
HWBOT x265 Benchmark v2.2: 4k Preset
LibreOffice : 20 Documents To PDF
R Benchmark 2.5: Overall mean

* ... kleinere Werte sind besser

Cinebench R15 CPU Multi 64Bit
1634 Points
Cinebench R15 OpenGL 64Bit
103.6 fps
Cinebench R15 Ref. Match 64Bit
97.8 %
Cinebench R15 CPU Single 64Bit
228 Points
Cinebench R20 CPU (Multi Core)
3641 Points
Cinebench R20 CPU (Single Core)
605 Points
Cinebench R23 Single Core
1563 Points
Cinebench R23 Multi Core
9315 Points
Hilfe
Performance Rating
Framework Laptop 13.5 Ryzen 7 7840U
AMD Ryzen 7 7840U, Radeon 780M
97.1 pt
Lenovo ThinkBook 13x G4 21KR0008GE
Intel Core Ultra 5 125H, Arc 7-Core
53.6 pt
Dell Latitude 13 7350
Intel Core Ultra 5 135U, Graphics 4-Core
48.3 pt
Durchschnittliche Intel Core Ultra 5 135U
 
48.3 pt
Dell Latitude 13 7330
Intel Core i7-1265U, Iris Xe G7 96EUs
40.1 pt
Dell Latitude 13 7340 i5-1345U
Intel Core i5-1345U, Iris Xe G7 80EUs
37.3 pt
AIDA64 / FP32 Ray-Trace
Framework Laptop 13.5 Ryzen 7 7840U
AMD Ryzen 7 7840U, Radeon 780M
22071 KRay/s +174%
Lenovo ThinkBook 13x G4 21KR0008GE
Intel Core Ultra 5 125H, Arc 7-Core
8430 KRay/s +5%
Dell Latitude 13 7350
Intel Core Ultra 5 135U, Graphics 4-Core
8054 KRay/s
Durchschnittliche Intel Core Ultra 5 135U
  ()
8054 KRay/s 0%
Dell Latitude 13 7330
Intel Core i7-1265U, Iris Xe G7 96EUs
6343 KRay/s -21%
Dell Latitude 13 7340 i5-1345U
Intel Core i5-1345U, Iris Xe G7 80EUs
5500 KRay/s -32%
AIDA64 / FPU Julia
Framework Laptop 13.5 Ryzen 7 7840U
AMD Ryzen 7 7840U, Radeon 780M
93684 Points +126%
Lenovo ThinkBook 13x G4 21KR0008GE
Intel Core Ultra 5 125H, Arc 7-Core
44947 Points +8%
Dell Latitude 13 7350
Intel Core Ultra 5 135U, Graphics 4-Core
41515 Points
Durchschnittliche Intel Core Ultra 5 135U
  ()
41515 Points 0%
Dell Latitude 13 7330
Intel Core i7-1265U, Iris Xe G7 96EUs
36027 Points -13%
Dell Latitude 13 7340 i5-1345U
Intel Core i5-1345U, Iris Xe G7 80EUs
28617 Points -31%
AIDA64 / CPU SHA3
Framework Laptop 13.5 Ryzen 7 7840U
AMD Ryzen 7 7840U, Radeon 780M
4256 MB/s +93%
Dell Latitude 13 7350
Intel Core Ultra 5 135U, Graphics 4-Core
2201 MB/s
Durchschnittliche Intel Core Ultra 5 135U
  ()
2201 MB/s 0%
Lenovo ThinkBook 13x G4 21KR0008GE
Intel Core Ultra 5 125H, Arc 7-Core
2047 MB/s -7%
Dell Latitude 13 7330
Intel Core i7-1265U, Iris Xe G7 96EUs
1972 MB/s -10%
Dell Latitude 13 7340 i5-1345U
Intel Core i5-1345U, Iris Xe G7 80EUs
1459 MB/s -34%
AIDA64 / CPU Queen
Framework Laptop 13.5 Ryzen 7 7840U
AMD Ryzen 7 7840U, Radeon 780M
107879 Points +126%
Lenovo ThinkBook 13x G4 21KR0008GE
Intel Core Ultra 5 125H, Arc 7-Core
79986 Points +67%
Dell Latitude 13 7330
Intel Core i7-1265U, Iris Xe G7 96EUs
63914 Points +34%
Dell Latitude 13 7340 i5-1345U
Intel Core i5-1345U, Iris Xe G7 80EUs
62305 Points +30%
Dell Latitude 13 7350
Intel Core Ultra 5 135U, Graphics 4-Core
47816 Points
Durchschnittliche Intel Core Ultra 5 135U
  ()
47816 Points 0%
AIDA64 / FPU SinJulia
Framework Laptop 13.5 Ryzen 7 7840U
AMD Ryzen 7 7840U, Radeon 780M
13499 Points +145%
Lenovo ThinkBook 13x G4 21KR0008GE
Intel Core Ultra 5 125H, Arc 7-Core
6588 Points +19%
Dell Latitude 13 7350
Intel Core Ultra 5 135U, Graphics 4-Core
5513 Points
Durchschnittliche Intel Core Ultra 5 135U
  ()
5513 Points 0%
Dell Latitude 13 7330
Intel Core i7-1265U, Iris Xe G7 96EUs
4266 Points -23%
Dell Latitude 13 7340 i5-1345U
Intel Core i5-1345U, Iris Xe G7 80EUs
4077 Points -26%
AIDA64 / FPU Mandel
Framework Laptop 13.5 Ryzen 7 7840U
AMD Ryzen 7 7840U, Radeon 780M
50190 Points +143%
Lenovo ThinkBook 13x G4 21KR0008GE
Intel Core Ultra 5 125H, Arc 7-Core
21210 Points +3%
Dell Latitude 13 7350
Intel Core Ultra 5 135U, Graphics 4-Core
20640 Points
Durchschnittliche Intel Core Ultra 5 135U
  ()
20640 Points 0%
Dell Latitude 13 7330
Intel Core i7-1265U, Iris Xe G7 96EUs
16893 Points -18%
Dell Latitude 13 7340 i5-1345U
Intel Core i5-1345U, Iris Xe G7 80EUs
13914 Points -33%
AIDA64 / CPU AES
Framework Laptop 13.5 Ryzen 7 7840U
AMD Ryzen 7 7840U, Radeon 780M
147611 MB/s +241%
Lenovo ThinkBook 13x G4 21KR0008GE
Intel Core Ultra 5 125H, Arc 7-Core
48373 MB/s +12%
Dell Latitude 13 7350
Intel Core Ultra 5 135U, Graphics 4-Core
43270 MB/s
Durchschnittliche Intel Core Ultra 5 135U
  ()
43270 MB/s 0%
Dell Latitude 13 7330
Intel Core i7-1265U, Iris Xe G7 96EUs
37800 MB/s -13%
Dell Latitude 13 7340 i5-1345U
Intel Core i5-1345U, Iris Xe G7 80EUs
29897 MB/s -31%
AIDA64 / CPU ZLib
Framework Laptop 13.5 Ryzen 7 7840U
AMD Ryzen 7 7840U, Radeon 780M
915 MB/s +43%
Dell Latitude 13 7350
Intel Core Ultra 5 135U, Graphics 4-Core
638 MB/s
Durchschnittliche Intel Core Ultra 5 135U
  ()
638 MB/s 0%
Lenovo ThinkBook 13x G4 21KR0008GE
Intel Core Ultra 5 125H, Arc 7-Core
612 MB/s -4%
Dell Latitude 13 7330
Intel Core i7-1265U, Iris Xe G7 96EUs
567 MB/s -11%
Dell Latitude 13 7340 i5-1345U
Intel Core i5-1345U, Iris Xe G7 80EUs
434 MB/s -32%
AIDA64 / FP64 Ray-Trace
Framework Laptop 13.5 Ryzen 7 7840U
AMD Ryzen 7 7840U, Radeon 780M
11834 KRay/s +190%
Lenovo ThinkBook 13x G4 21KR0008GE
Intel Core Ultra 5 125H, Arc 7-Core
4421 KRay/s +8%
Dell Latitude 13 7350
Intel Core Ultra 5 135U, Graphics 4-Core
4080 KRay/s
Durchschnittliche Intel Core Ultra 5 135U
  ()
4080 KRay/s 0%
Dell Latitude 13 7330
Intel Core i7-1265U, Iris Xe G7 96EUs
3354 KRay/s -18%
Dell Latitude 13 7340 i5-1345U
Intel Core i5-1345U, Iris Xe G7 80EUs
2812 KRay/s -31%
AIDA64 / CPU PhotoWorxx
Lenovo ThinkBook 13x G4 21KR0008GE
Intel Core Ultra 5 125H, Arc 7-Core
47353 MPixel/s +11%
Dell Latitude 13 7350
Intel Core Ultra 5 135U, Graphics 4-Core
42814 MPixel/s
Durchschnittliche Intel Core Ultra 5 135U
  ()
42814 MPixel/s 0%
Dell Latitude 13 7340 i5-1345U
Intel Core i5-1345U, Iris Xe G7 80EUs
35928 MPixel/s -16%
Framework Laptop 13.5 Ryzen 7 7840U
AMD Ryzen 7 7840U, Radeon 780M
33560 MPixel/s -22%
Dell Latitude 13 7330
Intel Core i7-1265U, Iris Xe G7 96EUs
22108 MPixel/s -48%

Stresstest

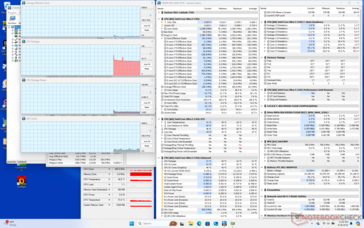
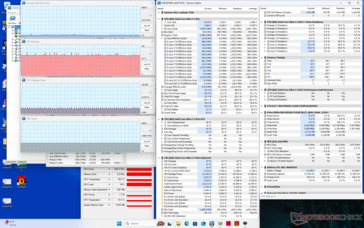
Beim Start von Prime95 boosten die CPU-Kerne kurz auf die Werte 3,2 GHz , 59 W und 100 °C hoch. Nach wenigen Sekunden fallen diese auf 2,1 GHz und 24 W und stabilisieren sich schließlich bei 1,8 GHz, 17 W und 68 °C. Der gleiche Test resultiert auf dem Latitude 7330 mit dem älteren Core i7-1265U in wärmeren Kerntemperaturen trotz schwächerer Leistung, hier sieht man, dass sich die Leistung-pro-Watt zwischen den Intel-Generationen gesteigert hat. Dennoch fällt der Leistungsabfall von 3,2 GHz auf nur noch 1,8 GHz steiler aus als uns lieb ist, auch bei einer Core-U-CPU.

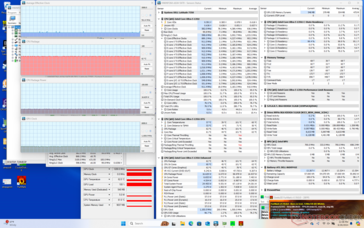
GPU-Takt und -Temperatur stabilisieren sich unter Witcher 3 bei 1.900 MHz und 65 °C, verglichen mit nur 1.247 MHz und 83 °C auf dem Latitude 7330. Insgesamt läuft unser Testsystem also kühler als das zwei Jahre alte Latitude 7330.

Leerlauf
Leerlauf
Witcher-3-Stress
Witcher-3-Stress
Prime95-Stress
Prime95-Stress
Prime95+FurMark-Stress
Durchschnittlicher CPU-Takt (GHz) GPU-Takt (MHz) Durchschnittliche CPU-Temperatur (°C)
Leerlauf -- -- 46
Prime95-Stress 1,8 -- 68
Prime95 + FurMark-Stress 0,9 1.100 62
Witcher-3-Stress 0,3 1.900 65

Systemleistung

Die PCMark-Scores sind mit denen des Latitude 7340 vergleichbar, einzig im GPU-lastigen Subtest Digital Content Creation kann die neuere CPU spürbar mehr herausholen.

PCMark 10 Standard
PCMark 10 Standard
PCMark 10 / Score
Framework Laptop 13.5 Ryzen 7 7840U
Radeon 780M, R7 7840U, WD PC SN740 512GB SDDPNQD-512G
7157 Points +31%
Lenovo ThinkBook 13x G4 21KR0008GE
Arc 7-Core, Ultra 5 125H, Samsung PM9C1a MZAL8512HDLU
6293 Points +15%
Dell Latitude 13 7350
Graphics 4-Core, Ultra 5 135U, Kioxia BG6 KBG60ZNS512G
5454 Points
Durchschnittliche Intel Core Ultra 5 135U, Intel Graphics 4-Cores iGPU (Arc)
  ()
5454 Points 0%
Dell Latitude 13 7340 i5-1345U
Iris Xe G7 80EUs, i5-1345U, Kioxia BG5 KBG50ZNS512G
5338 Points -2%
Dell Latitude 13 7330
Iris Xe G7 96EUs, i7-1265U, Toshiba KBG40ZNS512G NVMe
5182 Points -5%
PCMark 10 / Essentials
Framework Laptop 13.5 Ryzen 7 7840U
Radeon 780M, R7 7840U, WD PC SN740 512GB SDDPNQD-512G
11081 Points +15%
Dell Latitude 13 7330
Iris Xe G7 96EUs, i7-1265U, Toshiba KBG40ZNS512G NVMe
10559 Points +9%
Dell Latitude 13 7340 i5-1345U
Iris Xe G7 80EUs, i5-1345U, Kioxia BG5 KBG50ZNS512G
10352 Points +7%
Lenovo ThinkBook 13x G4 21KR0008GE
Arc 7-Core, Ultra 5 125H, Samsung PM9C1a MZAL8512HDLU
10159 Points +5%
Dell Latitude 13 7350
Graphics 4-Core, Ultra 5 135U, Kioxia BG6 KBG60ZNS512G
9668 Points
Durchschnittliche Intel Core Ultra 5 135U, Intel Graphics 4-Cores iGPU (Arc)
  ()
9668 Points 0%
PCMark 10 / Productivity
Framework Laptop 13.5 Ryzen 7 7840U
Radeon 780M, R7 7840U, WD PC SN740 512GB SDDPNQD-512G
9989 Points +45%
Lenovo ThinkBook 13x G4 21KR0008GE
Arc 7-Core, Ultra 5 125H, Samsung PM9C1a MZAL8512HDLU
8000 Points +16%
Dell Latitude 13 7340 i5-1345U
Iris Xe G7 80EUs, i5-1345U, Kioxia BG5 KBG50ZNS512G
7165 Points +4%
Dell Latitude 13 7330
Iris Xe G7 96EUs, i7-1265U, Toshiba KBG40ZNS512G NVMe
6978 Points +1%
Dell Latitude 13 7350
Graphics 4-Core, Ultra 5 135U, Kioxia BG6 KBG60ZNS512G
6912 Points
Durchschnittliche Intel Core Ultra 5 135U, Intel Graphics 4-Cores iGPU (Arc)
  ()
6912 Points 0%
PCMark 10 / Digital Content Creation
Framework Laptop 13.5 Ryzen 7 7840U
Radeon 780M, R7 7840U, WD PC SN740 512GB SDDPNQD-512G
8987 Points +36%
Lenovo ThinkBook 13x G4 21KR0008GE
Arc 7-Core, Ultra 5 125H, Samsung PM9C1a MZAL8512HDLU
8321 Points +26%
Dell Latitude 13 7350
Graphics 4-Core, Ultra 5 135U, Kioxia BG6 KBG60ZNS512G
6589 Points
Durchschnittliche Intel Core Ultra 5 135U, Intel Graphics 4-Cores iGPU (Arc)
  ()
6589 Points 0%
Dell Latitude 13 7340 i5-1345U
Iris Xe G7 80EUs, i5-1345U, Kioxia BG5 KBG50ZNS512G
5568 Points -15%
Dell Latitude 13 7330
Iris Xe G7 96EUs, i7-1265U, Toshiba KBG40ZNS512G NVMe
5127 Points -22%
CrossMark / Overall
Framework Laptop 13.5 Ryzen 7 7840U
Radeon 780M, R7 7840U, WD PC SN740 512GB SDDPNQD-512G
1682 Points +31%
Lenovo ThinkBook 13x G4 21KR0008GE
Arc 7-Core, Ultra 5 125H, Samsung PM9C1a MZAL8512HDLU
1548 Points +20%
Dell Latitude 13 7340 i5-1345U
Iris Xe G7 80EUs, i5-1345U, Kioxia BG5 KBG50ZNS512G
1531 Points +19%
Dell Latitude 13 7330
Iris Xe G7 96EUs, i7-1265U, Toshiba KBG40ZNS512G NVMe
1474 Points +15%
Apple iPad Air 13 2024
M2 10-Core GPU, M2, 128 GB NVMe
1468 Points +14%
Dell Latitude 13 7350
Graphics 4-Core, Ultra 5 135U, Kioxia BG6 KBG60ZNS512G
1287 Points
Durchschnittliche Intel Core Ultra 5 135U, Intel Graphics 4-Cores iGPU (Arc)
  ()
1287 Points 0%
CrossMark / Productivity
Framework Laptop 13.5 Ryzen 7 7840U
Radeon 780M, R7 7840U, WD PC SN740 512GB SDDPNQD-512G
1627 Points +32%
Dell Latitude 13 7340 i5-1345U
Iris Xe G7 80EUs, i5-1345U, Kioxia BG5 KBG50ZNS512G
1504 Points +22%
Lenovo ThinkBook 13x G4 21KR0008GE
Arc 7-Core, Ultra 5 125H, Samsung PM9C1a MZAL8512HDLU
1483 Points +20%
Dell Latitude 13 7330
Iris Xe G7 96EUs, i7-1265U, Toshiba KBG40ZNS512G NVMe
1478 Points +20%
Apple iPad Air 13 2024
M2 10-Core GPU, M2, 128 GB NVMe
1354 Points +10%
Dell Latitude 13 7350
Graphics 4-Core, Ultra 5 135U, Kioxia BG6 KBG60ZNS512G
1236 Points
Durchschnittliche Intel Core Ultra 5 135U, Intel Graphics 4-Cores iGPU (Arc)
  ()
1236 Points 0%
CrossMark / Creativity
Framework Laptop 13.5 Ryzen 7 7840U
Radeon 780M, R7 7840U, WD PC SN740 512GB SDDPNQD-512G
1835 Points +27%
Apple iPad Air 13 2024
M2 10-Core GPU, M2, 128 GB NVMe
1788 Points +24%
Lenovo ThinkBook 13x G4 21KR0008GE
Arc 7-Core, Ultra 5 125H, Samsung PM9C1a MZAL8512HDLU
1727 Points +20%
Dell Latitude 13 7340 i5-1345U
Iris Xe G7 80EUs, i5-1345U, Kioxia BG5 KBG50ZNS512G
1635 Points +14%
Dell Latitude 13 7330
Iris Xe G7 96EUs, i7-1265U, Toshiba KBG40ZNS512G NVMe
1549 Points +8%
Dell Latitude 13 7350
Graphics 4-Core, Ultra 5 135U, Kioxia BG6 KBG60ZNS512G
1440 Points
Durchschnittliche Intel Core Ultra 5 135U, Intel Graphics 4-Cores iGPU (Arc)
  ()
1440 Points 0%
CrossMark / Responsiveness
Framework Laptop 13.5 Ryzen 7 7840U
Radeon 780M, R7 7840U, WD PC SN740 512GB SDDPNQD-512G
1429 Points +38%
Dell Latitude 13 7340 i5-1345U
Iris Xe G7 80EUs, i5-1345U, Kioxia BG5 KBG50ZNS512G
1325 Points +28%
Lenovo ThinkBook 13x G4 21KR0008GE
Arc 7-Core, Ultra 5 125H, Samsung PM9C1a MZAL8512HDLU
1270 Points +22%
Dell Latitude 13 7330
Iris Xe G7 96EUs, i7-1265U, Toshiba KBG40ZNS512G NVMe
1260 Points +22%
Apple iPad Air 13 2024
M2 10-Core GPU, M2, 128 GB NVMe
1038 Points 0%
Dell Latitude 13 7350
Graphics 4-Core, Ultra 5 135U, Kioxia BG6 KBG60ZNS512G
1037 Points
Durchschnittliche Intel Core Ultra 5 135U, Intel Graphics 4-Cores iGPU (Arc)
  ()
1037 Points 0%
WebXPRT 3 / Overall
Apple iPad Air 13 2024
M2 10-Core GPU, M2, 128 GB NVMe
348 Points +41%
Framework Laptop 13.5 Ryzen 7 7840U
Radeon 780M, R7 7840U, WD PC SN740 512GB SDDPNQD-512G
322 Points +31%
Dell Latitude 13 7330
Iris Xe G7 96EUs, i7-1265U, Toshiba KBG40ZNS512G NVMe
280 Points +14%
Lenovo ThinkBook 13x G4 21KR0008GE
Arc 7-Core, Ultra 5 125H, Samsung PM9C1a MZAL8512HDLU
250 Points +2%
Dell Latitude 13 7350
Graphics 4-Core, Ultra 5 135U, Kioxia BG6 KBG60ZNS512G
246 Points
Durchschnittliche Intel Core Ultra 5 135U, Intel Graphics 4-Cores iGPU (Arc)
  ()
246 Points 0%
WebXPRT 4 / Overall
Framework Laptop 13.5 Ryzen 7 7840U
Radeon 780M, R7 7840U, WD PC SN740 512GB SDDPNQD-512G
256 Points +11%
Apple iPad Air 13 2024
M2 10-Core GPU, M2, 128 GB NVMe
246 Points +7%
Dell Latitude 13 7330
Iris Xe G7 96EUs, i7-1265U, Toshiba KBG40ZNS512G NVMe
245 Points +7%
Lenovo ThinkBook 13x G4 21KR0008GE
Arc 7-Core, Ultra 5 125H, Samsung PM9C1a MZAL8512HDLU
240 Points +4%
Dell Latitude 13 7350
Graphics 4-Core, Ultra 5 135U, Kioxia BG6 KBG60ZNS512G
230 Points
Durchschnittliche Intel Core Ultra 5 135U, Intel Graphics 4-Cores iGPU (Arc)
  ()
230 Points 0%
Mozilla Kraken 1.1 / Total
Dell Latitude 13 7350
Graphics 4-Core, Ultra 5 135U, Kioxia BG6 KBG60ZNS512G
578 ms *
Durchschnittliche Intel Core Ultra 5 135U, Intel Graphics 4-Cores iGPU (Arc)
  ()
578 ms * -0%
Lenovo ThinkBook 13x G4 21KR0008GE
Arc 7-Core, Ultra 5 125H, Samsung PM9C1a MZAL8512HDLU
560 ms * +3%
Dell Latitude 13 7330
Iris Xe G7 96EUs, i7-1265U, Toshiba KBG40ZNS512G NVMe
548 ms * +5%
Dell Latitude 13 7340 i5-1345U
Iris Xe G7 80EUs, i5-1345U, Kioxia BG5 KBG50ZNS512G
544 ms * +6%
Framework Laptop 13.5 Ryzen 7 7840U
Radeon 780M, R7 7840U, WD PC SN740 512GB SDDPNQD-512G
509 ms * +12%
Apple iPad Air 13 2024
M2 10-Core GPU, M2, 128 GB NVMe
441.7 ms * +24%

* ... kleinere Werte sind besser

PCMark 10 Score
5454 Punkte
Hilfe
AIDA64 / Memory Copy
Lenovo ThinkBook 13x G4 21KR0008GE
Intel Core Ultra 5 125H, Arc 7-Core
87473 MB/s +22%
Dell Latitude 13 7350
Intel Core Ultra 5 135U, Graphics 4-Core
71993 MB/s
Durchschnittliche Intel Core Ultra 5 135U
  ()
71993 MB/s 0%
Framework Laptop 13.5 Ryzen 7 7840U
AMD Ryzen 7 7840U, Radeon 780M
62540 MB/s -13%
Dell Latitude 13 7340 i5-1345U
Intel Core i5-1345U, Iris Xe G7 80EUs
56439 MB/s -22%
Dell Latitude 13 7330
Intel Core i7-1265U, Iris Xe G7 96EUs
40212 MB/s -44%
AIDA64 / Memory Read
Lenovo ThinkBook 13x G4 21KR0008GE
Intel Core Ultra 5 125H, Arc 7-Core
76803 MB/s +38%
Framework Laptop 13.5 Ryzen 7 7840U
AMD Ryzen 7 7840U, Radeon 780M
61602 MB/s +11%
Dell Latitude 13 7350
Intel Core Ultra 5 135U, Graphics 4-Core
55689 MB/s
Durchschnittliche Intel Core Ultra 5 135U
  ()
55689 MB/s 0%
Dell Latitude 13 7340 i5-1345U
Intel Core i5-1345U, Iris Xe G7 80EUs
48677 MB/s -13%
Dell Latitude 13 7330
Intel Core i7-1265U, Iris Xe G7 96EUs
41808 MB/s -25%
AIDA64 / Memory Write
Framework Laptop 13.5 Ryzen 7 7840U
AMD Ryzen 7 7840U, Radeon 780M
77965 MB/s +23%
Dell Latitude 13 7340 i5-1345U
Intel Core i5-1345U, Iris Xe G7 80EUs
71878 MB/s +13%
Lenovo ThinkBook 13x G4 21KR0008GE
Intel Core Ultra 5 125H, Arc 7-Core
69575 MB/s +9%
Dell Latitude 13 7350
Intel Core Ultra 5 135U, Graphics 4-Core
63603 MB/s
Durchschnittliche Intel Core Ultra 5 135U
  ()
63603 MB/s 0%
Dell Latitude 13 7330
Intel Core i7-1265U, Iris Xe G7 96EUs
44849 MB/s -29%
AIDA64 / Memory Latency
Dell Latitude 13 7350
Intel Core Ultra 5 135U, Graphics 4-Core
148.1 ns *
Durchschnittliche Intel Core Ultra 5 135U
  ()
148.1 ns * -0%
Lenovo ThinkBook 13x G4 21KR0008GE
Intel Core Ultra 5 125H, Arc 7-Core
133.4 ns * +10%
Dell Latitude 13 7340 i5-1345U
Intel Core i5-1345U, Iris Xe G7 80EUs
103.9 ns * +30%
Framework Laptop 13.5 Ryzen 7 7840U
AMD Ryzen 7 7840U, Radeon 780M
90 ns * +39%
Dell Latitude 13 7330
Intel Core i7-1265U, Iris Xe G7 96EUs
74.6 ns * +50%

* ... kleinere Werte sind besser

DPC Latency

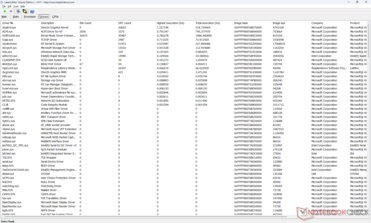
LatencyMon deckt beim Öffnen mehrerer Browsertabs auf unserer Homepage erste kleinere DPC-Probleme auf. Die Wiedergabe unseres 4K/60-fps-YouTubevideos läuft ansonsten aber perfekt und ohne ausgelassene Frames ab.

LatencyMon
LatencyMon
Treiberliste
Treiberliste
DPC Latencies / LatencyMon - interrupt to process latency (max), Web, Youtube, Prime95
Dell Latitude 13 7340 i5-1345U
Iris Xe G7 80EUs, i5-1345U, Kioxia BG5 KBG50ZNS512G
1475 μs * -40%
Framework Laptop 13.5 Ryzen 7 7840U
Radeon 780M, R7 7840U, WD PC SN740 512GB SDDPNQD-512G
1144.2 μs * -9%
Dell Latitude 13 7350
Graphics 4-Core, Ultra 5 135U, Kioxia BG6 KBG60ZNS512G
1053.2 μs *
Dell Latitude 13 7330
Iris Xe G7 96EUs, i7-1265U, Toshiba KBG40ZNS512G NVMe
829.5 μs * +21%
Lenovo ThinkBook 13x G4 21KR0008GE
Arc 7-Core, Ultra 5 125H, Samsung PM9C1a MZAL8512HDLU
744.1 μs * +29%

* ... kleinere Werte sind besser

Massenspeicher

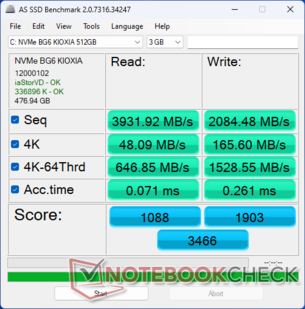
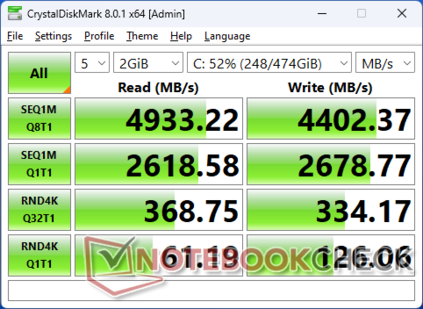
Dell hat auch die SSD einem Upgrade verpasst und ersetzt die Kioxia BG5 im Latitude 7340 durch die Kioxia BG6 im diesjährigen Latitude 7350. Das neuere Modell bietet sowohl eine schnellere Leistung als auch eine bessere Leistungskonstanz unter längerem Stress wie unser DiskSpd-Loop-Test unten zeigt.

AS SSD
AS SSD
CDM 8
CDM 8
Nur kurze M.2-2230-Laufwerke werden unterstützt
Kioxia BG6 KBG60ZNS512G
CDM 5/6 Read Seq Q32T1: 5009 MB/s
CDM 5/6 Write Seq Q32T1: 3553 MB/s
CDM 5/6 Read 4K Q32T1: 370.9 MB/s
CDM 5/6 Write 4K Q32T1: 332.4 MB/s
CDM 5 Read Seq: 2597 MB/s
CDM 5 Write Seq: 2720 MB/s
CDM 5/6 Read 4K: 59.51 MB/s
CDM 5/6 Write 4K: 124.9 MB/s
Drive Performance Rating - Percent
Framework Laptop 13.5 Ryzen 7 7840U -11!
WD PC SN740 512GB SDDPNQD-512G
94.6 pt
Lenovo ThinkBook 13x G4 21KR0008GE
Samsung PM9C1a MZAL8512HDLU
89.6 pt
Dell Latitude 13 7350
Kioxia BG6 KBG60ZNS512G
74.1 pt
Dell Latitude 13 7340 i5-1345U
Kioxia BG5 KBG50ZNS512G
62.9 pt
Dell Latitude 13 7330
Toshiba KBG40ZNS512G NVMe
46.5 pt
DiskSpd
seq read
Framework Laptop 13.5 Ryzen 7 7840U
WD PC SN740 512GB SDDPNQD-512G
3184 (3108.05min - 3184.11max) MB/s +28%
Dell Latitude 13 7340 i5-1345U
Kioxia BG5 KBG50ZNS512G
2617 (2592.44min - 2617.46max) MB/s +5%
Lenovo ThinkBook 13x G4 21KR0008GE
Samsung PM9C1a MZAL8512HDLU
2565 (1389.73min - 2564.61max) MB/s +3%
Dell Latitude 13 7350
Kioxia BG6 KBG60ZNS512G
2481 (2414.24min - 2480.93max) MB/s
Dell Latitude 13 7330
Toshiba KBG40ZNS512G NVMe
1748 (1276.54min - 1748.19max) MB/s -30%
seq write
Framework Laptop 13.5 Ryzen 7 7840U
WD PC SN740 512GB SDDPNQD-512G
3249 (2938.52min - 3248.91max) MB/s +26%
Lenovo ThinkBook 13x G4 21KR0008GE
Samsung PM9C1a MZAL8512HDLU
2983 (2793.48min - 2982.57max) MB/s +16%
Dell Latitude 13 7350
Kioxia BG6 KBG60ZNS512G
2574 (2353.33min - 2573.83max) MB/s
Dell Latitude 13 7340 i5-1345U
Kioxia BG5 KBG50ZNS512G
2191 (1832.28min - 2190.92max) MB/s -15%
Dell Latitude 13 7330
Toshiba KBG40ZNS512G NVMe
1501 (1115.27min - 1500.93max) MB/s -42%
seq q8 t1 read
Lenovo ThinkBook 13x G4 21KR0008GE
Samsung PM9C1a MZAL8512HDLU
6068 (5239.11min - 6068.32max) MB/s +46%
Framework Laptop 13.5 Ryzen 7 7840U
WD PC SN740 512GB SDDPNQD-512G
5098 (4619.39min - 5098.39max) MB/s +23%
Dell Latitude 13 7350
Kioxia BG6 KBG60ZNS512G
4144 (3371.98min - 4144.08max) MB/s
Dell Latitude 13 7340 i5-1345U
Kioxia BG5 KBG50ZNS512G
3241 (2663.38min - 3241.17max) MB/s -22%
Dell Latitude 13 7330
Toshiba KBG40ZNS512G NVMe
2385 (2063.81min - 2385.3max) MB/s -42%
seq q8 t1 write
Lenovo ThinkBook 13x G4 21KR0008GE
Samsung PM9C1a MZAL8512HDLU
4715 (4689.23min - 4715.24max) MB/s +9%
Dell Latitude 13 7350
Kioxia BG6 KBG60ZNS512G
4309 (4277.14min - 4309max) MB/s
Framework Laptop 13.5 Ryzen 7 7840U
WD PC SN740 512GB SDDPNQD-512G
3759 (3254.99min - 3759.39max) MB/s -13%
Dell Latitude 13 7340 i5-1345U
Kioxia BG5 KBG50ZNS512G
1964 (507.69min - 1963.77max) MB/s -54%
Dell Latitude 13 7330
Toshiba KBG40ZNS512G NVMe
1507 (1162.66min - 1507.22max) MB/s -65%
4k q1 t1 read
Dell Latitude 13 7340 i5-1345U
Kioxia BG5 KBG50ZNS512G
67.2 (63.38min - 67.24max) MB/s +38%
Lenovo ThinkBook 13x G4 21KR0008GE
Samsung PM9C1a MZAL8512HDLU
63 (61.94min - 62.98max) MB/s +29%
Framework Laptop 13.5 Ryzen 7 7840U
WD PC SN740 512GB SDDPNQD-512G
62.7 (61.75min - 62.74max) MB/s +29%
Dell Latitude 13 7330
Toshiba KBG40ZNS512G NVMe
52.8 (51.11min - 52.84max) MB/s +8%
Dell Latitude 13 7350
Kioxia BG6 KBG60ZNS512G
48.7 (47.68min - 48.72max) MB/s
4k q1 t1 write
Framework Laptop 13.5 Ryzen 7 7840U
WD PC SN740 512GB SDDPNQD-512G
164.7 (159.96min - 164.74max) MB/s +34%
Dell Latitude 13 7330
Toshiba KBG40ZNS512G NVMe
139.6 (134.38min - 139.63max) MB/s +14%
Dell Latitude 13 7340 i5-1345U
Kioxia BG5 KBG50ZNS512G
137 (125.92min - 137.01max) MB/s +11%
Dell Latitude 13 7350
Kioxia BG6 KBG60ZNS512G
122.9 (121.96min - 122.89max) MB/s
Lenovo ThinkBook 13x G4 21KR0008GE
Samsung PM9C1a MZAL8512HDLU
119.2 (114.62min - 119.17max) MB/s -3%
4k q32 t16 read
Framework Laptop 13.5 Ryzen 7 7840U
WD PC SN740 512GB SDDPNQD-512G
1505 (1389.3min - 1505max) MB/s +237%
Lenovo ThinkBook 13x G4 21KR0008GE
Samsung PM9C1a MZAL8512HDLU
703 (627.88min - 703.14max) MB/s +58%
Dell Latitude 13 7330
Toshiba KBG40ZNS512G NVMe
489 (472.72min - 489.08max) MB/s +10%
Dell Latitude 13 7340 i5-1345U
Kioxia BG5 KBG50ZNS512G
469 (422.79min - 468.97max) MB/s +5%
Dell Latitude 13 7350
Kioxia BG6 KBG60ZNS512G
446 (435.73min - 446.08max) MB/s
4k q32 t16 write
Framework Laptop 13.5 Ryzen 7 7840U
WD PC SN740 512GB SDDPNQD-512G
627 (616.63min - 627.37max) MB/s +84%
Lenovo ThinkBook 13x G4 21KR0008GE
Samsung PM9C1a MZAL8512HDLU
397 (338.3min - 396.83max) MB/s +16%
Dell Latitude 13 7330
Toshiba KBG40ZNS512G NVMe
356 (350.99min - 356.04max) MB/s +4%
Dell Latitude 13 7350
Kioxia BG6 KBG60ZNS512G
341 (334.17min - 340.78max) MB/s
Dell Latitude 13 7340 i5-1345U
Kioxia BG5 KBG50ZNS512G
308 (278.92min - 308.41max) MB/s -10%
AS SSD
Score Total
Lenovo ThinkBook 13x G4 21KR0008GE
Samsung PM9C1a MZAL8512HDLU
4180 Points +21%
Dell Latitude 13 7350
Kioxia BG6 KBG60ZNS512G
3466 Points
Dell Latitude 13 7340 i5-1345U
Kioxia BG5 KBG50ZNS512G
2229 Points -36%
Dell Latitude 13 7330
Toshiba KBG40ZNS512G NVMe
1685 Points -51%
Score Read
Lenovo ThinkBook 13x G4 21KR0008GE
Samsung PM9C1a MZAL8512HDLU
1211 Points +11%
Dell Latitude 13 7350
Kioxia BG6 KBG60ZNS512G
1088 Points
Dell Latitude 13 7340 i5-1345U
Kioxia BG5 KBG50ZNS512G
959 Points -12%
Dell Latitude 13 7330
Toshiba KBG40ZNS512G NVMe
926 Points -15%
Score Write
Lenovo ThinkBook 13x G4 21KR0008GE
Samsung PM9C1a MZAL8512HDLU
2426 Points +27%
Dell Latitude 13 7350
Kioxia BG6 KBG60ZNS512G
1903 Points
Dell Latitude 13 7340 i5-1345U
Kioxia BG5 KBG50ZNS512G
805 Points -58%
Dell Latitude 13 7330
Toshiba KBG40ZNS512G NVMe
338 Points -82%
Seq Read
Lenovo ThinkBook 13x G4 21KR0008GE
Samsung PM9C1a MZAL8512HDLU
4488 MB/s +14%
Dell Latitude 13 7350
Kioxia BG6 KBG60ZNS512G
3931.92 MB/s
Dell Latitude 13 7340 i5-1345U
Kioxia BG5 KBG50ZNS512G
2448.83 MB/s -38%
Dell Latitude 13 7330
Toshiba KBG40ZNS512G NVMe
1696.66 MB/s -57%
Seq Write
Lenovo ThinkBook 13x G4 21KR0008GE
Samsung PM9C1a MZAL8512HDLU
2595 MB/s +24%
Dell Latitude 13 7350
Kioxia BG6 KBG60ZNS512G
2084.48 MB/s
Dell Latitude 13 7340 i5-1345U
Kioxia BG5 KBG50ZNS512G
1494.15 MB/s -28%
Dell Latitude 13 7330
Toshiba KBG40ZNS512G NVMe
736.27 MB/s -65%
4K Read
Lenovo ThinkBook 13x G4 21KR0008GE
Samsung PM9C1a MZAL8512HDLU
65.3 MB/s +36%
Dell Latitude 13 7340 i5-1345U
Kioxia BG5 KBG50ZNS512G
63.77 MB/s +33%
Dell Latitude 13 7350
Kioxia BG6 KBG60ZNS512G
48.09 MB/s
Dell Latitude 13 7330
Toshiba KBG40ZNS512G NVMe
36.51 MB/s -24%
4K Write
Dell Latitude 13 7340 i5-1345U
Kioxia BG5 KBG50ZNS512G
196.72 MB/s +19%
Dell Latitude 13 7350
Kioxia BG6 KBG60ZNS512G
165.6 MB/s
Lenovo ThinkBook 13x G4 21KR0008GE
Samsung PM9C1a MZAL8512HDLU
156.9 MB/s -5%
Dell Latitude 13 7330
Toshiba KBG40ZNS512G NVMe
132.6 MB/s -20%
4K-64 Read
Lenovo ThinkBook 13x G4 21KR0008GE
Samsung PM9C1a MZAL8512HDLU
697 MB/s +8%
Dell Latitude 13 7330
Toshiba KBG40ZNS512G NVMe
692.84 MB/s +7%
Dell Latitude 13 7340 i5-1345U
Kioxia BG5 KBG50ZNS512G
650.83 MB/s +1%
Dell Latitude 13 7350
Kioxia BG6 KBG60ZNS512G
646.85 MB/s
4K-64 Write
Lenovo ThinkBook 13x G4 21KR0008GE
Samsung PM9C1a MZAL8512HDLU
2010 MB/s +31%
Dell Latitude 13 7350
Kioxia BG6 KBG60ZNS512G
1528.55 MB/s
Dell Latitude 13 7340 i5-1345U
Kioxia BG5 KBG50ZNS512G
459.11 MB/s -70%
Dell Latitude 13 7330
Toshiba KBG40ZNS512G NVMe
132.25 MB/s -91%
Access Time Read
Dell Latitude 13 7340 i5-1345U
Kioxia BG5 KBG50ZNS512G
0.16 ms * -125%
Dell Latitude 13 7330
Toshiba KBG40ZNS512G NVMe
0.108 ms * -52%
Dell Latitude 13 7350
Kioxia BG6 KBG60ZNS512G
0.071 ms *
Lenovo ThinkBook 13x G4 21KR0008GE
Samsung PM9C1a MZAL8512HDLU
0.036 ms * +49%
Access Time Write
Dell Latitude 13 7330
Toshiba KBG40ZNS512G NVMe
0.619 ms * -137%
Dell Latitude 13 7350
Kioxia BG6 KBG60ZNS512G
0.261 ms *
Dell Latitude 13 7340 i5-1345U
Kioxia BG5 KBG50ZNS512G
0.035 ms * +87%
Lenovo ThinkBook 13x G4 21KR0008GE
Samsung PM9C1a MZAL8512HDLU
0.023 ms * +91%

* ... kleinere Werte sind besser

Disk Throttling: DiskSpd Read Loop, Queue Depth 8

0210420630840105012601470168018902100231025202730294031503360357037803990Tooltip
Dell Latitude 13 7350 Kioxia BG6 KBG60ZNS512G; diskspd 2.0.17 f: Ø4070 (3602.2-4143.66)
Dell Latitude 13 7340 i5-1345U Kioxia BG5 KBG50ZNS512G: Ø2879 (2471.91-3436.18)

Grafikleistung

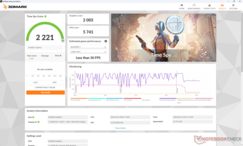
Die Grafikperformance ist mit unserer integrierten Arc-4-GPU nicht annähernd so stark wie die einer Arc 8 in einem Core-Ultra H-Prozessor oder einer konkurrierenden Radeon 680M/780M. Dennoch stellt es im Vergleich zur älteren Xe Graphics G7 80 EUs oder 96 EUs einen Schritt nach vorne dar, insbesondere im DX12-Test Time Spy, bei dem unsere Arc 4 zwischen 15 und 30 Prozent schneller rechnet. Allerdings ist die reale Leistung in den meisten Spielen nur auf Augenhöhe mit der Iris-Xe-Serie, der Titel Tiny Tina's Wonderlands ist immerhin eine positive Ausnahme.

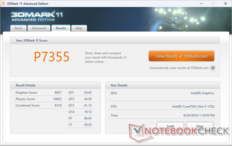
3DMark 11
3DMark 11
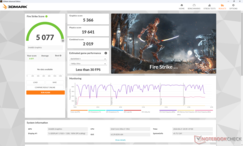
Fire Strike
Fire Strike
Time Spy
Time Spy
3DMark Performance Rating - Percent
Lenovo ThinkBook 13x G4 21KR0008GE -1!
Intel Arc 7-Core iGPU, Intel Core Ultra 5 125H
99.4 pt
Dell XPS 13 9340 Core Ultra 7 -1!
Intel Arc 8-Core iGPU, Intel Core Ultra 7 155H
91.3 pt
Framework Laptop 13.5 Ryzen 7 7840U -1!
AMD Radeon 780M, AMD Ryzen 7 7840U
89 pt
Dell Latitude 13 7350
Intel Graphics 4-Cores iGPU (Arc), Intel Core Ultra 5 135U
70.2 pt
Lenovo Yoga Book 9 13IMU9
Intel Graphics 4-Cores iGPU (Arc), Intel Core Ultra 7 155U
68.2 pt
Durchschnittliche Intel Graphics 4-Cores iGPU (Arc)
 
67.2 pt
Lenovo ThinkPad L13 Yoga G4 i7-1355U
Intel Iris Xe Graphics G7 96EUs, Intel Core i7-1355U
62.4 pt
Lenovo Yoga 6 13 83B2001SGE
AMD Radeon RX Vega 8 (Ryzen 4000/5000), AMD Ryzen 7 7730U
59.2 pt
HP EliteBook x360 830 G10 7L7U1ET
Intel Iris Xe Graphics G7 80EUs, Intel Core i5-1335U
57.8 pt
Dell Latitude 13 7340 i5-1345U
Intel Iris Xe Graphics G7 80EUs, Intel Core i5-1345U
55.8 pt
Dell Latitude 13 7330
Intel Iris Xe Graphics G7 96EUs, Intel Core i7-1265U
55.4 pt
3DMark 11 - 1280x720 Performance GPU
Framework Laptop 13.5 Ryzen 7 7840U
AMD Radeon 780M, AMD Ryzen 7 7840U
11695 Points +71%
Lenovo ThinkBook 13x G4 21KR0008GE
Intel Arc 7-Core iGPU, Intel Core Ultra 5 125H
11467 Points +68%
Dell XPS 13 9340 Core Ultra 7
Intel Arc 8-Core iGPU, Intel Core Ultra 7 155H
10624 Points +56%
Dell Latitude 13 7350
Intel Graphics 4-Cores iGPU (Arc), Intel Core Ultra 5 135U
6827 Points
Lenovo Yoga Book 9 13IMU9
Intel Graphics 4-Cores iGPU (Arc), Intel Core Ultra 7 155U
6741 Points -1%
Durchschnittliche Intel Graphics 4-Cores iGPU (Arc)
  (6007 - 7109, n=13)
6692 Points -2%
Lenovo ThinkPad L13 Yoga G4 i7-1355U
Intel Iris Xe Graphics G7 96EUs, Intel Core i7-1355U
6215 Points -9%
Dell Latitude 13 7330
Intel Iris Xe Graphics G7 96EUs, Intel Core i7-1265U
5840 Points -14%
Lenovo Yoga 6 13 83B2001SGE
AMD Radeon RX Vega 8 (Ryzen 4000/5000), AMD Ryzen 7 7730U
5656 Points -17%
HP EliteBook x360 830 G10 7L7U1ET
Intel Iris Xe Graphics G7 80EUs, Intel Core i5-1335U
5430 Points -20%
Dell Latitude 13 7340 i5-1345U
Intel Iris Xe Graphics G7 80EUs, Intel Core i5-1345U
5374 Points -21%
3DMark
1280x720 Cloud Gate Standard Graphics
Lenovo Yoga 6 13 83B2001SGE
AMD Radeon RX Vega 8 (Ryzen 4000/5000), AMD Ryzen 7 7730U
30501 Points +2%
Lenovo Yoga Book 9 13IMU9
Intel Graphics 4-Cores iGPU (Arc), Intel Core Ultra 7 155U
30198 Points +1%
Dell Latitude 13 7350
Intel Graphics 4-Cores iGPU (Arc), Intel Core Ultra 5 135U
29765 Points
Lenovo ThinkPad L13 Yoga G4 i7-1355U
Intel Iris Xe Graphics G7 96EUs, Intel Core i7-1355U
28773 Points -3%
Durchschnittliche Intel Graphics 4-Cores iGPU (Arc)
  (23935 - 31234, n=10)
28268 Points -5%
HP EliteBook x360 830 G10 7L7U1ET
Intel Iris Xe Graphics G7 80EUs, Intel Core i5-1335U
27821 Points -7%
Dell Latitude 13 7340 i5-1345U
Intel Iris Xe Graphics G7 80EUs, Intel Core i5-1345U
25789 Points -13%
Dell Latitude 13 7330
Intel Iris Xe Graphics G7 96EUs, Intel Core i7-1265U
25358 Points -15%
1920x1080 Fire Strike Graphics
Lenovo ThinkBook 13x G4 21KR0008GE
Intel Arc 7-Core iGPU, Intel Core Ultra 5 125H
8503 Points +58%
Dell XPS 13 9340 Core Ultra 7
Intel Arc 8-Core iGPU, Intel Core Ultra 7 155H
7946 Points +48%
Framework Laptop 13.5 Ryzen 7 7840U
AMD Radeon 780M, AMD Ryzen 7 7840U
7455 Points +39%
Lenovo Yoga Book 9 13IMU9
Intel Graphics 4-Cores iGPU (Arc), Intel Core Ultra 7 155U
5390 Points 0%
Dell Latitude 13 7350
Intel Graphics 4-Cores iGPU (Arc), Intel Core Ultra 5 135U
5366 Points
Durchschnittliche Intel Graphics 4-Cores iGPU (Arc)
  (4284 - 5554, n=14)
5126 Points -4%
Lenovo ThinkPad L13 Yoga G4 i7-1355U
Intel Iris Xe Graphics G7 96EUs, Intel Core i7-1355U
4657 Points -13%
HP EliteBook x360 830 G10 7L7U1ET
Intel Iris Xe Graphics G7 80EUs, Intel Core i5-1335U
4518 Points -16%
Dell Latitude 13 7340 i5-1345U
Intel Iris Xe Graphics G7 80EUs, Intel Core i5-1345U
4515 Points -16%
Lenovo Yoga 6 13 83B2001SGE
AMD Radeon RX Vega 8 (Ryzen 4000/5000), AMD Ryzen 7 7730U
4147 Points -23%
Dell Latitude 13 7330
Intel Iris Xe Graphics G7 96EUs, Intel Core i7-1265U
3978 Points -26%
2560x1440 Time Spy Graphics
Lenovo ThinkBook 13x G4 21KR0008GE
Intel Arc 7-Core iGPU, Intel Core Ultra 5 125H
3248 Points +62%
Dell XPS 13 9340 Core Ultra 7
Intel Arc 8-Core iGPU, Intel Core Ultra 7 155H
2911 Points +45%
Framework Laptop 13.5 Ryzen 7 7840U
AMD Radeon 780M, AMD Ryzen 7 7840U
2575 Points +28%
Dell Latitude 13 7350
Intel Graphics 4-Cores iGPU (Arc), Intel Core Ultra 5 135U
2005 Points
Durchschnittliche Intel Graphics 4-Cores iGPU (Arc)
  (1668 - 2075, n=14)
1898 Points -5%
Lenovo Yoga Book 9 13IMU9
Intel Graphics 4-Cores iGPU (Arc), Intel Core Ultra 7 155U
1712 Points -15%
Lenovo ThinkPad L13 Yoga G4 i7-1355U
Intel Iris Xe Graphics G7 96EUs, Intel Core i7-1355U
1537 Points -23%
Dell Latitude 13 7330
Intel Iris Xe Graphics G7 96EUs, Intel Core i7-1265U
1355 Points -32%
HP EliteBook x360 830 G10 7L7U1ET
Intel Iris Xe Graphics G7 80EUs, Intel Core i5-1335U
1309 Points -35%
Dell Latitude 13 7340 i5-1345U
Intel Iris Xe Graphics G7 80EUs, Intel Core i5-1345U
1286 Points -36%
Lenovo Yoga 6 13 83B2001SGE
AMD Radeon RX Vega 8 (Ryzen 4000/5000), AMD Ryzen 7 7730U
1283 Points -36%
3DMark 11 Performance
7355 Punkte
3DMark Cloud Gate Standard Score
21263 Punkte
3DMark Fire Strike Score
5077 Punkte
3DMark Time Spy Score
2221 Punkte
Hilfe
Blender
v3.3 Classroom HIP/AMD
Lenovo Yoga 6 13 83B2001SGE
AMD Radeon RX Vega 8 (Ryzen 4000/5000), AMD Ryzen 7 7730U
634 Seconds *
v3.3 Classroom CPU
Lenovo ThinkPad L13 Yoga G4 i7-1355U
Intel Iris Xe Graphics G7 96EUs, Intel Core i7-1355U
950 Seconds * -38%
Dell Latitude 13 7340 i5-1345U
Intel Iris Xe Graphics G7 80EUs, Intel Core i5-1345U
903 Seconds * -31%
HP EliteBook x360 830 G10 7L7U1ET
Intel Iris Xe Graphics G7 80EUs, Intel Core i5-1335U
869 Seconds * -26%
Dell Latitude 13 7330
Intel Iris Xe Graphics G7 96EUs, Intel Core i7-1265U
848 Seconds * -23%
Durchschnittliche Intel Graphics 4-Cores iGPU (Arc)
  (592 - 904, n=14)
688 Seconds * -0%
Dell Latitude 13 7350
Intel Graphics 4-Cores iGPU (Arc), Intel Core Ultra 5 135U
687 Seconds *
Lenovo ThinkBook 13x G4 21KR0008GE
Intel Arc 7-Core iGPU, Intel Core Ultra 5 125H
667 Seconds * +3%
Lenovo Yoga Book 9 13IMU9
Intel Graphics 4-Cores iGPU (Arc), Intel Core Ultra 7 155U
649 Seconds * +6%
Lenovo Yoga 6 13 83B2001SGE
AMD Radeon RX Vega 8 (Ryzen 4000/5000), AMD Ryzen 7 7730U
648 Seconds * +6%
Dell XPS 13 9340 Core Ultra 7
Intel Arc 8-Core iGPU, Intel Core Ultra 7 155H
481 Seconds * +30%
Framework Laptop 13.5 Ryzen 7 7840U
AMD Radeon 780M, AMD Ryzen 7 7840U
371 Seconds * +46%
v3.3 Classroom oneAPI/Intel
Durchschnittliche Intel Graphics 4-Cores iGPU (Arc)
  (364 - 423, n=4)
384 Seconds * -5%
Dell Latitude 13 7350
Intel Graphics 4-Cores iGPU (Arc), Intel Core Ultra 5 135U
364 Seconds *

* ... kleinere Werte sind besser

Performance Rating - Percent
Framework Laptop 13.5 Ryzen 7 7840U
AMD Ryzen 7 7840U, AMD Radeon 780M
99.6 pt
Lenovo ThinkBook 13x G4 21KR0008GE
Intel Core Ultra 5 125H, Intel Arc 7-Core iGPU
91.8 pt
Dell Latitude 13 7350
Intel Core Ultra 5 135U, Intel Graphics 4-Cores iGPU (Arc)
66.3 pt
Dell Latitude 13 7330 -1!
Intel Core i7-1265U, Intel Iris Xe Graphics G7 96EUs
56.2 pt
Dell Latitude 13 7340 i5-1345U -1!
Intel Core i5-1345U, Intel Iris Xe Graphics G7 80EUs
55.5 pt
The Witcher 3 - 1920x1080 Ultra Graphics & Postprocessing (HBAO+)
Framework Laptop 13.5 Ryzen 7 7840U
AMD Ryzen 7 7840U, AMD Radeon 780M
28.7 (25min) fps +63%
Lenovo ThinkBook 13x G4 21KR0008GE
Intel Core Ultra 5 125H, Intel Arc 7-Core iGPU
23.4 (18min, 20P1) fps +33%
Dell Latitude 13 7350
Intel Core Ultra 5 135U, Intel Graphics 4-Cores iGPU (Arc)
17.6 (15min) fps
Dell Latitude 13 7340 i5-1345U
Intel Core i5-1345U, Intel Iris Xe Graphics G7 80EUs
12.3 fps -30%
Dell Latitude 13 7330
Intel Core i7-1265U, Intel Iris Xe Graphics G7 96EUs
11.9 (10min) fps -32%
Final Fantasy XV Benchmark - 1920x1080 High Quality
Framework Laptop 13.5 Ryzen 7 7840U
AMD Ryzen 7 7840U, AMD Radeon 780M
25.7 fps +47%
Lenovo ThinkBook 13x G4 21KR0008GE
Intel Core Ultra 5 125H, Intel Arc 7-Core iGPU
25.3 fps +45%
Dell Latitude 13 7350
Intel Core Ultra 5 135U, Intel Graphics 4-Cores iGPU (Arc)
17.5 fps
Dell Latitude 13 7340 i5-1345U
Intel Core i5-1345U, Intel Iris Xe Graphics G7 80EUs
13.9 fps -21%
Dell Latitude 13 7330
Intel Core i7-1265U, Intel Iris Xe Graphics G7 96EUs
12.9 fps -26%
Strange Brigade - 1920x1080 ultra AA:ultra AF:16
Lenovo ThinkBook 13x G4 21KR0008GE
Intel Core Ultra 5 125H, Intel Arc 7-Core iGPU
44 fps +47%
Framework Laptop 13.5 Ryzen 7 7840U
AMD Ryzen 7 7840U, AMD Radeon 780M
43 (13.6min, 21.3P1) fps +44%
Dell Latitude 13 7350
Intel Core Ultra 5 135U, Intel Graphics 4-Cores iGPU (Arc)
29.9 (7.1min, 10P1) fps
Dell Latitude 13 7340 i5-1345U
Intel Core i5-1345U, Intel Iris Xe Graphics G7 80EUs
21 (5min, 5.02P1) fps -30%
Dell Latitude 13 7330
Intel Core i7-1265U, Intel Iris Xe Graphics G7 96EUs
20 (5.8min, 6.76P1) fps -33%
Dota 2 Reborn - 1920x1080 ultra (3/3) best looking
Framework Laptop 13.5 Ryzen 7 7840U
AMD Ryzen 7 7840U, AMD Radeon 780M
71.2 (59.4min) fps +32%
Lenovo ThinkBook 13x G4 21KR0008GE
Intel Core Ultra 5 125H, Intel Arc 7-Core iGPU
64.9 (45.5min) fps +20%
Dell Latitude 13 7350
Intel Core Ultra 5 135U, Intel Graphics 4-Cores iGPU (Arc)
54 (32.2min) fps
Dell Latitude 13 7340 i5-1345U
Intel Core i5-1345U, Intel Iris Xe Graphics G7 80EUs
47 (39.3min) fps -13%
Dell Latitude 13 7330
Intel Core i7-1265U, Intel Iris Xe Graphics G7 96EUs
44.9 (40.1min) fps -17%
X-Plane 11.11 - 1920x1080 high (fps_test=3)
Framework Laptop 13.5 Ryzen 7 7840U
AMD Ryzen 7 7840U, AMD Radeon 780M
37.5 fps +62%
Lenovo ThinkBook 13x G4 21KR0008GE
Intel Core Ultra 5 125H, Intel Arc 7-Core iGPU
34.2 fps +47%
Dell Latitude 13 7330
Intel Core i7-1265U, Intel Iris Xe Graphics G7 96EUs
30.3 fps +31%
Dell Latitude 13 7340 i5-1345U
Intel Core i5-1345U, Intel Iris Xe Graphics G7 80EUs
25.1 fps +8%
Dell Latitude 13 7350
Intel Core Ultra 5 135U, Intel Graphics 4-Cores iGPU (Arc)
23.2 fps
Far Cry 5 - 1920x1080 Ultra Preset AA:T
Framework Laptop 13.5 Ryzen 7 7840U
AMD Ryzen 7 7840U, AMD Radeon 780M
35 (29min) fps +59%
Lenovo ThinkBook 13x G4 21KR0008GE
Intel Core Ultra 5 125H, Intel Arc 7-Core iGPU
31 fps +41%
Dell Latitude 13 7350
Intel Core Ultra 5 135U, Intel Graphics 4-Cores iGPU (Arc)
22 (9min) fps
F1 22
1280x720 Ultra Low Preset AA:T AF:16x
Framework Laptop 13.5 Ryzen 7 7840U
AMD Ryzen 7 7840U, AMD Radeon 780M
133.2 (110min, 87P1) fps +84%
Dell Latitude 13 7350
Intel Core Ultra 5 135U, Intel Graphics 4-Cores iGPU (Arc)
72.5 (61min, 58P1) fps
Durchschnittliche Intel Graphics 4-Cores iGPU (Arc)
  (60.6 - 77.2, n=7)
68.9 fps -5%
Lenovo Yoga Book 9 13IMU9
Intel Core Ultra 7 155U, Intel Graphics 4-Cores iGPU (Arc)
63.7 (53min, 52P1) fps -12%
Lenovo ThinkPad L13 Yoga G4 i7-1355U
Intel Core i7-1355U, Intel Iris Xe Graphics G7 96EUs
61.2 (46min, 44P1) fps -16%
1920x1080 Low Preset AA:T AF:16x
Framework Laptop 13.5 Ryzen 7 7840U
AMD Ryzen 7 7840U, AMD Radeon 780M
80.6 (70min, 55P1) fps +73%
Dell Latitude 13 7340 i5-1345U
Intel Core i5-1345U, Intel Iris Xe Graphics G7 80EUs
58.8 (41min, 44P1) fps +26%
Dell Latitude 13 7350
Intel Core Ultra 5 135U, Intel Graphics 4-Cores iGPU (Arc)
46.6 (36min, 35P1) fps
Lenovo ThinkPad L13 Yoga G4 i7-1355U
Intel Core i7-1355U, Intel Iris Xe Graphics G7 96EUs
45 (37min, 33P1) fps -3%
Lenovo Yoga Book 9 13IMU9
Intel Core Ultra 7 155U, Intel Graphics 4-Cores iGPU (Arc)
43.8 (36min, 35P1) fps -6%
Durchschnittliche Intel Graphics 4-Cores iGPU (Arc)
  (39.9 - 46.6, n=7)
43.7 fps -6%
Lenovo Yoga 6 13 83B2001SGE
AMD Ryzen 7 7730U, AMD Radeon RX Vega 8 (Ryzen 4000/5000)
35.1 (29min, 25P1) fps -25%
1920x1080 Medium Preset AA:T AF:16x
Framework Laptop 13.5 Ryzen 7 7840U
AMD Ryzen 7 7840U, AMD Radeon 780M
72.5 (58min, 45P1) fps +73%
Dell Latitude 13 7350
Intel Core Ultra 5 135U, Intel Graphics 4-Cores iGPU (Arc)
41.9 (35min, 34P1) fps
Lenovo ThinkPad L13 Yoga G4 i7-1355U
Intel Core i7-1355U, Intel Iris Xe Graphics G7 96EUs
41.1 (35min, 31P1) fps -2%
Lenovo Yoga Book 9 13IMU9
Intel Core Ultra 7 155U, Intel Graphics 4-Cores iGPU (Arc)
40.5 (32min, 33P1) fps -3%
Durchschnittliche Intel Graphics 4-Cores iGPU (Arc)
  (34.1 - 42, n=7)
39.4 fps -6%
Dell Latitude 13 7340 i5-1345U
Intel Core i5-1345U, Intel Iris Xe Graphics G7 80EUs
33.6 (28min, 25P1) fps -20%
Lenovo Yoga 6 13 83B2001SGE
AMD Ryzen 7 7730U, AMD Radeon RX Vega 8 (Ryzen 4000/5000)
32.5 (26min, 24P1) fps -22%
1920x1080 High Preset AA:T AF:16x
Framework Laptop 13.5 Ryzen 7 7840U
AMD Ryzen 7 7840U, AMD Radeon 780M
54.2 (44min, 35P1) fps +76%
Dell Latitude 13 7340 i5-1345U
Intel Core i5-1345U, Intel Iris Xe Graphics G7 80EUs
30.9 (24min, 22P1) fps 0%
Dell Latitude 13 7350
Intel Core Ultra 5 135U, Intel Graphics 4-Cores iGPU (Arc)
30.8 (25min, 25P1) fps
Lenovo ThinkPad L13 Yoga G4 i7-1355U
Intel Core i7-1355U, Intel Iris Xe Graphics G7 96EUs
29.8 (25min, 22P1) fps -3%
Durchschnittliche Intel Graphics 4-Cores iGPU (Arc)
  (25 - 31, n=4)
29.1 fps -6%
Lenovo Yoga 6 13 83B2001SGE
AMD Ryzen 7 7730U, AMD Radeon RX Vega 8 (Ryzen 4000/5000)
23.6 (21min, 19P1) fps -23%
1920x1080 Ultra High Preset AA:T AF:16x
Dell Latitude 13 7340 i5-1345U
Intel Core i5-1345U, Intel Iris Xe Graphics G7 80EUs
23.4 (19min, 18P1) fps +191%
Lenovo ThinkPad L13 Yoga G4 i7-1355U
Intel Core i7-1355U, Intel Iris Xe Graphics G7 96EUs
22.6 (19min, 17P1) fps +181%
Lenovo Yoga 6 13 83B2001SGE
AMD Ryzen 7 7730U, AMD Radeon RX Vega 8 (Ryzen 4000/5000)
20.1 (17min, 16P1) fps +150%
Dell Latitude 13 7350
Intel Core Ultra 5 135U, Intel Graphics 4-Cores iGPU (Arc)
8.03 (6min, 6P1) fps
Durchschnittliche Intel Graphics 4-Cores iGPU (Arc)
  (6.95 - 8.03, n=3)
7.53 fps -6%
Far Cry 5
1280x720 Low Preset AA:T
Framework Laptop 13.5 Ryzen 7 7840U
AMD Ryzen 7 7840U, AMD Radeon 780M
74 (63min) fps +80%
Lenovo ThinkBook 13x G4 21KR0008GE
Intel Core Ultra 5 125H, Intel Arc 7-Core iGPU
64 fps +56%
Dell XPS 13 9340 Core Ultra 7
Intel Core Ultra 7 155H, Intel Arc 8-Core iGPU
57 fps +39%
Lenovo Yoga 6 13 83B2001SGE
AMD Ryzen 7 7730U, AMD Radeon RX Vega 8 (Ryzen 4000/5000)
47 (24min) fps +15%
Lenovo Yoga Book 9 13IMU9
Intel Core Ultra 7 155U, Intel Graphics 4-Cores iGPU (Arc)
47 (41min) fps +15%
Lenovo ThinkPad L13 Yoga G4 i7-1355U
Intel Core i7-1355U, Intel Iris Xe Graphics G7 96EUs
45 (37min) fps +10%
Durchschnittliche Intel Graphics 4-Cores iGPU (Arc)
  (33 - 51, n=11)
44.1 fps +8%
Dell Latitude 13 7350
Intel Core Ultra 5 135U, Intel Graphics 4-Cores iGPU (Arc)
41 (14min) fps
1920x1080 Medium Preset AA:T
Framework Laptop 13.5 Ryzen 7 7840U
AMD Ryzen 7 7840U, AMD Radeon 780M
39 (21min) fps +39%
Lenovo ThinkBook 13x G4 21KR0008GE
Intel Core Ultra 5 125H, Intel Arc 7-Core iGPU
37 fps +32%
Dell XPS 13 9340 Core Ultra 7
Intel Core Ultra 7 155H, Intel Arc 8-Core iGPU
33 fps +18%
Dell Latitude 13 7350
Intel Core Ultra 5 135U, Intel Graphics 4-Cores iGPU (Arc)
28 (15min) fps
Lenovo Yoga Book 9 13IMU9
Intel Core Ultra 7 155U, Intel Graphics 4-Cores iGPU (Arc)
25 (7min) fps -11%
Durchschnittliche Intel Graphics 4-Cores iGPU (Arc)
  (20 - 28, n=11)
24.3 fps -13%
Lenovo ThinkPad L13 Yoga G4 i7-1355U
Intel Core i7-1355U, Intel Iris Xe Graphics G7 96EUs
24 (21min) fps -14%
Lenovo Yoga 6 13 83B2001SGE
AMD Ryzen 7 7730U, AMD Radeon RX Vega 8 (Ryzen 4000/5000)
23 (14min) fps -18%
1920x1080 High Preset AA:T
Framework Laptop 13.5 Ryzen 7 7840U
AMD Ryzen 7 7840U, AMD Radeon 780M
37 (33min) fps +48%
Lenovo ThinkBook 13x G4 21KR0008GE
Intel Core Ultra 5 125H, Intel Arc 7-Core iGPU
35 fps +40%
Dell XPS 13 9340 Core Ultra 7
Intel Core Ultra 7 155H, Intel Arc 8-Core iGPU
30 fps +20%
Dell Latitude 13 7350
Intel Core Ultra 5 135U, Intel Graphics 4-Cores iGPU (Arc)
25 (10min) fps
Lenovo Yoga Book 9 13IMU9
Intel Core Ultra 7 155U, Intel Graphics 4-Cores iGPU (Arc)
24 (20min) fps -4%
Durchschnittliche Intel Graphics 4-Cores iGPU (Arc)
  (19 - 26, n=11)
22.7 fps -9%
Lenovo ThinkPad L13 Yoga G4 i7-1355U
Intel Core i7-1355U, Intel Iris Xe Graphics G7 96EUs
22 (20min) fps -12%
Lenovo Yoga 6 13 83B2001SGE
AMD Ryzen 7 7730U, AMD Radeon RX Vega 8 (Ryzen 4000/5000)
21 (3min) fps -16%
1920x1080 Ultra Preset AA:T
Framework Laptop 13.5 Ryzen 7 7840U
AMD Ryzen 7 7840U, AMD Radeon 780M
35 (29min) fps +59%
Lenovo ThinkBook 13x G4 21KR0008GE
Intel Core Ultra 5 125H, Intel Arc 7-Core iGPU
31 fps +41%
Dell XPS 13 9340 Core Ultra 7
Intel Core Ultra 7 155H, Intel Arc 8-Core iGPU
28 fps +27%
Lenovo Yoga Book 9 13IMU9
Intel Core Ultra 7 155U, Intel Graphics 4-Cores iGPU (Arc)
22 (18min) fps 0%
Dell Latitude 13 7350
Intel Core Ultra 5 135U, Intel Graphics 4-Cores iGPU (Arc)
22 (9min) fps
Lenovo ThinkPad L13 Yoga G4 i7-1355U
Intel Core i7-1355U, Intel Iris Xe Graphics G7 96EUs
21 (19min) fps -5%
Durchschnittliche Intel Graphics 4-Cores iGPU (Arc)
  (18 - 23, n=11)
20.7 fps -6%
Lenovo Yoga 6 13 83B2001SGE
AMD Ryzen 7 7730U, AMD Radeon RX Vega 8 (Ryzen 4000/5000)
20 (5min) fps -9%
The Witcher 3
1024x768 Low Graphics & Postprocessing
Dell XPS 13 9340 Core Ultra 7
Intel Core Ultra 7 155H, Intel Arc 8-Core iGPU
152 fps +64%
Framework Laptop 13.5 Ryzen 7 7840U
AMD Ryzen 7 7840U, AMD Radeon 780M
136.2 (99min) fps +47%
Lenovo ThinkBook 13x G4 21KR0008GE
Intel Core Ultra 5 125H, Intel Arc 7-Core iGPU
126 fps +36%
Dell Latitude 13 7350
Intel Core Ultra 5 135U, Intel Graphics 4-Cores iGPU (Arc)
92.9 (81min) fps
Lenovo ThinkPad L13 Yoga G4 i7-1355U
Intel Core i7-1355U, Intel Iris Xe Graphics G7 96EUs
92.8 (84min) fps 0%
Lenovo Yoga Book 9 13IMU9
Intel Core Ultra 7 155U, Intel Graphics 4-Cores iGPU (Arc)
92.1 (75min) fps -1%
Durchschnittliche Intel Graphics 4-Cores iGPU (Arc)
  (66.5 - 92.9, n=8)
86.2 fps -7%
HP EliteBook x360 830 G10 7L7U1ET
Intel Core i5-1335U, Intel Iris Xe Graphics G7 80EUs
78.3 (67min) fps -16%
Dell Latitude 13 7340 i5-1345U
Intel Core i5-1345U, Intel Iris Xe Graphics G7 80EUs
74.6 (67min, 69P1) fps -20%
Dell Latitude 13 7330
Intel Core i7-1265U, Intel Iris Xe Graphics G7 96EUs
71.6 (25min) fps -23%
Lenovo Yoga 6 13 83B2001SGE
AMD Ryzen 7 7730U, AMD Radeon RX Vega 8 (Ryzen 4000/5000)
60 fps -35%
1366x768 Medium Graphics & Postprocessing
Dell XPS 13 9340 Core Ultra 7
Intel Core Ultra 7 155H, Intel Arc 8-Core iGPU
89 fps +58%
Lenovo ThinkBook 13x G4 21KR0008GE
Intel Core Ultra 5 125H, Intel Arc 7-Core iGPU
80 fps +42%
Lenovo Yoga Book 9 13IMU9
Intel Core Ultra 7 155U, Intel Graphics 4-Cores iGPU (Arc)
57 (54min) fps +1%
Lenovo ThinkPad L13 Yoga G4 i7-1355U
Intel Core i7-1355U, Intel Iris Xe Graphics G7 96EUs
56.7 (54min) fps +1%
Dell Latitude 13 7350
Intel Core Ultra 5 135U, Intel Graphics 4-Cores iGPU (Arc)
56.2 (53min) fps
Durchschnittliche Intel Graphics 4-Cores iGPU (Arc)
  (41.3 - 57, n=8)
52.7 fps -6%
HP EliteBook x360 830 G10 7L7U1ET
Intel Core i5-1335U, Intel Iris Xe Graphics G7 80EUs
50.6 (42min) fps -10%
Dell Latitude 13 7330
Intel Core i7-1265U, Intel Iris Xe Graphics G7 96EUs
47.3 (44min) fps -16%
Dell Latitude 13 7340 i5-1345U
Intel Core i5-1345U, Intel Iris Xe Graphics G7 80EUs
45.5 fps -19%
Lenovo Yoga 6 13 83B2001SGE
AMD Ryzen 7 7730U, AMD Radeon RX Vega 8 (Ryzen 4000/5000)
39 fps -31%
1920x1080 High Graphics & Postprocessing (Nvidia HairWorks Off)
Dell XPS 13 9340 Core Ultra 7
Intel Core Ultra 7 155H, Intel Arc 8-Core iGPU
47 fps +41%
Framework Laptop 13.5 Ryzen 7 7840U
AMD Ryzen 7 7840U, AMD Radeon 780M
45.9 (41min) fps +38%
Lenovo ThinkBook 13x G4 21KR0008GE
Intel Core Ultra 5 125H, Intel Arc 7-Core iGPU
45 fps +35%
Dell Latitude 13 7350
Intel Core Ultra 5 135U, Intel Graphics 4-Cores iGPU (Arc)
33.3 (30min) fps
Lenovo Yoga Book 9 13IMU9
Intel Core Ultra 7 155U, Intel Graphics 4-Cores iGPU (Arc)
32.4 (28min) fps -3%
Lenovo ThinkPad L13 Yoga G4 i7-1355U
Intel Core i7-1355U, Intel Iris Xe Graphics G7 96EUs
31 (28min) fps -7%
Durchschnittliche Intel Graphics 4-Cores iGPU (Arc)
  (21.4 - 33.3, n=8)
29.4 fps -12%
HP EliteBook x360 830 G10 7L7U1ET
Intel Core i5-1335U, Intel Iris Xe Graphics G7 80EUs
27.5 (22min) fps -17%
Dell Latitude 13 7340 i5-1345U
Intel Core i5-1345U, Intel Iris Xe Graphics G7 80EUs
24.7 fps -26%
Dell Latitude 13 7330
Intel Core i7-1265U, Intel Iris Xe Graphics G7 96EUs
23.6 (20min) fps -29%
Lenovo Yoga 6 13 83B2001SGE
AMD Ryzen 7 7730U, AMD Radeon RX Vega 8 (Ryzen 4000/5000)
20 fps -40%
1920x1080 Ultra Graphics & Postprocessing (HBAO+)
Framework Laptop 13.5 Ryzen 7 7840U
AMD Ryzen 7 7840U, AMD Radeon 780M
28.7 (25min) fps +63%
Lenovo ThinkBook 13x G4 21KR0008GE
Intel Core Ultra 5 125H, Intel Arc 7-Core iGPU
23.4 (18min, 20P1) fps +33%
Dell XPS 13 9340 Core Ultra 7
Intel Core Ultra 7 155H, Intel Arc 8-Core iGPU
20.8 (16min, 19P1) fps +18%
Lenovo Yoga Book 9 13IMU9
Intel Core Ultra 7 155U, Intel Graphics 4-Cores iGPU (Arc)
17.9 (15min) fps +2%
Dell Latitude 13 7350
Intel Core Ultra 5 135U, Intel Graphics 4-Cores iGPU (Arc)
17.6 (15min) fps
Durchschnittliche Intel Graphics 4-Cores iGPU (Arc)
  (11.9 - 17.9, n=8)
15.9 fps -10%
Lenovo ThinkPad L13 Yoga G4 i7-1355U
Intel Core i7-1355U, Intel Iris Xe Graphics G7 96EUs
13.8 (12min) fps -22%
Lenovo Yoga 6 13 83B2001SGE
AMD Ryzen 7 7730U, AMD Radeon RX Vega 8 (Ryzen 4000/5000)
13 fps -26%
HP EliteBook x360 830 G10 7L7U1ET
Intel Core i5-1335U, Intel Iris Xe Graphics G7 80EUs
12.5 (10min) fps -29%
Dell Latitude 13 7340 i5-1345U
Intel Core i5-1345U, Intel Iris Xe Graphics G7 80EUs
12.3 fps -30%
Dell Latitude 13 7330
Intel Core i7-1265U, Intel Iris Xe Graphics G7 96EUs
11.9 (10min) fps -32%
Dota 2 Reborn
1280x720 min (0/3) fastest
Framework Laptop 13.5 Ryzen 7 7840U
AMD Ryzen 7 7840U, AMD Radeon 780M
154.1 (129.7min) fps +66%
Dell Latitude 13 7330
Intel Core i7-1265U, Intel Iris Xe Graphics G7 96EUs
109.7 (85.4min) fps +18%
Dell XPS 13 9340 Core Ultra 7
Intel Core Ultra 7 155H, Intel Arc 8-Core iGPU
106.2 (58min) fps +14%
Lenovo Yoga 6 13 83B2001SGE
AMD Ryzen 7 7730U, AMD Radeon RX Vega 8 (Ryzen 4000/5000)
103.2 (89.7min) fps +11%
Dell Latitude 13 7340 i5-1345U
Intel Core i5-1345U, Intel Iris Xe Graphics G7 80EUs
95.5 (77.5min) fps +3%
Lenovo ThinkPad L13 Yoga G4 i7-1355U
Intel Core i7-1355U, Intel Iris Xe Graphics G7 96EUs
94.3 (74.6min) fps +2%
Lenovo ThinkBook 13x G4 21KR0008GE
Intel Core Ultra 5 125H, Intel Arc 7-Core iGPU
93.8 (59.9min) fps +1%
Dell Latitude 13 7350
Intel Core Ultra 5 135U, Intel Graphics 4-Cores iGPU (Arc)
92.9 (38.4min) fps
HP EliteBook x360 830 G10 7L7U1ET
Intel Core i5-1335U, Intel Iris Xe Graphics G7 80EUs
90.4 (70.7min) fps -3%
Durchschnittliche Intel Graphics 4-Cores iGPU (Arc)
  (74.1 - 101.9, n=14)
89.3 fps -4%
Lenovo Yoga Book 9 13IMU9
Intel Core Ultra 7 155U, Intel Graphics 4-Cores iGPU (Arc)
82.6 (50.3min) fps -11%
1366x768 med (1/3)
Framework Laptop 13.5 Ryzen 7 7840U
AMD Ryzen 7 7840U, AMD Radeon 780M
119.3 (97.9min) fps +120%
Dell XPS 13 9340 Core Ultra 7
Intel Core Ultra 7 155H, Intel Arc 8-Core iGPU
89.8 (52.9min) fps +65%
Lenovo Yoga 6 13 83B2001SGE
AMD Ryzen 7 7730U, AMD Radeon RX Vega 8 (Ryzen 4000/5000)
86.3 (76.6min) fps +59%
Lenovo ThinkBook 13x G4 21KR0008GE
Intel Core Ultra 5 125H, Intel Arc 7-Core iGPU
83 (55.2min) fps +53%
Dell Latitude 13 7330
Intel Core i7-1265U, Intel Iris Xe Graphics G7 96EUs
79.6 (51.9min) fps +47%
HP EliteBook x360 830 G10 7L7U1ET
Intel Core i5-1335U, Intel Iris Xe Graphics G7 80EUs
70.2 (55.1min) fps +29%
Dell Latitude 13 7340 i5-1345U
Intel Core i5-1345U, Intel Iris Xe Graphics G7 80EUs
68.8 (54min) fps +27%
Lenovo ThinkPad L13 Yoga G4 i7-1355U
Intel Core i7-1355U, Intel Iris Xe Graphics G7 96EUs
65.3 (52.1min) fps +20%
Lenovo Yoga Book 9 13IMU9
Intel Core Ultra 7 155U, Intel Graphics 4-Cores iGPU (Arc)
59.7 (41.9min) fps +10%
Durchschnittliche Intel Graphics 4-Cores iGPU (Arc)
  (43.7 - 72.7, n=14)
58.8 fps +8%
Dell Latitude 13 7350
Intel Core Ultra 5 135U, Intel Graphics 4-Cores iGPU (Arc)
54.3 (31.3min) fps
1920x1080 high (2/3)
Framework Laptop 13.5 Ryzen 7 7840U
AMD Ryzen 7 7840U, AMD Radeon 780M
76.2 (63.3min) fps +24%
Dell XPS 13 9340 Core Ultra 7
Intel Core Ultra 7 155H, Intel Arc 8-Core iGPU
72 (49.5min) fps +17%
Lenovo ThinkBook 13x G4 21KR0008GE
Intel Core Ultra 5 125H, Intel Arc 7-Core iGPU
68.4 (46.3min) fps +11%
Dell Latitude 13 7350
Intel Core Ultra 5 135U, Intel Graphics 4-Cores iGPU (Arc)
61.6 (37.1min) fps
Lenovo Yoga Book 9 13IMU9
Intel Core Ultra 7 155U, Intel Graphics 4-Cores iGPU (Arc)
57.2 (42.7min) fps -7%
Durchschnittliche Intel Graphics 4-Cores iGPU (Arc)
  (48.4 - 62.2, n=14)
56.6 fps -8%
Lenovo Yoga 6 13 83B2001SGE
AMD Ryzen 7 7730U, AMD Radeon RX Vega 8 (Ryzen 4000/5000)
56.4 (47.8min) fps -8%
HP EliteBook x360 830 G10 7L7U1ET
Intel Core i5-1335U, Intel Iris Xe Graphics G7 80EUs
53 (43.3min) fps -14%
Lenovo ThinkPad L13 Yoga G4 i7-1355U
Intel Core i7-1355U, Intel Iris Xe Graphics G7 96EUs
52.4 (42.3min) fps -15%
Dell Latitude 13 7340 i5-1345U
Intel Core i5-1345U, Intel Iris Xe Graphics G7 80EUs
51.6 (44.5min) fps -16%
Dell Latitude 13 7330
Intel Core i7-1265U, Intel Iris Xe Graphics G7 96EUs
50.6 (44.7min) fps -18%
1920x1080 ultra (3/3) best looking
Framework Laptop 13.5 Ryzen 7 7840U
AMD Ryzen 7 7840U, AMD Radeon 780M
71.2 (59.4min) fps +32%
Dell XPS 13 9340 Core Ultra 7
Intel Core Ultra 7 155H, Intel Arc 8-Core iGPU
65.2 (48.8min) fps +21%
Lenovo ThinkBook 13x G4 21KR0008GE
Intel Core Ultra 5 125H, Intel Arc 7-Core iGPU
64.9 (45.5min) fps +20%
Lenovo Yoga Book 9 13IMU9
Intel Core Ultra 7 155U, Intel Graphics 4-Cores iGPU (Arc)
54.2 (41.9min) fps 0%
Dell Latitude 13 7350
Intel Core Ultra 5 135U, Intel Graphics 4-Cores iGPU (Arc)
54 (32.2min) fps
Durchschnittliche Intel Graphics 4-Cores iGPU (Arc)
  (45.5 - 60.4, n=14)
53.6 fps -1%
Lenovo Yoga 6 13 83B2001SGE
AMD Ryzen 7 7730U, AMD Radeon RX Vega 8 (Ryzen 4000/5000)
50.4 (44.6min) fps -7%
HP EliteBook x360 830 G10 7L7U1ET
Intel Core i5-1335U, Intel Iris Xe Graphics G7 80EUs
47.1 (38.8min) fps -13%
Dell Latitude 13 7340 i5-1345U
Intel Core i5-1345U, Intel Iris Xe Graphics G7 80EUs
47 (39.3min) fps -13%
Lenovo ThinkPad L13 Yoga G4 i7-1355U
Intel Core i7-1355U, Intel Iris Xe Graphics G7 96EUs
46.2 (37.9min) fps -14%
Dell Latitude 13 7330
Intel Core i7-1265U, Intel Iris Xe Graphics G7 96EUs
44.9 (40.1min) fps -17%
X-Plane 11.11
1280x720 low (fps_test=1)
Framework Laptop 13.5 Ryzen 7 7840U
AMD Ryzen 7 7840U, AMD Radeon 780M
60 fps +66%
Dell XPS 13 9340 Core Ultra 7
Intel Core Ultra 7 155H, Intel Arc 8-Core iGPU
53 fps +46%
Lenovo ThinkBook 13x G4 21KR0008GE
Intel Core Ultra 5 125H, Intel Arc 7-Core iGPU
52 fps +44%
Dell Latitude 13 7330
Intel Core i7-1265U, Intel Iris Xe Graphics G7 96EUs
47.3 fps +31%
Dell Latitude 13 7340 i5-1345U
Intel Core i5-1345U, Intel Iris Xe Graphics G7 80EUs
40 fps +10%
Lenovo ThinkPad L13 Yoga G4 i7-1355U
Intel Core i7-1355U, Intel Iris Xe Graphics G7 96EUs
39.8 fps +10%
Lenovo Yoga 6 13 83B2001SGE
AMD Ryzen 7 7730U, AMD Radeon RX Vega 8 (Ryzen 4000/5000)
39.5 fps +9%
HP EliteBook x360 830 G10 7L7U1ET
Intel Core i5-1335U, Intel Iris Xe Graphics G7 80EUs
38.3 fps +6%
Durchschnittliche Intel Graphics 4-Cores iGPU (Arc)
  (31.2 - 41.2, n=14)
36.4 fps +1%
Dell Latitude 13 7350
Intel Core Ultra 5 135U, Intel Graphics 4-Cores iGPU (Arc)
36.2 fps
Lenovo Yoga Book 9 13IMU9
Intel Core Ultra 7 155U, Intel Graphics 4-Cores iGPU (Arc)
34.7 fps -4%
1920x1080 med (fps_test=2)
Framework Laptop 13.5 Ryzen 7 7840U
AMD Ryzen 7 7840U, AMD Radeon 780M
44.4 fps +57%
Dell XPS 13 9340 Core Ultra 7
Intel Core Ultra 7 155H, Intel Arc 8-Core iGPU
40.7 fps +44%
Lenovo ThinkBook 13x G4 21KR0008GE
Intel Core Ultra 5 125H, Intel Arc 7-Core iGPU
40.1 fps +42%
Dell Latitude 13 7330
Intel Core i7-1265U, Intel Iris Xe Graphics G7 96EUs
33.8 fps +20%
Lenovo Yoga 6 13 83B2001SGE
AMD Ryzen 7 7730U, AMD Radeon RX Vega 8 (Ryzen 4000/5000)
30.4 fps +8%
Dell Latitude 13 7340 i5-1345U
Intel Core i5-1345U, Intel Iris Xe Graphics G7 80EUs
28.7 fps +2%
Durchschnittliche Intel Graphics 4-Cores iGPU (Arc)
  (25.2 - 31.9, n=14)
28.7 fps +2%
Lenovo Yoga Book 9 13IMU9
Intel Core Ultra 7 155U, Intel Graphics 4-Cores iGPU (Arc)
28.3 fps 0%
Dell Latitude 13 7350
Intel Core Ultra 5 135U, Intel Graphics 4-Cores iGPU (Arc)
28.2 fps
Lenovo ThinkPad L13 Yoga G4 i7-1355U
Intel Core i7-1355U, Intel Iris Xe Graphics G7 96EUs
27.3 fps -3%
HP EliteBook x360 830 G10 7L7U1ET
Intel Core i5-1335U, Intel Iris Xe Graphics G7 80EUs
27.2 fps -4%
1920x1080 high (fps_test=3)
Framework Laptop 13.5 Ryzen 7 7840U
AMD Ryzen 7 7840U, AMD Radeon 780M
37.5 fps +62%
Lenovo ThinkBook 13x G4 21KR0008GE
Intel Core Ultra 5 125H, Intel Arc 7-Core iGPU
34.2 fps +47%
Dell XPS 13 9340 Core Ultra 7
Intel Core Ultra 7 155H, Intel Arc 8-Core iGPU
30.8 fps +33%
Dell Latitude 13 7330
Intel Core i7-1265U, Intel Iris Xe Graphics G7 96EUs
30.3 fps +31%
Lenovo Yoga 6 13 83B2001SGE
AMD Ryzen 7 7730U, AMD Radeon RX Vega 8 (Ryzen 4000/5000)
26.7 fps +15%
Dell Latitude 13 7340 i5-1345U
Intel Core i5-1345U, Intel Iris Xe Graphics G7 80EUs
25.1 fps +8%
Lenovo ThinkPad L13 Yoga G4 i7-1355U
Intel Core i7-1355U, Intel Iris Xe Graphics G7 96EUs
25.1 fps +8%
HP EliteBook x360 830 G10 7L7U1ET
Intel Core i5-1335U, Intel Iris Xe Graphics G7 80EUs
24.2 fps +4%
Durchschnittliche Intel Graphics 4-Cores iGPU (Arc)
  (20.8 - 27.1, n=14)
24.1 fps +4%
Lenovo Yoga Book 9 13IMU9
Intel Core Ultra 7 155U, Intel Graphics 4-Cores iGPU (Arc)
23.6 fps +2%
Dell Latitude 13 7350
Intel Core Ultra 5 135U, Intel Graphics 4-Cores iGPU (Arc)
23.2 fps
Final Fantasy XV Benchmark
1280x720 Lite Quality
Framework Laptop 13.5 Ryzen 7 7840U
AMD Ryzen 7 7840U, AMD Radeon 780M
66.6 fps +56%
Dell XPS 13 9340 Core Ultra 7
Intel Core Ultra 7 155H, Intel Arc 8-Core iGPU
61.3 fps +44%
Lenovo ThinkBook 13x G4 21KR0008GE
Intel Core Ultra 5 125H, Intel Arc 7-Core iGPU
59.8 fps +40%
Dell Latitude 13 7350
Intel Core Ultra 5 135U, Intel Graphics 4-Cores iGPU (Arc)
42.7 fps
Durchschnittliche Intel Graphics 4-Cores iGPU (Arc)
  (33.7 - 48.6, n=14)
40.6 fps -5%
Lenovo Yoga 6 13 83B2001SGE
AMD Ryzen 7 7730U, AMD Radeon RX Vega 8 (Ryzen 4000/5000)
38.7 fps -9%
HP EliteBook x360 830 G10 7L7U1ET
Intel Core i5-1335U, Intel Iris Xe Graphics G7 80EUs
38.6 fps -10%
Lenovo Yoga Book 9 13IMU9
Intel Core Ultra 7 155U, Intel Graphics 4-Cores iGPU (Arc)
37.4 fps -12%
Lenovo ThinkPad L13 Yoga G4 i7-1355U
Intel Core i7-1355U, Intel Iris Xe Graphics G7 96EUs
36.6 fps -14%
Dell Latitude 13 7340 i5-1345U
Intel Core i5-1345U, Intel Iris Xe Graphics G7 80EUs
33.5 fps -22%
Dell Latitude 13 7330
Intel Core i7-1265U, Intel Iris Xe Graphics G7 96EUs
32.9 fps -23%
1920x1080 Standard Quality
Dell XPS 13 9340 Core Ultra 7
Intel Core Ultra 7 155H, Intel Arc 8-Core iGPU
36.2 fps +53%
Framework Laptop 13.5 Ryzen 7 7840U
AMD Ryzen 7 7840U, AMD Radeon 780M
34.4 fps +46%
Lenovo ThinkBook 13x G4 21KR0008GE
Intel Core Ultra 5 125H, Intel Arc 7-Core iGPU
33.4 fps +42%
Dell Latitude 13 7350
Intel Core Ultra 5 135U, Intel Graphics 4-Cores iGPU (Arc)
23.6 fps
Lenovo Yoga Book 9 13IMU9
Intel Core Ultra 7 155U, Intel Graphics 4-Cores iGPU (Arc)
23.4 fps -1%
Durchschnittliche Intel Graphics 4-Cores iGPU (Arc)
  (17.1 - 26, n=14)
22.8 fps -3%
HP EliteBook x360 830 G10 7L7U1ET
Intel Core i5-1335U, Intel Iris Xe Graphics G7 80EUs
20.8 fps -12%
Lenovo ThinkPad L13 Yoga G4 i7-1355U
Intel Core i7-1355U, Intel Iris Xe Graphics G7 96EUs
20.1 fps -15%
Dell Latitude 13 7340 i5-1345U
Intel Core i5-1345U, Intel Iris Xe Graphics G7 80EUs
18.9 fps -20%
Lenovo Yoga 6 13 83B2001SGE
AMD Ryzen 7 7730U, AMD Radeon RX Vega 8 (Ryzen 4000/5000)
17.7 fps -25%
Dell Latitude 13 7330
Intel Core i7-1265U, Intel Iris Xe Graphics G7 96EUs
17.5 fps -26%
1920x1080 High Quality
Dell XPS 13 9340 Core Ultra 7
Intel Core Ultra 7 155H, Intel Arc 8-Core iGPU
26.4 fps +51%
Framework Laptop 13.5 Ryzen 7 7840U
AMD Ryzen 7 7840U, AMD Radeon 780M
25.7 fps +47%
Lenovo ThinkBook 13x G4 21KR0008GE
Intel Core Ultra 5 125H, Intel Arc 7-Core iGPU
25.3 fps +45%
HP EliteBook x360 830 G10 7L7U1ET
Intel Core i5-1335U, Intel Iris Xe Graphics G7 80EUs
17.8 fps +2%
Dell Latitude 13 7350
Intel Core Ultra 5 135U, Intel Graphics 4-Cores iGPU (Arc)
17.5 fps
Durchschnittliche Intel Graphics 4-Cores iGPU (Arc)
  (12.2 - 19.1, n=14)
16.6 fps -5%
Lenovo Yoga Book 9 13IMU9
Intel Core Ultra 7 155U, Intel Graphics 4-Cores iGPU (Arc)
16.3 fps -7%
Lenovo ThinkPad L13 Yoga G4 i7-1355U
Intel Core i7-1355U, Intel Iris Xe Graphics G7 96EUs
15 fps -14%
Dell Latitude 13 7340 i5-1345U
Intel Core i5-1345U, Intel Iris Xe Graphics G7 80EUs
13.9 fps -21%
Dell Latitude 13 7330
Intel Core i7-1265U, Intel Iris Xe Graphics G7 96EUs
12.9 fps -26%
Lenovo Yoga 6 13 83B2001SGE
AMD Ryzen 7 7730U, AMD Radeon RX Vega 8 (Ryzen 4000/5000)
12.9 fps -26%
Cyberpunk 2077 2.1 Phantom Liberty
1280x720 Low Preset (FSR off)
Lenovo Yoga Book 9 13IMU9
Intel Core Ultra 7 155U, Intel Graphics 4-Cores iGPU (Arc)
32.5 (23.8min) fps +16%
Durchschnittliche Intel Graphics 4-Cores iGPU (Arc)
  (25.6 - 32.8, n=11)
29.1 fps +4%
Dell Latitude 13 7350
Intel Core Ultra 5 135U, Intel Graphics 4-Cores iGPU (Arc)
28 (23min) fps
1920x1080 Low Preset (FSR off)
Lenovo ThinkBook 13x G4 21KR0008GE
Intel Core Ultra 5 125H, Intel Arc 7-Core iGPU
23.2 (13.7min) fps +30%
Lenovo Yoga Book 9 13IMU9
Intel Core Ultra 7 155U, Intel Graphics 4-Cores iGPU (Arc)
21.6 (16.7min) fps +21%
Durchschnittliche Intel Graphics 4-Cores iGPU (Arc)
  (17.2 - 21.6, n=12)
19.3 fps +8%
Dell Latitude 13 7350
Intel Core Ultra 5 135U, Intel Graphics 4-Cores iGPU (Arc)
17.8 (13.6min) fps
1920x1080 Medium Preset (FSR off)
Lenovo ThinkBook 13x G4 21KR0008GE
Intel Core Ultra 5 125H, Intel Arc 7-Core iGPU
19.8 (11.5min) fps +43%
Lenovo Yoga Book 9 13IMU9
Intel Core Ultra 7 155U, Intel Graphics 4-Cores iGPU (Arc)
17.6 (14.4min) fps +28%
Durchschnittliche Intel Graphics 4-Cores iGPU (Arc)
  (13.8 - 17.6, n=12)
15.7 fps +14%
Dell Latitude 13 7350
Intel Core Ultra 5 135U, Intel Graphics 4-Cores iGPU (Arc)
13.8 (11.9min) fps
1920x1080 High Preset (FSR off)
Lenovo ThinkBook 13x G4 21KR0008GE
Intel Core Ultra 5 125H, Intel Arc 7-Core iGPU
16.6 (8.88min) fps +39%
Lenovo Yoga Book 9 13IMU9
Intel Core Ultra 7 155U, Intel Graphics 4-Cores iGPU (Arc)
14.9 (12.1min) fps +25%
Durchschnittliche Intel Graphics 4-Cores iGPU (Arc)
  (11.9 - 14.9, n=12)
13.2 fps +11%
Dell Latitude 13 7350
Intel Core Ultra 5 135U, Intel Graphics 4-Cores iGPU (Arc)
11.9 (10min) fps
1920x1080 Ultra Preset (FSR off)
Lenovo ThinkBook 13x G4 21KR0008GE
Intel Core Ultra 5 125H, Intel Arc 7-Core iGPU
14.8 (7.18min) fps +44%
Lenovo Yoga Book 9 13IMU9
Intel Core Ultra 7 155U, Intel Graphics 4-Cores iGPU (Arc)
13 (10.4min) fps +26%
Durchschnittliche Intel Graphics 4-Cores iGPU (Arc)
  (10.3 - 13, n=12)
11.6 fps +13%
Dell Latitude 13 7350
Intel Core Ultra 5 135U, Intel Graphics 4-Cores iGPU (Arc)
10.3 (8.89min) fps
Baldur's Gate 3
1280x720 Low Preset
Dell Latitude 13 7350
Intel Core Ultra 5 135U, Intel Graphics 4-Cores iGPU (Arc)
28.5 fps
Durchschnittliche Intel Graphics 4-Cores iGPU (Arc)
  (21.4 - 34.7, n=8)
27 fps -5%
1920x1080 Low Preset
Dell Latitude 13 7350
Intel Core Ultra 5 135U, Intel Graphics 4-Cores iGPU (Arc)
18.8 fps
Durchschnittliche Intel Graphics 4-Cores iGPU (Arc)
  (14.7 - 21.5, n=10)
17.2 fps -9%
Lenovo Yoga Book 9 13IMU9
Intel Core Ultra 7 155U, Intel Graphics 4-Cores iGPU (Arc)
16.2 fps -14%
1920x1080 Medium Preset
Dell Latitude 13 7350
Intel Core Ultra 5 135U, Intel Graphics 4-Cores iGPU (Arc)
15.5 fps
Durchschnittliche Intel Graphics 4-Cores iGPU (Arc)
  (12.3 - 16.1, n=9)
13.8 fps -11%
Lenovo Yoga Book 9 13IMU9
Intel Core Ultra 7 155U, Intel Graphics 4-Cores iGPU (Arc)
12.6 fps -19%
1920x1080 High Preset
Dell Latitude 13 7350
Intel Core Ultra 5 135U, Intel Graphics 4-Cores iGPU (Arc)
13.2 fps
Durchschnittliche Intel Graphics 4-Cores iGPU (Arc)
  (10.6 - 14.6, n=7)
12.1 fps -8%
1920x1080 Ultra Preset
Dell Latitude 13 7350
Intel Core Ultra 5 135U, Intel Graphics 4-Cores iGPU (Arc)
12.1 fps
Durchschnittliche Intel Graphics 4-Cores iGPU (Arc)
  (10.5 - 13.9, n=6)
11.8 fps -2%
Tiny Tina's Wonderlands
1280x720 Lowest Preset (DX12)
Framework Laptop 13.5 Ryzen 7 7840U
AMD Ryzen 7 7840U, AMD Radeon 780M
111.8 fps +118%
Lenovo Yoga Book 9 13IMU9
Intel Core Ultra 7 155U, Intel Graphics 4-Cores iGPU (Arc)
57.5 fps +12%
Durchschnittliche Intel Graphics 4-Cores iGPU (Arc)
  (49 - 61.8, n=7)
53.6 fps +4%
Dell Latitude 13 7350
Intel Core Ultra 5 135U, Intel Graphics 4-Cores iGPU (Arc)
51.3 fps
Lenovo ThinkPad L13 Yoga G4 i7-1355U
Intel Core i7-1355U, Intel Iris Xe Graphics G7 96EUs
36.4 fps -29%
1920x1080 Low Preset (DX12)
Framework Laptop 13.5 Ryzen 7 7840U
AMD Ryzen 7 7840U, AMD Radeon 780M
60.4 fps +119%
Lenovo Yoga Book 9 13IMU9
Intel Core Ultra 7 155U, Intel Graphics 4-Cores iGPU (Arc)
30.8 fps +12%
Durchschnittliche Intel Graphics 4-Cores iGPU (Arc)
  (24.1 - 30.8, n=6)
28.3 fps +3%
Dell Latitude 13 7350
Intel Core Ultra 5 135U, Intel Graphics 4-Cores iGPU (Arc)
27.6 fps
Lenovo ThinkPad L13 Yoga G4 i7-1355U
Intel Core i7-1355U, Intel Iris Xe Graphics G7 96EUs
23.3 fps -16%
Dell Latitude 13 7340 i5-1345U
Intel Core i5-1345U, Intel Iris Xe Graphics G7 80EUs
21.16 fps -23%
1920x1080 Medium Preset (DX12)
Framework Laptop 13.5 Ryzen 7 7840U
AMD Ryzen 7 7840U, AMD Radeon 780M
44.8 fps +96%
Lenovo Yoga Book 9 13IMU9
Intel Core Ultra 7 155U, Intel Graphics 4-Cores iGPU (Arc)
24.2 fps +6%
Durchschnittliche Intel Graphics 4-Cores iGPU (Arc)
  (21.1 - 24.2, n=5)
23 fps 0%
Dell Latitude 13 7350
Intel Core Ultra 5 135U, Intel Graphics 4-Cores iGPU (Arc)
22.9 fps
Lenovo ThinkPad L13 Yoga G4 i7-1355U
Intel Core i7-1355U, Intel Iris Xe Graphics G7 96EUs
17.7 fps -23%
Dell Latitude 13 7340 i5-1345U
Intel Core i5-1345U, Intel Iris Xe Graphics G7 80EUs
16.53 fps -28%
1920x1080 High Preset (DX12)
Framework Laptop 13.5 Ryzen 7 7840U
AMD Ryzen 7 7840U, AMD Radeon 780M
30.4 fps +81%
Dell Latitude 13 7350
Intel Core Ultra 5 135U, Intel Graphics 4-Cores iGPU (Arc)
16.8 fps
Lenovo Yoga Book 9 13IMU9
Intel Core Ultra 7 155U, Intel Graphics 4-Cores iGPU (Arc)
16.3 fps -3%
Durchschnittliche Intel Graphics 4-Cores iGPU (Arc)
  (14.1 - 16.8, n=5)
15.9 fps -5%
Lenovo ThinkPad L13 Yoga G4 i7-1355U
Intel Core i7-1355U, Intel Iris Xe Graphics G7 96EUs
10.9 fps -35%
Dell Latitude 13 7340 i5-1345U
Intel Core i5-1345U, Intel Iris Xe Graphics G7 80EUs
10.21 fps -39%
1920x1080 Badass Preset (DX12)
Framework Laptop 13.5 Ryzen 7 7840U
AMD Ryzen 7 7840U, AMD Radeon 780M
25.2 fps +85%
Lenovo Yoga Book 9 13IMU9
Intel Core Ultra 7 155U, Intel Graphics 4-Cores iGPU (Arc)
13.8 fps +1%
Dell Latitude 13 7350
Intel Core Ultra 5 135U, Intel Graphics 4-Cores iGPU (Arc)
13.6 fps
Durchschnittliche Intel Graphics 4-Cores iGPU (Arc)
  (11.3 - 13.8, n=5)
12.7 fps -7%
Dell Latitude 13 7340 i5-1345U
Intel Core i5-1345U, Intel Iris Xe Graphics G7 80EUs
9.87 fps -27%
Lenovo ThinkPad L13 Yoga G4 i7-1355U
Intel Core i7-1355U, Intel Iris Xe Graphics G7 96EUs
8.6 fps -37%
Strange Brigade
1280x720 lowest AF:1
Dell XPS 13 9340 Core Ultra 7
Intel Core Ultra 7 155H, Intel Arc 8-Core iGPU
156 fps +32%
Lenovo ThinkBook 13x G4 21KR0008GE
Intel Core Ultra 5 125H, Intel Arc 7-Core iGPU
141 fps +19%
Framework Laptop 13.5 Ryzen 7 7840U
AMD Ryzen 7 7840U, AMD Radeon 780M
139.8 (37.5min, 114.3P1) fps +18%
Dell Latitude 13 7350
Intel Core Ultra 5 135U, Intel Graphics 4-Cores iGPU (Arc)
118.4 (25.8min, 85.9P1) fps
Lenovo Yoga Book 9 13IMU9
Intel Core Ultra 7 155U, Intel Graphics 4-Cores iGPU (Arc)
118.1 (28.9min, 93.5P1) fps 0%
Durchschnittliche Intel Graphics 4-Cores iGPU (Arc)
  (73.7 - 123, n=11)
110.1 fps -7%
Lenovo ThinkPad L13 Yoga G4 i7-1355U
Intel Core i7-1355U, Intel Iris Xe Graphics G7 96EUs
87.2 (19.6min, 30.9P1) fps -26%
Lenovo Yoga 6 13 83B2001SGE
AMD Ryzen 7 7730U, AMD Radeon RX Vega 8 (Ryzen 4000/5000)
86.4 (40.5min, 74.7P1) fps -27%
Dell Latitude 13 7340 i5-1345U
Intel Core i5-1345U, Intel Iris Xe Graphics G7 80EUs
80.4 (17.8min, 25.1P1) fps -32%
Dell Latitude 13 7330
Intel Core i7-1265U, Intel Iris Xe Graphics G7 96EUs
75.8 (17.5min, 23P1) fps -36%
1920x1080 medium AA:medium AF:4
Dell XPS 13 9340 Core Ultra 7
Intel Core Ultra 7 155H, Intel Arc 8-Core iGPU
68 fps +38%
Lenovo ThinkBook 13x G4 21KR0008GE
Intel Core Ultra 5 125H, Intel Arc 7-Core iGPU
68 fps +38%
Framework Laptop 13.5 Ryzen 7 7840U
AMD Ryzen 7 7840U, AMD Radeon 780M
59.7 (18.3min, 51.4P1) fps +22%
Lenovo Yoga Book 9 13IMU9
Intel Core Ultra 7 155U, Intel Graphics 4-Cores iGPU (Arc)
50.8 (25.8min, 42.3P1) fps +3%
Dell Latitude 13 7350
Intel Core Ultra 5 135U, Intel Graphics 4-Cores iGPU (Arc)
49.1 (26.4min, 39.7P1) fps
Durchschnittliche Intel Graphics 4-Cores iGPU (Arc)
  (32.9 - 52.1, n=11)
46.8 fps -5%
Lenovo ThinkPad L13 Yoga G4 i7-1355U
Intel Core i7-1355U, Intel Iris Xe Graphics G7 96EUs
38.1 (15.8min, 21.5P1) fps -22%
Lenovo Yoga 6 13 83B2001SGE
AMD Ryzen 7 7730U, AMD Radeon RX Vega 8 (Ryzen 4000/5000)
33.8 (18min, 29.4P1) fps -31%
Dell Latitude 13 7340 i5-1345U
Intel Core i5-1345U, Intel Iris Xe Graphics G7 80EUs
32.9 (7.9min, 17.6P1) fps -33%
Dell Latitude 13 7330
Intel Core i7-1265U, Intel Iris Xe Graphics G7 96EUs
29.8 (10.6min, 16.5P1) fps -39%
1920x1080 high AA:high AF:8
Dell XPS 13 9340 Core Ultra 7
Intel Core Ultra 7 155H, Intel Arc 8-Core iGPU
54 fps +36%
Lenovo ThinkBook 13x G4 21KR0008GE
Intel Core Ultra 5 125H, Intel Arc 7-Core iGPU
54 fps +36%
Framework Laptop 13.5 Ryzen 7 7840U
AMD Ryzen 7 7840U, AMD Radeon 780M
50.5 (17.2min, 27.8P1) fps +28%
Dell Latitude 13 7350
Intel Core Ultra 5 135U, Intel Graphics 4-Cores iGPU (Arc)
39.6 (20.1min, 24.2P1) fps
Lenovo Yoga Book 9 13IMU9
Intel Core Ultra 7 155U, Intel Graphics 4-Cores iGPU (Arc)
37.7 (6.8min, 13.1P1) fps -5%
Durchschnittliche Intel Graphics 4-Cores iGPU (Arc)
  (26.6 - 41.9, n=11)
36.8 fps -7%
Lenovo ThinkPad L13 Yoga G4 i7-1355U
Intel Core i7-1355U, Intel Iris Xe Graphics G7 96EUs
30.5 (8min, 17.3P1) fps -23%
Lenovo Yoga 6 13 83B2001SGE
AMD Ryzen 7 7730U, AMD Radeon RX Vega 8 (Ryzen 4000/5000)
27 (5.5min, 8.17P1) fps -32%
Dell Latitude 13 7340 i5-1345U
Intel Core i5-1345U, Intel Iris Xe Graphics G7 80EUs
26.3 (6.5min, 9.4P1) fps -34%
Dell Latitude 13 7330
Intel Core i7-1265U, Intel Iris Xe Graphics G7 96EUs
24.9 (7.1min, 13.8P1) fps -37%
1920x1080 ultra AA:ultra AF:16
Lenovo ThinkBook 13x G4 21KR0008GE
Intel Core Ultra 5 125H, Intel Arc 7-Core iGPU
44 fps +47%
Framework Laptop 13.5 Ryzen 7 7840U
AMD Ryzen 7 7840U, AMD Radeon 780M
43 (13.6min, 21.3P1) fps +44%
Dell XPS 13 9340 Core Ultra 7
Intel Core Ultra 7 155H, Intel Arc 8-Core iGPU
41 fps +37%
Lenovo Yoga Book 9 13IMU9
Intel Core Ultra 7 155U, Intel Graphics 4-Cores iGPU (Arc)
30.3 (7.5min, 11.1P1) fps +1%
Dell Latitude 13 7350
Intel Core Ultra 5 135U, Intel Graphics 4-Cores iGPU (Arc)
29.9 (7.1min, 10P1) fps
Durchschnittliche Intel Graphics 4-Cores iGPU (Arc)
  (22.9 - 33.3, n=11)
28.7 fps -4%
Lenovo ThinkPad L13 Yoga G4 i7-1355U
Intel Core i7-1355U, Intel Iris Xe Graphics G7 96EUs
23 (5min, 6.57P1) fps -23%
Lenovo Yoga 6 13 83B2001SGE
AMD Ryzen 7 7730U, AMD Radeon RX Vega 8 (Ryzen 4000/5000)
22.7 (5min, 5.54P1) fps -24%
Dell Latitude 13 7340 i5-1345U
Intel Core i5-1345U, Intel Iris Xe Graphics G7 80EUs
21 (5min, 5.02P1) fps -30%
Dell Latitude 13 7330
Intel Core i7-1265U, Intel Iris Xe Graphics G7 96EUs
20 (5.8min, 6.76P1) fps -33%

Witcher 3 FPS Chart

051015202530Tooltip
Dell Latitude 13 7350: Ø30.3 (24-33)
min.mittelhochmax.
The Witcher 3 (2015) 92.9 56.2 33.3 17.6
Dota 2 Reborn (2015) 92.9 54.3 61.6 54
Final Fantasy XV Benchmark (2018) 42.7 23.6 17.5
X-Plane 11.11 (2018) 36.2 28.2 23.2
Far Cry 5 (2018) 41 28 25 22
Strange Brigade (2018) 118.4 49.1 39.6 29.9
Tiny Tina's Wonderlands (2022) 27.6 22.9 16.8 13.6
F1 22 (2022) 46.6 41.9 30.8 8.03
Baldur's Gate 3 (2023) 18.8 15.5 13.2 12.1
Cyberpunk 2077 2.1 Phantom Liberty (2023) 17.8 13.8 11.9 10.3

Emissionen — Leicht und ruhig

Systemlautstärke

Im Idle und bei geringfügigen Lasten wie Office tendiert der Lüfter dazu nicht einzugreifen. Realistischere Lasten wie Browsing oder Videostreaming initiiert ein Lüftergeräusch von knapp unter 28 dB(A) gegen einen ruhigen Hintergrund von 23 db(A), was unter den meisten Bedingungen noch immer kaum hörbar ist.

Unter hoher Last ist die Lüfterlautstärke praktisch identisch zu der im letztjährigen Modell. So misst unser Messmikrofon unter Running Witcher 3 ein konstantes Lüftergeräusch von rund 35 dB(A), was sich über längere Zeit oder unter noch höheren Lasten letztlich auf knapp über 40 dB(A) steigern kann.

Lüftergeräuschprofil (Weiß: Hintergrund, Rot: Leerlauf, Blau: 3DMark 06, Orange: Witcher 3, Grün: Prime95-Stress)

Lautstärkediagramm

Idle
23.3 / 26.6 / 27.7 dB(A)
Last
30.5 / 41.9 dB(A)
  red to green bar
 
 
30 dB
leise
40 dB(A)
deutlich hörbar
50 dB(A)
störend
 
min: dark, med: mid, max: light   Earthworks M23R, Arta (aus 15 cm gemessen)   Umgebungsgeräusche: 23.3 dB(A)
dB(A) 0102030405060708090Deep BassMiddle BassHigh BassLower RangeMidsHigher MidsLower HighsMid HighsUpper HighsSuper Highs2034.633.736.336.433.42522.722.625.825.320.93123.822.623.524.123.24020.220.119.219.7205020.421.619.719.221.66324.726.925.623.825.98022.223.420.820.722.910018.820.617.819.319.312515.917.715.916.118.216017.618.115.315.220.220017.718.215.116.619.625022.618.113.115.823.331521.318.414.817.425.340021.71912.715.32850020.817.312.114.326.863019.215.911.914.325.580019.816.611.213.425.8100020.616.19.91326.9125020.616.39.21327.1160022.217.69.414.328.6200024.820.41017.131.6250026.621.710.617.933.7315026.521.610.917.233.7400023.518.311.314.430.6500021.815.711.712.430.3630017.515.911.711.927.7800014.815.711.811.9231000013.515.311.611.619.21250012.212.411.811.716.11600011.511.711.51213.1SPL34.830.523.326.941.9N1.91.30.50.83.6median 20.6median 17.6median 11.7median 14.3median 25.8Delta2.51.31.12.15.3hearing rangehide median Fan NoiseDell Latitude 13 7350
Dell Latitude 13 7350
Graphics 4-Core, Ultra 5 135U, Kioxia BG6 KBG60ZNS512G
Dell Latitude 13 7340 i5-1345U
Iris Xe G7 80EUs, i5-1345U, Kioxia BG5 KBG50ZNS512G
Dell Latitude 13 7330
Iris Xe G7 96EUs, i7-1265U, Toshiba KBG40ZNS512G NVMe
Apple iPad Air 13 2024
M2 10-Core GPU, M2, 128 GB NVMe
Lenovo ThinkBook 13x G4 21KR0008GE
Arc 7-Core, Ultra 5 125H, Samsung PM9C1a MZAL8512HDLU
Framework Laptop 13.5 Ryzen 7 7840U
Radeon 780M, R7 7840U, WD PC SN740 512GB SDDPNQD-512G
Geräuschentwicklung
-1%
-2%
-2%
-5%
aus / Umgebung *
23.3
25.02
-7%
23.4
-0%
24.5
-5%
22.6
3%
Idle min *
23.3
25.02
-7%
23.4
-0%
24.5
-5%
22.6
3%
Idle avg *
26.6
25.02
6%
23.4
12%
24.5
8%
22.6
15%
Idle max *
27.7
25.02
10%
23.4
16%
27.1
2%
24.2
13%
Last avg *
30.5
35.07
-15%
37.8
-24%
33.3
-9%
35.8
-17%
Witcher 3 ultra *
34.8
39.2
-13%
36.8
-6%
46.5
-34%
Last max *
41.9
38.2
9%
43
-3%
40.7
3%
48.9
-17%

* ... kleinere Werte sind besser

Temperatur

Auch die Oberflächentemperaturen bleiben auf einem Niveau mit denen im Vorjahresgerät, immerhin haben sich das Kühlsystem und die Leistungsziele im Vergleich zum Latitude 7340 nicht verändert. Die Hot Spots finden sich auf der linken Tastaturhälfte und können hier bis über 35 °C erreichen, während die Handballenauflagen und die rechte Tastaturhälfte kühler und bei Berührungen angenehmer bleiben.

Hinterer Luftausgang
Netzteil wird unter anspruchsvollen Lasten über 33 °C heiß
Max. Last
 34.8 °C35.2 °C28.2 °C 
 32.6 °C32.4 °C25.4 °C 
 24.4 °C22.8 °C22.2 °C 
Maximal: 35.2 °C
Durchschnitt: 28.7 °C
25.2 °C36.6 °C37.8 °C
23.6 °C30.6 °C34.2 °C
23 °C25.6 °C26.6 °C
Maximal: 37.8 °C
Durchschnitt: 29.2 °C
Netzteil (max.)  35.6 °C | Raumtemperatur 20 °C | Fluke 62 Mini IR Thermometer
(+) Die Durchschnittstemperatur auf der Oberseite unter extremer Last ist 28.7 °C. Im Vergleich erhitzte sich der Durchschnitt der Geräteklasse Subnotebook auf 30.8 °C.
(+) Die maximale Temperatur auf der Oberseite ist 35.2 °C. Im Vergleich liegt der Klassendurchschnitt bei 35.9 °C (von 21.4 bis 59 °C für die Klasse Subnotebook).
(+) Auf der Unterseite messen wir eine maximalen Wert von 37.8 °C (im Vergleich zum Durchschnitt von 39.4 °C).
(+) Ohne Last messen wir eine durchschnittliche Temperatur von 24.7 °C auf der Oberseite. Der Klassendurchschnitt erreicht 30.8 °C.
(+) Die Handballen und der Touchpad-Bereich sind mit gemessenen 24.6 °C kühler als die typische Hauttemperatur und fühlen sich dadurch kühl an.
(+) Die durchschnittliche Handballen-Temperatur anderer getesteter Geräte war 28.3 °C (+3.7 °C).
Idle (oben)
Idle (oben)
Idle (unten)
Idle (unten)
Prime95+FurMark-Stress (oben)
Prime95+FurMark-Stress (unten)
Dell Latitude 13 7350
Intel Core Ultra 5 135U, Intel Graphics 4-Cores iGPU (Arc)
Dell Latitude 13 7340 i5-1345U
Intel Core i5-1345U, Intel Iris Xe Graphics G7 80EUs
Dell Latitude 13 7330
Intel Core i7-1265U, Intel Iris Xe Graphics G7 96EUs
Apple iPad Air 13 2024
Apple M2, Apple M2 10-Core GPU
Lenovo ThinkBook 13x G4 21KR0008GE
Intel Core Ultra 5 125H, Intel Arc 7-Core iGPU
Framework Laptop 13.5 Ryzen 7 7840U
AMD Ryzen 7 7840U, AMD Radeon 780M
Hitze
-6%
-4%
-25%
-13%
-19%
Last oben max *
35.2
34.3
3%
38.6
-10%
40.6
-15%
43.1
-22%
42
-19%
Last unten max *
37.8
37.6
1%
42
-11%
41.7
-10%
39.2
-4%
47.4
-25%
Idle oben max *
25
28.4
-14%
23.8
5%
35.2
-41%
28.3
-13%
28.8
-15%
Idle unten max *
25.2
28.8
-14%
24.6
2%
33.4
-33%
28
-11%
29.6
-17%

* ... kleinere Werte sind besser

Lautsprecher

Pink Noise: Lautsprecher sind lauter als für diese Größe erwartet und zeigen eine ordentliche Basswiedergabe
dB(A) 0102030405060708090Deep BassMiddle BassHigh BassLower RangeMidsHigher MidsLower HighsMid HighsUpper HighsSuper Highs2033.536.433.52526.825.326.83127.124.127.14025.319.725.35030.219.230.26344.623.844.68050.620.750.610048.319.348.312559.216.159.216065.215.265.220065.216.665.225064.615.864.631565.117.465.140070.315.370.35007114.37163074.114.374.180075.713.475.7100071.71371.71250751375160080.114.380.120008017.180250080.417.980.4315078.917.278.9400078.914.478.9500079.312.479.3630077.911.977.9800070.211.970.21000064.211.664.21250060.511.760.51600056.31256.3SPL89.726.989.7N83.60.883.6median 71.7median 14.3median 71.7Delta6.92.16.926.325.821.422.12624.925.127.622.532.523.448.72655.818.860.922.167.2267019.372.317.674.217.774.319.575.31571.711.871.311.27410.574.21072.710.17210.67210.97511.374.811.671.71269.71269.612.371.112.669.61270.111.269.824.784.70.666.6median 12median 71.73.42.2hearing rangehide median Pink NoiseDell Latitude 13 7350Apple MacBook Pro 16 2021 M1 Pro
Frequenzdiagramm (für Vergleiche die Checkboxen oben an-/abwählen)
Dell Latitude 13 7350 Audio Analyse

(+) | Die Lautsprecher können relativ laut spielen (89.7 dB)
Bass 100 - 315 Hz
(±) | abgesenkter Bass - 10.4% geringer als der Median
(+) | lineare Bass-Wiedergabe (5.9% Delta zum Vorgänger)
Mitteltöne 400 - 2000 Hz
(+) | ausgeglichene Mitten, vom Median nur 3.6% abweichend
(+) | lineare Mitten (5% Delta zum Vorgänger)
Hochtöne 2 - 16 kHz
(±) | zu hohe Hochtöne, vom Median nur 6.6% abweichend
(+) | sehr lineare Hochtöne (4.3% Delta zum Vorgänger)
Gesamt im hörbaren Bereich 100 - 16.000 Hz
(+) | hörbarer Bereich ist sehr linear (13.5% Abstand zum Median
Im Vergleich zu allen Geräten derselben Klasse
» 20% aller getesteten Geräte dieser Klasse waren besser, 6% vergleichbar, 74% schlechter
» Das beste Gerät hat einen Delta-Wert von 5%, durchschnittlich ist 19%, das schlechteste Gerät hat 53%
Im Vergleich zu allen Geräten im Test
» 12% aller getesteten Geräte waren besser, 3% vergleichbar, 84% schlechter
» Das beste Gerät hat einen Delta-Wert von 4%, durchschnittlich ist 25%, das schlechteste Gerät hat 134%

Apple MacBook Pro 16 2021 M1 Pro Audio Analyse

(+) | Die Lautsprecher können relativ laut spielen (84.7 dB)
Bass 100 - 315 Hz
(+) | guter Bass - nur 3.8% Abweichung vom Median
(+) | lineare Bass-Wiedergabe (5.2% Delta zum Vorgänger)
Mitteltöne 400 - 2000 Hz
(+) | ausgeglichene Mitten, vom Median nur 1.3% abweichend
(+) | lineare Mitten (2.1% Delta zum Vorgänger)
Hochtöne 2 - 16 kHz
(+) | ausgeglichene Hochtöne, vom Median nur 1.9% abweichend
(+) | sehr lineare Hochtöne (2.7% Delta zum Vorgänger)
Gesamt im hörbaren Bereich 100 - 16.000 Hz
(+) | hörbarer Bereich ist sehr linear (4.6% Abstand zum Median
Im Vergleich zu allen Geräten derselben Klasse
» 0% aller getesteten Geräte dieser Klasse waren besser, 0% vergleichbar, 100% schlechter
» Das beste Gerät hat einen Delta-Wert von 5%, durchschnittlich ist 18%, das schlechteste Gerät hat 45%
Im Vergleich zu allen Geräten im Test
» 0% aller getesteten Geräte waren besser, 0% vergleichbar, 100% schlechter
» Das beste Gerät hat einen Delta-Wert von 4%, durchschnittlich ist 25%, das schlechteste Gerät hat 134%

Energiemanagement

Energieverbrauch

Im Leerlauf auf dem Desktop werden nur zwischen 2 und 5 W verbraucht, selbst bei maximaler Helligkeit, was einen der niedrigsten Verbräuche bei den 13-Zoll-Subnotebooks darstellt. Dies erklärt gleichzeitig die extrem lange Akkulaufzeit im nächsten Abschnitt. Unter anspruchsvolleren Lasten wie 3DMark 06 oder Witcher 3 gleicht sich der Verbrauch dann dem des Latitude 7340 an. Da die Grafikleistung nun jedoch etwas höher ist, zeigen sich die Effizienzverbesserungen der neuen Meteor-Lake-U-Konfiguration gegenüber der älteren Raptor-Lake-U-Generation.

Wir messen einen temporären Maximalverbrauch von 63 W aus dem extra-kleinen 60-W-USB-C-Netzteil (ca. 6,6 x 5,6 x 2,3 cm) wenn die CPU maximal ausgelastet ist. Durch den limitierten Turbo Boost fällt dieser Wert jedoch sehr schnell auf 33 W, was sich mit unseren Beobachtungen beim CineBench-R15-xT-Loop weiter oben deckt.

Verbrauch unter 3DMark 06
Verbrauch unter Witcher 3 1080p Ultra
Verbrauch geht beim Prime95-Stress für wenige Sekunden auf 63 W hoch, fällt dann schnell und stabilisiert sich schließlich bei 33 W
Prime95+FurMark-Stress bei 10 s gestartet
Stromverbrauch
Aus / Standbydarklight 0.23 / 0.47 Watt
Idledarkmidlight 2 / 4.4 / 4.6 Watt
Last midlight 34.8 / 63.3 Watt
 color bar
Legende: min: dark, med: mid, max: light        Metrahit Energy
Dell Latitude 13 7350
Ultra 5 135U, Graphics 4-Core, Kioxia BG6 KBG60ZNS512G, IPS, 1920x1200, 13.3"
Dell Latitude 13 7340 i5-1345U
i5-1345U, Iris Xe G7 80EUs, Kioxia BG5 KBG50ZNS512G, IPS, 1920x1200, 13.3"
Dell Latitude 13 7330
i7-1265U, Iris Xe G7 96EUs, Toshiba KBG40ZNS512G NVMe, IPS, 1920x1080, 13.3"
Apple iPad Air 13 2024
M2, M2 10-Core GPU, 128 GB NVMe, IPS, 2732x2048, 13"
Lenovo ThinkBook 13x G4 21KR0008GE
Ultra 5 125H, Arc 7-Core, Samsung PM9C1a MZAL8512HDLU, IPS, 2880x1920, 13.5"
Framework Laptop 13.5 Ryzen 7 7840U
R7 7840U, Radeon 780M, WD PC SN740 512GB SDDPNQD-512G, IPS, 2256x1504, 13.5"
Stromverbrauch
-45%
-28%
-10%
-75%
-51%
Idle min *
2
2.37
-19%
2.8
-40%
2.23
-12%
5.4
-170%
4
-100%
Idle avg *
4.4
6.19
-41%
4.8
-9%
8.45
-92%
7.8
-77%
6.5
-48%
Idle max *
4.6
14.1
-207%
7.3
-59%
8.53
-85%
8.9
-93%
6.8
-48%
Last avg *
34.8
36.3
-4%
48.1
-38%
12.52
64%
49.4
-42%
48
-38%
Witcher 3 ultra *
28.5
24.9
13%
35.4
-24%
44.4
-56%
52.3
-84%
Last max *
63.3
69.13
-9%
63.6
-0%
16.76
74%
68.8
-9%
55.2
13%

* ... kleinere Werte sind besser

Energieverbrauch Witcher 3 / Stresstest

051015202530354045505560Tooltip
Dell Latitude 13 7350 Ultra 5 135U, Graphics 4-Core; Witcher 3 ultra: Ø28.5 (27.4-38.2)
Framework Laptop 13.5 Ryzen 7 7840U R7 7840U, Radeon 780M; Witcher 3 ultra: Ø52.3 (51.2-53.8)
Dell Latitude 13 7350 Ultra 5 135U, Graphics 4-Core; 1280x720 Prime95 28.10 and Furmark 1.25: Ø39.6 (35-63.3)
Framework Laptop 13.5 Ryzen 7 7840U R7 7840U, Radeon 780M; 1280x720 Prime95 28.10 and Furmark 1.25: Ø55 (54.5-55.2)
Dell Latitude 13 7350 Ultra 5 135U, Graphics 4-Core; Idle 150cd/m2: Ø2.29 (2.01-5.92)
Framework Laptop 13.5 Ryzen 7 7840U R7 7840U, Radeon 780M; Idle 150cd/m2: Ø4.74 (4.28-8.77)

Energieverbrauch mit externem Monitor

051015202530354045505560Tooltip
Dell Latitude 13 7350 Ultra 5 135U, Graphics 4-Core; Prime95 V2810 Stress (external Monitor): Ø33.7 (28-63.2)
Framework Laptop 13.5 Ryzen 7 7840U R7 7840U, Radeon 780M; Prime95 V2810 Stress (external Monitor): Ø54.7 (54.3-55)
Dell Latitude 13 7350 Ultra 5 135U, Graphics 4-Core; Cinebench R15 Multi (external Monitor): Ø47.5 (30.2-62)
Framework Laptop 13.5 Ryzen 7 7840U R7 7840U, Radeon 780M; Cinebench R15 Multi (external Monitor): Ø50.4 (40.1-54.8)
Dell Latitude 13 7350 Ultra 5 135U, Graphics 4-Core; 1280x720 FurMark 1.19 GPU Stress Test (external Monitor): Ø25.6 (24.2-30.1)
Framework Laptop 13.5 Ryzen 7 7840U R7 7840U, Radeon 780M; 1280x720 FurMark 1.19 GPU Stress Test (external Monitor): Ø52.9 (29.4-54)
Dell Latitude 13 7350 Ultra 5 135U, Graphics 4-Core; 1920x1080 The Witcher 3 ultra (external Monitor): Ø26.8 (25.3-35.5)
Framework Laptop 13.5 Ryzen 7 7840U R7 7840U, Radeon 780M; 1920x1080 The Witcher 3 ultra (external Monitor): Ø51.2 (50.7-52.2)
Dell Latitude 13 7350 Ultra 5 135U, Graphics 4-Core; Idle 1min (external Monitor): Ø2.16 (1.668-4.16)
Framework Laptop 13.5 Ryzen 7 7840U R7 7840U, Radeon 780M; Idle 1min (external Monitor): Ø4.05 (3.56-6.57)

Aukkulaufzeit

Die Laufzeiten sind mit knapp über 15 Stunden in unserem Wi-Fi-Browsing-Realszenario ziemlich genau auf dem Level des Latitude 7340. Damit haben wir hier wieder einen der ausdauerndsten 13-Zoll-Subnotebooks auf dem Markt, welches sogar das MacBook Air oder auch das gerade veröffentlichte ARM-betriebene EliteBook Ultra schlägt.

Akkulaufzeit
WiFi Websurfing
15h 05min
Dell Latitude 13 7350
Ultra 5 135U, Graphics 4-Core, 57 Wh
Dell Latitude 13 7340 i5-1345U
i5-1345U, Iris Xe G7 80EUs, 57 Wh
Dell Latitude 13 7330
i7-1265U, Iris Xe G7 96EUs, 41 Wh
Apple iPad Air 13 2024
M2, M2 10-Core GPU, 36.59 Wh
Lenovo ThinkBook 13x G4 21KR0008GE
Ultra 5 125H, Arc 7-Core, 74 Wh
Framework Laptop 13.5 Ryzen 7 7840U
R7 7840U, Radeon 780M, 61 Wh
Akkulaufzeit
0%
-45%
-15%
-24%
-20%
WLAN
905
901
0%
497
-45%
771
-15%
684
-24%
726
-20%
Last
176
84
272
116
Idle
1314
1519
H.264
783
1229

Pro

+ Thunderbolt 4
+ sehr lange Akkulaufzeit
+ Wi-Fi 7 und AI-fähig
+ einfache Wartung
+ ultraleichtes Design

Contra

- 5-MP-Webcam nur bei bestimmten SKUs verfügbar
- eingeschränkte Turbo-Boost-Leistung
- Unterstützung nur für M.2-2230-SSDs
- keine Windows VRR-Unterstützung
- spürbares Ghosting

Fazit — Verfeinert und poliert

Im Test: Das Dell Latitude 13 7350 Clamshell

Das Latitude 7350 bügelt einige der kleineren Fehler des letztjährigen Latitude-7340-Redesign aus. Die thermische Drosselung der SSD ist Geschichte, eine (optionale) 5-MP-Webcam ersetzt die alternde 2-MP-Kamera, der RAM ist nun schneller (6.400 MT/s vs. 4.800 MT/s) und sowohl Wi-Fi 7 als auch KI-Beschleunigung werden nun unterstützt und sorgen für Zukunftsicherheit. Klar, auch das leichte Leistungsplus durch den neuen Prozessor sollte nicht übergangen werden, immerhin ist das neue Modell schneller ohne die Akkulaufzeit, die Lautstärke oder die Oberflächentemperaturen zu beeinträchtigen. Trotz des kleinen 13,3-Zoll-Designs und des sehr mobilen Gewichts versprüht der kleine Laptop ordentlich Kraft.

Das Latitude 7350 wurde für sein 1-kg-Gewicht und seine extrem lange Akkulaufzeit ausgezeichnet und ist daher ideal für viele Business-Reisende. In Sachen Displayoptionen und Grafikleistung bietet es wenig überragendes, aber das dürfte in den meisten Nutzungsszenarien keine Rolle spielen.

Dennoch gibt es etwas Spielraum für Verbesserungen: Beispielsweise sind die Displayoptionen für die Clamshell-Version nur auf IPS und 1.200p limitiert. Außerdem lässt sich kein Modell mit sowohl Touchscreen als auch 5-MP-Webcam gleichzeitig konfigurieren. Konkurrierende Modelle wie das ThinkBook 13x, das HP Dragonfly oder das EliteBook 1040 bieten schnellere Bildwiederholraten, tiefere Farben und hellere Displays und/oder eine schnellere Grafikleistung als das Latitude 7350. Keine der Alternativen sind derart leicht, dennoch sind es starke Alternativen, insbesondere wenn es auf die Bildqualität ankommt.

Preis und Verfügbarkeit

In Deutschland ist das Latitude 13 7350 bislang noch nicht mit Core Ultra 5 135U erhältlich. Eine Version mit Ultra 5 125U, 16 GB RAM, 250-Nits-Display und 2-MP-Webcam kostet bereits 1.593 Euro bei Dell, die Variante mit Ultra 7 165U, 400-Nits-IPS (immer noch ohne Touch), 32 GB RAM, 5-MP-Kamera kostet dann enorme 2.284 Euro.

Hinweis: Wir haben unser Rating-System aktualisiert und die Ergebnisse von Version 8 sind nicht vergleichbar mit den Ergebnissen von Version 7. Weitere Informationen dazu sind hier verfügbar.

Dell Latitude 13 7350 - 30.06.2024 v8
Allen Ngo

Gehäuse
84 / 98 → 86%
Tastatur
87%
Pointing Device
86%
Konnektivität
73 / 74 → 98%
Gewicht
74 / 20-77 → 95%
Akkulaufzeit
90%
Display
83%
Leistung Spiele
30 / 75 → 41%
Leistung Anwendungen
73 / 92 → 79%
Temperatur
95%
Lautstärke
84%
Audio
81 / 91 → 89%
Kamera
45 / 75 → 60%
Durchschnitt
70%
86%
Subnotebook - gewichteter Durchschnitt
Weitere Informationen über unsere Bewertung finden Sie hier.
CO2 Emissions
Materials
50%
Packaging
50%
Power Use
90.2%
Repairability
80%
Software Updates
Recycle Logo Total Sustainability Score: 0%

Transparenz

Die Auswahl der zu testenden Geräte erfolgt innerhalb der Redaktion. Das vorliegende Testmuster wurde dem Autor vom Hersteller oder einem Shop zu Testzwecken leihweise zur Verfügung gestellt. Eine Einflussnahme des Leihstellers auf den Testbericht gab es nicht, der Hersteller erhielt keine Version des Reviews vor der Veröffentlichung. Es bestand keine Verpflichtung zur Publikation. Unsere Reviews erfolgen stets ohne Gegenleistung oder Kompensationen. Als eigenständiges, unabhängiges Unternehmen unterliegt Notebookcheck keiner Diktion von Herstellern, Shops und Verlagen.

So testet Notebookcheck

Pro Jahr werden von Notebookcheck hunderte Laptops und Smartphones unabhängig in von uns standardisierten technischen Verfahren getestet, um eine Vergleichbarkeit aller Testergebnisse zu gewährleisten. Seit rund 20 Jahren entwickeln wir diese Testmethoden kontinuierlich weiter und setzen damit Branchenstandards. In unseren Testlaboren kommt ausschließlich hochwertiges Messequipment in die Hände erfahrener Techniker und Redakteure. Die Tests unterliegen einer mehrstufigen Kontrolle. Unsere komplexe Gesamtbewertung basiert auf hunderten fundierten Messergebnissen und Benchmarks, womit Ihnen Objektivität garantiert ist. Weitere Informationen zu unseren Testmethoden gibt es hier.

Preisvergleich

Alle 2 Beträge lesen / Antworten
static version load dynamic
Loading Comments
Diesen Artikel kommentieren / Antworten
Teilen Sie diesen Artikel, um uns zu unterstützen. Jeder Link hilft!
Mail Logo
> Notebook Test, Laptop Test und News > Tests > Notebook Testberichte > Leistungsdebut des Core Ultra 5 135U: Superleichtes Dell Latitude 13 7350 im Laptop-Test
Autor: Allen Ngo,  1.07.2024 (Update:  2.07.2024)