Lenovo IdeaPad Pro 5 16IMH G9 im Test: 90 W GeForce RTX 4050 fast so gut wie die RTX 4060

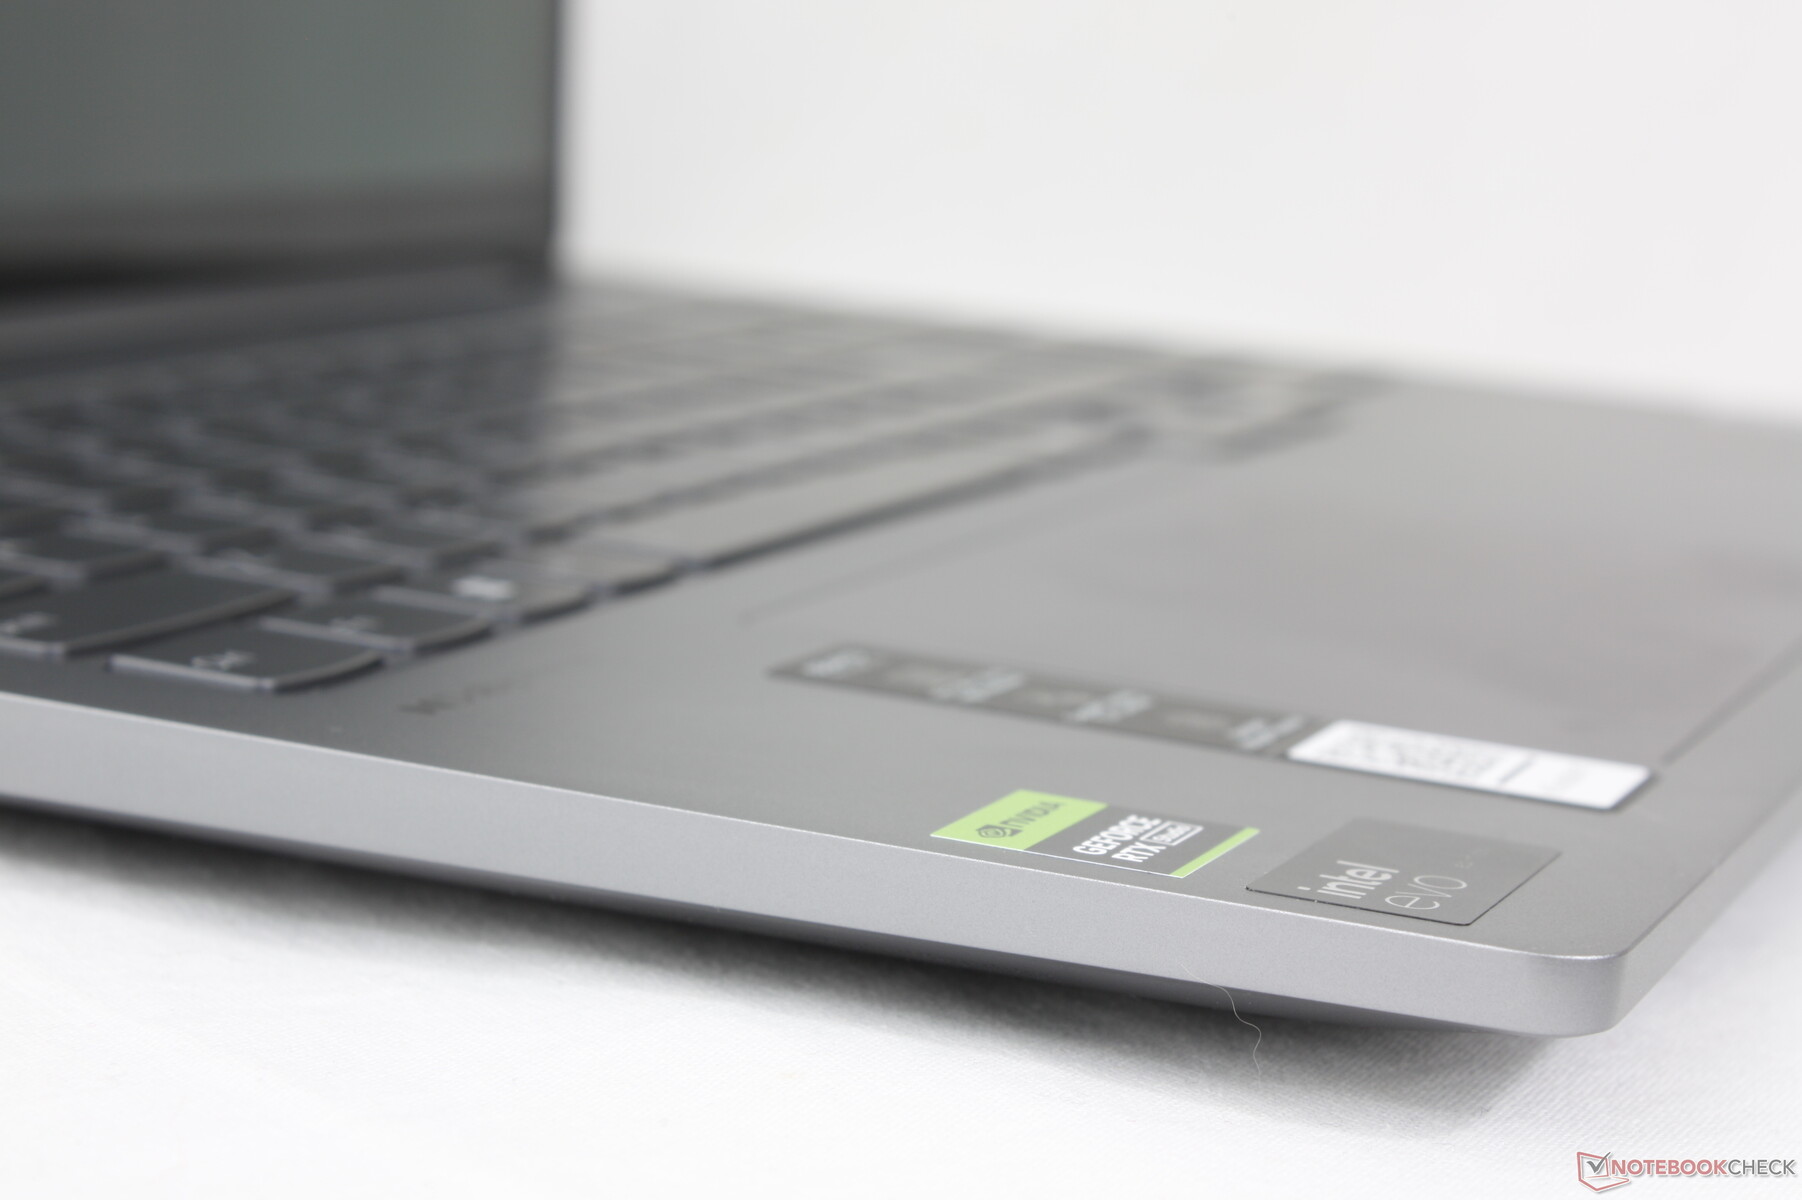
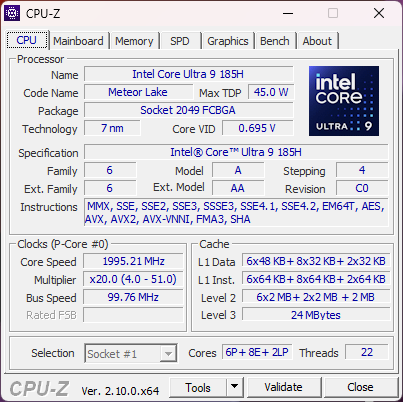
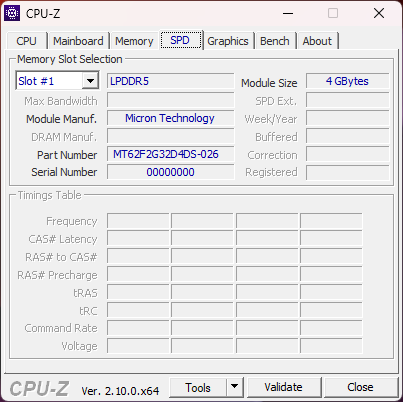
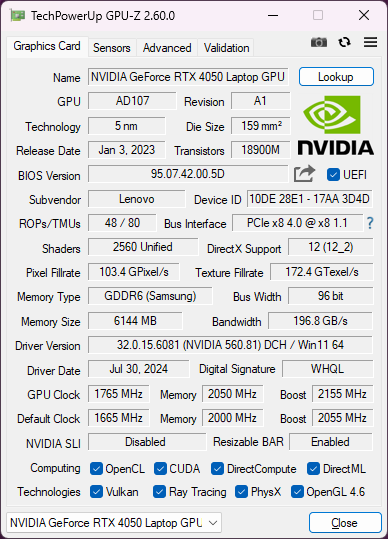
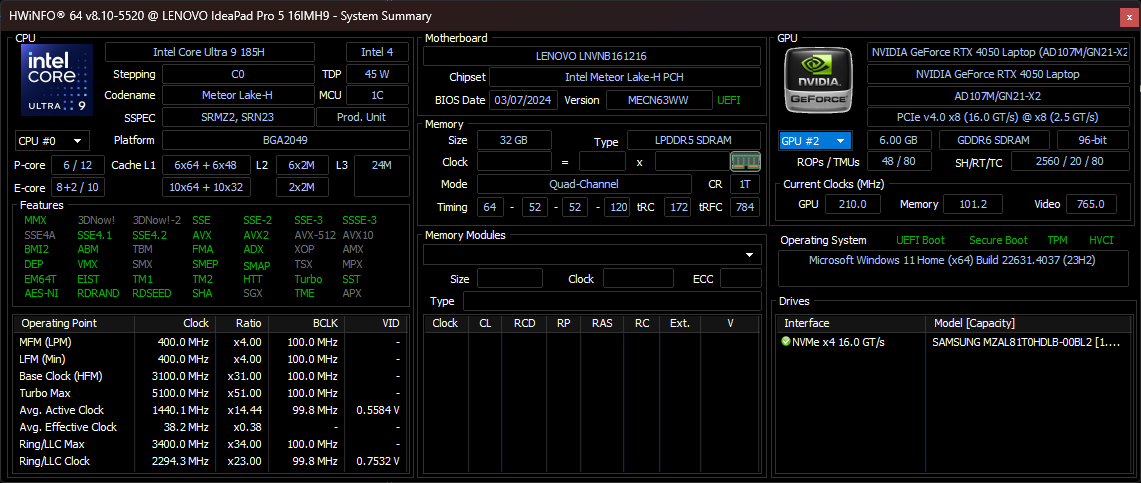
Nachdem wir kürzlich die günstigere iGPU- und IPS-Version des IdeaPad Pro 5 16IMH getestet haben, sind wir nun bereit, die teurere dGPU- und OLED-Variante zu bewerten. Unser Testgerät ist mit High-End-Komponenten ausgestattet, darunter der Meteor Lake Core Ultra 9 185H, der im Handel für rund 1.400 Euro erhältlich ist. Besonders hervorzuheben ist die leistungsstarke 90-Watt-GeForce RTX 4050, die in dieser Kategorie selten anzutreffen ist, da die meisten ultradünnen Multimedia-Notebooks auf niedrigere TGP-Werte setzen.
Das IdeaPad Pro 5 16 G9 unterscheidet sich zudem vom Flaggschiff-Modell Yoga Pro 9i 16 G9, das Optionen wie Mini-LED-Displays und RTX 4070-Grafik bietet, die beim IdeaPad nicht verfügbar sind.
Zu den Alternativen für das IdeaPad Pro 5 16IMH gehören andere 16-Zoll-Multimedia-Laptops der Mittel- bis Oberklasse, wie das Dell Inspiron 16 7640 2-in-1, Asus Zenbook S16, das Samsung Galaxy Book4 Ultra oder die HP Envy-Serie. Weitere Details zu den physischen Eigenschaften des Modells finden Sie in unserem Testbericht zur iGPU-Version des IdeaPad Pro 5 16IMH G9. Darüber hinaus gibt es auch eine kleinere 14-Zoll-Variante, das IdeaPad Pro 5 14 G9.
Weitere Lenovo Bewertungen:
Mögliche Konkurrenten im Vergleich
Bew. | Version | Datum | Modell | Gewicht | Dicke | Größe | Auflösung | Preis ab |
|---|---|---|---|---|---|---|---|---|
| 84.7 % | v8 | 09 / 2024 | Lenovo IdeaPad Pro 5 16IMH G9 RTX 4050 Ultra 9 185H, GeForce RTX 4050 Laptop GPU | 2 kg | 18.95 mm | 16.00" | 2048x1280 | |
| 87.9 % v7 (old) | v7 (old) | 05 / 2024 | Lenovo IdeaPad Pro 5 16IMH G9 Ultra 7 155H, Arc 8-Core | 1.9 kg | 17.5 mm | 16.00" | 2560x1600 | |
| 82.1 % | v8 | 07 / 2024 | Dell Inspiron 16 7640 2-in-1 Ultra 7 155H, Arc 8-Core | 2.1 kg | 18.99 mm | 16.00" | 2560x1600 | |
| 84.7 % | v8 | 07 / 2024 | Asus Zenbook S 16 UM5606-RK333W Ryzen AI 9 HX 370, Radeon 890M | 1.5 kg | 12.9 mm | 16.00" | 2880x1800 | |
| 87.2 % v7 (old) | v7 (old) | 05 / 2024 | HP Envy x360 2-in-1 16-ad0097nr R7 8840HS, Radeon 780M | 1.8 kg | 18.3 mm | 16.00" | 2880x1800 | |
| 90.4 % v7 (old) | v7 (old) | 03 / 2024 | Samsung Galaxy Book4 Ultra Ultra 7 155H, GeForce RTX 4050 Laptop GPU | 1.8 kg | 17 mm | 16.00" | 2880x1800 |
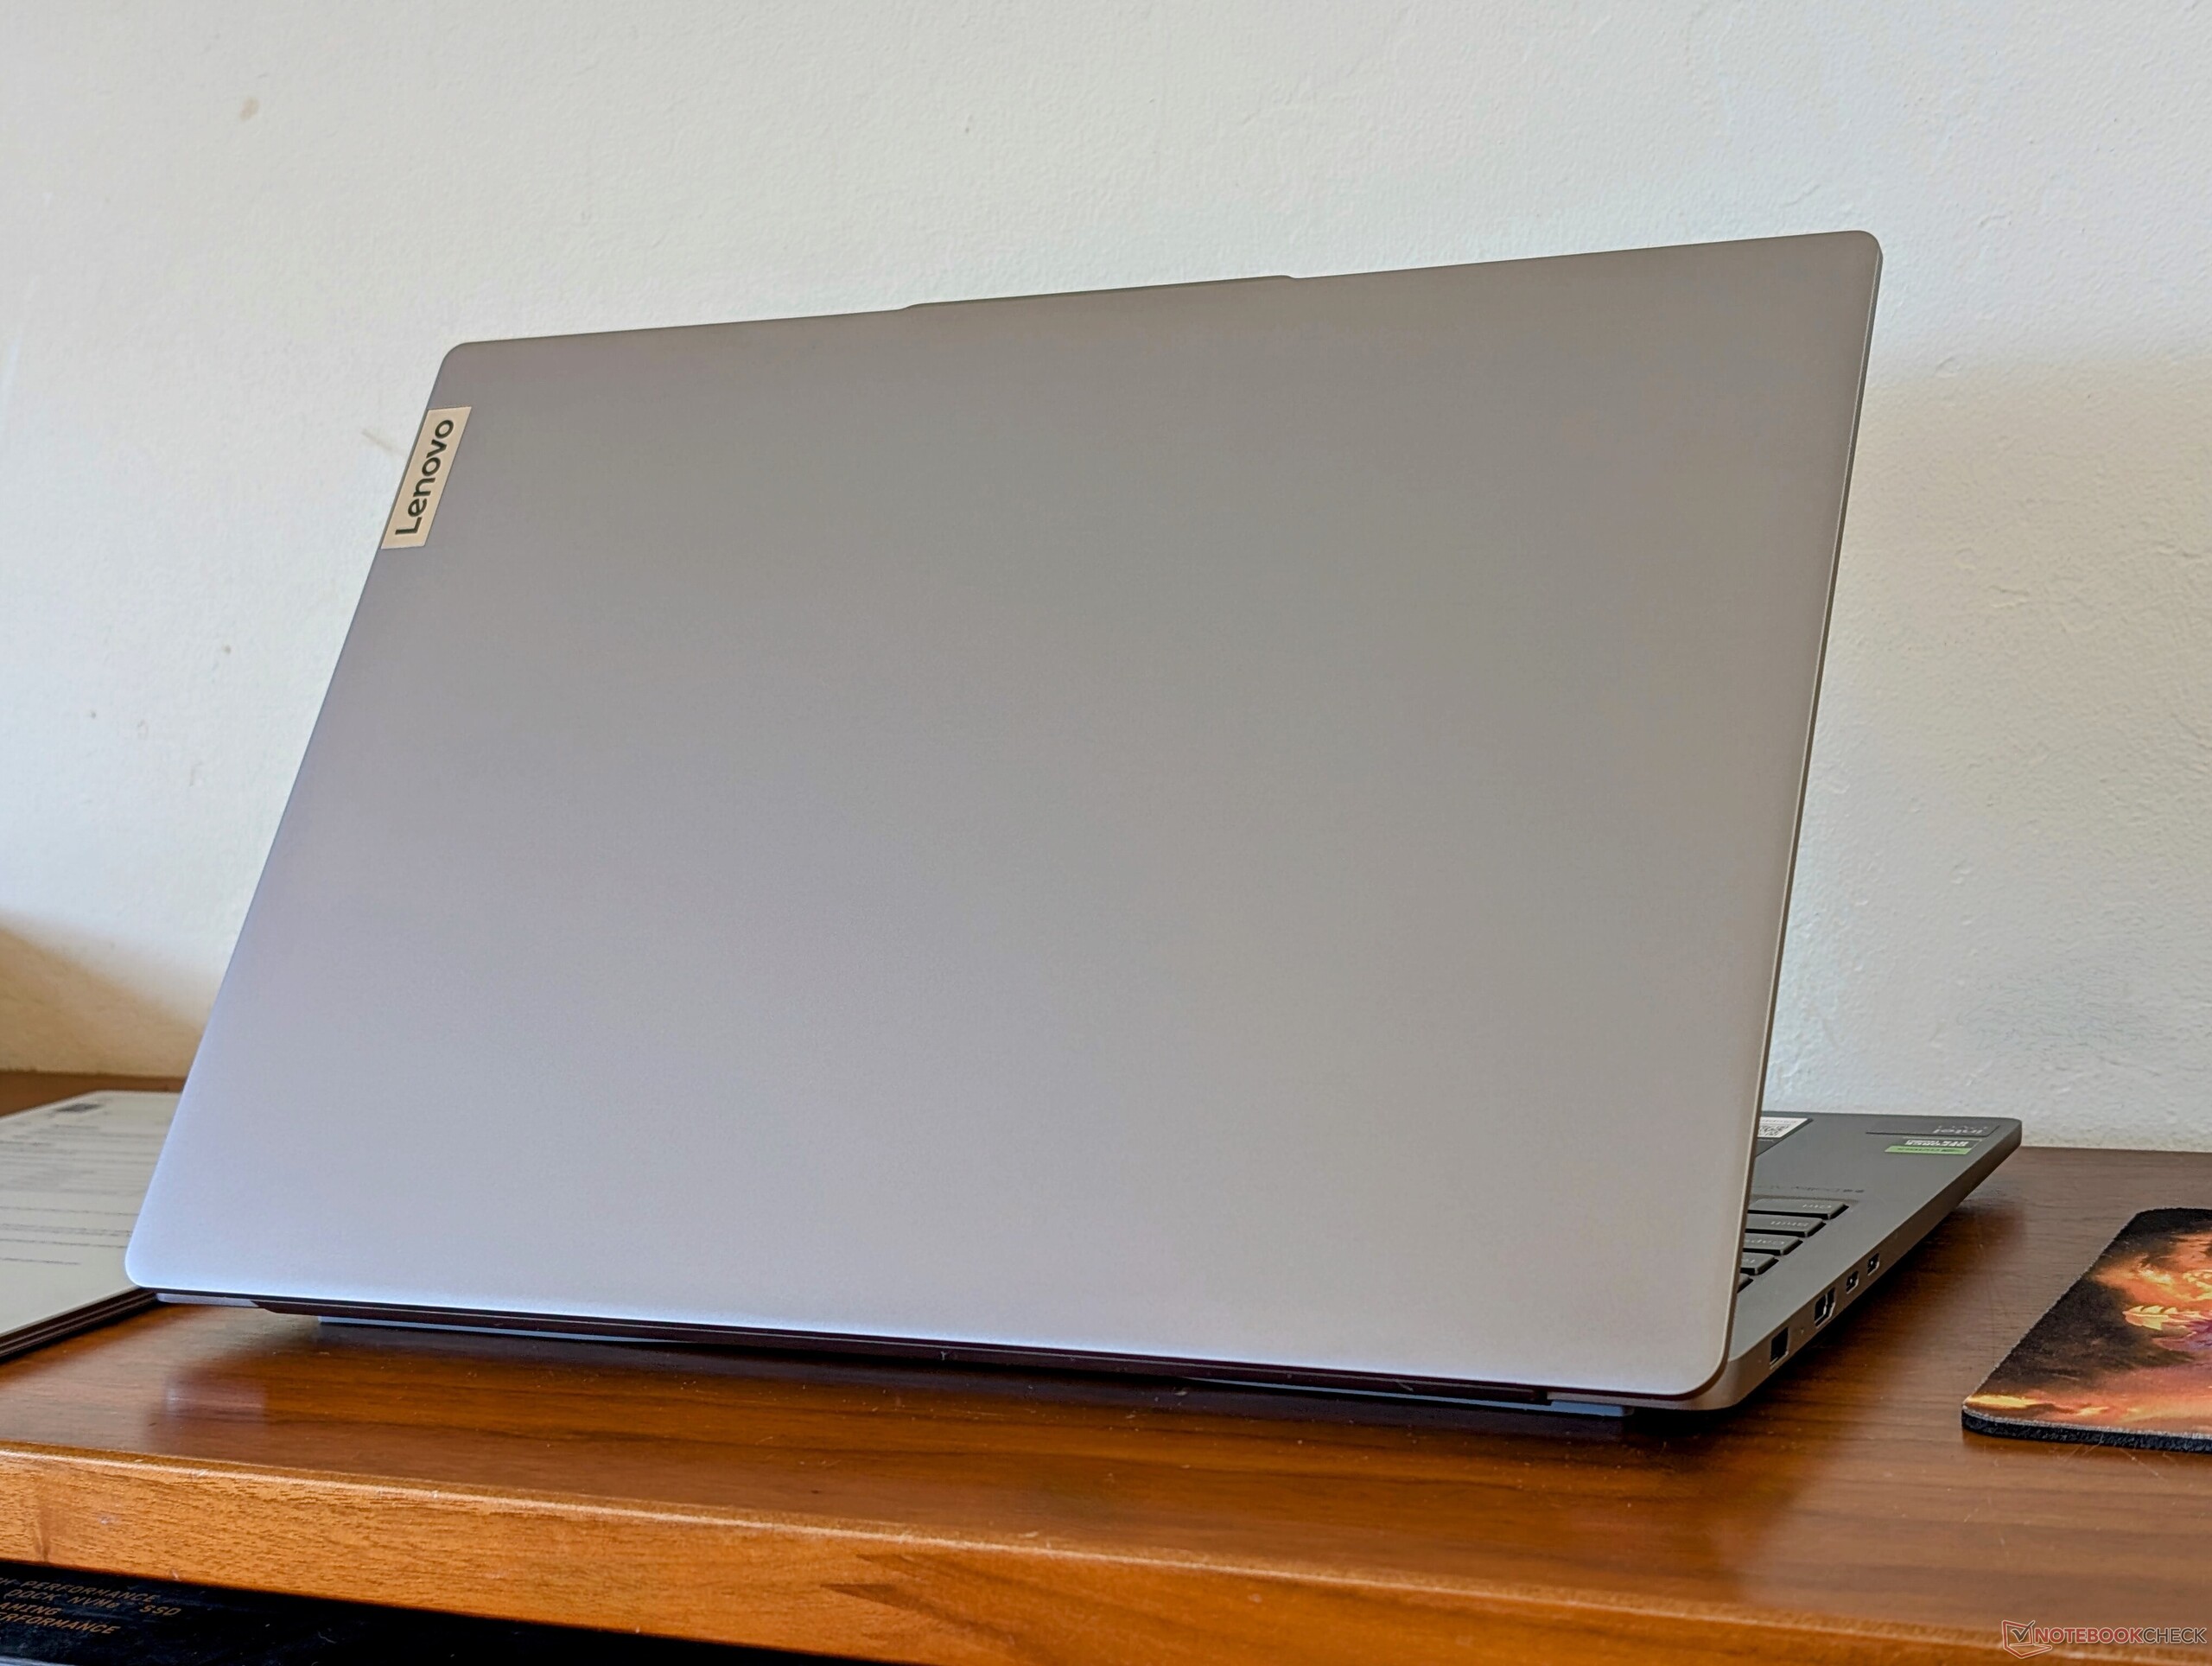
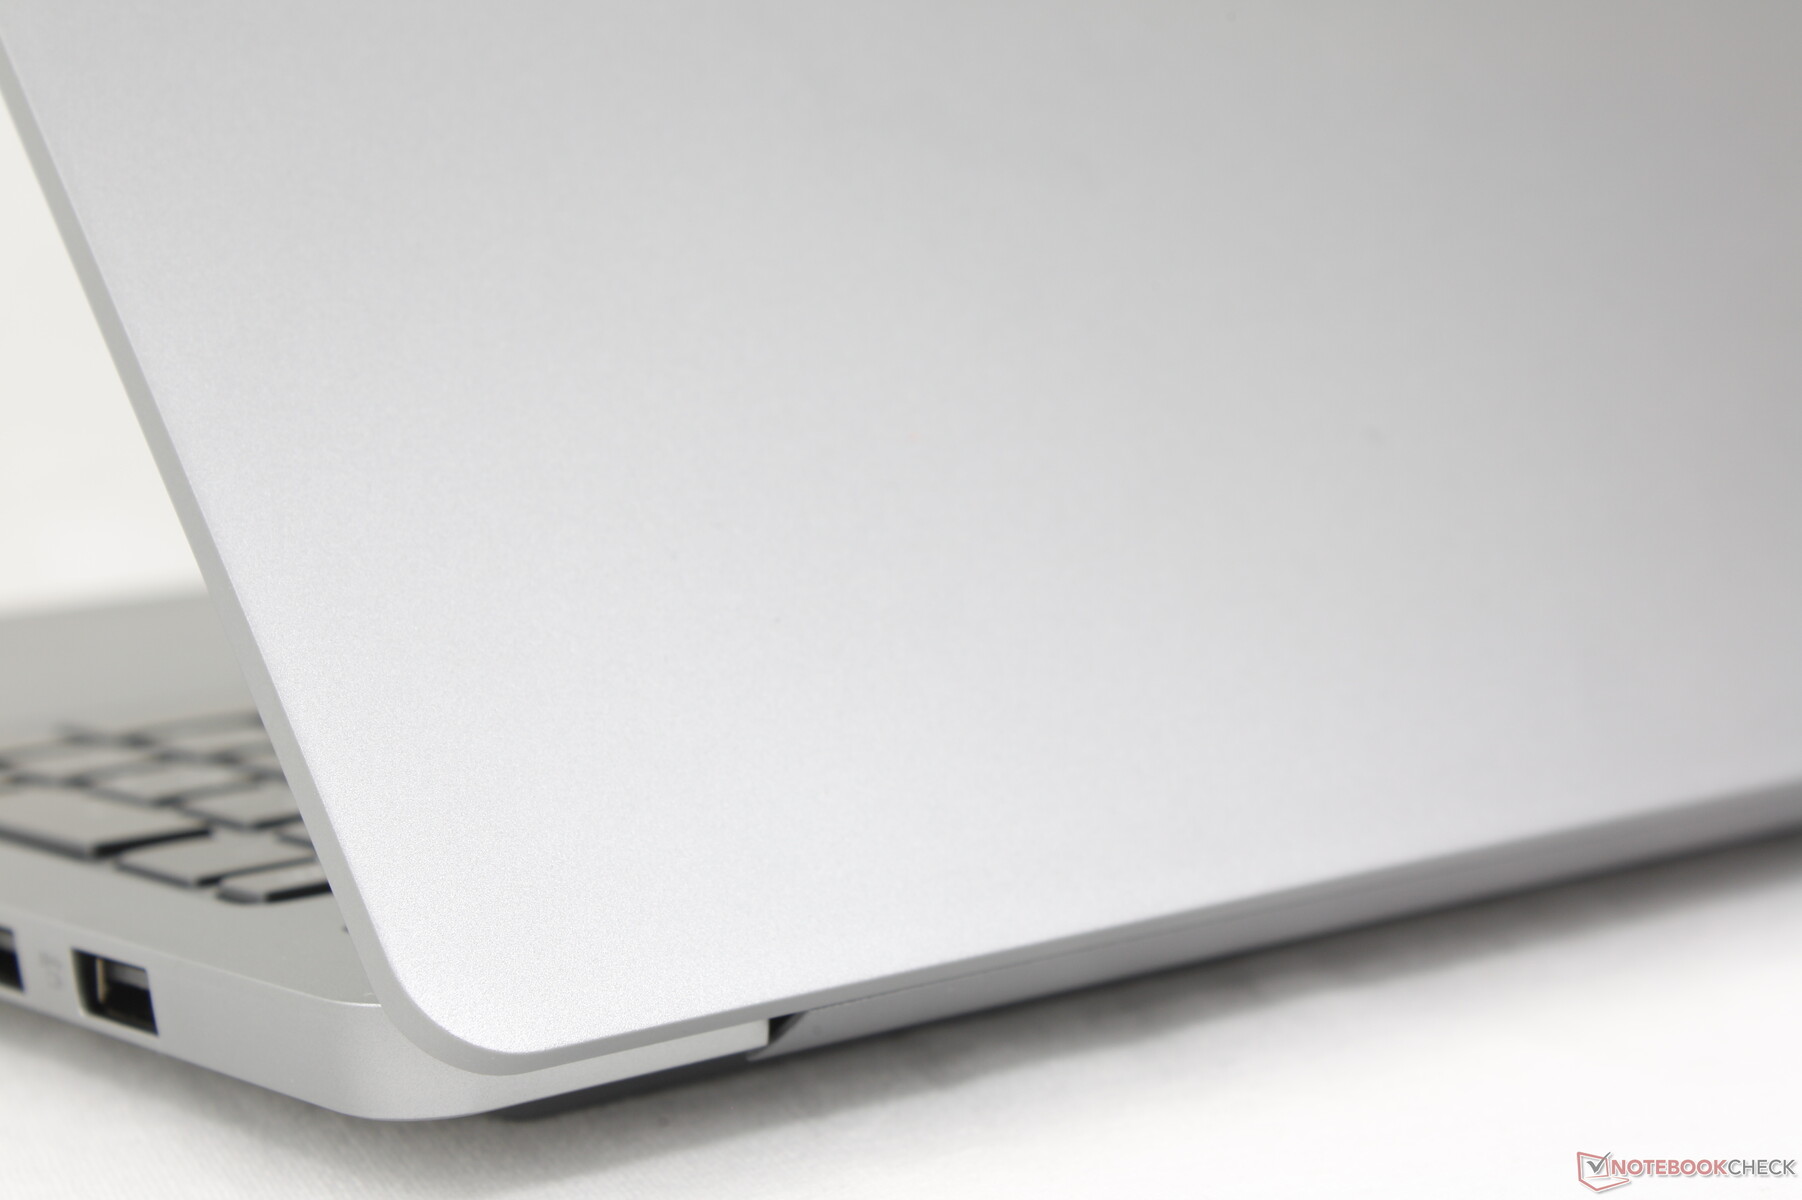
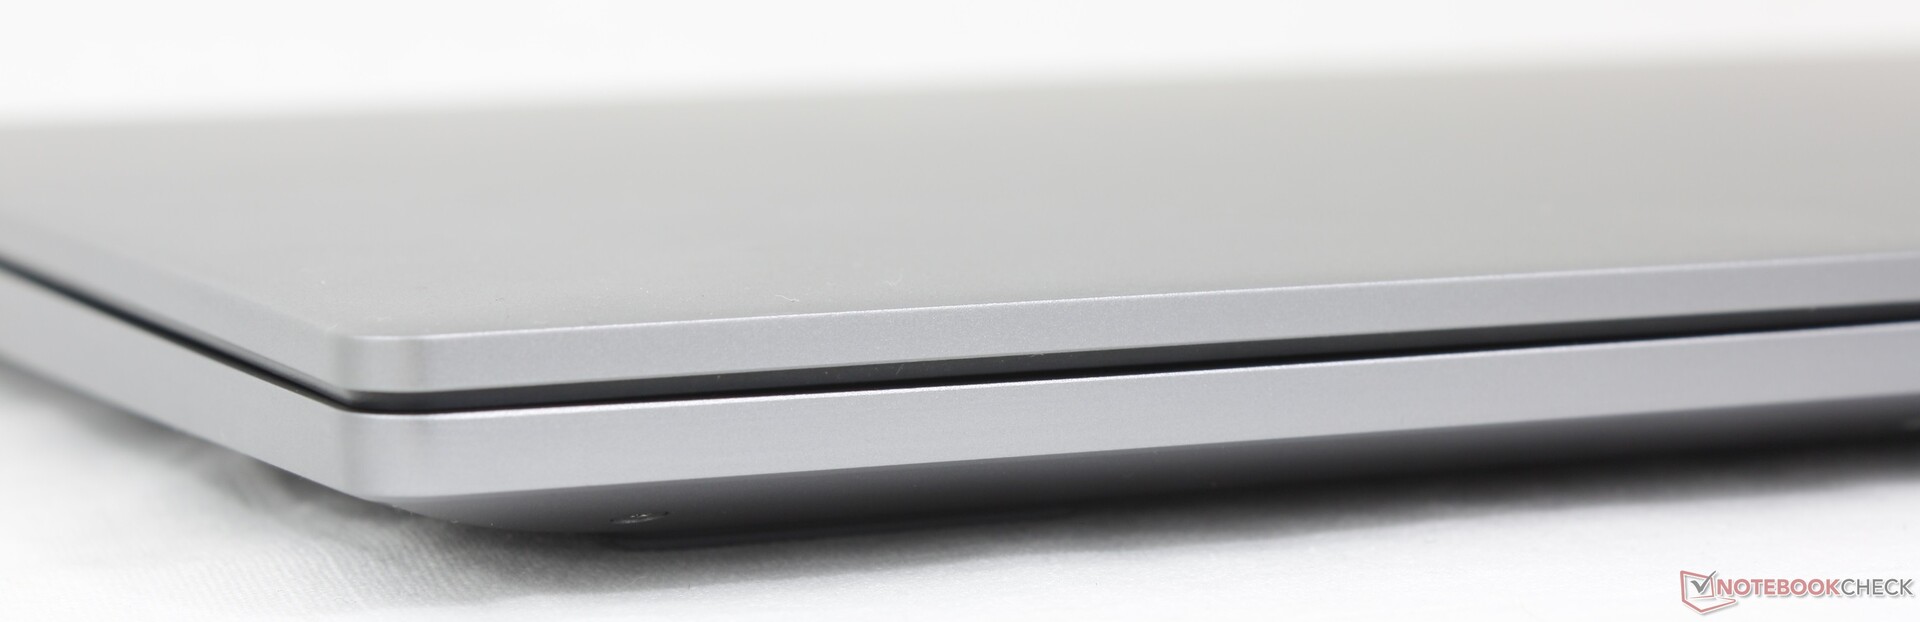
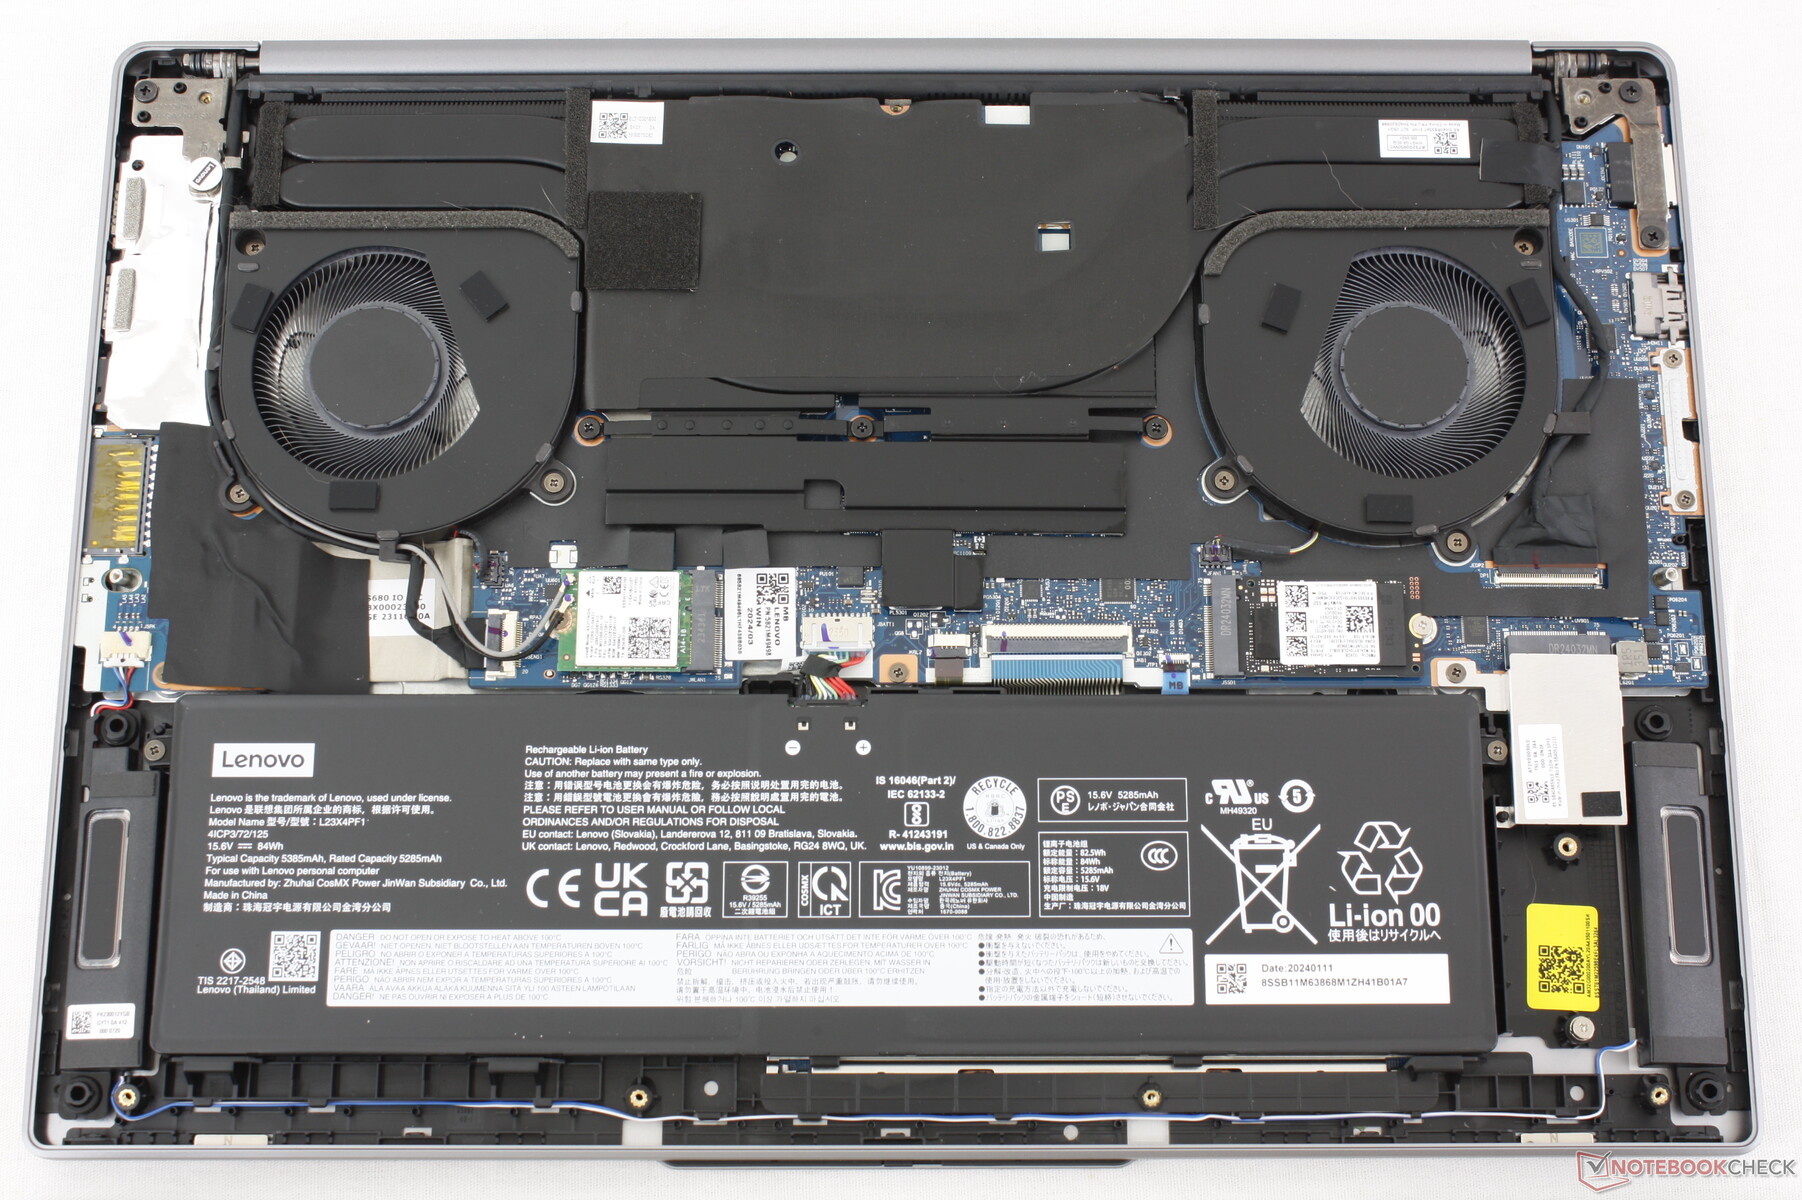
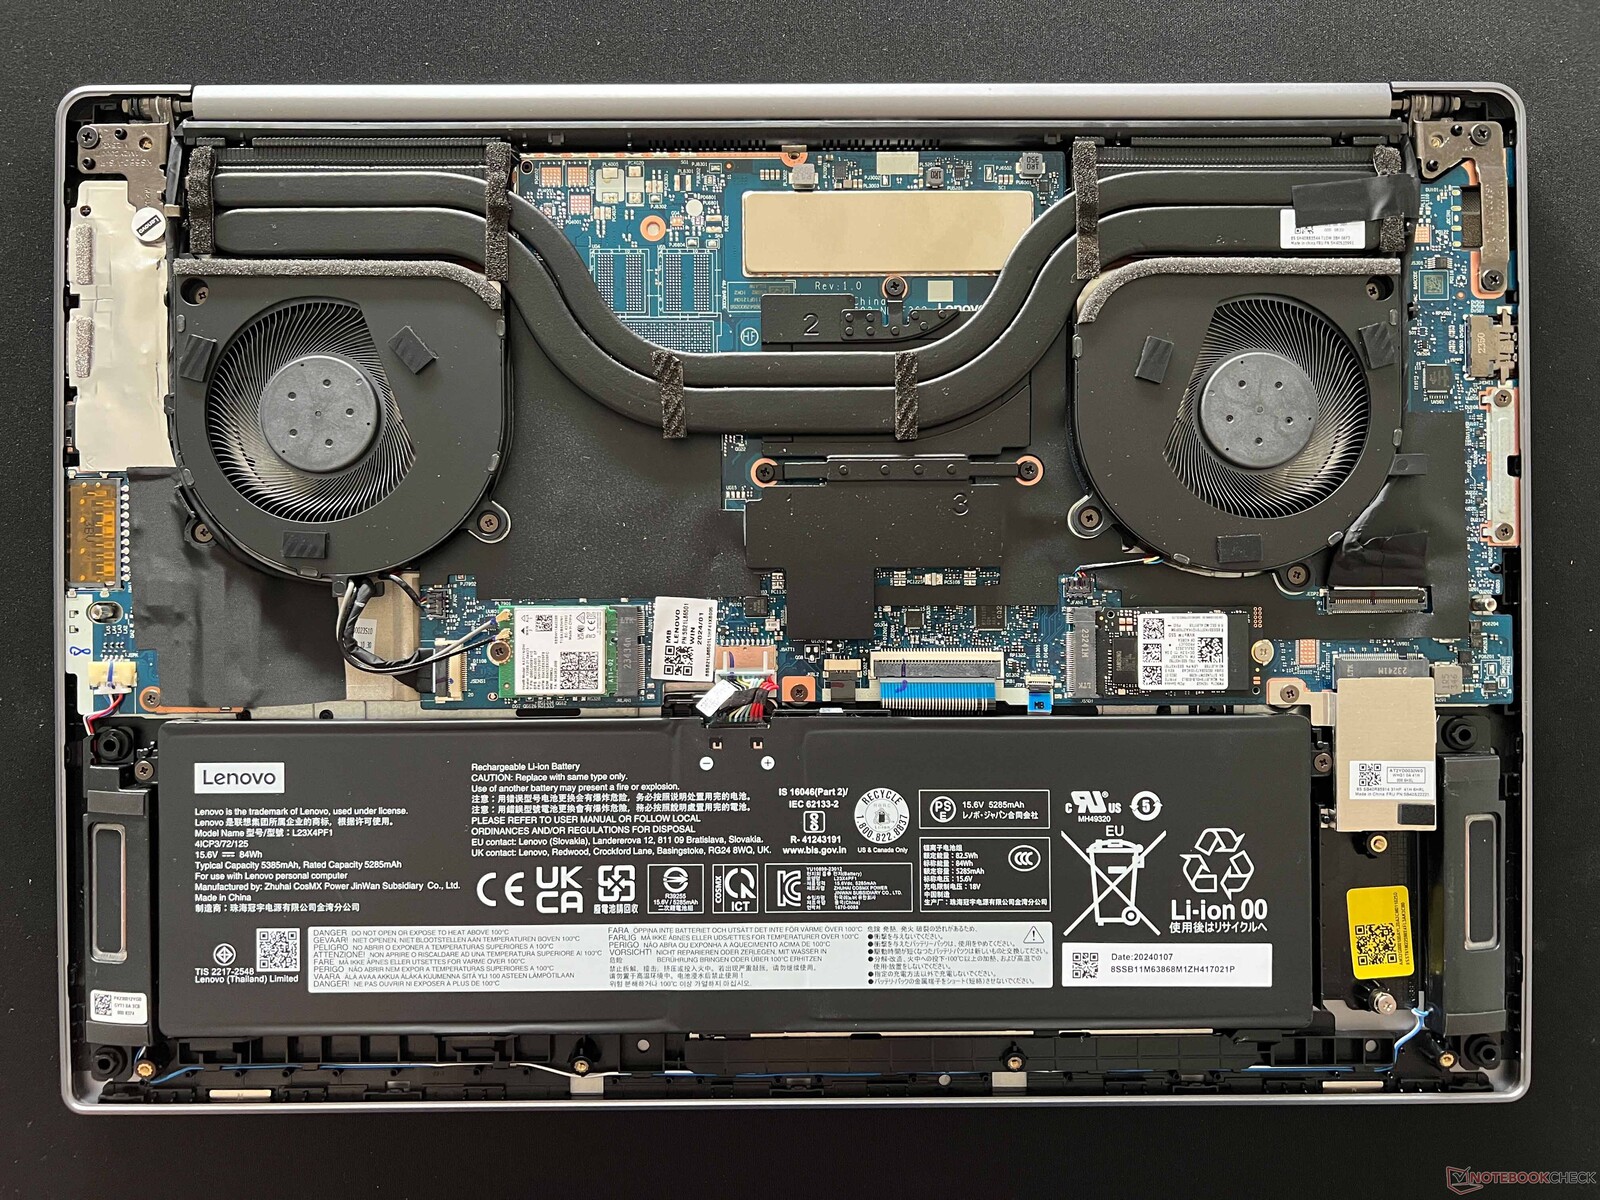
Gehäuse
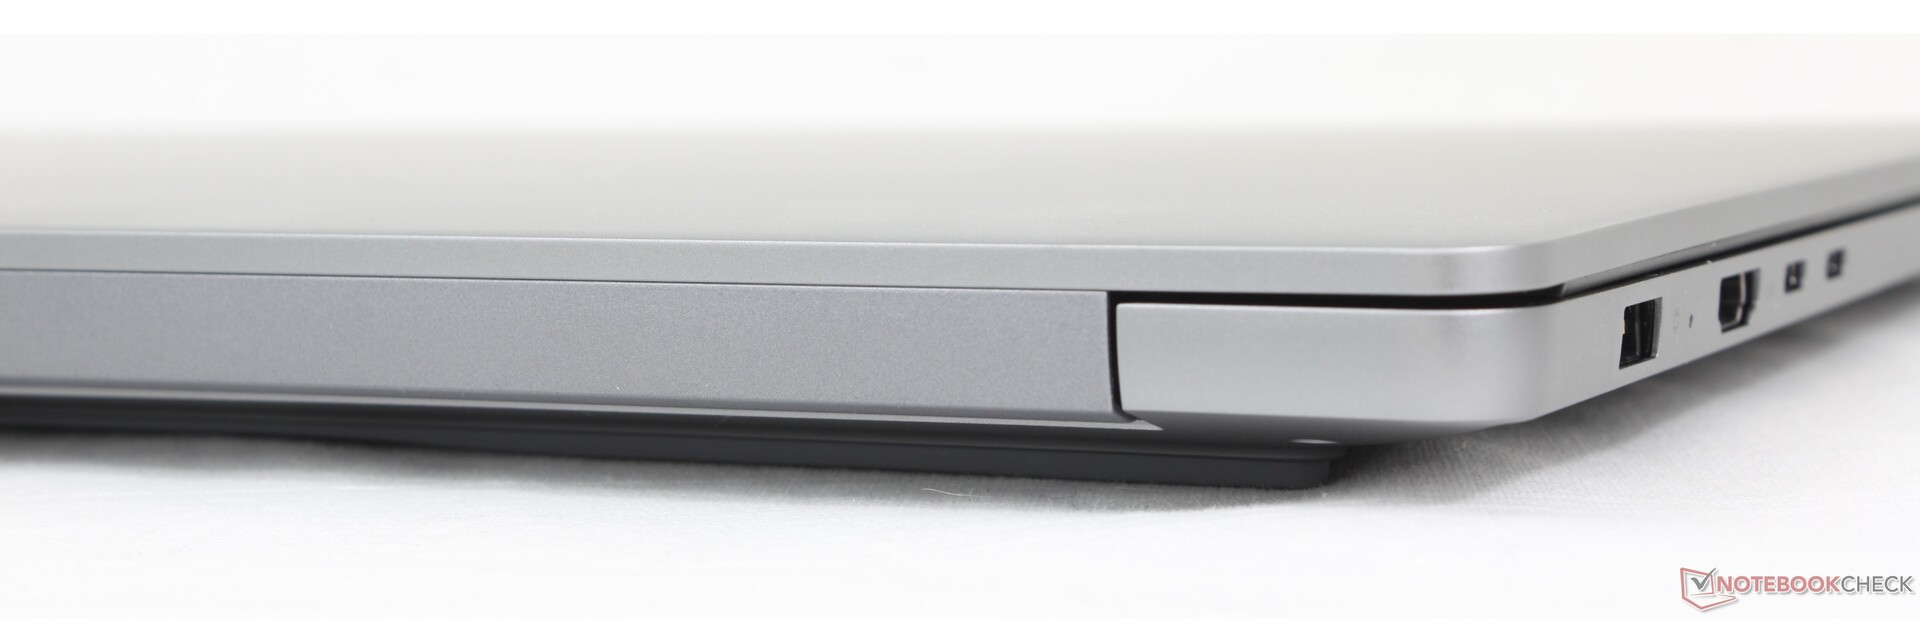
Das Gehäuse verfügt über einen eigenen Netzteilanschluss an der linken Seite, wodurch sich die iGPU- und dGPU-Konfigurationen leicht voneinander unterscheiden lassen. Die zusätzliche GPU und das OLED-Display erhöhen das Gesamtgewicht um etwa 100 Gramm, sodass unser Gerät kaum schwerer ist als die Basisversion mit iGPU. Abgesehen davon bleiben die Abmessungen, das Design und die verwendeten Materialien unverändert.

Ausstattung
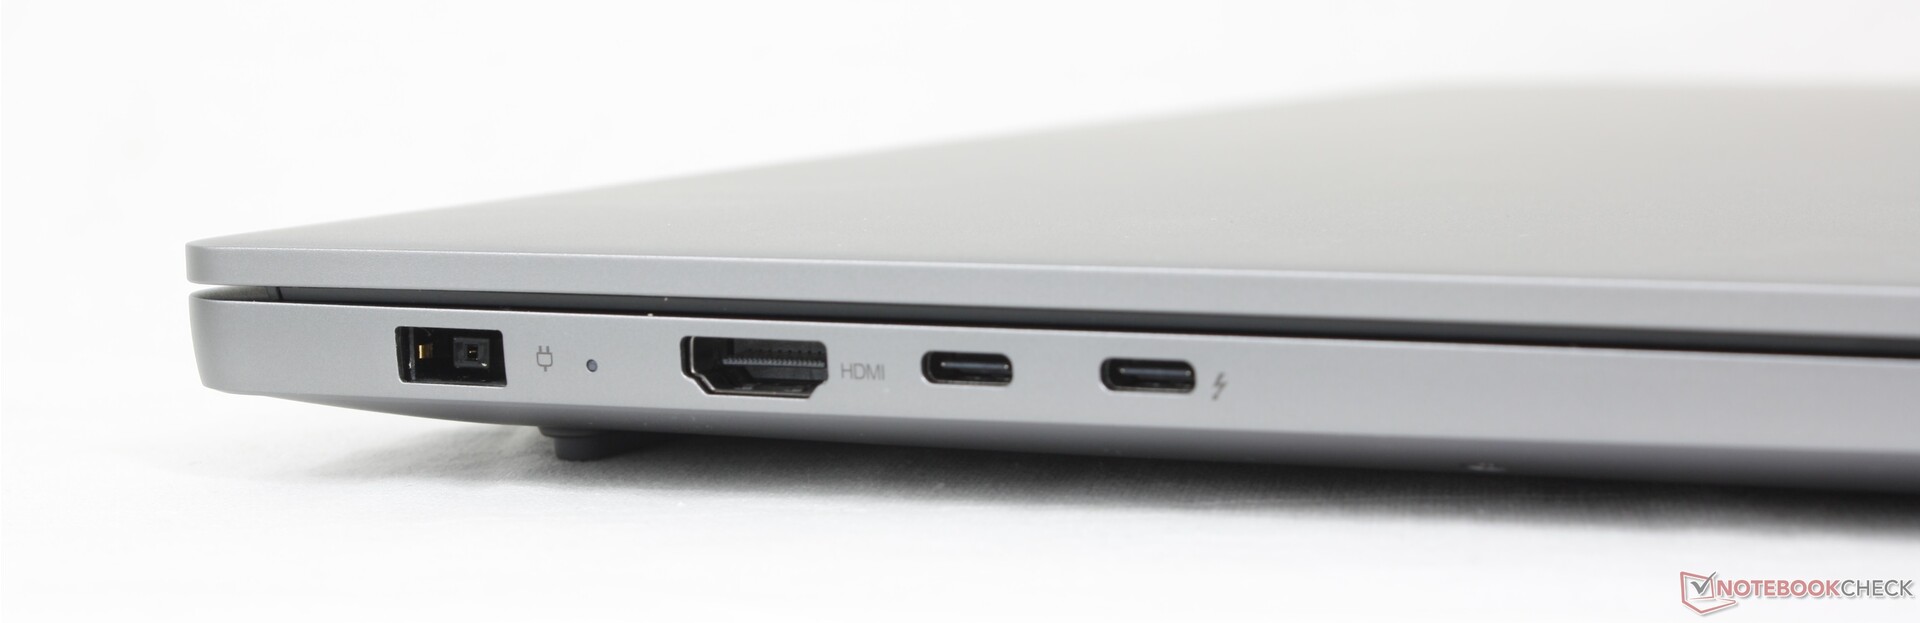
Unsere dGPU-Konfiguration unterstützt sowohl das universelle USB-C-Laden als auch das Laden über ein proprietäres Netzteil, im Gegensatz zur iGPU-Version, die nur über USB-C geladen werden kann. Das eigene Netzteil ist erforderlich, um die leistungsstarke Core-Ultra-H-CPU und die diskrete 90-Watt-Nvidia-GPU mit genügend Energie zu versorgen, ohne die TGP auf 50 Watt zu begrenzen, wie es Samsung bei seinem Galaxy Book4 Ultra tut.
Abgesehen davon sind die Anschlussmöglichkeiten mit denen des Dell Inspiron 16 7640 2-in-1 identisch, bieten jedoch mehr Optionen als das Samsung Galaxy Book.
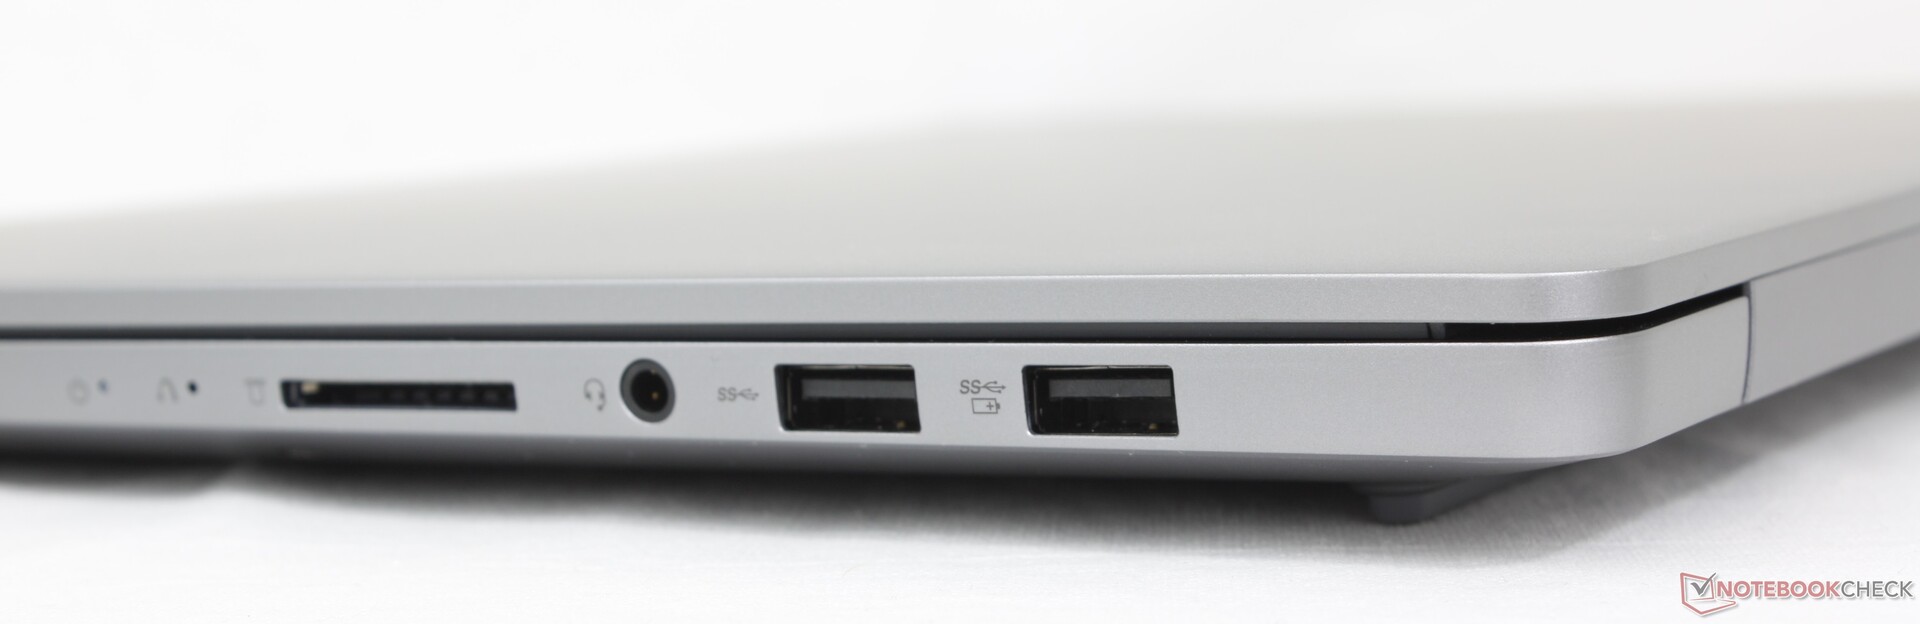
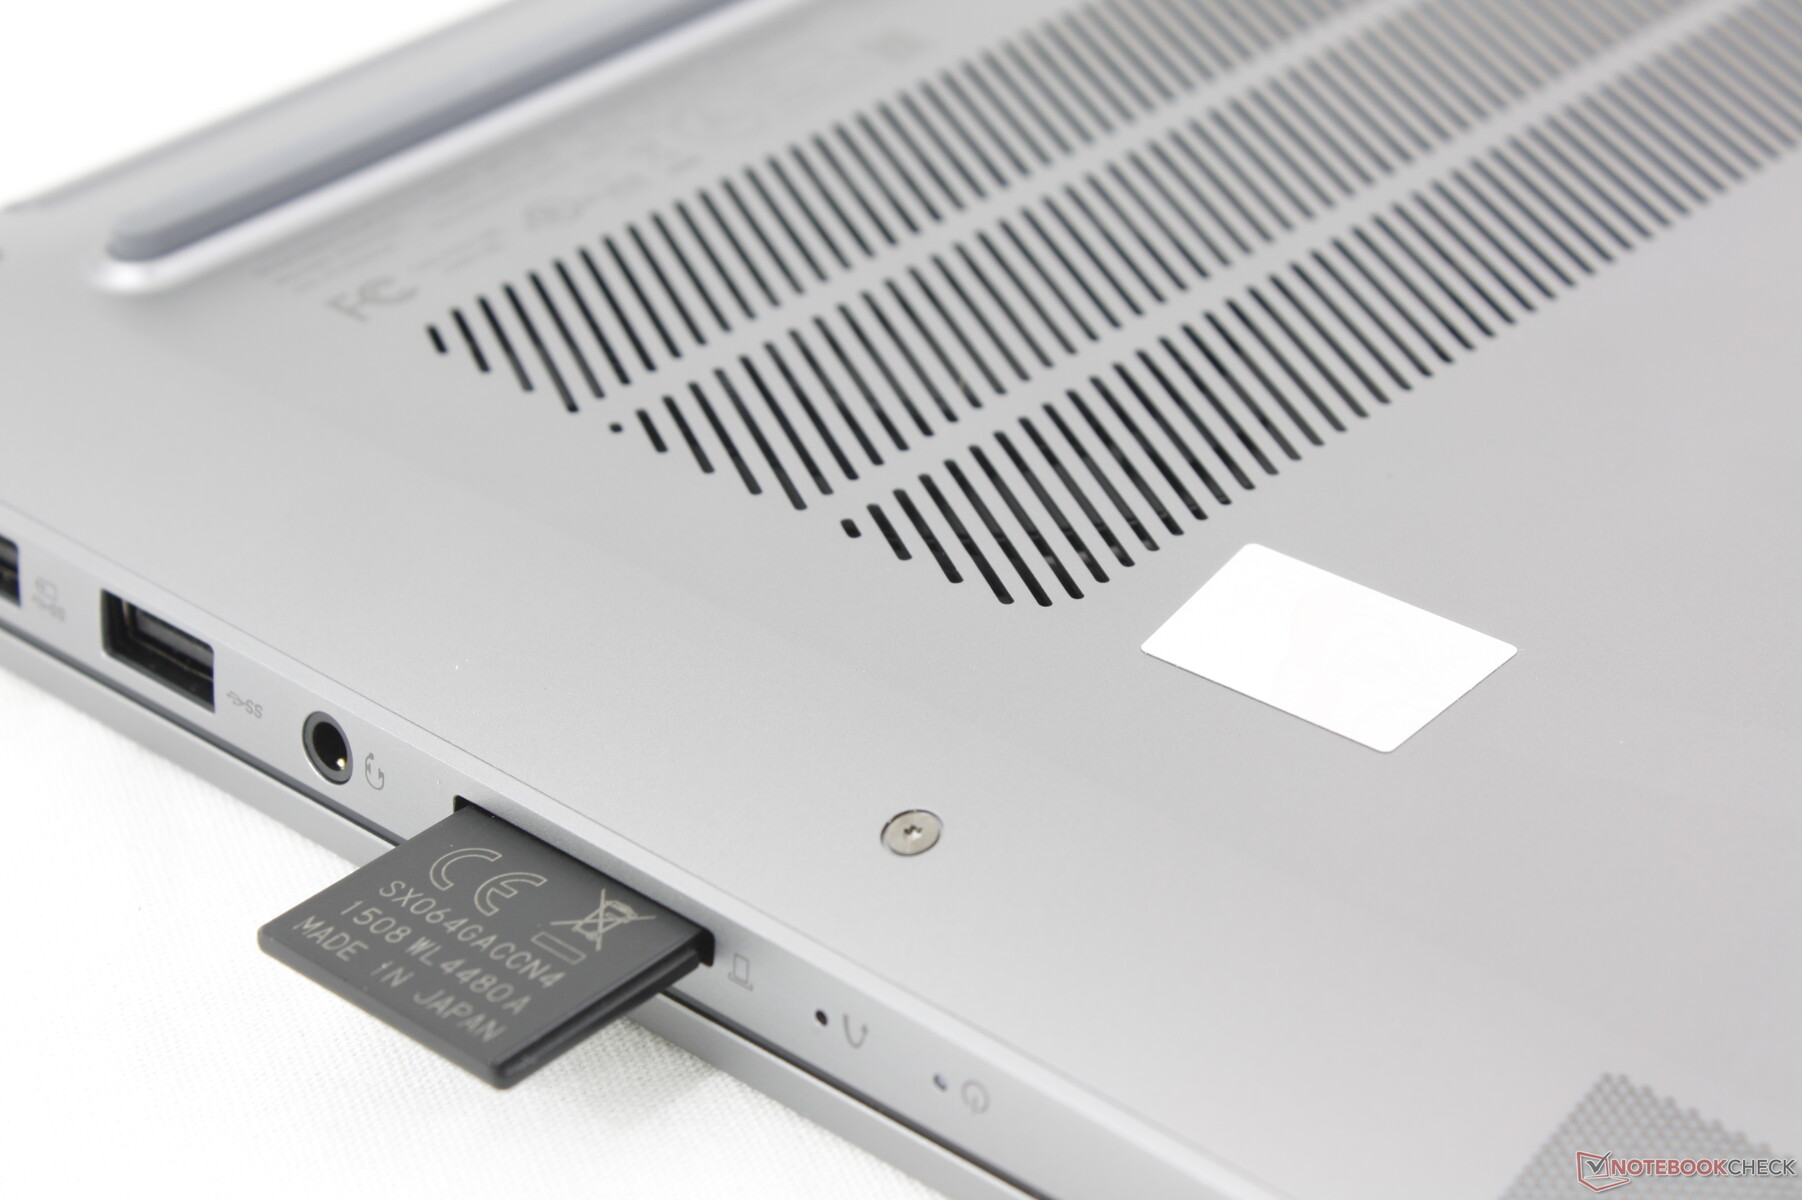
SD Card Reader
| SD Card Reader | |
| average JPG Copy Test (av. of 3 runs) | |
| Asus Zenbook S 16 UM5606-RK333W (Angelbird AV Pro V60) | |
| Samsung Galaxy Book4 Ultra (Angelbird AV Pro V60) | |
| Lenovo IdeaPad Pro 5 16IMH G9 RTX 4050 (Toshiba Exceria Pro SDXC 64 GB UHS-II) | |
| Lenovo IdeaPad Pro 5 16IMH G9 (Angelbird AV Pro V60) | |
| Dell Inspiron 16 7640 2-in-1 (Toshiba Exceria Pro SDXC 64 GB UHS-II) | |
| maximum AS SSD Seq Read Test (1GB) | |
| Asus Zenbook S 16 UM5606-RK333W (Angelbird AV Pro V60) | |
| Lenovo IdeaPad Pro 5 16IMH G9 (Angelbird AV Pro V60) | |
| Samsung Galaxy Book4 Ultra (Angelbird AV Pro V60) | |
| Lenovo IdeaPad Pro 5 16IMH G9 RTX 4050 (Toshiba Exceria Pro SDXC 64 GB UHS-II) | |
| Dell Inspiron 16 7640 2-in-1 (Toshiba Exceria Pro SDXC 64 GB UHS-II) | |
Kommunikation
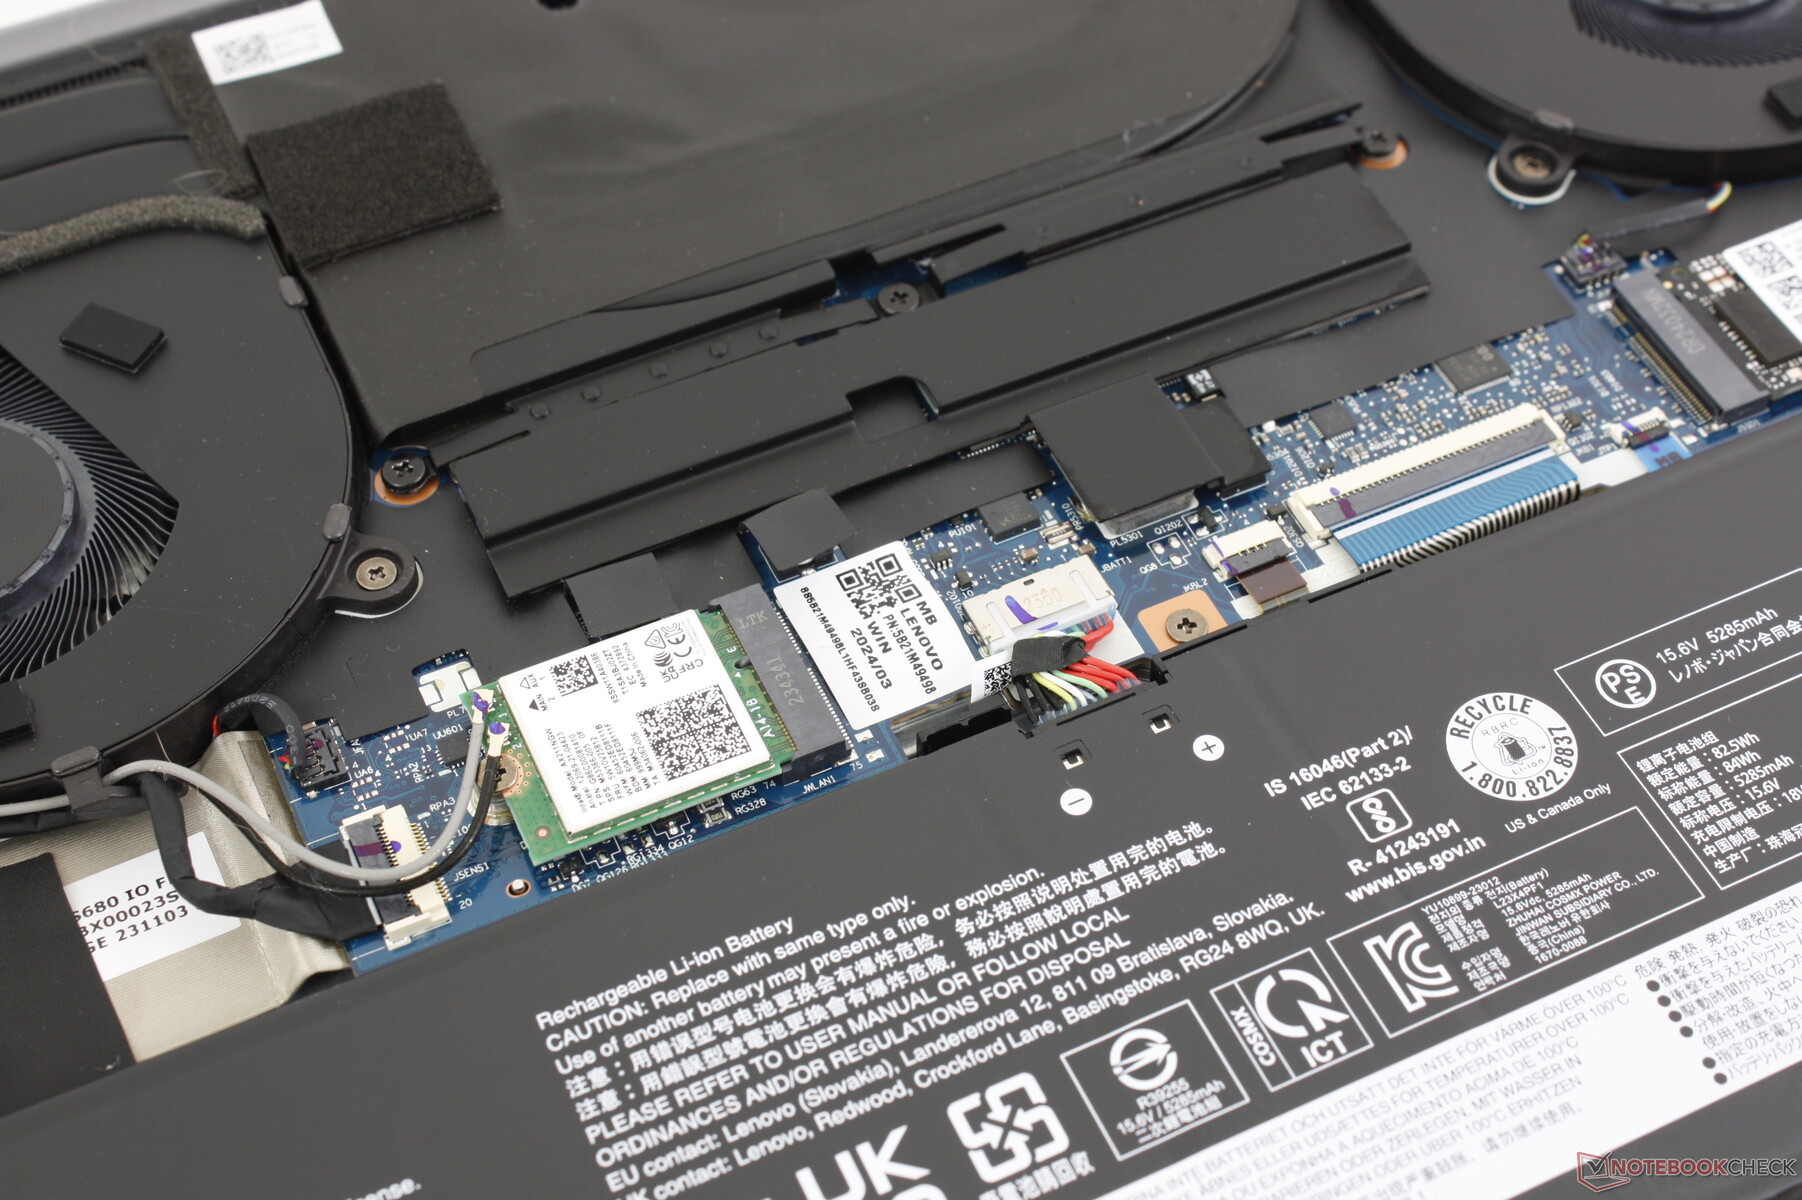
Der Intel AX211 unterstützt standardmäßig Wi-Fi 6E und Bluetooth 5.3. In Verbindung mit unserem Testrouter AXE11000 erreichen die Übertragungsraten konstant über 1 Gbit/s.
Webcam
Die 2-MP-Webcam verfügt standardmäßig über eine IR-Funktion für Gesichtserkennung sowie einen integrierten Schieberegler zum Schutz der Privatsphäre.


Wartung
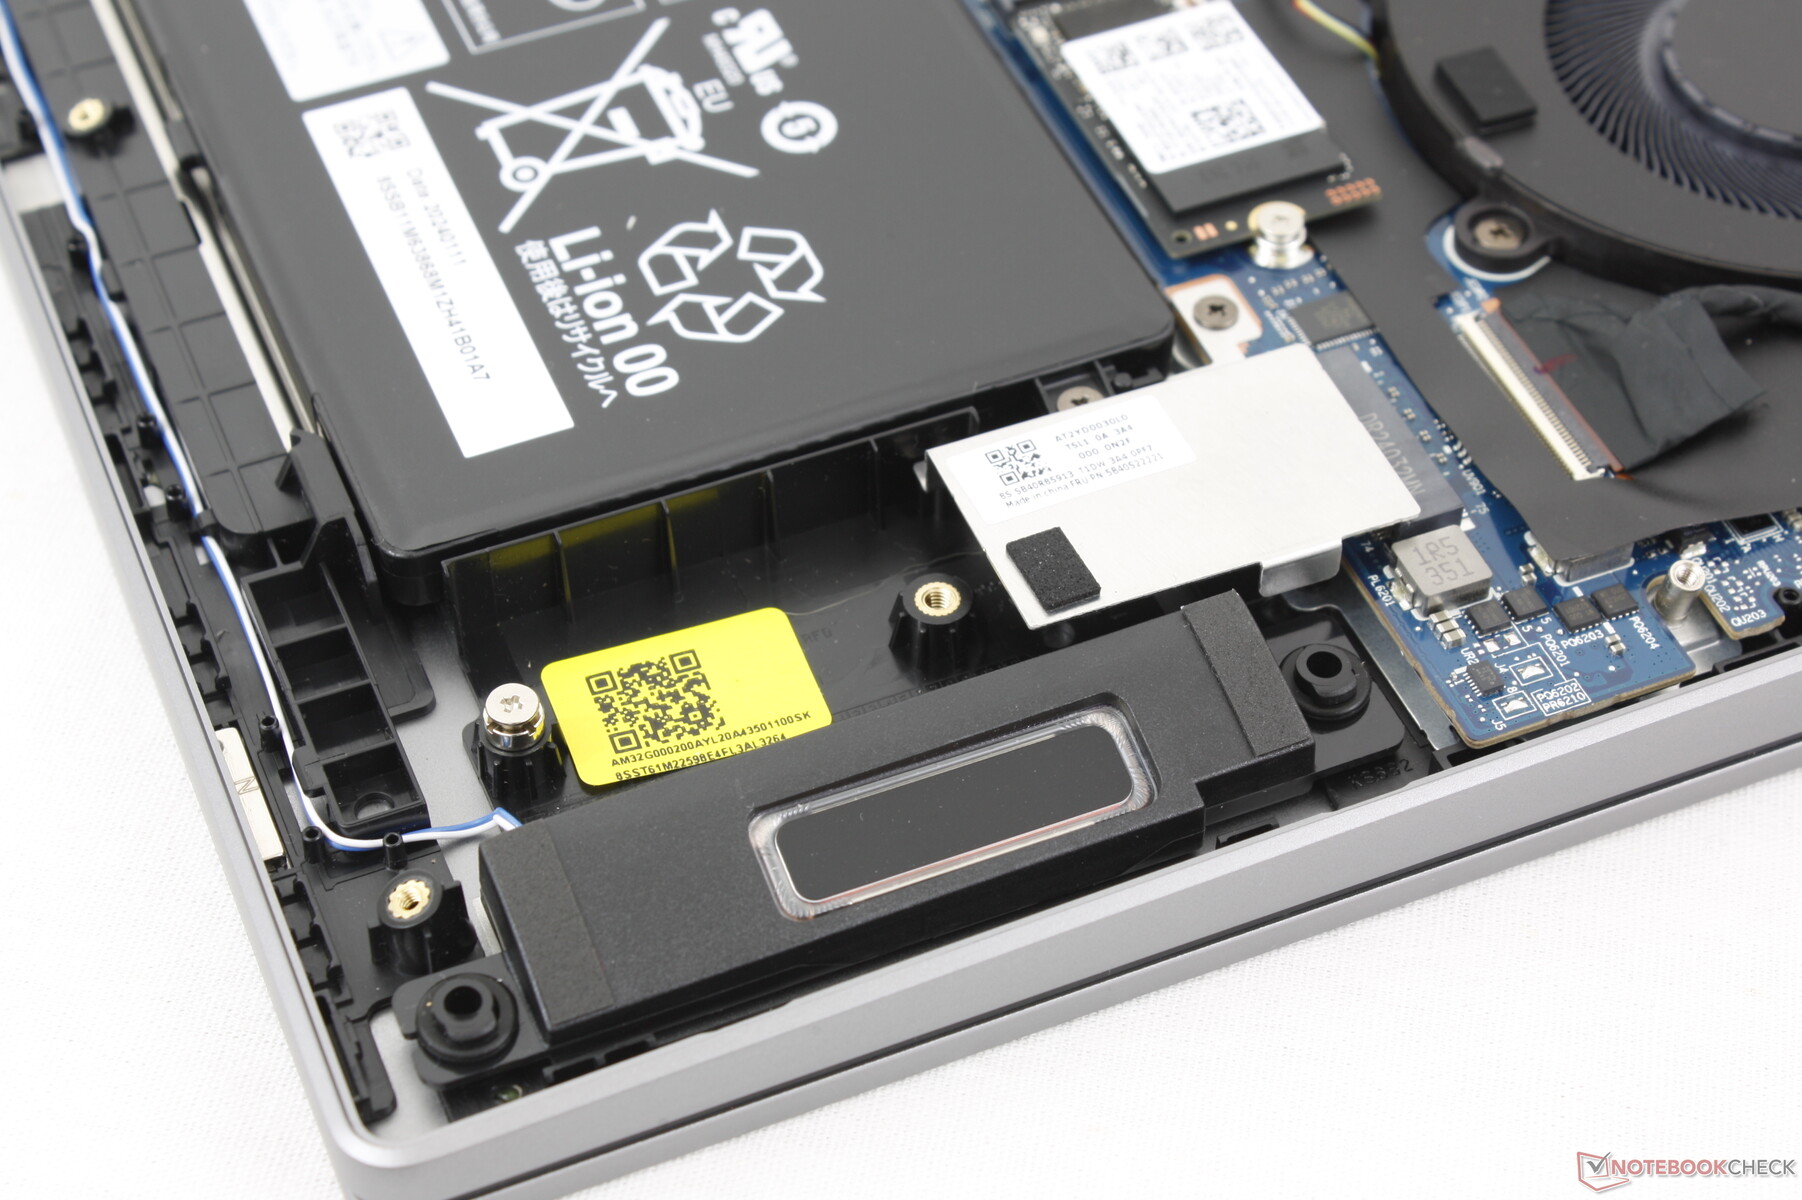
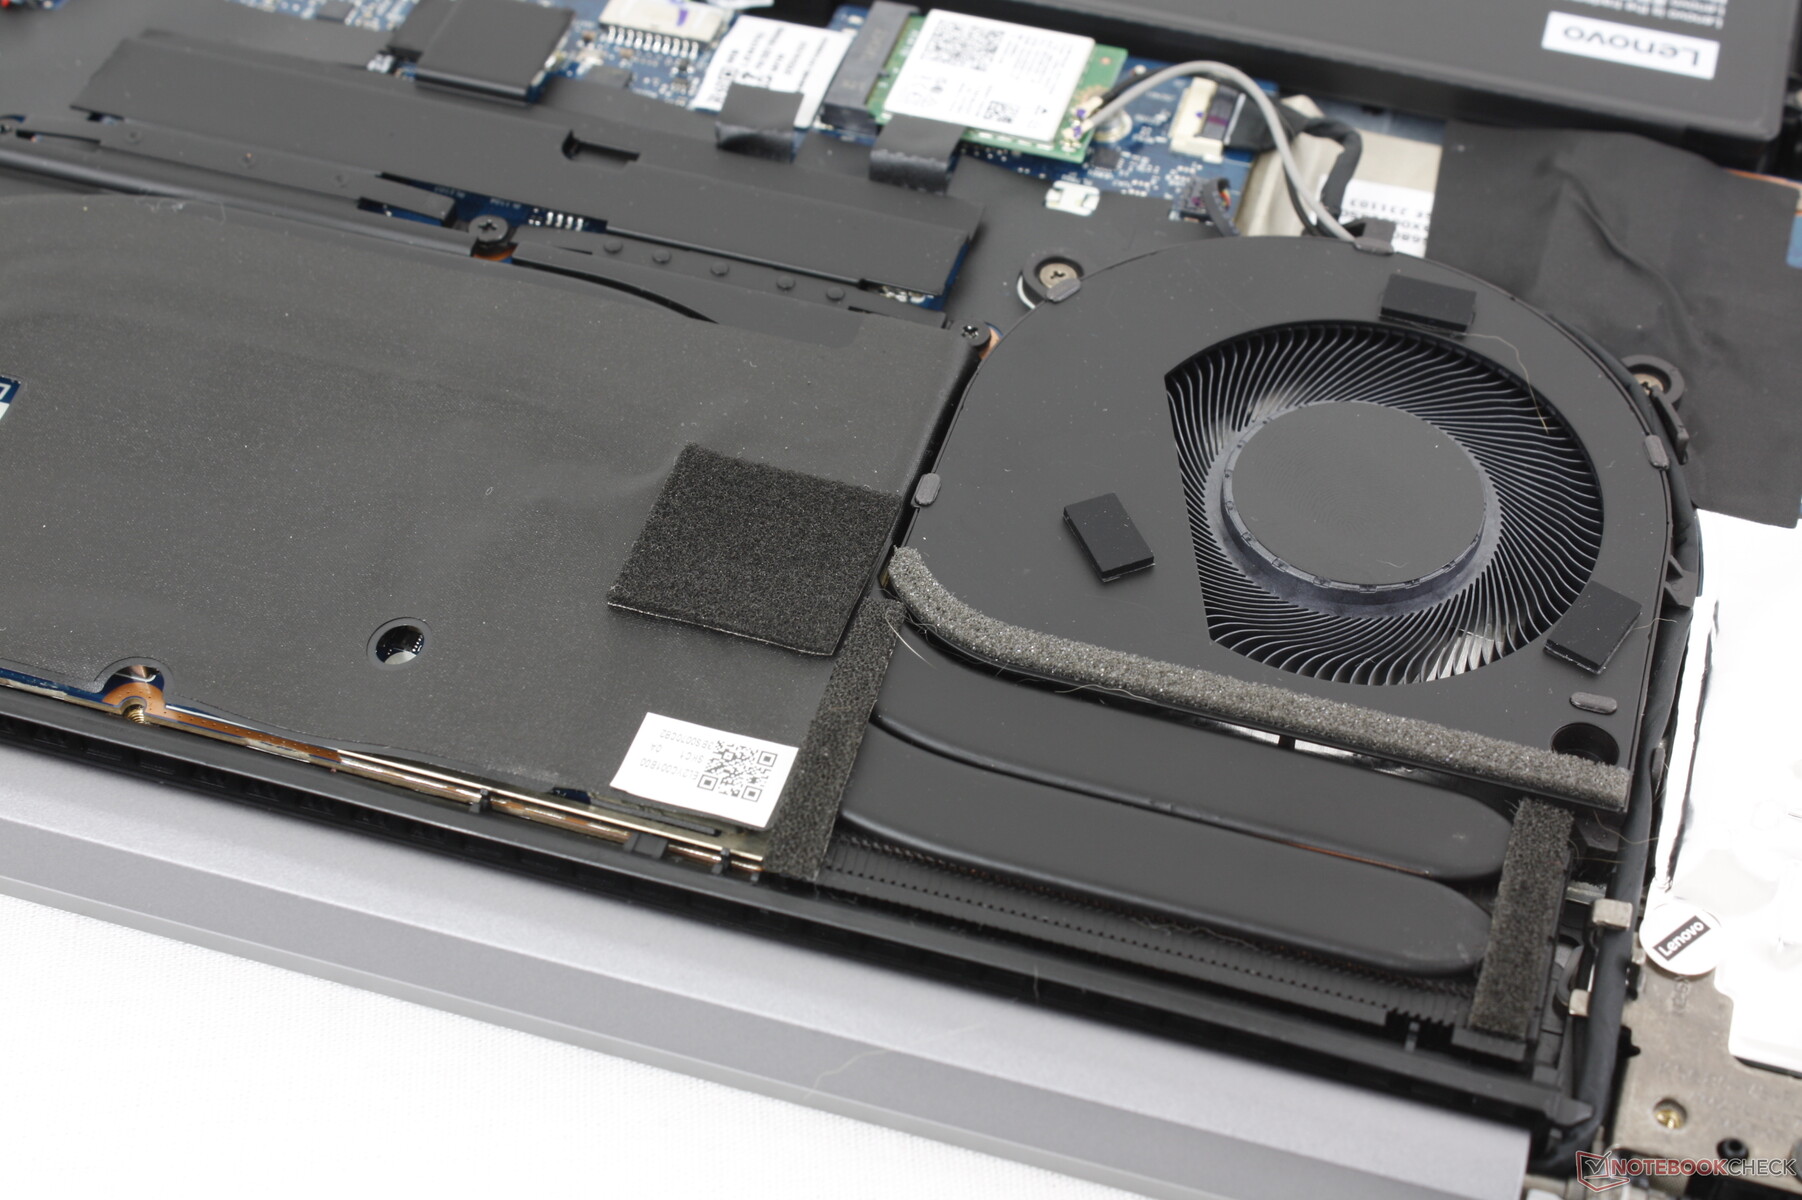
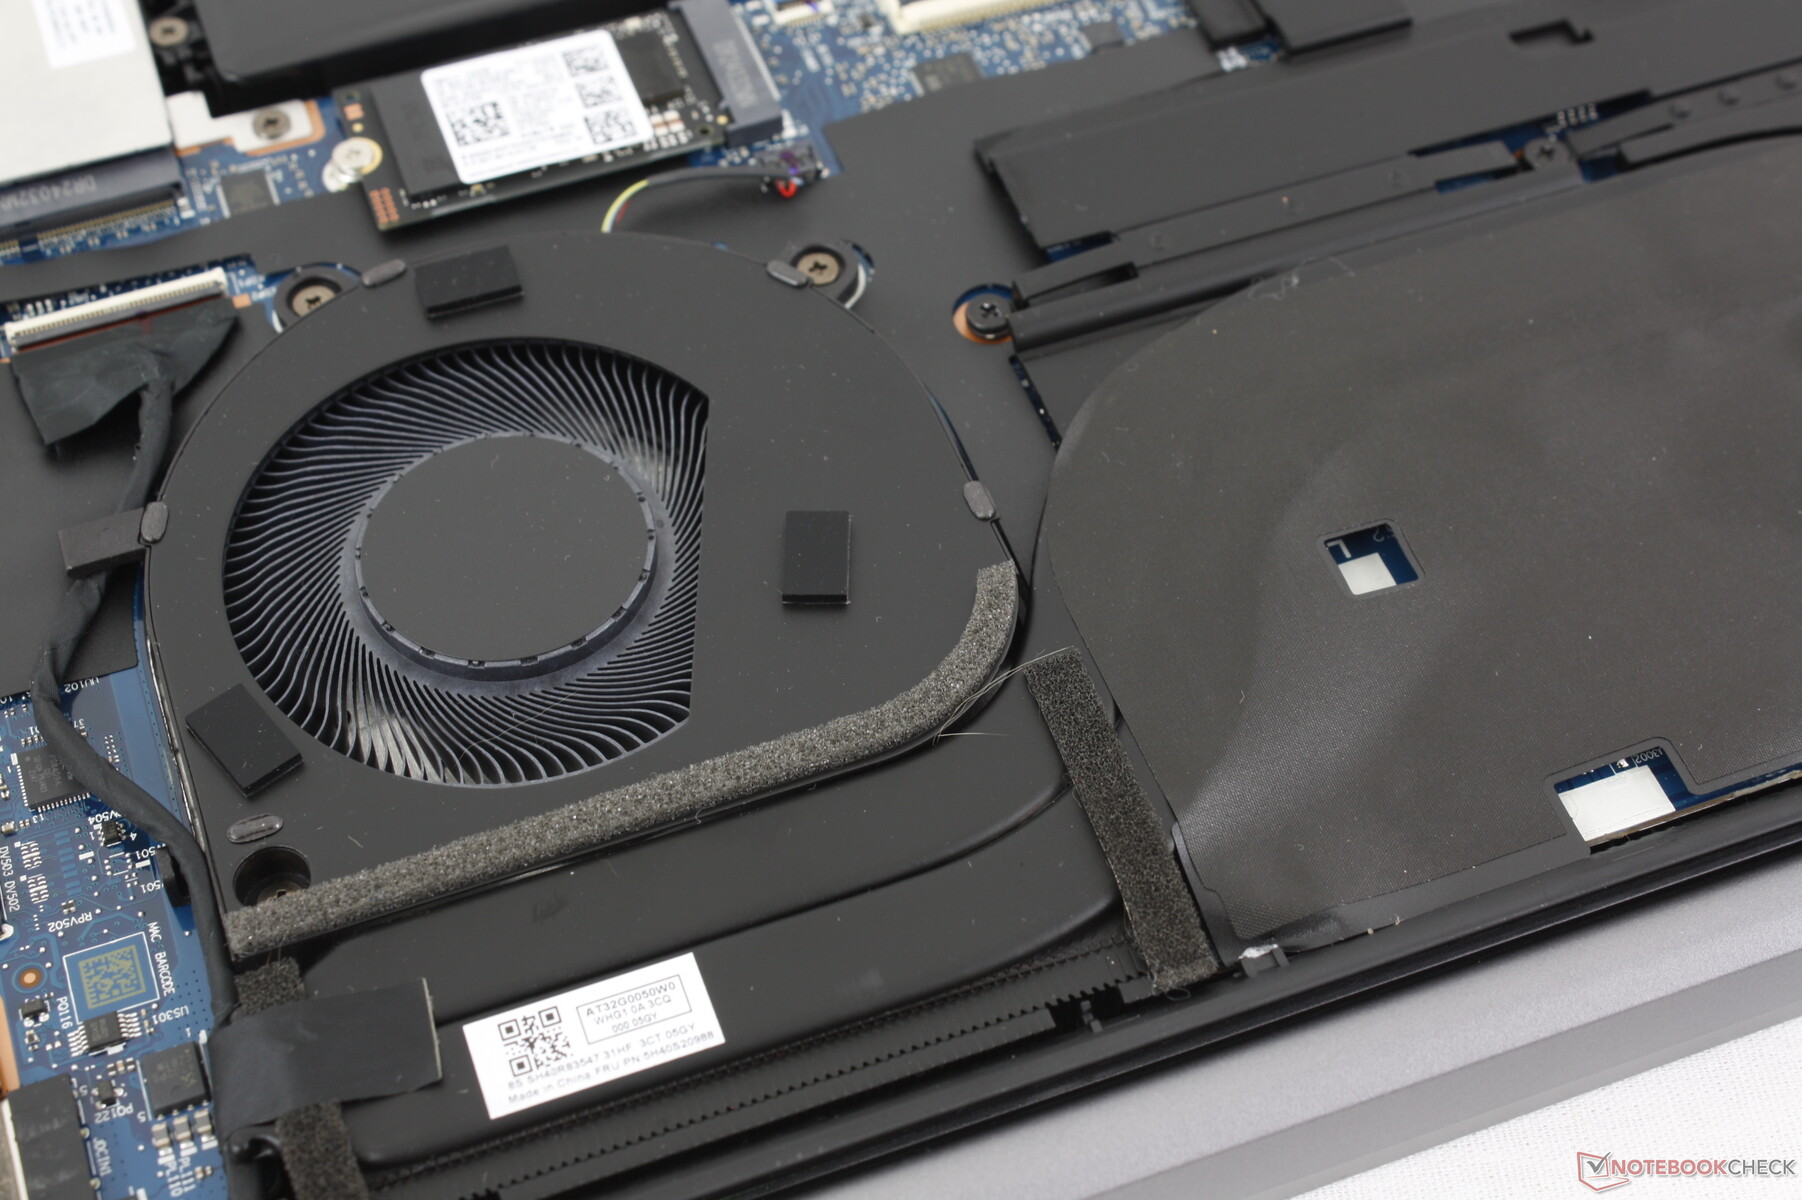
Die Unterseite ist mit neun Torx-Schrauben befestigt, was eine relativ einfache Wartung ermöglicht. Trotz der leistungsstärkeren Hardware bleibt die Kühllösung im Vergleich zur iGPU-Version unverändert, weshalb mit insgesamt lauteren Betriebsgeräuschen und höheren Temperaturen zu rechnen ist.
Nachhaltigkeit
Die untere Abdeckung besteht zu 50 Prozent aus recyceltem Aluminium, während 90 Prozent der Kunststoffe in der Verpackung aus meeresgebundenen Quellen stammen. Besonders positiv hervorzuheben ist, dass Lenovo offizielle Reparaturanleitungen für dieses Modell als kostenlose Downloads zur Verfügung stellt, was die Wartungsfreundlichkeit weiter erhöht.
Zubehör und Garantie
In der Verpackung befinden sich neben dem Netzteil und den Unterlagen keine weiteren Extras. Lenovo bietet eine Standardgarantie von 24 Monaten.
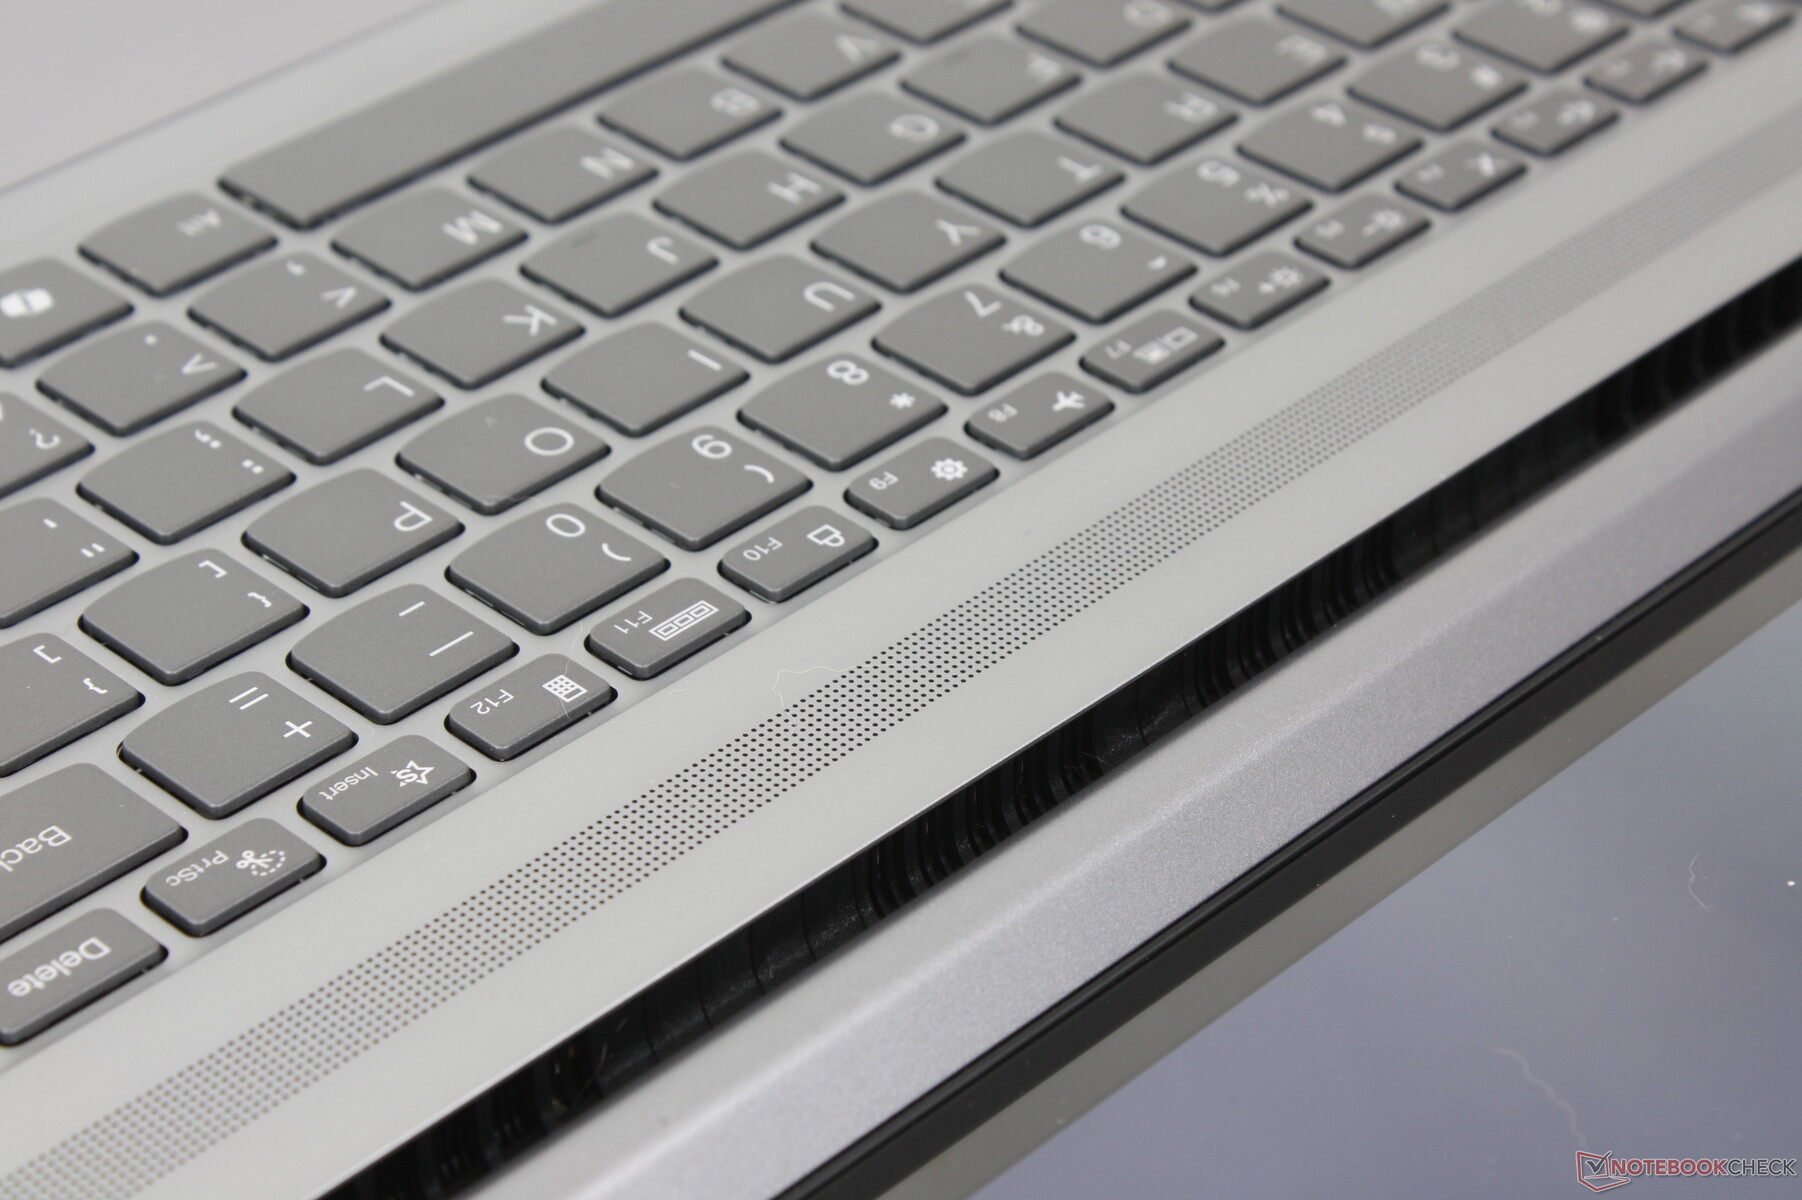
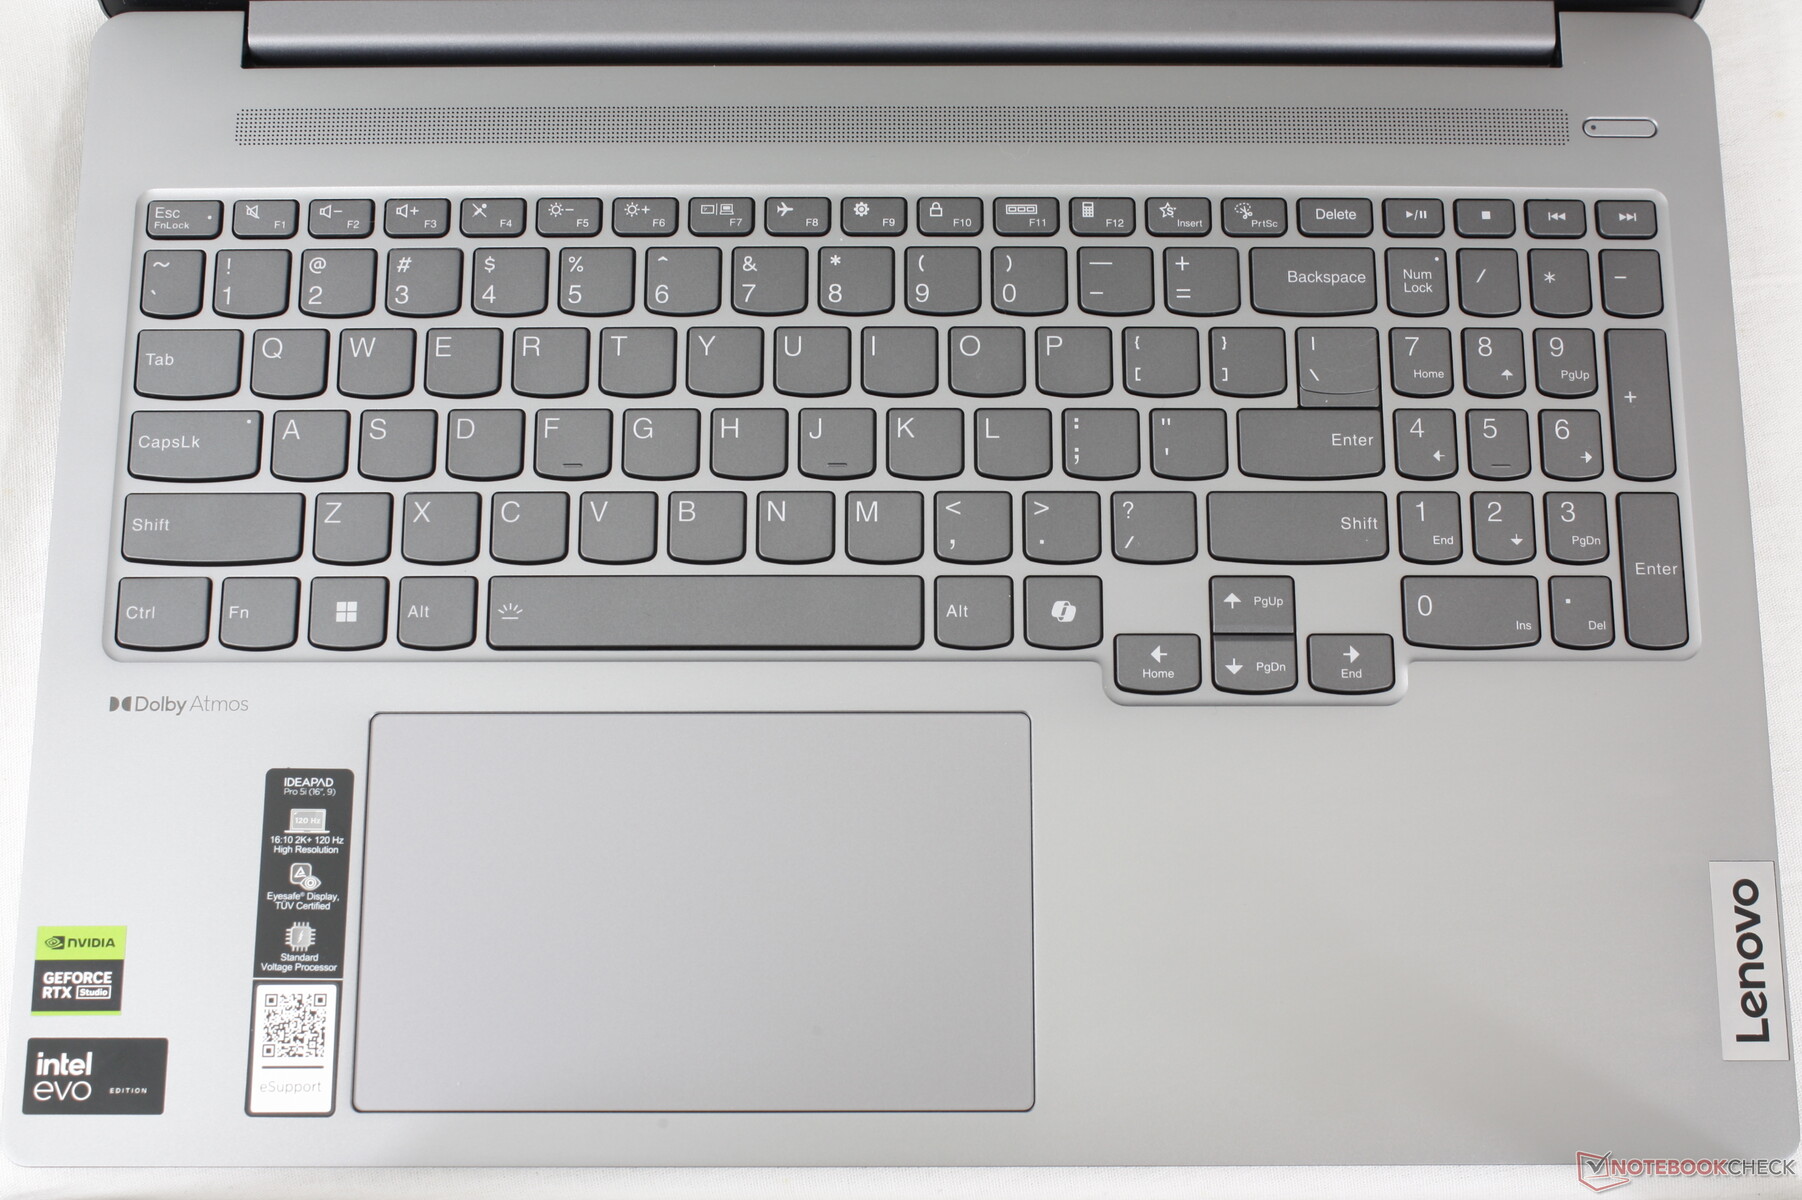
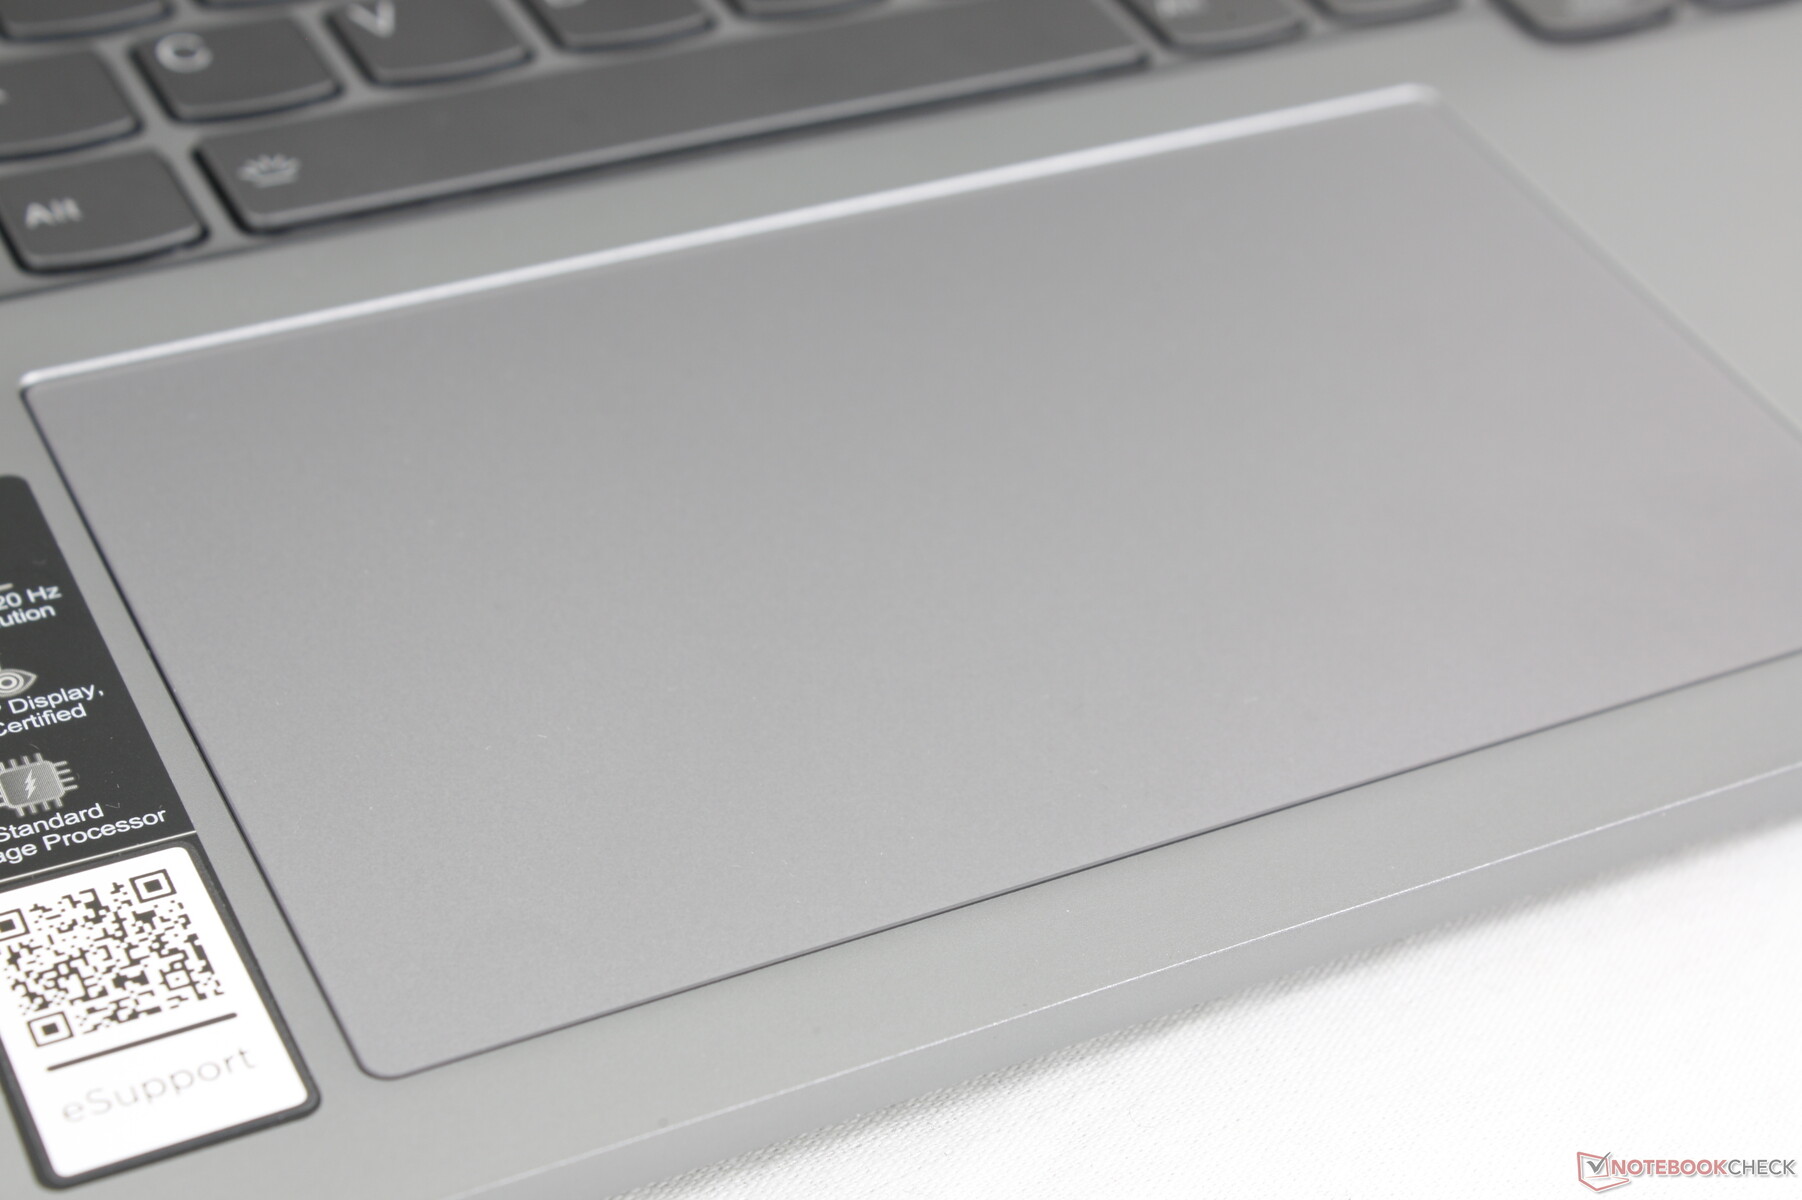
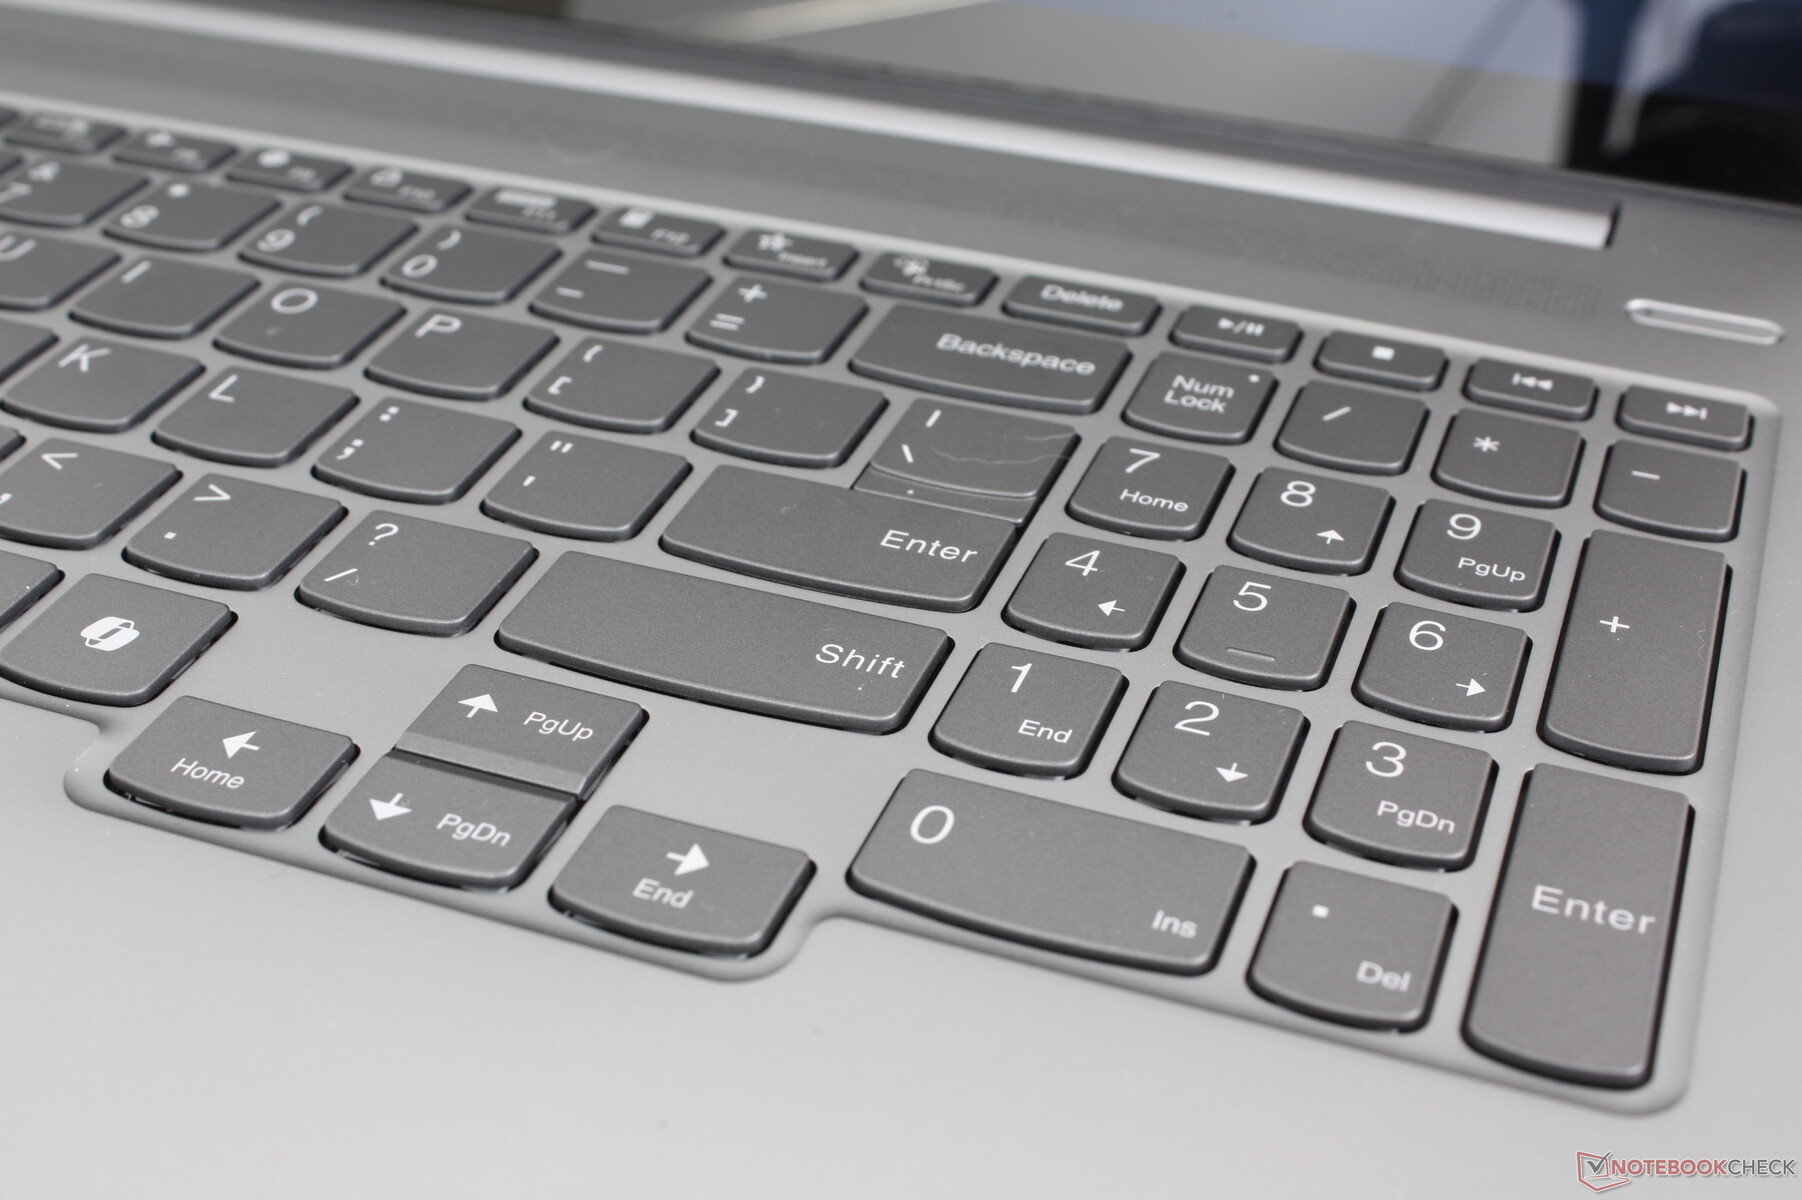
Eingabegeräten
Tastatur und Touchpad
Die Tastaturen der IdeaPad-Modelle sind flacher und bieten ein weniger ausgeprägtes Feedback im Vergleich zu den Tastaturen der ThinkPad-Modelle. Obwohl sie funktional sind, ist das Tipperlebnis bei den IdeaPads definitiv eine Stufe unter dem der besten Lenovo-Systeme, selbst bei der Top-End-Konfiguration für etwa 1.400 Euro.

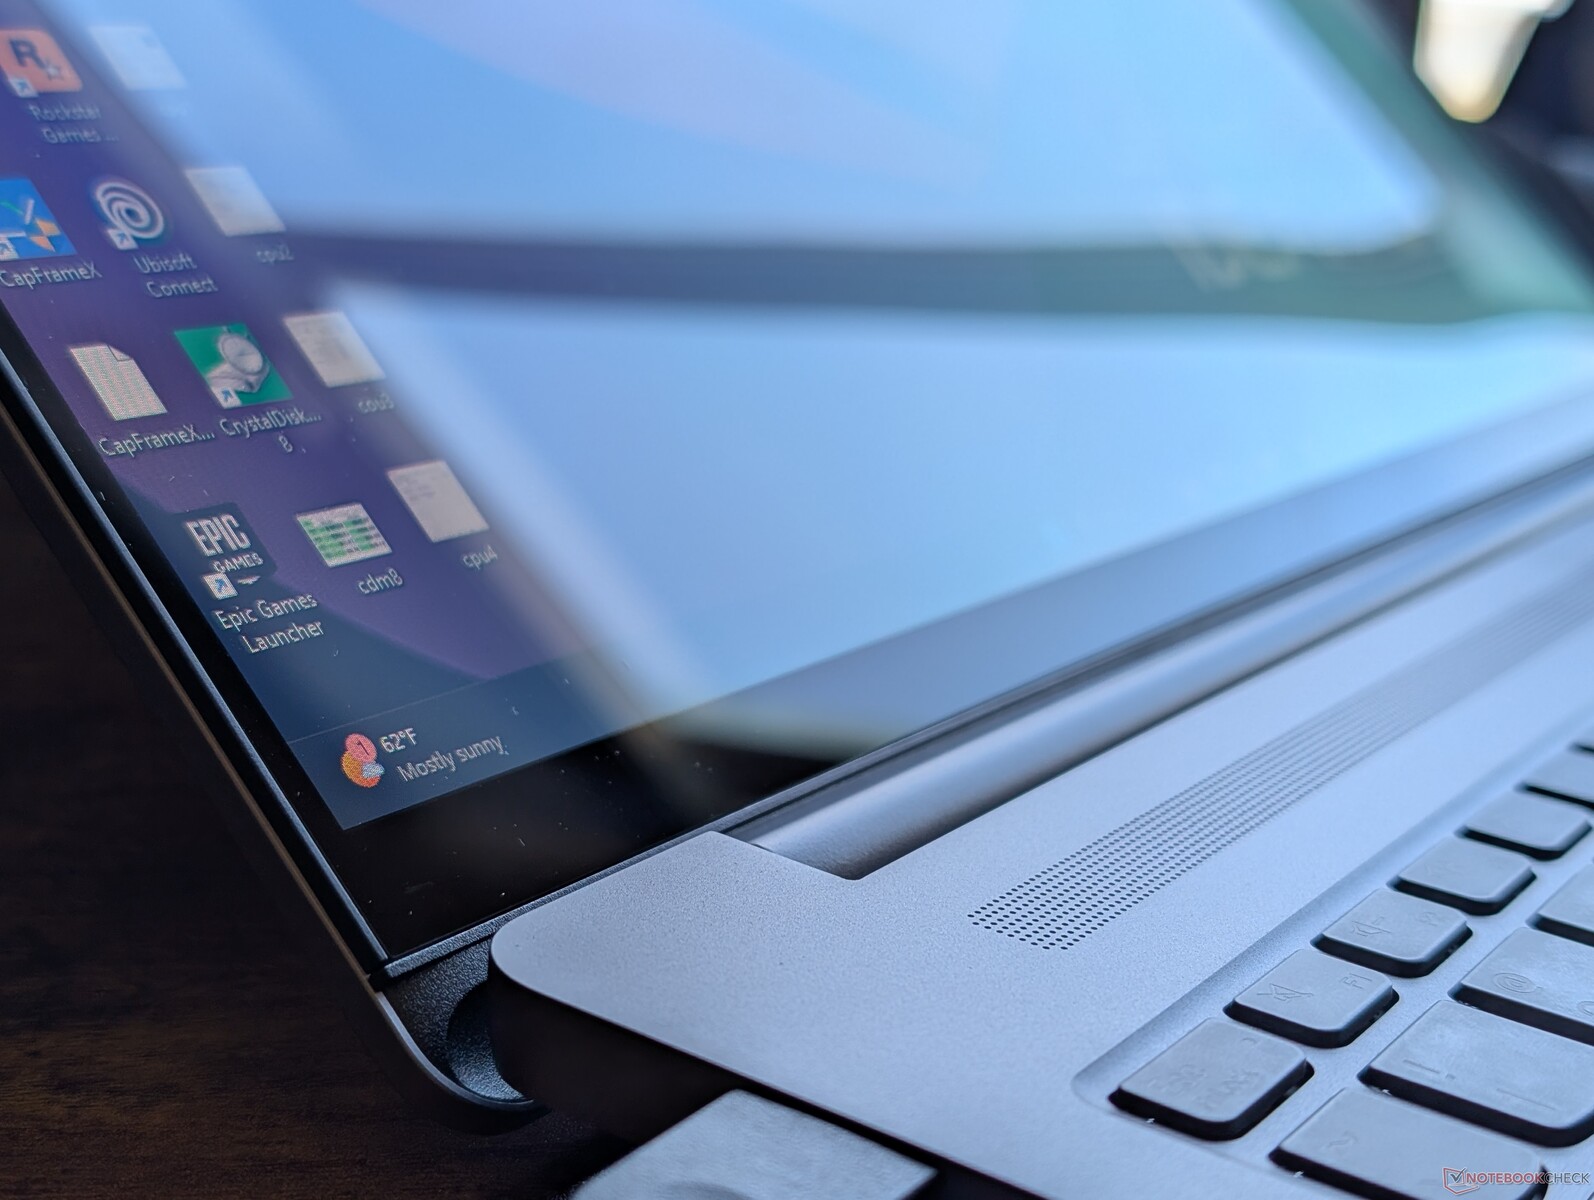
Display — Von IPS zu OLED

Hier sind die beiden Display-Optionen:
- 2560 x 1600, IPS, 120 Hz, nicht touch-fähig
- 2048 x 1280, OLED, 120 Hz, mit Touch
Im Gegensatz zu den meisten Laptops ist die OLED-Option hier nicht zwangsläufig überlegen. Während das OLED-Panel tiefere Farben und eine bessere HDR-Unterstützung bietet, hat es eine niedrigere native Auflösung als das IPS-Panel, das bei Aufgaben wie Tabellenkalkulationen oder Fenster-Multitasking produktiver sein kann. Für Anwendungen wie Videowiedergabe oder -bearbeitung kann das OLED-Panel jedoch ein verbessertes visuelles Erlebnis bieten.
Mit einer Auflösung von 1280p liegt das OLED-Panel hinter anderen 16-Zoll-Notebooks wie dem Asus Zenbook S 16, dem Envy x360 2-in-1 16 oder dem Galaxy Book4 Ultra, die alle 1800p OLED-Panels bieten. Diese niedrigere Auflösung könnte absichtlich gewählt sein, um Kunden zur höherwertigen Yoga Pro 9 16 G9-Serie zu bewegen. Trotzdem macht dies das IdeaPad Pro 5 16 G9 im Vergleich zu seinen direkten Konkurrenten etwas weniger attraktiv.

| |||||||||||||||||||||||||
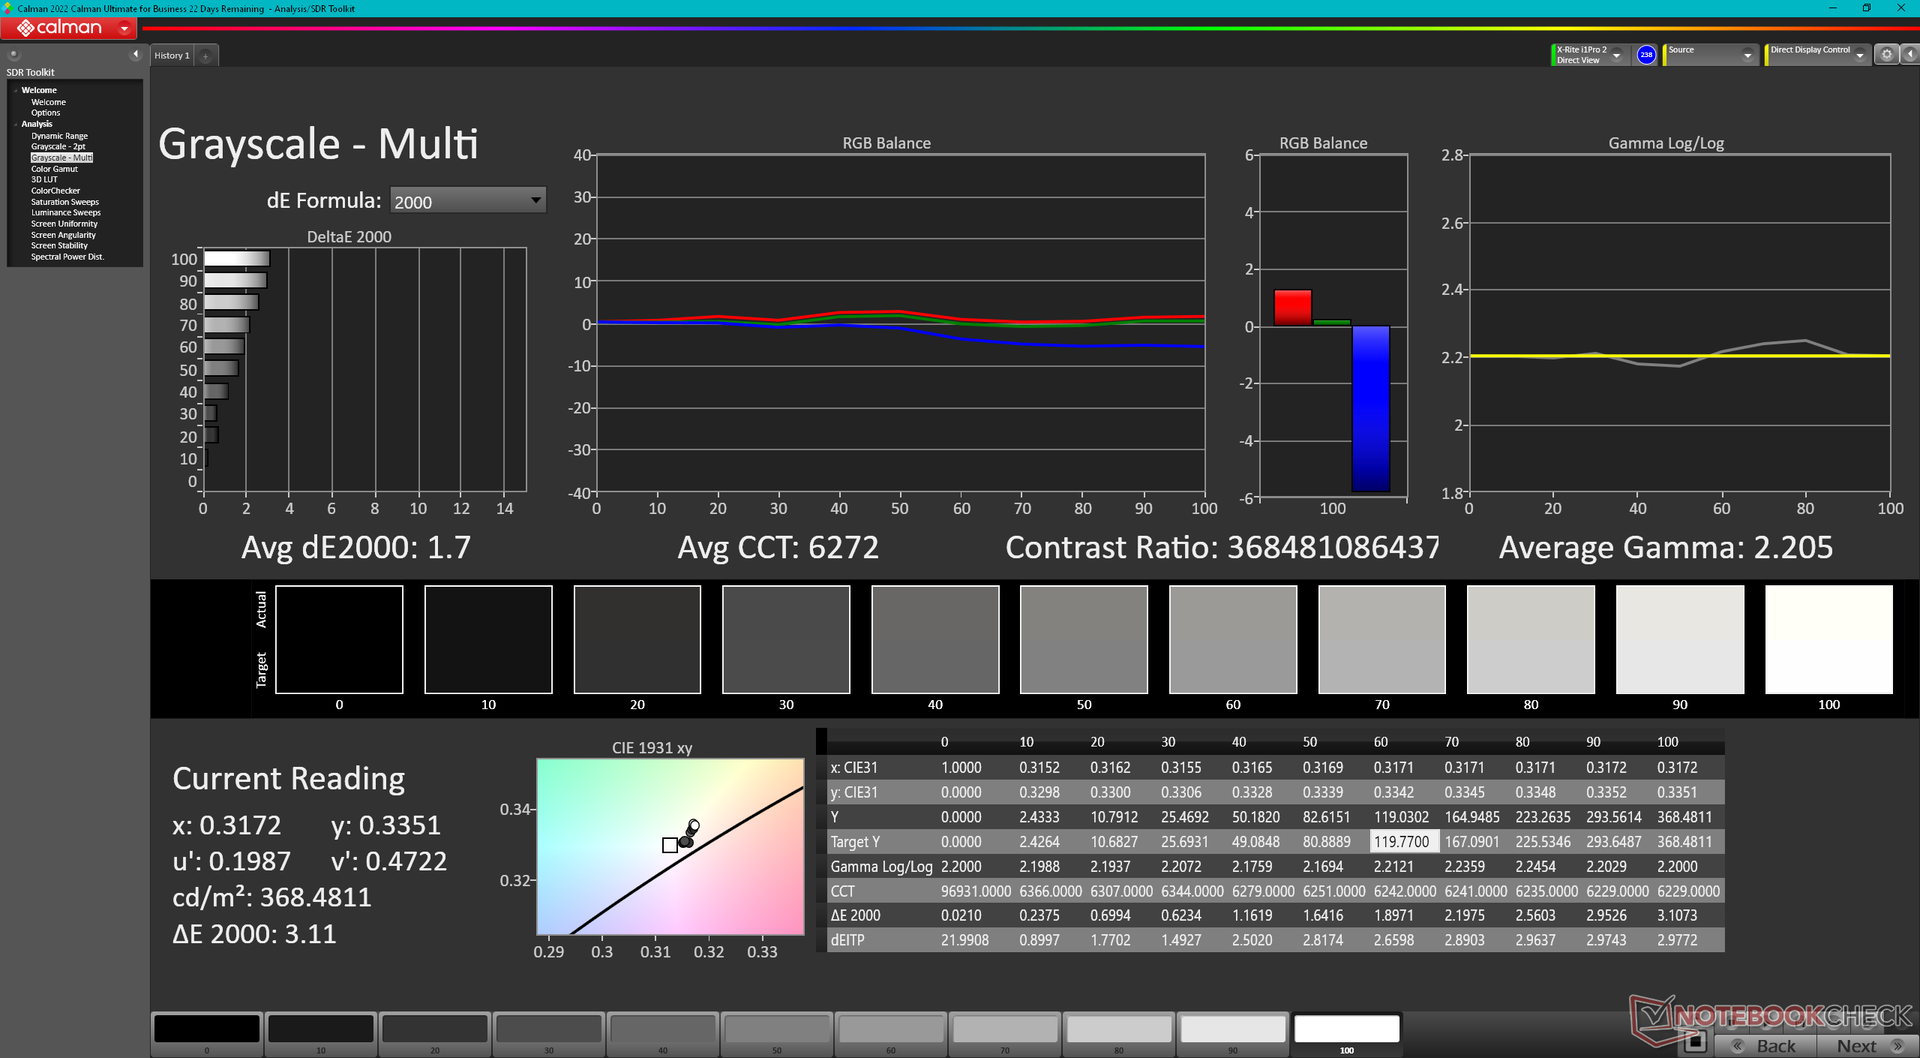
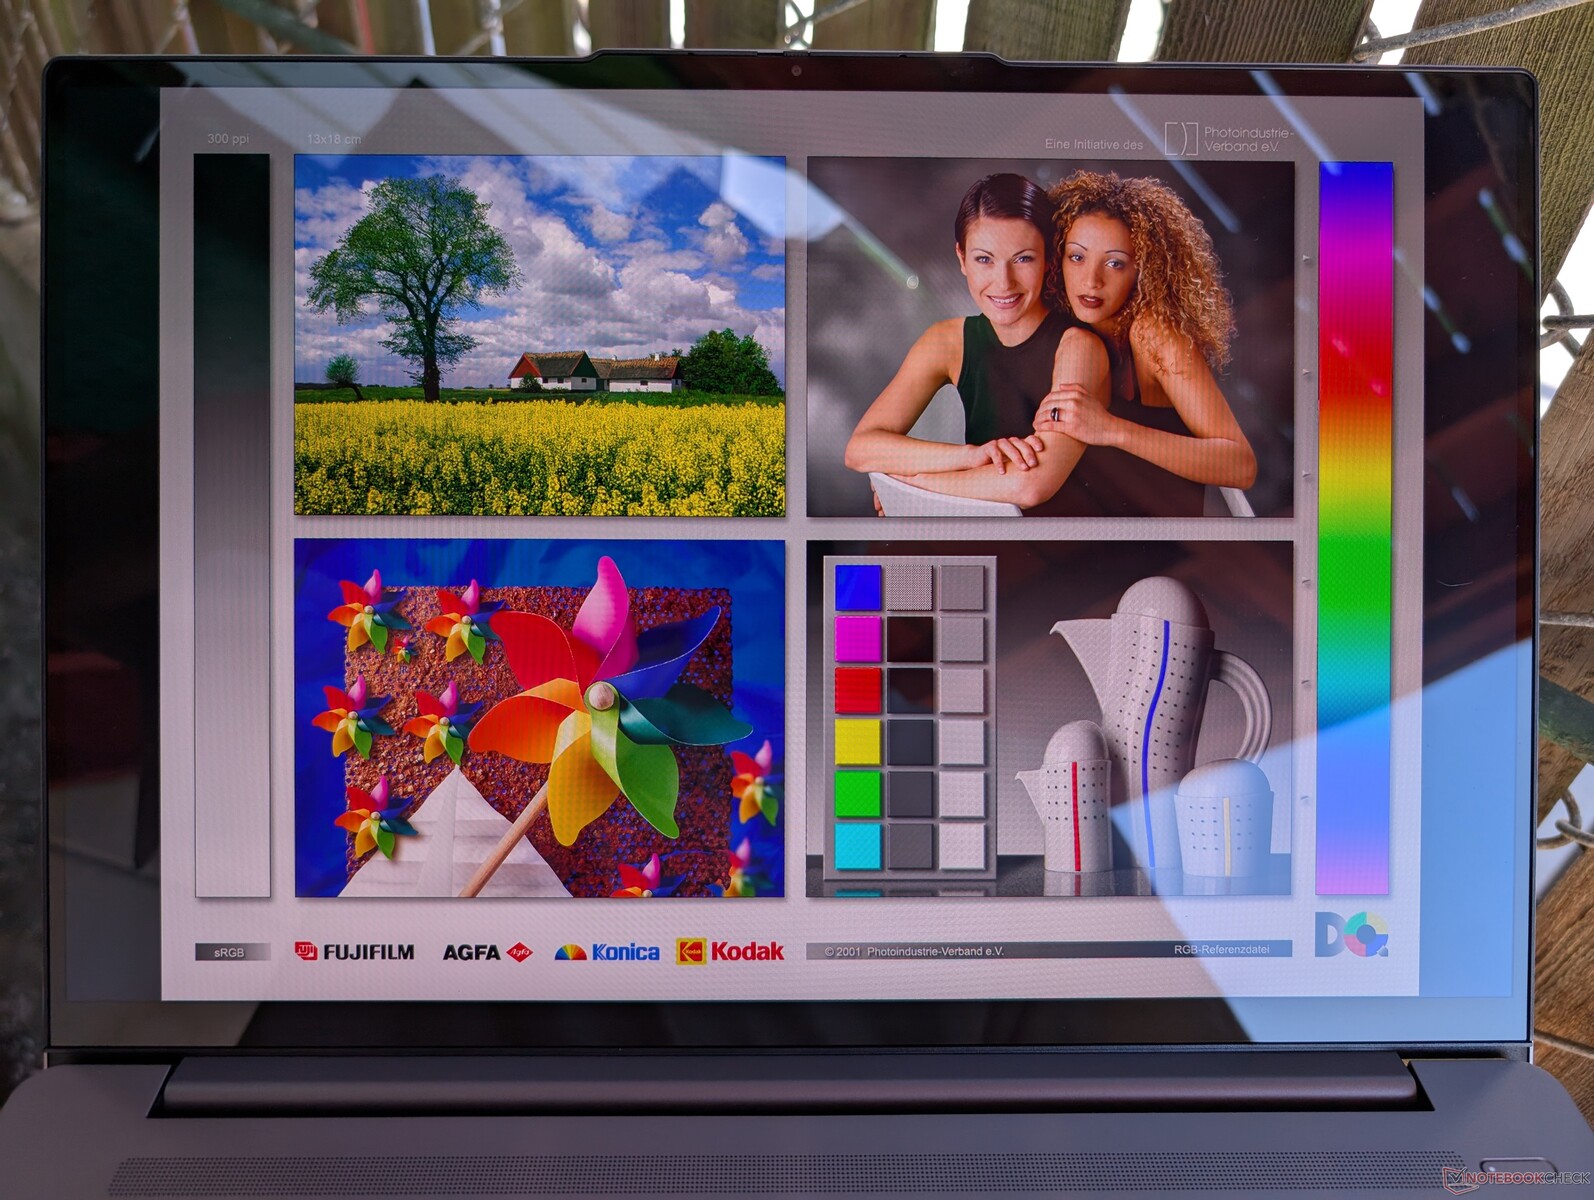
Ausleuchtung: 98 %
Helligkeit Akku: 367.6 cd/m²
Kontrast: ∞:1 (Schwarzwert: 0 cd/m²)
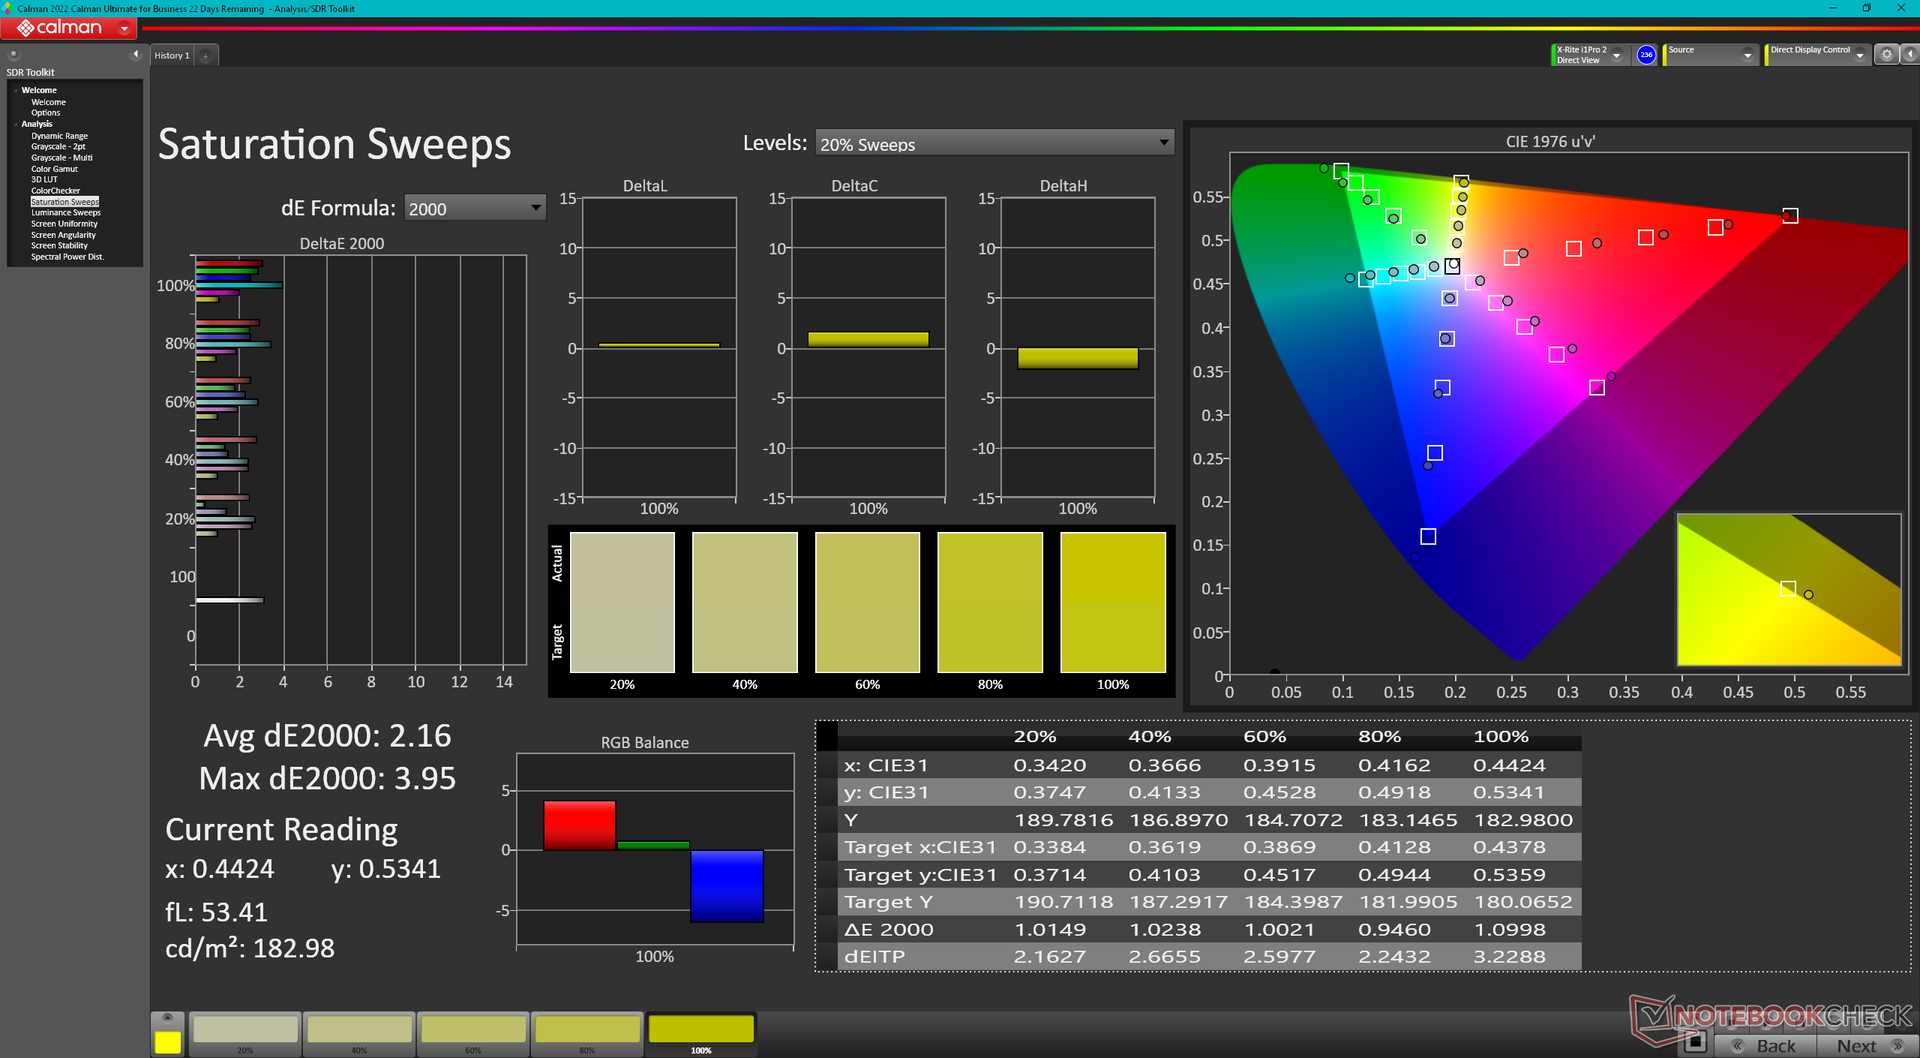
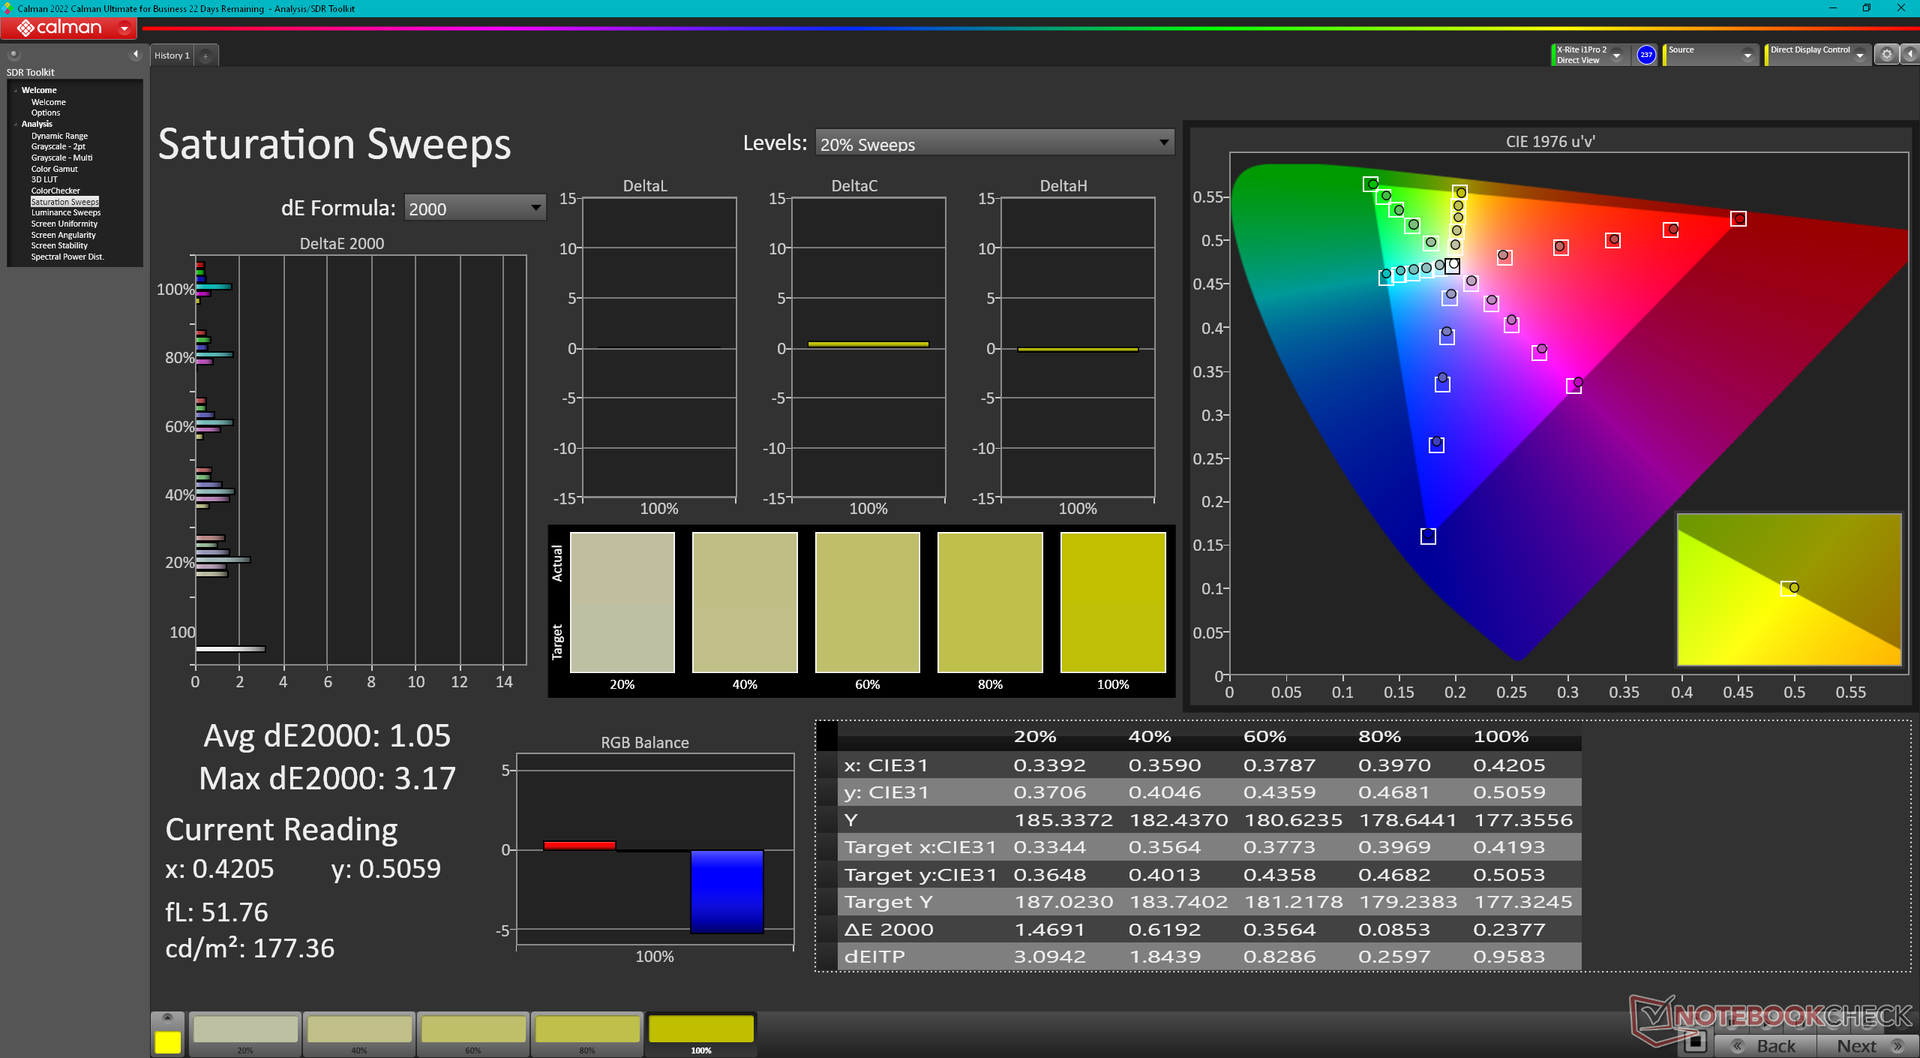
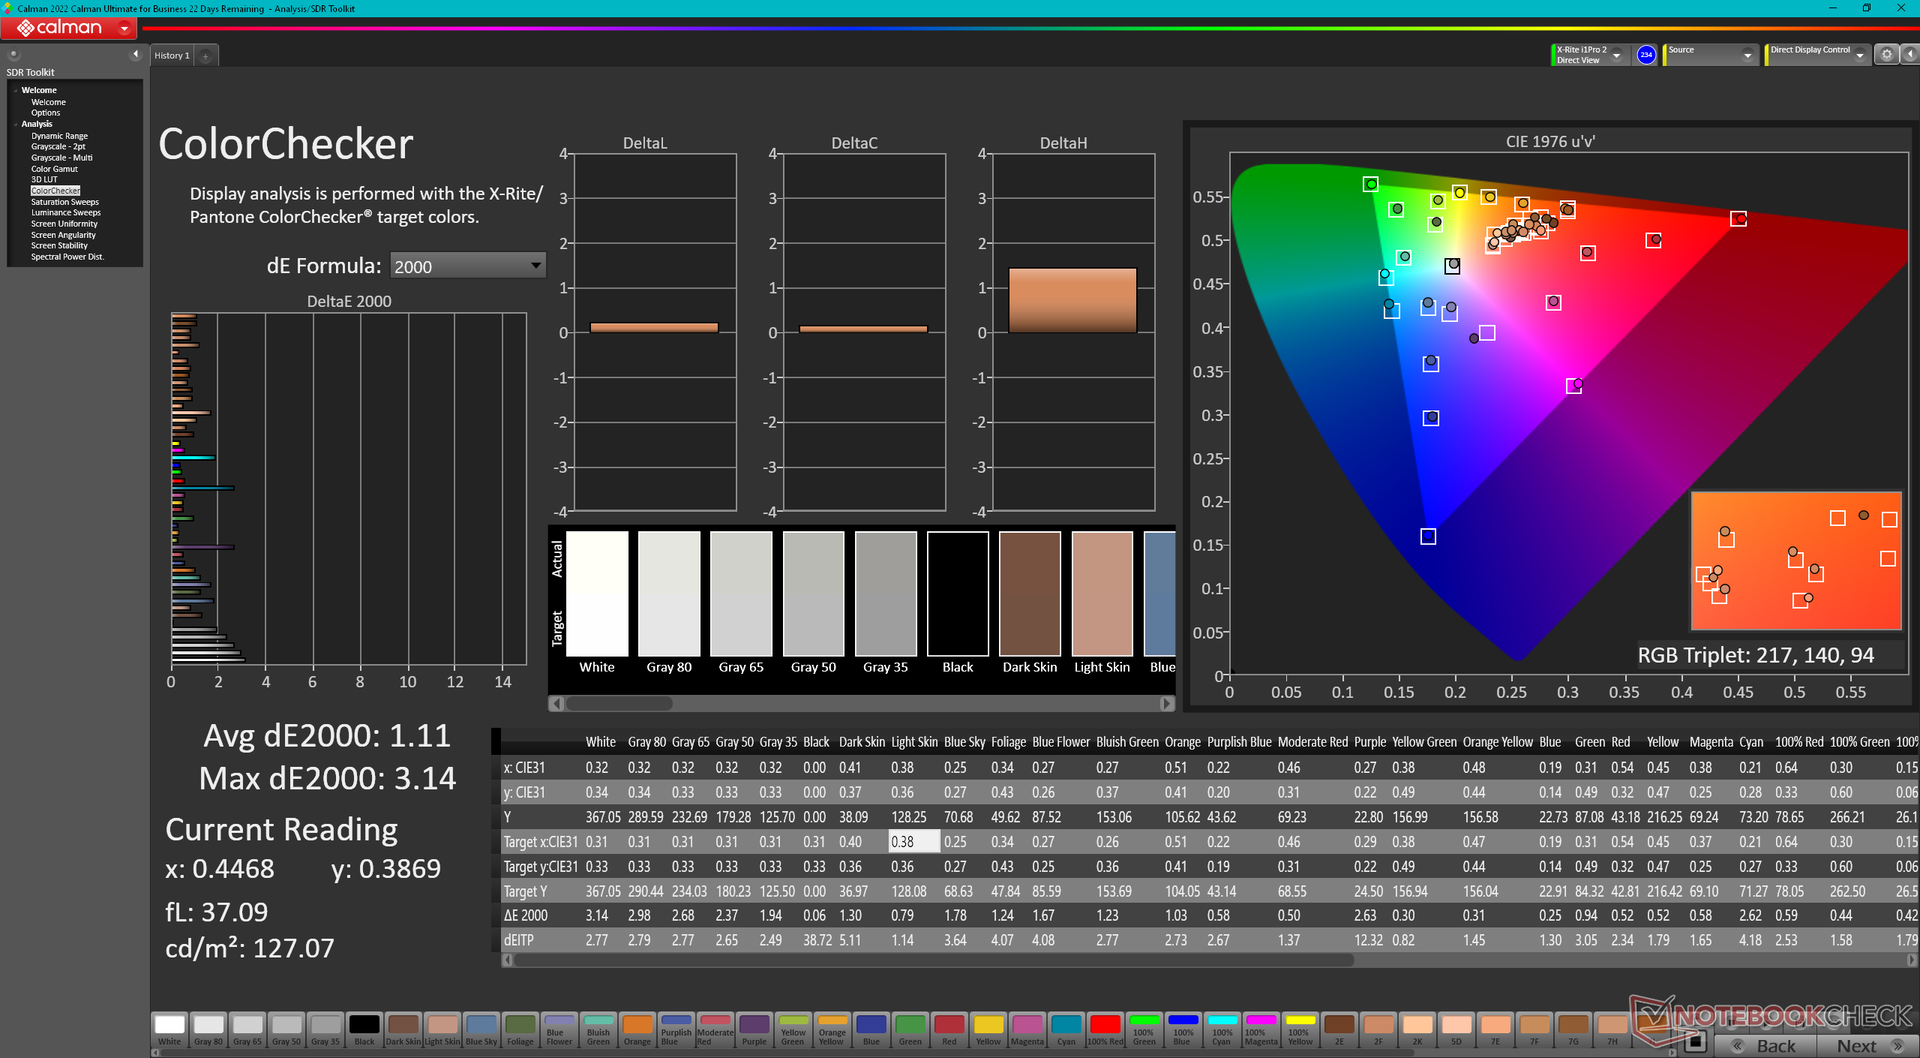
ΔE ColorChecker Calman: 4.31 | ∀{0.5-29.43 Ø4.78}
calibrated: 1.11
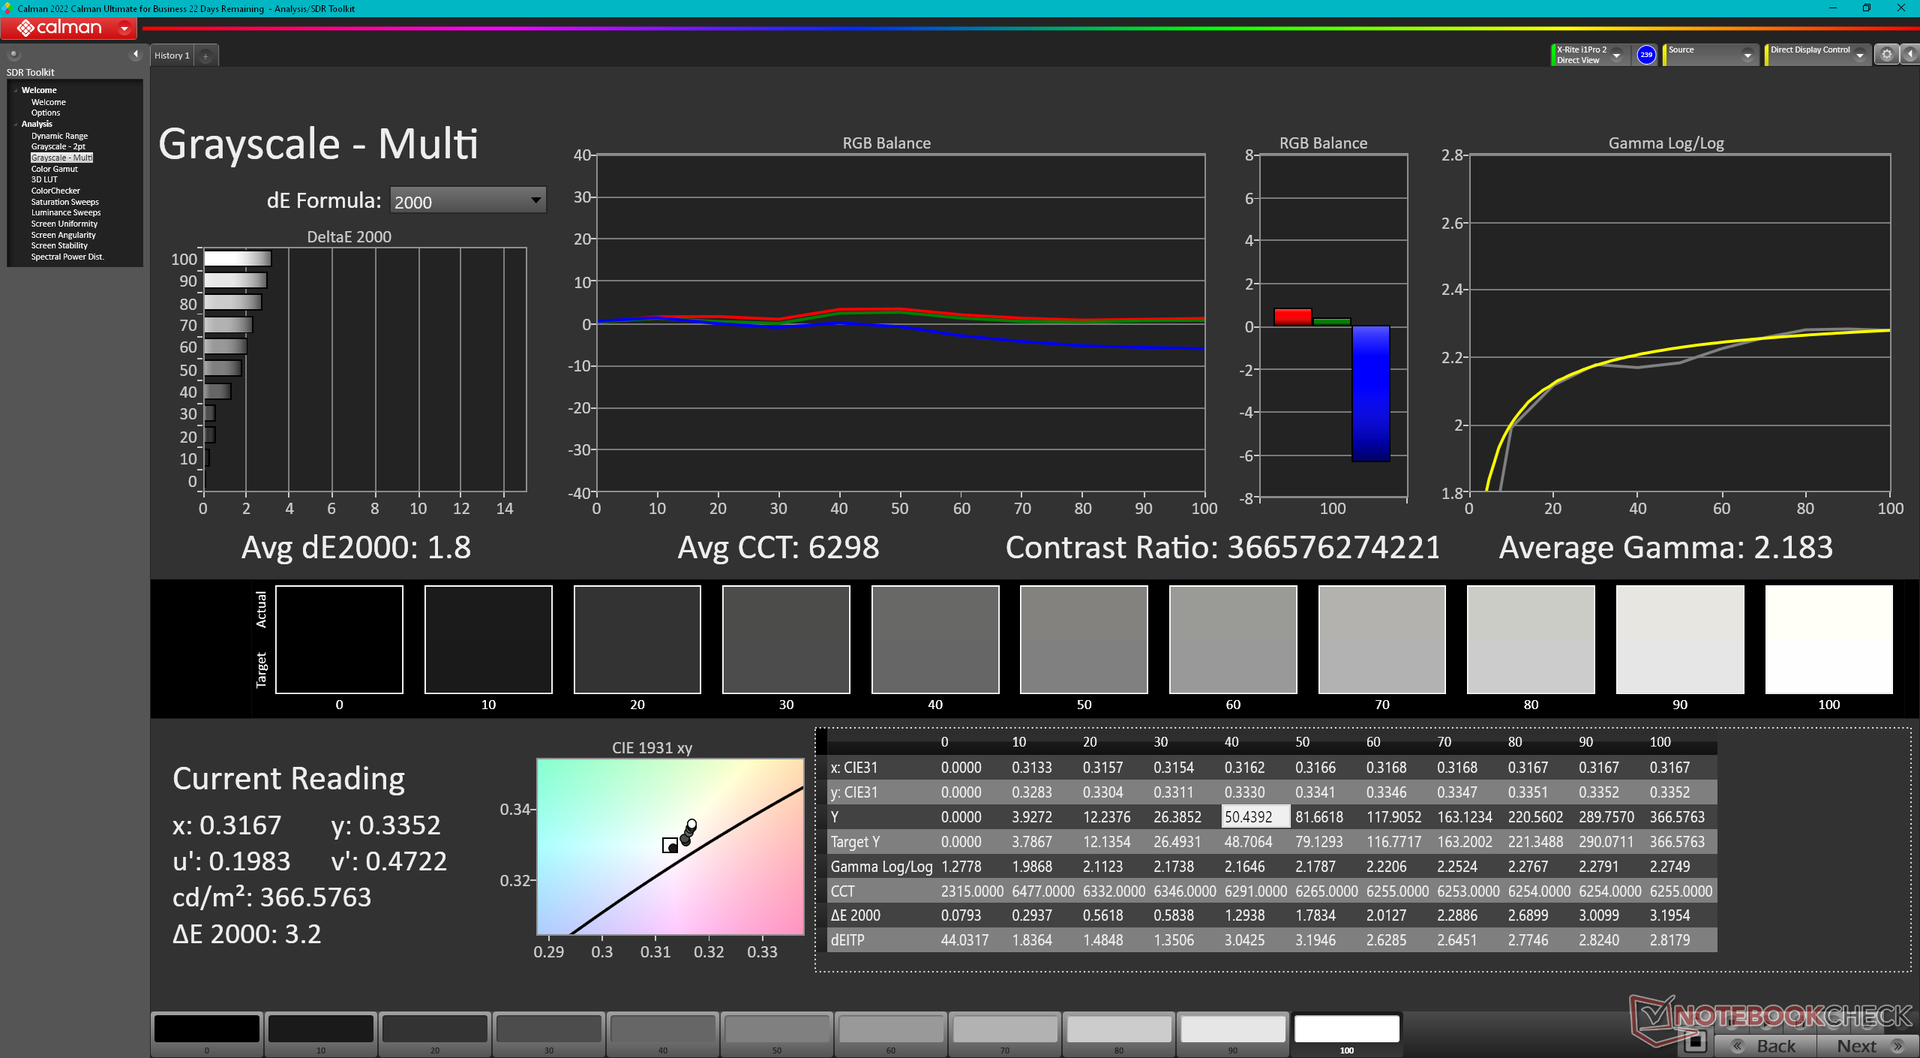
ΔE Greyscale Calman: 1.7 | ∀{0.09-98 Ø5}
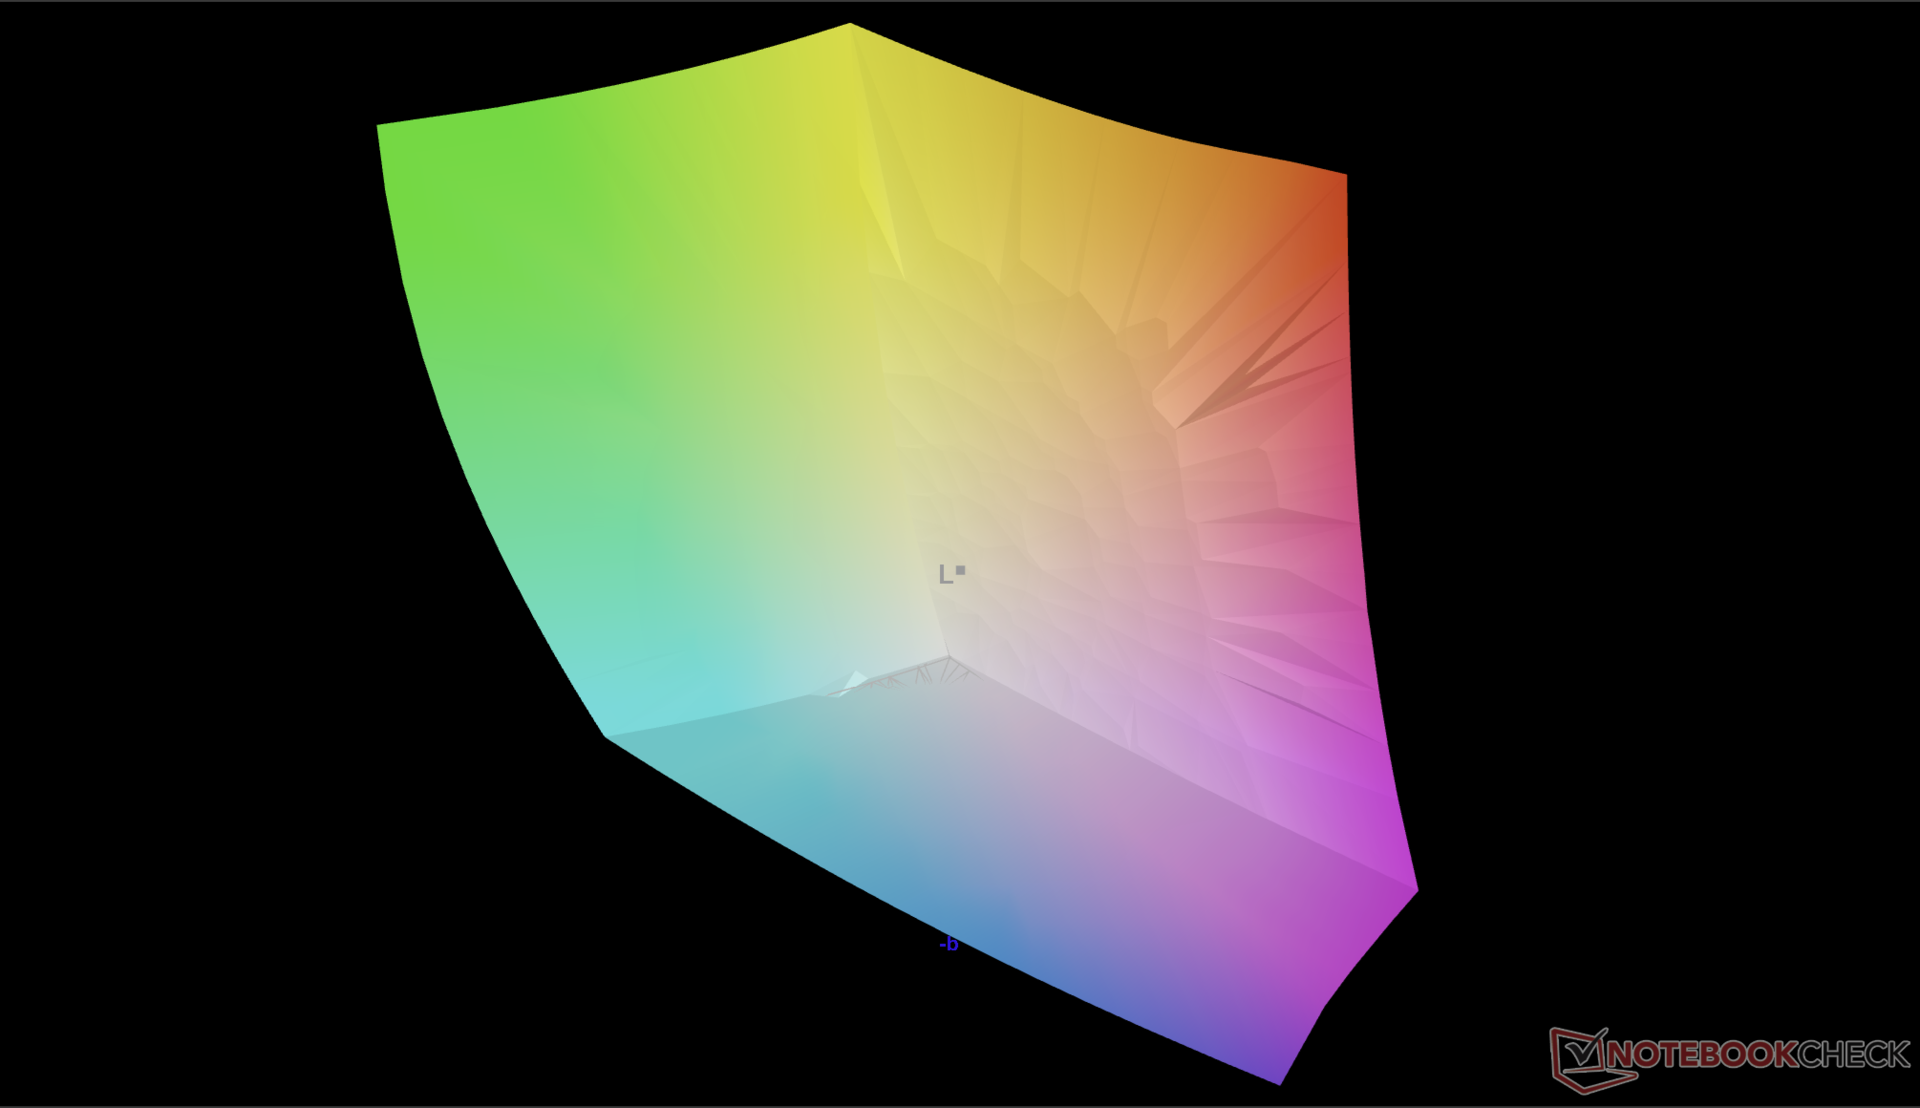
97.8% AdobeRGB 1998 (Argyll 3D)
100% sRGB (Argyll 3D)
99.7% Display P3 (Argyll 3D)
Gamma: 2.2
CCT: 6272 K
| Lenovo IdeaPad Pro 5 16IMH G9 RTX 4050 LEN1602K, OLED, 2048x1280, 16", 120 Hz | Lenovo IdeaPad Pro 5 16IMH G9 NE160QDM-NY2, IPS, 2560x1600, 16", 120 Hz | Dell Inspiron 16 7640 2-in-1 AU Optronics B160QAT, Mini-LED, 2560x1600, 16", 90 Hz | Asus Zenbook S 16 UM5606-RK333W ATNA60CL10-0, OLED, 2880x1800, 16", 120 Hz | HP Envy x360 2-in-1 16-ad0097nr Samsung SDC41A6, OLED, 2880x1800, 16", 120 Hz | Samsung Galaxy Book4 Ultra ATNA60CL07-0, OLED, 2880x1800, 16", 120 Hz | |
|---|---|---|---|---|---|---|
| Display | -25% | -2% | -1% | -0% | -4% | |
| Display P3 Coverage (%) | 99.7 | 63.3 -37% | 99.4 0% | 99.9 0% | 99.6 0% | 98.6 -1% |
| sRGB Coverage (%) | 100 | 95.2 -5% | 100 0% | 100 0% | 100 0% | 99.9 0% |
| AdobeRGB 1998 Coverage (%) | 97.8 | 65.3 -33% | 92.5 -5% | 95.6 -2% | 96.5 -1% | 88.5 -10% |
| Response Times | -1708% | -4258% | 20% | -14% | 19% | |
| Response Time Grey 50% / Grey 80% * (ms) | 0.58 ? | 15 ? -2486% | 15.4 ? -2555% | 0.56 ? 3% | 0.8 ? -38% | 0.54 ? 7% |
| Response Time Black / White * (ms) | 1 ? | 10.3 ? -930% | 60.6 ? -5960% | 0.65 ? 35% | 0.89 ? 11% | 0.69 ? 31% |
| PWM Frequency (Hz) | 240 ? | 2753.7 ? | 480 | 491.8 ? | 240 ? | |
| PWM Amplitude * (%) | 38 | 30 21% | ||||
| Bildschirm | -14% | -21% | 43% | 10% | 20% | |
| Helligkeit Bildmitte (cd/m²) | 367.6 | 368 0% | 413 12% | 407 11% | 399.4 9% | 390 6% |
| Brightness (cd/m²) | 371 | 368 -1% | 409 10% | 405 9% | 405 9% | 393 6% |
| Brightness Distribution (%) | 98 | 91 -7% | 97 -1% | 97 -1% | 98 0% | 98 0% |
| Schwarzwert * (cd/m²) | 0.31 | 0.14 | 0.02 | |||
| Delta E Colorchecker * | 4.31 | 2.4 44% | 3.48 19% | 0.6 86% | 4.05 6% | 1.4 68% |
| Colorchecker dE 2000 max. * | 6.85 | 6.5 5% | 6.97 -2% | 1.2 82% | 6.69 2% | 2.7 61% |
| Colorchecker dE 2000 calibrated * | 1.11 | 0.8 28% | 1.02 8% | |||
| Delta E Graustufen * | 1.7 | 4.5 -165% | 4.5 -165% | 0.5 71% | 1.1 35% | 2.1 -24% |
| Gamma | 2.2 100% | 2.21 100% | 2.15 102% | 2.2 100% | 2.27 97% | 2.27 97% |
| CCT | 6272 104% | 6324 103% | 6446 101% | 6453 101% | 6419 101% | 6431 101% |
| Kontrast (:1) | 1187 | 2950 | 20350 | |||
| Durchschnitt gesamt (Programm / Settings) | -582% /
-299% | -1427% /
-786% | 21% /
26% | -1% /
3% | 12% /
13% |
* ... kleinere Werte sind besser

Obwohl das Display werkseitig nicht kalibriert wurde, zeigt es mit durchschnittlichen Graustufen- und Farb-DeltaE-Werten von 1,7 bzw. 4,31 eine gute Genauigkeit gegenüber dem P3-Standard.

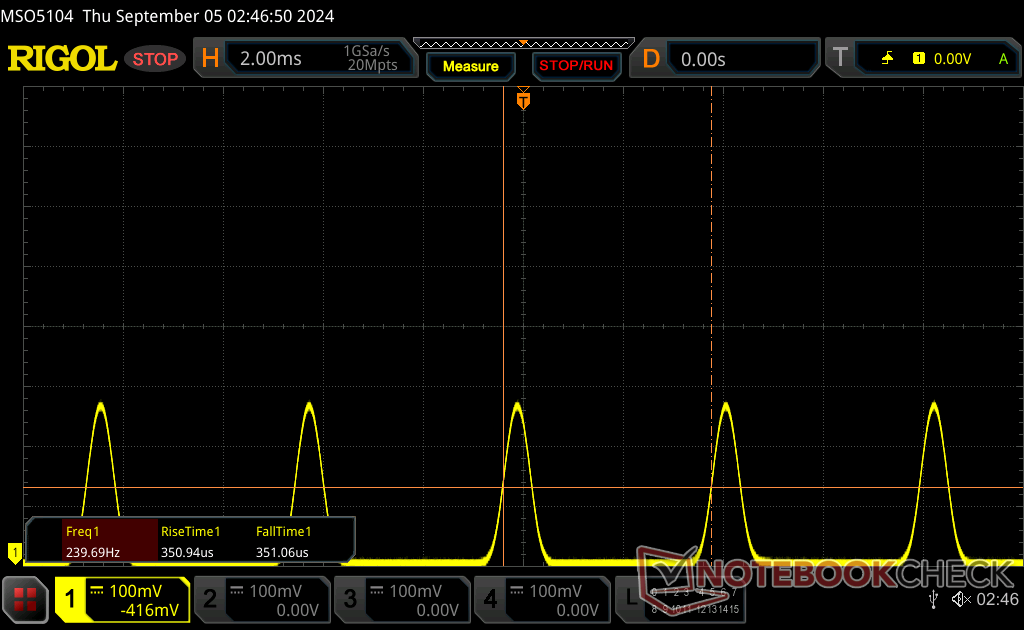
Reaktionszeiten (Response Times) des Displays
| ↔ Reaktionszeiten Schwarz zu Weiß | ||
|---|---|---|
| 1 ms ... steigend ↗ und fallend ↘ kombiniert | ↗ 0.56 ms steigend | 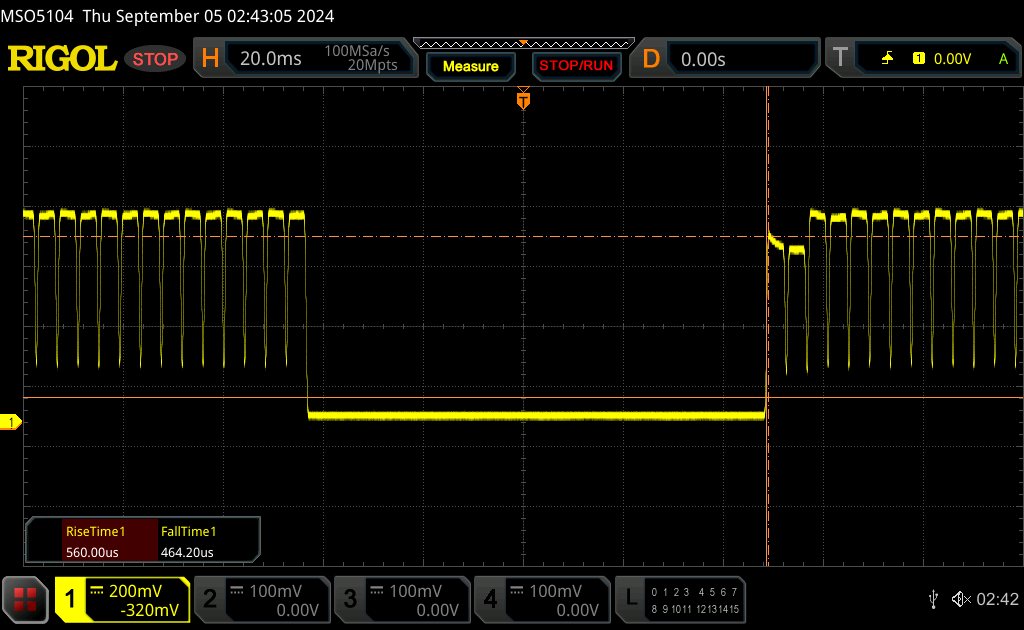 |
| ↘ 0.44 ms fallend | ||
| Die gemessenen Reaktionszeiten sind sehr kurz, wodurch sich der Bildschirm auch für schnelle 3D Spiele eignen sollte. Im Vergleich rangierten die bei uns getesteten Geräte von 0.1 (Minimum) zu 240 (Maximum) ms. » 3 % aller Screens waren schneller als der getestete. Daher sind die gemessenen Reaktionszeiten besser als der Durchschnitt aller vermessenen Geräte (20.2 ms). | ||
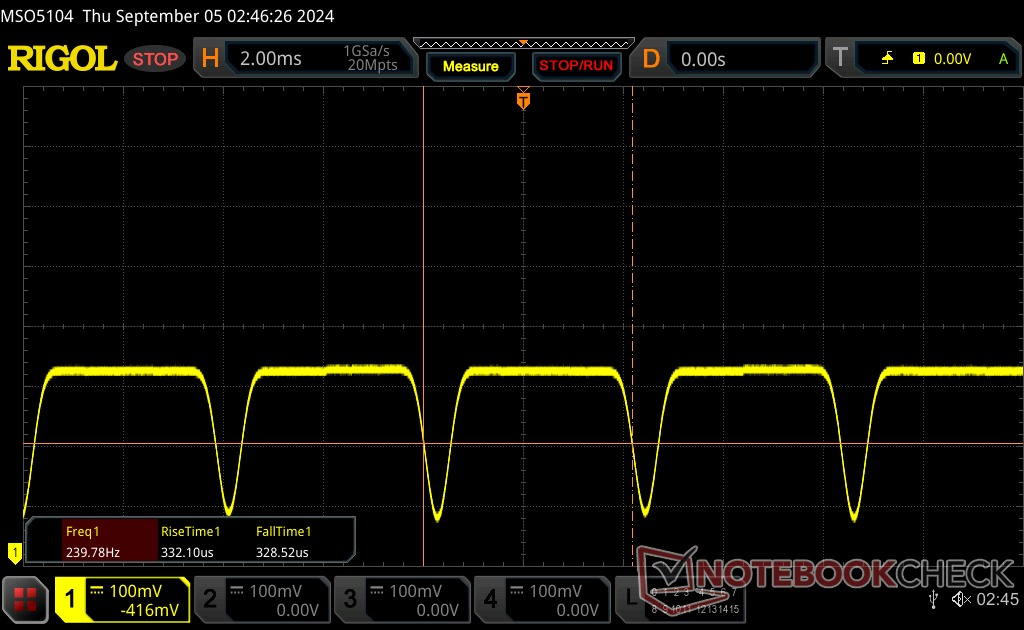
| ↔ Reaktionszeiten 50% Grau zu 80% Grau | ||
| 0.58 ms ... steigend ↗ und fallend ↘ kombiniert | ↗ 0.28 ms steigend | 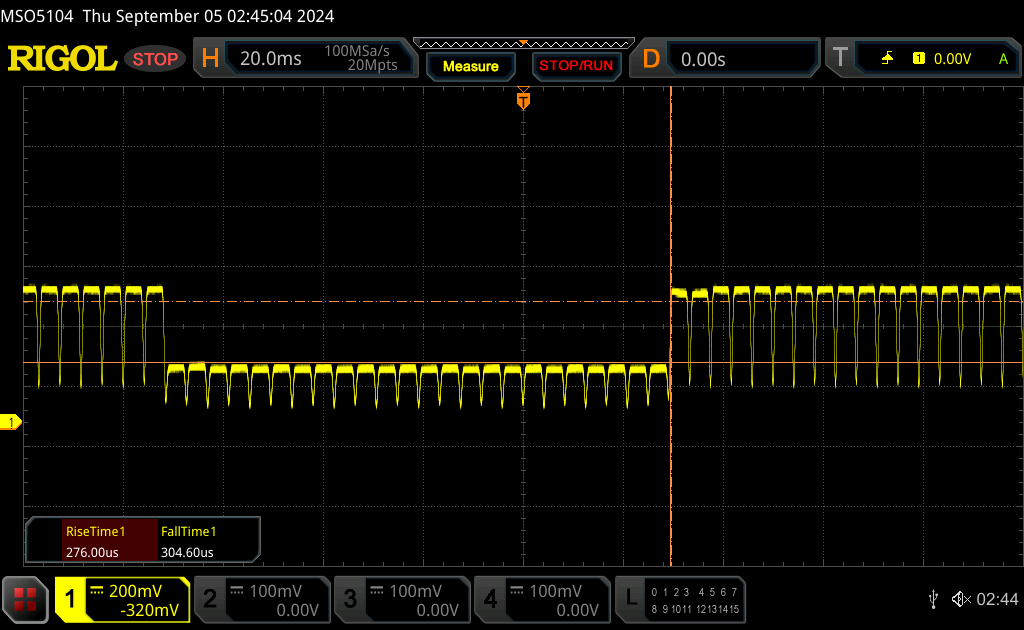 |
| ↘ 0.3 ms fallend | ||
| Die gemessenen Reaktionszeiten sind sehr kurz, wodurch sich der Bildschirm auch für schnelle 3D Spiele eignen sollte. Im Vergleich rangierten die bei uns getesteten Geräte von 0.165 (Minimum) zu 636 (Maximum) ms. » 1 % aller Screens waren schneller als der getestete. Daher sind die gemessenen Reaktionszeiten besser als der Durchschnitt aller vermessenen Geräte (31.6 ms). | ||
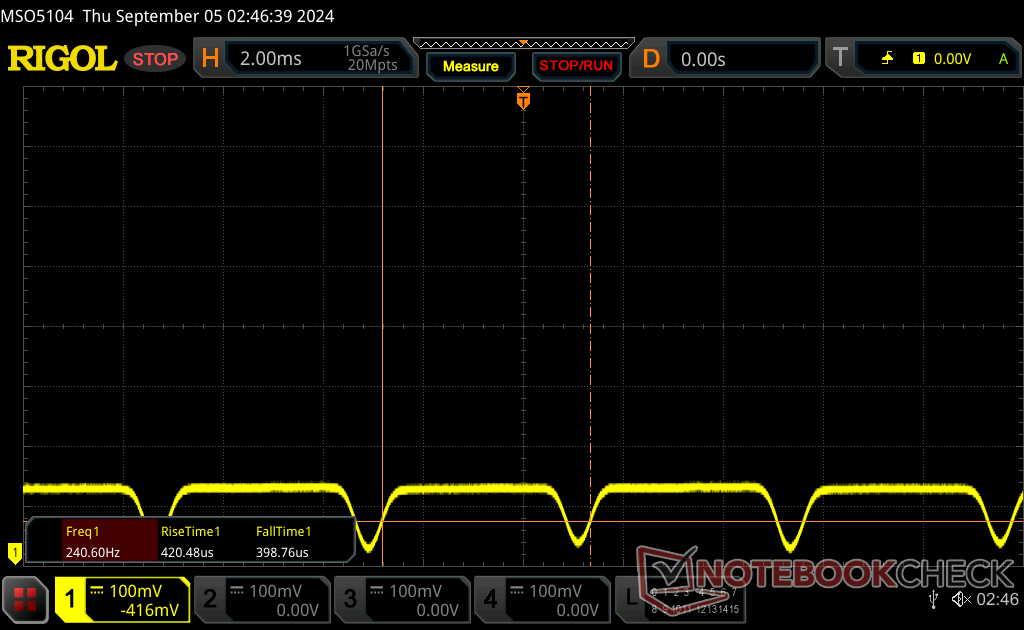
Bildschirm-Flackern / PWM (Pulse-Width Modulation)
| Flackern / PWM festgestellt | 240 Hz Amplitude: 38 % | ≤ 100 % Helligkeit | 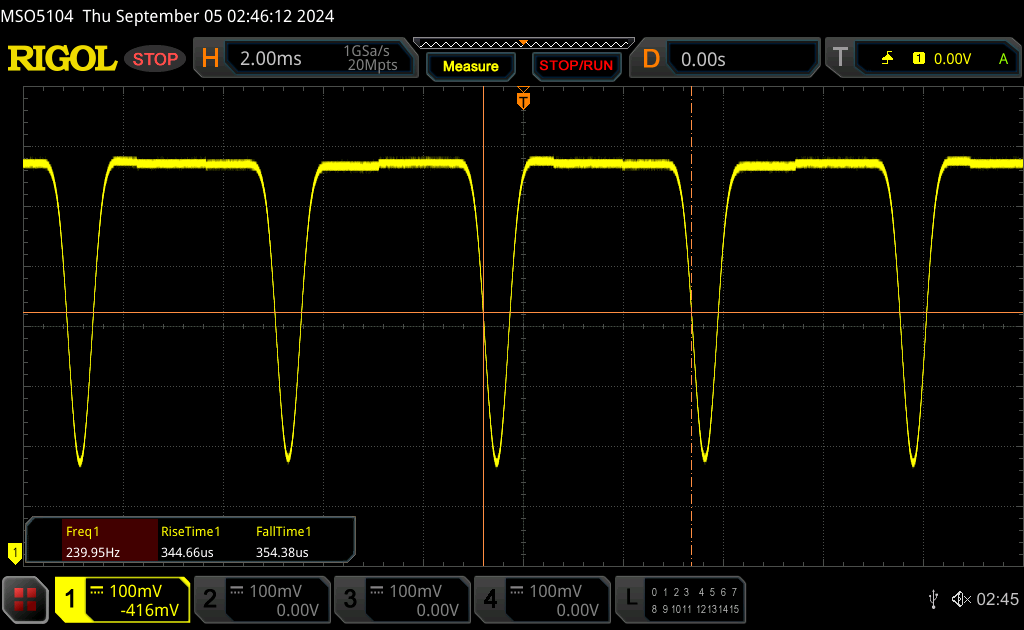 |
Das Display flackert mit 240 Hz (im schlimmsten Fall, eventuell durch Pulsweitenmodulation PWM) bei einer eingestellten Helligkeit von 100 % und darunter. Darüber sollte es zu keinem Flackern kommen. Die Frequenz von 240 Hz ist relativ gering und daher sollte es bei sensiblen Personen zu Problemen wie Flackern oder Augenbeschwerden führen. Im Vergleich: 53 % aller getesteten Geräte nutzten kein PWM um die Helligkeit zu reduzieren. Wenn PWM eingesetzt wurde, dann bei einer Frequenz von durchschnittlich 8111 (Minimum 5, Maximum 343500) Hz. | |||
Eine Pulsweitenmodulationsfrequenz von 240 Hz ist bei allen Helligkeitsstufen nachweisbar und gleichmäßig verteilt.
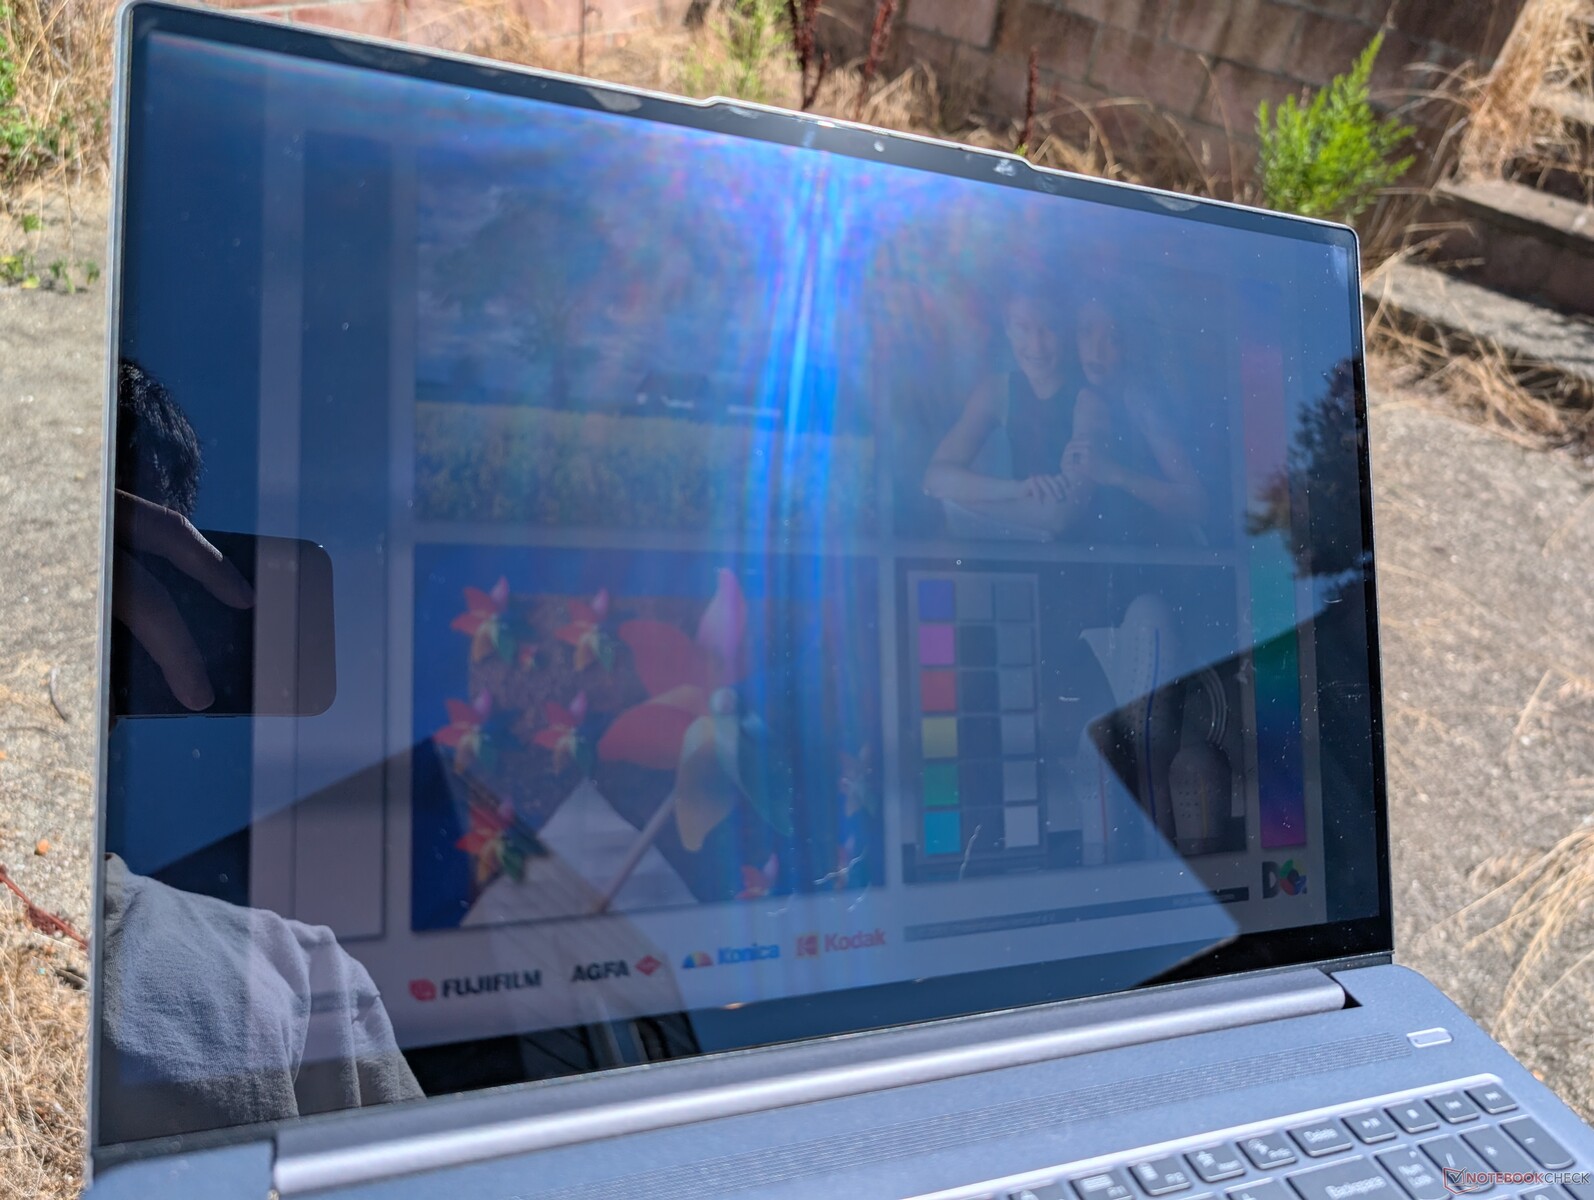
Die OLED-Option ist für den Außeneinsatz nicht zwangsläufig überlegen, da die maximale Helligkeit bei beiden Optionen ungefähr gleich ist. Tatsächlich könnte die OLED-Konfiguration aufgrund des glänzenden Overlays sogar weniger vorteilhaft sein, während die IPS-Option mit ihrer matten Oberfläche Blendungen reduziert.


Performance — Core Ultra 9 Leistung ist ein Kraftwerk
Testbedingungen
Wir haben sowohl Windows als auch Lenovo Vantage auf den Performance-Modus eingestellt, bevor wir die folgenden Benchmarks durchgeführt haben. Es wird nur Optimus 1.0 unterstützt; G-Sync, MUX- oder Windows VRR-Optionen sind nicht verfügbar.

Prozessor
Es stehen drei Meteor Lake CPU-Optionen zur Verfügung: Core Ultra 5 125H, Core Ultra 7 155H und Core Ultra 9 185H. Der Wechsel vom Core Ultra 5 zum Core Ultra 7 bringt einen signifikanten Leistungszuwachs von etwa 80 Prozent, während der Unterschied zwischen dem Core Ultra 7 und dem Core Ultra 9 nur weitere 5 bis 10 Prozent beträgt, was in den meisten Anwendungsszenarien kaum spürbar ist. Wenn Sie also nicht unbedingt die Spitzenleistung benötigen, reicht die Core Ultra 7-Option für die meisten Nutzer aus, da sie immer noch schneller ist als viele andere Optionen in dieser Klasse.
In Bezug auf die Rohleistung übertrifft die Core Ultra-Serie konkurrierende AMD-CPUs wie den Ryzen 7 8840HS und den neuesten Ryzen AI 9 HX 370. Die Raptor Lake Core i7 HX-Serie könnte sogar noch schneller sein, allerdings fehlt diesen CPUs eine integrierte NPU, die kompatible KI-Aufgaben beschleunigt. Beachten Sie, dass Co-Pilot Plus derzeit nicht mit Meteor Lake-Prozessoren kompatibel ist.
Cinebench R15 Multi Dauertest
Cinebench R23: Multi Core | Single Core
Cinebench R20: CPU (Multi Core) | CPU (Single Core)
Cinebench R15: CPU Multi 64Bit | CPU Single 64Bit
Blender: v2.79 BMW27 CPU
7-Zip 18.03: 7z b 4 | 7z b 4 -mmt1
Geekbench 6.5: Multi-Core | Single-Core
Geekbench 5.5: Multi-Core | Single-Core
HWBOT x265 Benchmark v2.2: 4k Preset
LibreOffice : 20 Documents To PDF
R Benchmark 2.5: Overall mean
* ... kleinere Werte sind besser
AIDA64: FP32 Ray-Trace | FPU Julia | CPU SHA3 | CPU Queen | FPU SinJulia | FPU Mandel | CPU AES | CPU ZLib | FP64 Ray-Trace | CPU PhotoWorxx
| Performance Rating | |
| Asus Zenbook S 16 UM5606-RK333W | |
| Lenovo IdeaPad Pro 5 16IMH G9 RTX 4050 | |
| Lenovo IdeaPad Pro 5 16IMH G9 | |
| Durchschnittliche Intel Core Ultra 9 185H | |
| HP Envy x360 2-in-1 16-ad0097nr | |
| Dell Inspiron 16 7640 2-in-1 | |
| Samsung Galaxy Book4 Ultra | |
| AIDA64 / FP32 Ray-Trace | |
| Asus Zenbook S 16 UM5606-RK333W | |
| HP Envy x360 2-in-1 16-ad0097nr | |
| Lenovo IdeaPad Pro 5 16IMH G9 RTX 4050 | |
| Lenovo IdeaPad Pro 5 16IMH G9 | |
| Durchschnittliche Intel Core Ultra 9 185H (9220 - 18676, n=19) | |
| Dell Inspiron 16 7640 2-in-1 | |
| Samsung Galaxy Book4 Ultra | |
| AIDA64 / FPU Julia | |
| Asus Zenbook S 16 UM5606-RK333W | |
| Lenovo IdeaPad Pro 5 16IMH G9 RTX 4050 | |
| Lenovo IdeaPad Pro 5 16IMH G9 | |
| Durchschnittliche Intel Core Ultra 9 185H (48865 - 96463, n=19) | |
| HP Envy x360 2-in-1 16-ad0097nr | |
| Dell Inspiron 16 7640 2-in-1 | |
| Samsung Galaxy Book4 Ultra | |
| AIDA64 / CPU SHA3 | |
| Asus Zenbook S 16 UM5606-RK333W | |
| Lenovo IdeaPad Pro 5 16IMH G9 RTX 4050 | |
| Durchschnittliche Intel Core Ultra 9 185H (2394 - 4534, n=19) | |
| Lenovo IdeaPad Pro 5 16IMH G9 | |
| HP Envy x360 2-in-1 16-ad0097nr | |
| Dell Inspiron 16 7640 2-in-1 | |
| Samsung Galaxy Book4 Ultra | |
| AIDA64 / CPU Queen | |
| HP Envy x360 2-in-1 16-ad0097nr | |
| Lenovo IdeaPad Pro 5 16IMH G9 RTX 4050 | |
| Durchschnittliche Intel Core Ultra 9 185H (66785 - 95241, n=19) | |
| Dell Inspiron 16 7640 2-in-1 | |
| Lenovo IdeaPad Pro 5 16IMH G9 | |
| Asus Zenbook S 16 UM5606-RK333W | |
| Samsung Galaxy Book4 Ultra | |
| AIDA64 / FPU SinJulia | |
| Asus Zenbook S 16 UM5606-RK333W | |
| HP Envy x360 2-in-1 16-ad0097nr | |
| Lenovo IdeaPad Pro 5 16IMH G9 RTX 4050 | |
| Lenovo IdeaPad Pro 5 16IMH G9 | |
| Durchschnittliche Intel Core Ultra 9 185H (7255 - 11392, n=19) | |
| Dell Inspiron 16 7640 2-in-1 | |
| Samsung Galaxy Book4 Ultra | |
| AIDA64 / FPU Mandel | |
| Asus Zenbook S 16 UM5606-RK333W | |
| Lenovo IdeaPad Pro 5 16IMH G9 RTX 4050 | |
| HP Envy x360 2-in-1 16-ad0097nr | |
| Lenovo IdeaPad Pro 5 16IMH G9 | |
| Durchschnittliche Intel Core Ultra 9 185H (24004 - 48020, n=19) | |
| Dell Inspiron 16 7640 2-in-1 | |
| Samsung Galaxy Book4 Ultra | |
| AIDA64 / CPU AES | |
| Durchschnittliche Intel Core Ultra 9 185H (53116 - 154066, n=19) | |
| Lenovo IdeaPad Pro 5 16IMH G9 RTX 4050 | |
| Lenovo IdeaPad Pro 5 16IMH G9 | |
| Dell Inspiron 16 7640 2-in-1 | |
| HP Envy x360 2-in-1 16-ad0097nr | |
| Samsung Galaxy Book4 Ultra | |
| Asus Zenbook S 16 UM5606-RK333W | |
| AIDA64 / CPU ZLib | |
| Lenovo IdeaPad Pro 5 16IMH G9 RTX 4050 | |
| Durchschnittliche Intel Core Ultra 9 185H (678 - 1341, n=19) | |
| Lenovo IdeaPad Pro 5 16IMH G9 | |
| Asus Zenbook S 16 UM5606-RK333W | |
| Dell Inspiron 16 7640 2-in-1 | |
| Samsung Galaxy Book4 Ultra | |
| HP Envy x360 2-in-1 16-ad0097nr | |
| AIDA64 / FP64 Ray-Trace | |
| Asus Zenbook S 16 UM5606-RK333W | |
| HP Envy x360 2-in-1 16-ad0097nr | |
| Lenovo IdeaPad Pro 5 16IMH G9 RTX 4050 | |
| Lenovo IdeaPad Pro 5 16IMH G9 | |
| Durchschnittliche Intel Core Ultra 9 185H (4428 - 10078, n=19) | |
| Dell Inspiron 16 7640 2-in-1 | |
| Samsung Galaxy Book4 Ultra | |
| AIDA64 / CPU PhotoWorxx | |
| Lenovo IdeaPad Pro 5 16IMH G9 | |
| Lenovo IdeaPad Pro 5 16IMH G9 RTX 4050 | |
| Samsung Galaxy Book4 Ultra | |
| Asus Zenbook S 16 UM5606-RK333W | |
| Durchschnittliche Intel Core Ultra 9 185H (44547 - 53918, n=19) | |
| Dell Inspiron 16 7640 2-in-1 | |
| HP Envy x360 2-in-1 16-ad0097nr | |
Stresstest
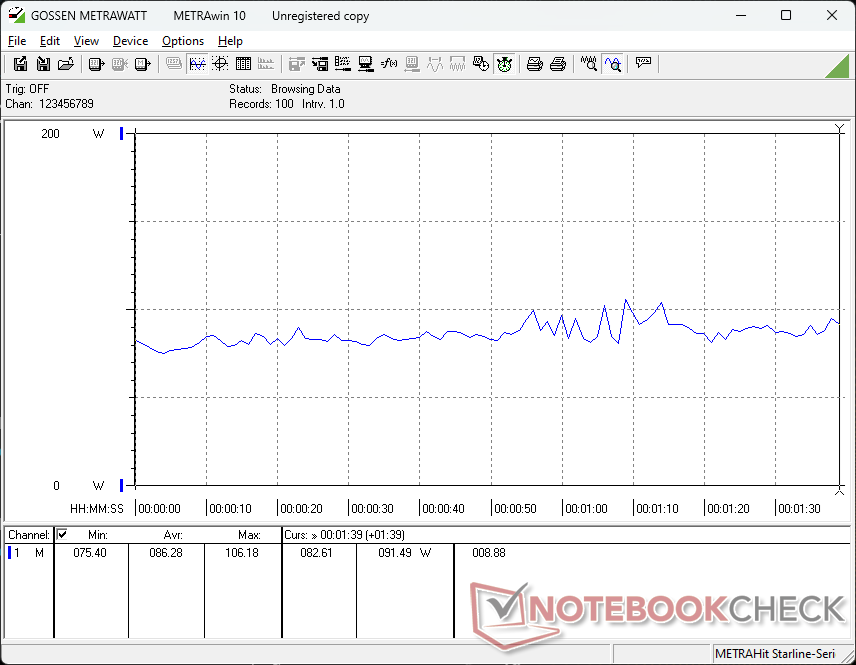
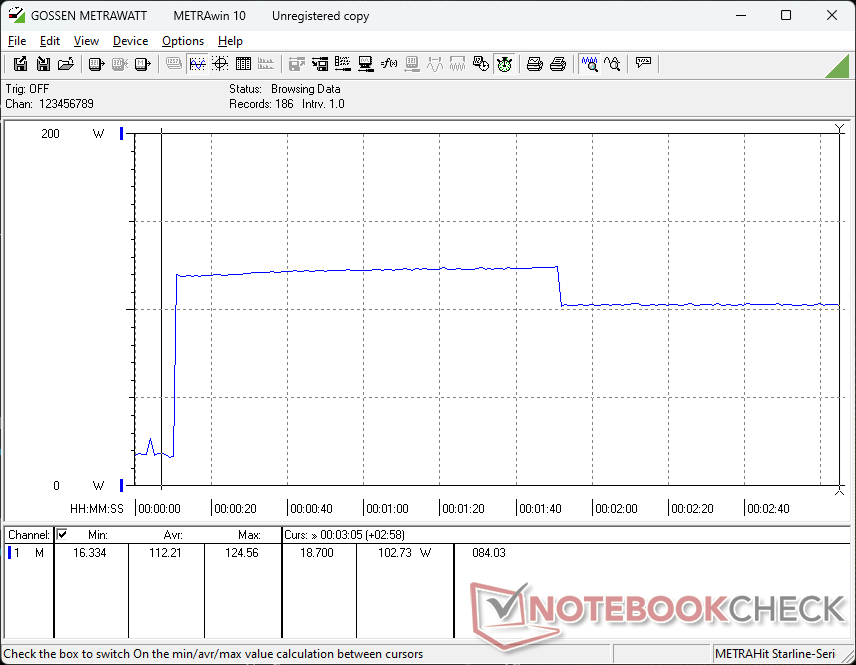
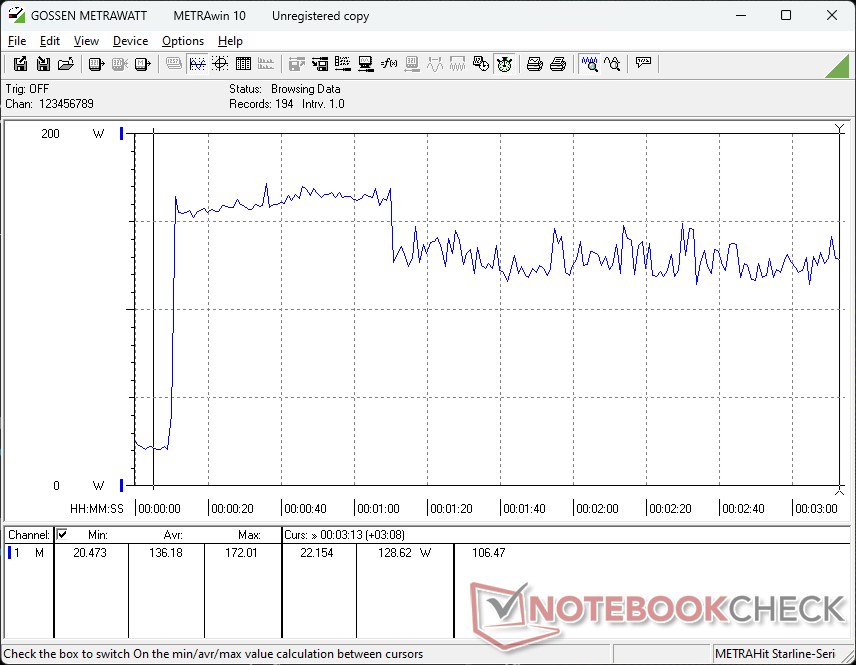
Beim Starten von Prime95 stieg die CPU auf 3,2 GHz, 81 W und 94 °C an. Nach etwa einer Minute sank die Frequenz auf 2,8 GHz und der Energieverbrauch auf 65 W, um eine etwas kühlere Kerntemperatur von 87 °C aufrechtzuerhalten. Der hohe Temperaturbereich von 87 °C ist immer noch sehr warm und deutet darauf hin, dass die CPU-Leistung wahrscheinlich besser gewesen wäre, wenn das Gehäuse größer und mit einer leistungsfähigeren Kühllösung ausgestattet wäre.
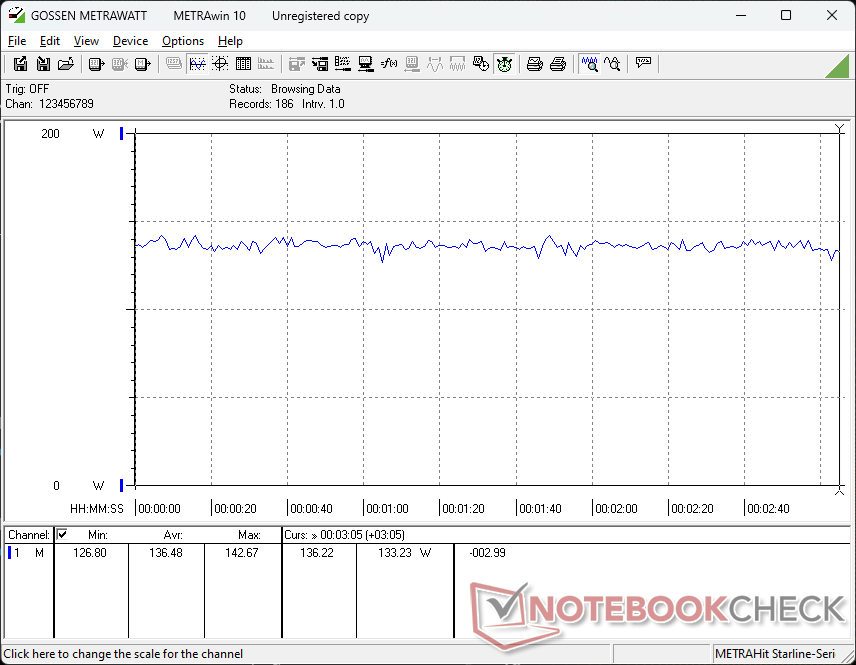
Die GPU stabilisierte sich bei 2595 MHz, 82 °C und 80 W, während Cyberpunk 2077 lief, was eine typische Gaming-Last darstellt. Zum Vergleich: Beim Spectre x360 16 und dem Lenovo LOQ 15, beide mit derselben RTX 4050 GPU, lagen die Temperaturen bei nur 71 °C bzw. 75 °C. Die generell höheren Betriebstemperaturen sind angesichts des dünnen Gehäusedesigns, der Core-Ultra-H-CPU und des relativ hohen TGP-Ziels von 90 W nicht überraschend.
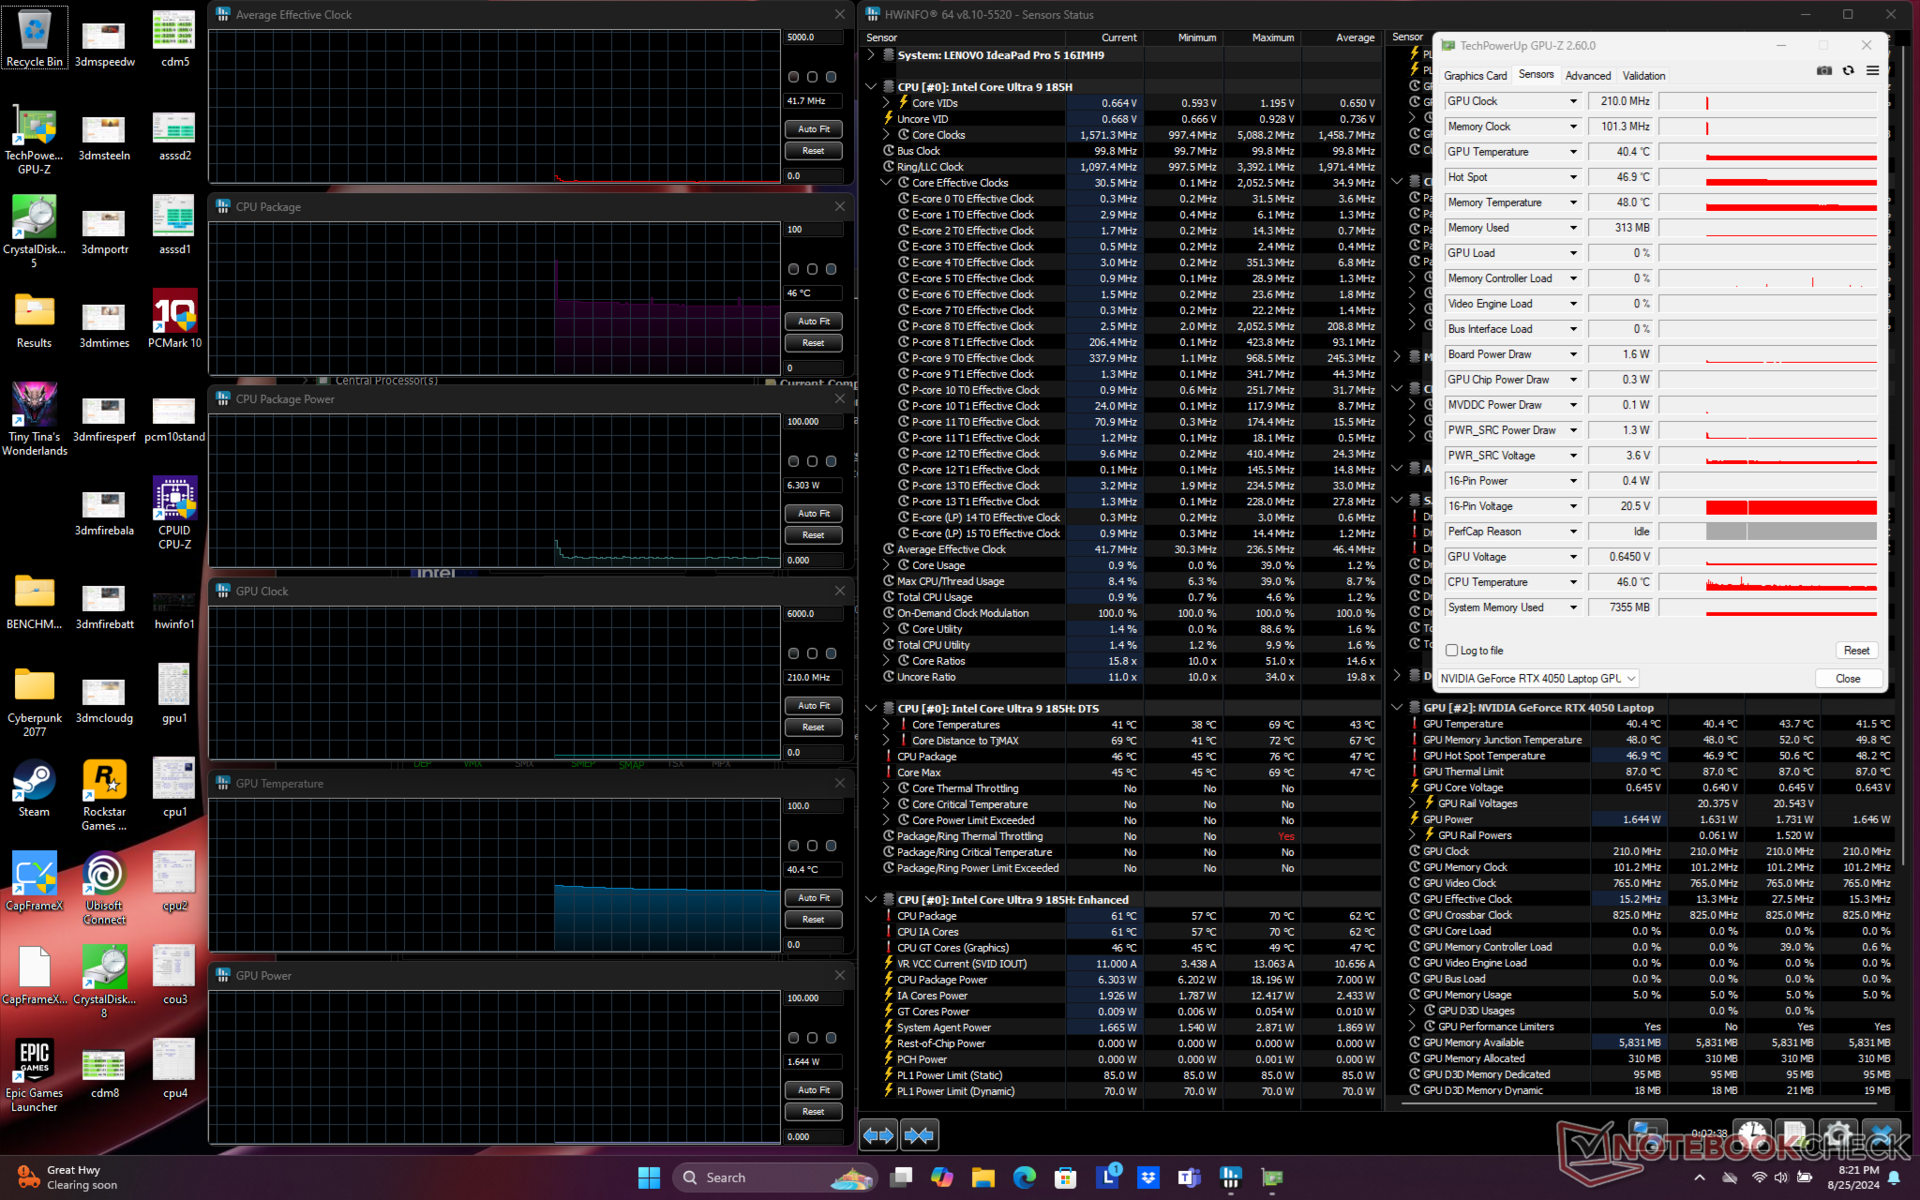
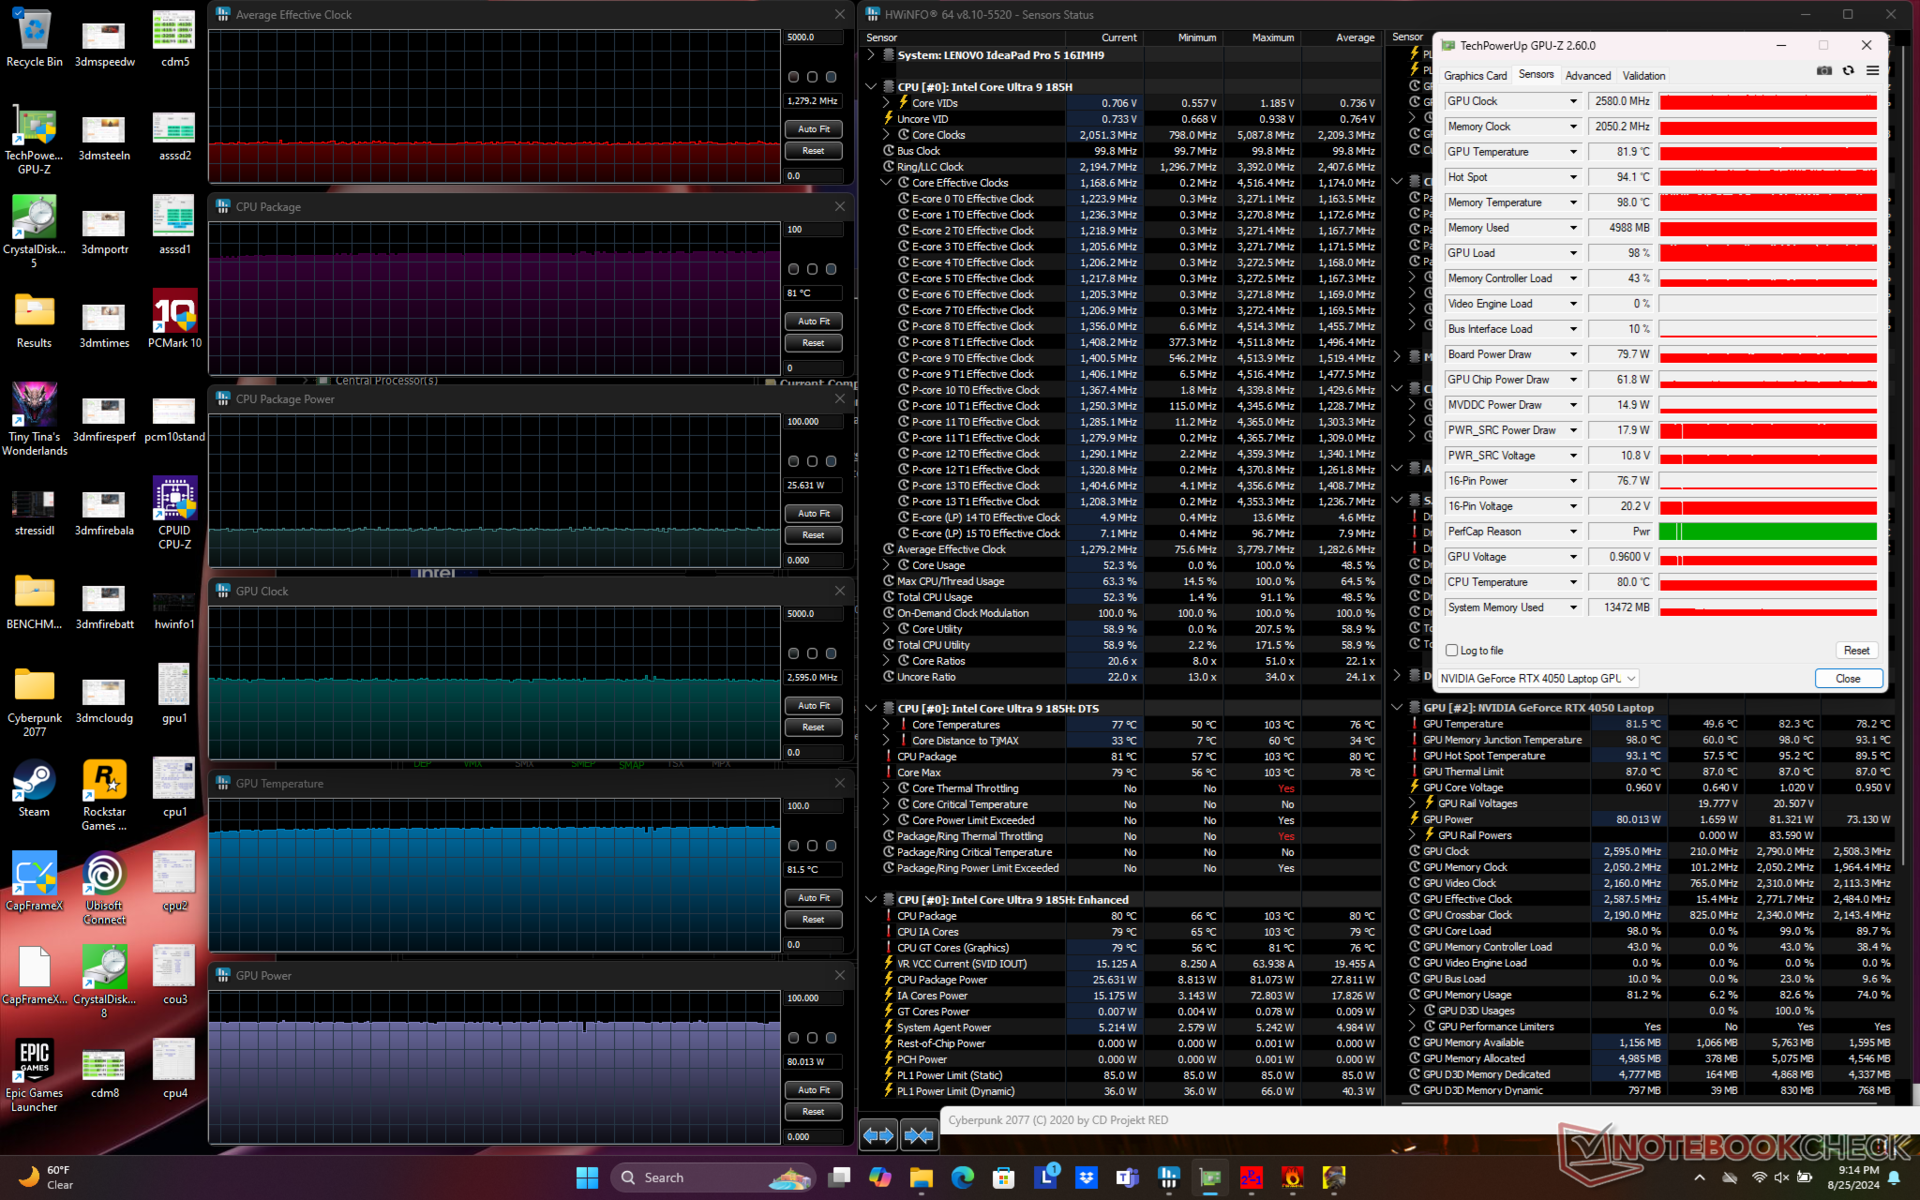
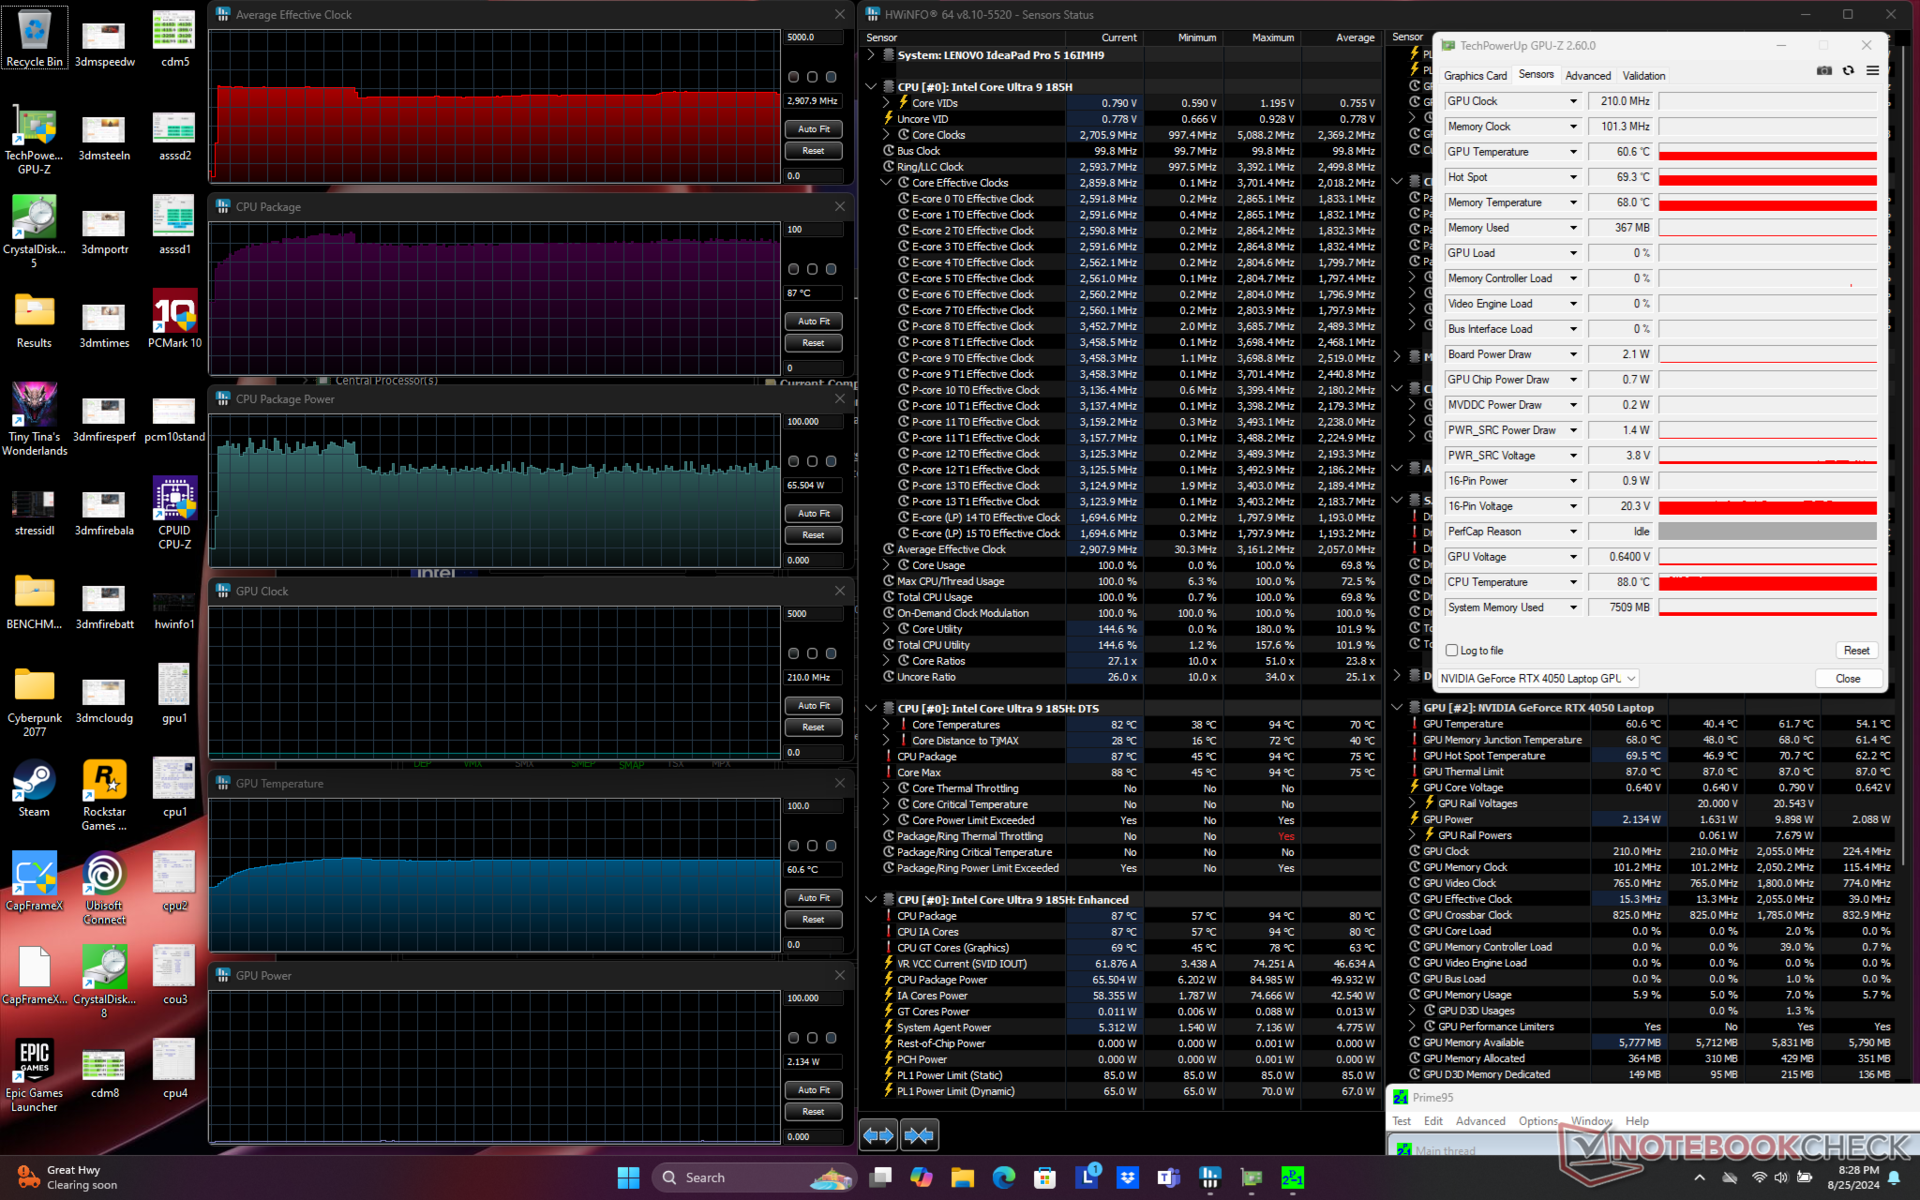
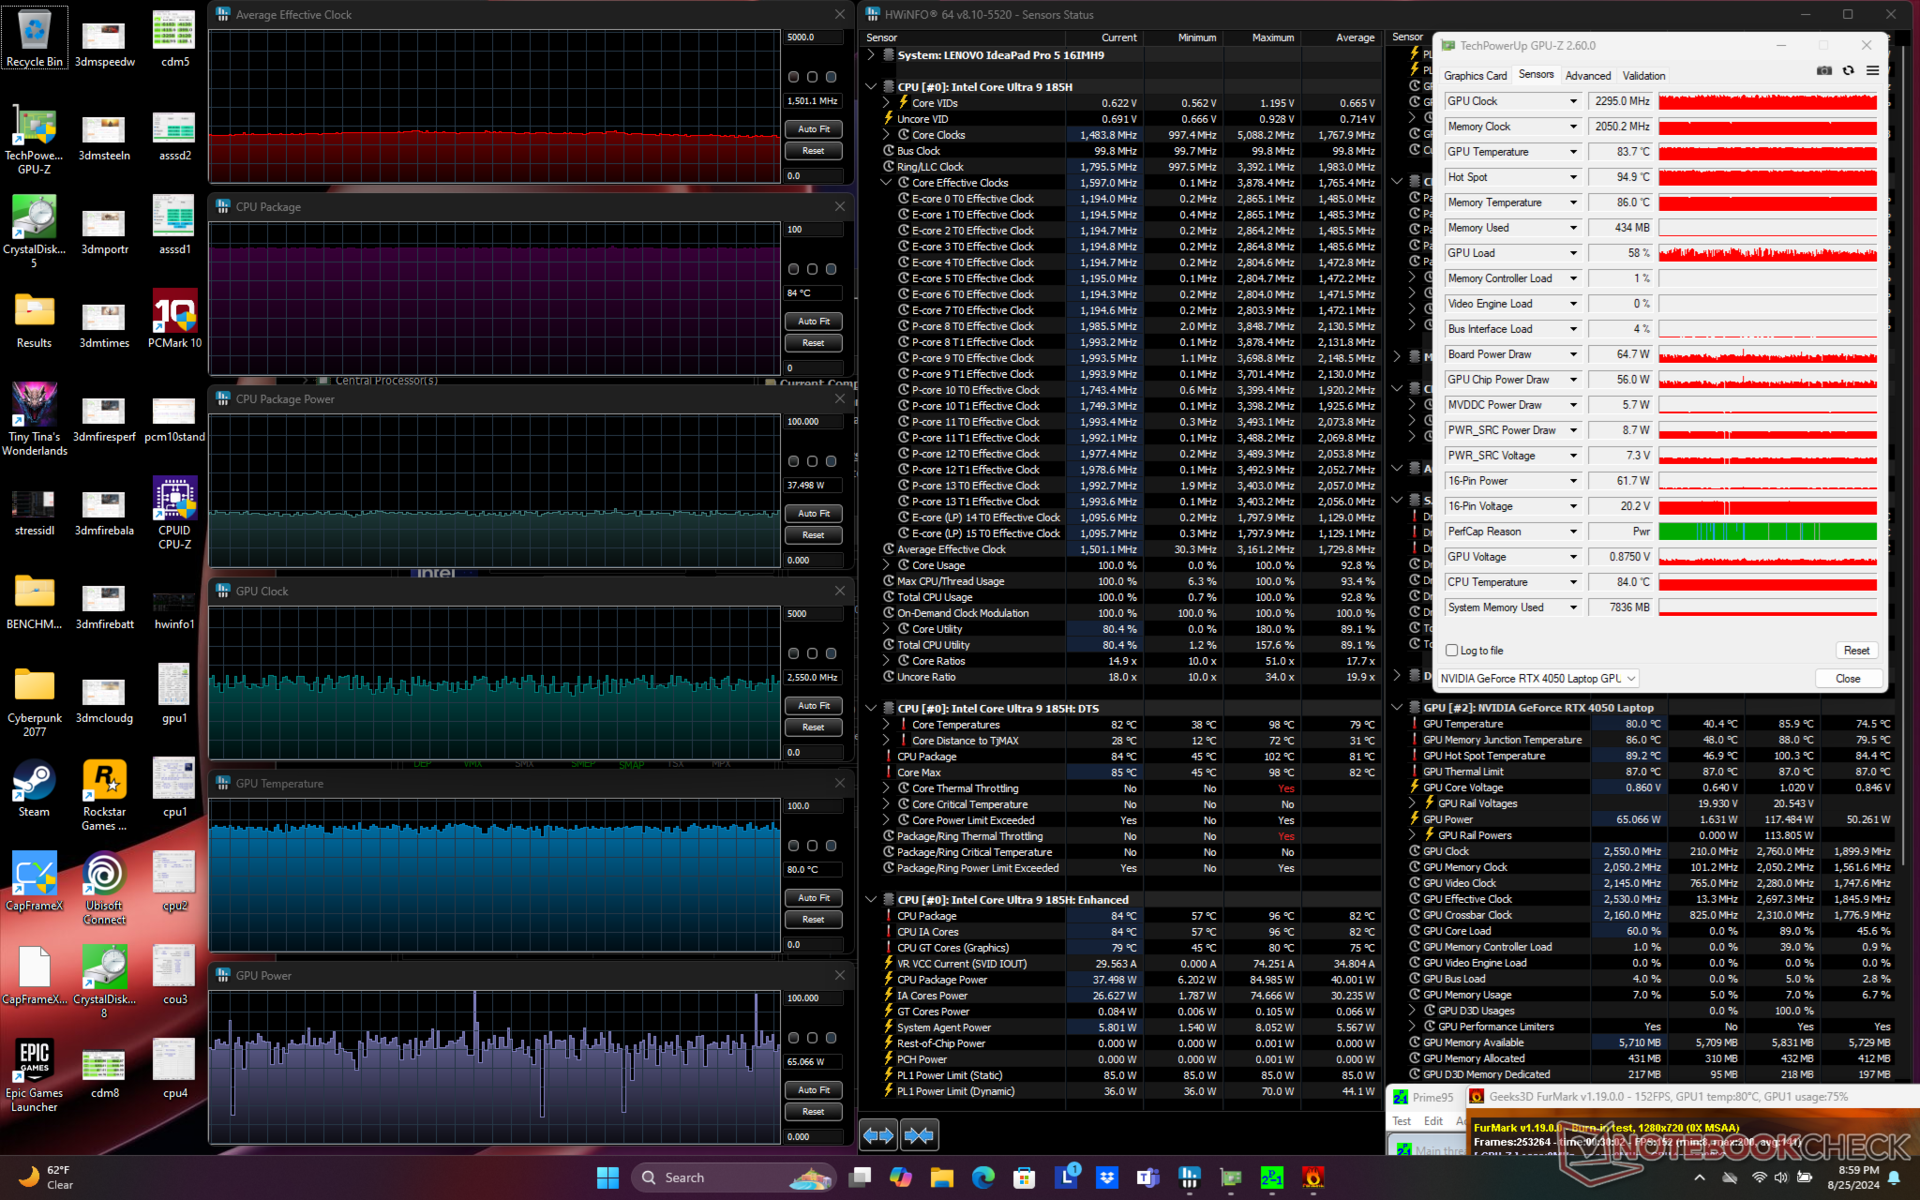
| Durchschnittlicher CPU-Takt (GHz) | GPU-Takt (MHz) | Durchschnittliche CPU-Temperatur (°C) | Durchschnittliche GPU-Temperatur (°C) | |
| System im Leerlauf | -- | -- | 46 | 40 |
| Prime95 Stresstest | 2.9 | -- | 87 | 61 |
| Prime95 + FurMark Stresstest | 1.5 | 2295 - 2550 | 84 | 80 |
| Cyberpunk 2077 Stresstest | 1.3 | 2580 | 81 | 82 |
System Performance
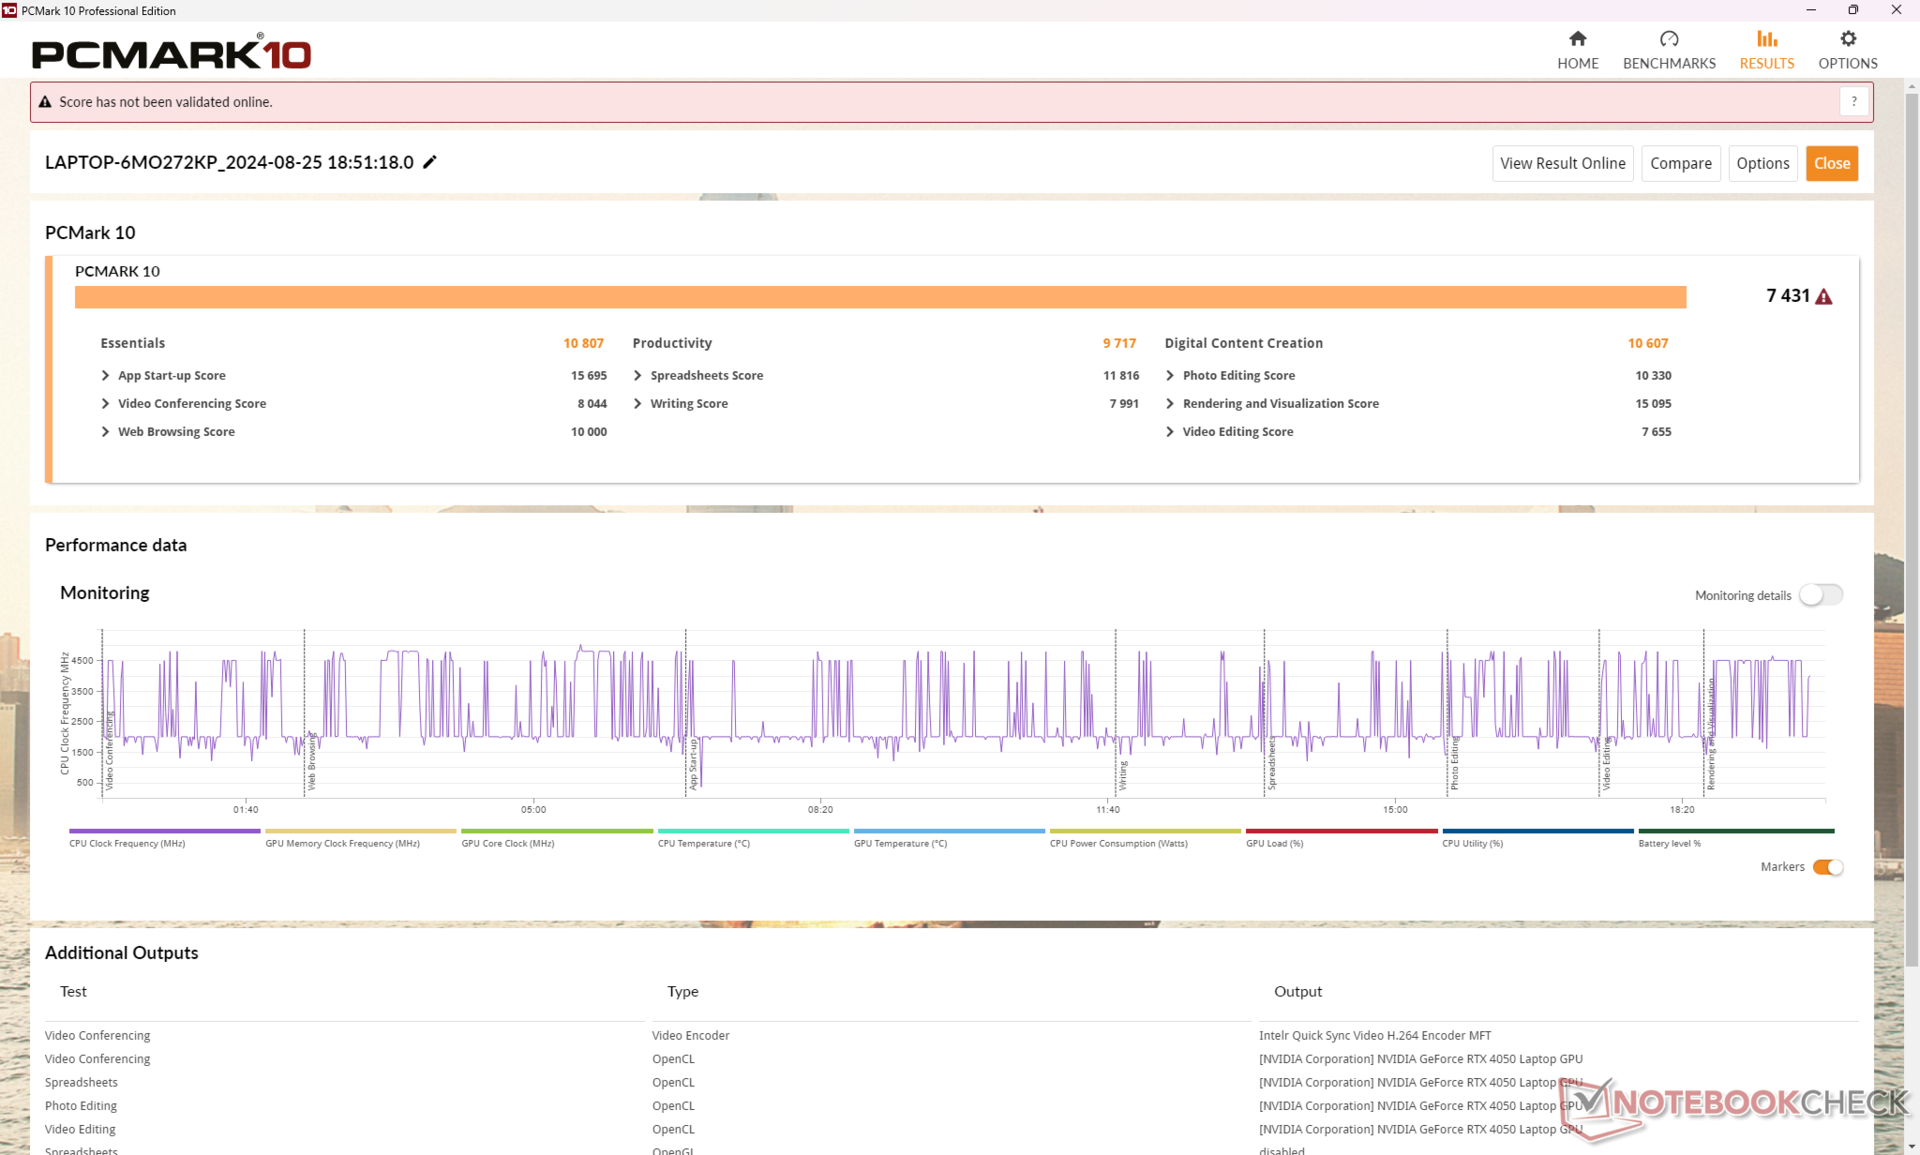
Die PCMark-Ergebnisse entsprechen denen anderer 16-Zoll-Multimedia-Notebooks mit langsamerer integrierter Grafik. Der PCMark 10 Benchmark ist allgemein nicht besonders gut darin, zwischen dGPU- und iGPU-Notebooks zu unterscheiden, insbesondere wenn MUX nicht unterstützt wird.
CrossMark: Overall | Productivity | Creativity | Responsiveness
WebXPRT 3: Overall
WebXPRT 4: Overall
Mozilla Kraken 1.1: Total
| PCMark 10 / Score | |
| Durchschnittliche Intel Core Ultra 9 185H, NVIDIA GeForce RTX 4050 Laptop GPU (7431 - 7846, n=2) | |
| Asus Zenbook S 16 UM5606-RK333W | |
| Lenovo IdeaPad Pro 5 16IMH G9 RTX 4050 | |
| Lenovo IdeaPad Pro 5 16IMH G9 | |
| Dell Inspiron 16 7640 2-in-1 | |
| Samsung Galaxy Book4 Ultra | |
| HP Envy x360 2-in-1 16-ad0097nr | |
| PCMark 10 / Essentials | |
| Lenovo IdeaPad Pro 5 16IMH G9 | |
| Dell Inspiron 16 7640 2-in-1 | |
| Asus Zenbook S 16 UM5606-RK333W | |
| Lenovo IdeaPad Pro 5 16IMH G9 RTX 4050 | |
| Durchschnittliche Intel Core Ultra 9 185H, NVIDIA GeForce RTX 4050 Laptop GPU (10672 - 10807, n=2) | |
| HP Envy x360 2-in-1 16-ad0097nr | |
| Samsung Galaxy Book4 Ultra | |
| PCMark 10 / Productivity | |
| Asus Zenbook S 16 UM5606-RK333W | |
| HP Envy x360 2-in-1 16-ad0097nr | |
| Durchschnittliche Intel Core Ultra 9 185H, NVIDIA GeForce RTX 4050 Laptop GPU (9717 - 9986, n=2) | |
| Lenovo IdeaPad Pro 5 16IMH G9 RTX 4050 | |
| Samsung Galaxy Book4 Ultra | |
| Lenovo IdeaPad Pro 5 16IMH G9 | |
| Dell Inspiron 16 7640 2-in-1 | |
| PCMark 10 / Digital Content Creation | |
| Durchschnittliche Intel Core Ultra 9 185H, NVIDIA GeForce RTX 4050 Laptop GPU (10607 - 12301, n=2) | |
| Lenovo IdeaPad Pro 5 16IMH G9 RTX 4050 | |
| Lenovo IdeaPad Pro 5 16IMH G9 | |
| Asus Zenbook S 16 UM5606-RK333W | |
| Dell Inspiron 16 7640 2-in-1 | |
| Samsung Galaxy Book4 Ultra | |
| HP Envy x360 2-in-1 16-ad0097nr | |
| CrossMark / Overall | |
| Durchschnittliche Intel Core Ultra 9 185H, NVIDIA GeForce RTX 4050 Laptop GPU (1790 - 1811, n=2) | |
| Lenovo IdeaPad Pro 5 16IMH G9 RTX 4050 | |
| Asus Zenbook S 16 UM5606-RK333W | |
| Samsung Galaxy Book4 Ultra | |
| Dell Inspiron 16 7640 2-in-1 | |
| HP Envy x360 2-in-1 16-ad0097nr | |
| Lenovo IdeaPad Pro 5 16IMH G9 | |
| CrossMark / Productivity | |
| Durchschnittliche Intel Core Ultra 9 185H, NVIDIA GeForce RTX 4050 Laptop GPU (1700 - 1717, n=2) | |
| Lenovo IdeaPad Pro 5 16IMH G9 RTX 4050 | |
| Samsung Galaxy Book4 Ultra | |
| Dell Inspiron 16 7640 2-in-1 | |
| Asus Zenbook S 16 UM5606-RK333W | |
| HP Envy x360 2-in-1 16-ad0097nr | |
| Lenovo IdeaPad Pro 5 16IMH G9 | |
| CrossMark / Creativity | |
| Lenovo IdeaPad Pro 5 16IMH G9 RTX 4050 | |
| Durchschnittliche Intel Core Ultra 9 185H, NVIDIA GeForce RTX 4050 Laptop GPU (2037 - 2038, n=2) | |
| Asus Zenbook S 16 UM5606-RK333W | |
| Samsung Galaxy Book4 Ultra | |
| Dell Inspiron 16 7640 2-in-1 | |
| Lenovo IdeaPad Pro 5 16IMH G9 | |
| HP Envy x360 2-in-1 16-ad0097nr | |
| CrossMark / Responsiveness | |
| Samsung Galaxy Book4 Ultra | |
| Durchschnittliche Intel Core Ultra 9 185H, NVIDIA GeForce RTX 4050 Laptop GPU (1419 - 1493, n=2) | |
| Lenovo IdeaPad Pro 5 16IMH G9 RTX 4050 | |
| Asus Zenbook S 16 UM5606-RK333W | |
| Dell Inspiron 16 7640 2-in-1 | |
| HP Envy x360 2-in-1 16-ad0097nr | |
| Lenovo IdeaPad Pro 5 16IMH G9 | |
| WebXPRT 3 / Overall | |
| Asus Zenbook S 16 UM5606-RK333W | |
| Lenovo IdeaPad Pro 5 16IMH G9 RTX 4050 | |
| HP Envy x360 2-in-1 16-ad0097nr | |
| Durchschnittliche Intel Core Ultra 9 185H, NVIDIA GeForce RTX 4050 Laptop GPU (293 - 301, n=2) | |
| Lenovo IdeaPad Pro 5 16IMH G9 | |
| Dell Inspiron 16 7640 2-in-1 | |
| Samsung Galaxy Book4 Ultra | |
| WebXPRT 4 / Overall | |
| Lenovo IdeaPad Pro 5 16IMH G9 RTX 4050 | |
| Durchschnittliche Intel Core Ultra 9 185H, NVIDIA GeForce RTX 4050 Laptop GPU (268 - 271, n=2) | |
| Asus Zenbook S 16 UM5606-RK333W | |
| Lenovo IdeaPad Pro 5 16IMH G9 | |
| Samsung Galaxy Book4 Ultra | |
| Dell Inspiron 16 7640 2-in-1 | |
| HP Envy x360 2-in-1 16-ad0097nr | |
| Mozilla Kraken 1.1 / Total | |
| HP Envy x360 2-in-1 16-ad0097nr | |
| Dell Inspiron 16 7640 2-in-1 | |
| Lenovo IdeaPad Pro 5 16IMH G9 | |
| Durchschnittliche Intel Core Ultra 9 185H, NVIDIA GeForce RTX 4050 Laptop GPU (498 - 512, n=2) | |
| Lenovo IdeaPad Pro 5 16IMH G9 RTX 4050 | |
| Asus Zenbook S 16 UM5606-RK333W | |
| Samsung Galaxy Book4 Ultra | |
* ... kleinere Werte sind besser
| PCMark 10 Score | 7431 Punkte | |
Hilfe | ||
| AIDA64 / Memory Copy | |
| Lenovo IdeaPad Pro 5 16IMH G9 RTX 4050 | |
| Lenovo IdeaPad Pro 5 16IMH G9 | |
| Samsung Galaxy Book4 Ultra | |
| Asus Zenbook S 16 UM5606-RK333W | |
| Durchschnittliche Intel Core Ultra 9 185H (69929 - 95718, n=19) | |
| Dell Inspiron 16 7640 2-in-1 | |
| HP Envy x360 2-in-1 16-ad0097nr | |
| AIDA64 / Memory Read | |
| Asus Zenbook S 16 UM5606-RK333W | |
| Samsung Galaxy Book4 Ultra | |
| Lenovo IdeaPad Pro 5 16IMH G9 RTX 4050 | |
| Lenovo IdeaPad Pro 5 16IMH G9 | |
| Durchschnittliche Intel Core Ultra 9 185H (64619 - 87768, n=19) | |
| Dell Inspiron 16 7640 2-in-1 | |
| HP Envy x360 2-in-1 16-ad0097nr | |
| AIDA64 / Memory Write | |
| Asus Zenbook S 16 UM5606-RK333W | |
| HP Envy x360 2-in-1 16-ad0097nr | |
| Dell Inspiron 16 7640 2-in-1 | |
| Lenovo IdeaPad Pro 5 16IMH G9 | |
| Samsung Galaxy Book4 Ultra | |
| Lenovo IdeaPad Pro 5 16IMH G9 RTX 4050 | |
| Durchschnittliche Intel Core Ultra 9 185H (51114 - 93871, n=19) | |
| AIDA64 / Memory Latency | |
| Durchschnittliche Intel Core Ultra 9 185H (121.4 - 259, n=19) | |
| Dell Inspiron 16 7640 2-in-1 | |
| Samsung Galaxy Book4 Ultra | |
| Lenovo IdeaPad Pro 5 16IMH G9 | |
| Lenovo IdeaPad Pro 5 16IMH G9 RTX 4050 | |
| HP Envy x360 2-in-1 16-ad0097nr | |
| Asus Zenbook S 16 UM5606-RK333W | |
* ... kleinere Werte sind besser
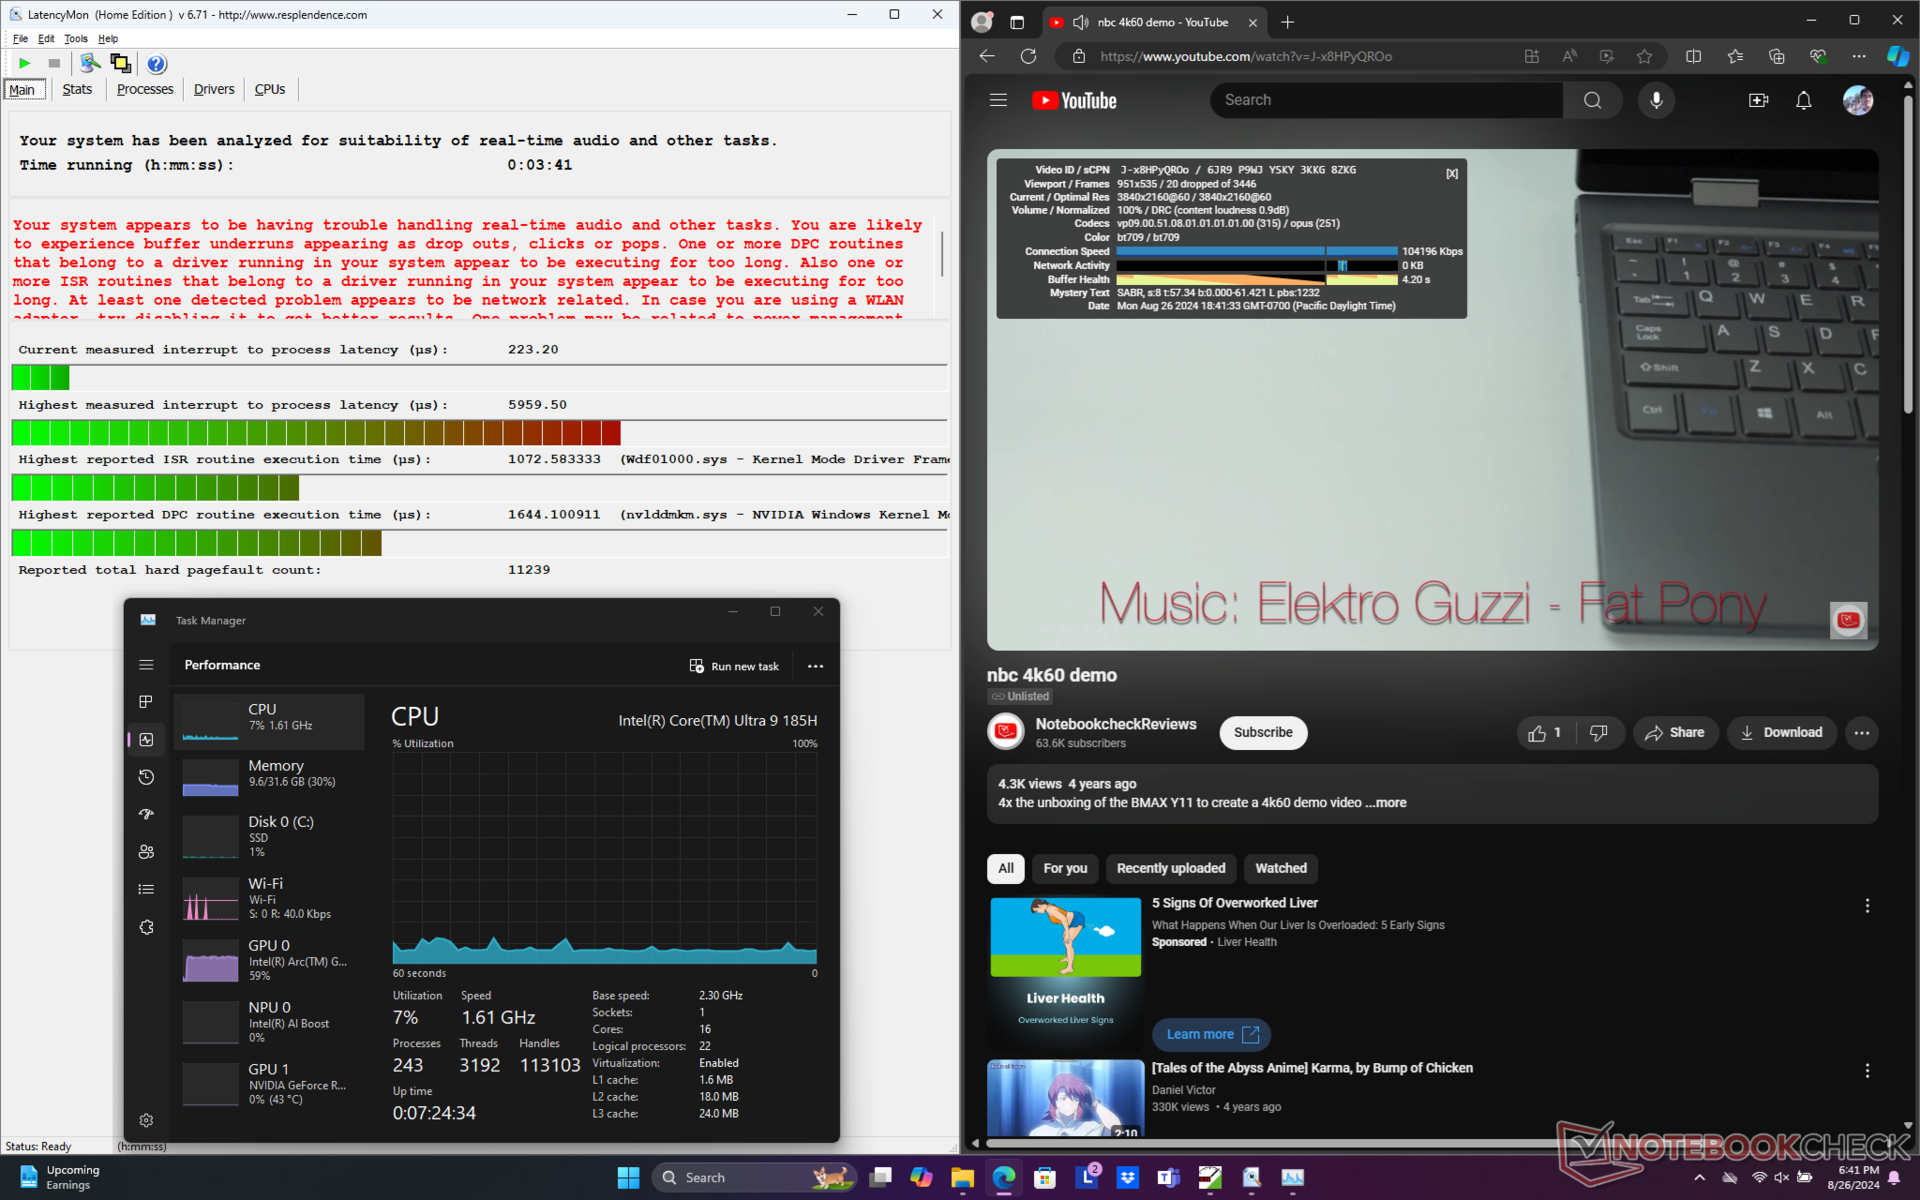
DPC-Latenzen
LatencyMon zeigt sowohl DPC-Probleme als auch unvollständige 4K-Videowiedergabe bei 60 FPS. Innerhalb einer Minute konnten wir 20 Bildaussetzer feststellen, die sich beim Videostreaming als Ruckler bemerkbar machen. Dies ist enttäuschend, da die iGPU-Konfiguration im Vergleich keine Bildausfälle aufweist.

| DPC Latencies / LatencyMon - interrupt to process latency (max), Web, Youtube, Prime95 | |
| Lenovo IdeaPad Pro 5 16IMH G9 RTX 4050 | |
| HP Envy x360 2-in-1 16-ad0097nr | |
| Dell Inspiron 16 7640 2-in-1 | |
| Lenovo IdeaPad Pro 5 16IMH G9 | |
| Samsung Galaxy Book4 Ultra | |
* ... kleinere Werte sind besser
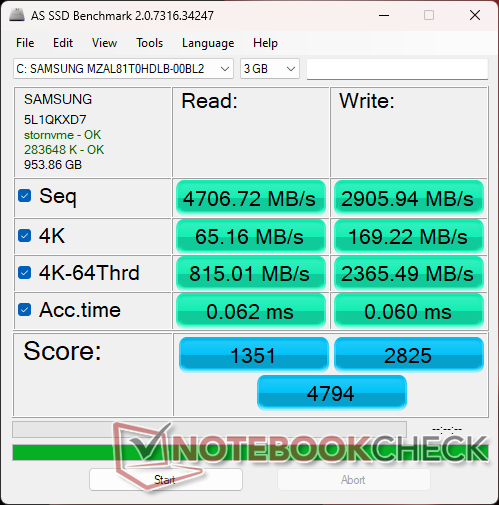
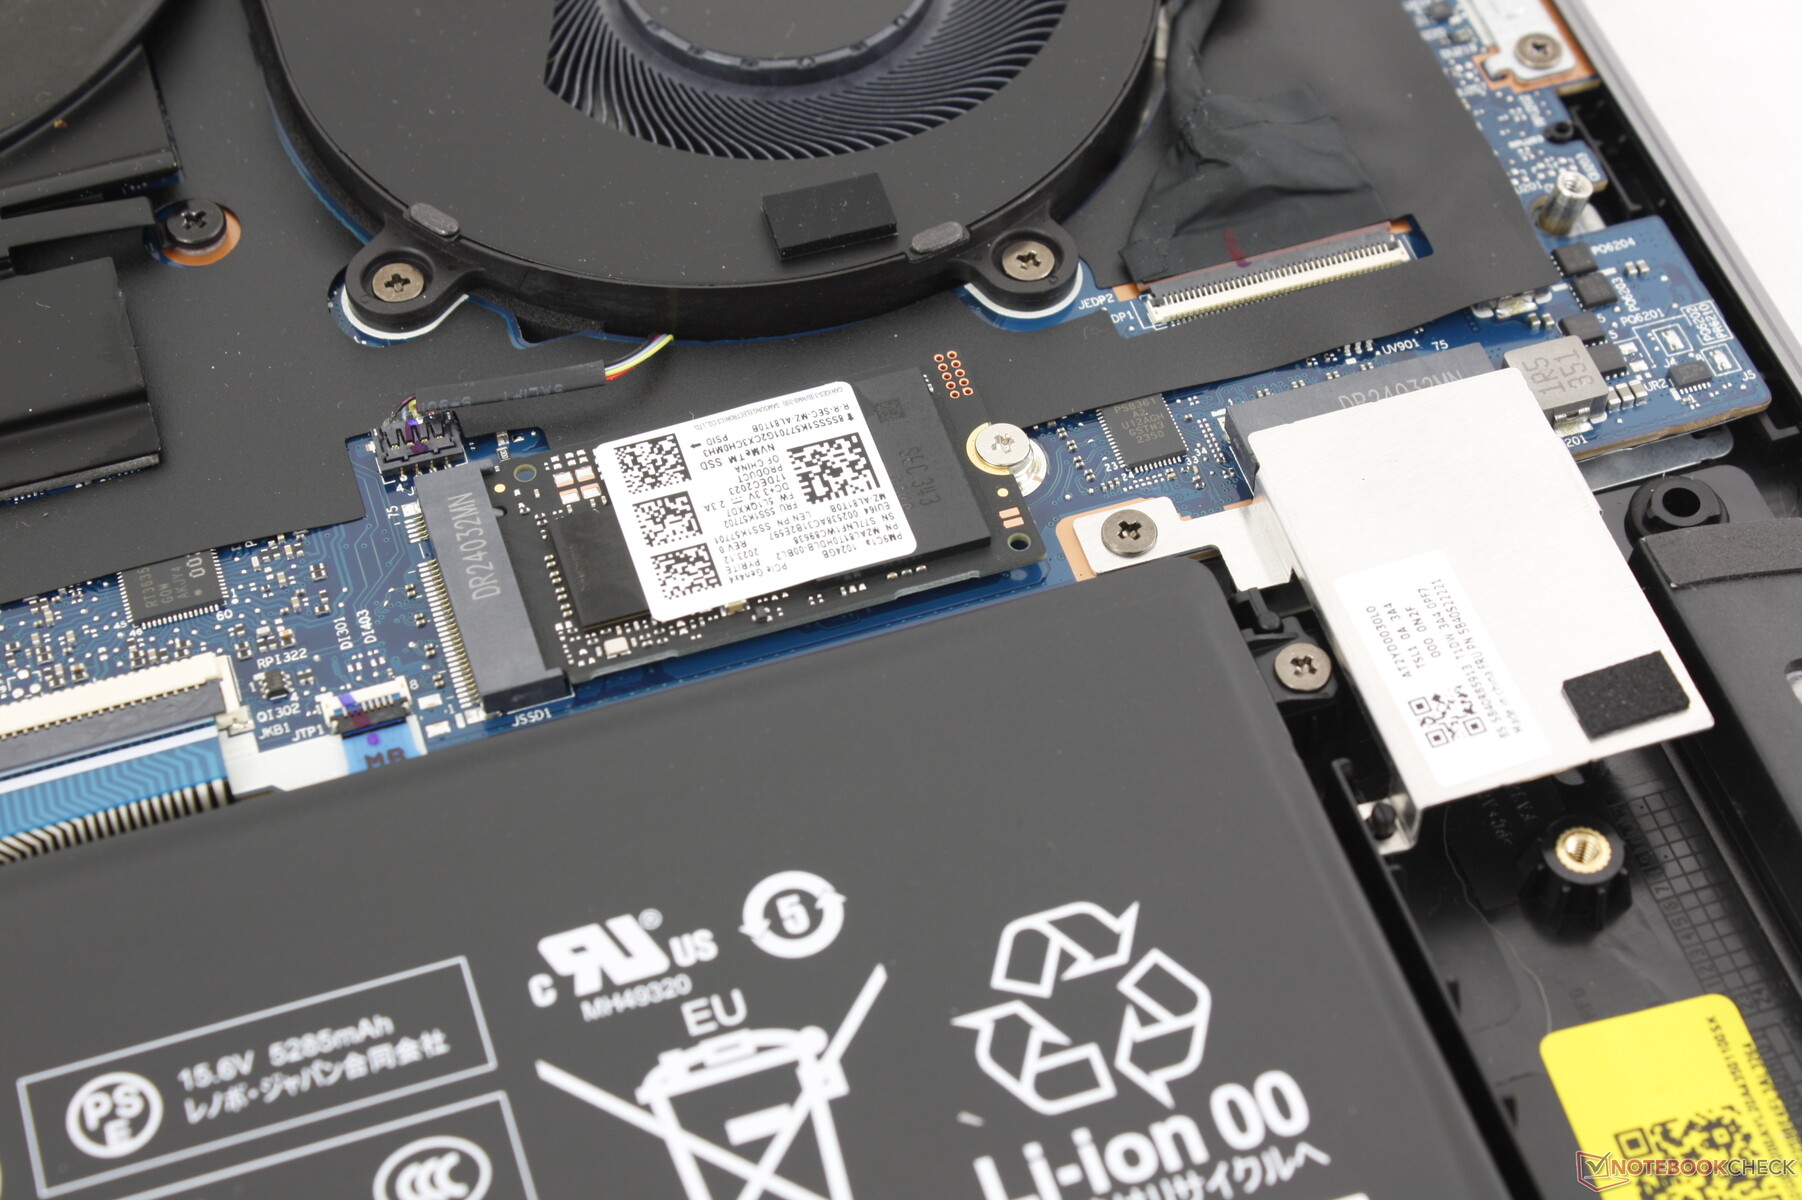
Storage Devices
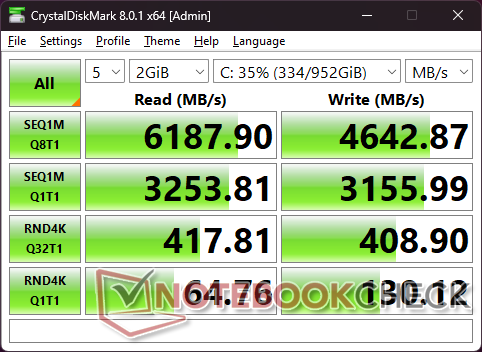
Das System wird mit gleichen Samsung PM9C1a MZAL81T0HDLB-Laufwerk ausgeliefert wie die iGPU-Version. Interessanterweise zeigt es die üblichen Besonderheiten bei den Übertragungsraten: Nach einigen Minuten in unserem DiskSpd-Schleifentest springt die Leistung von 5100 MB/s auf 6100 MB/s. Im Vergleich dazu blieben die meisten anderen Laufwerke, wie das Samsung PM9A1 im Galaxy Book4 Ultra, von Anfang bis Ende konstant.
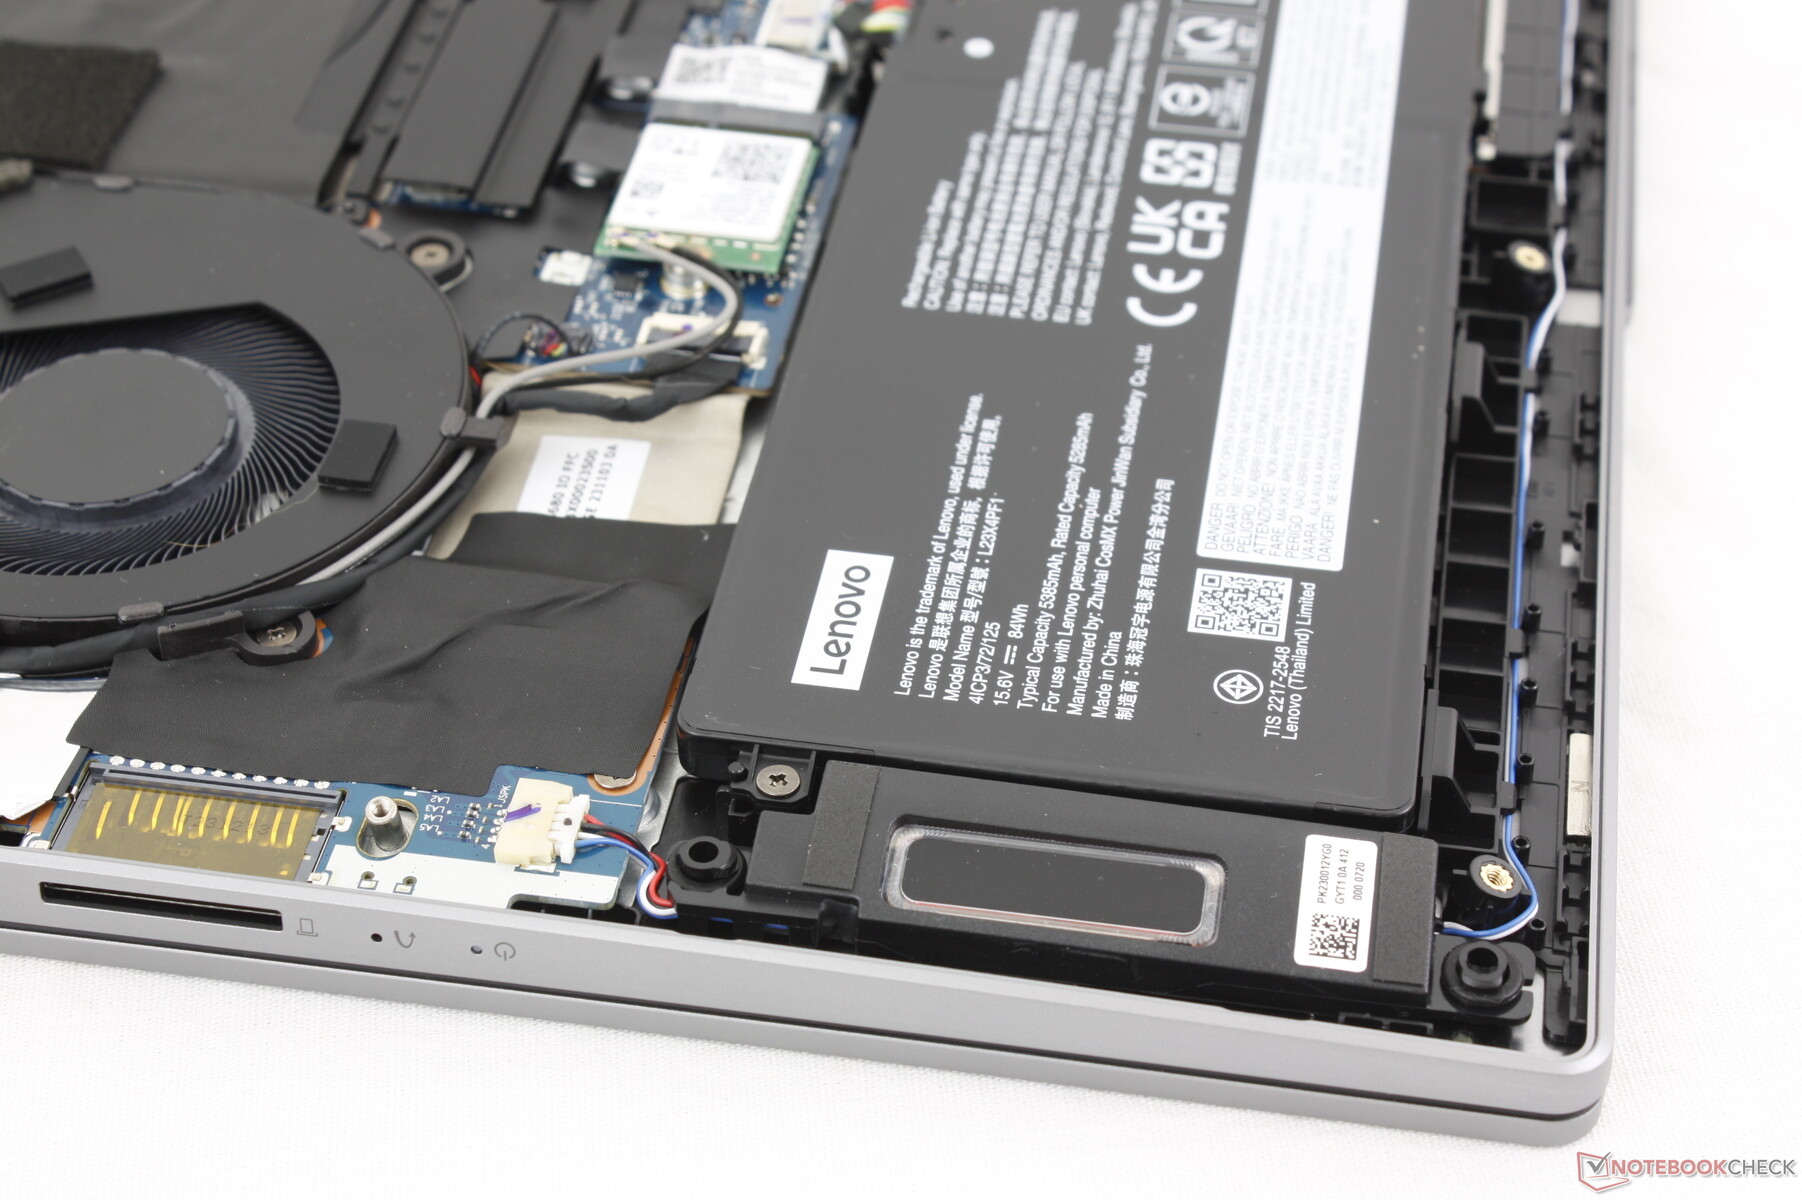
Für die primäre SSD ist ein Wärmeleitpad vorgesehen, das die Wärme an die darunter liegende Metallabdeckung ableitet.

* ... kleinere Werte sind besser
Dauerleistung Lesen: DiskSpd Read Loop, Queue Depth 8
GPU Performance — Der 90-W-Unterschied
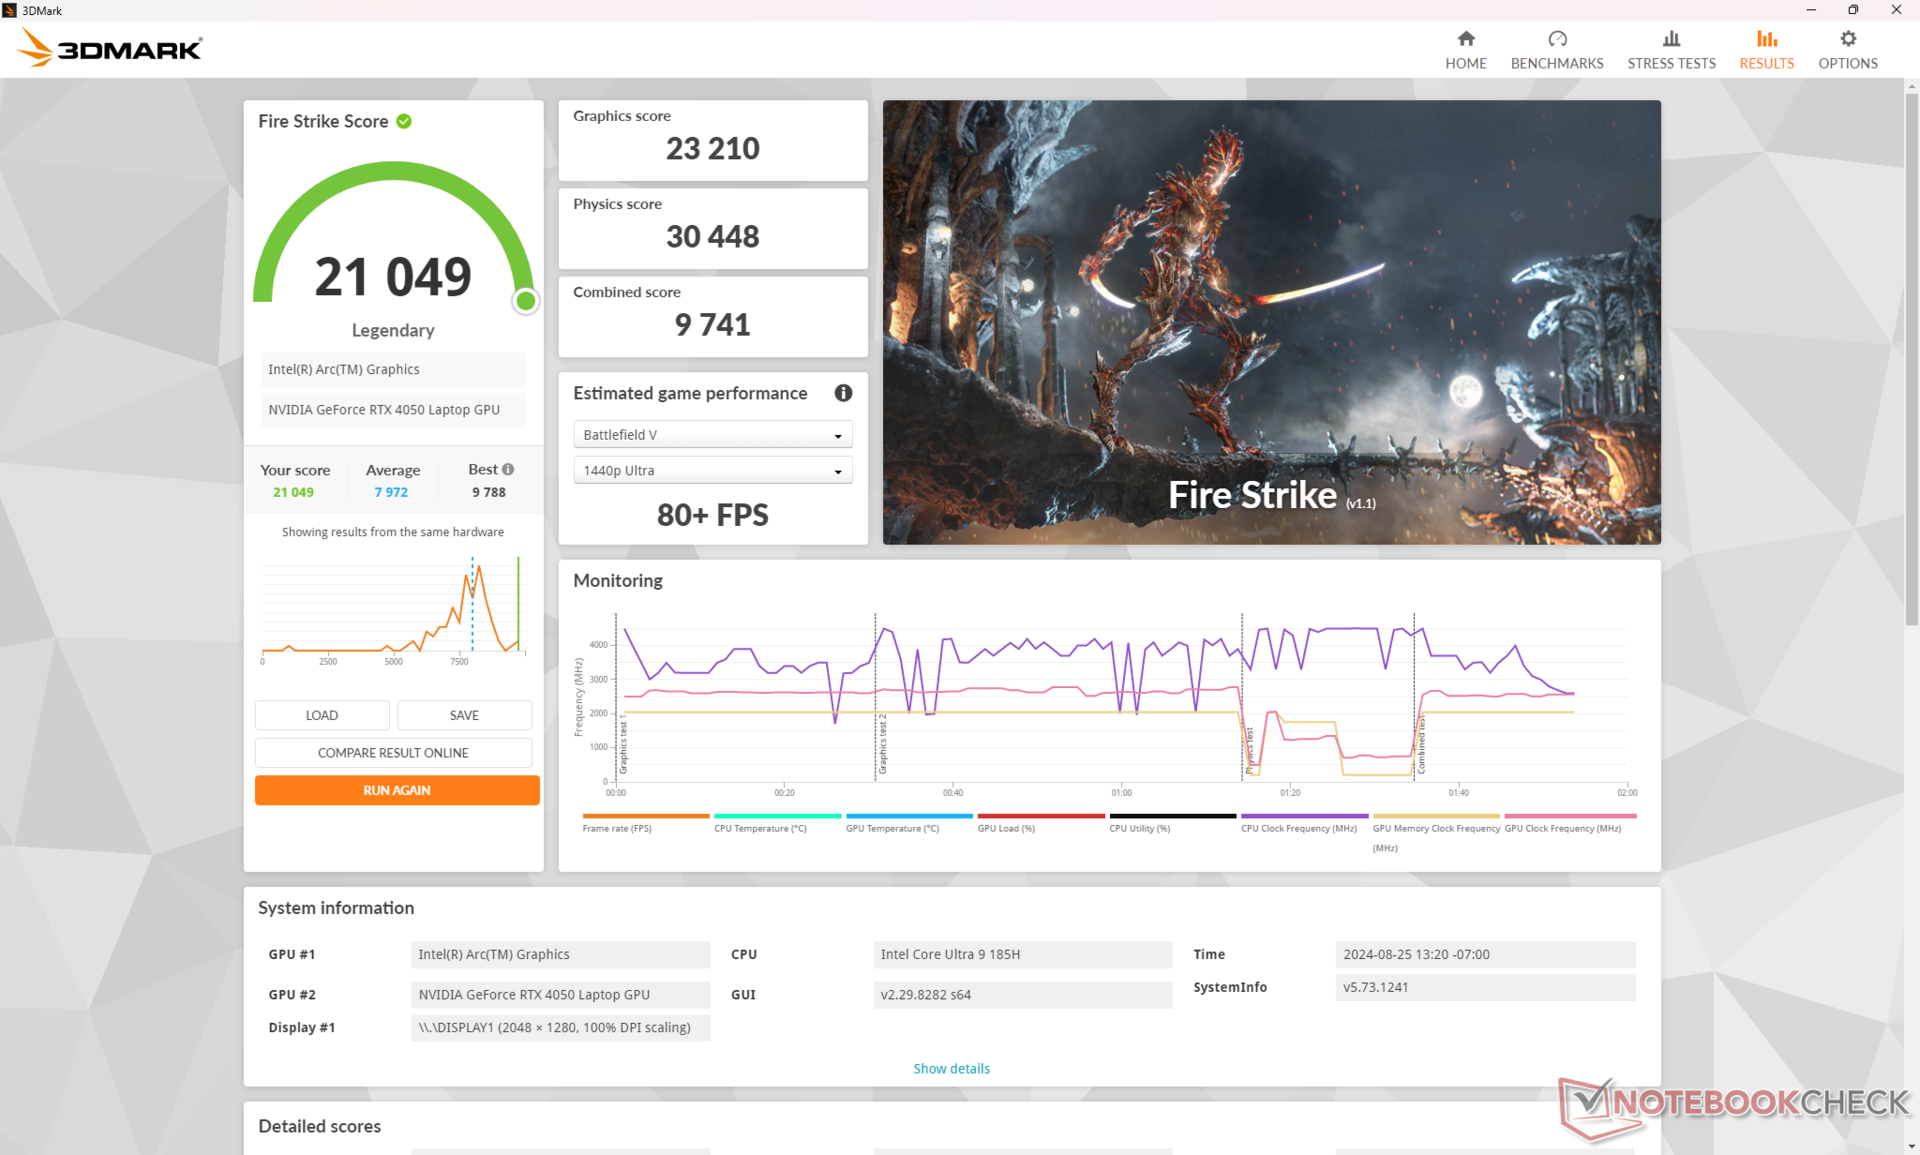
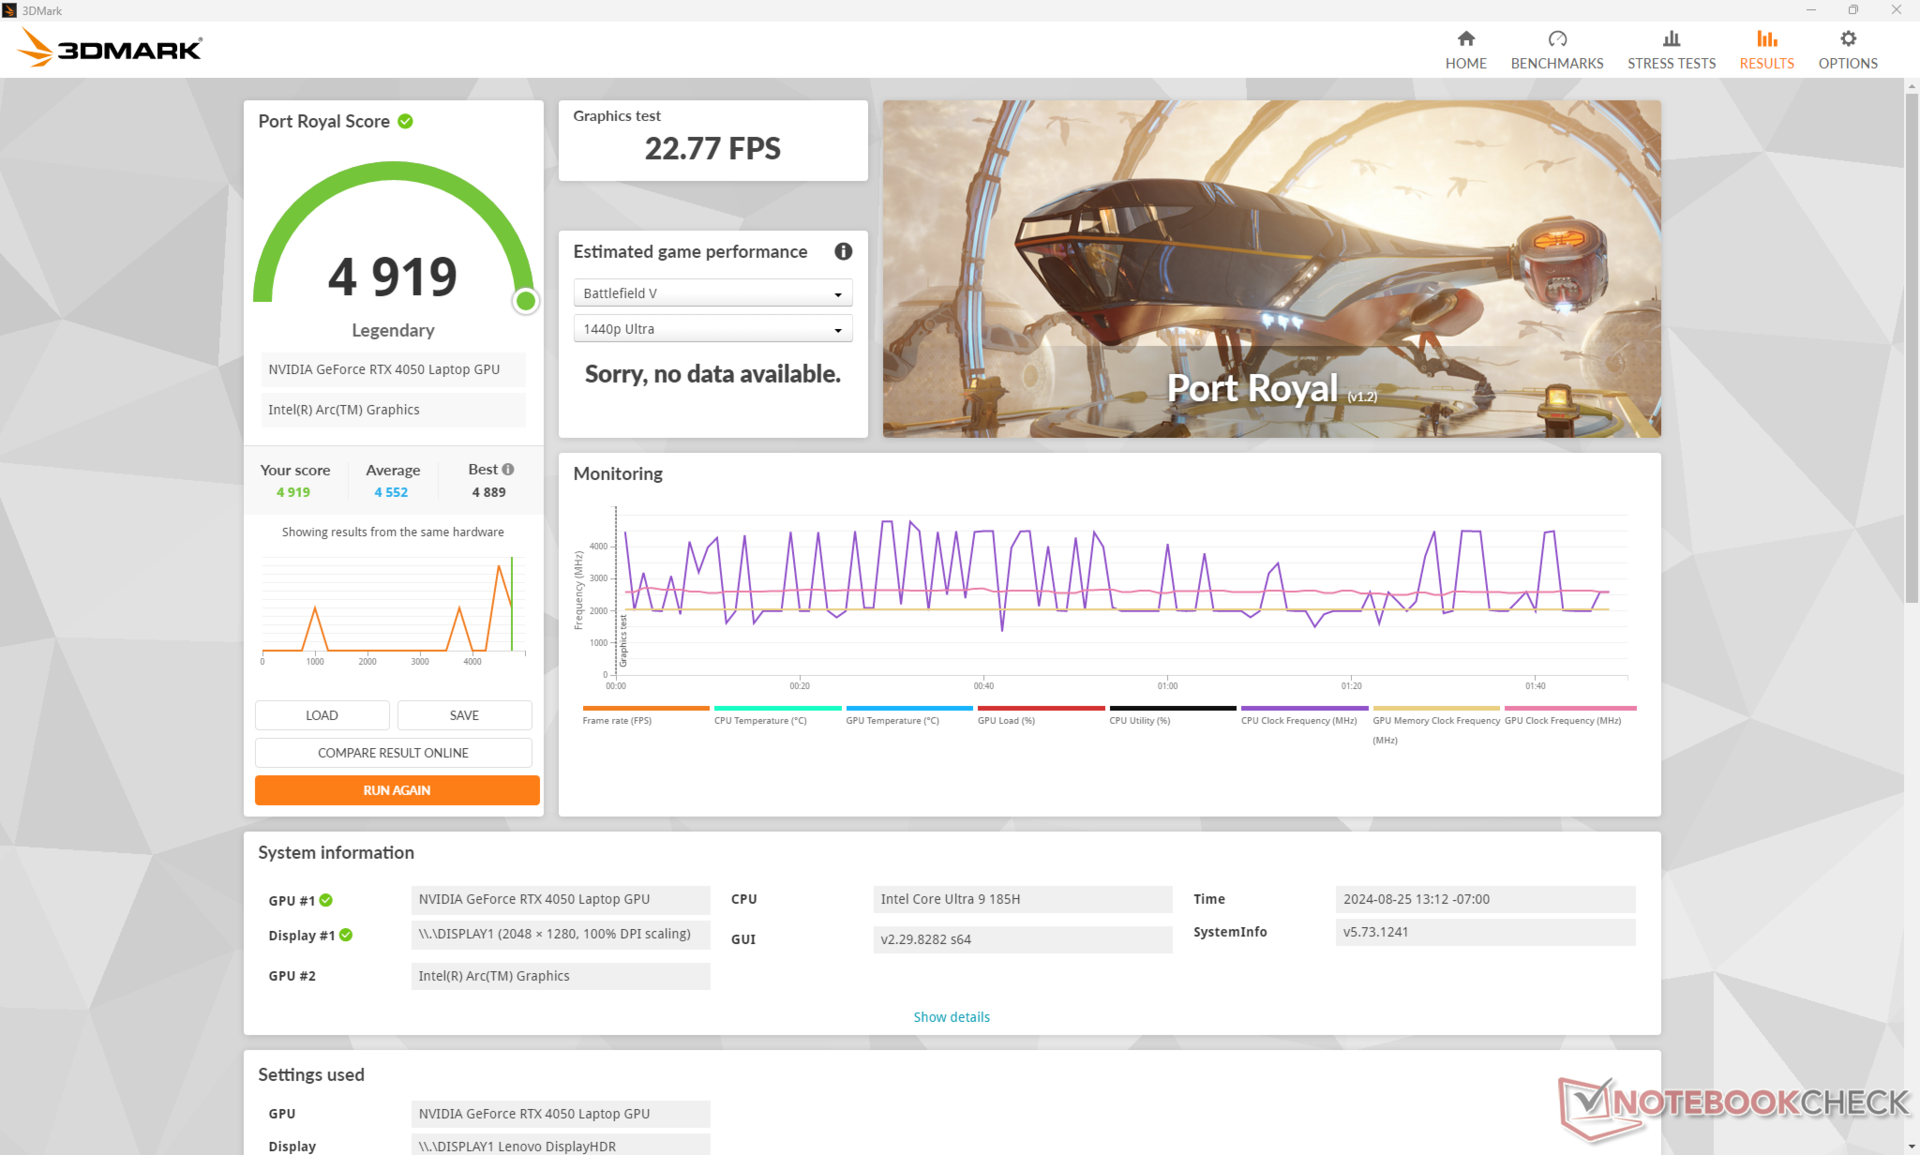
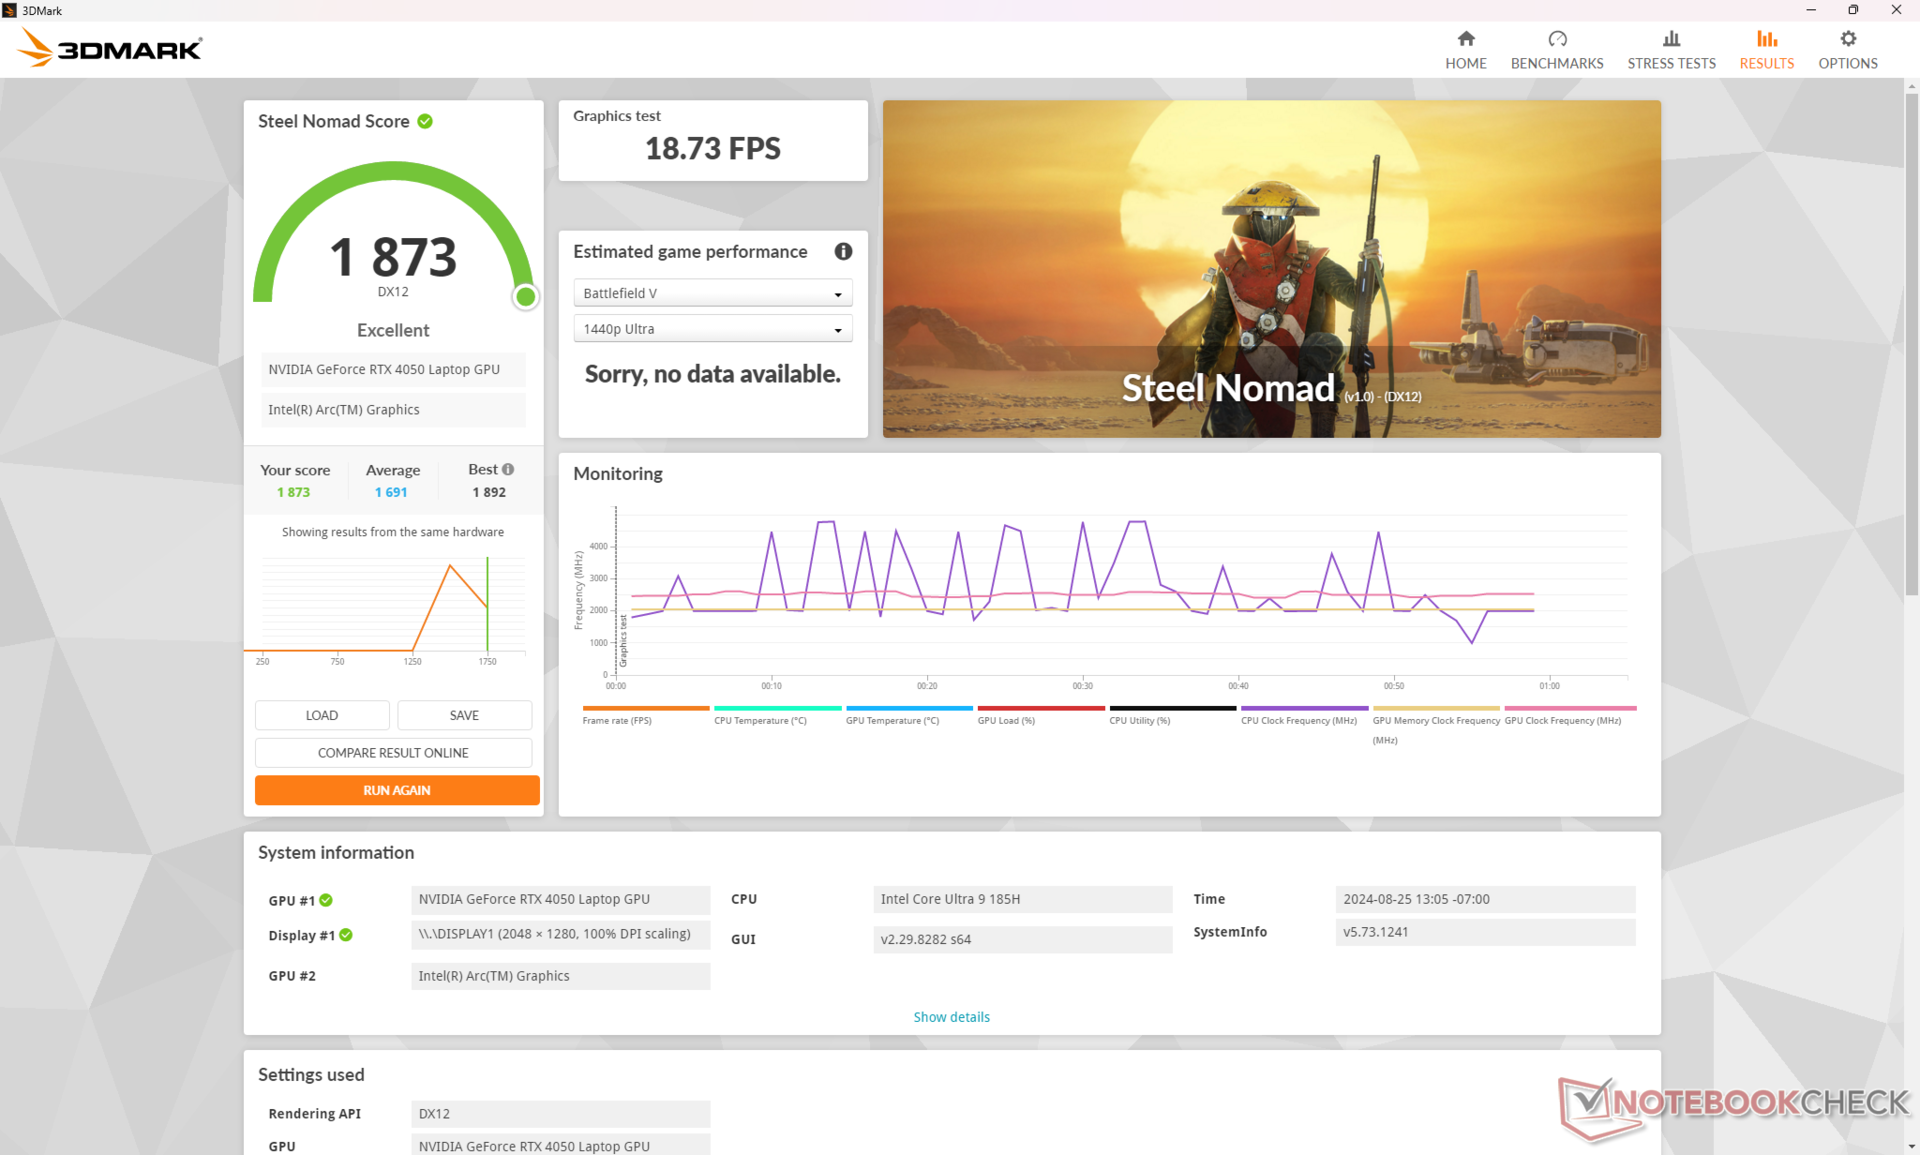
Die 90-W-GeForce RTX 4050 GPU zielt auf eine höhere TGP-Obergrenze an als bei vielen anderen Nicht-Gaming-Notebooks, die ebenfalls mit dieser GPU-Option ausgestattet sind. Beispielsweise haben die RTX 4050 im Spectre x360 16 und im Samsung Galaxy Book3 Ultra 16 niedrigere TGP-Werte von nur 55 W bzw. 60 W. Daher kann die GPU in unserem IdeaPad Pro 5 16 G9 bis zu 10 % schneller sein als der Durchschnitt der Laptops in unserer Datenbank mit der gleichen RTX 4050 GPU. Dieser Unterschied reicht laut 3DMark-Benchmarks sogar aus, um die 70-W-RTX 4060 im konkurrierenden Inspiron 16 Plus 7640 durchweg zu übertreffen.
Nutzer, die von der älteren GeForce RTX 3050, wie sie im IdeaPad Pro 5 16 G7 oder G8 der letzten Generation verbaut war, auf die RTX 4050 upgraden, können mit einer deutlichen Leistungssteigerung von 70 bis 80 Prozent rechnen. Bei einem Upgrade von der integrierten Arc 8-Konfiguration sind die Vorteile mit 2 bis 2,5 Prozent noch spürbarer.
| Energieprofile | Grafikleistung | CPU-Leistung | Gesamtwert |
| Performance-Modus | 23210 | 30448 | 9741 |
| Balanced-Modus | 21032 (-9%) | 30008 (-1%) | 8158 (-16%) |
| Battery Power | 19718 (-15%) | 30484 (-0%) | 8216 (-16%) |
Der Wechsel vom Performance-Modus zum Balanced-Modus kann die Grafikleistung um bis zu 10 Prozent reduzieren, während die CPU-Leistung laut unserer Fire-Strike-Ergebnistabelle weitgehend konstant bleibt. Im Akkubetrieb zeigt sich die Auswirkung auf die Prozessorleistung nicht so stark, wie wir ursprünglich erwartet hatten.
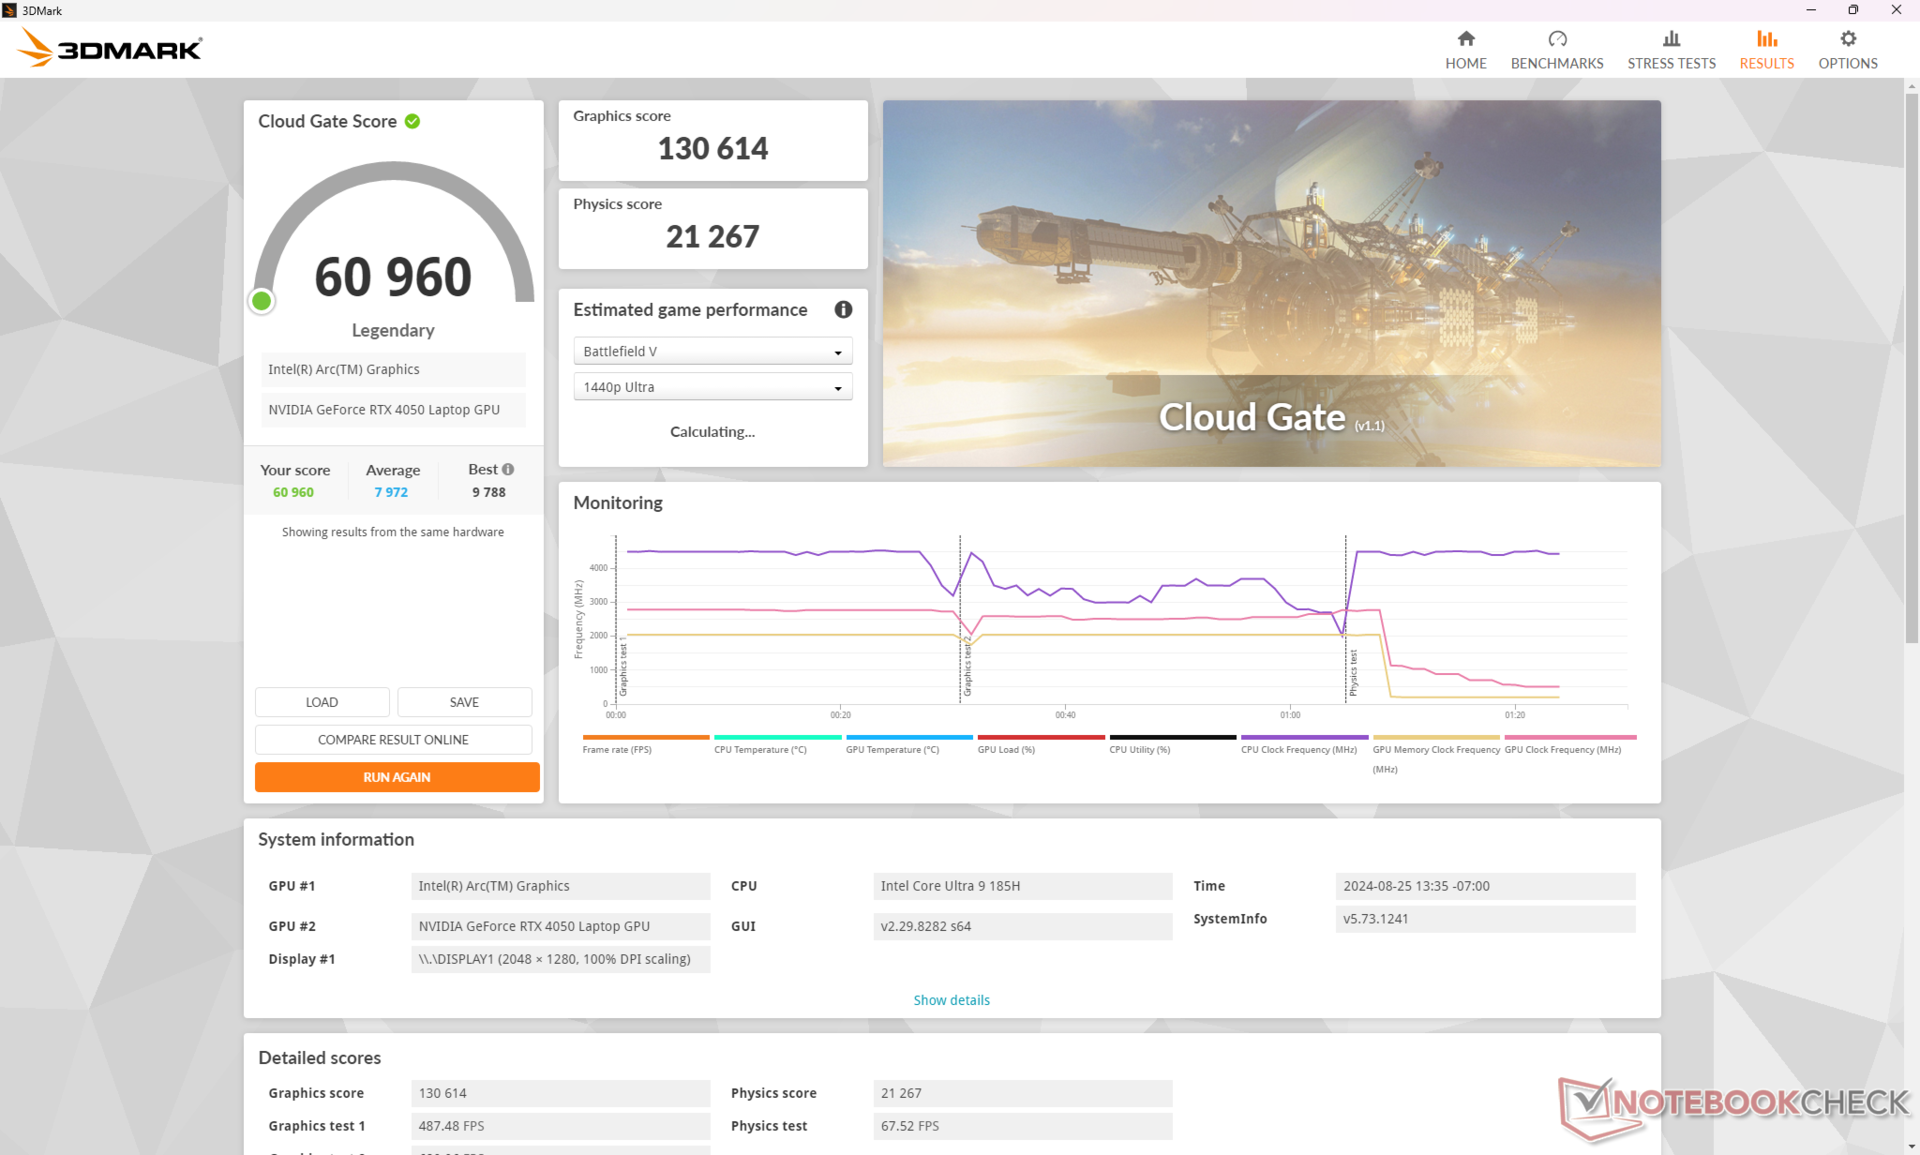

| 3DMark 11 Performance | 27986 Punkte | |
| 3DMark Cloud Gate Standard Score | 60960 Punkte | |
| 3DMark Fire Strike Score | 21049 Punkte | |
| 3DMark Time Spy Score | 8963 Punkte | |
| 3DMark Steel Nomad Score | 1873 Punkte | |
Hilfe | ||
* ... kleinere Werte sind besser
Gaming Performance
Obwohl es sich nicht ausdrücklich um ein Gaming-Notebook handelt, ermöglicht die 90-Watt-RTX-4050 dem Lenovo, Spiele besser als erwartet auszuführen. Titel wie Final Fantasy XV, Cyberpunk 2077 und Tiny Tina's Wonderlands laufen etwa 25 bis 30 Prozent schneller als auf dem HP Spectre x360 16 mit der gleichen RTX 4050 GPU. Unser System übertrifft sogar das Inspiron 16 Plus 7640 mit seiner 70-Watt-RTX-4060-GPU, wie die oben genannten 3DMark-Ergebnisse zeigen. In diesem Szenario bietet die niedrigere native Auflösung des OLED-Panels einen Vorteil für ein flüssigeres Spielerlebnis im Vergleich zum 1600p-IPS-Panel.
| GTA V - 1920x1080 Highest AA:4xMSAA + FX AF:16x | |
| Lenovo IdeaPad Pro 5 16IMH G9 RTX 4050 | |
| Samsung Galaxy Book4 Ultra | |
| Asus Zenbook S 16 UM5606-RK333W | |
| Lenovo IdeaPad Pro 5 16IMH G9 | |
| Final Fantasy XV Benchmark - 1920x1080 High Quality | |
| Lenovo IdeaPad Pro 5 16IMH G9 RTX 4050 | |
| Samsung Galaxy Book4 Ultra | |
| Lenovo IdeaPad Pro 5 16IMH G9 | |
| Asus Zenbook S 16 UM5606-RK333W | |
| Dell Inspiron 16 7640 2-in-1 | |
| HP Envy x360 2-in-1 16-ad0097nr | |
| Strange Brigade - 1920x1080 ultra AA:ultra AF:16 | |
| Lenovo IdeaPad Pro 5 16IMH G9 RTX 4050 | |
| Samsung Galaxy Book4 Ultra | |
| Lenovo IdeaPad Pro 5 16IMH G9 | |
| Asus Zenbook S 16 UM5606-RK333W | |
| Dell Inspiron 16 7640 2-in-1 | |
| HP Envy x360 2-in-1 16-ad0097nr | |
| Dota 2 Reborn - 1920x1080 ultra (3/3) best looking | |
| Lenovo IdeaPad Pro 5 16IMH G9 RTX 4050 | |
| Samsung Galaxy Book4 Ultra | |
| Lenovo IdeaPad Pro 5 16IMH G9 | |
| Dell Inspiron 16 7640 2-in-1 | |
| HP Envy x360 2-in-1 16-ad0097nr | |
| Asus Zenbook S 16 UM5606-RK333W | |
Cyberpunk 2077 Ultra FPS-Diagramm
| min. | mittel | hoch | max. | |
|---|---|---|---|---|
| GTA V (2015) | 183 | 178.4 | 166.9 | 98.7 |
| Dota 2 Reborn (2015) | 167.2 | 151.9 | 145.9 | 137.4 |
| Final Fantasy XV Benchmark (2018) | 171.3 | 123.3 | 87.8 | |
| X-Plane 11.11 (2018) | 127.7 | 114.1 | 89 | |
| Far Cry 5 (2018) | 155 | 129 | 120 | 113 |
| Strange Brigade (2018) | 411 | 204 | 172.9 | 149.4 |
| Tiny Tina's Wonderlands (2022) | 181.6 | 149.2 | 96 | 74 |
| F1 22 (2022) | 211 | 204 | 156.6 | 54.1 |
| Baldur's Gate 3 (2023) | 110.1 | 91.4 | 81.3 | 78.6 |
| Cyberpunk 2077 (2023) | 103.1 | 82.2 | 69.4 | 59.8 |
Emissionen — Laut und heiß unter Last
Geräuschemissionen
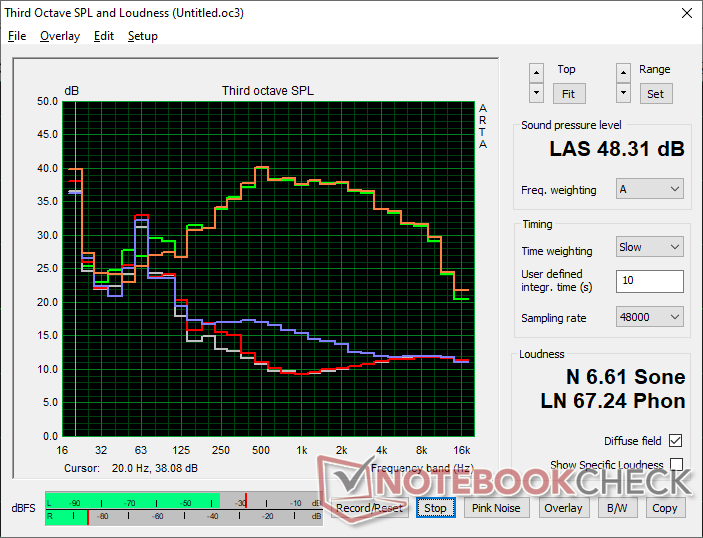
Das Lüftergeräusch bleibt bei weniger anspruchsvollen Anwendungen wie Browsern oder Textverarbeitungssoftware ruhig, ohne störendes Pulsieren oder plötzliche Geräuschspitzen. Bei intensiven Lasten wie 3DMark 06 liegt das Lüftergeräusch während der meisten Zeit der ersten Benchmark-Szene konstant bei etwa 26 dB(A), bevor es auf fast 46 dB(A) ansteigt – ähnlich wie bei der iGPU-Konfiguration.
Beim Spielen erreicht das Lüftergeräusch einen Spitzenwert von knapp über 48 dB(A), was einige Dezibel lauter ist als bei der iGPU-Konfiguration. Dies ist auch deutlicher lauter als bei konkurrierenden 16-Zoll-Notebooks wie dem Inspiron 16 7640 2-in-1 oder dem Samsung Galaxy Book4 Ultra. Insgesamt ist die dGPU-Option nicht unbedingt lauter als die iGPU-Option, bis anspruchsvollere Lasten ins Spiel kommen.
Lautstärkediagramm
| Idle |
| 23 / 23.3 / 23.3 dB(A) |
| Last |
| 45.7 / 48.4 dB(A) |
 | ||
30 dB leise 40 dB(A) deutlich hörbar 50 dB(A) störend |
||
min: | ||
| Lenovo IdeaPad Pro 5 16IMH G9 RTX 4050 GeForce RTX 4050 Laptop GPU, Ultra 9 185H, Samsung PM9C1a MZAL81T0HDLB | Lenovo IdeaPad Pro 5 16IMH G9 Arc 8-Core, Ultra 7 155H, Samsung PM9C1a MZAL81T0HDLB | Dell Inspiron 16 7640 2-in-1 Arc 8-Core, Ultra 7 155H, Micron 2550 1TB | Asus Zenbook S 16 UM5606-RK333W Radeon 890M, Ryzen AI 9 HX 370, Micron 2400 MTFDKBA1T0QFM | HP Envy x360 2-in-1 16-ad0097nr Radeon 780M, R7 8840HS, KIOXIA BG5 KBG50ZNV1T02 | Samsung Galaxy Book4 Ultra GeForce RTX 4050 Laptop GPU, Ultra 7 155H, Samsung PM9A1 MZVL2512HCJQ | |
|---|---|---|---|---|---|---|
| Geräuschentwicklung | -4% | 1% | 5% | 10% | 2% | |
| aus / Umgebung * (dB) | 23 | 24.1 -5% | 22.9 -0% | 24.7 -7% | 22.9 -0% | 24.2 -5% |
| Idle min * (dB) | 23 | 24.1 -5% | 22.9 -0% | 24.7 -7% | 23 -0% | 24.2 -5% |
| Idle avg * (dB) | 23.3 | 24.1 -3% | 22.9 2% | 24.7 -6% | 23 1% | 24.2 -4% |
| Idle max * (dB) | 23.3 | 28.2 -21% | 25 -7% | 26.4 -13% | 23 1% | 24.2 -4% |
| Last avg * (dB) | 45.7 | 44.4 3% | 45.1 1% | 35.7 22% | 23.8 48% | 37.9 17% |
| Cyberpunk 2077 ultra * (dB) | 48.4 | 44.9 7% | 36.8 24% | |||
| Last max * (dB) | 48.4 | 44.4 8% | 44.9 7% | 36.8 24% | 43.8 10% | 41.7 14% |
| Witcher 3 ultra * (dB) | 36.5 | 43.8 | 41.7 |
* ... kleinere Werte sind besser
Temperatur
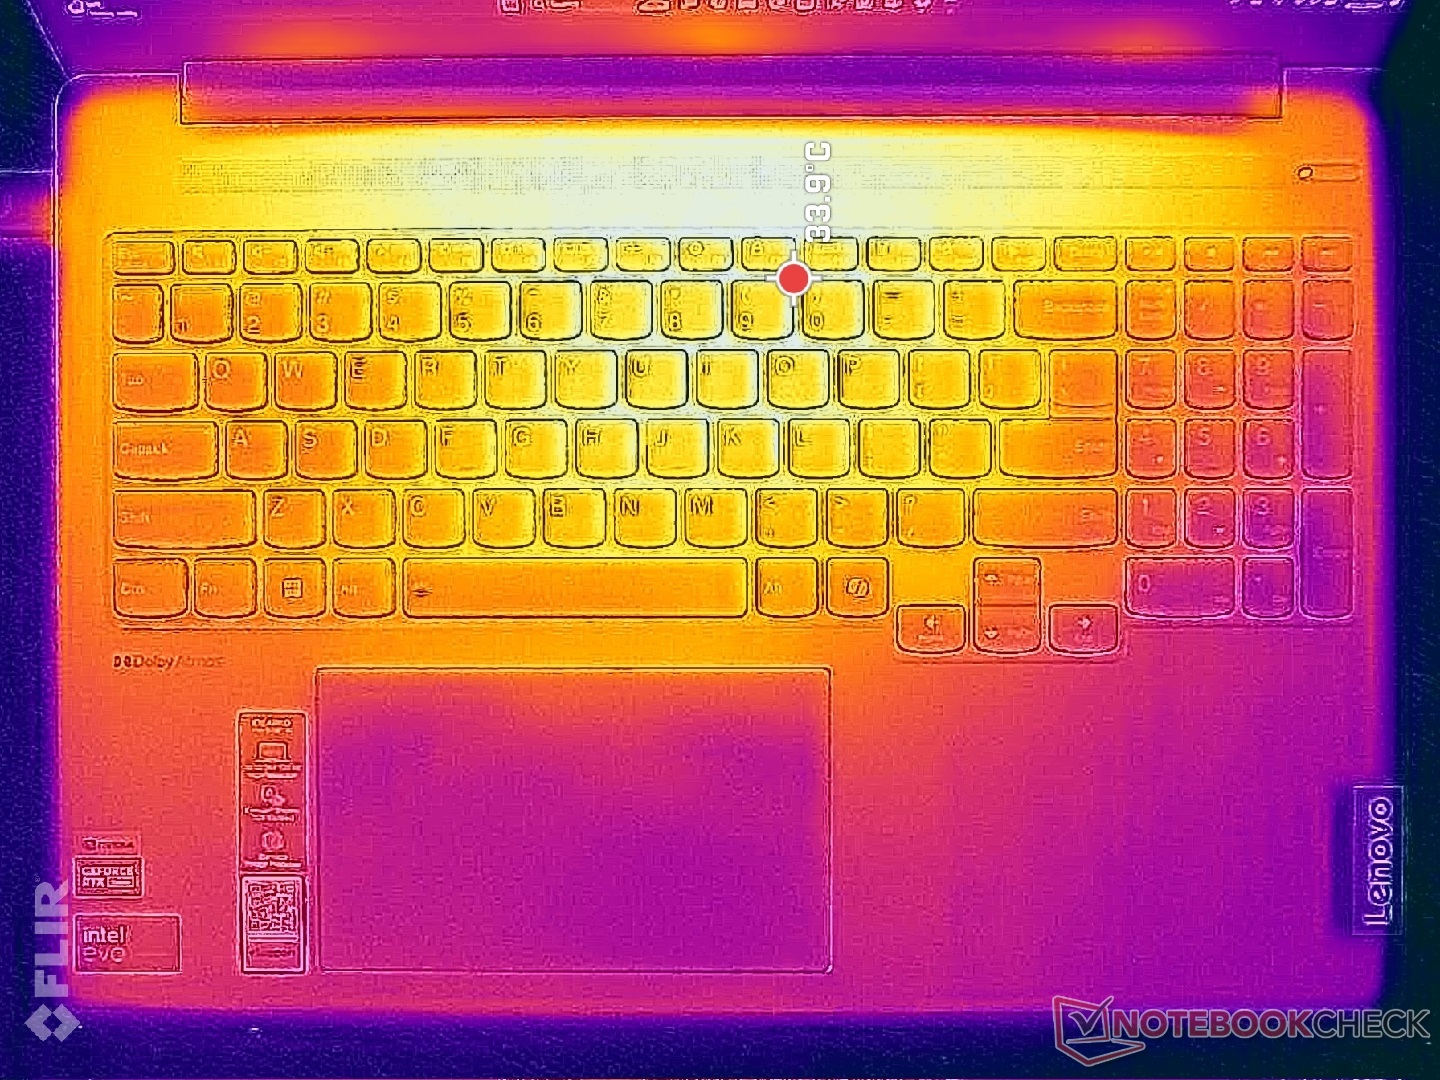
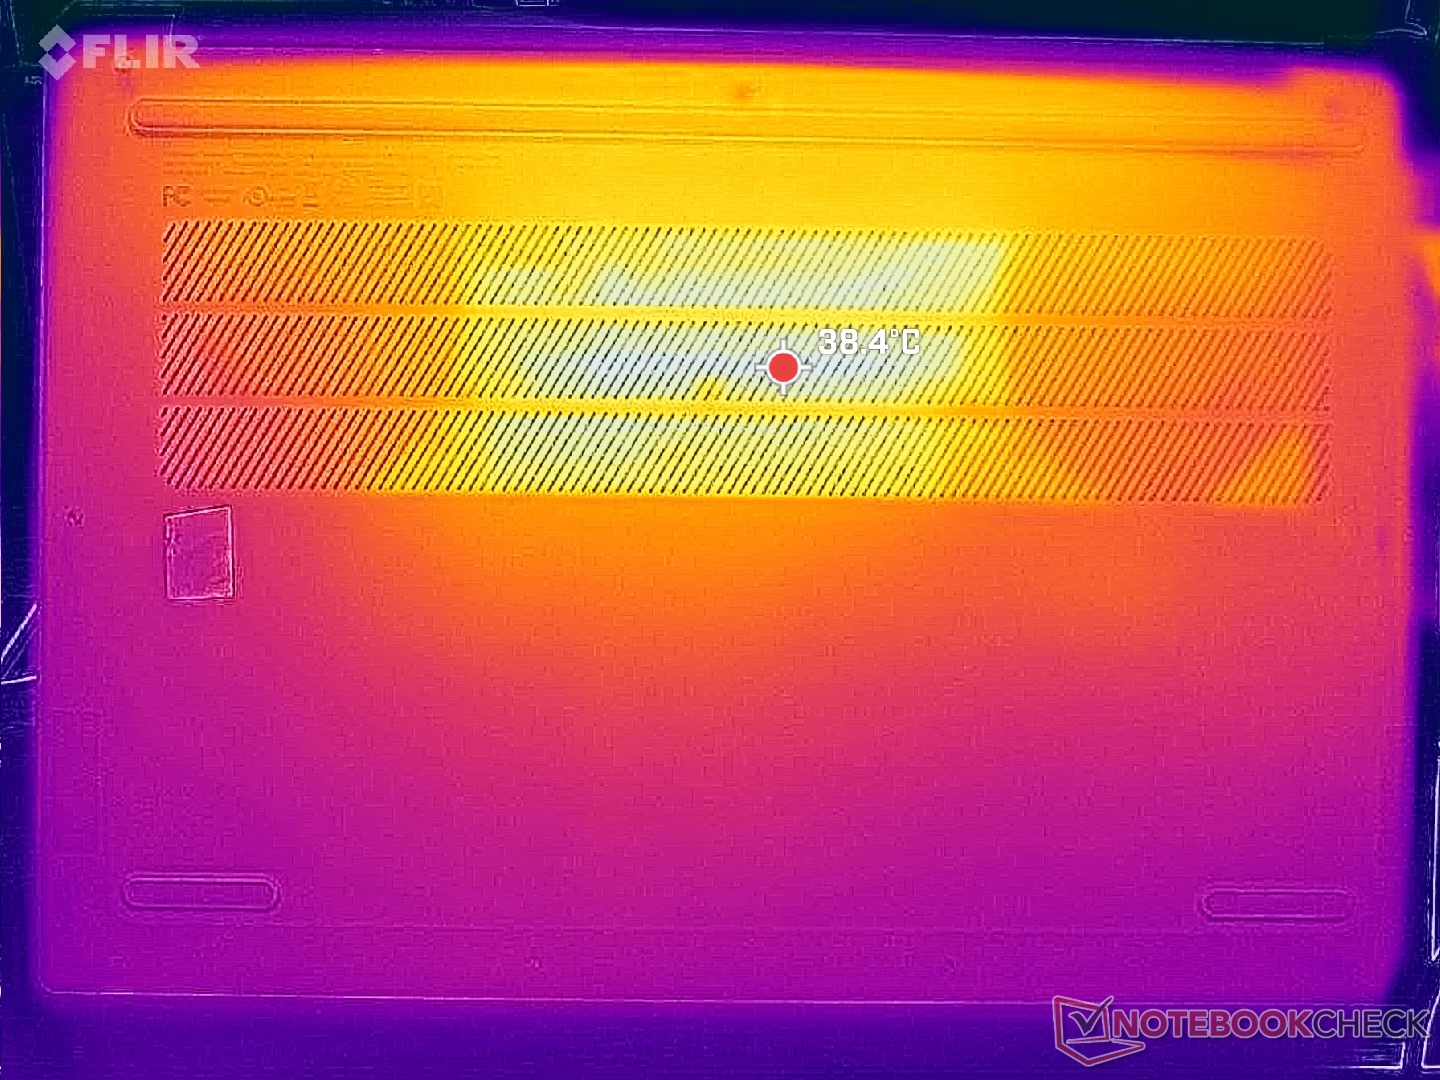
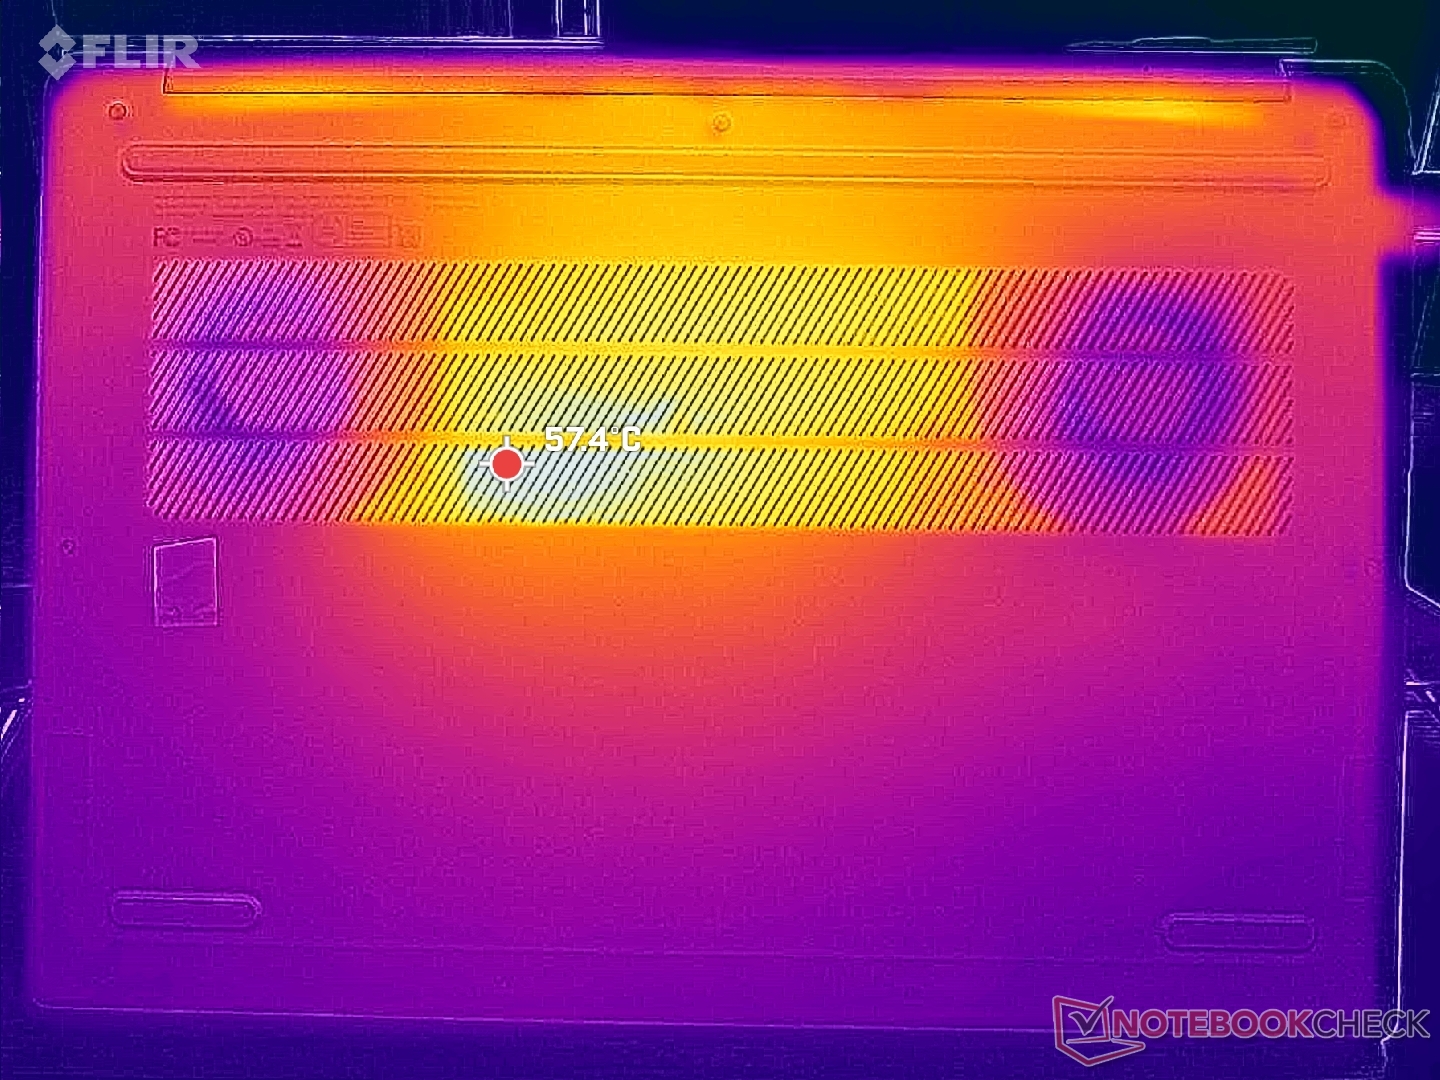
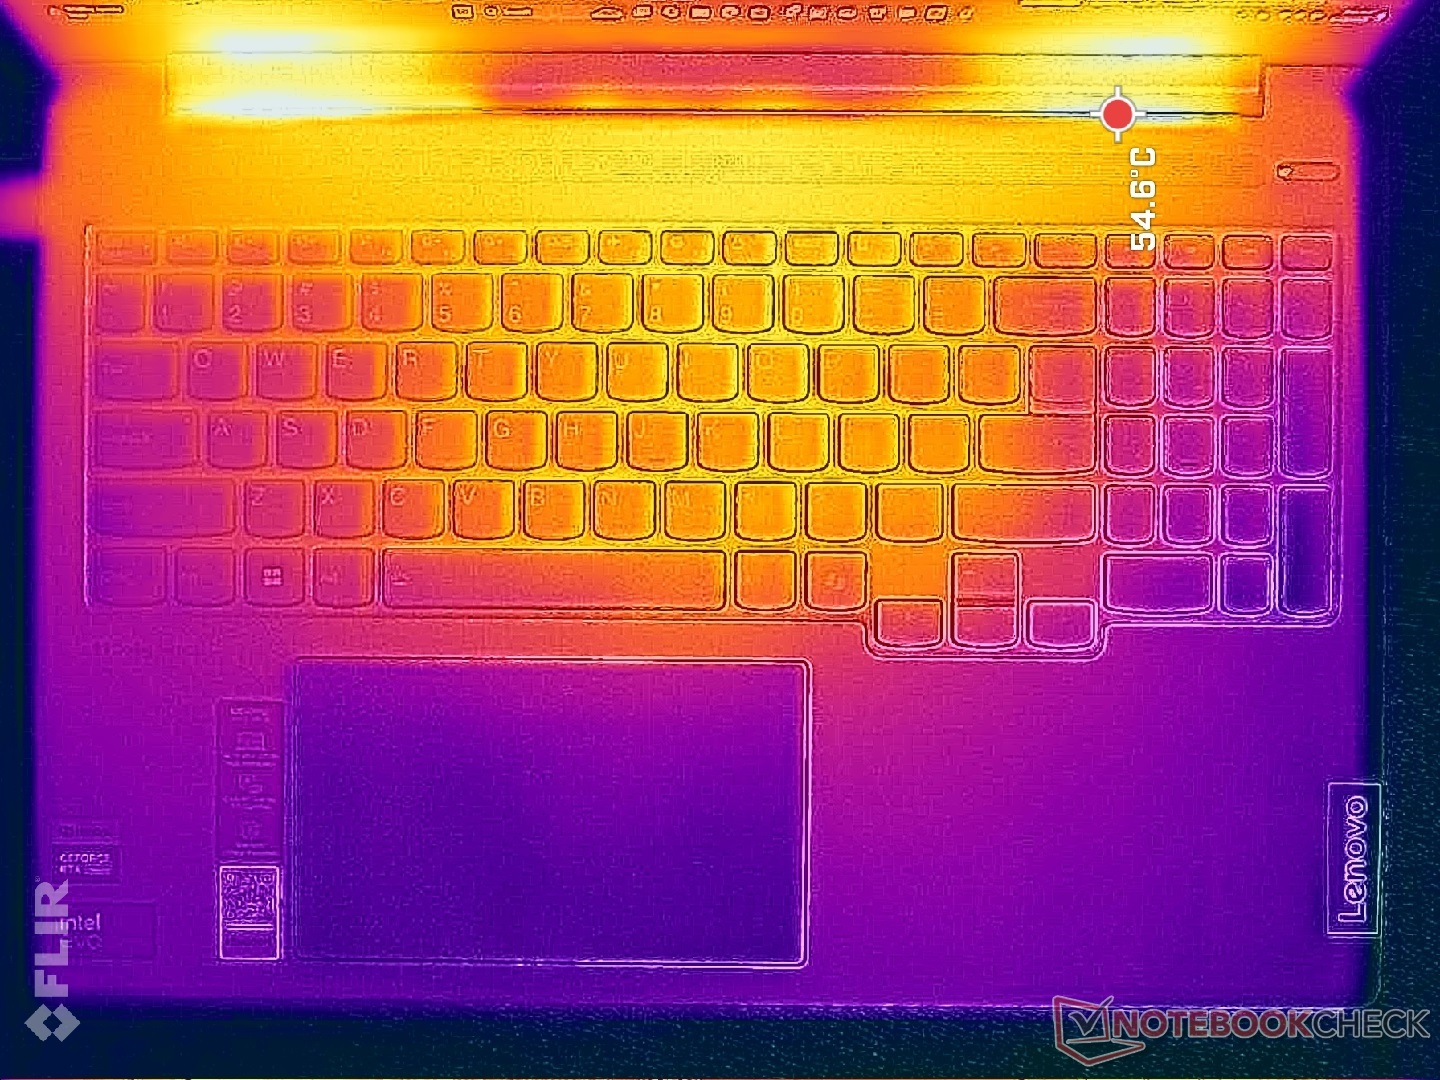
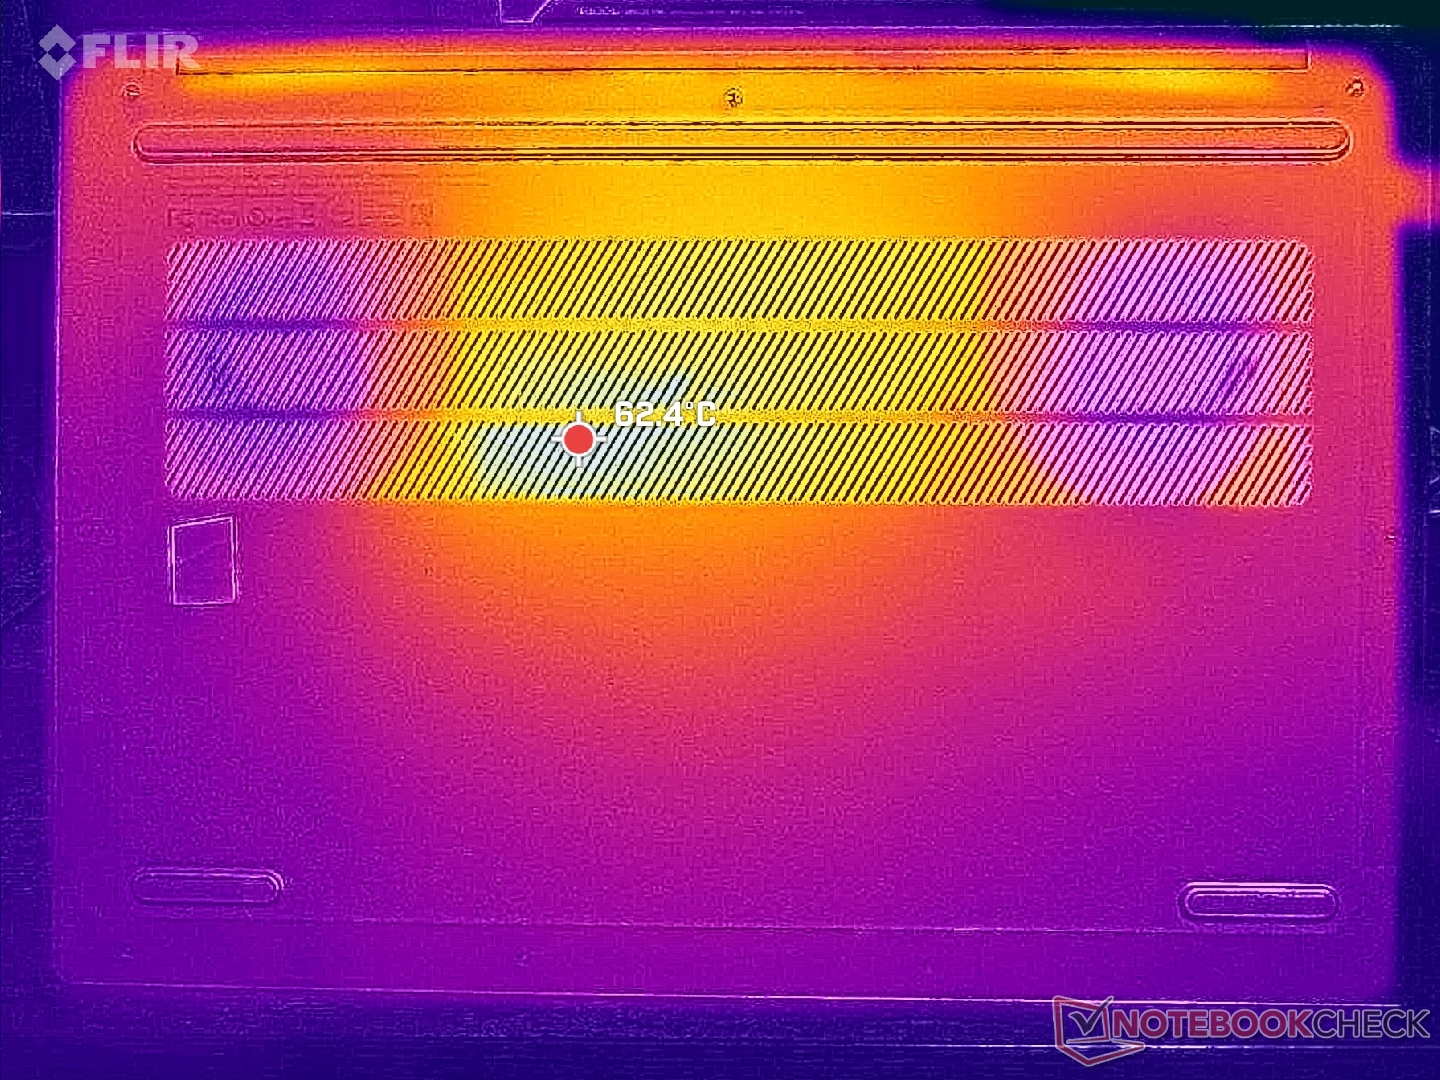
Die Oberflächentemperaturen sind bei der dGPU-Konfiguration spürbar höher als bei der iGPU-Version, selbst im Leerlauf sind sie um mehrere Grad erhöht. Unter intensiver Nutzung können heiße Stellen beim Spielen Temperaturen von bis zu 42 °C auf dem Tastaturdeck und 52 °C auf der Unterseite erreichen, im Vergleich zu nur 32 °C und 38 °C bei der iGPU-Version. Die heißesten Bereiche befinden sich glücklicherweise in der Mitte der Tastatur, weshalb es ratsam ist, anspruchsvolle Aufgaben auf einem flachen Tisch auszuführen, um einen optimalen Luftstrom zu gewährleisten.
Im Vergleich zum Galaxy Book4 Ultra, das ähnliche Core Ultra H CPUs und GeForce RTX Optionen verwendet, läuft das System insgesamt wärmer.
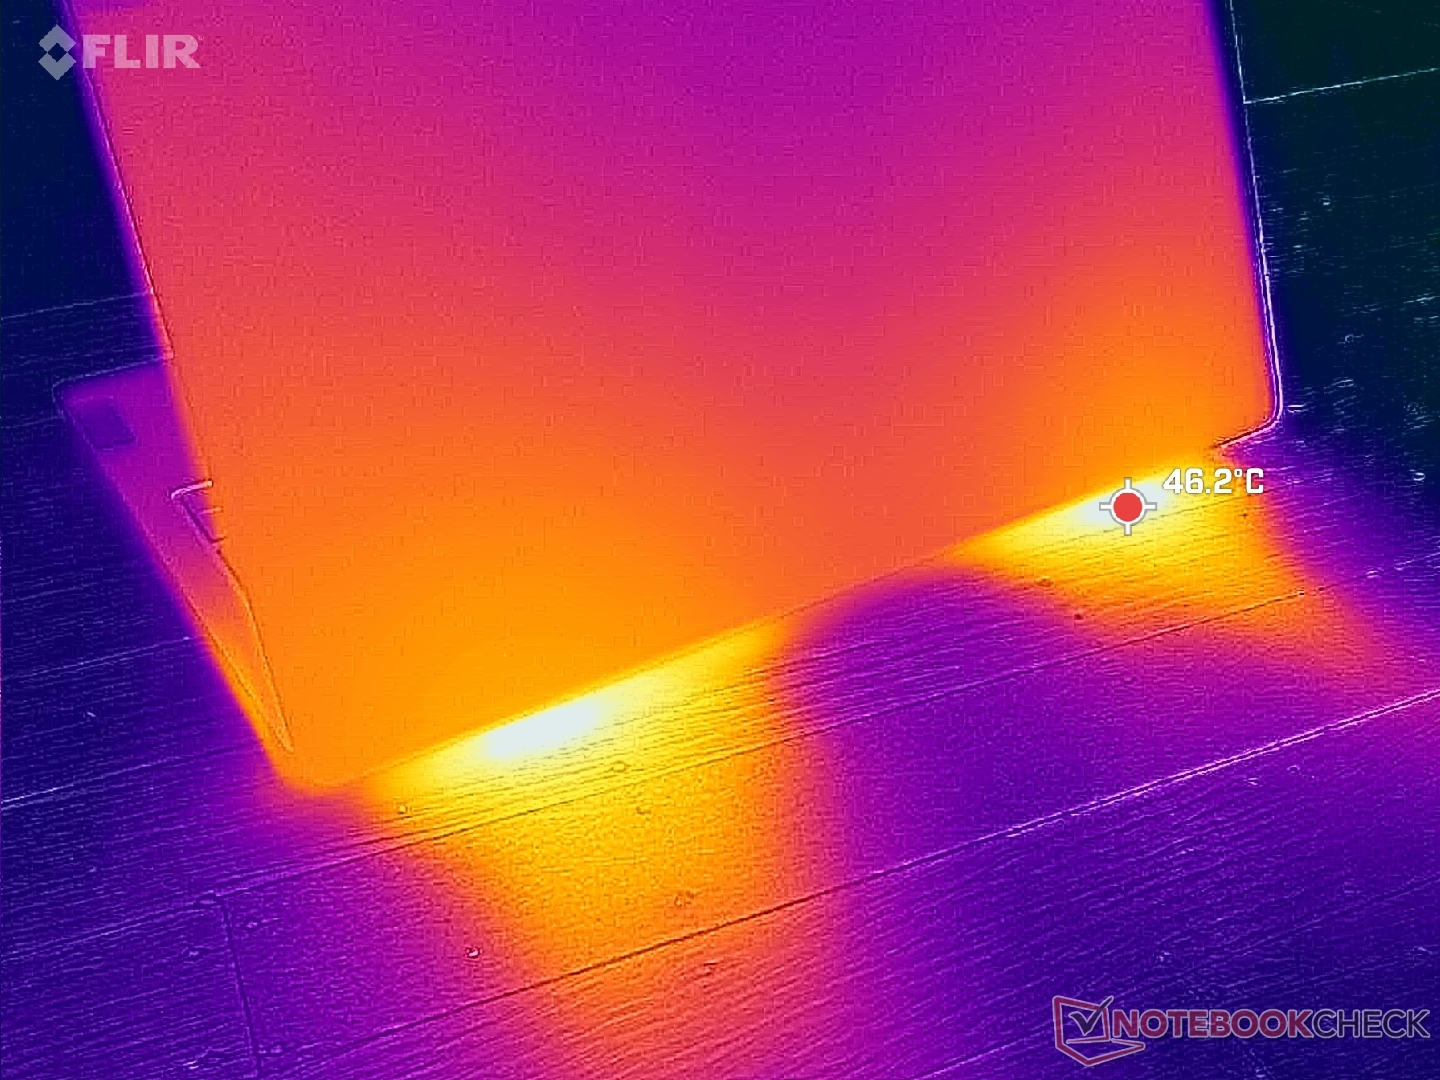
(-) Die maximale Temperatur auf der Oberseite ist 48.2 °C. Im Vergleich liegt der Klassendurchschnitt bei 36.9 °C (von 21.1 bis 71 °C für die Klasse Multimedia).
(-) Auf der Unterseite messen wir eine maximalen Wert von 59.4 °C (im Vergleich zum Durchschnitt von 39.2 °C).
(+) Ohne Last messen wir eine durchschnittliche Temperatur von 31.2 °C auf der Oberseite. Der Klassendurchschnitt erreicht 31.3 °C.
(±) 3: The average temperature for the upper side is 35.7 °C / 96 F, compared to the average of 31.3 °C / 88 F for the class Multimedia.
(+) Die Handballen und der Touchpad-Bereich erreichen maximal 34.4 °C und damit die typische Hauttemperatur und fühlen sich daher nicht heiß an.
(-) Die durchschnittliche Handballen-Temperatur anderer getesteter Geräte war 28.7 °C (-5.7 °C).

| Lenovo IdeaPad Pro 5 16IMH G9 RTX 4050 Intel Core Ultra 9 185H, NVIDIA GeForce RTX 4050 Laptop GPU | Lenovo IdeaPad Pro 5 16IMH G9 Intel Core Ultra 7 155H, Intel Arc 8-Core iGPU | Dell Inspiron 16 7640 2-in-1 Intel Core Ultra 7 155H, Intel Arc 8-Core iGPU | Asus Zenbook S 16 UM5606-RK333W AMD Ryzen AI 9 HX 370, AMD Radeon 890M | HP Envy x360 2-in-1 16-ad0097nr AMD Ryzen 7 8840HS, AMD Radeon 780M | Samsung Galaxy Book4 Ultra Intel Core Ultra 7 155H, NVIDIA GeForce RTX 4050 Laptop GPU | |
|---|---|---|---|---|---|---|
| Hitze | 28% | 11% | 10% | 18% | 28% | |
| Last oben max * (°C) | 48.2 | 36.3 25% | 46.8 3% | 46.9 3% | 42.6 12% | 38.5 20% |
| Last unten max * (°C) | 59.4 | 39.1 34% | 45.6 23% | 53.5 10% | 47.8 20% | 41.2 31% |
| Idle oben max * (°C) | 34.2 | 24.9 27% | 32.2 6% | 29.5 14% | 27.4 20% | 23.5 31% |
| Idle unten max * (°C) | 34.8 | 26.1 25% | 31.4 10% | 30.2 13% | 27.8 20% | 24.1 31% |
* ... kleinere Werte sind besser
Lautsprecher
Lenovo IdeaPad Pro 5 16IMH G9 RTX 4050 Audio Analyse
(±) | Mittelmäßig laut spielende Lautsprecher (80.2 dB)
Bass 100 - 315 Hz
(-) | kaum Bass - 22.4% niedriger als der Median
(±) | durchschnittlich lineare Bass-Wiedergabe (10.3% Delta zum Vorgänger)
Mitteltöne 400 - 2000 Hz
(+) | ausgeglichene Mitten, vom Median nur 2.7% abweichend
(+) | lineare Mitten (4% Delta zum Vorgänger)
Hochtöne 2 - 16 kHz
(+) | ausgeglichene Hochtöne, vom Median nur 1.5% abweichend
(+) | sehr lineare Hochtöne (4.1% Delta zum Vorgänger)
Gesamt im hörbaren Bereich 100 - 16.000 Hz
(+) | hörbarer Bereich ist sehr linear (14.3% Abstand zum Median
Im Vergleich zu allen Geräten derselben Klasse
» 30% aller getesteten Geräte dieser Klasse waren besser, 5% vergleichbar, 65% schlechter
» Das beste Gerät hat einen Delta-Wert von 5%, durchschnittlich ist 17%, das schlechteste Gerät hat 45%
Im Vergleich zu allen Geräten im Test
» 17% aller getesteten Geräte waren besser, 4% vergleichbar, 79% schlechter
» Das beste Gerät hat einen Delta-Wert von 4%, durchschnittlich ist 24%, das schlechteste Gerät hat 134%
Apple MacBook Pro 16 2021 M1 Pro Audio Analyse
(+) | Die Lautsprecher können relativ laut spielen (84.7 dB)
Bass 100 - 315 Hz
(+) | guter Bass - nur 3.8% Abweichung vom Median
(+) | lineare Bass-Wiedergabe (5.2% Delta zum Vorgänger)
Mitteltöne 400 - 2000 Hz
(+) | ausgeglichene Mitten, vom Median nur 1.3% abweichend
(+) | lineare Mitten (2.1% Delta zum Vorgänger)
Hochtöne 2 - 16 kHz
(+) | ausgeglichene Hochtöne, vom Median nur 1.9% abweichend
(+) | sehr lineare Hochtöne (2.7% Delta zum Vorgänger)
Gesamt im hörbaren Bereich 100 - 16.000 Hz
(+) | hörbarer Bereich ist sehr linear (4.6% Abstand zum Median
Im Vergleich zu allen Geräten derselben Klasse
» 0% aller getesteten Geräte dieser Klasse waren besser, 0% vergleichbar, 100% schlechter
» Das beste Gerät hat einen Delta-Wert von 5%, durchschnittlich ist 17%, das schlechteste Gerät hat 45%
Im Vergleich zu allen Geräten im Test
» 0% aller getesteten Geräte waren besser, 0% vergleichbar, 100% schlechter
» Das beste Gerät hat einen Delta-Wert von 4%, durchschnittlich ist 24%, das schlechteste Gerät hat 134%
Energieverwaltung
Energieaufnahme
Im Leerlauf auf dem Desktop benötigt das System bis zu 15 W, verglichen mit nur 10 W bei der iGPU-Konfiguration, was hauptsächlich auf das OLED-Panel zurückzuführen ist. Bei anspruchsvolleren Aufgaben wie Spielen steigt der Verbrauch auf 70 bis 80 W. Es ist bemerkenswert, dass unsere RTX 4050 GPU beim Spielen etwas mehr als 80 W erreicht, im Vergleich zu etwa 50 W beim Galaxy Book4 Ultra. Daher ist der Gesamtstromverbrauch bei unserem Lenovo deutlich höher und liegt fast auf dem Niveau eines Einsteiger-Gaming-Laptops.
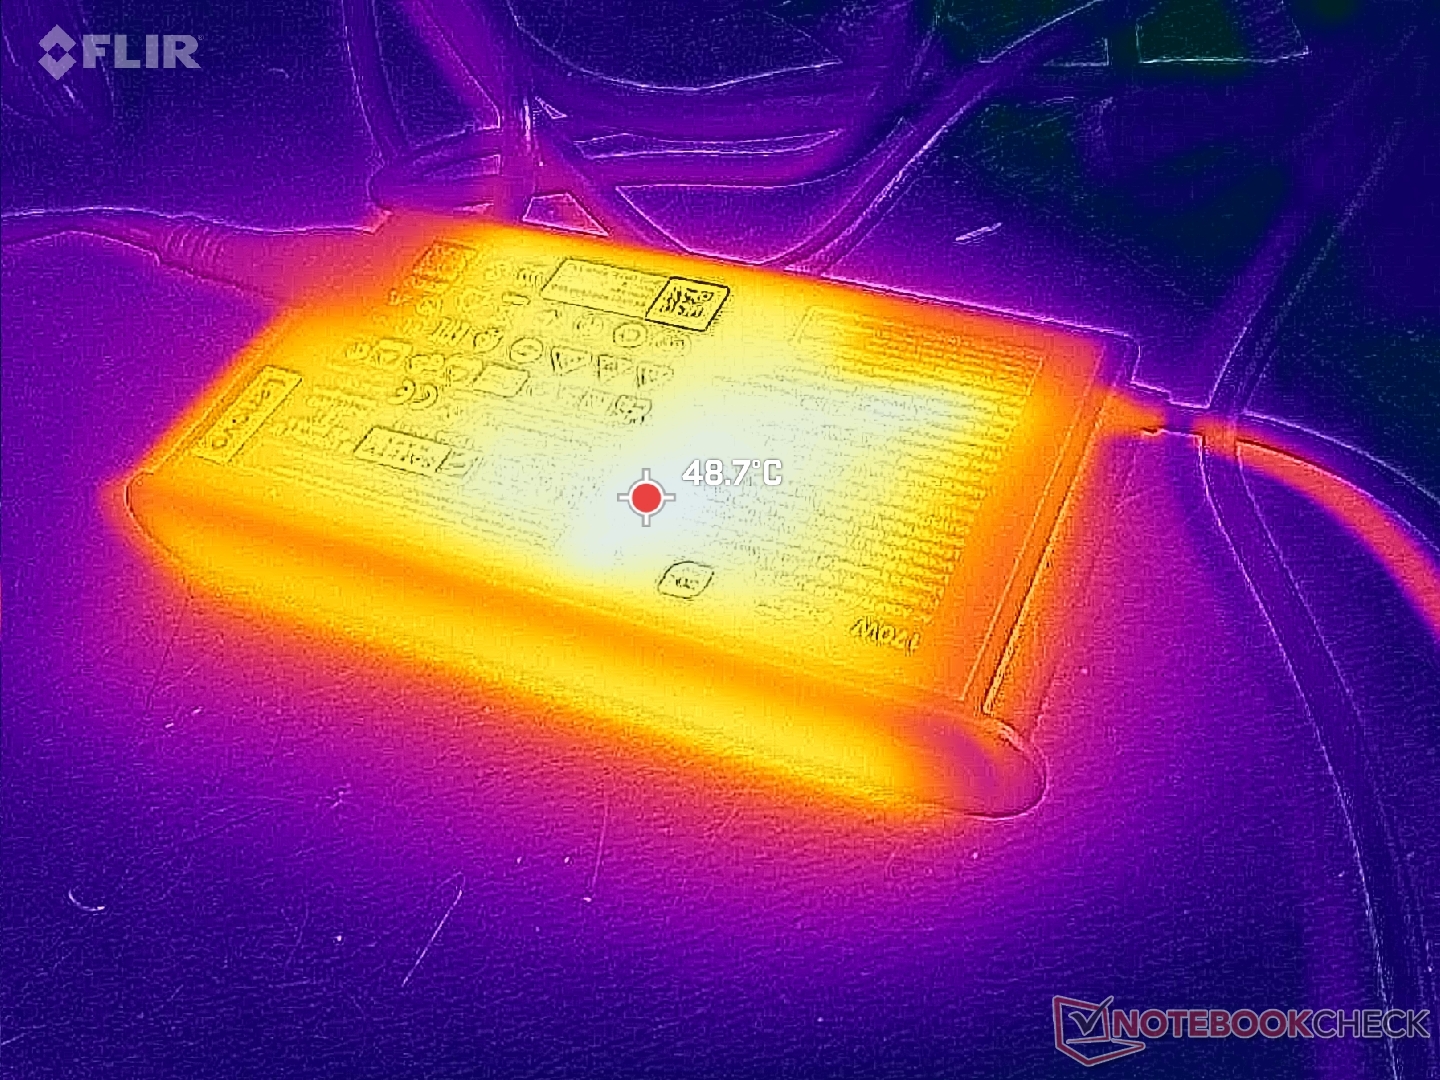
Mit dem mittelgroßen (~15 x 7,8 x 2,2 cm) 170-Watt-Netzteil können wir bei voller Auslastung von CPU und GPU einen temporären Maximalverbrauch von 172 W verzeichnen. Beim Spielen liegt der Verbrauch knapp unter 140 W, sodass das System bei Bedarf immer noch mit einer soliden Rate aufgeladen werden kann. Wir sind froh, dass das Lenovo-System das Laden über Wechselstrom und nicht nur über USB-C unterstützt, da die geringere Wattzahl von USB-C die Leistung stark beeinträchtigt hätte. Das Galaxy Book4 Ultra unterstützt beispielsweise nur USB-C-Ladung, während unser Lenovo aufgrund der höheren Leistungsobergrenzen konstant besser abgeschnitten hat.
| Aus / Standby | |
| Idle | |
| Last |
|
Legende:
min: | |
| Lenovo IdeaPad Pro 5 16IMH G9 RTX 4050 Ultra 9 185H, GeForce RTX 4050 Laptop GPU, Samsung PM9C1a MZAL81T0HDLB, OLED, 2048x1280, 16" | Lenovo IdeaPad Pro 5 16IMH G9 Ultra 7 155H, Arc 8-Core, Samsung PM9C1a MZAL81T0HDLB, IPS, 2560x1600, 16" | Dell Inspiron 16 7640 2-in-1 Ultra 7 155H, Arc 8-Core, Micron 2550 1TB, Mini-LED, 2560x1600, 16" | Asus Zenbook S 16 UM5606-RK333W Ryzen AI 9 HX 370, Radeon 890M, Micron 2400 MTFDKBA1T0QFM, OLED, 2880x1800, 16" | HP Envy x360 2-in-1 16-ad0097nr R7 8840HS, Radeon 780M, KIOXIA BG5 KBG50ZNV1T02, OLED, 2880x1800, 16" | Samsung Galaxy Book4 Ultra Ultra 7 155H, GeForce RTX 4050 Laptop GPU, Samsung PM9A1 MZVL2512HCJQ, OLED, 2880x1800, 16" | |
|---|---|---|---|---|---|---|
| Stromverbrauch | 21% | 11% | 32% | 26% | 18% | |
| Idle min * (Watt) | 5.6 | 3.5 37% | 6.1 -9% | 5.4 4% | 5 11% | 4.8 14% |
| Idle avg * (Watt) | 7.3 | 9.6 -32% | 13.5 -85% | 10.5 -44% | 6.2 15% | 7.5 -3% |
| Idle max * (Watt) | 14.6 | 9.9 32% | 13.8 5% | 10.9 25% | 14.7 -1% | 7.9 46% |
| Last avg * (Watt) | 86.3 | 62.7 27% | 63.6 26% | 47.8 45% | 49.9 42% | 79.3 8% |
| Cyberpunk 2077 ultra external monitor * (Watt) | 135.8 | 64.6 52% | 46.7 66% | |||
| Cyberpunk 2077 ultra * (Watt) | 136.4 | 67 51% | 49.2 64% | |||
| Last max * (Watt) | 172 | 101.2 41% | 109.7 36% | 58.6 66% | 65 62% | 125 27% |
| Witcher 3 ultra * (Watt) | 55.8 | 54.5 | 79.2 |
* ... kleinere Werte sind besser
Energieaufnahme Cyberpunk / Stresstest
Energieaufnahme externer Monitor
Akkulaufzeit
Die Laufzeiten sind erwartungsgemäß kürzer als bei der IPS-iGPU-Konfiguration, was auf die oben genannten Gründe zurückzuführen ist. Dennoch sind 10,5 Stunden WLAN-Surfen unter realen Bedingungen immer noch beeindruckend und vergleichbar mit dem Inspiron 16 7640 2-in-1 oder dem Zenbook S 16.
Der Ladevorgang vom leeren zum vollen Akku erfolgt in etwa 60 Minuten, was im Vergleich zu den meisten anderen Ultrabooks, bei denen der Ladevorgang 90 Minuten dauert, sehr schnell ist. Das Aufladen mit USB-C-Netzteilen ist jedoch langsamer.
| Lenovo IdeaPad Pro 5 16IMH G9 RTX 4050 Ultra 9 185H, GeForce RTX 4050 Laptop GPU, 84 Wh | Lenovo IdeaPad Pro 5 16IMH G9 Ultra 7 155H, Arc 8-Core, 84 Wh | Dell Inspiron 16 7640 2-in-1 Ultra 7 155H, Arc 8-Core, 90 Wh | Asus Zenbook S 16 UM5606-RK333W Ryzen AI 9 HX 370, Radeon 890M, 78 Wh | HP Envy x360 2-in-1 16-ad0097nr R7 8840HS, Radeon 780M, 68 Wh | Samsung Galaxy Book4 Ultra Ultra 7 155H, GeForce RTX 4050 Laptop GPU, 76 Wh | |
|---|---|---|---|---|---|---|
| Akkulaufzeit | 28% | 35% | 63% | 27% | 33% | |
| Idle (h) | 22.3 | 21.8 -2% | 15.6 -30% | |||
| WLAN (h) | 10.7 | 12.6 18% | 11.4 7% | 10.7 0% | 7.7 -28% | 10.9 2% |
| Last (h) | 0.8 | 1.1 38% | 1.6 100% | 1.8 125% | 1.9 138% | 1.3 63% |
| H.264 (h) | 16 | 20.1 | 17.9 |
Pro
Contra
Fazit — Gut ausbalanciertes Angebot für etwa 1.400 Euro
Während die niedrigere iGPU-Konfiguration eine respektable Multimedia-Maschine ist, stellt die höhere dGPU-Konfiguration bereits eine grenzwertige Gaming-Maschine dar. Die 90-W-GeForce RTX 4050-Grafik ist schneller als bei den meisten anderen Multimedia-Laptops, wie dem Samsung Galaxy Book4 Ultra, und kann sogar mit vielen Einsteiger-Gaming-Laptops mit RTX 4060-Grafik, wie dem Legion LOQ, mithalten. Trotz des dünnen Profils und des eher langweiligen, büroähnlichen Designs hat das System durchaus beeindruckende Leistung zu bieten.
Das IdeaPad Pro 5 16 G9 ist schneller, als es auf den ersten Blick wirkt, insbesondere wenn es mit der leistungsstarken 90-W-GeForce RTX 4050 GPU ausgestattet ist.
All diese Leistung in einem so dünnen Gehäuse geht jedoch auf Kosten einer kürzeren Akkulaufzeit, lauteren Lüftergeräusche und höherer Temperaturen im Vergleich zur iGPU-Option und den meisten Konkurrenten im 16-Zoll-Bereich. Lenovo hätte diese Nachteile möglicherweise durch den Einsatz einer langsameren 50-W-GPU verringern können, aber wir begrüßen die Entscheidung, eine höhere 90-W-Grenze zu wählen, um das IdeaPad Pro 5 16 G9 besser von der Konkurrenz abzugrenzen. Es mag bei der Büroarbeit nicht ganz mit einem ThinkPad T16 mithalten oder beim Spielen mit einem Legion Pro 5 16 konkurrieren, aber es ist in beiden Bereichen besser als der Durchschnitt und erweist sich somit als solider Alleskönner.
Preis und Verfügbarkeit
Nur Costco bietet jetzt das Lenovo IdeaPad Pro 5i 16 mit der Konfiguration des Core Ultra 9 185H und der RTX 4050 für 1.500 US-Dollar (1.400 Euro) an.
Lenovo IdeaPad Pro 5 16IMH G9 RTX 4050
- 08.09.2024 v8
Allen Ngo
 Total Sustainability Score:
 Transparenz
Die Auswahl der zu testenden Geräte erfolgt innerhalb der Redaktion. Das vorliegende Testmuster wurde dem Autor vom Hersteller oder einem Shop zu Testzwecken leihweise zur Verfügung gestellt. Eine Einflussnahme des Leihstellers auf den Testbericht gab es nicht, der Hersteller erhielt keine Version des Reviews vor der Veröffentlichung. Es bestand keine Verpflichtung zur Publikation. Als eigenständiges, unabhängiges Unternehmen unterliegt Notebookcheck keiner Diktion von Herstellern, Shops und Verlagen.
So testet Notebookcheck
Pro Jahr werden von Notebookcheck hunderte Laptops und Smartphones unabhängig in von uns standardisierten technischen Verfahren getestet, um eine Vergleichbarkeit aller Testergebnisse zu gewährleisten. Seit rund 20 Jahren entwickeln wir diese Testmethoden kontinuierlich weiter und setzen damit Branchenstandards. In unseren Testlaboren kommt ausschließlich hochwertiges Messequipment in die Hände erfahrener Techniker und Redakteure. Die Tests unterliegen einer mehrstufigen Kontrolle. Unsere komplexe Gesamtbewertung basiert auf hunderten fundierten Messergebnissen und Benchmarks, womit Ihnen Objektivität garantiert ist. Weitere Informationen zu unseren Testmethoden gibt es hier.
Preisvergleich

