Dell Inspiron 16 Plus 7640 Laptop Test: Kleine, aber wichtige Änderungen gegenüber dem Vorjahresmodell

Das Inspiron 16 Plus 7640 mit dem passenden Namen ersetzt das Inspiron 16 Plus 7630 aus dem Jahr 2023 mit neuen KI-fähigen Prozessoren anstelle der Raptor-Lake-H-Optionen aus dem letzten Jahr. Abgesehen von ein paar anderen kleinen Änderungen im Inneren und Äußeren ist das Modell weitgehend identisch mit seinem Vorgänger. Wir empfehlen den Test des Inspiron 15 Plus 7630 zu lesen, um mehr über die physischen Eigenschaften des Inspiron 15 Plus 7640 zu erfahren.
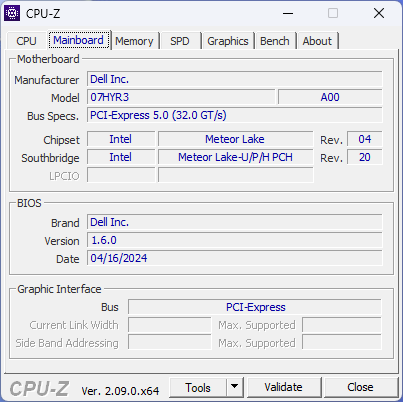
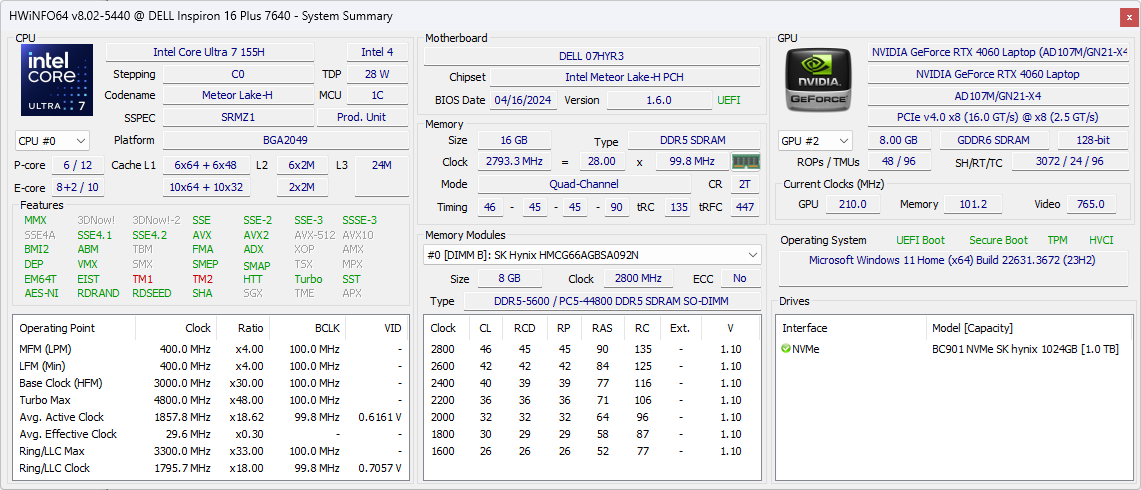
Das Inspiron 16 Plus 7640 ist in vielen Konfigurationen erhältlich, vom Core i7-13620H der 13. Generation bis zum Core Ultra 9 185H der 14. Generation, mit integrierter UHD- oder Arc-Grafik bis zur diskreten GeForce RTX 4060 und 1.200p- oder 1.600p-Displayoptionen. AMD Zen 4 SKUs mit Ryzen 5 8540U oder Ryzen 7 8840U sind ebenfalls verfügbar, allerdings nur für das reguläre Inspiron-16-7640-Non-Plus-Modell ohne diskrete Grafik oder 1.600p-Option. Bei unserem Testgerät handelt es sich um eine High-End-Konfiguration mit Core Ultra 7 155H, 1.600p-Display und RTX-4060-Grafik für ca. 1.300 US-Dollar im Einzelhandel.
Zu den Konkurrenten gehören andere 16-Zoll-Multimedia-Laptops der Mittelklasse wie das Asus VivoBook Pro 16, Lenovo Yoga 7 2-in-1 16IML9, oder die HP-Envy-16-Serie.
Weitere Dell Bewertungen:
Mögliche Konkurrenten im Vergleich
Bew. | Version | Datum | Modell | Gewicht | Dicke | Größe | Auflösung | Preis ab |
|---|---|---|---|---|---|---|---|---|
| 83.4 % | v8 | 06 / 2024 | Dell Inspiron 16 Plus 7640 Ultra 7 155H, GeForce RTX 4060 Laptop GPU | 2.2 kg | 19.9 mm | 16.00" | 2560x1600 | |
| 87.1 % v7 (old) | v7 (old) | 09 / 2023 | Dell Inspiron 16 Plus 7630 i7-13700H, GeForce RTX 4060 Laptop GPU | 2.2 kg | 19.95 mm | 16.00" | 2560x1600 | |
| 87.4 % v7 (old) | v7 (old) | 08 / 2022 | Dell Inspiron 16 Plus 7620 i7-12700H, GeForce RTX 3050 Ti Laptop GPU | 2.1 kg | 18.99 mm | 16.00" | 3072x1920 | |
| 90.4 % v7 (old) | v7 (old) | 03 / 2024 | Samsung Galaxy Book4 Ultra Ultra 7 155H, GeForce RTX 4050 Laptop GPU | 1.8 kg | 17 mm | 16.00" | 2880x1800 | |
| 89.1 % v7 (old) | v7 (old) | 01 / 2024 | Lenovo Legion 5 16IRX G9 i7-14650HX, GeForce RTX 4060 Laptop GPU | 2.4 kg | 25.2 mm | 16.00" | 2560x1600 | |
| 87.6 % v7 (old) | v7 (old) | 11 / 2023 | Asus VivoBook Pro 16 K6602VU i9-13900H, GeForce RTX 4050 Laptop GPU | 1.9 kg | 19 mm | 16.00" | 3200x2000 |
Hinweis: Wir haben unser Rating-System kürzlich aktualisiert und die Ergebnisse von Version 8 sind nicht mit den Ergebnissen von Version 7 vergleichbar. Weitere Informationen dazu sind hier verfügbar.
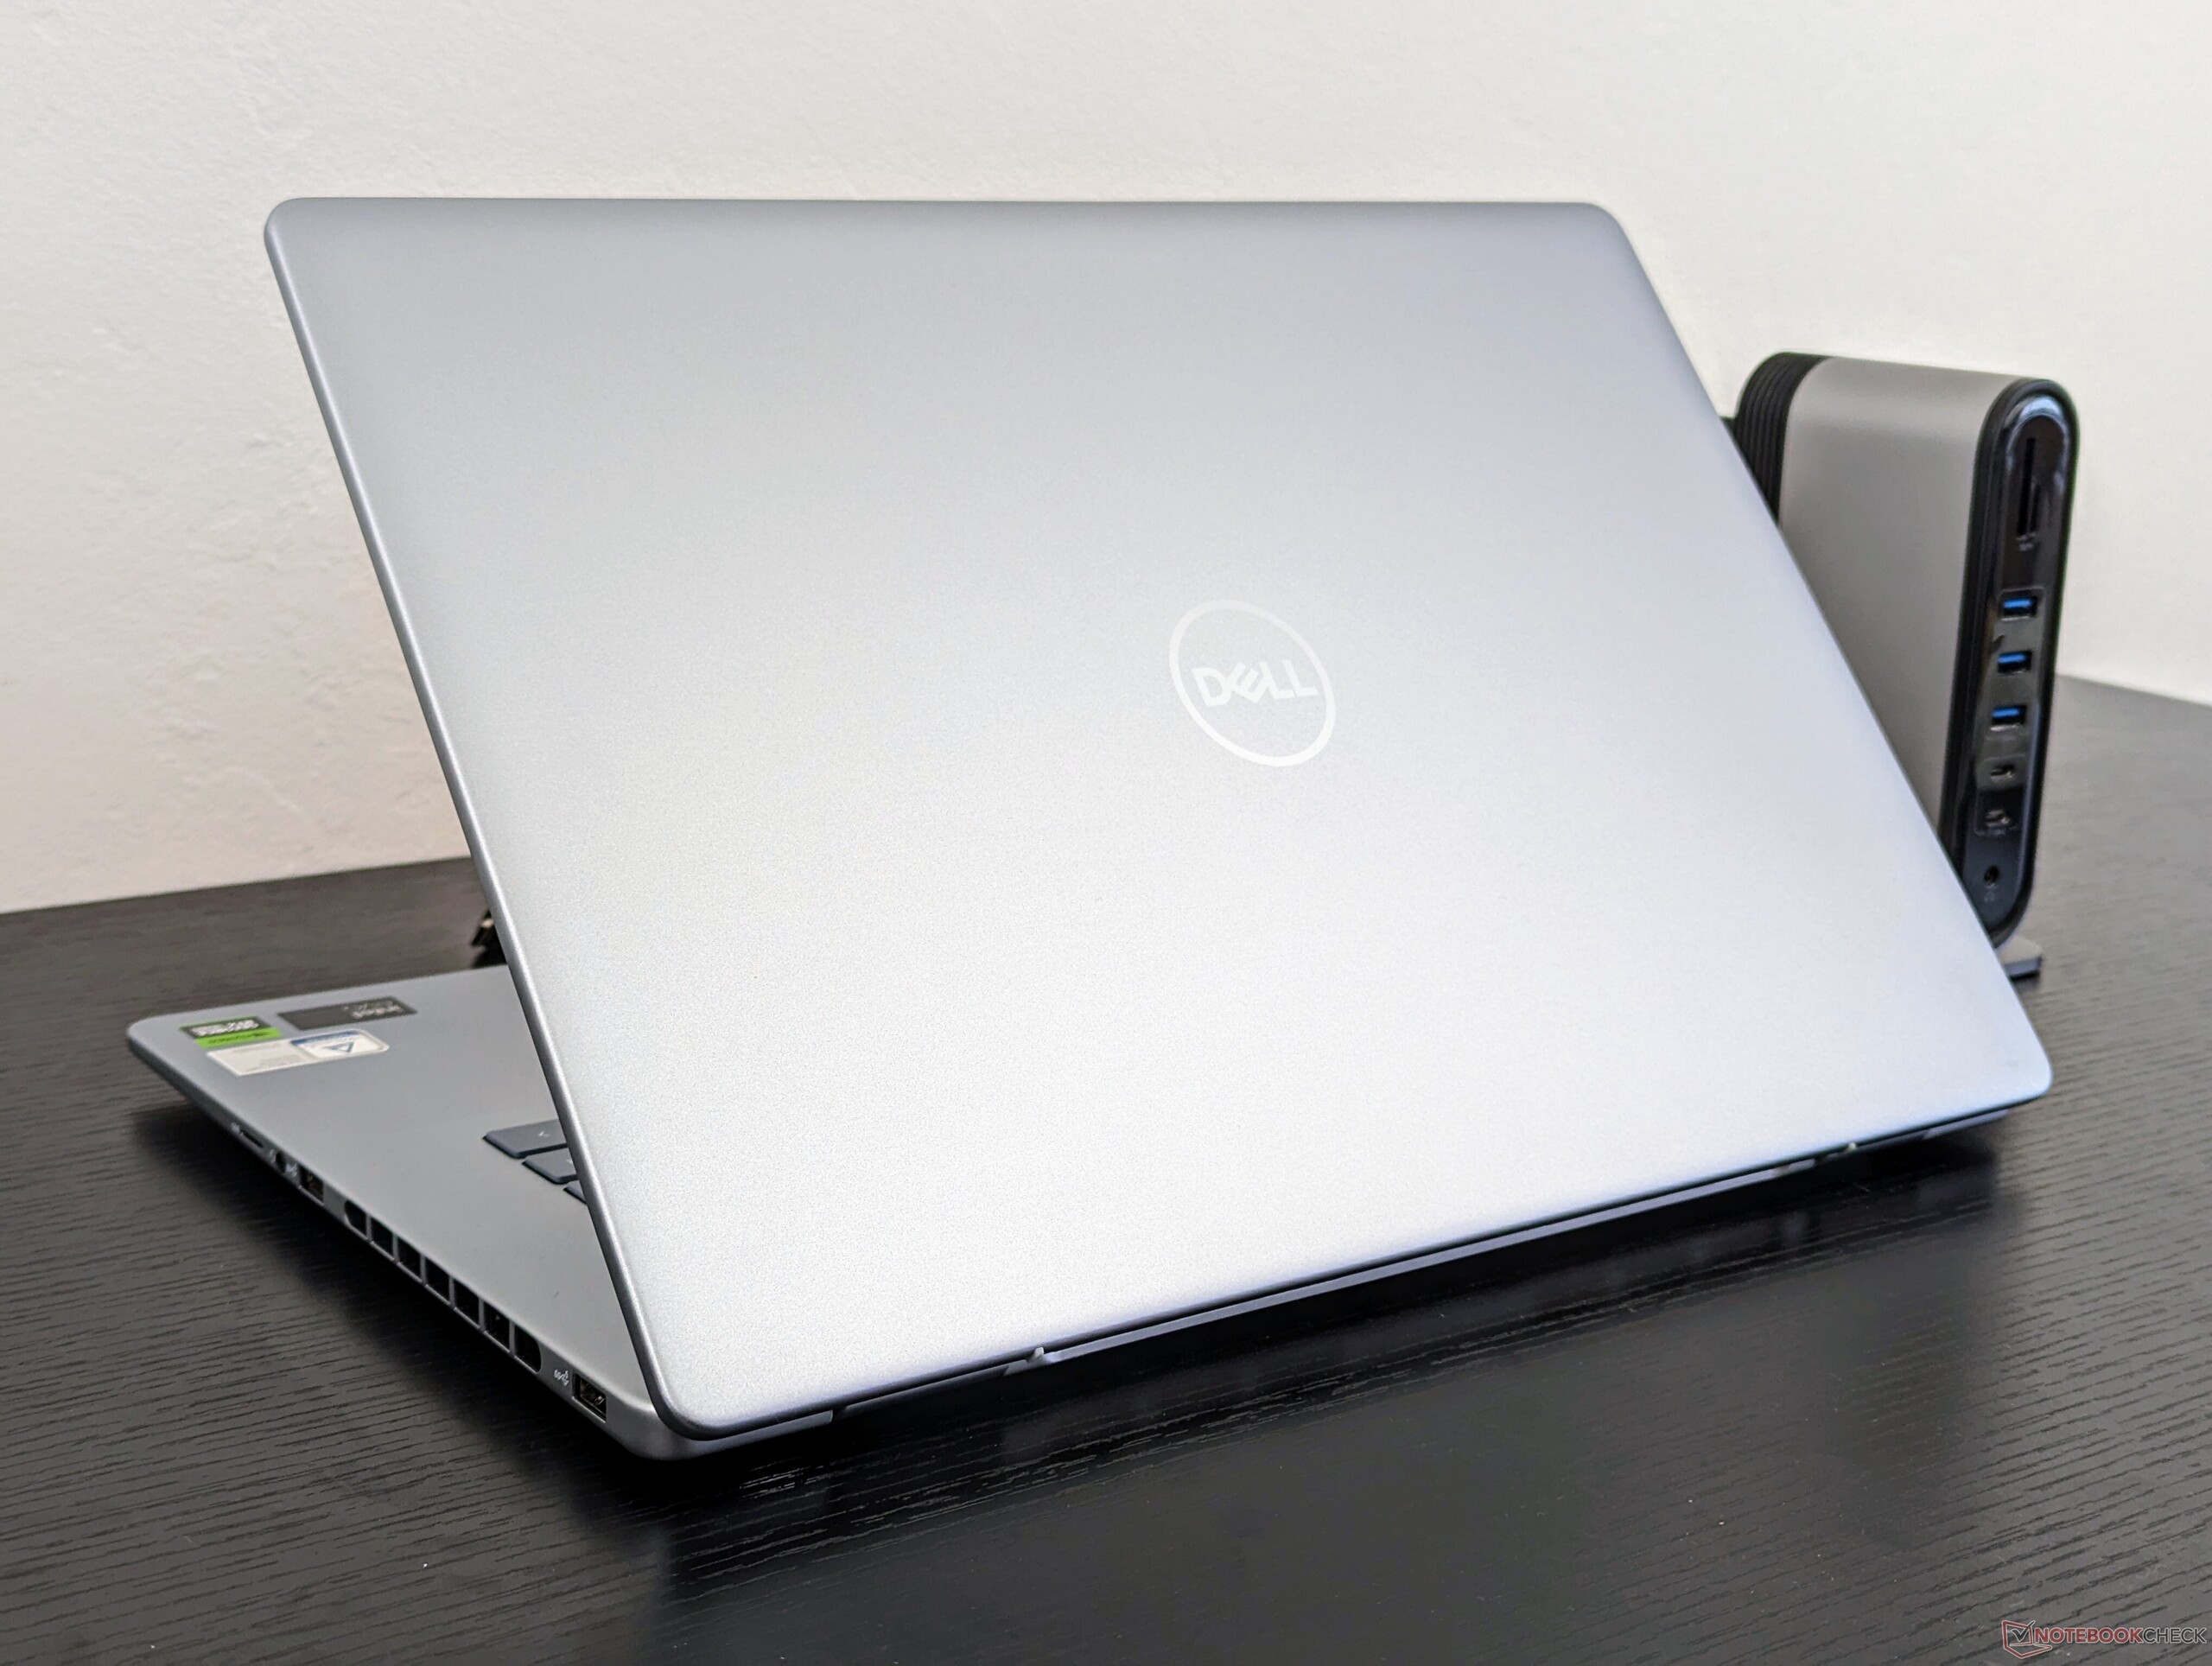
Gehäuse - mehr und größere Öffnungen
Das Modell verfügt über eine neue spezielle Co-Pilot-Taste, welche die Strg-Taste auf der rechten Hälfte der Tastatur ersetzt. Der Bereich der Handballenablage ist flacher, der Umfang der Basis ist runder und die Lüftungsgitter an der Rückseite und den Seiten wurden neu gestaltet und sind nun größer als zuvor. Die Gehäusematerialien und Ports sind ansonsten unverändert und bieten einen ähnlichen ersten Eindruck und ähnliche Abmessungen.
SD-Kartenleser
| SD Card Reader | |
| average JPG Copy Test (av. of 3 runs) | |
| Asus VivoBook Pro 16 K6602VU (Angelbird AV Pro V60) | |
| Samsung Galaxy Book4 Ultra (Angelbird AV Pro V60) | |
| Lenovo Legion 5 16IRX G9 | |
| Dell Inspiron 16 Plus 7620 (Toshiba Exceria Pro SDXC 64 GB UHS-II) | |
| Dell Inspiron 16 Plus 7640 (Angelbird AV Pro V60) | |
| Dell Inspiron 16 Plus 7630 (AV Pro SD microSD 128 GB V60) | |
| maximum AS SSD Seq Read Test (1GB) | |
| Asus VivoBook Pro 16 K6602VU (Angelbird AV Pro V60) | |
| Samsung Galaxy Book4 Ultra (Angelbird AV Pro V60) | |
| Lenovo Legion 5 16IRX G9 | |
| Dell Inspiron 16 Plus 7640 (Angelbird AV Pro V60) | |
| Dell Inspiron 16 Plus 7620 (Toshiba Exceria Pro SDXC 64 GB UHS-II) | |
| Dell Inspiron 16 Plus 7630 (AV Pro SD microSD 128 GB V60) | |
Kommunikation
| Networking | |
| iperf3 transmit AXE11000 | |
| Samsung Galaxy Book4 Ultra | |
| Asus VivoBook Pro 16 K6602VU | |
| Lenovo Legion 5 16IRX G9 | |
| Dell Inspiron 16 Plus 7630 | |
| Dell Inspiron 16 Plus 7640 | |
| iperf3 receive AXE11000 | |
| Samsung Galaxy Book4 Ultra | |
| Asus VivoBook Pro 16 K6602VU | |
| Lenovo Legion 5 16IRX G9 | |
| Dell Inspiron 16 Plus 7630 | |
| Dell Inspiron 16 Plus 7640 | |
| iperf3 transmit AXE11000 6GHz | |
| Dell Inspiron 16 Plus 7630 | |
| Asus VivoBook Pro 16 K6602VU | |
| Dell Inspiron 16 Plus 7620 | |
| Dell Inspiron 16 Plus 7640 | |
| iperf3 receive AXE11000 6GHz | |
| Asus VivoBook Pro 16 K6602VU | |
| Dell Inspiron 16 Plus 7630 | |
| Dell Inspiron 16 Plus 7620 | |
| Dell Inspiron 16 Plus 7640 | |


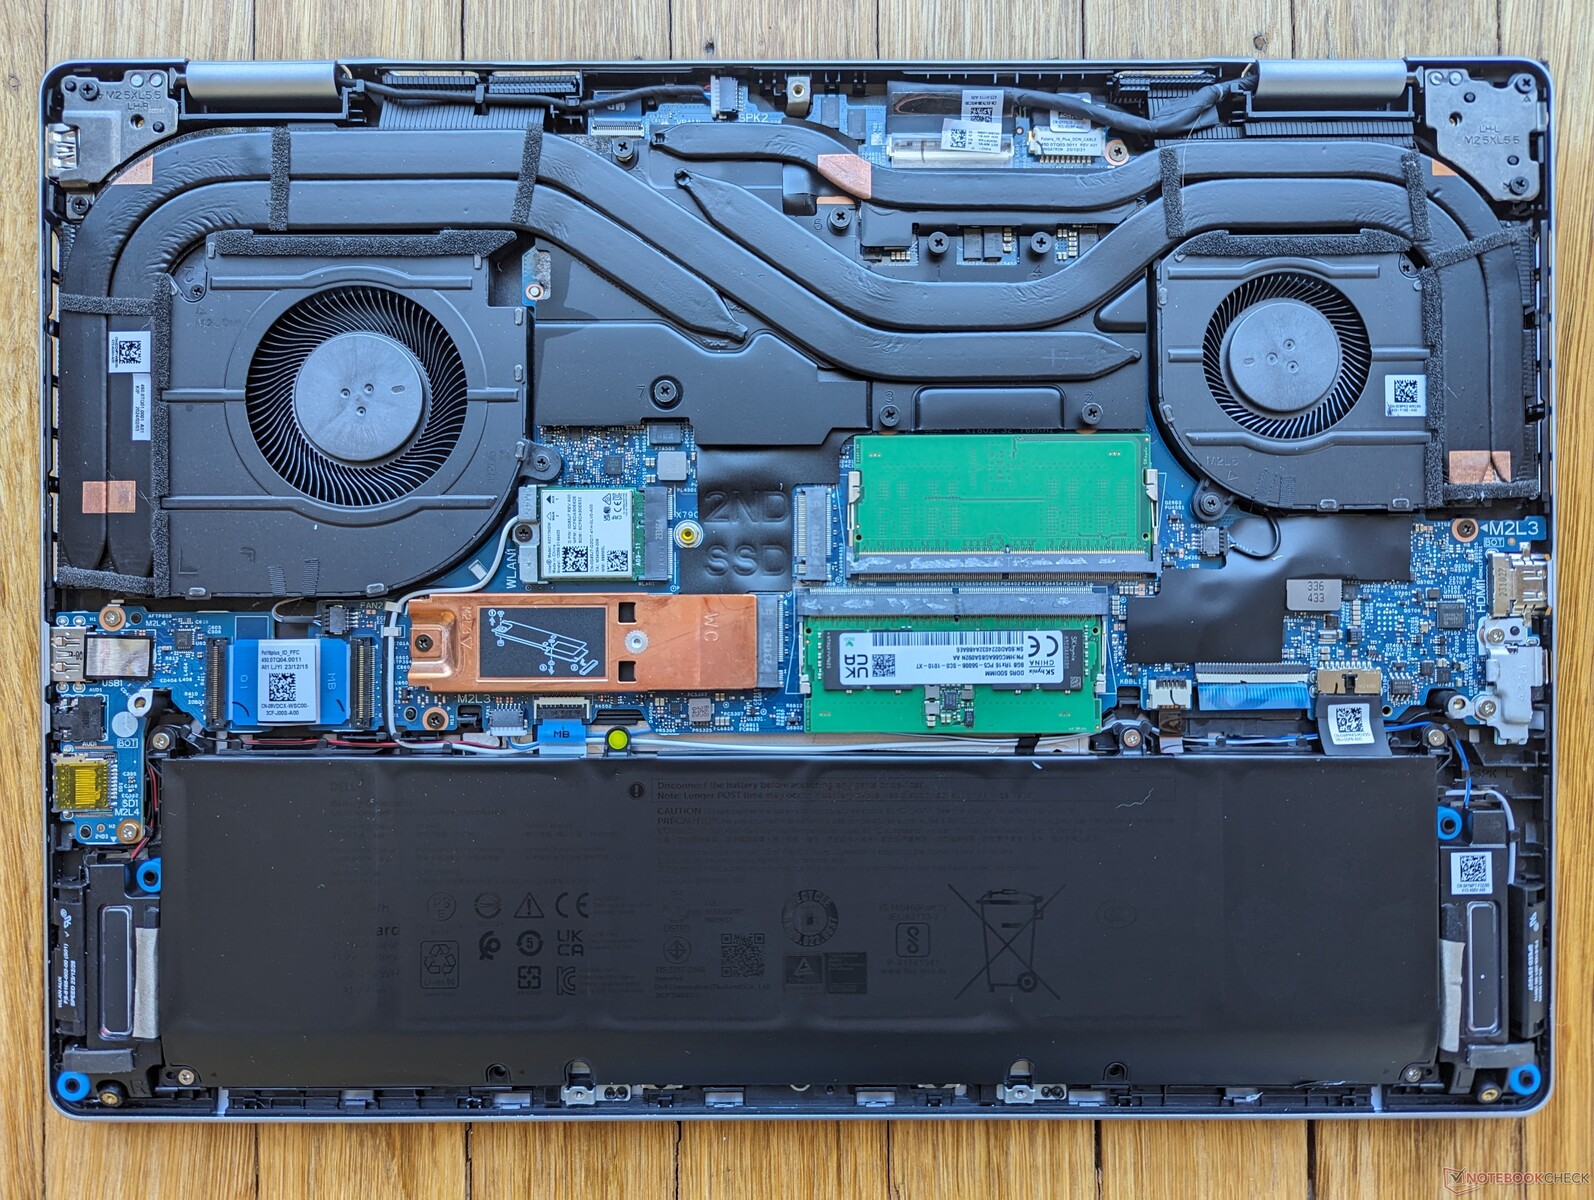
Wartung
Beim Öffnen des Systems sieht man einen großen Unterschied zu seinem unmittelbaren Vorgänger: die Unterstützung für eine zweite M.2-2230-SSD. Ansonsten scheint alles andere weitgehend identisch mit dem Inspiron 16 Plus 7630 zu sein, wie die Bilder unten zeigen.

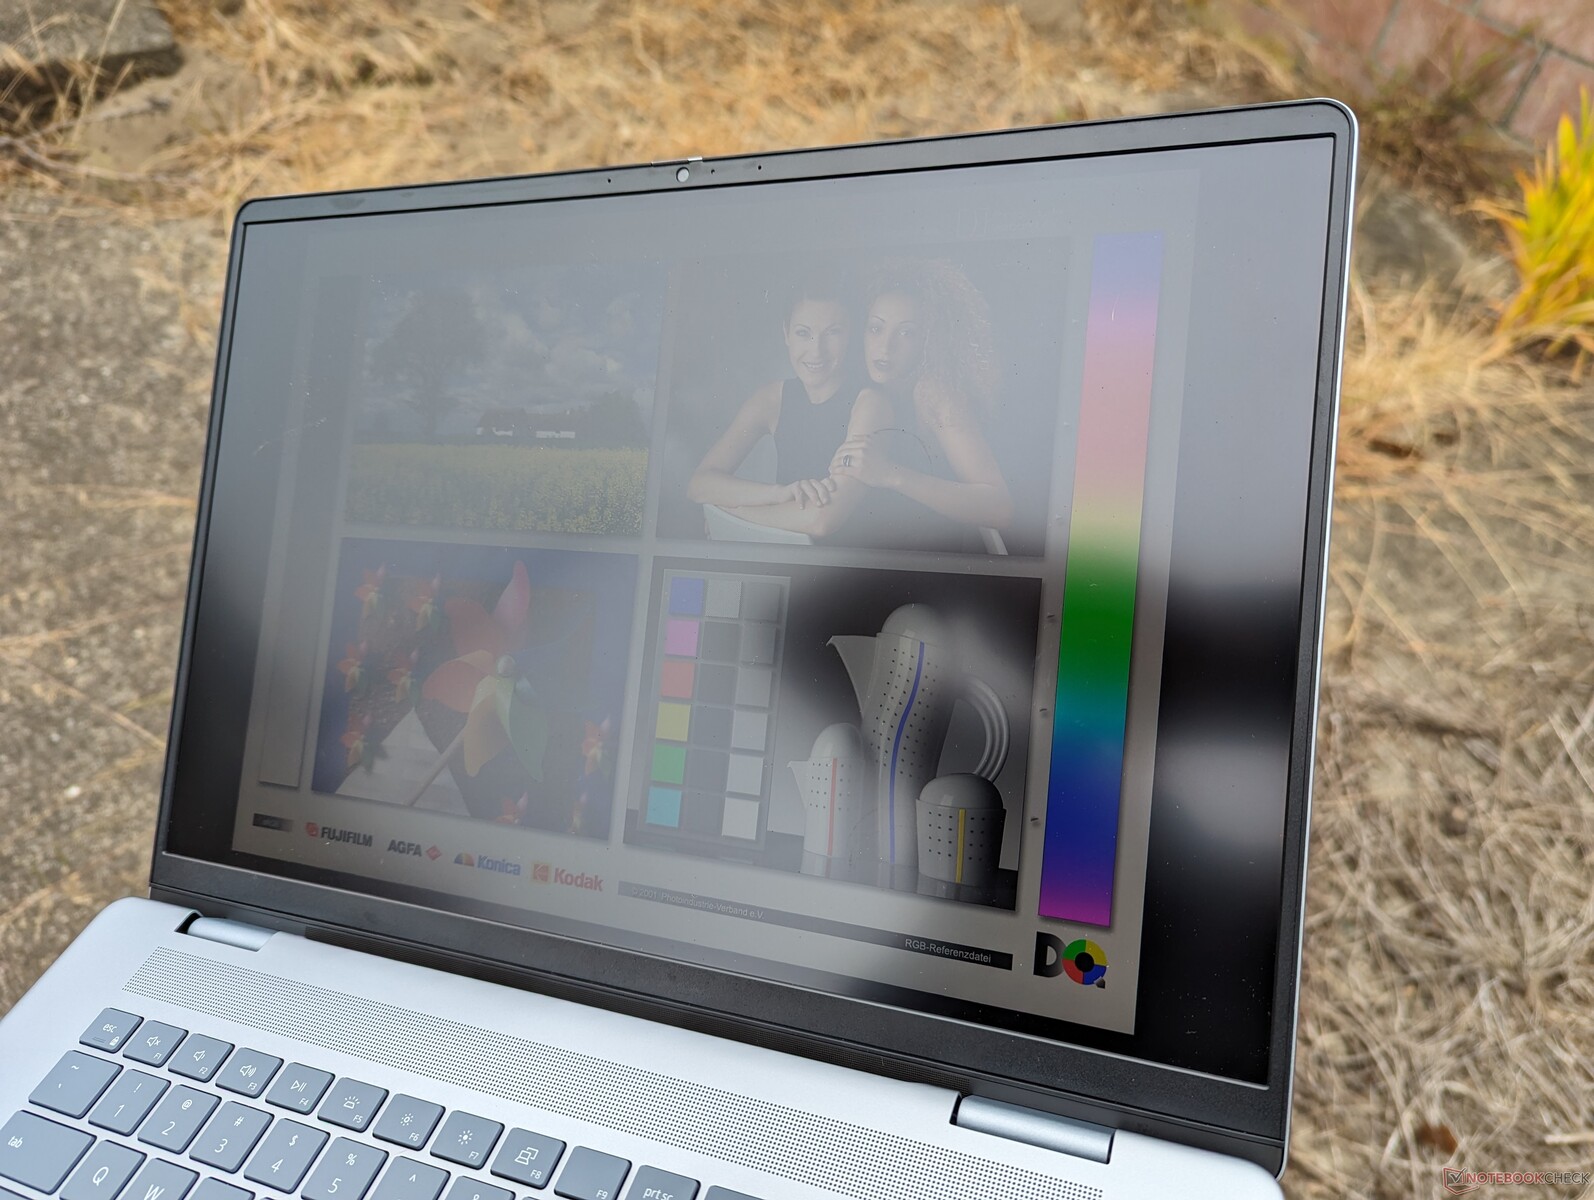
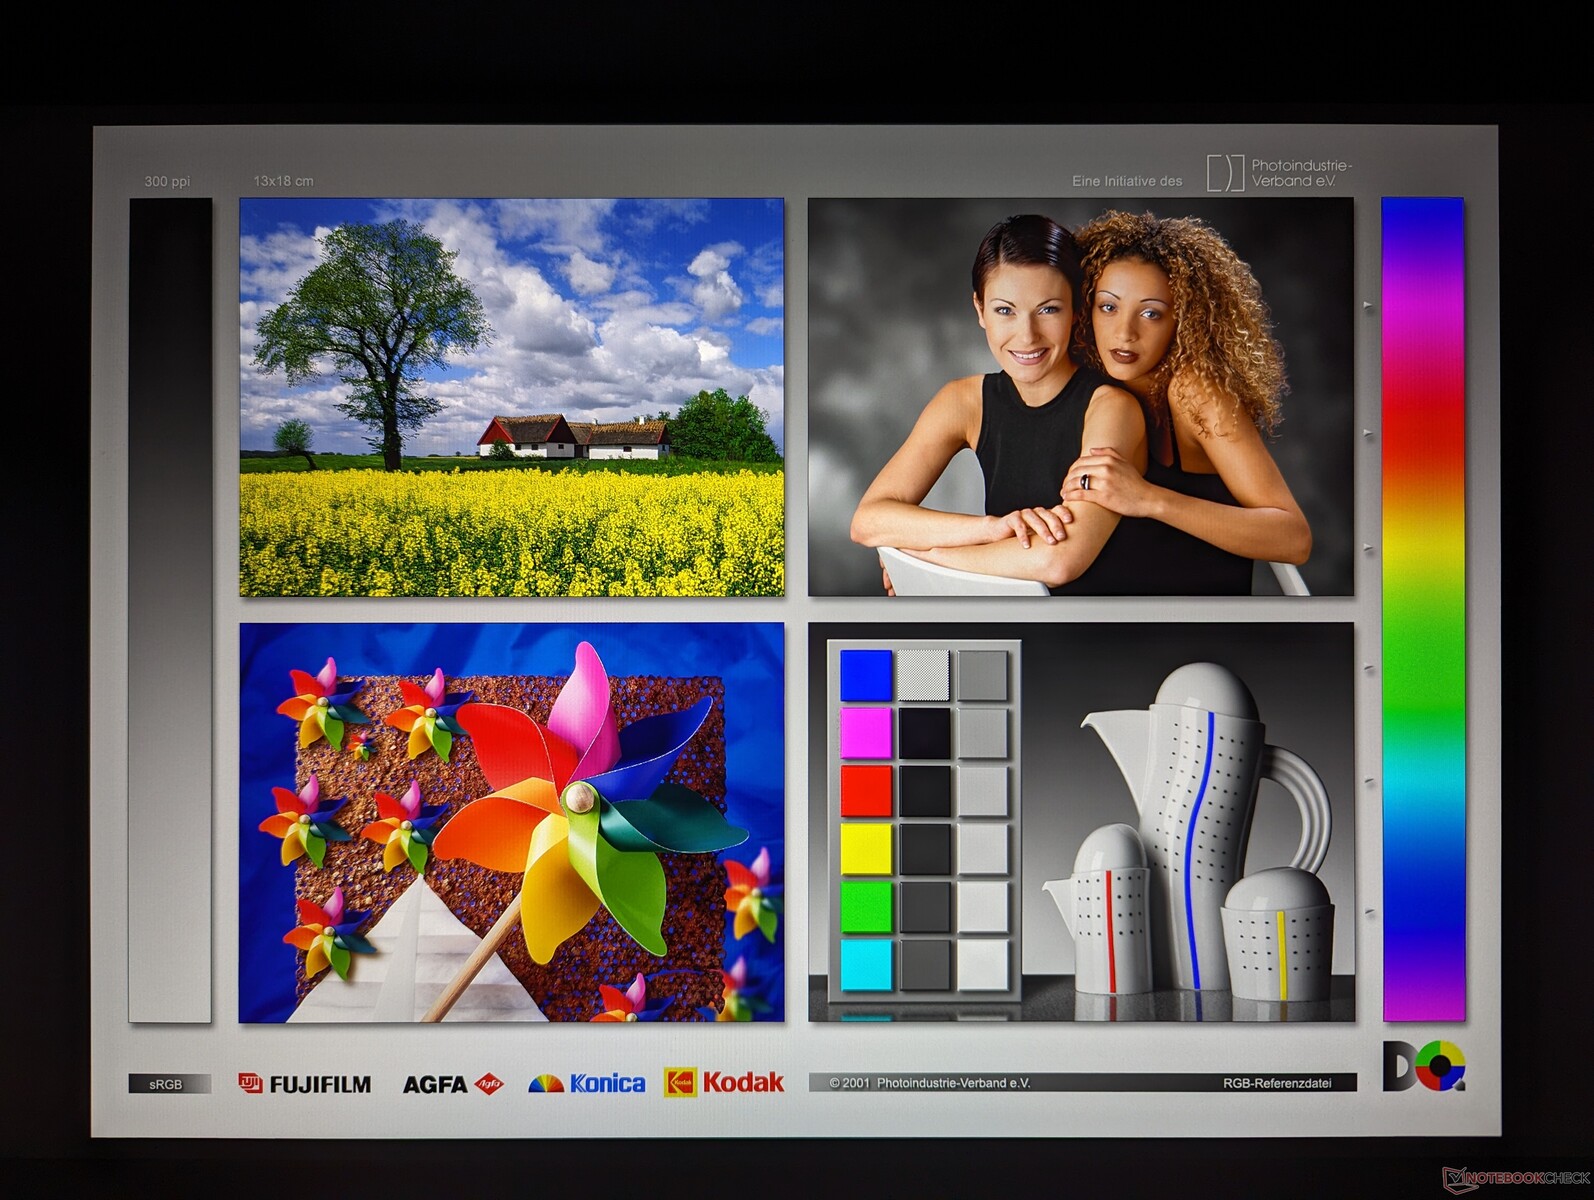
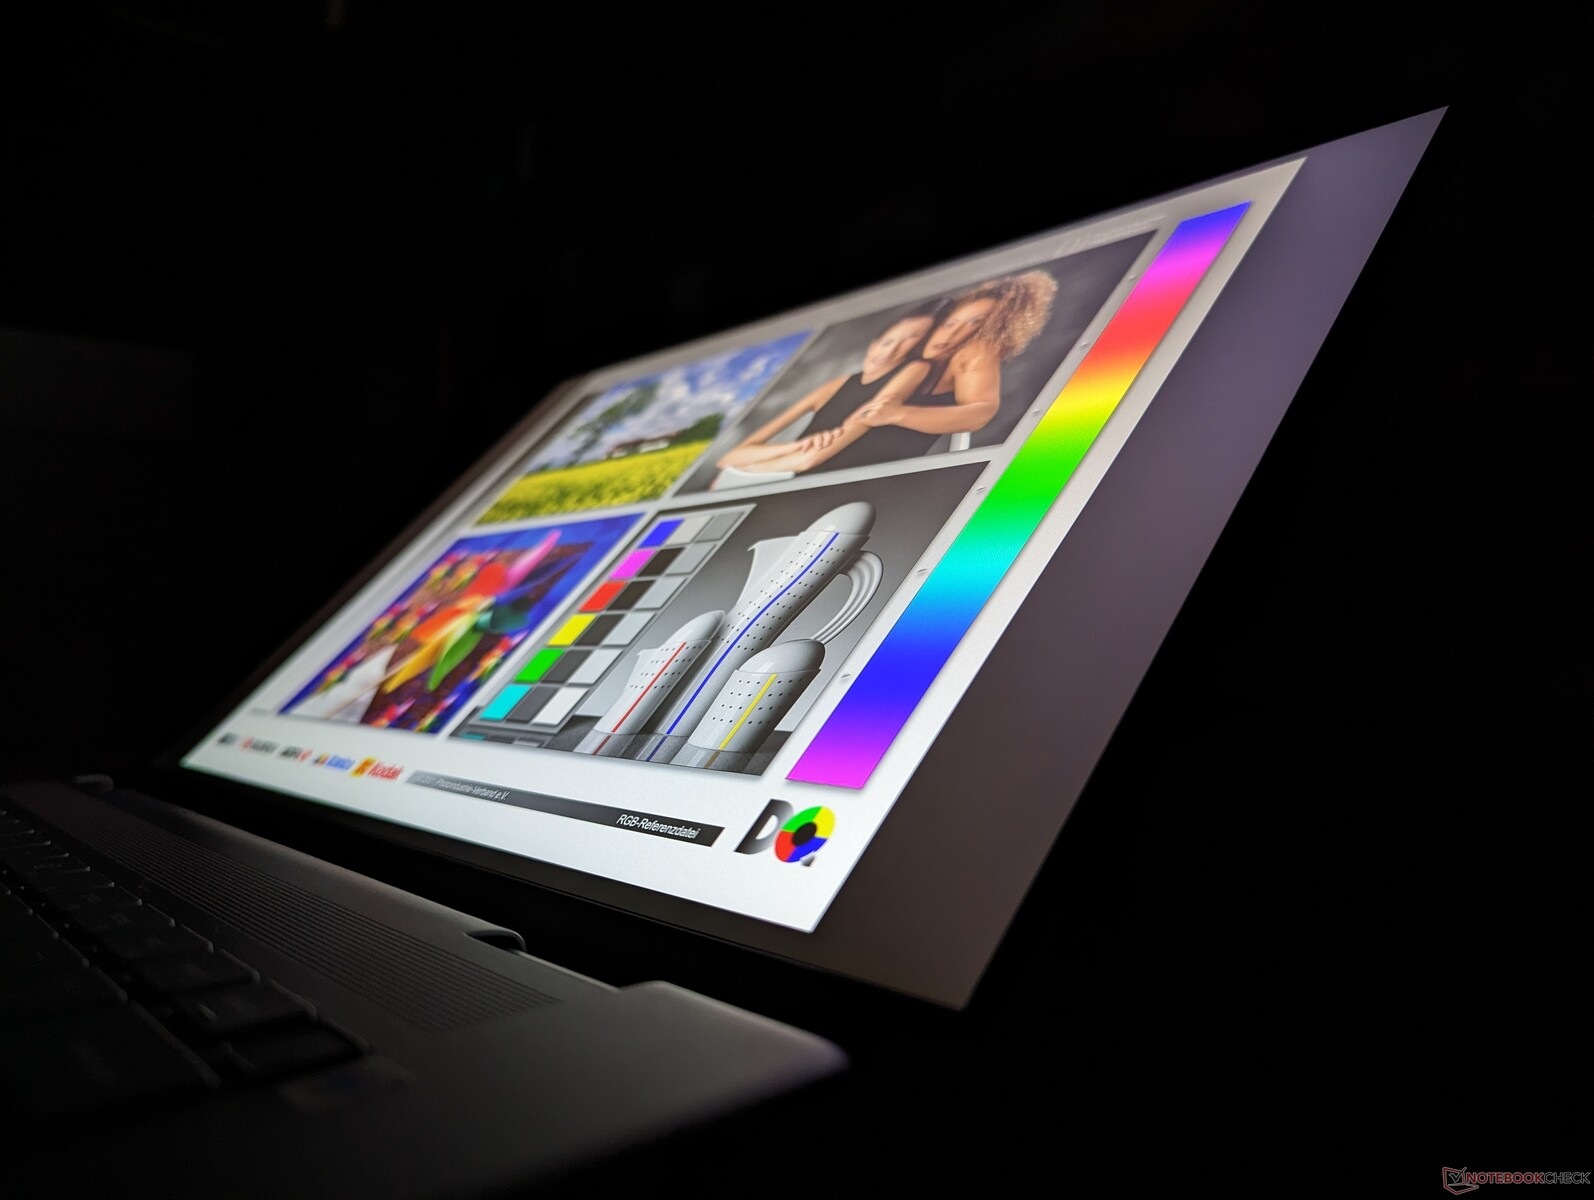
Display - FHD+ und QHD+ Optionen
Es stehen zwei Anzeigeoptionen zur Verfügung:
- 1.920 x 1.200, 60 Hz, Touchscreen, glänzend
- 2.560 x 1.600, 120 Hz, Non-Touchscreen, matt
Unser Gerät wird mit dem oben fettgedruckten Panel geliefert. Beachten Sie, dass die offizielle Dell Produktseite fälschlicherweise 60 Hz für das 1.600p-Panel angibt. Wir können bestätigen, dass dieses Panel native Bildwiederholraten von 120 Hz und 48 Hz ohne G-Sync-Unterstützung unterstützt, ähnlich wie das Inspiron 16 Plus 7630 aus dem letzten Jahr.
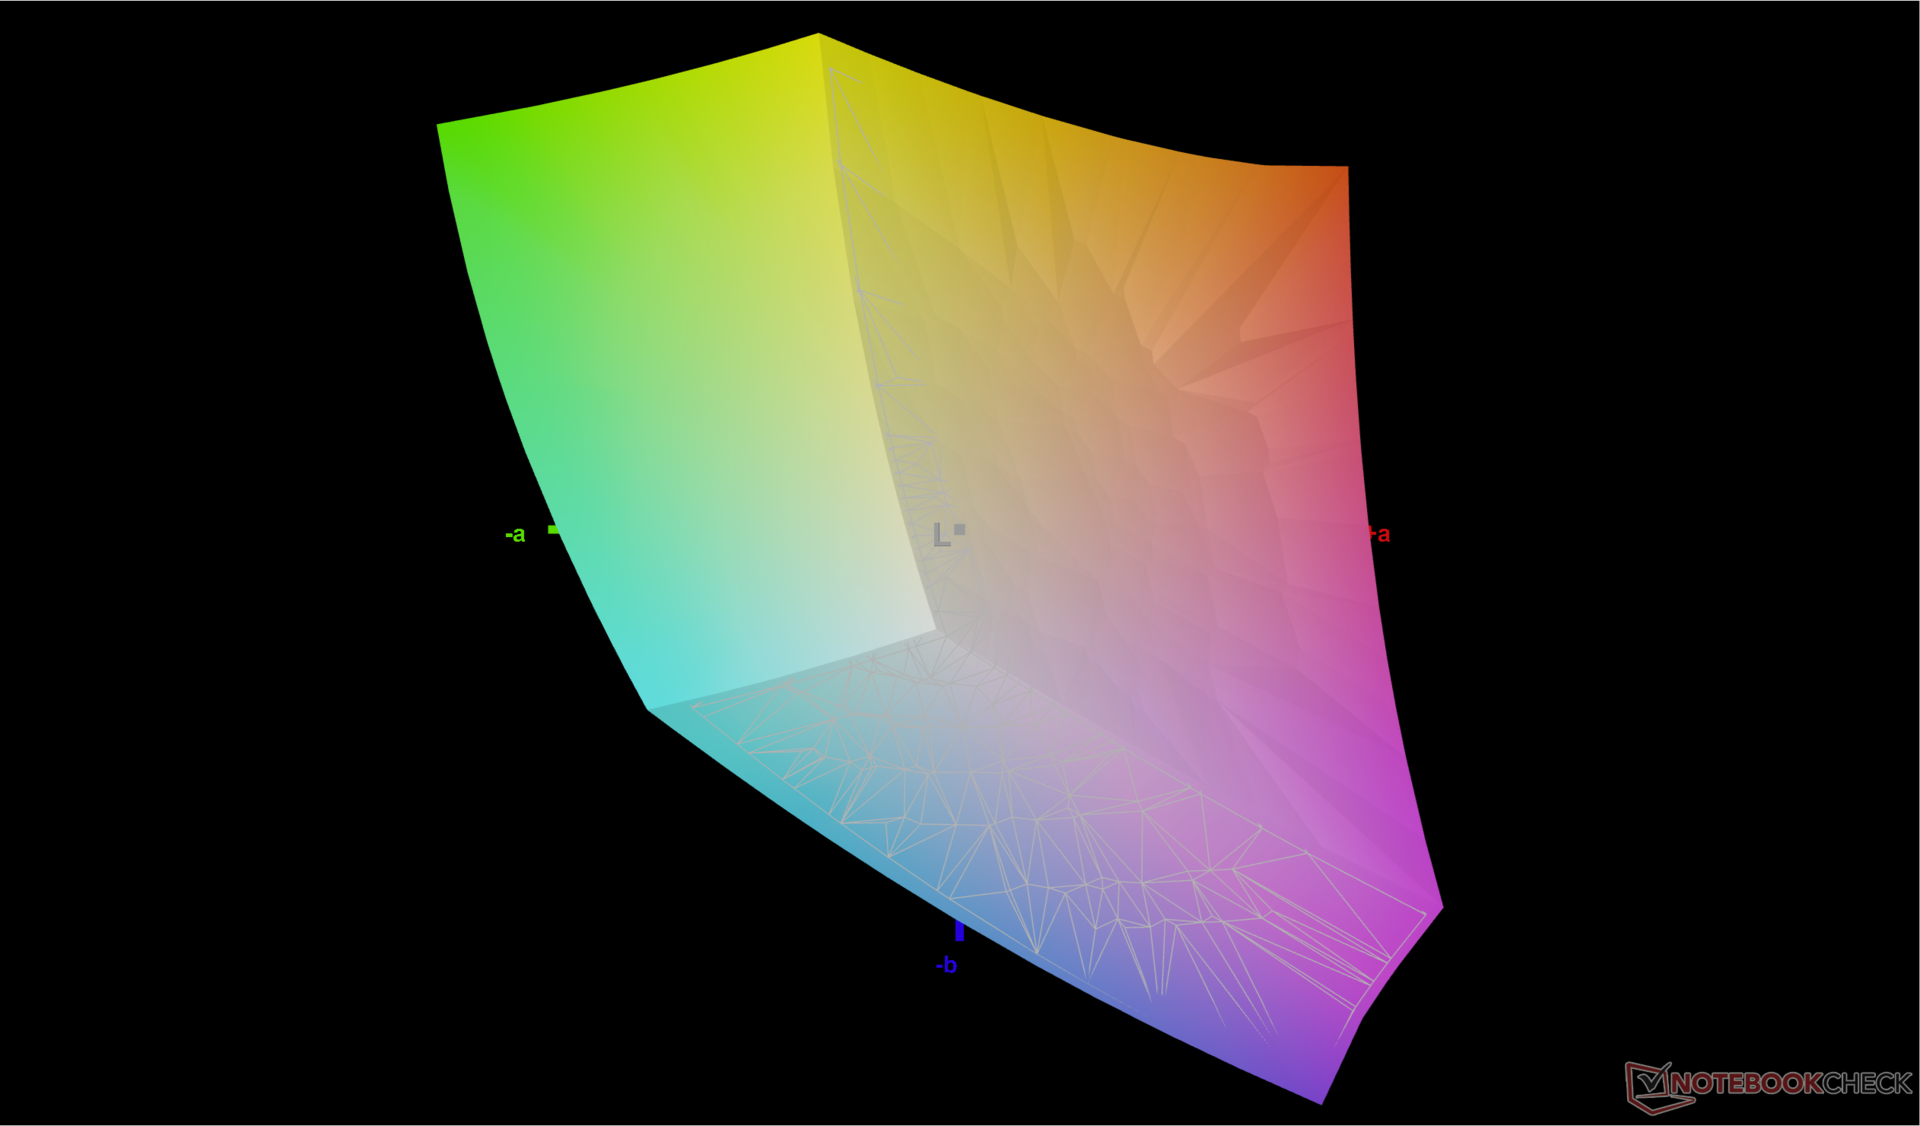
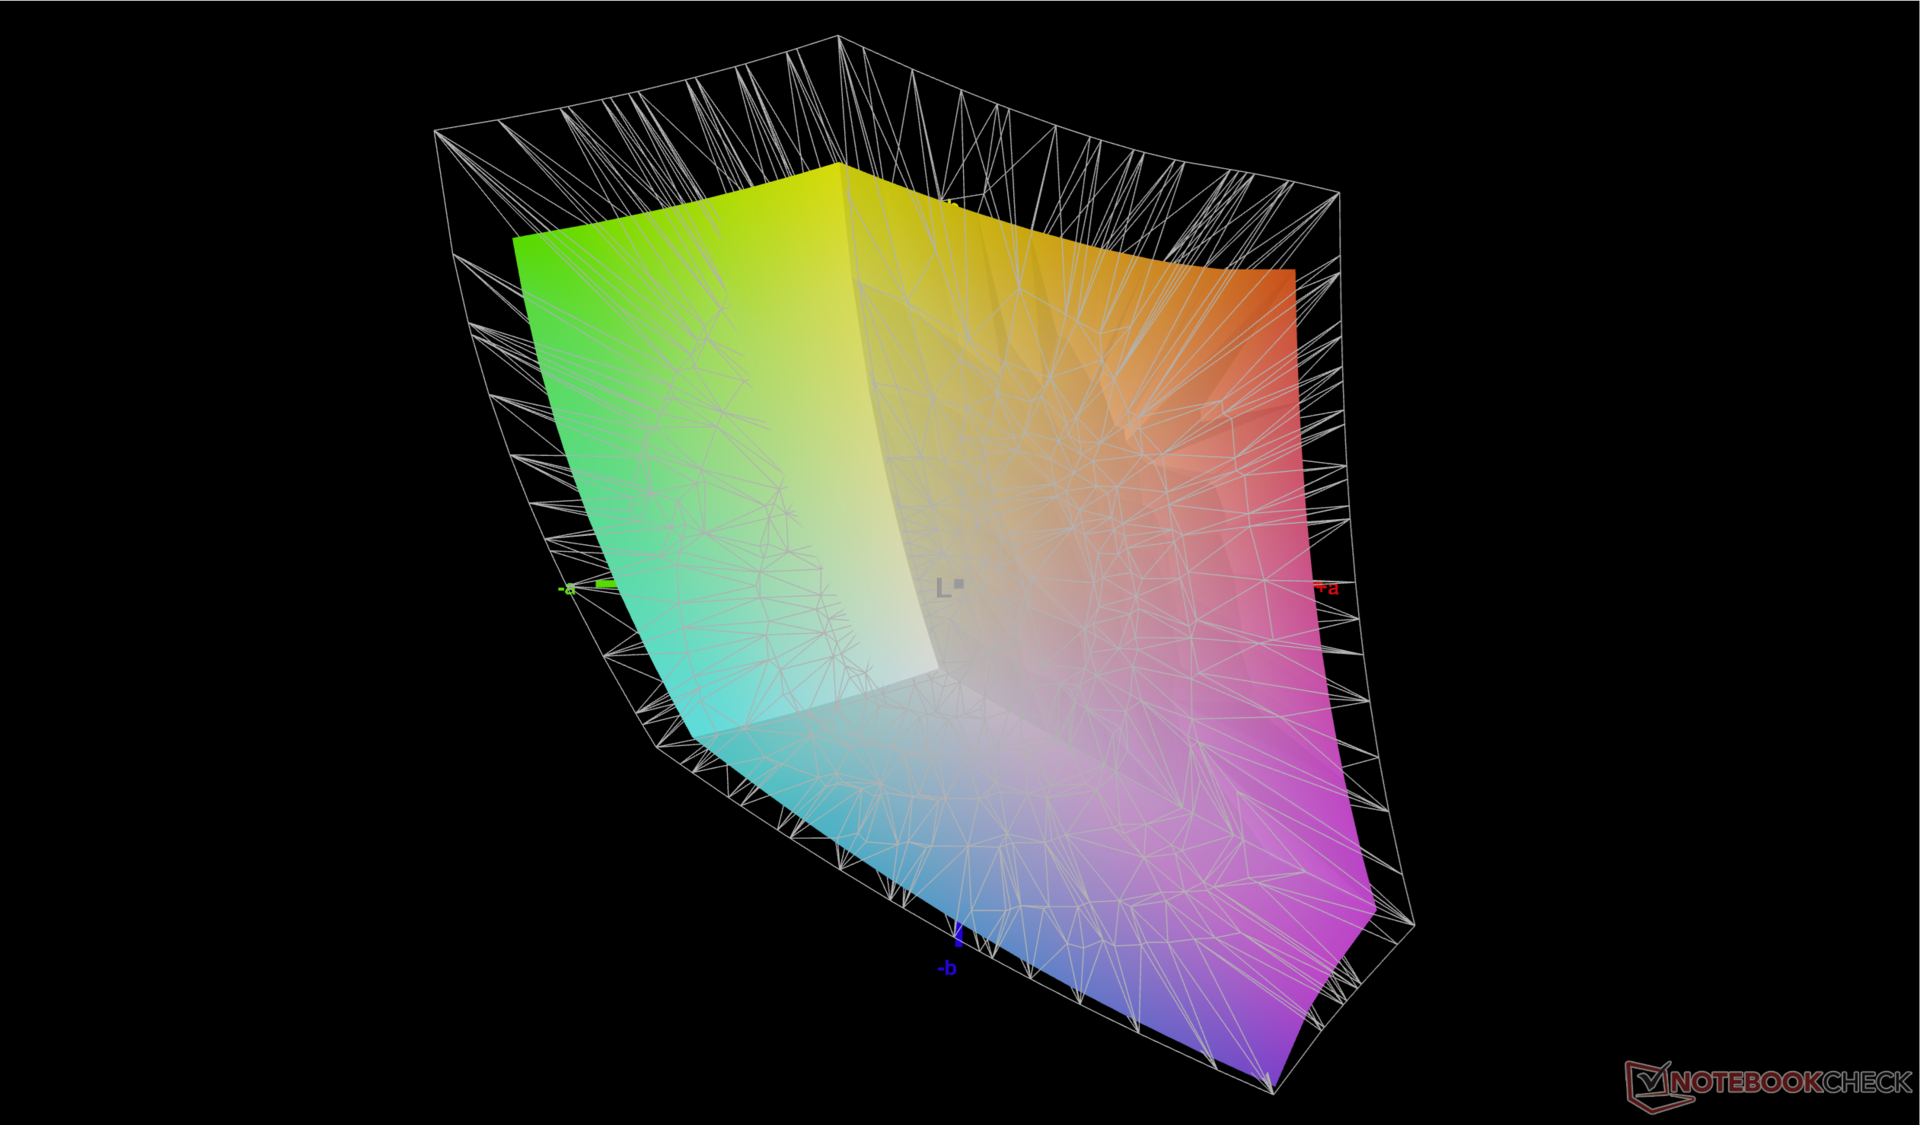
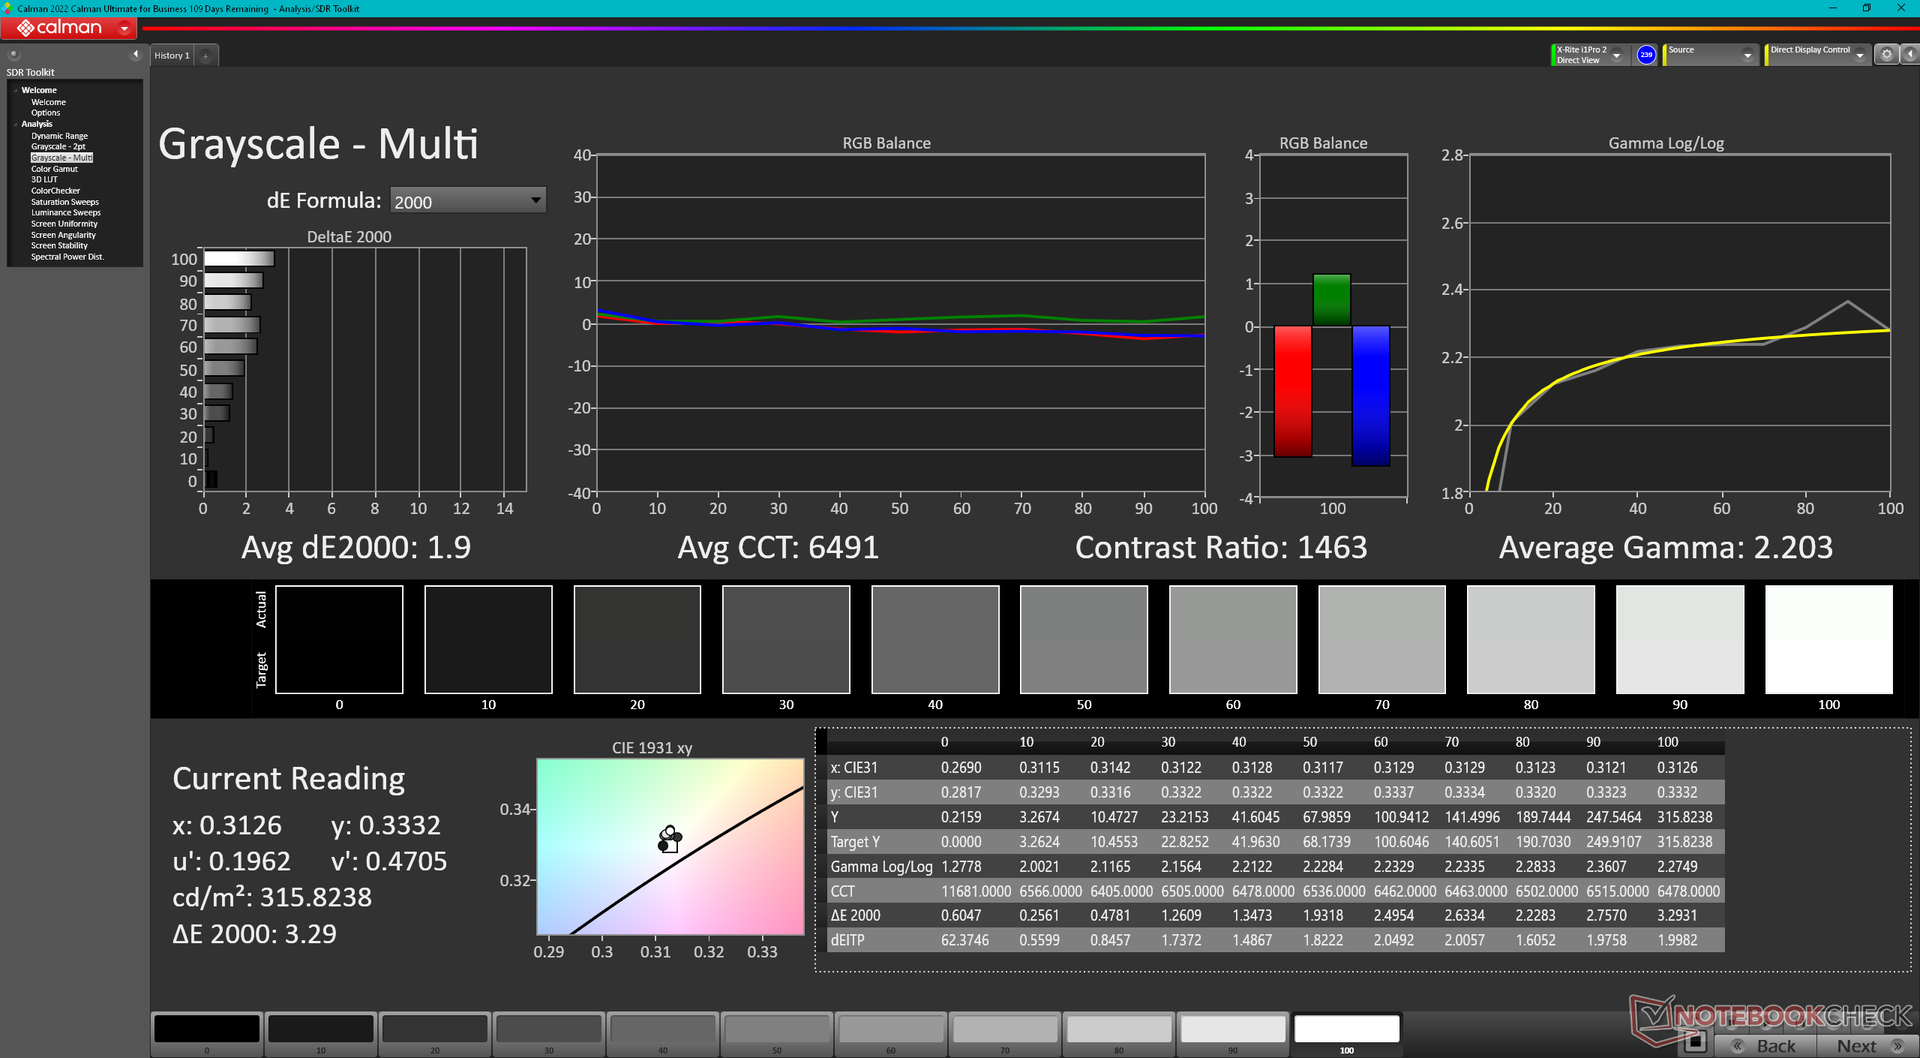
Interessanterweise hat Dell für das diesjährige Inspiron 16 Plus 7640 den Panel-Anbieter von LG Philips zu AU Optronics gewechselt. Das neuere Panel bietet schnellere Reaktionszeiten zur Minimierung von Ghosting und bietet gleichzeitig ähnliche sRGB-Farben, Helligkeitsstufen und Kontrastverhältnisse wie zuvor.

| |||||||||||||||||||||||||
Ausleuchtung: 89 %
Helligkeit Akku: 314.7 cd/m²
Kontrast: 1124:1 (Schwarzwert: 0.28 cd/m²)
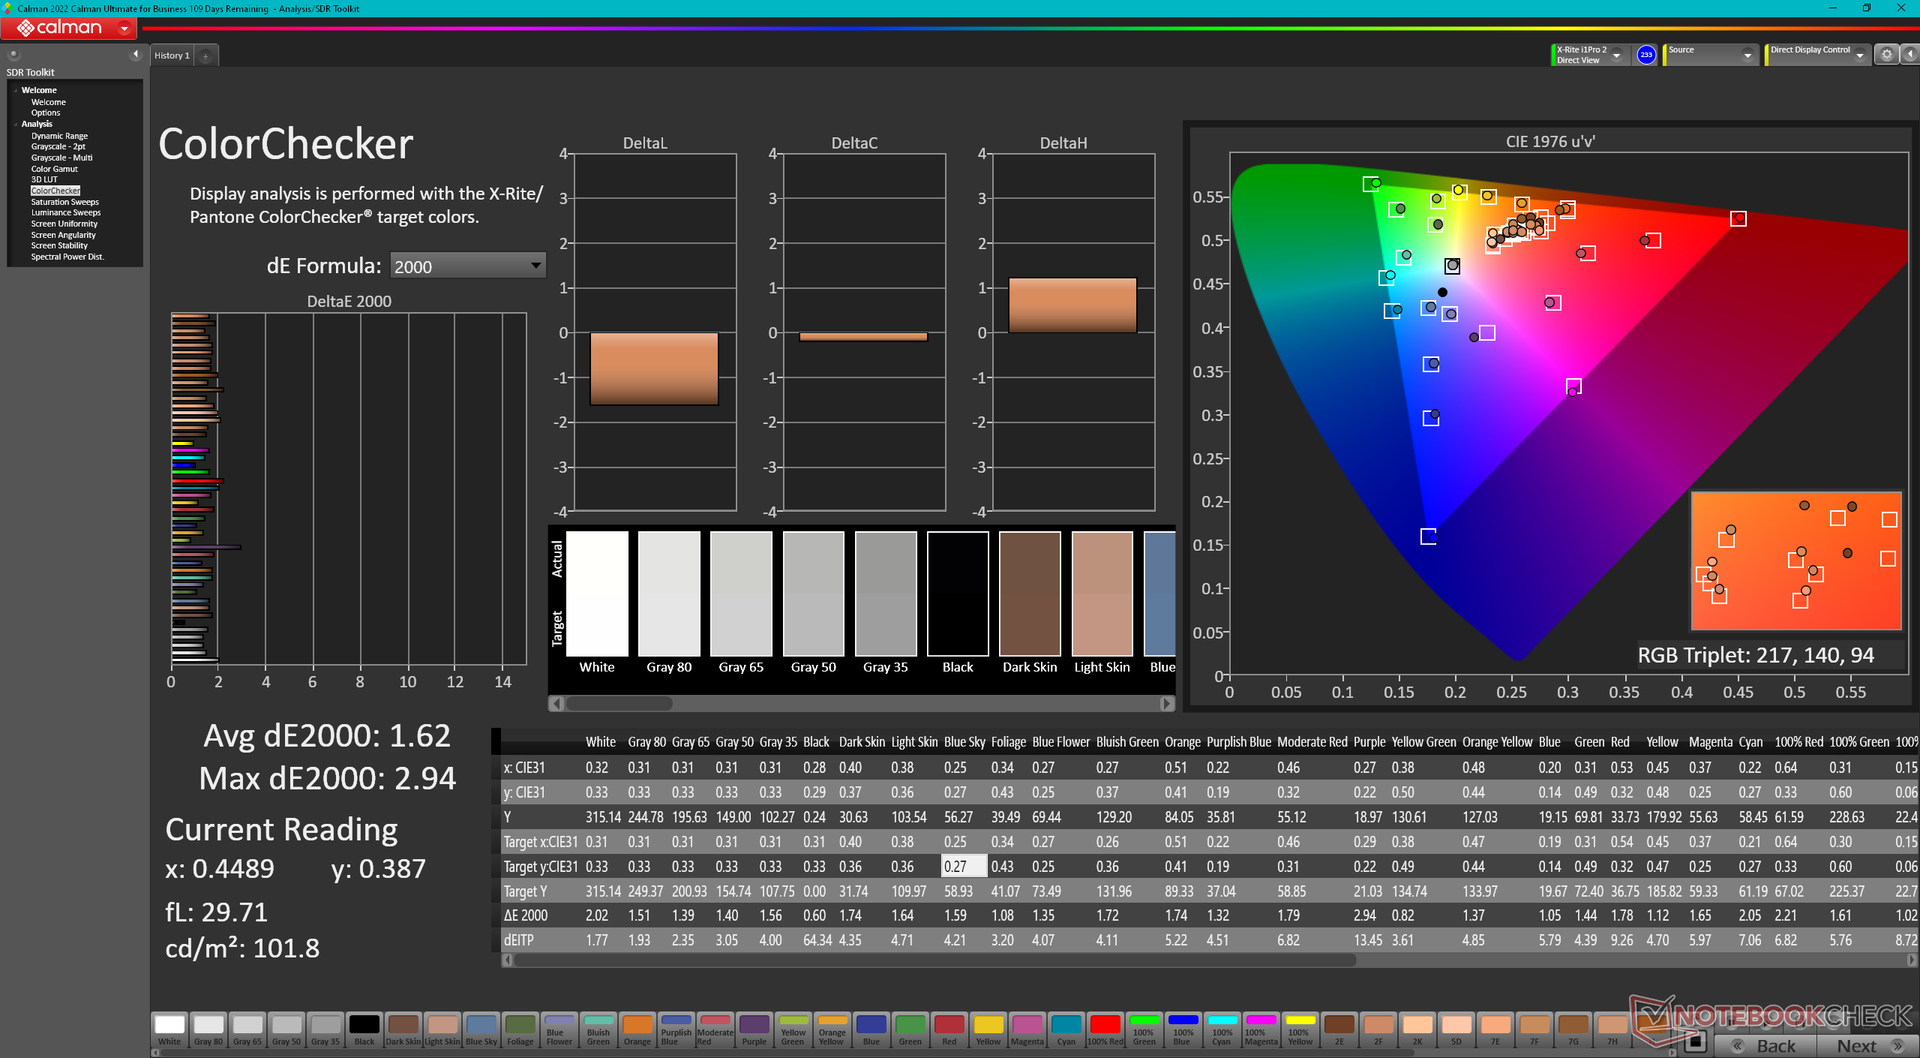
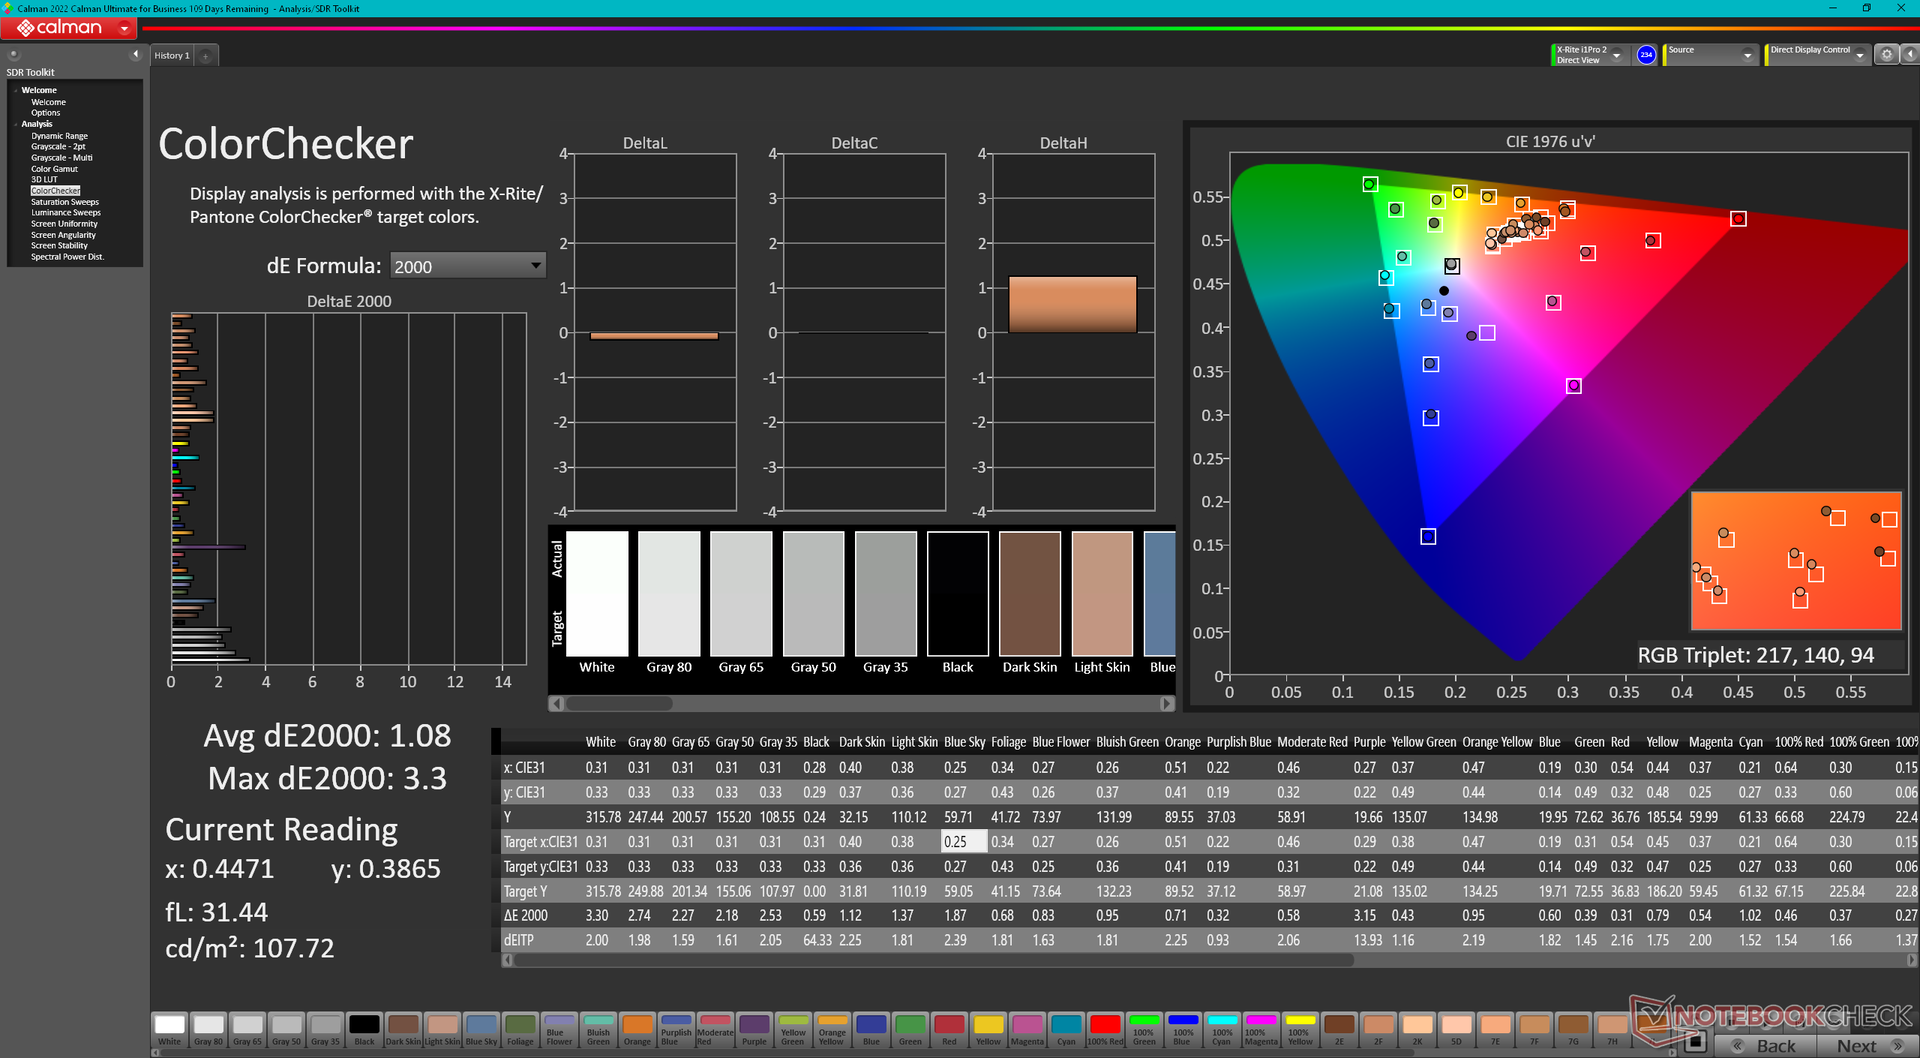
ΔE ColorChecker Calman: 1.62 | ∀{0.5-29.43 Ø4.78}
calibrated: 1.08
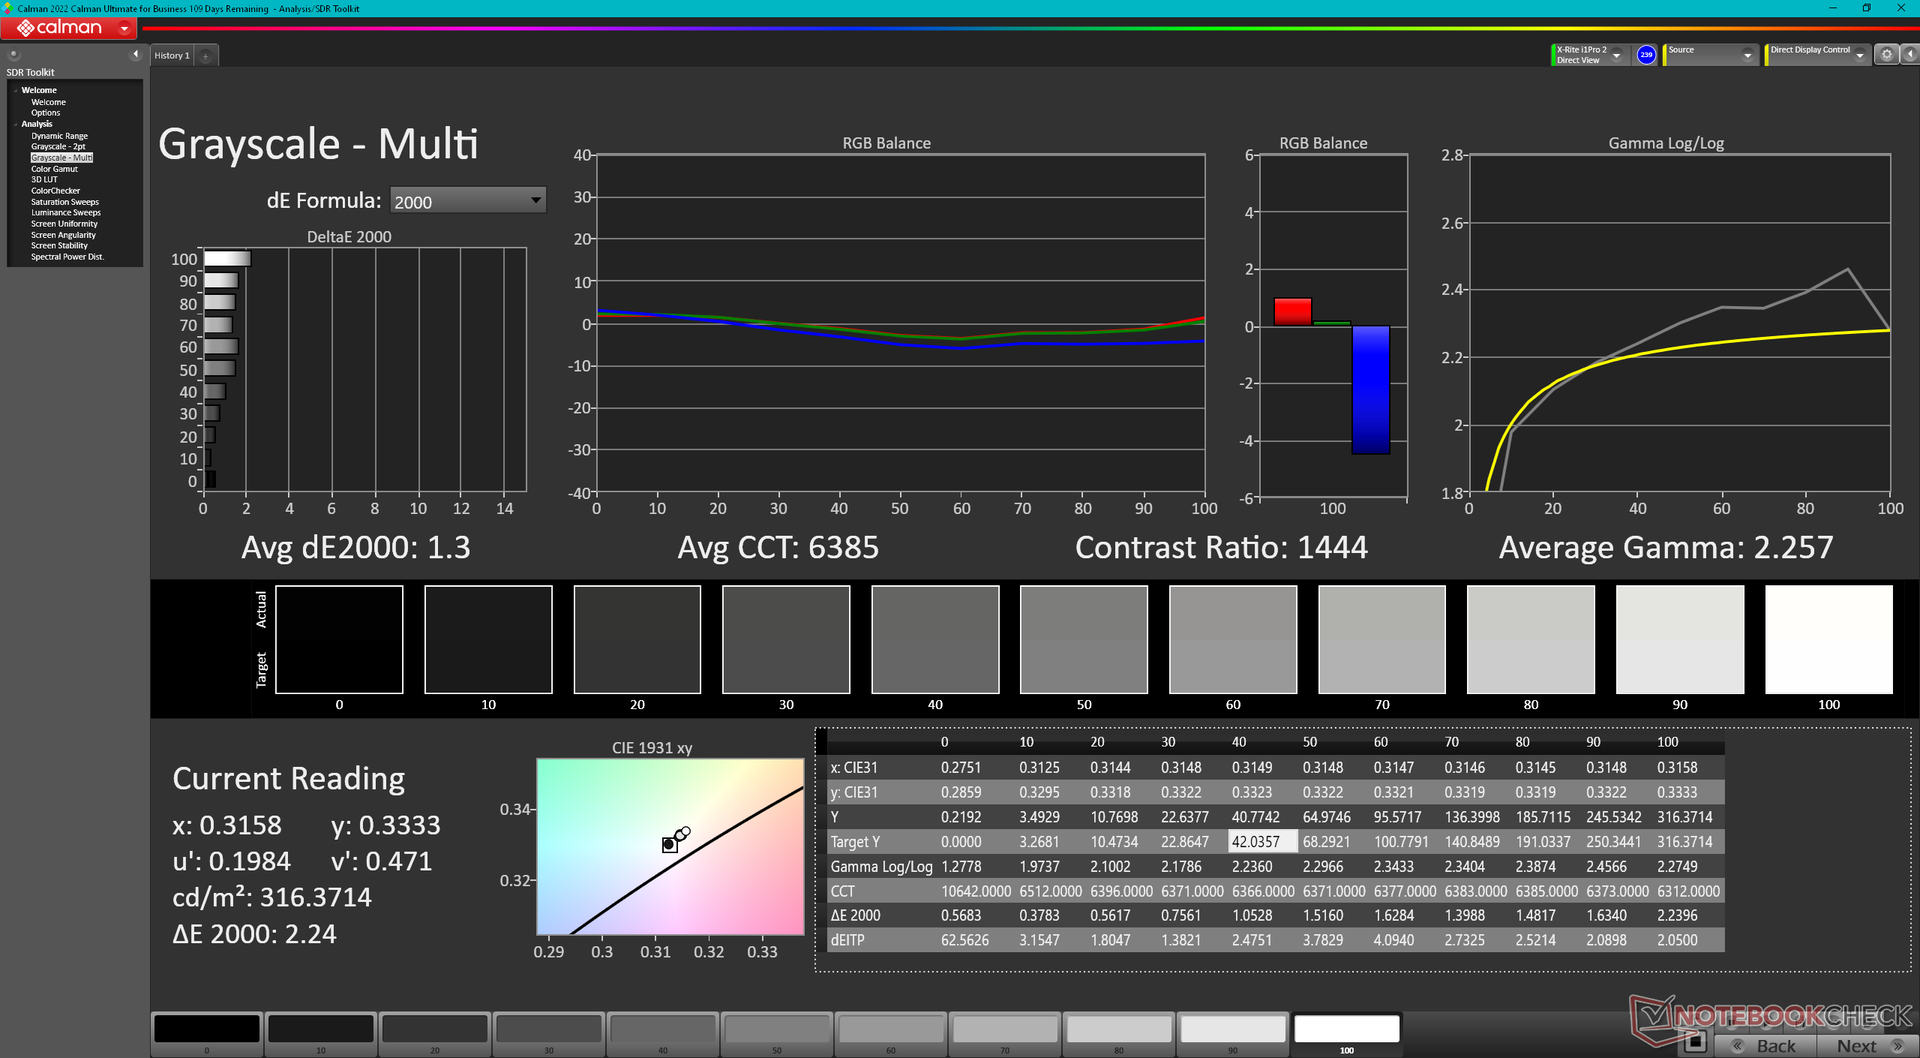
ΔE Greyscale Calman: 1.3 | ∀{0.09-98 Ø5}
76.7% AdobeRGB 1998 (Argyll 3D)
99.8% sRGB (Argyll 3D)
76% Display P3 (Argyll 3D)
Gamma: 2.26
CCT: 6385 K
| Dell Inspiron 16 Plus 7640 AU Optronics B160QAN, IPS, 2560x1600, 16" | Dell Inspiron 16 Plus 7630 LG Philips 160WQ2, IPS, 2560x1600, 16" | Dell Inspiron 16 Plus 7620 BOE NE16N41, IPS, 3072x1920, 16" | Samsung Galaxy Book4 Ultra ATNA60CL07-0, OLED, 2880x1800, 16" | Lenovo Legion 5 16IRX G9 NE160QDM-NZ3, IPS, 2560x1600, 16" | Asus VivoBook Pro 16 K6602VU Samsung ATNA60BX01-1, OLED, 3200x2000, 16" | |
|---|---|---|---|---|---|---|
| Display | -5% | -4% | 15% | -3% | 19% | |
| Display P3 Coverage (%) | 76 | 70.1 -8% | 70.8 -7% | 98.6 30% | 72.4 -5% | 98.7 30% |
| sRGB Coverage (%) | 99.8 | 99.6 0% | 99.5 0% | 99.9 0% | 100 0% | 99.7 0% |
| AdobeRGB 1998 Coverage (%) | 76.7 | 72.3 -6% | 73.2 -5% | 88.5 15% | 74.1 -3% | 96.5 26% |
| Response Times | -38% | -54% | 97% | 51% | 61% | |
| Response Time Grey 50% / Grey 80% * (ms) | 25.6 ? | 35 ? -37% | 38 ? -48% | 0.54 ? 98% | 12.5 ? 51% | 0.68 ? 97% |
| Response Time Black / White * (ms) | 17.6 ? | 24.2 ? -38% | 28 ? -59% | 0.69 ? 96% | 8.7 ? 51% | 13.2 ? 25% |
| PWM Frequency (Hz) | 240 ? | 240 ? | ||||
| Bildschirm | -57% | -2% | 5% | 25% | -68% | |
| Helligkeit Bildmitte (cd/m²) | 314.7 | 299.4 -5% | 288.9 -8% | 390 24% | 526 67% | 353 12% |
| Brightness (cd/m²) | 291 | 290 0% | 276 -5% | 393 35% | 500 72% | 354 22% |
| Brightness Distribution (%) | 89 | 92 3% | 92 3% | 98 10% | 87 -2% | 98 10% |
| Schwarzwert * (cd/m²) | 0.28 | 0.21 25% | 0.26 7% | 0.33 -18% | ||
| Kontrast (:1) | 1124 | 1426 27% | 1111 -1% | 1594 42% | ||
| Delta E Colorchecker * | 1.62 | 4.25 -162% | 1.88 -16% | 1.4 14% | 1.2 26% | 4.23 -161% |
| Colorchecker dE 2000 max. * | 2.94 | 6.71 -128% | 4.37 -49% | 2.7 8% | 2.1 29% | 7.13 -143% |
| Colorchecker dE 2000 calibrated * | 1.08 | 0.52 52% | 0.42 61% | 1 7% | 2.42 -124% | |
| Delta E Graustufen * | 1.3 | 5.5 -323% | 1.4 -8% | 2.1 -62% | 1.3 -0% | 2.5 -92% |
| Gamma | 2.26 97% | 2.35 94% | 2.3 96% | 2.27 97% | 2.23 99% | 2.4 92% |
| CCT | 6385 102% | 6368 102% | 6634 98% | 6431 101% | 6391 102% | 6642 98% |
| Durchschnitt gesamt (Programm / Settings) | -33% /
-43% | -20% /
-10% | 39% /
24% | 24% /
23% | 4% /
-25% |
* ... kleinere Werte sind besser
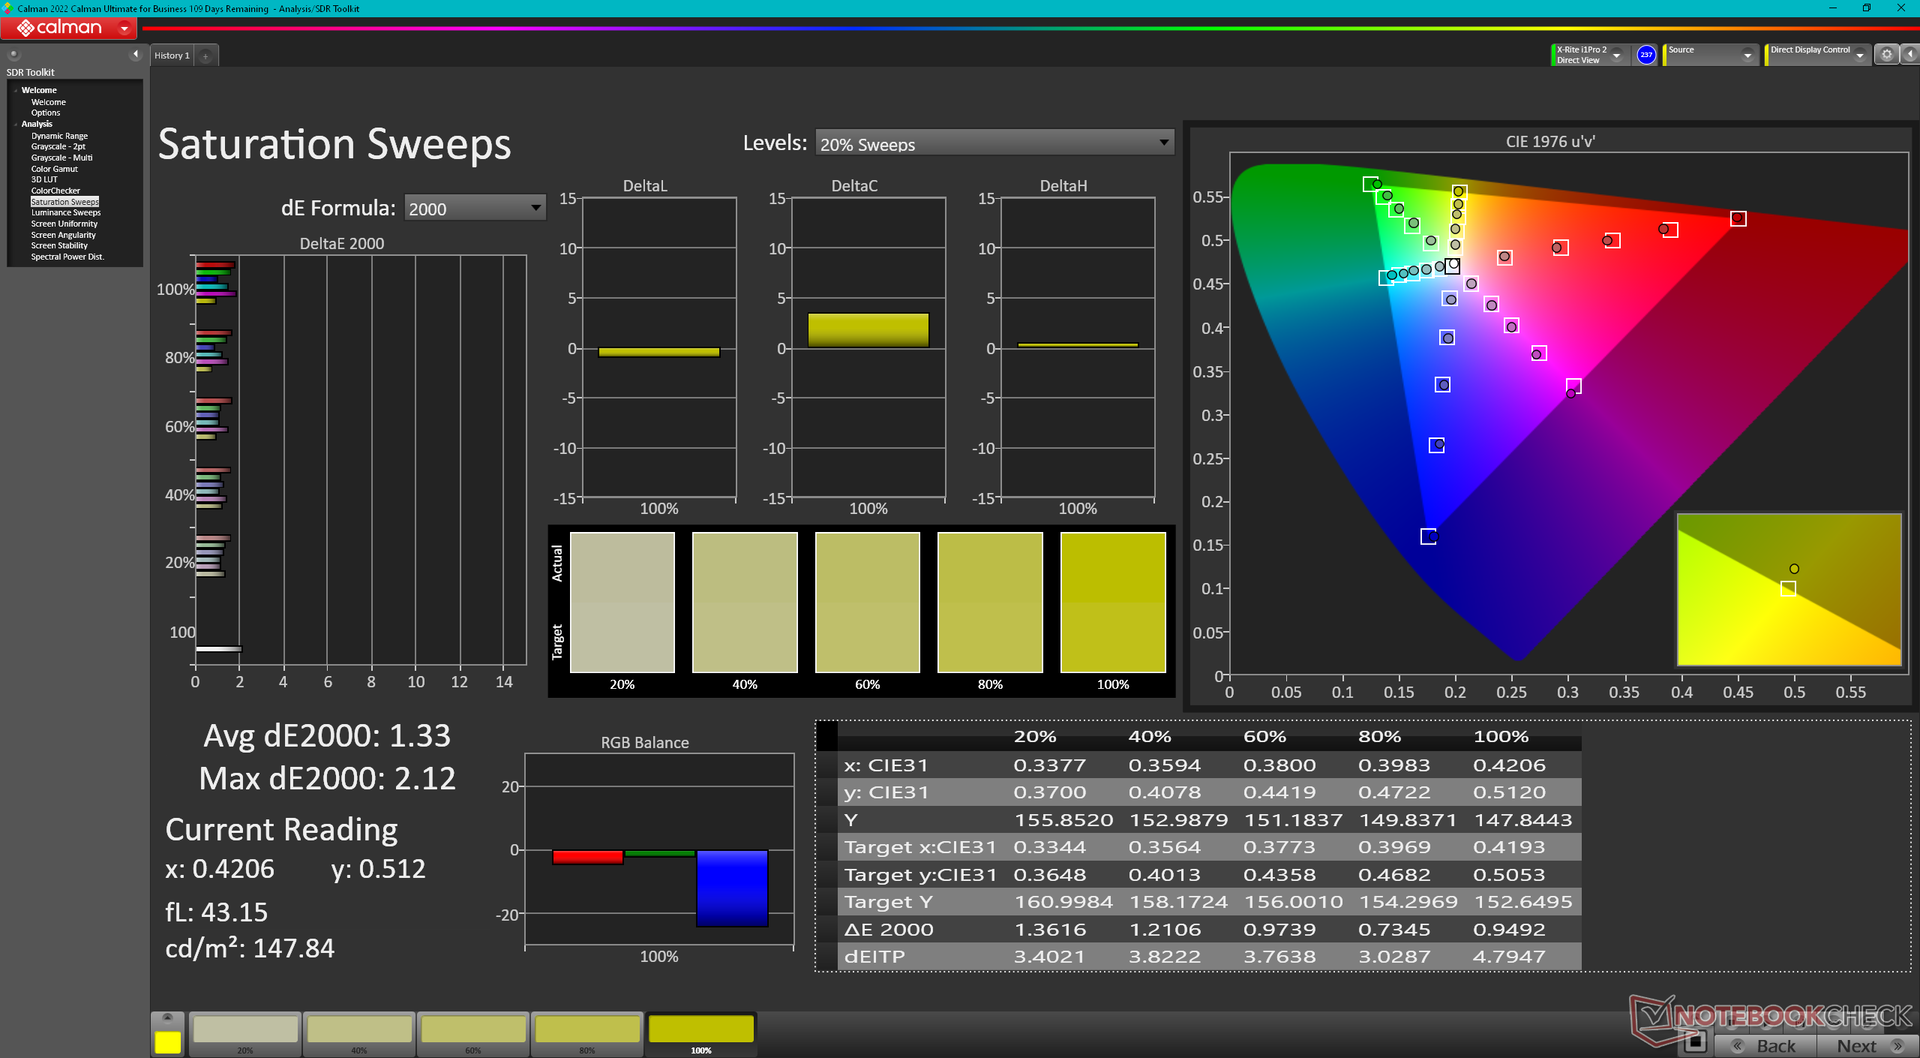
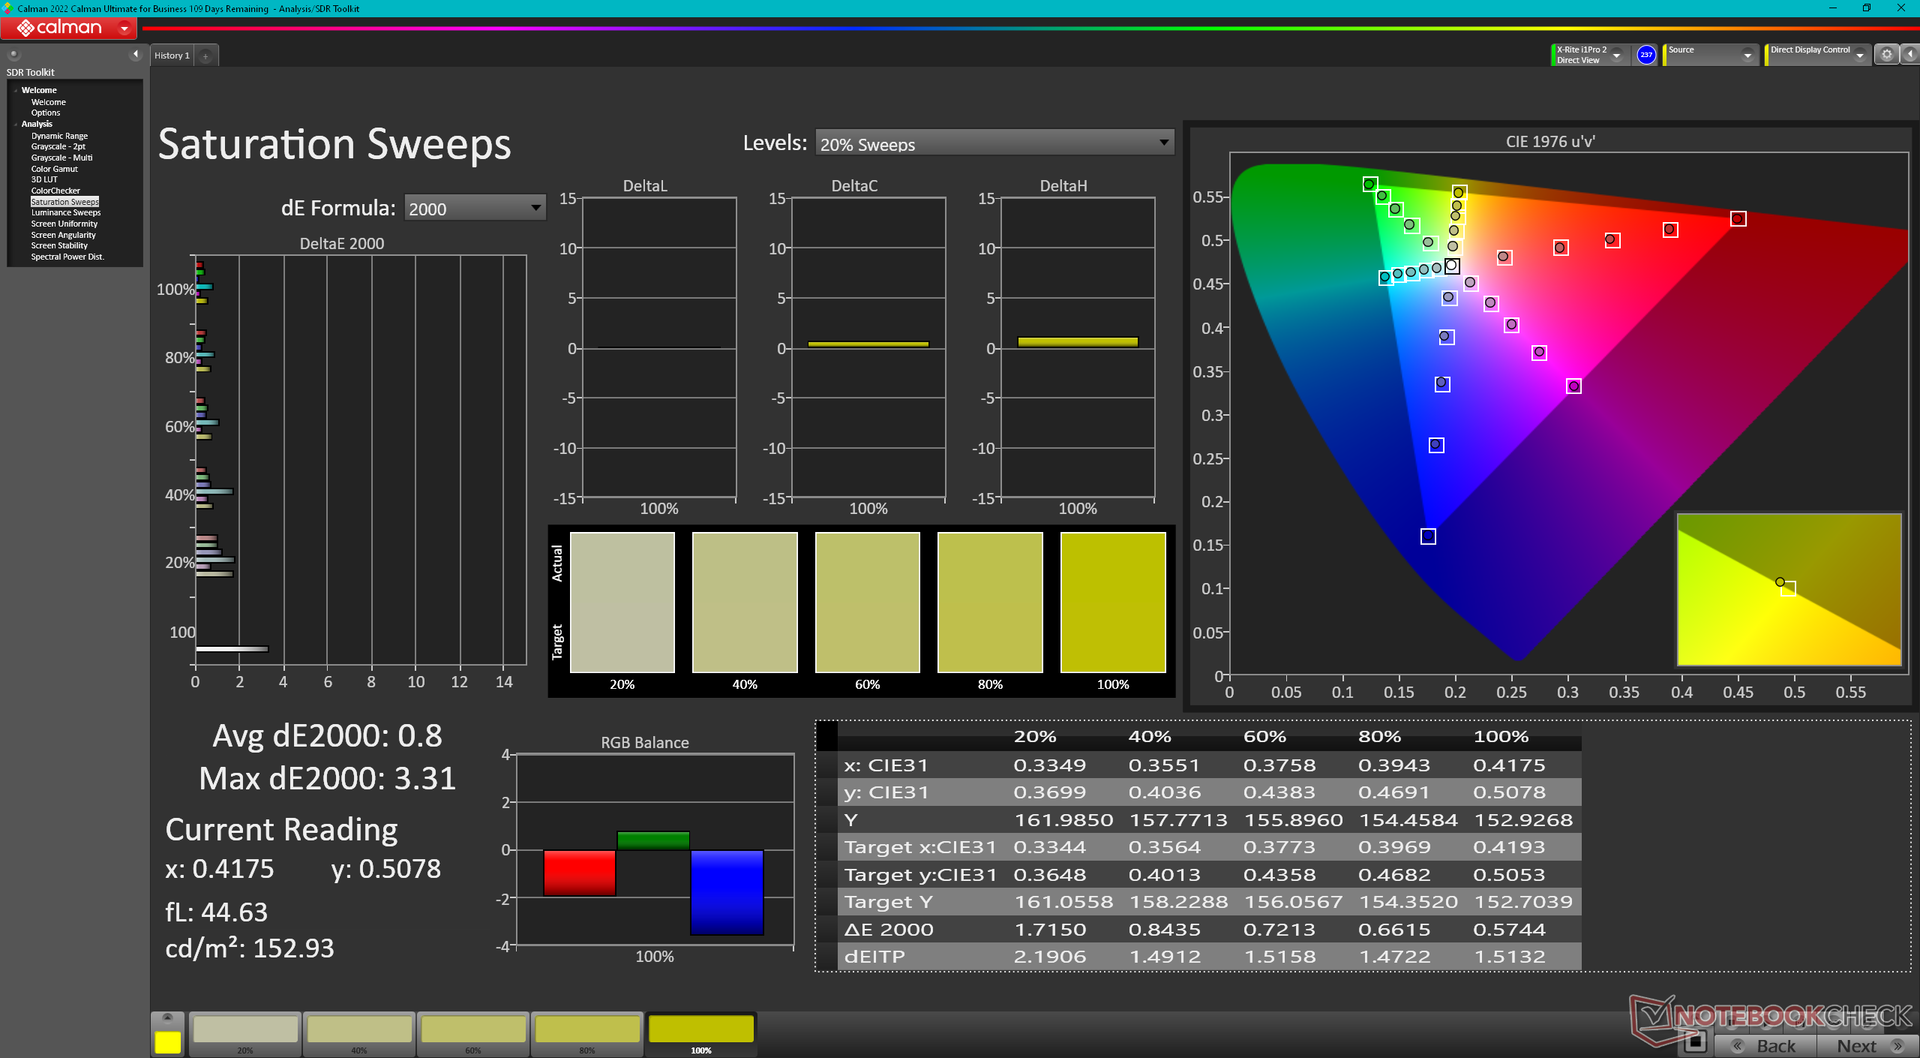
Das Display wird gut kalibriert geliefert ab Werk. Das ist überraschend, wenn man bedenkt, dass die Inspiron Serie in der Regel preisgünstiger ist und weniger Wert auf Farbgenauigkeit legt als die höherwertige XPS-Serie. Der Versuch, das Panel selbst zu kalibrieren, würde nur zu leichten Verbesserungen der durchschnittlichen DeltaE-Werte führen, wie die Screenshots unten zeigen. Eine Kalibrierung durch den Endbenutzer ist daher für die meisten Benutzer nicht notwendig.
Reaktionszeiten (Response Times) des Displays
| ↔ Reaktionszeiten Schwarz zu Weiß | ||
|---|---|---|
| 17.6 ms ... steigend ↗ und fallend ↘ kombiniert | ↗ 8.5 ms steigend | 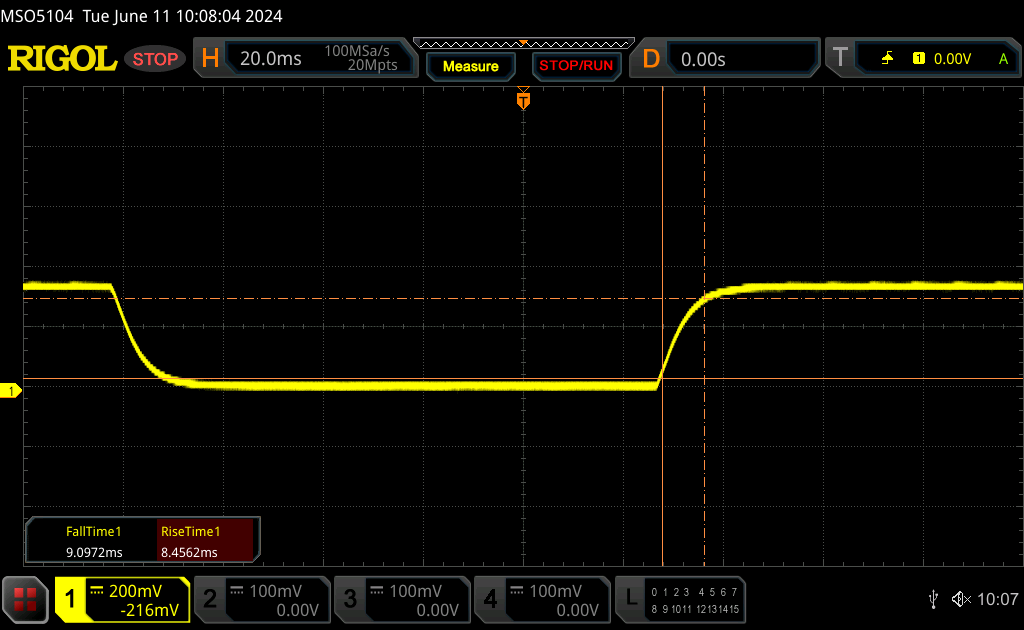 |
| ↘ 9.1 ms fallend | ||
| Die gemessenen Reaktionszeiten sind gut, für anspruchsvolle Spieler könnten der Bildschirm jedoch zu langsam sein. Im Vergleich rangierten die bei uns getesteten Geräte von 0.1 (Minimum) zu 240 (Maximum) ms. » 38 % aller Screens waren schneller als der getestete. Daher sind die gemessenen Reaktionszeiten besser als der Durchschnitt aller vermessenen Geräte (20.2 ms). | ||
| ↔ Reaktionszeiten 50% Grau zu 80% Grau | ||
| 25.6 ms ... steigend ↗ und fallend ↘ kombiniert | ↗ 12.3 ms steigend | 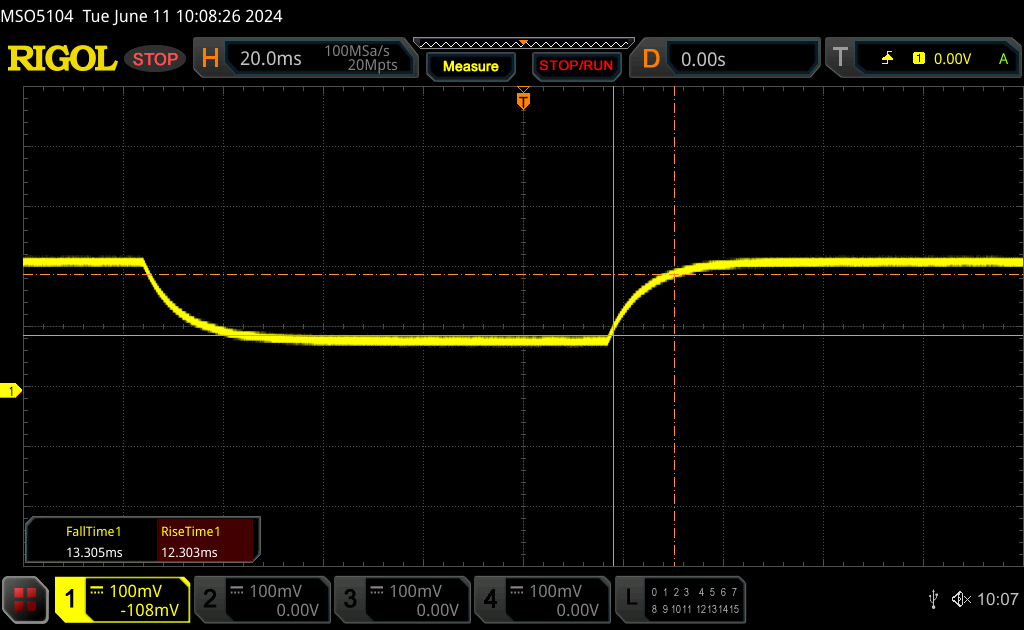 |
| ↘ 13.3 ms fallend | ||
| Die gemessenen Reaktionszeiten sind mittelmäßig und dadurch für Spieler eventuell zu langsam. Im Vergleich rangierten die bei uns getesteten Geräte von 0.165 (Minimum) zu 636 (Maximum) ms. » 34 % aller Screens waren schneller als der getestete. Daher sind die gemessenen Reaktionszeiten besser als der Durchschnitt aller vermessenen Geräte (31.6 ms). | ||
Bildschirm-Flackern / PWM (Pulse-Width Modulation)
| Flackern / PWM nicht festgestellt | 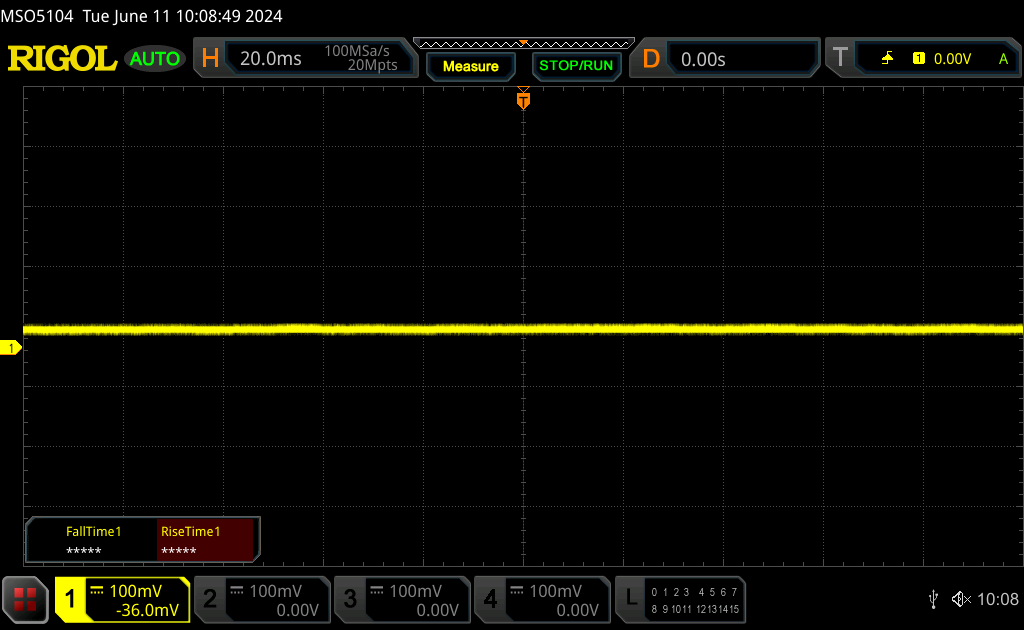 | ||
Im Vergleich: 53 % aller getesteten Geräte nutzten kein PWM um die Helligkeit zu reduzieren. Wenn PWM eingesetzt wurde, dann bei einer Frequenz von durchschnittlich 8091 (Minimum 5, Maximum 343500) Hz. | |||

Performance - KI-fähig
Testbedingungen
Wir haben Windows in den Modus Performance versetzt, bevor wir die folgenden Benchmarks durchgeführt haben.
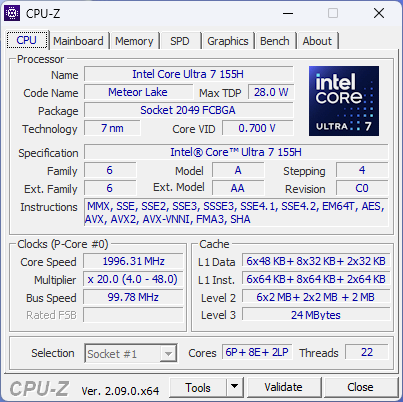
Prozessor
Die Leistung unseres Core Ultra 7 155H ist hervorragend, mit Multi-Thread-Ergebnissen, die 15 bis 20 Prozent schneller sind als bei anderen Laptops mit demselben Prozessor. Im Vergleich mit dem Core i7-13700H im letztjährigen Inspiron 16 Plus 7630 ist die neuere CPU jedoch nur etwa zehn Prozent schneller, so dass sie für die meisten Aufgaben kaum wahrnehmbar ist. Tatsächlich scheint die ältere CPU einen leichten Vorteil zu haben, wenn es um Single-Thread-Workloads geht.
Der Joker des Core Ultra 7 155H liegt natürlich in der integrierten NPU, die für KI-beschleunigte Aufgaben sehr nützlich sein dürfte, sobald diese besser verfügbar sind. Ansonsten ist ihr Nutzen zum Zeitpunkt der Erstellung dieses Artikels äußerst begrenzt.
Cinebench R15 Multi Loop
Cinebench R23: Multi Core | Single Core
Cinebench R20: CPU (Multi Core) | CPU (Single Core)
Cinebench R15: CPU Multi 64Bit | CPU Single 64Bit
Blender: v2.79 BMW27 CPU
7-Zip 18.03: 7z b 4 | 7z b 4 -mmt1
Geekbench 6.5: Multi-Core | Single-Core
Geekbench 5.5: Multi-Core | Single-Core
HWBOT x265 Benchmark v2.2: 4k Preset
LibreOffice : 20 Documents To PDF
R Benchmark 2.5: Overall mean
* ... kleinere Werte sind besser
AIDA64: FP32 Ray-Trace | FPU Julia | CPU SHA3 | CPU Queen | FPU SinJulia | FPU Mandel | CPU AES | CPU ZLib | FP64 Ray-Trace | CPU PhotoWorxx
| Performance Rating | |
| Lenovo Legion 5 16IRX G9 | |
| Asus VivoBook Pro 16 K6602VU | |
| Samsung Galaxy Book4 Ultra | |
| Dell Inspiron 16 Plus 7640 | |
| Durchschnittliche Intel Core Ultra 7 155H | |
| Dell Inspiron 16 Plus 7630 | |
| Dell Inspiron 16 Plus 7620 | |
| AIDA64 / FP32 Ray-Trace | |
| Lenovo Legion 5 16IRX G9 | |
| Dell Inspiron 16 Plus 7640 | |
| Dell Inspiron 16 Plus 7630 | |
| Asus VivoBook Pro 16 K6602VU | |
| Samsung Galaxy Book4 Ultra | |
| Durchschnittliche Intel Core Ultra 7 155H (6670 - 18470, n=50) | |
| Dell Inspiron 16 Plus 7620 | |
| AIDA64 / FPU Julia | |
| Lenovo Legion 5 16IRX G9 | |
| Asus VivoBook Pro 16 K6602VU | |
| Samsung Galaxy Book4 Ultra | |
| Dell Inspiron 16 Plus 7640 | |
| Durchschnittliche Intel Core Ultra 7 155H (40905 - 93181, n=50) | |
| Dell Inspiron 16 Plus 7630 | |
| Dell Inspiron 16 Plus 7620 | |
| AIDA64 / CPU SHA3 | |
| Lenovo Legion 5 16IRX G9 | |
| Dell Inspiron 16 Plus 7640 | |
| Asus VivoBook Pro 16 K6602VU | |
| Samsung Galaxy Book4 Ultra | |
| Durchschnittliche Intel Core Ultra 7 155H (1940 - 4436, n=50) | |
| Dell Inspiron 16 Plus 7630 | |
| Dell Inspiron 16 Plus 7620 | |
| AIDA64 / CPU Queen | |
| Dell Inspiron 16 Plus 7630 | |
| Lenovo Legion 5 16IRX G9 | |
| Asus VivoBook Pro 16 K6602VU | |
| Dell Inspiron 16 Plus 7620 | |
| Dell Inspiron 16 Plus 7640 | |
| Samsung Galaxy Book4 Ultra | |
| Durchschnittliche Intel Core Ultra 7 155H (64698 - 94181, n=50) | |
| AIDA64 / FPU SinJulia | |
| Lenovo Legion 5 16IRX G9 | |
| Dell Inspiron 16 Plus 7640 | |
| Samsung Galaxy Book4 Ultra | |
| Durchschnittliche Intel Core Ultra 7 155H (5639 - 10647, n=50) | |
| Dell Inspiron 16 Plus 7630 | |
| Asus VivoBook Pro 16 K6602VU | |
| Dell Inspiron 16 Plus 7620 | |
| AIDA64 / FPU Mandel | |
| Lenovo Legion 5 16IRX G9 | |
| Dell Inspiron 16 Plus 7640 | |
| Samsung Galaxy Book4 Ultra | |
| Durchschnittliche Intel Core Ultra 7 155H (18236 - 47685, n=50) | |
| Asus VivoBook Pro 16 K6602VU | |
| Dell Inspiron 16 Plus 7630 | |
| Dell Inspiron 16 Plus 7620 | |
| AIDA64 / CPU AES | |
| Asus VivoBook Pro 16 K6602VU | |
| Lenovo Legion 5 16IRX G9 | |
| Durchschnittliche Intel Core Ultra 7 155H (45713 - 152179, n=50) | |
| Samsung Galaxy Book4 Ultra | |
| Dell Inspiron 16 Plus 7640 | |
| Dell Inspiron 16 Plus 7620 | |
| Dell Inspiron 16 Plus 7630 | |
| AIDA64 / CPU ZLib | |
| Lenovo Legion 5 16IRX G9 | |
| Dell Inspiron 16 Plus 7640 | |
| Dell Inspiron 16 Plus 7620 | |
| Samsung Galaxy Book4 Ultra | |
| Asus VivoBook Pro 16 K6602VU | |
| Durchschnittliche Intel Core Ultra 7 155H (557 - 1250, n=50) | |
| Dell Inspiron 16 Plus 7630 | |
| AIDA64 / FP64 Ray-Trace | |
| Lenovo Legion 5 16IRX G9 | |
| Asus VivoBook Pro 16 K6602VU | |
| Dell Inspiron 16 Plus 7640 | |
| Dell Inspiron 16 Plus 7630 | |
| Samsung Galaxy Book4 Ultra | |
| Durchschnittliche Intel Core Ultra 7 155H (3569 - 9802, n=50) | |
| Dell Inspiron 16 Plus 7620 | |
| AIDA64 / CPU PhotoWorxx | |
| Samsung Galaxy Book4 Ultra | |
| Durchschnittliche Intel Core Ultra 7 155H (32719 - 54223, n=50) | |
| Dell Inspiron 16 Plus 7640 | |
| Asus VivoBook Pro 16 K6602VU | |
| Dell Inspiron 16 Plus 7630 | |
| Dell Inspiron 16 Plus 7620 | |
| Lenovo Legion 5 16IRX G9 | |
Stresstest
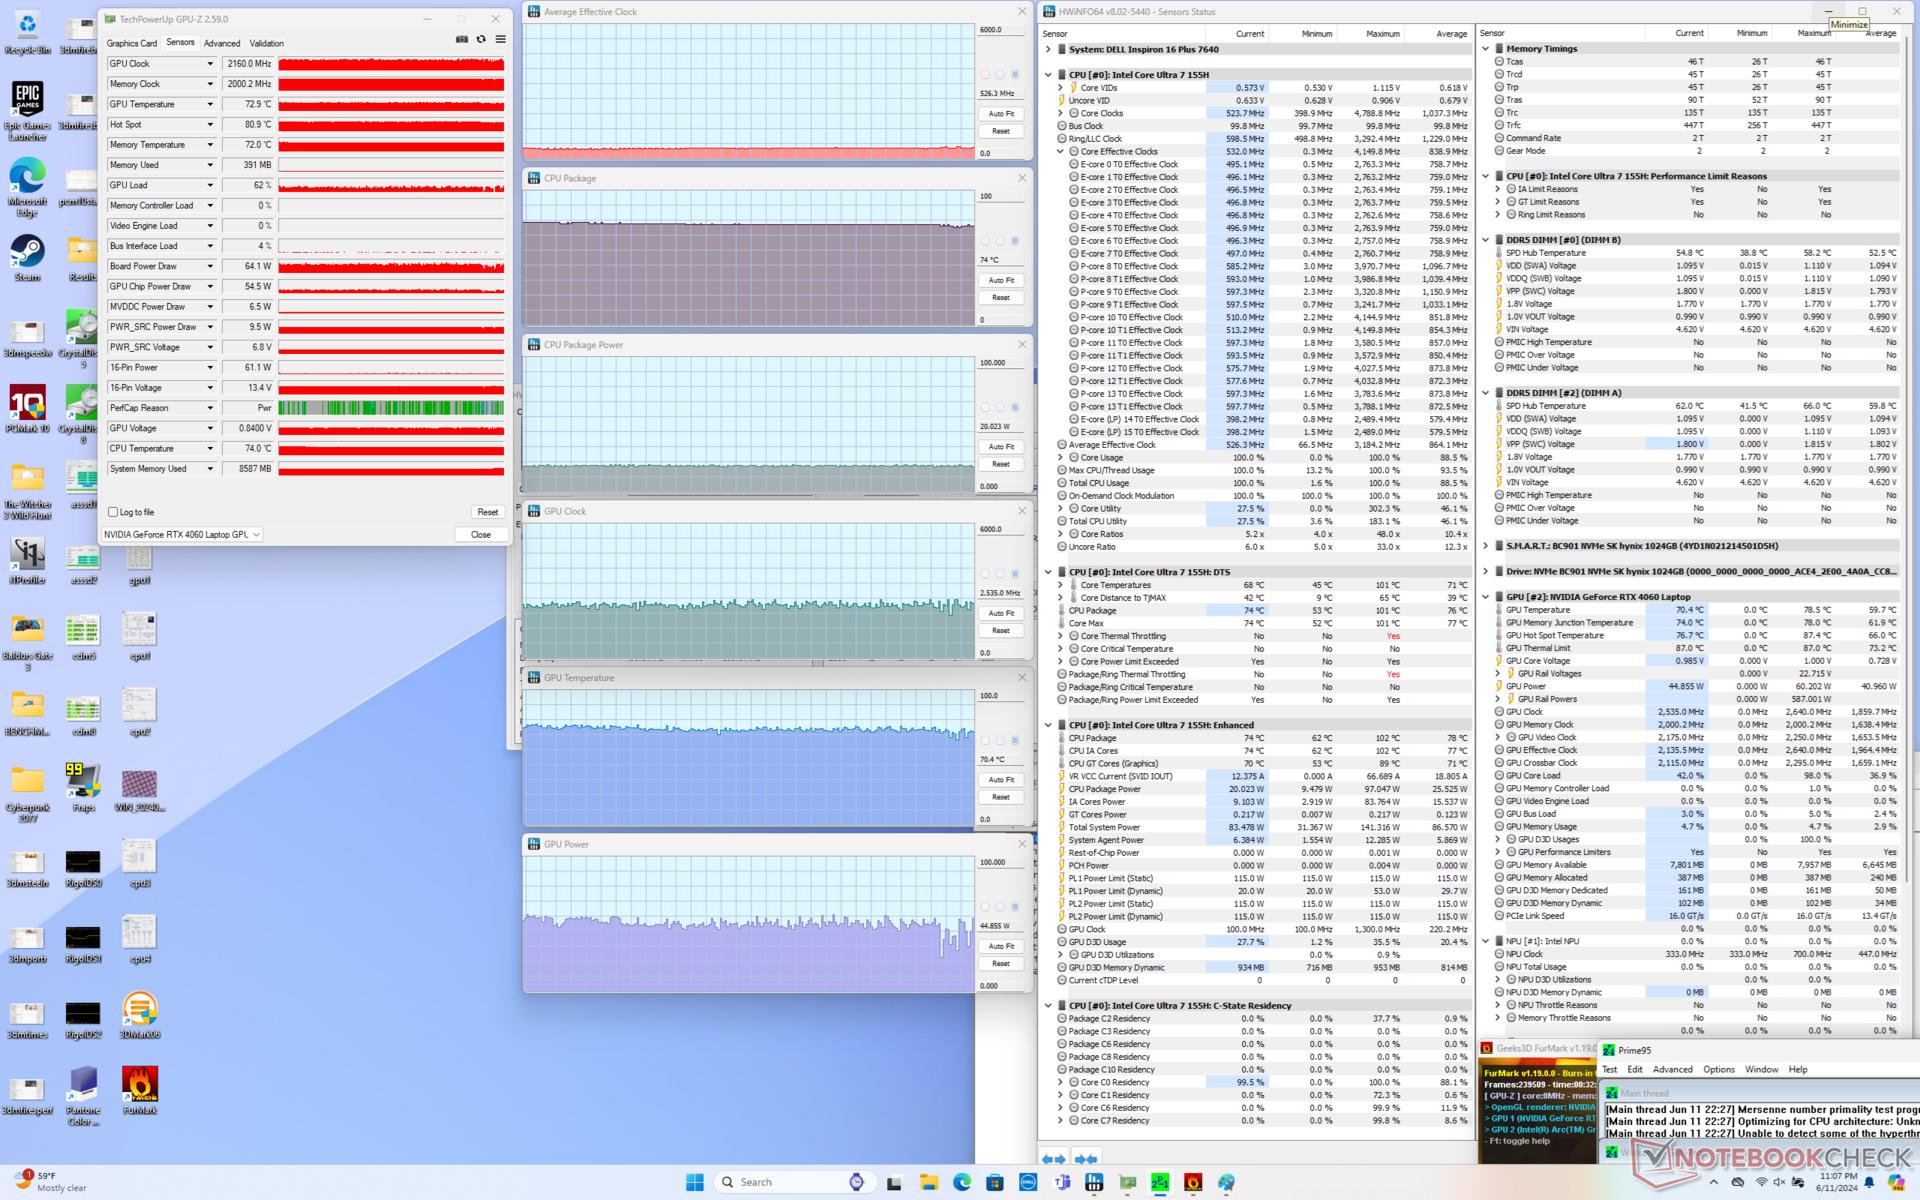
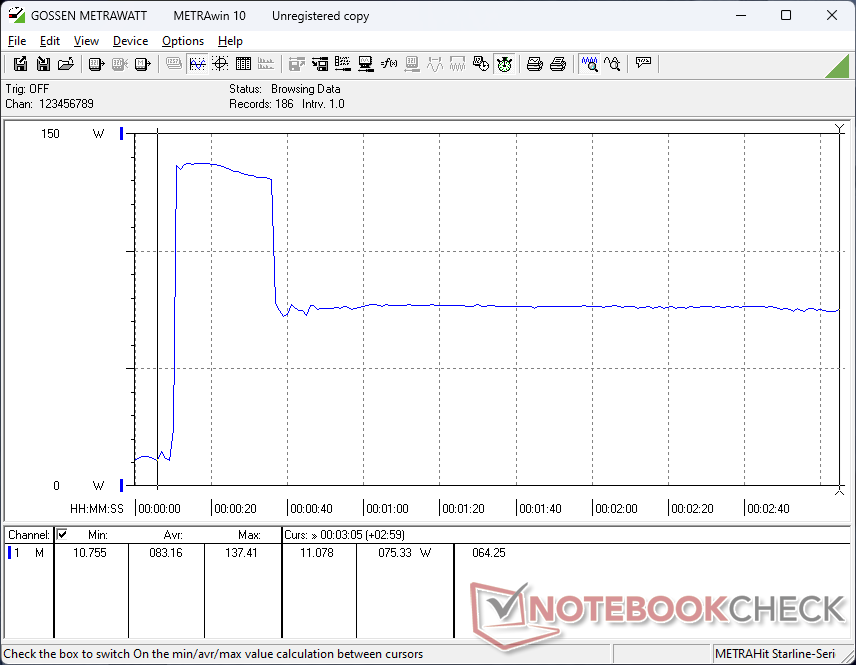
Die CPU wurde auf durchschnittlich 3,2 GHz, 97 W und 101 °C hochgefahren, was etwa 25 Sekunden lang anhielt, wenn Prime95 Stress gestartet wurde. Danach sinkt sie auf ~2,3 GHz und 44 W, um eine kühlere Kerntemperatur von 83 °C aufrechtzuerhalten. Die Turbo-Boost-Leistung ist also nur von kurzer Dauer, ähnlich wie wir es beim Vorgängermodell beobachtet haben.
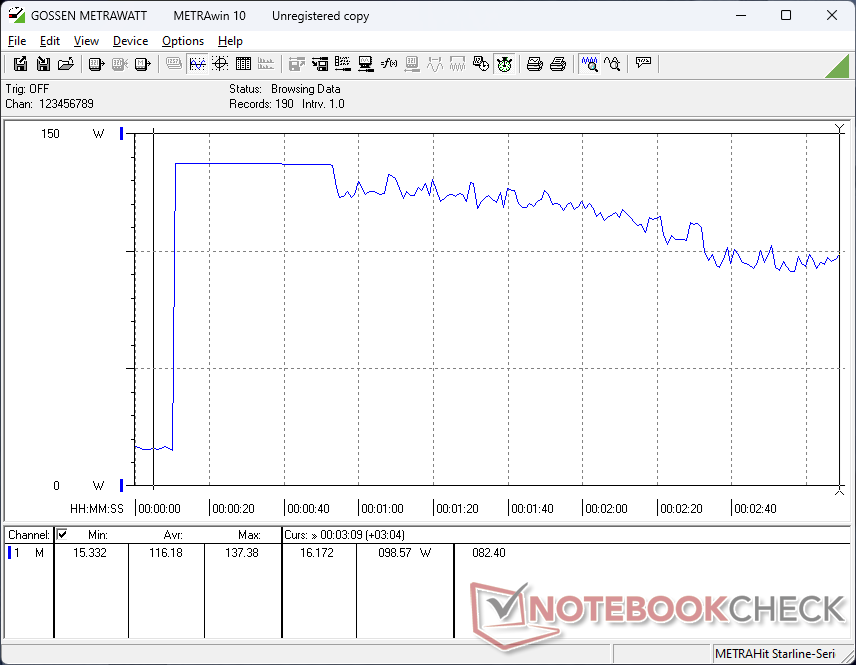
Die Nvidia GPU stabilisiert sich bei 2.070 MHz, 76 °C und 60 W, wenn Witcher 3 läuft, im Vergleich zu 2.250 MHz, 72 läuft C und 69 W beim letztjährigen Modell unter ähnlichen Testbedingungen. Diese Ergebnisse ergänzen die allgemein langsamere Leistung in Spielen, wie im Abschnitt Gaming Performance unten beschrieben. Die GPU-Leistung des neuen Dell Modells erreichte eine Obergrenze von 60 W im Vergleich zu 70 W bei dem älteren Dell Modell, selbst wenn der Modus Performance eingestellt war.
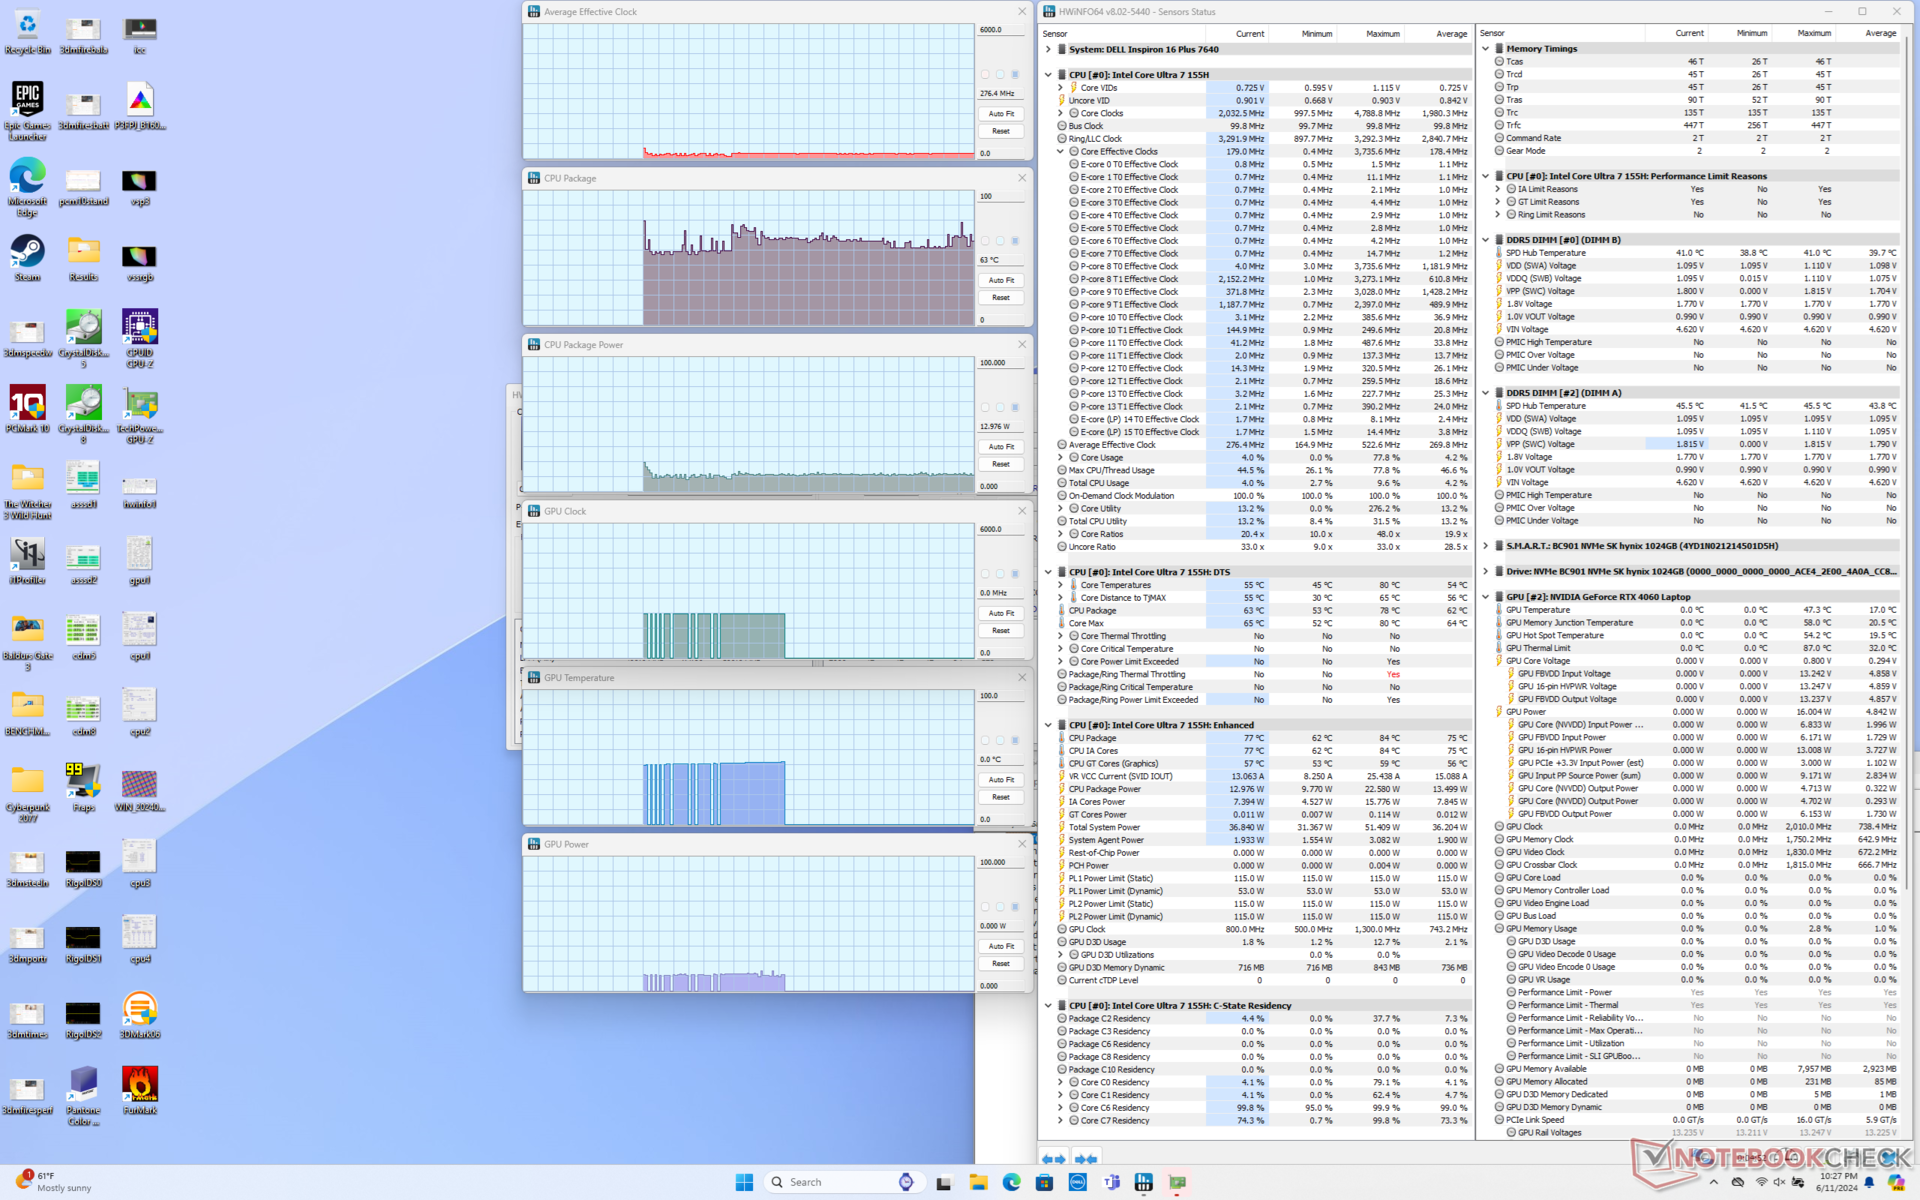
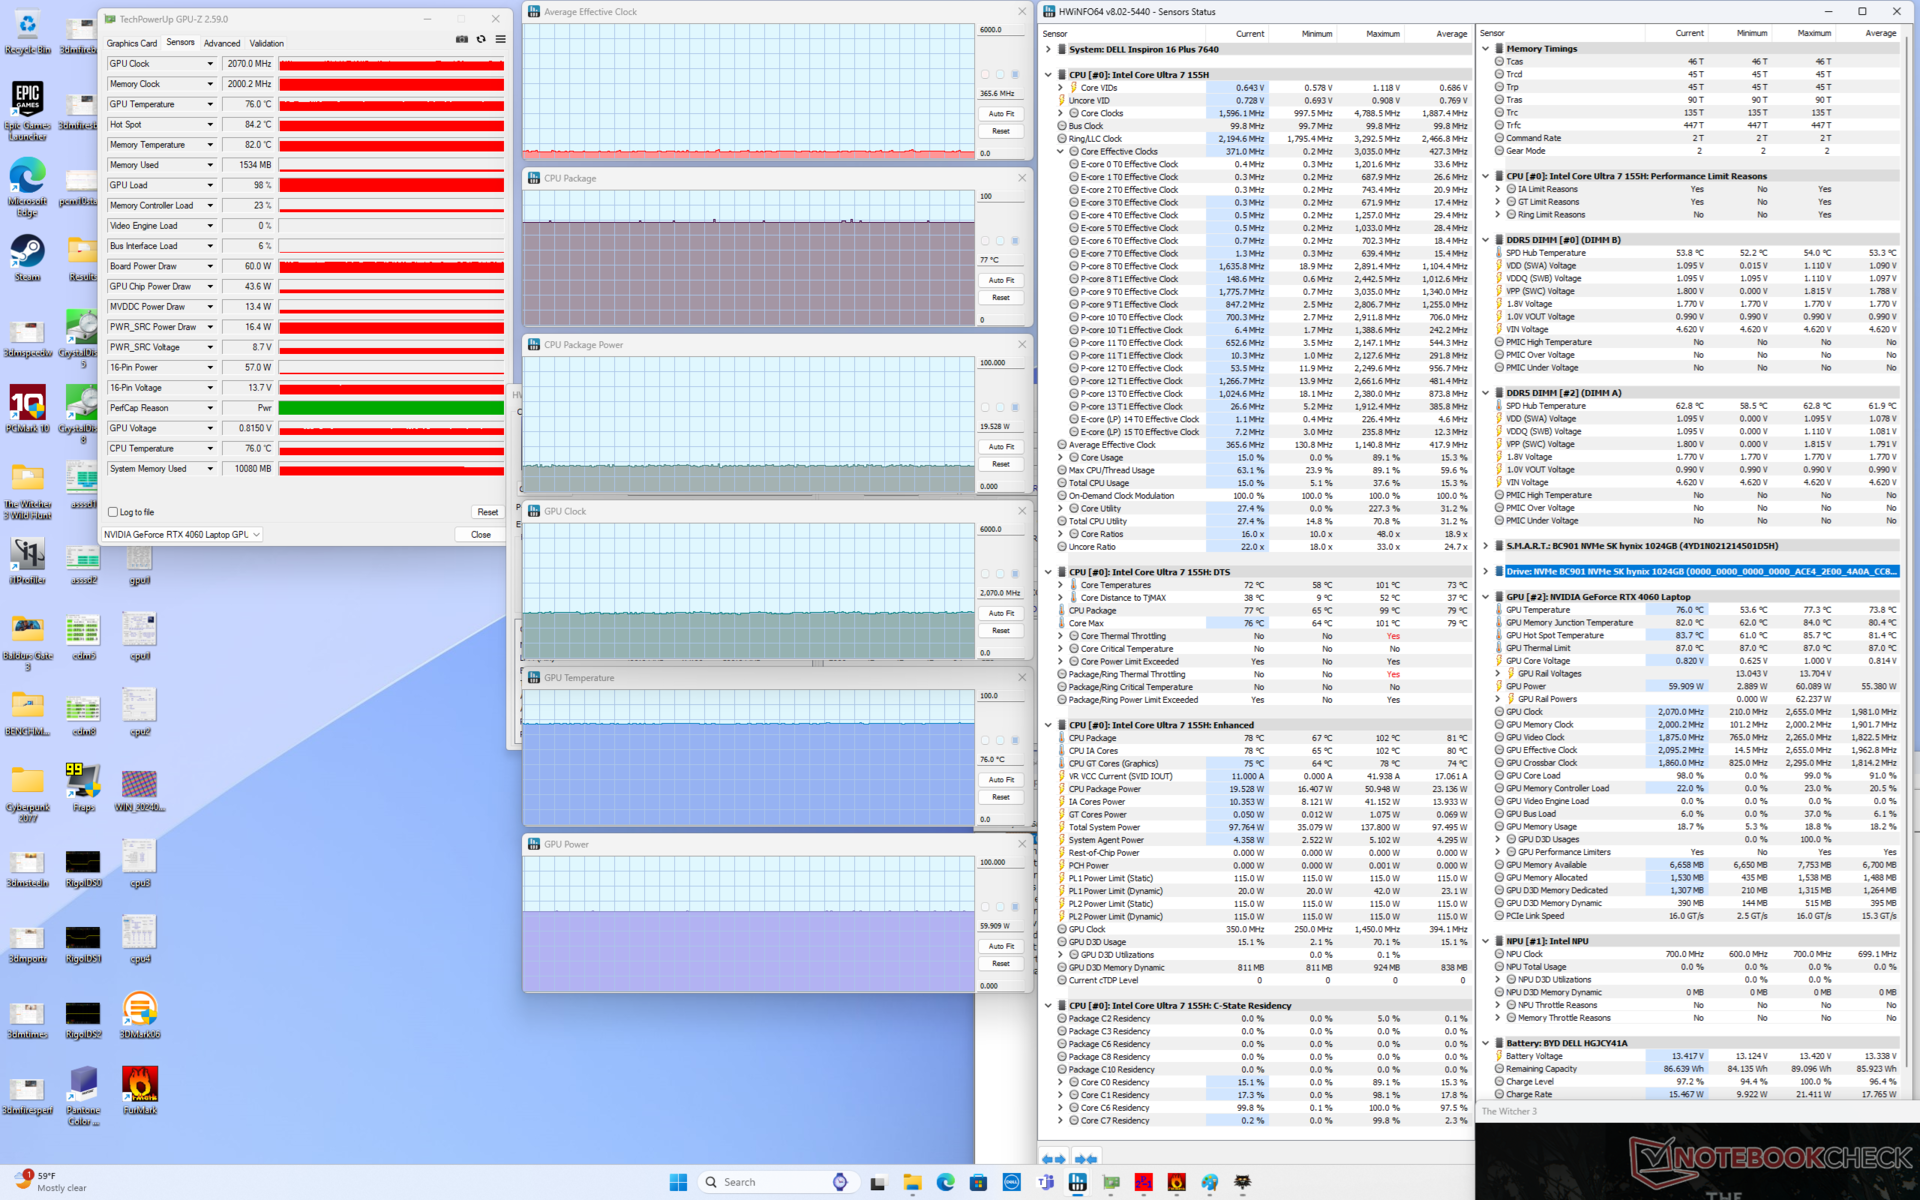

| durchschnittlicher CPU-Takt (GHz) | GPU-Takt (MHz) | durchschnittliche CPU-Temperatur (°C) | durchschnittliche GPU-Temperatur (°C) | |
| System Leerlauf | -- | -- | 63 | 45 |
| Prime95, Stress | 2,1-2,4 | -- | 83 | 56 |
| Prime95 + FurMark, Stress | 0,5 | 2.160 | 74 | 70 |
| Witcher 3, Stress | 0,4 | 2.070 | 77 | 77 |
System Performance
Die PCMark Ergebnisse sind trotz des CPU-Upgrades mit denen des Vorjahresmodells vergleichbar und zeigen, dass das neuere Modell bei den meisten alltäglichen Aufgaben nicht unbedingt schneller ist.

CrossMark: Overall | Productivity | Creativity | Responsiveness
WebXPRT 3: Overall
WebXPRT 4: Overall
Mozilla Kraken 1.1: Total
| PCMark 10 / Score | |
| Dell Inspiron 16 Plus 7630 | |
| Lenovo Legion 5 16IRX G9 | |
| Asus VivoBook Pro 16 K6602VU | |
| Dell Inspiron 16 Plus 7640 | |
| Durchschnittliche Intel Core Ultra 7 155H, NVIDIA GeForce RTX 4060 Laptop GPU (6751 - 7370, n=5) | |
| Samsung Galaxy Book4 Ultra | |
| Dell Inspiron 16 Plus 7620 | |
| PCMark 10 / Essentials | |
| Dell Inspiron 16 Plus 7630 | |
| Lenovo Legion 5 16IRX G9 | |
| Samsung Galaxy Book4 Ultra | |
| Dell Inspiron 16 Plus 7640 | |
| Asus VivoBook Pro 16 K6602VU | |
| Dell Inspiron 16 Plus 7620 | |
| Durchschnittliche Intel Core Ultra 7 155H, NVIDIA GeForce RTX 4060 Laptop GPU (9476 - 10446, n=5) | |
| PCMark 10 / Productivity | |
| Dell Inspiron 16 Plus 7630 | |
| Lenovo Legion 5 16IRX G9 | |
| Samsung Galaxy Book4 Ultra | |
| Dell Inspiron 16 Plus 7620 | |
| Durchschnittliche Intel Core Ultra 7 155H, NVIDIA GeForce RTX 4060 Laptop GPU (8079 - 9477, n=5) | |
| Asus VivoBook Pro 16 K6602VU | |
| Dell Inspiron 16 Plus 7640 | |
| PCMark 10 / Digital Content Creation | |
| Lenovo Legion 5 16IRX G9 | |
| Dell Inspiron 16 Plus 7630 | |
| Dell Inspiron 16 Plus 7640 | |
| Asus VivoBook Pro 16 K6602VU | |
| Durchschnittliche Intel Core Ultra 7 155H, NVIDIA GeForce RTX 4060 Laptop GPU (9811 - 11620, n=5) | |
| Samsung Galaxy Book4 Ultra | |
| Dell Inspiron 16 Plus 7620 | |
| CrossMark / Overall | |
| Lenovo Legion 5 16IRX G9 | |
| Dell Inspiron 16 Plus 7630 | |
| Dell Inspiron 16 Plus 7620 | |
| Samsung Galaxy Book4 Ultra | |
| Asus VivoBook Pro 16 K6602VU | |
| Dell Inspiron 16 Plus 7640 | |
| Durchschnittliche Intel Core Ultra 7 155H, NVIDIA GeForce RTX 4060 Laptop GPU (1540 - 1746, n=5) | |
| CrossMark / Productivity | |
| Lenovo Legion 5 16IRX G9 | |
| Dell Inspiron 16 Plus 7630 | |
| Asus VivoBook Pro 16 K6602VU | |
| Samsung Galaxy Book4 Ultra | |
| Dell Inspiron 16 Plus 7620 | |
| Durchschnittliche Intel Core Ultra 7 155H, NVIDIA GeForce RTX 4060 Laptop GPU (1436 - 1684, n=5) | |
| Dell Inspiron 16 Plus 7640 | |
| CrossMark / Creativity | |
| Lenovo Legion 5 16IRX G9 | |
| Dell Inspiron 16 Plus 7630 | |
| Samsung Galaxy Book4 Ultra | |
| Dell Inspiron 16 Plus 7640 | |
| Dell Inspiron 16 Plus 7620 | |
| Durchschnittliche Intel Core Ultra 7 155H, NVIDIA GeForce RTX 4060 Laptop GPU (1811 - 1929, n=5) | |
| Asus VivoBook Pro 16 K6602VU | |
| CrossMark / Responsiveness | |
| Lenovo Legion 5 16IRX G9 | |
| Dell Inspiron 16 Plus 7630 | |
| Asus VivoBook Pro 16 K6602VU | |
| Dell Inspiron 16 Plus 7620 | |
| Samsung Galaxy Book4 Ultra | |
| Durchschnittliche Intel Core Ultra 7 155H, NVIDIA GeForce RTX 4060 Laptop GPU (1165 - 1631, n=5) | |
| Dell Inspiron 16 Plus 7640 | |
| WebXPRT 3 / Overall | |
| Dell Inspiron 16 Plus 7630 | |
| Lenovo Legion 5 16IRX G9 | |
| Dell Inspiron 16 Plus 7620 | |
| Dell Inspiron 16 Plus 7640 | |
| Durchschnittliche Intel Core Ultra 7 155H, NVIDIA GeForce RTX 4060 Laptop GPU (274 - 290, n=5) | |
| Samsung Galaxy Book4 Ultra | |
| WebXPRT 4 / Overall | |
| Lenovo Legion 5 16IRX G9 | |
| Dell Inspiron 16 Plus 7630 | |
| Dell Inspiron 16 Plus 7620 | |
| Samsung Galaxy Book4 Ultra | |
| Dell Inspiron 16 Plus 7640 | |
| Durchschnittliche Intel Core Ultra 7 155H, NVIDIA GeForce RTX 4060 Laptop GPU (236 - 262, n=5) | |
| Asus VivoBook Pro 16 K6602VU | |
| Mozilla Kraken 1.1 / Total | |
| Durchschnittliche Intel Core Ultra 7 155H, NVIDIA GeForce RTX 4060 Laptop GPU (519 - 585, n=5) | |
| Asus VivoBook Pro 16 K6602VU | |
| Dell Inspiron 16 Plus 7620 | |
| Dell Inspiron 16 Plus 7640 | |
| Dell Inspiron 16 Plus 7630 | |
| Lenovo Legion 5 16IRX G9 | |
| Samsung Galaxy Book4 Ultra | |
* ... kleinere Werte sind besser
| PCMark 10 Score | 7042 Punkte | |
Hilfe | ||
| AIDA64 / Memory Copy | |
| Samsung Galaxy Book4 Ultra | |
| Durchschnittliche Intel Core Ultra 7 155H (62397 - 96791, n=50) | |
| Dell Inspiron 16 Plus 7640 | |
| Lenovo Legion 5 16IRX G9 | |
| Dell Inspiron 16 Plus 7630 | |
| Asus VivoBook Pro 16 K6602VU | |
| Dell Inspiron 16 Plus 7620 | |
| AIDA64 / Memory Read | |
| Samsung Galaxy Book4 Ultra | |
| Durchschnittliche Intel Core Ultra 7 155H (60544 - 90647, n=50) | |
| Dell Inspiron 16 Plus 7640 | |
| Lenovo Legion 5 16IRX G9 | |
| Dell Inspiron 16 Plus 7630 | |
| Asus VivoBook Pro 16 K6602VU | |
| Dell Inspiron 16 Plus 7620 | |
| AIDA64 / Memory Write | |
| Samsung Galaxy Book4 Ultra | |
| Durchschnittliche Intel Core Ultra 7 155H (58692 - 93451, n=50) | |
| Dell Inspiron 16 Plus 7640 | |
| Asus VivoBook Pro 16 K6602VU | |
| Dell Inspiron 16 Plus 7630 | |
| Dell Inspiron 16 Plus 7620 | |
| Lenovo Legion 5 16IRX G9 | |
| AIDA64 / Memory Latency | |
| Durchschnittliche Intel Core Ultra 7 155H (116.2 - 233, n=50) | |
| Samsung Galaxy Book4 Ultra | |
| Dell Inspiron 16 Plus 7640 | |
| Dell Inspiron 16 Plus 7620 | |
| Dell Inspiron 16 Plus 7630 | |
| Asus VivoBook Pro 16 K6602VU | |
| Lenovo Legion 5 16IRX G9 | |
* ... kleinere Werte sind besser
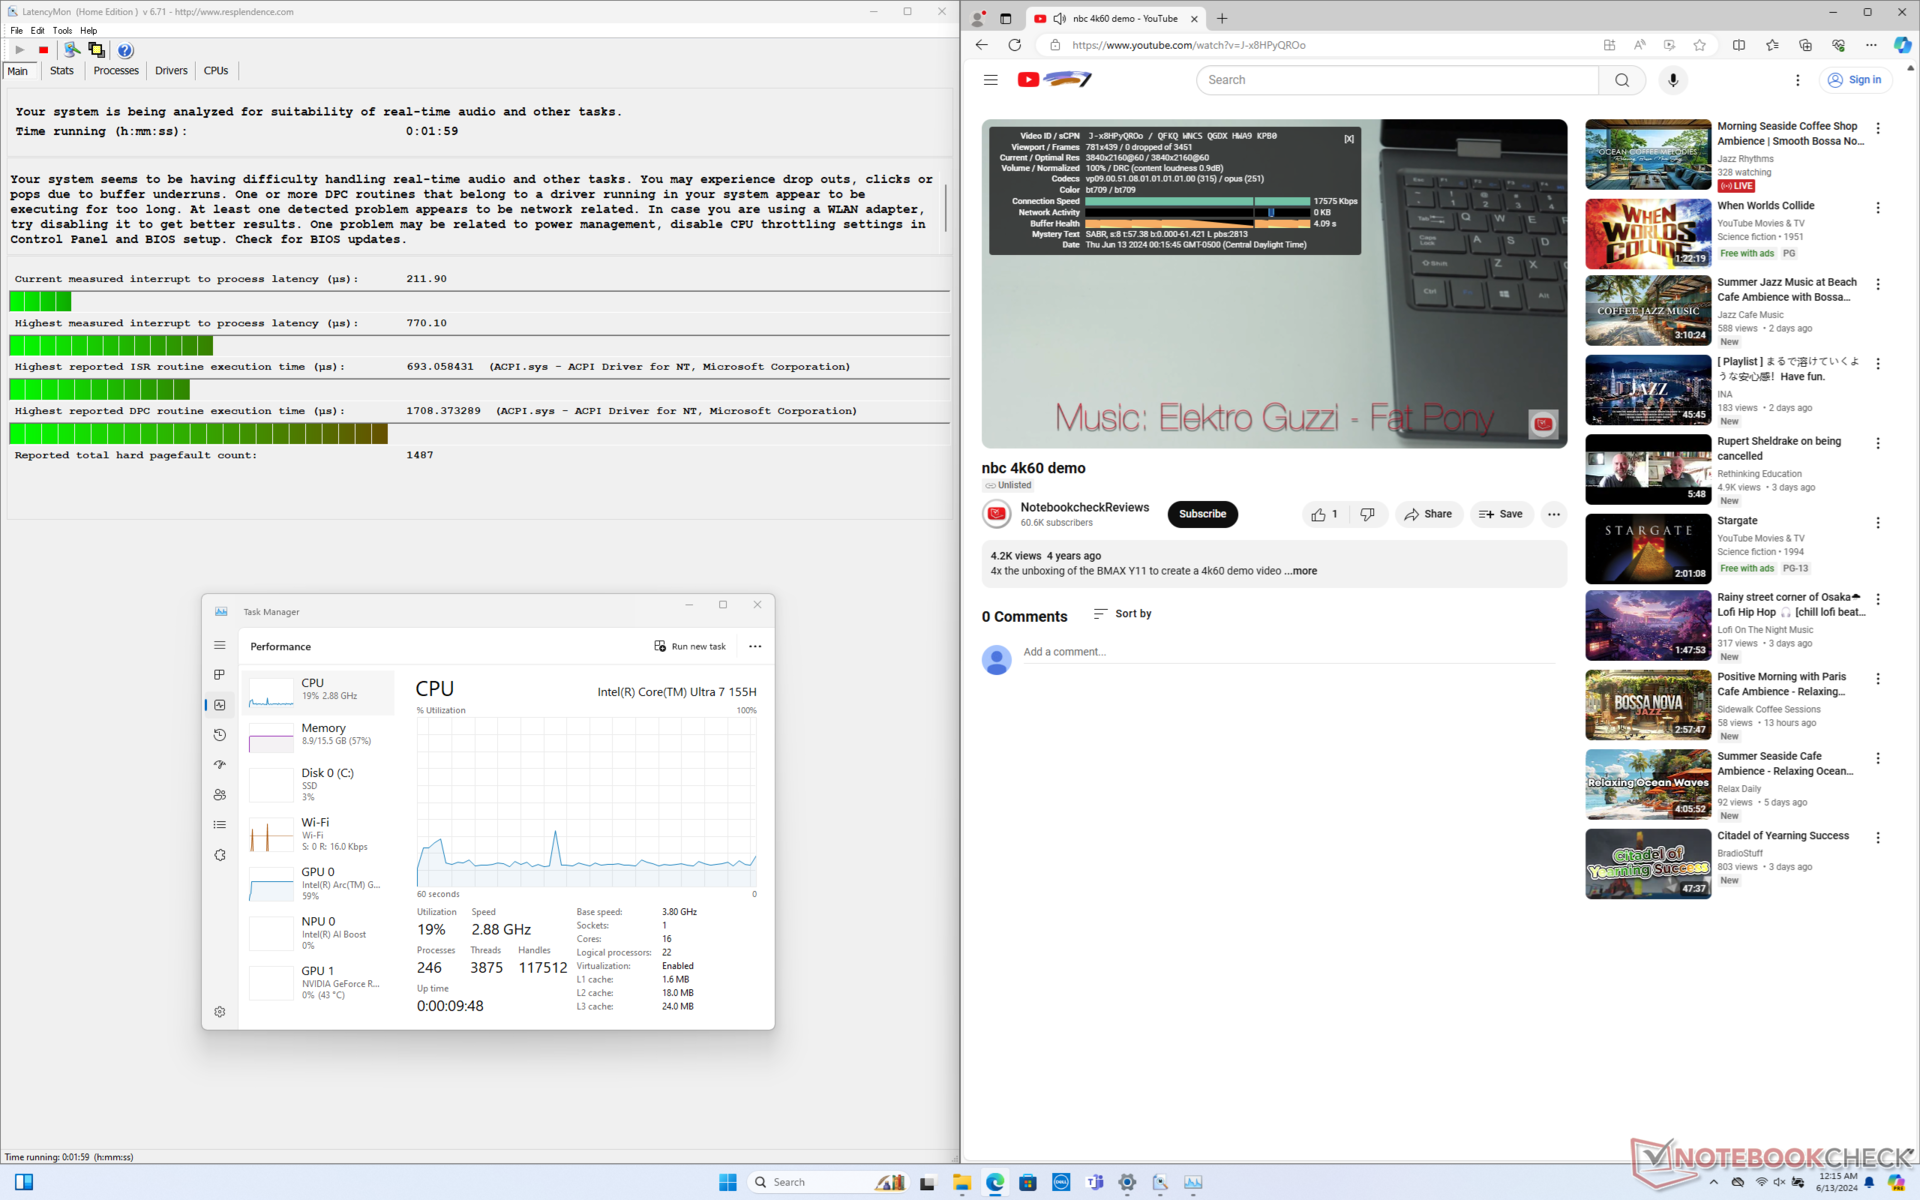
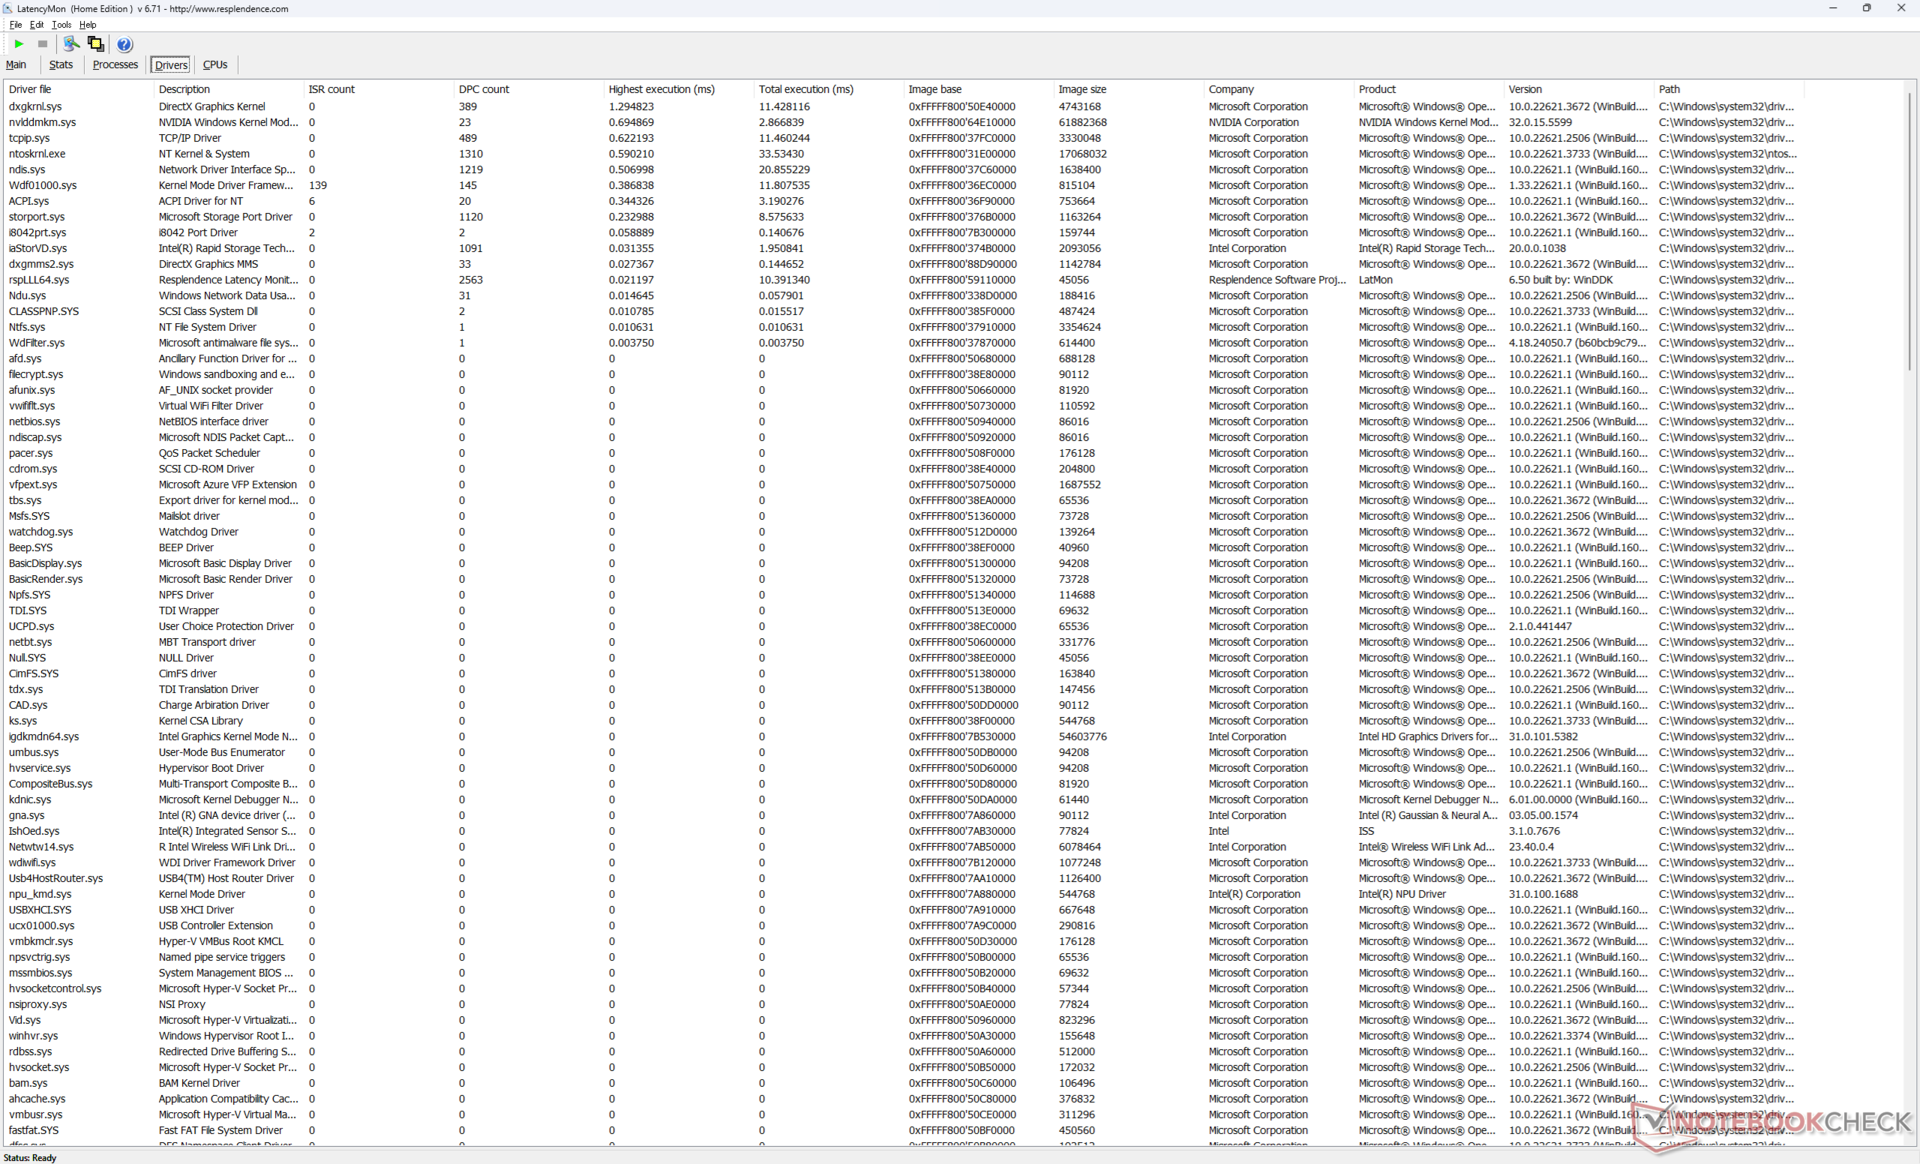
DPC-Latenzzeit
LatencyMon zeigt nur geringe DPC-Probleme beim Öffnen mehrerer Browser Tabs unserer Homepage. Die 4K-Videowiedergabe bei 60 fps ist ansonsten perfekt, und es wurden keine Bildaussetzer verzeichnet.
| DPC Latencies / LatencyMon - interrupt to process latency (max), Web, Youtube, Prime95 | |
| Lenovo Legion 5 16IRX G9 | |
| Asus VivoBook Pro 16 K6602VU | |
| Dell Inspiron 16 Plus 7630 | |
| Dell Inspiron 16 Plus 7620 | |
| Dell Inspiron 16 Plus 7640 | |
| Samsung Galaxy Book4 Ultra | |
* ... kleinere Werte sind besser
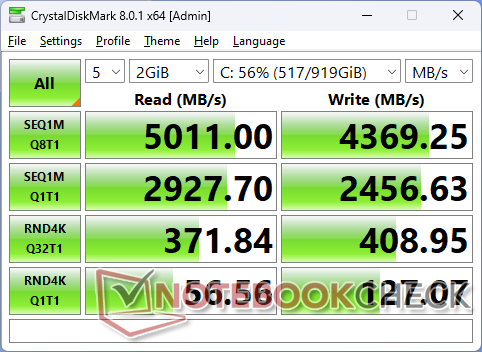
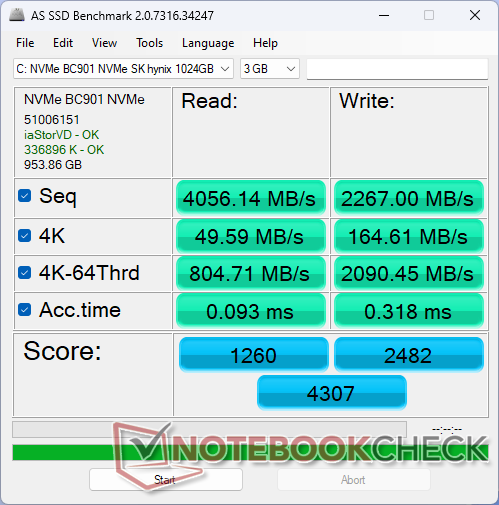
Speichergeräte
Unser Testgerät wird mit einer langsameren SK-Hynix-Festplatte ausgeliefert anstelle des Western-Digital-Laufwerks des letztjährigen Modells. Das SK-Hynix-Laufwerk ist spürbar langsamer, wie unsere Benchmark-Tests gezeigt haben, aber es leidet nicht unter Leistungsdrosselungsproblemen und bietet insgesamt stabilere Übertragungsraten.

| Drive Performance Rating - Percent | |
| Lenovo Legion 5 16IRX G9 | |
| Samsung Galaxy Book4 Ultra | |
| Dell Inspiron 16 Plus 7630 | |
| Asus VivoBook Pro 16 K6602VU | |
| Dell Inspiron 16 Plus 7640 | |
| Dell Inspiron 16 Plus 7620 | |
* ... kleinere Werte sind besser
Disk Throttling: DiskSpd Read Loop, Queue Depth 8
GPU Performance
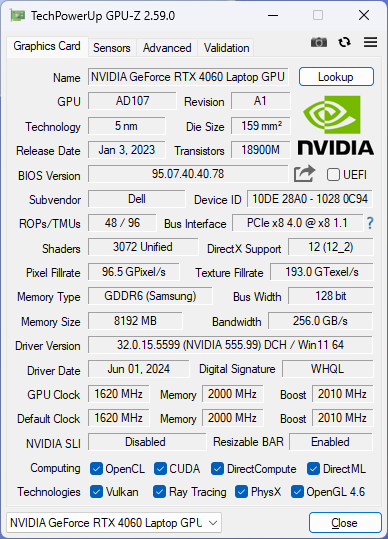
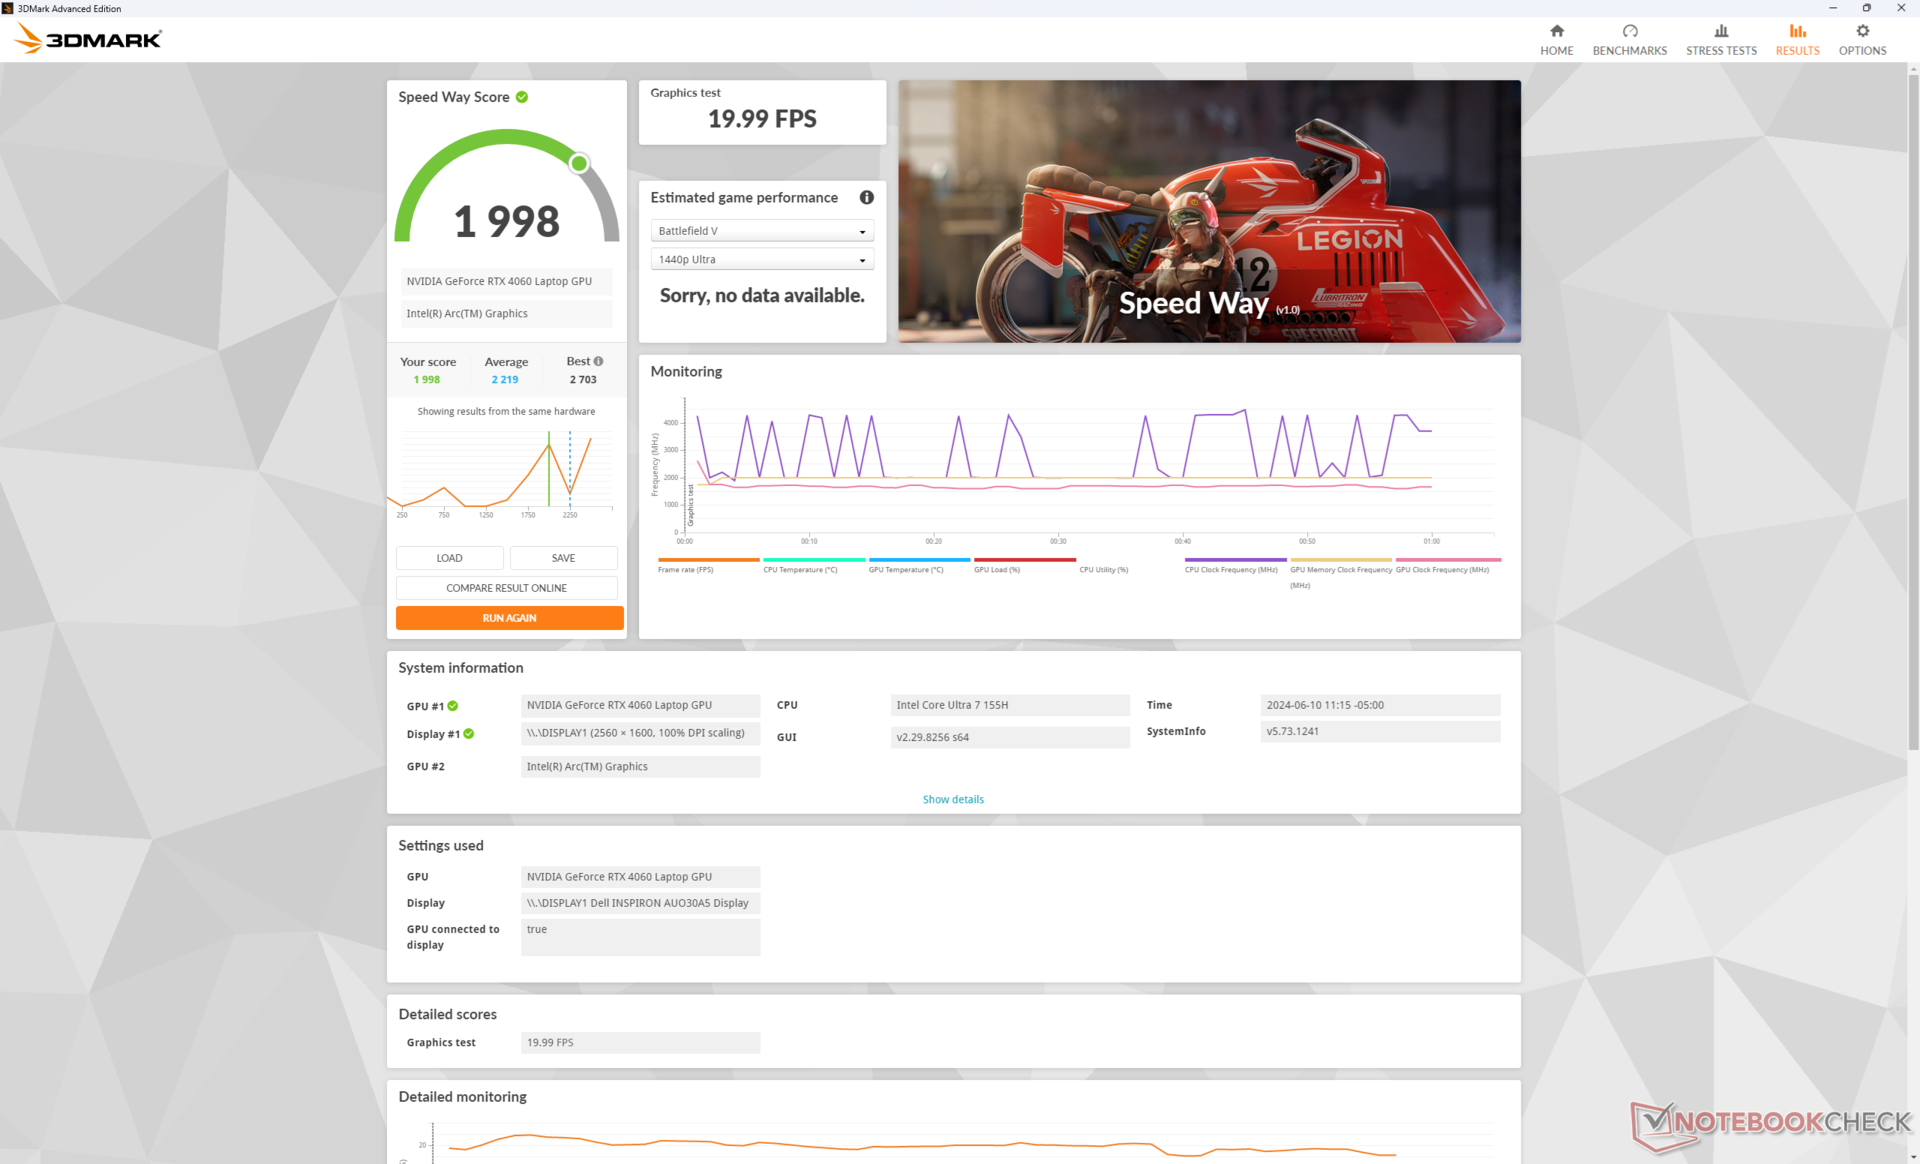
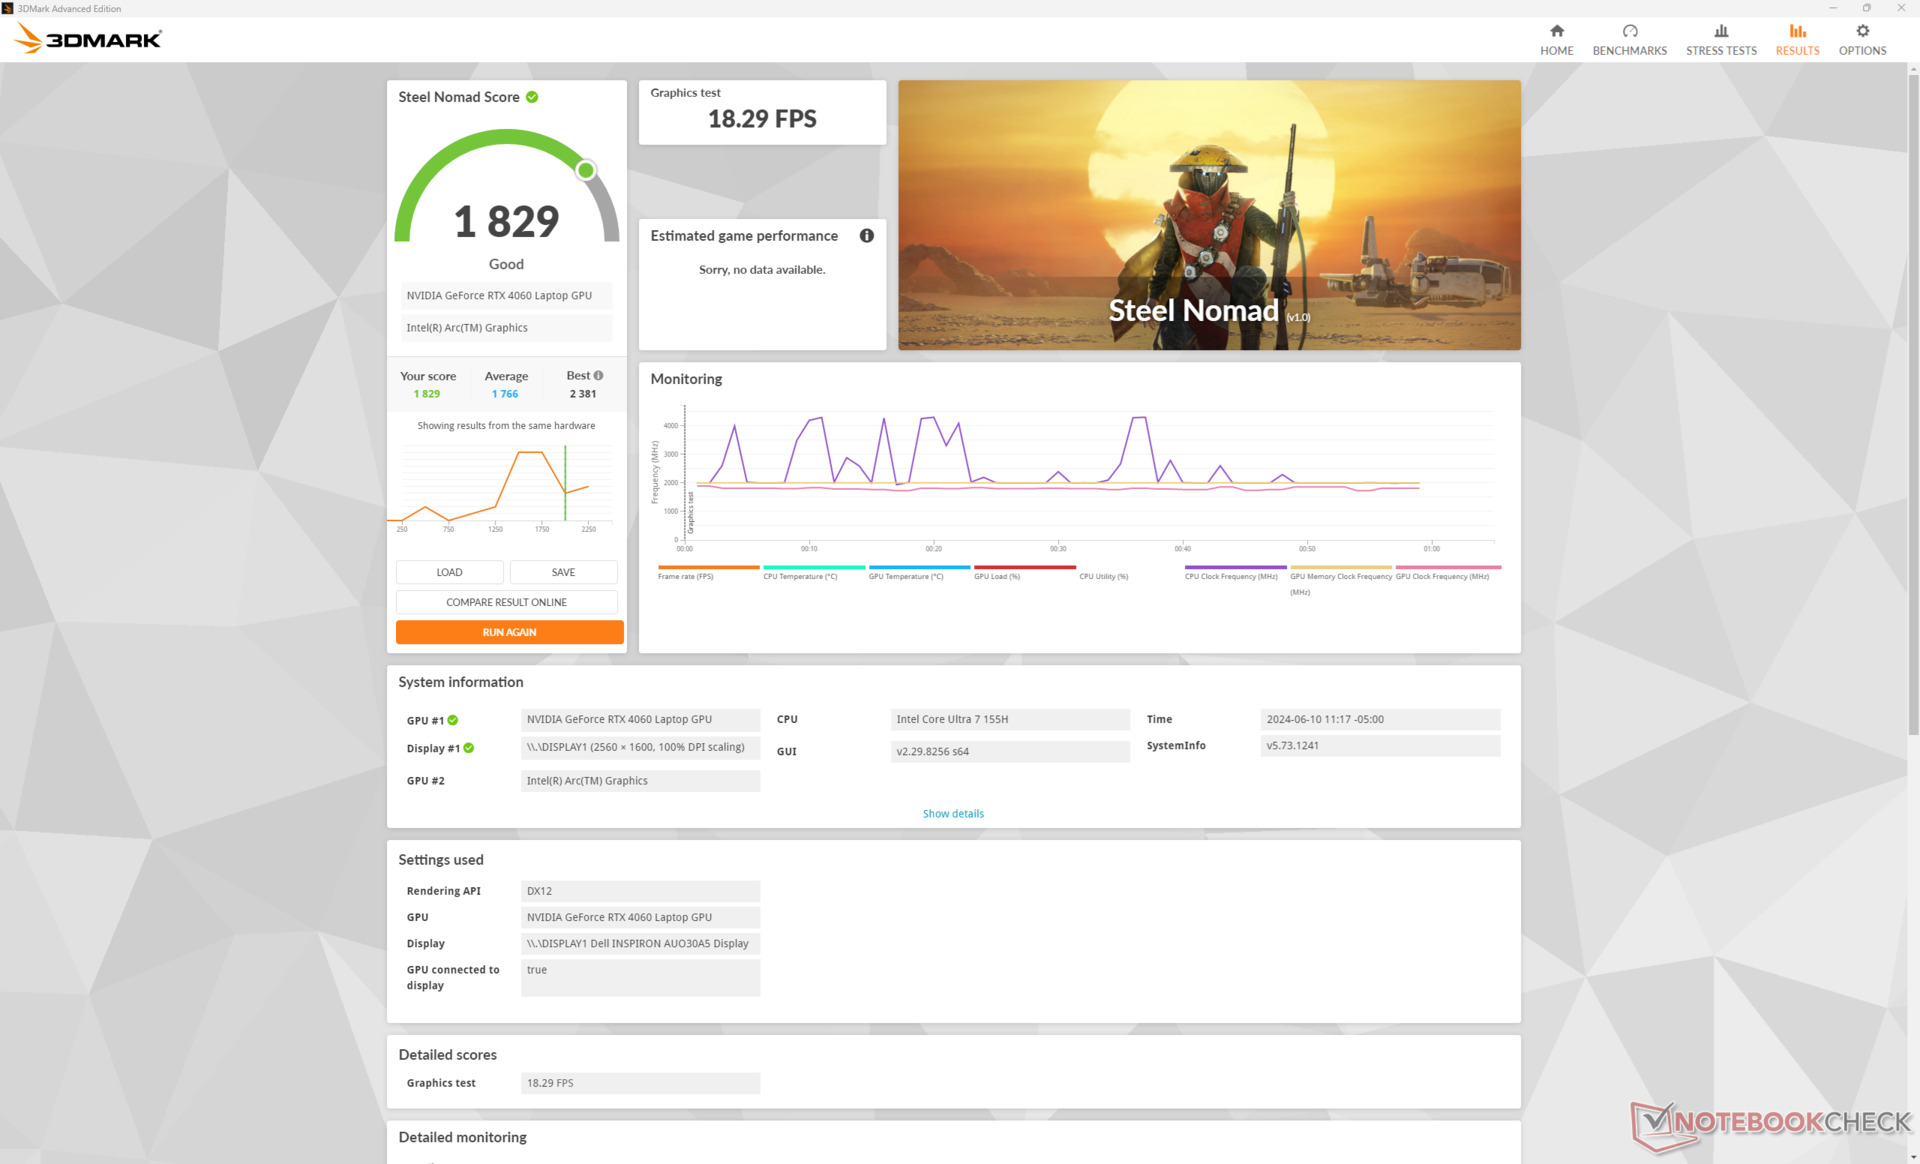
Die Optionen für Nvidia GPUs bleiben gleich mit GeForce-RTX-4050- und -4060-Optionen. Die 3DMark Ergebnisse sind ein paar Prozentpunkte höher als zuvor, aber das lässt sich leider nicht auf die tatsächliche Gaming Performance übertragen.
Ein Downgrade auf die RTX 4050 wird die Leistung voraussichtlich nur um 10 Prozent beeinträchtigen. Der Verzicht auf eine diskrete Grafikkarte wirkt sich mit 60 bis 80 Prozent deutlich stärker auf die Leistung aus.
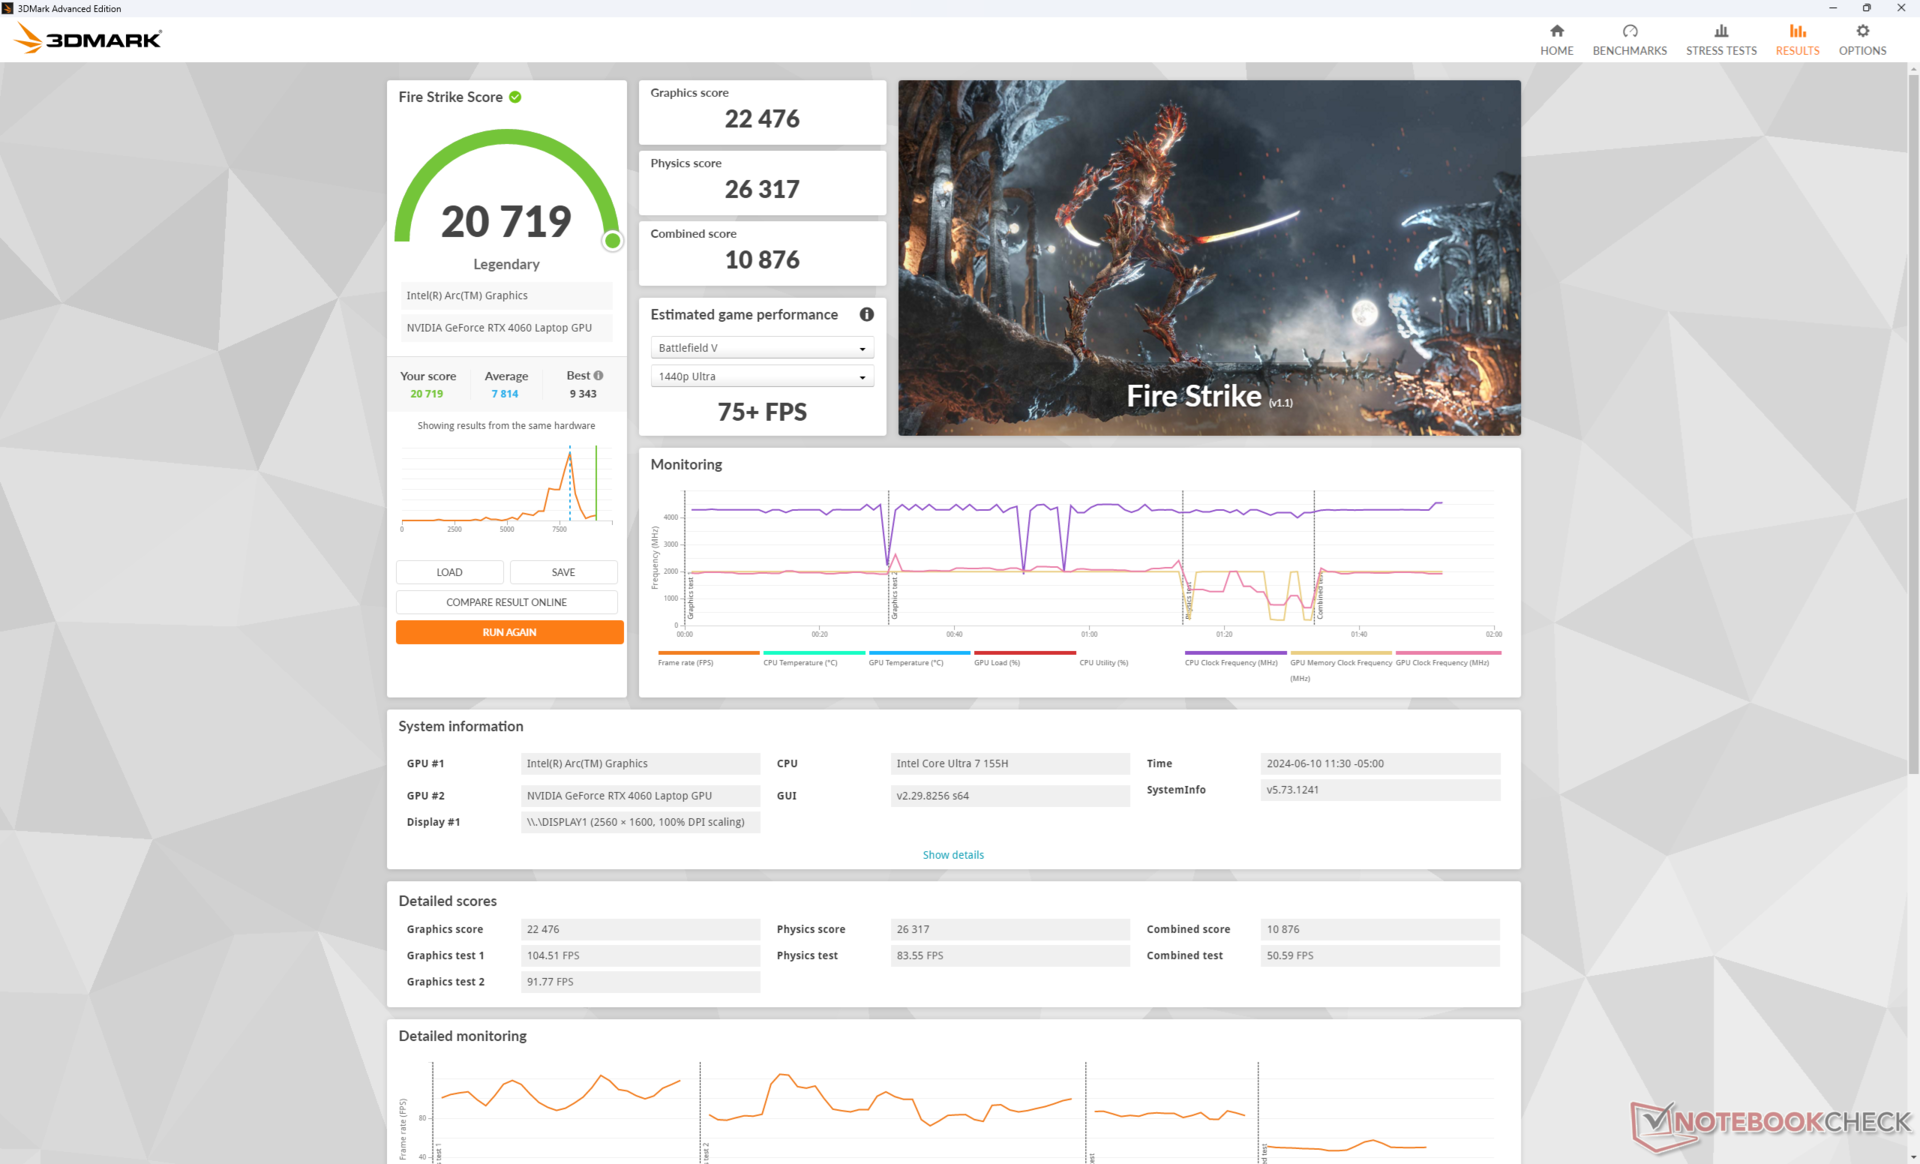
| Leistungsprofil | Grafik-Score | Physik-Punktzahl | Kombinierte Punktzahl |
| Performance-Modus | 22.476 | 26.317 | 10.876 |
| Ausgeglichener Modus | 22.542 (-0 %) | 27.226 (-0 %) | 10.829 (-0 %) |
| Akku-Leistung | 21.957 (-2 %) | 26.817 (-0 %) | 9.623 (-12 %) |
Der Betrieb im Modus "Ausgewogen" anstelle des Modus "Performance" scheint keine nennenswerten Auswirkungen auf die Leistung zu haben, wie unsere Fire-Strike-Ergebnistabelle oben zeigt. Selbst im Akkubetrieb bleibt die Leistung recht gut erhalten.
| 3DMark 11 Performance | 21491 Punkte | |
| 3DMark Fire Strike Score | 20719 Punkte | |
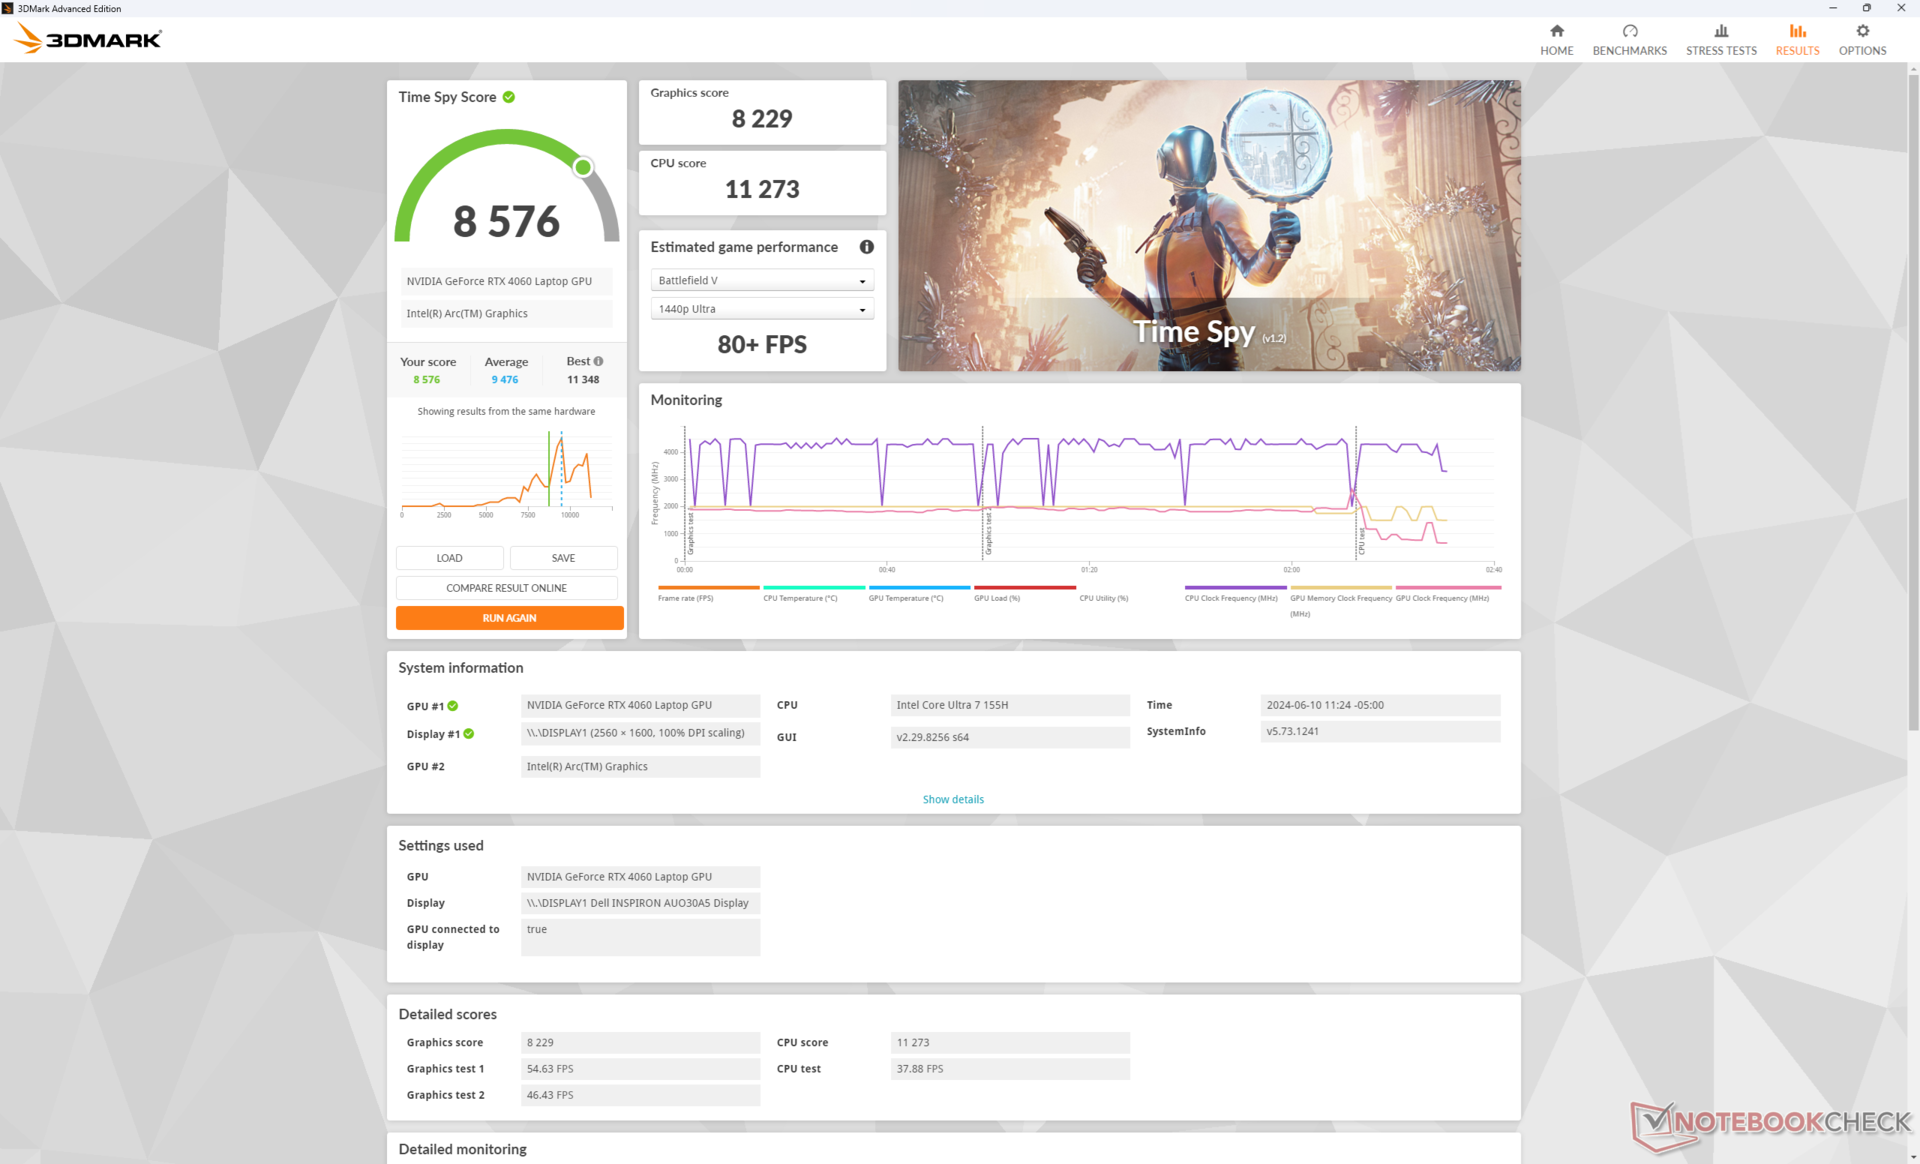
| 3DMark Time Spy Score | 8576 Punkte | |
| 3DMark Steel Nomad Score | 1829 Punkte | |
Hilfe | ||
* ... kleinere Werte sind besser
Gaming Performance
Die Performance in Spielen hat sich nicht verändert und kann sogar etwas schlechter sein als zuvor. Final Fantasy XV läuft zum Beispiel 10 Prozent langsamer als auf dem Inspiron 16 Plus 7630, und auch bei anderen Spielen wie F1 22 und Strange Brigade sind kleinere Defizite zu beobachten.
| Performance Rating - Percent | |
| Lenovo Legion 5 16IRX G9 | |
| Dell Inspiron 16 Plus 7630 | |
| Dell Inspiron 16 Plus 7640 | |
| Asus VivoBook Pro 16 K6602VU | |
| Dell Inspiron 16 Plus 7620 -1! | |
| Samsung Galaxy Book4 Ultra | |
| The Witcher 3 - 1920x1080 Ultra Graphics & Postprocessing (HBAO+) | |
| Lenovo Legion 5 16IRX G9 | |
| Dell Inspiron 16 Plus 7630 | |
| Dell Inspiron 16 Plus 7640 | |
| Asus VivoBook Pro 16 K6602VU | |
| Dell Inspiron 16 Plus 7620 | |
| Samsung Galaxy Book4 Ultra | |
| Final Fantasy XV Benchmark - 1920x1080 High Quality | |
| Lenovo Legion 5 16IRX G9 | |
| Dell Inspiron 16 Plus 7630 | |
| Dell Inspiron 16 Plus 7640 | |
| Asus VivoBook Pro 16 K6602VU | |
| Samsung Galaxy Book4 Ultra | |
| Dell Inspiron 16 Plus 7620 | |
| Strange Brigade - 1920x1080 ultra AA:ultra AF:16 | |
| Lenovo Legion 5 16IRX G9 | |
| Dell Inspiron 16 Plus 7630 | |
| Dell Inspiron 16 Plus 7640 | |
| Asus VivoBook Pro 16 K6602VU | |
| Samsung Galaxy Book4 Ultra | |
| Dell Inspiron 16 Plus 7620 | |
| Dota 2 Reborn - 1920x1080 ultra (3/3) best looking | |
| Lenovo Legion 5 16IRX G9 | |
| Dell Inspiron 16 Plus 7630 | |
| Dell Inspiron 16 Plus 7620 | |
| Dell Inspiron 16 Plus 7640 | |
| Samsung Galaxy Book4 Ultra | |
| Asus VivoBook Pro 16 K6602VU | |
| X-Plane 11.11 - 1920x1080 high (fps_test=3) | |
| Lenovo Legion 5 16IRX G9 | |
| Dell Inspiron 16 Plus 7630 | |
| Asus VivoBook Pro 16 K6602VU | |
| Dell Inspiron 16 Plus 7620 | |
| Dell Inspiron 16 Plus 7640 | |
| Samsung Galaxy Book4 Ultra | |
| Far Cry 5 - 1920x1080 Ultra Preset AA:T | |
| Lenovo Legion 5 16IRX G9 | |
| Dell Inspiron 16 Plus 7640 | |
| Asus VivoBook Pro 16 K6602VU | |
| Dell Inspiron 16 Plus 7630 | |
| Samsung Galaxy Book4 Ultra | |
| Baldur's Gate 3 | |
| 1920x1080 Low Preset AA:SM | |
| Durchschnittliche NVIDIA GeForce RTX 4060 Laptop GPU (102.8 - 160.3, n=15) | |
| Dell Inspiron 16 Plus 7640 | |
| Framework Laptop 16 | |
| Lenovo Yoga 7 2-in-1 16IML9 | |
| 1920x1080 Medium Preset AA:T | |
| Durchschnittliche NVIDIA GeForce RTX 4060 Laptop GPU (77.5 - 125.7, n=18) | |
| Dell Inspiron 16 Plus 7640 | |
| Framework Laptop 16 | |
| 1920x1080 High Preset AA:T | |
| Durchschnittliche NVIDIA GeForce RTX 4060 Laptop GPU (68.7 - 110.7, n=18) | |
| Dell Inspiron 16 Plus 7640 | |
| Framework Laptop 16 | |
| 1920x1080 Ultra Preset AA:T | |
| Durchschnittliche NVIDIA GeForce RTX 4060 Laptop GPU (66.5 - 105.5, n=19) | |
| Dell Inspiron 16 Plus 7640 | |
| Framework Laptop 16 | |
| 2560x1440 Ultra Preset AA:T | |
| Durchschnittliche NVIDIA GeForce RTX 4060 Laptop GPU (45.2 - 72.2, n=14) | |
| Dell Inspiron 16 Plus 7640 | |
| Framework Laptop 16 | |
Witcher 3 FPS Chart
| min. | mittel | hoch | max. | QHD | |
|---|---|---|---|---|---|
| The Witcher 3 (2015) | 375.8 | 276.8 | 160.3 | 84.1 | 61.9 |
| Dota 2 Reborn (2015) | 173.5 | 152.1 | 143.2 | 135.1 | |
| Final Fantasy XV Benchmark (2018) | 137.6 | 98.4 | 78.8 | 58.8 | |
| X-Plane 11.11 (2018) | 123.7 | 109 | 86.5 | ||
| Far Cry 5 (2018) | 138 | 125 | 118 | 110 | 83 |
| Strange Brigade (2018) | 360 | 225 | 178.1 | 153.5 | 105.2 |
| Tiny Tina's Wonderlands (2022) | 177.4 | 116 | 91.9 | 71.1 | 48 |
| F1 22 (2022) | 197 | 184.3 | 151.3 | 51.8 | 32.1 |
| Baldur's Gate 3 (2023) | 111.1 | 93.2 | 82.4 | 76.7 | 53.2 |
| Cyberpunk 2077 (2023) | 96.8 | 83.1 | 69.9 | 59.8 | 36.8 |
Emissionen
Systemgeräusche - Laut beim Spielen
Die internen Lüfter sind in der Lage, länger leise zu bleiben als beim Vorjahresmodell. Wenn Sie beispielsweise den 3DMark 06 ausführen, bleibt das Lüftergeräusch bis zum Ende der ersten Benchmark-Szene bei 29 dB(A), während das Inspiron 16 Plus 7630 mit 35 dB(A) deutlich lauter wird. Die beiden Laptops stabilisieren sich ansonsten bei jeweils über 50 dB(A), wenn sie über einen längeren Zeitraum anspruchsvollere Lasten wie Spiele ausführen.
Lautstärkediagramm
| Idle |
| 24.2 / 24.2 / 24.2 dB(A) |
| Last |
| 28.9 / 51 dB(A) |
 | ||
30 dB leise 40 dB(A) deutlich hörbar 50 dB(A) störend |
||
min: | ||
| Dell Inspiron 16 Plus 7640 GeForce RTX 4060 Laptop GPU, Ultra 7 155H, SK hynix BC901 HFS001TEJ4X164N | Dell Inspiron 16 Plus 7630 GeForce RTX 4060 Laptop GPU, i7-13700H, WD PC SN740 SDDPTQD-1T00 | Dell Inspiron 16 Plus 7620 GeForce RTX 3050 Ti Laptop GPU, i7-12700H, Kioxia BG5 KBG50ZNS512G | Samsung Galaxy Book4 Ultra GeForce RTX 4050 Laptop GPU, Ultra 7 155H, Samsung PM9A1 MZVL2512HCJQ | Lenovo Legion 5 16IRX G9 GeForce RTX 4060 Laptop GPU, i7-14650HX, Samsung PM9A1 MZVL21T0HCLR | Asus VivoBook Pro 16 K6602VU GeForce RTX 4050 Laptop GPU, i9-13900H, Micron 2400 MTFDKBA1T0QFM | |
|---|---|---|---|---|---|---|
| Geräuschentwicklung | -2% | -13% | 0% | -17% | -11% | |
| aus / Umgebung * (dB) | 23.8 | 23.2 3% | 23.3 2% | 24.2 -2% | 24 -1% | 20.96 12% |
| Idle min * (dB) | 24.2 | 23.2 4% | 25.7 -6% | 24.2 -0% | 24 1% | 25.28 -4% |
| Idle avg * (dB) | 24.2 | 23.2 4% | 26.1 -8% | 24.2 -0% | 28.8 -19% | 25.28 -4% |
| Idle max * (dB) | 24.2 | 23.2 4% | 30.6 -26% | 24.2 -0% | 32 -32% | 25.28 -4% |
| Last avg * (dB) | 28.9 | 35.1 -21% | 46.2 -60% | 37.9 -31% | 45.5 -57% | 51.88 -80% |
| Witcher 3 ultra * (dB) | 51 | 52.5 -3% | 49.2 4% | 41.7 18% | 53.1 -4% | 49 4% |
| Last max * (dB) | 51 | 52.5 -3% | 49.4 3% | 41.7 18% | 55.7 -9% | 51.8 -2% |
* ... kleinere Werte sind besser
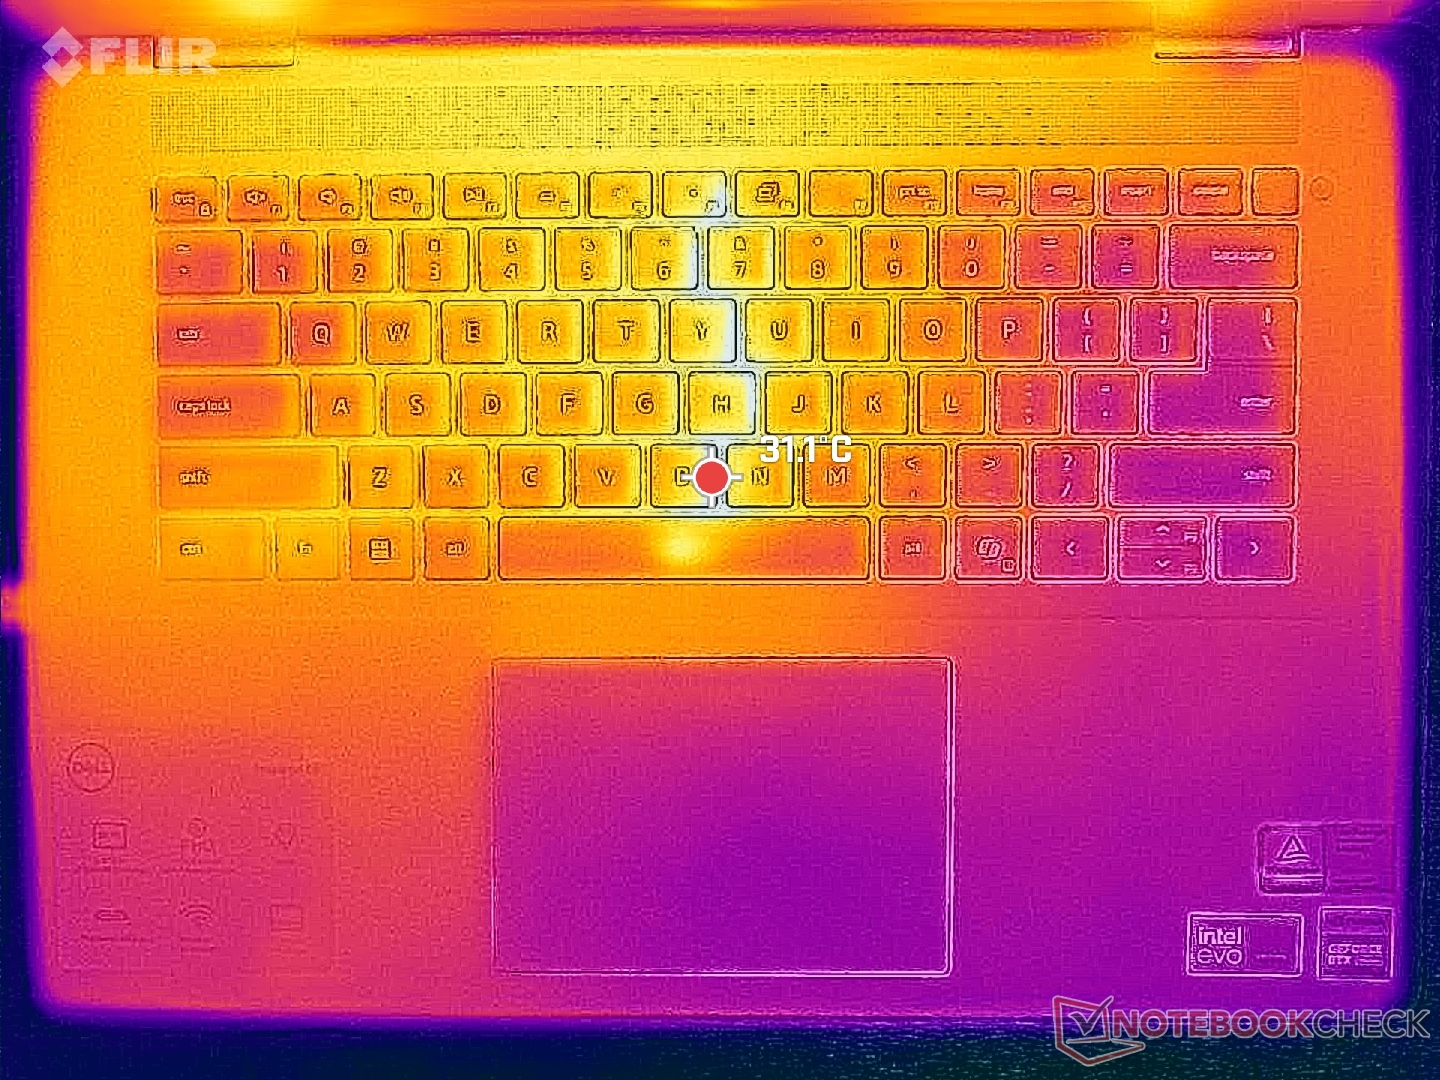
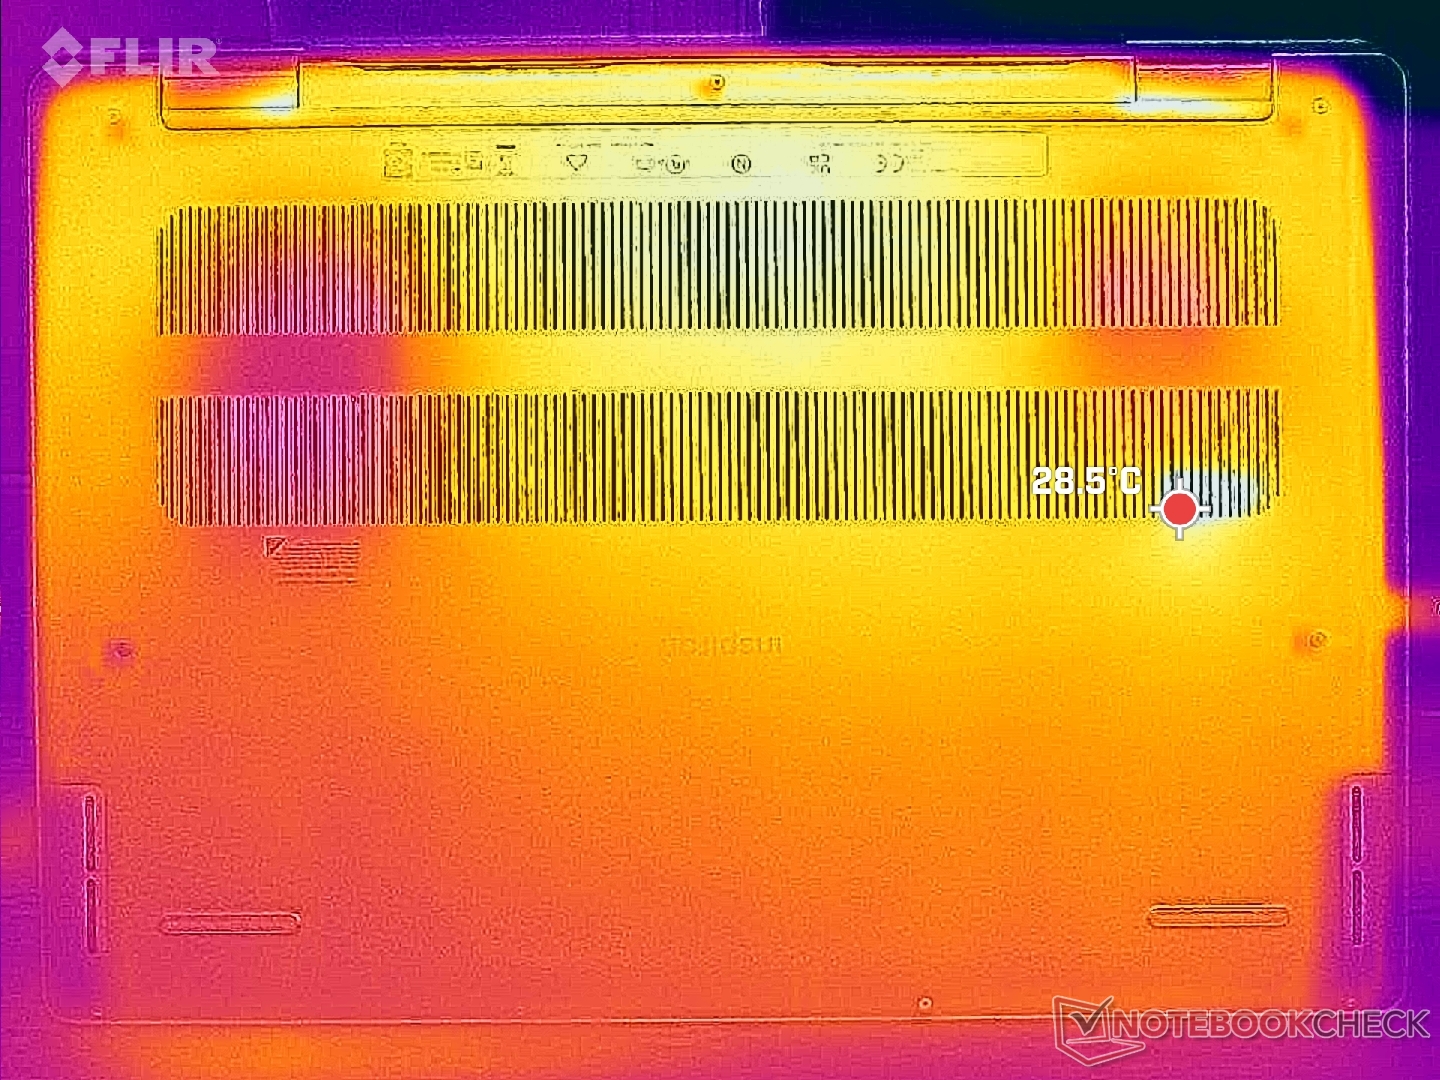
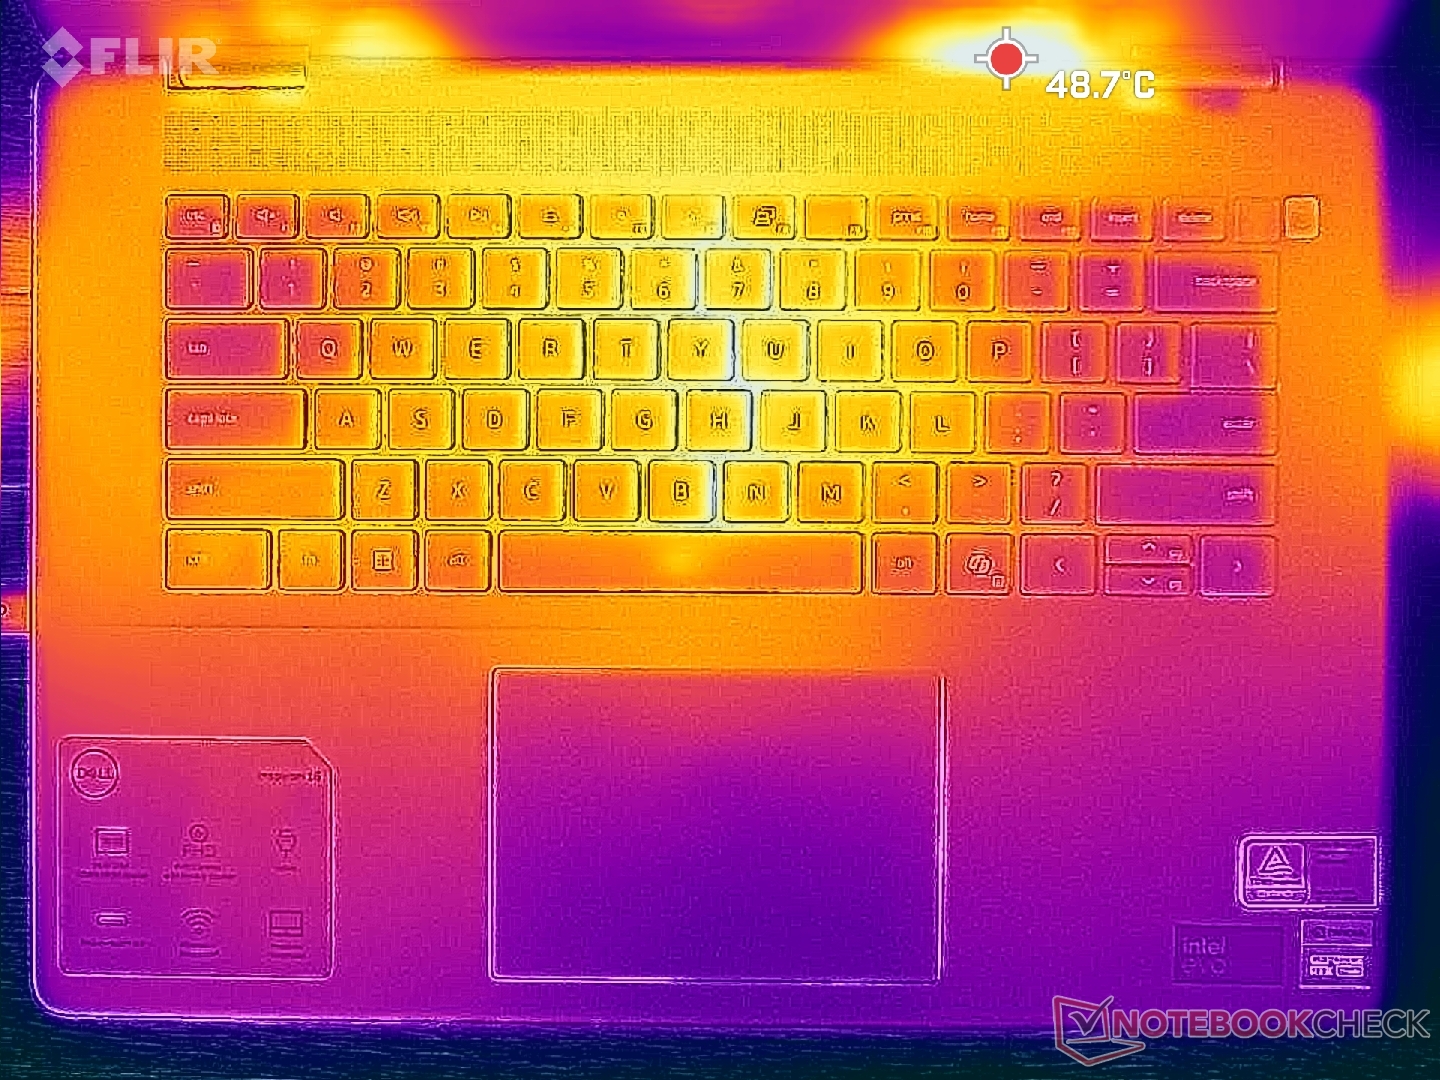
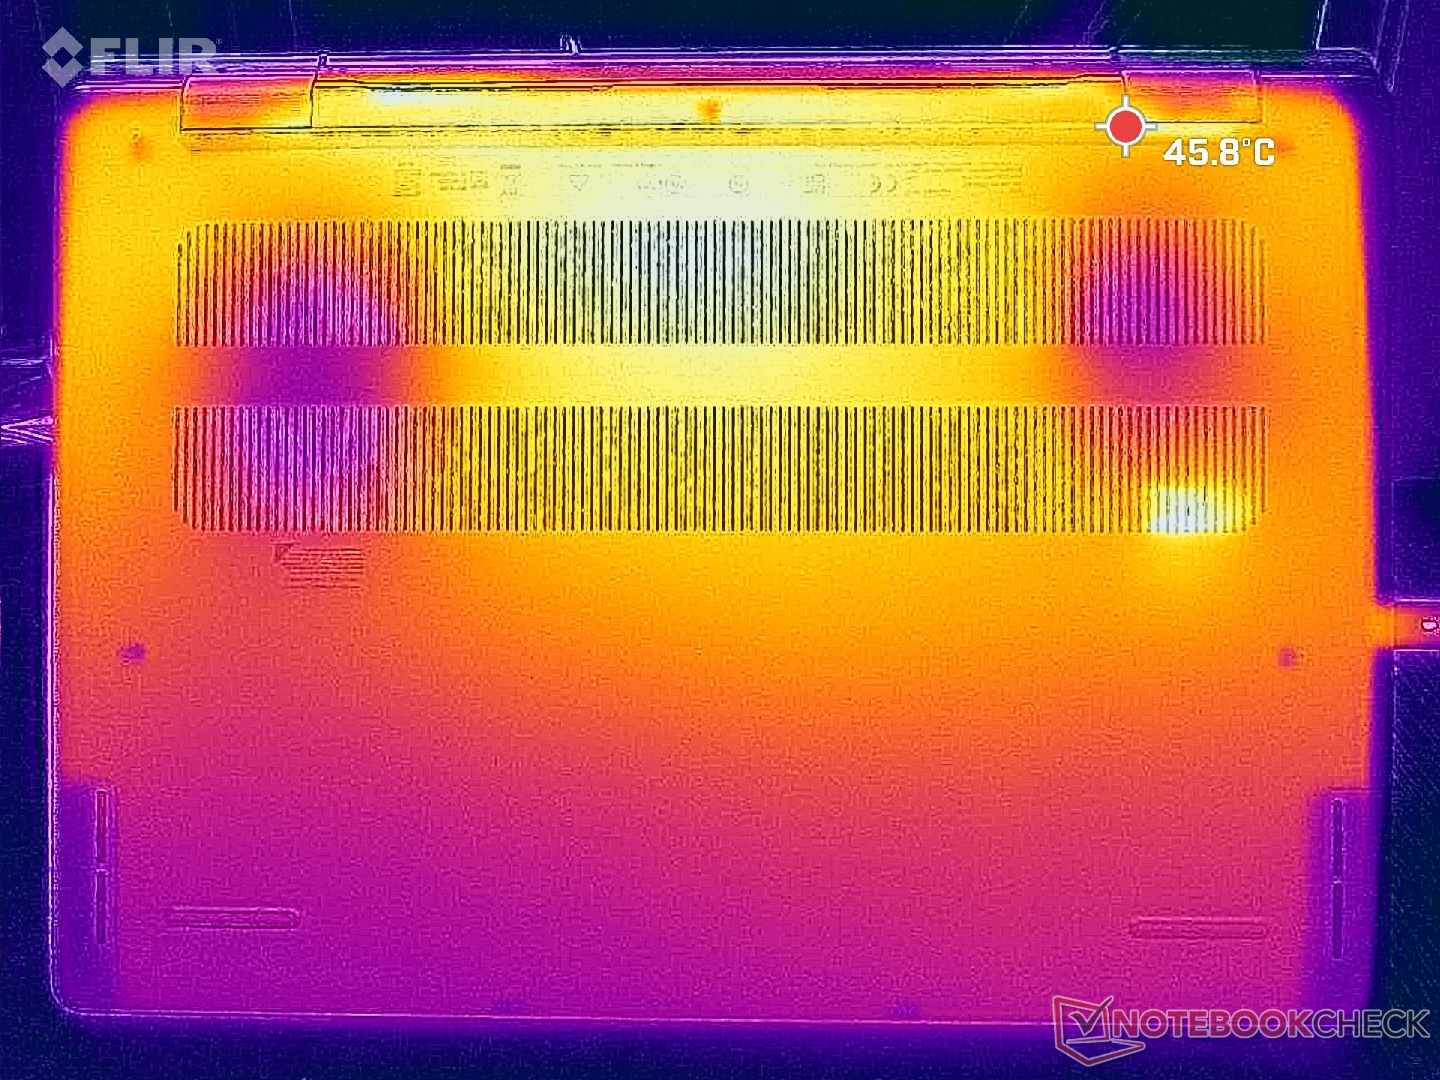
Temperatur
Die Oberflächentemperaturen können trotz der vielen Lüftungsgitter an den Rändern recht warm werden. Hot Spots beim Spielen können sowohl auf der C- als auch auf der D-Abdeckung des Gehäuses bis zu 43 °C erreichen und sind damit vergleichbar mit denen des Lenovo Legion 5i 16 G9 Gaming-Laptop.
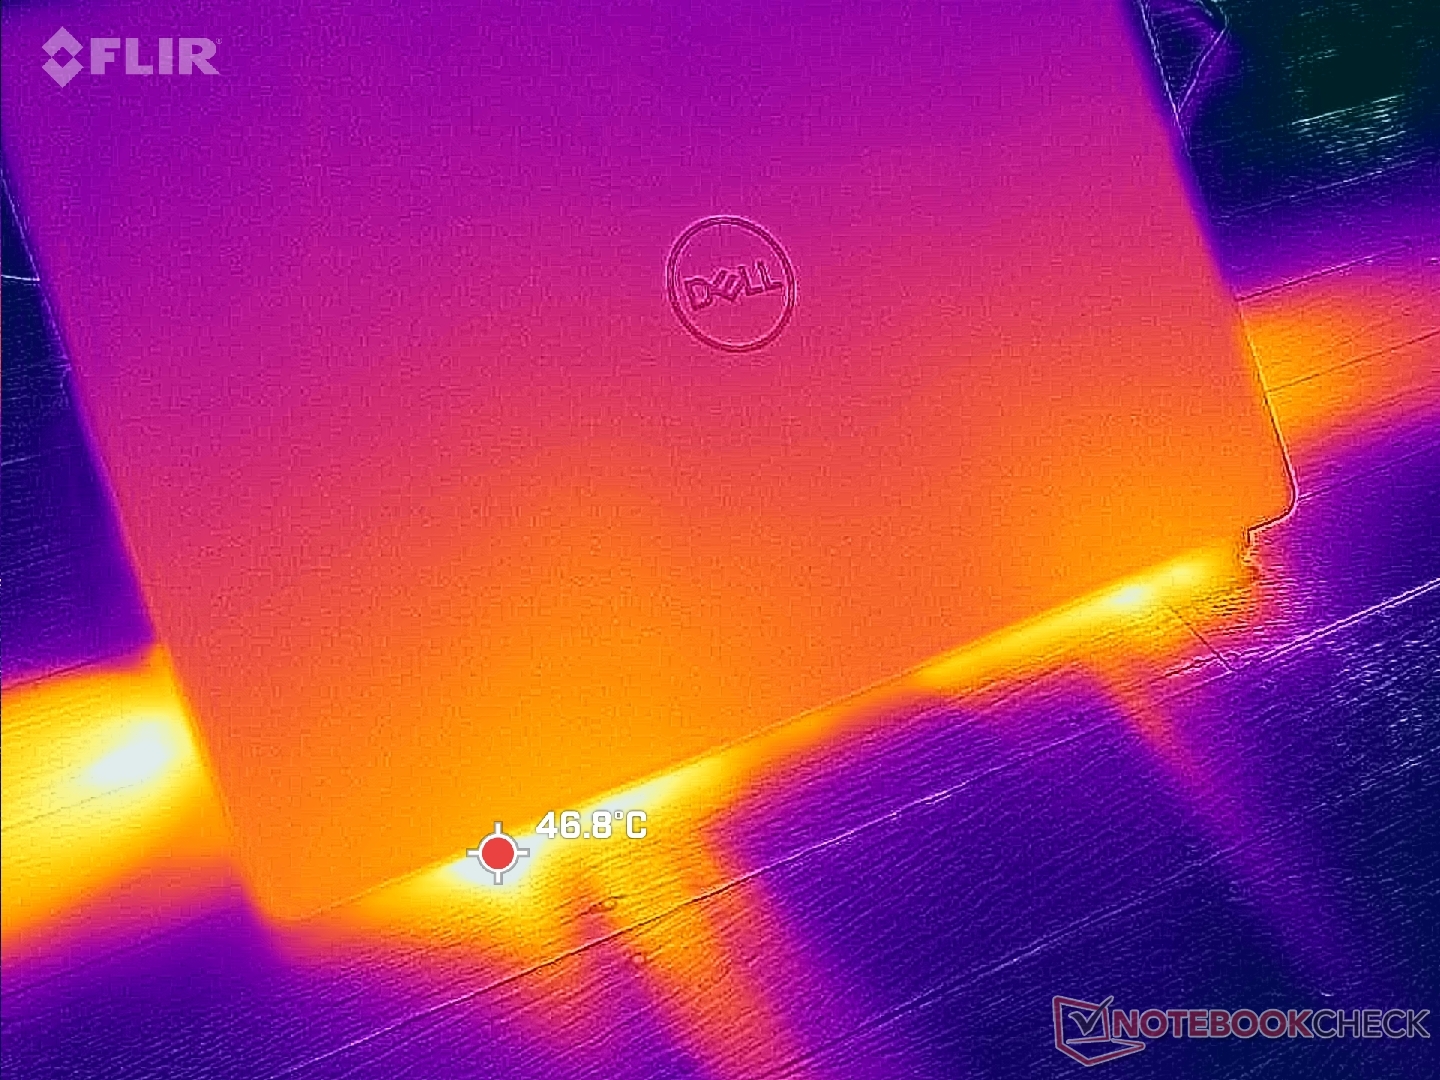
(±) Die maximale Temperatur auf der Oberseite ist 43.4 °C. Im Vergleich liegt der Klassendurchschnitt bei 36.9 °C (von 21.1 bis 71 °C für die Klasse Multimedia).
(±) Auf der Unterseite messen wir eine maximalen Wert von 41.6 °C (im Vergleich zum Durchschnitt von 39.2 °C).
(+) Ohne Last messen wir eine durchschnittliche Temperatur von 29.9 °C auf der Oberseite. Der Klassendurchschnitt erreicht 31.3 °C.
(+) Die Handballen und der Touchpad-Bereich erreichen maximal 35.2 °C und damit die typische Hauttemperatur und fühlen sich daher nicht heiß an.
(-) Die durchschnittliche Handballen-Temperatur anderer getesteter Geräte war 28.7 °C (-6.5 °C).
| Dell Inspiron 16 Plus 7640 Intel Core Ultra 7 155H, NVIDIA GeForce RTX 4060 Laptop GPU | Dell Inspiron 16 Plus 7630 Intel Core i7-13700H, NVIDIA GeForce RTX 4060 Laptop GPU | Dell Inspiron 16 Plus 7620 Intel Core i7-12700H, NVIDIA GeForce RTX 3050 Ti Laptop GPU | Samsung Galaxy Book4 Ultra Intel Core Ultra 7 155H, NVIDIA GeForce RTX 4050 Laptop GPU | Lenovo Legion 5 16IRX G9 Intel Core i7-14650HX, NVIDIA GeForce RTX 4060 Laptop GPU | Asus VivoBook Pro 16 K6602VU Intel Core i9-13900H, NVIDIA GeForce RTX 4050 Laptop GPU | |
|---|---|---|---|---|---|---|
| Hitze | -7% | -0% | 17% | 0% | -14% | |
| Last oben max * (°C) | 43.4 | 47.8 -10% | 46 -6% | 38.5 11% | 40.4 7% | 42.6 2% |
| Last unten max * (°C) | 41.6 | 42.2 -1% | 45.8 -10% | 41.2 1% | 43.8 -5% | 48.4 -16% |
| Idle oben max * (°C) | 32.8 | 35.2 -7% | 29.2 11% | 23.5 28% | 30.3 8% | 39.4 -20% |
| Idle unten max * (°C) | 32.4 | 35 -8% | 31 4% | 24.1 26% | 35.3 -9% | 39.8 -23% |
* ... kleinere Werte sind besser
Lautsprecher
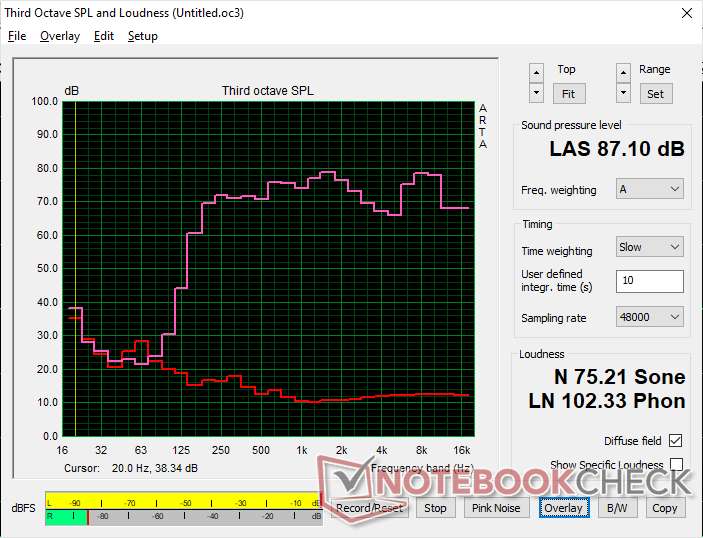
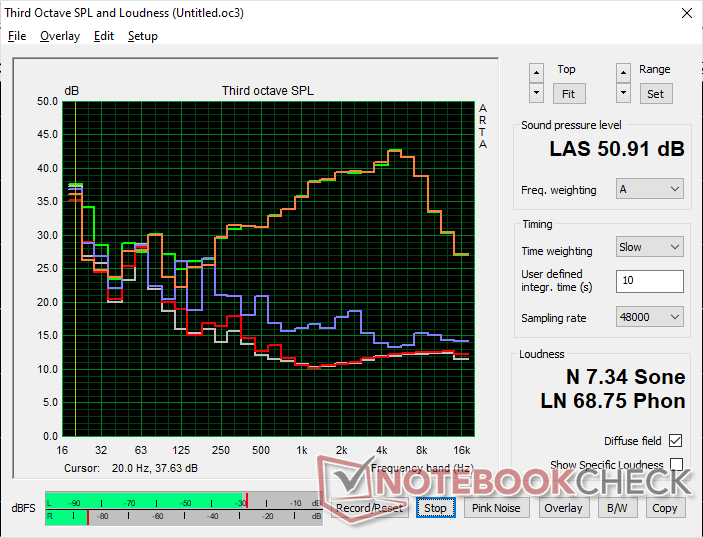
Dell Inspiron 16 Plus 7640 Audio Analyse
(+) | Die Lautsprecher können relativ laut spielen (87.1 dB)
Bass 100 - 315 Hz
(±) | abgesenkter Bass - 13.9% geringer als der Median
(±) | durchschnittlich lineare Bass-Wiedergabe (13.7% Delta zum Vorgänger)
Mitteltöne 400 - 2000 Hz
(+) | ausgeglichene Mitten, vom Median nur 3.6% abweichend
(+) | lineare Mitten (3.4% Delta zum Vorgänger)
Hochtöne 2 - 16 kHz
(+) | ausgeglichene Hochtöne, vom Median nur 4.3% abweichend
(+) | sehr lineare Hochtöne (5.7% Delta zum Vorgänger)
Gesamt im hörbaren Bereich 100 - 16.000 Hz
(+) | hörbarer Bereich ist sehr linear (11.3% Abstand zum Median
Im Vergleich zu allen Geräten derselben Klasse
» 15% aller getesteten Geräte dieser Klasse waren besser, 4% vergleichbar, 81% schlechter
» Das beste Gerät hat einen Delta-Wert von 5%, durchschnittlich ist 17%, das schlechteste Gerät hat 45%
Im Vergleich zu allen Geräten im Test
» 7% aller getesteten Geräte waren besser, 2% vergleichbar, 91% schlechter
» Das beste Gerät hat einen Delta-Wert von 4%, durchschnittlich ist 24%, das schlechteste Gerät hat 134%
Apple MacBook Pro 16 2021 M1 Pro Audio Analyse
(+) | Die Lautsprecher können relativ laut spielen (84.7 dB)
Bass 100 - 315 Hz
(+) | guter Bass - nur 3.8% Abweichung vom Median
(+) | lineare Bass-Wiedergabe (5.2% Delta zum Vorgänger)
Mitteltöne 400 - 2000 Hz
(+) | ausgeglichene Mitten, vom Median nur 1.3% abweichend
(+) | lineare Mitten (2.1% Delta zum Vorgänger)
Hochtöne 2 - 16 kHz
(+) | ausgeglichene Hochtöne, vom Median nur 1.9% abweichend
(+) | sehr lineare Hochtöne (2.7% Delta zum Vorgänger)
Gesamt im hörbaren Bereich 100 - 16.000 Hz
(+) | hörbarer Bereich ist sehr linear (4.6% Abstand zum Median
Im Vergleich zu allen Geräten derselben Klasse
» 0% aller getesteten Geräte dieser Klasse waren besser, 0% vergleichbar, 100% schlechter
» Das beste Gerät hat einen Delta-Wert von 5%, durchschnittlich ist 17%, das schlechteste Gerät hat 45%
Im Vergleich zu allen Geräten im Test
» 0% aller getesteten Geräte waren besser, 0% vergleichbar, 100% schlechter
» Das beste Gerät hat einen Delta-Wert von 4%, durchschnittlich ist 24%, das schlechteste Gerät hat 134%
Energieverwaltung
Stromverbrauch
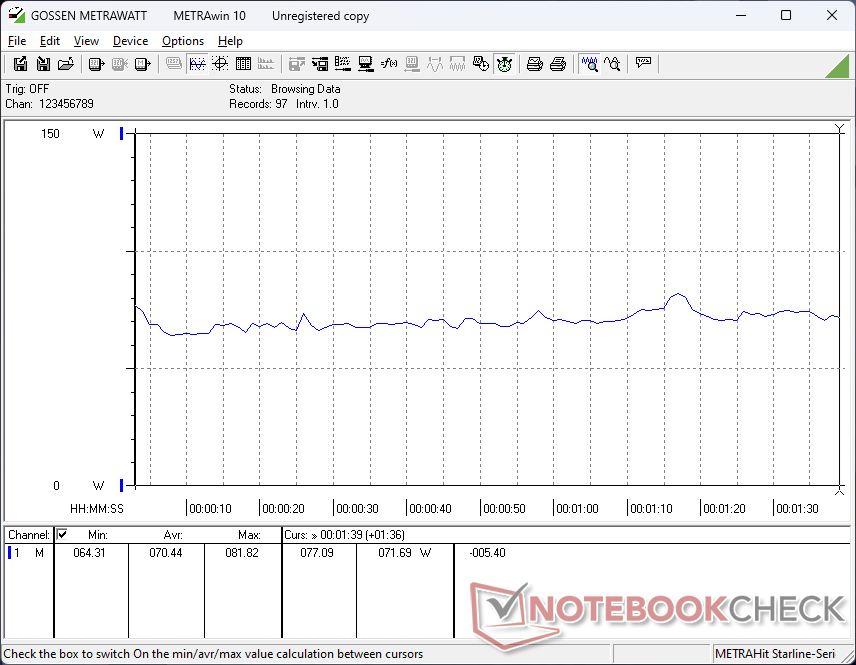
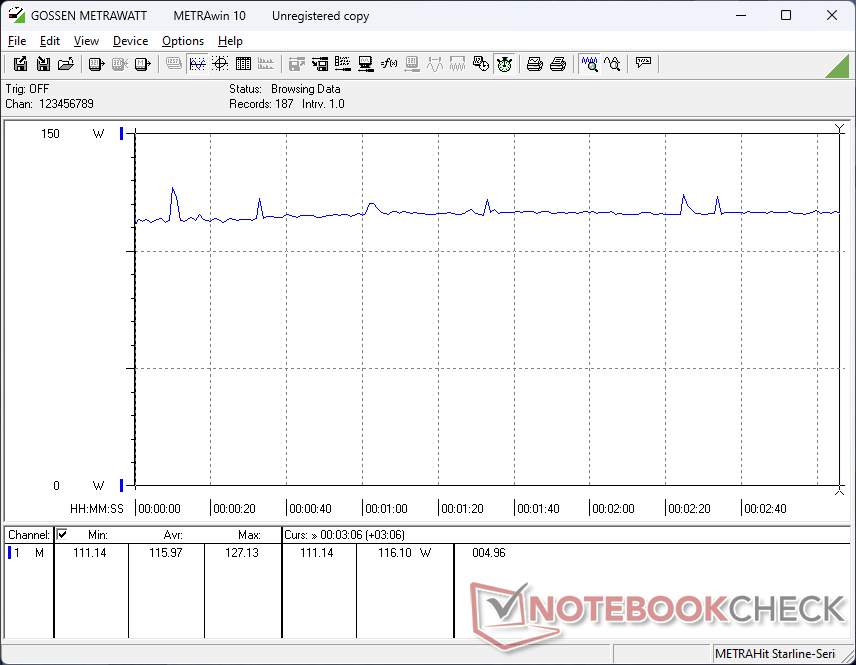
Der Stromverbrauch ist im Leerlauf auf dem Desktop spürbar niedriger als beim Vorjahresmodell, was die allgemein längere Akkulaufzeit im nächsten Abschnitt unten erklären kann. Das System benötigt zwischen 4 und 16 W im Vergleich zu 16 bis 21 W beim Inspiron 16 Plus 7630. Der Verbrauch bei anspruchsvolleren Anwendungen wie Spielen ist ansonsten fast gleich, wenn nicht sogar um ein paar Watt niedriger.
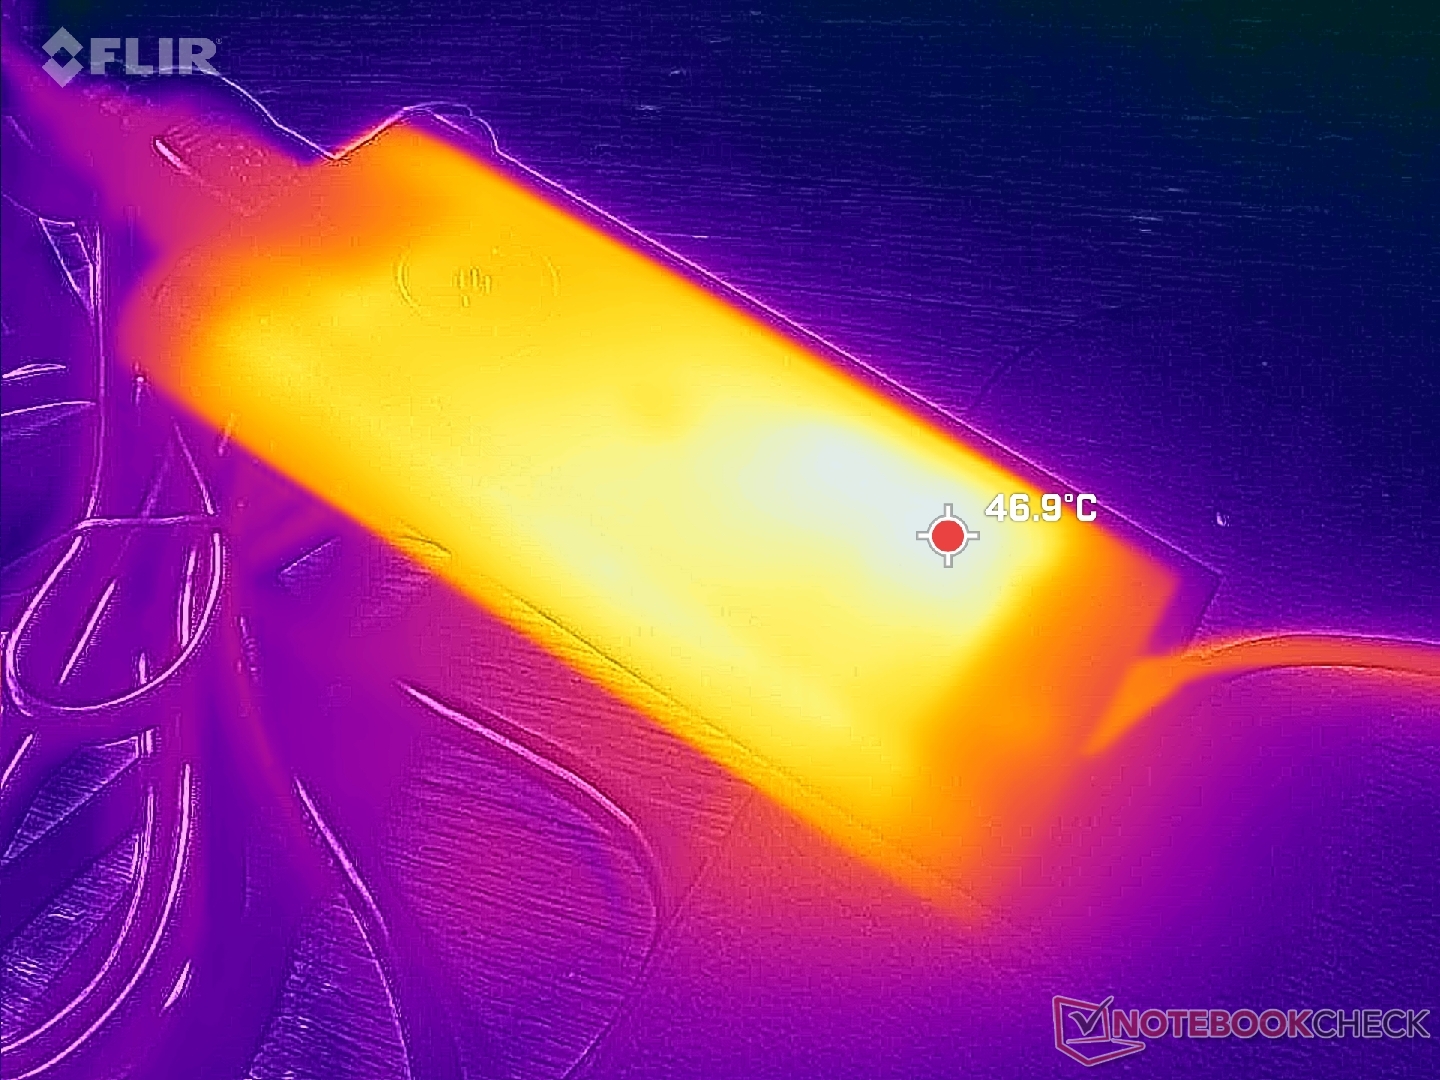
Interessanterweise wird das Modell mit einem universellen 130-W-USB-C-Netzteil (~14,3 x 6,5 x 2,2 cm) anstelle des proprietären 130-W-Netzteils geliefert, das dem Vorjahresmodell beilag. Der Anschluss für das Fassadennetzteil bleibt jedoch erhalten, d. h. Sie können das System weiterhin über ein kompatibles Fassadennetzteil aufladen. Bei der gleichzeitigen Ausführung von Prime95 und FurMark stellten wir eine vorübergehende maximale Leistungsaufnahme von 138 W fest.
| Aus / Standby | |
| Idle | |
| Last |
|
Legende:
min: | |
| Dell Inspiron 16 Plus 7640 Ultra 7 155H, GeForce RTX 4060 Laptop GPU, SK hynix BC901 HFS001TEJ4X164N, IPS, 2560x1600, 16" | Dell Inspiron 16 Plus 7630 i7-13700H, GeForce RTX 4060 Laptop GPU, WD PC SN740 SDDPTQD-1T00, IPS, 2560x1600, 16" | Dell Inspiron 16 Plus 7620 i7-12700H, GeForce RTX 3050 Ti Laptop GPU, Kioxia BG5 KBG50ZNS512G, IPS, 3072x1920, 16" | Samsung Galaxy Book4 Ultra Ultra 7 155H, GeForce RTX 4050 Laptop GPU, Samsung PM9A1 MZVL2512HCJQ, OLED, 2880x1800, 16" | Lenovo Legion 5 16IRX G9 i7-14650HX, GeForce RTX 4060 Laptop GPU, Samsung PM9A1 MZVL21T0HCLR, IPS, 2560x1600, 16" | Asus VivoBook Pro 16 K6602VU i9-13900H, GeForce RTX 4050 Laptop GPU, Micron 2400 MTFDKBA1T0QFM, OLED, 3200x2000, 16" | |
|---|---|---|---|---|---|---|
| Stromverbrauch | -82% | -30% | 9% | -113% | -116% | |
| Idle min * (Watt) | 4.2 | 15.6 -271% | 6.8 -62% | 4.8 -14% | 15.4 -267% | 21.06 -401% |
| Idle avg * (Watt) | 6.9 | 17.7 -157% | 9.6 -39% | 7.5 -9% | 19.7 -186% | 24.27 -252% |
| Idle max * (Watt) | 15.2 | 20.6 -36% | 17 -12% | 7.9 48% | 20.7 -36% | 25.12 -65% |
| Last avg * (Watt) | 70.4 | 87.4 -24% | 117.5 -67% | 79.3 -13% | 102.6 -46% | 52.4 26% |
| Witcher 3 ultra * (Watt) | 115.9 | 121.7 -5% | 113.1 2% | 79.2 32% | 191.3 -65% | 110.2 5% |
| Last max * (Watt) | 137.4 | 138 -0% | 137.4 -0% | 125 9% | 246.6 -79% | 146 -6% |
* ... kleinere Werte sind besser
Power Consumption Witcher 3 / Stresstest
Power Consumption external Monitor
Akkulaufzeit
Die Laufzeiten sind viel länger als zuvor, was wahrscheinlich auf Optimierungen und den Wechsel zu einer neueren Generation der Intel CPU zurückzuführen ist. Wir konnten eine reale WLAN-Laufzeit Akkulaufzeit von fast 13,5 Stunden aufzeichnen, verglichen mit 9,5 Stunden beim letztjährigen Modell.
Das Aufladen von der leeren bis zur vollen Kapazität dauert mit dem mitgelieferten USB-C-Adapter etwa zwei Stunden.
| Dell Inspiron 16 Plus 7640 Ultra 7 155H, GeForce RTX 4060 Laptop GPU, 90 Wh | Dell Inspiron 16 Plus 7630 i7-13700H, GeForce RTX 4060 Laptop GPU, 86 Wh | Dell Inspiron 16 Plus 7620 i7-12700H, GeForce RTX 3050 Ti Laptop GPU, 86 Wh | Samsung Galaxy Book4 Ultra Ultra 7 155H, GeForce RTX 4050 Laptop GPU, 76 Wh | Lenovo Legion 5 16IRX G9 i7-14650HX, GeForce RTX 4060 Laptop GPU, 80 Wh | Asus VivoBook Pro 16 K6602VU i9-13900H, GeForce RTX 4050 Laptop GPU, 96 Wh | |
|---|---|---|---|---|---|---|
| Akkulaufzeit | -29% | -28% | -18% | -44% | -24% | |
| WLAN (h) | 13.3 | 9.4 -29% | 9.6 -28% | 10.9 -18% | 7.4 -44% | 10.1 -24% |
| Idle (h) | 17.6 | 18.6 | ||||
| Last (h) | 1.4 | 1.2 | 1.3 | 0.8 | ||
| H.264 (h) | 17.9 | 9.6 | 9.8 |
Pro
Contra
Fazit - Flicken einiger kleiner Löcher
Während das Inspiron 16 Plus 7640 2024 dem Inspiron 16 Plus 2023 zwar sehr ähnlich sehen, bringt es über das erwartete jährliche Prozessor-Upgrade hinaus genügend Neuerungen mit, die interessierte Käufer beachten sollten. Das neuere Modell unterstützt bis zu zwei SSDs, bietet schnellere Schwarz-Weiß- und Grau-Grau-Reaktionszeiten, eine längere Akkulaufzeit und KI-Beschleunigung. Diese Änderungen unter der Haube sind für Enthusiasten wichtig, die Wert auf Speichererweiterung, schnelle Spiele, Reisen und KI-unterstützte Programme wie Co-Pilot legen. In dieser Hinsicht ist das Inspiron 16 Plus 7640 ein klarer Vorteil gegenüber seinem Vorgänger.
Der Inspiron 16 Plus 7640 behebt einige der Nachteile seines Vorgängers und ist damit eine noch bessere Multimedia-Maschine als zuvor. Die Single-Thread-CPU-Leistung und Gaming Performance gehen jedoch einen kleinen Schritt rückwärts.
Leider muss die Gaming Performance mit dem neuen Modell Einbußen hinnehmen, da die meisten Spiele etwas langsamer laufen als zuvor. Für Hardcore-Spieler mag das enttäuschend sein, aber das Defizit sollte nicht ausreichen, um Gelegenheitsspieler abzuschrecken, für die die Inspiron Serie entwickelt wurde. Gamer, die wirklich mehr Leistung aus ihrem Laptop herausholen wollen, müssen sich mit größeren und teureren Modellen wie denen der Dell-G16-Serie, Asus-Zephyrus-G16-Serie oder Razer-Blade-16-Serie, wo TGP oft dreistellige Werte erreichen kann.
Hinweis: Wir haben unser Rating-System kürzlich aktualisiert und die Ergebnisse von Version 8 sind nicht mit den Ergebnissen von Version 7 vergleichbar. Weitere Informationen dazu sind hier verfügbar.
Preis und Verfügbarkeit
Unsere Testkonfiguration aus Core Ultra 7, RTX 4060 und 1.600p wird derzeit direkt von Dell für 1.300 US-Dollar ausgeliefert. Die günstigere SKU mit Core i7 mit UHD Graphics beginnt bei nur 900 US-Dollar.
Dell Inspiron 16 Plus 7640
- 21.06.2024 v8
Allen Ngo
Transparenz
Die Auswahl der zu testenden Geräte erfolgt innerhalb der Redaktion. Das vorliegende Testmuster wurde dem Autor vom Hersteller oder einem Shop zu Testzwecken leihweise zur Verfügung gestellt. Eine Einflussnahme des Leihstellers auf den Testbericht gab es nicht, der Hersteller erhielt keine Version des Reviews vor der Veröffentlichung. Es bestand keine Verpflichtung zur Publikation. Als eigenständiges, unabhängiges Unternehmen unterliegt Notebookcheck keiner Diktion von Herstellern, Shops und Verlagen.
So testet Notebookcheck
Pro Jahr werden von Notebookcheck hunderte Laptops und Smartphones unabhängig in von uns standardisierten technischen Verfahren getestet, um eine Vergleichbarkeit aller Testergebnisse zu gewährleisten. Seit rund 20 Jahren entwickeln wir diese Testmethoden kontinuierlich weiter und setzen damit Branchenstandards. In unseren Testlaboren kommt ausschließlich hochwertiges Messequipment in die Hände erfahrener Techniker und Redakteure. Die Tests unterliegen einer mehrstufigen Kontrolle. Unsere komplexe Gesamtbewertung basiert auf hunderten fundierten Messergebnissen und Benchmarks, womit Ihnen Objektivität garantiert ist. Weitere Informationen zu unseren Testmethoden gibt es hier.
Preisvergleich

