MSI Raider 18 HX A14V im Test: Titan-Leistung ohne den Titan-Preis
")
Größere 18-Zoll-Gaming-Notebooks erleben derzeit eine Art Comeback, da die Auswahl in dieser Produktkategorie stetig wächst. MSI hat bereits mit dem Titan 18 HX das „ultimative“ 18-Zoll-Gaming-Erlebnis auf den Markt gebracht. Mit dem neuen Raider 18 HX-Modell bietet MSI nun eine kompaktere Version an, die darauf abzielt, den Einstieg in die 18-Zoll-Klasse zu erleichtern.
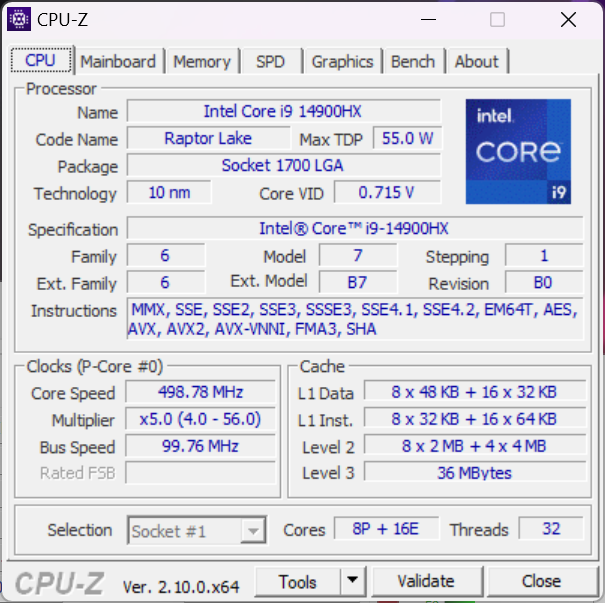
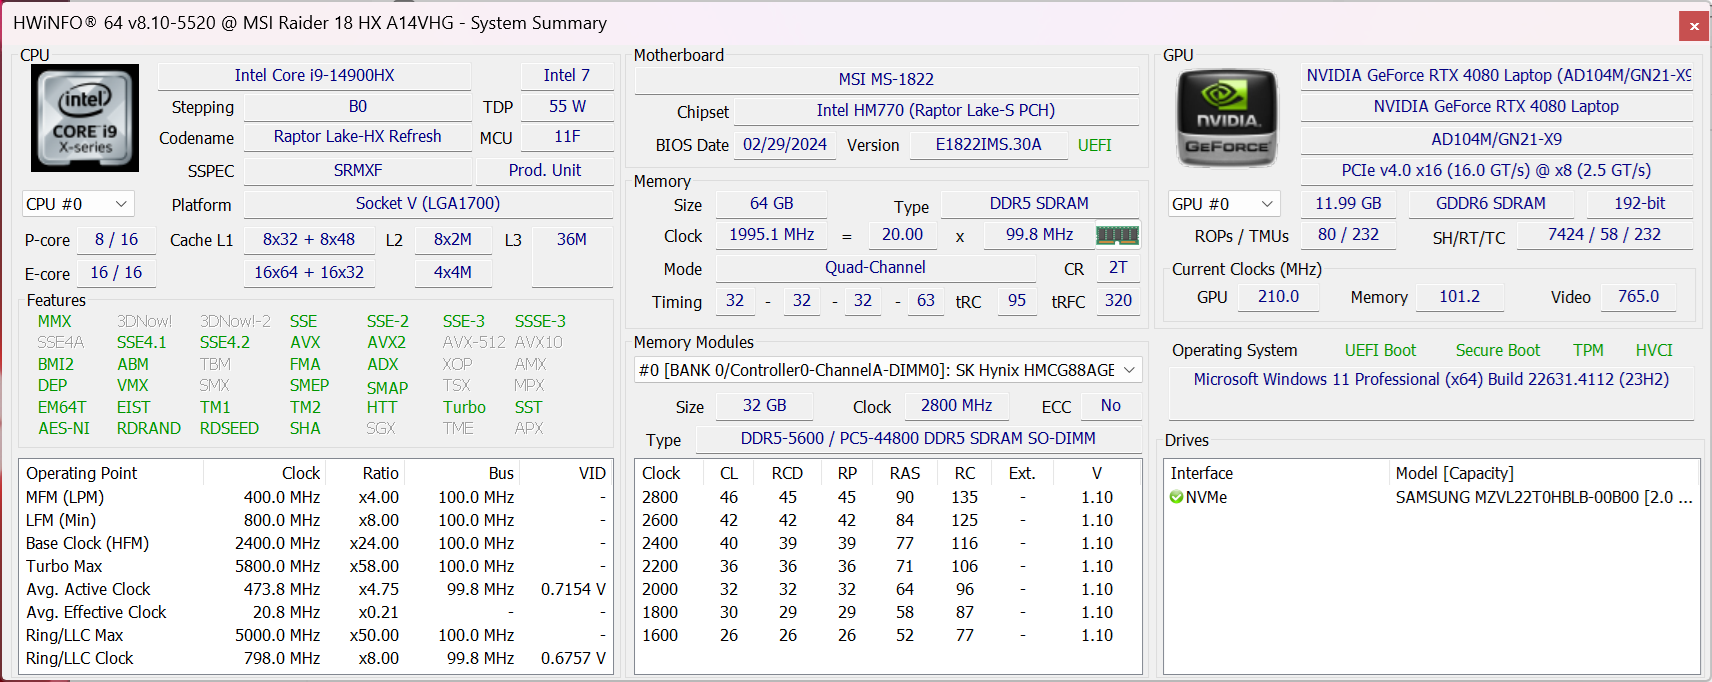
Unser Testgerät ist eine mittlere Konfiguration und kommt mit einer Raptor Lake-R Core i9-14900HX CPU, einer 175 W GeForce RTX 4080 GPU und einem 3,840 x 2,400 120 Hz Mini-LED-Display für rund 4000 Euro. Andere Ausstattungsvarianten enthalten den Zen 4 Ryzen 9 7945HX, eine RTX 4070 oder RTX 4090 sowie ein QHD+ 2560 x 1600 240 Hz IPS-Display.
Der Raider 18 HX tritt in Konkurrenz zu anderen 18-Zoll-Gaming-Laptops wie dem Razer Blade 18, Alienware m18 R2 oder dem Asus ROG Strix G18.
Weitere MSI Bewertungen:
Mögliche Konkurrenten im Vergleich
Bew. | Version | Datum | Modell | Gewicht | Dicke | Größe | Auflösung | Preis ab |
|---|---|---|---|---|---|---|---|---|
| 84.7 % | v8 | 09 / 2024 | MSI Raider 18 HX A14V i9-14900HX, GeForce RTX 4080 Laptop GPU | 3.6 kg | 32 mm | 18.00" | 3840x2400 | |
| 90.5 % v7 (old) | v7 (old) | 05 / 2024 | Razer Blade 18 2024 RZ09-0509 i9-14900HX, GeForce RTX 4090 Laptop GPU | 3.1 kg | 21.9 mm | 18.00" | 2560x1600 | |
| 89.5 % v7 (old) | v7 (old) | 03 / 2024 | Alienware m18 R2 i9-14900HX, GeForce RTX 4090 Laptop GPU | 4 kg | 26.7 mm | 18.00" | 2560x1600 | |
| 88.8 % v7 (old) | v7 (old) | 01 / 2024 | MSI Titan 18 HX A14VIG i9-14900HX, GeForce RTX 4090 Laptop GPU | 3.6 kg | 32.1 mm | 18.00" | 3840x2400 | |
| 87.4 % v7 (old) | v7 (old) | 03 / 2023 | Asus ROG Strix G18 G814JI i7-13650HX, GeForce RTX 4070 Laptop GPU | 3 kg | 31 mm | 18.00" | 2560x1600 | |
| 87.1 % v7 (old) | v7 (old) | 02 / 2024 | Acer Predator Helios 18 PH18-72-98MW i9-14900HX, GeForce RTX 4090 Laptop GPU | 3.3 kg | 29.5 mm | 18.00" | 2560x1600 |
Hinweis: Wir haben unser Bewertungssystem kürzlich aktualisiert, und die Ergebnisse der Version 8 sind nicht mit denen der Version 7 vergleichbar. Weitere Informationen finden Sie hier.
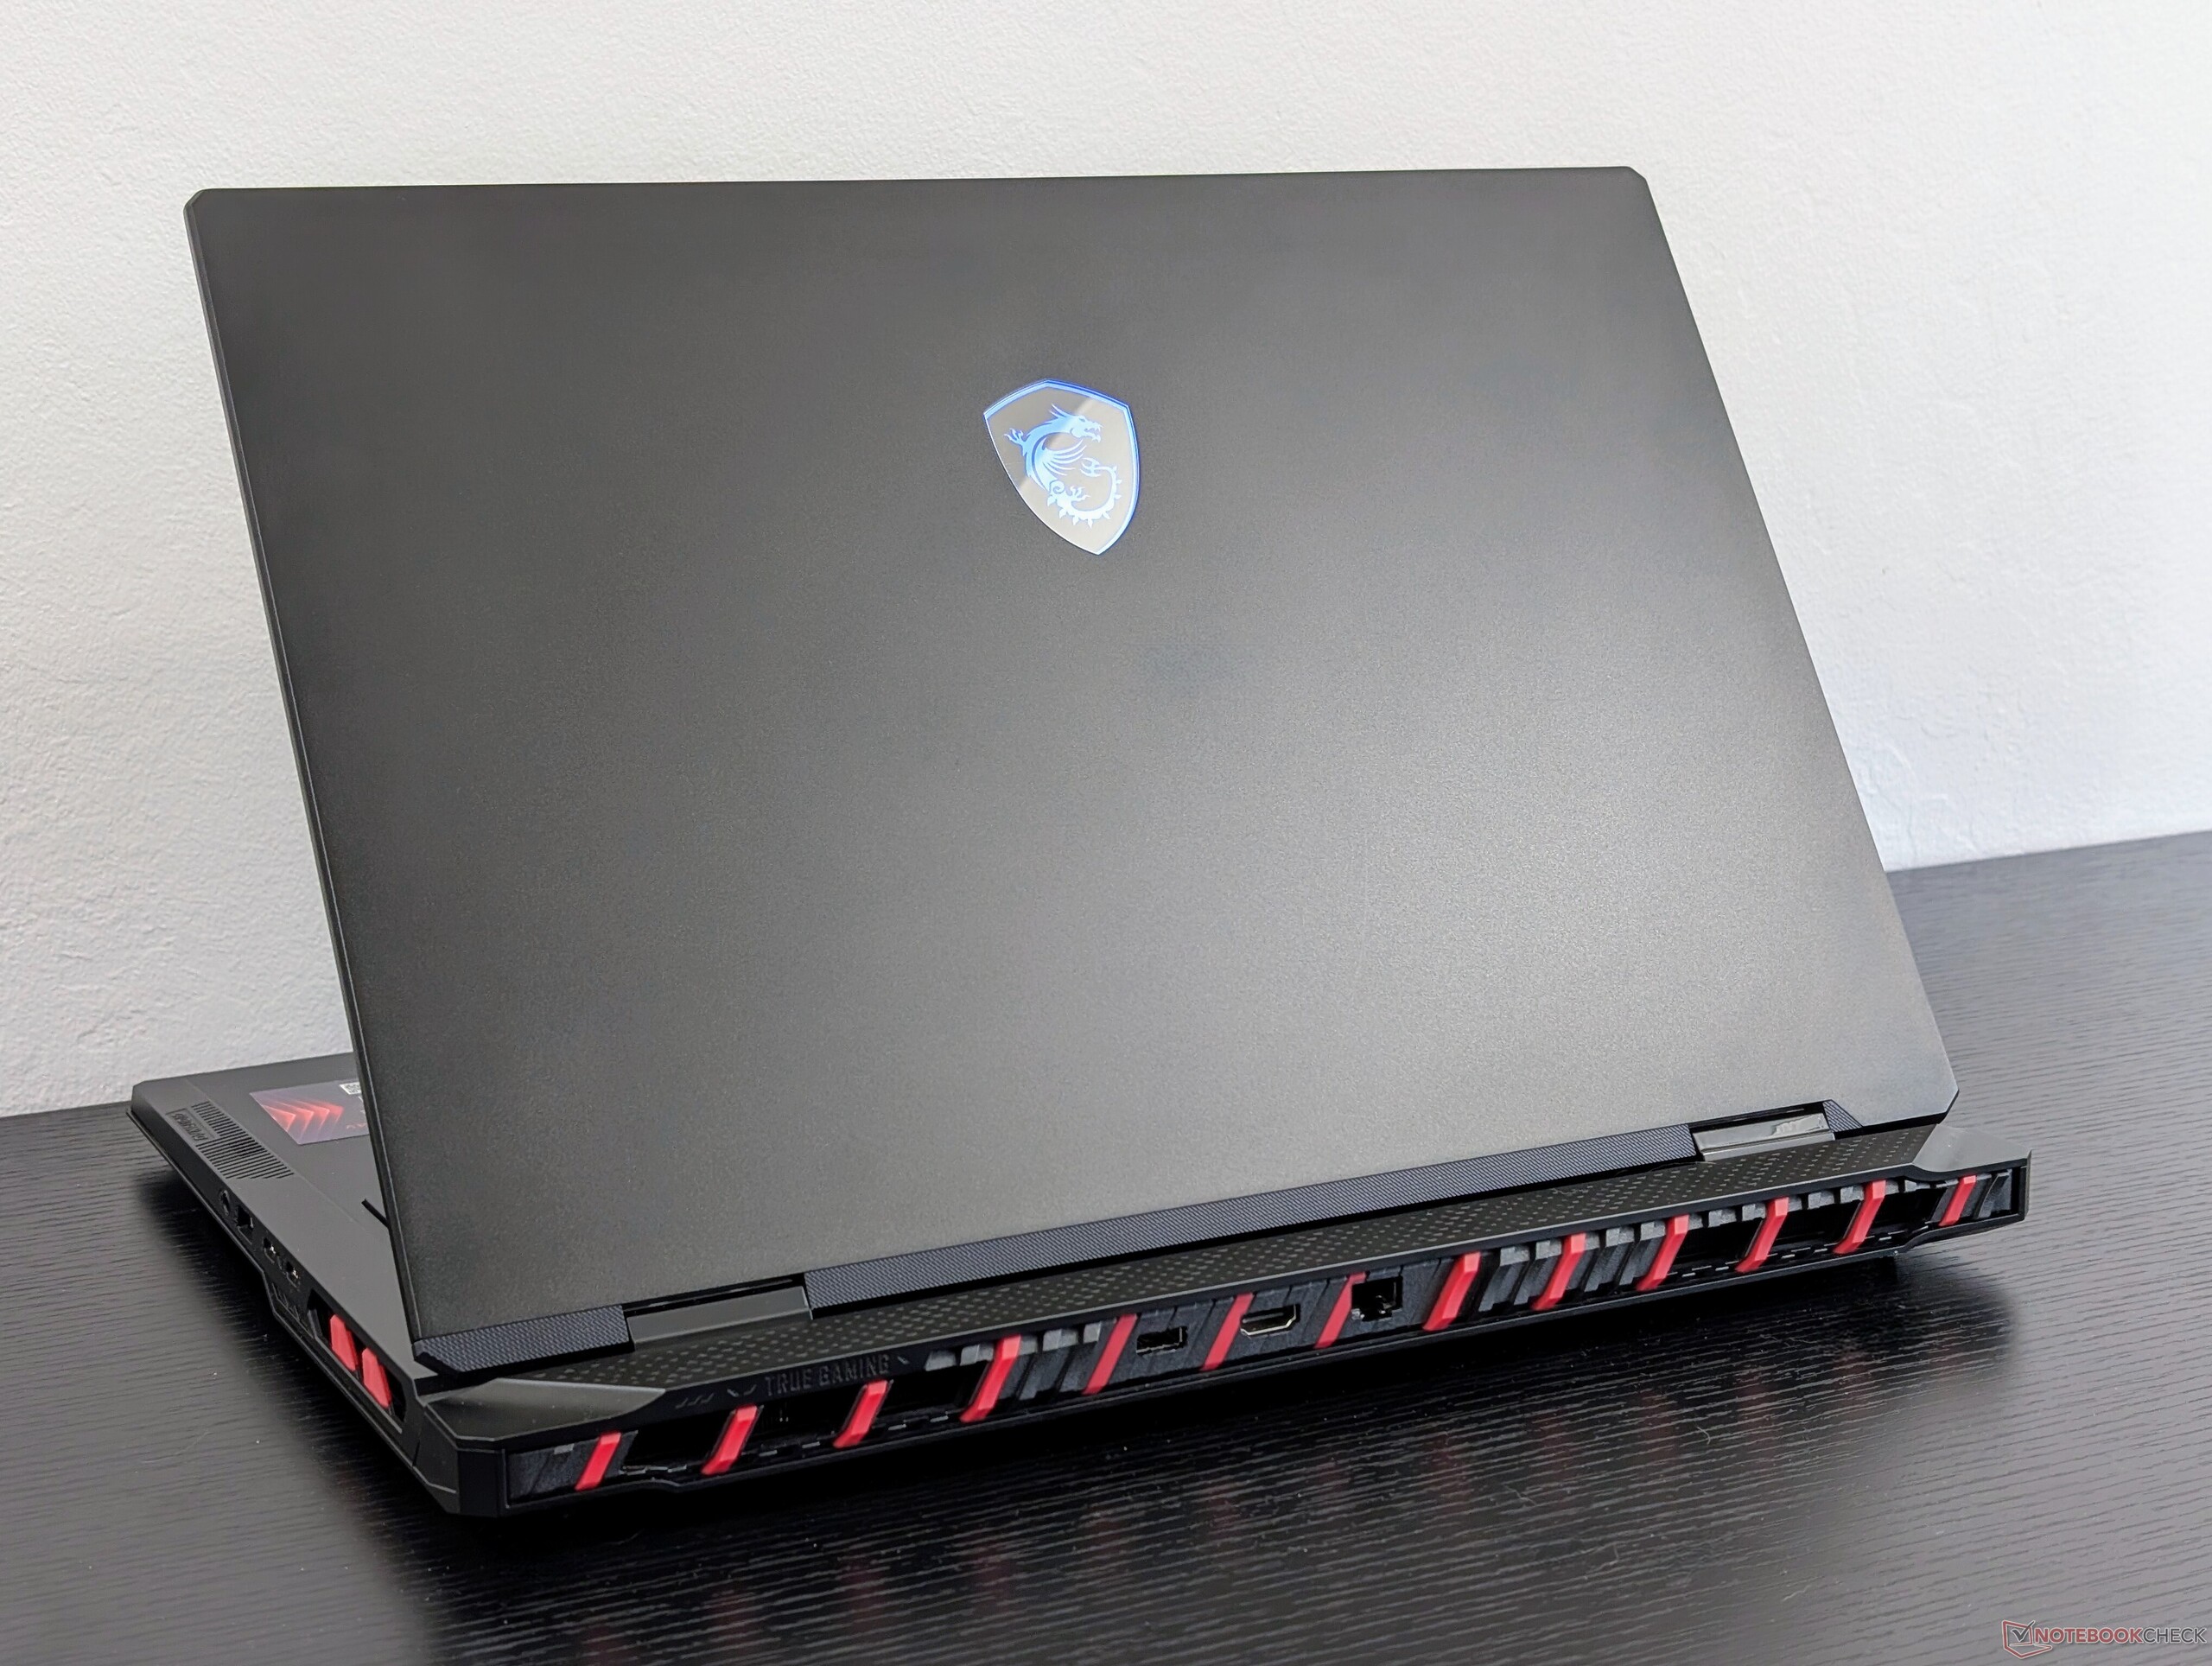
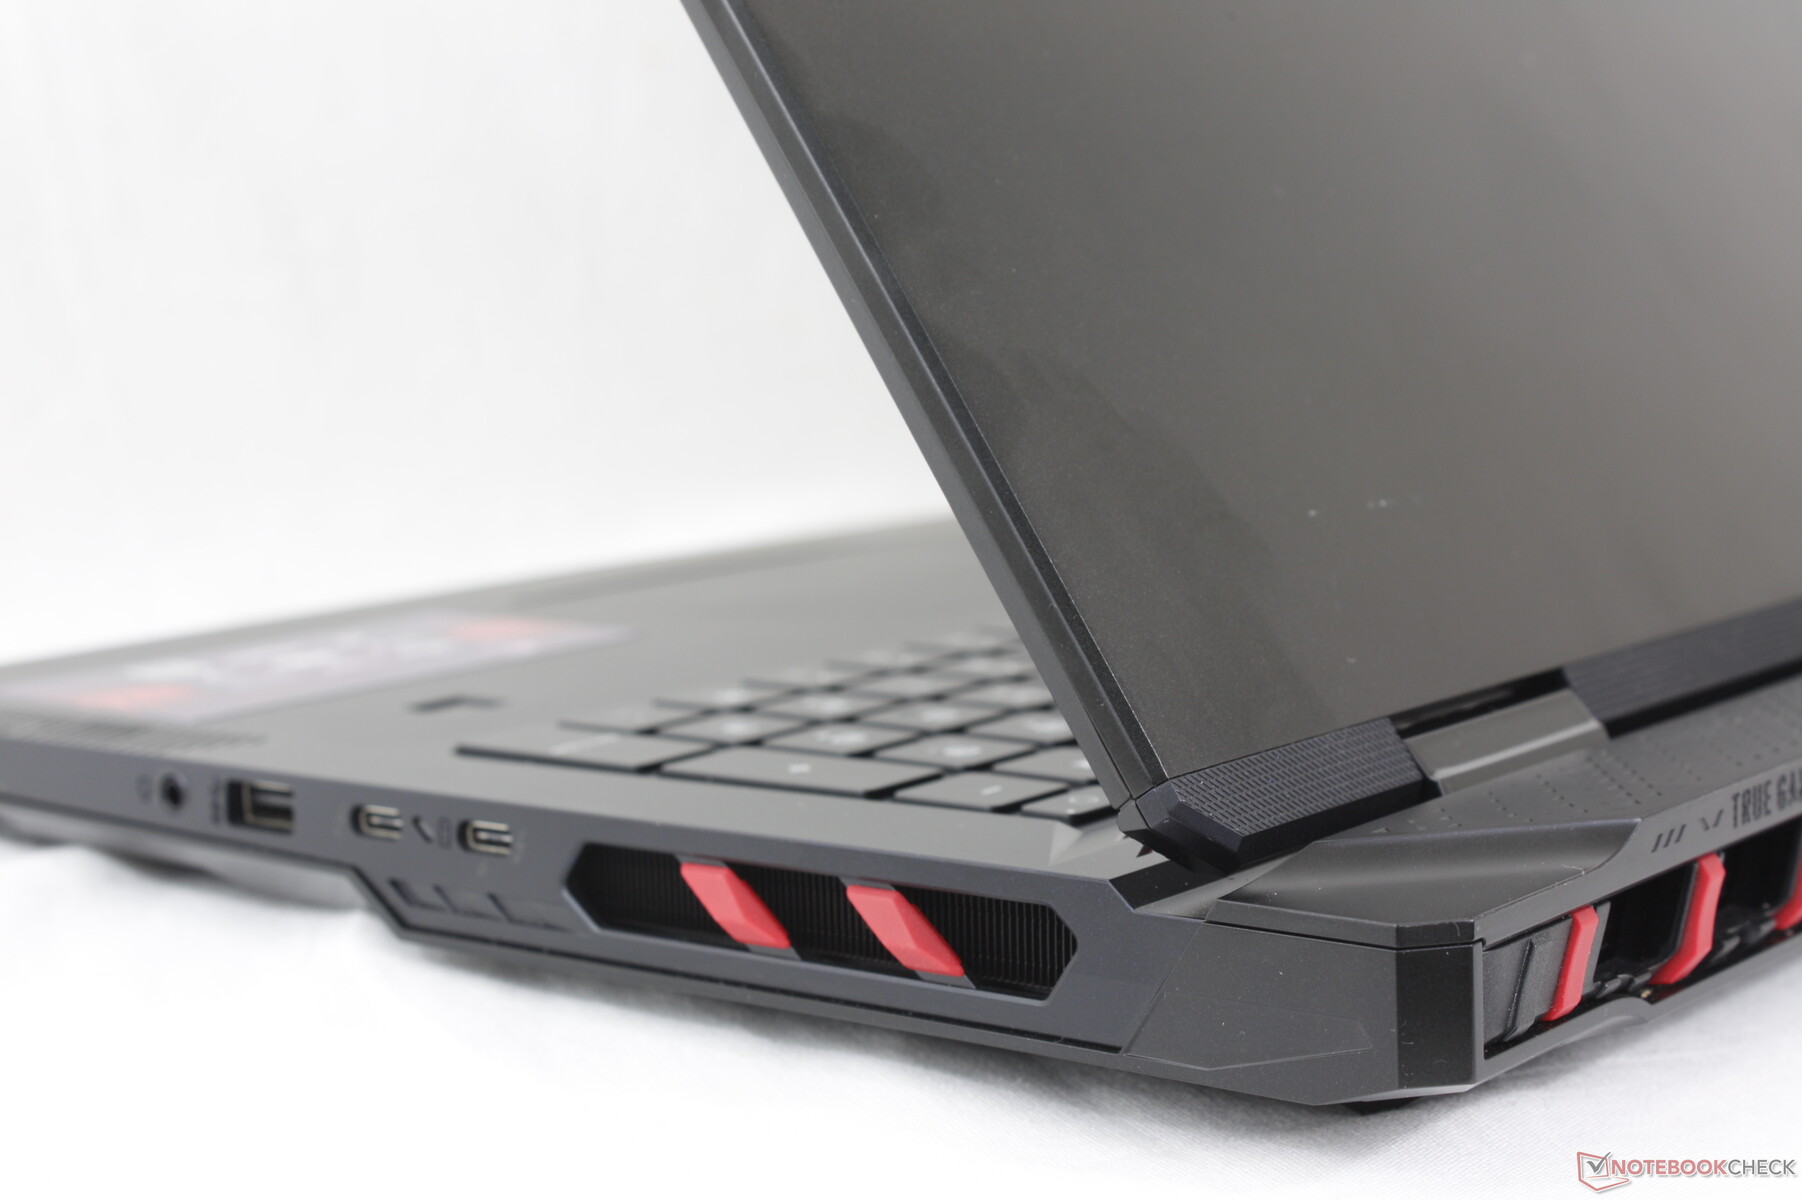
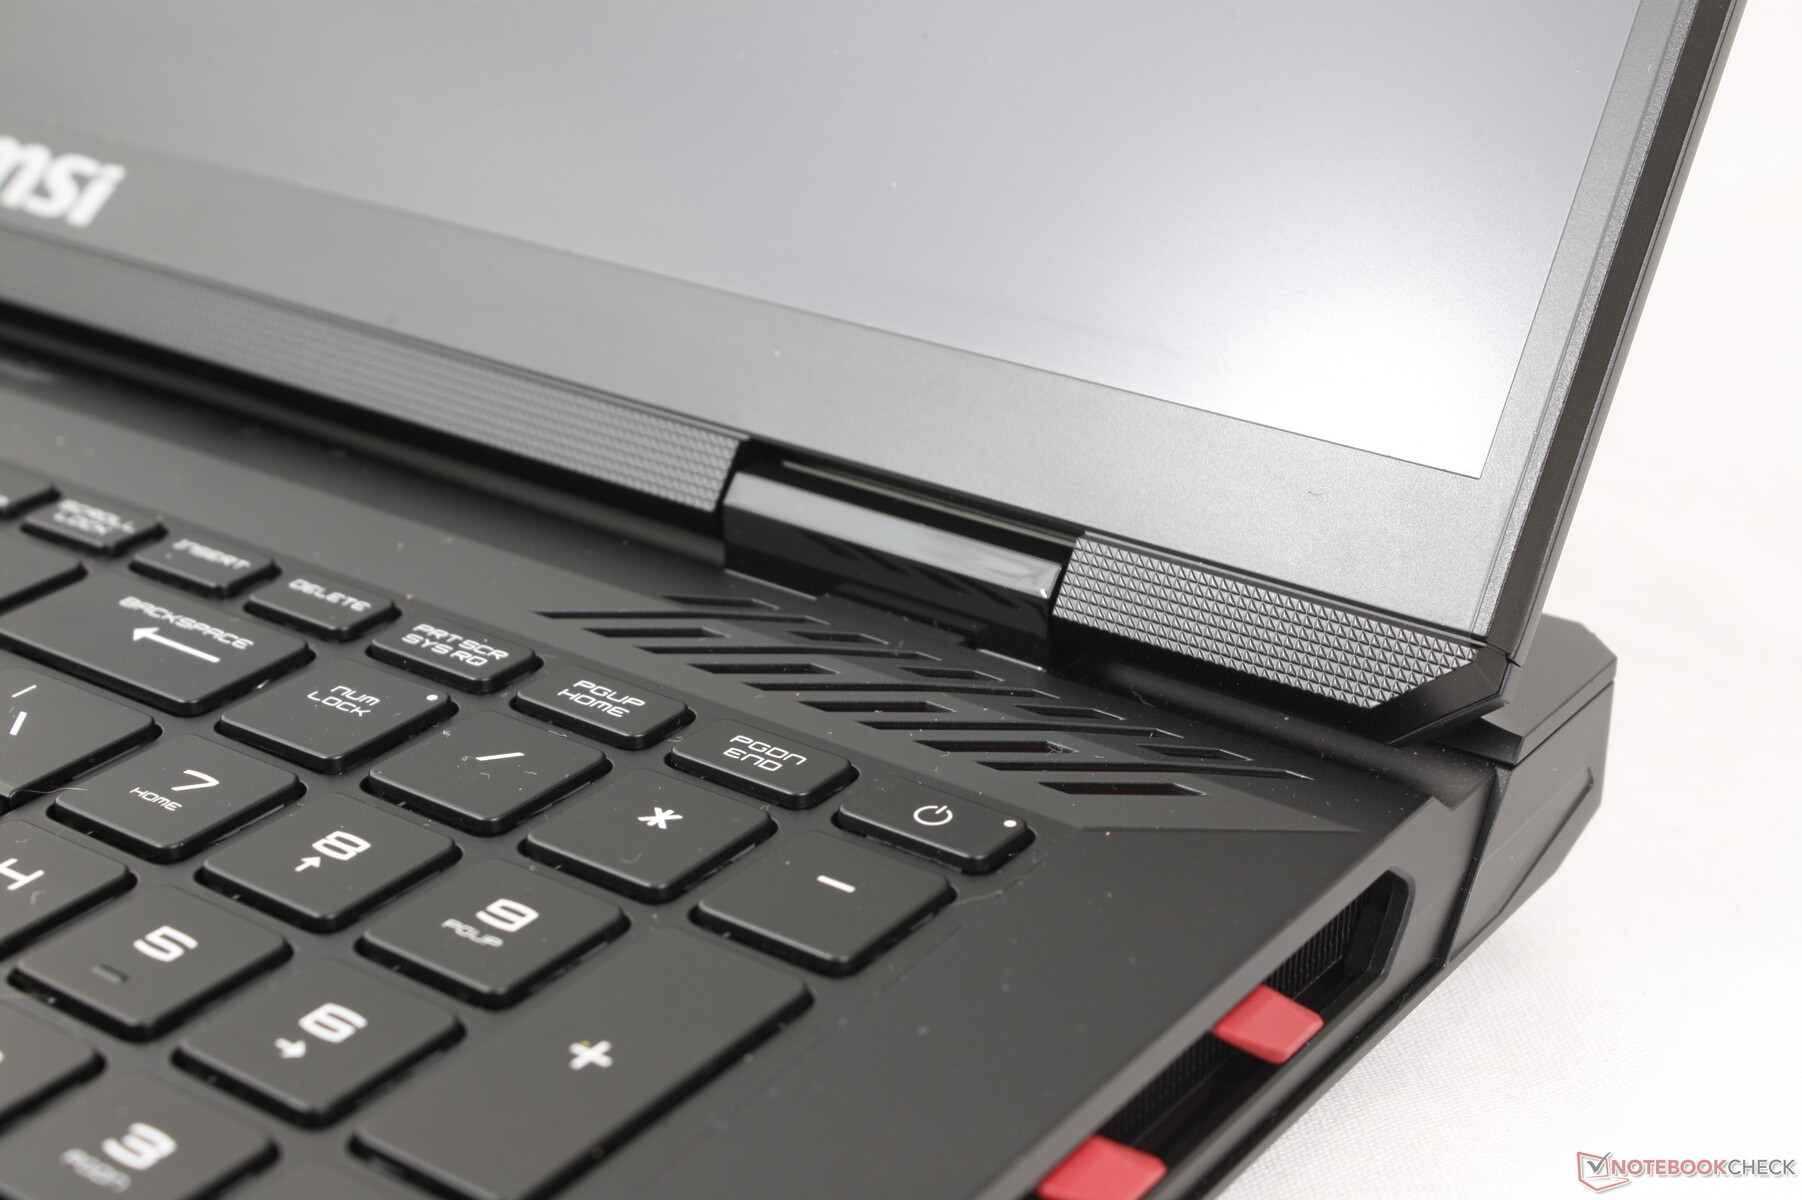
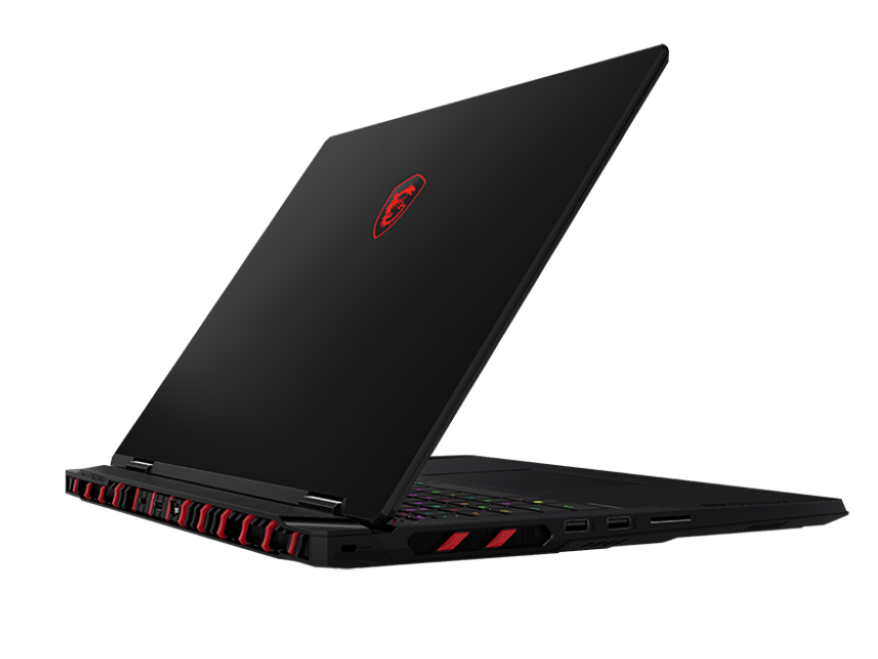
Gehäuse — Vom blauen Drachen zum roten
Das Gehäuse des Raider 18 HX ist eine Ableitung des Titan 18 HX. Anstelle der roten Akzente des Titan 18 sind beim neuen Raider 18 HX die Details blau, und die meisten Oberflächen sind tiefschwarz statt grau oder silber, was dem Gerät ein insgesamt dunkleres Erscheinungsbild verleiht. Zusätzlich hat MSI eine LED-Leiste an der Vorderkante des Systems angebracht, die beim Titan 18 HX fehlte. Die Änderungen sind größtenteils ästhetischer Natur, wodurch sich das Raider 18 HX immer noch genauso robust anfühlt wie das teurere Modell, da die zugrunde liegenden Materialien und das Skelett identisch sind.
Der auffälligste optische Unterschied zwischen dem Raider 18 HX und dem Titan 18 HX ist das neu gestaltete Tastaturdeck. Während das Titan 18 HX ein flacheres Deck mit einem eleganten Glaspanel bietet, das sich über die Handballenablagen und das Clickpad erstreckt, setzt das Raider 18 HX auf einen traditionelleren Ansatz ohne Glas und lediglich mit einem einfachen Clickpad.
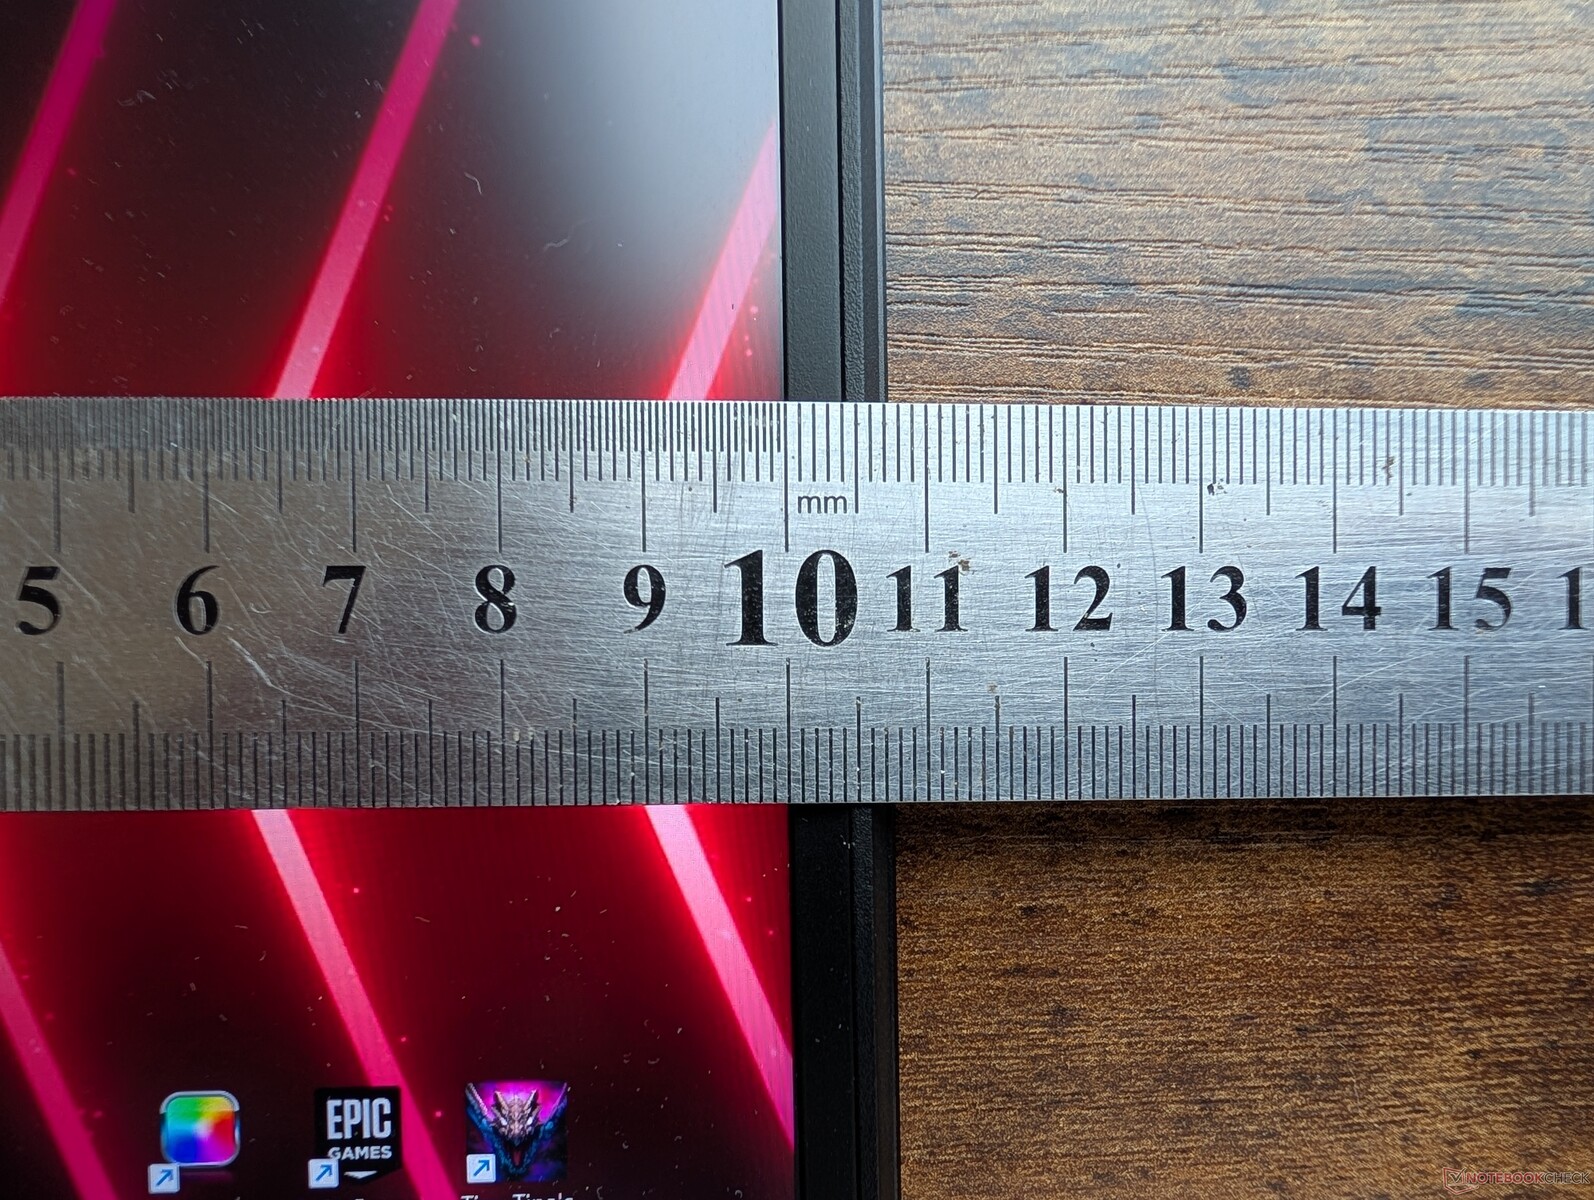
Die Abmessungen und das Gewicht des Raider 18 HX sind im Wesentlichen identisch mit denen des Titan 18 HX, trotz aller äußeren Unterschiede. In Bezug auf die Portabilität bewegt sich das Modell im Mittelfeld: Alternativen wie der Alienware m18 R2 sind zwar größer und schwerer, aber der ROG Strix G18 und der Blade 18 sind deutlich leichter.
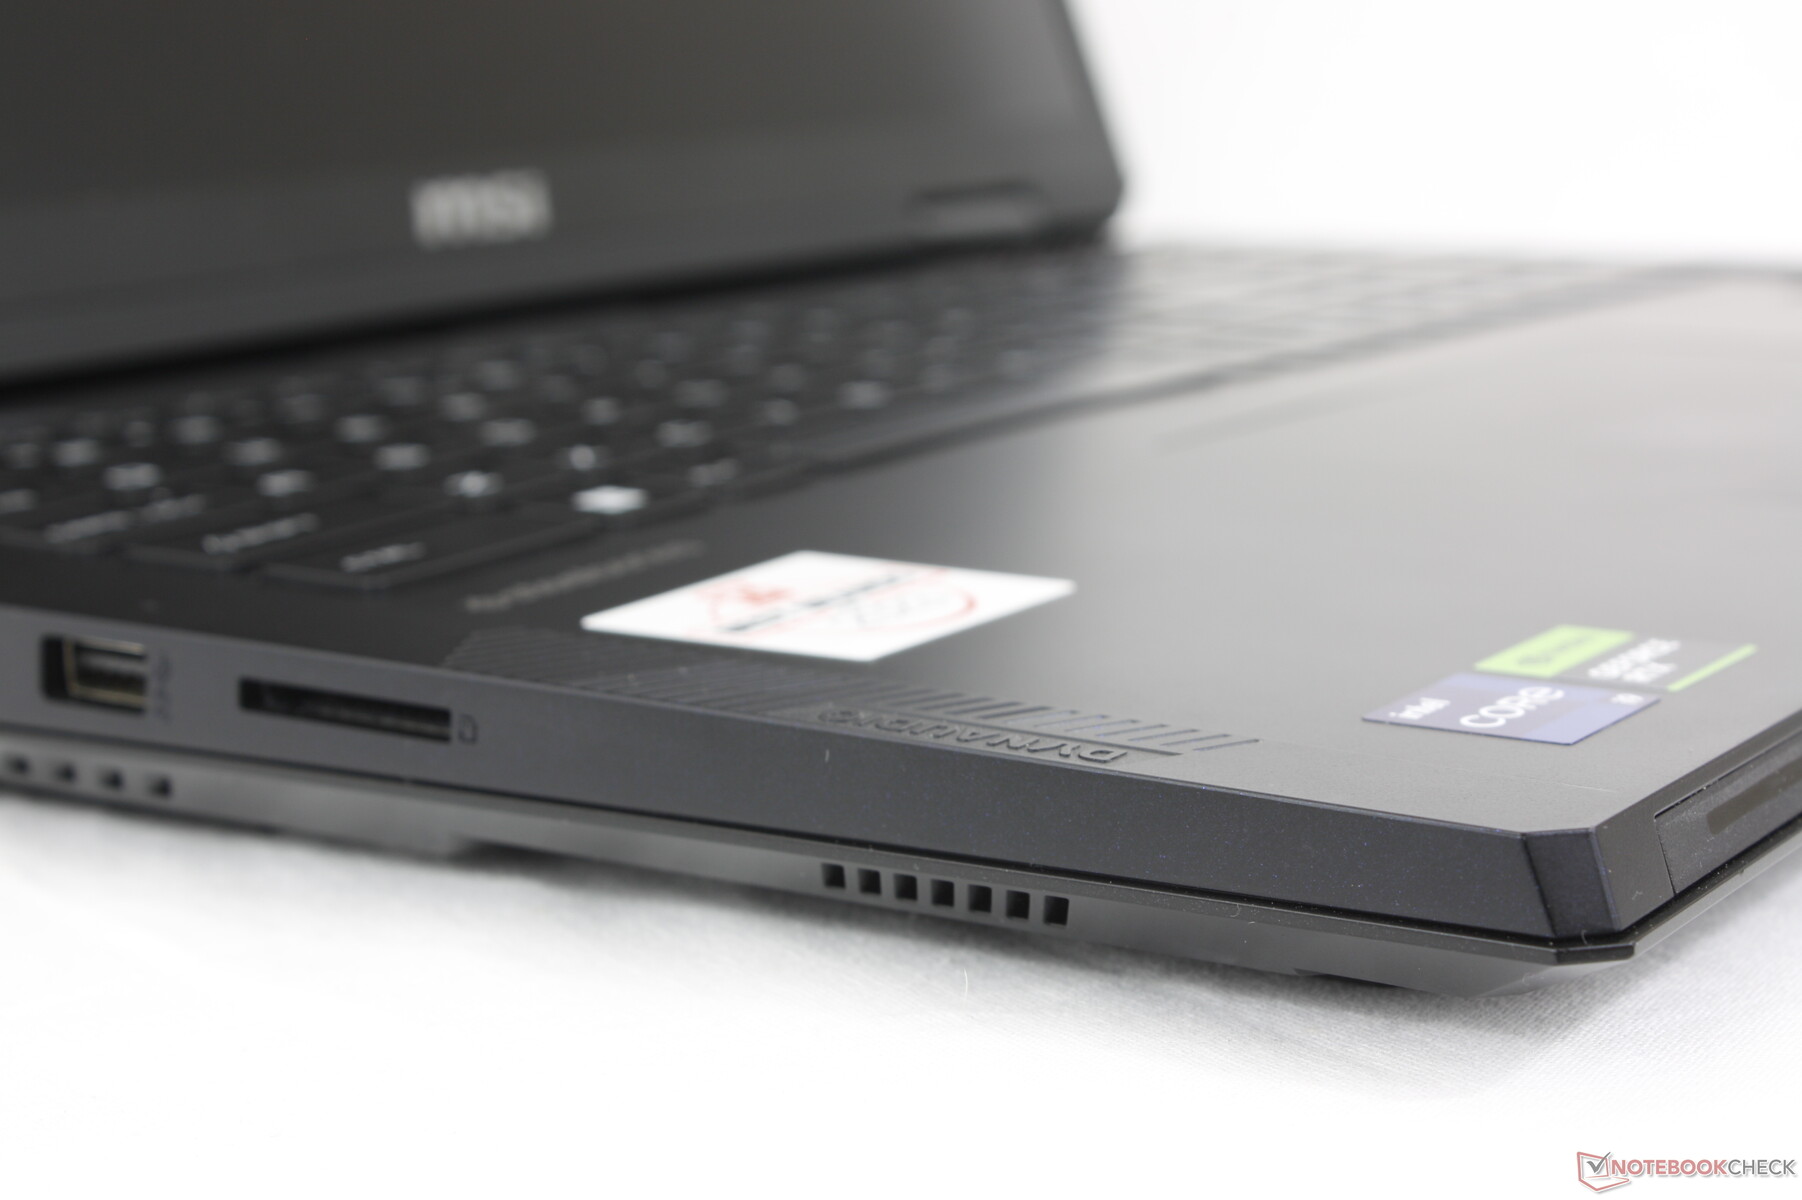
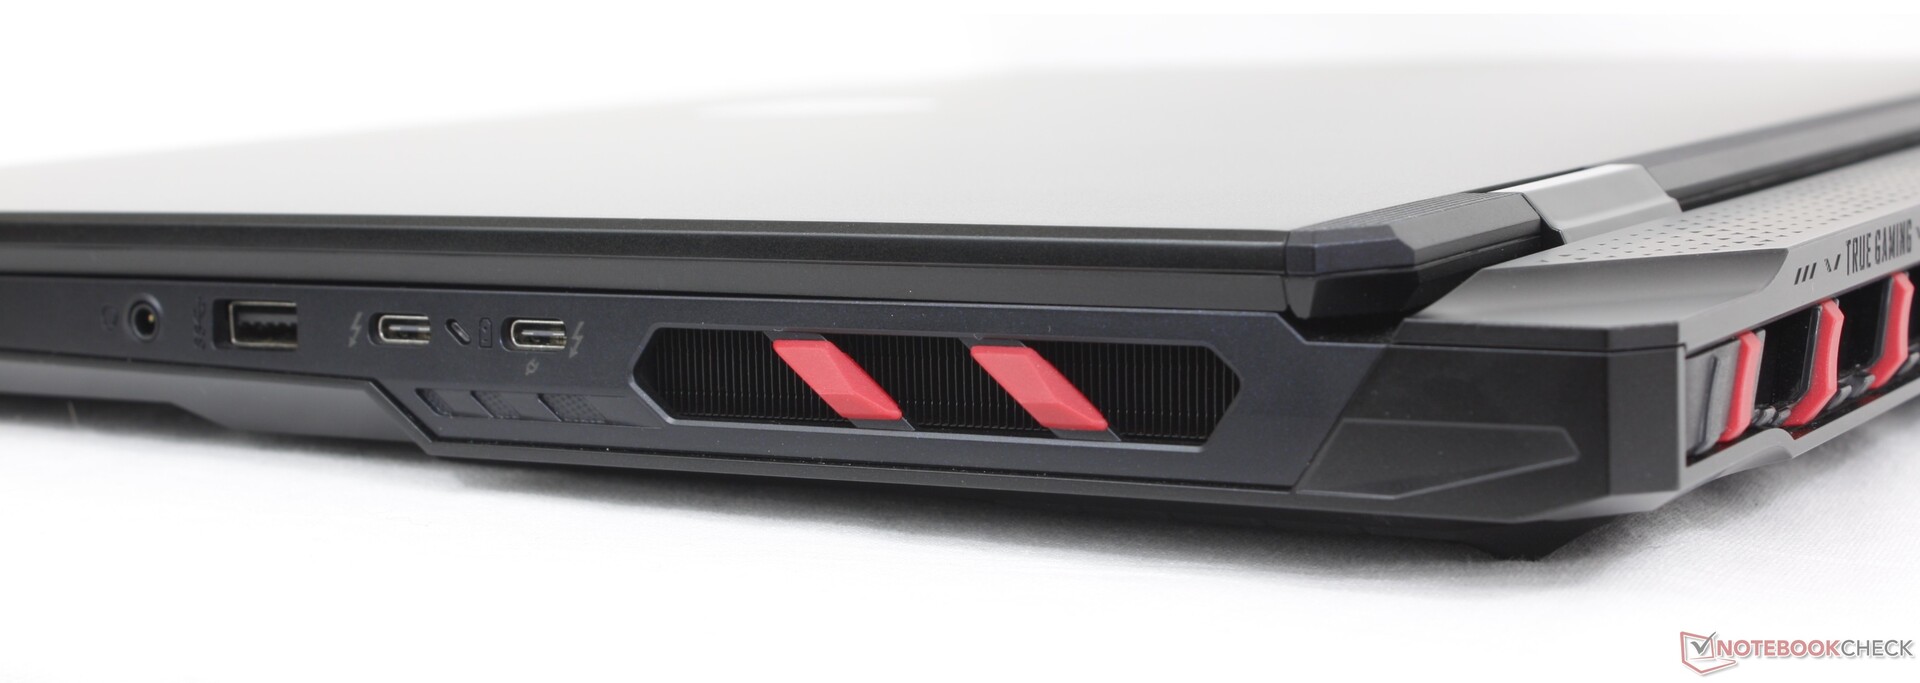
Ausstattung
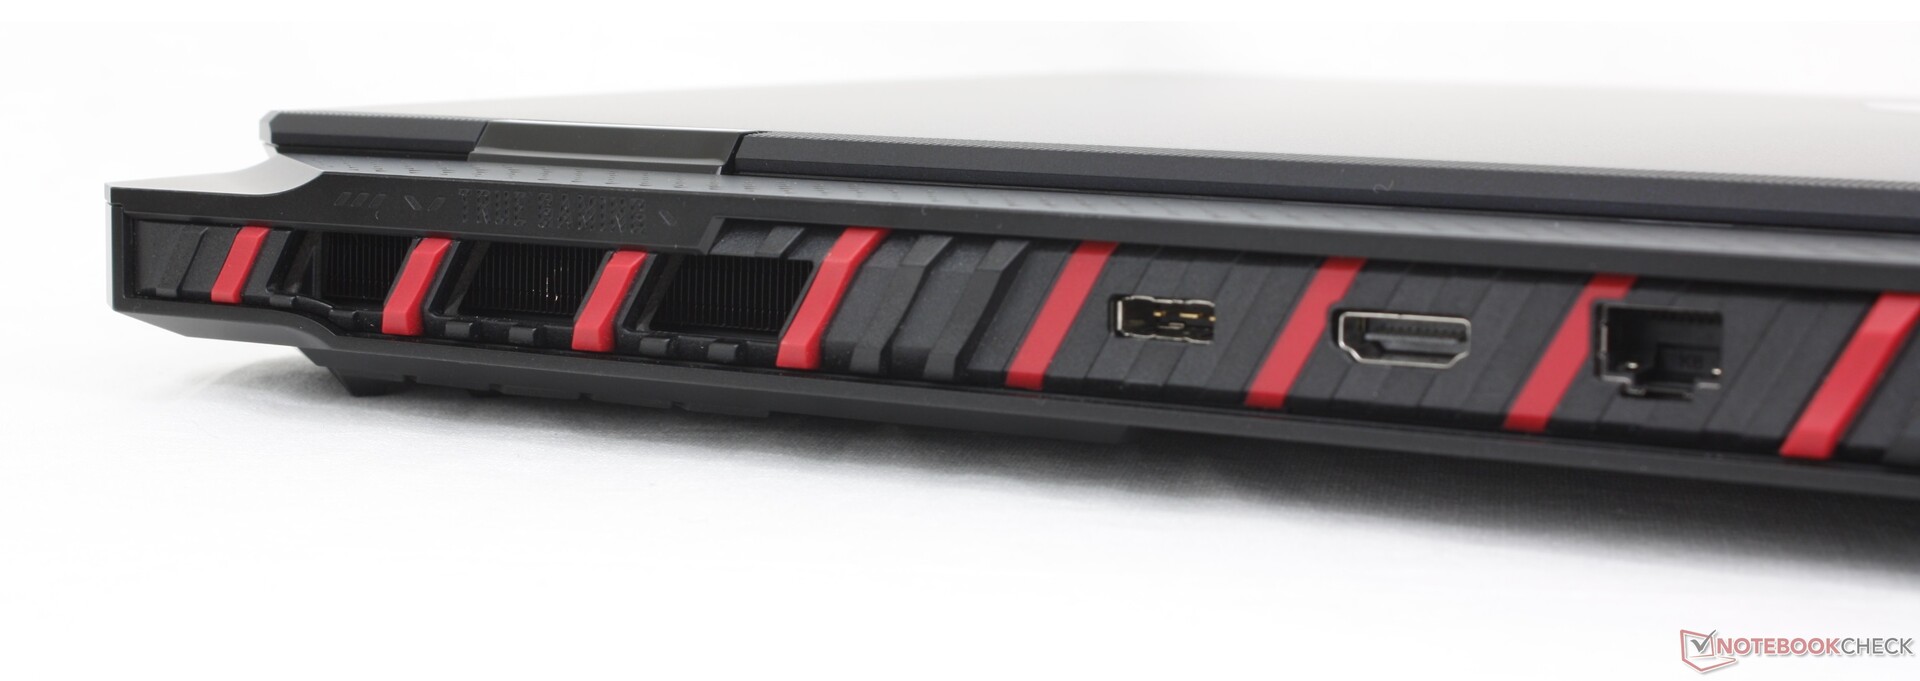
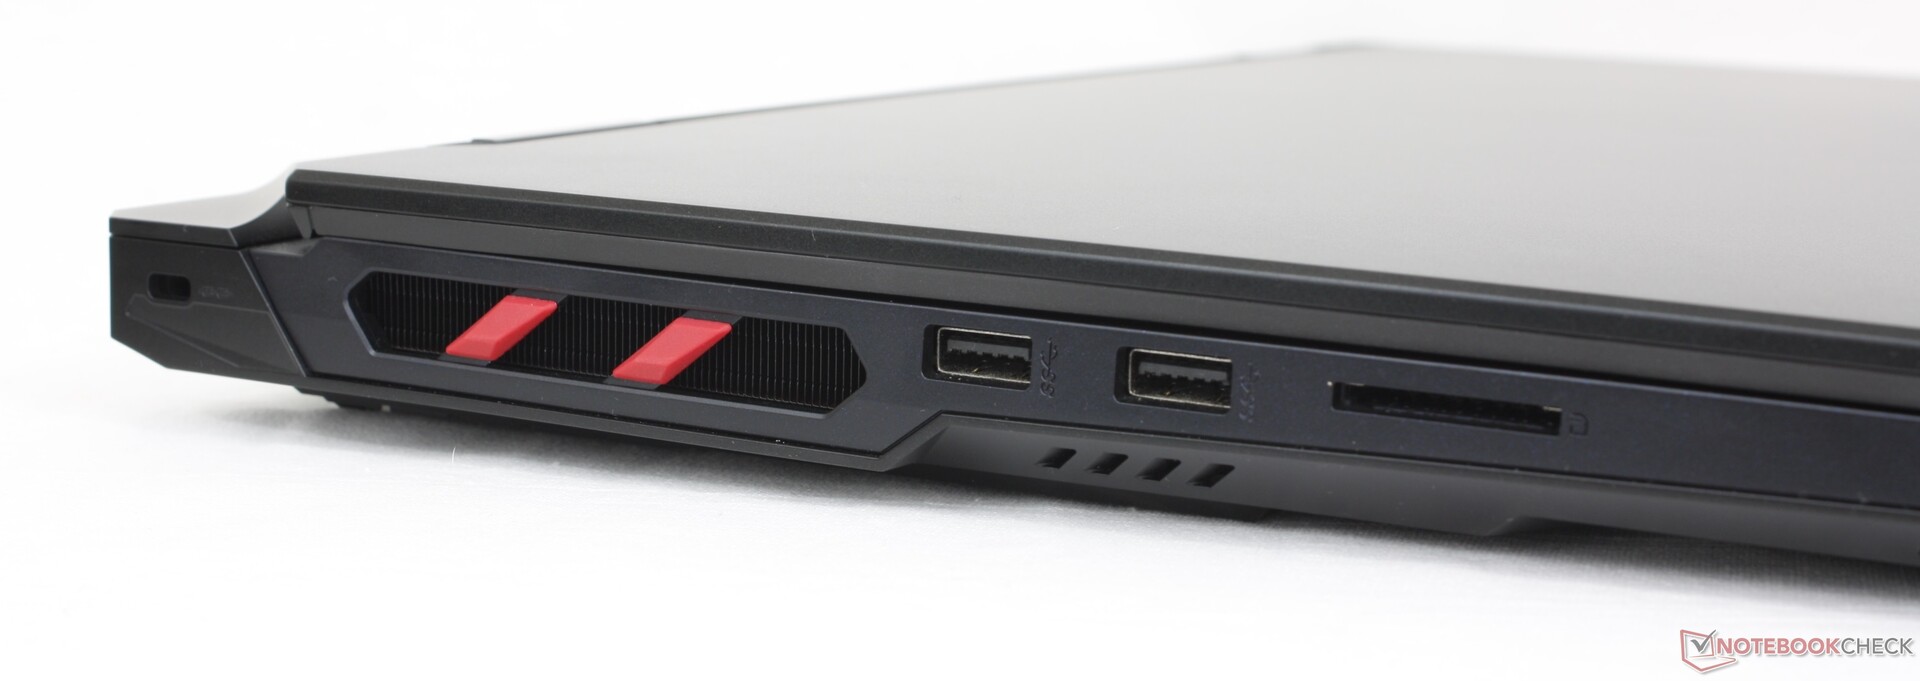
Die Anschlüsse und deren Positionierung entsprechen denen des Titan 18 HX, was einen klaren Hinweis darauf gibt, was unter der Haube zu erwarten ist. Die integrierten Optionen sind vergleichbar mit denen des Blade 18 oder des ROG Strix G18, allerdings in einer sehr unterschiedlichen Anordnung.
Wichtig zu beachten ist, dass lediglich einer der beiden USB-C-Anschlüsse Power-Delivery-Funktionalität bietet. Beide Anschlüsse sind ansonsten mit DisplayPort kompatibel.

SD Card Reader
Der integrierte SD-Leser bietet mit rund 90 MB/s eine solide Leistung, ist jedoch im Vergleich zum hohen Preis des Raider 18 HX eher langsam. Im Vergleich dazu sind die SD-Kartenleser des Razer Blade 18 und des Alienware m18 R2 mehr als doppelt so schnell.
| SD Card Reader | |
| average JPG Copy Test (av. of 3 runs) | |
| Alienware m18 R2 (Toshiba Exceria Pro SDXC 64 GB UHS-II) | |
| Razer Blade 18 2024 RZ09-0509 (Toshiba Exceria Pro SDXC 64 GB UHS-II) | |
| Acer Predator Helios 18 PH18-72-98MW (AV PRO microSD 128 GB V60) | |
| MSI Raider 18 HX A14V (Toshiba Exceria Pro SDXC 64 GB UHS-II) | |
| MSI Titan 18 HX A14VIG (Toshiba Exceria Pro SDXC 64 GB UHS-II) | |
| maximum AS SSD Seq Read Test (1GB) | |
| Razer Blade 18 2024 RZ09-0509 (Toshiba Exceria Pro SDXC 64 GB UHS-II) | |
| Alienware m18 R2 (Toshiba Exceria Pro SDXC 64 GB UHS-II) | |
| MSI Titan 18 HX A14VIG (Toshiba Exceria Pro SDXC 64 GB UHS-II) | |
| MSI Raider 18 HX A14V (Toshiba Exceria Pro SDXC 64 GB UHS-II) | |
| Acer Predator Helios 18 PH18-72-98MW (AV PRO microSD 128 GB V60) | |
Kommunikation
Das Killer BE1750x ist standardmäßig mit Wi-Fi 7 und Bluetooth 5.4 ausgestattet. Die Übertragungsraten bleiben stabil und zuverlässig bei der Verbindung mit unserem Wi-Fi 6E-Testrouter.
Webcam
Eine 2-MP-Webcam mit IR und Schieberegler ist standardmäßig vorhanden, wie beim Titan 18 HX. Interessanterweise zeigt die Kamera auch ähnliche Helligkeitsprobleme.


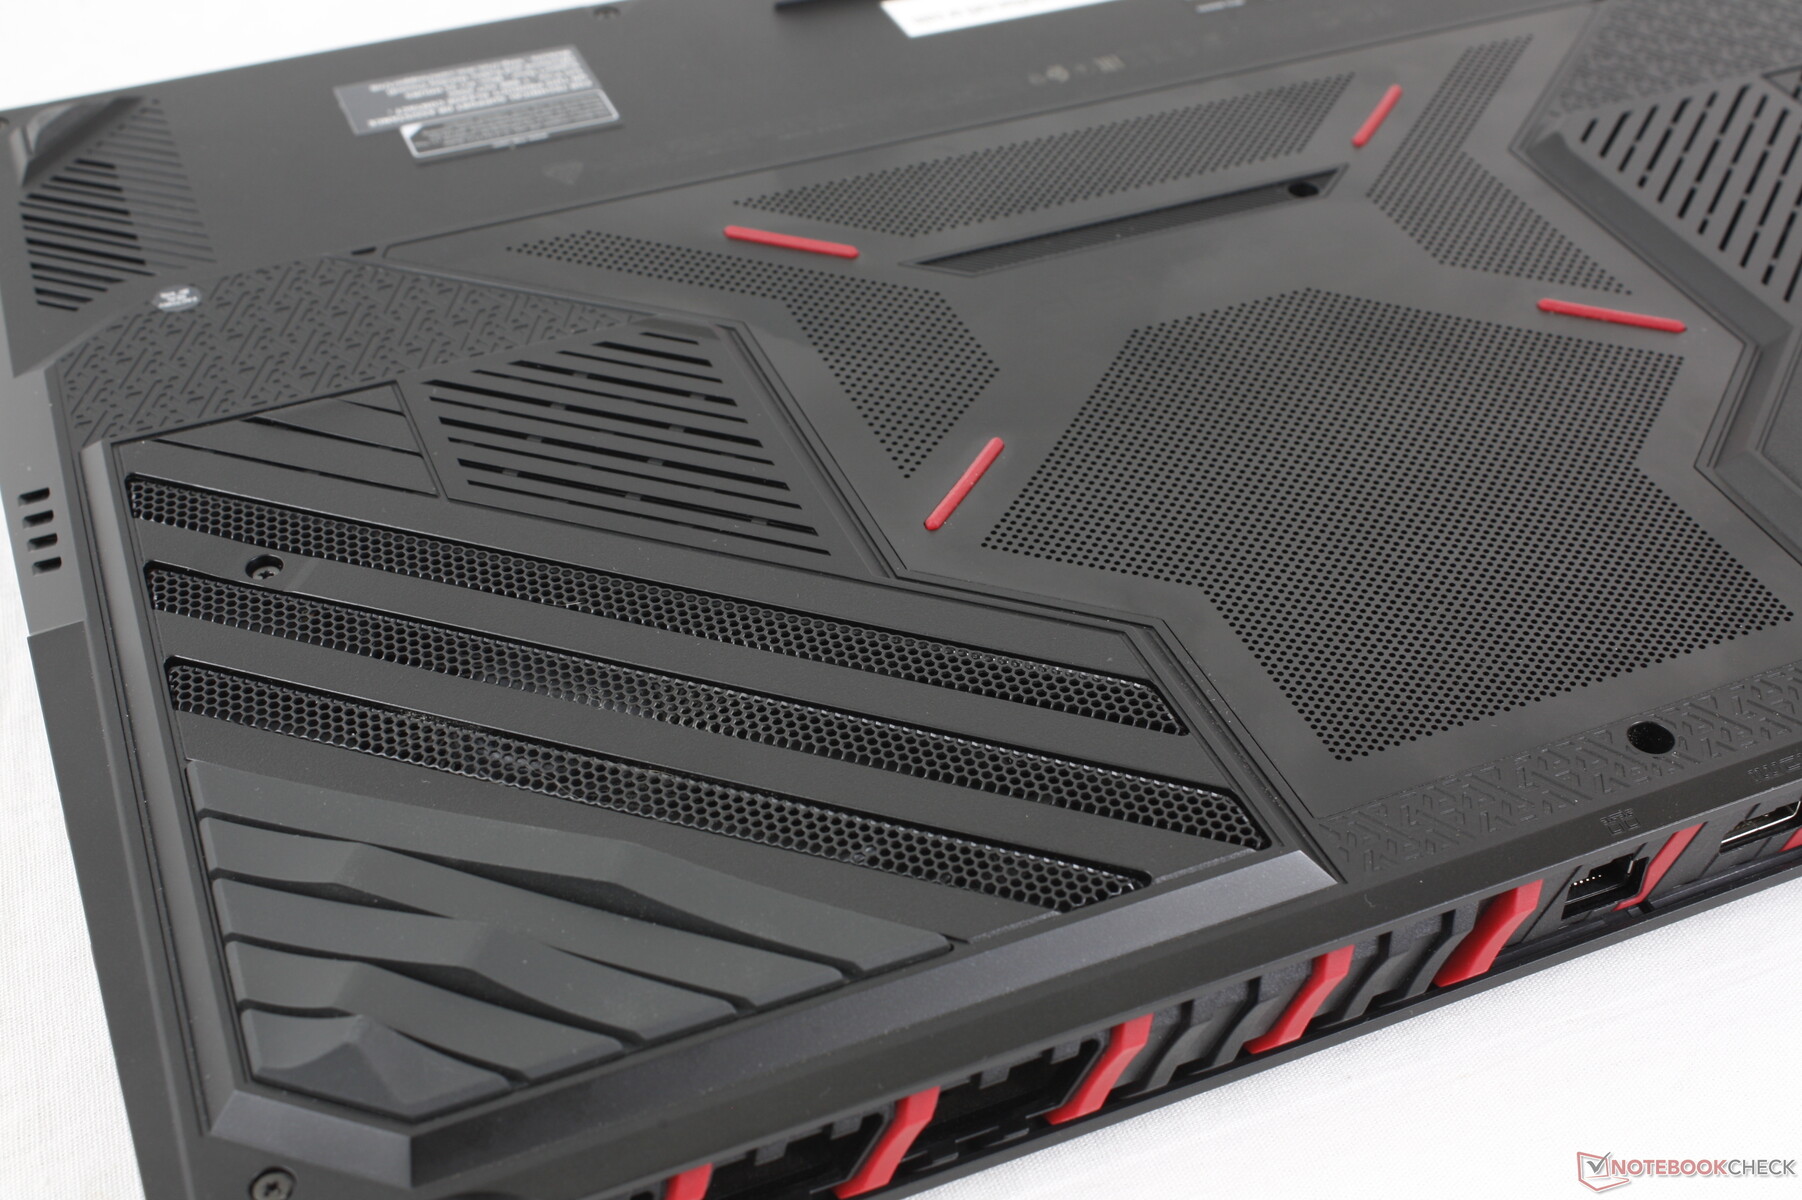
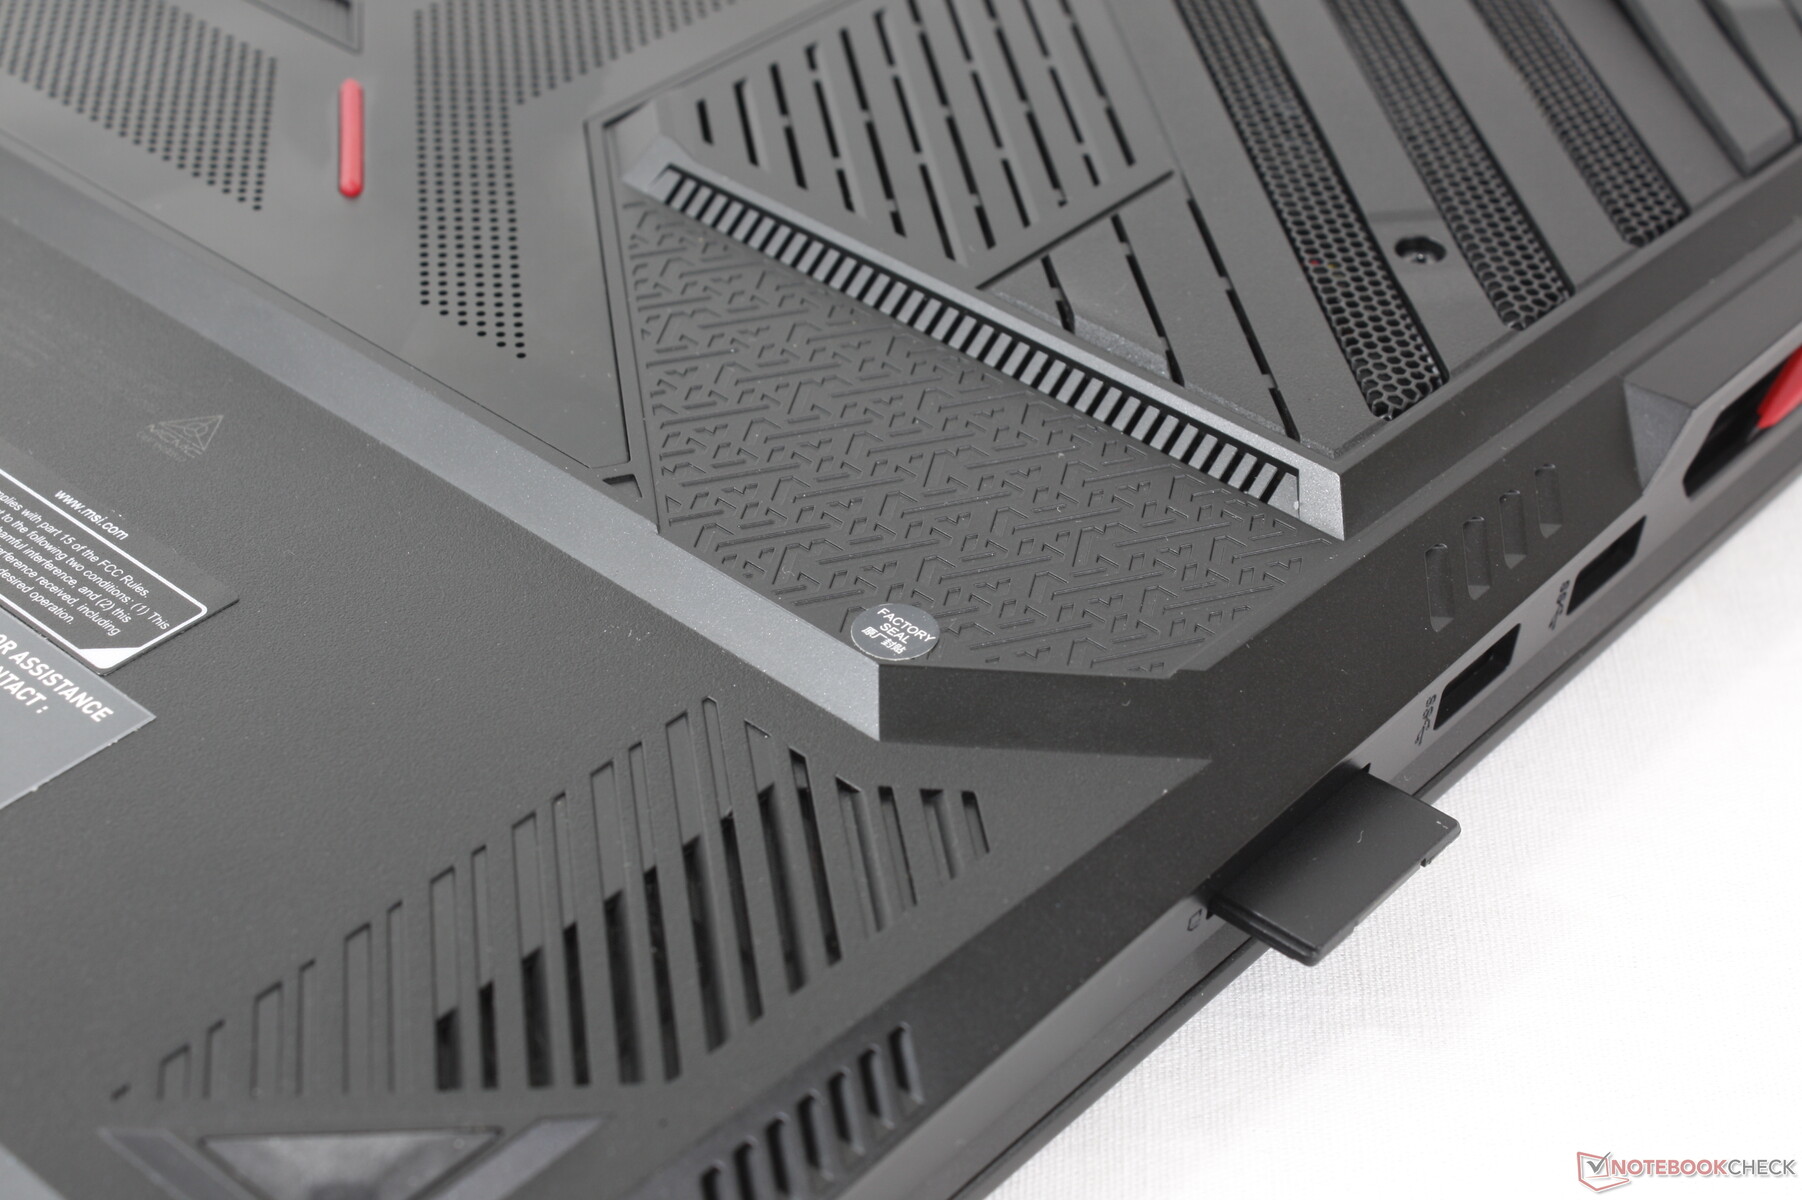
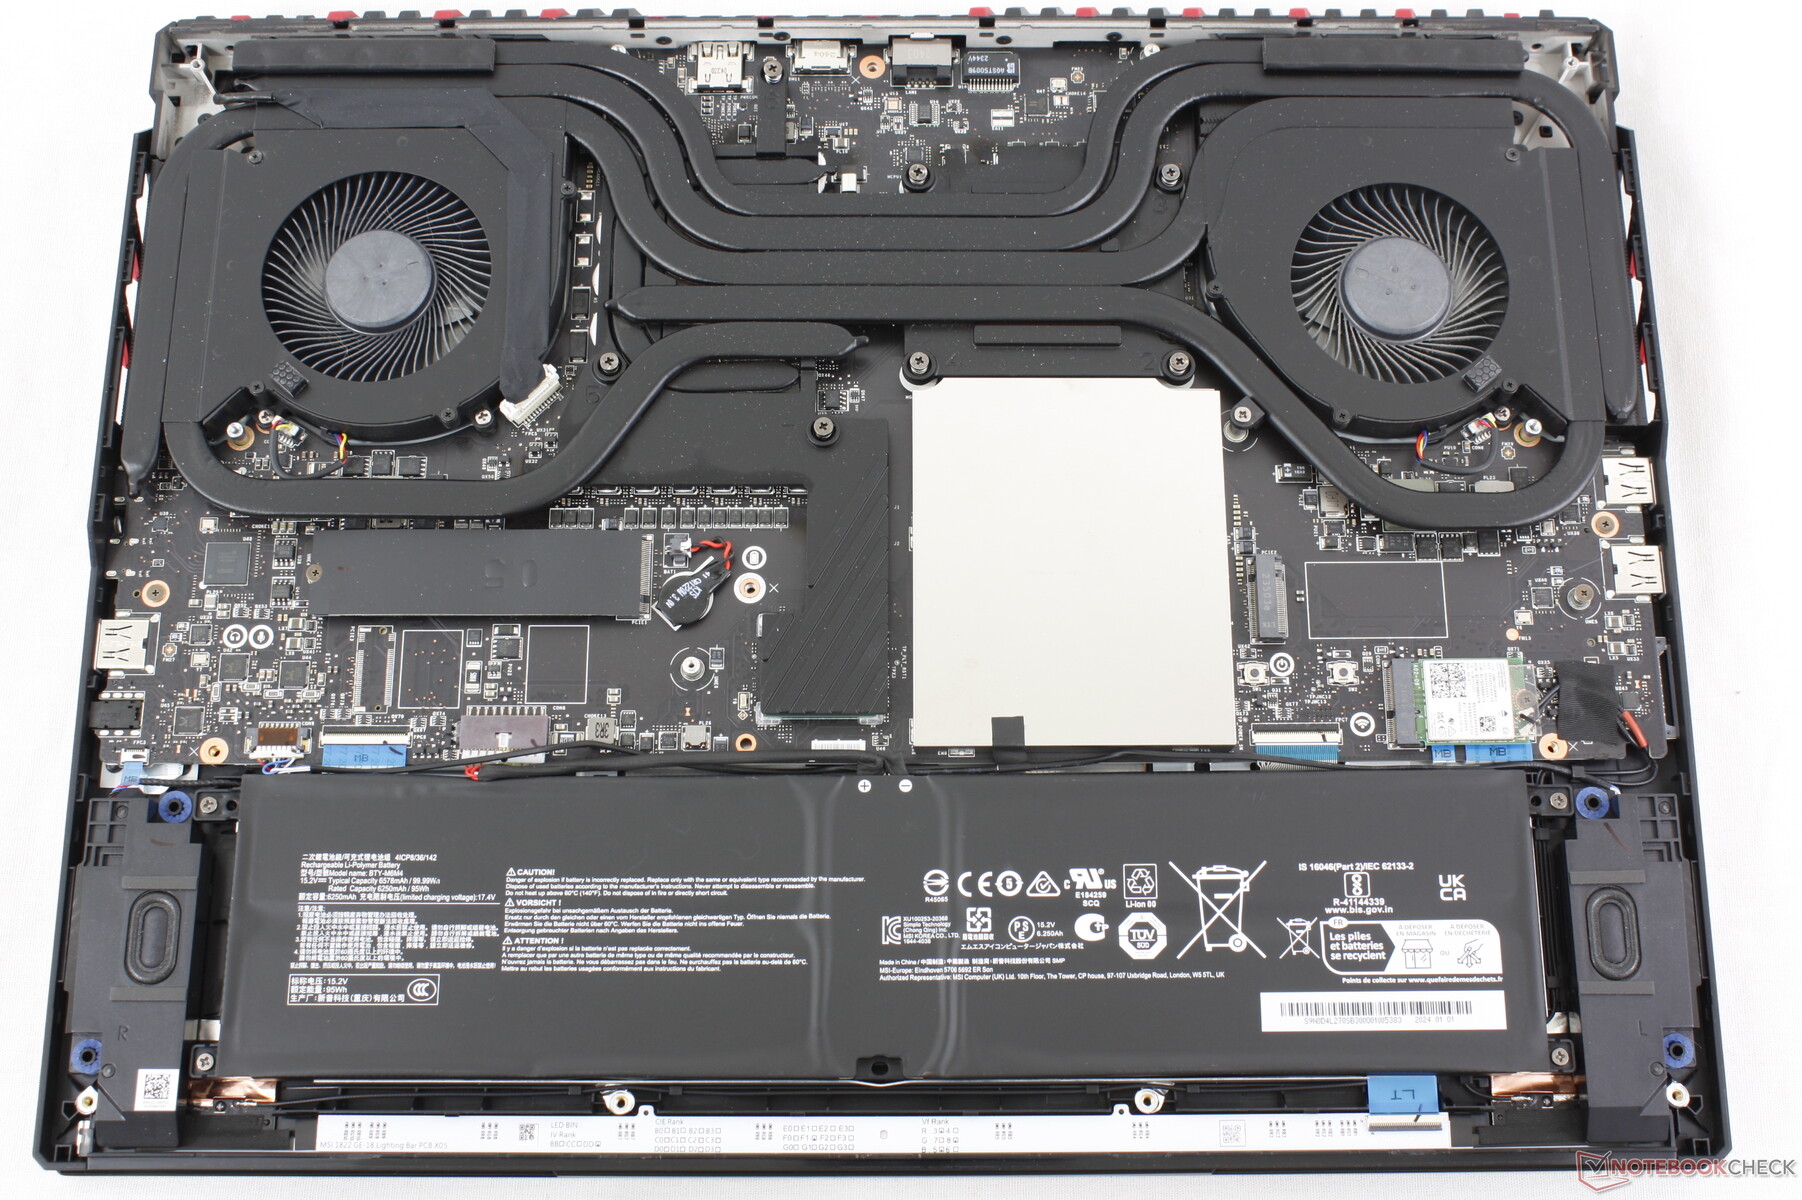
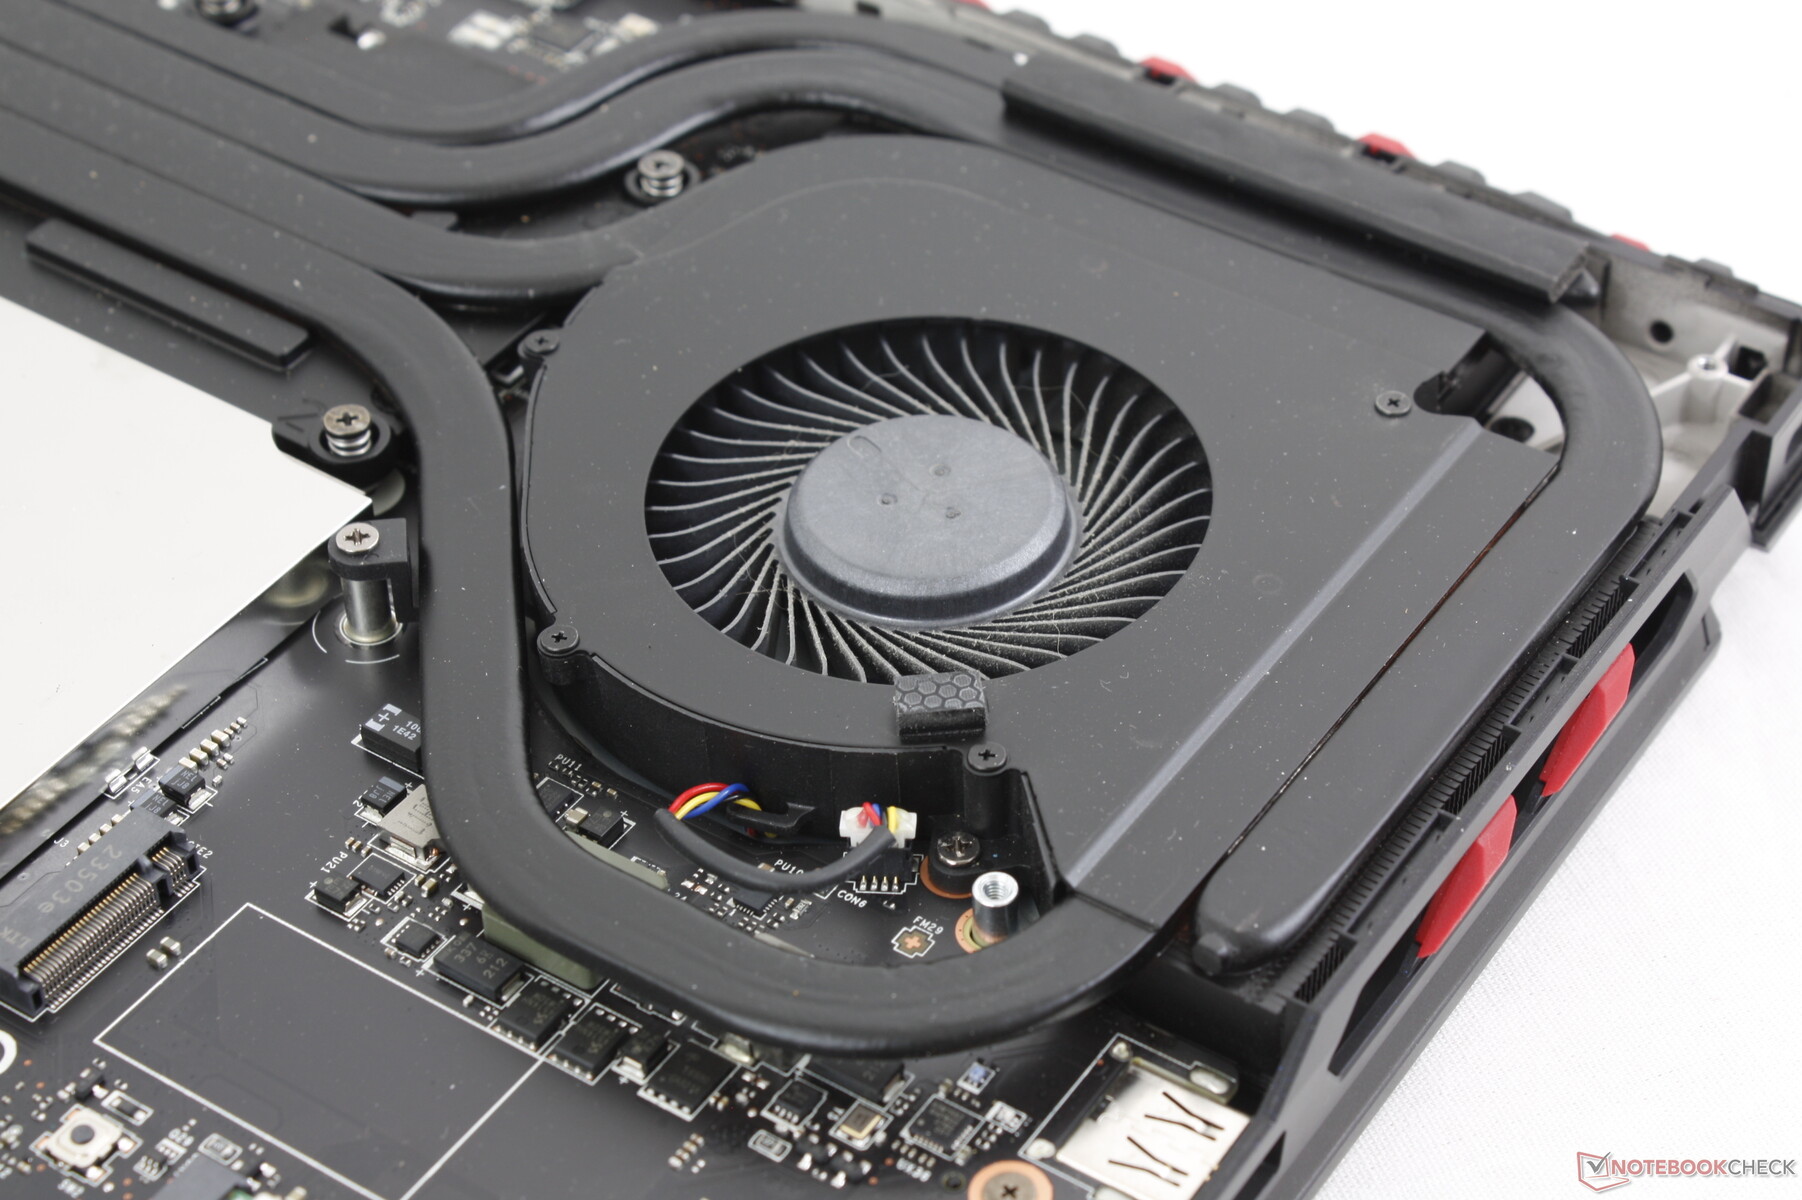
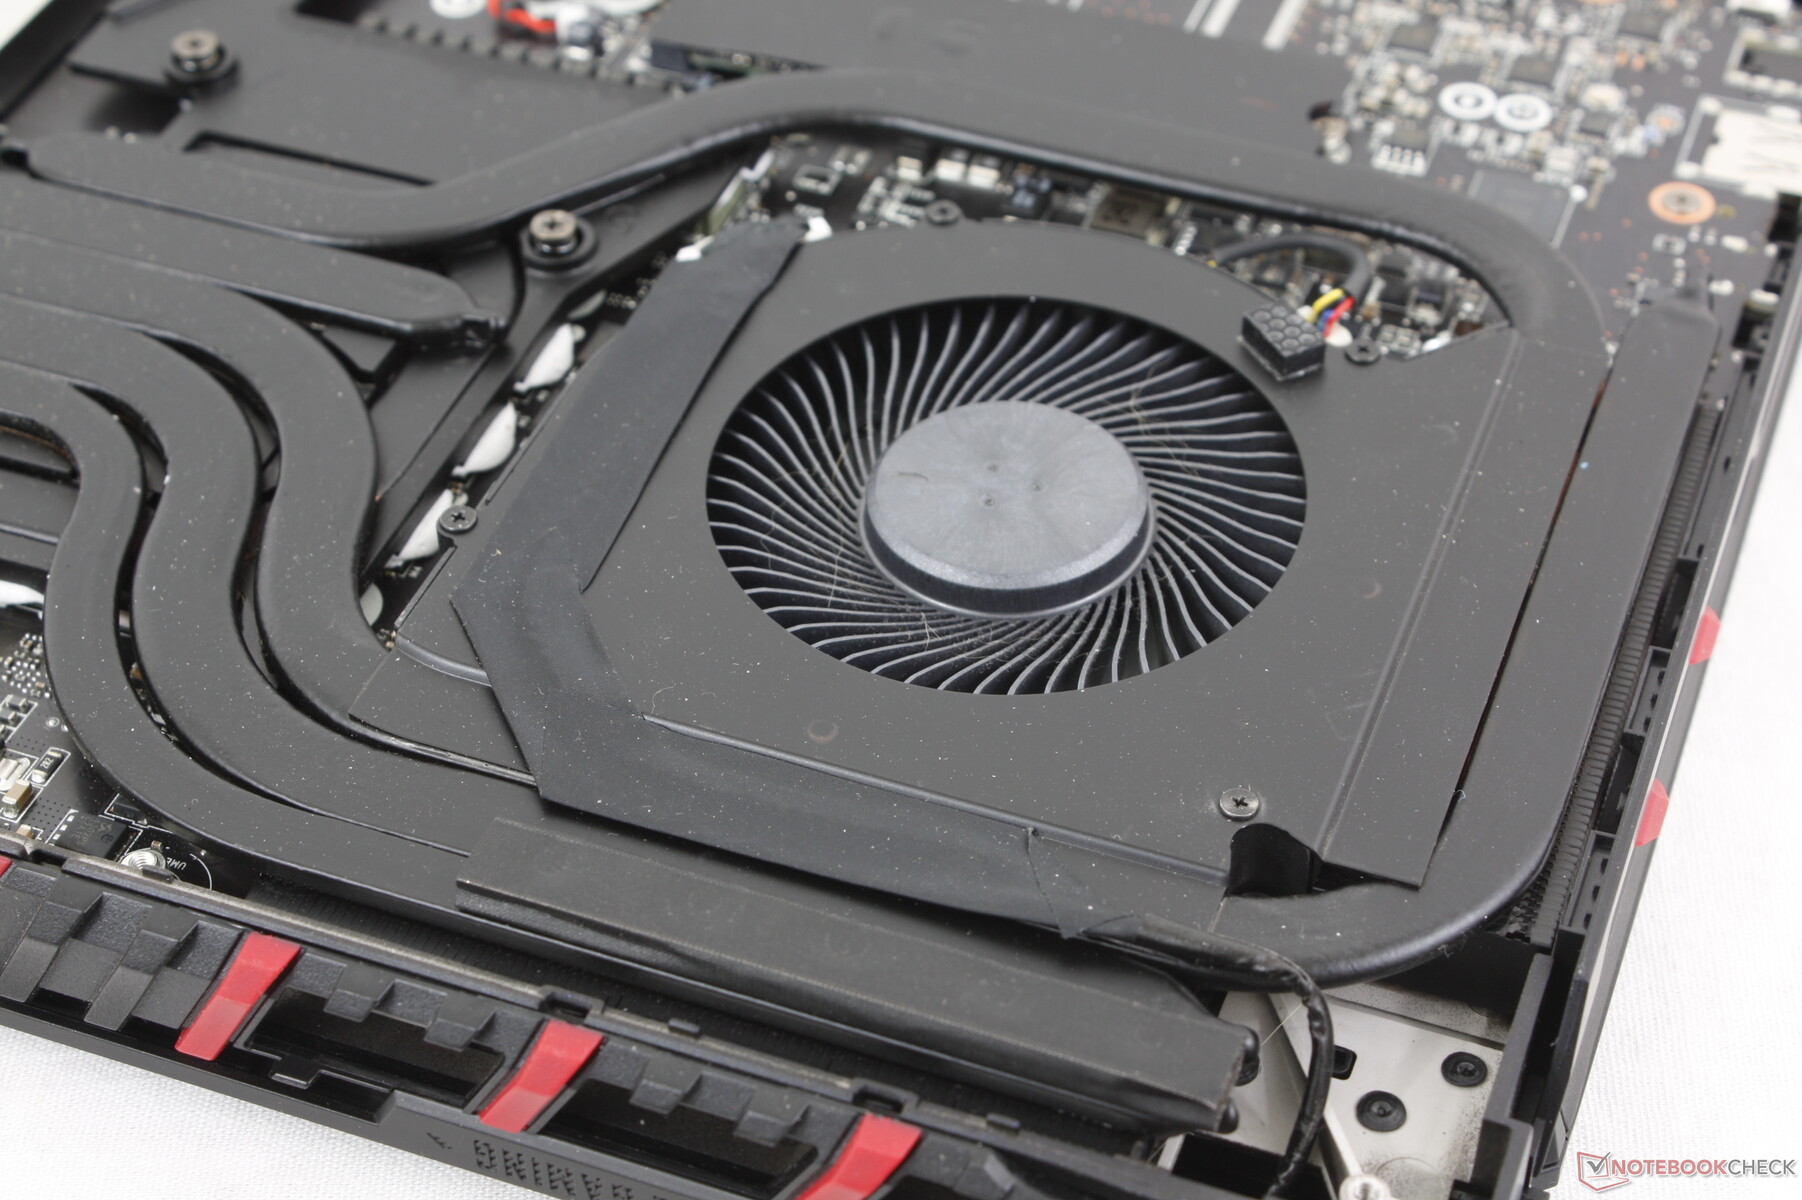
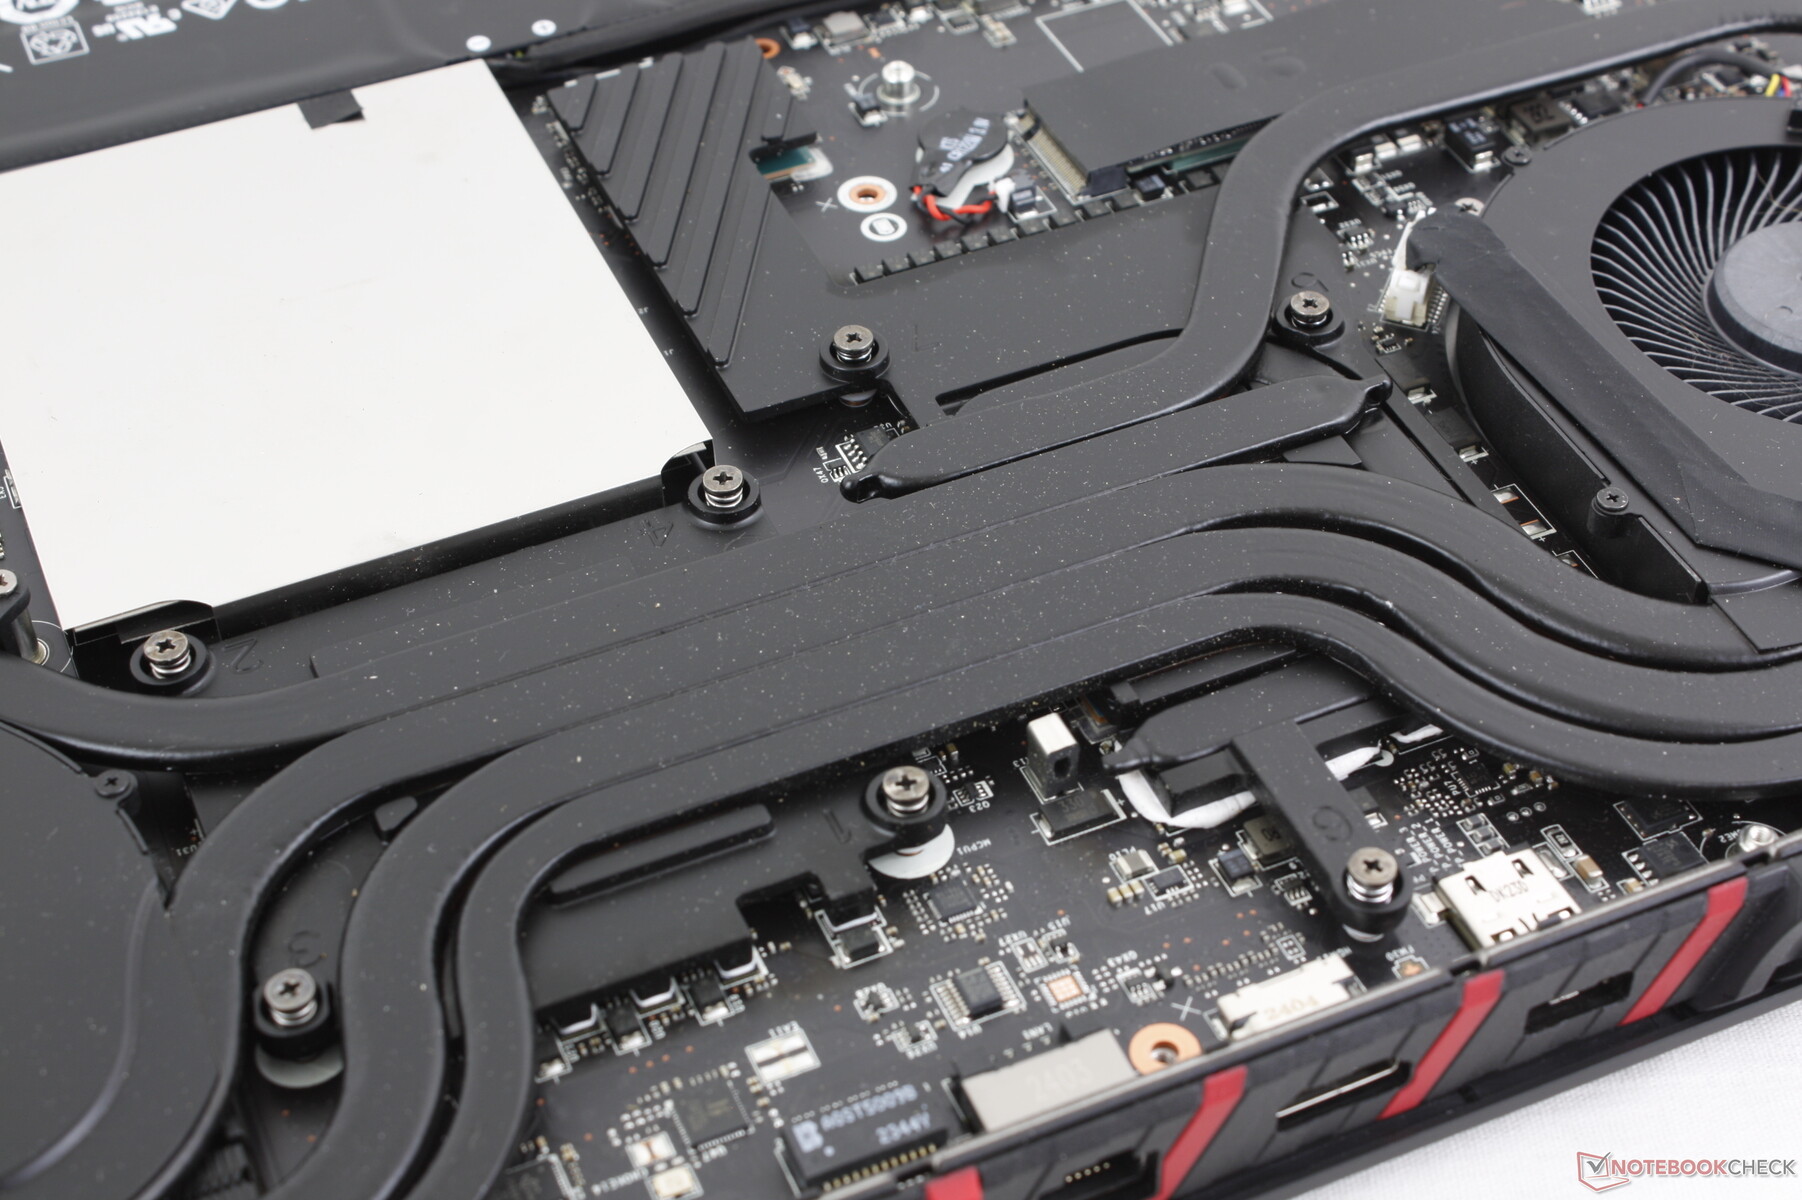
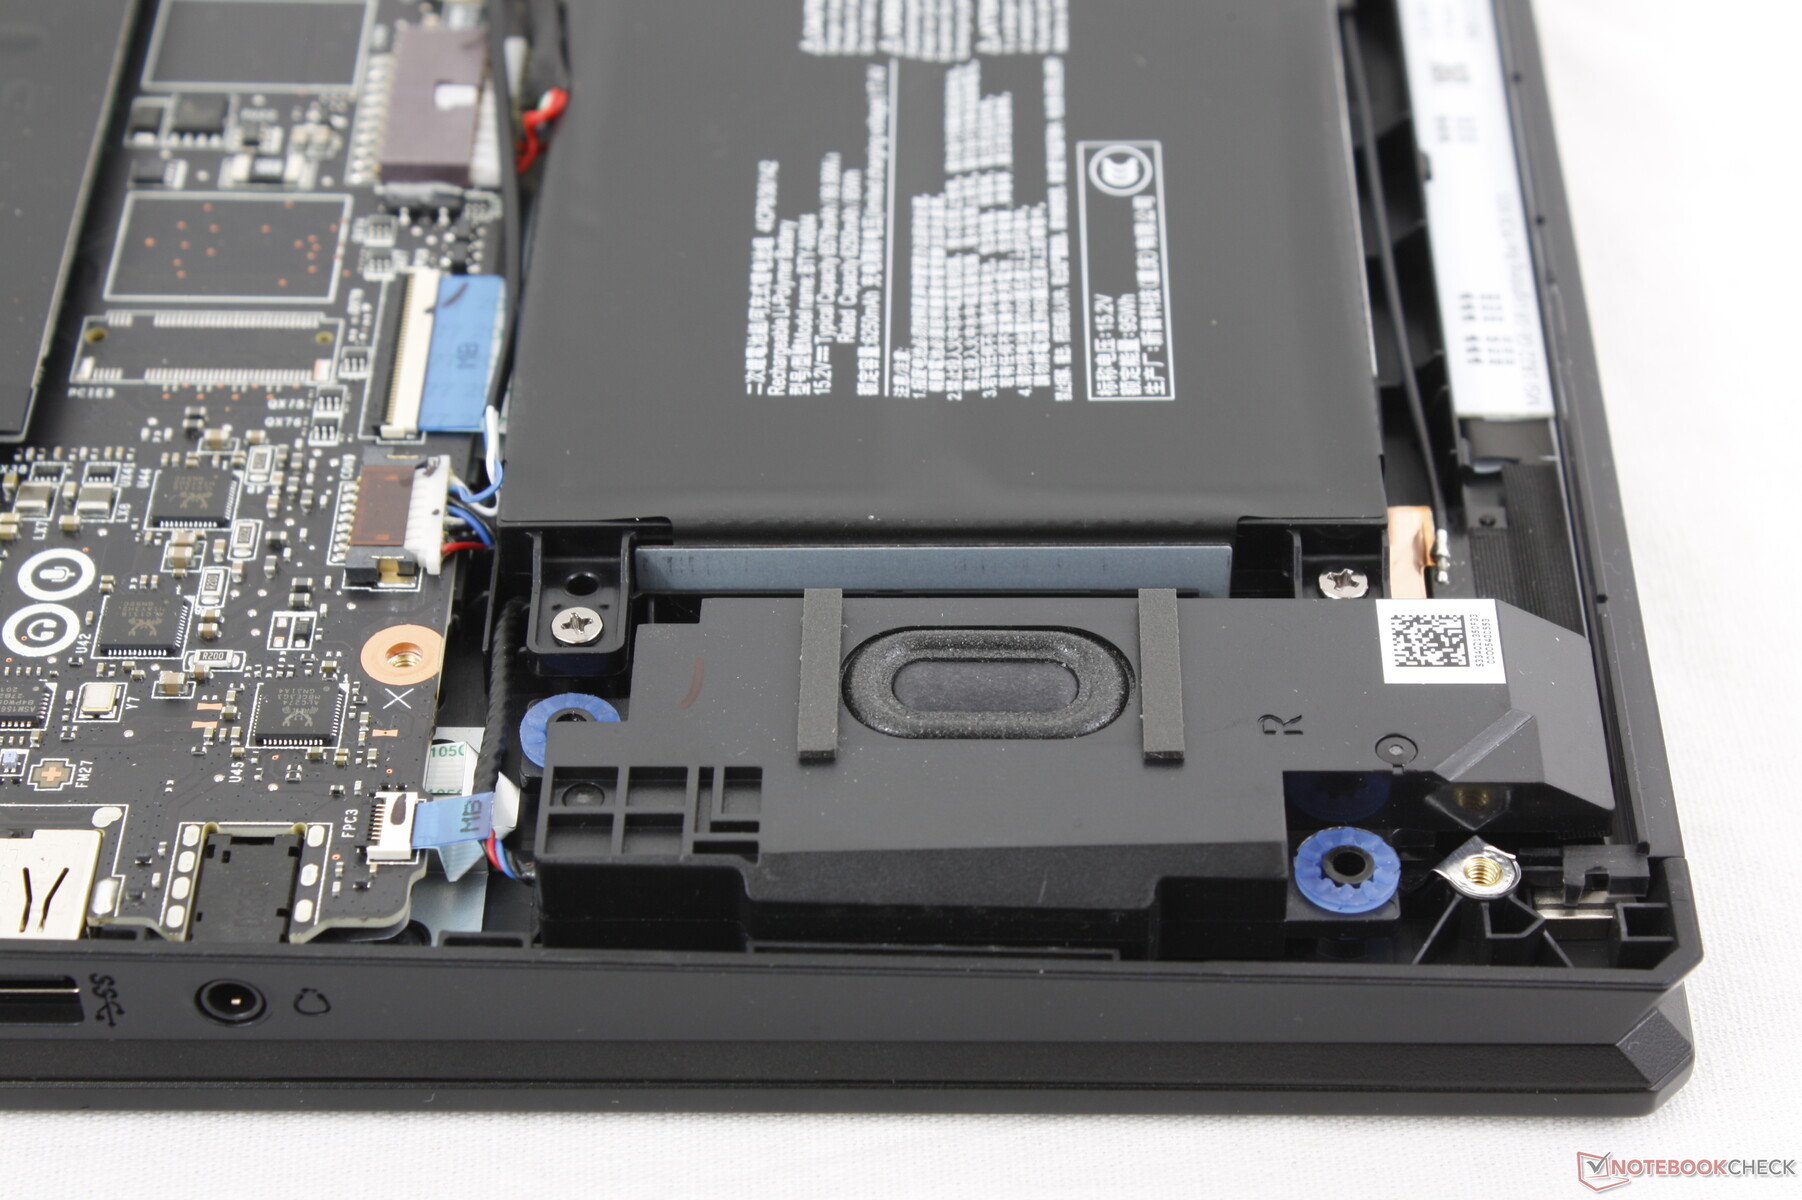
Wartung
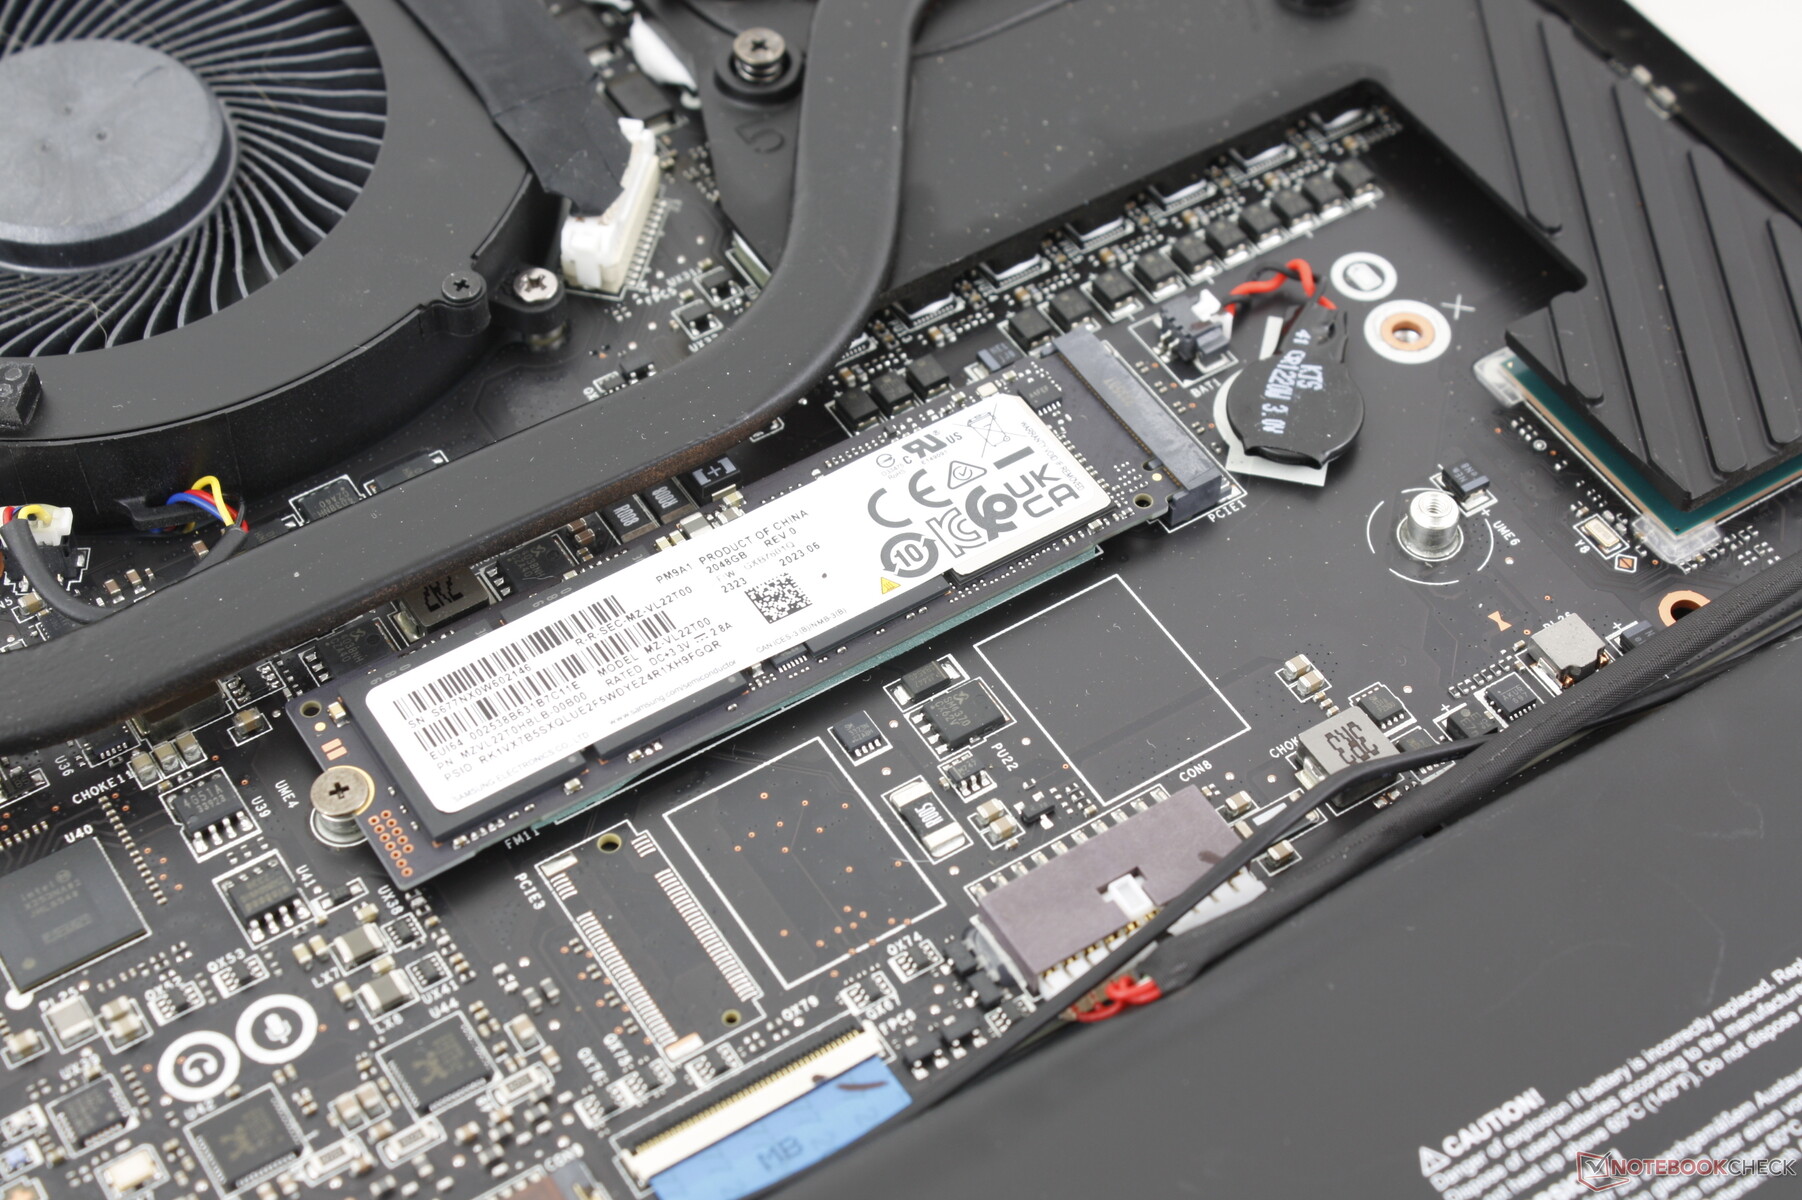
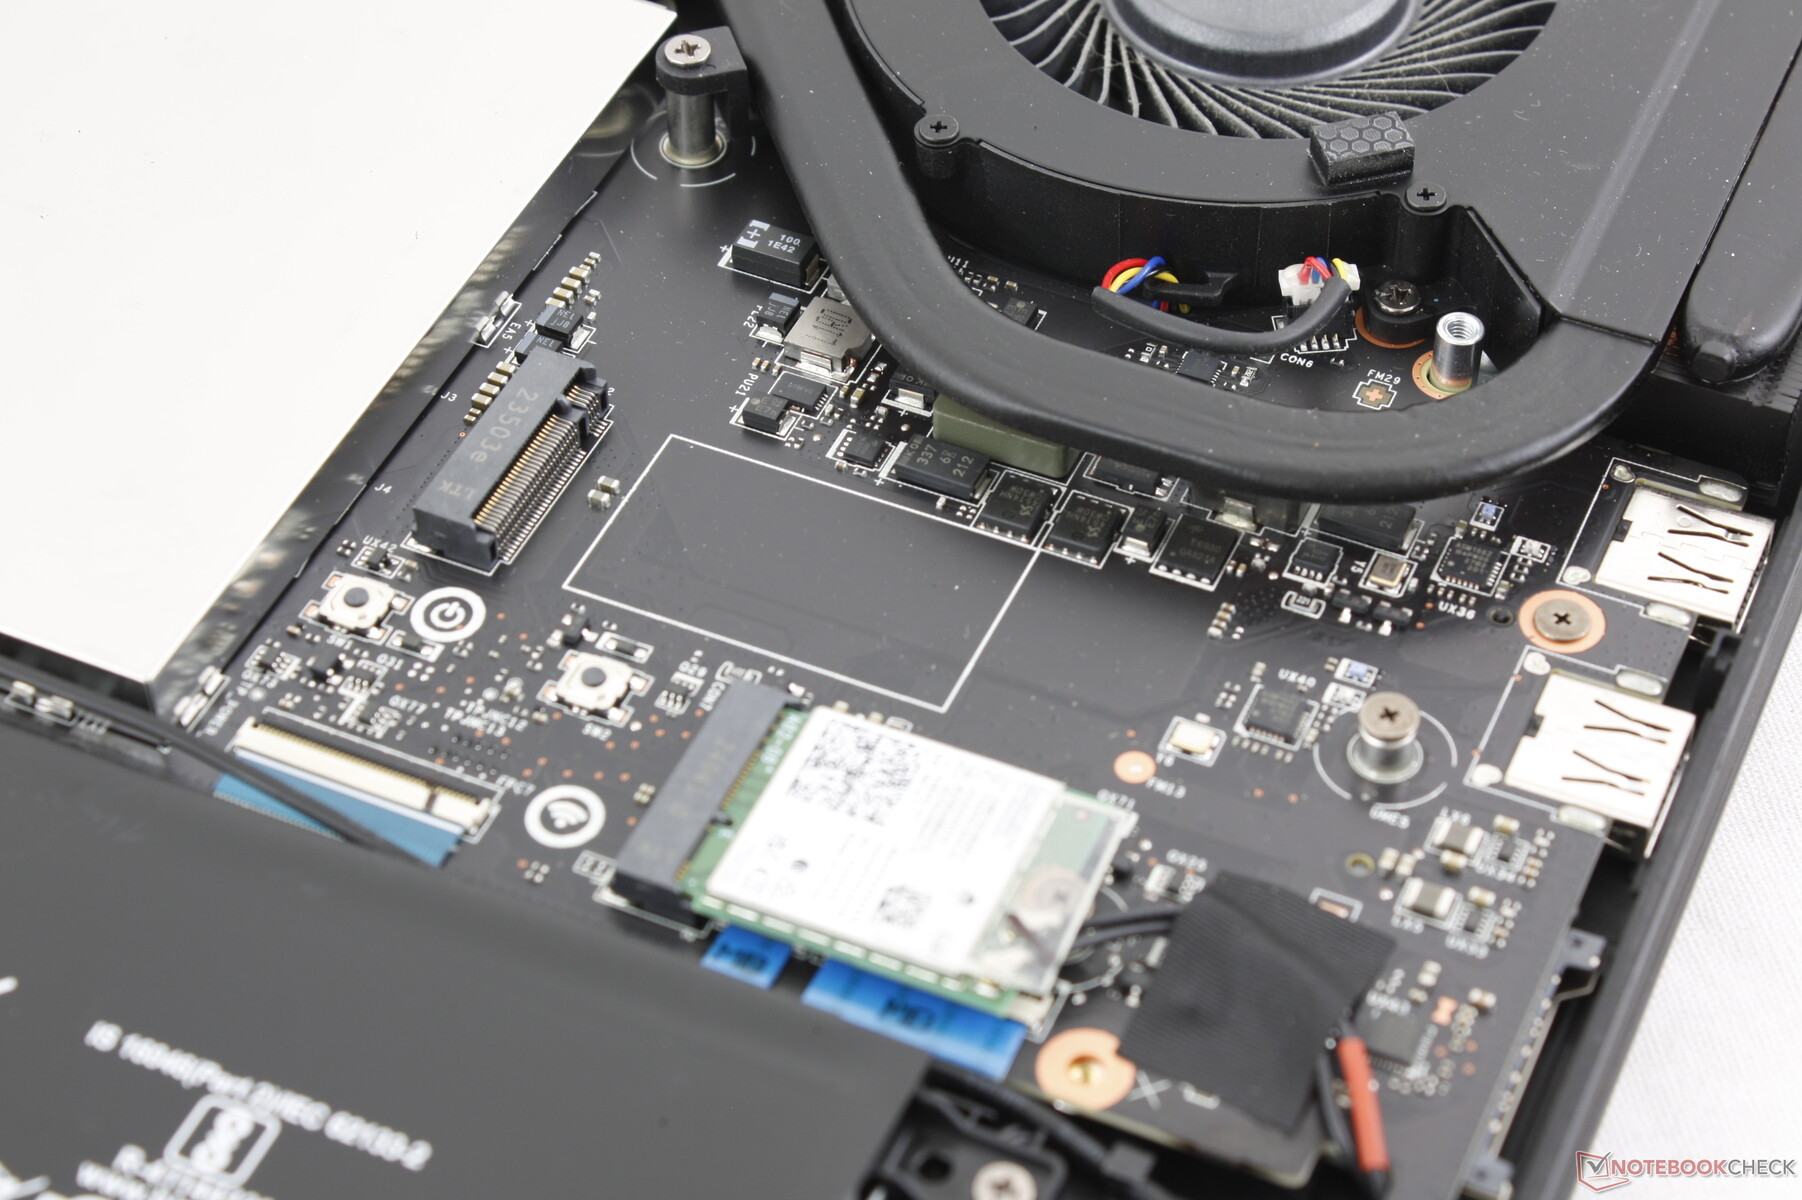
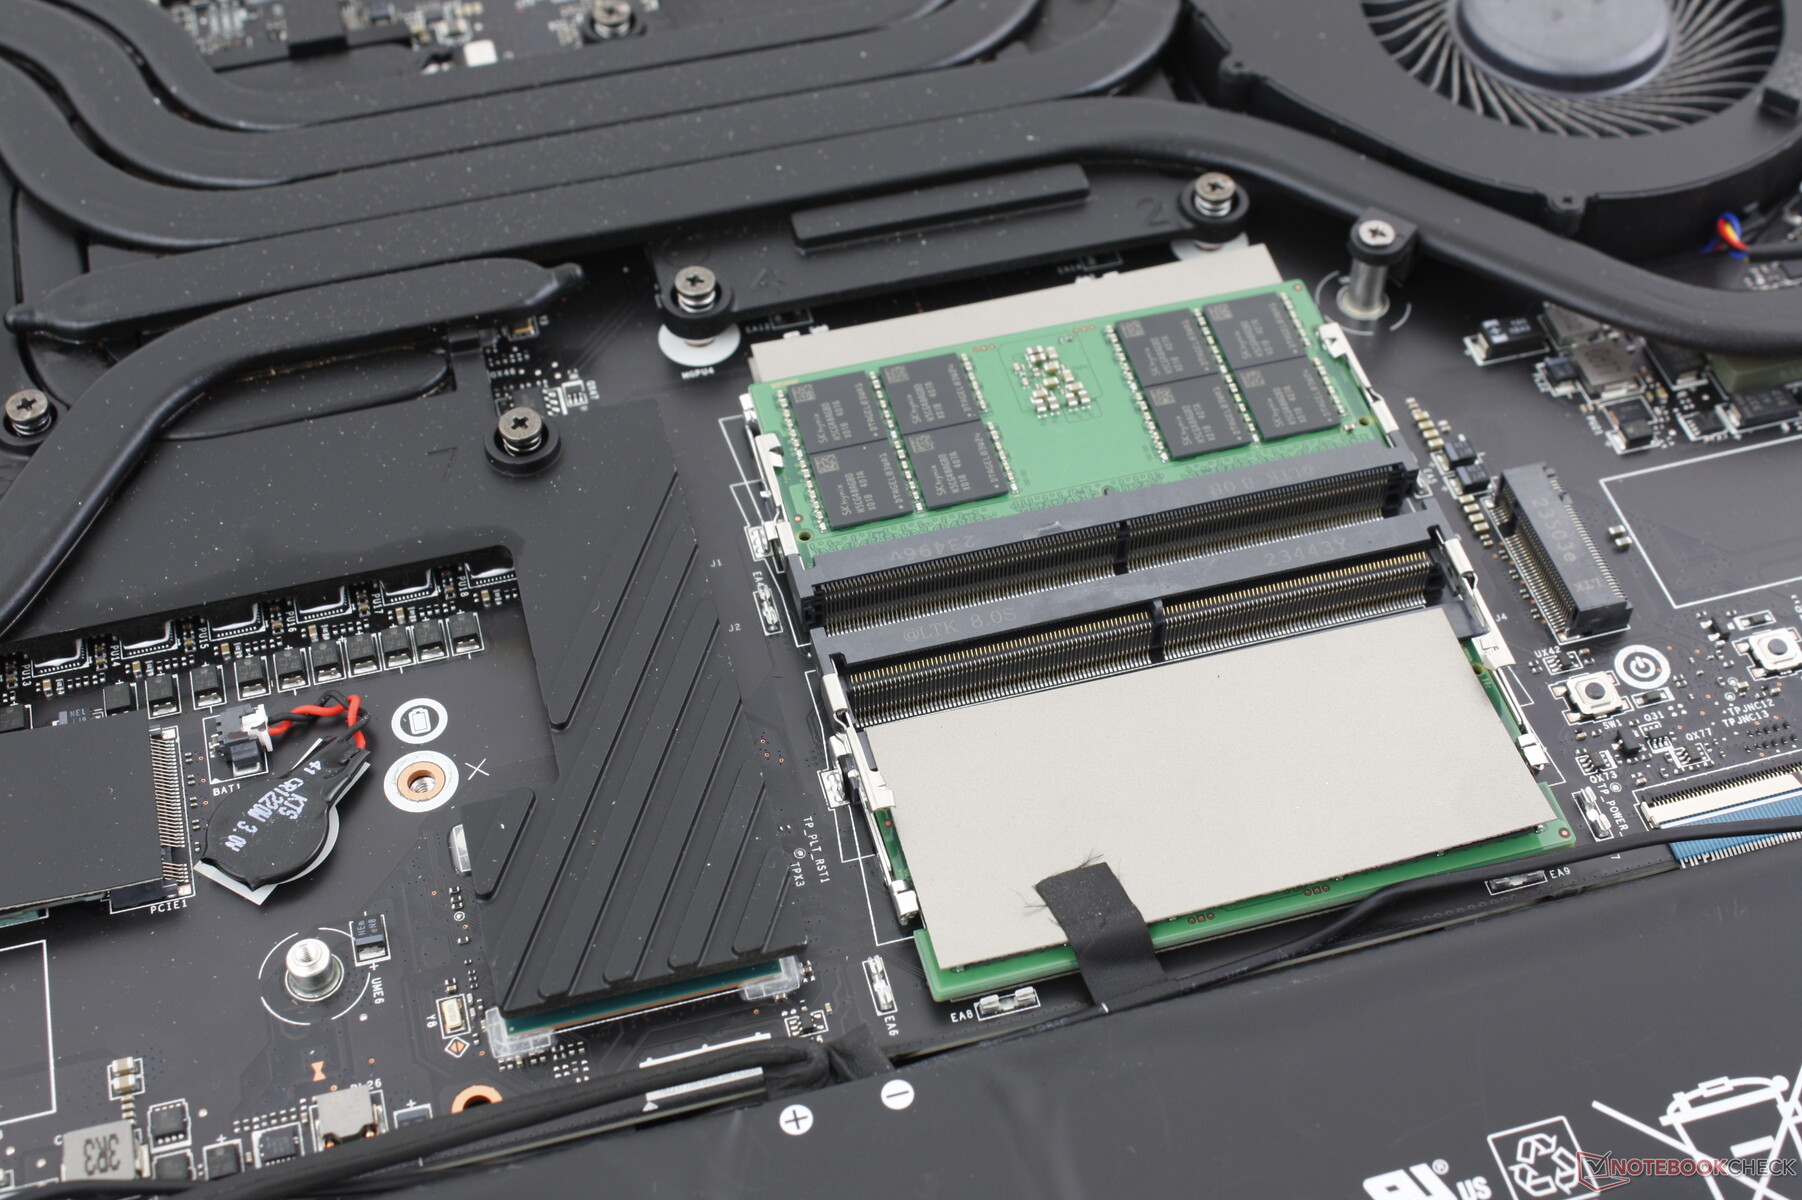
Die Unterseite des Raider 18 HX ist mit 12 Phillips-Schrauben gesichert, die sich relativ leicht entfernen lassen. MSI gehört jedoch weiterhin zu den wenigen Herstellern, die einen Anti-Tamper-Aufkleber verwenden, der eine der Schrauben abdeckt, die für einfache Upgrades wie RAM oder Speicher entfernt werden muss.
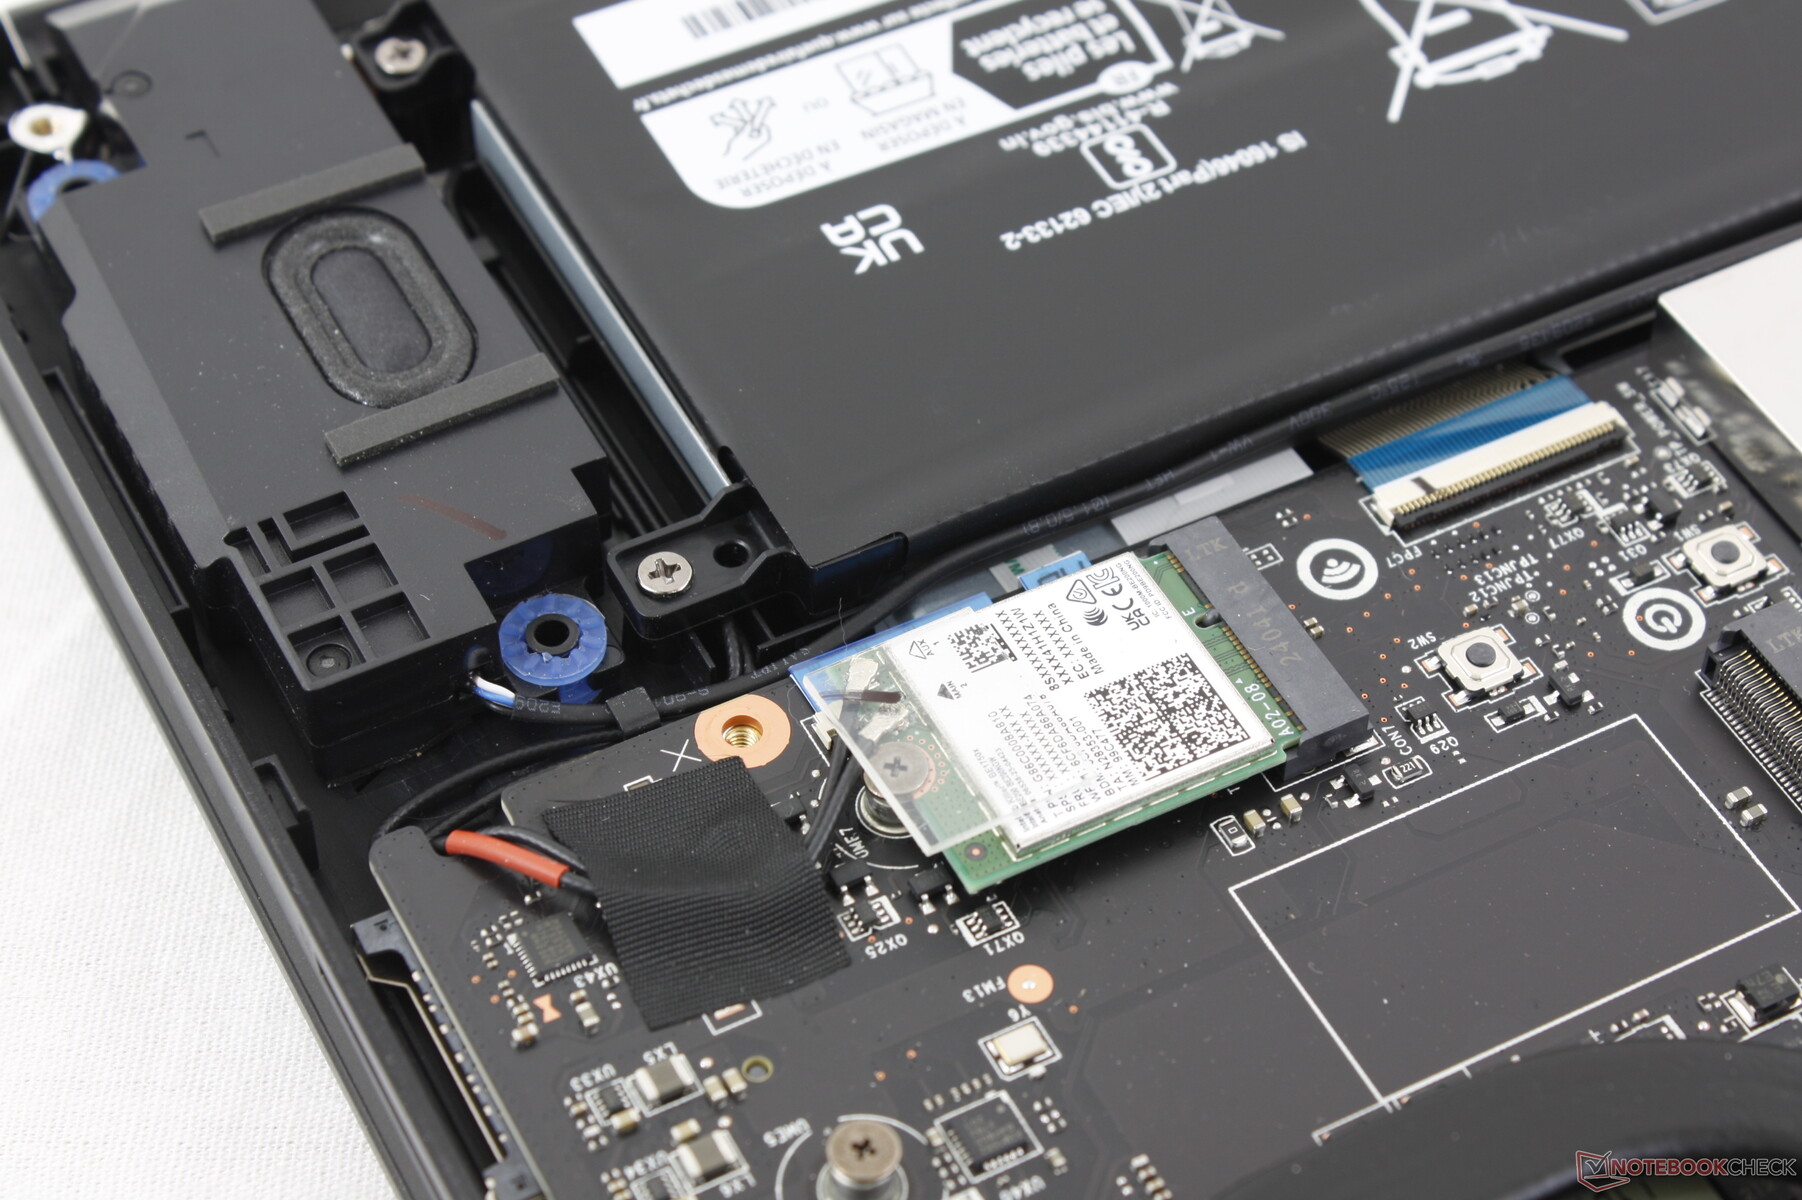
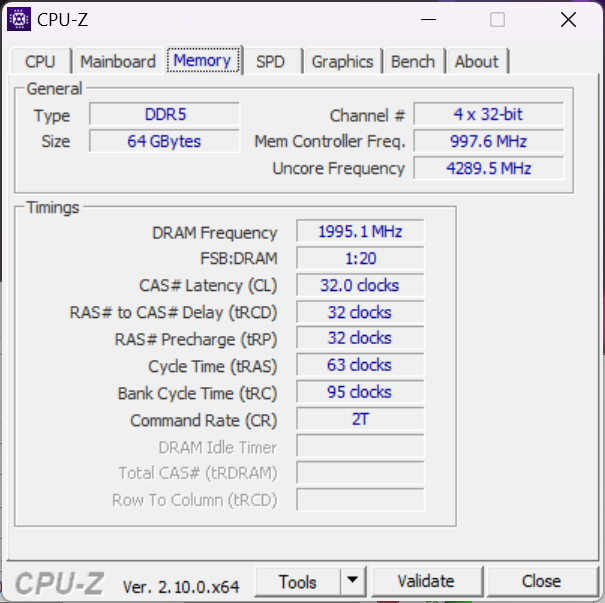
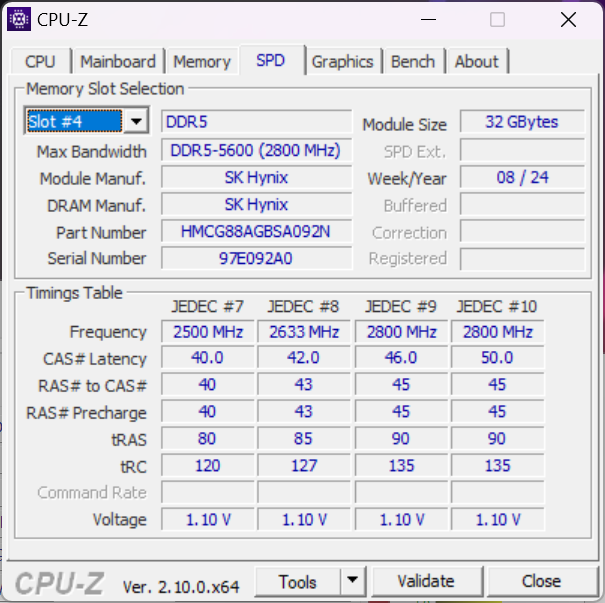
Das Raider 18 HX enthält viele der gleichen internen Komponenten wie das Titan 18 HX. Benutzer haben Zugang zu zwei M.2 2280 SSD-Slots und vier DDR5 SODIMM-Slots. Allerdings wurde der dritte M.2-SSD-Slots aus diesem Modell entfernt; für diese Funktion müssen Benutzer auf das Titan 18 HX aufrüsten.

Nachhaltigkeit
Die Verpackung ist vollständig recycelbar und besteht überwiegend aus Pappe; lediglich die Bedienungsanleitung ist teilweise in Plastik eingepackt. Informationen über die Verwendung von recycelten Materialien bei der Herstellung des Systems fehlen jedoch.
Zubehör und Garantie
Im Lieferungumfang befinden sich neben dem Netzteil und den Dokumenten keine weiteren Extras. Während ältere Raider-Modelle noch mit einem Reinigungstuch aus Samt geliefert wurden, ist dies beim aktuellen Modell nicht mehr der Fall.
Die Garantie erstreckt sich in Deutschland über 24 Monate.
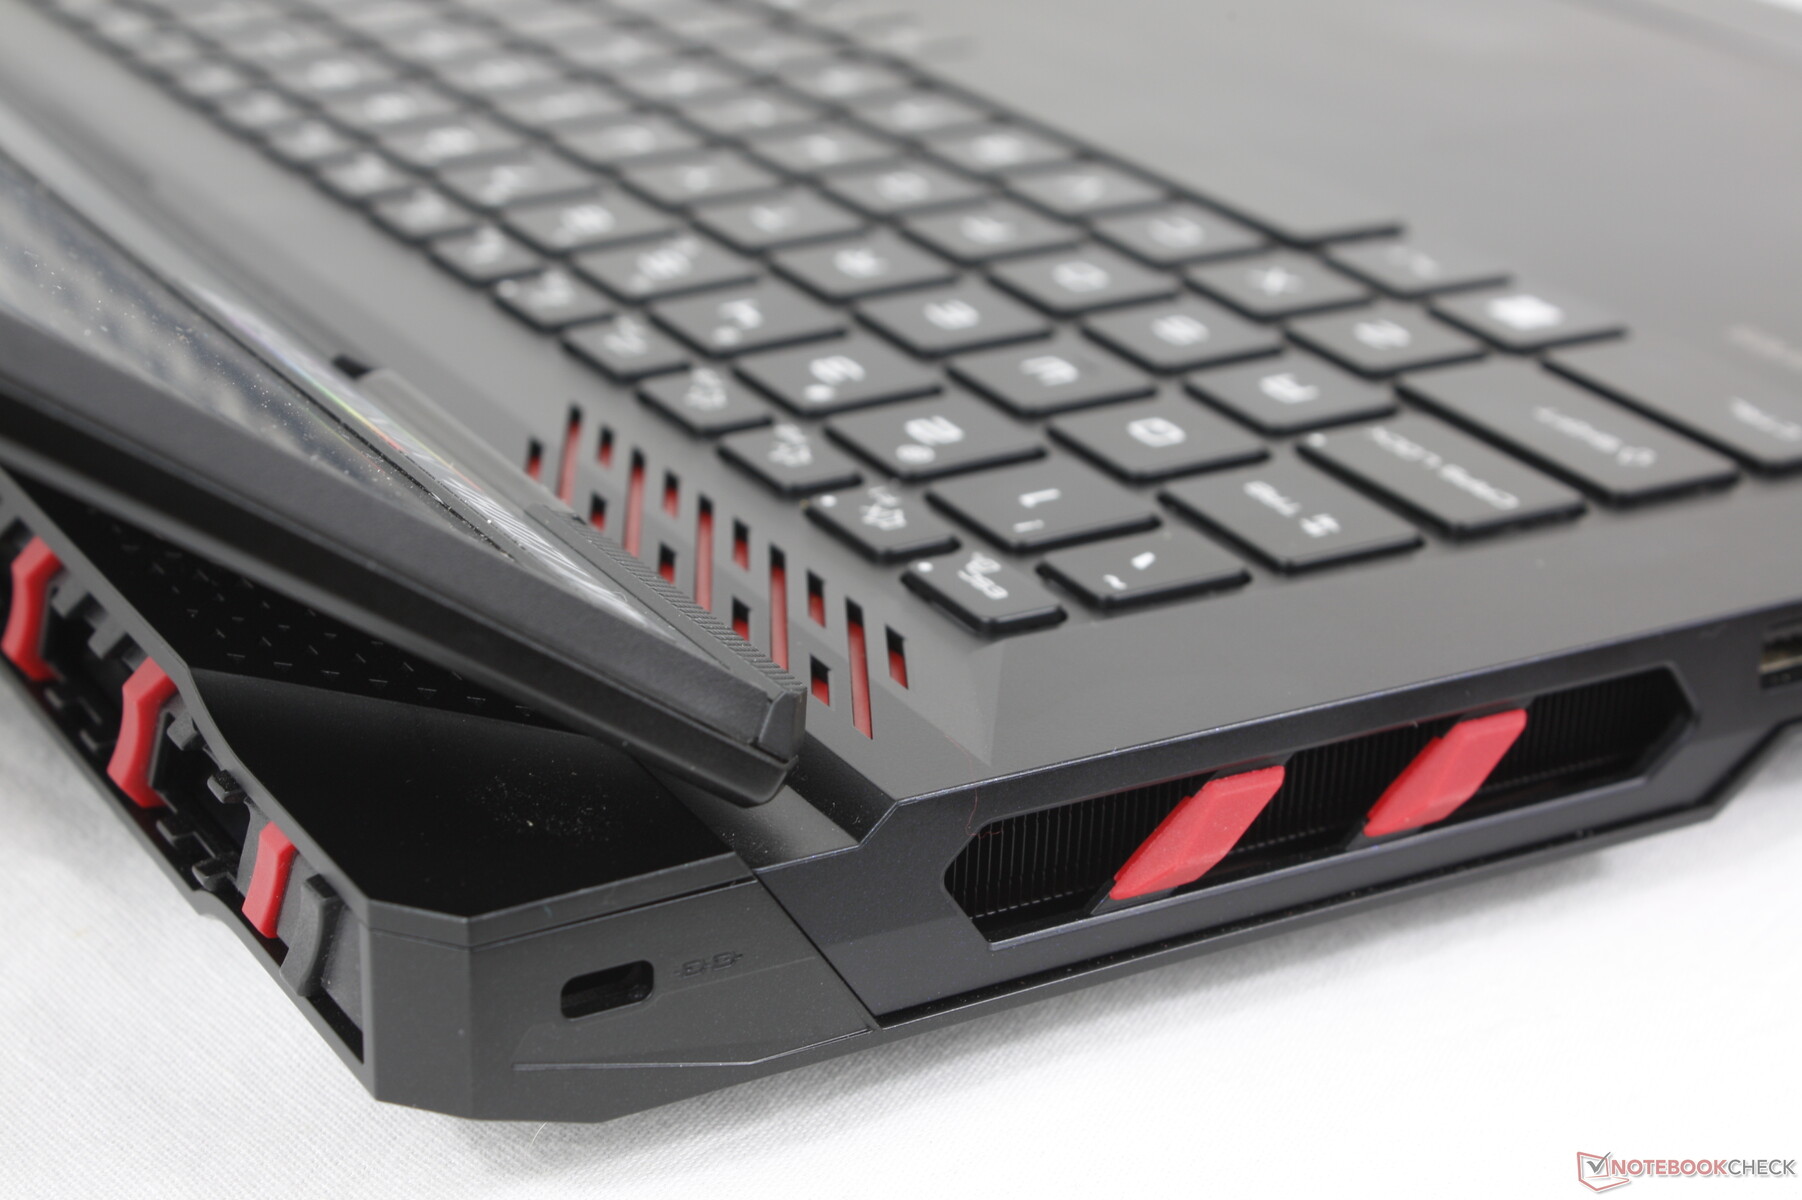
Eingabegeräte — Vertraut statt ausgefallen
Tastatur
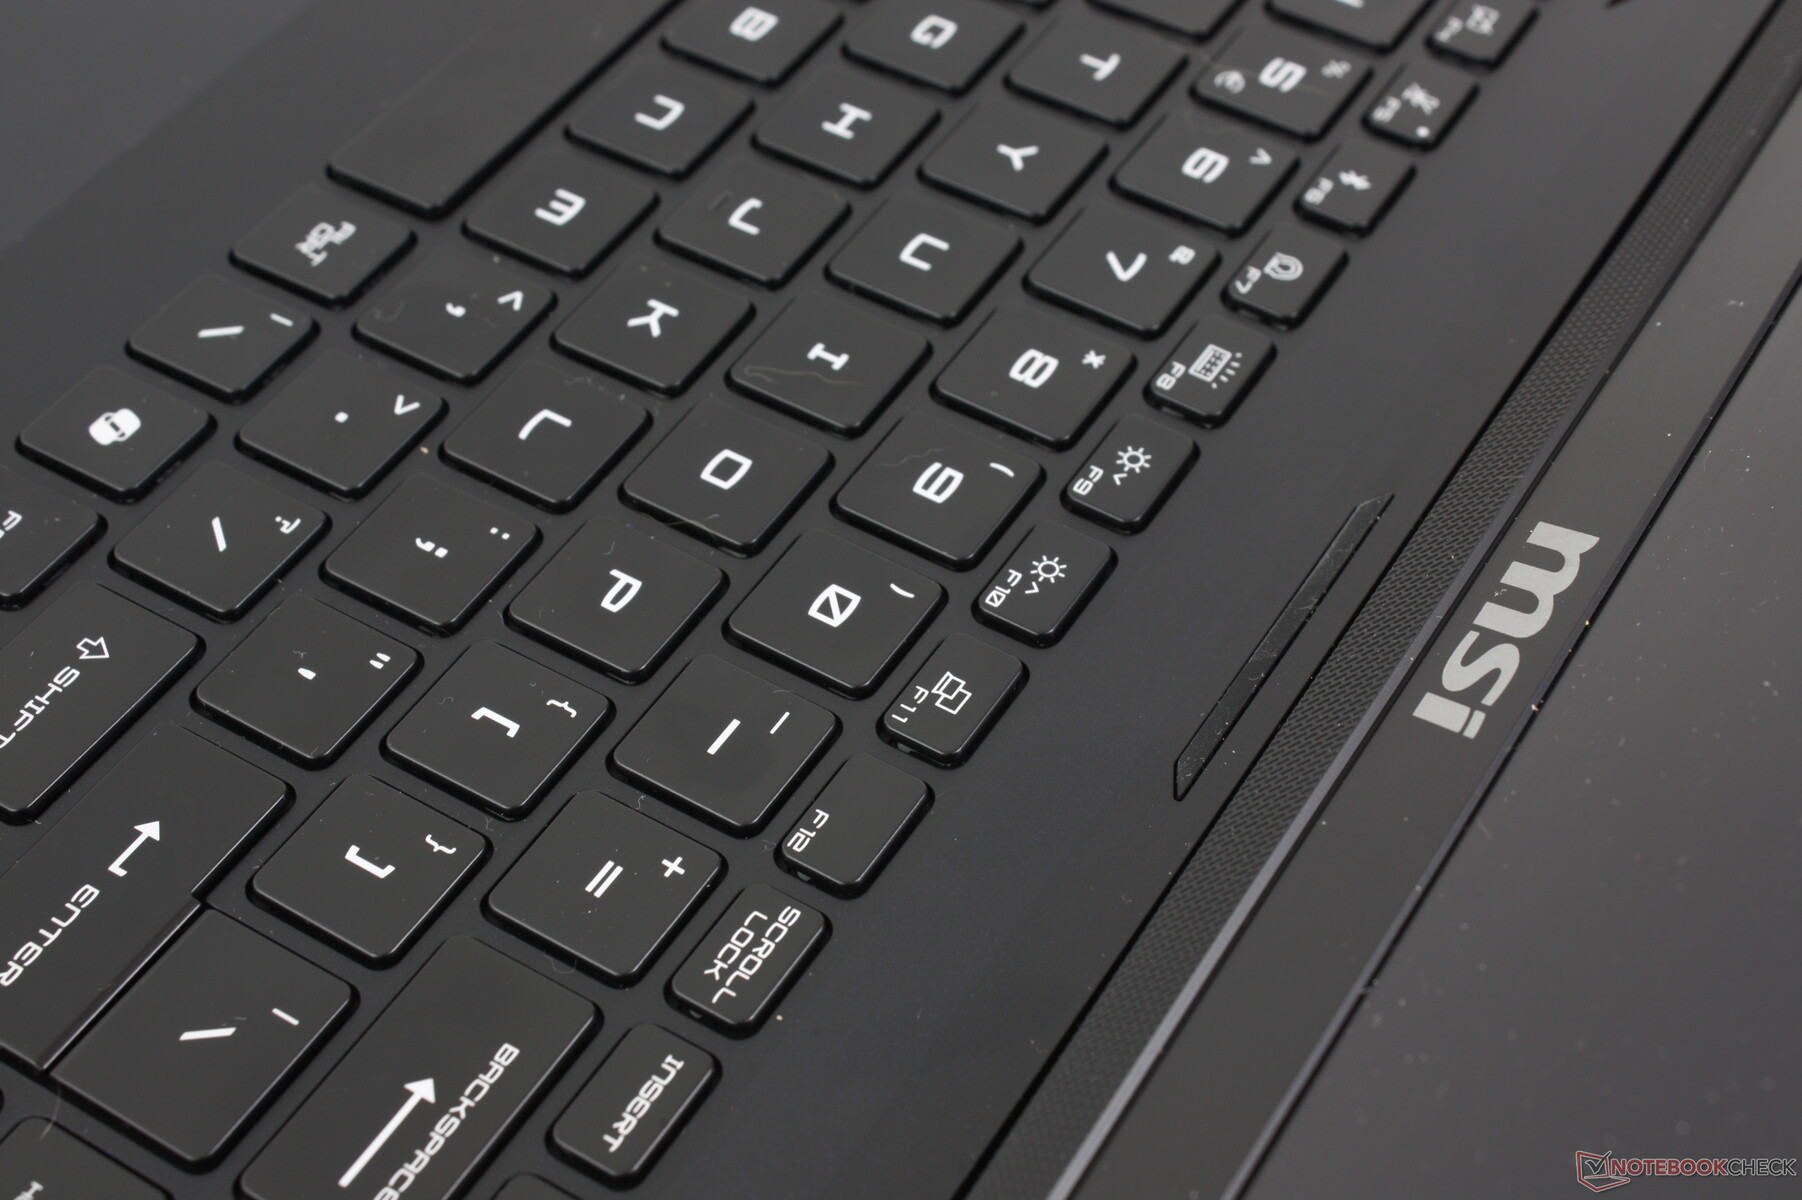
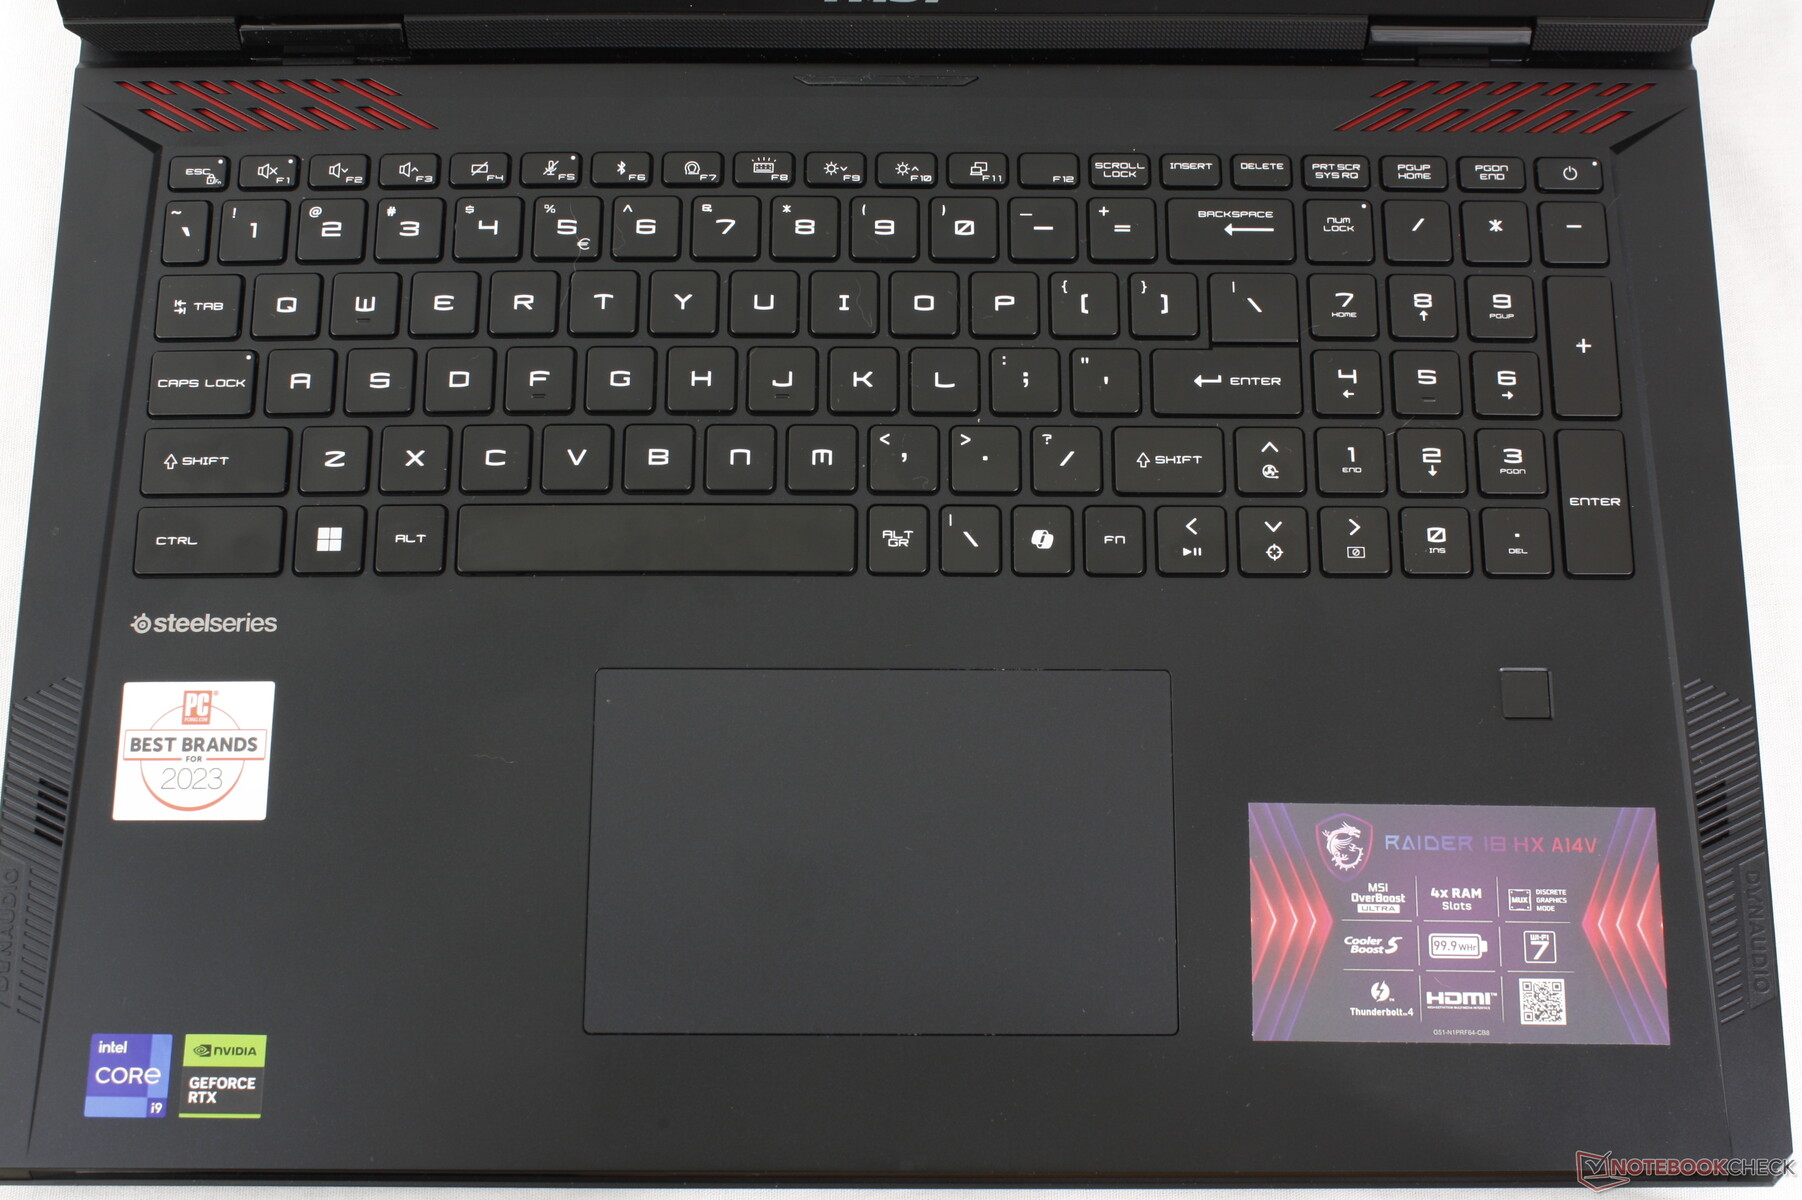
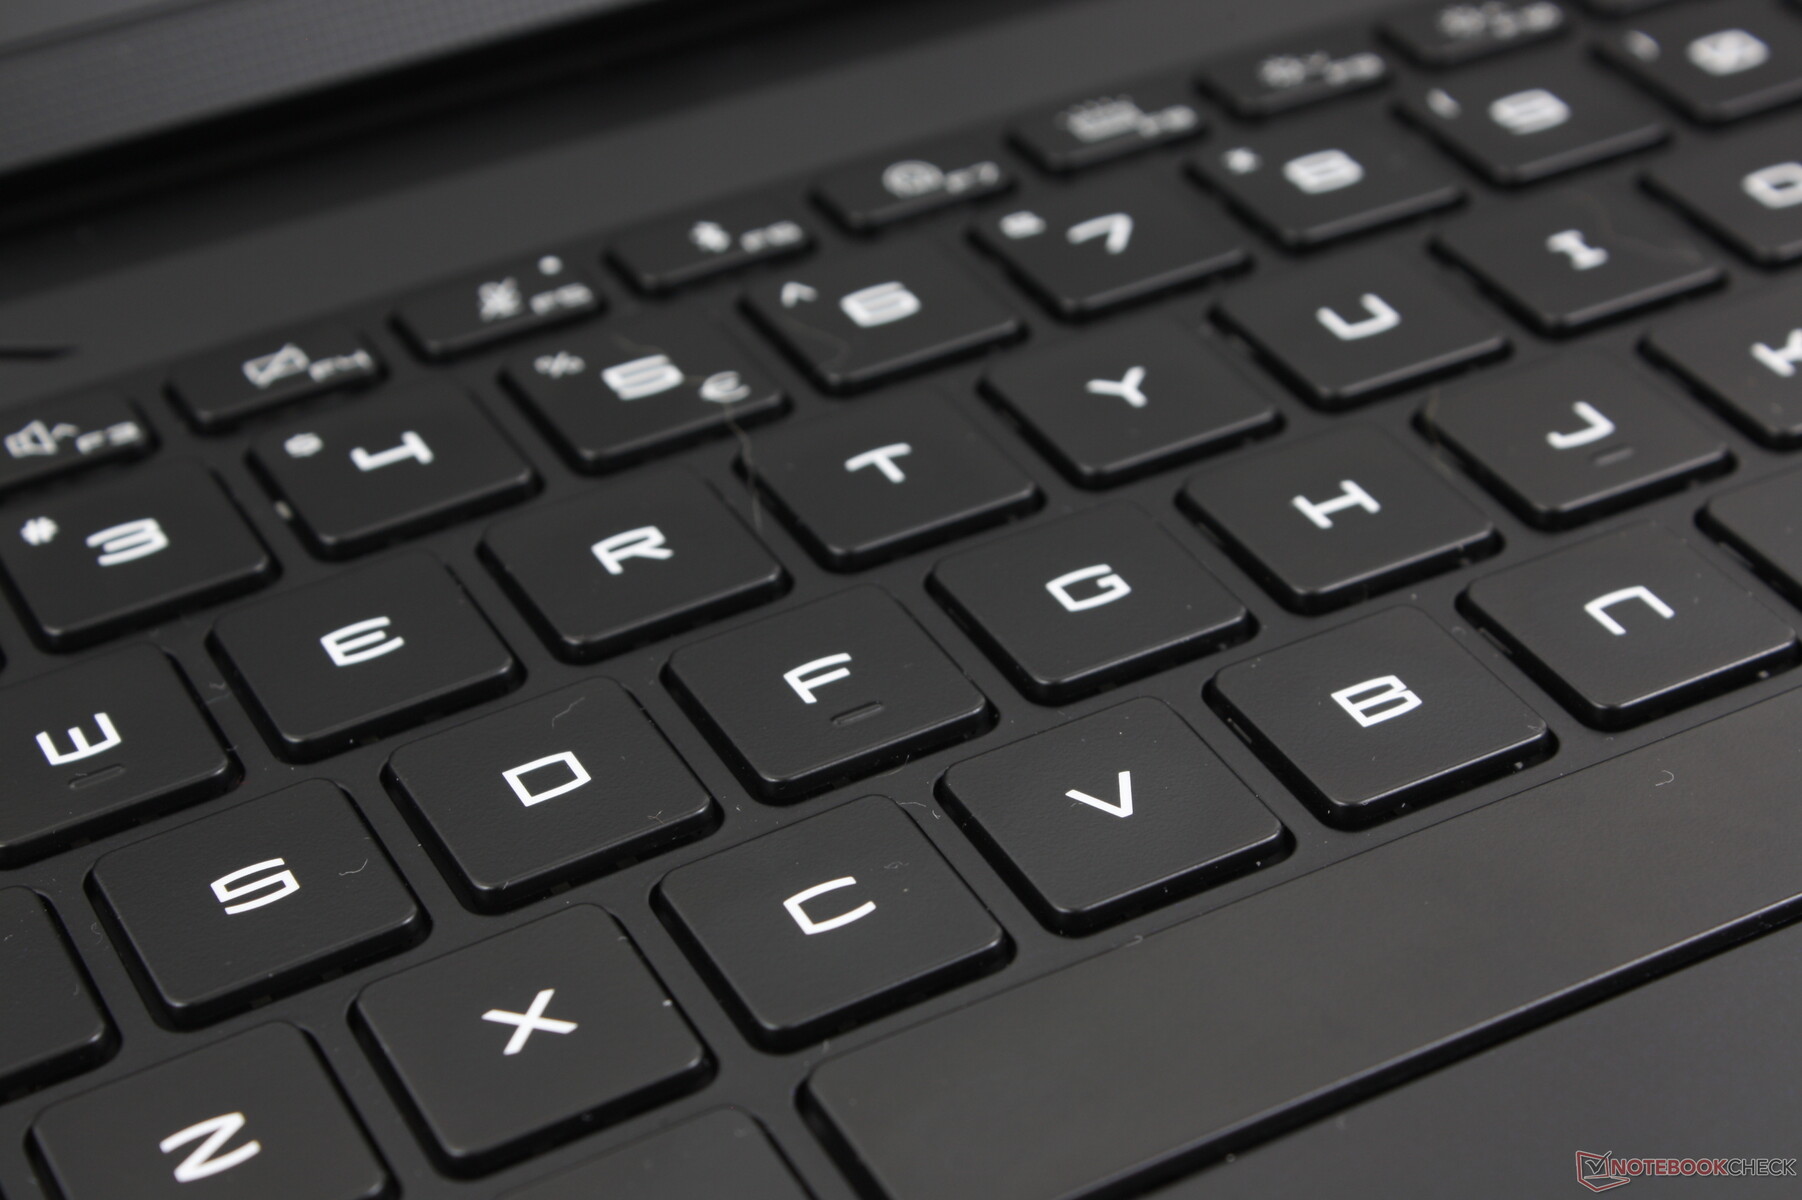
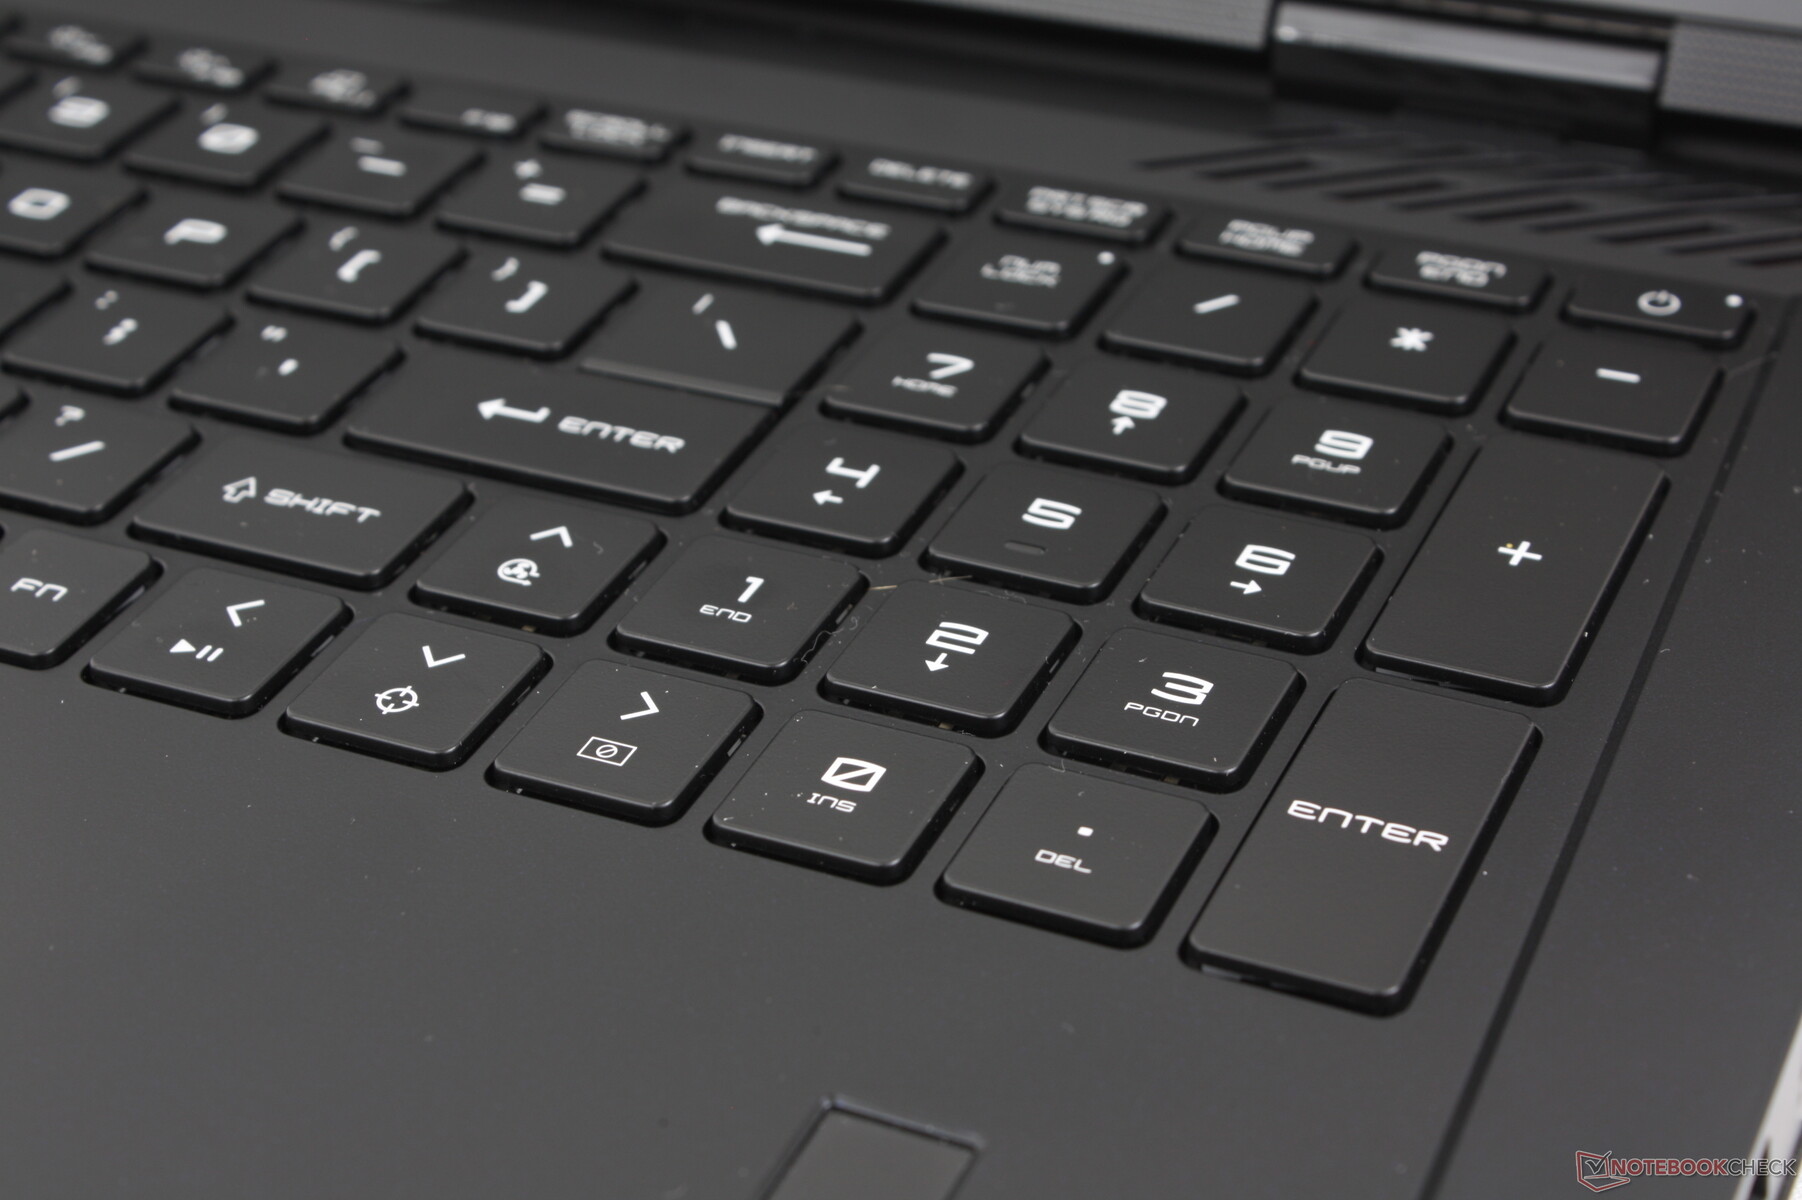
Die Tastatur des Raider 18 HX sieht zwar genauso aus wie die des Titan 18 HX, bietet jedoch einen wesentlichen Unterschied: Es fehlen die mechanischen CherryMX-Optionen. Das Tippgefühl auf dem Raider 18 HX ähnelt daher eher dem traditionellen Laptop-Tastaturen wie beim MSI Stealth 16 oder bei älteren Raider-Modellen. Das Feedback ist weniger klickend und fest, was die sanftere Geräuschkulisse möglicherweise besser für Umgebungen wie Konferenzräume, Klassenzimmer, Bibliotheken oder Schlafsäle geeignet macht.
Besonders hervorzuheben sind der große Ziffernblock und die Pfeiltasten, da diese in der Regel schmaler und kleiner sind als die QWERTZ-Haupttasten der meisten anderen Laptops. Die Arbeit mit Tabellenkalkulationen gestaltet sich auf dem Raider 18 HX daher komfortabler als auf dem Blade 18 oder dem ROG Strix G18.
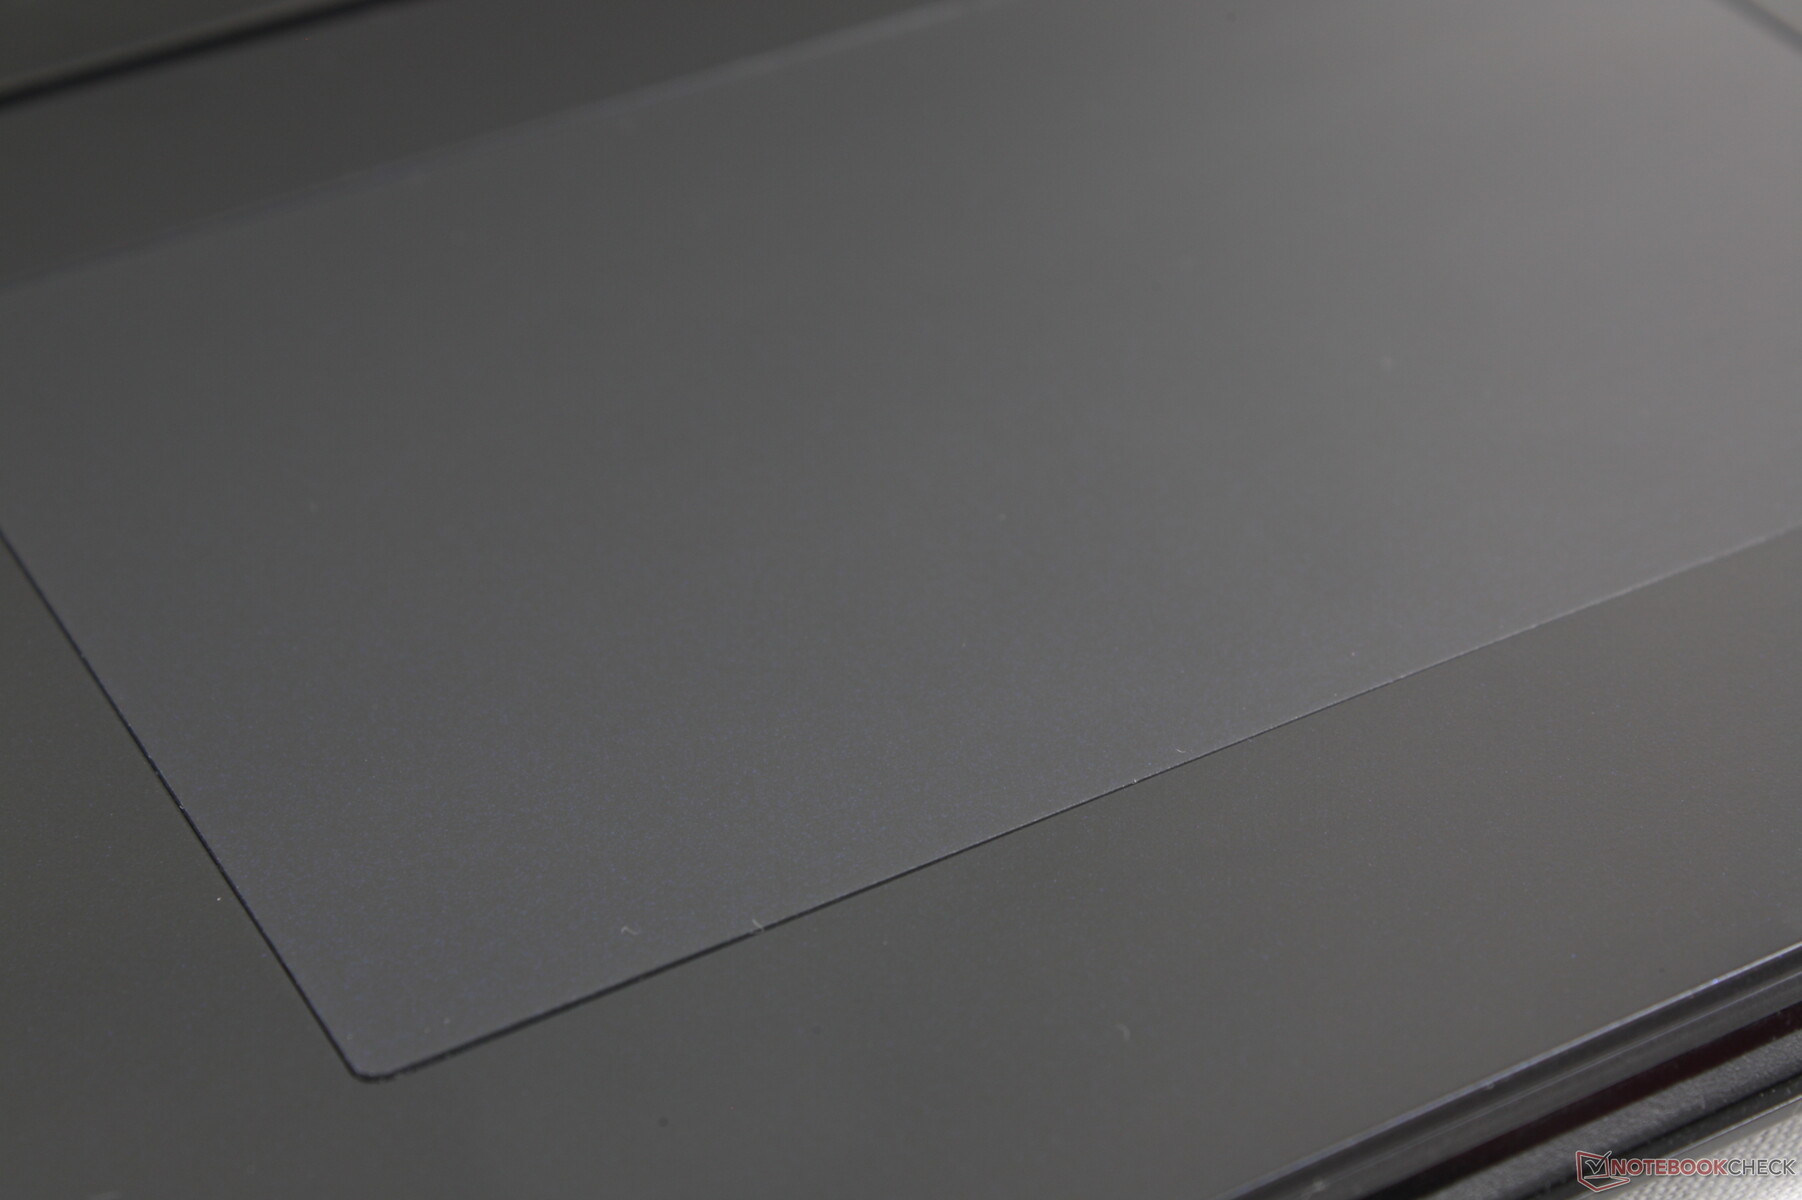
Touchpad
Im Gegensatz zum ausgefallenen, LED-beleuchteten und kantenlosen Clickpad des Titan 18 HX verfügt das Raider 18 HX über ein traditionelles Clickpad, das sich vertrauter anfühlt. Die Größe bleibt unverändert (13 x 8,2 cm) und es ist vermutlich komfortabler zu bedienen, da es nicht versucht, etwas Neues zu sein oder ein nicht vorhandenes Problem zu beheben. Die Fahrt ist ultraleicht, jedoch gibt es bei langsameren Geschwindigkeiten gelegentlich leichte Ruckler.
Das Herunterdrücken zur Eingabe eines Klicks bleibt leider oberflächlich und schwach, mit unbefriedigendem Feedback. Ein kräftigerer und festerer Klick wäre wünschenswert gewesen, oder sogar die Rückkehr zu dedizierten Maustasten, da das Tastaturdeck ausreichend Platz bietet.
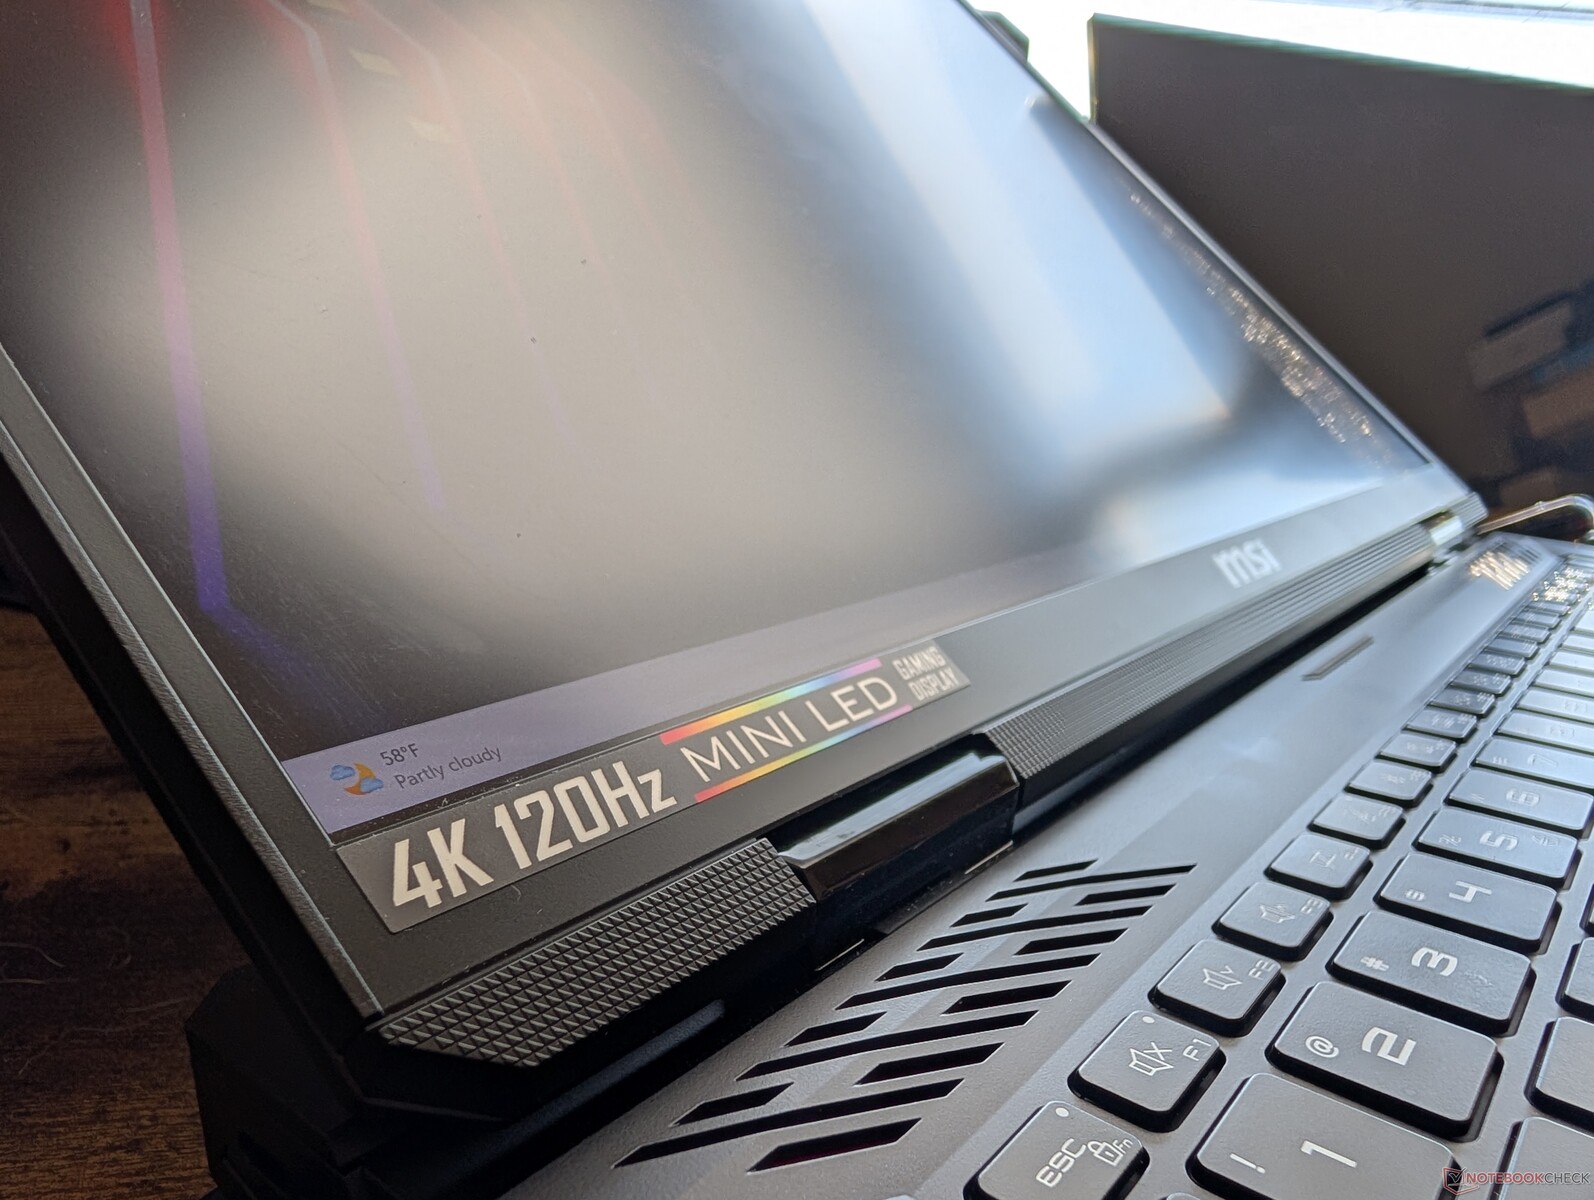
Display — Günstigeres Titan 18 HX-Erlebnis
Der Raider 18 HX ist mit dem gleichen AU Optronics B180ZAN01.0 120 Hz Mini-LED-Panel ausgestattet, das auch im Titan 18 HX verwendet wird und ein nahezu identisches Seherlebnis bietet. Die maximale Helligkeit erreicht fast 600 nits bei deaktiviertem HDR und bis zu 935 nits bei aktiviertem HDR. Im Vergleich zu IPS- oder OLED-Bildschirmen bietet Mini-LED ein überlegenes HDR-Erlebnis, da es höhere Helligkeitsstufen erreichen kann, allerdings auf Kosten eines höheren Stromverbrauchs. Während IPS- oder OLED-Notebooks in der Regel bestenfalls HDR600 unterstützen, versprechen Mini-LED-Panels oft HDR1000.
| |||||||||||||||||||||||||
Ausleuchtung: 94 %
Helligkeit Akku: 392.2 cd/m²
Kontrast: ∞:1 (Schwarzwert: 0 cd/m²)
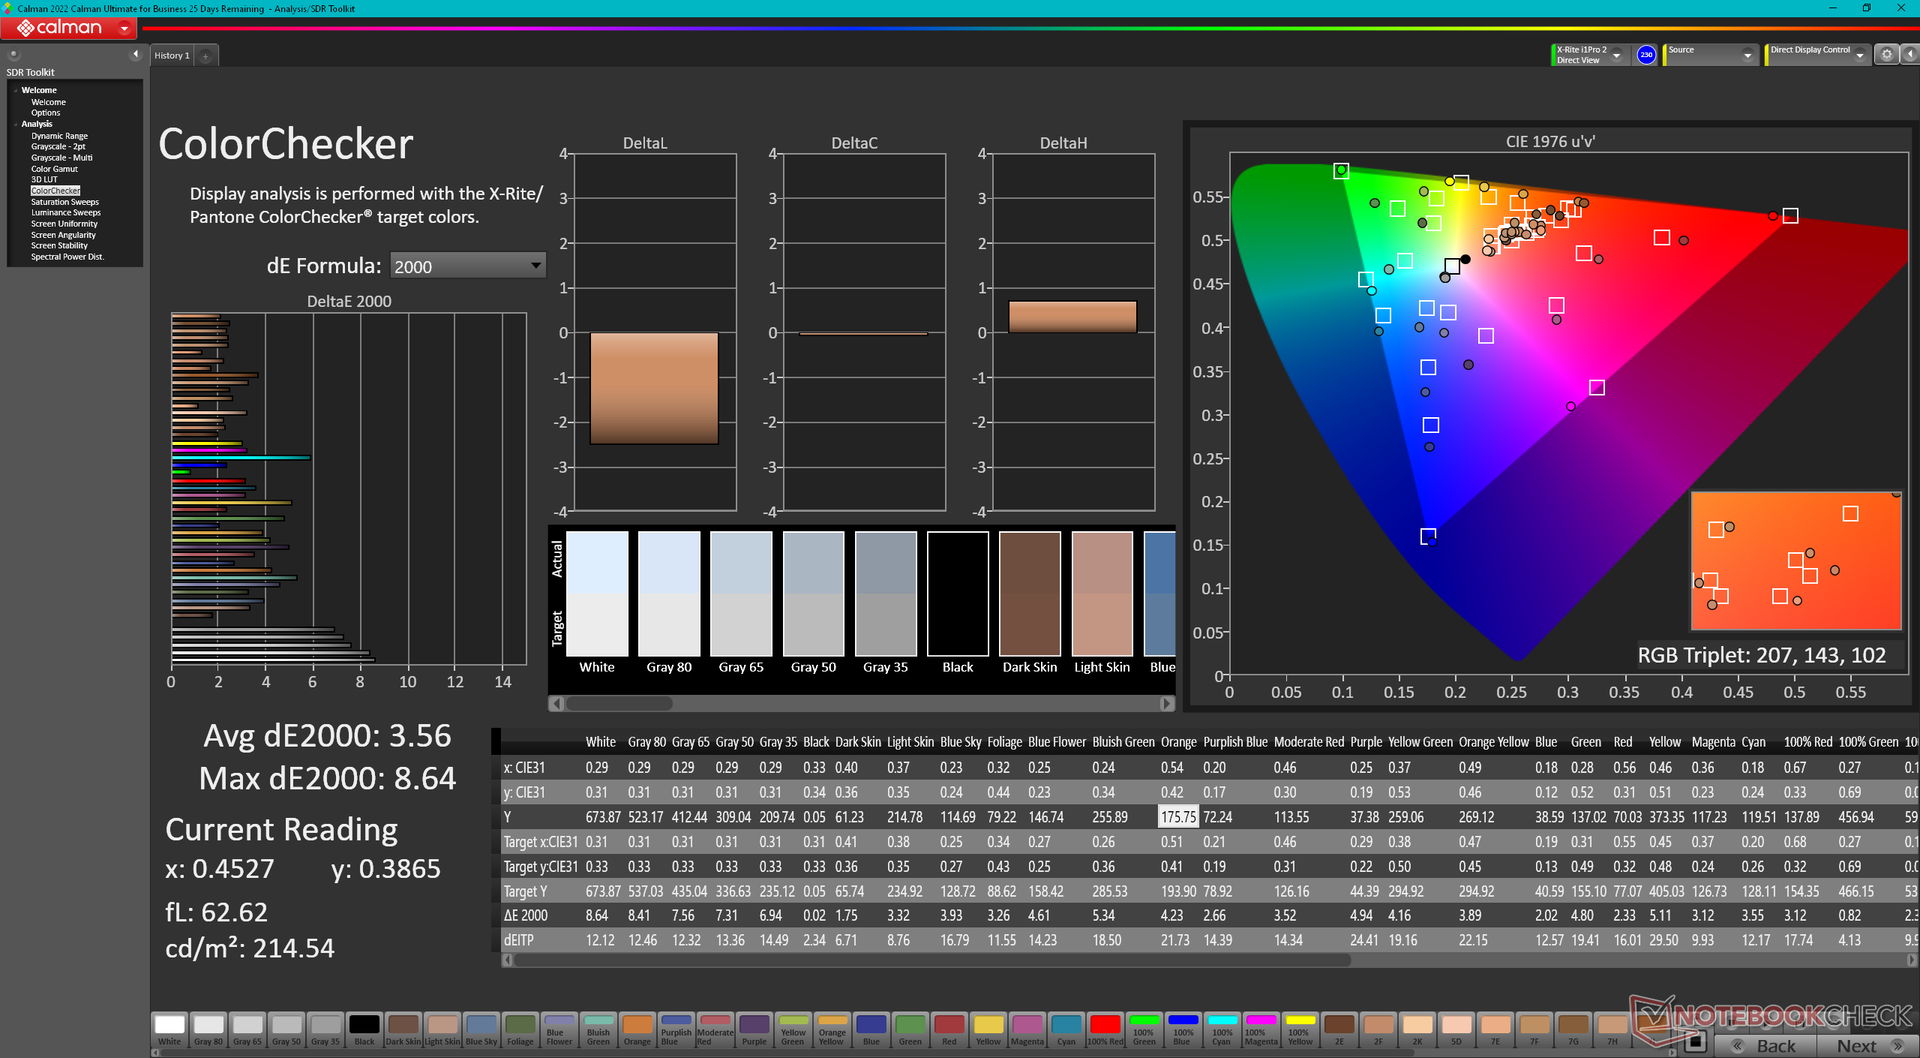
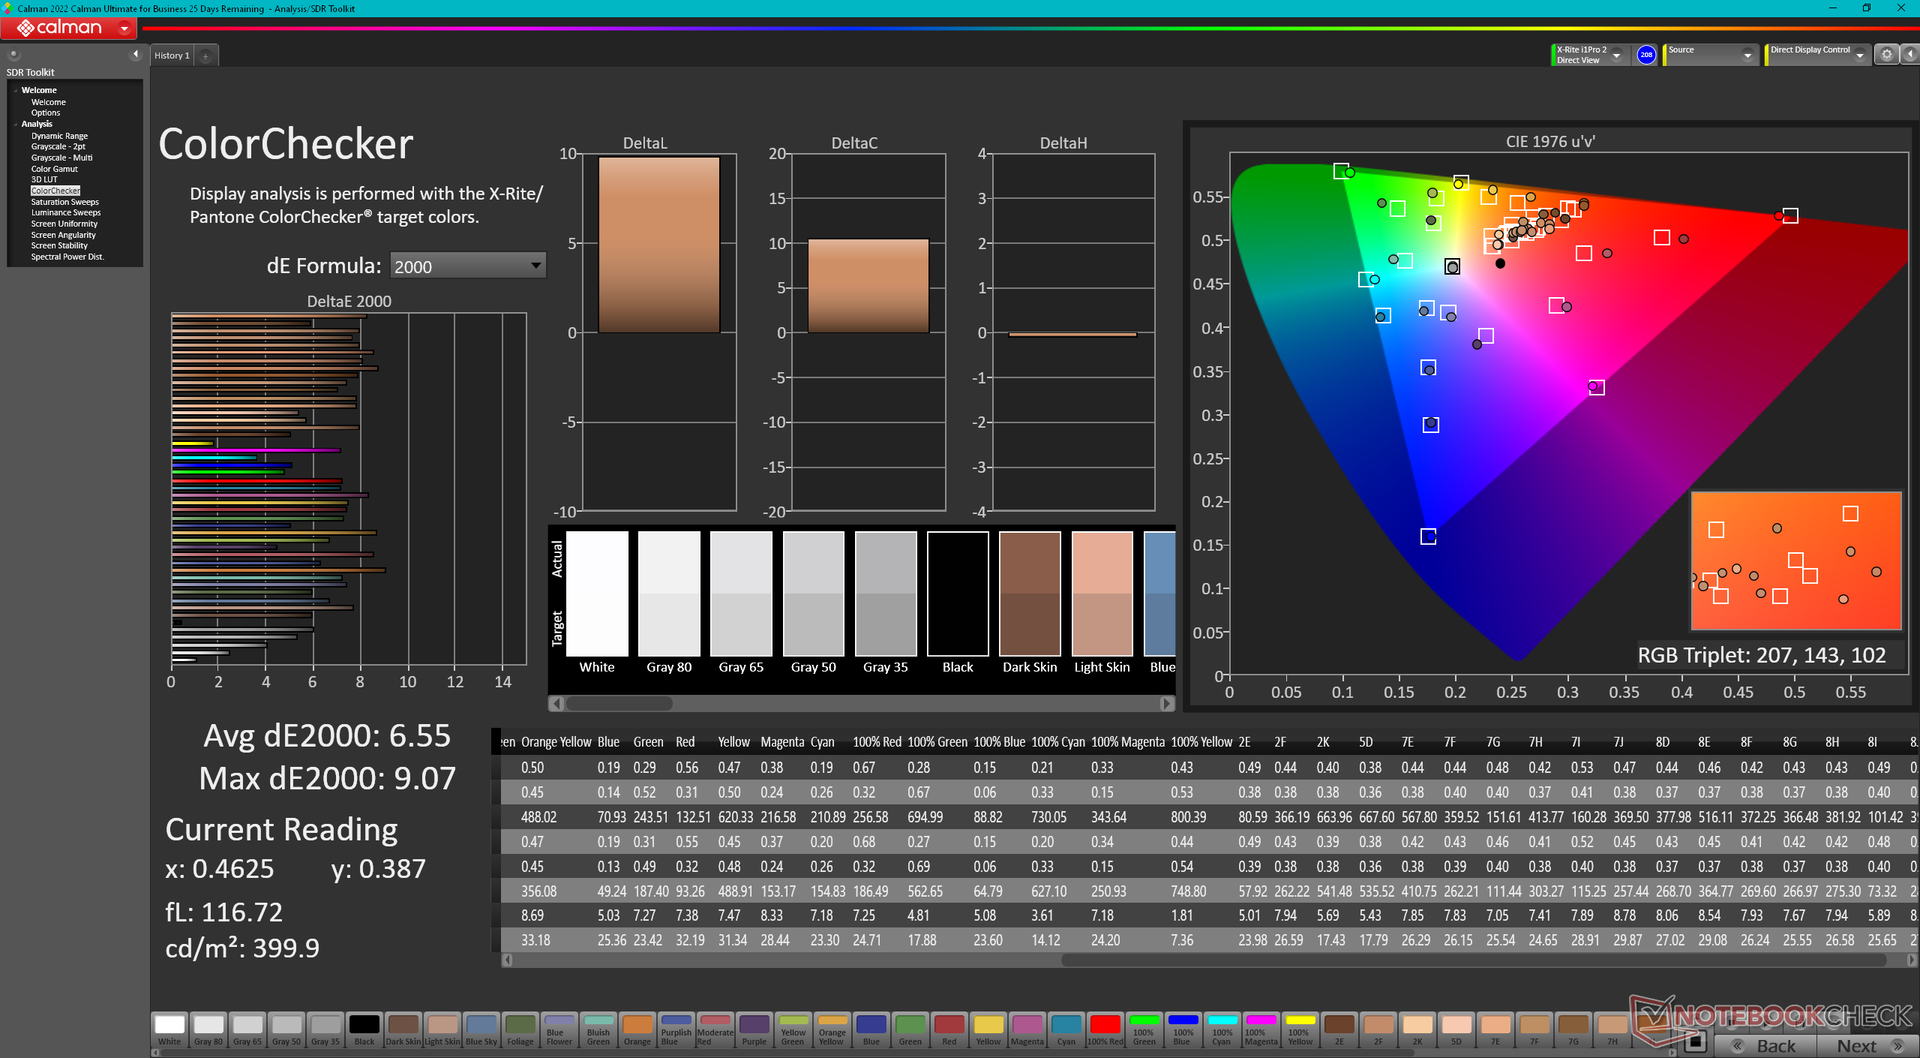
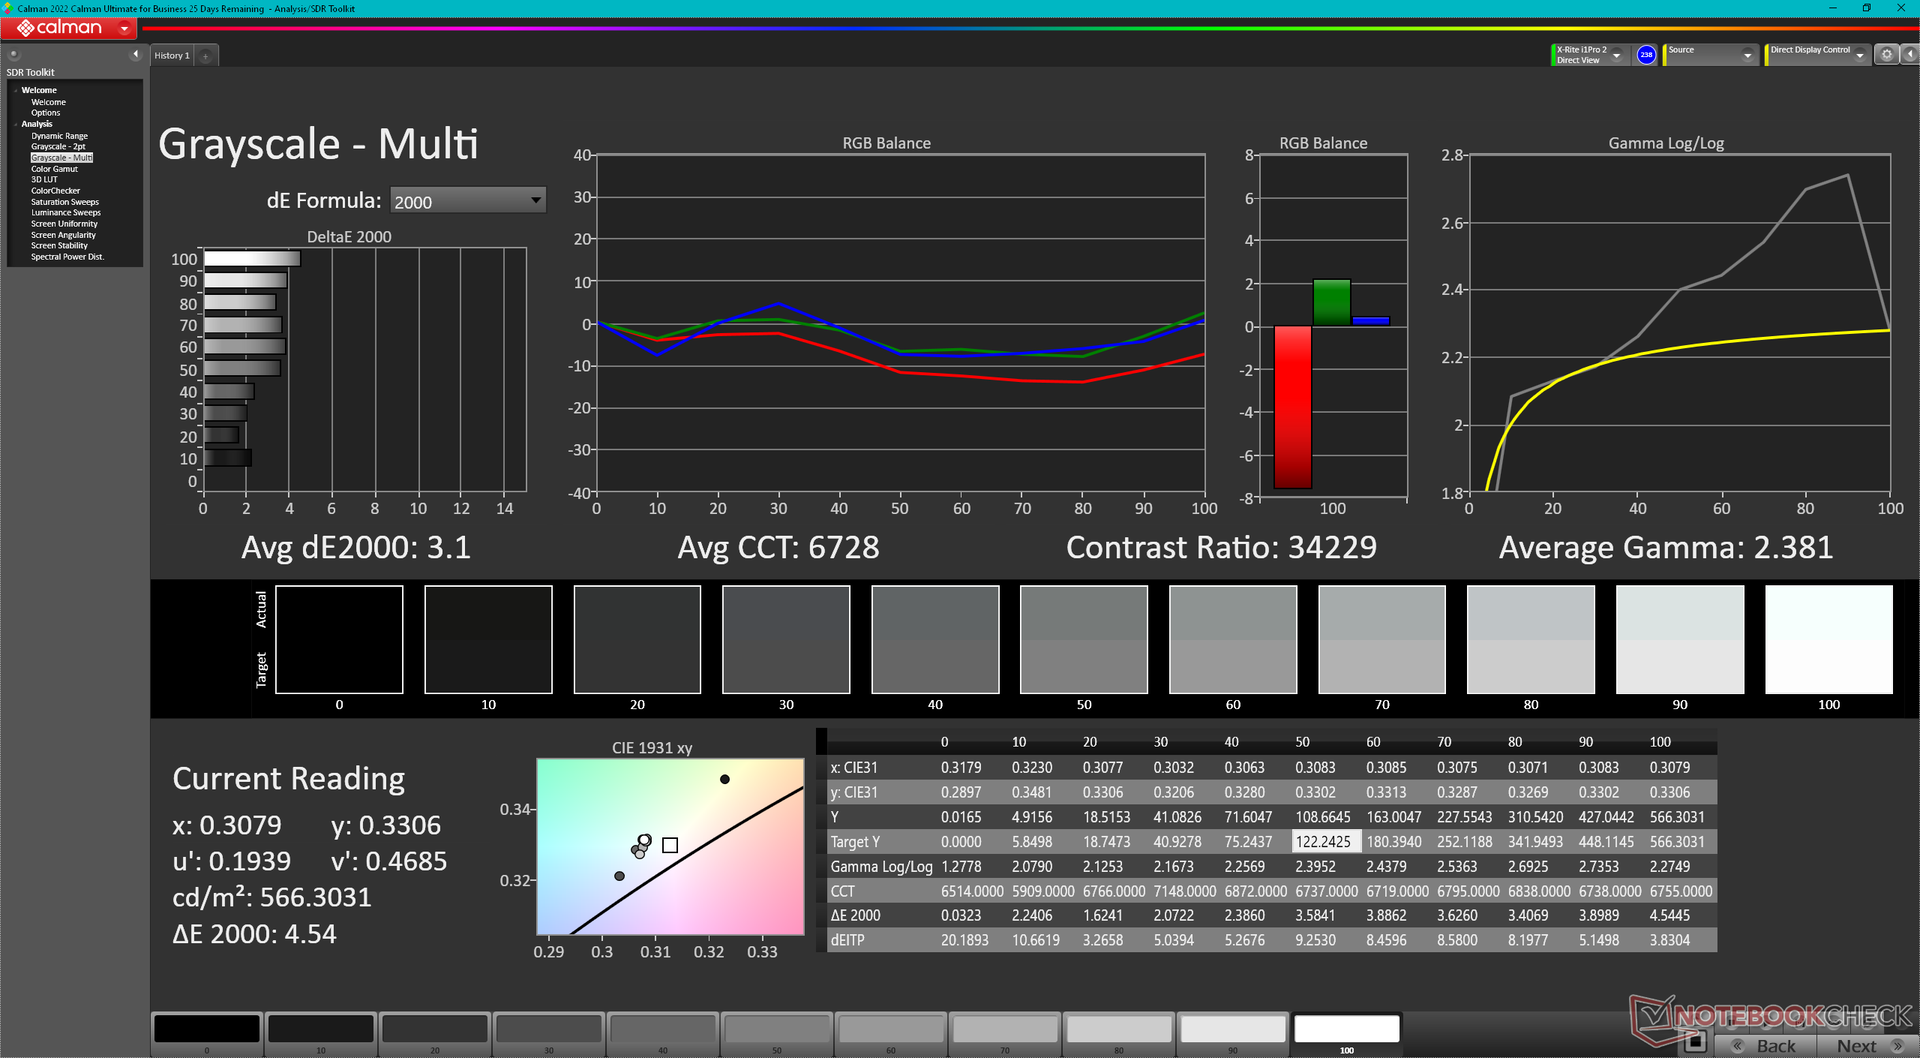
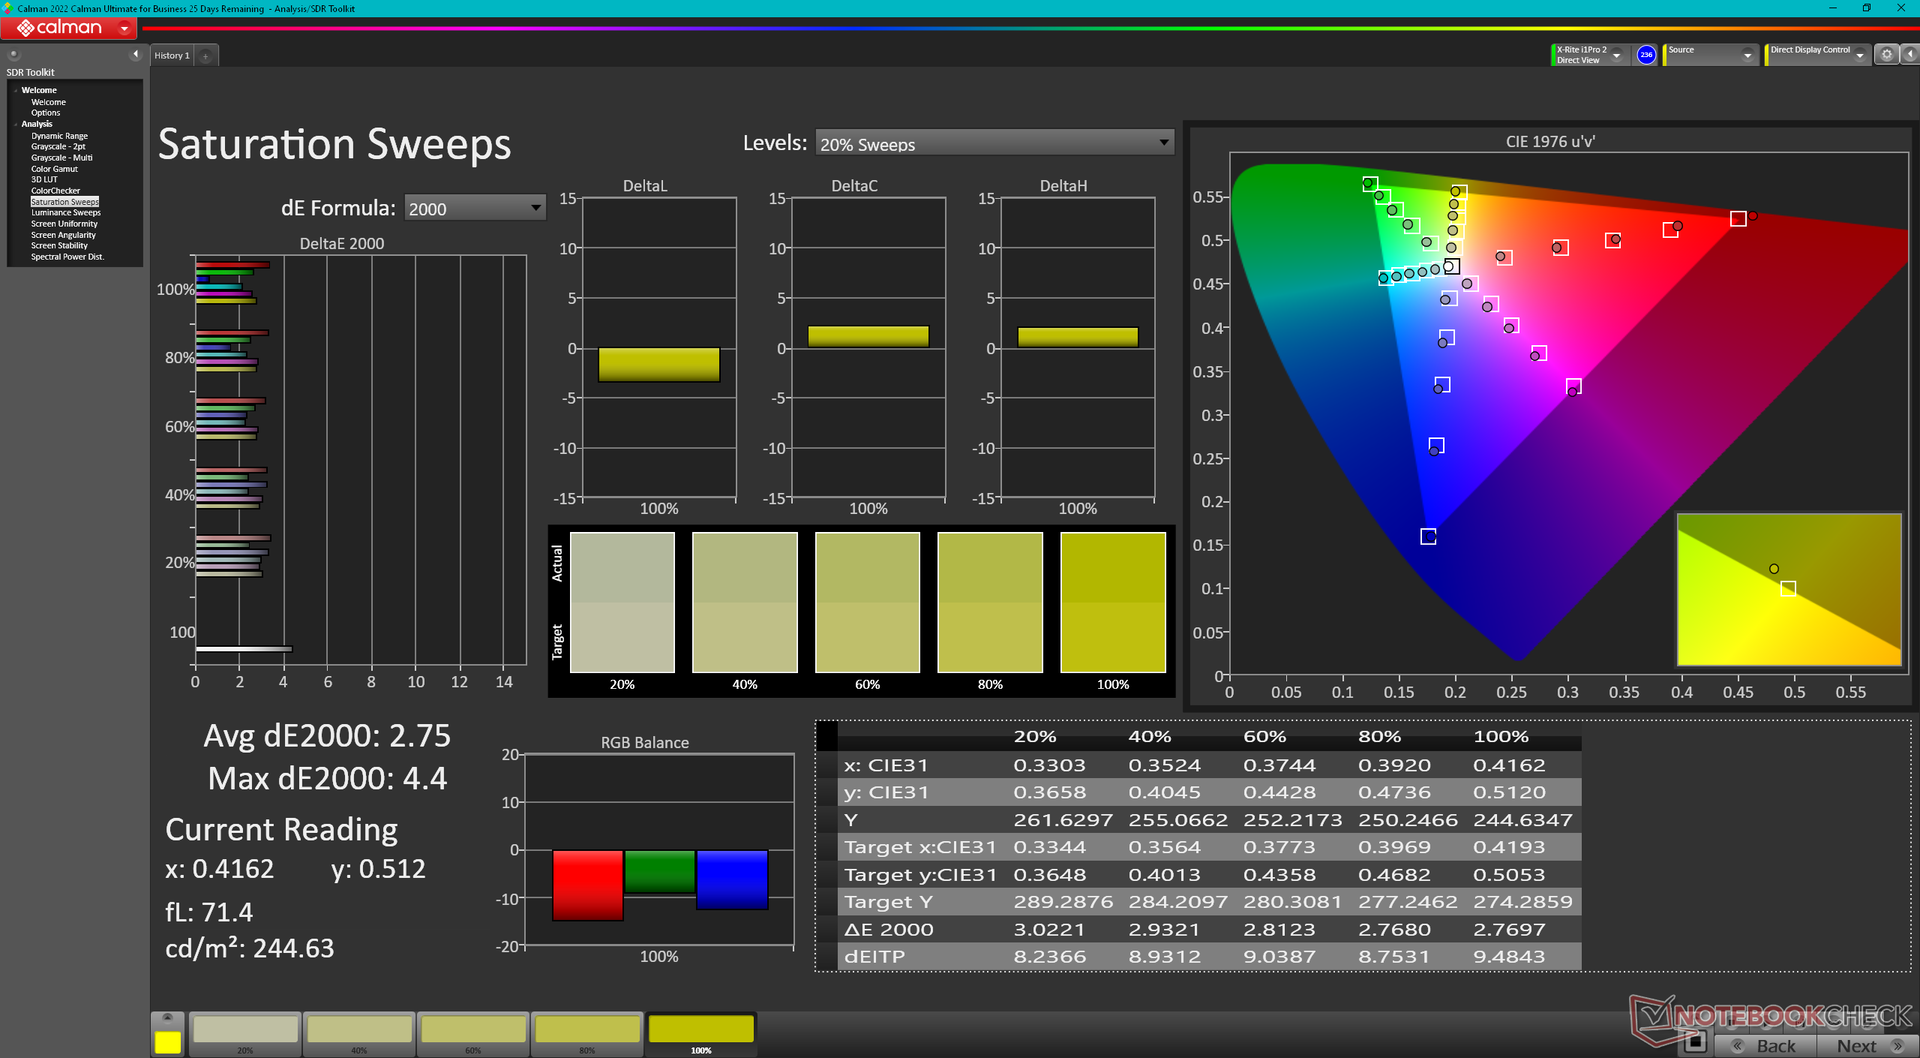
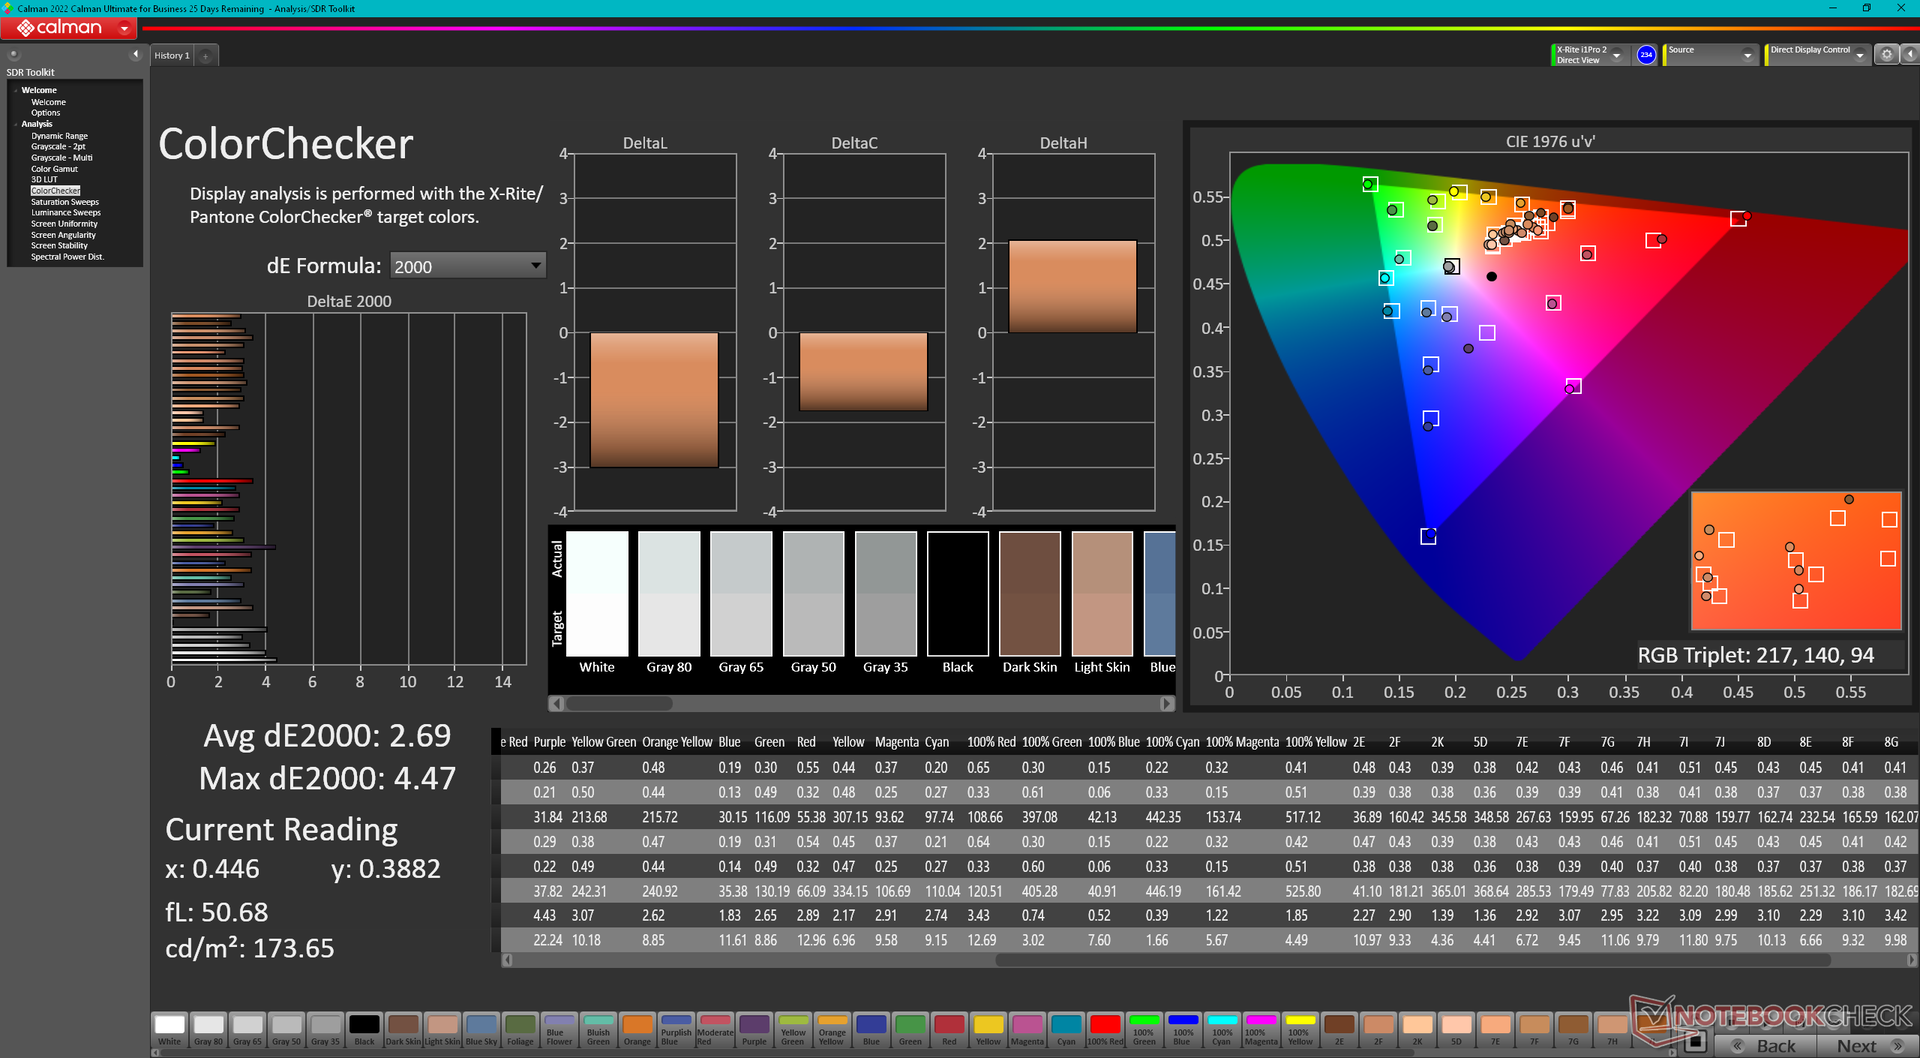
ΔE ColorChecker Calman: 3.56 | ∀{0.5-29.43 Ø4.78}
calibrated: 2.69
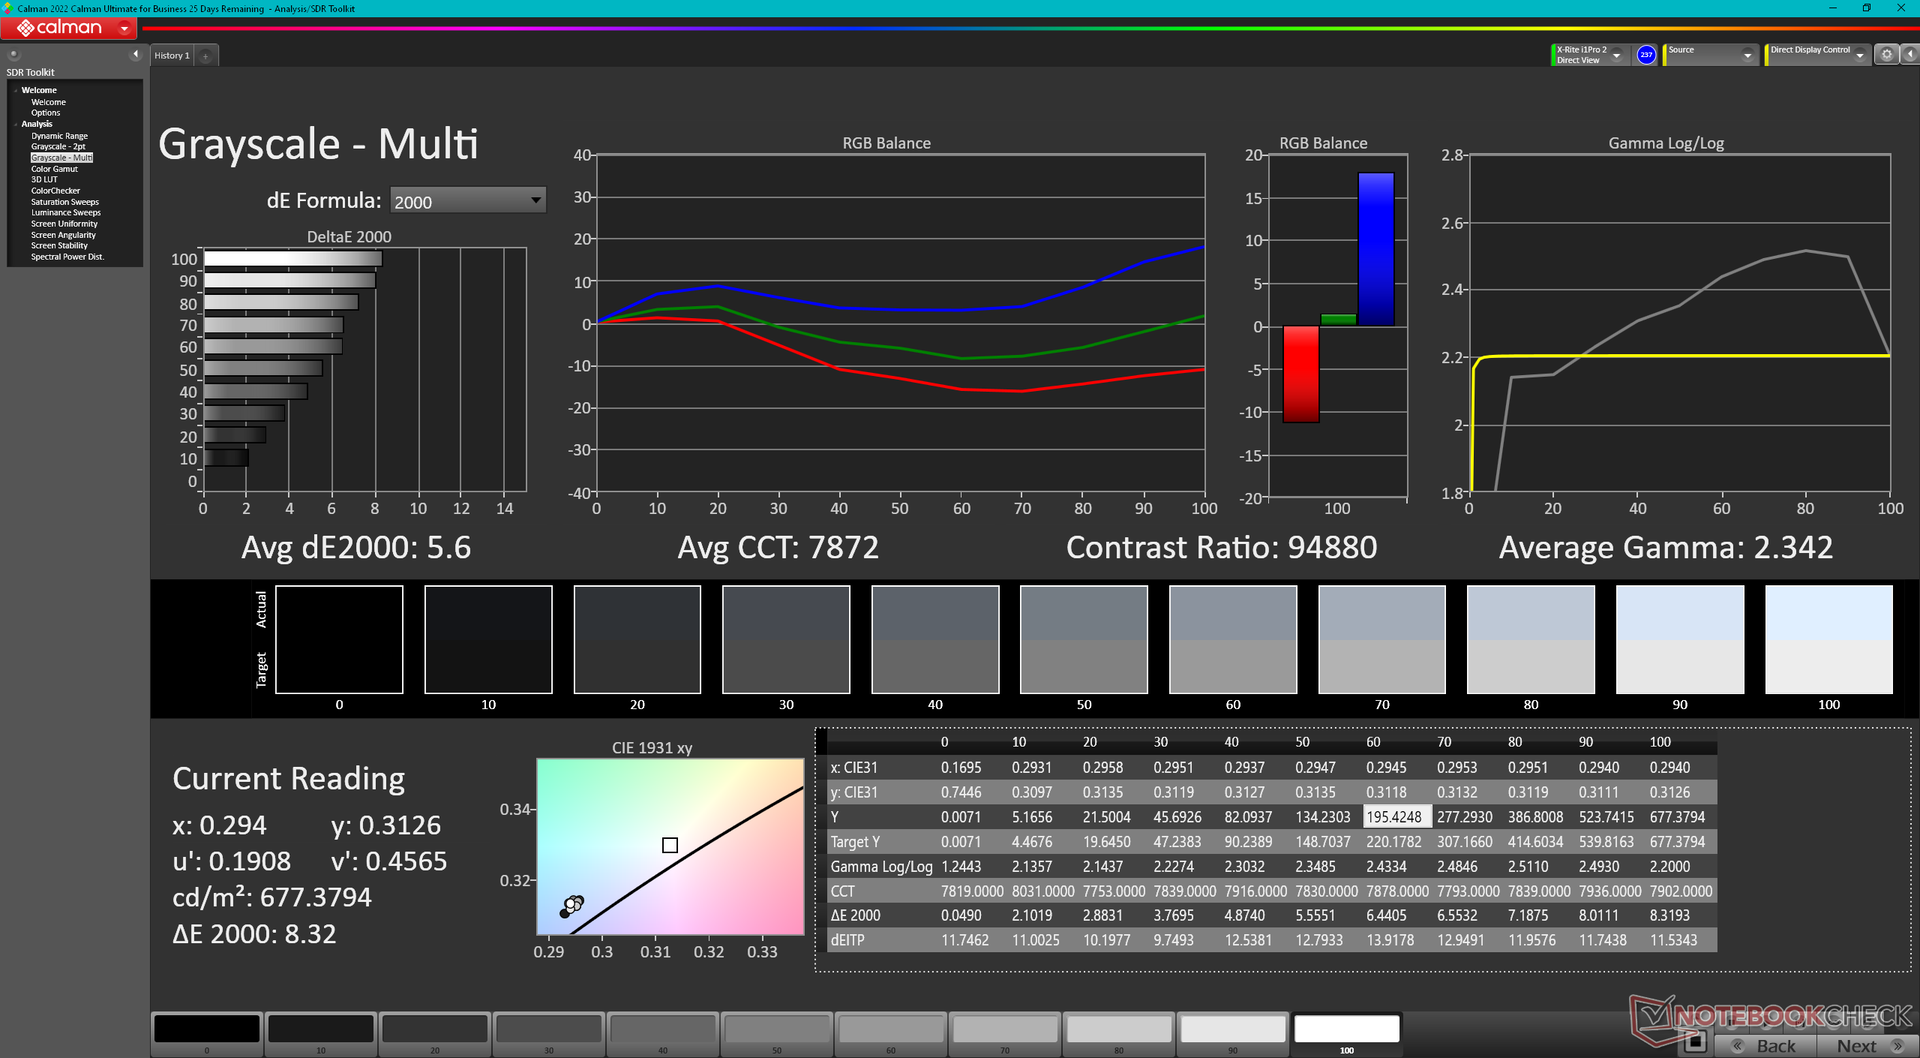
ΔE Greyscale Calman: 5.6 | ∀{0.09-98 Ø5}
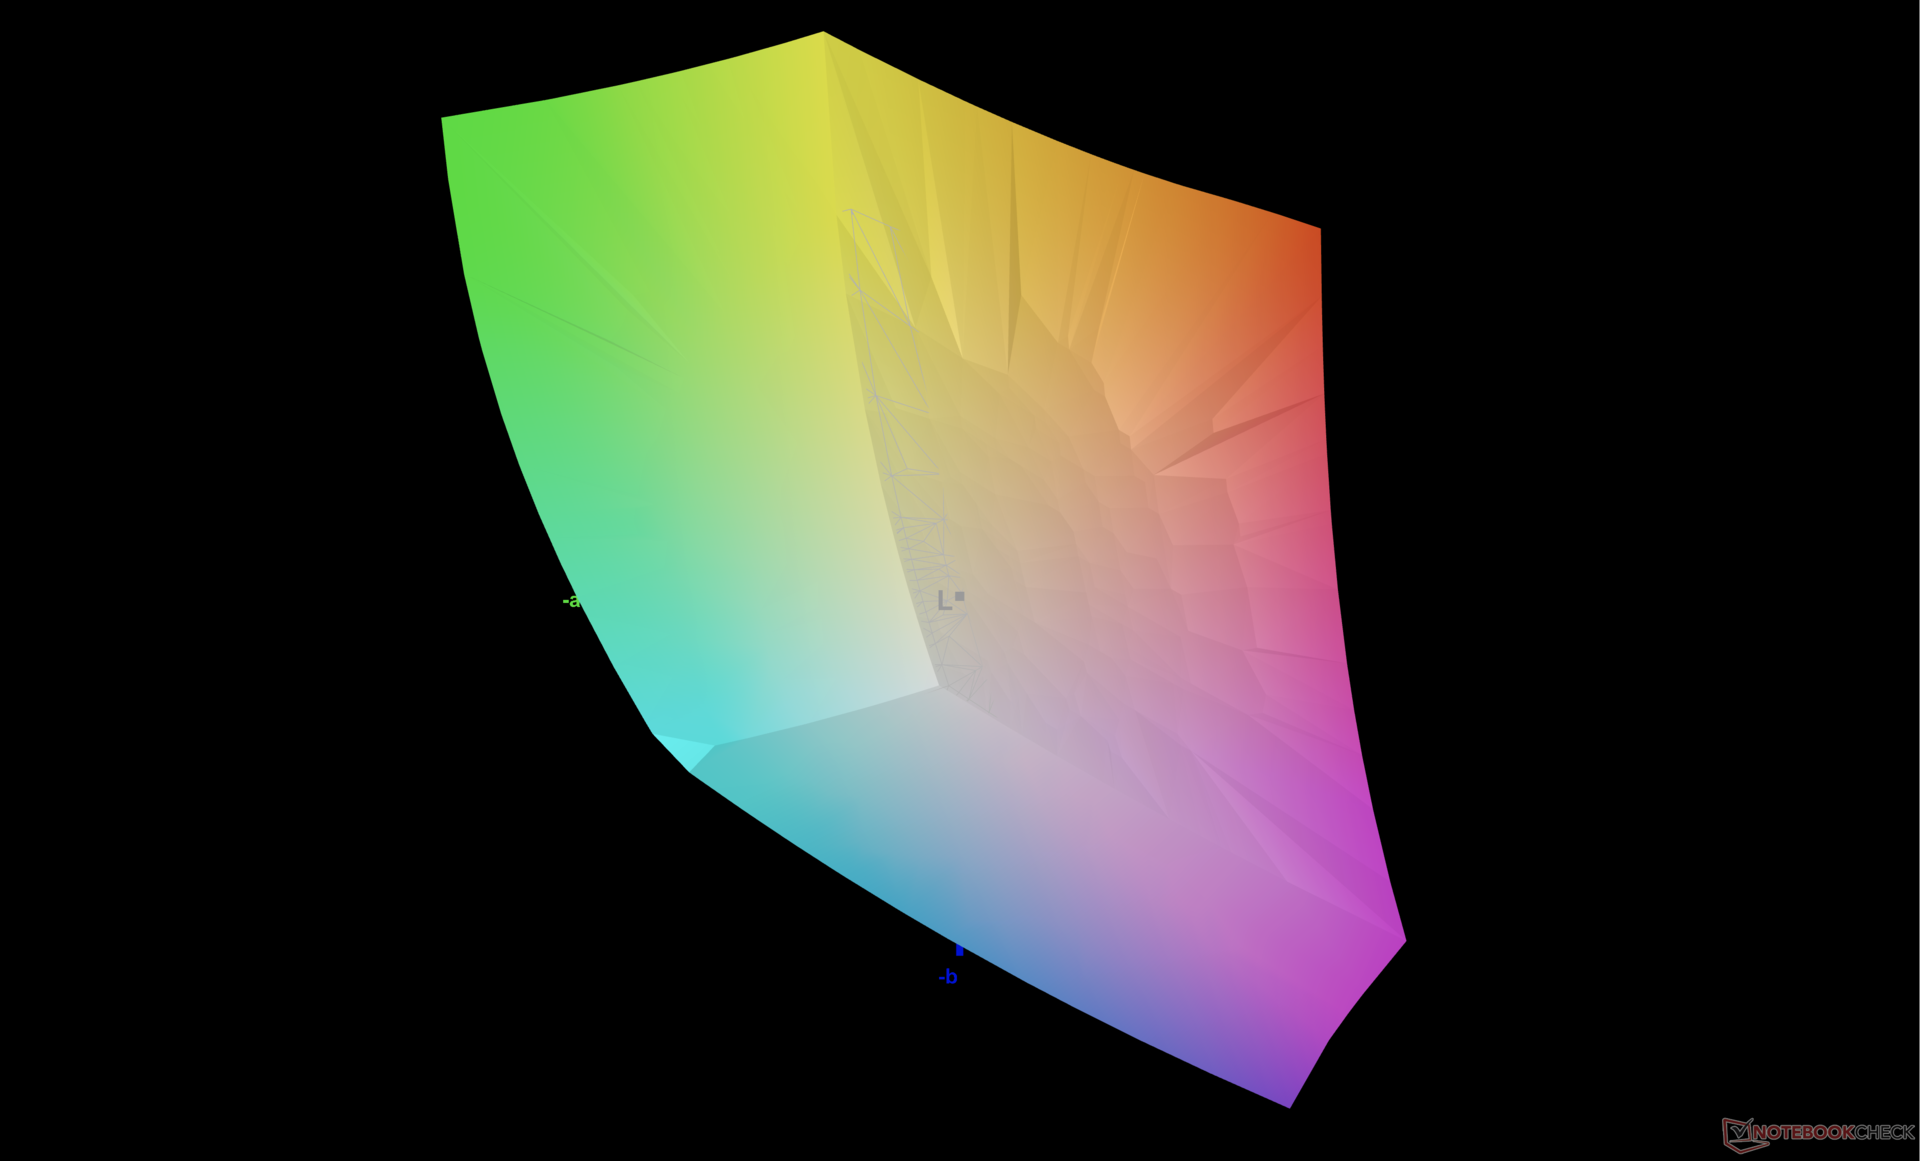
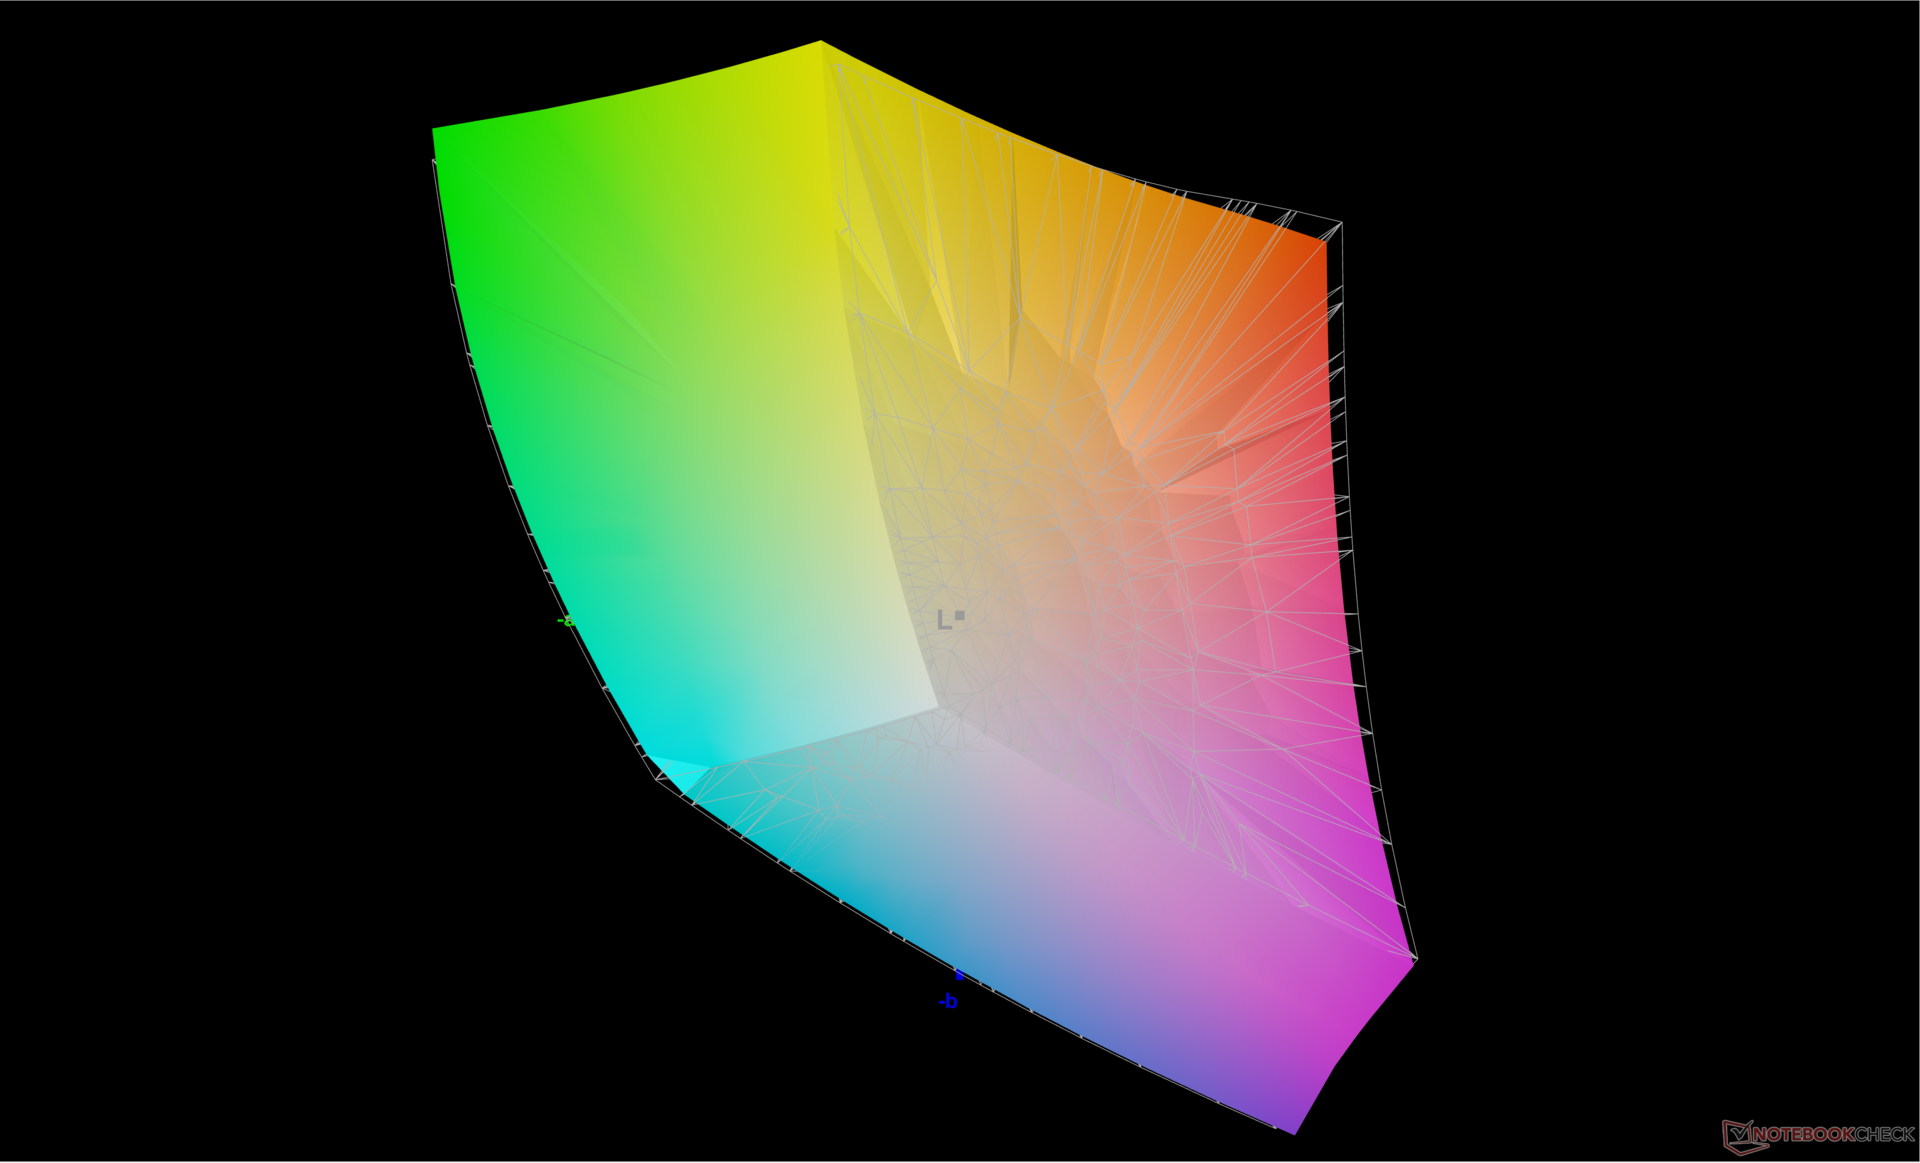
84.8% AdobeRGB 1998 (Argyll 3D)
99.9% sRGB (Argyll 3D)
96.6% Display P3 (Argyll 3D)
Gamma: 2.34
CCT: 7872 K
| MSI Raider 18 HX A14V AU Optronics B180ZAN1.0, Mini-LED, 3840x2400, 18", 120 Hz | Razer Blade 18 2024 RZ09-0509 BOE NE180QDM-NM1, Mini-LED, 2560x1600, 18", 300 Hz | Alienware m18 R2 BOE NE18NZ1, IPS, 2560x1600, 18", 165 Hz | MSI Titan 18 HX A14VIG AU Optronics B180ZAN01.0, Mini-LED, 3840x2400, 18", 120 Hz | Asus ROG Strix G18 G814JI NE180QDM-NZ2 (BOE0B35), IPS, 2560x1600, 18", 240 Hz | Acer Predator Helios 18 PH18-72-98MW B180QAN01.2 (AUO45A8), Mini-LED, 2560x1600, 18", 250 Hz | |
|---|---|---|---|---|---|---|
| Display | 1% | 2% | 1% | 1% | 4% | |
| Display P3 Coverage (%) | 96.6 | 99 2% | 97.8 1% | 98.1 2% | 98.1 2% | 99.7 3% |
| sRGB Coverage (%) | 99.9 | 100 0% | 99.5 0% | 99.8 0% | 99.9 0% | 100 0% |
| AdobeRGB 1998 Coverage (%) | 84.8 | 86.9 2% | 88.9 5% | 86.2 2% | 85.6 1% | 91.6 8% |
| Response Times | 55% | 68% | 5% | 67% | 50% | |
| Response Time Grey 50% / Grey 80% * (ms) | 10.4 ? | 7.6 ? 27% | 5.3 ? 49% | 8.6 ? 17% | 5.6 ? 46% | 8 ? 23% |
| Response Time Black / White * (ms) | 75.8 ? | 14 ? 82% | 10.4 ? 86% | 81.8 ? -8% | 9 ? 88% | 17.6 ? 77% |
| PWM Frequency (Hz) | 2606.2 ? | 26444 ? | 2592 ? | 4832 ? | ||
| PWM Amplitude * (%) | 90 | |||||
| Bildschirm | 29% | 8% | 2% | 23% | 24% | |
| Helligkeit Bildmitte (cd/m²) | 575.7 | 605.4 5% | 271.8 -53% | 467.5 -19% | 471 -18% | 722 25% |
| Brightness (cd/m²) | 574 | 600 5% | 275 -52% | 459 -20% | 422 -26% | 724 26% |
| Brightness Distribution (%) | 94 | 97 3% | 78 -17% | 90 -4% | 83 -12% | 93 -1% |
| Schwarzwert * (cd/m²) | 0.62 | 0.27 | 0.47 | 0.04 | ||
| Delta E Colorchecker * | 3.56 | 1.53 57% | 2.48 30% | 3.77 -6% | 2.05 42% | 3.4 4% |
| Colorchecker dE 2000 max. * | 8.64 | 4.15 52% | 5.59 35% | 6.12 29% | 4.15 52% | 5.32 38% |
| Colorchecker dE 2000 calibrated * | 2.69 | 0.56 79% | 2.94 -9% | 0.8 70% | 1.6 41% | |
| Delta E Graustufen * | 5.6 | 2.6 54% | 3.7 34% | 3.2 43% | 2.8 50% | 3.8 32% |
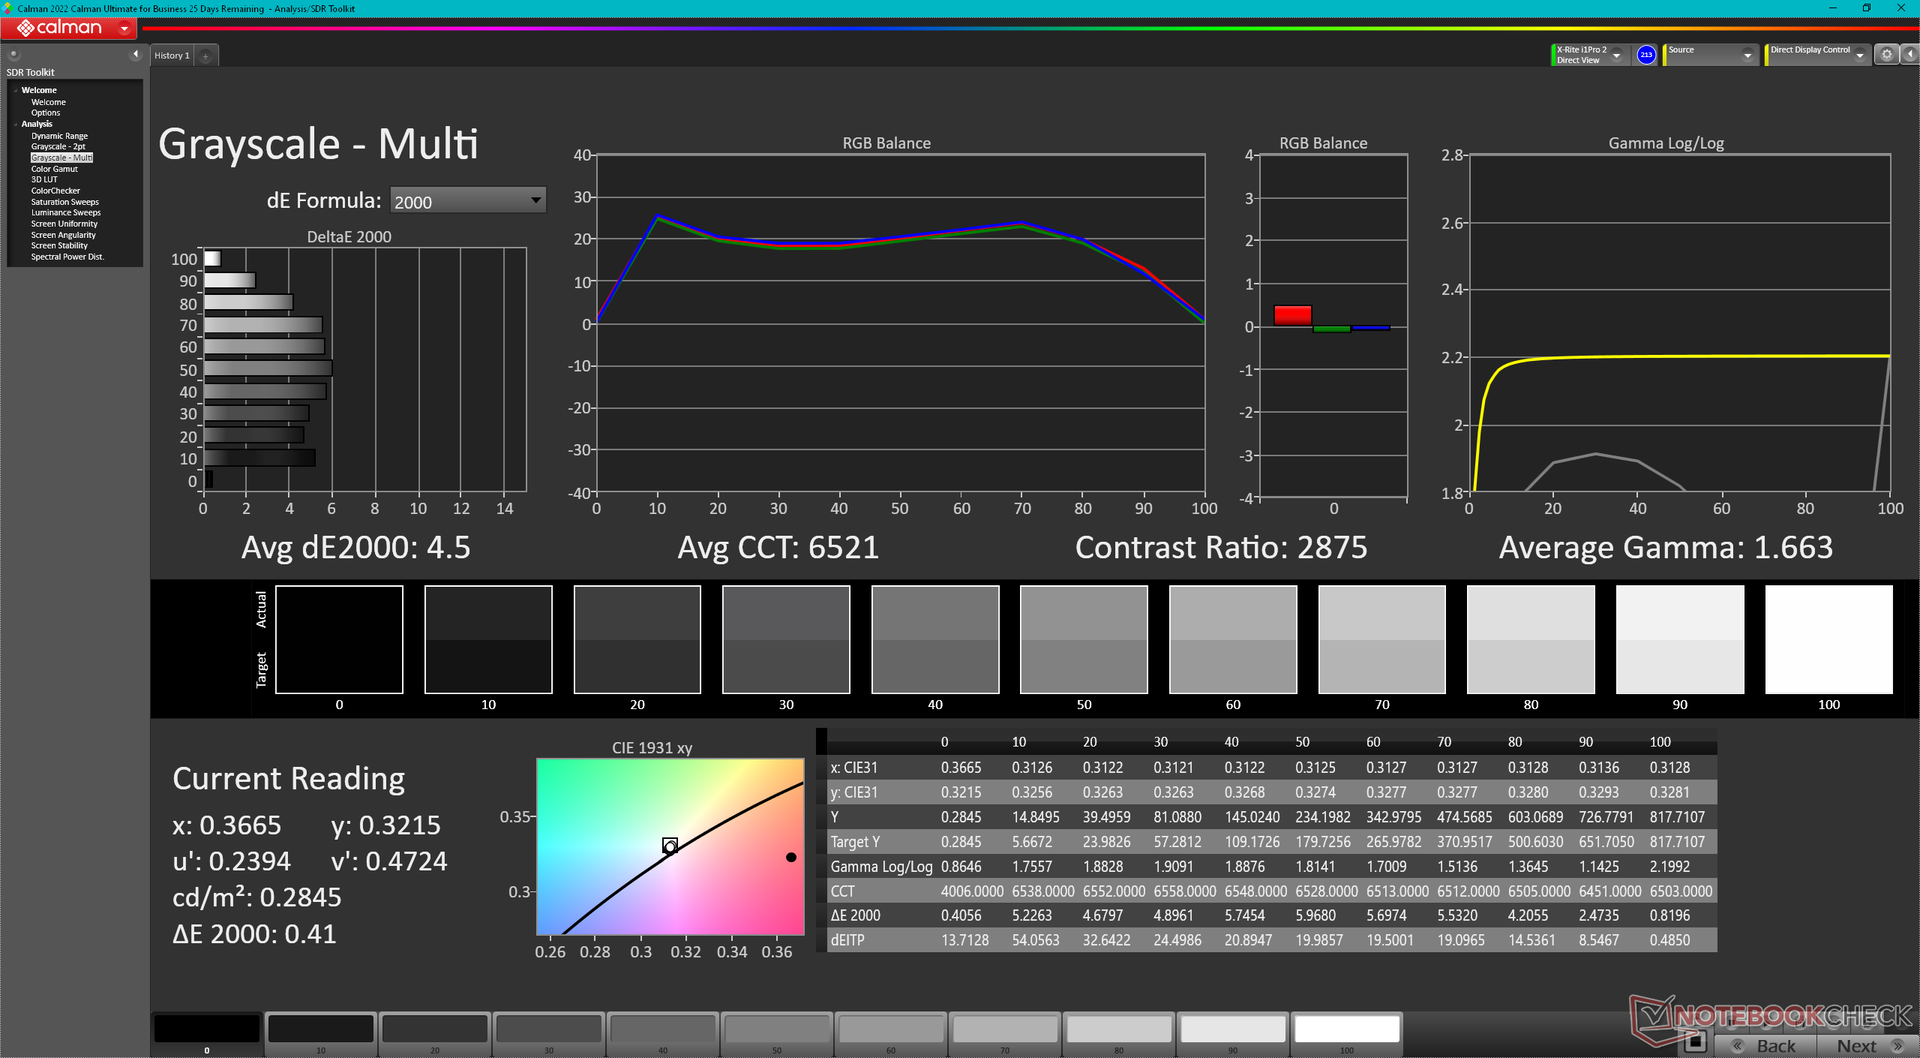
| Gamma | 2.34 94% | 2.22 99% | 2.2 100% | 2.43 91% | 2.204 100% | 2.383 92% |
| CCT | 7872 83% | 6843 95% | 6355 102% | 6478 100% | 7122 91% | 7051 92% |
| Kontrast (:1) | 976 | 1007 | 1002 | 18050 | ||
| Durchschnitt gesamt (Programm / Settings) | 28% /
26% | 26% /
16% | 3% /
2% | 30% /
25% | 26% /
23% |
* ... kleinere Werte sind besser
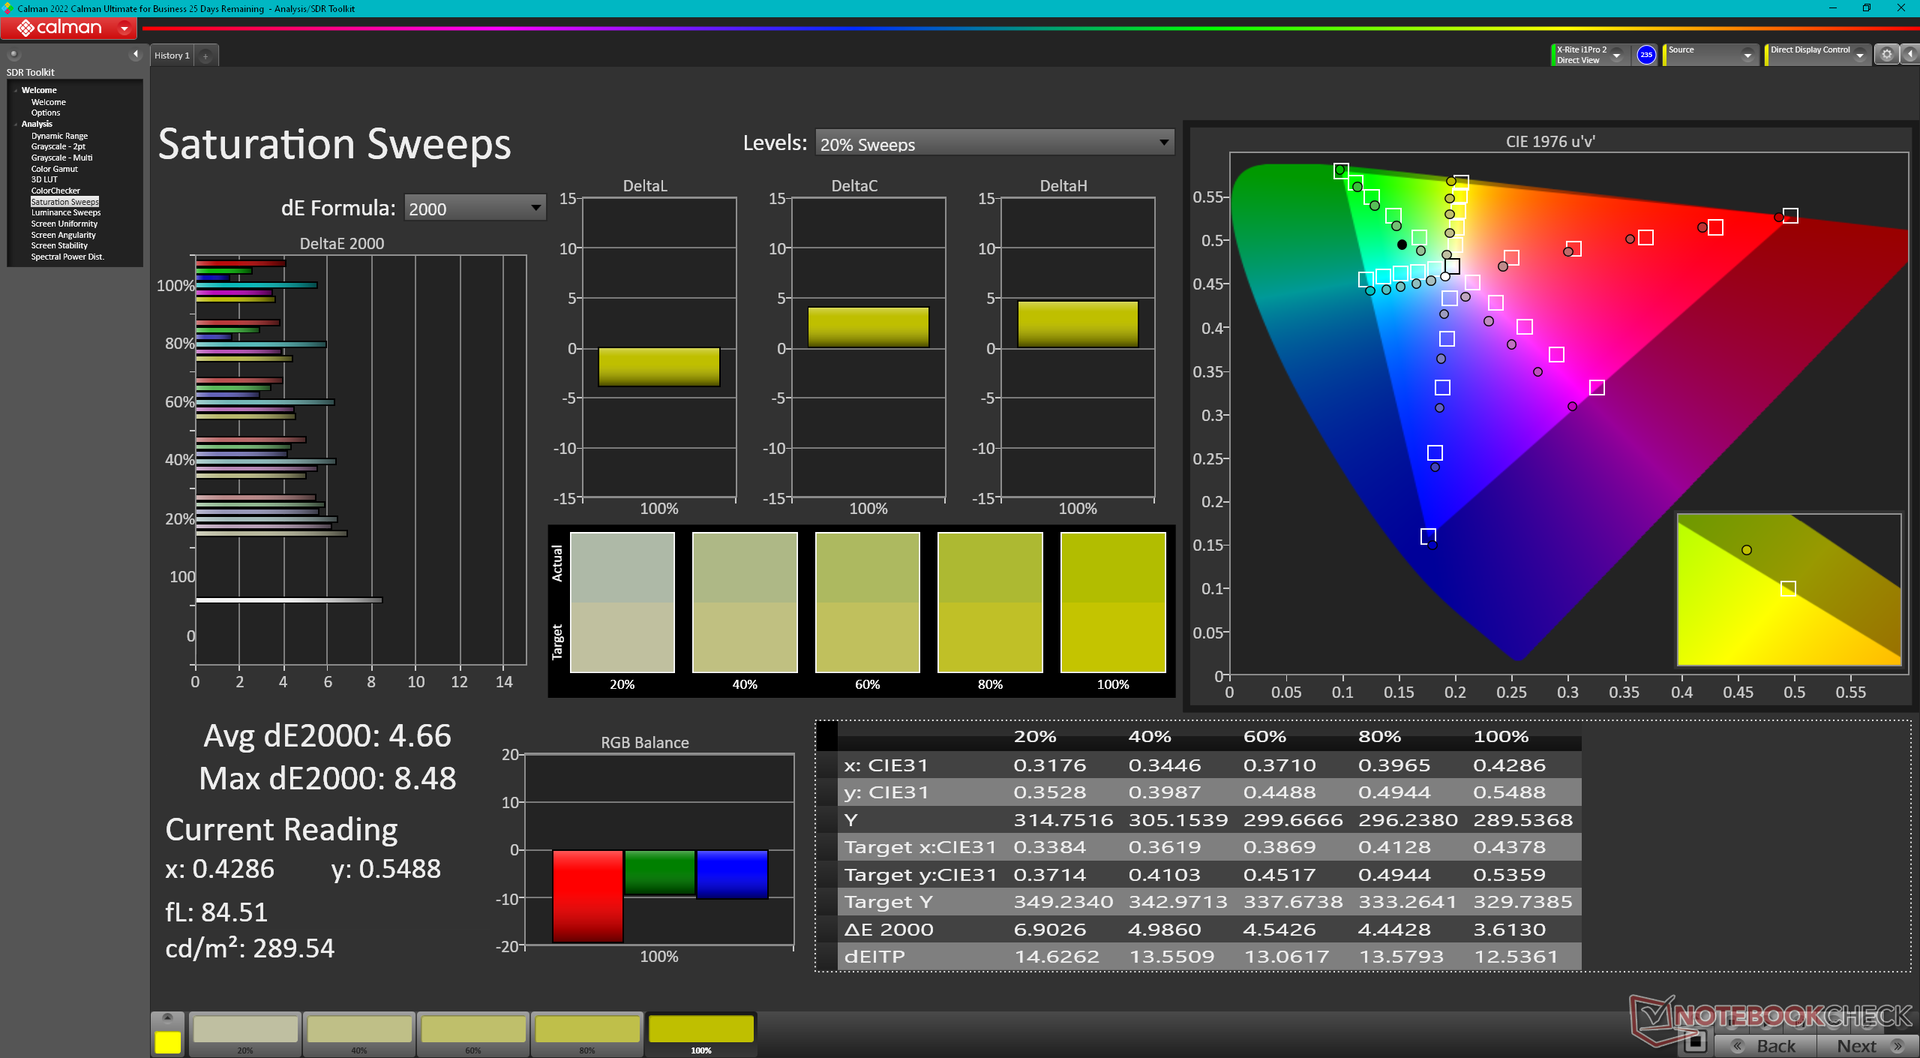
Die Farbtemperatur des Displays im P3-Farbraum beträgt bei deaktiviertem HDR, 7872 und wirkt daher recht kühl. Mit aktivem HDR werden automatisch alle MSI TrueColor-Einstellungen deaktiviert, und die Farbtemperatur wird auf 6521 angepasst, was zu einer wärmeren und genaueren Farbdarstellung führt. MSI gibt für dieses Raider-Modell keine Werkskalibrierung an.
Reaktionszeiten (Response Times) des Displays
| ↔ Reaktionszeiten Schwarz zu Weiß | ||
|---|---|---|
| 75.8 ms ... steigend ↗ und fallend ↘ kombiniert | ↗ 71 ms steigend | 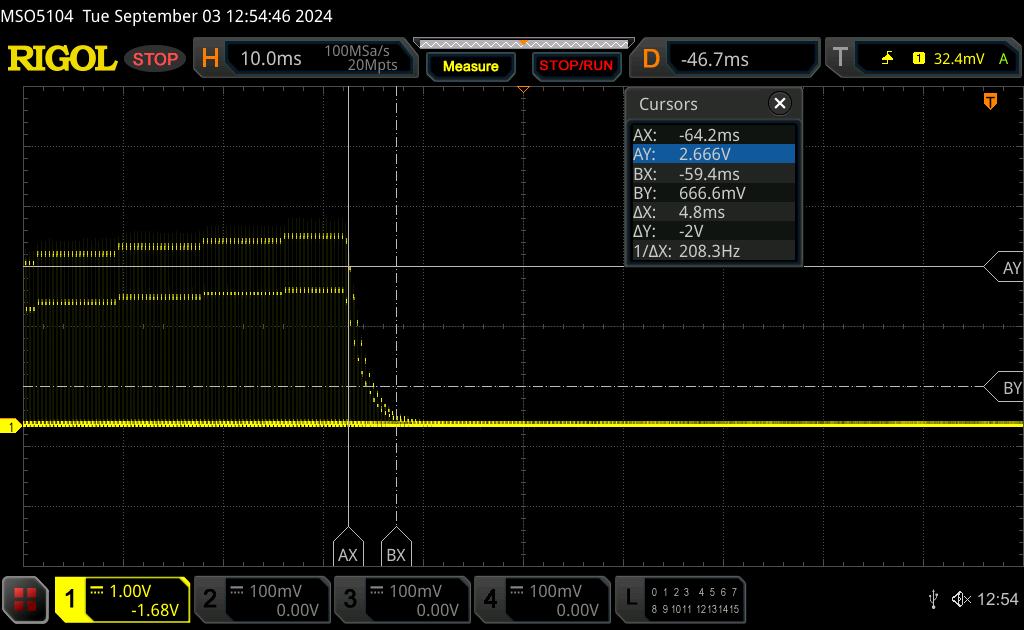 |
| ↘ 4.8 ms fallend | ||
| Die gemessenen Reaktionszeiten sind langsam und dadurch für viele Spieler wahrscheinlich zu langsam. Im Vergleich rangierten die bei uns getesteten Geräte von 0.1 (Minimum) zu 240 (Maximum) ms. » 100 % aller Screens waren schneller als der getestete. Daher sind die gemessenen Reaktionszeiten schlechter als der Durchschnitt aller vermessenen Geräte (20.2 ms). | ||
| ↔ Reaktionszeiten 50% Grau zu 80% Grau | ||
| 10.4 ms ... steigend ↗ und fallend ↘ kombiniert | ↗ 4.8 ms steigend | 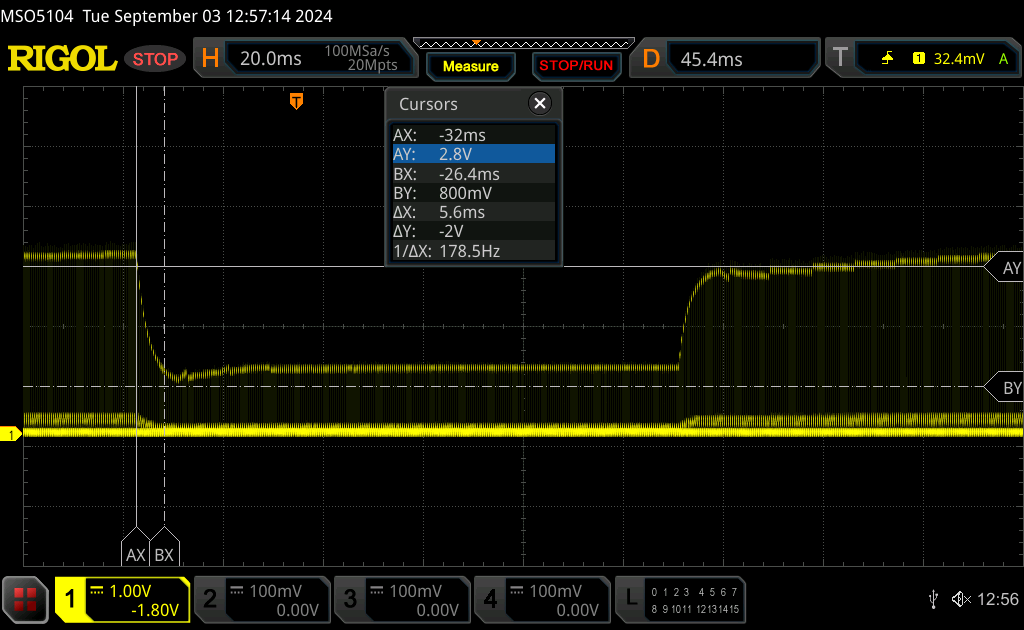 |
| ↘ 5.6 ms fallend | ||
| Die gemessenen Reaktionszeiten sind gut, für anspruchsvolle Spieler könnten der Bildschirm jedoch zu langsam sein. Im Vergleich rangierten die bei uns getesteten Geräte von 0.165 (Minimum) zu 636 (Maximum) ms. » 23 % aller Screens waren schneller als der getestete. Daher sind die gemessenen Reaktionszeiten besser als der Durchschnitt aller vermessenen Geräte (31.6 ms). | ||
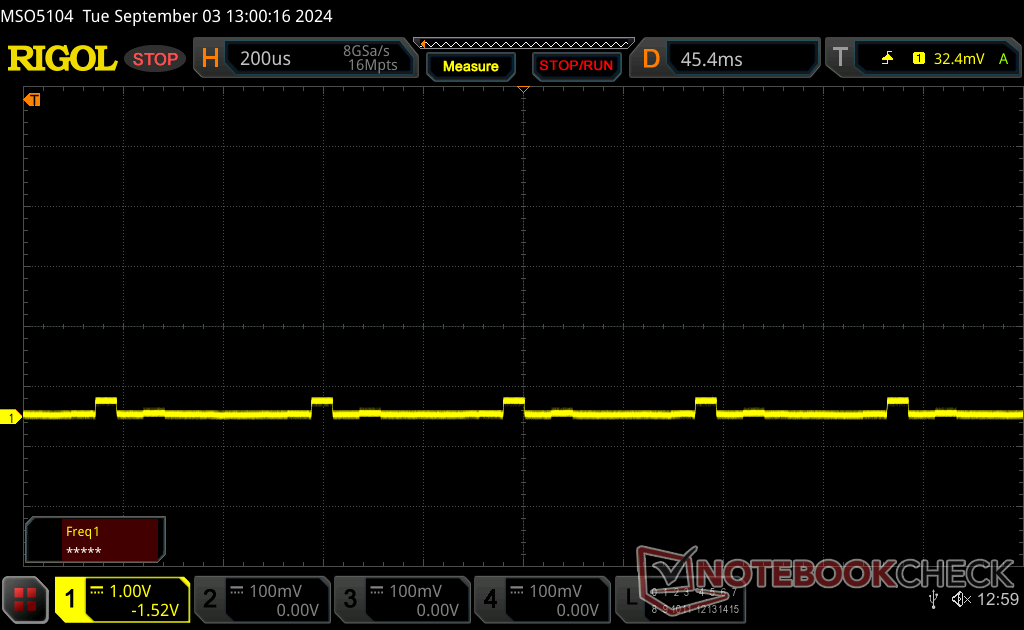
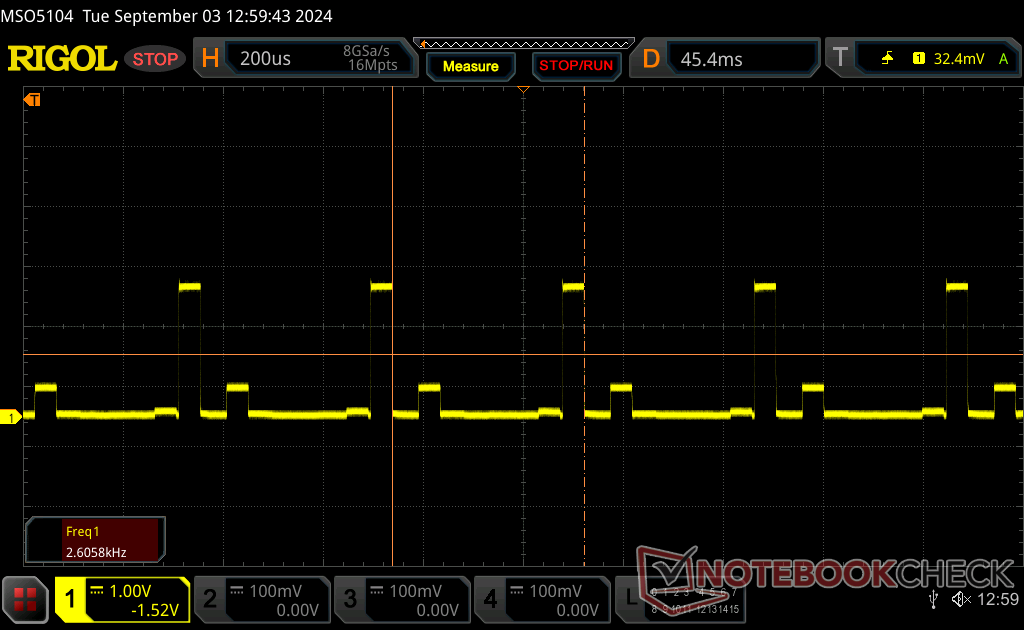
Bildschirm-Flackern / PWM (Pulse-Width Modulation)
| Flackern / PWM festgestellt | 2606.2 Hz Amplitude: 90 % | ≤ 100 % Helligkeit | 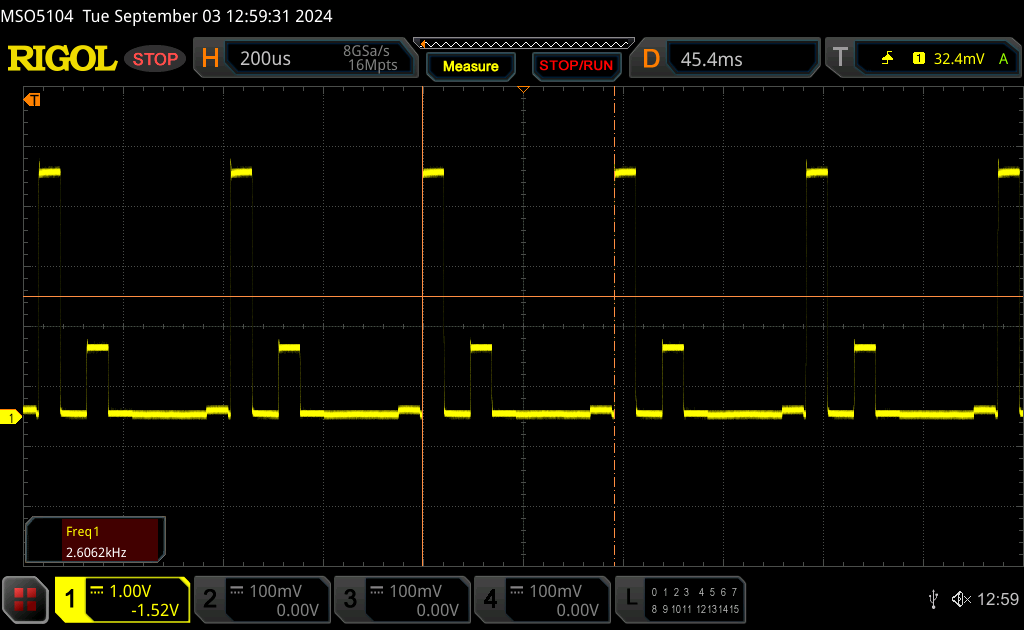 |
Das Display flackert mit 2606.2 Hz (im schlimmsten Fall, eventuell durch Pulsweitenmodulation PWM) bei einer eingestellten Helligkeit von 100 % und darunter. Darüber sollte es zu keinem Flackern kommen. Die Frequenz von 2606.2 Hz ist sehr hoch und sollte daher auch bei empfindlichen Personen zu keinen Problemen führen. Im Vergleich: 53 % aller getesteten Geräte nutzten kein PWM um die Helligkeit zu reduzieren. Wenn PWM eingesetzt wurde, dann bei einer Frequenz von durchschnittlich 8091 (Minimum 5, Maximum 343500) Hz. | |||


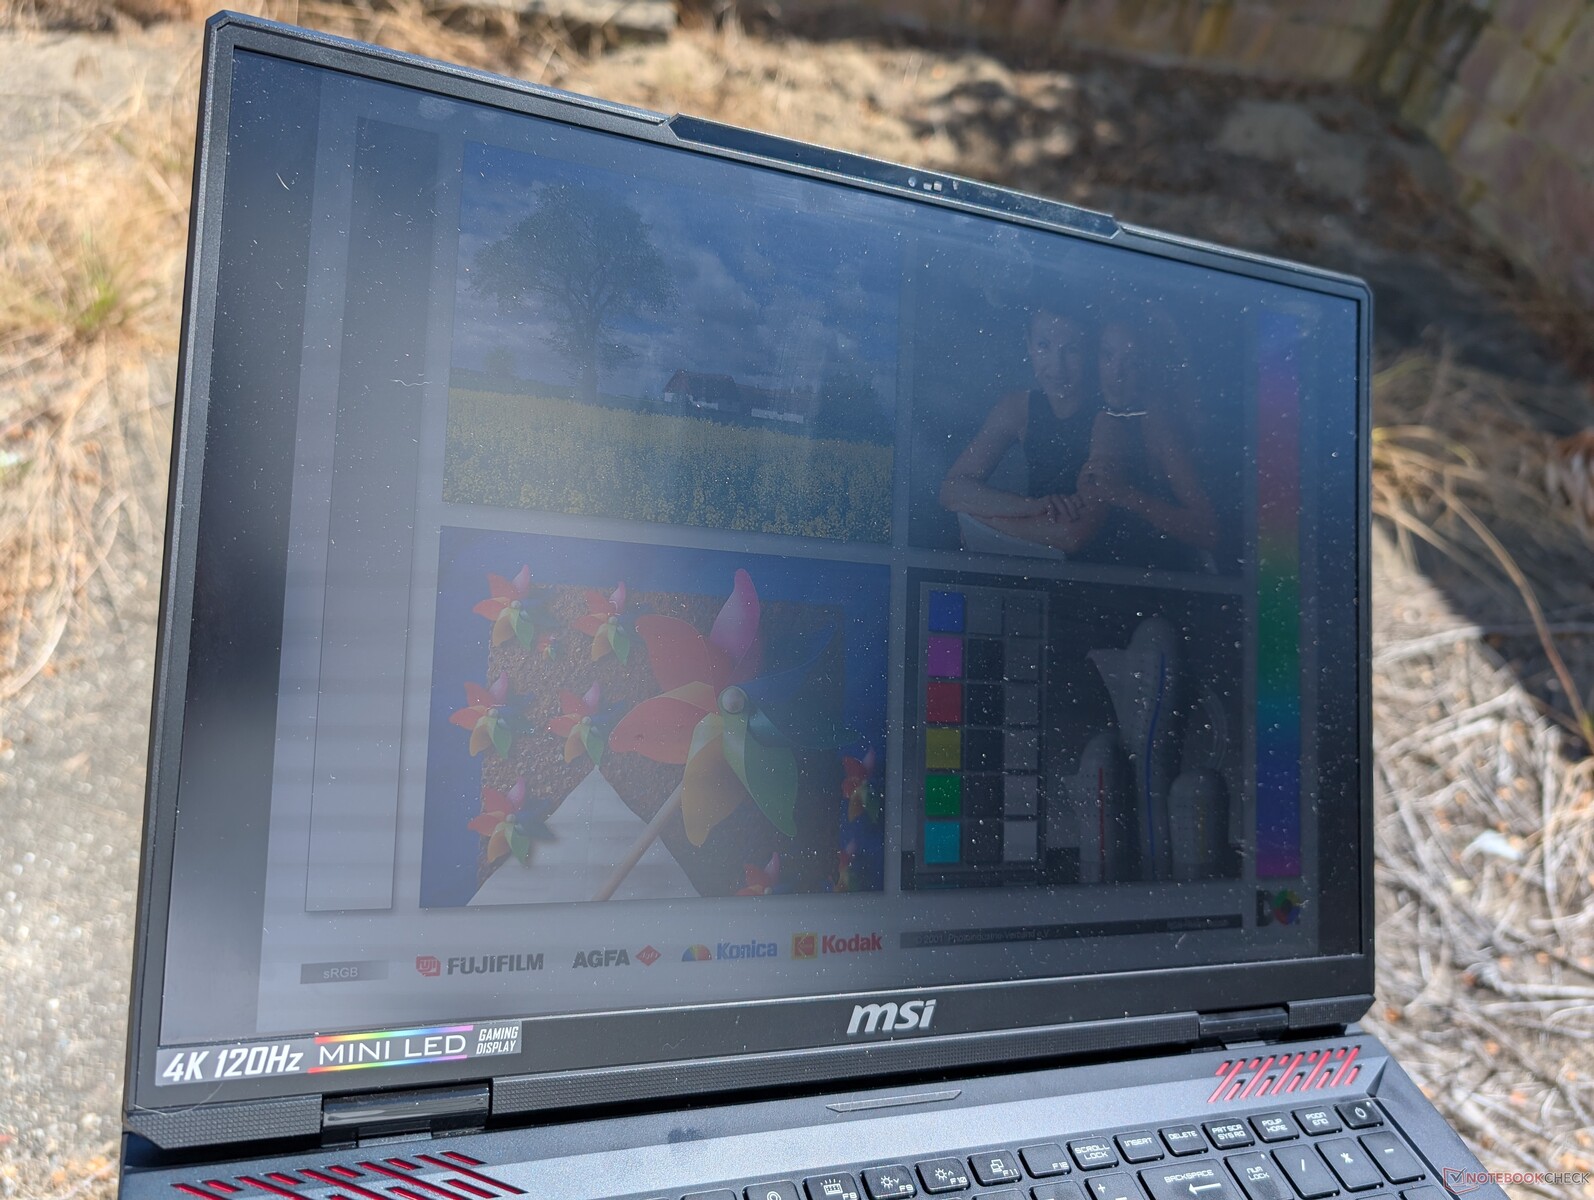
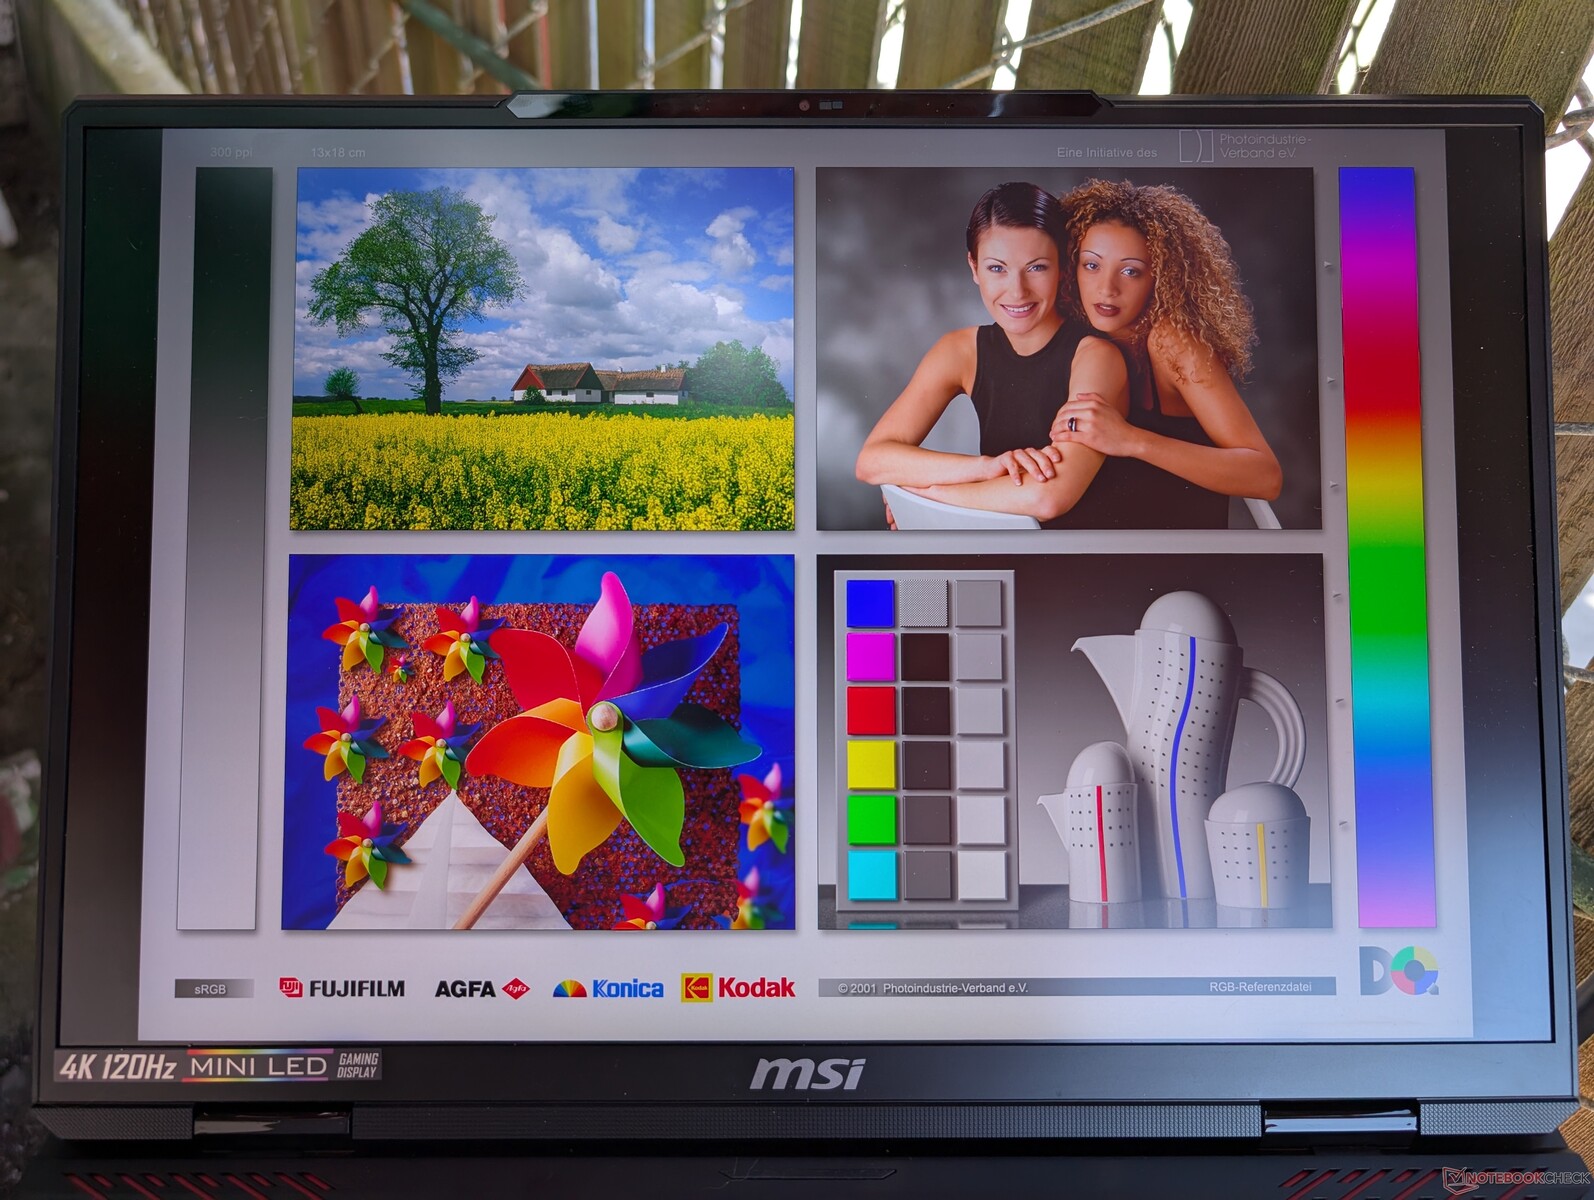
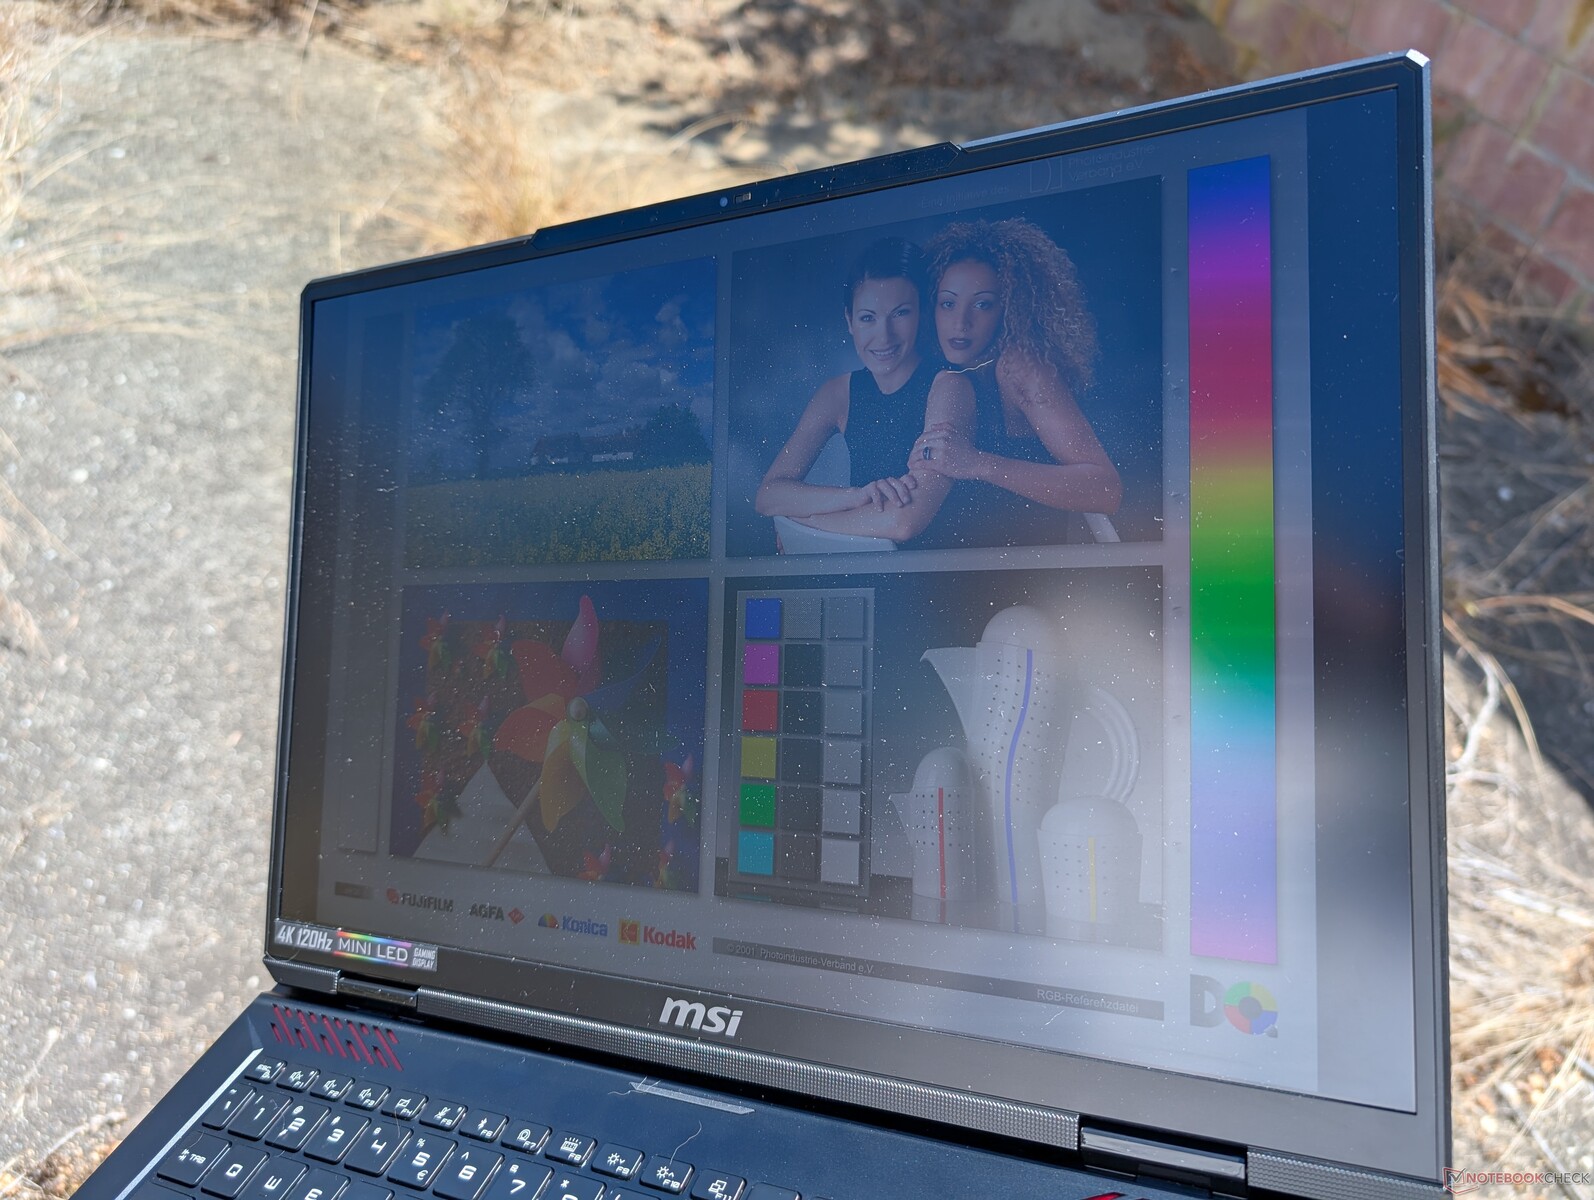
Die Sichtbarkeit im Freien ist nur im Schatten akzeptabel und bei direkter Sonneneinstrahlung eher eingeschränkt. Im Akkubetrieb reduziert sich die maximale Helligkeit auf nur 392 cd/m², und Windows HDR wird automatisch deaktiviert.
Performance — Neuer CPU-Name, gleiche CPU-Leistung
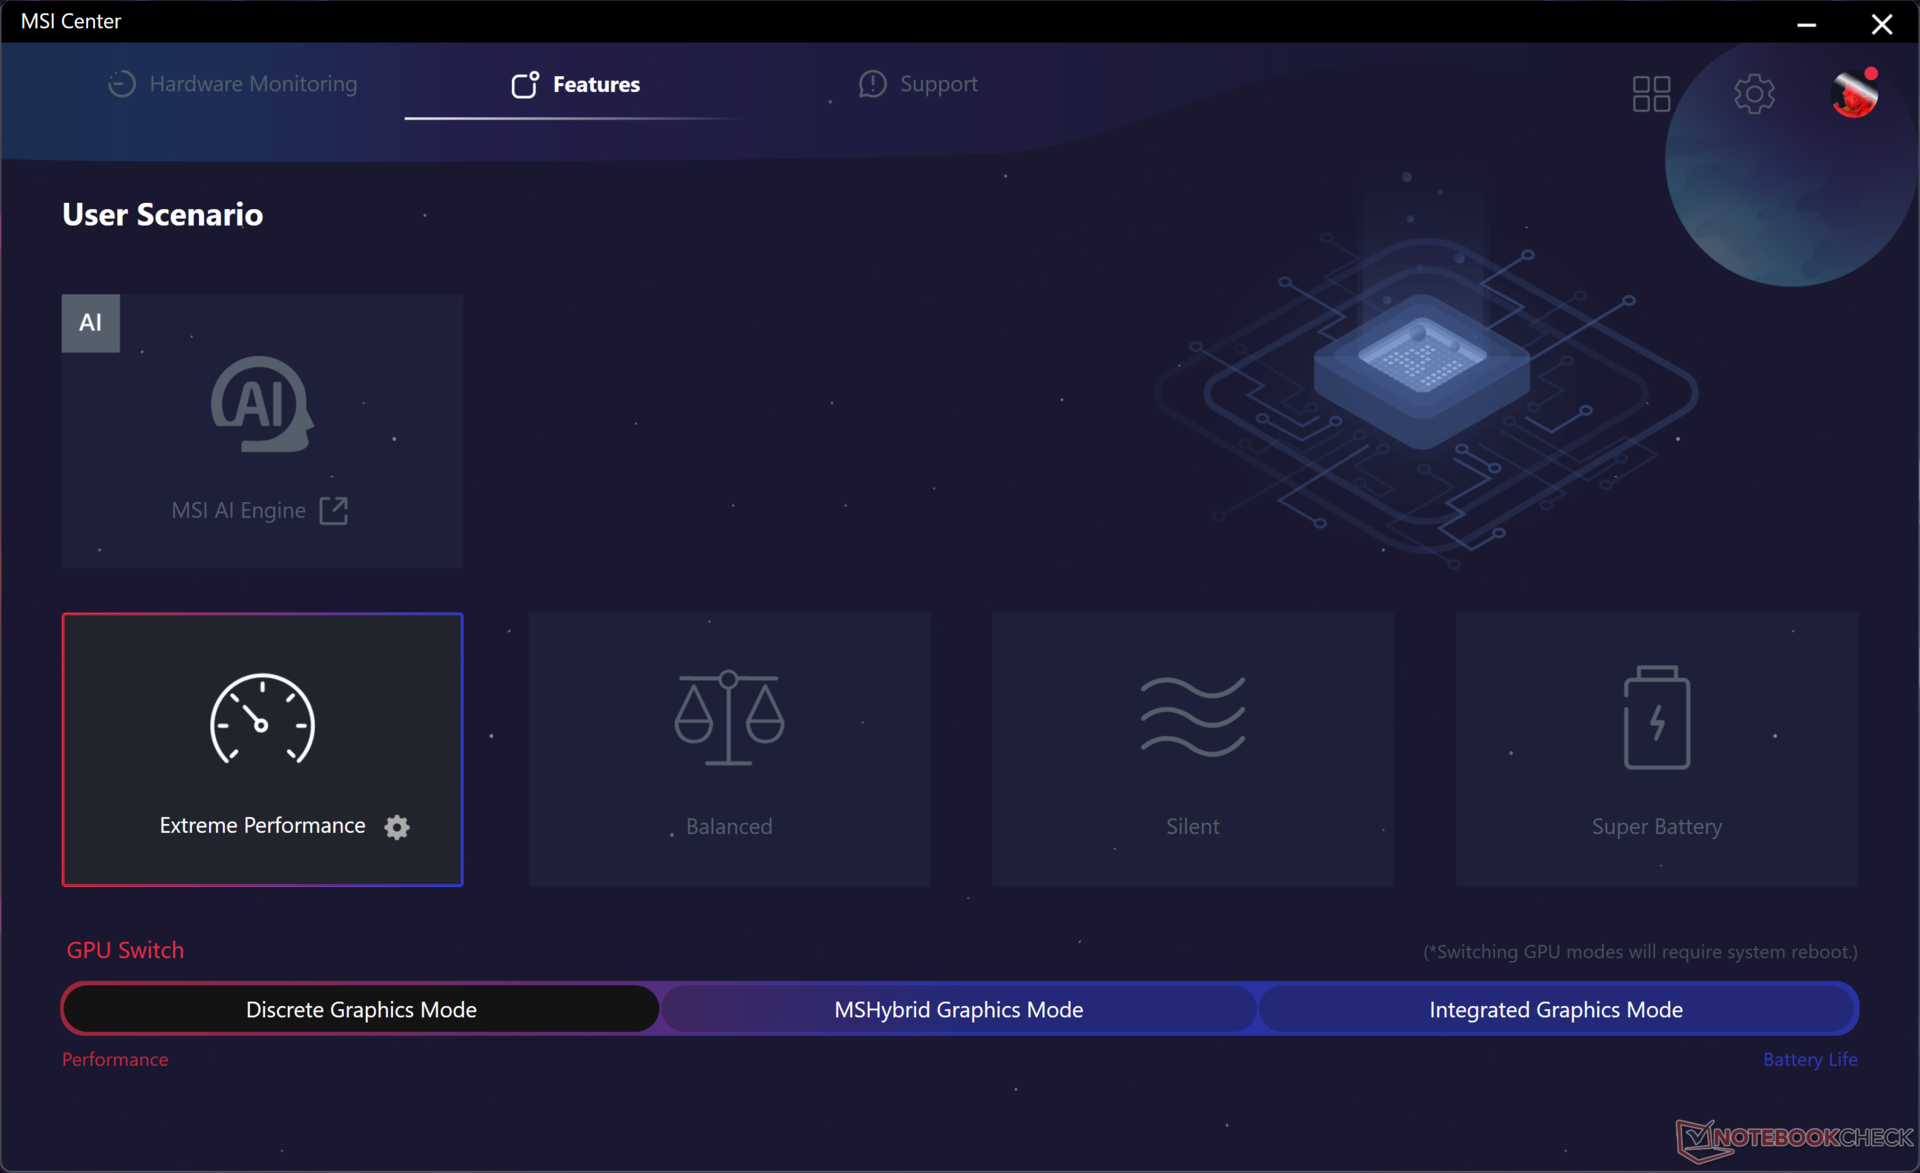
Testbedingungen
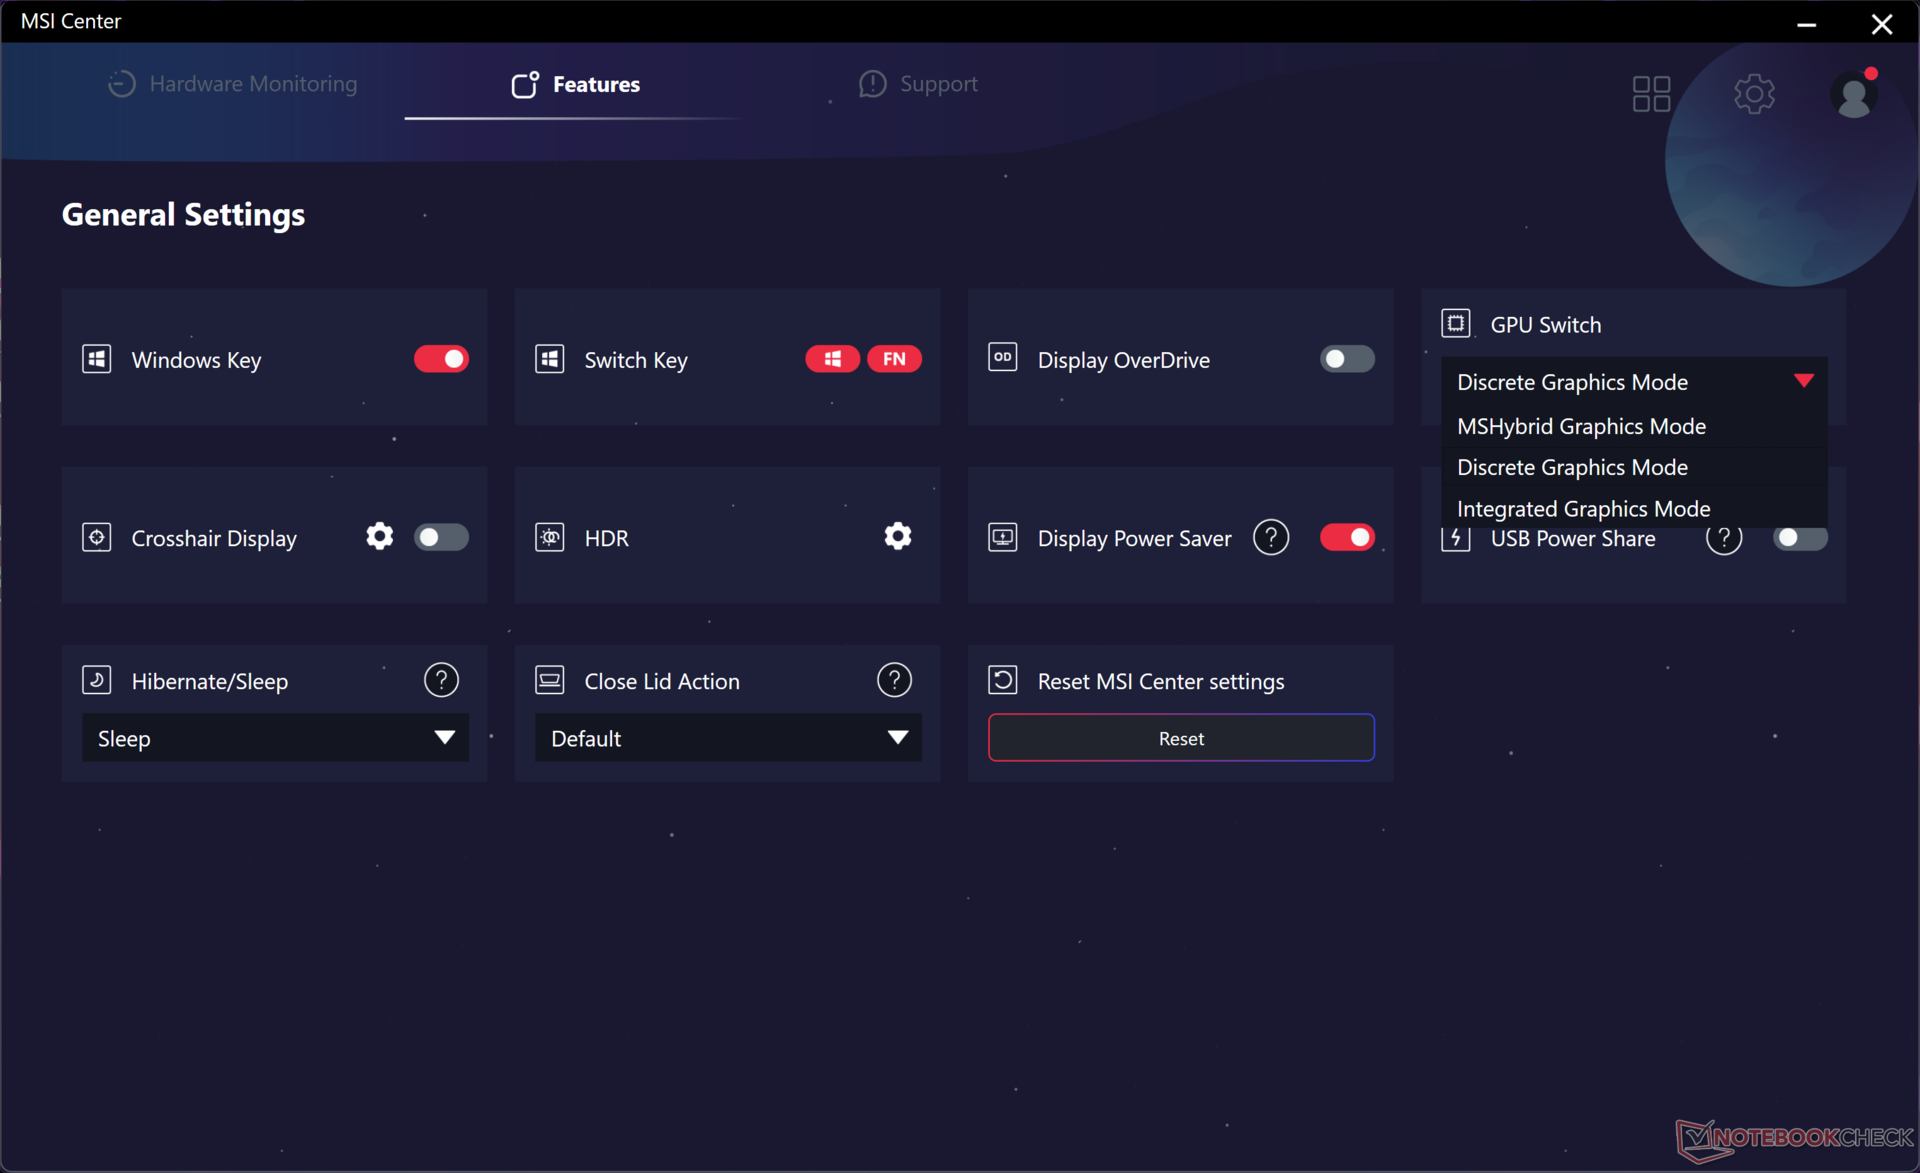
Wir haben die GPU auf den diskreten Grafikmodus, Windows auf den Performance-Modus und das MSI Center auf den Extreme-Performance-Modus eingestellt, bevor wir die folgenden Benchmarks durchgeführt haben. Der Cooler-Boost-Modus (d. h. maximaler Lüftermodus) ist eine zusätzliche Einstellung innerhalb des Extreme-Performance-Modus, aber unsere Ergebnisse zeigen, dass diese Option für die maximale Leistung im Allgemeinen nicht erforderlich ist. Dies entspricht unseren Erfahrungen mit anderen MSI-Notebooks, die über dieselbe Cooler-Boost-Funktion verfügen.
Der MUX-Switch unterstützt den Wechsel zwischen dGPU-, iGPU- und MSHybrid-Modi, jedoch nicht Advanced Optimus wie beim Titan 18 HX. Ein wesentlicher Nachteil des 4K-Mini-LED-Panels ist die fehlende G-Sync-Unterstützung.
Prozessor
Der Core i9-14900HX stellt im Wesentlichen ein Rebranding des Core i9-13900HX dar und bietet daher nur marginale Leistungssteigerungen. Dennoch gehört er weiterhin zu den schnellsten CPUs auf dem Markt, insbesondere bei traditionellen Leistungskennzahlen wie CineBench oder Blender-Rendering. Diese CPU wird ergänzt durch den Meteor Lake Core Ultra 9 185H, der etwas Rohleistung gegen eine integrierte NPU zur Beschleunigung von KI-Aufgaben eintauscht.
Die Leistung bleibt unter Last ausgezeichnet, ohne signifikante Taktraten-Einbrüche, im Gegensatz zum Acer Predator Helios 18 , das ebenfalls mit dem Core i9-14900HX ausgestattet ist.
Der Wechsel zur AMD Ryzen 9 7945HX-Konfiguration könnte die Multi-Thread-Leistung um etwa 10 bis 15 Prozent steigern, während die Single-Thread-Leistung um 10 bis 15 Prozent sinken könnte.
Cinebench R15 Multi Dauertest
Cinebench R23: Multi Core | Single Core
Cinebench R20: CPU (Multi Core) | CPU (Single Core)
Cinebench R15: CPU Multi 64Bit | CPU Single 64Bit
Blender: v2.79 BMW27 CPU
7-Zip 18.03: 7z b 4 | 7z b 4 -mmt1
Geekbench 6.5: Multi-Core | Single-Core
Geekbench 5.5: Multi-Core | Single-Core
HWBOT x265 Benchmark v2.2: 4k Preset
LibreOffice : 20 Documents To PDF
R Benchmark 2.5: Overall mean
| Geekbench 6.5 / Multi-Core | |
| Alienware m18 R2 | |
| Acer Predator Helios 18 N23Q2 | |
| MSI Raider GE68HX 13VF | |
| Durchschnittliche Intel Core i9-14900HX (13158 - 19665, n=37) | |
| MSI Raider 18 HX A14V | |
| MSI Titan 18 HX A14VIG | |
| Alienware m18 R1 AMD | |
| Asus ROG Zephyrus G16 GA605WV | |
| Lenovo Legion Slim 7 16APH8 | |
| Alienware x16 R2 P120F | |
| Asus TUF Gaming A15 FA507UV | |
| Alienware m16 R1 AMD | |
| Geekbench 6.5 / Single-Core | |
| Alienware m18 R2 | |
| MSI Raider 18 HX A14V | |
| Durchschnittliche Intel Core i9-14900HX (2419 - 3129, n=37) | |
| Acer Predator Helios 18 N23Q2 | |
| MSI Raider GE68HX 13VF | |
| Alienware m18 R1 AMD | |
| Asus ROG Zephyrus G16 GA605WV | |
| MSI Titan 18 HX A14VIG | |
| Alienware m16 R1 AMD | |
| Asus TUF Gaming A15 FA507UV | |
| Lenovo Legion Slim 7 16APH8 | |
| Alienware x16 R2 P120F | |
Cinebench R23: Multi Core | Single Core
Cinebench R20: CPU (Multi Core) | CPU (Single Core)
Cinebench R15: CPU Multi 64Bit | CPU Single 64Bit
Blender: v2.79 BMW27 CPU
7-Zip 18.03: 7z b 4 | 7z b 4 -mmt1
Geekbench 6.5: Multi-Core | Single-Core
Geekbench 5.5: Multi-Core | Single-Core
HWBOT x265 Benchmark v2.2: 4k Preset
LibreOffice : 20 Documents To PDF
R Benchmark 2.5: Overall mean
* ... kleinere Werte sind besser
AIDA64: FP32 Ray-Trace | FPU Julia | CPU SHA3 | CPU Queen | FPU SinJulia | FPU Mandel | CPU AES | CPU ZLib | FP64 Ray-Trace | CPU PhotoWorxx
| Performance Rating | |
| Alienware m18 R2 | |
| MSI Titan 18 HX A14VIG | |
| MSI Raider 18 HX A14V | |
| Durchschnittliche Intel Core i9-14900HX | |
| Razer Blade 18 2024 RZ09-0509 | |
| Acer Predator Helios 18 PH18-72-98MW | |
| Asus ROG Strix G18 G814JI | |
| AIDA64 / FP32 Ray-Trace | |
| MSI Titan 18 HX A14VIG | |
| Alienware m18 R2 | |
| MSI Raider 18 HX A14V | |
| Razer Blade 18 2024 RZ09-0509 | |
| Durchschnittliche Intel Core i9-14900HX (13098 - 33474, n=36) | |
| Acer Predator Helios 18 PH18-72-98MW | |
| Asus ROG Strix G18 G814JI | |
| AIDA64 / FPU Julia | |
| MSI Titan 18 HX A14VIG | |
| Alienware m18 R2 | |
| MSI Raider 18 HX A14V | |
| Razer Blade 18 2024 RZ09-0509 | |
| Durchschnittliche Intel Core i9-14900HX (67573 - 166040, n=36) | |
| Acer Predator Helios 18 PH18-72-98MW | |
| Asus ROG Strix G18 G814JI | |
| AIDA64 / CPU SHA3 | |
| MSI Titan 18 HX A14VIG | |
| Alienware m18 R2 | |
| MSI Raider 18 HX A14V | |
| Razer Blade 18 2024 RZ09-0509 | |
| Durchschnittliche Intel Core i9-14900HX (3589 - 7979, n=36) | |
| Acer Predator Helios 18 PH18-72-98MW | |
| Asus ROG Strix G18 G814JI | |
| AIDA64 / CPU Queen | |
| MSI Titan 18 HX A14VIG | |
| MSI Raider 18 HX A14V | |
| Alienware m18 R2 | |
| Acer Predator Helios 18 PH18-72-98MW | |
| Durchschnittliche Intel Core i9-14900HX (118405 - 148966, n=36) | |
| Razer Blade 18 2024 RZ09-0509 | |
| Asus ROG Strix G18 G814JI | |
| AIDA64 / FPU SinJulia | |
| MSI Titan 18 HX A14VIG | |
| MSI Raider 18 HX A14V | |
| Alienware m18 R2 | |
| Razer Blade 18 2024 RZ09-0509 | |
| Durchschnittliche Intel Core i9-14900HX (10475 - 18517, n=36) | |
| Acer Predator Helios 18 PH18-72-98MW | |
| Asus ROG Strix G18 G814JI | |
| AIDA64 / FPU Mandel | |
| Alienware m18 R2 | |
| MSI Titan 18 HX A14VIG | |
| MSI Raider 18 HX A14V | |
| Razer Blade 18 2024 RZ09-0509 | |
| Durchschnittliche Intel Core i9-14900HX (32543 - 83662, n=36) | |
| Acer Predator Helios 18 PH18-72-98MW | |
| Asus ROG Strix G18 G814JI | |
| AIDA64 / CPU AES | |
| Durchschnittliche Intel Core i9-14900HX (86964 - 241777, n=36) | |
| MSI Titan 18 HX A14VIG | |
| Alienware m18 R2 | |
| MSI Raider 18 HX A14V | |
| Razer Blade 18 2024 RZ09-0509 | |
| Acer Predator Helios 18 PH18-72-98MW | |
| Asus ROG Strix G18 G814JI | |
| AIDA64 / CPU ZLib | |
| MSI Titan 18 HX A14VIG | |
| Alienware m18 R2 | |
| MSI Raider 18 HX A14V | |
| Razer Blade 18 2024 RZ09-0509 | |
| Durchschnittliche Intel Core i9-14900HX (1054 - 2292, n=36) | |
| Acer Predator Helios 18 PH18-72-98MW | |
| Asus ROG Strix G18 G814JI | |
| AIDA64 / FP64 Ray-Trace | |
| Alienware m18 R2 | |
| MSI Titan 18 HX A14VIG | |
| MSI Raider 18 HX A14V | |
| Razer Blade 18 2024 RZ09-0509 | |
| Durchschnittliche Intel Core i9-14900HX (6809 - 18349, n=36) | |
| Acer Predator Helios 18 PH18-72-98MW | |
| Asus ROG Strix G18 G814JI | |
| AIDA64 / CPU PhotoWorxx | |
| Alienware m18 R2 | |
| Razer Blade 18 2024 RZ09-0509 | |
| Acer Predator Helios 18 PH18-72-98MW | |
| Durchschnittliche Intel Core i9-14900HX (23903 - 54702, n=36) | |
| Asus ROG Strix G18 G814JI | |
| MSI Raider 18 HX A14V | |
| MSI Titan 18 HX A14VIG | |
Stresstest
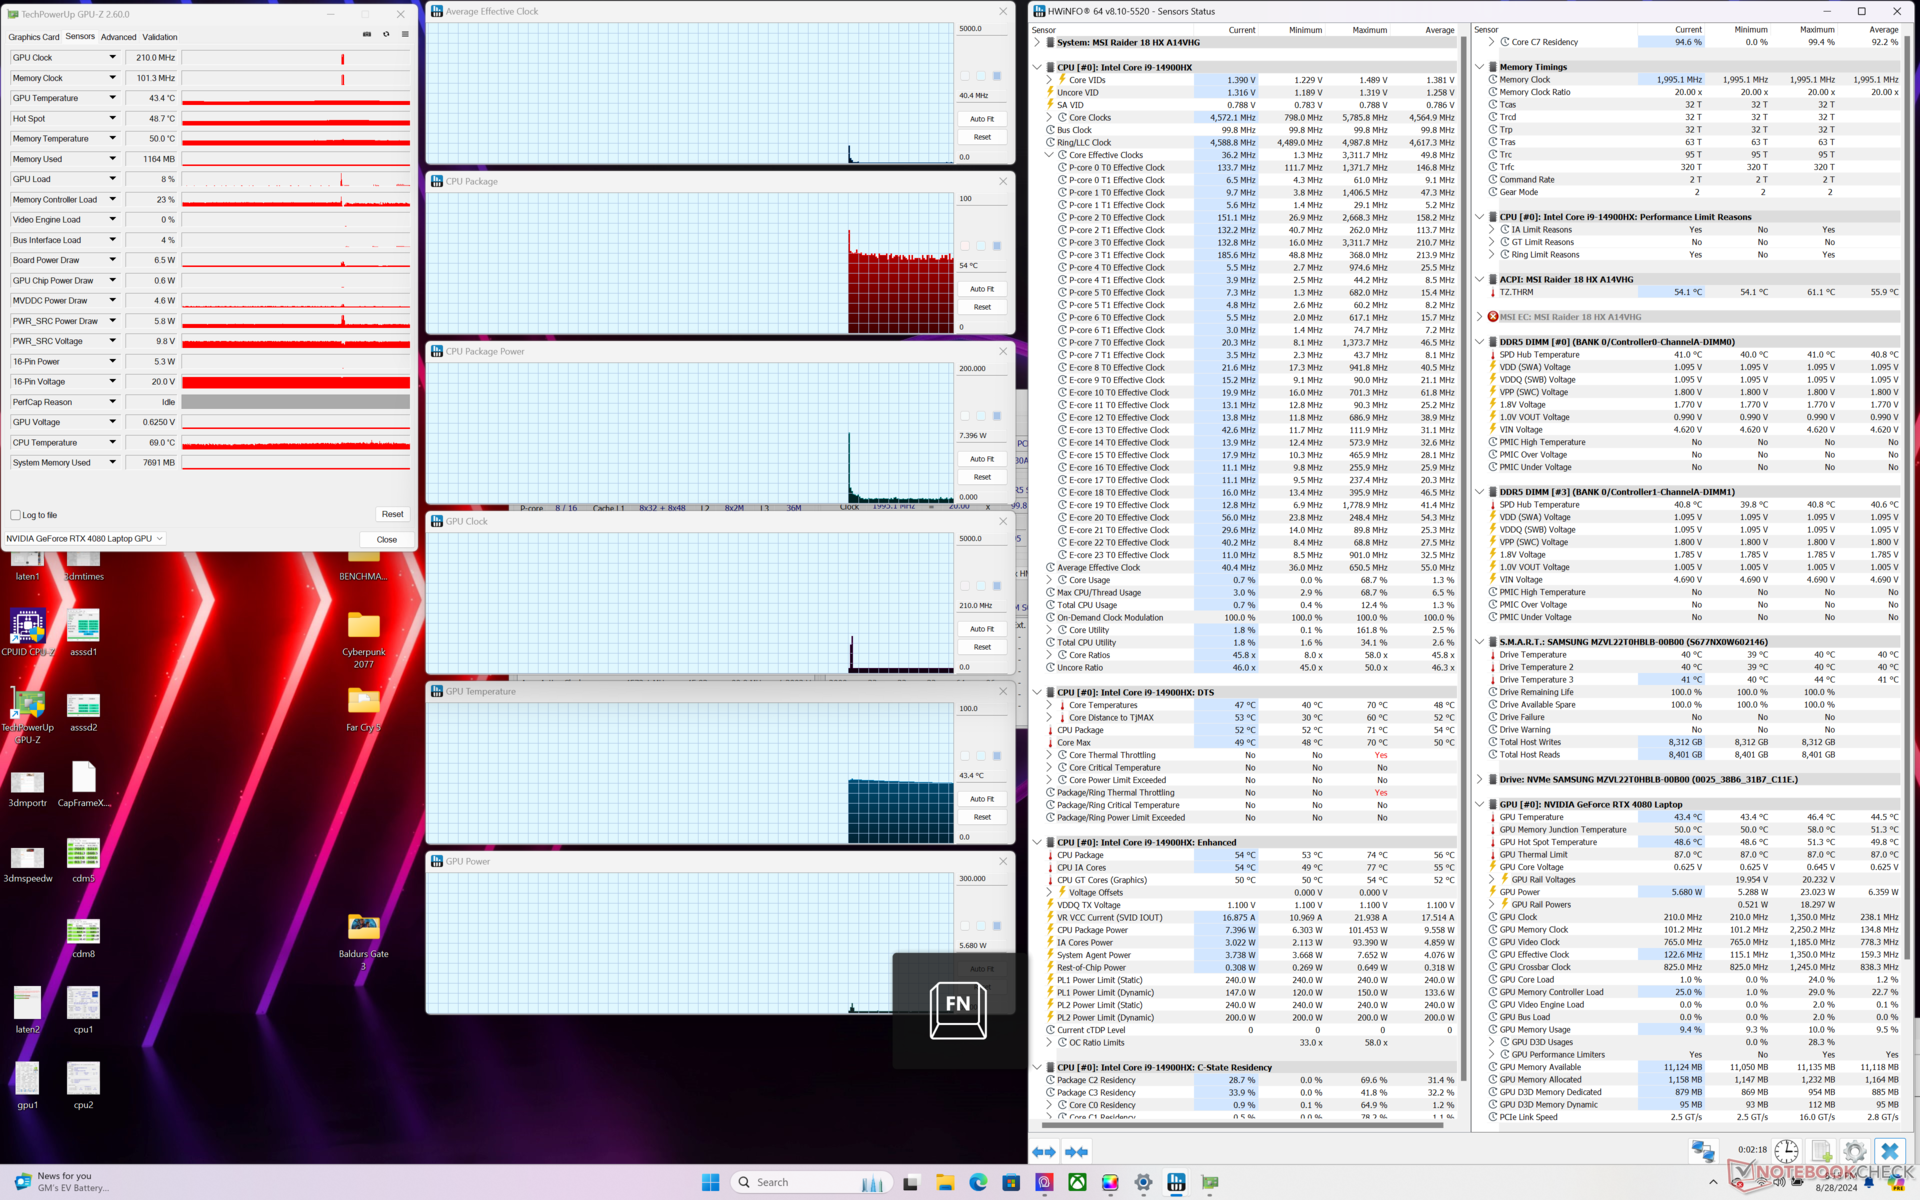
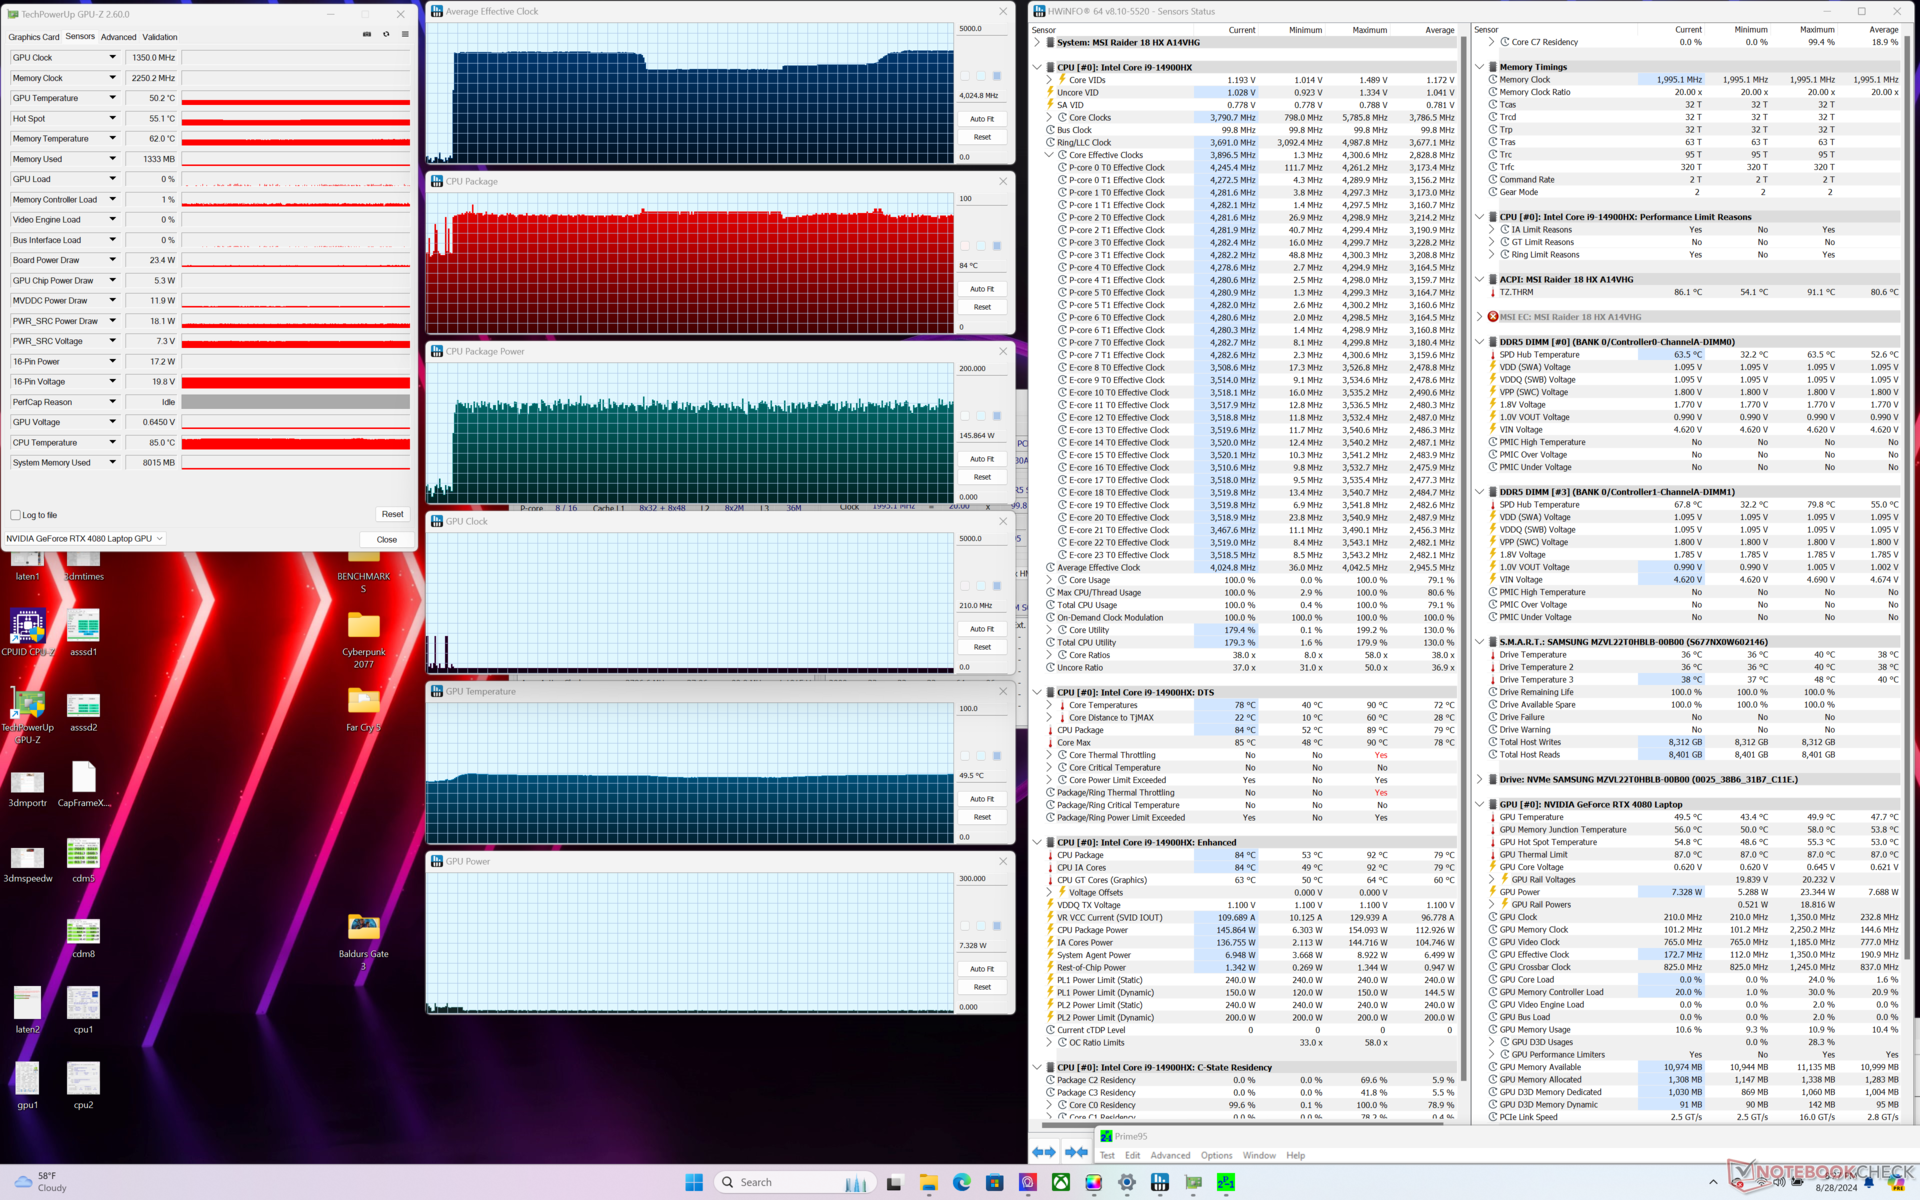
Während des Prime95-Stresstests erreichte die CPU 4 GHz, 86 °C und 145 W, ohne dass es zu signifikanten Einbrüchen bei den Taktraten oder der Leistung kam. Das große Gehäuse und die Kühllösung ermöglichen es, mehr Leistung aus dem Core i9-14900HX herauszuholen als bei kleineren Systemen mit demselben Prozessor, wie z. B. dem RedMagic Titan 16 Pro, das stark drosselt.
Im Extreme-Performance-Modus mit aktiviertem Cooler Boost ergeben sich beim Spielen keine spürbaren Leistungsvorteile im Vergleich zum ausgeschalteten Cooler Boost. Die GPU-Taktraten, Speichertaktraten und die Leistungsaufnahme des Boards beim Spielen von Cyberpunk 2077 stabilisieren sich in beiden Einstellungen bei 2550 MHz, 2250 MHz bzw. 159 W. Die Kerntemperaturen sind mit aktiviertem Cooler Boost um einige Grad Celsius niedriger, da die Lüftergeräusche lauter sind, aber das ist der einzige nennenswerte Vorteil.
Der Wechsel zum Balanced-Modus reduziert die GPU-Taktraten und die Leistungsaufnahme des Boards auf 2295 MHz bzw. 150 W, was nur geringfügig langsamer ist als im Extreme-Performance-Modus. Die Leistungsunterschiede zwischen dem Balanced-Modus und dem Extreme-Performance-Modus sind also geringer als erwartet.
Beim Spielen sind die GPU-Temperaturen um bis zu 9 °C höher als beim Razer Blade 18, obwohl unser MSI-System dicker und schwerer ist.

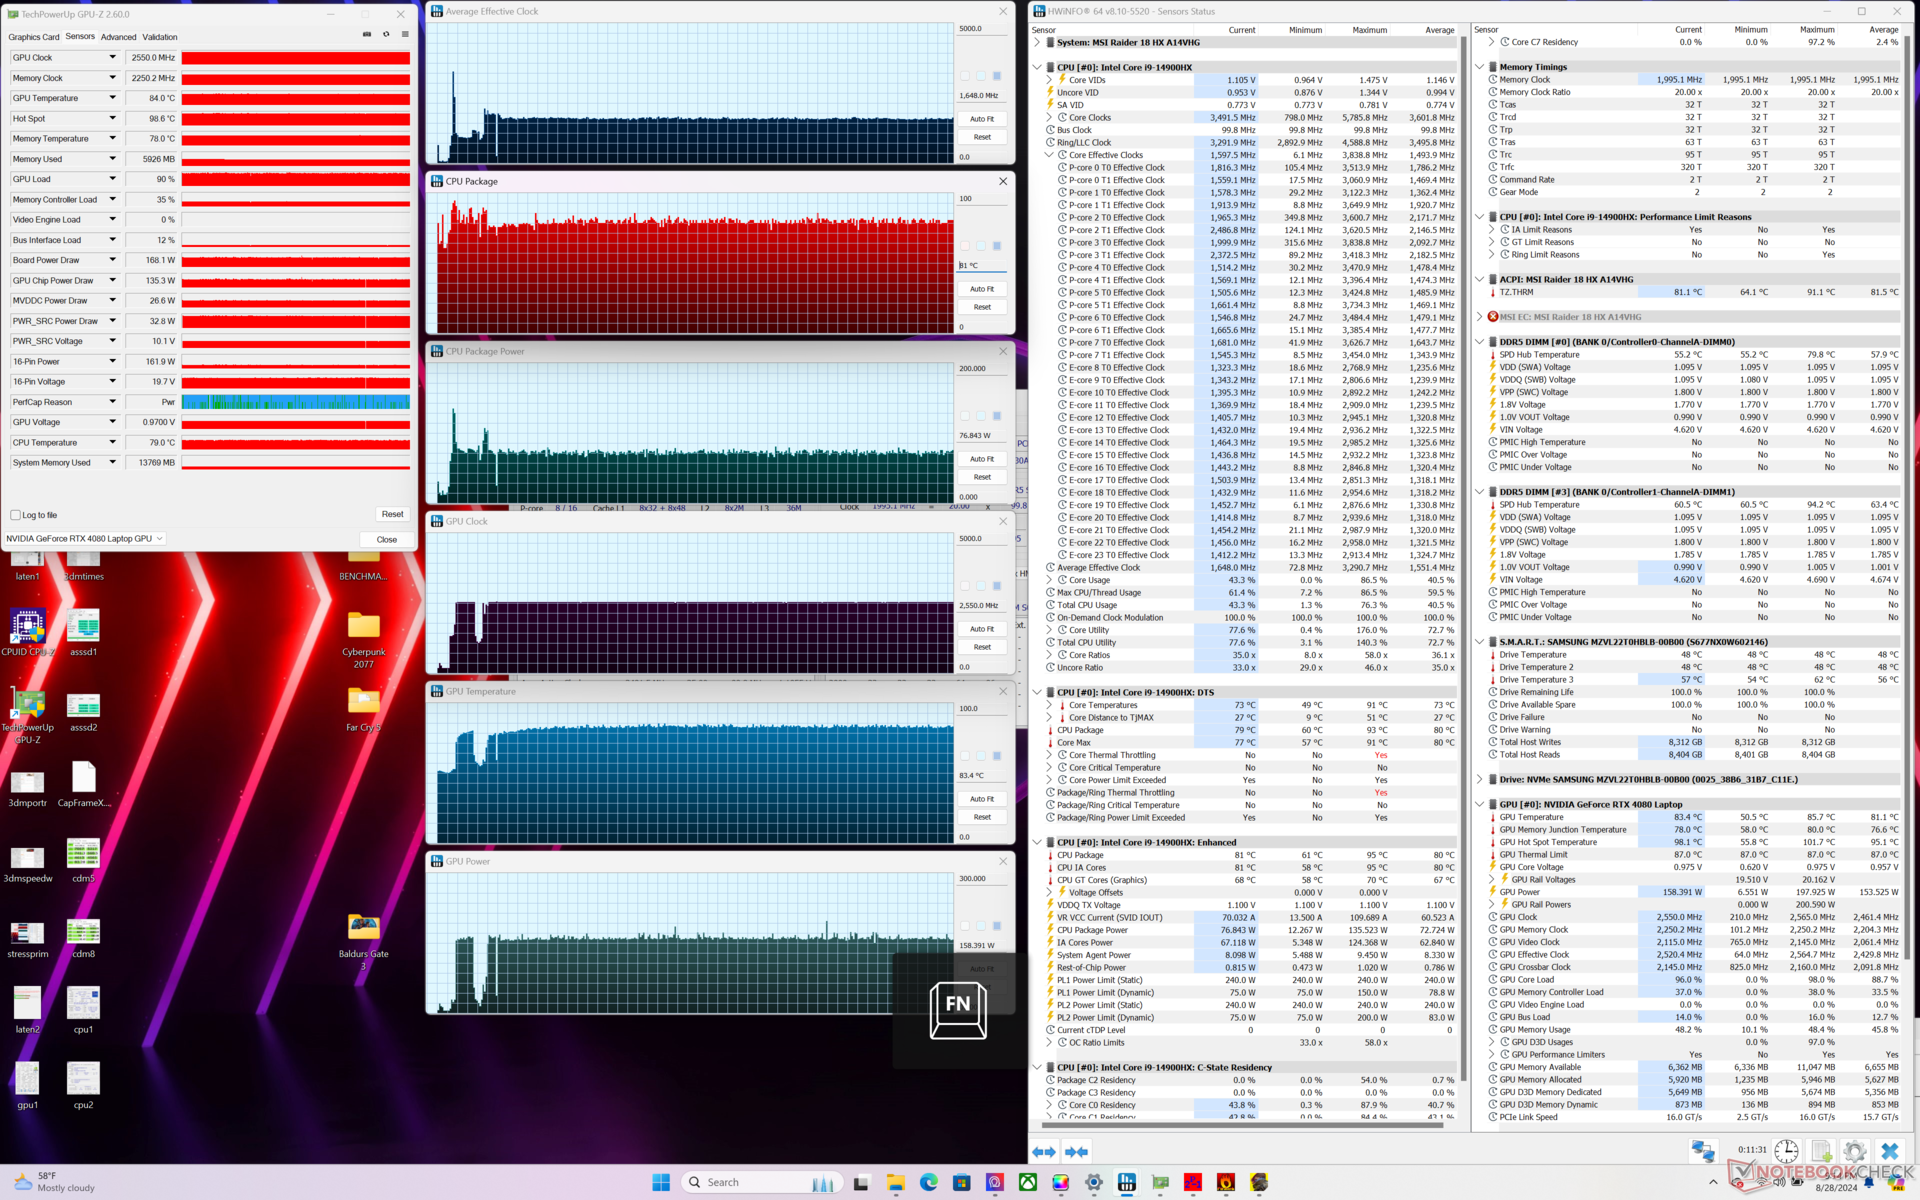
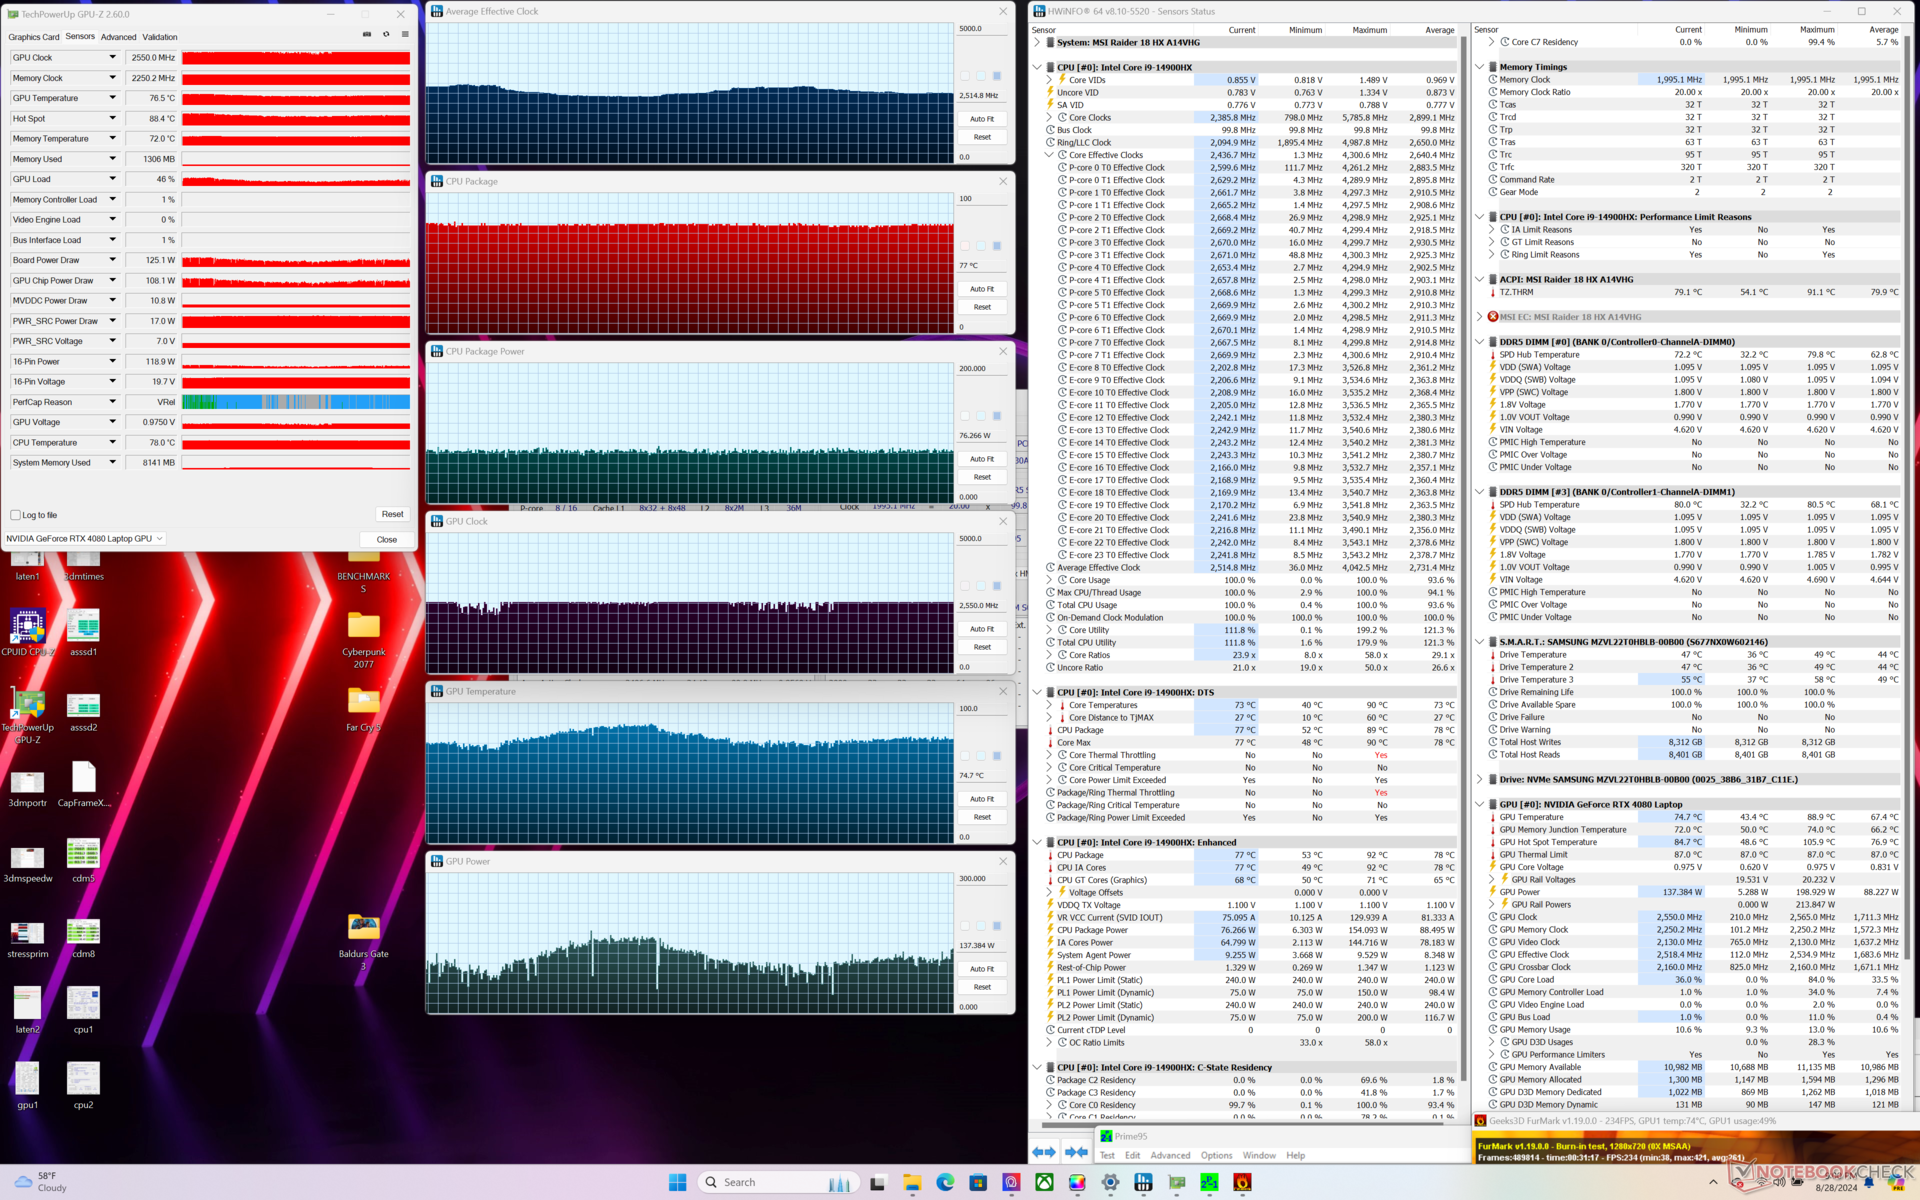
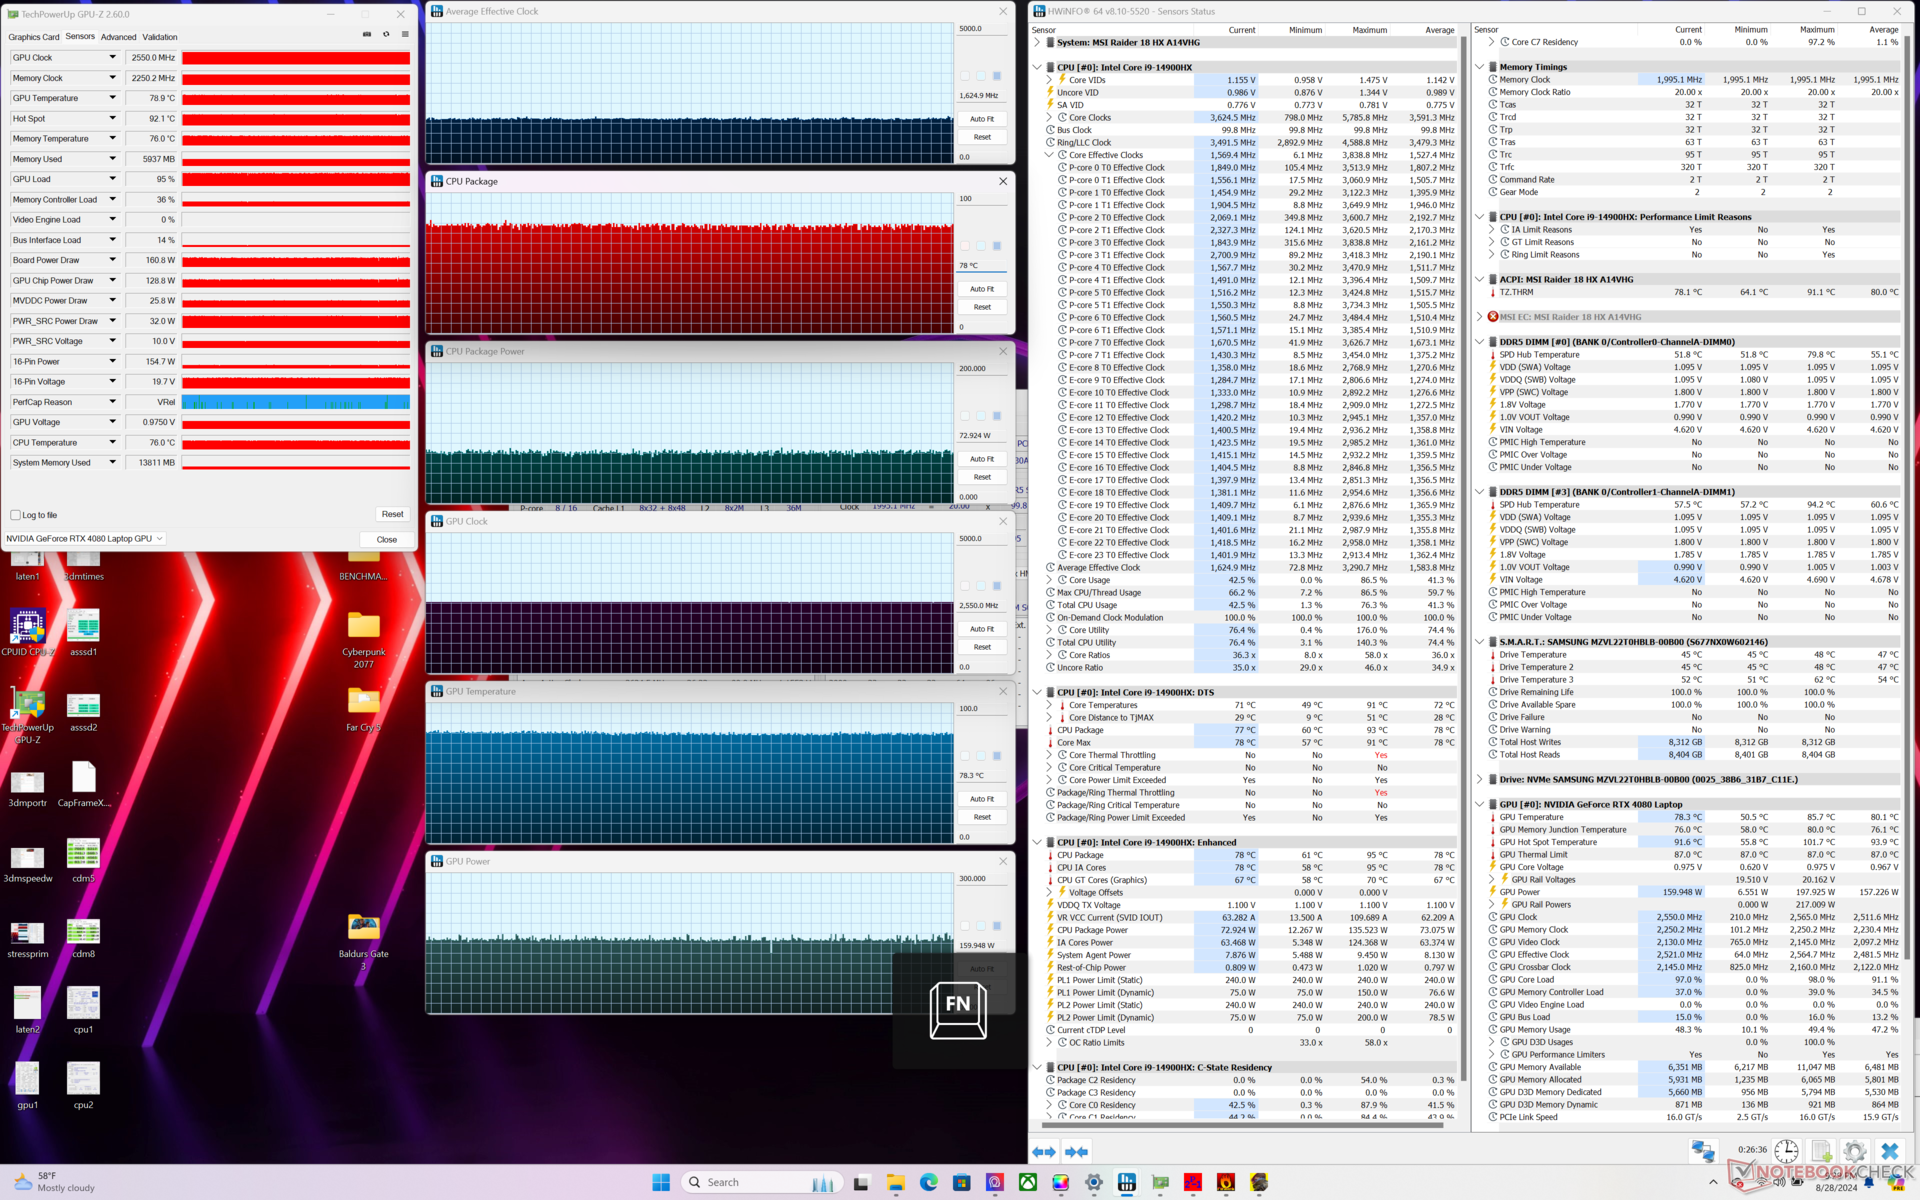
| Durchschnittlicher CPU-Takt (GHz) | GPU-Takt (MHz) | Durchschnittliche CPU-Temperatur (°C) | Durchschnittliche GPU-Temperatur (°C) | |
| System im Leerlauf | -- | -- | 54 | 43 |
| Prime95 Stresstest | 4.0 | -- | 84 | 50 |
| Prime95 + FurMark Stresstest | 2.5 | 2550 | 77 | 75 |
| Cyberpunk 2077 Stresstest (Balanced-Modus) | 1.5 | 2295 | 78 | 85 |
| Cyberpunk 2077 Stresstest (Extreme-Performance-Modus mit ausgeschaltetem Cooler Boost) | 1.7 | 2550 | 81 | 83 |
| Cyberpunk 2077 Stresstest (Extreme-Performance-Modus mit eingeschaltetem Cooler Boost) | 1.6 | 2550 | 78 | 78 |
System Performance
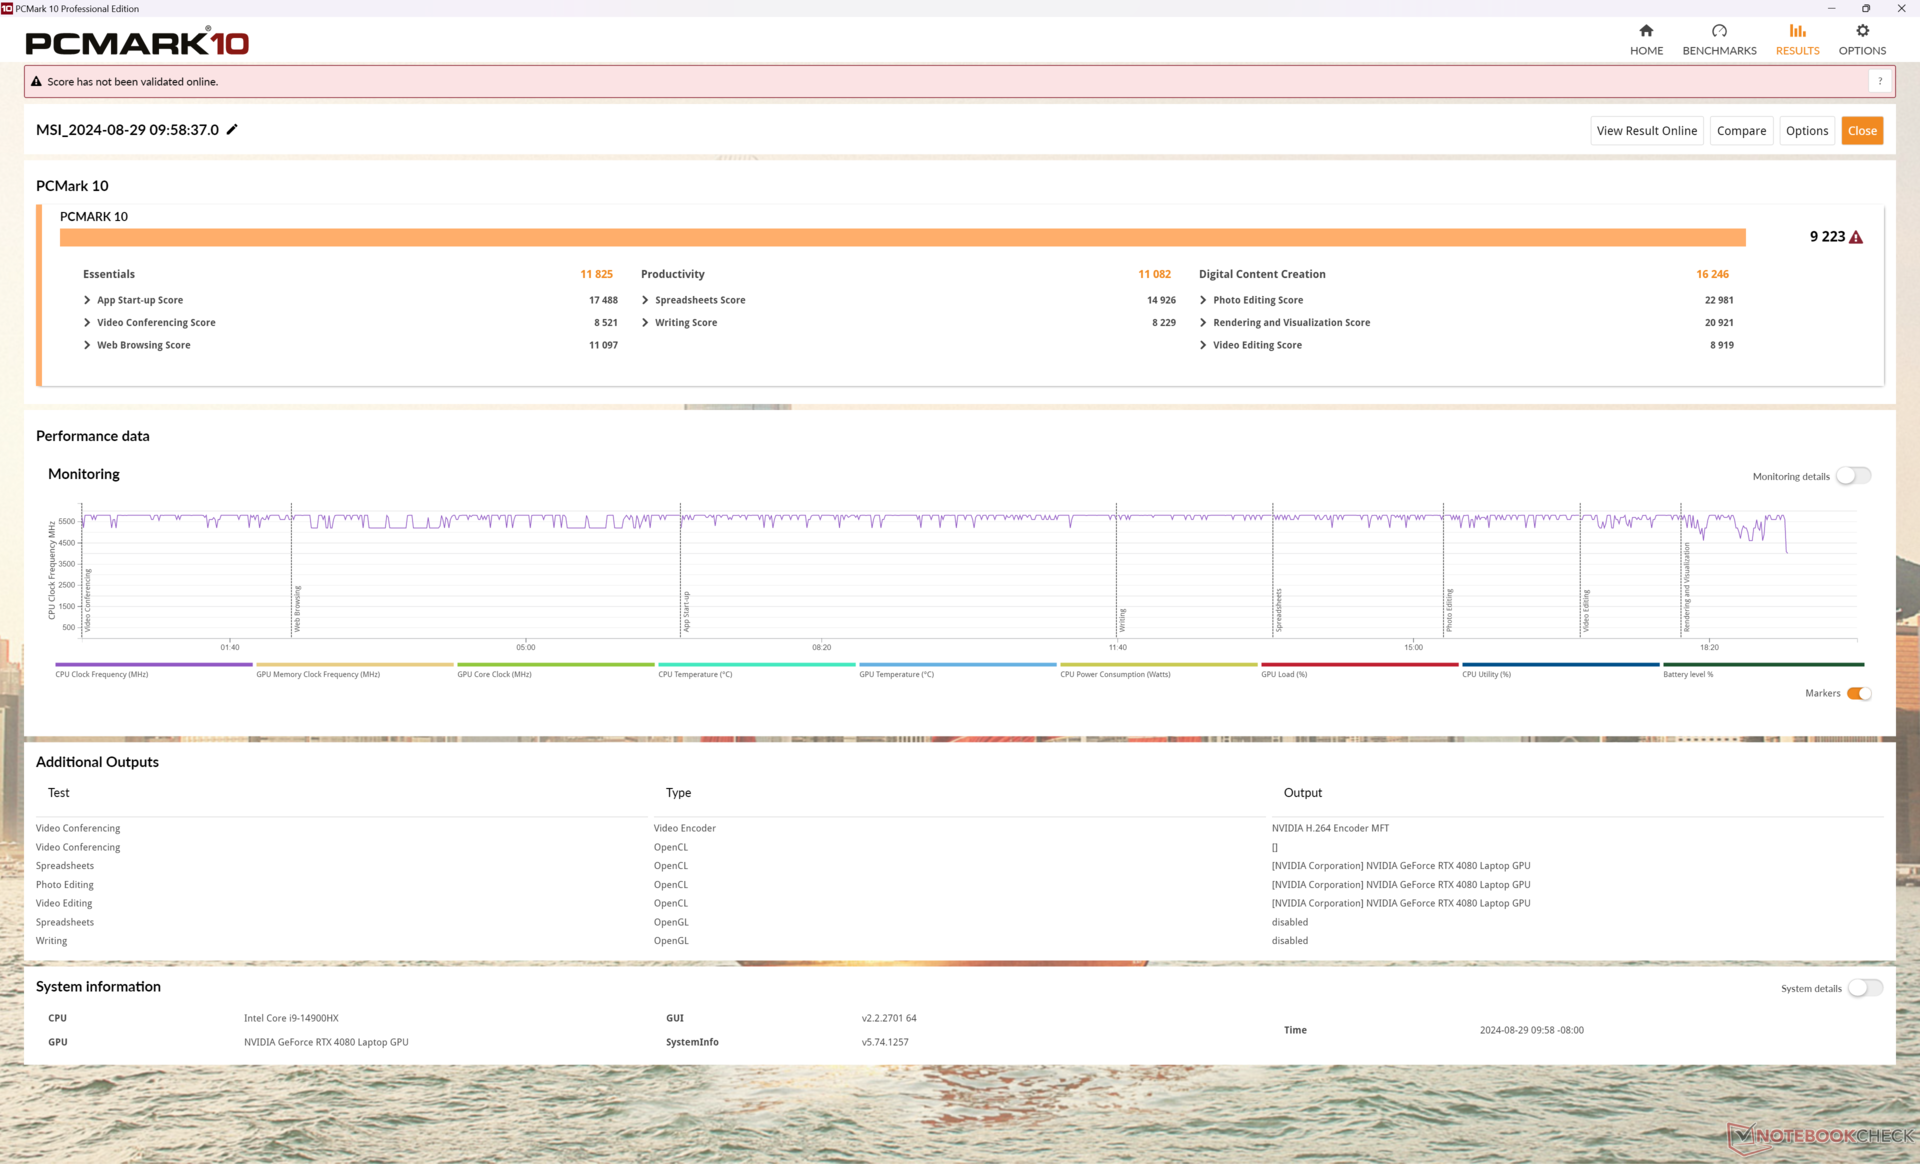
Die PCMark 10-Ergebnisse sind vergleichbar mit denen des MSI Titan 18 HX und zeigen, dass alltägliche Aufgaben auf dem Raider 18 HX nicht wirklich langsamer ausgeführt werden, obwohl es sich im Wesentlichen um einen heruntergestuften Titan handelt.
Beim Umschalten zwischen dGPU- und iGPU-Modus traten bei unserem Testgerät merkwürdige Anmeldeprobleme auf, die uns jedes Mal dazu zwangen, die PIN zurückzusetzen.
CrossMark: Overall | Productivity | Creativity | Responsiveness
WebXPRT 3: Overall
WebXPRT 4: Overall
Mozilla Kraken 1.1: Total
| PCMark 10 / Score | |
| Alienware m18 R2 | |
| MSI Raider 18 HX A14V | |
| MSI Titan 18 HX A14VIG | |
| Razer Blade 18 2024 RZ09-0509 | |
| Durchschnittliche Intel Core i9-14900HX, NVIDIA GeForce RTX 4080 Laptop GPU (7703 - 9223, n=7) | |
| Acer Predator Helios 18 PH18-72-98MW | |
| Asus ROG Strix G18 G814JI | |
| PCMark 10 / Essentials | |
| MSI Raider 18 HX A14V | |
| Durchschnittliche Intel Core i9-14900HX, NVIDIA GeForce RTX 4080 Laptop GPU (11255 - 12600, n=7) | |
| MSI Titan 18 HX A14VIG | |
| Alienware m18 R2 | |
| Razer Blade 18 2024 RZ09-0509 | |
| Acer Predator Helios 18 PH18-72-98MW | |
| Asus ROG Strix G18 G814JI | |
| PCMark 10 / Productivity | |
| Alienware m18 R2 | |
| MSI Raider 18 HX A14V | |
| Durchschnittliche Intel Core i9-14900HX, NVIDIA GeForce RTX 4080 Laptop GPU (6662 - 11410, n=7) | |
| MSI Titan 18 HX A14VIG | |
| Razer Blade 18 2024 RZ09-0509 | |
| Acer Predator Helios 18 PH18-72-98MW | |
| Asus ROG Strix G18 G814JI | |
| PCMark 10 / Digital Content Creation | |
| MSI Titan 18 HX A14VIG | |
| Alienware m18 R2 | |
| MSI Raider 18 HX A14V | |
| Razer Blade 18 2024 RZ09-0509 | |
| Durchschnittliche Intel Core i9-14900HX, NVIDIA GeForce RTX 4080 Laptop GPU (14211 - 16246, n=7) | |
| Acer Predator Helios 18 PH18-72-98MW | |
| Asus ROG Strix G18 G814JI | |
| CrossMark / Overall | |
| Durchschnittliche Intel Core i9-14900HX, NVIDIA GeForce RTX 4080 Laptop GPU (1992 - 2334, n=7) | |
| MSI Raider 18 HX A14V | |
| Alienware m18 R2 | |
| Razer Blade 18 2024 RZ09-0509 | |
| MSI Titan 18 HX A14VIG | |
| CrossMark / Productivity | |
| Durchschnittliche Intel Core i9-14900HX, NVIDIA GeForce RTX 4080 Laptop GPU (1812 - 2204, n=7) | |
| MSI Raider 18 HX A14V | |
| Razer Blade 18 2024 RZ09-0509 | |
| Alienware m18 R2 | |
| MSI Titan 18 HX A14VIG | |
| CrossMark / Creativity | |
| Durchschnittliche Intel Core i9-14900HX, NVIDIA GeForce RTX 4080 Laptop GPU (2327 - 2500, n=7) | |
| Alienware m18 R2 | |
| MSI Raider 18 HX A14V | |
| Razer Blade 18 2024 RZ09-0509 | |
| MSI Titan 18 HX A14VIG | |
| CrossMark / Responsiveness | |
| Durchschnittliche Intel Core i9-14900HX, NVIDIA GeForce RTX 4080 Laptop GPU (1520 - 2254, n=7) | |
| MSI Raider 18 HX A14V | |
| Alienware m18 R2 | |
| Razer Blade 18 2024 RZ09-0509 | |
| MSI Titan 18 HX A14VIG | |
| WebXPRT 3 / Overall | |
| Razer Blade 18 2024 RZ09-0509 | |
| MSI Raider 18 HX A14V | |
| Durchschnittliche Intel Core i9-14900HX, NVIDIA GeForce RTX 4080 Laptop GPU (310 - 345, n=7) | |
| MSI Titan 18 HX A14VIG | |
| Alienware m18 R2 | |
| Asus ROG Strix G18 G814JI | |
| Asus ROG Strix G18 G814JI | |
| WebXPRT 4 / Overall | |
| MSI Raider 18 HX A14V | |
| Durchschnittliche Intel Core i9-14900HX, NVIDIA GeForce RTX 4080 Laptop GPU (300 - 321, n=7) | |
| Alienware m18 R2 | |
| MSI Titan 18 HX A14VIG | |
| Asus ROG Strix G18 G814JI | |
| Asus ROG Strix G18 G814JI | |
| Mozilla Kraken 1.1 / Total | |
| Asus ROG Strix G18 G814JI | |
| Asus ROG Strix G18 G814JI | |
| MSI Titan 18 HX A14VIG | |
| Razer Blade 18 2024 RZ09-0509 | |
| MSI Raider 18 HX A14V | |
| Acer Predator Helios 18 PH18-72-98MW | |
| Durchschnittliche Intel Core i9-14900HX, NVIDIA GeForce RTX 4080 Laptop GPU (437 - 446, n=7) | |
| Alienware m18 R2 | |
* ... kleinere Werte sind besser
| PCMark 10 Score | 9223 Punkte | |
Hilfe | ||
| AIDA64 / Memory Copy | |
| Alienware m18 R2 | |
| Acer Predator Helios 18 PH18-72-98MW | |
| Razer Blade 18 2024 RZ09-0509 | |
| Durchschnittliche Intel Core i9-14900HX (38028 - 83392, n=36) | |
| MSI Raider 18 HX A14V | |
| Asus ROG Strix G18 G814JI | |
| MSI Titan 18 HX A14VIG | |
| AIDA64 / Memory Read | |
| Alienware m18 R2 | |
| Acer Predator Helios 18 PH18-72-98MW | |
| Razer Blade 18 2024 RZ09-0509 | |
| Durchschnittliche Intel Core i9-14900HX (43306 - 87568, n=36) | |
| Asus ROG Strix G18 G814JI | |
| MSI Raider 18 HX A14V | |
| MSI Titan 18 HX A14VIG | |
| AIDA64 / Memory Write | |
| Alienware m18 R2 | |
| Durchschnittliche Intel Core i9-14900HX (37146 - 80589, n=36) | |
| Acer Predator Helios 18 PH18-72-98MW | |
| Razer Blade 18 2024 RZ09-0509 | |
| MSI Raider 18 HX A14V | |
| Asus ROG Strix G18 G814JI | |
| MSI Titan 18 HX A14VIG | |
| AIDA64 / Memory Latency | |
| MSI Titan 18 HX A14VIG | |
| MSI Raider 18 HX A14V | |
| Razer Blade 18 2024 RZ09-0509 | |
| Alienware m18 R2 | |
| Durchschnittliche Intel Core i9-14900HX (76.1 - 105, n=36) | |
| Asus ROG Strix G18 G814JI | |
| Acer Predator Helios 18 PH18-72-98MW | |
* ... kleinere Werte sind besser
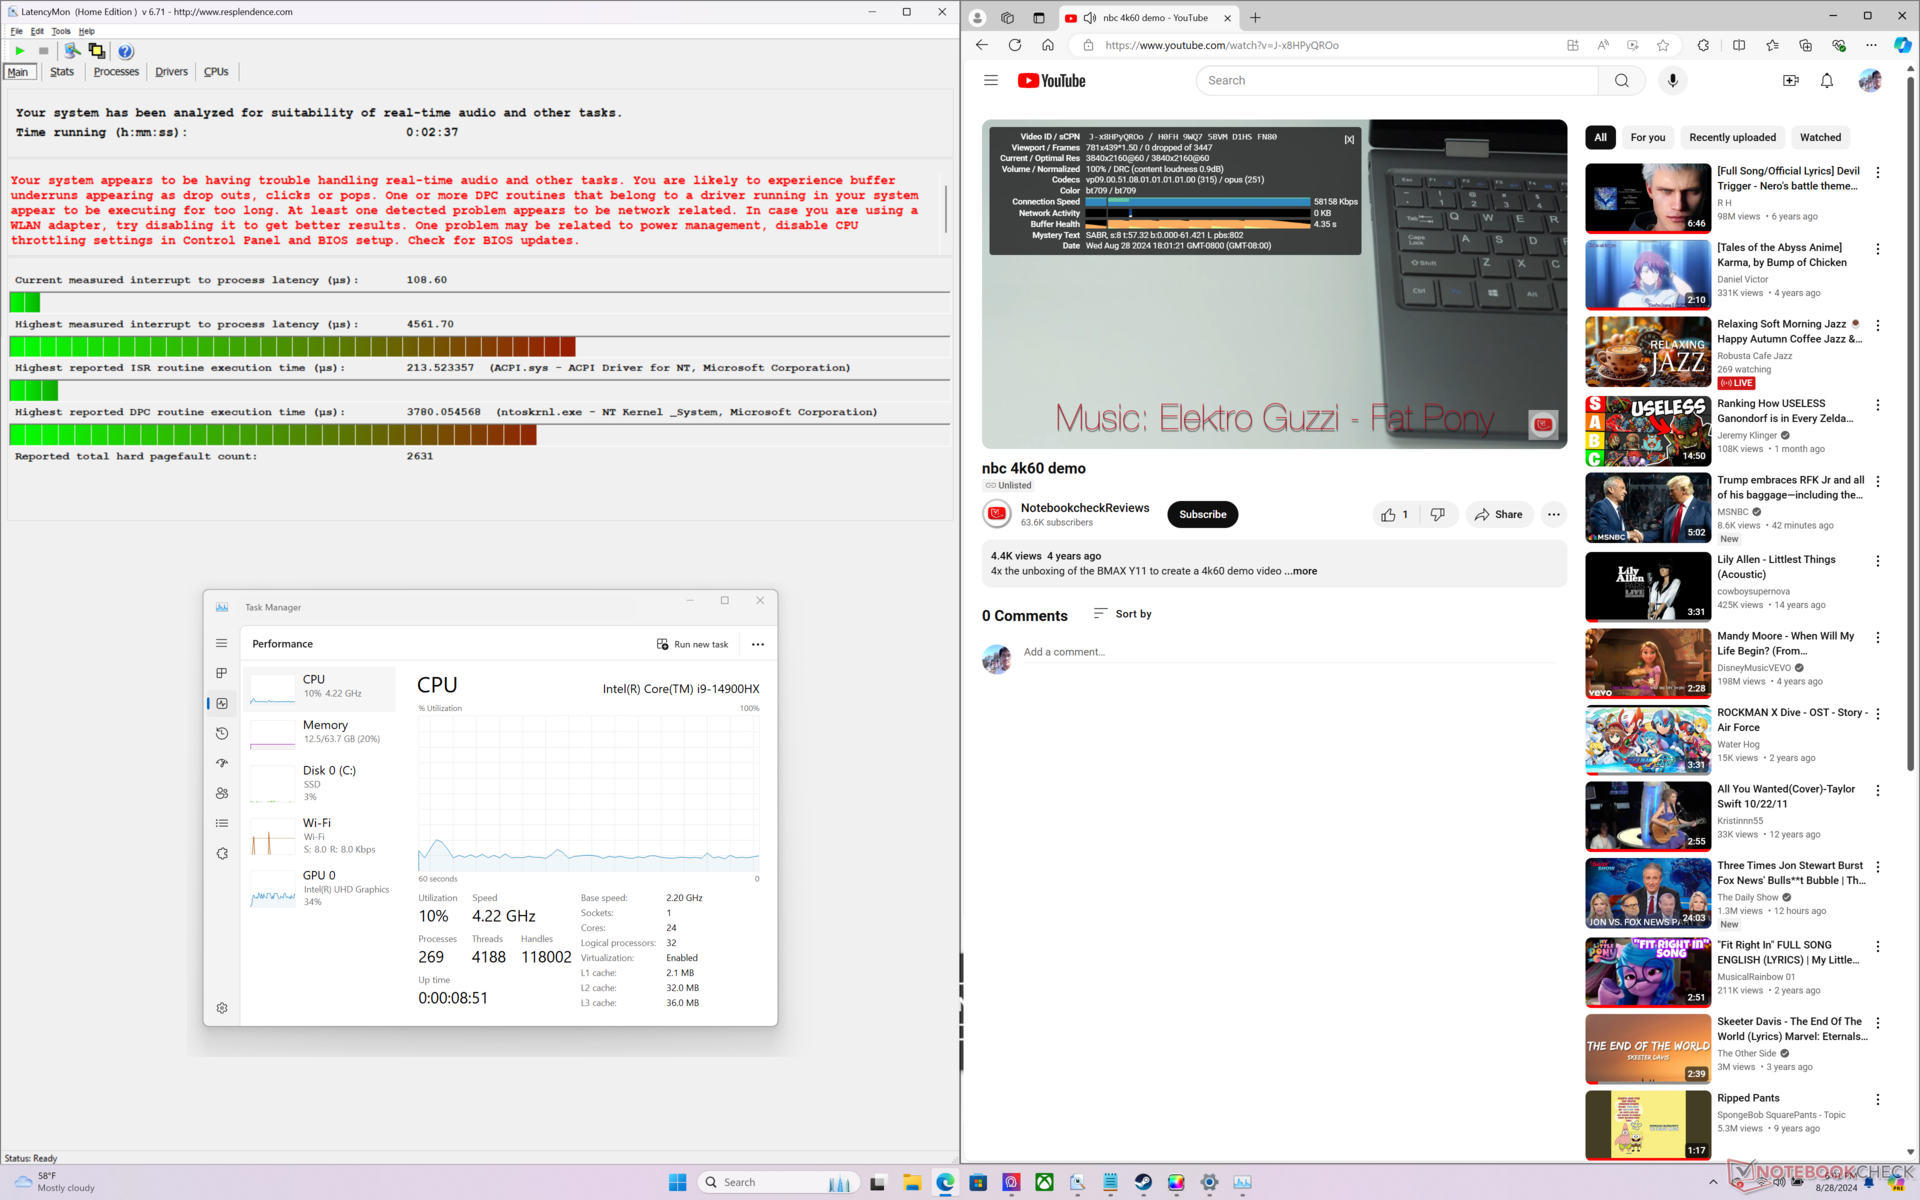
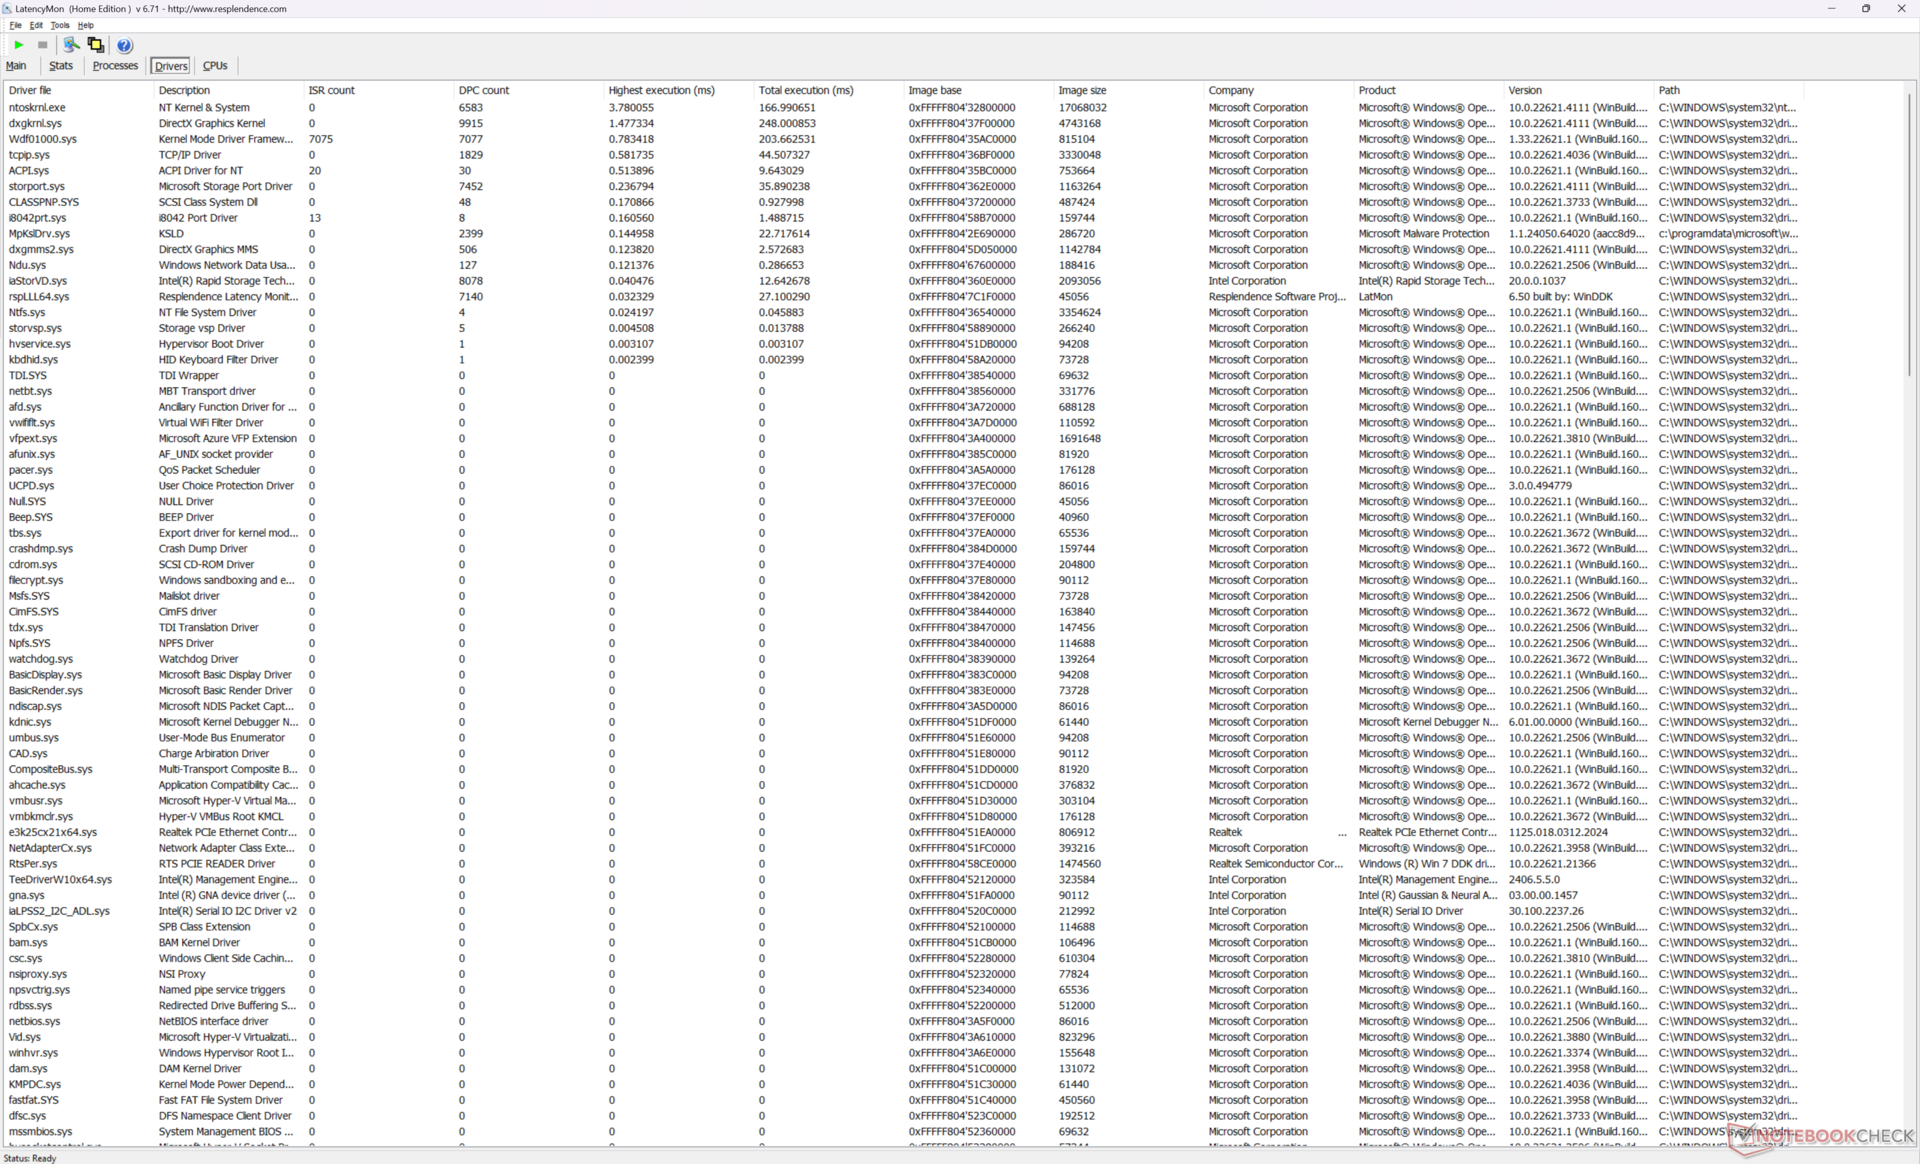
DPC-Latenzen
LatencyMon zeigt DPC-Probleme beim Öffnen mehrerer Tabs unserer Homepage, selbst im iGPU-Modus. Abgesehen davon läuft die 4K-Videowiedergabe bei 60 FPS reibungslos und ohne Bildaussetzer.
| DPC Latencies / LatencyMon - interrupt to process latency (max), Web, Youtube, Prime95 | |
| MSI Raider 18 HX A14V | |
| Acer Predator Helios 18 PH18-72-98MW | |
| Alienware m18 R2 | |
| MSI Titan 18 HX A14VIG | |
| Razer Blade 18 2024 RZ09-0509 | |
| Asus ROG Strix G18 G814JI | |
* ... kleinere Werte sind besser
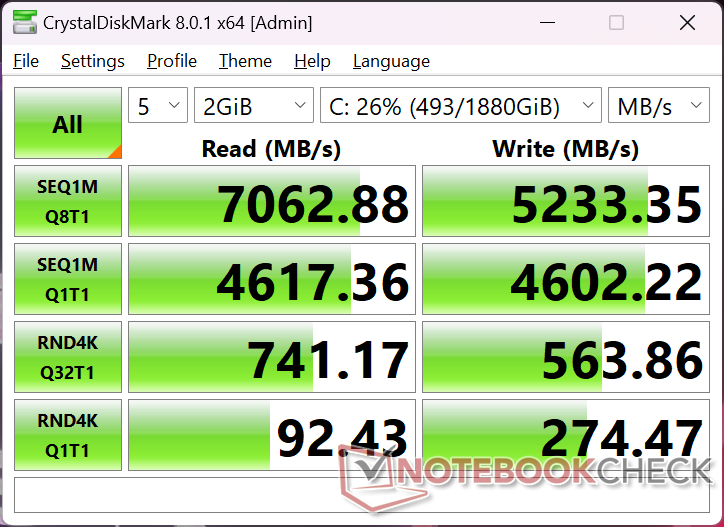
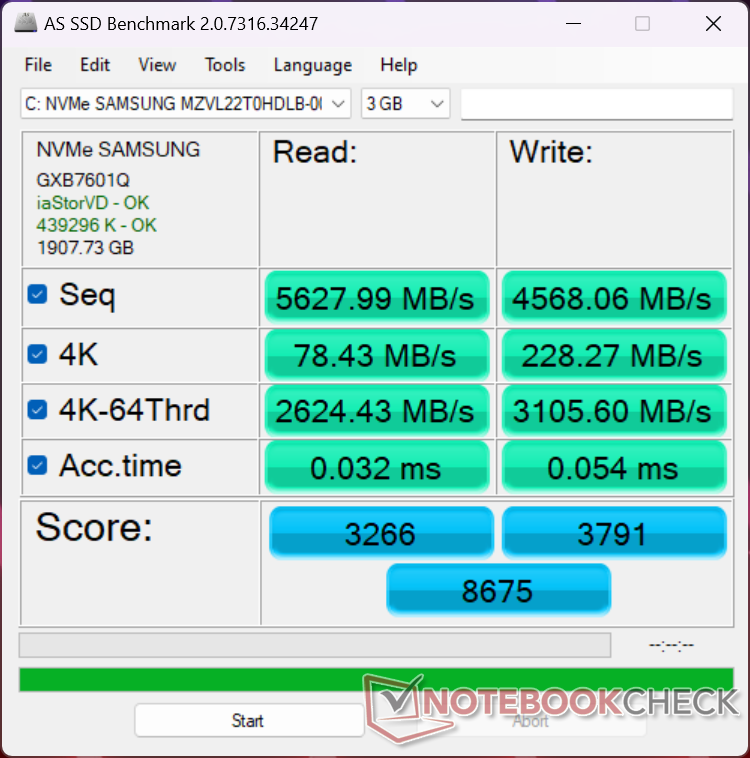
Massenspeicher
Unser Gerät ist mit der Samsung PM9A1a MZVL22T0HDLB PCIe4 SSD ausgestattet, die häufig in High-End-Laptops verbaut wird. Die Übertragungsraten bleiben selbst unter Belastung stabil bei etwa 7000 MB/s und können bei der Konfiguration mit einem PCIe5-Laufwerk sogar noch höher ausfallen. Allerdings könnte das Fehlen eines integrierten Wärmeableiters dazu führen, dass PCIe5-Laufwerke anfälliger für Throttling sind.

| Drive Performance Rating - Percent | |
| Alienware m18 R2 | |
| MSI Raider 18 HX A14V | |
| Acer Predator Helios 18 PH18-72-98MW | |
| MSI Titan 18 HX A14VIG | |
| Razer Blade 18 2024 RZ09-0509 | |
| Asus ROG Strix G18 G814JI | |
* ... kleinere Werte sind besser
Dauerleistung Lesen: DiskSpd Read Loop, Queue Depth 8
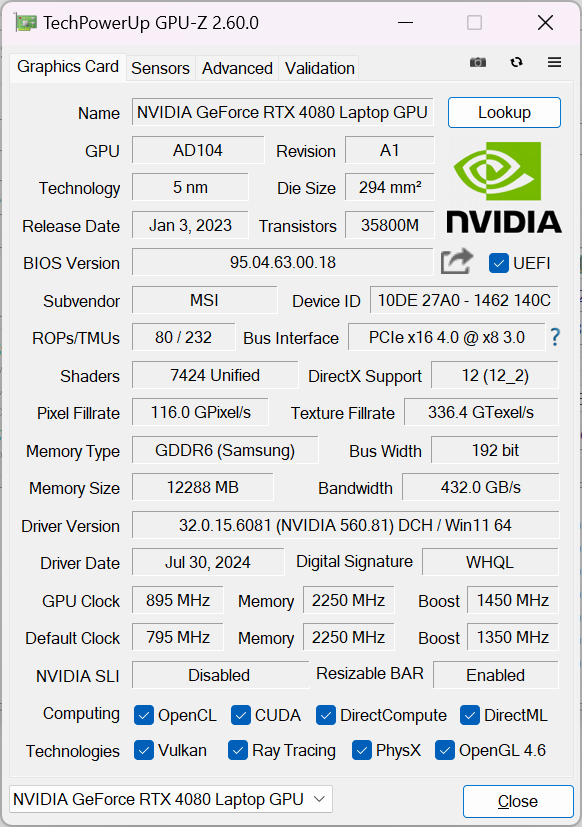
GPU Performance — 175 W TGP-Grafik
Im Gegensatz zu dünneren Laptops, die oft mit einer schwächeren 80-Watt-GeForce RTX 4080-Grafikkarte ausgestattet sind, verfügt das größere Raider 18 HX über eine leistungsstärkere 175-Watt-Version (150 W + 25 W Dynamic Boost). Dadurch ist die Leistung etwa 5 % höher als bei durchschnittlichen Laptops in unserer Datenbank mit derselben GPU, während ein Upgrade auf die RTX 4090 die Leistung um weitere 10 % steigern würde.
Es ist jedoch wichtig zu beachten, dass die Gesamtleistung der mobilen RTX 4080 immer noch 30 bis 35 Prozent langsamer ist als die Desktop-Version der GeForce RTX 4080, obwohl beide denselben Namen tragen. Leistungsmäßig liegt unsere mobile RTX 4080 daher näher an der Desktop RTX 4070.
| Energieprofile | Grafikleistung | CPU-Leistung | Gesamtwert |
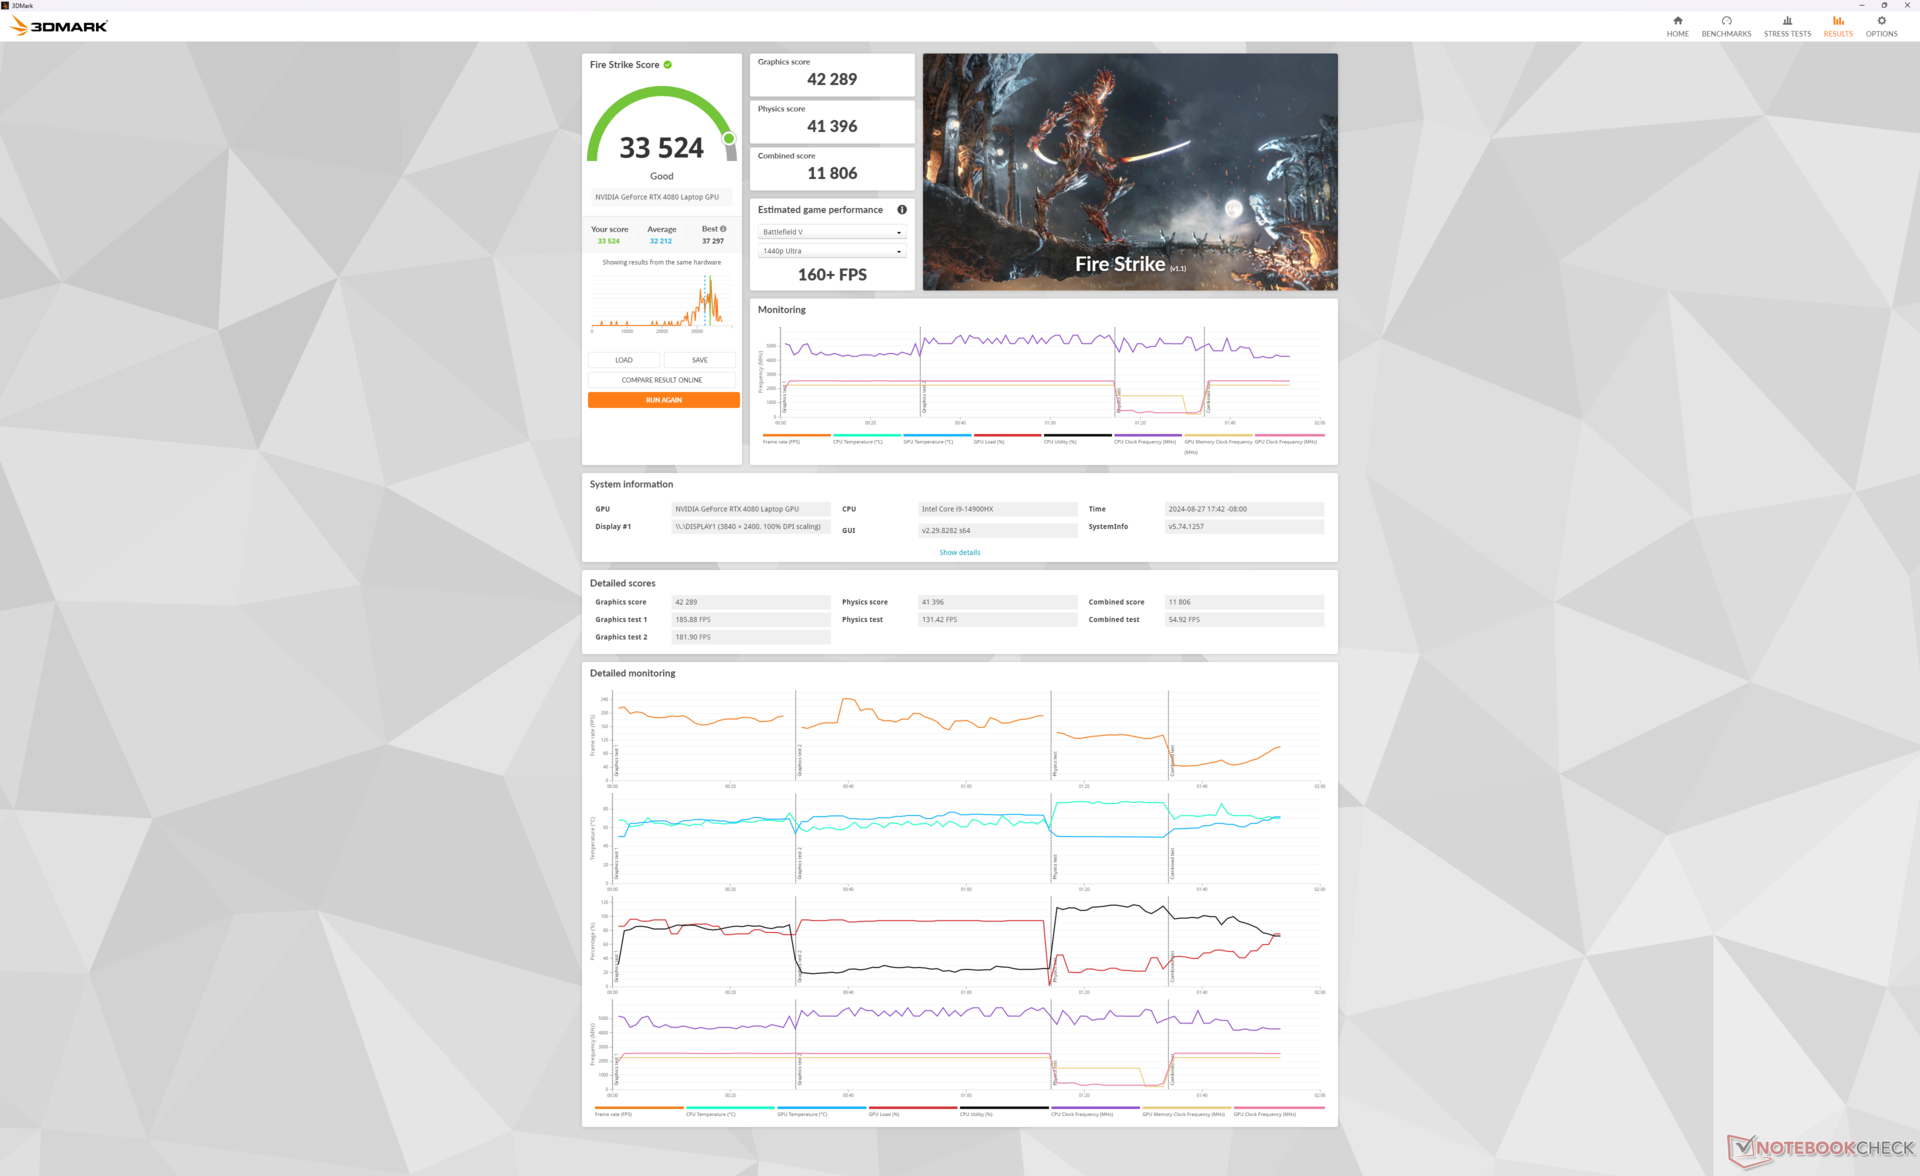
| Extreme-Performance-Modus (Cooler Boost eingeschaltet) | 42289 | 41396 | 11806 |
| Extreme-Performance-Modus (Cooler Boost ausgeschaltet) | 41778 (-1%) | 40723 (-2%) | 11968 (-1%) |
| Balanced Mode | 41673 (-2%) | 41013 (-1%) | 10404 (-12%) |
| Battery Power | 21731 (-49%) | 17988 (-57%) | 5809 (-51%) |
Der Wechsel vom Extreme-Performance-Modus in den Balanced-Modus hat nur minimale Auswirkungen auf die Leistung, was sich auch in unseren Stresstests bestätigt hat. Auch die Aktivierung des Cooler-Boost-Modus führt nur zu geringfügigen Unterschieden, abgesehen davon, dass die Kerntemperaturen durch eine deutlich erhöhte Lüfterlautstärke gesenkt werden.
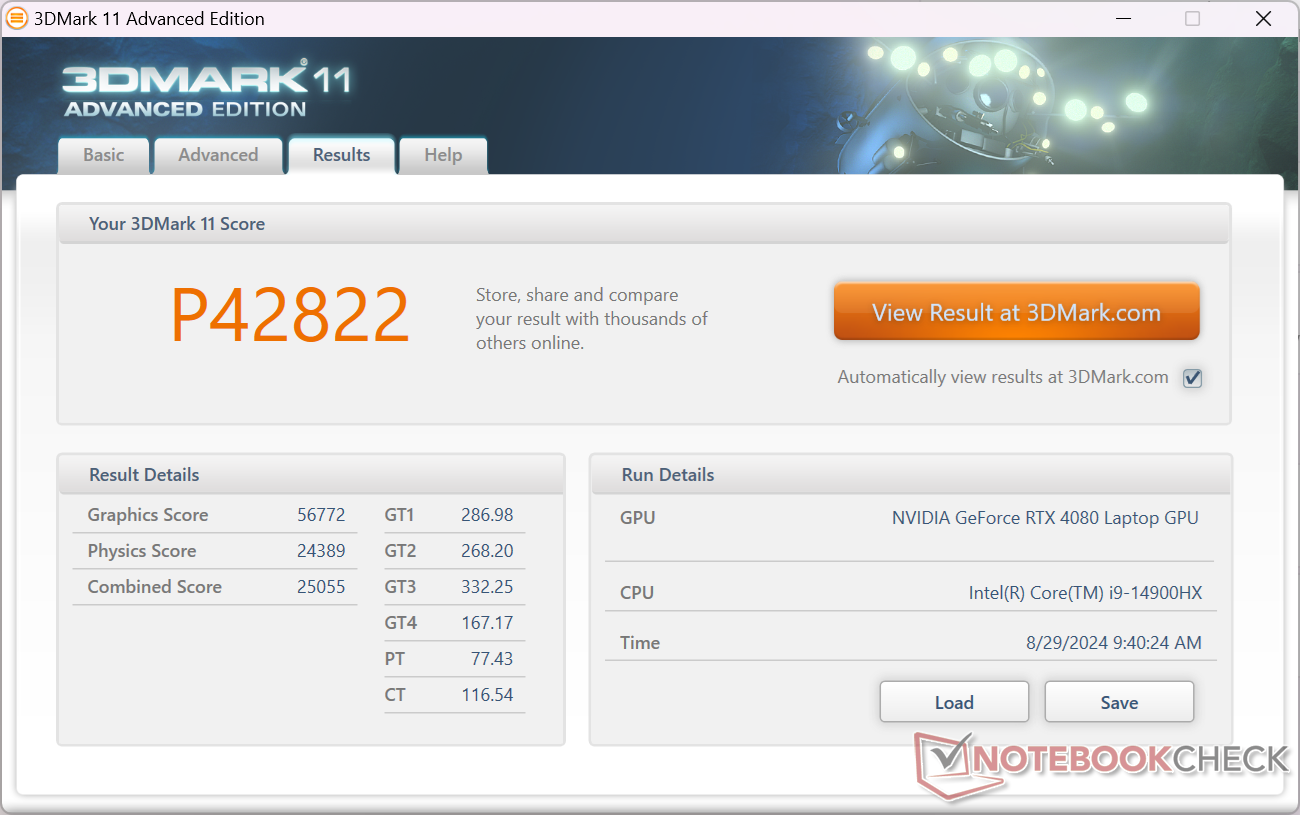

| 3DMark 11 Performance | 42822 Punkte | |
| 3DMark Fire Strike Score | 33524 Punkte | |
| 3DMark Time Spy Score | 18608 Punkte | |
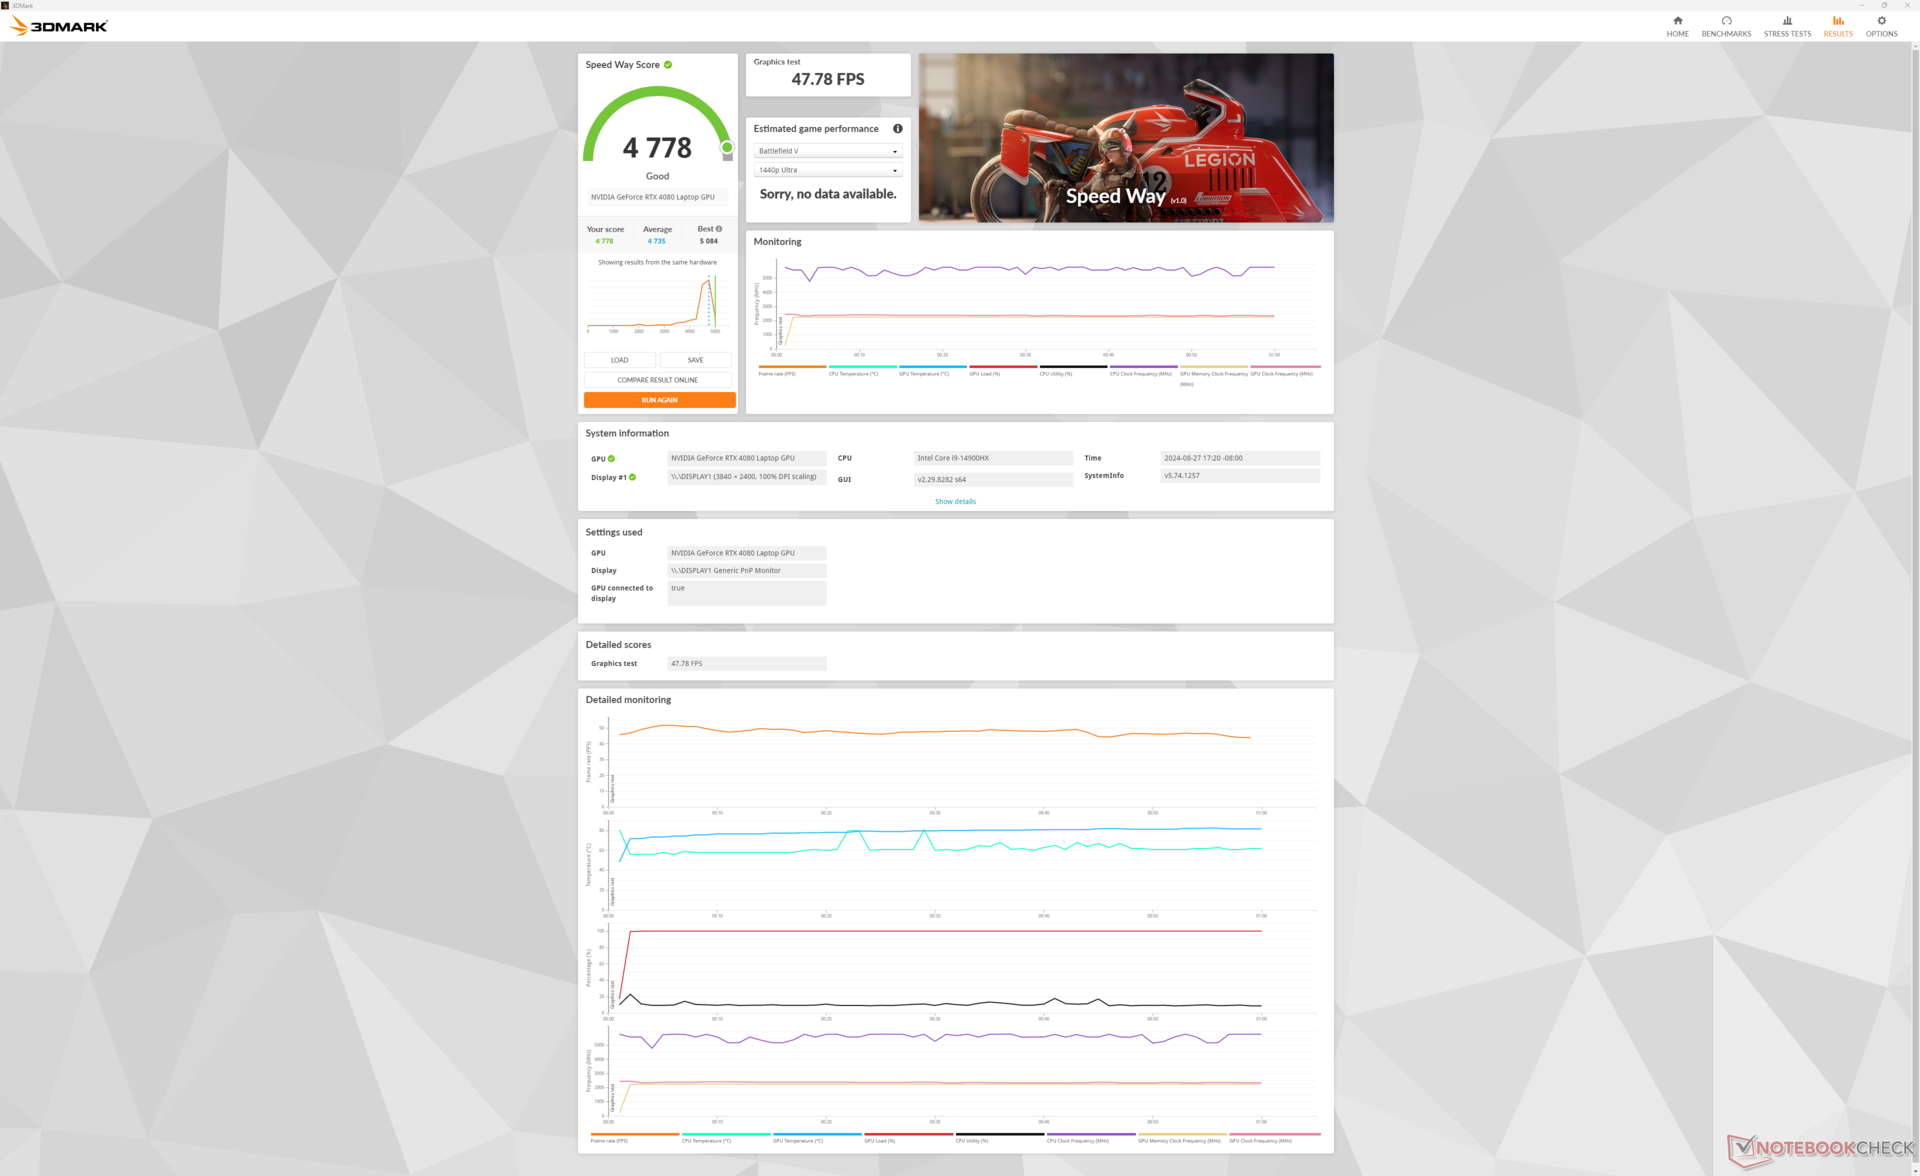
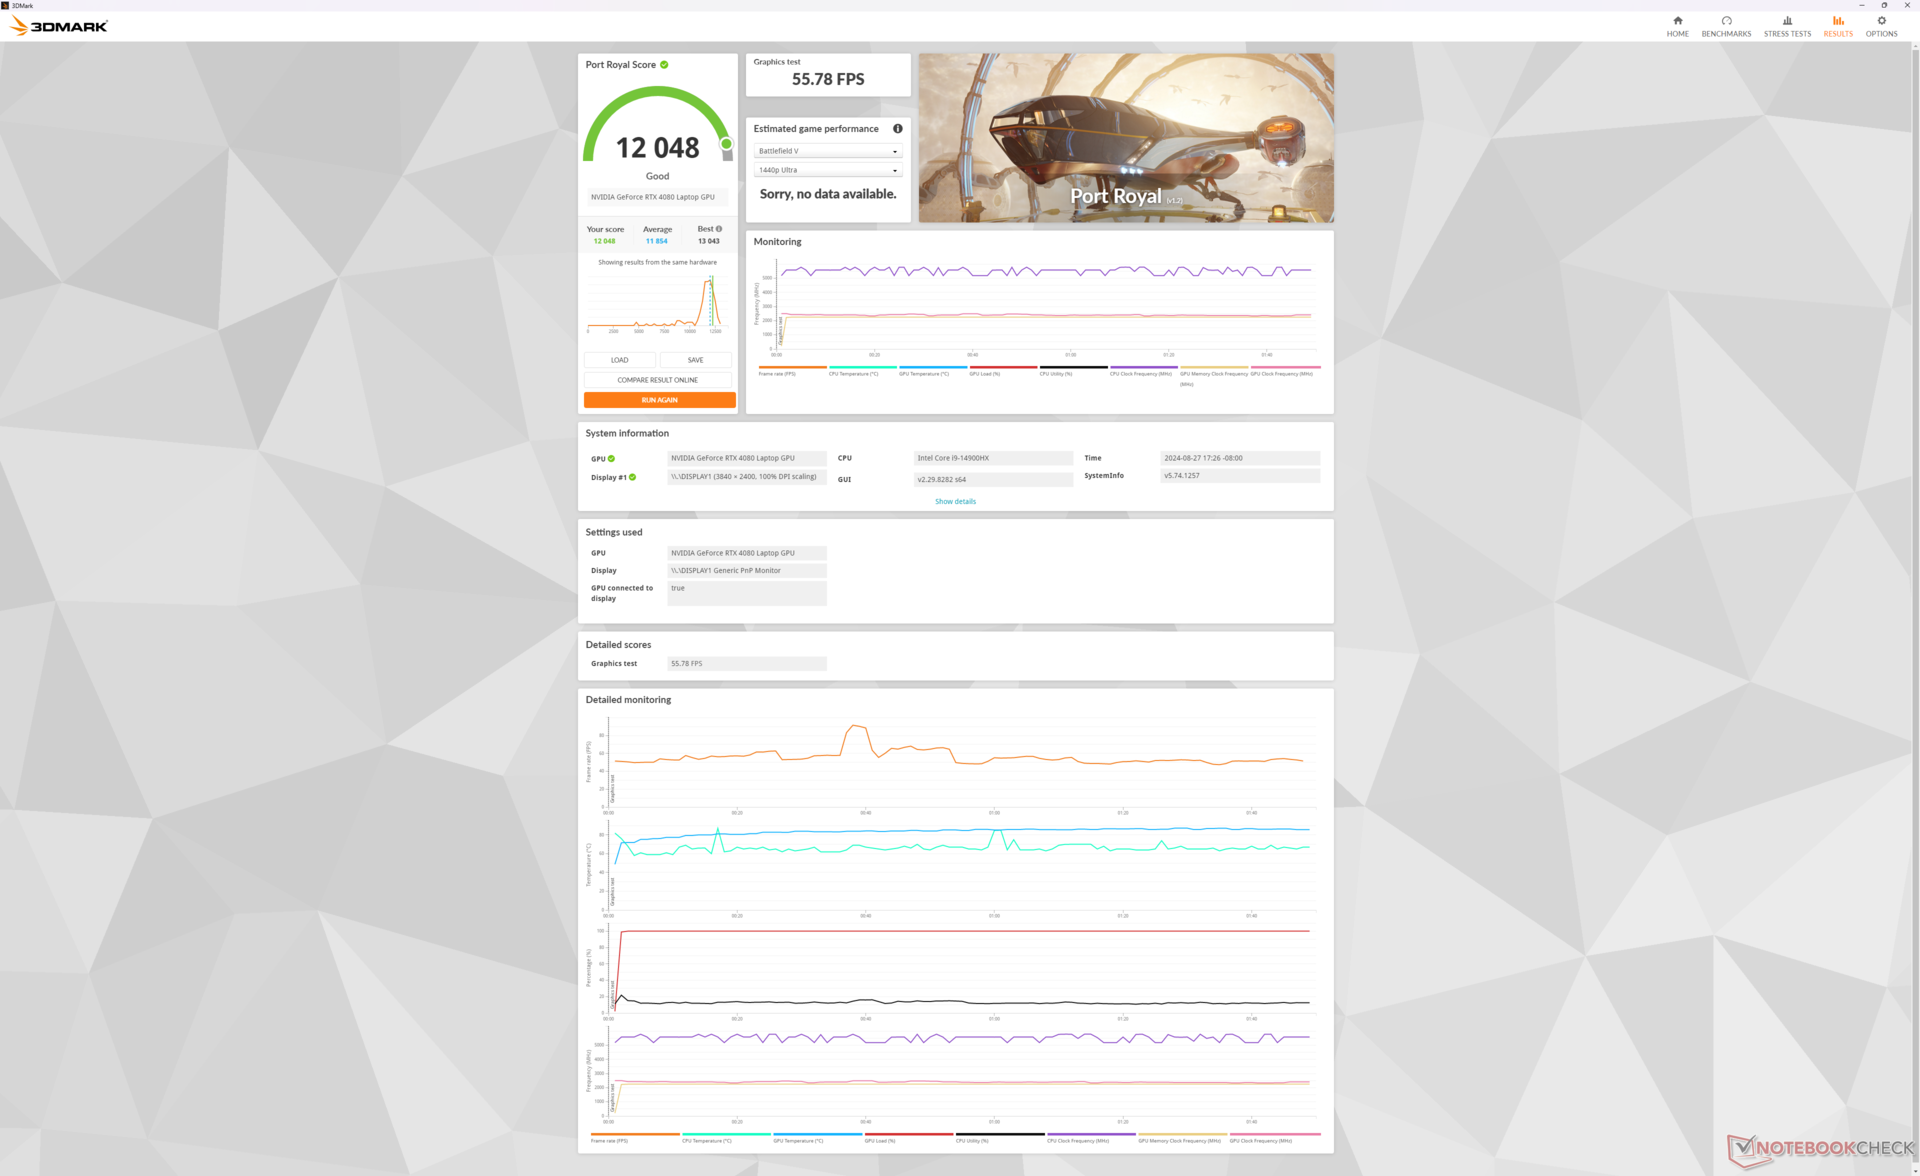
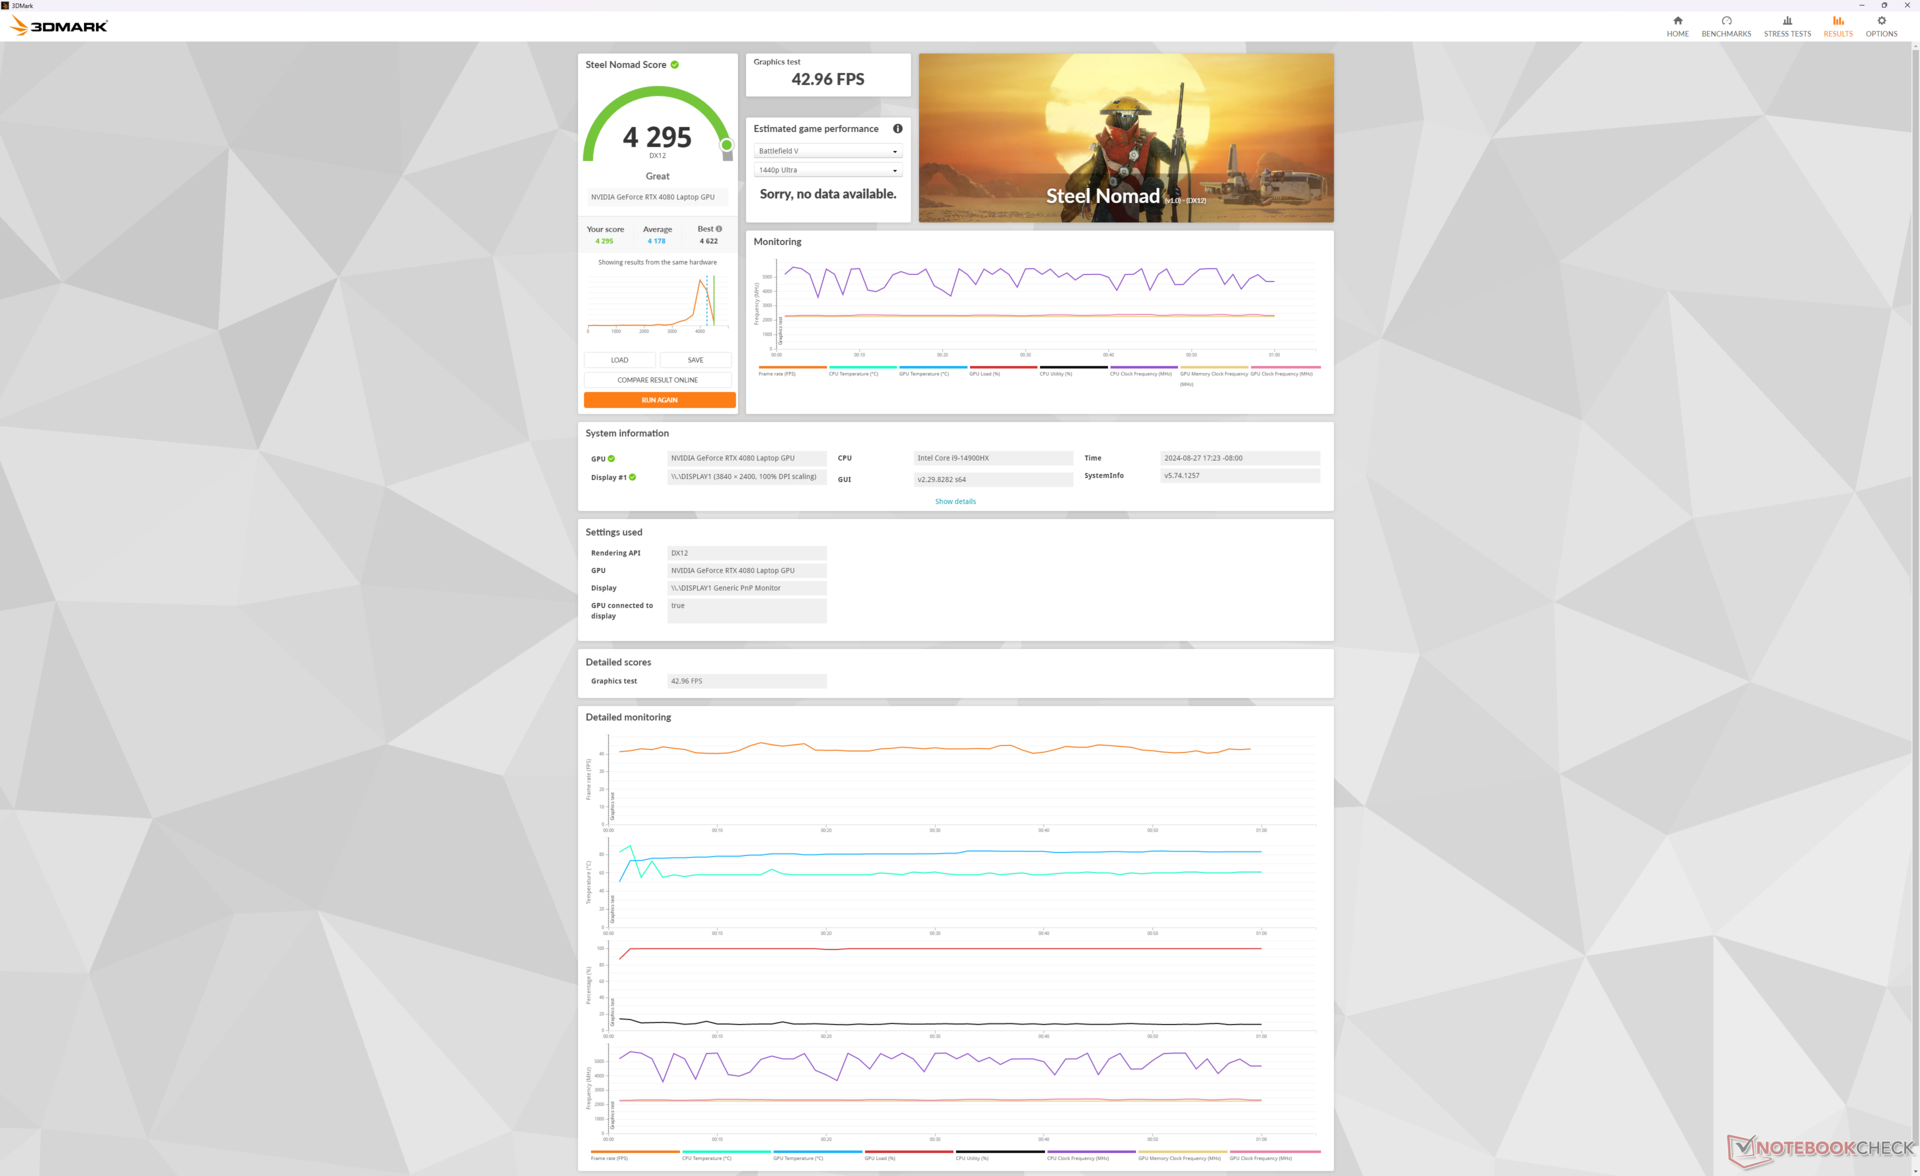
| 3DMark Steel Nomad Score | 4295 Punkte | |
Hilfe | ||
* ... kleinere Werte sind besser
Gaming Performance
Moderne Spiele laufen in der nativen 4K UHD+-Auflösung recht gut. Bei anspruchsvolleren Titeln wie Cyberpunk 2077 wird jedoch die Verwendung von DLSS empfohlen, um die Bildrate näher an 60 FPS heranzuführen.
Merkwürdigerweise ließ sich Baldur's Gate 3 auf unserem Gerät auch nach mehreren Systemresets weder im DX11- noch im DX12-Modus starten.
| Performance Rating - Percent | |
| Alienware m18 R2 | |
| MSI Titan 18 HX A14VIG | |
| MSI Raider 18 HX A14V | |
| Razer Blade 18 2024 RZ09-0509 -1! | |
| Acer Predator Helios 18 PH18-72-98MW | |
| Asus ROG Strix G18 G814JI | |
| GTA V - 1920x1080 Highest AA:4xMSAA + FX AF:16x | |
| MSI Raider 18 HX A14V | |
| MSI Titan 18 HX A14VIG | |
| Alienware m18 R2 | |
| Acer Predator Helios 18 PH18-72-98MW | |
| Razer Blade 18 2024 RZ09-0509 | |
| Asus ROG Strix G18 G814JI | |
| Final Fantasy XV Benchmark - 1920x1080 High Quality | |
| Alienware m18 R2 | |
| MSI Titan 18 HX A14VIG | |
| MSI Raider 18 HX A14V | |
| Acer Predator Helios 18 PH18-72-98MW | |
| Razer Blade 18 2024 RZ09-0509 | |
| Asus ROG Strix G18 G814JI | |
| Strange Brigade - 1920x1080 ultra AA:ultra AF:16 | |
| MSI Titan 18 HX A14VIG | |
| Alienware m18 R2 | |
| MSI Raider 18 HX A14V | |
| Razer Blade 18 2024 RZ09-0509 | |
| Acer Predator Helios 18 PH18-72-98MW | |
| Asus ROG Strix G18 G814JI | |
| Dota 2 Reborn - 1920x1080 ultra (3/3) best looking | |
| Acer Predator Helios 18 PH18-72-98MW | |
| MSI Titan 18 HX A14VIG | |
| MSI Raider 18 HX A14V | |
| Alienware m18 R2 | |
| Razer Blade 18 2024 RZ09-0509 | |
| Asus ROG Strix G18 G814JI | |
| X-Plane 11.11 - 1920x1080 high (fps_test=3) | |
| MSI Raider 18 HX A14V | |
| Alienware m18 R2 | |
| Razer Blade 18 2024 RZ09-0509 | |
| MSI Titan 18 HX A14VIG | |
| Acer Predator Helios 18 PH18-72-98MW | |
| Asus ROG Strix G18 G814JI | |
| Far Cry 5 - 1920x1080 Ultra Preset AA:T | |
| Alienware m18 R2 | |
| MSI Titan 18 HX A14VIG | |
| MSI Raider 18 HX A14V | |
| Asus ROG Strix G18 G814JI | |
| Acer Predator Helios 18 PH18-72-98MW | |
| Tiny Tina's Wonderlands | |
| 1920x1080 High Preset (DX12) | |
| Alienware m18 R2 | |
| MSI Raider 18 HX A14V | |
| Durchschnittliche NVIDIA GeForce RTX 4080 Laptop GPU (166.7 - 213, n=6) | |
| 1920x1080 Badass Preset (DX12) | |
| Alienware m18 R2 | |
| MSI Raider 18 HX A14V | |
| Alienware m18 R1 AMD | |
| Durchschnittliche NVIDIA GeForce RTX 4080 Laptop GPU (112.9 - 167.1, n=9) | |
| 2560x1440 Badass Preset (DX12) | |
| Alienware m18 R2 | |
| MSI Raider 18 HX A14V | |
| Alienware m18 R1 AMD | |
| Durchschnittliche NVIDIA GeForce RTX 4080 Laptop GPU (85 - 114.8, n=9) | |
| 3840x2160 Badass Preset (DX12) | |
| Alienware m18 R2 | |
| MSI Raider 18 HX A14V | |
| Alienware m18 R1 AMD | |
| Durchschnittliche NVIDIA GeForce RTX 4080 Laptop GPU (46.4 - 60.9, n=9) | |
Cyberpunk 2077 ultra FPS-Diagramm
| min. | mittel | hoch | max. | QHD | 4K | |
|---|---|---|---|---|---|---|
| GTA V (2015) | 185.1 | 183.8 | 181.6 | 143.4 | 134.6 | 158.3 |
| Dota 2 Reborn (2015) | 218 | 193.1 | 184.6 | 172.5 | 166.4 | |
| Final Fantasy XV Benchmark (2018) | 223 | 212 | 177 | 141.8 | 78.6 | |
| X-Plane 11.11 (2018) | 199 | 178.5 | 143.5 | 119.3 | ||
| Far Cry 5 (2018) | 173 | 163 | 151 | 149 | 96 | |
| Strange Brigade (2018) | 504 | 408 | 378 | 349 | 246 | 122.6 |
| Tiny Tina's Wonderlands (2022) | 352.5 | 292.6 | 203.3 | 159.4 | 111.2 | 60.9 |
| F1 22 (2022) | 305 | 299 | 271 | 121.2 | 77.8 | 39.8 |
| Cyberpunk 2077 (2023) | 150.6 | 150 | 140.7 | 125.5 | 82.5 | 35.1 |
Emissionen — Leise im Leerlauf, laut beim Spielen
Geräuschemissionen
Das Lüftergeräusch und das Lüfterverhalten sind trotz der unterschiedlichen Kühllösungen dem des Titan 18 HX sehr ähnlich. Die Lüfter neigen dazu, selbst beim Surfen im Internet im Balanced- oder Silent-Modus zu pulsieren, ähnlich wie beim Titan. Glücklicherweise ist der Anstieg des Geräuschpegels jedoch nicht stark genug, um störend zu wirken.
MSI Center beeinflusst das Spielerlebnis direkt, da das Lüftergeräusch stark vom gewählten Energieprofil abhängt. Cyberpunk 2077 erzeugt im Balanced-Modus, im Extreme-Performance-Modus ohne Cooler Boost und im Extreme-Performance-Modus mit Cooler Boost ein stabiles Lüftergeräusch von 52,8 dB(A), 59,4 dB(A) bzw. 62,7 dB(A). Der Geräuschunterschied zwischen den Modi Balanced-Modus und Extreme-Performance-Modus ist deutlich, auch wenn der Leistungsunterschied gering ist, was den Balanced-Modus für die meisten Spielszenarien empfehlenswert macht. Cooler Boost ist vor allem für manuelles Übertakten nützlich, da er in den Standardeinstellungen keine wesentlichen Vorteile für das Spielen bietet.
Der niedrige bis mittlere 50 dB(A)-Bereich beim Spielen ist vergleichbar mit dem Blade 18 oder Alienware m18 R2. Kopfhörer werden besonders empfohlen, wenn im Extreme-Performance-Modus gespielt wird.
Lautstärkediagramm
| Idle |
| 28.6 / 28.6 / 31.3 dB(A) |
| Last |
| 44.1 / 62.7 dB(A) |
 | ||
30 dB leise 40 dB(A) deutlich hörbar 50 dB(A) störend |
||
min: | ||
| MSI Raider 18 HX A14V GeForce RTX 4080 Laptop GPU, i9-14900HX, Samsung PM9A1 MZVL22T0HBLB | Razer Blade 18 2024 RZ09-0509 GeForce RTX 4090 Laptop GPU, i9-14900HX | Alienware m18 R2 GeForce RTX 4090 Laptop GPU, i9-14900HX, SK Hynix PC811 HFS002TEM9X152N | MSI Titan 18 HX A14VIG GeForce RTX 4090 Laptop GPU, i9-14900HX, 2x Samsung PM9A1a MZVL22T0HDLB (RAID 0) | Asus ROG Strix G18 G814JI GeForce RTX 4070 Laptop GPU, i7-13650HX, Micron 2400 MTFDKBA1T0QFM | Acer Predator Helios 18 PH18-72-98MW GeForce RTX 4090 Laptop GPU, i9-14900HX, 2x SK Hynix HFS001TEJ9X115N (RAID 0) | |
|---|---|---|---|---|---|---|
| Geräuschentwicklung | 7% | 11% | 10% | 8% | -12% | |
| aus / Umgebung * (dB) | 23.3 | 23.4 -0% | 23.6 -1% | 22.8 2% | 25 -7% | 25 -7% |
| Idle min * (dB) | 28.6 | 23.9 16% | 23.8 17% | 23.8 17% | 26 9% | 30 -5% |
| Idle avg * (dB) | 28.6 | 28.2 1% | 26.1 9% | 23.8 17% | 28 2% | 36 -26% |
| Idle max * (dB) | 31.3 | 29 7% | 31.5 -1% | 28 11% | 29 7% | 44 -41% |
| Last avg * (dB) | 44.1 | 36.8 17% | 31.5 29% | 38 14% | 41 7% | 48 -9% |
| Cyberpunk 2077 ultra * (dB) | 59.4 | |||||
| Last max * (dB) | 62.7 | 61.1 3% | 56.6 10% | 62.8 -0% | 46 27% | 51 19% |
| Witcher 3 ultra * (dB) | 54.1 | 52.1 | 57.3 | 44 | 49 |
* ... kleinere Werte sind besser
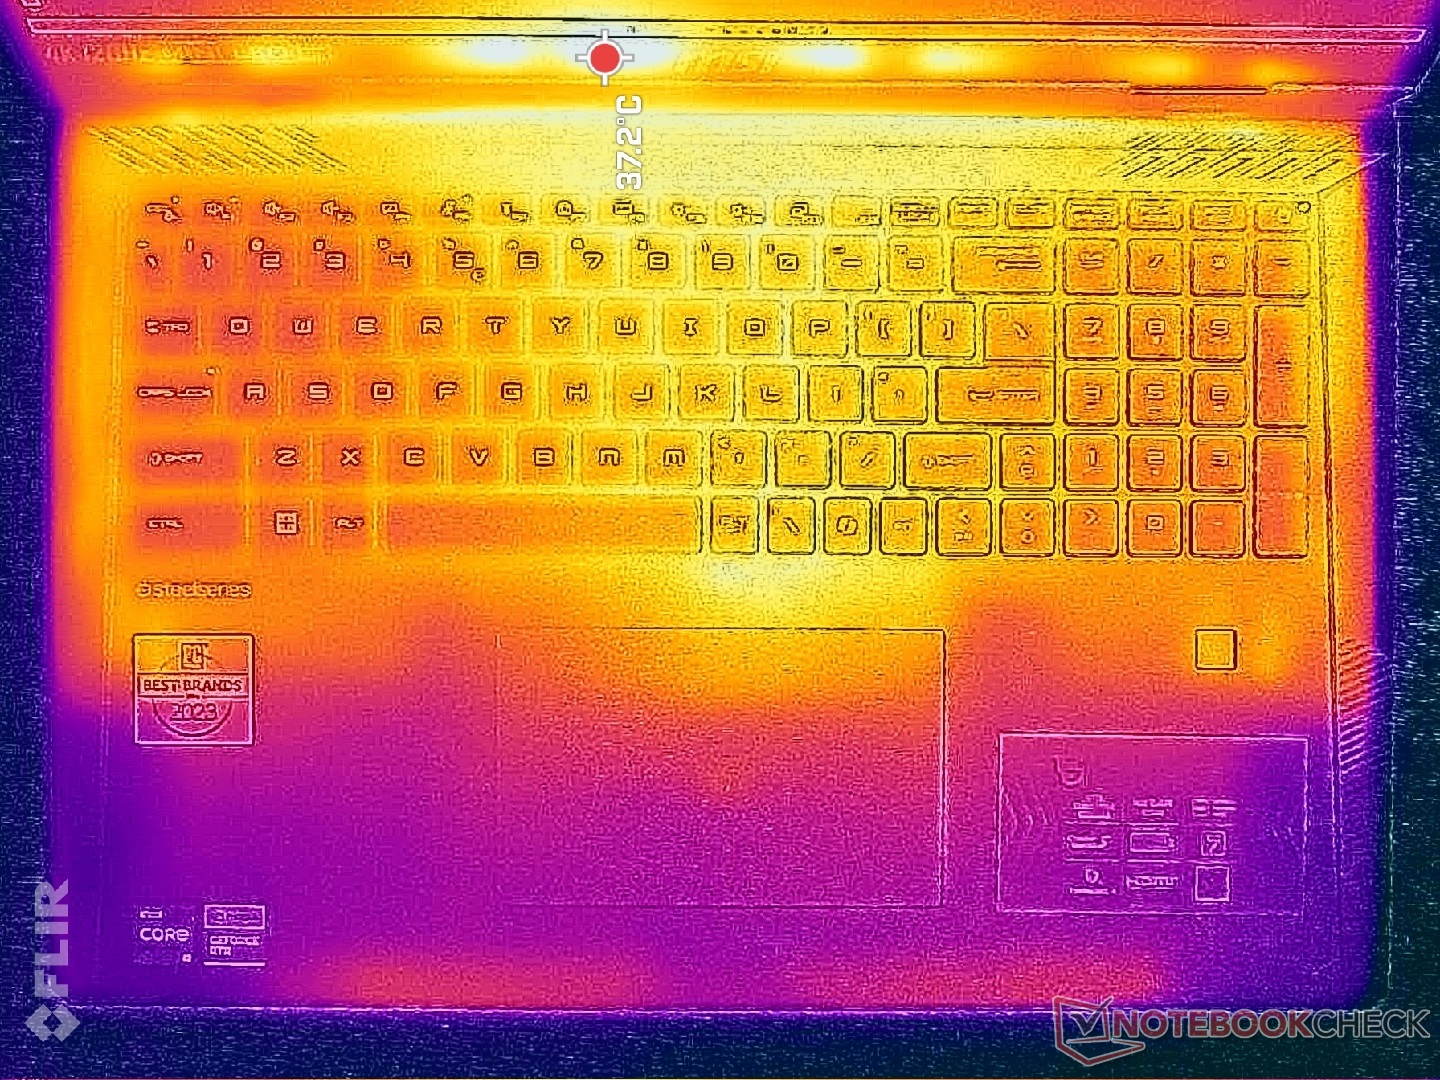
Temperatur
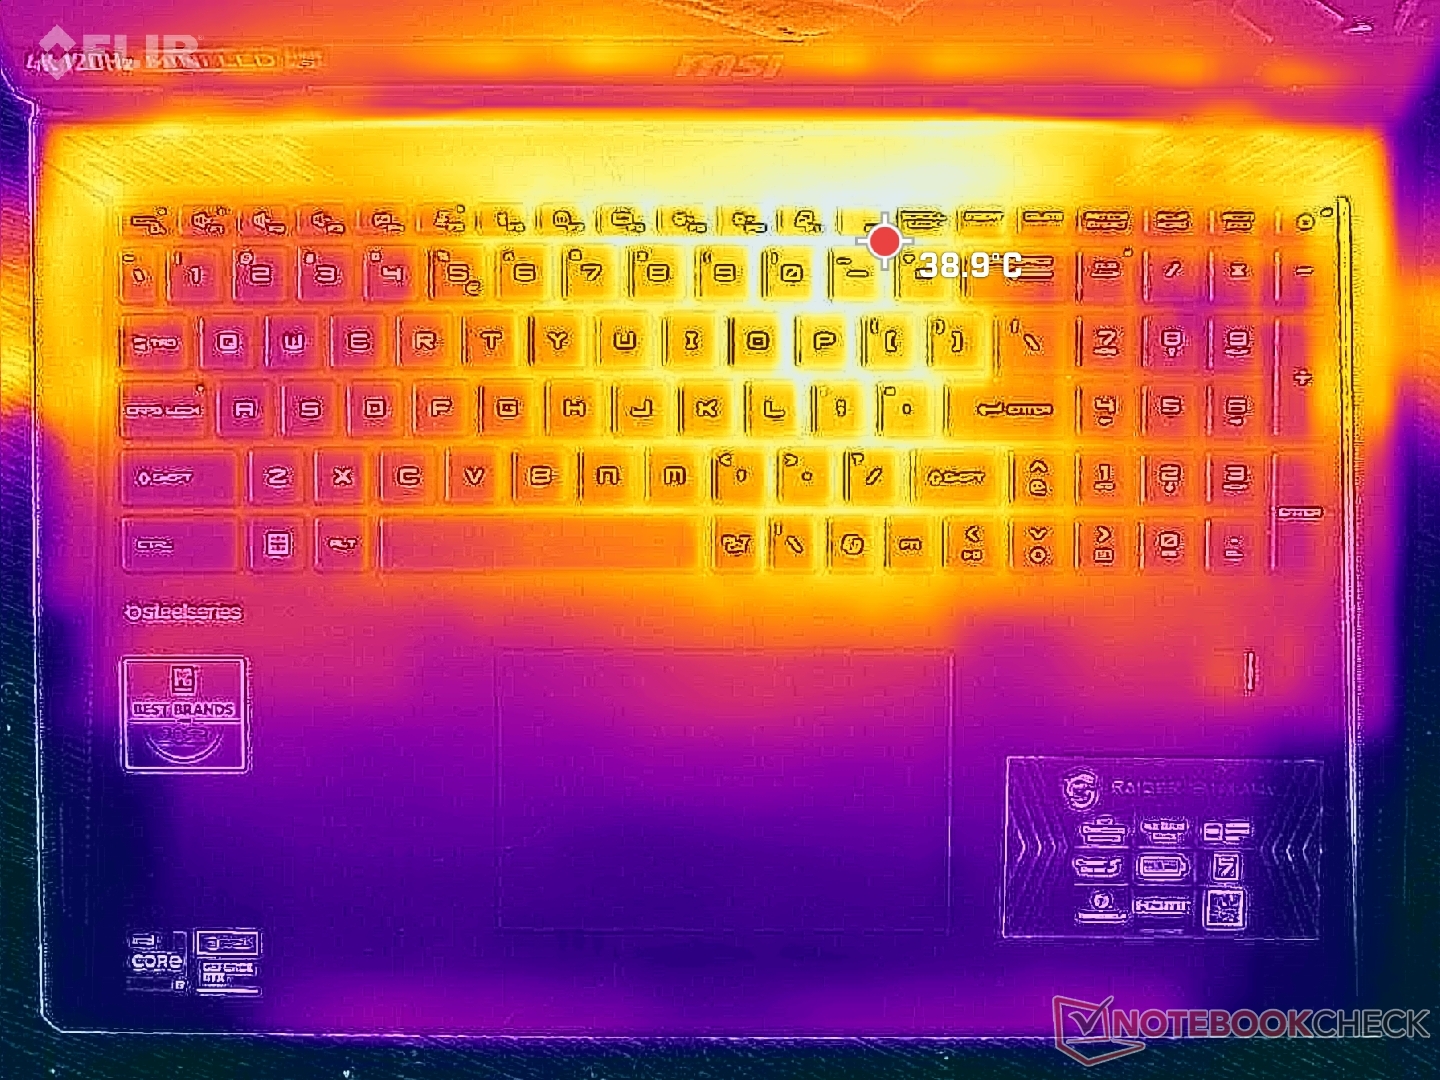
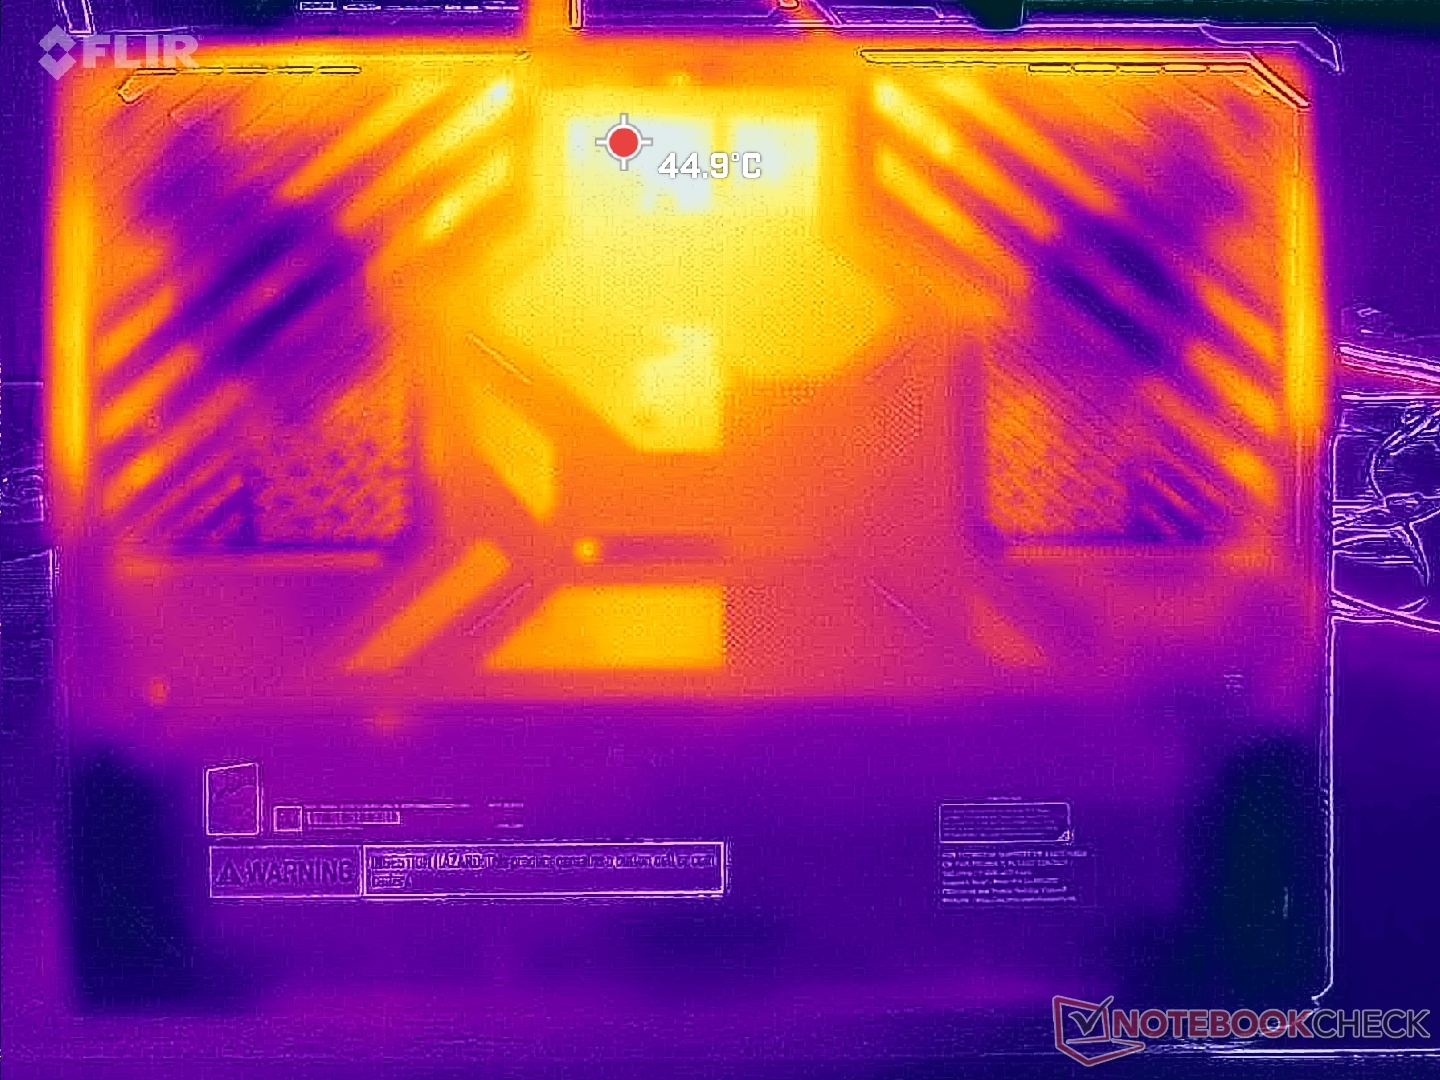
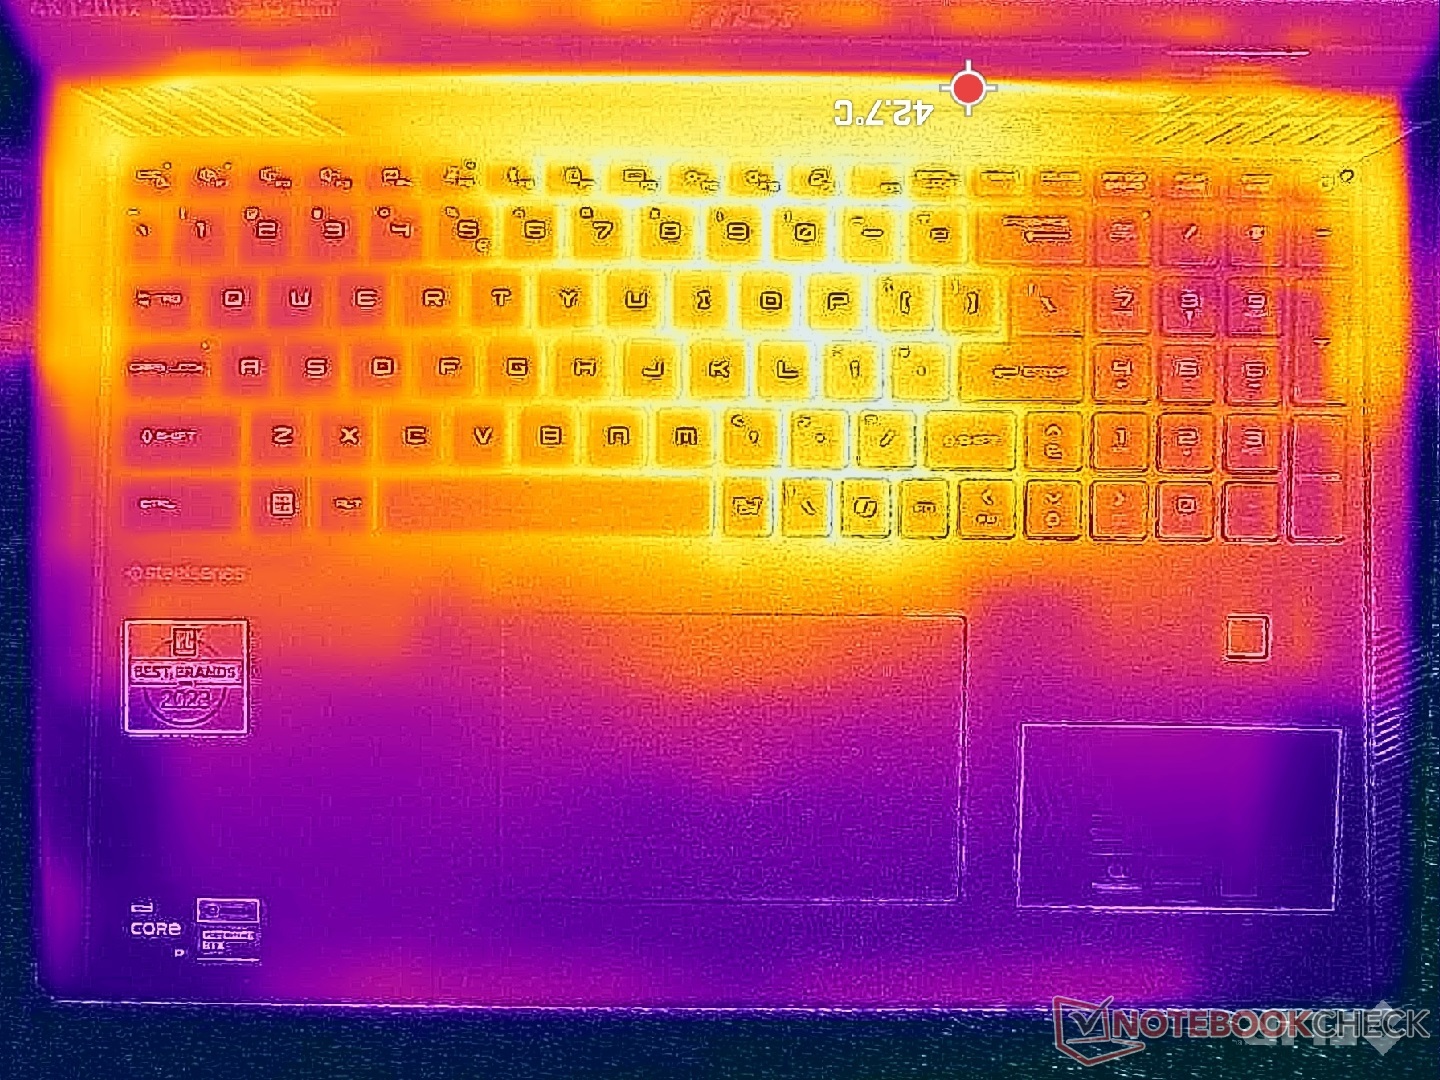
Wie beim Titan 18 HX können beim Spielen Temperaturspitzen von knapp über 40 °C erreicht werden. Die heißesten Bereiche befinden sich in der Mitte der Tastatur, während die WASD-Tasten, der Ziffernblock und die Handballenauflagen deutlich kühler und damit angenehmer für die Haut bleiben.
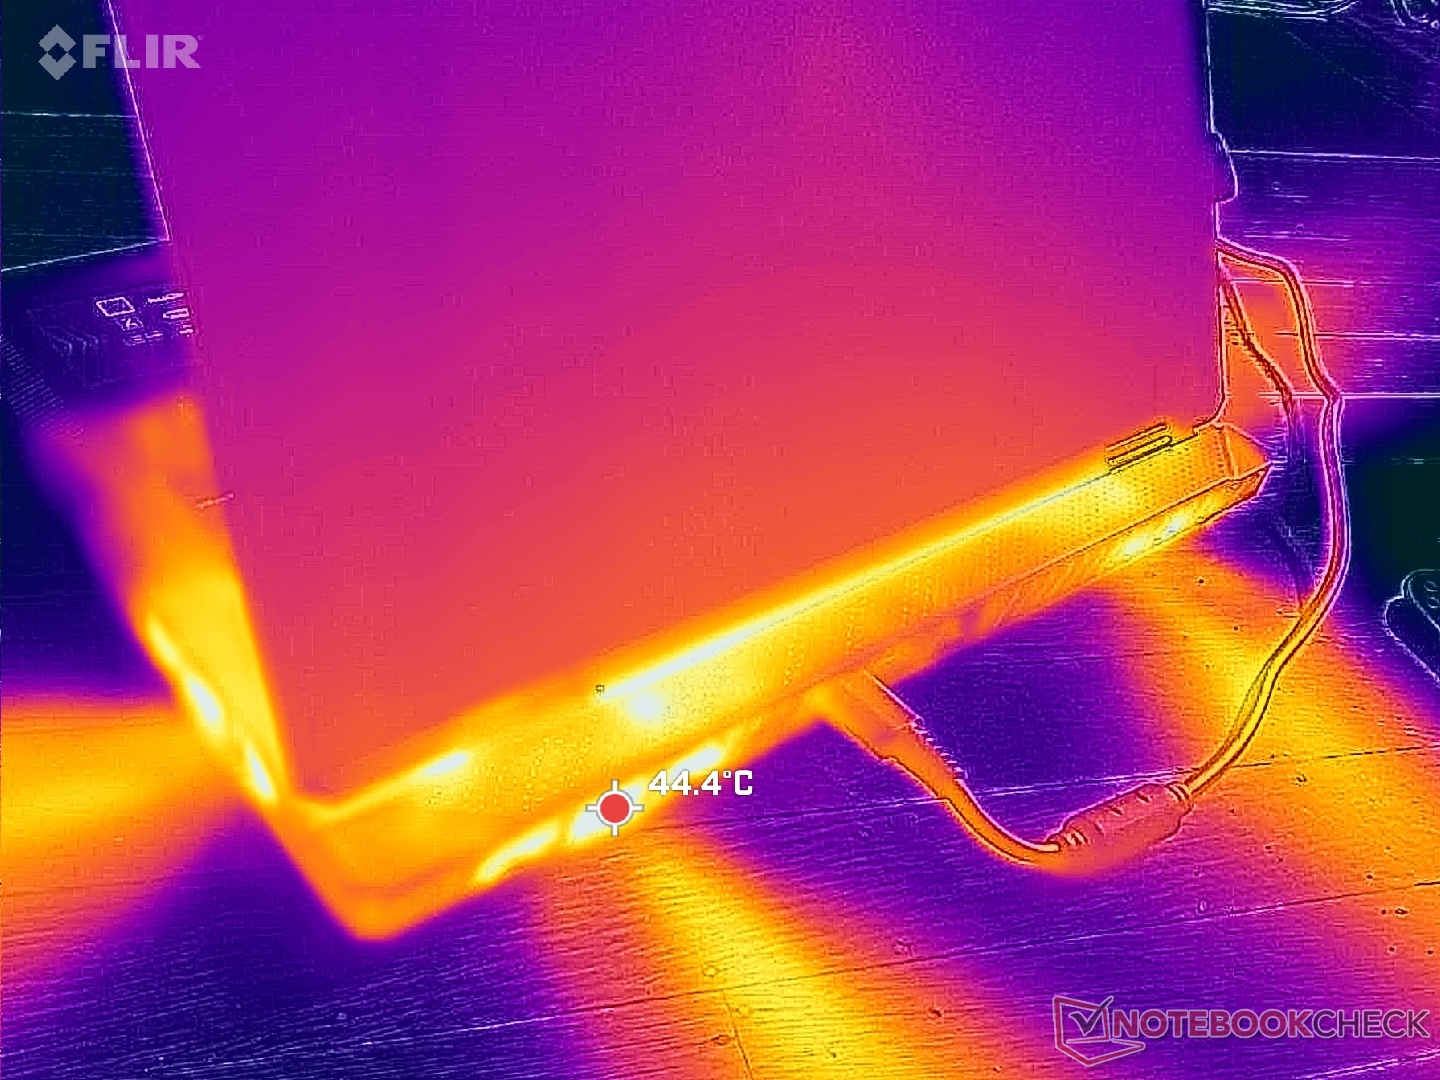
(±) Die maximale Temperatur auf der Oberseite ist 40.8 °C. Im Vergleich liegt der Klassendurchschnitt bei 40.4 °C (von 21.2 bis 68.8 °C für die Klasse Gaming).
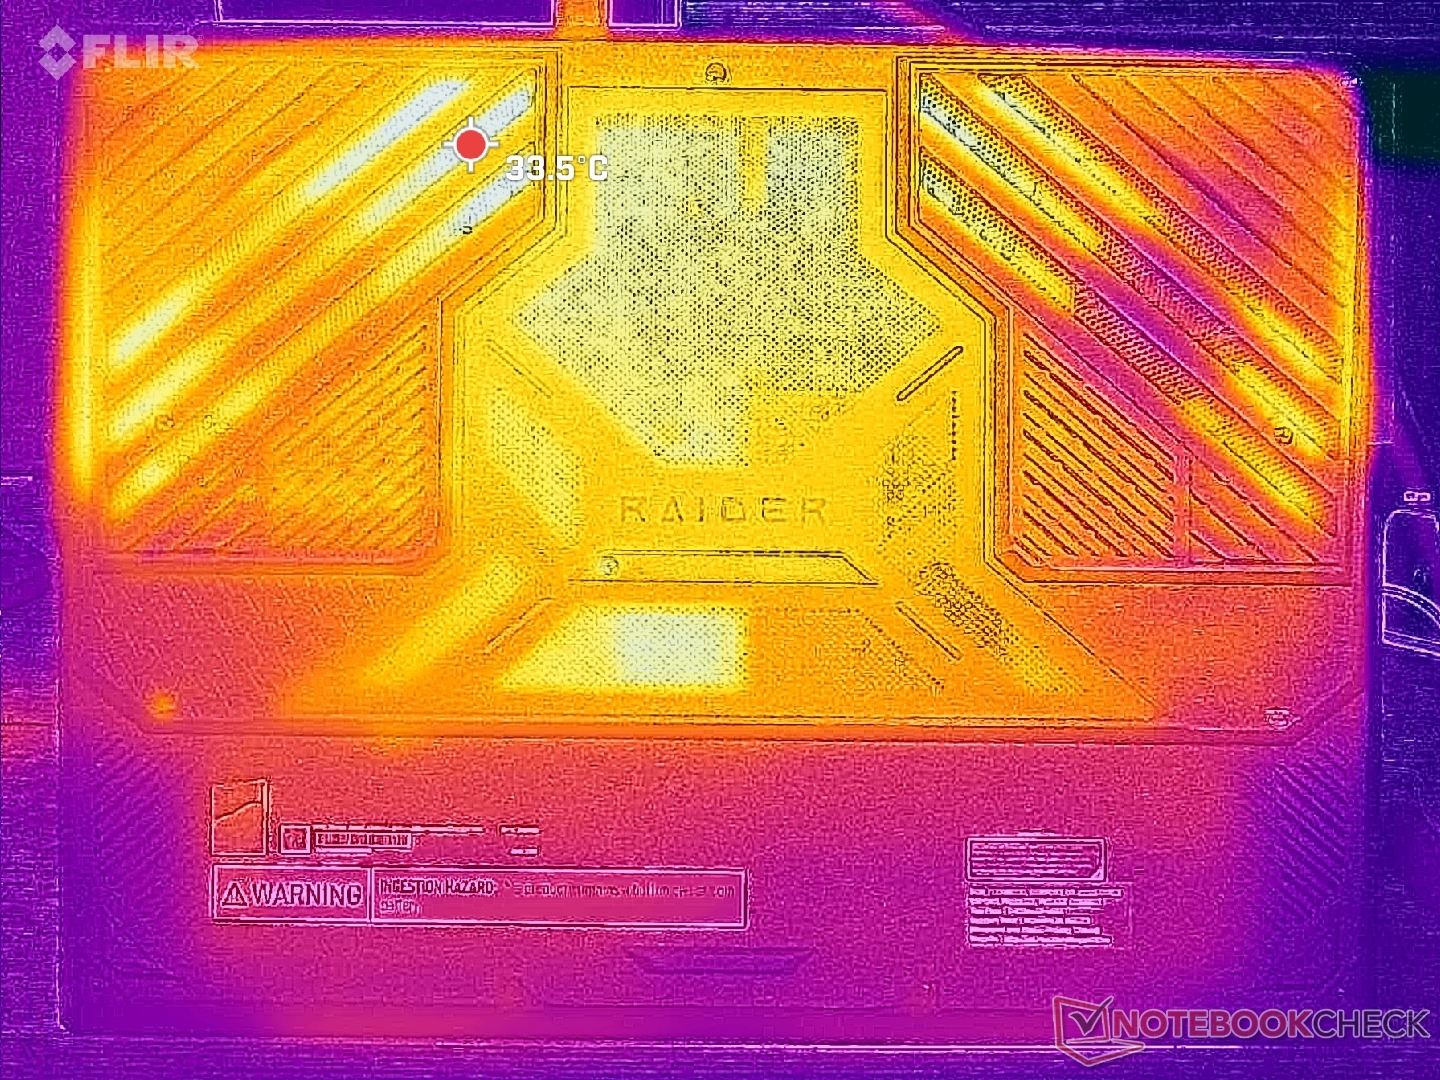
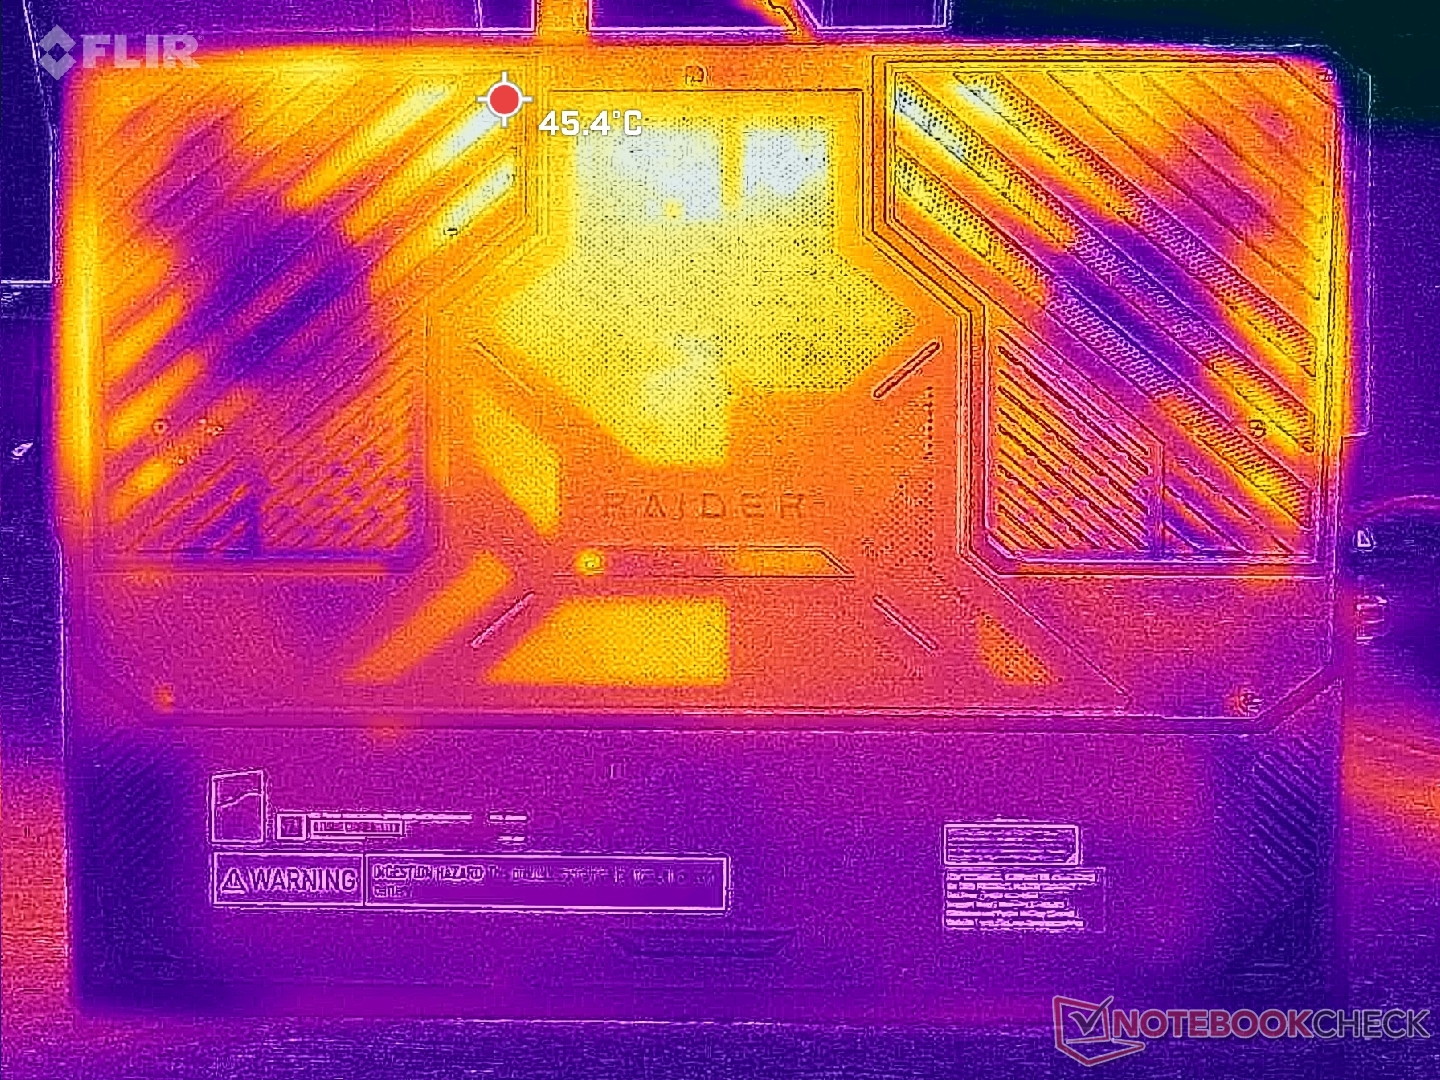
(±) Auf der Unterseite messen wir eine maximalen Wert von 43.4 °C (im Vergleich zum Durchschnitt von 43.3 °C).
(±) Ohne Last messen wir eine durchschnittliche Temperatur von 33.7 °C auf der Oberseite. Der Klassendurchschnitt erreicht 33.9 °C.
(±) 3: The average temperature for the upper side is 34.4 °C / 94 F, compared to the average of 33.9 °C / 93 F for the class Gaming.
(+) Die Handballen und der Touchpad-Bereich erreichen maximal 32.6 °C und damit die typische Hauttemperatur und fühlen sich daher nicht heiß an.
(-) Die durchschnittliche Handballen-Temperatur anderer getesteter Geräte war 28.8 °C (-3.8 °C).
| MSI Raider 18 HX A14V Intel Core i9-14900HX, NVIDIA GeForce RTX 4080 Laptop GPU | Razer Blade 18 2024 RZ09-0509 Intel Core i9-14900HX, NVIDIA GeForce RTX 4090 Laptop GPU | Alienware m18 R2 Intel Core i9-14900HX, NVIDIA GeForce RTX 4090 Laptop GPU | MSI Titan 18 HX A14VIG Intel Core i9-14900HX, NVIDIA GeForce RTX 4090 Laptop GPU | Asus ROG Strix G18 G814JI Intel Core i7-13650HX, NVIDIA GeForce RTX 4070 Laptop GPU | Acer Predator Helios 18 PH18-72-98MW Intel Core i9-14900HX, NVIDIA GeForce RTX 4090 Laptop GPU | |
|---|---|---|---|---|---|---|
| Hitze | -1% | -5% | 6% | 5% | -6% | |
| Last oben max * (°C) | 40.8 | 43.2 -6% | 41.2 -1% | 37.8 7% | 45 -10% | 43 -5% |
| Last unten max * (°C) | 43.4 | 42.6 2% | 34.6 20% | 37.6 13% | 47 -8% | 59 -36% |
| Idle oben max * (°C) | 36.4 | 36 1% | 42.8 -18% | 34.8 4% | 28 23% | 32 12% |
| Idle unten max * (°C) | 36.4 | 36.4 -0% | 43.6 -20% | 36 1% | 31 15% | 34 7% |
* ... kleinere Werte sind besser
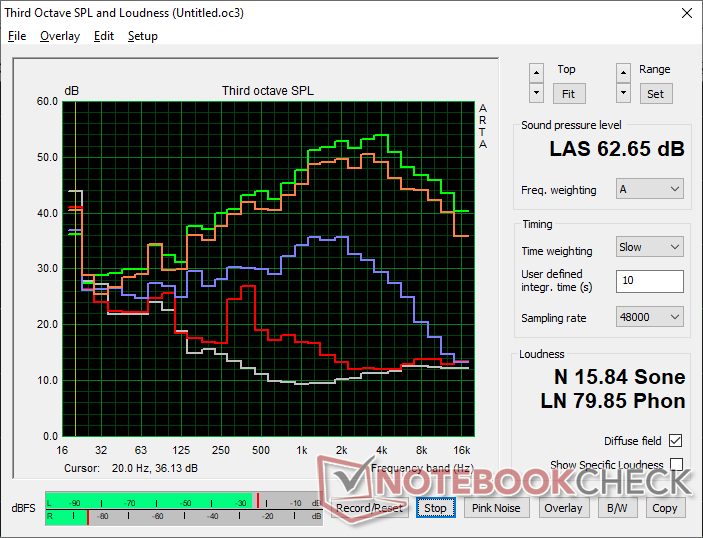
Lautsprecher
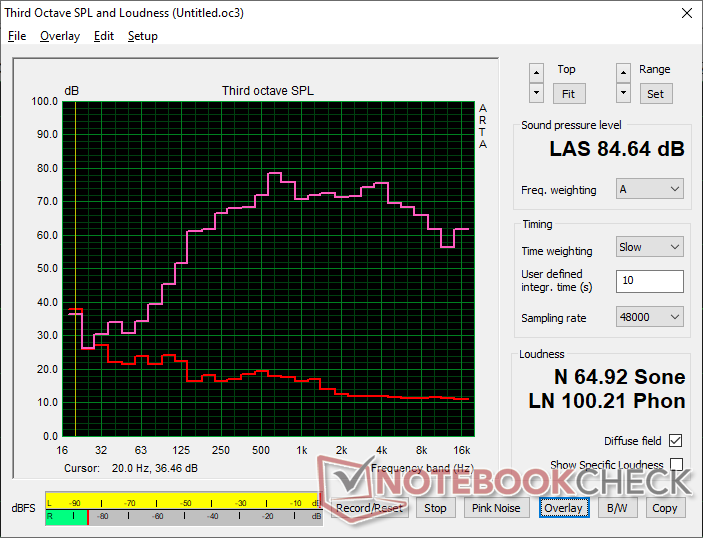
MSI Raider 18 HX A14V Audio Analyse
(+) | Die Lautsprecher können relativ laut spielen (84.6 dB)
Bass 100 - 315 Hz
(±) | abgesenkter Bass - 9.2% geringer als der Median
(±) | durchschnittlich lineare Bass-Wiedergabe (9.2% Delta zum Vorgänger)
Mitteltöne 400 - 2000 Hz
(+) | ausgeglichene Mitten, vom Median nur 4.3% abweichend
(+) | lineare Mitten (5.1% Delta zum Vorgänger)
Hochtöne 2 - 16 kHz
(+) | ausgeglichene Hochtöne, vom Median nur 3.8% abweichend
(+) | sehr lineare Hochtöne (4.9% Delta zum Vorgänger)
Gesamt im hörbaren Bereich 100 - 16.000 Hz
(+) | hörbarer Bereich ist sehr linear (11.9% Abstand zum Median
Im Vergleich zu allen Geräten derselben Klasse
» 12% aller getesteten Geräte dieser Klasse waren besser, 4% vergleichbar, 85% schlechter
» Das beste Gerät hat einen Delta-Wert von 6%, durchschnittlich ist 18%, das schlechteste Gerät hat 132%
Im Vergleich zu allen Geräten im Test
» 8% aller getesteten Geräte waren besser, 2% vergleichbar, 89% schlechter
» Das beste Gerät hat einen Delta-Wert von 4%, durchschnittlich ist 24%, das schlechteste Gerät hat 134%
Apple MacBook Pro 16 2021 M1 Pro Audio Analyse
(+) | Die Lautsprecher können relativ laut spielen (84.7 dB)
Bass 100 - 315 Hz
(+) | guter Bass - nur 3.8% Abweichung vom Median
(+) | lineare Bass-Wiedergabe (5.2% Delta zum Vorgänger)
Mitteltöne 400 - 2000 Hz
(+) | ausgeglichene Mitten, vom Median nur 1.3% abweichend
(+) | lineare Mitten (2.1% Delta zum Vorgänger)
Hochtöne 2 - 16 kHz
(+) | ausgeglichene Hochtöne, vom Median nur 1.9% abweichend
(+) | sehr lineare Hochtöne (2.7% Delta zum Vorgänger)
Gesamt im hörbaren Bereich 100 - 16.000 Hz
(+) | hörbarer Bereich ist sehr linear (4.6% Abstand zum Median
Im Vergleich zu allen Geräten derselben Klasse
» 0% aller getesteten Geräte dieser Klasse waren besser, 0% vergleichbar, 100% schlechter
» Das beste Gerät hat einen Delta-Wert von 5%, durchschnittlich ist 17%, das schlechteste Gerät hat 45%
Im Vergleich zu allen Geräten im Test
» 0% aller getesteten Geräte waren besser, 0% vergleichbar, 100% schlechter
» Das beste Gerät hat einen Delta-Wert von 4%, durchschnittlich ist 24%, das schlechteste Gerät hat 134%
Energieverwaltung
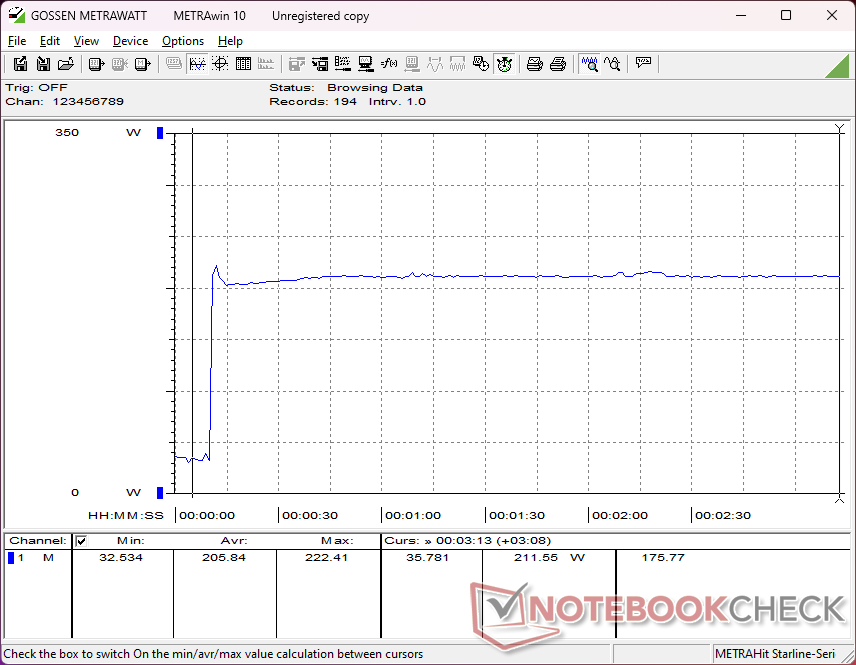
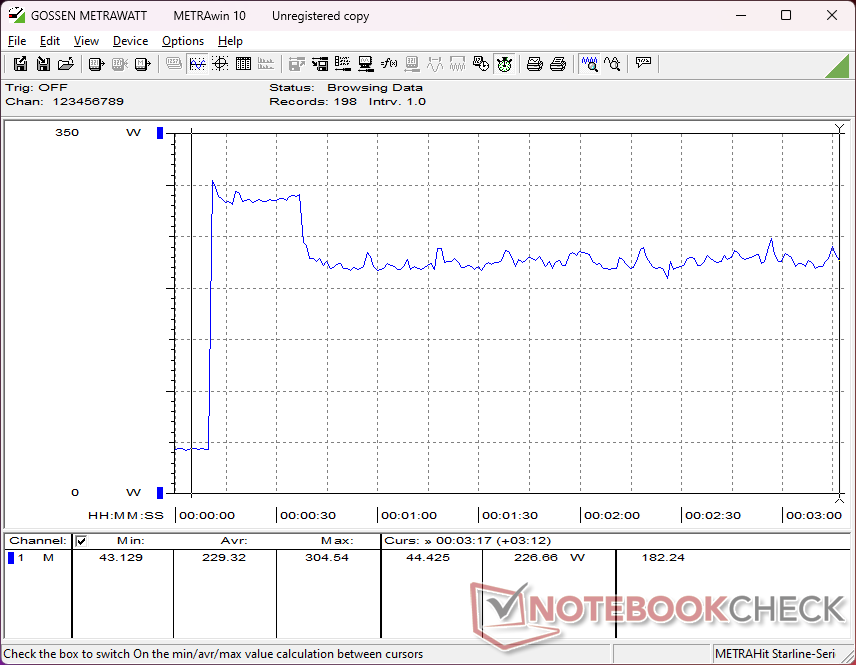
Energieaufnahme
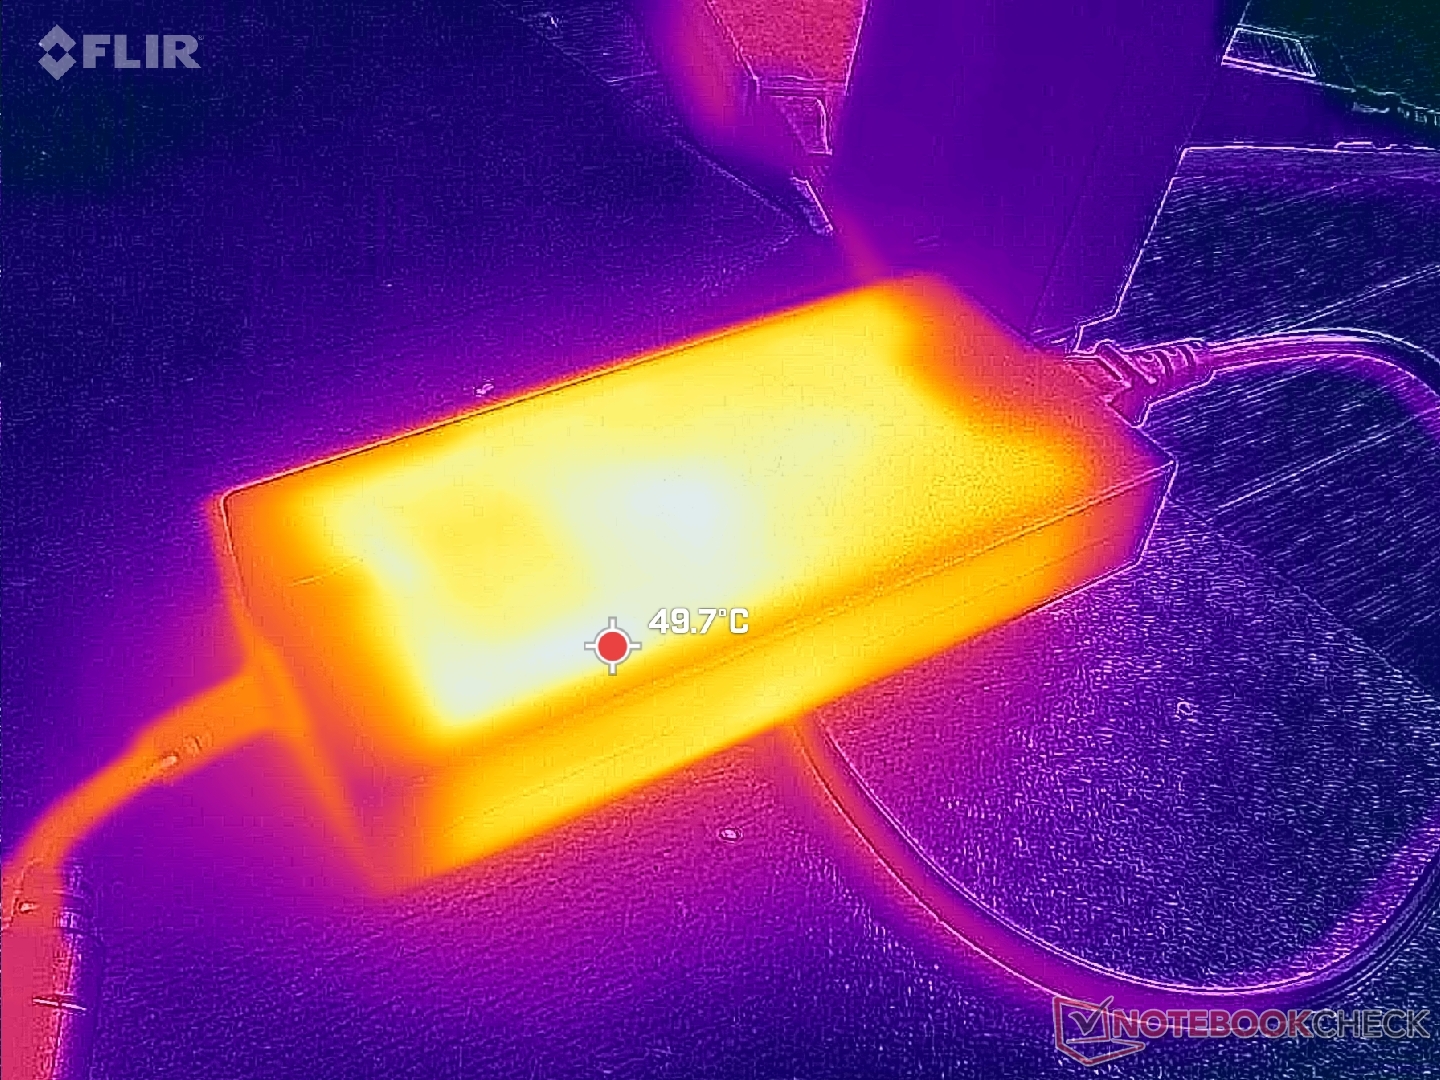
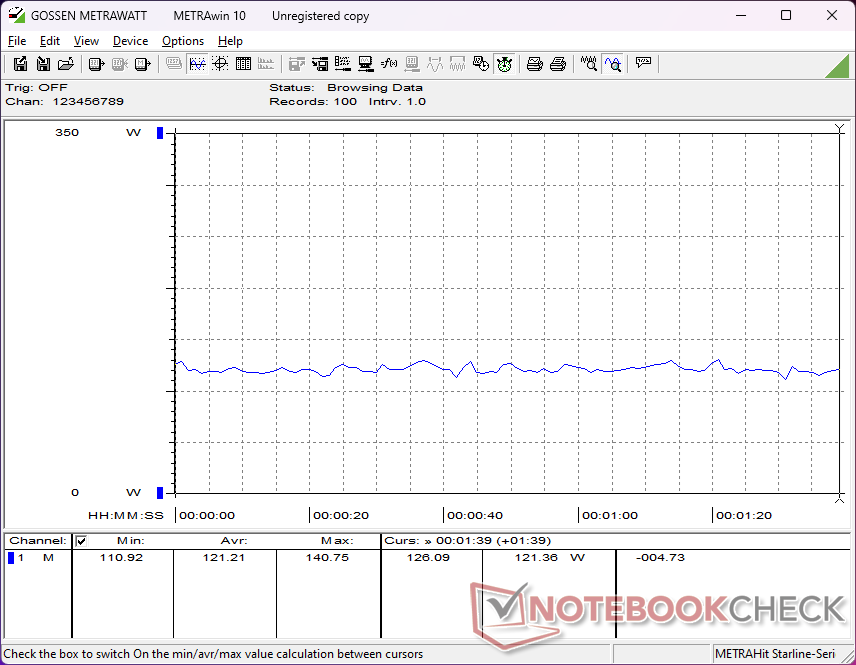
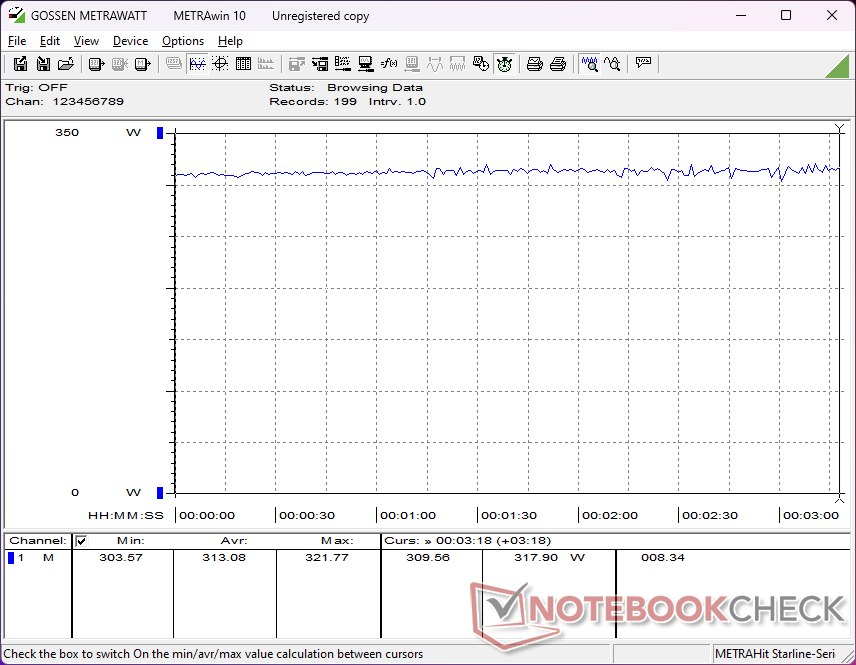
Der Gesamtenergieverbrauch ist erwartungsgemäß sehr hoch, wie es bei einem 18-Zoll-Desktop-Replacement (DTR) mit einem anspruchsvollen 4K-Mini-LED-Panel der Fall ist. Im Leerlauf auf dem Desktop variiert der Verbrauch je nach Helligkeitseinstellung, GPU-Konfiguration und Energieprofil zwischen 27 W und 48 W. Beim Gaming steigt der Verbrauch auf über 300 W, im Vergleich zu nur 220 W beim Acer Predator Helios 18.
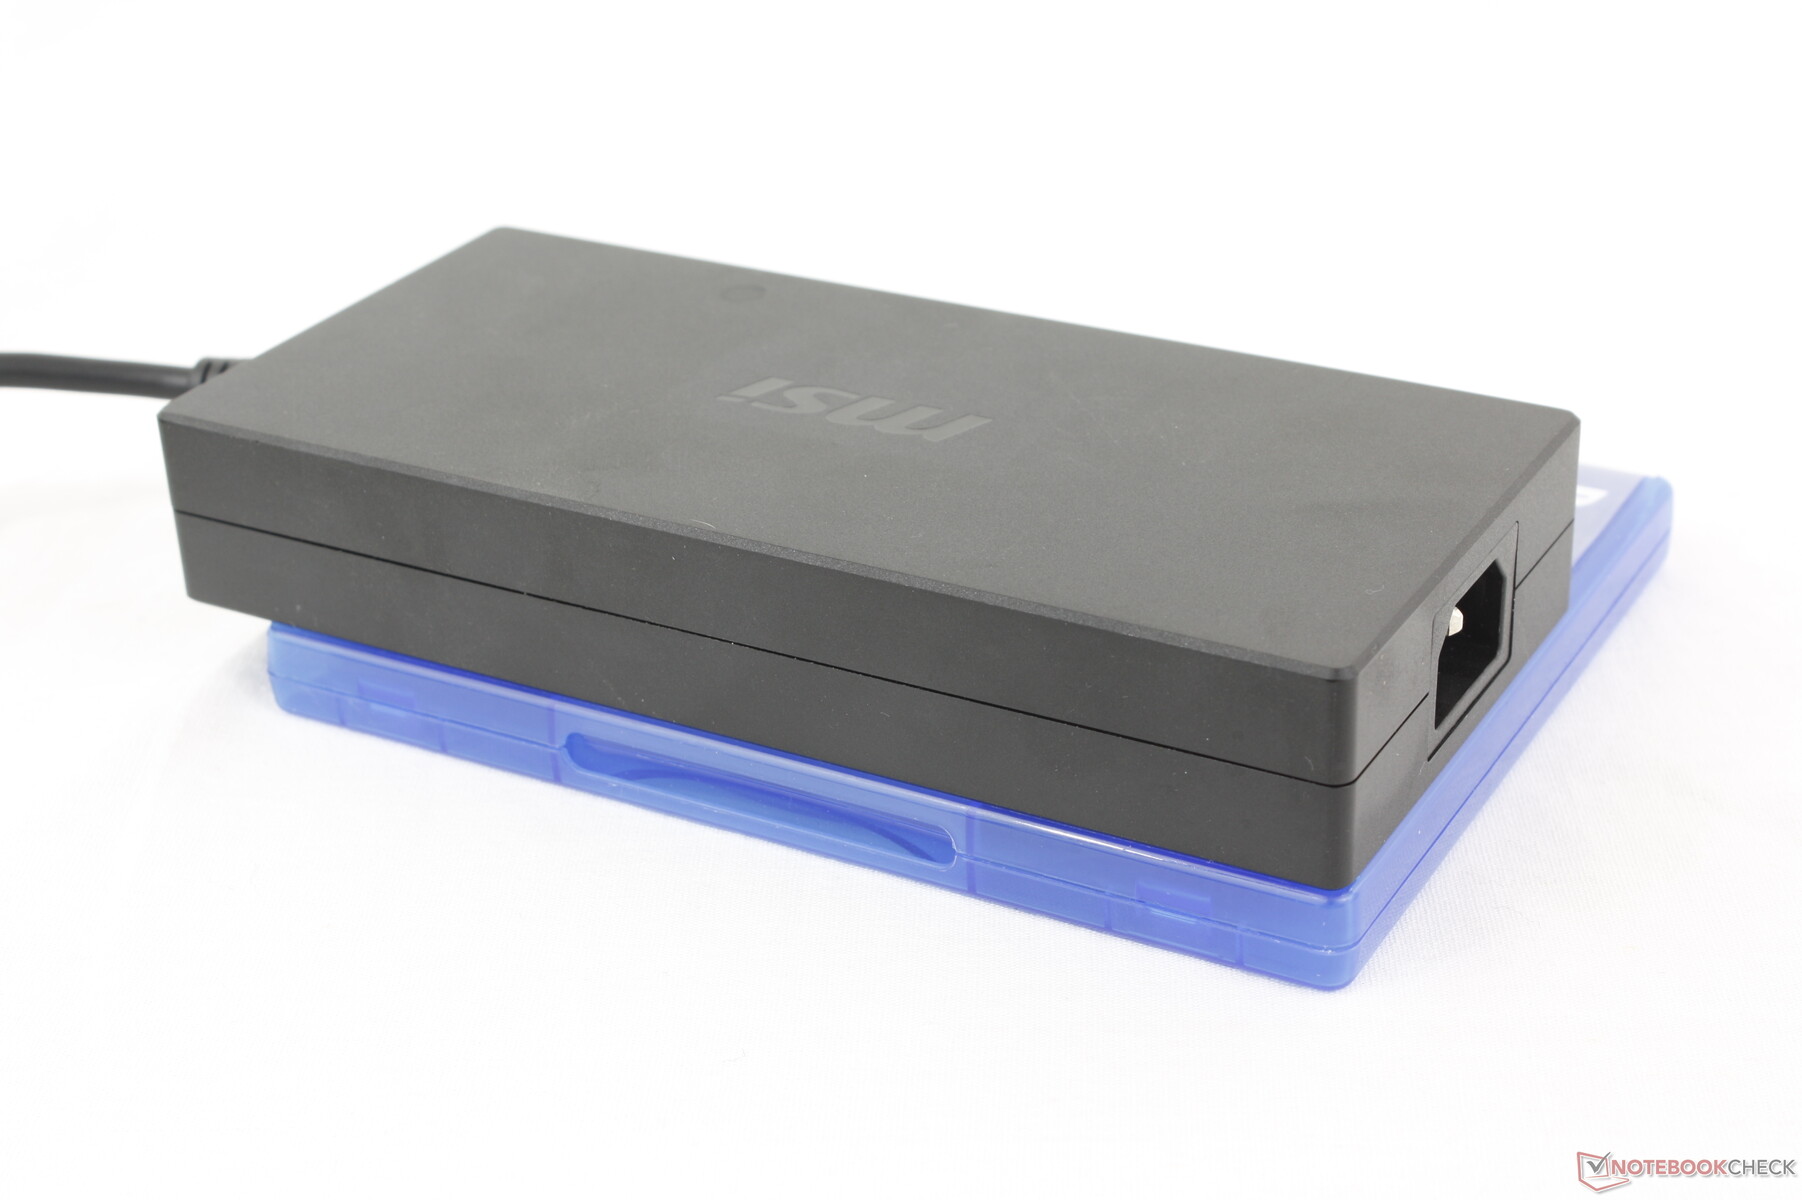
Mit dem großen 330-W-Netzteil konnten wir einen Spitzenverbrauch von bis zu 322 W verzeichnen. Im Vergleich zum 400-W-Netzteil des Titan 18 HX ist das 330-W-Netzteil etwas kompakter (~18,4 x 8,4 x 3,1 cm vs. ~18,8 x 8,8 x 3,2 cm). Der Energieverbrauch bei CPU-intensiven Aufgaben ist beim Raider 18 HX insgesamt niedriger, obwohl er mit der gleichen CPU wie der Titan 18 HX ausgestattet ist, was mit der etwas langsameren CPU-Leistung übereinstimmt, die wir in unserem CineBench-Abschnitt weiter oben gemessen haben.
| Aus / Standby | |
| Idle | |
| Last |
|
Legende:
min: | |
| MSI Raider 18 HX A14V i9-14900HX, GeForce RTX 4080 Laptop GPU, Samsung PM9A1 MZVL22T0HBLB, Mini-LED, 3840x2400, 18" | Razer Blade 18 2024 RZ09-0509 i9-14900HX, GeForce RTX 4090 Laptop GPU, , Mini-LED, 2560x1600, 18" | Alienware m18 R2 i9-14900HX, GeForce RTX 4090 Laptop GPU, SK Hynix PC811 HFS002TEM9X152N, IPS, 2560x1600, 18" | MSI Titan 18 HX A14VIG i9-14900HX, GeForce RTX 4090 Laptop GPU, 2x Samsung PM9A1a MZVL22T0HDLB (RAID 0), Mini-LED, 3840x2400, 18" | Asus ROG Strix G18 G814JI i7-13650HX, GeForce RTX 4070 Laptop GPU, Micron 2400 MTFDKBA1T0QFM, IPS, 2560x1600, 18" | Acer Predator Helios 18 PH18-72-98MW i9-14900HX, GeForce RTX 4090 Laptop GPU, 2x SK Hynix HFS001TEJ9X115N (RAID 0), Mini-LED, 2560x1600, 18" | |
|---|---|---|---|---|---|---|
| Stromverbrauch | -2% | 8% | 5% | 42% | -2% | |
| Idle min * (Watt) | 27.7 | 25.4 8% | 10.6 62% | 13.2 52% | 8 71% | 31 -12% |
| Idle avg * (Watt) | 38.3 | 37.7 2% | 20.9 45% | 25.4 34% | 15 61% | 35 9% |
| Idle max * (Watt) | 47.1 | 57.9 -23% | 40 15% | 53.5 -14% | 26 45% | 43 9% |
| Last avg * (Watt) | 121.2 | 128.4 -6% | 201.1 -66% | 151.4 -25% | 102 16% | 144 -19% |
| Cyberpunk 2077 ultra * (Watt) | 313 | |||||
| Cyberpunk 2077 ultra external monitor * (Watt) | 306 | |||||
| Last max * (Watt) | 321.8 | 297.9 7% | 378.9 -18% | 395.2 -23% | 267 17% | 318 1% |
| Witcher 3 ultra * (Watt) | 273.1 | 358 | 336 | 178.6 | 228 |
* ... kleinere Werte sind besser
Energieaufnahme Cyberpunk / Stresstest
Energieaufnahme externer Monitor
Akkulaufzeit
Die Laufzeiten sind aufgrund der leistungsstarken Hardware kurz. Selbst im Akkusparmodus und im iGPU-Modus erreichen wir nur etwas mehr als 3 Stunden bei realer WLAN-Nutzung, während das ROG Strix G18 mit seinem IPS-Display mehr als doppelt so lange durchhält. Die Akkukapazität liegt bereits am gesetzlichen Maximum von 99,9 Wh.
Der Ladevorgang von leer auf volle Kapazität dauert fast 2,5 Stunden, was etwas länger ist als bei den meisten anderen Laptops. Das Aufladen mit USB-C-Netzteilen von Drittanbietern verläuft sogar noch langsamer.
| MSI Raider 18 HX A14V i9-14900HX, GeForce RTX 4080 Laptop GPU, 99.9 Wh | Razer Blade 18 2024 RZ09-0509 i9-14900HX, GeForce RTX 4090 Laptop GPU, 91.7 Wh | Alienware m18 R2 i9-14900HX, GeForce RTX 4090 Laptop GPU, 97 Wh | MSI Titan 18 HX A14VIG i9-14900HX, GeForce RTX 4090 Laptop GPU, 99.9 Wh | Asus ROG Strix G18 G814JI i7-13650HX, GeForce RTX 4070 Laptop GPU, 90 Wh | Acer Predator Helios 18 PH18-72-98MW i9-14900HX, GeForce RTX 4090 Laptop GPU, 90 Wh | |
|---|---|---|---|---|---|---|
| Akkulaufzeit | 20% | 45% | 18% | 101% | -9% | |
| Idle (h) | 4.4 | 6.6 50% | 5.9 34% | 11.7 166% | ||
| WLAN (h) | 3.3 | 4.4 33% | 4.8 45% | 4.2 27% | 8.1 145% | 3.2 -3% |
| Last (h) | 1.3 | 1 -23% | 1.2 -8% | 1.2 -8% | 1.1 -15% |
Pro
Contra
Fazit — Ein Titan mit Leib und Seele
Zu Jahresbeginn waren wir von der Leistung des Titan 18 HX beeindruckt, aber überrascht vom Preis von über 5000 Euro. Die Tatsache, dass die CPU und GPU im Wesentlichen unverändert blieben, machte das Modell noch weniger attraktiv. Das Raider 18 HX adressiert den hohen Preis des Titan 18 HX, indem es bei gleicher CPU-, GPU- und Display-Ausstattung etwas abgespeckt wurde. Raider-Besitzer müssen auf das beleuchtete Clickpad, die Dampfkammer-Kühlung, die mechanischen Tasten und die Unterstützung für eine dritte M.2-SSD verzichten. Diese Luxusmerkmale sind jedoch leicht zu vernachlässigen, da das Spielerlebnis zwischen Raider und Titan ansonsten nahezu identisch ist. Tatsächlich könnte man argumentieren, dass das Raider komfortabler zu bedienen ist, da das traditionelle Clickpad und die membranbasierte Tastatur vertrauter wirken als die unkonventionellen Lösungen des Titan.
Das Raider 18 HX schöpft das Potenzial der Core i9-CPU und der 175-W-GPU voll aus, auch wenn es dafür größer, schwerer und oft lauter ist als viele seiner Konkurrenten.
Im Vergleich zu anderen 18-Zoll-Gaming-Notebooks bietet das Raider 18 HX ein großzügigeres Tipperlebnis und vier SODIMM-Slots, während Alternativen wie das Blade 18 oder das ROG Strix G18 entweder keinen Nummernblock oder nur zwei SODIMM-Module unterstützen. Das MSI-System bleibt jedoch deutlich größer und schwerer als die meisten Mitbewerber und läuft oft nicht leiser, um dies auszugleichen. Obwohl die CPU- und GPU-Leistung etwas schneller ist, werden viele Nutzer den Unterschied möglicherweise nicht bemerken. In diesem Fall sollte man die einfachere Wartung und die 4K-Mini-LED-Optionen des Raider schätzen, um das zusätzliche Gewicht zu rechtfertigen.
Preis und Verfügbarkeit
Der MSI Raider 18 HX, in der von uns getesteten Konfiguration, ist ab sofort bei Amazon für 4019,55 Euro erhältlich.
Note: We have recently updated our rating system and the results of version 8 are not comparable with the results of version 7. More information is available here .
MSI Raider 18 HX A14V
- 03.09.2024 v8
Allen Ngo
 Total Sustainability Score:
 Transparenz
Die Auswahl der zu testenden Geräte erfolgt innerhalb der Redaktion. Das vorliegende Testmuster wurde dem Autor vom Hersteller oder einem Shop zu Testzwecken leihweise zur Verfügung gestellt. Eine Einflussnahme des Leihstellers auf den Testbericht gab es nicht, der Hersteller erhielt keine Version des Reviews vor der Veröffentlichung. Es bestand keine Verpflichtung zur Publikation. Als eigenständiges, unabhängiges Unternehmen unterliegt Notebookcheck keiner Diktion von Herstellern, Shops und Verlagen.
So testet Notebookcheck
Pro Jahr werden von Notebookcheck hunderte Laptops und Smartphones unabhängig in von uns standardisierten technischen Verfahren getestet, um eine Vergleichbarkeit aller Testergebnisse zu gewährleisten. Seit rund 20 Jahren entwickeln wir diese Testmethoden kontinuierlich weiter und setzen damit Branchenstandards. In unseren Testlaboren kommt ausschließlich hochwertiges Messequipment in die Hände erfahrener Techniker und Redakteure. Die Tests unterliegen einer mehrstufigen Kontrolle. Unsere komplexe Gesamtbewertung basiert auf hunderten fundierten Messergebnissen und Benchmarks, womit Ihnen Objektivität garantiert ist. Weitere Informationen zu unseren Testmethoden gibt es hier.
Preisvergleich

