Notebookcheck Logo

Razer Blade 18 2024 im Test: Erster Laptop, der sowohl mit Mini-LED als auch mit Thunderbolt 5 vermarktet wird
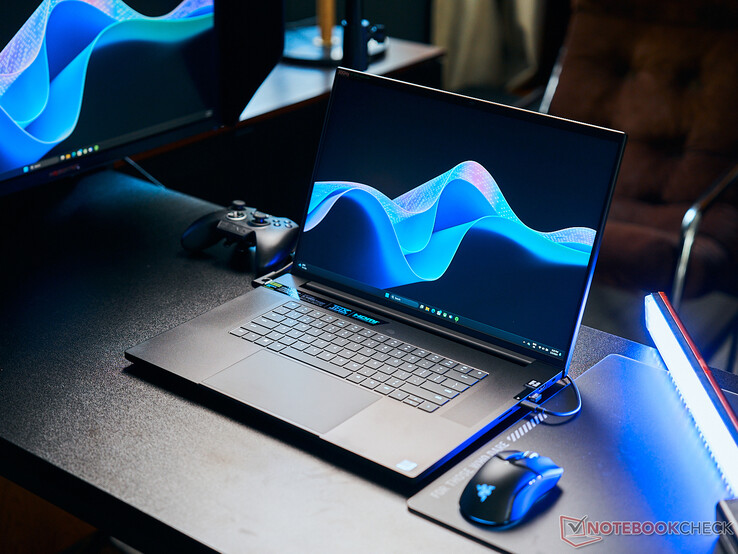
Das mit Abstand hellste Blade.

Razer setzt die Messlatte dieses Jahr nochmals ein Stück höher an mit seinen 300-Hz-2K-Mini-LED- und 200-Hz-4K-IPS-Display-Optionen neben der ohnehin schon beeindruckenden 175 W starken GeForce RTX 4090. Insbesondere das HDR1000-Mini-LED-Panel macht aus dem Blade 18 einen Multimedia-Giganten wenn es ums Gaming oder auch die Videowiedergabe geht.

Das Razer Blade 18 hat sein Debut 2023 mit einem Design gefeiert, das sich stark am alternden Blade 17 orientiert hat. Auch im Jahr 2024 nutzt das Modell noch das gleiche Gehäusedesign, verfeinert dieses jedoch mit ein paar zusätzlichen High-Level-Funktionen, um für Leistungsjäger und Enthusiasten noch attraktiver zu sein. Die neuen Optionen beinhalten einen Core i9-14900HX der Raptor-Lake-Serie, Thunderbolt 5 sowie ein optionales 4K-16:10-200-Hz-IPS-Display. Besonders die beiden letzteren Funktionen debutieren auf einem Razer-System und sind auch der sicher bald folgenden Konkurrenz zeitlich leicht voraus. 

Unser Testmodell kommt mit einer 175 W starken GeForce RTX 4090, 2 TB SSD und einem 300-Hz-Mini-LED-Display mit einer Auflösung von 2.560 x 1.600 ausgestattet und kostet voraussichtlich etwa $4500 USD (in Deutschland ab rund 5.200 Euro). Andere Konfigurationen bietet stattdessen eine GeForce RTX 4070/4080 oder auch das zuvor erwähnte 4K-200-Hz-IPS-Display, aber alle SKUs verfügen über den gleichen Core i9-14900HX. Die alternative Farbvariante Mercury White ist ganz bestimmten Konfigurationen vorbehalten.

Es gibt nur eine kleine Auswahl an Konkurrenten zum Blade 18, einschließlich des MSI Titan 18, des Asus ROG Strix Scar 18, des Acer Predator Helios 18 oder des massiven Alienware m18 R2.

Weitere Razer-Tests:

Razer Blade 18 2024 RZ09-0509
Prozessor
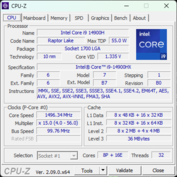
Intel Core i9-14900HX 24 x 1.6 - 5.8 GHz, 138 W PL2 / Short Burst, 117 W PL1 / Sustained, Raptor Lake-HX Refresh
Grafikkarte
NVIDIA GeForce RTX 4090 Laptop GPU - 16 GB VRAM, Kerntakt: 1455 MHz, Speichertakt: 2250 MHz, 175 W TDP, GDDR6, 552.22, Optimus
RAM
32 GB 
, Samsung DDR5-5600, 46-45-45-89, Dual-Channel
Bildschirm
18.00 Zoll 16:10, 2560 x 1600 Pixel 168 PPI, BOE NE180QDM-NM1, Mini-LED, spiegelnd: nein, HDR, 300 Hz
Mainboard
Intel HM770 (Raptor Lake-S PCH)
Soundkarte
Intel Raptor Lake-S PCH - cAVS
Anschlüsse
5 USB 3.1 Gen2, 1 Thunderbolt, USB-C Power Delivery (PD), 1 HDMI, 2 DisplayPort, 1 Kensington Lock, Audio Anschlüsse: 3.5 mm headset, Card Reader: SD
Netzwerk
Realtek RTL8125 2.5GBe Family Ethernet Controller (10/100/1000/2500MBit/s), Intel Wi-Fi 7 BE200 320MHz (a/b/g/n = Wi-Fi 4/ac = Wi-Fi 5/ax = Wi-Fi 6/ Wi-Fi 6E 6 GHz be = Wi-Fi 7), Bluetooth 5.4
Abmessungen
Höhe x Breite x Tiefe (in mm): 21.9 x 399.9 x 275.4
Akku
91.7 Wh Lithium-Polymer
Betriebssystem
Microsoft Windows 11 Home
Kamera
Webcam: 1080p30
Primary Camera: 5 MPix
Sonstiges
Lautsprecher: 2x tweeters, 4x subwoofers, Tastatur: Chiclet, Tastatur-Beleuchtung: ja, Razer Synapse, 12 Monate Garantie
Gewicht
3.134 kg, Netzteil: 931 g
Preis
4500 USD
Geizhals
Preisvergleich
Geizhals Bestpreis 4339€ (Historischer Bestpreis: 3799€)
Razer Blade 18 (2024) - QHD+/300Hz, schwarz, Core i9-14900HX, 32GB RAM, 2TB SSD, GeForce RTX 4090, DE (RZ09-05092GK4-R3G1)
Hinweis: Der Hersteller kann abweichende Bauteile wie Bildschirme, Laufwerke und Speicherriegel mit ähnlichen Spezifikationen unter dem gleichen Modellnamen einsetzen.


Potentielle Konkurrenten im Vergleich

Bew.
Datum
Modell
Gewicht
Dicke
Größe
Auflösung
Preis ab
90.5 %
v7 (old)
05 / 2024
Razer Blade 18 2024 RZ09-0509
i9-14900HX, NVIDIA GeForce RTX 4090 Laptop GPU
3.1 kg21.9 mm18.00"2560x1600
89.5 %
v7 (old)
03 / 2024
Alienware m18 R2
i9-14900HX, NVIDIA GeForce RTX 4090 Laptop GPU
4 kg26.7 mm18.00"2560x1600
87.2 %
v7 (old)
08 / 2023
Asus ROG Strix Scar 17 G733PYV-LL053X
R9 7945HX3D, NVIDIA GeForce RTX 4090 Laptop GPU
2.9 kg28.3 mm17.30"2560x1440
88.8 %
v7 (old)
01 / 2024
MSI Titan 18 HX A14VIG
i9-14900HX, NVIDIA GeForce RTX 4090 Laptop GPU
3.6 kg32.1 mm18.00"3840x2400
88.3 %
v7 (old)
02 / 2024
Asus ROG Strix Scar 18 G834JYR (2024)
i9-14900HX, NVIDIA GeForce RTX 4090 Laptop GPU
3.1 kg30.8 mm18.00"2560x1600
91.1 %
v7 (old)
02 / 2024
Razer Blade 16 2024, RTX 4090
i9-14900HX, NVIDIA GeForce RTX 4090 Laptop GPU
2.5 kg22 mm16.00"2560x1600

Gehäuse — So scharf wie eh und je

Wir empfehlen an dieser Stelle unseren Tests des 2023er Blade 18 für alle physischen Merkmale des Modells, immerhin gelten unsere damaligen Feststellungen auch für die 2024er Version. Zwar gab es weder bei der Tastatur noch beim Gehäuse echte Veränderungen, dennoch gibt es ein Merkmal wonach sich beide Jahresversionen unterscheiden lassen: Das 2024er Model besitzt jetzt endlich einen manuellen Webcam-Slider, den es 2023 noch nicht gab.

Größenvergleich

410.3 mm 319.9 mm 26.7 mm 4 kg404 mm 307.5 mm 32.1 mm 3.6 kg399 mm 294 mm 30.8 mm 3.1 kg395 mm 282.1 mm 28.3 mm 2.9 kg399.9 mm 275.4 mm 21.9 mm 3.1 kg355 mm 244 mm 22 mm 2.5 kg297 mm 210 mm 1 mm 5.7 g

Anschlüsse — Zukunftssicher dank Thunderbolt 5

Demo des Blade 18 auf der GDC2024, verbunden mit diversen Zubehörartikeln, inklusive eines externen 5K-Bildschirms via TB 5
Das 330-W-Standard-Netzteil wird beim Gaming auch weiterhin benötigt, da das Laden per USB-C auf 100 W begrenzt ist

Der Thunderbolt-4-Port wurde im 2024er Modell zum Thunderbolt-5-Port aufgerüstet. Das bezieht sich jedoch nur auf den USB-C-Port an der rechten Kante, sodass der USB-C-Anschluss links weiterhin auf USB 3.2 Gen 2 beschränkt ist. Verglichen mit Thunderbolt 4 unterstützt Thunderbolt 5 nun die doppelte Bandbreite (80 Gbps vs. 40 Gbps) sowie zusätzliche Lanes, die speziell für anspriuchsvollere, externe Geräte reserviert sind, beispielsweise für eine eGPU. 

Die Thunderbolt-5-Specifikationen erlauben theoretisch sogar das Downstream-Aufladen mit bis zu 240 W. Im Blade 18 ist das Laden via USB-C allerdings immer noch auf nur 100 W beziehungsweise auf weniger als einen Drittel der Leistung des 330-W-Hauptnetzteils limitiert. Fairerweise sei erwähnt, dass aktuell noch kein Laptop das Laden mit den vollen 240 W per USB-C erlaubt, da zusätzliche Hardwareanpassungen vonnöten sind, um die neuen Spezifikationen auch wirklich ausreizen zu können.

Vorne: Keine Anschlüsse
Rechts: SD Card Reader, USB-C 3.2 Gen 2 mit Thunderbolt 5 + Power Delivery + DisplayPort 1.4, USB-A 3.2 Gen 2, HDMI 2.1, Kensington Lock
Hinten: Keine Anschlüsse
Links: Netzteil, 2.5 Gbps RJ-45, 2x USB-A 3.2 Gen 2, USB-C mit Power Delivery + DisplayPort 1.4, 3,5 mm Headset

SD Card Reader

SD Card Reader
average JPG Copy Test (av. of 3 runs)
Alienware m18 R2
Intel Core i9-14900HX (Toshiba Exceria Pro SDXC 64 GB UHS-II)
190.3 MB/s +1%
Razer Blade 18 2024 RZ09-0509
Intel Core i9-14900HX (Toshiba Exceria Pro SDXC 64 GB UHS-II)
188.25 MB/s
Razer Blade 16 2024, RTX 4090
Intel Core i9-14900HX
171 (169.48min - 194.55max) MB/s -9%
MSI Titan 18 HX A14VIG
Intel Core i9-14900HX (Toshiba Exceria Pro SDXC 64 GB UHS-II)
83.8 MB/s -55%
maximum AS SSD Seq Read Test (1GB)
Razer Blade 18 2024 RZ09-0509
Intel Core i9-14900HX (Toshiba Exceria Pro SDXC 64 GB UHS-II)
220.56 MB/s
Alienware m18 R2
Intel Core i9-14900HX (Toshiba Exceria Pro SDXC 64 GB UHS-II)
219.7 MB/s 0%
Razer Blade 16 2024, RTX 4090
Intel Core i9-14900HX
181.81 MB/s -18%
MSI Titan 18 HX A14VIG
Intel Core i9-14900HX (Toshiba Exceria Pro SDXC 64 GB UHS-II)
91.5 MB/s -59%

Kommunikation

Das WLAN-Modul hat ein Upgrade auf das Intel BE200 erfahren und unterstützt nun Bluetooth 5.4 und Wi-Fi 7. Die überwiegende Mehrheit der Nutzer dürfte allerdings noch keinen Wi-Fi 7-Router haben, sodass nur eine Handvoll User Verbesserungen feststellen werden.

Networking
iperf3 transmit AXE11000
Razer Blade 16 2024, RTX 4090
Intel Killer Wi-Fi 7 BE1750W 320 MHz (BE200NGW)
1577 (796min - 1617max) MBit/s +38%
Razer Blade 18 2024 RZ09-0509
Intel Wi-Fi 7 BE200 320MHz
1143 (813min - 1407max) MBit/s
MSI Titan 18 HX A14VIG
Intel Killer Wi-Fi 7 BE1750x BE200NGW
1011 (514min - 1160max) MBit/s -12%
Asus ROG Strix Scar 18 G834JYR (2024)
Intel Wi-Fi 6E AX211
968 (656min - 1200max) MBit/s -15%
Alienware m18 R2
Intel Killer Wi-Fi 7 BE1750x BE200NGW
791 (736min - 894max) MBit/s -31%
iperf3 receive AXE11000
Asus ROG Strix Scar 18 G834JYR (2024)
Intel Wi-Fi 6E AX211
1681 (1662min - 1704max) MBit/s +15%
Razer Blade 16 2024, RTX 4090
Intel Killer Wi-Fi 7 BE1750W 320 MHz (BE200NGW)
1604 (1554min - 1623max) MBit/s +10%
Razer Blade 18 2024 RZ09-0509
Intel Wi-Fi 7 BE200 320MHz
1459 (1375min - 1525max) MBit/s
Alienware m18 R2
Intel Killer Wi-Fi 7 BE1750x BE200NGW
1381 (1277min - 1427max) MBit/s -5%
MSI Titan 18 HX A14VIG
Intel Killer Wi-Fi 7 BE1750x BE200NGW
1116 (932min - 1352max) MBit/s -24%
iperf3 transmit AXE11000 6GHz
Razer Blade 16 2024, RTX 4090
Intel Killer Wi-Fi 7 BE1750W 320 MHz (BE200NGW)
1538 (784min - 1597max) MBit/s +28%
Razer Blade 18 2024 RZ09-0509
Intel Wi-Fi 7 BE200 320MHz
1199 (1057min - 1319max) MBit/s
MSI Titan 18 HX A14VIG
Intel Killer Wi-Fi 7 BE1750x BE200NGW
1096 (900min - 1242max) MBit/s -9%
Alienware m18 R2
Intel Killer Wi-Fi 7 BE1750x BE200NGW
648 (595min - 759max) MBit/s -46%
iperf3 receive AXE11000 6GHz
Razer Blade 16 2024, RTX 4090
Intel Killer Wi-Fi 7 BE1750W 320 MHz (BE200NGW)
1518 (762min - 1536max) MBit/s +15%
MSI Titan 18 HX A14VIG
Intel Killer Wi-Fi 7 BE1750x BE200NGW
1379 (709min - 1426max) MBit/s +5%
Razer Blade 18 2024 RZ09-0509
Intel Wi-Fi 7 BE200 320MHz
1315 (1269min - 1369max) MBit/s
Alienware m18 R2
Intel Killer Wi-Fi 7 BE1750x BE200NGW
1292 (1215min - 1327max) MBit/s -2%
05010015020025030035040045050055060065070075080085090095010001050110011501200125013001350Tooltip
Razer Blade 18 2024 RZ09-0509; iperf3 transmit AXE11000 6GHz; iperf 3.1.3: Ø1199 (1057-1319)
Razer Blade 18 2024 RZ09-0509; iperf3 receive AXE11000 6GHz; iperf 3.1.3: Ø1315 (1269-1369)

Webcam

Abgesehen vom neuen Shutter hat sich die 5-MP-Webcam mit IR nicht verändert. Interessanterweise ist das Blade aktuell der einzige 18-Zoll-Gamer mit einer 5-MP-Webcam, die konkurrierenden Titan HX, Alienware m18 R2 und ROG Strix Scar 18 bieten Webcams mit nur 1 MP bis 2 MP.
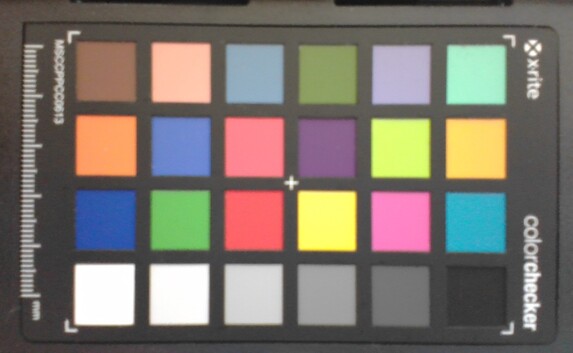
ColorChecker
13.5 ∆E
13.4 ∆E
18.4 ∆E
20 ∆E
17 ∆E
14.1 ∆E
11.9 ∆E
17.5 ∆E
16.7 ∆E
15 ∆E
15.5 ∆E
15.2 ∆E
9.4 ∆E
15.3 ∆E
21.9 ∆E
14.1 ∆E
17.5 ∆E
14.8 ∆E
2.3 ∆E
11.8 ∆E
14.4 ∆E
14.3 ∆E
11.9 ∆E
1.4 ∆E
ColorChecker Razer Blade 18 2024 RZ09-0509: 14.07 ∆E min: 1.43 - max: 21.9 ∆E

Wartung

Das 2024er Modell verfügt über leicht größere Lautsprecher ind er Nähe der vorderen Ecken. Ansonsten gibt es keine nennenswerten Unterschiede zum letzten Jahr.

Blade 18 2024
Blade 18 2024
Blade 18 2023 zum Vergleich

Display — QHD+ Mini-LED mit 300 Hz

Matte RGB-Subpixel. Display ist leicht körniger als die meisten spiegelnden Alternativen

Das QHD+ 240-Hz-Panel im 2023er Blade 18 wurde durch zwei neue Optionen ersetzt:

  • QHD+ (2.560 x 1.600), 300 Hz, Mini-LED, HDR1000
  • 4K UHD+ (3.840 x 2.400), 200 Hz, IPS, HDR400

Beide Panel bieten G-Sync, eine Werkskalibrierung, volle DCI-P3-Farben und <3 ms schnelle Reaktionszeiten, um sowohl für Hardcore-Gaming als auch die meisten Editieraufgaben gerüstet zu sein. Unsere spezifische Testeinheit ist mit der fett gedruckten Option ausgerüstet. Übrigens kann das exakt gleiche Panel namens BOE NE180QDM-NM1 auch im ROG Strix Scar 18 gefunden werden, Razer und Asus bieten also vergleichbare Seherfahrungen in ihren Laptops.

Verglichen mit IPS und OLED kommen Mini-LED auf tiefere Schwarzwerte als IPS und hellere Weißwerte als OLED, was sie fitter für HDR-Voraussetzungen macht. Beispielsweise decken Laptops mit High-End-IPS- oder -OLED-Panels typischerweise HDR400 oder HDR500 ab, während Mini-LED oft sogar HDR1000 bieten, was für eine lebhaftere Darstellung sorgt. Bei unserem Blade 18 beträgt die maximale Helligkeit 1.227 Nits, wenn sowohl HDR als auch Local Dimming aktiv sind. Ist HDR aktiv, LOcal Dimming jedoch deaktiviert, so erreicht das Panel noch 712 Nits. In SDR ist die Helligkeit ansonsten auf annähernd 600 Nits limitiert, was noch immer heller ist als die meisten anderen Gaming-Laptops.

Display-EinstellungSDR, Local Dimming OffSDR, Local Dimming OnHDR, Local Dimming OffHDR, Local Dimming On
Maximale Helligkeit in Nits6056027121.227


Komplett schwarzer Bildschirm in SDR, Local Dimming off. Backlight Bleeding vorhanden, aber relativ gleichmäßig
Komplett schwarzer Bildschirm in HDR, Local Dimming on. Bildschirm wird komplett schwarz, Kontraste beinahe wie beim OLED

Schwarzwert und somit auch der Kontrast werden ebenfalls vom Local Dimming beeinflusst. Wir messen einen Schwarzwert von 0.62 Nits bei deaktiviertem Local Dimming, aber 0.22 Nits mit aktiviertem Local Dimming, was in letzterem Fall zu deutlich höheren Kontrasten führt, besonders wenn auch noch HDR aktiviert ist. Durch seinen potentiell störenden "Halo"-Effekt ist Local Dimming weder notwendig noch empfehlenswert, wenn es um das alltägliche Browsen oder Editieren geht, aber beim Schauen von HDR-Videos oder beim Gaming sollte man das Feature aktivieren.

Zu beachten ist, dass die Bildrate des Panels ausschließlich im dGPU-Modus auf bis zu 300 Hz kommt, unter Optimus ist sie auf 240 Hz limitiert. Und eine dynamische Bildwiederholrate bis runter auf 60 Hz wird auch nur im Optimus-Modus unterstützt. 

600.6
cd/m²
605.5
cd/m²
602.3
cd/m²
601.8
cd/m²
605.4
cd/m²
588
cd/m²
605
cd/m²
603.5
cd/m²
586.6
cd/m²
Ausleuchtung des Bildschirms
BOE NE180QDM-NM1 getestet mit X-Rite i1Pro 2
Maximal: 605.5 cd/m² (Nits) Durchschnitt: 599.9 cd/m² Minimum: 0.62 cd/m²
Ausleuchtung: 97 %
Helligkeit Akku: 605.4 cd/m²
Kontrast: 976:1 (Schwarzwert: 0.62 cd/m²)
ΔE Color 1.53 | 0.5-29.43 Ø4.92
ΔE Greyscale 2.6 | 0.5-98 Ø5.2
86.9% AdobeRGB 1998 (Argyll 2.2.0 3D)
100% sRGB (Argyll 2.2.0 3D)
99% Display P3 (Argyll 2.2.0 3D)
Gamma: 2.22
Razer Blade 18 2024 RZ09-0509
BOE NE180QDM-NM1, Mini-LED, 2560x1600, 18"
Razer Blade 18 RTX 4070
AU Optronics B180QAN01.0, IPS, 2560x1600, 18"
Alienware m18 R2
BOE NE18NZ1, IPS, 2560x1600, 18"
MSI Titan 18 HX A14VIG
AU Optronics B180ZAN01.0, Mini-LED, 3840x2400, 18"
Asus ROG Strix Scar 18 G834JYR (2024)
BOE NE180QDM-NM1, Mini LED, 2560x1600, 18"
Display
-1%
0%
-1%
2%
Display P3 Coverage
99
96.9
-2%
97.8
-1%
98.1
-1%
99.9
1%
sRGB Coverage
100
99.8
0%
99.5
0%
99.8
0%
100
0%
AdobeRGB 1998 Coverage
86.9
85.3
-2%
88.9
2%
86.2
-1%
90
4%
Response Times
44%
28%
-196%
-37%
Response Time Grey 50% / Grey 80% *
7.6 ?(3.6, 4)
4.2 ?(2.1, 2.1)
45%
5.3 ?(2.2, 3.1)
30%
8.6 ?(4.2, 4.4)
-13%
12 ?(8, 4)
-58%
Response Time Black / White *
14 ?(6.6, 7.4)
8 ?(3.8, 4.2)
43%
10.4 ?(4.8, 5.6)
26%
81.8 ?(76, 5.8)
-484%
10.7 ?(7.6, 3.1)
24%
PWM Frequency
26444 ?(100)
2592 ?(100)
-90%
5733 ?(94)
-78%
Bildschirm
-20%
-26%
-45%
202%
Helligkeit Bildmitte
605.4
549.6
-9%
271.8
-55%
467.5
-23%
937
55%
Brightness
600
524
-13%
275
-54%
459
-23%
934
56%
Brightness Distribution
97
89
-8%
78
-20%
90
-7%
89
-8%
Schwarzwert *
0.62
0.53
15%
0.27
56%
0.066
89%
Kontrast
976
1037
6%
1007
3%
14197
1355%
Delta E Colorchecker *
1.53
3.32
-117%
2.48
-62%
3.77
-146%
1.52
1%
Colorchecker dE 2000 max. *
4.15
6.63
-60%
5.59
-35%
6.12
-47%
2.82
32%
Delta E Graustufen *
2.6
2
23%
3.7
-42%
3.2
-23%
1.7
35%
Gamma
2.22 99%
2.29 96%
2.2 100%
2.43 91%
2.042 108%
CCT
6843 95%
6319 103%
6355 102%
6478 100%
6578 99%
Colorchecker dE 2000 calibrated *
2.7
0.56
2.94
1.21
Durchschnitt gesamt (Programm / Settings)
8% / -6%
1% / -12%
-81% / -72%
56% / 108%

* ... kleinere Werte sind besser

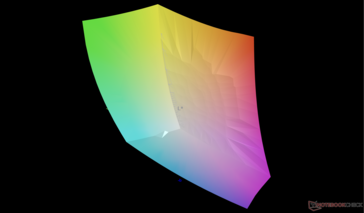
vs. sRGB
vs. sRGB
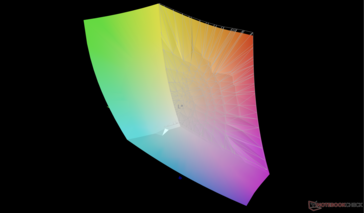
vs. P3
vs. P3

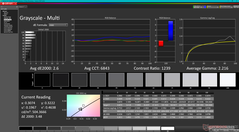
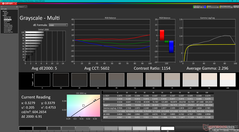
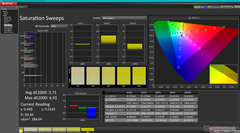
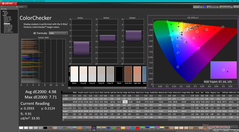
Wie beworben wird der P3-Standard komplett repräsentiert. Ärgerlicherweise verschieben sich jedoch die Farben, wenn zwischen Optimus und der dGPU umhergeschaltet wird. Die sRGB-Farben werden akkurat wiedergegeben, bei durchschnittlichen DeltaE-Graustufen- und -ColorChecker-Werten von nur 2,6 und 1,53. Aber die P3-Farben sind selbst im P3-Modus weniger akkurat. Beispielsweise wird die Farbtemperatur automatisch auf wärmere 5600K gesetzt, wenn der P3-Modus aktiv ist. Möglicherweise gibt es einen Bug wie P3-Farben dargestellt werden beim Wechsel zwischen den verschiedenen GPU-Modi.

Graustufen (vs. sRGB)
Sättigung (vs. sRGB)
ColorChecker (vs. sRGB)
Graustufen (vs. P3)
Graustufen (vs. P3)
Sättigung (vs. P3)
Sättigung (vs. P3)
ColorChecker (vs. P3)

Reaktionszeiten (Response Times) des Displays

Die Reaktionszeiten (Response Times) beschreiben wie schnell zwischen zwei Farben eines Pixels umgeschaltet werden kann. Langsame Response Times können zu einer verschwommenen Darstellung, Schlieren und Geisterbilder führen. Besonders bei schnellen 3D-Spielen sind kurze Umschaltzeiten wichtig.
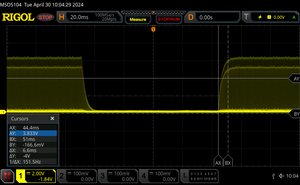
       Reaktionszeiten Schwarz zu Weiß
14 ms ... steigend ↗ und fallend ↘ kombiniert↗ 6.6 ms steigend
↘ 7.4 ms fallend
Die gemessenen Reaktionszeiten sind gut, für anspruchsvolle Spieler könnten der Bildschirm jedoch zu langsam sein.
Im Vergleich rangierten die bei uns getesteten Geräte von 0.1 (Minimum) zu 240 (Maximum) ms. » 31 % aller Screens waren schneller als der getestete.
Daher sind die gemessenen Reaktionszeiten besser als der Durchschnitt aller vermessenen Geräte (21 ms).
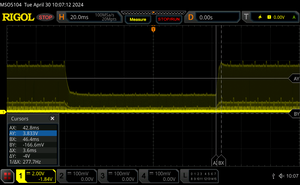
       Reaktionszeiten 50% Grau zu 80% Grau
7.6 ms ... steigend ↗ und fallend ↘ kombiniert↗ 3.6 ms steigend
↘ 4 ms fallend
Die gemessenen Reaktionszeiten sind sehr kurz, wodurch sich der Bildschirm auch für schnelle 3D Spiele eignen sollte.
Im Vergleich rangierten die bei uns getesteten Geräte von 0.165 (Minimum) zu 636 (Maximum) ms. » 17 % aller Screens waren schneller als der getestete.
Daher sind die gemessenen Reaktionszeiten besser als der Durchschnitt aller vermessenen Geräte (32.9 ms).

Bildschirm-Flackern / PWM (Pulse-Width Modulation)

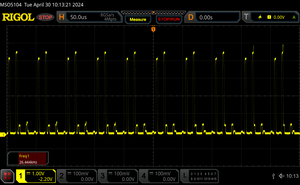
Eine günstige Methode um die Helligkeit eines Bildschirms zu steuern, ist die Beleuchtung periodisch ein- und auszuschalten. Dies nennt sich PWM (Pulsweitenmodulation) Diese Umschaltung sollte mit einer hohen Frequenz stattfinden damit das menschliche Auge kein Flimmern wahrnimmt. Wenn die Frequenz zu niedrig ist, kann dies zu Ermüdungserscheinungen, Augenbrennen, Kopfweh und auch sichtbaren Flackern führen.
Flackern / PWM festgestellt 26444 Hz ≤ 100 % Helligkeit

Das Display flackert mit 26444 Hz (im schlimmsten Fall, eventuell durch Pulsweitenmodulation PWM) bei einer eingestellten Helligkeit von 100 % und darunter. Darüber sollte es zu keinem Flackern kommen.

Die Frequenz von 26444 Hz ist sehr hoch und sollte daher auch bei empfindlichen Personen zu keinen Problemen führen.

Im Vergleich: 53 % aller getesteten Geräte nutzten kein PWM um die Helligkeit zu reduzieren. Wenn PWM eingesetzt wurde, dann bei einer Frequenz von durchschnittlich 8743 (Minimum 5, Maximum 343500) Hz.

Flackern ist wie auch bei anderen Laptops mit Mini-LED-Display vorhanden. Allerdings fällt die Frequenz extrem hoch aus, sodass eine Augenermüdung auch bei sensiblen Personen eher unwahrscheinlich ist. Die Intensität des Flackerns scheint auch massiv abzunehmen, sobald die Helligkeit auf unter 50 Prozent sinkt. Niedrigere Helligkeitsstufen wären in einem solchen Fall also eher eine gute Idee.

0 Prozent Helligkeit
25 Prozent Helligkeit
50 Prozent Helligkeit
75 Prozent Helligkeit
100 Prozent Helligkeit

Im Freien ist die Sichtbarkeit im Schatten ganz in Ordnung, vor allem auch weil die matte Oberfläche Spiegelungen minimiert. Direkte Sonneneinstrahlung sollte für eine optimale Seherfahrung dennoch vermieden werden.

Draußen bei Sonnenschein
Draußen im Schatten
Draußen im Schatten
Draußen bei Sonnenschein
Weite Mini-LED-Blickwinkel ohne IPS-Kontrastreduktion oder OLED-Rainbow-Effect für stabilere Farben

Leistung — Genauso wie letztes Jahr


Testbedingungen

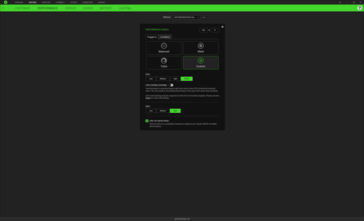
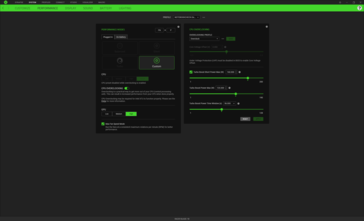
Razer arbeitet weiter daran Synapse mit zusätzlichen Funktionen anzureichern und alle Häkchen bei den verbesserten Individualisierungsmöglichkeiten zu setzen. Neu in diesem Jahr sind der Turbomodus, der Max Fan Modus und weitere Funktionen für das integrierte Display wie Farbprofile und Hotkeys, um die Bildwiederholrate anzupassen. Wie unsere Tests weiter unten zeigen ist der "neue" Turbomodus aber quasi der alte Custom Modus. Razer meint, dass sie den Turbomodus hinzugefügt haben, um es den Nutzern noch leichter zu machen den "besten" Modus für das Gaming auszuwählen. Wir befürchten hingegen, dass es eher den gegenteiligen Effekt haben könnte, allein weil es nun zu viele verwirrende Modi gibt aus denen man wählen soll. Alle unsere Tests sind mit dem Custom Modus durchgeführt worden, CPU und GPU wurden auf Boost und High gesetzt, sofern wir keine anderen Angaben machen.

Die vielleicht wichtigste neue Synapse-Funktion ist der Schalter für das Local Dimming unterhalb des Display-Tabs. Interessanterweise deaktiviert Razer dies standarmäßig, obwohl Local Dimming einer der Hauptverkaufsargumente des Mini-LEDs ist. Das Aktivieren der Funktion hat einen großen Einfluß auf die Helligkeit in HDR.

Leistungsprofile mit dem Custom Modus, Max Fan Modus und Turbomodus und weiteren
CPU-Overclocking-Untermenü
Display-Tab mit Farbprofilen, Bildwiederholraten und Local Dimming
Audioanpassungen
Audioanpassungen

Prozessor

Während der Sprung von der Gen12-CPU Core i9-12900HX auf die 13. Generation um den Core i9-13900HX Leistungsgewinne von 25 bis 30 Prozent einbrachte, ähneln die Leistungssprünge von der Gen13- auf die Gen14-CPU Core i9-14900HX eher einer Nulllinie. Die Unterschiede in den Benchmarkergebnissen zwischen unserem 2023er und unserem 2024er Blade 18 liegen innerhalb von nur 5 Prozent, sowohl in der Single- als auch der Multi-Thread-Leistung. Der i9-14900HX wird informell als ein "Rebrand" des i9-13900HX bezeichnet und unsere Zahlen spiegeln genau dies wieder. 

LeistungsprofilCineBench R23 xT Score (Punkte)Sustained CPU Power Level (W)Cyberpunk 2077 QHD Ultra (FPS)
Balanced14.26955 -> 4565,13
Turbo27.029135 -> 12584,69
Custom mit Max Fan On27.167135 -> 12585,46

Erstaunlicherweise sind die CPU-Ergebnisse unseres Razer-Systems minimal, aber konsistent niedriger als bei anderen Gaming-Laptops mit der gleichen CPU wie das Alienware m18 R2 oder das MSI Titan 18 HX. Wir vermuten, dass hier Absicht seitens Razer im Spiel ist, um mehr Spielraum für Übertaktungen via Synapse zu bieten. Die CPU-Turbo-Boost-Leistung und TDP-Level der verschiedenen Leistungsprofile sind in der obigen Tabelle aufgeführt. 

Cinebench R15 Multi Loop

02805608401120140016801960224025202800308033603640392042004480476050405320Tooltip
Razer Blade 18 2024 RZ09-0509 Intel Core i9-14900HX: Ø4163 (3956.09-4227.88)
Alienware m18 R2 Intel Core i9-14900HX: Ø4743 (4458.81-4807.11)
Asus ROG Strix Scar 17 G733PYV-LL053X AMD Ryzen 9 7945HX3D: Ø5282 (5177.32-5599.89)
MSI Titan 18 HX A14VIG Intel Core i9-14900HX: Ø4753 (4700.35-4782.4)
Asus ROG Strix Scar 18 G834JYR (2024) Intel Core i9-14900HX: Ø4024 (3961.18-4098.11)
Razer Blade 16 2024, RTX 4090 Intel Core i9-14900HX: Ø4396 (4349.72-4455.83)
CPU Performance Rating: Percent
Cinebench R23: Multi Core | Single Core
Cinebench R20: CPU (Multi Core) | CPU (Single Core)
Cinebench R15: CPU Multi 64Bit | CPU Single 64Bit
Blender: v2.79 BMW27 CPU
7-Zip 18.03: 7z b 4 | 7z b 4 -mmt1
Geekbench 6.3: Multi-Core | Single-Core
Geekbench 5.5: Multi-Core | Single-Core
HWBOT x265 Benchmark v2.2: 4k Preset
LibreOffice : 20 Documents To PDF
R Benchmark 2.5: Overall mean
CPU Performance Rating
Alienware m18 R1 AMD
AMD Ryzen 9 7945HX
84.3 pt
Asus ROG Strix Scar 17 G733PYV-LL053X
AMD Ryzen 9 7945HX3D
84.2 pt
Alienware m18 R2
Intel Core i9-14900HX
83.4 pt
Alienware m18 R1 -2!
Intel Core i9-13980HX
80.7 pt
MSI Titan 18 HX A14VIG
Intel Core i9-14900HX
79.9 pt
Razer Blade 16 2024, RTX 4090
Intel Core i9-14900HX
79 pt
Durchschnittliche Intel Core i9-14900HX
 
79 pt
Asus ROG Strix Scar 18 G834JYR (2024)
Intel Core i9-14900HX
78.8 pt
Razer Blade 18 RTX 4070 -2!
Intel Core i9-13950HX
76.1 pt
Razer Blade 18 2024 RZ09-0509
Intel Core i9-14900HX
75.9 pt
MSI Titan GT77 12UHS -2!
Intel Core i9-12900HX
65.4 pt
Asus TUF Gaming A17 FA707XI-NS94
AMD Ryzen 9 7940HS
60 pt
MSI Pulse 17 B13VGK
Intel Core i7-13700H
55.2 pt
Acer Nitro 17 AN17-41-R9LN
AMD Ryzen 7 7735HS
46.8 pt
Cinebench R23 / Multi Core
Alienware m18 R1 AMD
AMD Ryzen 9 7945HX
34613 (33896.2min - 34613.2max) Points +25%
Asus ROG Strix Scar 17 G733PYV-LL053X
AMD Ryzen 9 7945HX3D
32782 Points +19%
Alienware m18 R1
Intel Core i9-13980HX
32601 (28888.6min - 32601.4max) Points +18%
MSI Titan 18 HX A14VIG
Intel Core i9-14900HX
32428 (29693.8min - 32428.3max) Points +17%
Alienware m18 R2
Intel Core i9-14900HX
31391 (28656min - 31390.7max) Points +14%
Durchschnittliche Intel Core i9-14900HX
  (17078 - 36249, n=34)
29130 Points +5%
Razer Blade 16 2024, RTX 4090
Intel Core i9-14900HX
28867 Points +4%
Razer Blade 18 RTX 4070
Intel Core i9-13950HX
28681 (25585.5min - 28680.9max) Points +4%
Asus ROG Strix Scar 18 G834JYR (2024)
Intel Core i9-14900HX
28516 Points +3%
Razer Blade 18 2024 RZ09-0509
Intel Core i9-14900HX
27657 (23328.1min - 27657.5max) Points
MSI Titan GT77 12UHS
Intel Core i9-12900HX
22982 Points -17%
MSI Pulse 17 B13VGK
Intel Core i7-13700H
18304 Points -34%
Asus TUF Gaming A17 FA707XI-NS94
AMD Ryzen 9 7940HS
17623 (17398.8min - 17622.8max) Points -36%
Acer Nitro 17 AN17-41-R9LN
AMD Ryzen 7 7735HS
14087 Points -49%
Cinebench R23 / Single Core
Alienware m18 R2
Intel Core i9-14900HX
2235 Points +7%
Asus ROG Strix Scar 18 G834JYR (2024)
Intel Core i9-14900HX
2177 Points +4%
Durchschnittliche Intel Core i9-14900HX
  (1720 - 2245, n=34)
2157 Points +3%
MSI Titan 18 HX A14VIG
Intel Core i9-14900HX
2143 Points +3%
Razer Blade 16 2024, RTX 4090
Intel Core i9-14900HX
2117 Points +1%
Alienware m18 R1
Intel Core i9-13980HX
2106 Points +1%
Razer Blade 18 2024 RZ09-0509
Intel Core i9-14900HX
2088 Points
Razer Blade 18 RTX 4070
Intel Core i9-13950HX
2076 Points -1%
Alienware m18 R1 AMD
AMD Ryzen 9 7945HX
1948 Points -7%
Asus ROG Strix Scar 17 G733PYV-LL053X
AMD Ryzen 9 7945HX3D
1935 Points -7%
MSI Titan GT77 12UHS
Intel Core i9-12900HX
1913 Points -8%
Asus TUF Gaming A17 FA707XI-NS94
AMD Ryzen 9 7940HS
1832 Points -12%
MSI Pulse 17 B13VGK
Intel Core i7-13700H
1694 Points -19%
Acer Nitro 17 AN17-41-R9LN
AMD Ryzen 7 7735HS
1569 Points -25%
Cinebench R20 / CPU (Multi Core)
Alienware m18 R1 AMD
AMD Ryzen 9 7945HX
13308 Points +22%
Asus ROG Strix Scar 17 G733PYV-LL053X
AMD Ryzen 9 7945HX3D
13033 Points +20%
Alienware m18 R1
Intel Core i9-13980HX
12423 Points +14%
MSI Titan 18 HX A14VIG
Intel Core i9-14900HX
12103 Points +11%
Alienware m18 R2
Intel Core i9-14900HX
11816 Points +9%
Durchschnittliche Intel Core i9-14900HX
  (6579 - 13832, n=34)
11084 Points +2%
Razer Blade 16 2024, RTX 4090
Intel Core i9-14900HX
10968 Points +1%
Razer Blade 18 RTX 4070
Intel Core i9-13950HX
10919 Points 0%
Razer Blade 18 2024 RZ09-0509
Intel Core i9-14900HX
10871 Points
Asus ROG Strix Scar 18 G834JYR (2024)
Intel Core i9-14900HX
10787 Points -1%
MSI Titan GT77 12UHS
Intel Core i9-12900HX
8667 Points -20%
MSI Pulse 17 B13VGK
Intel Core i7-13700H
7190 Points -34%
Asus TUF Gaming A17 FA707XI-NS94
AMD Ryzen 9 7940HS
6894 Points -37%
Acer Nitro 17 AN17-41-R9LN
AMD Ryzen 7 7735HS
5408 Points -50%
Cinebench R20 / CPU (Single Core)
Alienware m18 R2
Intel Core i9-14900HX
853 Points +5%
Asus ROG Strix Scar 18 G834JYR (2024)
Intel Core i9-14900HX
833 Points +2%
Durchschnittliche Intel Core i9-14900HX
  (657 - 859, n=34)
826 Points +1%
MSI Titan 18 HX A14VIG
Intel Core i9-14900HX
823 Points +1%
Razer Blade 18 2024 RZ09-0509
Intel Core i9-14900HX
814 Points
Razer Blade 16 2024, RTX 4090
Intel Core i9-14900HX
810 Points 0%
Alienware m18 R1
Intel Core i9-13980HX
807 Points -1%
Razer Blade 18 RTX 4070
Intel Core i9-13950HX
797 Points -2%
Asus ROG Strix Scar 17 G733PYV-LL053X
AMD Ryzen 9 7945HX3D
755 Points -7%
Alienware m18 R1 AMD
AMD Ryzen 9 7945HX
747 Points -8%
MSI Titan GT77 12UHS
Intel Core i9-12900HX
738 Points -9%
Asus TUF Gaming A17 FA707XI-NS94
AMD Ryzen 9 7940HS
714 Points -12%
MSI Pulse 17 B13VGK
Intel Core i7-13700H
663 Points -19%
Acer Nitro 17 AN17-41-R9LN
AMD Ryzen 7 7735HS
611 Points -25%
Cinebench R15 / CPU Multi 64Bit
Asus ROG Strix Scar 17 G733PYV-LL053X
AMD Ryzen 9 7945HX3D
5600 (5177.32min - 5599.89max) Points +32%
Alienware m18 R1 AMD
AMD Ryzen 9 7945HX
5541 (5377.07min - 5540.93max) Points +31%
Alienware m18 R1
Intel Core i9-13980HX
4989 (4579.8min - 4989.4max) Points +18%
Alienware m18 R2
Intel Core i9-14900HX
4807 (4458.81min - 4807.11max) Points +14%
MSI Titan 18 HX A14VIG
Intel Core i9-14900HX
4782 (4700.35min - 4782.4max) Points +13%
Razer Blade 18 RTX 4070
Intel Core i9-13950HX
4481 Points +6%
Durchschnittliche Intel Core i9-14900HX
  (3263 - 5589, n=35)
4462 Points +6%
Razer Blade 16 2024, RTX 4090
Intel Core i9-14900HX
4456 (4349.72min - 4455.83max) Points +5%
Razer Blade 18 2024 RZ09-0509
Intel Core i9-14900HX
4228 (3956.09min - 4227.88max) Points
Asus ROG Strix Scar 18 G834JYR (2024)
Intel Core i9-14900HX
4098 Points -3%
MSI Titan GT77 12UHS
Intel Core i9-12900HX
3570 (3259.45min - 3569.52max) Points -16%
MSI Pulse 17 B13VGK
Intel Core i7-13700H
2869 (2748.57min - 2868.62max) Points -32%
Asus TUF Gaming A17 FA707XI-NS94
AMD Ryzen 9 7940HS
2817 (2741.98min - 2817.3max) Points -33%
Acer Nitro 17 AN17-41-R9LN
AMD Ryzen 7 7735HS
2296 (2231.27min - 2296.34max) Points -46%
Cinebench R15 / CPU Single 64Bit
Alienware m18 R2
Intel Core i9-14900HX
318 Points +5%
Asus ROG Strix Scar 17 G733PYV-LL053X
AMD Ryzen 9 7945HX3D
311 Points +2%
Razer Blade 16 2024, RTX 4090
Intel Core i9-14900HX
311 Points +2%
Alienware m18 R1 AMD
AMD Ryzen 9 7945HX
309 Points +2%
Durchschnittliche Intel Core i9-14900HX
  (247 - 323, n=34)
306 Points +1%
Razer Blade 18 2024 RZ09-0509
Intel Core i9-14900HX
304 Points
Alienware m18 R1
Intel Core i9-13980HX
303 Points 0%
Asus ROG Strix Scar 18 G834JYR (2024)
Intel Core i9-14900HX
302 Points -1%
MSI Titan 18 HX A14VIG
Intel Core i9-14900HX
300 Points -1%
Razer Blade 18 RTX 4070
Intel Core i9-13950HX
297 Points -2%
Asus TUF Gaming A17 FA707XI-NS94
AMD Ryzen 9 7940HS
287 Points -6%
MSI Titan GT77 12UHS
Intel Core i9-12900HX
278 Points -9%
Acer Nitro 17 AN17-41-R9LN
AMD Ryzen 7 7735HS
251 Points -17%
MSI Pulse 17 B13VGK
Intel Core i7-13700H
250 Points -18%
Blender / v2.79 BMW27 CPU
Acer Nitro 17 AN17-41-R9LN
AMD Ryzen 7 7735HS
222 Seconds * -90%
Asus TUF Gaming A17 FA707XI-NS94
AMD Ryzen 9 7940HS
183 Seconds * -56%
MSI Pulse 17 B13VGK
Intel Core i7-13700H
173 Seconds * -48%
MSI Titan GT77 12UHS
Intel Core i9-12900HX
147 Seconds * -26%
Durchschnittliche Intel Core i9-14900HX
  (91 - 206, n=34)
119.5 Seconds * -2%
Asus ROG Strix Scar 18 G834JYR (2024)
Intel Core i9-14900HX
118 Seconds * -1%
Razer Blade 18 2024 RZ09-0509
Intel Core i9-14900HX
117 Seconds *
Razer Blade 16 2024, RTX 4090
Intel Core i9-14900HX
113 Seconds * +3%
Razer Blade 18 RTX 4070
Intel Core i9-13950HX
111 Seconds * +5%
MSI Titan 18 HX A14VIG
Intel Core i9-14900HX
104 Seconds * +11%
Alienware m18 R2
Intel Core i9-14900HX
102 Seconds * +13%
Alienware m18 R1
Intel Core i9-13980HX
97 Seconds * +17%
Asus ROG Strix Scar 17 G733PYV-LL053X
AMD Ryzen 9 7945HX3D
95 Seconds * +19%
Alienware m18 R1 AMD
AMD Ryzen 9 7945HX
87 Seconds * +26%
7-Zip 18.03 / 7z b 4
Alienware m18 R1 AMD
AMD Ryzen 9 7945HX
140493 MIPS +31%
Asus ROG Strix Scar 17 G733PYV-LL053X
AMD Ryzen 9 7945HX3D
136201 MIPS +27%
Alienware m18 R1
Intel Core i9-13980HX
129804 MIPS +21%
Alienware m18 R2
Intel Core i9-14900HX
122772 MIPS +14%
MSI Titan 18 HX A14VIG
Intel Core i9-14900HX
121266 MIPS +13%
Razer Blade 18 RTX 4070
Intel Core i9-13950HX
116665 MIPS +8%
Razer Blade 16 2024, RTX 4090
Intel Core i9-14900HX
115695 MIPS +8%
Asus ROG Strix Scar 18 G834JYR (2024)
Intel Core i9-14900HX
114546 MIPS +7%
Durchschnittliche Intel Core i9-14900HX
  (66769 - 136645, n=34)
112494 MIPS +5%
Razer Blade 18 2024 RZ09-0509
Intel Core i9-14900HX
107527 MIPS
MSI Titan GT77 12UHS
Intel Core i9-12900HX
86234 MIPS -20%
MSI Pulse 17 B13VGK
Intel Core i7-13700H
74965 MIPS -30%
Asus TUF Gaming A17 FA707XI-NS94
AMD Ryzen 9 7940HS
72749 MIPS -32%
Acer Nitro 17 AN17-41-R9LN
AMD Ryzen 7 7735HS
61495 MIPS -43%
7-Zip 18.03 / 7z b 4 -mmt1
Asus ROG Strix Scar 17 G733PYV-LL053X
AMD Ryzen 9 7945HX3D
7573 MIPS +17%
Alienware m18 R1 AMD
AMD Ryzen 9 7945HX
7381 MIPS +14%
Asus ROG Strix Scar 18 G834JYR (2024)
Intel Core i9-14900HX
7172 MIPS +10%
Alienware m18 R2
Intel Core i9-14900HX
7103 MIPS +9%
Razer Blade 16 2024, RTX 4090
Intel Core i9-14900HX
7018 MIPS +8%
Durchschnittliche Intel Core i9-14900HX
  (5452 - 7545, n=34)
7017 MIPS +8%
Alienware m18 R1
Intel Core i9-13980HX
6889 MIPS +6%
Razer Blade 18 RTX 4070
Intel Core i9-13950HX
6880 MIPS +6%
Asus TUF Gaming A17 FA707XI-NS94
AMD Ryzen 9 7940HS
6642 MIPS +2%
MSI Titan 18 HX A14VIG
Intel Core i9-14900HX
6504 MIPS 0%
Razer Blade 18 2024 RZ09-0509
Intel Core i9-14900HX
6497 MIPS
MSI Titan GT77 12UHS
Intel Core i9-12900HX
6256 MIPS -4%
Acer Nitro 17 AN17-41-R9LN
AMD Ryzen 7 7735HS
5797 MIPS -11%
MSI Pulse 17 B13VGK
Intel Core i7-13700H
5461 MIPS -16%
Geekbench 6.3 / Multi-Core
Alienware m18 R2
Intel Core i9-14900HX
18233 Points +6%
Asus ROG Strix Scar 18 G834JYR (2024)
Intel Core i9-14900HX
17695 Points +3%
Razer Blade 16 2024, RTX 4090
Intel Core i9-14900HX
17559 Points +2%
Durchschnittliche Intel Core i9-14900HX
  (13158 - 19665, n=34)
17369 Points +1%
Razer Blade 18 2024 RZ09-0509
Intel Core i9-14900HX
17231 Points
Asus ROG Strix Scar 17 G733PYV-LL053X
AMD Ryzen 9 7945HX3D
16957 Points -2%
MSI Titan 18 HX A14VIG
Intel Core i9-14900HX
16652 Points -3%
Alienware m18 R1 AMD
AMD Ryzen 9 7945HX
16316 Points -5%
MSI Pulse 17 B13VGK
Intel Core i7-13700H
12989 Points -25%
Asus TUF Gaming A17 FA707XI-NS94
AMD Ryzen 9 7940HS
12447 Points -28%
Acer Nitro 17 AN17-41-R9LN
AMD Ryzen 7 7735HS
10348 Points -40%
Geekbench 6.3 / Single-Core
Alienware m18 R2
Intel Core i9-14900HX
3057 Points +8%
Asus ROG Strix Scar 18 G834JYR (2024)
Intel Core i9-14900HX
2999 Points +6%
Durchschnittliche Intel Core i9-14900HX
  (2419 - 3129, n=34)
2973 Points +5%
Razer Blade 16 2024, RTX 4090
Intel Core i9-14900HX
2964 Points +4%
Asus ROG Strix Scar 17 G733PYV-LL053X
AMD Ryzen 9 7945HX3D
2916 Points +3%
Alienware m18 R1 AMD
AMD Ryzen 9 7945HX
2876 Points +1%
MSI Titan 18 HX A14VIG
Intel Core i9-14900HX
2843 Points 0%
Razer Blade 18 2024 RZ09-0509
Intel Core i9-14900HX
2842 Points
Asus TUF Gaming A17 FA707XI-NS94
AMD Ryzen 9 7940HS
2730 Points -4%
MSI Pulse 17 B13VGK
Intel Core i7-13700H
2316 Points -19%
Acer Nitro 17 AN17-41-R9LN
AMD Ryzen 7 7735HS
2115 Points -26%
Geekbench 5.5 / Multi-Core
Alienware m18 R1
Intel Core i9-13980HX
22200 Points +15%
Alienware m18 R2
Intel Core i9-14900HX
21284 Points +10%
Razer Blade 18 RTX 4070
Intel Core i9-13950HX
20036 Points +4%
Asus ROG Strix Scar 18 G834JYR (2024)
Intel Core i9-14900HX
19975 Points +3%
Asus ROG Strix Scar 17 G733PYV-LL053X
AMD Ryzen 9 7945HX3D
19875 Points +3%
Alienware m18 R1 AMD
AMD Ryzen 9 7945HX
19802 Points +3%
Durchschnittliche Intel Core i9-14900HX
  (8618 - 23194, n=34)
19540 Points +1%
Razer Blade 16 2024, RTX 4090
Intel Core i9-14900HX
19372 Points 0%
Razer Blade 18 2024 RZ09-0509
Intel Core i9-14900HX
19310 Points
MSI Titan 18 HX A14VIG
Intel Core i9-14900HX
19137 Points -1%
MSI Titan GT77 12UHS
Intel Core i9-12900HX
16250 Points -16%
MSI Pulse 17 B13VGK
Intel Core i7-13700H
13257 Points -31%
Asus TUF Gaming A17 FA707XI-NS94
AMD Ryzen 9 7940HS
11399 Points -41%
Acer Nitro 17 AN17-41-R9LN
AMD Ryzen 7 7735HS
9694 Points -50%
Geekbench 5.5 / Single-Core
Alienware m18 R2
Intel Core i9-14900HX
2193 Points +9%
Asus ROG Strix Scar 17 G733PYV-LL053X
AMD Ryzen 9 7945HX3D
2133 Points +6%
Razer Blade 16 2024, RTX 4090
Intel Core i9-14900HX
2131 Points +6%
Alienware m18 R1 AMD
AMD Ryzen 9 7945HX
2124 Points +5%
Asus ROG Strix Scar 18 G834JYR (2024)
Intel Core i9-14900HX
2118 Points +5%
MSI Titan 18 HX A14VIG
Intel Core i9-14900HX
2098 Points +4%
Durchschnittliche Intel Core i9-14900HX
  (1669 - 2210, n=34)
2092 Points +4%
Alienware m18 R1
Intel Core i9-13980HX
2062 Points +2%
Razer Blade 18 RTX 4070
Intel Core i9-13950HX
2035 Points +1%
Razer Blade 18 2024 RZ09-0509
Intel Core i9-14900HX
2015 Points
Asus TUF Gaming A17 FA707XI-NS94
AMD Ryzen 9 7940HS
2014 Points 0%
MSI Titan GT77 12UHS
Intel Core i9-12900HX
1923 Points -5%
MSI Pulse 17 B13VGK
Intel Core i7-13700H
1704 Points -15%
Acer Nitro 17 AN17-41-R9LN
AMD Ryzen 7 7735HS
1554 Points -23%
HWBOT x265 Benchmark v2.2 / 4k Preset
Alienware m18 R1 AMD
AMD Ryzen 9 7945HX
37.5 fps +35%
Asus ROG Strix Scar 17 G733PYV-LL053X
AMD Ryzen 9 7945HX3D
36.4 fps +31%
Alienware m18 R1
Intel Core i9-13980HX
33.1 fps +19%
Alienware m18 R2
Intel Core i9-14900HX
32.1 fps +16%
Razer Blade 18 RTX 4070
Intel Core i9-13950HX
31 fps +12%
MSI Titan 18 HX A14VIG
Intel Core i9-14900HX
30.9 fps +12%
Razer Blade 16 2024, RTX 4090
Intel Core i9-14900HX
30.1 fps +9%
Durchschnittliche Intel Core i9-14900HX
  (16.8 - 38.9, n=34)
29.7 fps +7%
Asus ROG Strix Scar 18 G834JYR (2024)
Intel Core i9-14900HX
29.2 fps +5%
Razer Blade 18 2024 RZ09-0509
Intel Core i9-14900HX
27.7 fps
MSI Titan GT77 12UHS
Intel Core i9-12900HX
25.6 fps -8%
Asus TUF Gaming A17 FA707XI-NS94
AMD Ryzen 9 7940HS
21.8 fps -21%
MSI Pulse 17 B13VGK
Intel Core i7-13700H
21.2 fps -23%
Acer Nitro 17 AN17-41-R9LN
AMD Ryzen 7 7735HS
17 fps -39%
LibreOffice / 20 Documents To PDF
Acer Nitro 17 AN17-41-R9LN
AMD Ryzen 7 7735HS
63.8 s * -32%
MSI Pulse 17 B13VGK
Intel Core i7-13700H
62.4 s * -29%
Asus TUF Gaming A17 FA707XI-NS94
AMD Ryzen 9 7940HS
49.4 s * -2%
Razer Blade 18 2024 RZ09-0509
Intel Core i9-14900HX
48.5 s *
Razer Blade 16 2024, RTX 4090
Intel Core i9-14900HX
47.5 s * +2%
Alienware m18 R1
Intel Core i9-13980HX
46.7 s * +4%
MSI Titan 18 HX A14VIG
Intel Core i9-14900HX
46.2 s * +5%
Alienware m18 R2
Intel Core i9-14900HX
44.8 s * +8%
Asus ROG Strix Scar 18 G834JYR (2024)
Intel Core i9-14900HX
43.8 s * +10%
Razer Blade 18 RTX 4070
Intel Core i9-13950HX
43.4 s * +11%
Durchschnittliche Intel Core i9-14900HX
  (31.4 - 85.1, n=34)
43.4 s * +11%
Alienware m18 R1 AMD
AMD Ryzen 9 7945HX
41.8 s * +14%
MSI Titan GT77 12UHS
Intel Core i9-12900HX
39 s * +20%
Asus ROG Strix Scar 17 G733PYV-LL053X
AMD Ryzen 9 7945HX3D
39 s * +20%
R Benchmark 2.5 / Overall mean
Acer Nitro 17 AN17-41-R9LN
AMD Ryzen 7 7735HS
0.4911 sec * -25%
MSI Pulse 17 B13VGK
Intel Core i7-13700H
0.4809 sec * -22%
Asus TUF Gaming A17 FA707XI-NS94
AMD Ryzen 9 7940HS
0.4278 sec * -9%
MSI Titan GT77 12UHS
Intel Core i9-12900HX
0.4194 sec * -7%
Alienware m18 R1 AMD
AMD Ryzen 9 7945HX
0.4145 sec * -5%
Asus ROG Strix Scar 17 G733PYV-LL053X
AMD Ryzen 9 7945HX3D
0.4127 sec * -5%
Razer Blade 18 RTX 4070
Intel Core i9-13950HX
0.3955 sec * -0%
Asus ROG Strix Scar 18 G834JYR (2024)
Intel Core i9-14900HX
0.3944 sec * -0%
Razer Blade 18 2024 RZ09-0509
Intel Core i9-14900HX
0.3937 sec *
Alienware m18 R1
Intel Core i9-13980HX
0.3931 sec * -0%
MSI Titan 18 HX A14VIG
Intel Core i9-14900HX
0.3919 sec * -0%
Durchschnittliche Intel Core i9-14900HX
  (0.3604 - 0.4859, n=34)
0.3845 sec * +2%
Razer Blade 16 2024, RTX 4090
Intel Core i9-14900HX
0.3789 sec * +4%
Alienware m18 R2
Intel Core i9-14900HX
0.3767 sec * +4%
CPU Performance Rating: Percent
Cinebench R23: Multi Core | Single Core
Cinebench R20: CPU (Multi Core) | CPU (Single Core)
Cinebench R15: CPU Multi 64Bit | CPU Single 64Bit
Blender: v2.79 BMW27 CPU
7-Zip 18.03: 7z b 4 | 7z b 4 -mmt1
Geekbench 6.3: Multi-Core | Single-Core
Geekbench 5.5: Multi-Core | Single-Core
HWBOT x265 Benchmark v2.2: 4k Preset
LibreOffice : 20 Documents To PDF
R Benchmark 2.5: Overall mean

* ... kleinere Werte sind besser

Cinebench R15 CPU Multi 64Bit
4228 Points
Cinebench R15 OpenGL 64Bit
271 fps
Cinebench R15 Ref. Match 64Bit
99.6 %
Cinebench R15 CPU Single 64Bit
304 Points
Cinebench R20 CPU (Multi Core)
10871 Points
Cinebench R20 CPU (Single Core)
814 Points
Cinebench R23 Single Core
2088 Points
Cinebench R23 Multi Core
27657 Points
Hilfe
Performance Rating
Asus ROG Strix Scar 17 G733PYV-LL053X
AMD Ryzen 9 7945HX3D, NVIDIA GeForce RTX 4090 Laptop GPU
96.8 pt
Alienware m18 R2
Intel Core i9-14900HX, NVIDIA GeForce RTX 4090 Laptop GPU
67.8 pt
MSI Titan 18 HX A14VIG
Intel Core i9-14900HX, NVIDIA GeForce RTX 4090 Laptop GPU
66.8 pt
Razer Blade 16 2024, RTX 4090
Intel Core i9-14900HX, NVIDIA GeForce RTX 4090 Laptop GPU
62.6 pt
Asus ROG Strix Scar 18 G834JYR (2024)
Intel Core i9-14900HX, NVIDIA GeForce RTX 4090 Laptop GPU
62.4 pt
Durchschnittliche Intel Core i9-14900HX
 
61.5 pt
Razer Blade 18 2024 RZ09-0509
Intel Core i9-14900HX, NVIDIA GeForce RTX 4090 Laptop GPU
61.1 pt
Durchschnitt der Klasse Gaming
 
50.9 pt
AIDA64 / FP32 Ray-Trace
Asus ROG Strix Scar 17 G733PYV-LL053X
AMD Ryzen 9 7945HX3D, NVIDIA GeForce RTX 4090 Laptop GPU
53908 KRay/s +115%
MSI Titan 18 HX A14VIG
Intel Core i9-14900HX, NVIDIA GeForce RTX 4090 Laptop GPU
29351 KRay/s +17%
Alienware m18 R2
Intel Core i9-14900HX, NVIDIA GeForce RTX 4090 Laptop GPU
29280 KRay/s +17%
Razer Blade 16 2024, RTX 4090
Intel Core i9-14900HX, NVIDIA GeForce RTX 4090 Laptop GPU
25682 KRay/s +2%
Asus ROG Strix Scar 18 G834JYR (2024)
Intel Core i9-14900HX, NVIDIA GeForce RTX 4090 Laptop GPU
25444 KRay/s +1%
Razer Blade 18 2024 RZ09-0509
Intel Core i9-14900HX, NVIDIA GeForce RTX 4090 Laptop GPU
25098 KRay/s
Durchschnittliche Intel Core i9-14900HX
  (13098 - 33474, n=33)
25096 KRay/s 0%
Durchschnitt der Klasse Gaming
  (4986 - 60169, n=185, der letzten 2 Jahre)
21686 KRay/s -14%
AIDA64 / FPU Julia
Asus ROG Strix Scar 17 G733PYV-LL053X
AMD Ryzen 9 7945HX3D, NVIDIA GeForce RTX 4090 Laptop GPU
222115 Points +73%
MSI Titan 18 HX A14VIG
Intel Core i9-14900HX, NVIDIA GeForce RTX 4090 Laptop GPU
148888 Points +16%
Alienware m18 R2
Intel Core i9-14900HX, NVIDIA GeForce RTX 4090 Laptop GPU
142791 Points +11%
Asus ROG Strix Scar 18 G834JYR (2024)
Intel Core i9-14900HX, NVIDIA GeForce RTX 4090 Laptop GPU
128826 Points 0%
Razer Blade 18 2024 RZ09-0509
Intel Core i9-14900HX, NVIDIA GeForce RTX 4090 Laptop GPU
128369 Points
Razer Blade 16 2024, RTX 4090
Intel Core i9-14900HX, NVIDIA GeForce RTX 4090 Laptop GPU
127908 Points 0%
Durchschnittliche Intel Core i9-14900HX
  (67573 - 166040, n=33)
125765 Points -2%
Durchschnitt der Klasse Gaming
  (25360 - 252486, n=185, der letzten 2 Jahre)
106189 Points -17%
AIDA64 / CPU SHA3
Asus ROG Strix Scar 17 G733PYV-LL053X
AMD Ryzen 9 7945HX3D, NVIDIA GeForce RTX 4090 Laptop GPU
9582 MB/s +56%
MSI Titan 18 HX A14VIG
Intel Core i9-14900HX, NVIDIA GeForce RTX 4090 Laptop GPU
7229 MB/s +17%
Alienware m18 R2
Intel Core i9-14900HX, NVIDIA GeForce RTX 4090 Laptop GPU
7095 MB/s +15%
Durchschnittliche Intel Core i9-14900HX
  (3589 - 7979, n=33)
6212 MB/s +1%
Asus ROG Strix Scar 18 G834JYR (2024)
Intel Core i9-14900HX, NVIDIA GeForce RTX 4090 Laptop GPU
6204 MB/s +1%
Razer Blade 16 2024, RTX 4090
Intel Core i9-14900HX, NVIDIA GeForce RTX 4090 Laptop GPU
6188 MB/s 0%
Razer Blade 18 2024 RZ09-0509
Intel Core i9-14900HX, NVIDIA GeForce RTX 4090 Laptop GPU
6159 MB/s
Durchschnitt der Klasse Gaming
  (1339 - 10389, n=185, der letzten 2 Jahre)
4862 MB/s -21%
AIDA64 / CPU Queen
Asus ROG Strix Scar 17 G733PYV-LL053X
AMD Ryzen 9 7945HX3D, NVIDIA GeForce RTX 4090 Laptop GPU
181270 Points +33%
MSI Titan 18 HX A14VIG
Intel Core i9-14900HX, NVIDIA GeForce RTX 4090 Laptop GPU
148773 Points +9%
Asus ROG Strix Scar 18 G834JYR (2024)
Intel Core i9-14900HX, NVIDIA GeForce RTX 4090 Laptop GPU
141681 Points +4%
Alienware m18 R2
Intel Core i9-14900HX, NVIDIA GeForce RTX 4090 Laptop GPU
139323 Points +2%
Durchschnittliche Intel Core i9-14900HX
  (118405 - 148966, n=33)
138709 Points +2%
Razer Blade 16 2024, RTX 4090
Intel Core i9-14900HX, NVIDIA GeForce RTX 4090 Laptop GPU
138473 Points +1%
Razer Blade 18 2024 RZ09-0509
Intel Core i9-14900HX, NVIDIA GeForce RTX 4090 Laptop GPU
136621 Points
Durchschnitt der Klasse Gaming
  (50699 - 200651, n=185, der letzten 2 Jahre)
116446 Points -15%
AIDA64 / FPU SinJulia
Asus ROG Strix Scar 17 G733PYV-LL053X
AMD Ryzen 9 7945HX3D, NVIDIA GeForce RTX 4090 Laptop GPU
29487 Points +90%
MSI Titan 18 HX A14VIG
Intel Core i9-14900HX, NVIDIA GeForce RTX 4090 Laptop GPU
18256 Points +18%
Alienware m18 R2
Intel Core i9-14900HX, NVIDIA GeForce RTX 4090 Laptop GPU
16279 Points +5%
Asus ROG Strix Scar 18 G834JYR (2024)
Intel Core i9-14900HX, NVIDIA GeForce RTX 4090 Laptop GPU
16121 Points +4%
Razer Blade 16 2024, RTX 4090
Intel Core i9-14900HX, NVIDIA GeForce RTX 4090 Laptop GPU
15857 Points +2%
Razer Blade 18 2024 RZ09-0509
Intel Core i9-14900HX, NVIDIA GeForce RTX 4090 Laptop GPU
15500 Points
Durchschnittliche Intel Core i9-14900HX
  (10475 - 18517, n=33)
15369 Points -1%
Durchschnitt der Klasse Gaming
  (4800 - 32988, n=185, der letzten 2 Jahre)
13194 Points -15%
AIDA64 / FPU Mandel
Asus ROG Strix Scar 17 G733PYV-LL053X
AMD Ryzen 9 7945HX3D, NVIDIA GeForce RTX 4090 Laptop GPU
118813 Points +89%
Alienware m18 R2
Intel Core i9-14900HX, NVIDIA GeForce RTX 4090 Laptop GPU
72594 Points +15%
MSI Titan 18 HX A14VIG
Intel Core i9-14900HX, NVIDIA GeForce RTX 4090 Laptop GPU
72355 Points +15%
Razer Blade 16 2024, RTX 4090
Intel Core i9-14900HX, NVIDIA GeForce RTX 4090 Laptop GPU
64134 Points +2%
Asus ROG Strix Scar 18 G834JYR (2024)
Intel Core i9-14900HX, NVIDIA GeForce RTX 4090 Laptop GPU
63748 Points +1%
Razer Blade 18 2024 RZ09-0509
Intel Core i9-14900HX, NVIDIA GeForce RTX 4090 Laptop GPU
62867 Points
Durchschnittliche Intel Core i9-14900HX
  (32543 - 83662, n=33)
61872 Points -2%
Durchschnitt der Klasse Gaming
  (12321 - 134044, n=185, der letzten 2 Jahre)
53500 Points -15%
AIDA64 / CPU AES
Asus ROG Strix Scar 17 G733PYV-LL053X
AMD Ryzen 9 7945HX3D, NVIDIA GeForce RTX 4090 Laptop GPU
328679 MB/s +179%
MSI Titan 18 HX A14VIG
Intel Core i9-14900HX, NVIDIA GeForce RTX 4090 Laptop GPU
138830 MB/s +18%
Durchschnittliche Intel Core i9-14900HX
  (86964 - 241777, n=33)
137399 MB/s +17%
Alienware m18 R2
Intel Core i9-14900HX, NVIDIA GeForce RTX 4090 Laptop GPU
134675 MB/s +14%
Razer Blade 16 2024, RTX 4090
Intel Core i9-14900HX, NVIDIA GeForce RTX 4090 Laptop GPU
122937 MB/s +4%
Asus ROG Strix Scar 18 G834JYR (2024)
Intel Core i9-14900HX, NVIDIA GeForce RTX 4090 Laptop GPU
122250 MB/s +4%
Razer Blade 18 2024 RZ09-0509
Intel Core i9-14900HX, NVIDIA GeForce RTX 4090 Laptop GPU
117887 MB/s
Durchschnitt der Klasse Gaming
  (19065 - 328679, n=185, der letzten 2 Jahre)
109209 MB/s -7%
AIDA64 / CPU ZLib
MSI Titan 18 HX A14VIG
Intel Core i9-14900HX, NVIDIA GeForce RTX 4090 Laptop GPU
2149 MB/s +20%
Alienware m18 R2
Intel Core i9-14900HX, NVIDIA GeForce RTX 4090 Laptop GPU
2053 MB/s +14%
Asus ROG Strix Scar 17 G733PYV-LL053X
AMD Ryzen 9 7945HX3D, NVIDIA GeForce RTX 4090 Laptop GPU
2043 MB/s +14%
Razer Blade 16 2024, RTX 4090
Intel Core i9-14900HX, NVIDIA GeForce RTX 4090 Laptop GPU
1863 MB/s +4%
Durchschnittliche Intel Core i9-14900HX
  (1054 - 2292, n=33)
1815 MB/s +1%
Razer Blade 18 2024 RZ09-0509
Intel Core i9-14900HX, NVIDIA GeForce RTX 4090 Laptop GPU
1794 MB/s
Asus ROG Strix Scar 18 G834JYR (2024)
Intel Core i9-14900HX, NVIDIA GeForce RTX 4090 Laptop GPU
1789 MB/s 0%
Durchschnitt der Klasse Gaming
  (373 - 2409, n=185, der letzten 2 Jahre)
1352 MB/s -25%
AIDA64 / FP64 Ray-Trace
Asus ROG Strix Scar 17 G733PYV-LL053X
AMD Ryzen 9 7945HX3D, NVIDIA GeForce RTX 4090 Laptop GPU
29140 KRay/s +113%
Alienware m18 R2
Intel Core i9-14900HX, NVIDIA GeForce RTX 4090 Laptop GPU
16128 KRay/s +18%
MSI Titan 18 HX A14VIG
Intel Core i9-14900HX, NVIDIA GeForce RTX 4090 Laptop GPU
16104 KRay/s +18%
Razer Blade 16 2024, RTX 4090
Intel Core i9-14900HX, NVIDIA GeForce RTX 4090 Laptop GPU
13993 KRay/s +2%
Razer Blade 18 2024 RZ09-0509
Intel Core i9-14900HX, NVIDIA GeForce RTX 4090 Laptop GPU
13680 KRay/s
Asus ROG Strix Scar 18 G834JYR (2024)
Intel Core i9-14900HX, NVIDIA GeForce RTX 4090 Laptop GPU
13608 KRay/s -1%
Durchschnittliche Intel Core i9-14900HX
  (6809 - 18349, n=33)
13525 KRay/s -1%
Durchschnitt der Klasse Gaming
  (2540 - 31796, n=185, der letzten 2 Jahre)
11679 KRay/s -15%
AIDA64 / CPU PhotoWorxx
Alienware m18 R2
Intel Core i9-14900HX, NVIDIA GeForce RTX 4090 Laptop GPU
49716 MPixel/s +5%
Asus ROG Strix Scar 18 G834JYR (2024)
Intel Core i9-14900HX, NVIDIA GeForce RTX 4090 Laptop GPU
49710 MPixel/s +5%
Razer Blade 16 2024, RTX 4090
Intel Core i9-14900HX, NVIDIA GeForce RTX 4090 Laptop GPU
49616 MPixel/s +5%
Razer Blade 18 2024 RZ09-0509
Intel Core i9-14900HX, NVIDIA GeForce RTX 4090 Laptop GPU
47472 MPixel/s
Durchschnittliche Intel Core i9-14900HX
  (23903 - 54702, n=33)
46637 MPixel/s -2%
Durchschnitt der Klasse Gaming
  (10805 - 60161, n=186, der letzten 2 Jahre)
39997 MPixel/s -16%
Asus ROG Strix Scar 17 G733PYV-LL053X
AMD Ryzen 9 7945HX3D, NVIDIA GeForce RTX 4090 Laptop GPU
36406 MPixel/s -23%
MSI Titan 18 HX A14VIG
Intel Core i9-14900HX, NVIDIA GeForce RTX 4090 Laptop GPU
33960 MPixel/s -28%

Stresstest

Systemleerlauf
Systemleerlauf

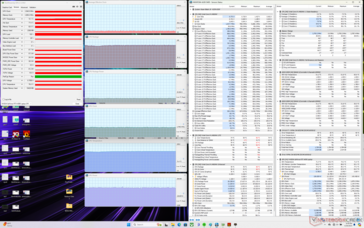
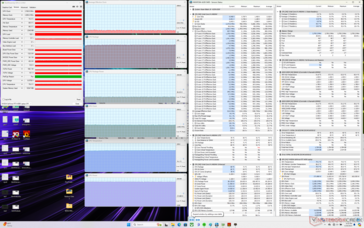
Unter Prime95 stabilisiert sich der CPU-Verbrauch bei um die 117 W, was sehr nahe an dem liegt, was wir auch im letztjährigen Blade 18 gemessen haben (114 W). Gepaart mit den nahezu identischen Leistungswerten weiter oben zementiert sich der Fakt, dass der neuere Raptor-Lake-HX-Refresh kleine bis keine Vorteile gegenüber dem älteren Core i9-13950HX bietet.

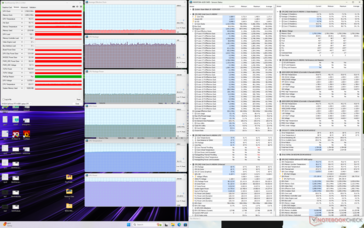
Als typische Gaming-Last lassen wir Witcher 3 laufen, hier zeigen sich keine größeren Unterschiede zwischen Max Fan on oder off, der Wert beim GPU Board Power Draw bleibt annähernd gleich bei stabilen 172 W. Wechseln wir auf den Turbomodus, so reduziert sich der Verbrauch um nur wenige Watt, sodass der Unterschied in der Praxis kaum wahrnehmbar ausfällt. CPU- und GPU-Temperaturen stabilisieren sich bei 80 und 74 °C, verglichen zu den 87 und 64 °C beim deutlich schwereren und nur leicht schnelleren Alienware m18 R2.

Prime95-Stress (Custom Modus, CPU Boost, GPU High, Max Fan on)
Prime95+FurMark-Stress (Custom Modus, CPU Boost, GPU High, Max Fan on)
Witcher-3-Stress (Balanced Modus)
Witcher-3-Stress (Turbomodus)
Witcher-3-Stress (Custom Modus, CPU Boost, GPU High, Max Fan off)
Witcher-3-Stress (Custom Modus, CPU Boost, GPU High, Max Fan on)
Durchschnittlicher, effektiver CPU-Takt (GHz) GPU-Takt (MHz) Durchschnittliche CPU-Temperatur (°C) Durchschnittliche GPU-Temperatur (°C) GPU Board Power Draw
Leerlauf -- -- 54 44 --
Prime95 Stress 2.8 -- 78 54 --
Prime95 + FurMark Stress 1,8 1.515 - 2.340 70 62 42 - 181
Witcher 3 Stress (Custom Mode w/ Max Fan On) ~0,6 2.145 81 70 172
Witcher 3 Stress (Custom Mode w/ Max Fan Off) ~0,5 2.160 80 74 172
Witcher 3 Stress (Turbo Mode) ~0,5 2.100 80 74 165
Witcher 3 Stress (Balanced Mode) ~0,4 1.740 79 71 127

Systemleistung

PCMark-Scores sind auf einem Niveau mit denen von anderen Gaming-Laptops mit ähnlichen Raptor-Lake-HX-CPUs und GeForce RTX 4090, inklusive Systeme mit dem älteren Core i9-13900HX. Die RAM-Geschwindigkeit bleibt zum 2023er Modell unverändert.

Wir sind auf ein paar Bugs beim Versetzen in den Ruhemodus gestoßen. Im dGPU-Modus wird der Laptop auch im Ruhemodus sehr warm. Setzt man hingegen auf Optimus, so scheint das System ganz normal in den Ruhemodus zu gehen. Vereinzelt friert dann auch noch der Bildschirm für mehrere Sekunden ein, wenn man das System aus dem Ruhemodus aufweckt.

Auf der anderen Seite sind die G-Sync-Probleme, auf die wir im 2023er Modell gestoßen sind, im 2024er Modell offenbar behoben worden.

PCMark 10 Standard
PCMark 10 Standard
PCMark 10 / Score
Alienware m18 R2
NVIDIA GeForce RTX 4090 Laptop GPU, i9-14900HX, SK Hynix PC811 HFS002TEM9X152N
9234 Points +5%
Asus ROG Strix Scar 17 G733PYV-LL053X
NVIDIA GeForce RTX 4090 Laptop GPU, R9 7945HX3D, SK hynix PC801 HFS001TEJ9X101N
9117 Points +4%
MSI Titan 18 HX A14VIG
NVIDIA GeForce RTX 4090 Laptop GPU, i9-14900HX, 2x Samsung PM9A1a MZVL22T0HDLB (RAID 0)
8968 Points +2%
Razer Blade 18 2024 RZ09-0509
NVIDIA GeForce RTX 4090 Laptop GPU, i9-14900HX
8805 Points
Asus ROG Strix Scar 18 G834JYR (2024)
NVIDIA GeForce RTX 4090 Laptop GPU, i9-14900HX, Samsung PM9A1a MZVL22T0HDLB
8801 Points 0%
Durchschnittliche Intel Core i9-14900HX, NVIDIA GeForce RTX 4090 Laptop GPU
  (8230 - 9234, n=13)
8674 Points -1%
Razer Blade 16 2024, RTX 4090
NVIDIA GeForce RTX 4090 Laptop GPU, i9-14900HX, Samsung PM9A1 MZVL22T0HBLB
8401 Points -5%
PCMark 10 / Essentials
MSI Titan 18 HX A14VIG
NVIDIA GeForce RTX 4090 Laptop GPU, i9-14900HX, 2x Samsung PM9A1a MZVL22T0HDLB (RAID 0)
11628 Points +2%
Asus ROG Strix Scar 17 G733PYV-LL053X
NVIDIA GeForce RTX 4090 Laptop GPU, R9 7945HX3D, SK hynix PC801 HFS001TEJ9X101N
11561 Points +2%
Alienware m18 R2
NVIDIA GeForce RTX 4090 Laptop GPU, i9-14900HX, SK Hynix PC811 HFS002TEM9X152N
11415 Points 0%
Asus ROG Strix Scar 18 G834JYR (2024)
NVIDIA GeForce RTX 4090 Laptop GPU, i9-14900HX, Samsung PM9A1a MZVL22T0HDLB
11394 Points 0%
Razer Blade 18 2024 RZ09-0509
NVIDIA GeForce RTX 4090 Laptop GPU, i9-14900HX
11378 Points
Durchschnittliche Intel Core i9-14900HX, NVIDIA GeForce RTX 4090 Laptop GPU
  (10778 - 11628, n=13)
11125 Points -2%
Razer Blade 16 2024, RTX 4090
NVIDIA GeForce RTX 4090 Laptop GPU, i9-14900HX, Samsung PM9A1 MZVL22T0HBLB
10915 Points -4%
PCMark 10 / Productivity
Alienware m18 R2
NVIDIA GeForce RTX 4090 Laptop GPU, i9-14900HX, SK Hynix PC811 HFS002TEM9X152N
11415 Points +12%
Razer Blade 16 2024, RTX 4090
NVIDIA GeForce RTX 4090 Laptop GPU, i9-14900HX, Samsung PM9A1 MZVL22T0HBLB
11150 Points +9%
Asus ROG Strix Scar 17 G733PYV-LL053X
NVIDIA GeForce RTX 4090 Laptop GPU, R9 7945HX3D, SK hynix PC801 HFS001TEJ9X101N
10881 Points +7%
Durchschnittliche Intel Core i9-14900HX, NVIDIA GeForce RTX 4090 Laptop GPU
  (9458 - 11759, n=13)
10610 Points +4%
Asus ROG Strix Scar 18 G834JYR (2024)
NVIDIA GeForce RTX 4090 Laptop GPU, i9-14900HX, Samsung PM9A1a MZVL22T0HDLB
10528 Points +3%
MSI Titan 18 HX A14VIG
NVIDIA GeForce RTX 4090 Laptop GPU, i9-14900HX, 2x Samsung PM9A1a MZVL22T0HDLB (RAID 0)
10225 Points 0%
Razer Blade 18 2024 RZ09-0509
NVIDIA GeForce RTX 4090 Laptop GPU, i9-14900HX
10186 Points
PCMark 10 / Digital Content Creation
MSI Titan 18 HX A14VIG
NVIDIA GeForce RTX 4090 Laptop GPU, i9-14900HX, 2x Samsung PM9A1a MZVL22T0HDLB (RAID 0)
16462 Points +3%
Alienware m18 R2
NVIDIA GeForce RTX 4090 Laptop GPU, i9-14900HX, SK Hynix PC811 HFS002TEM9X152N
16398 Points +3%
Asus ROG Strix Scar 17 G733PYV-LL053X
NVIDIA GeForce RTX 4090 Laptop GPU, R9 7945HX3D, SK hynix PC801 HFS001TEJ9X101N
16348 Points +2%
Razer Blade 18 2024 RZ09-0509
NVIDIA GeForce RTX 4090 Laptop GPU, i9-14900HX
15985 Points
Asus ROG Strix Scar 18 G834JYR (2024)
NVIDIA GeForce RTX 4090 Laptop GPU, i9-14900HX, Samsung PM9A1a MZVL22T0HDLB
15421 Points -4%
Durchschnittliche Intel Core i9-14900HX, NVIDIA GeForce RTX 4090 Laptop GPU
  (13219 - 16462, n=13)
15042 Points -6%
Razer Blade 16 2024, RTX 4090
NVIDIA GeForce RTX 4090 Laptop GPU, i9-14900HX, Samsung PM9A1 MZVL22T0HBLB
13219 Points -17%
CrossMark / Overall
Asus ROG Strix Scar 18 G834JYR (2024)
NVIDIA GeForce RTX 4090 Laptop GPU, i9-14900HX, Samsung PM9A1a MZVL22T0HDLB
2208 Points +8%
Razer Blade 16 2024, RTX 4090
NVIDIA GeForce RTX 4090 Laptop GPU, i9-14900HX, Samsung PM9A1 MZVL22T0HBLB
2149 Points +5%
Durchschnittliche Intel Core i9-14900HX, NVIDIA GeForce RTX 4090 Laptop GPU
  (1877 - 2344, n=10)
2119 Points +3%
Asus ROG Strix Scar 17 G733PYV-LL053X
NVIDIA GeForce RTX 4090 Laptop GPU, R9 7945HX3D, SK hynix PC801 HFS001TEJ9X101N
2086 Points +2%
Alienware m18 R2
NVIDIA GeForce RTX 4090 Laptop GPU, i9-14900HX, SK Hynix PC811 HFS002TEM9X152N
2073 Points +1%
Razer Blade 18 2024 RZ09-0509
NVIDIA GeForce RTX 4090 Laptop GPU, i9-14900HX
2048 Points
MSI Titan 18 HX A14VIG
NVIDIA GeForce RTX 4090 Laptop GPU, i9-14900HX, 2x Samsung PM9A1a MZVL22T0HDLB (RAID 0)
1877 Points -8%
CrossMark / Productivity
Asus ROG Strix Scar 18 G834JYR (2024)
NVIDIA GeForce RTX 4090 Laptop GPU, i9-14900HX, Samsung PM9A1a MZVL22T0HDLB
2055 Points +8%
Razer Blade 16 2024, RTX 4090
NVIDIA GeForce RTX 4090 Laptop GPU, i9-14900HX, Samsung PM9A1 MZVL22T0HBLB
2007 Points +6%
Durchschnittliche Intel Core i9-14900HX, NVIDIA GeForce RTX 4090 Laptop GPU
  (1738 - 2162, n=10)
1968 Points +3%
Asus ROG Strix Scar 17 G733PYV-LL053X
NVIDIA GeForce RTX 4090 Laptop GPU, R9 7945HX3D, SK hynix PC801 HFS001TEJ9X101N
1948 Points +2%
Razer Blade 18 2024 RZ09-0509
NVIDIA GeForce RTX 4090 Laptop GPU, i9-14900HX
1902 Points
Alienware m18 R2
NVIDIA GeForce RTX 4090 Laptop GPU, i9-14900HX, SK Hynix PC811 HFS002TEM9X152N
1881 Points -1%
MSI Titan 18 HX A14VIG
NVIDIA GeForce RTX 4090 Laptop GPU, i9-14900HX, 2x Samsung PM9A1a MZVL22T0HDLB (RAID 0)
1738 Points -9%
CrossMark / Creativity
Asus ROG Strix Scar 18 G834JYR (2024)
NVIDIA GeForce RTX 4090 Laptop GPU, i9-14900HX, Samsung PM9A1a MZVL22T0HDLB
2478 Points +7%
Razer Blade 16 2024, RTX 4090
NVIDIA GeForce RTX 4090 Laptop GPU, i9-14900HX, Samsung PM9A1 MZVL22T0HBLB
2418 Points +4%
Asus ROG Strix Scar 17 G733PYV-LL053X
NVIDIA GeForce RTX 4090 Laptop GPU, R9 7945HX3D, SK hynix PC801 HFS001TEJ9X101N
2415 Points +4%
Alienware m18 R2
NVIDIA GeForce RTX 4090 Laptop GPU, i9-14900HX, SK Hynix PC811 HFS002TEM9X152N
2393 Points +3%
Durchschnittliche Intel Core i9-14900HX, NVIDIA GeForce RTX 4090 Laptop GPU
  (2195 - 2660, n=10)
2387 Points +3%
Razer Blade 18 2024 RZ09-0509
NVIDIA GeForce RTX 4090 Laptop GPU, i9-14900HX
2316 Points
MSI Titan 18 HX A14VIG
NVIDIA GeForce RTX 4090 Laptop GPU, i9-14900HX, 2x Samsung PM9A1a MZVL22T0HDLB (RAID 0)
2195 Points -5%
CrossMark / Responsiveness
Asus ROG Strix Scar 18 G834JYR (2024)
NVIDIA GeForce RTX 4090 Laptop GPU, i9-14900HX, Samsung PM9A1a MZVL22T0HDLB
1944 Points +10%
Durchschnittliche Intel Core i9-14900HX, NVIDIA GeForce RTX 4090 Laptop GPU
  (1478 - 2327, n=10)
1862 Points +5%
Razer Blade 16 2024, RTX 4090
NVIDIA GeForce RTX 4090 Laptop GPU, i9-14900HX, Samsung PM9A1 MZVL22T0HBLB
1851 Points +5%
Alienware m18 R2
NVIDIA GeForce RTX 4090 Laptop GPU, i9-14900HX, SK Hynix PC811 HFS002TEM9X152N
1806 Points +2%
Razer Blade 18 2024 RZ09-0509
NVIDIA GeForce RTX 4090 Laptop GPU, i9-14900HX
1765 Points
Asus ROG Strix Scar 17 G733PYV-LL053X
NVIDIA GeForce RTX 4090 Laptop GPU, R9 7945HX3D, SK hynix PC801 HFS001TEJ9X101N
1649 Points -7%
MSI Titan 18 HX A14VIG
NVIDIA GeForce RTX 4090 Laptop GPU, i9-14900HX, 2x Samsung PM9A1a MZVL22T0HDLB (RAID 0)
1478 Points -16%
WebXPRT 3 / Overall
Asus ROG Strix Scar 17 G733PYV-LL053X
NVIDIA GeForce RTX 4090 Laptop GPU, R9 7945HX3D, SK hynix PC801 HFS001TEJ9X101N
480 Points +42%
Razer Blade 18 2024 RZ09-0509
NVIDIA GeForce RTX 4090 Laptop GPU, i9-14900HX
339 Points
Razer Blade 16 2024, RTX 4090
NVIDIA GeForce RTX 4090 Laptop GPU, i9-14900HX, Samsung PM9A1 MZVL22T0HBLB
330 Points -3%
MSI Titan 18 HX A14VIG
NVIDIA GeForce RTX 4090 Laptop GPU, i9-14900HX, 2x Samsung PM9A1a MZVL22T0HDLB (RAID 0)
327 Points -4%
Alienware m18 R2
NVIDIA GeForce RTX 4090 Laptop GPU, i9-14900HX, SK Hynix PC811 HFS002TEM9X152N
326 Points -4%
Durchschnittliche Intel Core i9-14900HX, NVIDIA GeForce RTX 4090 Laptop GPU
  (279 - 339, n=10)
323 Points -5%
Asus ROG Strix Scar 18 G834JYR (2024)
NVIDIA GeForce RTX 4090 Laptop GPU, i9-14900HX, Samsung PM9A1a MZVL22T0HDLB
322 Points -5%
WebXPRT 4 / Overall
Asus ROG Strix Scar 17 G733PYV-LL053X
NVIDIA GeForce RTX 4090 Laptop GPU, R9 7945HX3D, SK hynix PC801 HFS001TEJ9X101N
328 Points
Alienware m18 R2
NVIDIA GeForce RTX 4090 Laptop GPU, i9-14900HX, SK Hynix PC811 HFS002TEM9X152N
309 Points
Asus ROG Strix Scar 18 G834JYR (2024)
NVIDIA GeForce RTX 4090 Laptop GPU, i9-14900HX, Samsung PM9A1a MZVL22T0HDLB
304 Points
Durchschnittliche Intel Core i9-14900HX, NVIDIA GeForce RTX 4090 Laptop GPU
  (246 - 309, n=8)
291 Points
MSI Titan 18 HX A14VIG
NVIDIA GeForce RTX 4090 Laptop GPU, i9-14900HX, 2x Samsung PM9A1a MZVL22T0HDLB (RAID 0)
287 Points
Mozilla Kraken 1.1 / Total
Durchschnittliche Intel Core i9-14900HX, NVIDIA GeForce RTX 4090 Laptop GPU
  (428 - 535, n=11)
456 ms * -2%
MSI Titan 18 HX A14VIG
NVIDIA GeForce RTX 4090 Laptop GPU, i9-14900HX, 2x Samsung PM9A1a MZVL22T0HDLB (RAID 0)
452 ms * -1%
Razer Blade 16 2024, RTX 4090
NVIDIA GeForce RTX 4090 Laptop GPU, i9-14900HX, Samsung PM9A1 MZVL22T0HBLB
450 ms * -0%
Asus ROG Strix Scar 18 G834JYR (2024)
NVIDIA GeForce RTX 4090 Laptop GPU, i9-14900HX, Samsung PM9A1a MZVL22T0HDLB
449 ms * -0%
Razer Blade 18 2024 RZ09-0509
NVIDIA GeForce RTX 4090 Laptop GPU, i9-14900HX
449 ms *
Alienware m18 R2
NVIDIA GeForce RTX 4090 Laptop GPU, i9-14900HX, SK Hynix PC811 HFS002TEM9X152N
430 ms * +4%
Asus ROG Strix Scar 17 G733PYV-LL053X
NVIDIA GeForce RTX 4090 Laptop GPU, R9 7945HX3D, SK hynix PC801 HFS001TEJ9X101N
421.3 ms * +6%

* ... kleinere Werte sind besser

PCMark 10 Score
8805 Punkte
Hilfe
AIDA64 / Memory Copy
Asus ROG Strix Scar 18 G834JYR (2024)
Intel Core i9-14900HX, NVIDIA GeForce RTX 4090 Laptop GPU
83392 MB/s +9%
Alienware m18 R2
Intel Core i9-14900HX, NVIDIA GeForce RTX 4090 Laptop GPU
79243 MB/s +4%
Razer Blade 16 2024, RTX 4090
Intel Core i9-14900HX, NVIDIA GeForce RTX 4090 Laptop GPU
78799 MB/s +3%
Razer Blade 18 RTX 4070
Intel Core i9-13950HX, NVIDIA GeForce RTX 4070 Laptop GPU
77096 MB/s +1%
Razer Blade 18 2024 RZ09-0509
Intel Core i9-14900HX, NVIDIA GeForce RTX 4090 Laptop GPU
76268 MB/s
Durchschnittliche Intel Core i9-14900HX
  (38028 - 83392, n=33)
74739 MB/s -2%
MSI Titan 18 HX A14VIG
Intel Core i9-14900HX, NVIDIA GeForce RTX 4090 Laptop GPU
56992 MB/s -25%
Asus ROG Strix Scar 17 G733PYV-LL053X
AMD Ryzen 9 7945HX3D, NVIDIA GeForce RTX 4090 Laptop GPU
50335 MB/s -34%
AIDA64 / Memory Read
Asus ROG Strix Scar 18 G834JYR (2024)
Intel Core i9-14900HX, NVIDIA GeForce RTX 4090 Laptop GPU
86788 MB/s +5%
Razer Blade 16 2024, RTX 4090
Intel Core i9-14900HX, NVIDIA GeForce RTX 4090 Laptop GPU
86387 MB/s +4%
Razer Blade 18 RTX 4070
Intel Core i9-13950HX, NVIDIA GeForce RTX 4070 Laptop GPU
86207 MB/s +4%
Alienware m18 R2
Intel Core i9-14900HX, NVIDIA GeForce RTX 4090 Laptop GPU
85791 MB/s +3%
Razer Blade 18 2024 RZ09-0509
Intel Core i9-14900HX, NVIDIA GeForce RTX 4090 Laptop GPU
82992 MB/s
Durchschnittliche Intel Core i9-14900HX
  (43306 - 87568, n=33)
80919 MB/s -2%
Asus ROG Strix Scar 17 G733PYV-LL053X
AMD Ryzen 9 7945HX3D, NVIDIA GeForce RTX 4090 Laptop GPU
59921 MB/s -28%
MSI Titan 18 HX A14VIG
Intel Core i9-14900HX, NVIDIA GeForce RTX 4090 Laptop GPU
54443 MB/s -34%
AIDA64 / Memory Write
Asus ROG Strix Scar 18 G834JYR (2024)
Intel Core i9-14900HX, NVIDIA GeForce RTX 4090 Laptop GPU
77534 MB/s +14%
Alienware m18 R2
Intel Core i9-14900HX, NVIDIA GeForce RTX 4090 Laptop GPU
77089 MB/s +14%
Razer Blade 18 RTX 4070
Intel Core i9-13950HX, NVIDIA GeForce RTX 4070 Laptop GPU
75814 MB/s +12%
Razer Blade 16 2024, RTX 4090
Intel Core i9-14900HX, NVIDIA GeForce RTX 4090 Laptop GPU
75421 MB/s +11%
Durchschnittliche Intel Core i9-14900HX
  (37146 - 80589, n=33)
71949 MB/s +6%
Razer Blade 18 2024 RZ09-0509
Intel Core i9-14900HX, NVIDIA GeForce RTX 4090 Laptop GPU
67801 MB/s
Asus ROG Strix Scar 17 G733PYV-LL053X
AMD Ryzen 9 7945HX3D, NVIDIA GeForce RTX 4090 Laptop GPU
58774 MB/s -13%
MSI Titan 18 HX A14VIG
Intel Core i9-14900HX, NVIDIA GeForce RTX 4090 Laptop GPU
51387 MB/s -24%
AIDA64 / Memory Latency
MSI Titan 18 HX A14VIG
Intel Core i9-14900HX, NVIDIA GeForce RTX 4090 Laptop GPU
105 ns * -20%
Asus ROG Strix Scar 17 G733PYV-LL053X
AMD Ryzen 9 7945HX3D, NVIDIA GeForce RTX 4090 Laptop GPU
88.6 ns * -1%
Razer Blade 18 2024 RZ09-0509
Intel Core i9-14900HX, NVIDIA GeForce RTX 4090 Laptop GPU
87.6 ns *
Alienware m18 R2
Intel Core i9-14900HX, NVIDIA GeForce RTX 4090 Laptop GPU
86.4 ns * +1%
Durchschnittliche Intel Core i9-14900HX
  (76.1 - 105, n=33)
84.8 ns * +3%
Razer Blade 18 RTX 4070
Intel Core i9-13950HX, NVIDIA GeForce RTX 4070 Laptop GPU
84.5 ns * +4%
Razer Blade 16 2024, RTX 4090
Intel Core i9-14900HX, NVIDIA GeForce RTX 4090 Laptop GPU
83.4 ns * +5%
Asus ROG Strix Scar 18 G834JYR (2024)
Intel Core i9-14900HX, NVIDIA GeForce RTX 4090 Laptop GPU
82.8 ns * +5%

* ... kleinere Werte sind besser

DPC Latency

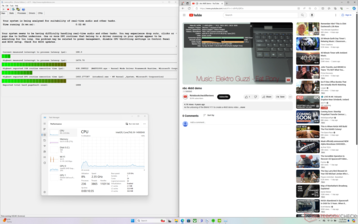
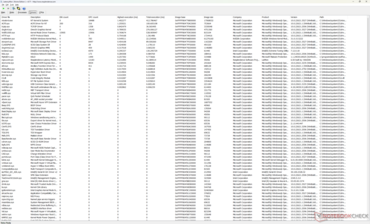
LatencyMon verweist nur auf geringfügige DPC-Probleme beim Öffnen mehrerer Browsertabs auf unserer Homepage. Die Wiedergabe unseres 4K/60-fps-YouTubevideos läuft perfekt und ohne ausgelassene Frames ab, mit Ausnahme eines einzelnen Frames beim Anfertigen des Screenshots.

LatencyMon
LatencyMon
Treiberliste
Treiberliste
DPC Latencies / LatencyMon - interrupt to process latency (max), Web, Youtube, Prime95
Alienware m18 R2
NVIDIA GeForce RTX 4090 Laptop GPU, i9-14900HX, SK Hynix PC811 HFS002TEM9X152N
2815.1 μs * -90%
MSI Titan 18 HX A14VIG
NVIDIA GeForce RTX 4090 Laptop GPU, i9-14900HX, 2x Samsung PM9A1a MZVL22T0HDLB (RAID 0)
2384.5 μs * -61%
Razer Blade 18 2024 RZ09-0509
NVIDIA GeForce RTX 4090 Laptop GPU, i9-14900HX
1479.7 μs *
Razer Blade 16 2024, RTX 4090
NVIDIA GeForce RTX 4090 Laptop GPU, i9-14900HX, Samsung PM9A1 MZVL22T0HBLB
1389.7 μs * +6%
Asus ROG Strix Scar 18 G834JYR (2024)
NVIDIA GeForce RTX 4090 Laptop GPU, i9-14900HX, Samsung PM9A1a MZVL22T0HDLB
1117.4 μs * +24%
Asus ROG Strix Scar 17 G733PYV-LL053X
NVIDIA GeForce RTX 4090 Laptop GPU, R9 7945HX3D, SK hynix PC801 HFS001TEJ9X101N
1100.8 μs * +26%

* ... kleinere Werte sind besser

Massenspeicher

Sowohl das 2023er als auch das aktuelle Blade 18 sind mit einer Micron CA6 NVMe SSDs bestückt, während die meisten anderen Blade-Modelle mit Samsung-Speicher ausgestattet sind. Lese- und Schreibraten kleinerer 4K-Blöcke sind eher auf der langsameren Seite, ansonsten gibt es aber keinerlei Drosselprobleme.

PCIe5-SSDs sind bislang leider noch nicht vorhanden, vermutlich durch zu hohe Kosten und die limitierte Verfügbarkeit.

AS SSD
AS SSD
CDM 8
CDM 8
CDM 5/6 Read Seq Q32T1: 6905 MB/s
CDM 5/6 Write Seq Q32T1: 4883 MB/s
CDM 5/6 Read 4K Q32T1: 438 MB/s
CDM 5/6 Write 4K Q32T1: 405.9 MB/s
CDM 5 Read Seq: 3709 MB/s
CDM 5 Write Seq: 3438 MB/s
CDM 5/6 Read 4K: 65.54 MB/s
CDM 5/6 Write 4K: 157.3 MB/s
Drive Performance Rating - Percent
Alienware m18 R2
SK Hynix PC811 HFS002TEM9X152N
83.6 pt
Asus ROG Strix Scar 18 G834JYR (2024)
Samsung PM9A1a MZVL22T0HDLB
69.7 pt
Razer Blade 18 RTX 4070
SSSTC CA6-8D1024
66 pt
Razer Blade 16 2024, RTX 4090
Samsung PM9A1 MZVL22T0HBLB
63.2 pt
MSI Titan 18 HX A14VIG
2x Samsung PM9A1a MZVL22T0HDLB (RAID 0)
62.7 pt
Asus ROG Strix Scar 17 G733PYV-LL053X
SK hynix PC801 HFS001TEJ9X101N
50.3 pt
Razer Blade 18 2024 RZ09-0509
 
50.2 pt
DiskSpd
seq read
Alienware m18 R2
SK Hynix PC811 HFS002TEM9X152N
5588 (5540.05min - 5587.65max) MB/s +57%
MSI Titan 18 HX A14VIG
2x Samsung PM9A1a MZVL22T0HDLB (RAID 0)
5424 (5395.57min - 5423.86max) MB/s +52%
Asus ROG Strix Scar 18 G834JYR (2024)
Samsung PM9A1a MZVL22T0HDLB
3908 (3887.48min - 3908.2max) MB/s +10%
Razer Blade 18 RTX 4070
SSSTC CA6-8D1024
3889 (3873.65min - 3888.73max) MB/s +9%
Razer Blade 16 2024, RTX 4090
Samsung PM9A1 MZVL22T0HBLB
3795 (3693.04min - 3794.8max) MB/s +7%
Razer Blade 18 2024 RZ09-0509
 
3560 (3002.28min - 3559.93max) MB/s
Asus ROG Strix Scar 17 G733PYV-LL053X
SK hynix PC801 HFS001TEJ9X101N
2570 (2552.37min - 2570.06max) MB/s -28%
seq write
MSI Titan 18 HX A14VIG
2x Samsung PM9A1a MZVL22T0HDLB (RAID 0)
7291 (7191.64min - 7291.38max) MB/s +117%
Alienware m18 R2
SK Hynix PC811 HFS002TEM9X152N
5153 (5139.7min - 5152.91max) MB/s +53%
Asus ROG Strix Scar 18 G834JYR (2024)
Samsung PM9A1a MZVL22T0HDLB
4335 (4306.29min - 4335.44max) MB/s +29%
Razer Blade 18 RTX 4070
SSSTC CA6-8D1024
3798 (3750.39min - 3798.15max) MB/s +13%
Razer Blade 16 2024, RTX 4090
Samsung PM9A1 MZVL22T0HBLB
3794 (3745.51min - 3793.5max) MB/s +13%
Razer Blade 18 2024 RZ09-0509
 
3367 (3255.82min - 3366.95max) MB/s
Asus ROG Strix Scar 17 G733PYV-LL053X
SK hynix PC801 HFS001TEJ9X101N
1690 (1454.82min - 1690.3max) MB/s -50%
seq q8 t1 read
MSI Titan 18 HX A14VIG
2x Samsung PM9A1a MZVL22T0HDLB (RAID 0)
13588 (10727.3min - 13588.3max) MB/s +100%
Alienware m18 R2
SK Hynix PC811 HFS002TEM9X152N
7110 (6256.85min - 7110.18max) MB/s +5%
Asus ROG Strix Scar 18 G834JYR (2024)
Samsung PM9A1a MZVL22T0HDLB
7084 (6413.06min - 7083.97max) MB/s +4%
Asus ROG Strix Scar 17 G733PYV-LL053X
SK hynix PC801 HFS001TEJ9X101N
6971 (6127.67min - 6971.35max) MB/s +3%
Razer Blade 18 RTX 4070
SSSTC CA6-8D1024
6810 (6260.27min - 6809.87max) MB/s 0%
Razer Blade 18 2024 RZ09-0509
 
6797 (5573.18min - 6797.33max) MB/s
Razer Blade 16 2024, RTX 4090
Samsung PM9A1 MZVL22T0HBLB
6673 (5801.28min - 6672.72max) MB/s -2%
seq q8 t1 write
MSI Titan 18 HX A14VIG
2x Samsung PM9A1a MZVL22T0HDLB (RAID 0)
10571 (10519.3min - 10571.3max) MB/s +116%
Alienware m18 R2
SK Hynix PC811 HFS002TEM9X152N
6779 (6710.47min - 6778.83max) MB/s +38%
Asus ROG Strix Scar 18 G834JYR (2024)
Samsung PM9A1a MZVL22T0HDLB
5255 (5183.65min - 5254.62max) MB/s +7%
Razer Blade 16 2024, RTX 4090
Samsung PM9A1 MZVL22T0HBLB
4936 (4909.47min - 4936.28max) MB/s +1%
Razer Blade 18 2024 RZ09-0509
 
4902 (4309.42min - 4901.73max) MB/s
Razer Blade 18 RTX 4070
SSSTC CA6-8D1024
4426 (4263.58min - 4426.04max) MB/s -10%
Asus ROG Strix Scar 17 G733PYV-LL053X
SK hynix PC801 HFS001TEJ9X101N
2382 (920.86min - 2382.42max) MB/s -51%
4k q1 t1 read
Asus ROG Strix Scar 18 G834JYR (2024)
Samsung PM9A1a MZVL22T0HDLB
80.7 (80.11min - 80.66max) MB/s +31%
Alienware m18 R2
SK Hynix PC811 HFS002TEM9X152N
75.4 (73.49min - 75.43max) MB/s +22%
Razer Blade 18 RTX 4070
SSSTC CA6-8D1024
74.5 (73.46min - 74.52max) MB/s +21%
Razer Blade 16 2024, RTX 4090
Samsung PM9A1 MZVL22T0HBLB
71.4 (66.19min - 71.35max) MB/s +16%
MSI Titan 18 HX A14VIG
2x Samsung PM9A1a MZVL22T0HDLB (RAID 0)
69.6 (68.6min - 69.57max) MB/s +13%
Razer Blade 18 2024 RZ09-0509
 
61.8 (61.2min - 61.81max) MB/s
Asus ROG Strix Scar 17 G733PYV-LL053X
SK hynix PC801 HFS001TEJ9X101N
54.3 (54.23min - 54.34max) MB/s -12%
4k q1 t1 write
Alienware m18 R2
SK Hynix PC811 HFS002TEM9X152N
300 (297.27min - 299.6max) MB/s +83%
Razer Blade 18 RTX 4070
SSSTC CA6-8D1024
280 (267.82min - 279.79max) MB/s +71%
Asus ROG Strix Scar 18 G834JYR (2024)
Samsung PM9A1a MZVL22T0HDLB
230 (219.52min - 229.87max) MB/s +40%
Razer Blade 16 2024, RTX 4090
Samsung PM9A1 MZVL22T0HBLB
205 (202.97min - 204.75max) MB/s +25%
Asus ROG Strix Scar 17 G733PYV-LL053X
SK hynix PC801 HFS001TEJ9X101N
183.8 (182.06min - 183.78max) MB/s +12%
Razer Blade 18 2024 RZ09-0509
 
164 (110.95min - 164max) MB/s
MSI Titan 18 HX A14VIG
2x Samsung PM9A1a MZVL22T0HDLB (RAID 0)
152.1 (149.74min - 152.09max) MB/s -7%
4k q32 t16 read
Alienware m18 R2
SK Hynix PC811 HFS002TEM9X152N
6067 (5596.15min - 6066.73max) MB/s +504%
Asus ROG Strix Scar 18 G834JYR (2024)
Samsung PM9A1a MZVL22T0HDLB
3732 (3273.44min - 3732.1max) MB/s +271%
Razer Blade 16 2024, RTX 4090
Samsung PM9A1 MZVL22T0HBLB
3726 (3704.12min - 3725.6max) MB/s +271%
Razer Blade 18 RTX 4070
SSSTC CA6-8D1024
3203 (3180.36min - 3203.41max) MB/s +219%
MSI Titan 18 HX A14VIG
2x Samsung PM9A1a MZVL22T0HDLB (RAID 0)
1623 (1464.8min - 1623.24max) MB/s +61%
Asus ROG Strix Scar 17 G733PYV-LL053X
SK hynix PC801 HFS001TEJ9X101N
1331 (1250.04min - 1330.81max) MB/s +32%
Razer Blade 18 2024 RZ09-0509
 
1005 (964.75min - 1004.59max) MB/s
4k q32 t16 write
Alienware m18 R2
SK Hynix PC811 HFS002TEM9X152N
4176 (3805.57min - 4175.9max) MB/s +845%
Razer Blade 16 2024, RTX 4090
Samsung PM9A1 MZVL22T0HBLB
3548 (3533.85min - 3548.33max) MB/s +703%
Asus ROG Strix Scar 18 G834JYR (2024)
Samsung PM9A1a MZVL22T0HDLB
2900 MB/s +556%
Razer Blade 18 RTX 4070
SSSTC CA6-8D1024
2209 (1041.25min - 2208.74max) MB/s +400%
MSI Titan 18 HX A14VIG
2x Samsung PM9A1a MZVL22T0HDLB (RAID 0)
1377 (1306.51min - 1377.05max) MB/s +212%
Asus ROG Strix Scar 17 G733PYV-LL053X
SK hynix PC801 HFS001TEJ9X101N
730 (694.74min - 729.67max) MB/s +65%
Razer Blade 18 2024 RZ09-0509
 
442 (336.87min - 441.83max) MB/s
AS SSD
Score Total
Alienware m18 R2
SK Hynix PC811 HFS002TEM9X152N
10655 Points +116%
Asus ROG Strix Scar 18 G834JYR (2024)
Samsung PM9A1a MZVL22T0HDLB
8367 Points +70%
Razer Blade 18 RTX 4070
SSSTC CA6-8D1024
7745 Points +57%
Razer Blade 16 2024, RTX 4090
Samsung PM9A1 MZVL22T0HBLB
7040 Points +43%
Asus ROG Strix Scar 17 G733PYV-LL053X
SK hynix PC801 HFS001TEJ9X101N
6546 Points +33%
MSI Titan 18 HX A14VIG
2x Samsung PM9A1a MZVL22T0HDLB (RAID 0)
5369 Points +9%
Razer Blade 18 2024 RZ09-0509
 
4927 Points
Score Read
Alienware m18 R2
SK Hynix PC811 HFS002TEM9X152N
3753 Points +125%
Razer Blade 18 RTX 4070
SSSTC CA6-8D1024
3490 Points +109%
Asus ROG Strix Scar 18 G834JYR (2024)
Samsung PM9A1a MZVL22T0HDLB
3272 Points +96%
Razer Blade 16 2024, RTX 4090
Samsung PM9A1 MZVL22T0HBLB
2848 Points +71%
MSI Titan 18 HX A14VIG
2x Samsung PM9A1a MZVL22T0HDLB (RAID 0)
2194 Points +32%
Asus ROG Strix Scar 17 G733PYV-LL053X
SK hynix PC801 HFS001TEJ9X101N
1689 Points +1%
Razer Blade 18 2024 RZ09-0509
 
1667 Points
Score Write
Alienware m18 R2
SK Hynix PC811 HFS002TEM9X152N
4993 Points +98%
Asus ROG Strix Scar 17 G733PYV-LL053X
SK hynix PC801 HFS001TEJ9X101N
4073 Points +62%
Asus ROG Strix Scar 18 G834JYR (2024)
Samsung PM9A1a MZVL22T0HDLB
3490 Points +39%
Razer Blade 16 2024, RTX 4090
Samsung PM9A1 MZVL22T0HBLB
2766 Points +10%
Razer Blade 18 RTX 4070
SSSTC CA6-8D1024
2566 Points +2%
Razer Blade 18 2024 RZ09-0509
 
2518 Points
MSI Titan 18 HX A14VIG
2x Samsung PM9A1a MZVL22T0HDLB (RAID 0)
2092 Points -17%
Seq Read
MSI Titan 18 HX A14VIG
2x Samsung PM9A1a MZVL22T0HDLB (RAID 0)
9576.8 MB/s +75%
Alienware m18 R2
SK Hynix PC811 HFS002TEM9X152N
5916.27 MB/s +8%
Razer Blade 18 RTX 4070
SSSTC CA6-8D1024
5770.79 MB/s +5%
Asus ROG Strix Scar 17 G733PYV-LL053X
SK hynix PC801 HFS001TEJ9X101N
5739 MB/s +5%
Asus ROG Strix Scar 18 G834JYR (2024)
Samsung PM9A1a MZVL22T0HDLB
5636.54 MB/s +3%
Razer Blade 18 2024 RZ09-0509
 
5476.6 MB/s
Razer Blade 16 2024, RTX 4090
Samsung PM9A1 MZVL22T0HBLB
4371 MB/s -20%
Seq Write
MSI Titan 18 HX A14VIG
2x Samsung PM9A1a MZVL22T0HDLB (RAID 0)
8685.54 MB/s +190%
Alienware m18 R2
SK Hynix PC811 HFS002TEM9X152N
5929.42 MB/s +98%
Asus ROG Strix Scar 18 G834JYR (2024)
Samsung PM9A1a MZVL22T0HDLB
4294.95 MB/s +43%
Asus ROG Strix Scar 17 G733PYV-LL053X
SK hynix PC801 HFS001TEJ9X101N
3972 MB/s +33%
Razer Blade 18 RTX 4070
SSSTC CA6-8D1024
3951.34 MB/s +32%
Razer Blade 16 2024, RTX 4090
Samsung PM9A1 MZVL22T0HBLB
3791 MB/s +27%
Razer Blade 18 2024 RZ09-0509
 
2995.22 MB/s
4K Read
Asus ROG Strix Scar 18 G834JYR (2024)
Samsung PM9A1a MZVL22T0HDLB
75.56 MB/s +15%
Razer Blade 18 RTX 4070
SSSTC CA6-8D1024
69.72 MB/s +6%
Razer Blade 18 2024 RZ09-0509
 
65.49 MB/s
Alienware m18 R2
SK Hynix PC811 HFS002TEM9X152N
64.97 MB/s -1%
MSI Titan 18 HX A14VIG
2x Samsung PM9A1a MZVL22T0HDLB (RAID 0)
63.69 MB/s -3%
Razer Blade 16 2024, RTX 4090
Samsung PM9A1 MZVL22T0HBLB
61.1 MB/s -7%
Asus ROG Strix Scar 17 G733PYV-LL053X
SK hynix PC801 HFS001TEJ9X101N
56 MB/s -14%
4K Write
Razer Blade 18 RTX 4070
SSSTC CA6-8D1024
241.69 MB/s +10%
Alienware m18 R2
SK Hynix PC811 HFS002TEM9X152N
238.28 MB/s +9%
Razer Blade 18 2024 RZ09-0509
 
219.58 MB/s
Asus ROG Strix Scar 18 G834JYR (2024)
Samsung PM9A1a MZVL22T0HDLB
207.25 MB/s -6%
Asus ROG Strix Scar 17 G733PYV-LL053X
SK hynix PC801 HFS001TEJ9X101N
192.1 MB/s -13%
Razer Blade 16 2024, RTX 4090
Samsung PM9A1 MZVL22T0HBLB
160.6 MB/s -27%
MSI Titan 18 HX A14VIG
2x Samsung PM9A1a MZVL22T0HDLB (RAID 0)
134.66 MB/s -39%
4K-64 Read
Alienware m18 R2
SK Hynix PC811 HFS002TEM9X152N
3096 MB/s +194%
Razer Blade 18 RTX 4070
SSSTC CA6-8D1024
2843.31 MB/s +170%
Asus ROG Strix Scar 18 G834JYR (2024)
Samsung PM9A1a MZVL22T0HDLB
2636.61 MB/s +150%
Razer Blade 16 2024, RTX 4090
Samsung PM9A1 MZVL22T0HBLB
2350 MB/s +123%
MSI Titan 18 HX A14VIG
2x Samsung PM9A1a MZVL22T0HDLB (RAID 0)
1172.14 MB/s +11%
Asus ROG Strix Scar 17 G733PYV-LL053X
SK hynix PC801 HFS001TEJ9X101N
1059 MB/s 0%
Razer Blade 18 2024 RZ09-0509
 
1053.83 MB/s
4K-64 Write
Alienware m18 R2
SK Hynix PC811 HFS002TEM9X152N
4161.9 MB/s +108%
Asus ROG Strix Scar 17 G733PYV-LL053X
SK hynix PC801 HFS001TEJ9X101N
3484 MB/s +74%
Asus ROG Strix Scar 18 G834JYR (2024)
Samsung PM9A1a MZVL22T0HDLB
2866.57 MB/s +43%
Razer Blade 16 2024, RTX 4090
Samsung PM9A1 MZVL22T0HBLB
2226 MB/s +11%
Razer Blade 18 2024 RZ09-0509
 
1998.53 MB/s
Razer Blade 18 RTX 4070
SSSTC CA6-8D1024
1929.02 MB/s -3%
MSI Titan 18 HX A14VIG
2x Samsung PM9A1a MZVL22T0HDLB (RAID 0)
1088.59 MB/s -46%
Access Time Read
Asus ROG Strix Scar 17 G733PYV-LL053X
SK hynix PC801 HFS001TEJ9X101N
0.062 ms * -148%
Asus ROG Strix Scar 18 G834JYR (2024)
Samsung PM9A1a MZVL22T0HDLB
0.046 ms * -84%
MSI Titan 18 HX A14VIG
2x Samsung PM9A1a MZVL22T0HDLB (RAID 0)
0.036 ms * -44%
Razer Blade 16 2024, RTX 4090
Samsung PM9A1 MZVL22T0HBLB
0.033 ms * -32%
Alienware m18 R2
SK Hynix PC811 HFS002TEM9X152N
0.029 ms * -16%
Razer Blade 18 RTX 4070
SSSTC CA6-8D1024
0.026 ms * -4%
Razer Blade 18 2024 RZ09-0509
 
0.025 ms *
Access Time Write
MSI Titan 18 HX A14VIG
2x Samsung PM9A1a MZVL22T0HDLB (RAID 0)
0.091 ms * -60%
Razer Blade 18 2024 RZ09-0509
 
0.057 ms *
Razer Blade 18 RTX 4070
SSSTC CA6-8D1024
0.056 ms * +2%
Alienware m18 R2
SK Hynix PC811 HFS002TEM9X152N
0.055 ms * +4%
Razer Blade 16 2024, RTX 4090
Samsung PM9A1 MZVL22T0HBLB
0.025 ms * +56%
Asus ROG Strix Scar 18 G834JYR (2024)
Samsung PM9A1a MZVL22T0HDLB
0.022 ms * +61%
Asus ROG Strix Scar 17 G733PYV-LL053X
SK hynix PC801 HFS001TEJ9X101N
0.019 ms * +67%

* ... kleinere Werte sind besser

Disk Throttling: DiskSpd Read Loop, Queue Depth 8

035070010501400175021002450280031503500385042004550490052505600595063006650Tooltip
Razer Blade 18 2024 RZ09-0509  ; diskspd 2.0.17 f: Ø6880 (5682.4-6917.67)
Razer Blade 18 RTX 4070 SSSTC CA6-8D1024: Ø6845 (5855.67-6875.3)

Gaming Performance — RTX 4090 im zweiten Jahr in Folge

Die reine Grafikleistung der mobilen GeForce RTX 4090 ist quasi identisch zum Blade 16 mit der gleichen 175-W-Grafikkarte. Daher stellt das Blade 18 Spiele nicht spürbar schneller dar als das kleinere Modell. Setzzt man auf die langsameren Konfigurationen mit RTX 4080 oder 4070, so kann man einen Leistungsrückgang von 10 bis 35 oder gar 40 Prozent erwarten. Das MSI Titan 18 HX ist mit der gleichen GPU etwas schneller als unser Razer, fällt aber gleichzeitig auch signifikant größer und schwerer aus.

Der Max Fan Modus hat dabei bestenfalls einen minimalen Einfluss auf die Leistung, wie unsere Tabelle der Fire-Strike-Ergebnisse unten zeigt. Das Aktivieren von Max Fan ist also nicht nötig, um die beste GPU-Leistung zu erhalten. Selbst der Turbomodus scheint keinen signifikanten Effekt auf die Gamingleistung zu haben. 

Power ProfileGraphics ScorePhysics ScoreCombined Score
Custom Profile mit Max Fan On44.70238.88712.094
Custom Profile mit Max Fan Off44.397 (-1%)35.809 (-8%)12.595 (-0%)
Turbo Mode44.111 (-1%)33.180 (-15%)13.065 (-0%)
Balanced Mode36.832 (-18%)25.159 (-35%)6.109 (-49%)
Battery Power18.581 (-58%)23.066 (-41%)5.093 (-58%)

Advanced Optimus wird unterstützt und erlaubt das Umherschalten zwischen dGPU und den Optimus-Modi. Allerdings gibt es, anders als bei den aktuellen Alienware-Laptops keinen iGPU-Modus, um zusätzlich Energie zu sparen.

Fire Strike (Custom mode mit Max Fan off)
Fire Strike (Turbomodus)
Fire Strike Ultra
Fire Strike Ultra
Speed Way
Speed Way
Time Spy
Time Spy
 
3DMark Performance Rating - Percent
AMD Ryzen 7 7800X3D
NVIDIA GeForce RTX 4090, AMD Ryzen 7 7800X3D
100 pt
Alienware m18 R1
NVIDIA GeForce RTX 4090 Laptop GPU, Intel Core i9-13980HX
59.6 pt
MSI Titan 18 HX A14VIG
NVIDIA GeForce RTX 4090 Laptop GPU, Intel Core i9-14900HX
59 pt
Alienware m18 R2
NVIDIA GeForce RTX 4090 Laptop GPU, Intel Core i9-14900HX
58.3 pt
Asus ROG Strix Scar 17 G733PYV-LL053X
NVIDIA GeForce RTX 4090 Laptop GPU, AMD Ryzen 9 7945HX3D
58.1 pt
Razer Blade 18 2024 RZ09-0509
NVIDIA GeForce RTX 4090 Laptop GPU, Intel Core i9-14900HX
56.9 pt
Durchschnittliche NVIDIA GeForce RTX 4090 Laptop GPU
 
56.2 pt
Razer Blade 16 2024, RTX 4090 -1!
NVIDIA GeForce RTX 4090 Laptop GPU, Intel Core i9-14900HX
56.1 pt
Asus ROG Strix Scar 18 G834JYR (2024)
NVIDIA GeForce RTX 4090 Laptop GPU, Intel Core i9-14900HX
53.6 pt
Alienware m18 R1 AMD -1!
AMD Radeon RX 7900M, AMD Ryzen 9 7945HX
53.5 pt
Razer Blade 16 Early 2023
NVIDIA GeForce RTX 4080 Laptop GPU, Intel Core i9-13950HX
48.5 pt
Razer Blade 18 RTX 4070
NVIDIA GeForce RTX 4070 Laptop GPU, Intel Core i9-13950HX
31.9 pt
3DMark 11 - 1280x720 Performance GPU
AMD Ryzen 7 7800X3D
NVIDIA GeForce RTX 4090, AMD Ryzen 7 7800X3D
114641 Points +77%
Alienware m18 R1
NVIDIA GeForce RTX 4090 Laptop GPU, Intel Core i9-13980HX
71383 Points +10%
Alienware m18 R2
NVIDIA GeForce RTX 4090 Laptop GPU, Intel Core i9-14900HX
69254 Points +7%
Razer Blade 16 2024, RTX 4090
NVIDIA GeForce RTX 4090 Laptop GPU, Intel Core i9-14900HX
65956 Points +2%
Durchschnittliche NVIDIA GeForce RTX 4090 Laptop GPU
  (54073 - 73027, n=42)
65041 Points 0%
Razer Blade 18 2024 RZ09-0509
NVIDIA GeForce RTX 4090 Laptop GPU, Intel Core i9-14900HX
64952 Points
Asus ROG Strix Scar 17 G733PYV-LL053X
NVIDIA GeForce RTX 4090 Laptop GPU, AMD Ryzen 9 7945HX3D
64166 Points -1%
MSI Titan 18 HX A14VIG
NVIDIA GeForce RTX 4090 Laptop GPU, Intel Core i9-14900HX
63978 Points -1%
Asus ROG Strix Scar 18 G834JYR (2024)
NVIDIA GeForce RTX 4090 Laptop GPU, Intel Core i9-14900HX
61833 Points -5%
Alienware m18 R1 AMD
AMD Radeon RX 7900M, AMD Ryzen 9 7945HX
59943 Points -8%
Razer Blade 16 Early 2023
NVIDIA GeForce RTX 4080 Laptop GPU, Intel Core i9-13950HX
56565 Points -13%
Razer Blade 18 RTX 4070
NVIDIA GeForce RTX 4070 Laptop GPU, Intel Core i9-13950HX
39733 Points -39%
3DMark
1920x1080 Fire Strike Graphics
AMD Ryzen 7 7800X3D
NVIDIA GeForce RTX 4090, AMD Ryzen 7 7800X3D
73447 Points +64%
MSI Titan 18 HX A14VIG
NVIDIA GeForce RTX 4090 Laptop GPU, Intel Core i9-14900HX
50532 Points +13%
Alienware m18 R1 AMD
AMD Radeon RX 7900M, AMD Ryzen 9 7945HX
50241 Points +12%
Asus ROG Strix Scar 17 G733PYV-LL053X
NVIDIA GeForce RTX 4090 Laptop GPU, AMD Ryzen 9 7945HX3D
49422 Points +11%
Alienware m18 R1
NVIDIA GeForce RTX 4090 Laptop GPU, Intel Core i9-13980HX
46998 Points +5%
Razer Blade 16 2024, RTX 4090
NVIDIA GeForce RTX 4090 Laptop GPU, Intel Core i9-14900HX
46527 Points +4%
Durchschnittliche NVIDIA GeForce RTX 4090 Laptop GPU
  (40259 - 53059, n=41)
46365 Points +4%
Razer Blade 18 2024 RZ09-0509
NVIDIA GeForce RTX 4090 Laptop GPU, Intel Core i9-14900HX
44702 Points
Alienware m18 R2
NVIDIA GeForce RTX 4090 Laptop GPU, Intel Core i9-14900HX
44492 Points 0%
Asus ROG Strix Scar 18 G834JYR (2024)
NVIDIA GeForce RTX 4090 Laptop GPU, Intel Core i9-14900HX
43477 Points -3%
Razer Blade 16 Early 2023
NVIDIA GeForce RTX 4080 Laptop GPU, Intel Core i9-13950HX
40570 Points -9%
Razer Blade 18 RTX 4070
NVIDIA GeForce RTX 4070 Laptop GPU, Intel Core i9-13950HX
28743 Points -36%
2560x1440 Time Spy Graphics
AMD Ryzen 7 7800X3D
NVIDIA GeForce RTX 4090, AMD Ryzen 7 7800X3D
37664 Points +77%
Alienware m18 R1
NVIDIA GeForce RTX 4090 Laptop GPU, Intel Core i9-13980HX
22547 Points +6%
Alienware m18 R2
NVIDIA GeForce RTX 4090 Laptop GPU, Intel Core i9-14900HX
22290 Points +5%
MSI Titan 18 HX A14VIG
NVIDIA GeForce RTX 4090 Laptop GPU, Intel Core i9-14900HX
22256 Points +5%
Asus ROG Strix Scar 17 G733PYV-LL053X
NVIDIA GeForce RTX 4090 Laptop GPU, AMD Ryzen 9 7945HX3D
21353 Points +1%
Razer Blade 18 2024 RZ09-0509
NVIDIA GeForce RTX 4090 Laptop GPU, Intel Core i9-14900HX
21246 Points
Durchschnittliche NVIDIA GeForce RTX 4090 Laptop GPU
  (16950 - 23292, n=43)
20950 Points -1%
Asus ROG Strix Scar 18 G834JYR (2024)
NVIDIA GeForce RTX 4090 Laptop GPU, Intel Core i9-14900HX
20070 Points -6%
Razer Blade 16 2024, RTX 4090
NVIDIA GeForce RTX 4090 Laptop GPU, Intel Core i9-14900HX
19878 Points -6%
Alienware m18 R1 AMD
AMD Radeon RX 7900M, AMD Ryzen 9 7945HX
19434 Points -9%
Razer Blade 16 Early 2023
NVIDIA GeForce RTX 4080 Laptop GPU, Intel Core i9-13950HX
18441 Points -13%
Razer Blade 18 RTX 4070
NVIDIA GeForce RTX 4070 Laptop GPU, Intel Core i9-13950HX
11683 Points -45%
2560x1440 Speed Way Score
AMD Ryzen 7 7800X3D
NVIDIA GeForce RTX 4090, AMD Ryzen 7 7800X3D
10133 Points +77%
Alienware m18 R1
NVIDIA GeForce RTX 4090 Laptop GPU, Intel Core i9-13980HX
5794 Points +1%
Alienware m18 R2
NVIDIA GeForce RTX 4090 Laptop GPU, Intel Core i9-14900HX
5784 Points +1%
Razer Blade 18 2024 RZ09-0509
NVIDIA GeForce RTX 4090 Laptop GPU, Intel Core i9-14900HX
5736 Points
MSI Titan 18 HX A14VIG
NVIDIA GeForce RTX 4090 Laptop GPU, Intel Core i9-14900HX
5726 Points 0%
Asus ROG Strix Scar 17 G733PYV-LL053X
NVIDIA GeForce RTX 4090 Laptop GPU, AMD Ryzen 9 7945HX3D
5712 Points 0%
Durchschnittliche NVIDIA GeForce RTX 4090 Laptop GPU
  (4401 - 5940, n=27)
5459 Points -5%
Asus ROG Strix Scar 18 G834JYR (2024)
NVIDIA GeForce RTX 4090 Laptop GPU, Intel Core i9-14900HX
5319 Points -7%
Razer Blade 16 Early 2023
NVIDIA GeForce RTX 4080 Laptop GPU, Intel Core i9-13950HX
4642 Points -19%
Razer Blade 18 RTX 4070
NVIDIA GeForce RTX 4070 Laptop GPU, Intel Core i9-13950HX
2789 Points -51%
2560x1440 Port Royal Graphics
AMD Ryzen 7 7800X3D
NVIDIA GeForce RTX 4090, AMD Ryzen 7 7800X3D
25924 Points +86%
Alienware m18 R1
NVIDIA GeForce RTX 4090 Laptop GPU, Intel Core i9-13980HX
14225 Points +2%
MSI Titan 18 HX A14VIG
NVIDIA GeForce RTX 4090 Laptop GPU, Intel Core i9-14900HX
14201 Points +2%
Alienware m18 R2
NVIDIA GeForce RTX 4090 Laptop GPU, Intel Core i9-14900HX
14069 Points +1%
Asus ROG Strix Scar 17 G733PYV-LL053X
NVIDIA GeForce RTX 4090 Laptop GPU, AMD Ryzen 9 7945HX3D
14057 Points +1%
Razer Blade 18 2024 RZ09-0509
NVIDIA GeForce RTX 4090 Laptop GPU, Intel Core i9-14900HX
13936 Points
Durchschnittliche NVIDIA GeForce RTX 4090 Laptop GPU
  (10798 - 14592, n=31)
13397 Points -4%
Razer Blade 16 2024, RTX 4090
NVIDIA GeForce RTX 4090 Laptop GPU, Intel Core i9-14900HX
13182 Points -5%
Asus ROG Strix Scar 18 G834JYR (2024)
NVIDIA GeForce RTX 4090 Laptop GPU, Intel Core i9-14900HX
12677 Points -9%
Razer Blade 16 Early 2023
NVIDIA GeForce RTX 4080 Laptop GPU, Intel Core i9-13950HX
11665 Points -16%
Razer Blade 16 Early 2023
NVIDIA GeForce RTX 4080 Laptop GPU, Intel Core i9-13950HX
10705 Points -23%
Alienware m18 R1 AMD
AMD Radeon RX 7900M, AMD Ryzen 9 7945HX
10814 Points -22%
Razer Blade 18 RTX 4070
NVIDIA GeForce RTX 4070 Laptop GPU, Intel Core i9-13950HX
7078 Points -49%
3DMark 11 Performance
45938 Punkte
3DMark Fire Strike Score
34597 Punkte
3DMark Time Spy Score
20561 Punkte
Hilfe
Blender
v3.3 Classroom OPTIX/RTX
Razer Blade 18 2024 RZ09-0509
NVIDIA GeForce RTX 4090 Laptop GPU, Intel Core i9-14900HX
14 Seconds *
Durchschnittliche NVIDIA GeForce RTX 4090 Laptop GPU
  (9 - 19, n=39)
12.1 Seconds * +14%
Asus ROG Strix Scar 18 G834JYR (2024)
NVIDIA GeForce RTX 4090 Laptop GPU, Intel Core i9-14900HX
12 Seconds * +14%
Razer Blade 16 2024, RTX 4090
NVIDIA GeForce RTX 4090 Laptop GPU, Intel Core i9-14900HX
12 Seconds * +14%
Alienware m18 R2
NVIDIA GeForce RTX 4090 Laptop GPU, Intel Core i9-14900HX
12 Seconds * +14%
Asus ROG Strix Scar 17 G733PYV-LL053X
NVIDIA GeForce RTX 4090 Laptop GPU, AMD Ryzen 9 7945HX3D
11 Seconds * +21%
MSI Titan 18 HX A14VIG
NVIDIA GeForce RTX 4090 Laptop GPU, Intel Core i9-14900HX
10 Seconds * +29%
v3.3 Classroom CUDA
Razer Blade 18 2024 RZ09-0509
NVIDIA GeForce RTX 4090 Laptop GPU, Intel Core i9-14900HX
19 Seconds *
Durchschnittliche NVIDIA GeForce RTX 4090 Laptop GPU
  (16 - 24, n=39)
18.3 Seconds * +4%
Asus ROG Strix Scar 17 G733PYV-LL053X
NVIDIA GeForce RTX 4090 Laptop GPU, AMD Ryzen 9 7945HX3D
18 Seconds * +5%
MSI Titan 18 HX A14VIG
NVIDIA GeForce RTX 4090 Laptop GPU, Intel Core i9-14900HX
18 Seconds * +5%
Razer Blade 16 2024, RTX 4090
NVIDIA GeForce RTX 4090 Laptop GPU, Intel Core i9-14900HX
18 Seconds * +5%
Alienware m18 R2
NVIDIA GeForce RTX 4090 Laptop GPU, Intel Core i9-14900HX
18 Seconds * +5%
Asus ROG Strix Scar 18 G834JYR (2024)
NVIDIA GeForce RTX 4090 Laptop GPU, Intel Core i9-14900HX
17 Seconds * +11%
v3.3 Classroom CPU
Asus ROG Strix Scar 18 G834JYR (2024)
NVIDIA GeForce RTX 4090 Laptop GPU, Intel Core i9-14900HX
209 Seconds * -1%
Razer Blade 18 2024 RZ09-0509
NVIDIA GeForce RTX 4090 Laptop GPU, Intel Core i9-14900HX
207 Seconds *
Razer Blade 16 2024, RTX 4090
NVIDIA GeForce RTX 4090 Laptop GPU, Intel Core i9-14900HX
202 Seconds * +2%
Durchschnittliche NVIDIA GeForce RTX 4090 Laptop GPU
  (144 - 305, n=39)
199.1 Seconds * +4%
Alienware m18 R2
NVIDIA GeForce RTX 4090 Laptop GPU, Intel Core i9-14900HX
180 Seconds * +13%
MSI Titan 18 HX A14VIG
NVIDIA GeForce RTX 4090 Laptop GPU, Intel Core i9-14900HX
179 Seconds * +14%
Asus ROG Strix Scar 17 G733PYV-LL053X
NVIDIA GeForce RTX 4090 Laptop GPU, AMD Ryzen 9 7945HX3D
150 Seconds * +28%

* ... kleinere Werte sind besser

Performance Rating - Percent
Asus ROG Strix Scar 17 G733PYV-LL053X
AMD Ryzen 9 7945HX3D, NVIDIA GeForce RTX 4090 Laptop GPU
98.5 pt
Alienware m18 R2
Intel Core i9-14900HX, NVIDIA GeForce RTX 4090 Laptop GPU
88.3 pt
MSI Titan 18 HX A14VIG
Intel Core i9-14900HX, NVIDIA GeForce RTX 4090 Laptop GPU
87.5 pt
Razer Blade 16 2024, RTX 4090
Intel Core i9-14900HX, NVIDIA GeForce RTX 4090 Laptop GPU
84.6 pt
Asus ROG Strix Scar 18 G834JYR (2024)
Intel Core i9-14900HX, NVIDIA GeForce RTX 4090 Laptop GPU
81.9 pt
Razer Blade 18 2024 RZ09-0509
Intel Core i9-14900HX, NVIDIA GeForce RTX 4090 Laptop GPU
79.7 pt
Durchschnitt der Klasse Gaming
 
62.7 pt
The Witcher 3 - 1920x1080 Ultra Graphics & Postprocessing (HBAO+)
MSI Titan 18 HX A14VIG
Intel Core i9-14900HX, NVIDIA GeForce RTX 4090 Laptop GPU
211.2 (165min) fps +9%
Asus ROG Strix Scar 17 G733PYV-LL053X
AMD Ryzen 9 7945HX3D, NVIDIA GeForce RTX 4090 Laptop GPU
207 fps +7%
Alienware m18 R2
Intel Core i9-14900HX, NVIDIA GeForce RTX 4090 Laptop GPU
205.7 (193min) fps +7%
Razer Blade 16 2024, RTX 4090
Intel Core i9-14900HX, NVIDIA GeForce RTX 4090 Laptop GPU
200 fps +4%
Razer Blade 18 2024 RZ09-0509
Intel Core i9-14900HX, NVIDIA GeForce RTX 4090 Laptop GPU
193 (53.6P0.1, 119.7P1) fps
Asus ROG Strix Scar 18 G834JYR (2024)
Intel Core i9-14900HX, NVIDIA GeForce RTX 4090 Laptop GPU
189.4 (165min) fps -2%
Durchschnitt der Klasse Gaming
  (18.4 - 216, n=166, der letzten 2 Jahre)
127.4 fps -34%
GTA V - 1920x1080 Highest Settings possible AA:4xMSAA + FX AF:16x
Asus ROG Strix Scar 17 G733PYV-LL053X
AMD Ryzen 9 7945HX3D, NVIDIA GeForce RTX 4090 Laptop GPU
167.7 (1.87min, 111.1P1) fps +29%
MSI Titan 18 HX A14VIG
Intel Core i9-14900HX, NVIDIA GeForce RTX 4090 Laptop GPU
139.2 (3.73min, 90.9P1) fps +7%
Razer Blade 16 2024, RTX 4090
Intel Core i9-14900HX, NVIDIA GeForce RTX 4090 Laptop GPU
138.1 (4.19min, 83.3P1) fps +6%
Alienware m18 R2
Intel Core i9-14900HX, NVIDIA GeForce RTX 4090 Laptop GPU
137 (7.81min, 83.3P1) fps +6%
Asus ROG Strix Scar 18 G834JYR (2024)
Intel Core i9-14900HX, NVIDIA GeForce RTX 4090 Laptop GPU
136 (8.67min, 100P1) fps +5%
Razer Blade 18 2024 RZ09-0509
Intel Core i9-14900HX, NVIDIA GeForce RTX 4090 Laptop GPU
129.8 (16.1min, 90.9P1) fps
Durchschnitt der Klasse Gaming
  (12.1 - 167.7, n=169, der letzten 2 Jahre)
113.1 fps -13%
Final Fantasy XV Benchmark - 1920x1080 High Quality
Alienware m18 R2
Intel Core i9-14900HX, NVIDIA GeForce RTX 4090 Laptop GPU
193.2 fps +23%
MSI Titan 18 HX A14VIG
Intel Core i9-14900HX, NVIDIA GeForce RTX 4090 Laptop GPU
184 fps +17%
Asus ROG Strix Scar 17 G733PYV-LL053X
AMD Ryzen 9 7945HX3D, NVIDIA GeForce RTX 4090 Laptop GPU
180 fps +15%
Asus ROG Strix Scar 18 G834JYR (2024)
Intel Core i9-14900HX, NVIDIA GeForce RTX 4090 Laptop GPU
166.1 fps +6%
Razer Blade 18 2024 RZ09-0509
Intel Core i9-14900HX, NVIDIA GeForce RTX 4090 Laptop GPU
156.9 fps
Razer Blade 16 2024, RTX 4090
Intel Core i9-14900HX, NVIDIA GeForce RTX 4090 Laptop GPU
137.5 fps -12%
Durchschnitt der Klasse Gaming
  (19.2 - 201, n=182, der letzten 2 Jahre)
119.3 fps -24%
Strange Brigade - 1920x1080 ultra AA:ultra AF:16
Asus ROG Strix Scar 17 G733PYV-LL053X
AMD Ryzen 9 7945HX3D, NVIDIA GeForce RTX 4090 Laptop GPU
420 (64.7min, 302P1) fps +29%
MSI Titan 18 HX A14VIG
Intel Core i9-14900HX, NVIDIA GeForce RTX 4090 Laptop GPU
385 (27.2min, 274P1) fps +18%
Alienware m18 R2
Intel Core i9-14900HX, NVIDIA GeForce RTX 4090 Laptop GPU
369 (31.4min, 266P1) fps +14%
Razer Blade 16 2024, RTX 4090
Intel Core i9-14900HX, NVIDIA GeForce RTX 4090 Laptop GPU
359.8 (30.2min, 253P1) fps +11%
Asus ROG Strix Scar 18 G834JYR (2024)
Intel Core i9-14900HX, NVIDIA GeForce RTX 4090 Laptop GPU
331 (34.1min, 238P1) fps +2%
Razer Blade 18 2024 RZ09-0509
Intel Core i9-14900HX, NVIDIA GeForce RTX 4090 Laptop GPU
325 (49.1min, 213P1) fps
Durchschnitt der Klasse Gaming
  (38.9 - 421, n=180, der letzten 2 Jahre)
228 fps -30%
Dota 2 Reborn - 1920x1080 ultra (3/3) best looking
Asus ROG Strix Scar 17 G733PYV-LL053X
AMD Ryzen 9 7945HX3D, NVIDIA GeForce RTX 4090 Laptop GPU
220 (175min) fps +34%
Razer Blade 16 2024, RTX 4090
Intel Core i9-14900HX, NVIDIA GeForce RTX 4090 Laptop GPU
188.1 (155.2min) fps +15%
MSI Titan 18 HX A14VIG
Intel Core i9-14900HX, NVIDIA GeForce RTX 4090 Laptop GPU
174.5 (151.1min) fps +6%
Alienware m18 R2
Intel Core i9-14900HX, NVIDIA GeForce RTX 4090 Laptop GPU
171.8 (143.6min) fps +5%
Razer Blade 18 2024 RZ09-0509
Intel Core i9-14900HX, NVIDIA GeForce RTX 4090 Laptop GPU
164 (140min) fps
Asus ROG Strix Scar 18 G834JYR (2024)
Intel Core i9-14900HX, NVIDIA GeForce RTX 4090 Laptop GPU
161.3 (135.6min) fps -2%
Durchschnitt der Klasse Gaming
  (30.8 - 220, n=188, der letzten 2 Jahre)
149.4 fps -9%
X-Plane 11.11 - 1920x1080 high (fps_test=3)
Asus ROG Strix Scar 17 G733PYV-LL053X
AMD Ryzen 9 7945HX3D, NVIDIA GeForce RTX 4090 Laptop GPU
166.2 fps +31%
Razer Blade 16 2024, RTX 4090
Intel Core i9-14900HX, NVIDIA GeForce RTX 4090 Laptop GPU
146.2 fps +15%
Alienware m18 R2
Intel Core i9-14900HX, NVIDIA GeForce RTX 4090 Laptop GPU
140.6 fps +11%
Asus ROG Strix Scar 18 G834JYR (2024)
Intel Core i9-14900HX, NVIDIA GeForce RTX 4090 Laptop GPU
136.8 fps +8%
Razer Blade 18 2024 RZ09-0509
Intel Core i9-14900HX, NVIDIA GeForce RTX 4090 Laptop GPU
127.2 fps
MSI Titan 18 HX A14VIG
Intel Core i9-14900HX, NVIDIA GeForce RTX 4090 Laptop GPU
126.1 fps -1%
Durchschnitt der Klasse Gaming
  (31.5 - 166.2, n=194, der letzten 2 Jahre)
107.3 fps -16%
Call of Duty Modern Warfare 3 2023
3840x2160 Extreme Preset
Alienware m18 R2
Intel Core i9-14900HX, NVIDIA GeForce RTX 4090 Laptop GPU
106 fps +22%
Razer Blade 16 2024, RTX 4090
Intel Core i9-14900HX, NVIDIA GeForce RTX 4090 Laptop GPU
91 fps +5%
Durchschnittliche NVIDIA GeForce RTX 4090 Laptop GPU
  (73 - 106, n=5)
90 fps +3%
Razer Blade 18 2024 RZ09-0509
Intel Core i9-14900HX, NVIDIA GeForce RTX 4090 Laptop GPU
87 fps
Durchschnitt der Klasse Gaming
  (27 - 106, n=6, der letzten 2 Jahre)
72.3 fps -17%
2560x1440 Extreme Preset
Asus ROG Strix Scar 18 G834JYR (2024)
Intel Core i9-14900HX, NVIDIA GeForce RTX 4090 Laptop GPU
162 (119min) fps +23%
Alienware m18 R2
Intel Core i9-14900HX, NVIDIA GeForce RTX 4090 Laptop GPU
160 fps +21%
Durchschnittliche NVIDIA GeForce RTX 4090 Laptop GPU
  (113 - 162, n=7)
138.6 fps +5%
Razer Blade 16 2024, RTX 4090
Intel Core i9-14900HX, NVIDIA GeForce RTX 4090 Laptop GPU
138 fps +5%
Razer Blade 18 2024 RZ09-0509
Intel Core i9-14900HX, NVIDIA GeForce RTX 4090 Laptop GPU
132 fps
Durchschnitt der Klasse Gaming
  (48 - 162, n=15, der letzten 2 Jahre)
95.9 fps -27%
1920x1080 Extreme Preset
Alienware m18 R2
Intel Core i9-14900HX, NVIDIA GeForce RTX 4090 Laptop GPU
205 fps +18%
Razer Blade 16 2024, RTX 4090
Intel Core i9-14900HX, NVIDIA GeForce RTX 4090 Laptop GPU
179 fps +3%
Durchschnittliche NVIDIA GeForce RTX 4090 Laptop GPU
  (148 - 205, n=7)
175.1 fps +1%
Razer Blade 18 2024 RZ09-0509
Intel Core i9-14900HX, NVIDIA GeForce RTX 4090 Laptop GPU
174 fps
Asus ROG Strix Scar 18 G834JYR (2024)
Intel Core i9-14900HX, NVIDIA GeForce RTX 4090 Laptop GPU
162 (119min) fps -7%
Durchschnitt der Klasse Gaming
  (27 - 205, n=18, der letzten 2 Jahre)
112.5 fps -35%
Cyberpunk 2077 2.1 Phantom Liberty
3840x2160 Ultra Preset (FSR off)
MSI Titan 18 HX A14VIG
Intel Core i9-14900HX, NVIDIA GeForce RTX 4090 Laptop GPU
43.9 (27.1min) fps +17%
Alienware m18 R2
Intel Core i9-14900HX, NVIDIA GeForce RTX 4090 Laptop GPU
43.4 (30.4min) fps +16%
Durchschnittliche NVIDIA GeForce RTX 4090 Laptop GPU
  (32.9 - 50.6, n=9)
42 fps +12%
Razer Blade 16 2024, RTX 4090
Intel Core i9-14900HX, NVIDIA GeForce RTX 4090 Laptop GPU
39.61 fps +6%
Razer Blade 18 2024 RZ09-0509
Intel Core i9-14900HX, NVIDIA GeForce RTX 4090 Laptop GPU
37.38 (31.36min) fps
Durchschnitt der Klasse Gaming
  (13.8 - 50.6, n=19, der letzten 2 Jahre)
31.8 fps -15%
2560x1440 Ultra Preset (FSR off)
MSI Titan 18 HX A14VIG
Intel Core i9-14900HX, NVIDIA GeForce RTX 4090 Laptop GPU
94.5 (50.3min) fps +13%
Alienware m18 R2
Intel Core i9-14900HX, NVIDIA GeForce RTX 4090 Laptop GPU
94.1 (57.3min) fps +13%
Durchschnittliche NVIDIA GeForce RTX 4090 Laptop GPU
  (68.1 - 103.9, n=19)
89.9 fps +8%
Asus ROG Strix Scar 18 G834JYR (2024)
Intel Core i9-14900HX, NVIDIA GeForce RTX 4090 Laptop GPU
83.8 (35.1min) fps +1%
Razer Blade 16 2024, RTX 4090
Intel Core i9-14900HX, NVIDIA GeForce RTX 4090 Laptop GPU
83.39 (67.14min) fps 0%
Razer Blade 18 2024 RZ09-0509
Intel Core i9-14900HX, NVIDIA GeForce RTX 4090 Laptop GPU
83.38 (67.53min) fps
Durchschnitt der Klasse Gaming
  (24.8 - 110, n=69, der letzten 2 Jahre)
64.9 fps -22%
1920x1080 Ultra Preset (FSR off)
Alienware m18 R2
Intel Core i9-14900HX, NVIDIA GeForce RTX 4090 Laptop GPU
133.9 (67.5min) fps +32%
MSI Titan 18 HX A14VIG
Intel Core i9-14900HX, NVIDIA GeForce RTX 4090 Laptop GPU
129.8 (26.2min) fps +28%
Durchschnittliche NVIDIA GeForce RTX 4090 Laptop GPU
  (93.1 - 144.7, n=19)
120.8 fps +19%
Asus ROG Strix Scar 18 G834JYR (2024)
Intel Core i9-14900HX, NVIDIA GeForce RTX 4090 Laptop GPU
112.1 (42.7min) fps +11%
Razer Blade 18 2024 RZ09-0509
Intel Core i9-14900HX, NVIDIA GeForce RTX 4090 Laptop GPU
101.25 (77.2min) fps
Razer Blade 16 2024, RTX 4090
Intel Core i9-14900HX, NVIDIA GeForce RTX 4090 Laptop GPU
95.35 (70.51min) fps -6%
Durchschnitt der Klasse Gaming
  (6.76 - 144.7, n=79, der letzten 2 Jahre)
85.9 fps -15%
Baldur's Gate 3
3840x2160 Ultra Preset
Alienware m18 R2
Intel Core i9-14900HX, NVIDIA GeForce RTX 4090 Laptop GPU
81.7 fps +16%
MSI Titan 18 HX A14VIG
Intel Core i9-14900HX, NVIDIA GeForce RTX 4090 Laptop GPU
80.8 fps +15%
Durchschnittliche NVIDIA GeForce RTX 4090 Laptop GPU
  (57 - 81.7, n=7)
71.2 fps +1%
Razer Blade 18 2024 RZ09-0509
Intel Core i9-14900HX, NVIDIA GeForce RTX 4090 Laptop GPU
70.5 (39.1P0.1, 55.6P1) fps
Durchschnitt der Klasse Gaming
  (22.9 - 81.7, n=15, der letzten 2 Jahre)
54.7 fps -22%
2560x1440 Ultra Preset
MSI Titan 18 HX A14VIG
Intel Core i9-14900HX, NVIDIA GeForce RTX 4090 Laptop GPU
155.2 fps +30%
Alienware m18 R2
Intel Core i9-14900HX, NVIDIA GeForce RTX 4090 Laptop GPU
151.6 fps +27%
Durchschnittliche NVIDIA GeForce RTX 4090 Laptop GPU
  (99 - 155.2, n=7)
133.2 fps +12%
Razer Blade 18 2024 RZ09-0509
Intel Core i9-14900HX, NVIDIA GeForce RTX 4090 Laptop GPU
119.2 (40.8P0.1, 73.2P1) fps
Durchschnitt der Klasse Gaming
  (44 - 155.2, n=34, der letzten 2 Jahre)
82.2 fps -31%
1920x1080 Ultra Preset
MSI Titan 18 HX A14VIG
Intel Core i9-14900HX, NVIDIA GeForce RTX 4090 Laptop GPU
207.7 fps +29%
Alienware m18 R2
Intel Core i9-14900HX, NVIDIA GeForce RTX 4090 Laptop GPU
202 fps +26%
Durchschnittliche NVIDIA GeForce RTX 4090 Laptop GPU
  (118 - 208, n=7)
177.5 fps +11%
Razer Blade 18 2024 RZ09-0509
Intel Core i9-14900HX, NVIDIA GeForce RTX 4090 Laptop GPU
160.5 (65P0.1, 99.5P1) fps
Durchschnitt der Klasse Gaming
  (21.2 - 208, n=44, der letzten 2 Jahre)
102.1 fps -36%
Alan Wake 2
3840x2160 High Preset
Alienware m18 R2
Intel Core i9-14900HX, NVIDIA GeForce RTX 4090 Laptop GPU
45.2 fps +7%
Durchschnittliche NVIDIA GeForce RTX 4090 Laptop GPU
  (41.6 - 46.9, n=4)
44 fps +4%
Razer Blade 18 2024 RZ09-0509
Intel Core i9-14900HX, NVIDIA GeForce RTX 4090 Laptop GPU
42.3 (21.9P0.1, 33.4P1) fps
Razer Blade 16 2024, RTX 4090
Intel Core i9-14900HX, NVIDIA GeForce RTX 4090 Laptop GPU
41.6 (20P0.1, 31.8P1) fps -2%
Durchschnitt der Klasse Gaming
  (12.3 - 45.2, n=6, der letzten 2 Jahre)
35.6 fps -16%
2560x1440 High Preset
Alienware m18 R2
Intel Core i9-14900HX, NVIDIA GeForce RTX 4090 Laptop GPU
83.1 fps +5%
Durchschnittliche NVIDIA GeForce RTX 4090 Laptop GPU
  (78.4 - 87.1, n=6)
82.9 fps +4%
Razer Blade 18 2024 RZ09-0509
Intel Core i9-14900HX, NVIDIA GeForce RTX 4090 Laptop GPU
79.4 (33.5P0.1, 57.9P1) fps
Razer Blade 16 2024, RTX 4090
Intel Core i9-14900HX, NVIDIA GeForce RTX 4090 Laptop GPU
78.4 (17P0.1, 52.8P1) fps -1%
Durchschnitt der Klasse Gaming
  (22.5 - 87.1, n=13, der letzten 2 Jahre)
62 fps -22%
1920x1080 High Preset
Durchschnittliche NVIDIA GeForce RTX 4090 Laptop GPU
  (108.6 - 124.7, n=6)
118.1 fps +4%
Alienware m18 R2
Intel Core i9-14900HX, NVIDIA GeForce RTX 4090 Laptop GPU
116.9 fps +2%
Razer Blade 18 2024 RZ09-0509
Intel Core i9-14900HX, NVIDIA GeForce RTX 4090 Laptop GPU
114.1 (56.8P0.1, 81.7P1) fps
Razer Blade 16 2024, RTX 4090
Intel Core i9-14900HX, NVIDIA GeForce RTX 4090 Laptop GPU
108.6 (26.3P0.1, 67P1) fps -5%
Durchschnitt der Klasse Gaming
  (17.1 - 123.3, n=18, der letzten 2 Jahre)
70.8 fps -38%

Witcher 3 FPS Chart

0153045607590105120135150165180195Tooltip
Razer Blade 18 2024 RZ09-0509 i9-14900HX, NVIDIA GeForce RTX 4090 Laptop GPU: Ø191.2 (168-206)
min.mittelhochmax.QHD4K DLSS4K
GTA V (2015) 129.8 126.6 165.4
The Witcher 3 (2015) 193 154.6 149.8
Dota 2 Reborn (2015) 213 191.8 180.5 164 147
Final Fantasy XV Benchmark (2018) 156.9 139.1 87.3
X-Plane 11.11 (2018) 183.8 158.2 127.2 107.2
Strange Brigade (2018) 325 268 149.2
F1 23 (2023) 110.9 73.1 37.1
Baldur's Gate 3 (2023) 160.5 119.2 94.4 70.5
Cyberpunk 2077 2.1 Phantom Liberty (2023) 101.25 83.38 54.59 37.38
Assassin's Creed Mirage (2023) 124 114 98 73
Alan Wake 2 (2023) 114.1 79.4 60.8 42.3
Call of Duty Modern Warfare 3 2023 (2023) 174 132 92 87

Emissionen — Nur dann laut, wenn nötig

Systemlautstärke

Die Lüfterlautstärke fällt insgesamt höher aus als beim letztjährigen Blade 18, vor allem natürlich durch die unterschiedlichen GPU-Konfigurationen. Auch im Balanced- und Optimusmodus pulsieren die Lüfter öfter zwischen 24 und 29 dB(A). Das ist laut genug, um wahrgenommen zu werden, aber noch nicht störend.

Besonders wichtig für Gamer: Die Lüfterlautstärke kann je nach Leistungsprofil deutlich unterschiedlich ausfallen. Witcher 3 mit aktivem Max Fan beispielsweise, lässt die Lüfter auf 61 dB(A) hochdrehen, verglichen mit nur 54 dB(A) bei deaktiviertem Max Fan. Angesichts des nicht vorhandenen Leistungsunterschieds von Max Fan on oder off, empfehlen wir das Deaktivieren der Option. Im Turbomodus ist die Lüfterlautstärke auf dem gleichen Niveau wie mit Max Fan off, was sich in unsere Erkenntnisse zur Leistung weiter oben einreiht.

Verglichen mit der Konkurrenz ist unser Blade 18 ähnlich oder sogar minimal lauter als das Alienware m18 R2 oder das ROG Strix Scar 18 mit derselben GeForce RTX 4090. Wir empfehlen Kopfhörer sobald die Lautstärke über 50 dB(A) steigt, besonders beim Gaming, wenn das Hören von Schritten und anderen kleinen Audiohinweisen spielentscheidend sein können.

Lüfterlautstärkeprofil (Weiß: Hintergrund, Rot: Leerlauf, Blau: 3DMark 06, Orange: Witcher 3, Grün: Prime95+FurMark-Stress)

Lautstärkediagramm

Idle
23.9 / 28.2 / 29 dB(A)
Last
36.8 / 61.1 dB(A)
  red to green bar
 
 
30 dB
leise
40 dB(A)
deutlich hörbar
50 dB(A)
störend
 
min: dark, med: mid, max: light   Earthworks M23R, Arta (aus 15 cm gemessen)   Umgebungsgeräusche: 23.4 dB(A)
dB(A) 0102030405060708090Deep BassMiddle BassHigh BassLower RangeMidsHigher MidsLower HighsMid HighsUpper HighsSuper Highs2036.237.639.835.432.836.2252827.52827.323.1283127.626.728.123.723.627.64028.525.92522.62328.55029.927.729.628.327.229.96329.529.224.223.625.129.58032.32923.923.52332.310032.728.921.222.721.532.712532.328.218.917.91732.316035.630.421.918.118.235.620035.429.926.822.716.935.425036.831.621.222.41536.831538.533.121.517.515.538.540040.434.721.917.813.140.450042.837.72618.412.442.863042.437.623.918.411.642.480044.739.525.820.912.344.7100045.840.426.219.210.245.8125047.441.226.618.79.947.4160050.344.129.520.19.550.3200050.444.428.416.89.950.4250051.144.725.514.810.251.1315051.744.722.713.810.651.740005144.420.312.610.951500050.339.716.712.311.650.3630049.238.815.212.111.549.2800046.636.71311.911.546.61000044.73412.71211.644.71250041.33012.511.811.541.31600037.82611.911.210.837.8SPL61.154.136.82923.461.1N14.492.31.10.514.4median 44.7median 37.6median 21.9median 17.8median 11.6median 44.7Delta6.35.753.92.46.3hearing rangehide median Fan NoiseRazer Blade 18 2024 RZ09-0509
Razer Blade 18 2024 RZ09-0509
NVIDIA GeForce RTX 4090 Laptop GPU, i9-14900HX
Razer Blade 18 RTX 4070
NVIDIA GeForce RTX 4070 Laptop GPU, i9-13950HX, SSSTC CA6-8D1024
Alienware m18 R2
NVIDIA GeForce RTX 4090 Laptop GPU, i9-14900HX, SK Hynix PC811 HFS002TEM9X152N
MSI Titan 18 HX A14VIG
NVIDIA GeForce RTX 4090 Laptop GPU, i9-14900HX, 2x Samsung PM9A1a MZVL22T0HDLB (RAID 0)
Asus ROG Strix Scar 18 G834JYR (2024)
NVIDIA GeForce RTX 4090 Laptop GPU, i9-14900HX, Samsung PM9A1a MZVL22T0HDLB
Razer Blade 16 2024, RTX 4090
NVIDIA GeForce RTX 4090 Laptop GPU, i9-14900HX, Samsung PM9A1 MZVL22T0HBLB
Geräuschentwicklung
7%
3%
1%
-5%
6%
aus / Umgebung *
23.4
23.5
-0%
23.6
-1%
22.8
3%
24
-3%
23
2%
Idle min *
23.9
23.8
-0%
23.8
-0%
23.8
-0%
27
-13%
23
4%
Idle avg *
28.2
23.8
16%
26.1
7%
23.8
16%
28
1%
23
18%
Idle max *
29
26.8
8%
31.5
-9%
28
3%
32
-10%
27.66
5%
Last avg *
36.8
37.3
-1%
31.5
14%
38
-3%
50
-36%
43.76
-19%
Witcher 3 ultra *
54.1
48
11%
52.1
4%
57.3
-6%
50
8%
46.81
13%
Last max *
61.1
53.5
12%
56.6
7%
62.8
-3%
52
15%
50.37
18%

* ... kleinere Werte sind besser

Temperatur

Auch die Oberflächentemperaturen fallen spürbar höher aus als im letztjährigen Blade 18, was aber, wie erwähnt, an den unterschiedlichen GPU-Konfigurationen liegt. Razer hat keine Änderungen am zugrunde liegenden Kühlsystem vorgenommen. 

Razer Netzteile gehören auch weiterhin zu den kleinsten, aber auch wärmsten auf dem Markt. Beispielsweise erhitzt sich das Razer-Netzteil auf bis zu 63 °C beim Gaming, verglichen mit nur 54 °C beim Netzteil des Alienware m18 R2. Das Design der GaN-Adapter toleriert höhere Temperaturen. 

Hintere Luftausgänge
Netzteil kann sich bei hohen Lasten wie Games auf bis zu 63 °C erhitzen
Max. Last
 38.2 °C43.2 °C37.2 °C 
 34.8 °C41.2 °C33.4 °C 
 35.4 °C36.2 °C33.2 °C 
Maximal: 43.2 °C
Durchschnitt: 37 °C
33.6 °C42.6 °C35.6 °C
36.4 °C38.8 °C37 °C
33.6 °C34.8 °C35.4 °C
Maximal: 42.6 °C
Durchschnitt: 36.4 °C
Netzteil (max.)  51.4 °C | Raumtemperatur 20 °C | Fluke 62 Mini IR Thermometer
(±) Die Durchschnittstemperatur auf der Oberseite unter extremer Last ist 37 °C. Im Vergleich erhitzte sich der Durchschnitt der Geräteklasse Gaming auf 33.9 °C.
(±) Die maximale Temperatur auf der Oberseite ist 43.2 °C. Im Vergleich liegt der Klassendurchschnitt bei 40.5 °C (von 21.2 bis 68.8 °C für die Klasse Gaming).
(±) Auf der Unterseite messen wir eine maximalen Wert von 42.6 °C (im Vergleich zum Durchschnitt von 43.2 °C).
(+) Ohne Last messen wir eine durchschnittliche Temperatur von 31.3 °C auf der Oberseite. Der Klassendurchschnitt erreicht 33.9 °C.
(±) Beim längeren Spielen von The Witcher 3 erhitzt sich das Gerät durchschnittlich auf 34.9 °C. Der Durchschnitt der Klasse ist derzeit 33.9 °C.
(±) Die Handballen und der Touchpad-Bereich können sehr heiß werden mit maximal 36.2 °C.
(-) Die durchschnittliche Handballen-Temperatur anderer getesteter Geräte war 28.9 °C (-7.3 °C).
Leerlauf (oben)
Leerlauf (oben)
Leerlauf (unten)
Leerlauf (unten)
Witcher-3-Stress (oben)
Witcher-3-Stress (unten)
Prime95+FurMark-Stress (oben)
Prime95+FurMark-Stress (unten)
Razer Blade 18 2024 RZ09-0509
Intel Core i9-14900HX, NVIDIA GeForce RTX 4090 Laptop GPU
Razer Blade 18 RTX 4070
Intel Core i9-13950HX, NVIDIA GeForce RTX 4070 Laptop GPU
Alienware m18 R2
Intel Core i9-14900HX, NVIDIA GeForce RTX 4090 Laptop GPU
MSI Titan 18 HX A14VIG
Intel Core i9-14900HX, NVIDIA GeForce RTX 4090 Laptop GPU
Asus ROG Strix Scar 18 G834JYR (2024)
Intel Core i9-14900HX, NVIDIA GeForce RTX 4090 Laptop GPU
Razer Blade 16 2024, RTX 4090
Intel Core i9-14900HX, NVIDIA GeForce RTX 4090 Laptop GPU
Hitze
12%
-4%
7%
3%
7%
Last oben max *
43.2
39.2
9%
41.2
5%
37.8
12%
49
-13%
45
-4%
Last unten max *
42.6
35.6
16%
34.6
19%
37.6
12%
47
-10%
45
-6%
Idle oben max *
36
31.8
12%
42.8
-19%
34.8
3%
29
19%
29
19%
Idle unten max *
36.4
33.2
9%
43.6
-20%
36
1%
31
15%
30
18%

* ... kleinere Werte sind besser

Lautsprecher

Maximimale Lautstärke ist mit knapp über 85 dB(A) quasi ebenso laut wie beim 2023 Modell, trotz der physisch nun leicht größeren Lautsprecher
dB(A) 0102030405060708090Deep BassMiddle BassHigh BassLower RangeMidsHigher MidsLower HighsMid HighsUpper HighsSuper Highs2033.935.433.92526.127.326.1312523.725402622.6265036.128.336.1634623.6468055.223.555.210058.222.758.212561.917.961.916070.218.170.22007122.77125075.322.475.33157617.57640075.517.875.550076.818.476.863074.918.474.980074.520.974.510006319.263125072.118.772.1160076.220.176.2200074.916.874.925007614.876315070.813.870.8400070.512.670.550007112.371630069.912.169.9800065.611.965.61000063.21263.21250062.911.862.91600057.911.257.9SPL85.22985.2N70.21.170.2median 71median 17.8median 71Delta4.53.94.526.325.821.422.12624.925.127.622.532.523.448.72655.818.860.922.167.2267019.372.317.674.217.774.319.575.31571.711.871.311.27410.574.21072.710.17210.67210.97511.374.811.671.71269.71269.612.371.112.669.61270.111.269.824.784.70.666.6median 12median 71.73.42.2hearing rangehide median Pink NoiseRazer Blade 18 2024 RZ09-0509Apple MacBook Pro 16 2021 M1 Pro
Frequenzdiagramm (für Vergleiche die Checkboxen oben an-/abwählen)
Razer Blade 18 2024 RZ09-0509 Audio Analyse

(+) | Die Lautsprecher können relativ laut spielen (85.2 dB)
Bass 100 - 315 Hz
(±) | abgesenkter Bass - 5.3% geringer als der Median
(+) | lineare Bass-Wiedergabe (6.5% Delta zum Vorgänger)
Mitteltöne 400 - 2000 Hz
(+) | ausgeglichene Mitten, vom Median nur 4.5% abweichend
(±) | Linearität der Mitten ist durchschnittlich (7.1% Delta zum Vorgänger)
Hochtöne 2 - 16 kHz
(+) | ausgeglichene Hochtöne, vom Median nur 2.9% abweichend
(+) | sehr lineare Hochtöne (4% Delta zum Vorgänger)
Gesamt im hörbaren Bereich 100 - 16.000 Hz
(+) | hörbarer Bereich ist sehr linear (9.3% Abstand zum Median
Im Vergleich zu allen Geräten derselben Klasse
» 3% aller getesteten Geräte dieser Klasse waren besser, 2% vergleichbar, 96% schlechter
» Das beste Gerät hat einen Delta-Wert von 6%, durchschnittlich ist 18%, das schlechteste Gerät hat 132%
Im Vergleich zu allen Geräten im Test
» 3% aller getesteten Geräte waren besser, 1% vergleichbar, 97% schlechter
» Das beste Gerät hat einen Delta-Wert von 4%, durchschnittlich ist 25%, das schlechteste Gerät hat 134%

Apple MacBook Pro 16 2021 M1 Pro Audio Analyse

(+) | Die Lautsprecher können relativ laut spielen (84.7 dB)
Bass 100 - 315 Hz
(+) | guter Bass - nur 3.8% Abweichung vom Median
(+) | lineare Bass-Wiedergabe (5.2% Delta zum Vorgänger)
Mitteltöne 400 - 2000 Hz
(+) | ausgeglichene Mitten, vom Median nur 1.3% abweichend
(+) | lineare Mitten (2.1% Delta zum Vorgänger)
Hochtöne 2 - 16 kHz
(+) | ausgeglichene Hochtöne, vom Median nur 1.9% abweichend
(+) | sehr lineare Hochtöne (2.7% Delta zum Vorgänger)
Gesamt im hörbaren Bereich 100 - 16.000 Hz
(+) | hörbarer Bereich ist sehr linear (4.6% Abstand zum Median
Im Vergleich zu allen Geräten derselben Klasse
» 0% aller getesteten Geräte dieser Klasse waren besser, 0% vergleichbar, 100% schlechter
» Das beste Gerät hat einen Delta-Wert von 5%, durchschnittlich ist 18%, das schlechteste Gerät hat 45%
Im Vergleich zu allen Geräten im Test
» 0% aller getesteten Geräte waren besser, 0% vergleichbar, 100% schlechter
» Das beste Gerät hat einen Delta-Wert von 4%, durchschnittlich ist 25%, das schlechteste Gerät hat 134%

Energiemanagement

Energieverbrauch

Im Leerlauf auf dem Desktop im Optimusmodus bei minimaler Helligkeit und einer Bildwiederholrate von 60 Hz zieht etwa 25 W aus dem Netzteil, während Leerlauf im dGPU-Modus bei maximaler Helligkeit und einer Bildwiederholrate von 300 Hz mehr als doppelt so viel verbraucht.

Witcher 3 verlangt um die 70 W mehr von unserem 2024er System mit RTX 4090 als vom 2023er Modell mit RTX 4070. Folglich werden die Lower-End-SKUs mit RTX 4070 auch mit einem kleineren 280-W-GaN-Netzteil verschickt, während die SKUs mit RTX 4080/4090 mit dem leicht größeren 330-W-GaN-Netzteil ausgestattet werden (~18 x 7.5 x 2.5 cm vs. ~16.3 x 7 x 2.5 cm).

Stromverbrauch
Aus / Standbydarklight 0.08 / 0.1 Watt
Idledarkmidlight 25.4 / 37.7 / 57.9 Watt
Last midlight 128.4 / 297.9 Watt
 color bar
Legende: min: dark, med: mid, max: light        Metrahit Energy
Razer Blade 18 2024 RZ09-0509
i9-14900HX, NVIDIA GeForce RTX 4090 Laptop GPU, , Mini-LED, 2560x1600, 18"
Razer Blade 18 RTX 4070
i9-13950HX, NVIDIA GeForce RTX 4070 Laptop GPU, SSSTC CA6-8D1024, IPS, 2560x1600, 18"
Alienware m18 R2
i9-14900HX, NVIDIA GeForce RTX 4090 Laptop GPU, SK Hynix PC811 HFS002TEM9X152N, IPS, 2560x1600, 18"
MSI Titan 18 HX A14VIG
i9-14900HX, NVIDIA GeForce RTX 4090 Laptop GPU, 2x Samsung PM9A1a MZVL22T0HDLB (RAID 0), Mini-LED, 3840x2400, 18"
Asus ROG Strix Scar 18 G834JYR (2024)
i9-14900HX, NVIDIA GeForce RTX 4090 Laptop GPU, Samsung PM9A1a MZVL22T0HDLB, Mini LED, 2560x1600, 18"
Stromverbrauch
10%
3%
3%
26%
Idle min *
25.4
24.5
4%
10.6
58%
13.2
48%
14
45%
Idle avg *
37.7
34.1
10%
20.9
45%
25.4
33%
17
55%
Idle max *
57.9
47.7
18%
40
31%
53.5
8%
24
59%
Last avg *
128.4
140
-9%
201.1
-57%
151.4
-18%
143
-11%
Witcher 3 ultra *
273.1
202
26%
358
-31%
336
-23%
251
8%
Last max *
297.9
261
12%
378.9
-27%
395.2
-33%
302
-1%

* ... kleinere Werte sind besser

Akkulaufzeit

Die Laufzeiten sind ähnlich wie zuvor, wenn nicht etwas länger, so um die 20 Minuten. Dabei macht unser WLAN-Test bereits von Stromsparmaßnahmen wie Optimus und 60 Hz Bildwiederholrate Gebrauch, im dGPU-Modus, aktiviertem Local Dimming und höheren Bildwiederholraten dürfte die Ausdauer kräftig schrumpfen.

Natürlich ist es eher unrealistisch lange Laufzeiten von einem großen 18-Zoll-Gaming-Powersystem zu verlangen, aber Konkurrenten wie das ROG Strix Scar 18 oder das Alienware m18 R2 übertreffen das Razer in dieser Disziplin.

Akkulaufzeit
Idle (ohne WLAN, min Helligkeit)
6h 35min
WiFi Websurfing
4h 23min
Last (volle Helligkeit)
0h 58min
Razer Blade 18 2024 RZ09-0509
i9-14900HX, NVIDIA GeForce RTX 4090 Laptop GPU, 91.7 Wh
Razer Blade 18 RTX 4070
i9-13950HX, NVIDIA GeForce RTX 4070 Laptop GPU, 91.7 Wh
Alienware m18 R2
i9-14900HX, NVIDIA GeForce RTX 4090 Laptop GPU, 97 Wh
MSI Titan 18 HX A14VIG
i9-14900HX, NVIDIA GeForce RTX 4090 Laptop GPU, 99.9 Wh
Asus ROG Strix Scar 18 G834JYR (2024)
i9-14900HX, NVIDIA GeForce RTX 4090 Laptop GPU, 90 Wh
Razer Blade 16 2024, RTX 4090
i9-14900HX, NVIDIA GeForce RTX 4090 Laptop GPU, 95.2 Wh
Akkulaufzeit
12%
10%
3%
54%
31%
Idle
395
420
6%
353
-11%
612
55%
WLAN
263
240
-9%
290
10%
252
-4%
461
75%
329
25%
Last
58
80
38%
72
24%
77
33%
79
36%
H.264
447
456

Pro

+ endlich ein Webcam-Shutter
+ lebendiges Mini-LED-HDR1000-Display
+ 175-W-Grafikkarte mit voller Leistung
+ Thunderbolt-5-Unterstützung
+ Wi-Fi-7-Unterstützung

Contra

- quasi identische Leistung wie das 2023er Blade 18
- keine wesentlichen Verbesserungen der Akkulaufzeit
- der neue „Turbo“-Modus fühlt sich überflüssig an
- kein OLED oder 4K-Mini-LED
- kein reiner iGPU-Modus

Fazit — Alles dreht sich um die neuen Displayoptionen

Im Test: Das Razer Blade 18 2024

Ohne neue Nvidia-GPUs, die man in diesem Jahr verbauen könnte und keinen echten Gewinnen durch die neue Raptor-Lake-HX-Refresh-Serie, ist Razer gewissermaßen dazu gezwungen sich auf andere Aspekte zu konzentrieren, um das 2024er Blade 18 attraktiver als den visuell identischen 2023er Vorgänger zu gestalten. Ergebnis ist in diesem Fall vor allem die neuen Displayoptionen und Thunderbolt 5, wodurch das Blade 18 zu einem der ersten Laptops auf dem Markt mit sowohl Mini-LED als auch der nächsten Thunderbolt-Generation wird. Weitere, kleinere Änderungen wie Wi-Fi 7 und der Webcam-Shutter sind natürlich willkommen, aber weniger kaufentscheidend. Wer von diesen spezifischen, neuen Features nicht überzeugt ist, sollte den Kauf des 2023er Blade 18 in Betracht ziehen, hier bekommt man die gleiche Gaming-Leistung und Nutzererfahrung für mehrere hundert Euro weniger.

Thunderbolt 5, Mini-LED und Wi-Fi 7 helfen dabei das 2024er Blade 18 vom Vorgänger zu unterscheiden. Leistungsenthusiasten werden hingegen keinen spürbaren Unterschied zwischen dem 2023er und dem 2024 Modell feststellen.

Was das Mini-LED angeht haben wir hier eines der besten auf einem Laptop, vor allem mit aktiviertem HDR und Local Dimming bei unterstützenden Games und Videos. Ansonsten heißt es ständig Local Dimming an- und auszuschalten, je nach Workload. Für Nutzer, die das Blade 18 vorwiegend für Gaming oder Multimedia einsetzen möchten, könnte das 2K-Mini-LED-Display die optimale Wahl sein. Wer hingegen selten HDR aktiviert und das Blade 18 primär für professionelle Zwecke wie Content Creation, Editing oder CAD-Arbeiten zu nutzen gedenkt, solllte eher das höher auflösende 4K-IPS-Display in Betracht ziehen, das verträgt sich ebenfalls gut mit dem großen 18-Zoll-Laptop. Razer deckt in diesem Aspekt gleich beide Seiten der Medaille ab.

Abschließend ist es erwähnenswert, dass das MSI Titan 18 sogar ein 4K-Mini-LED-Display anbietet, welches im Razer nicht zur Verfügung steht. Die Kehrseite ist, dass das MSI-System dafür kein G-Sync unterstützt, sodass es aktuell kein "ultimatives" 18-Zoll-Mini-LED-Panel gibt.

Preise und Verfügbarkeit

Unter 5.000 Euro ist unsere Testkonfiguration aktuell nicht zu bekommen. Los geht es bei 5.105 Euro über einen ebay-Shop, die üblichen Versandhändler listen das Gerät für 5.149 Euro auf, beispielsweise notebooksbilliger. Das Modell mit 4K kostet 200 Euro Aufpreis, eine RTX 4070 spart 1.600 Euro gegenüber der RTX 4090..

Razer Blade 18 2024 RZ09-0509 - 05.05.2024 v7 (old)
Allen Ngo

Gehäuse
91 / 98 → 92%
Tastatur
83%
Pointing Device
89%
Konnektivität
0 / 80 → 0%
Gewicht
56 / 10-66 → 81%
Akkulaufzeit
60 / 95 → 63%
Display
93%
Leistung Spiele
100%
Leistung Anwendungen
97%
Temperatur
87 / 95 → 92%
Lautstärke
73 / 90 → 81%
Audio
89%
Kamera
48 / 85 → 56%
Durchschnitt
80%
91%
Gaming - gewichteter Durchschnitt
Weitere Informationen über unsere Bewertung finden Sie hier.

Transparenz

Die Auswahl der zu testenden Geräte erfolgt innerhalb der Redaktion. Das vorliegende Testmuster wurde dem Autor vom Hersteller oder einem Shop zu Testzwecken leihweise zur Verfügung gestellt. Eine Einflussnahme des Leihstellers auf den Testbericht gab es nicht, der Hersteller erhielt keine Version des Reviews vor der Veröffentlichung. Es bestand keine Verpflichtung zur Publikation. Unsere Reviews erfolgen stets ohne Gegenleistung oder Kompensationen. Als eigenständiges, unabhängiges Unternehmen unterliegt Notebookcheck keiner Diktion von Herstellern, Shops und Verlagen.

So testet Notebookcheck

Pro Jahr werden von Notebookcheck hunderte Laptops und Smartphones unabhängig in von uns standardisierten technischen Verfahren getestet, um eine Vergleichbarkeit aller Testergebnisse zu gewährleisten. Seit rund 20 Jahren entwickeln wir diese Testmethoden kontinuierlich weiter und setzen damit Branchenstandards. In unseren Testlaboren kommt ausschließlich hochwertiges Messequipment in die Hände erfahrener Techniker und Redakteure. Die Tests unterliegen einer mehrstufigen Kontrolle. Unsere komplexe Gesamtbewertung basiert auf hunderten fundierten Messergebnissen und Benchmarks, womit Ihnen Objektivität garantiert ist. Weitere Informationen zu unseren Testmethoden gibt es hier.

Preisvergleich

Alle 4 Beträge lesen / Antworten
static version load dynamic
Loading Comments
Diesen Artikel kommentieren / Antworten
Teilen Sie diesen Artikel, um uns zu unterstützen. Jeder Link hilft!
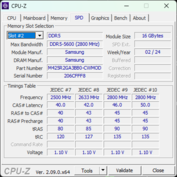
Mail Logo
> Notebook Test, Laptop Test und News > Tests > Notebook Testberichte > Razer Blade 18 2024 im Test: Erster Laptop, der sowohl mit Mini-LED als auch mit Thunderbolt 5 vermarktet wird
Autor: Allen Ngo,  7.05.2024 (Update: 15.08.2024)