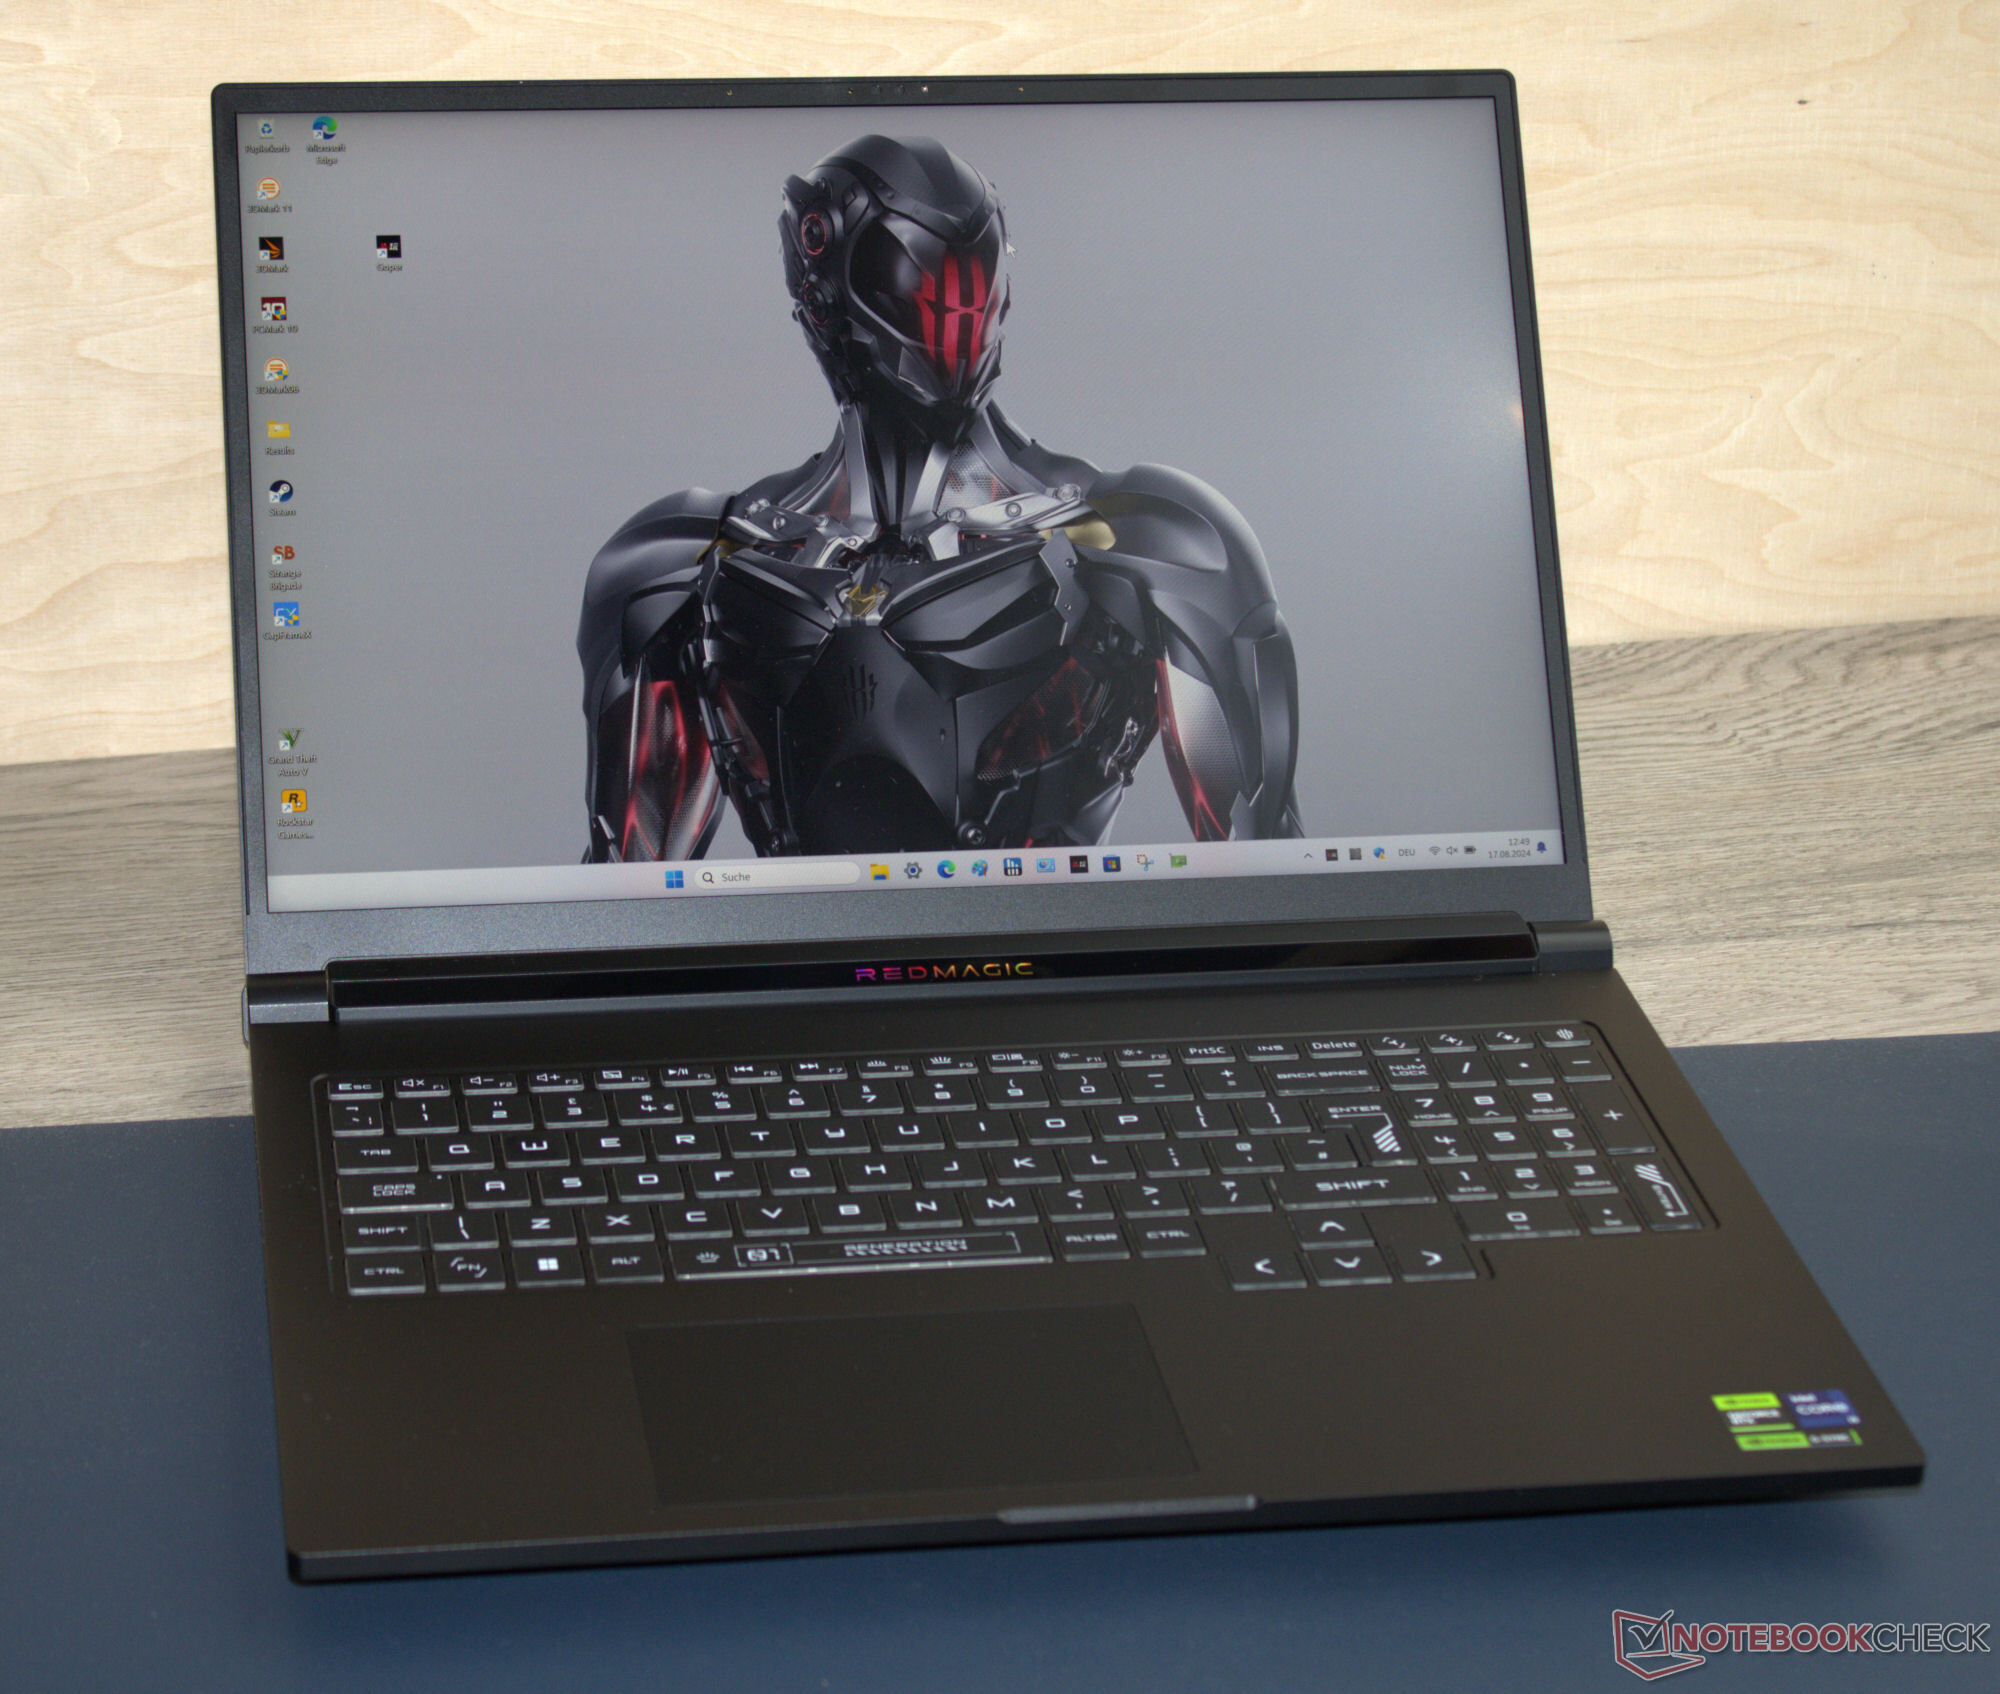
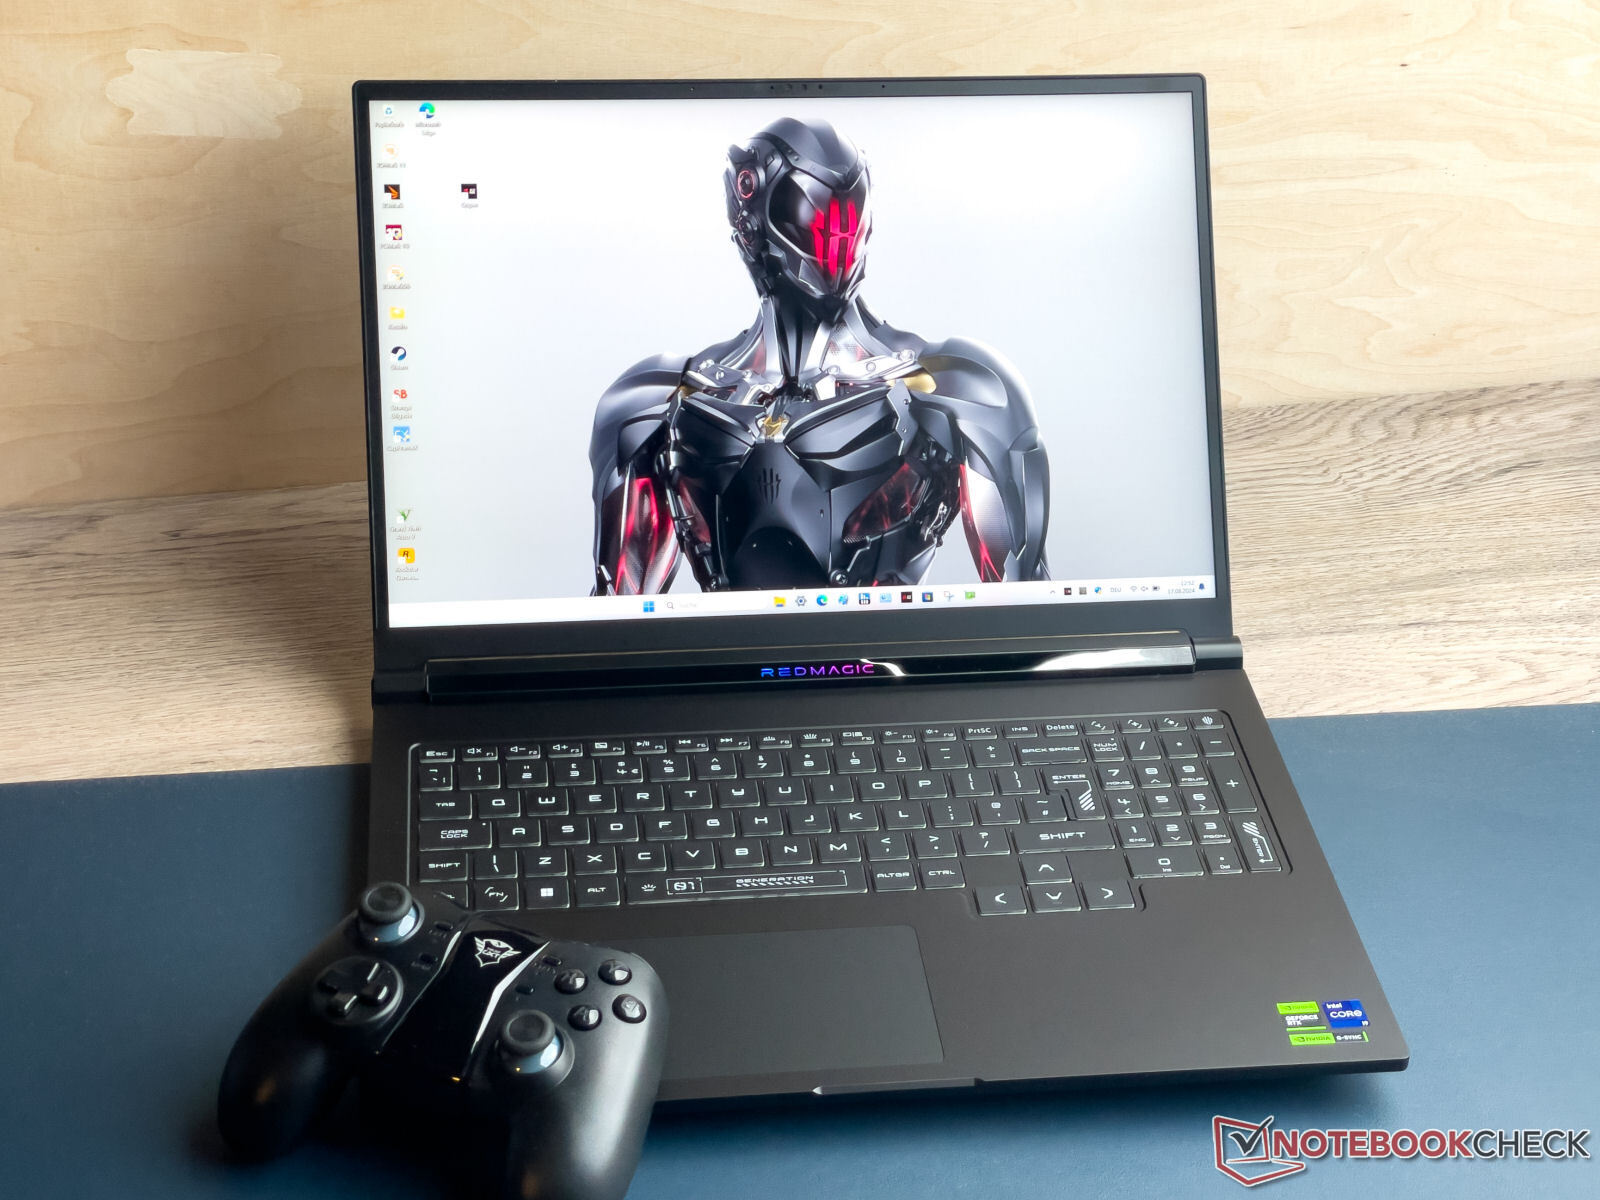
RedMagic Titan 16 Pro im Test: Gaming-Notebook vom Smartphone-Hersteller

Regelmäßige Besucher dieser Webseite dürften die Marke "RedMagic" bereits aus dem Segment der Gaming-Smartphones (z.B. Nubia RedMagic 9 Pro) kennen. Das RedMagic Titan 16 Pro stellt den ersten Gehversuch des Herstellers Nubia im Bereich der Gaming-Notebooks dar. Das Datenblatt hält keine Überraschungen bereit: Einem Core i9-14900HX wird eine GeForce RTX 4060 zur Seite gestellt. Dazu gesellen sich ein 16-Zoll-Bildschirm im 16:10-Format, Thunderbolt 4, DDR5-RAM sowie 2 SSD-Slots.
Ob Nubia der etablierten Konkurrenz Paroli bieten kann, wird sich zeigen. Das Titan tritt gegen folgende Rechner an: Lenovo Legion Pro 5 16IRX9, HP Victus 16 (2024), Acer Predator Helios Neo 16 (2024), XMG Pro 16 Studio (Mid 24), Gigabyte G6X 9KG (2024).
Mögliche Konkurrenten im Vergleich
Bew. | Version | Datum | Modell | Gewicht | Dicke | Größe | Auflösung | Preis ab |
|---|---|---|---|---|---|---|---|---|
| 81.2 % | v8 | 08 / 2024 | Nubia RedMagic Titan 16 Pro i9-14900HX, GeForce RTX 4060 Laptop GPU | 2.4 kg | 23.9 mm | 16.00" | 2560x1600 | |
| 82.3 % | v8 | 07 / 2024 | Lenovo Legion Pro 5 16IRX9 G9 i7-14700HX, GeForce RTX 4060 Laptop GPU | 2.5 kg | 26.55 mm | 16.00" | 2560x1600 | |
| 84.3 % v7 (old) | v7 (old) | 05 / 2024 | HP Victus 16 (2024) i7-14700HX, GeForce RTX 4060 Laptop GPU | 2.4 kg | 23.9 mm | 16.10" | 1920x1080 | |
| 86.8 % v7 (old) | v7 (old) | 05 / 2024 | Acer Predator Helios Neo 16 (2024) i7-14700HX, GeForce RTX 4070 Laptop GPU | 2.6 kg | 25.95 mm | 16.00" | 2560x1600 | |
| 81.2 % | v8 | 07 / 2024 | Schenker XMG Pro 16 Studio (Mid 24) i9-14900HX, GeForce RTX 4070 Laptop GPU | 2.3 kg | 19.9 mm | 16.00" | 2560x1600 | |
| 83.2 % v7 (old) | v7 (old) | 03 / 2024 | Gigabyte G6X 9KG (2024) i7-13650HX, GeForce RTX 4060 Laptop GPU | 2.6 kg | 25.1 mm | 16.00" | 1920x1200 |
Hinweis: Wir haben unser Rating-System kürzlich aktualisiert und die Ergebnisse von Version 8 sind nicht mit den Ergebnissen von Version 7 vergleichbar. Weitere Informationen dazu sind hier verfügbar.
Gehäuse - Nubia setzt auf ein Aluminiumchassis
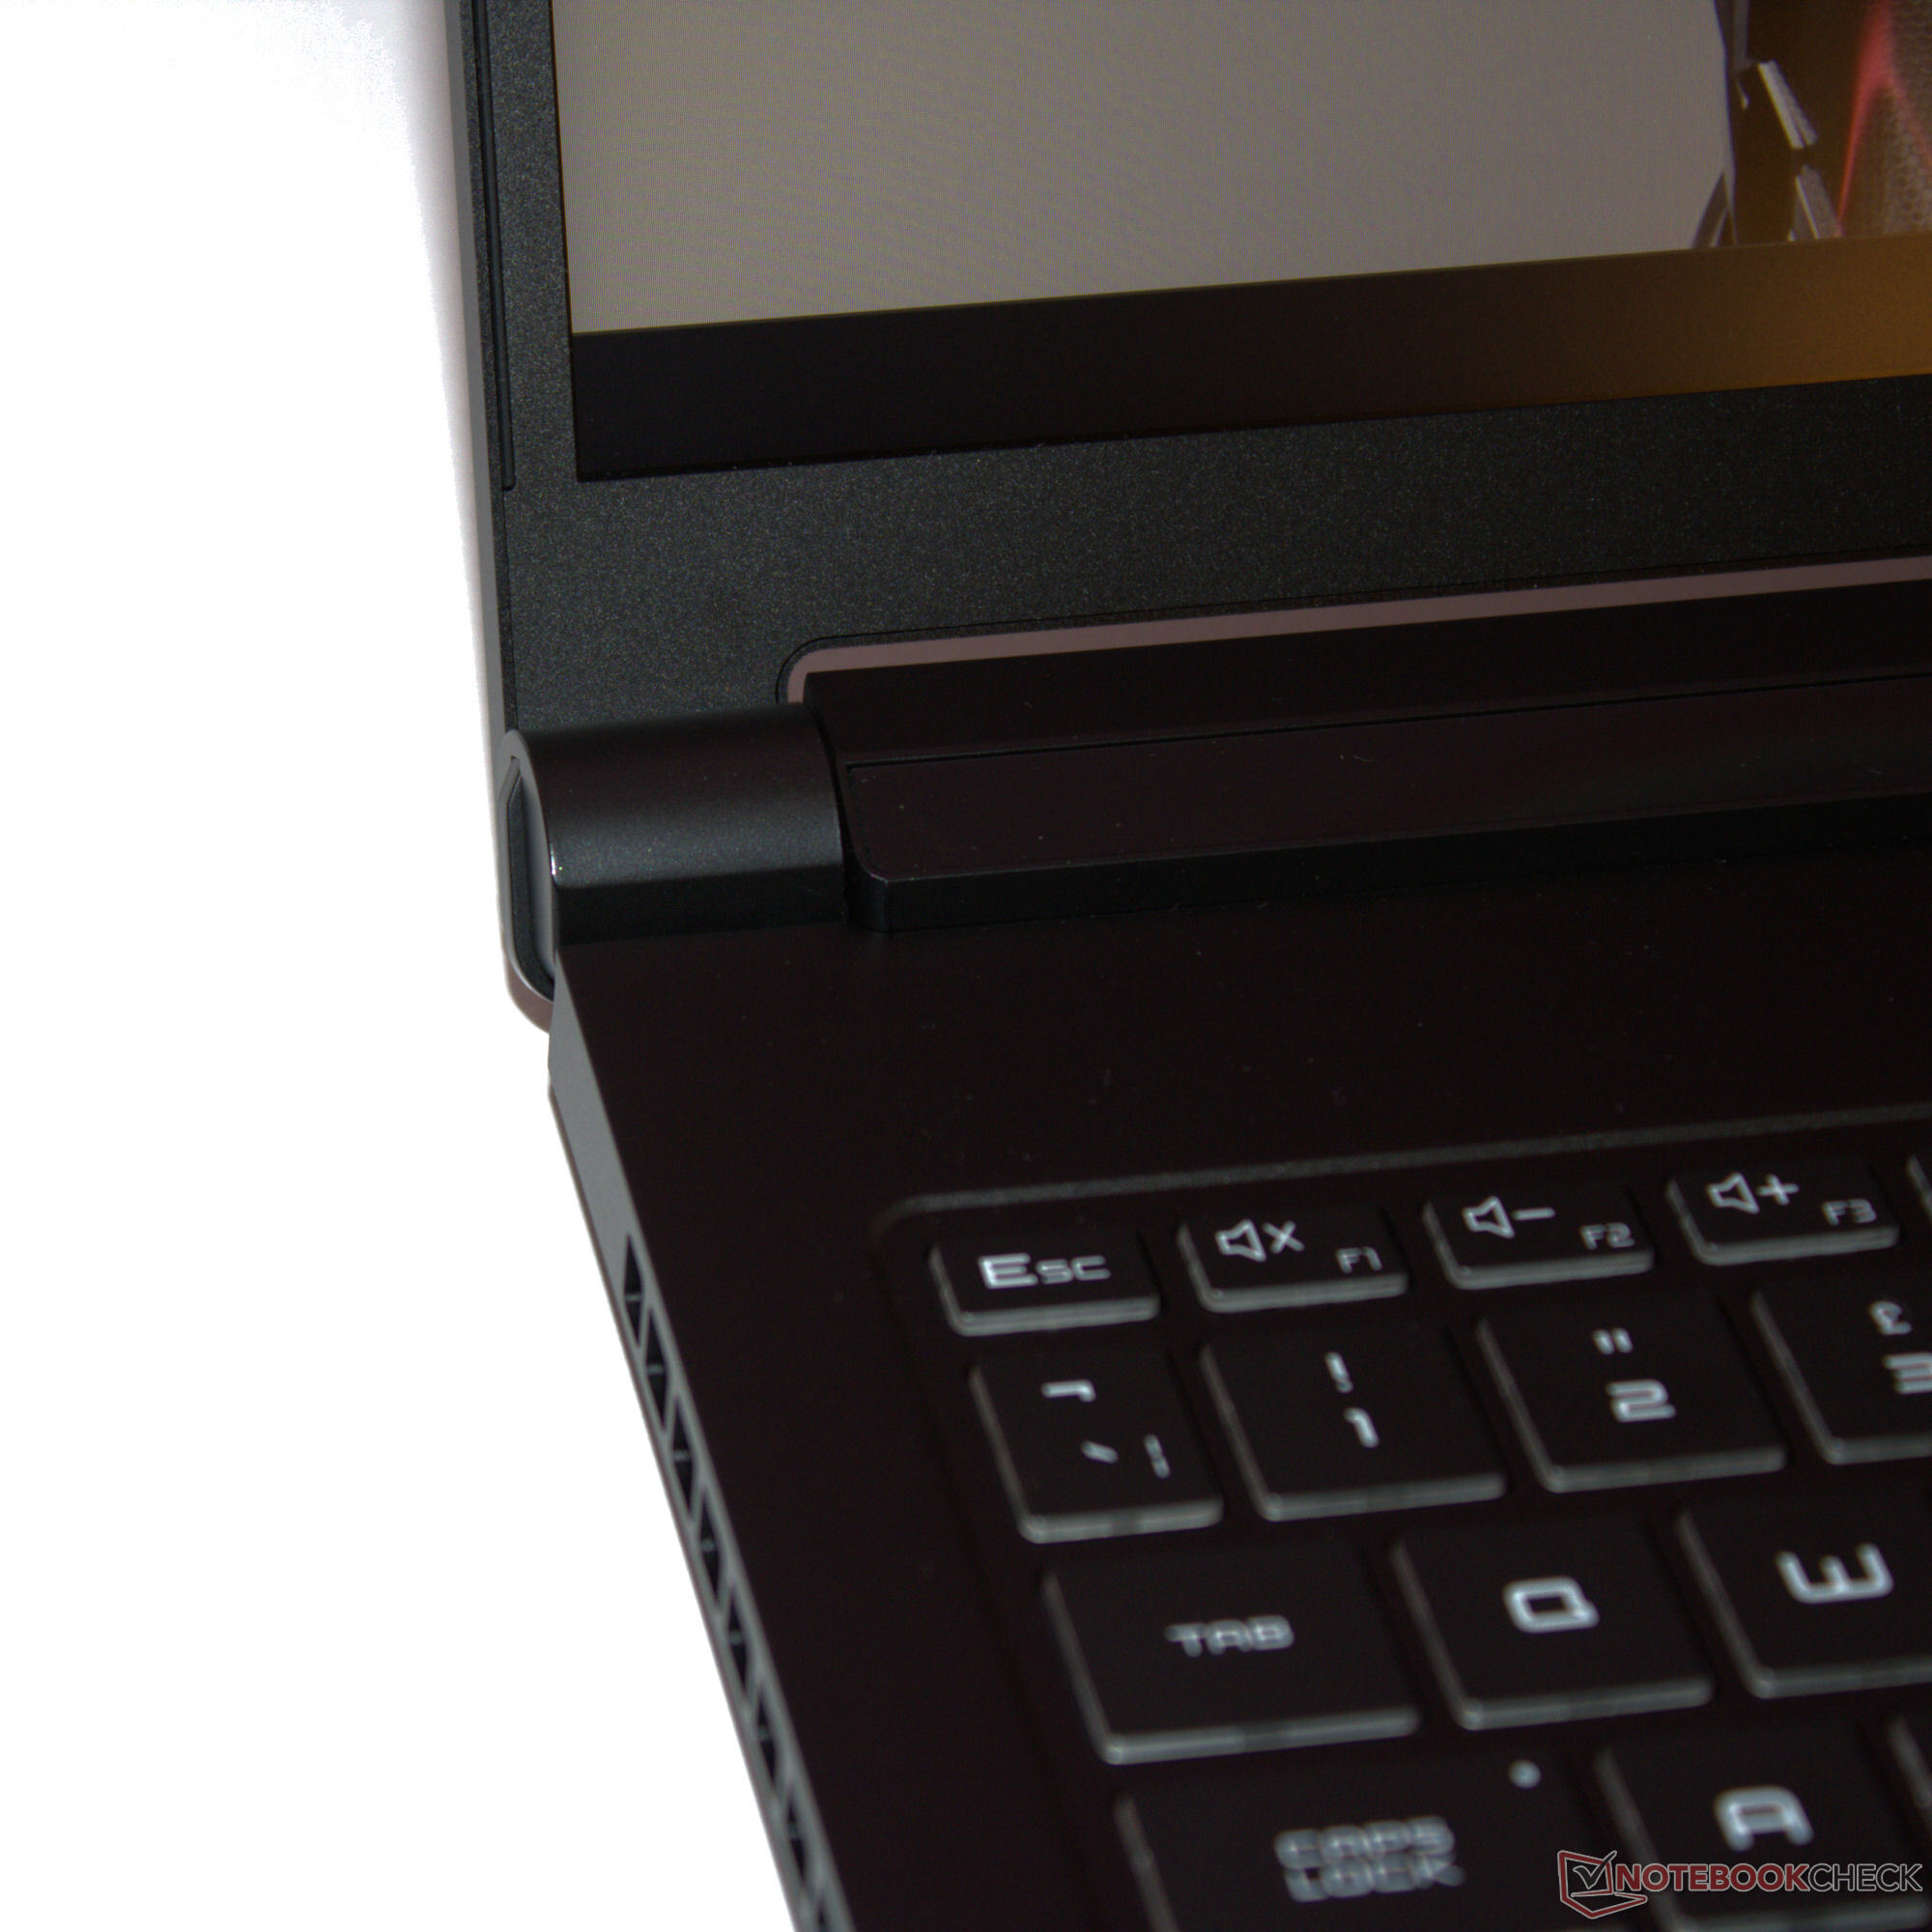
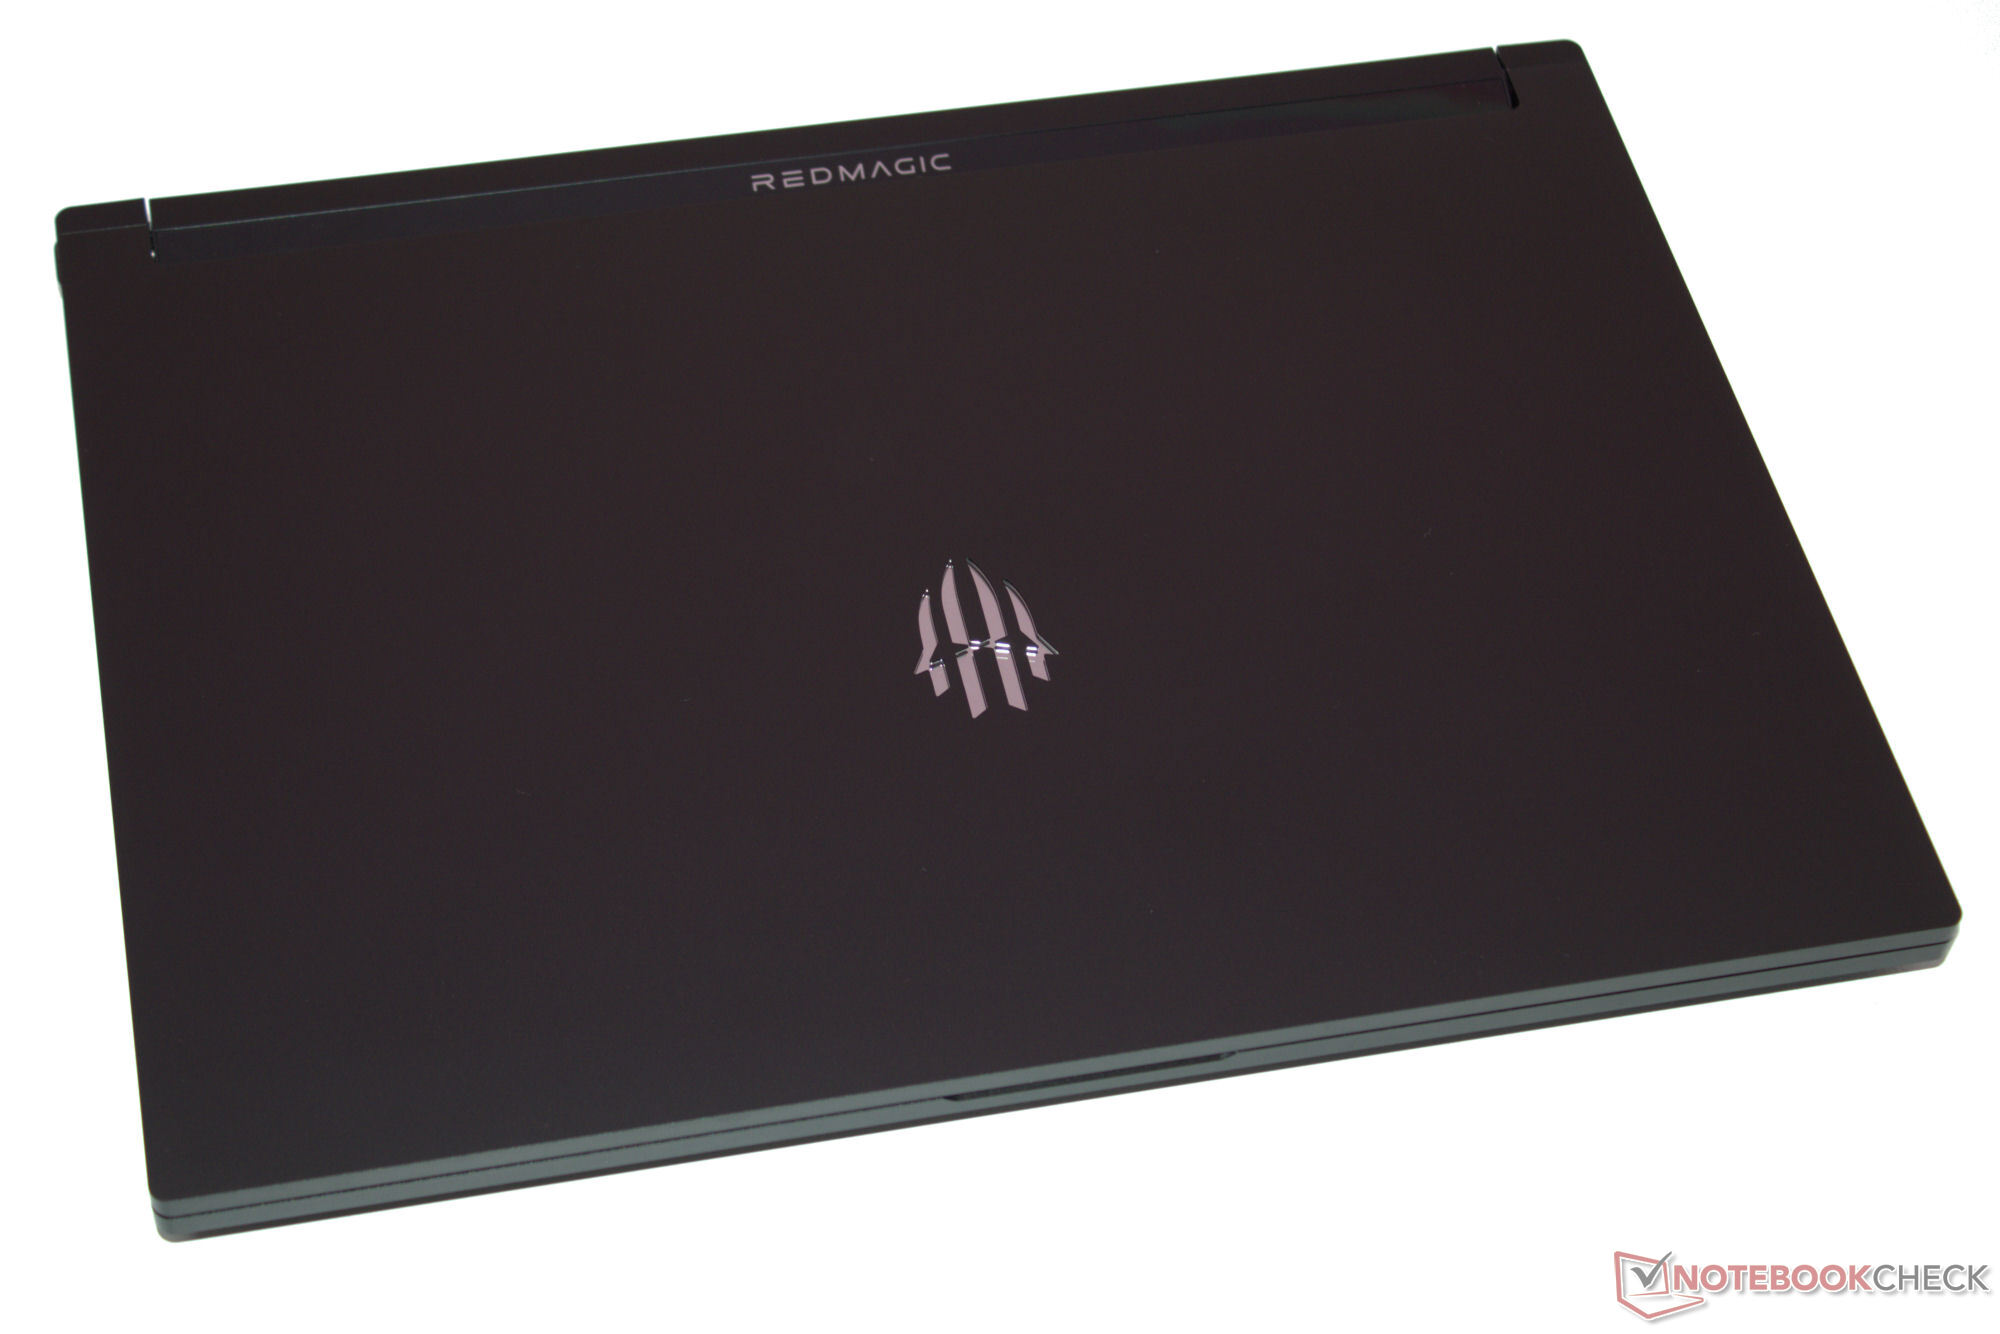
Ein Reinigungstuch sollte immer parat liegen: Die Oberflächen des matt-schwarzen Chassis zeigen sich empfänglich für Hinterlassenschaften der Finger und Hände. Baseunit und Deckel des aus Aluminium gefertigten Gehäuses können nur in geringem Maße verdreht werden, Verarbeitungsmängel sind uns nicht begegnet. Druck auf die Deckelrückseite führt nicht zu Bildveränderungen. Die sehr straffen Scharniere halten den Deckel fest in Position und wippen bestenfalls minimal nach. Der maximale Öffnungswinkel beträgt 130 Grad. Eine Einhand-Öffnung ist möglich.
Für farbliche Vielfalt in dem schwarzen Einerlei sorgen neben der Tastenbeleuchtung zwei LED-Elemente: Der RedMagic-Schriftzug auf der Scharnierabdeckung und das Logo auf dem Deckel strahlen in den Farben des Regenbogens. Alle Elemente können individuell angesteuert werden. Der Schriftzug dient zudem als Akkuleuchte: Ein rotes Blinken zeigt einen niedrigen Ladestand an.
Innerhalb des Vergleichsfeldes zählt das Titan zu den kompakteren und leichteren Geräten. Die Unterschiede zur Konkurrenz fallen aber nur gering aus.
Ausstattung - Das Titan wartet mit Thunderbolt 4 auf
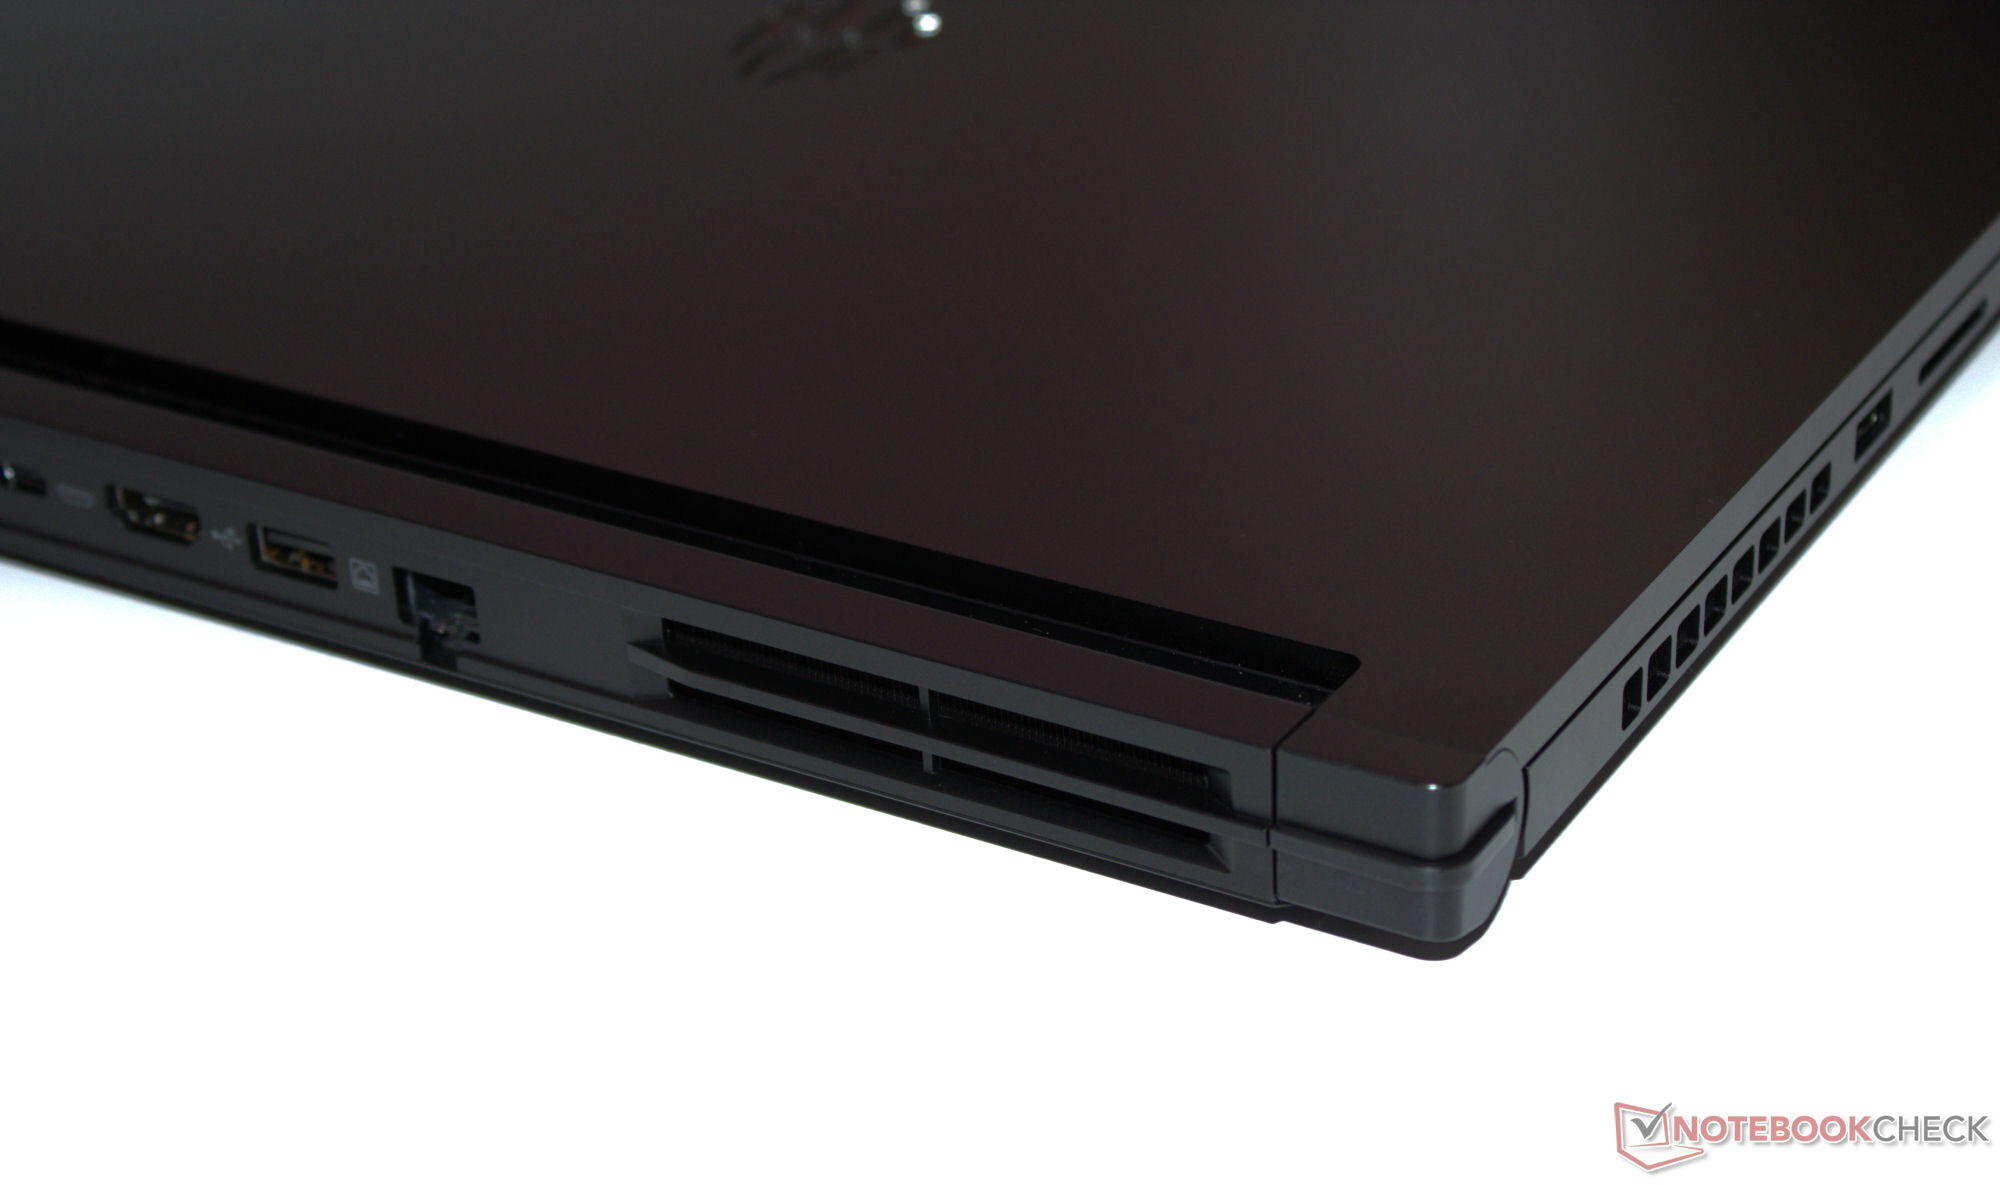
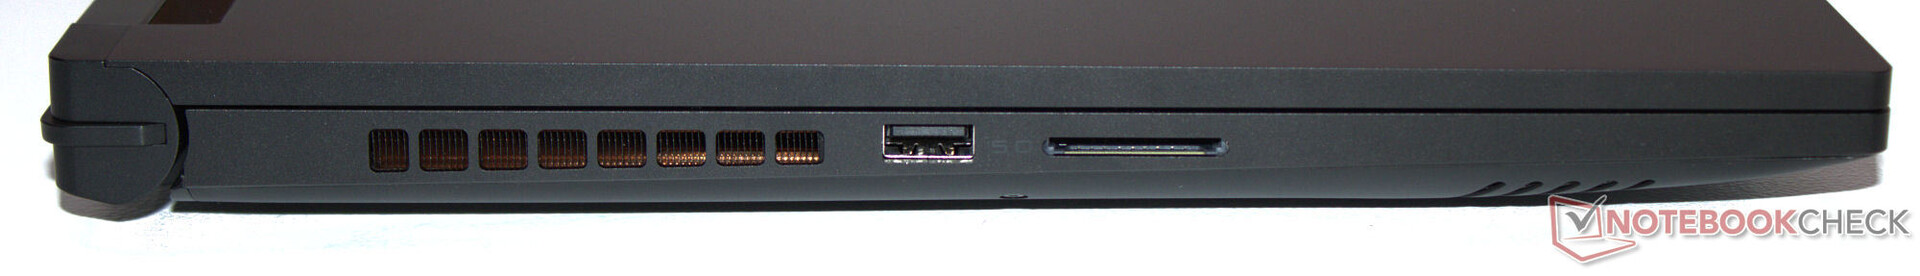
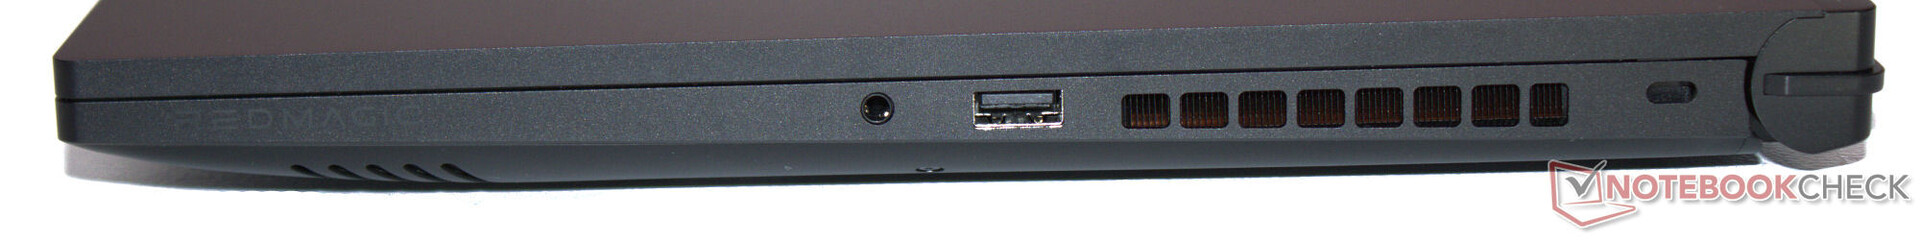
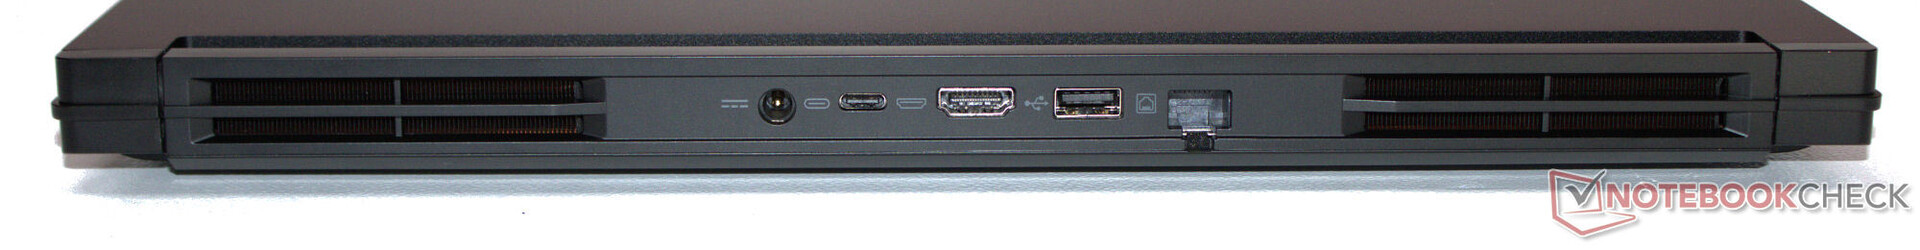
Das Titan bringt drei USB-A-Anschlüsse (2x USB 3.2 Gen 2, 1x USB 3.2 Gen 1) sowie einen USB-C-Port (Thunderbolt 4) mit. Letzterer bietet Unterstützung für Power Delivery und den DP Alt-Mode. Insgesamt stehen zwei Videoausgänge (1x HDMI, 1x DP) parat. Eine Audiobuchse und ein Ethernet-Port (1 GBit/s) runden das Angebot ab.
Videoausgänge, Netzwerkbuchse und Stromanschluss befinden sich auf der Rückseite des Geräts. Zugehörige Kabel würden nach hinten laufen und nicht im Weg liegen. Gut: Linke und rechte Seite des Rechner beherbergen jeweils eine USB-A-Buchse.
SD Card Reader
Der SD-Kartenleser (Referenzkarte: AV PRO microSD 128 GB V60) gehört nicht zu den schnellsten Vertretern seiner Art, liefert aber solide Datenraten im mittelschnellen Bereich. Dass deutlich höhere Übertragungsraten möglich wären, zeigt ein Vergleich mit den Werten des Blade 16 (2024).
| SD Card Reader | |
| average JPG Copy Test (av. of 3 runs) | |
| Razer Blade 16 2024, RTX 4090 | |
| Durchschnitt der Klasse Gaming (20 - 210, n=66, der letzten 2 Jahre) | |
| Schenker XMG Pro 16 Studio (Mid 24) (AV PRO microSD 128 GB V60) | |
| Nubia RedMagic Titan 16 Pro (AV PRO microSD 128 GB V60) | |
| Acer Predator Helios Neo 16 (2024) (AV PRO microSD 128 GB V60) | |
| maximum AS SSD Seq Read Test (1GB) | |
| Razer Blade 16 2024, RTX 4090 | |
| Durchschnitt der Klasse Gaming (25.8 - 261, n=63, der letzten 2 Jahre) | |
| Schenker XMG Pro 16 Studio (Mid 24) (AV PRO microSD 128 GB V60) | |
| Nubia RedMagic Titan 16 Pro (AV PRO microSD 128 GB V60) | |
| Acer Predator Helios Neo 16 (2024) (AV PRO microSD 128 GB V60) | |
Kommunikation
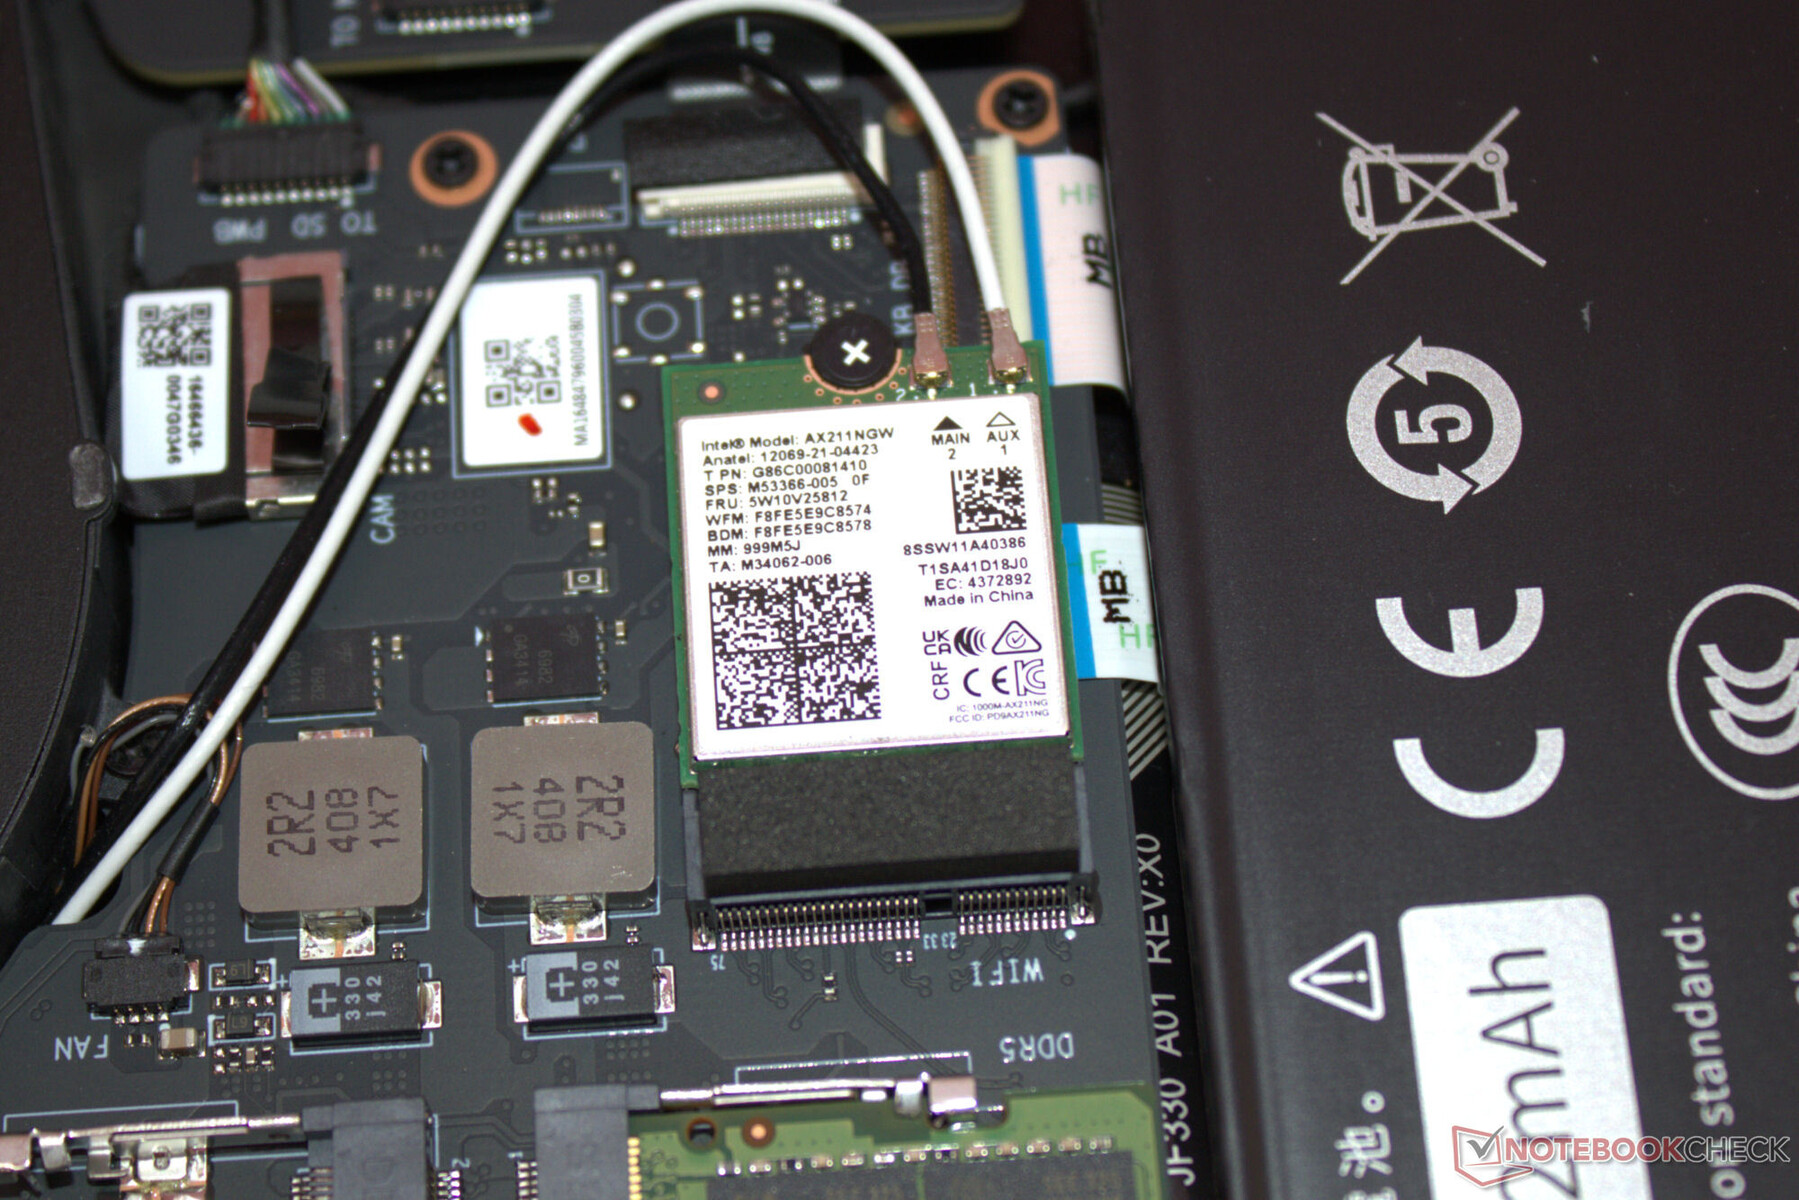
Keine Überraschungen bei den Netzwerkoptionen: Drahtgebundene Verbindungen wickelt ein etablierter Gigabit-Ethernet-Controller (RTL8168/8111, 1 GBit/s) der Firma Realtek ab. Intels WiFi-6E-Chip (AX211) liefert unter optimalen Bedingungen (keine WiFi-Geräte in der Nähe, geringer Abstand zwischen Laptop und Server) gute bis sehr gute Datenraten.
Webcam
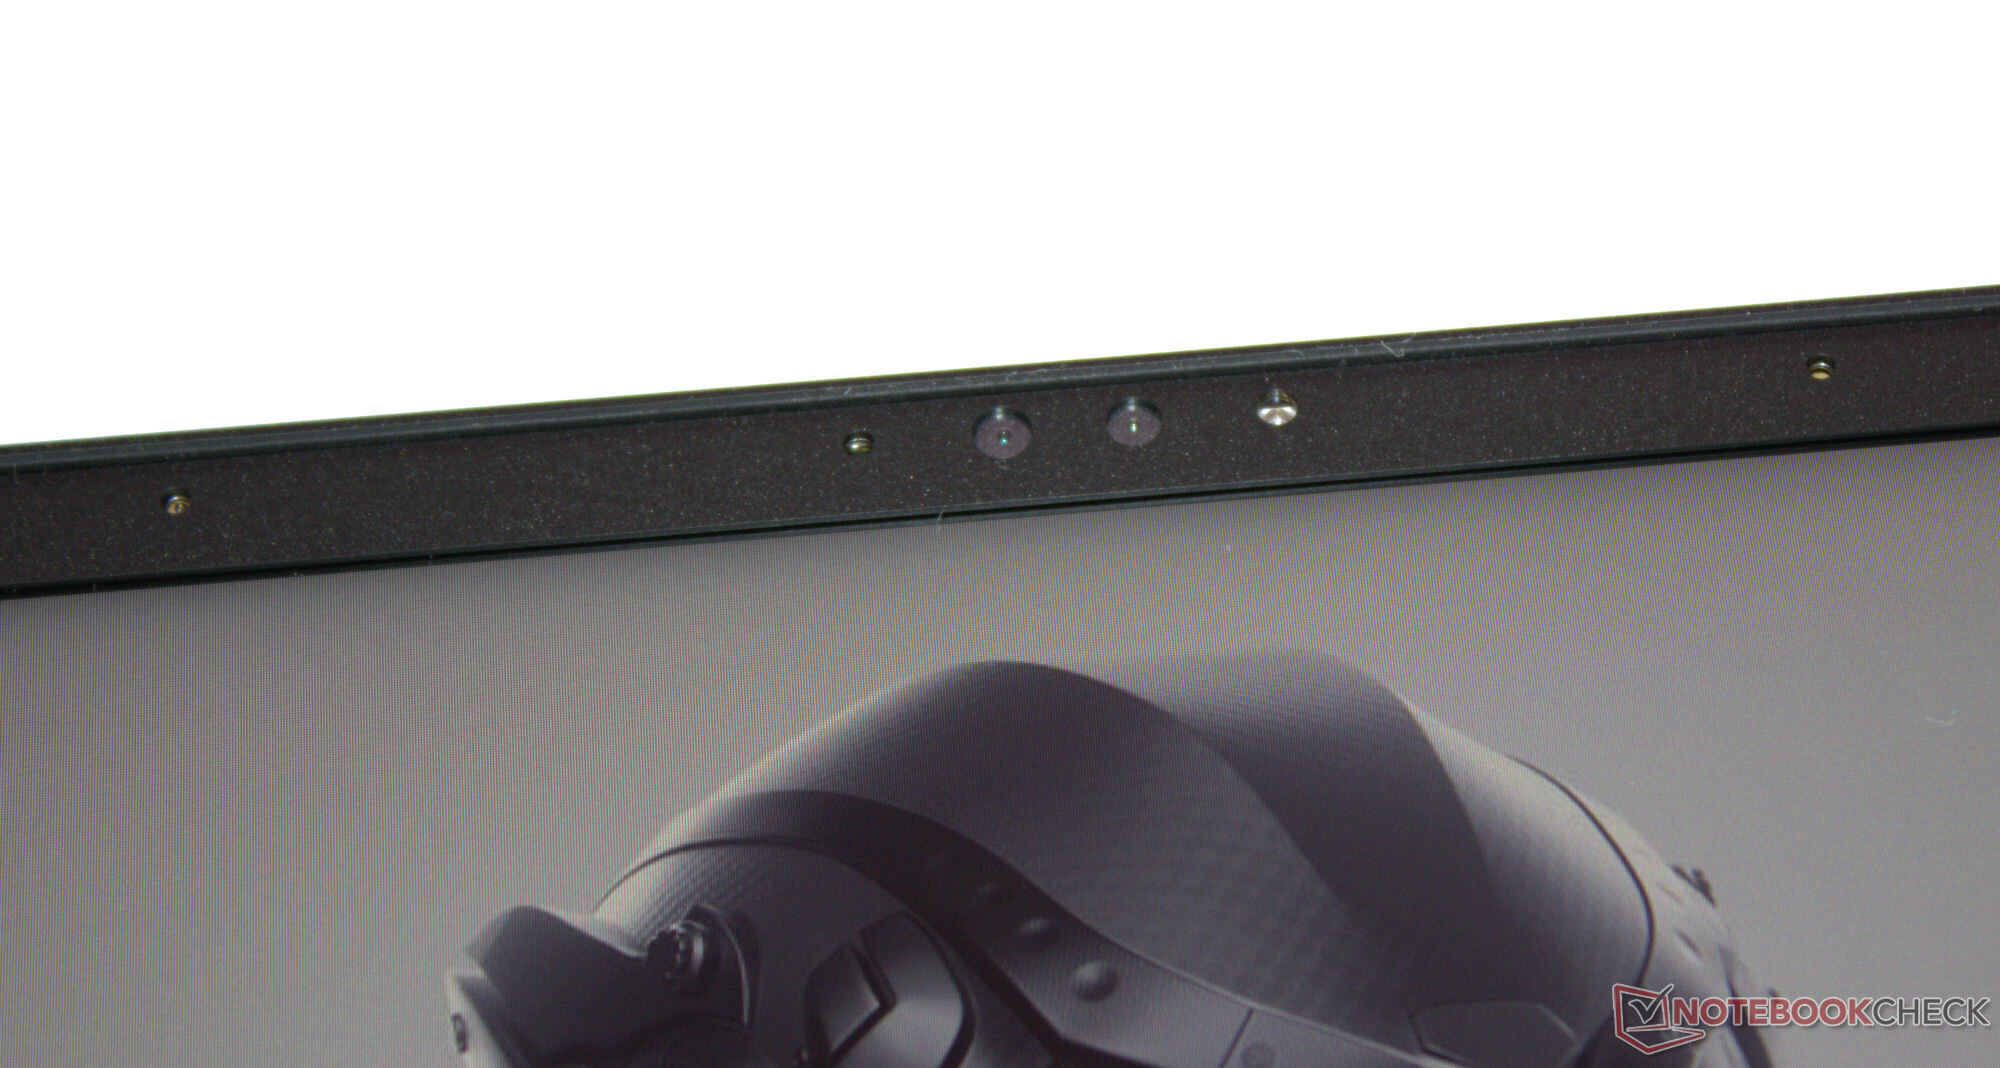
Die Webcam (2,1 MP) liefert Standardkost, Unterstützung für Windows Hello ist gegeben. Eine mechanische Abdeckung oder einen physischen Ein-/Ausschalter hält die Kamera nicht bereit.


Zubehör
Neben den üblichen Dokumenten (Schnellstartanleitung und Garantieinformationen) liegt dem Notebook kein weiteres Zubehör bei.
Wartung
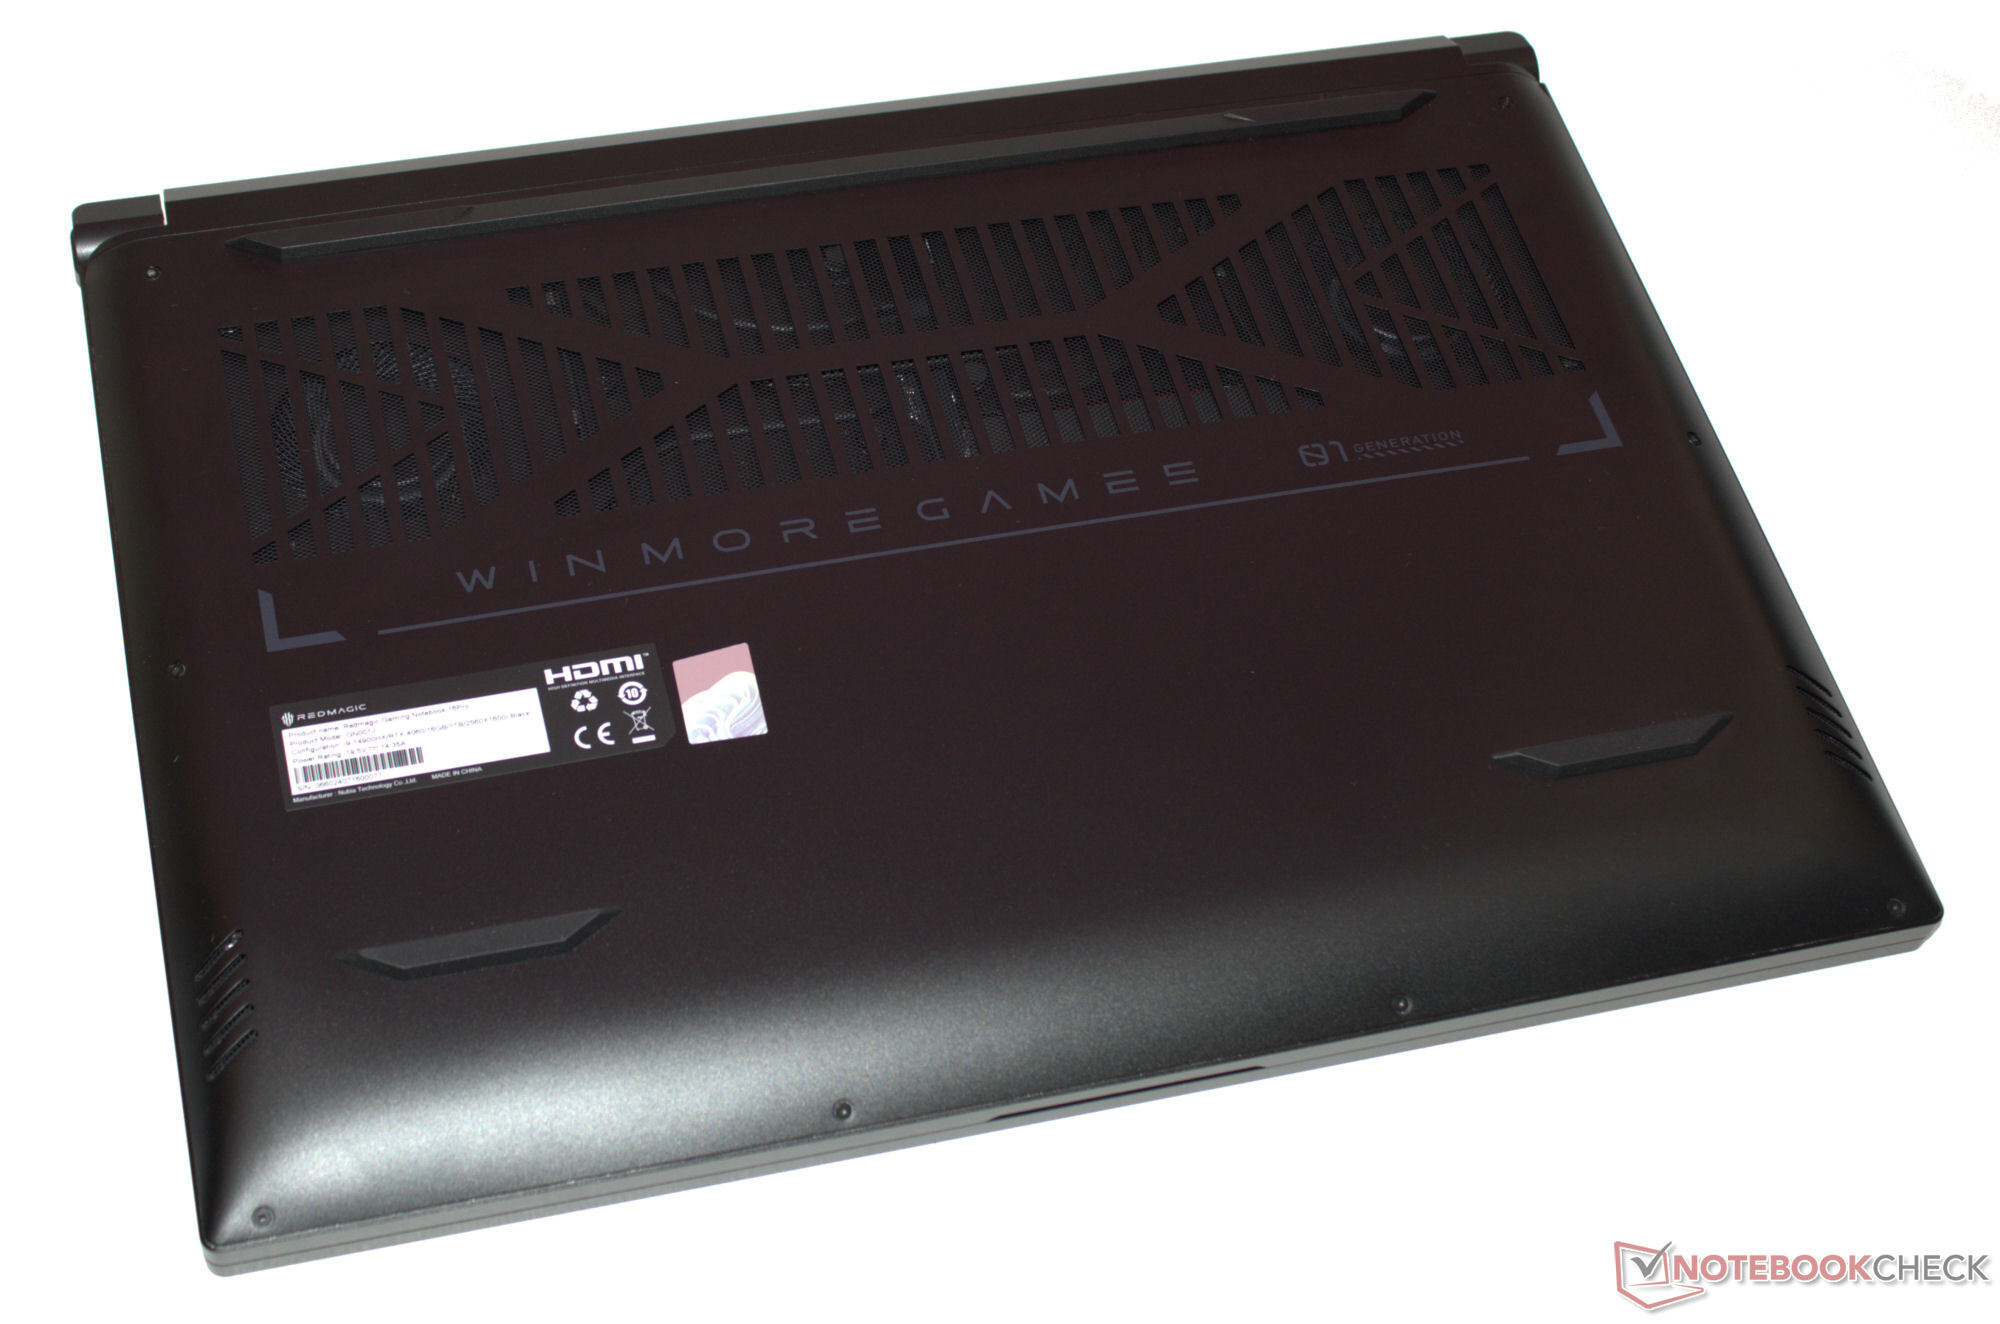
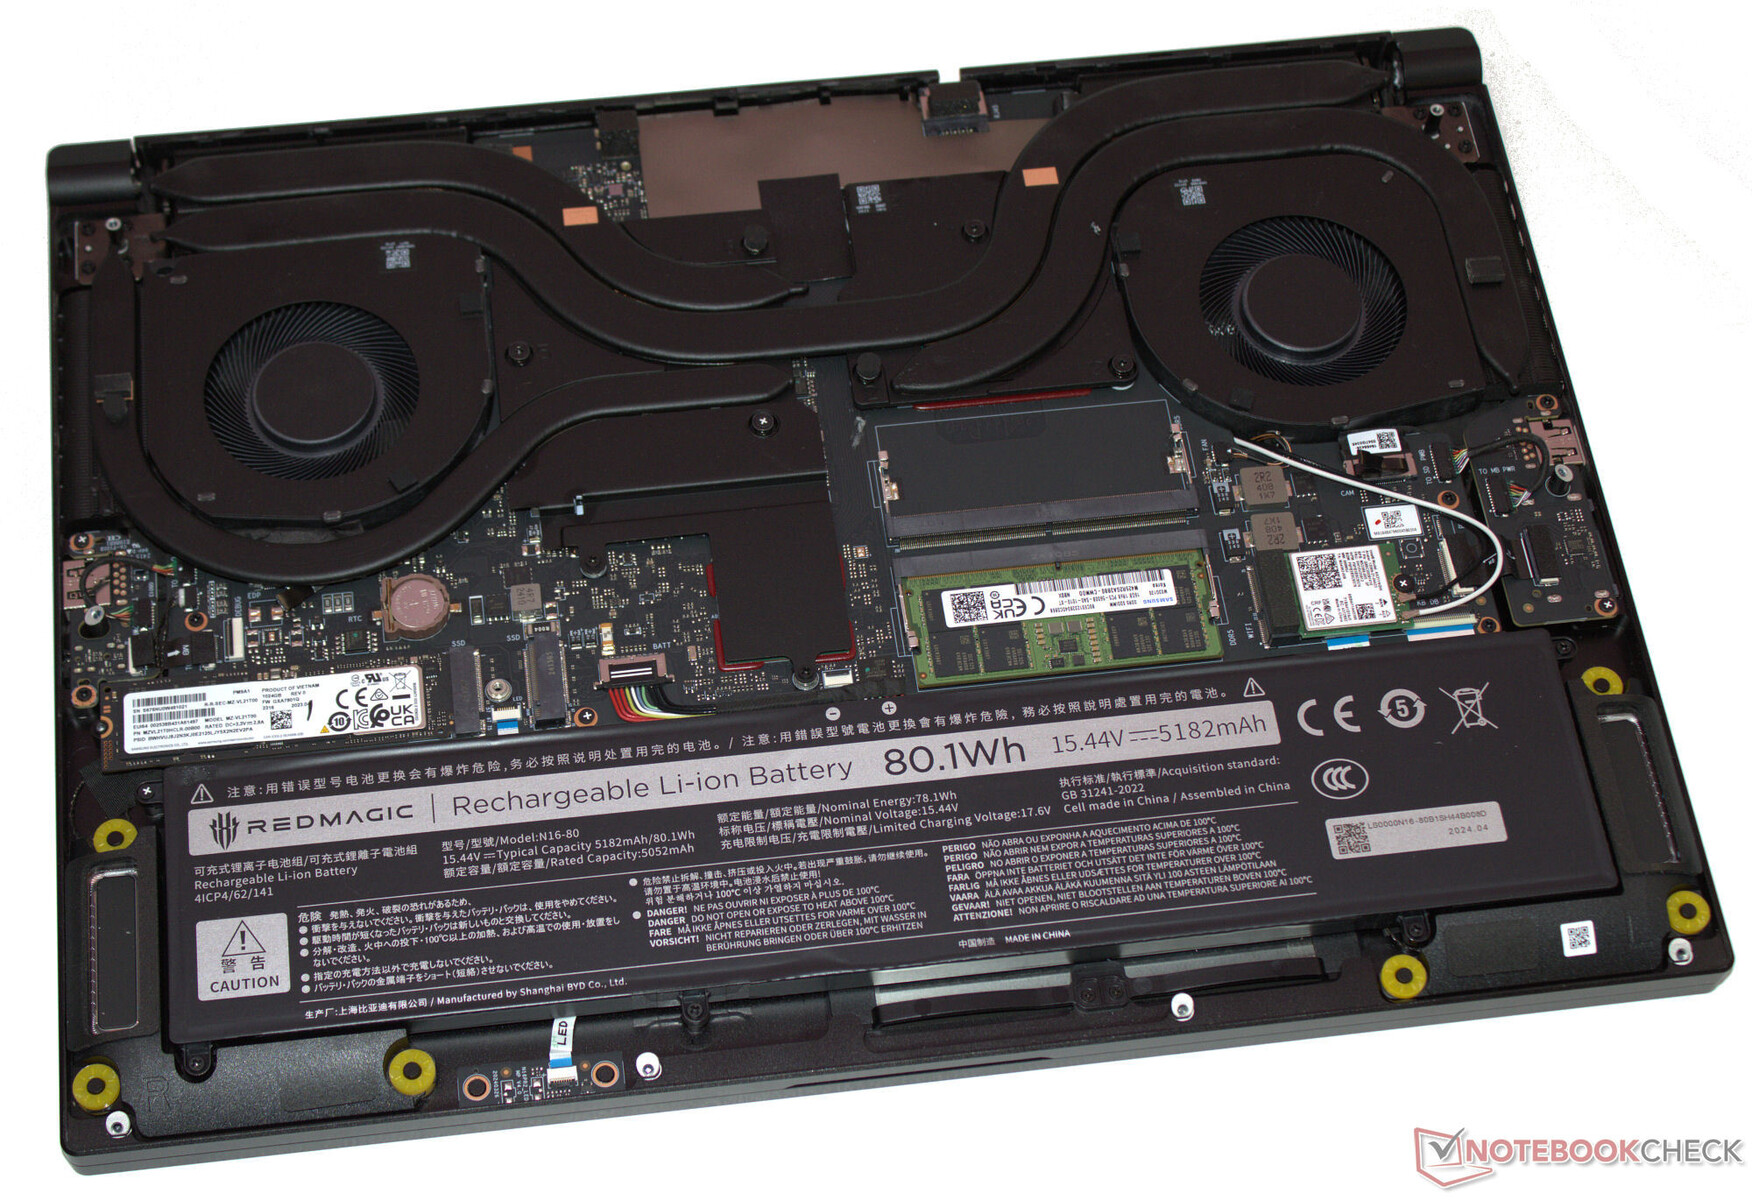
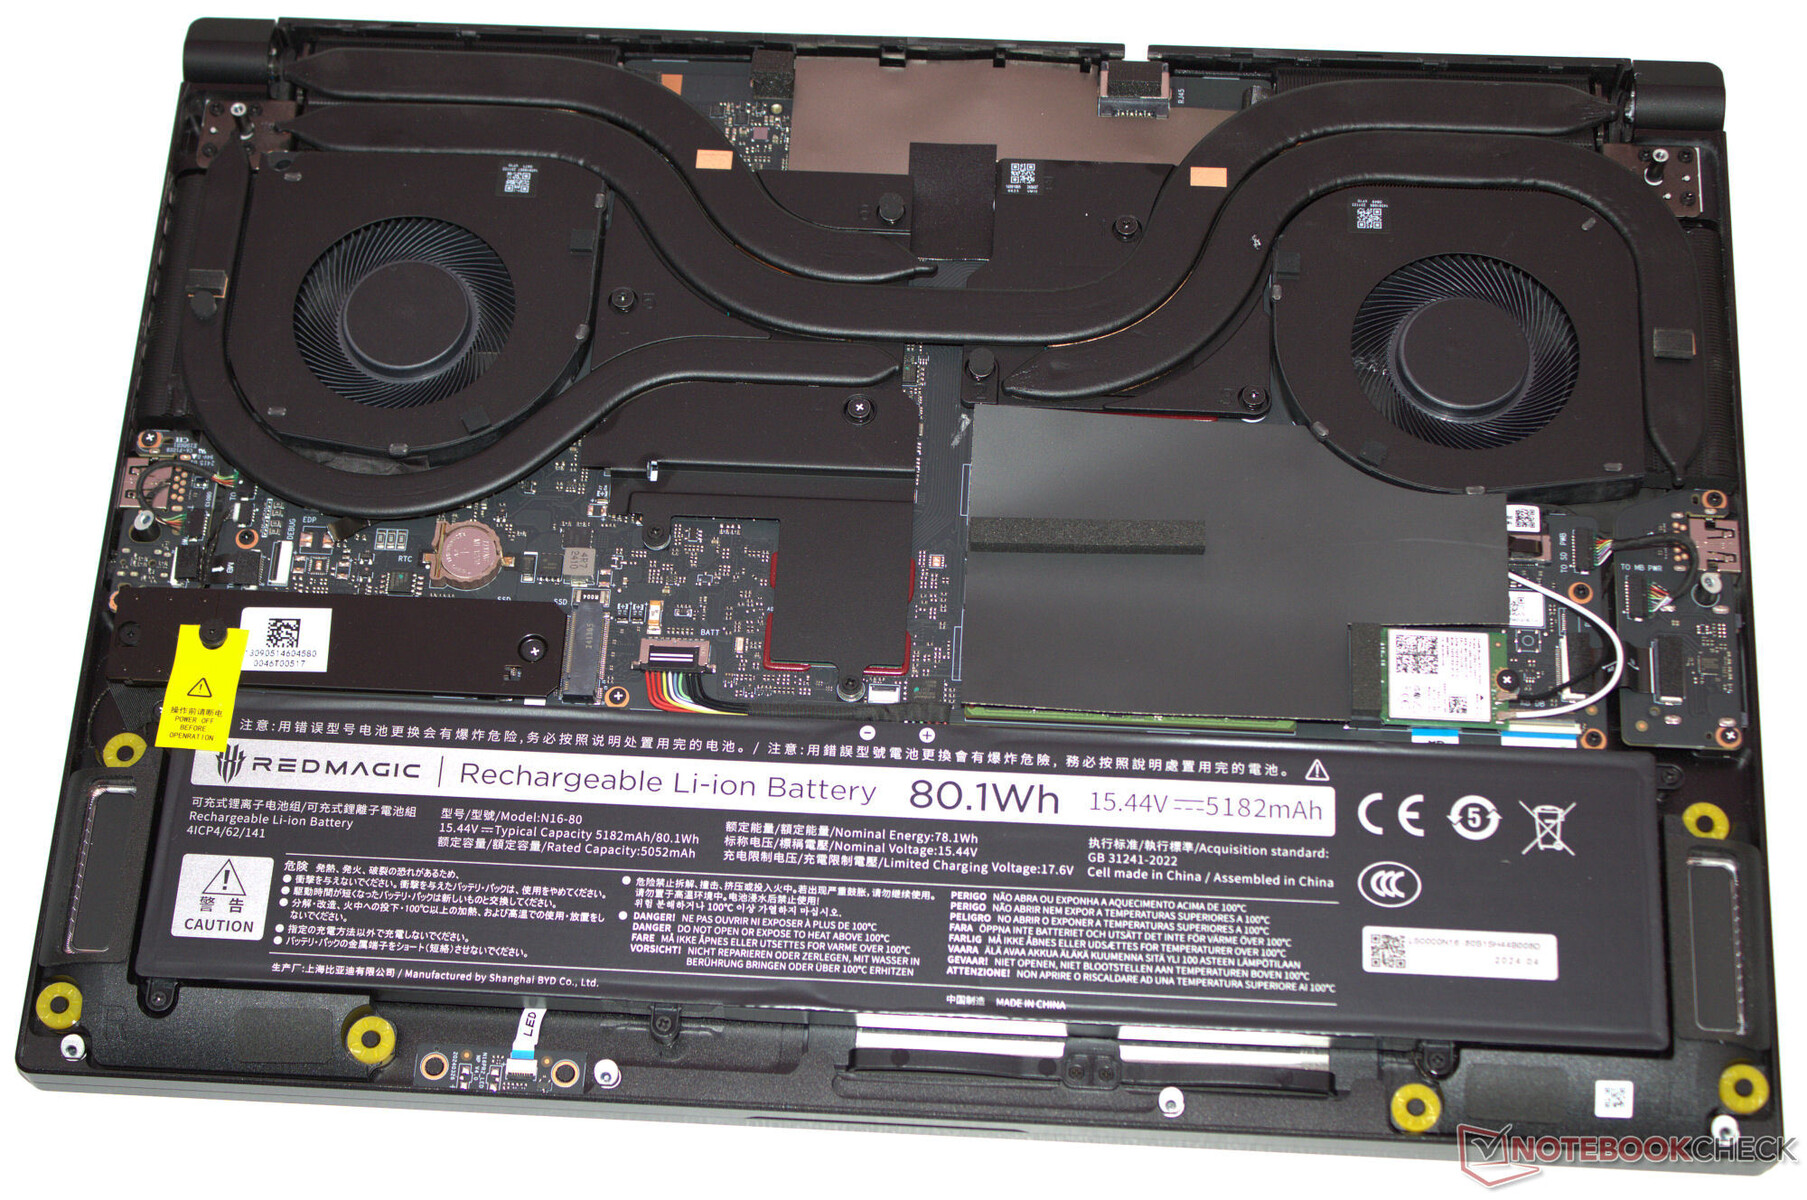
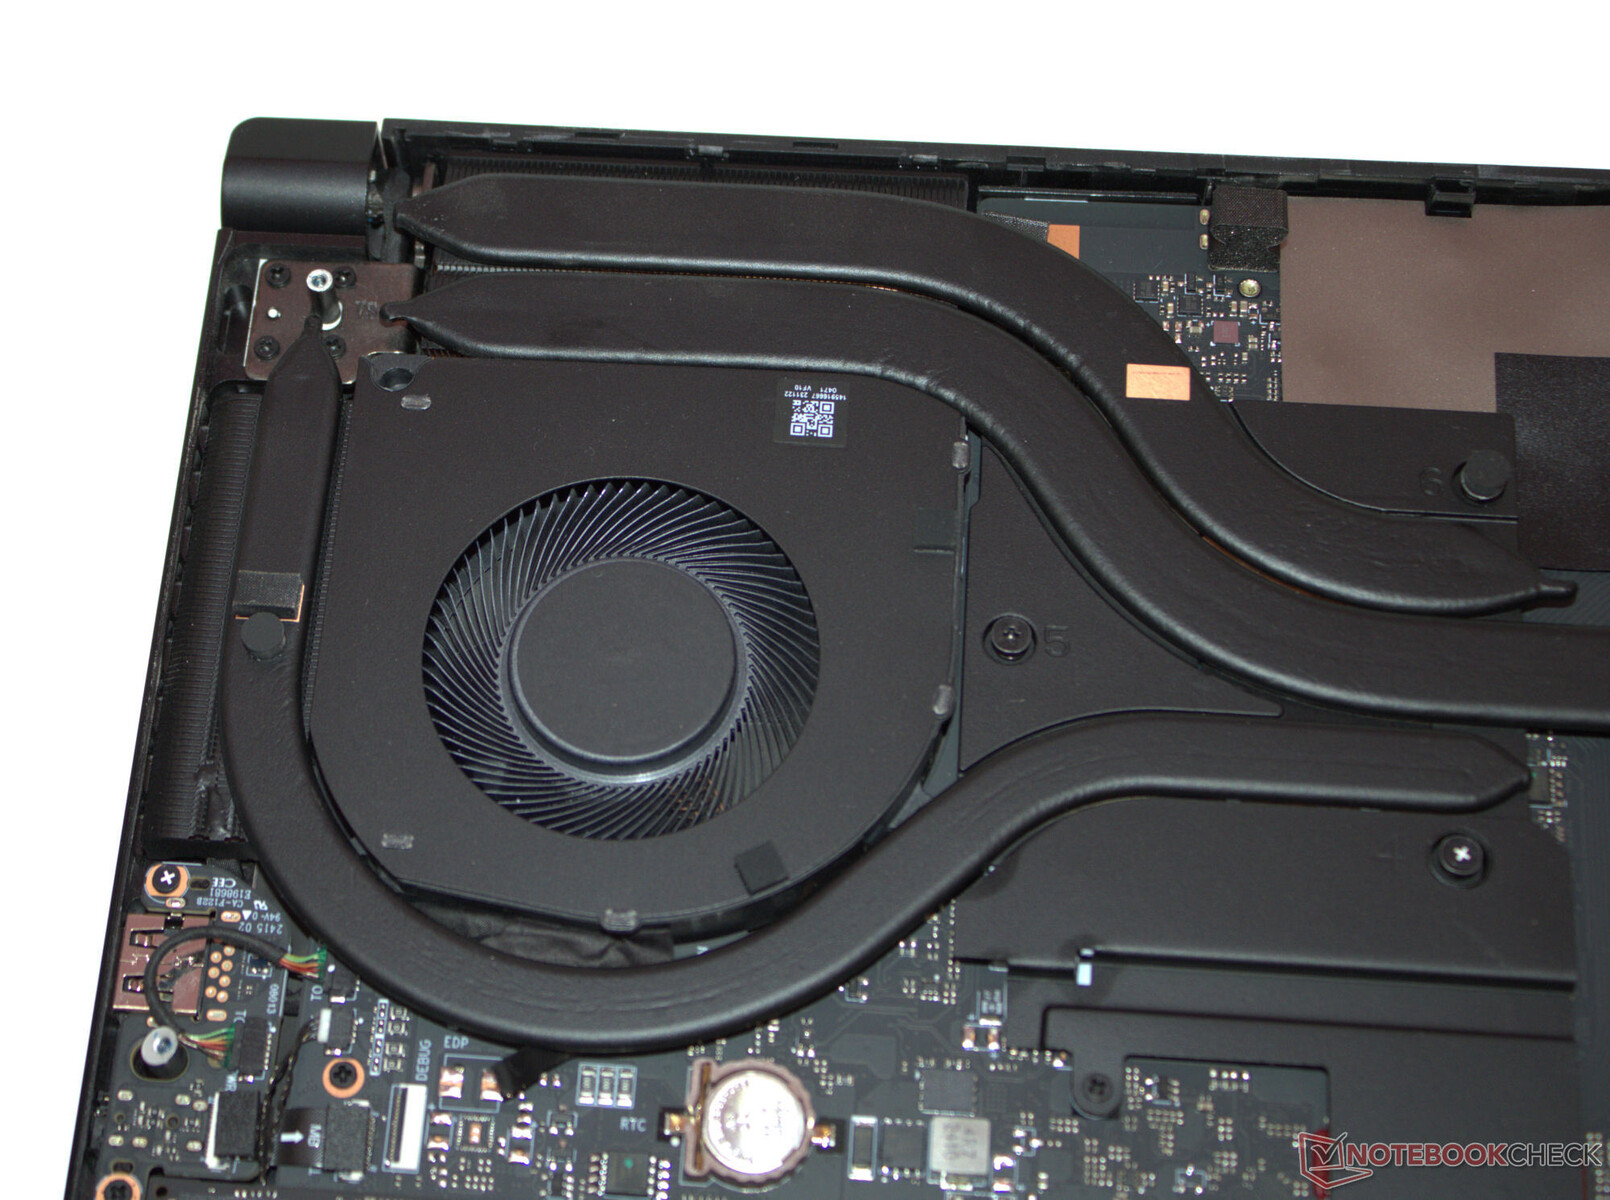
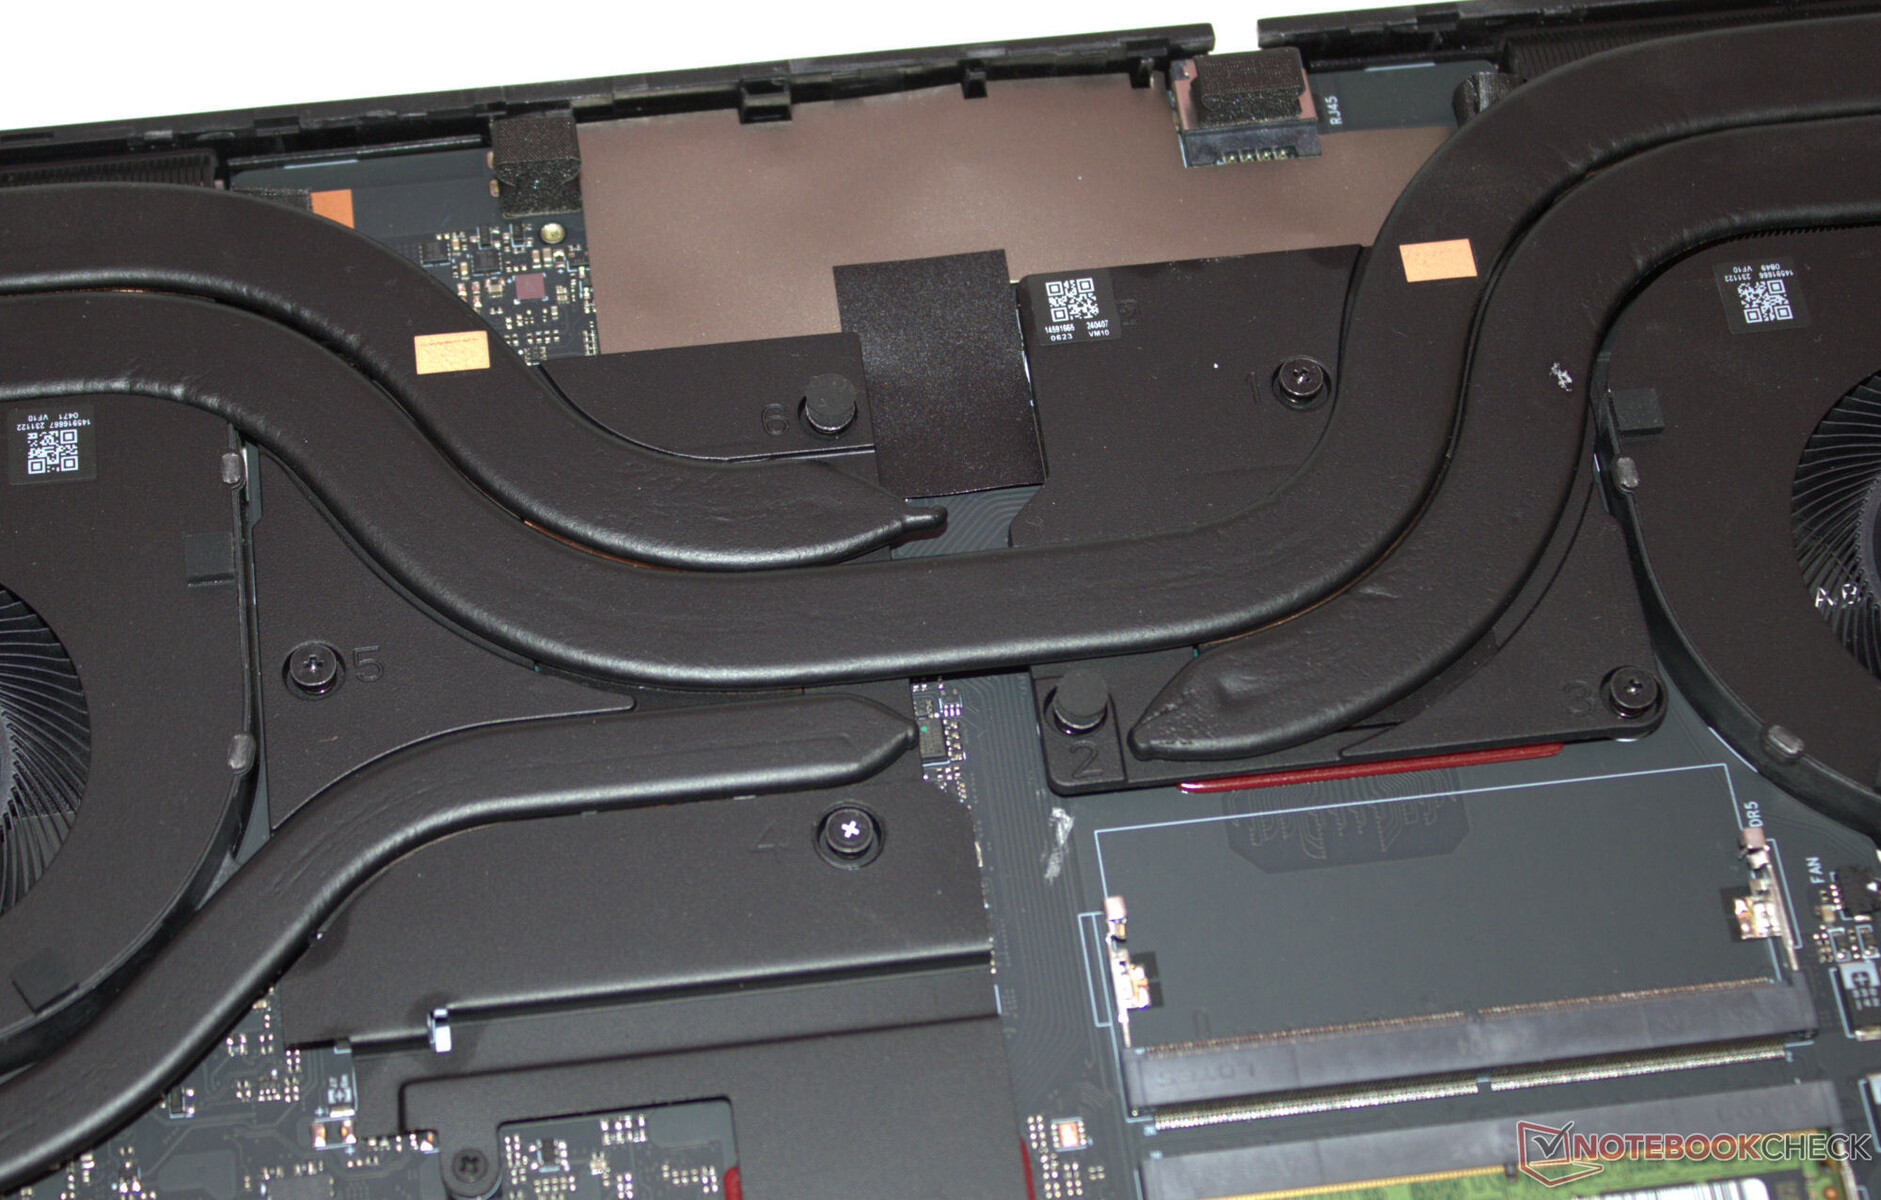
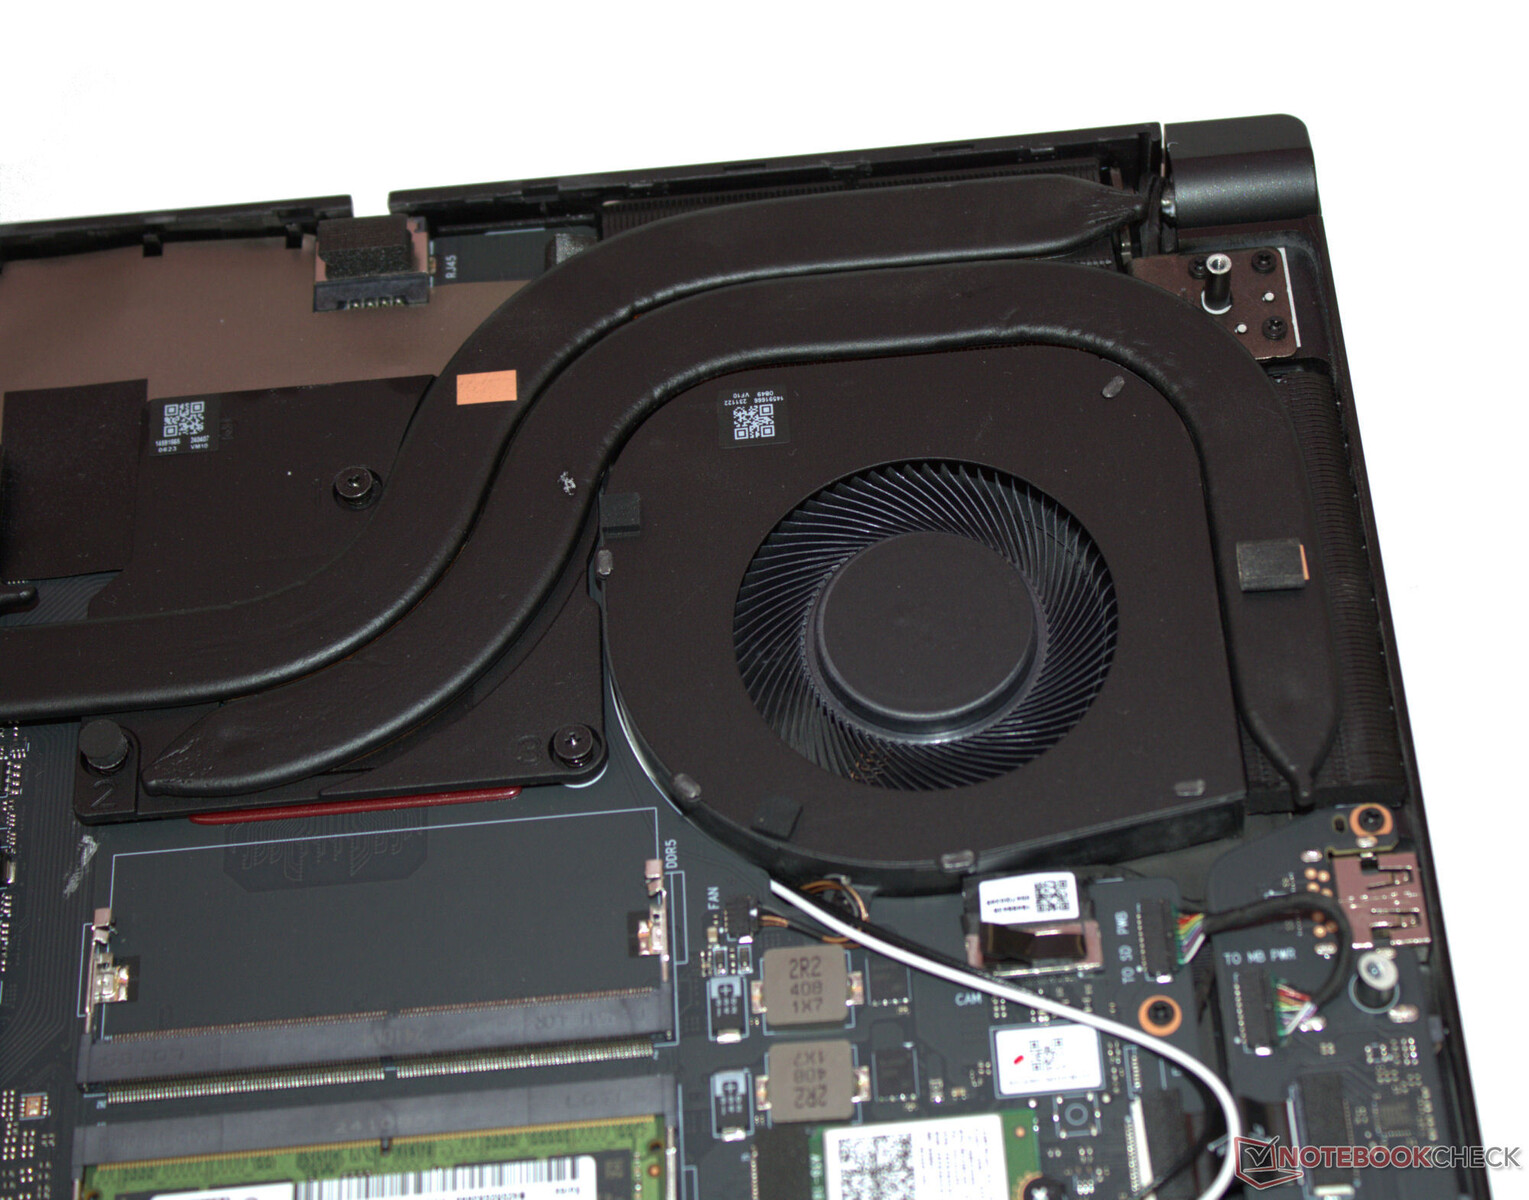
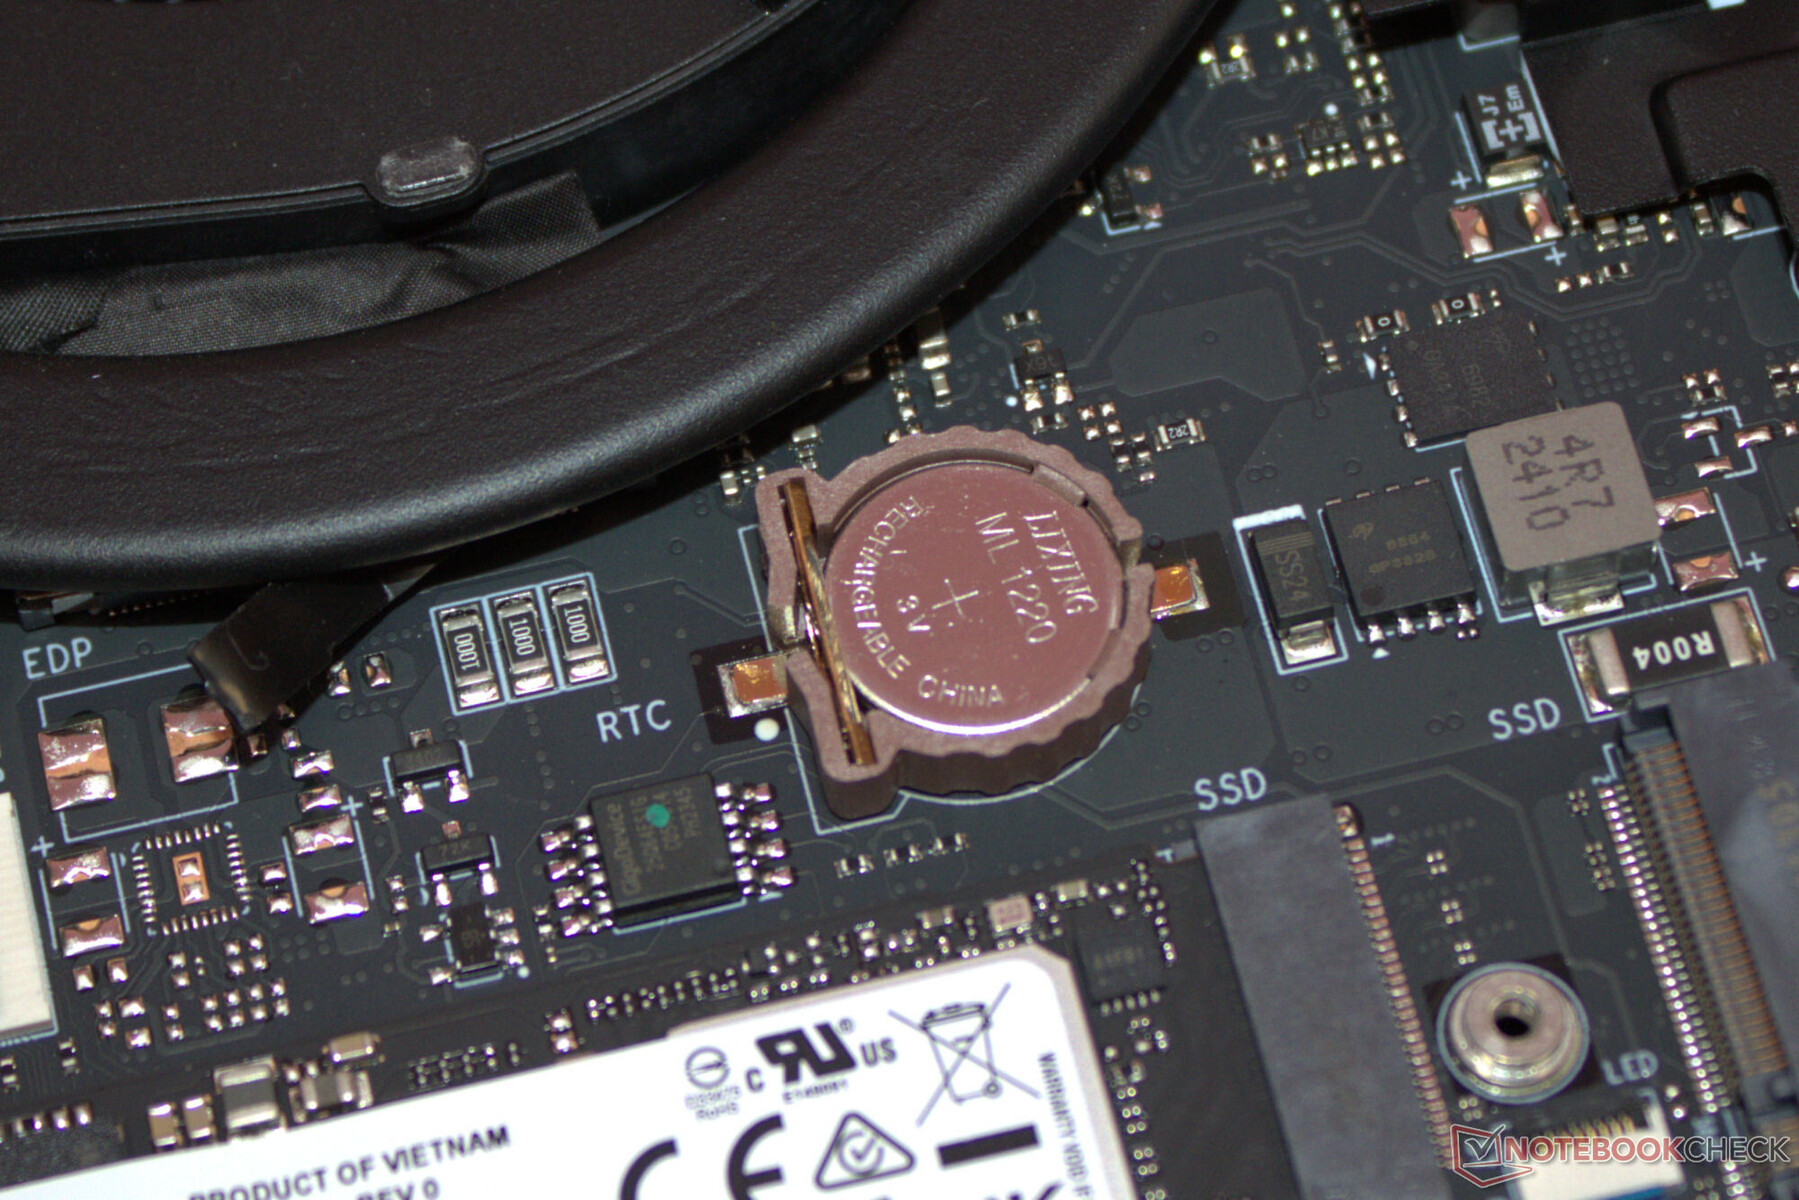
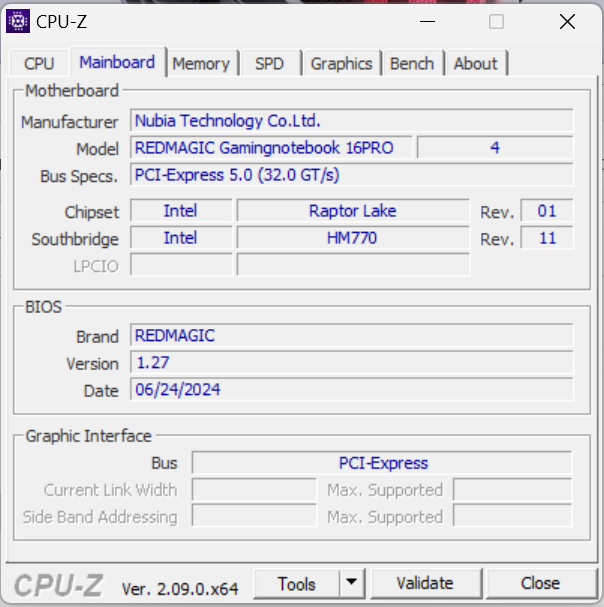
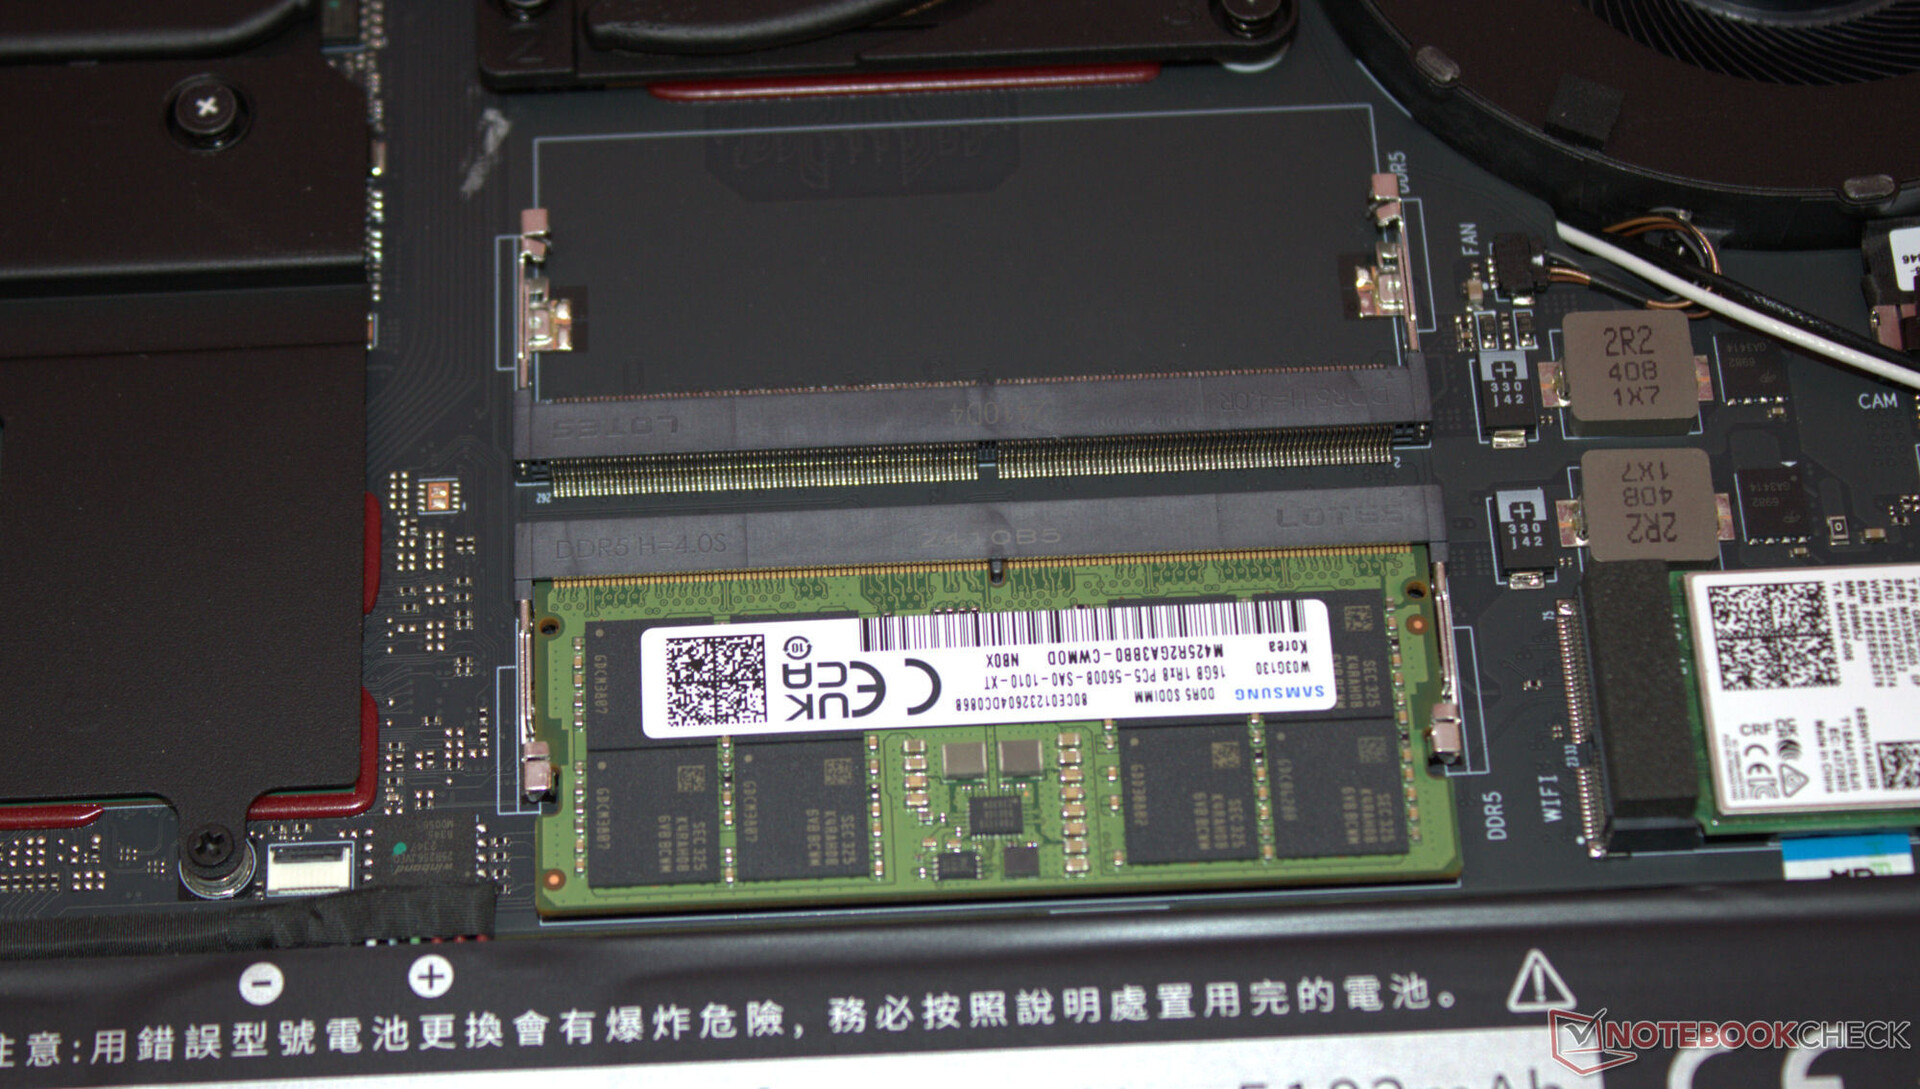
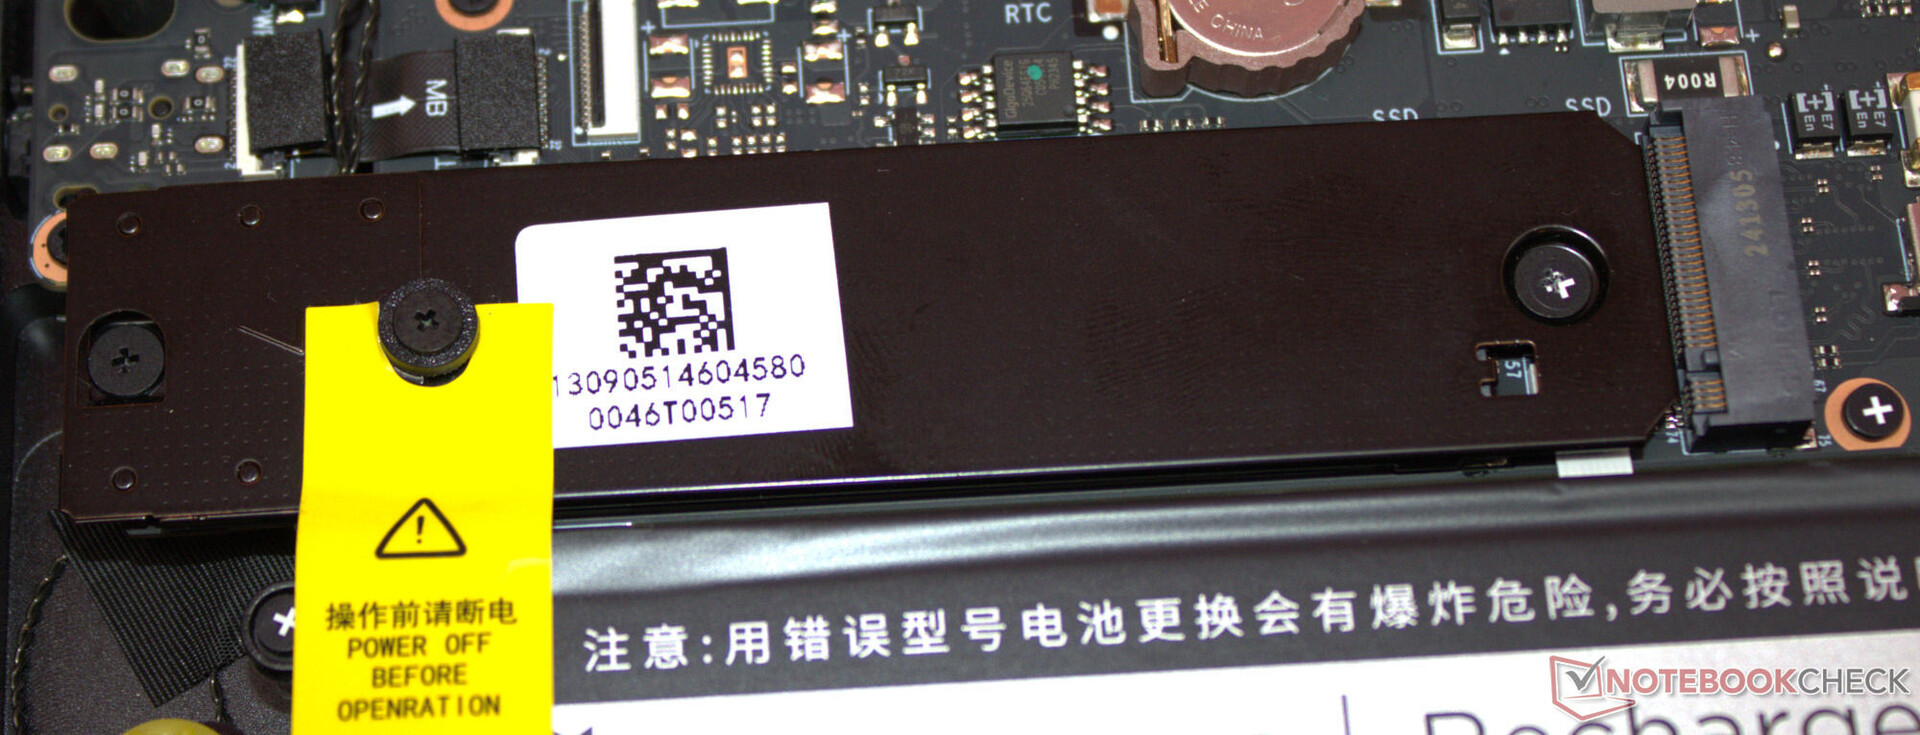
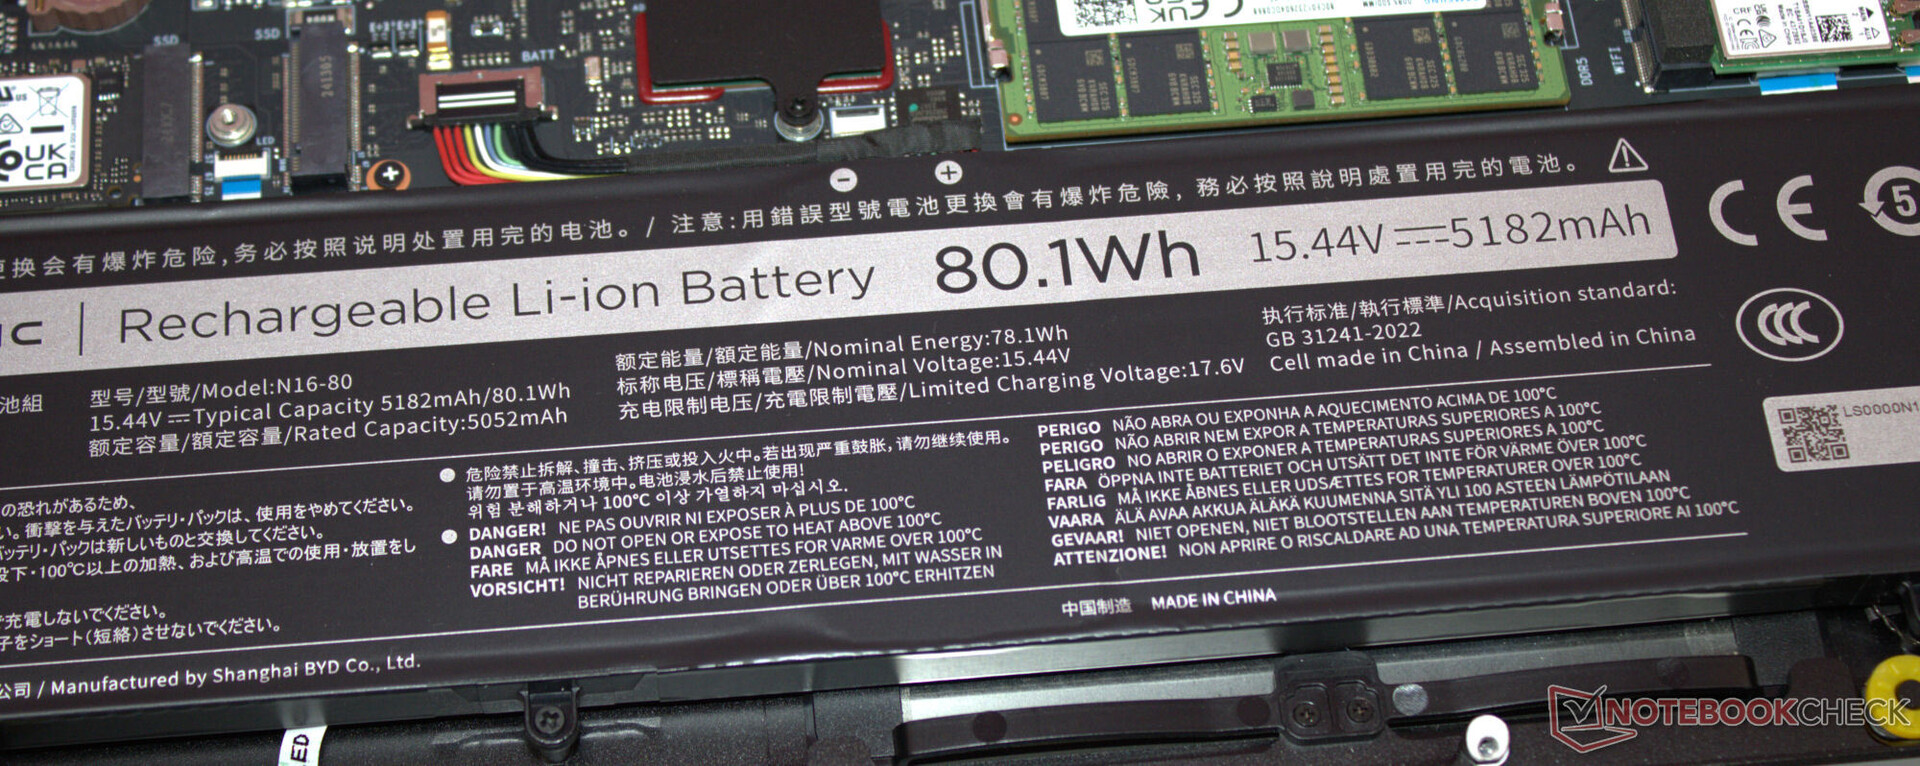
Nach Entfernung aller Schrauben auf der Geräteunterseite kann die Unterschale mittels eines Plektrums oder eines flachen Spatels abgelöst werden. Es besteht dann Zugriff auf die Speicherbänke (eine Bank belegt), die SSD (PCIe 4, M.2-2280) sowie den zweiten SSD-Slot (PCIe 4, M.2-2280), das WLAN-Modul, die BIOS-Batterie, die Lüfter und den Akku.
Nachhaltigkeit
Viel Pappe, wenig Kunststoff: Der Laptop wird von einer Folie umschlossen, eine dünne Schaumstoffmatte schützt die Oberseite des Rechners. Die gedruckte Kurzanleitung steckt in einem Plastikbeutel. Eine demontierbare Bodenplatte ermöglicht Reparaturen - die gesamte Hardware ist zugänglich. Softwareupdates dürften für die nächsten Jahre kein Problem darstellen - schließlich kommt Windows 11 als Betriebssystem zum Einsatz.
Wie Nubia die Versorgung mit Ersatzteilen und den Support der eigenen Software handhaben wird, wird sich zeigen müssen. Zum Testzeitpunkt findet sich auf der Nubia-Webseite noch kein Downloadbereich für das Titan.
Garantie
Bezüglich der Garantie können wir keine Angaben machen - es dürfte auf einen in Deutschland üblichen Zeitraum von 1 bis 2 Jahren hinauslaufen. Garantieerweiterungen halten wir für unwahrscheinlich.
Eingabegeräte - RedMagic Notebook mit RGB-Beleuchtung
Tastatur
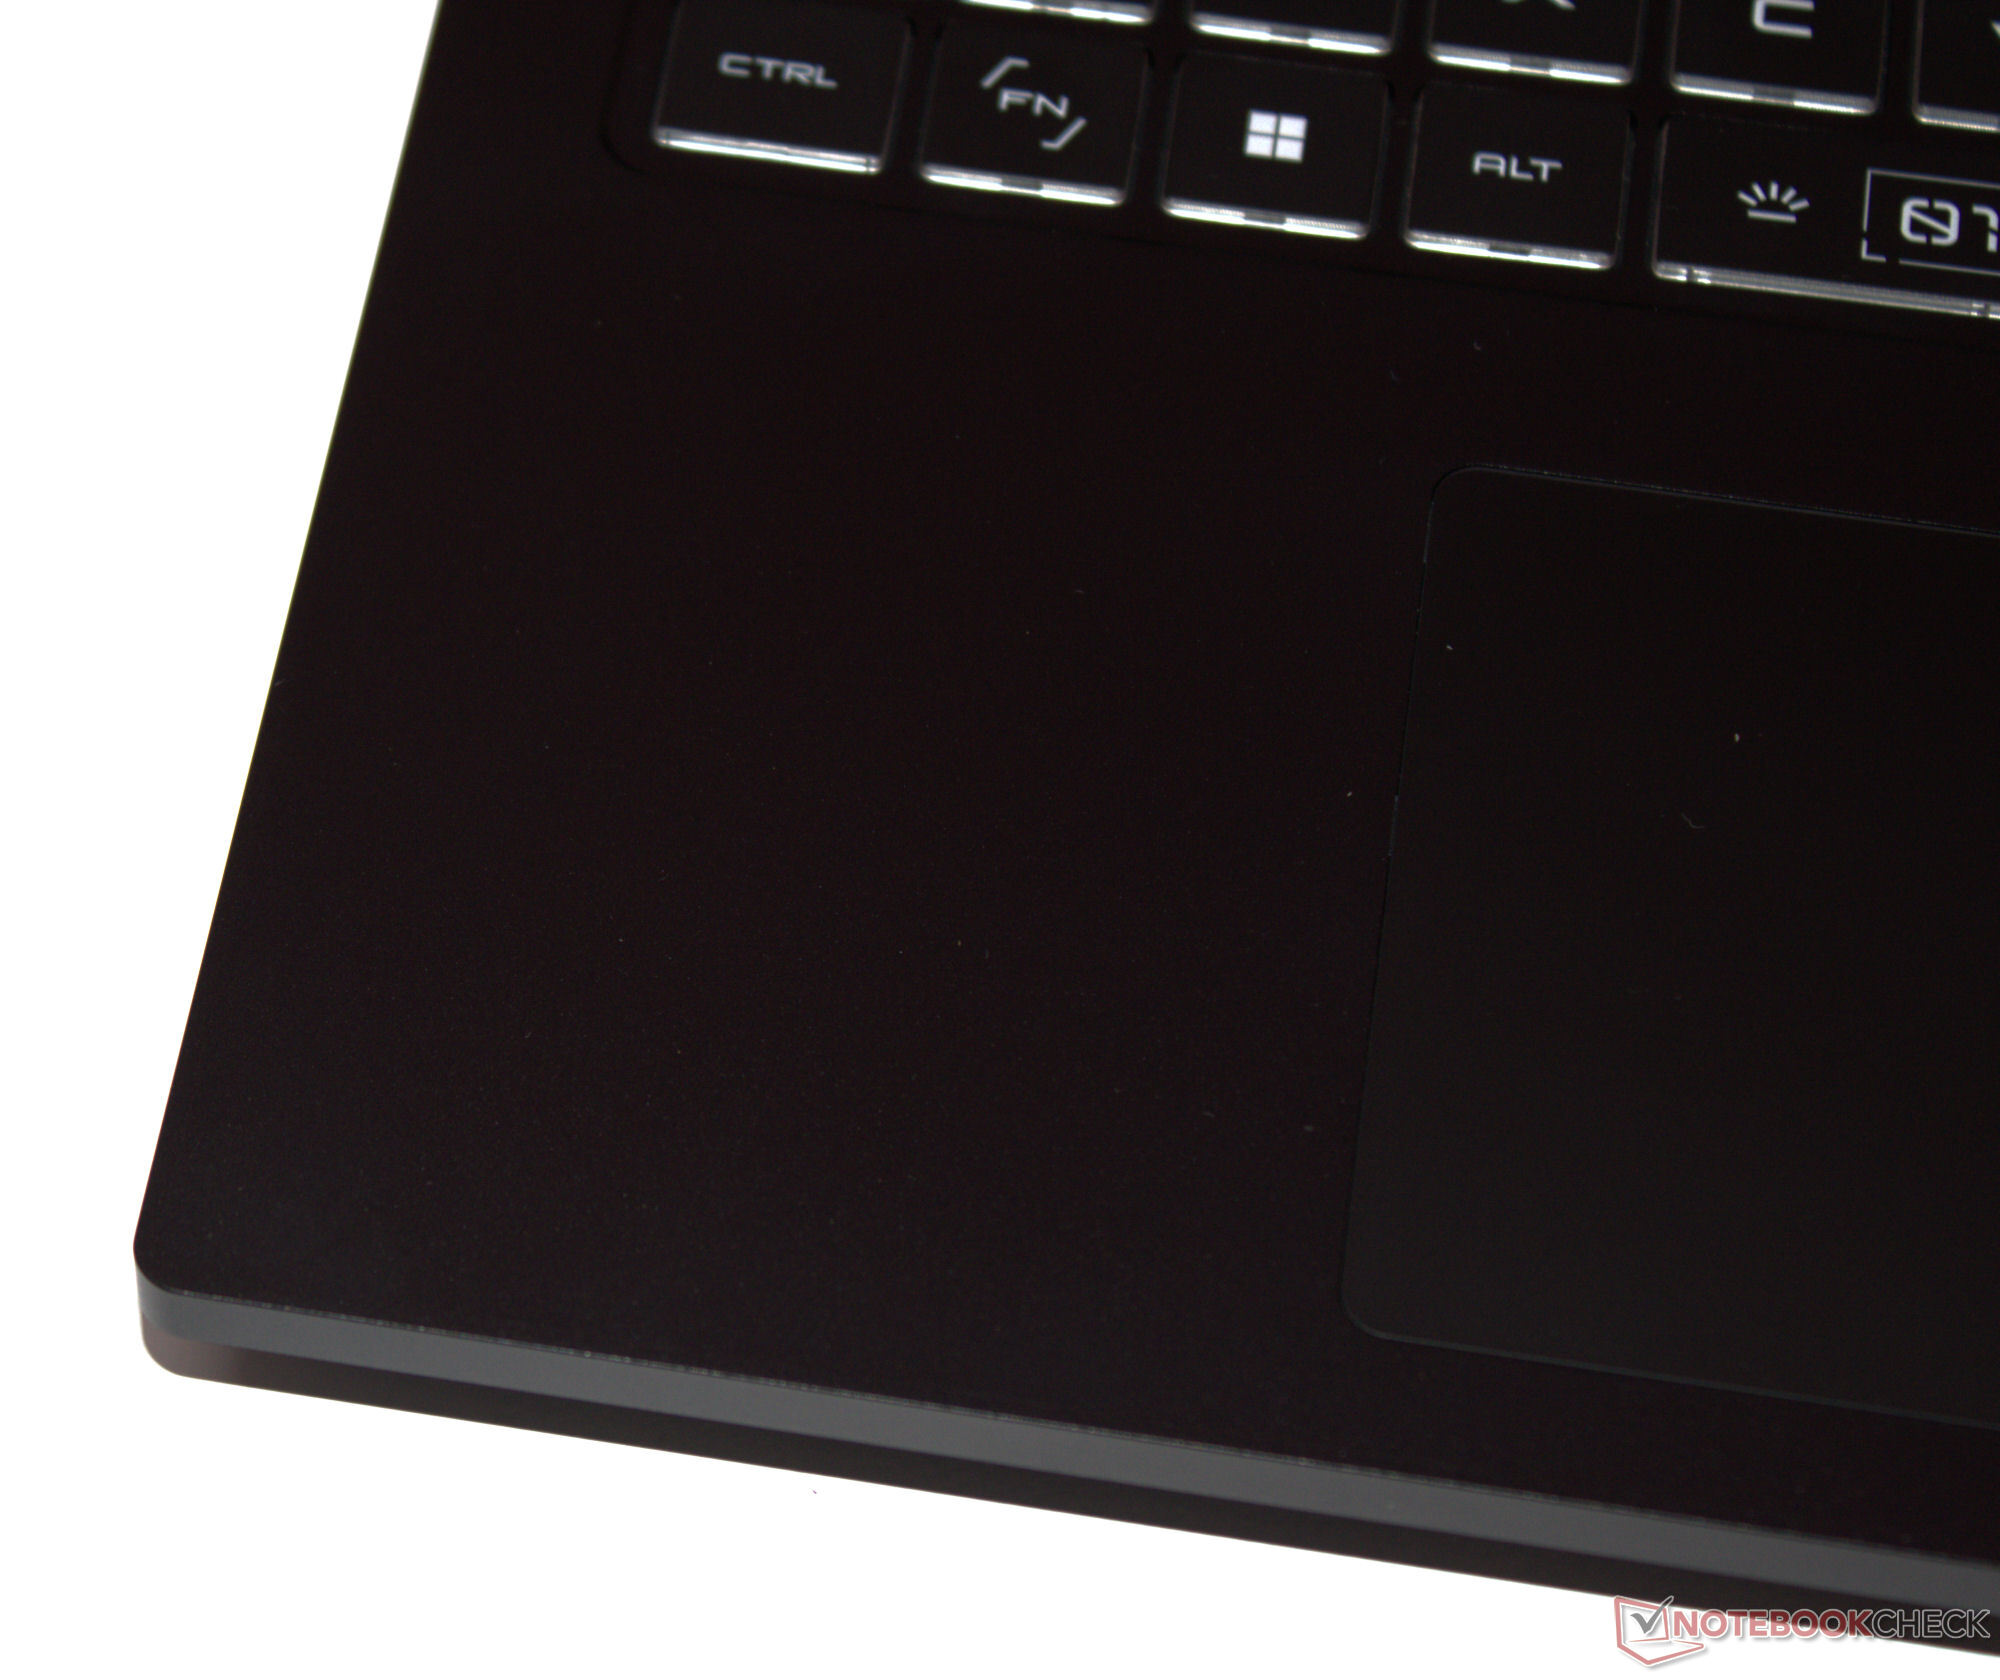
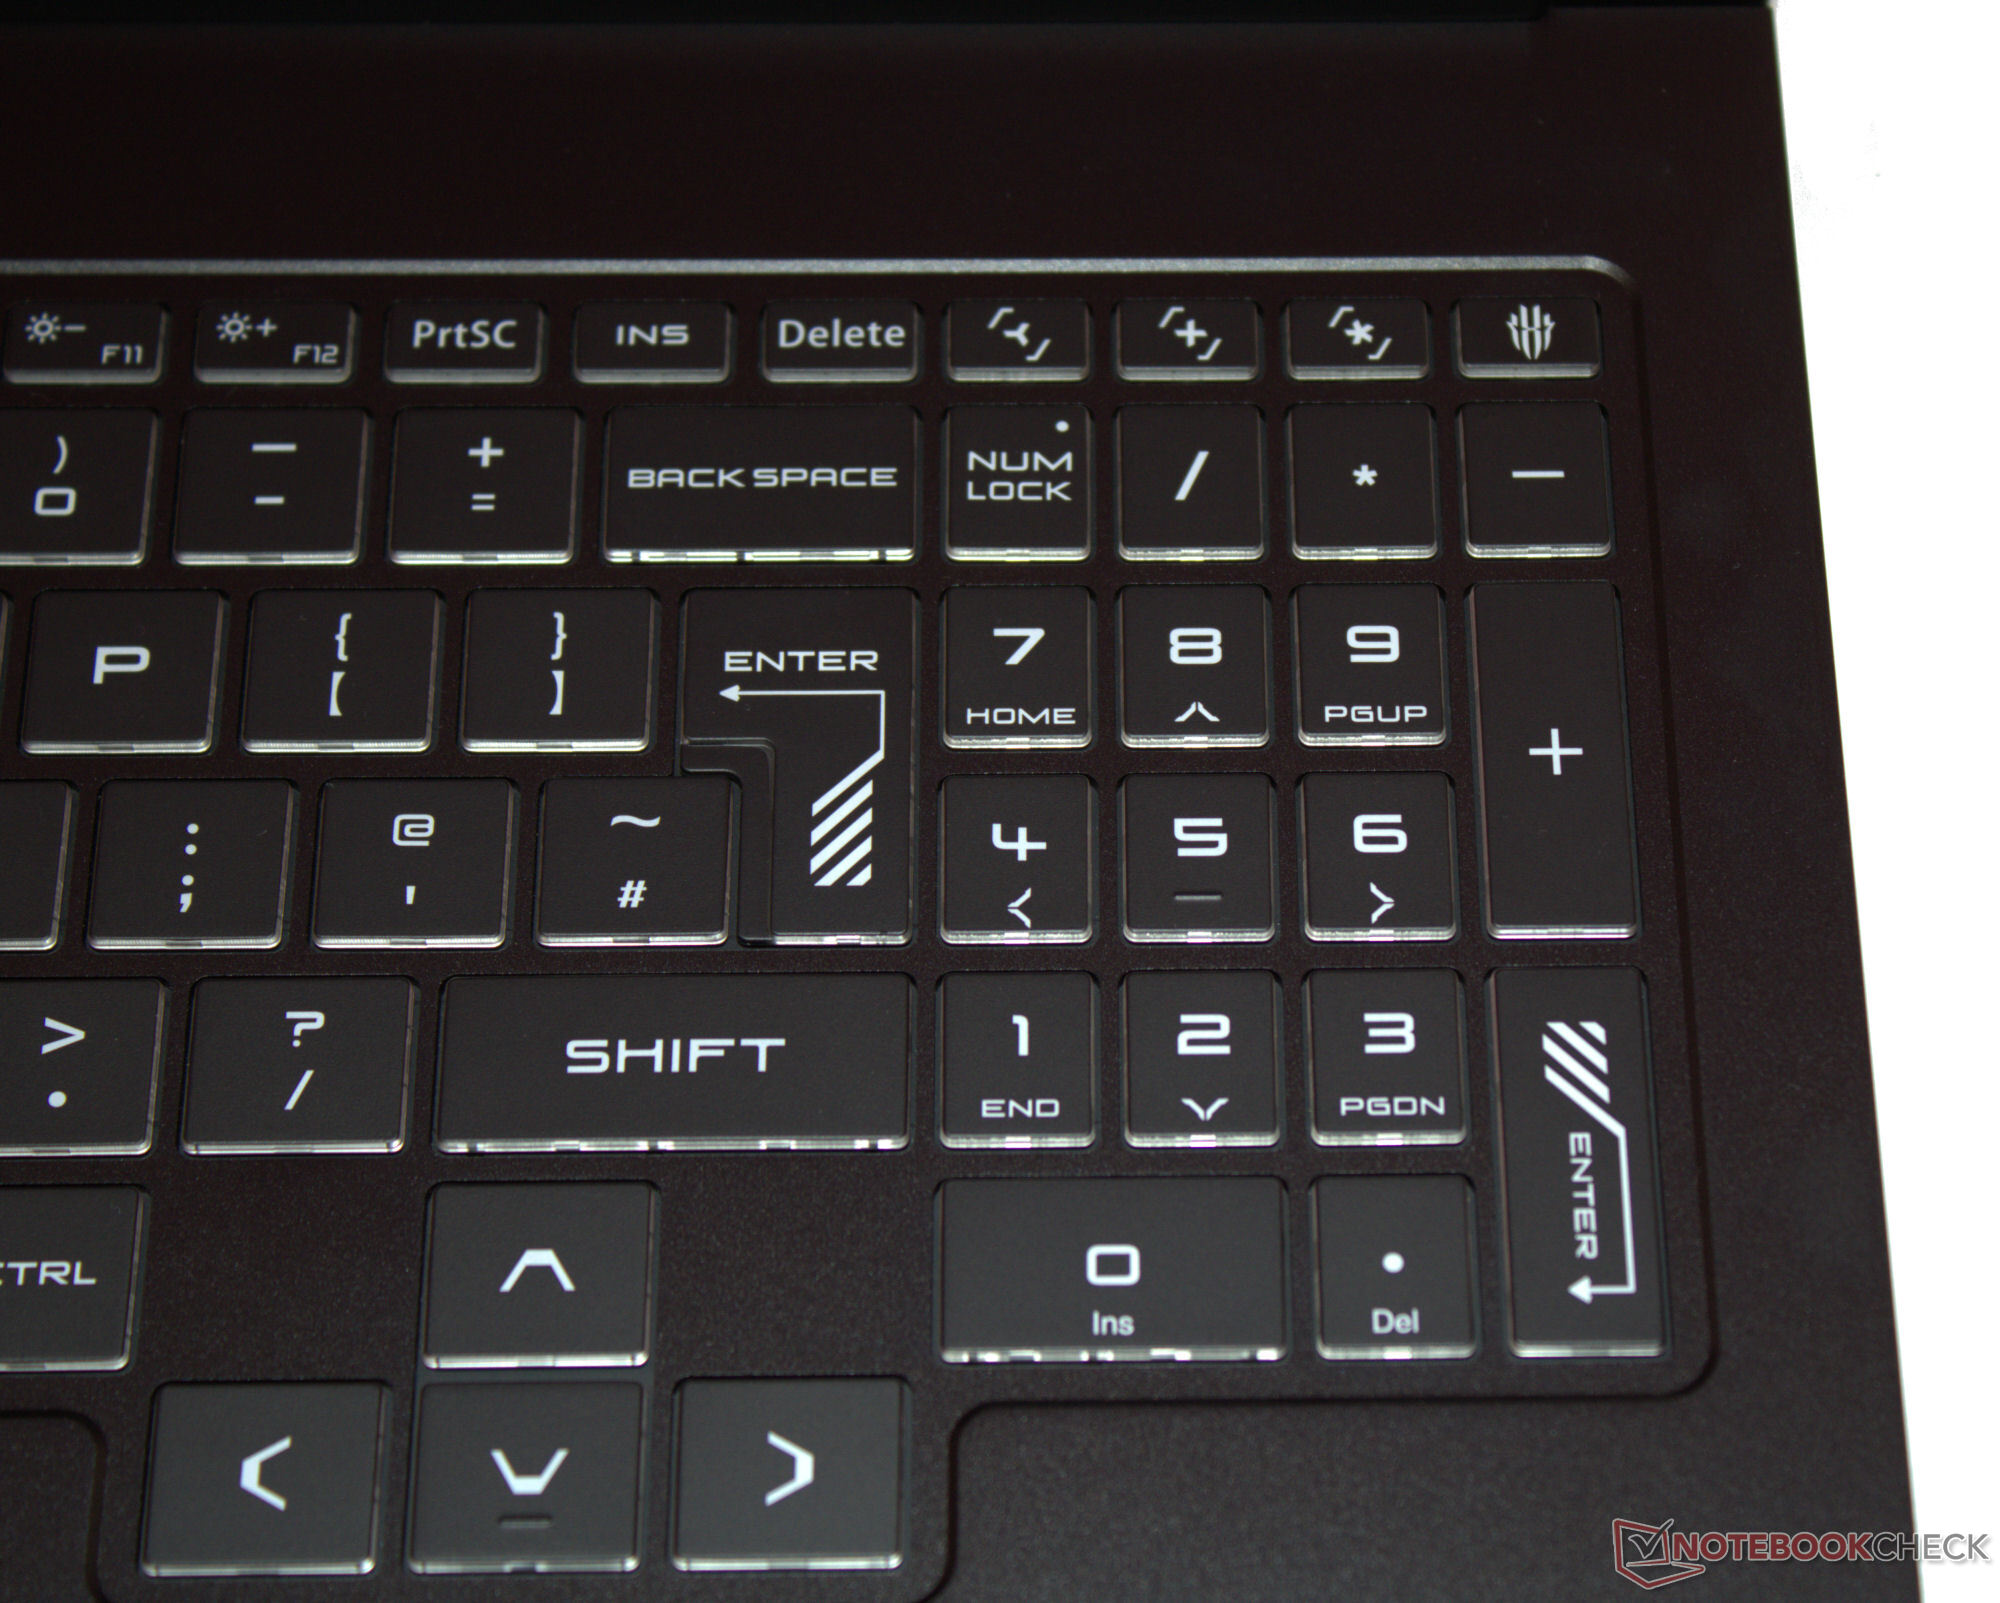
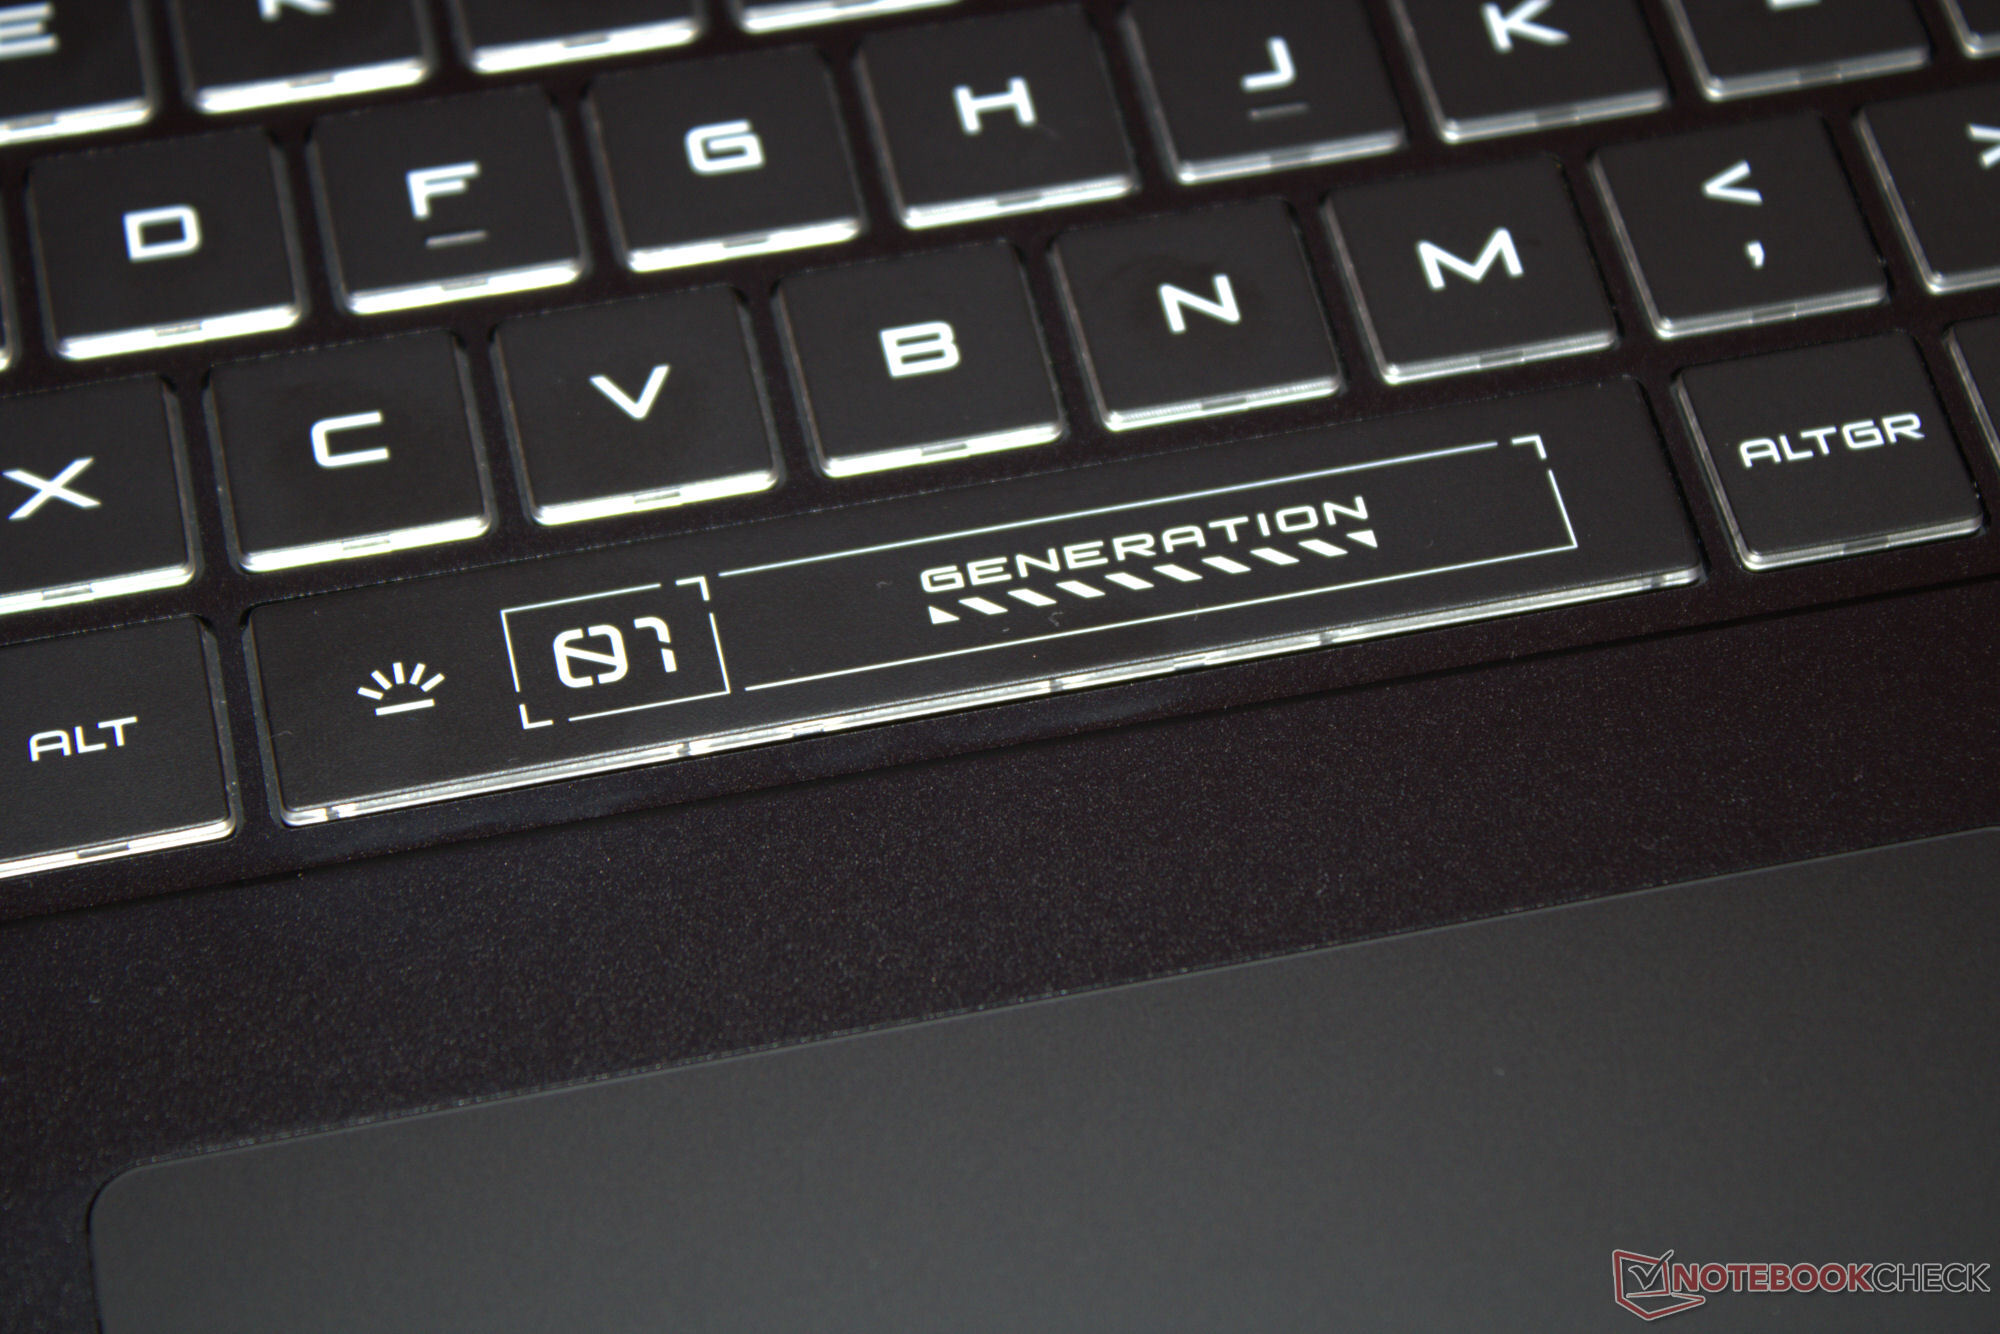
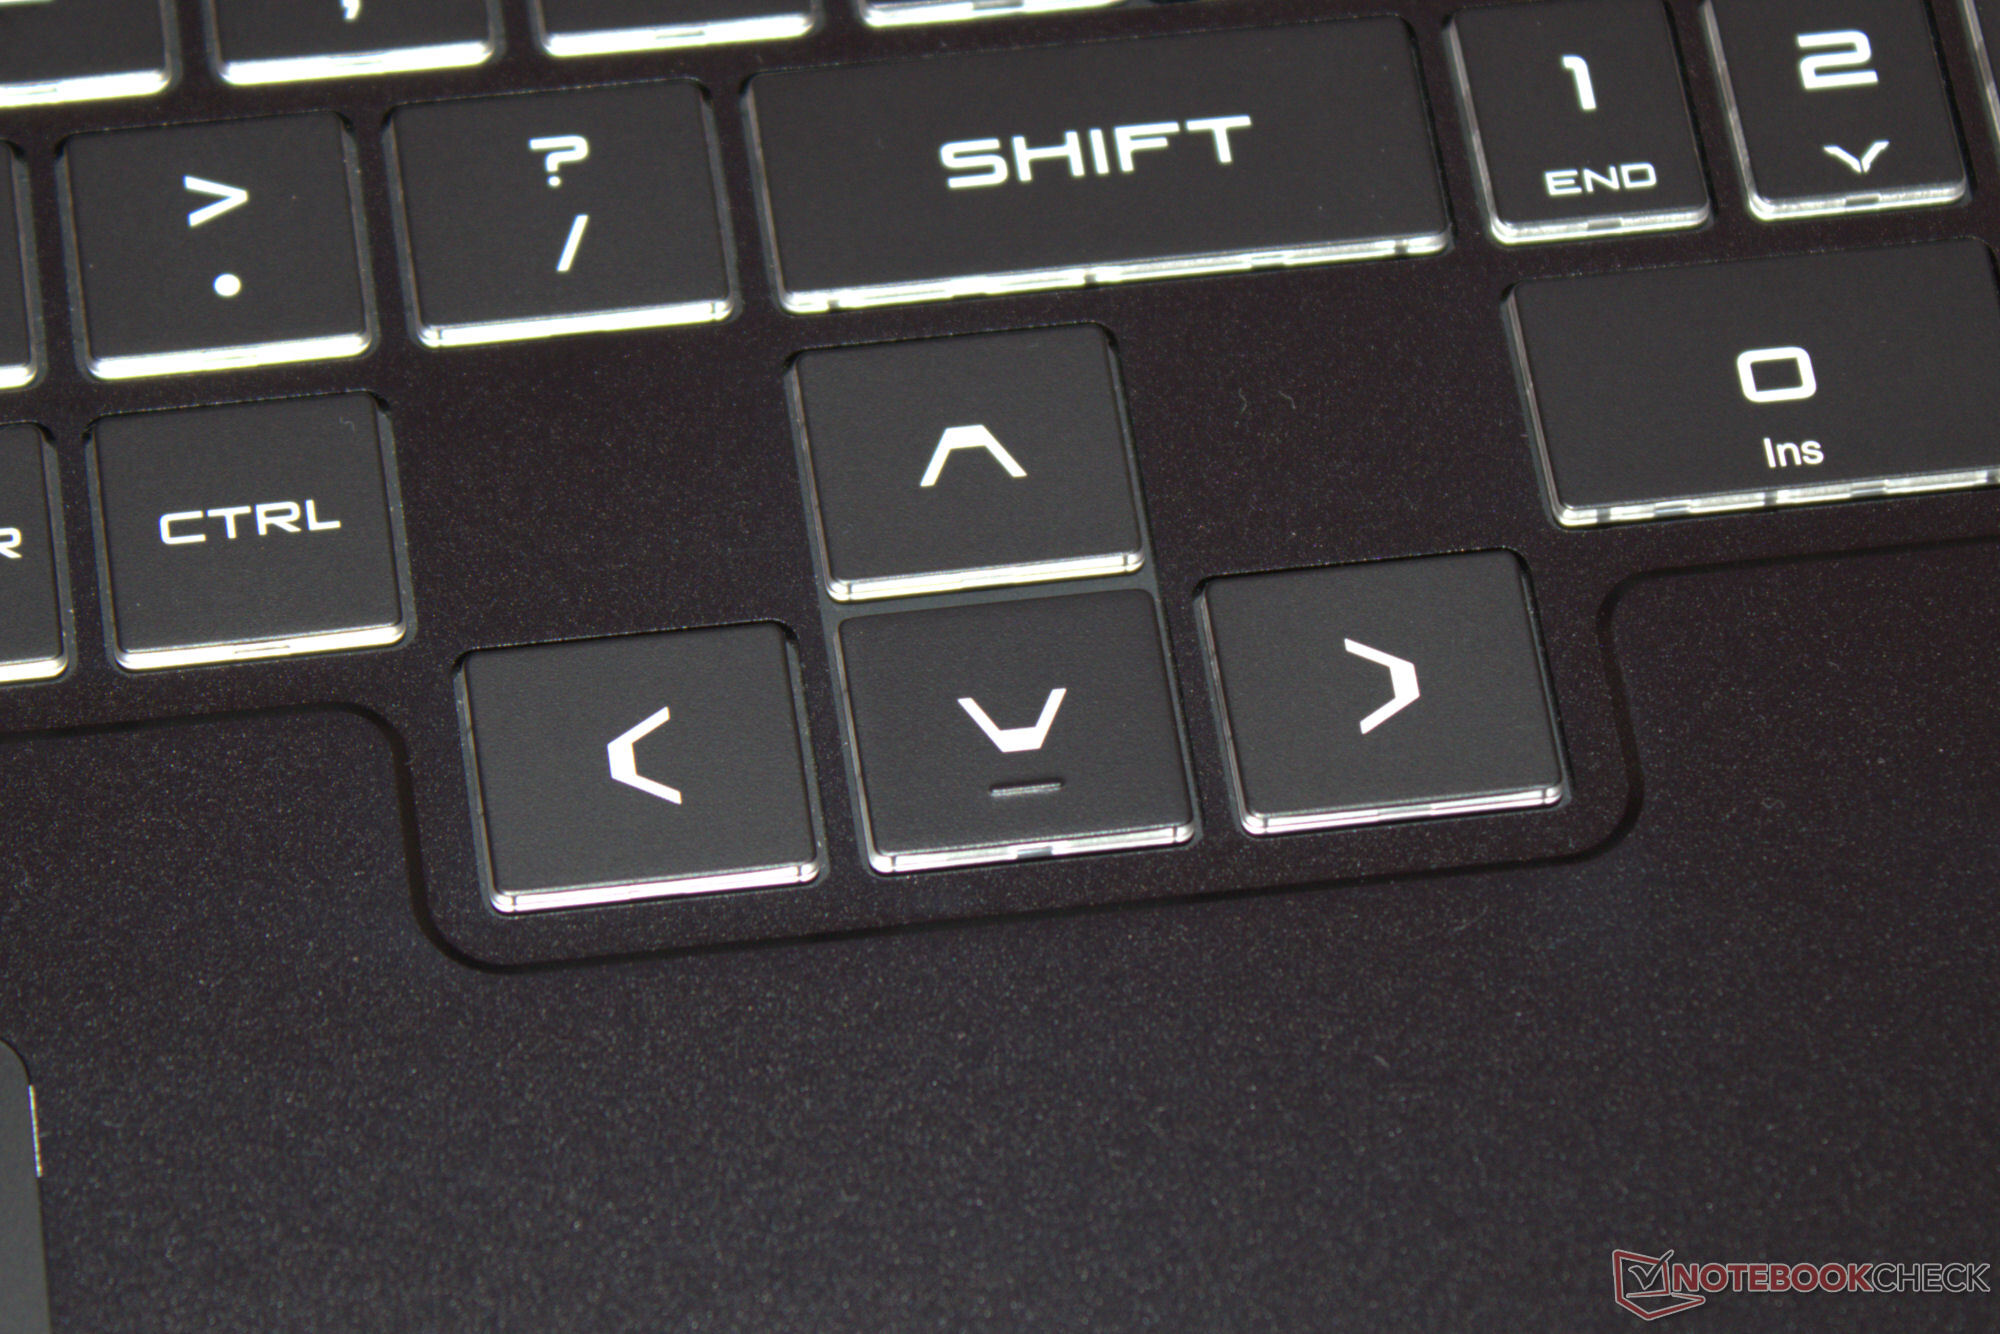
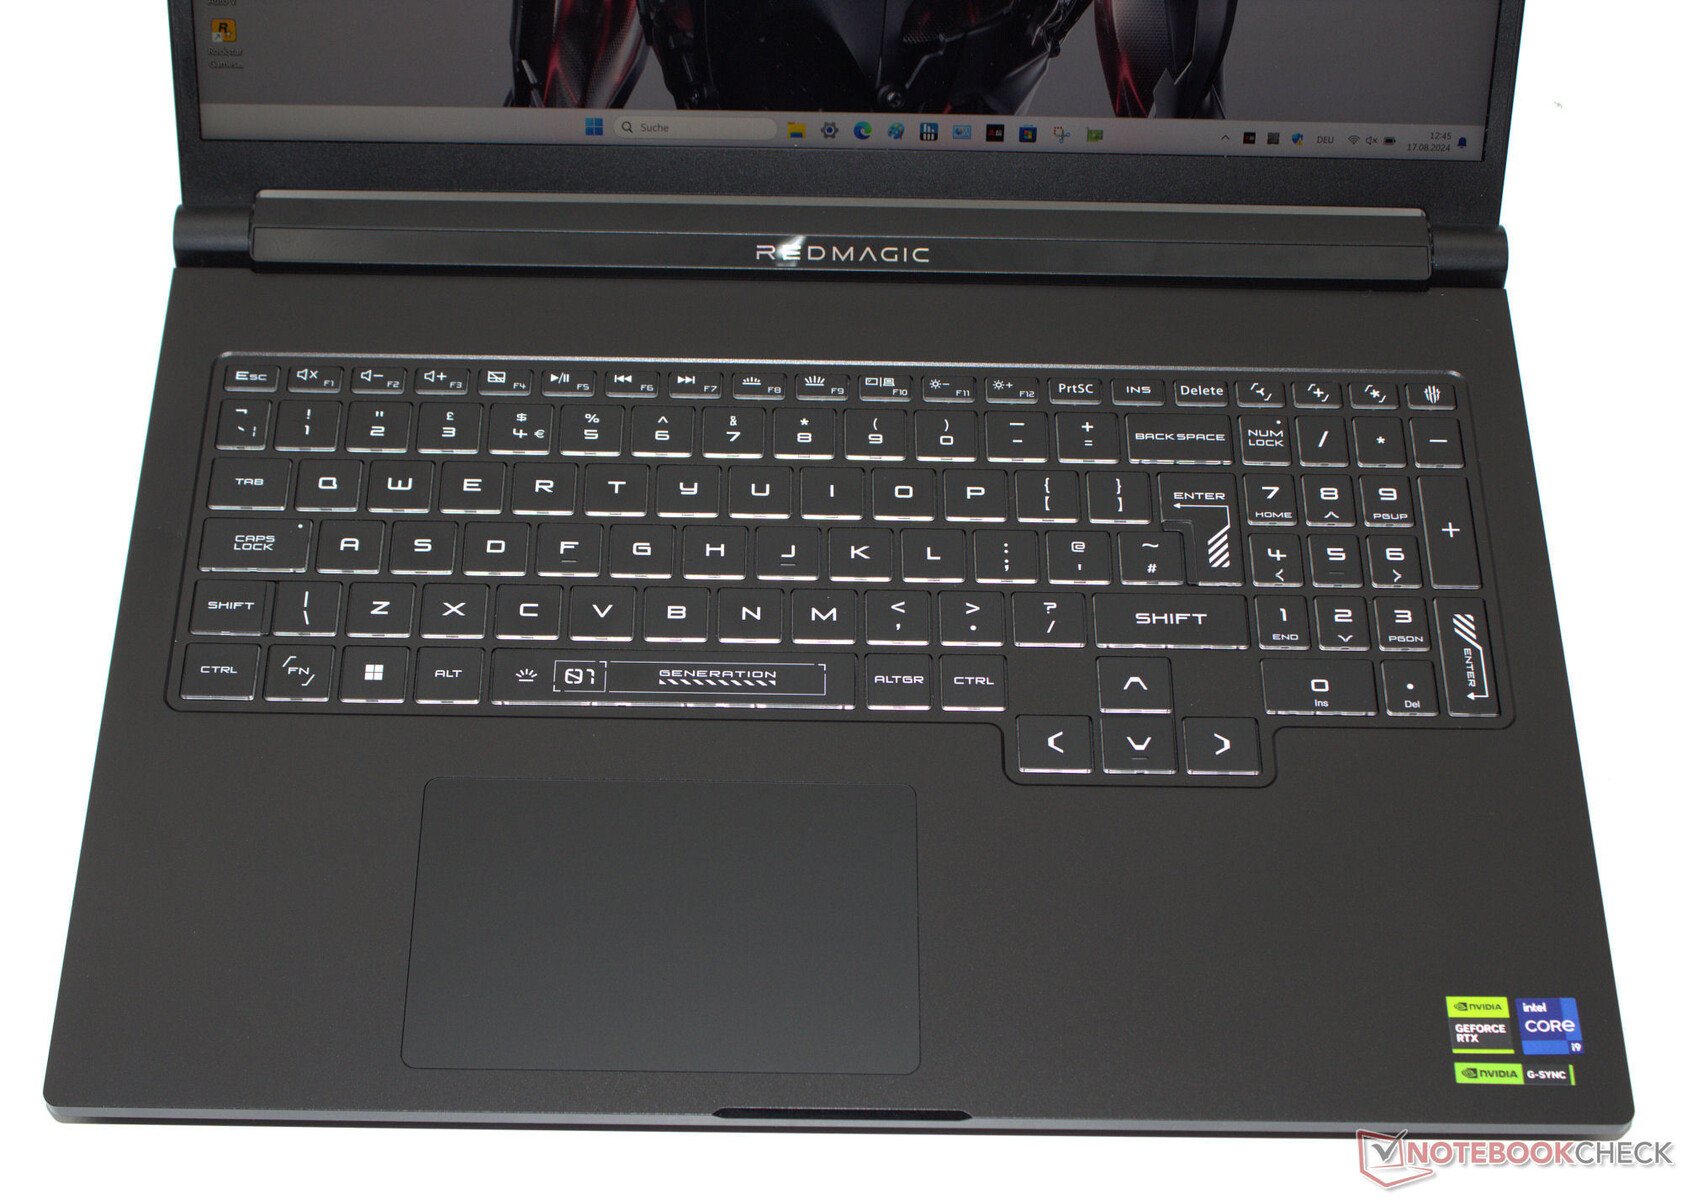
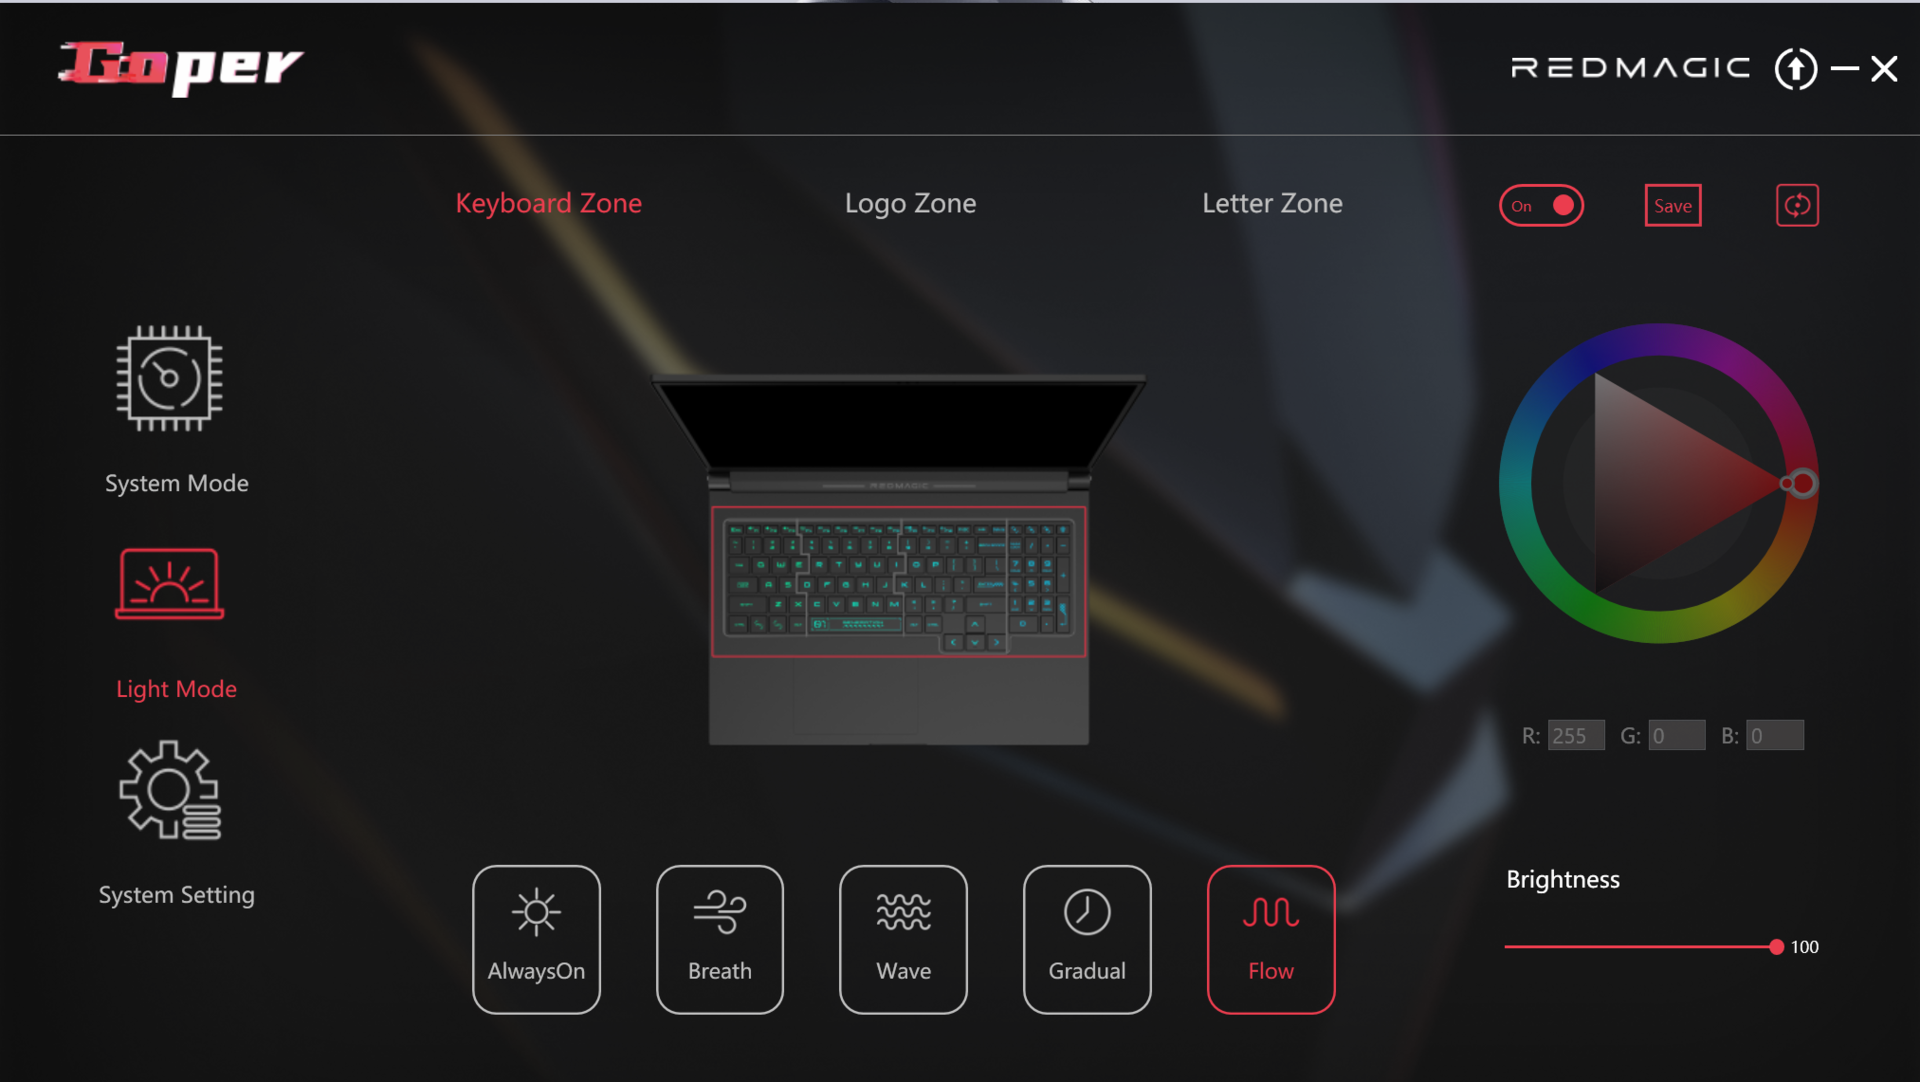
Nubia setzt auf eine Chiclet-Tastatur samt Nummernblock. Ihre eben gestalteten Tasten bieten einen kurzen Hub und einen deutlichen Druckpunkt. Während des Tippens gibt die Tastatur nicht nach. Gut: Die abgesetzten Pfeiltasten liegen in normaler Größe vor. Die RGB-Beleuchtung ist in vier Zonen unterteilt. Das Testgerät verfügt über ein QWERTY-Tastenlayout. Ob lokalisierte Layouts zu haben sind, können wir nicht sagen.
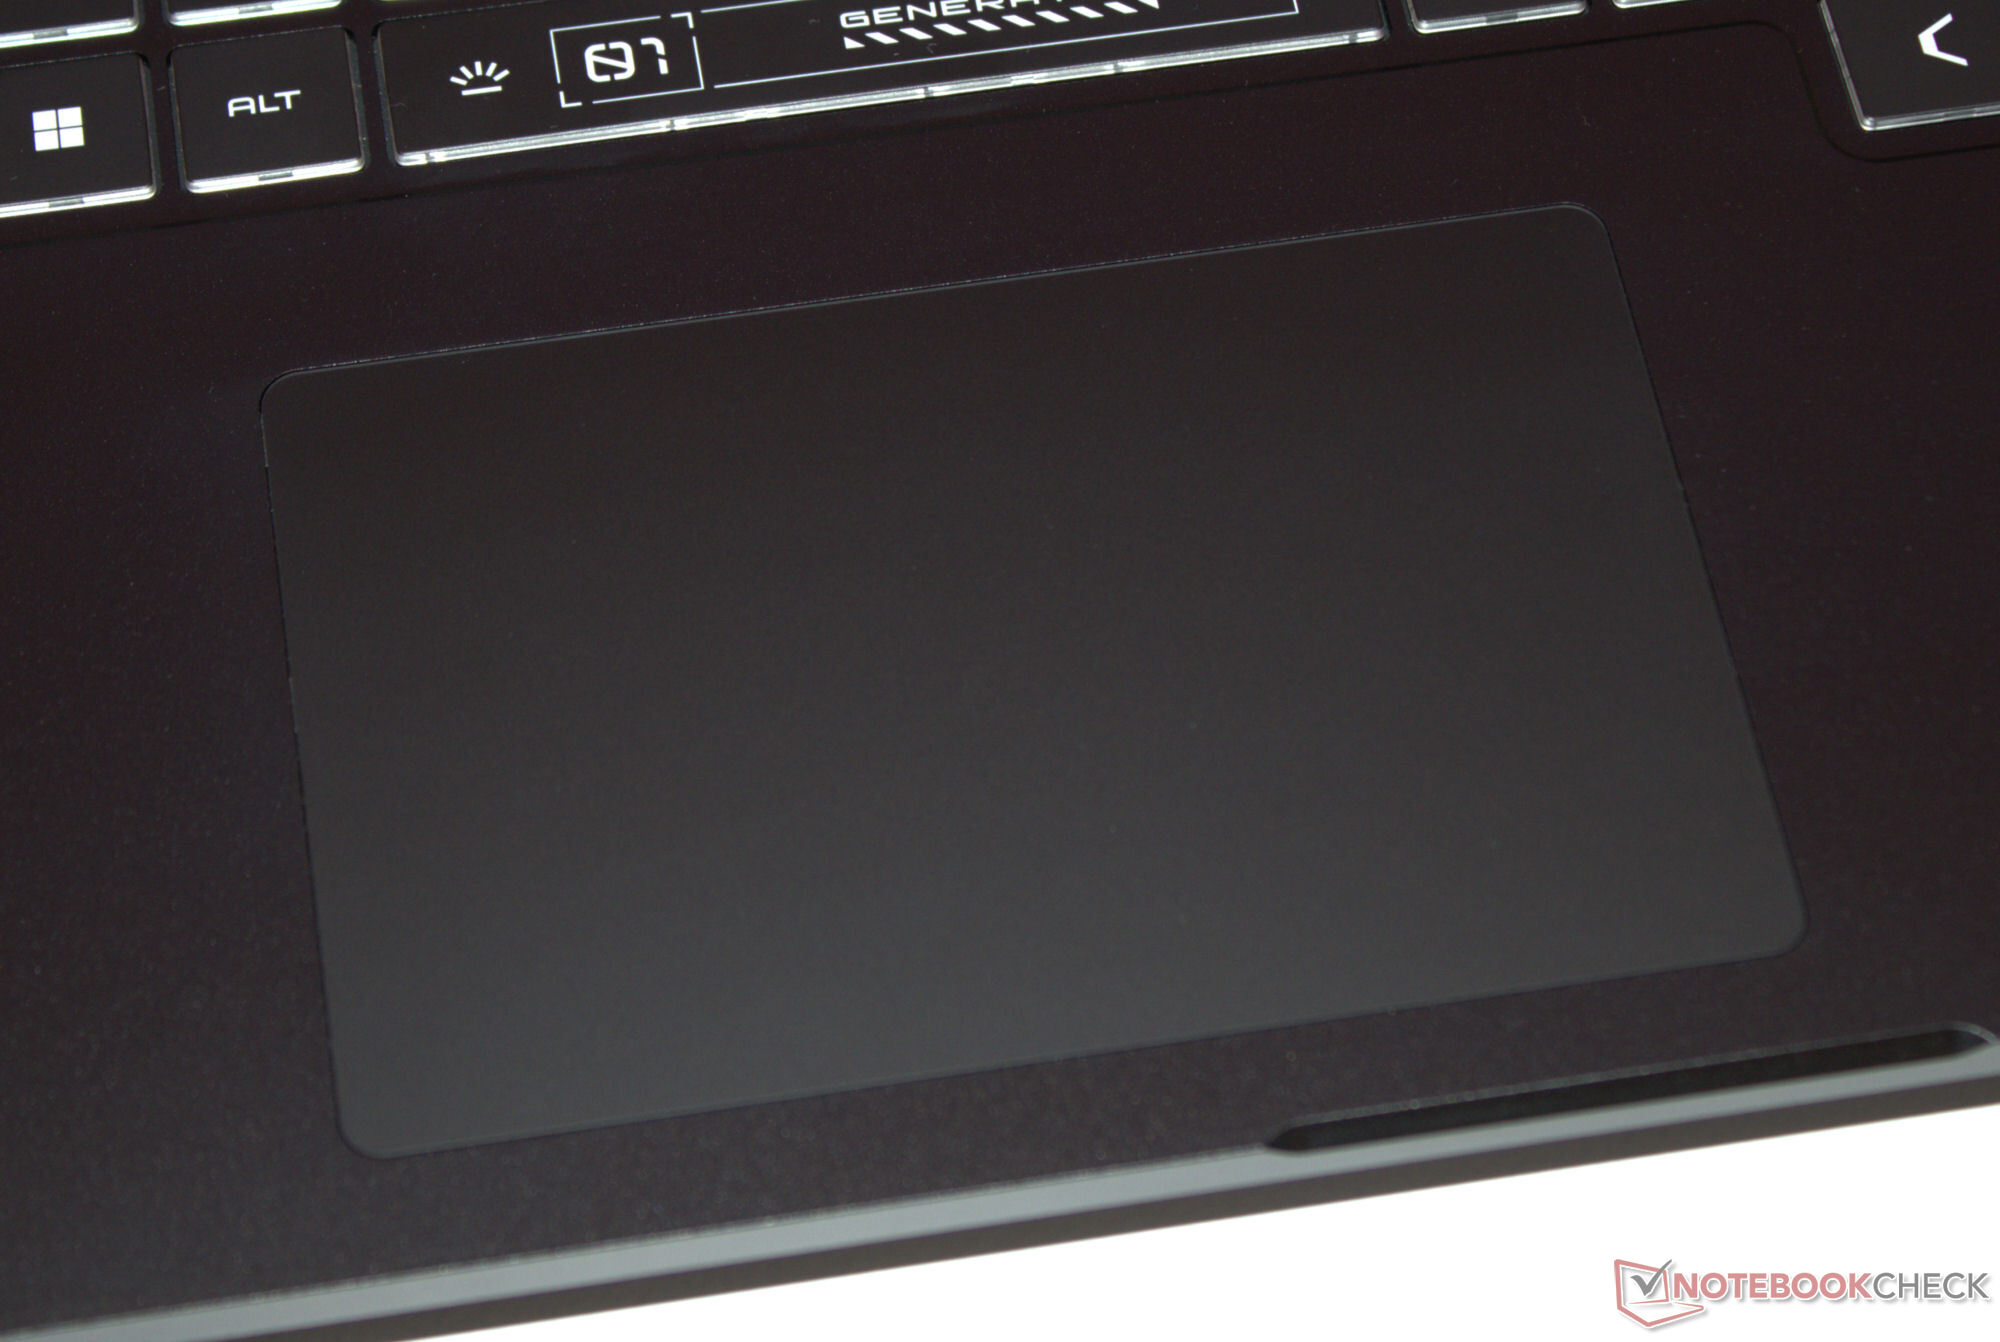
Touchpad
Als Mausersatz dient ein Multitouch-Clickpad (ca. 11,7 x 7,5 ) mit Glasoberfläche. Es verfügt über einen kurzen Hub und einen klaren Druckpunkt. Bei Bedarf kann das Pad deaktiviert werden.
Display - IPS-Panel mit DCI-P3-Abdeckung
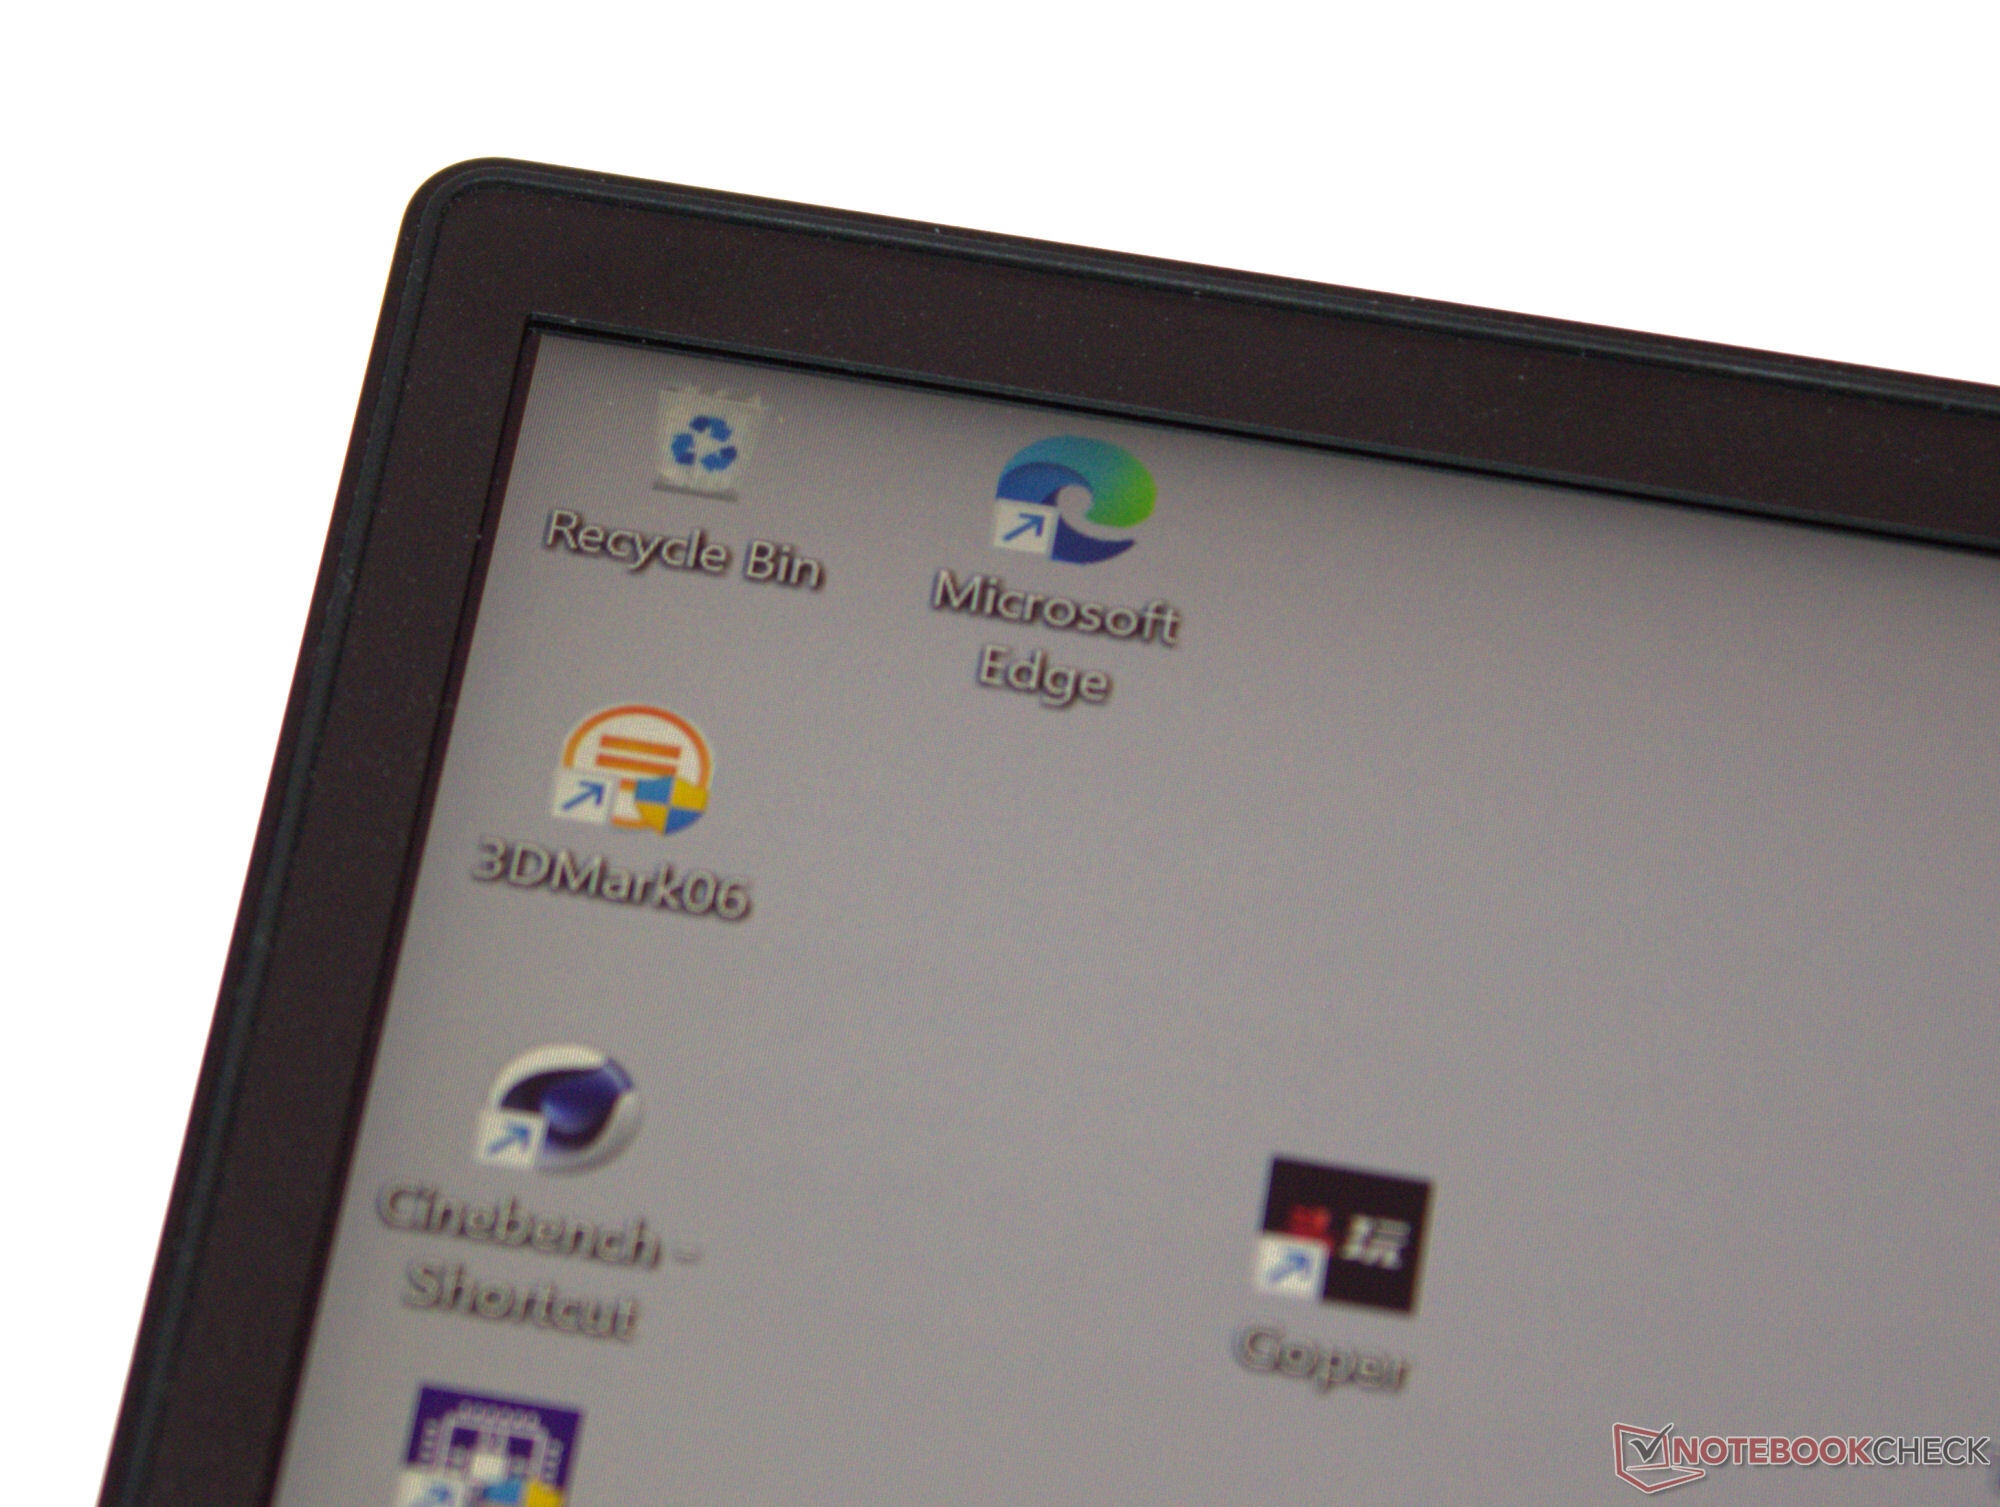
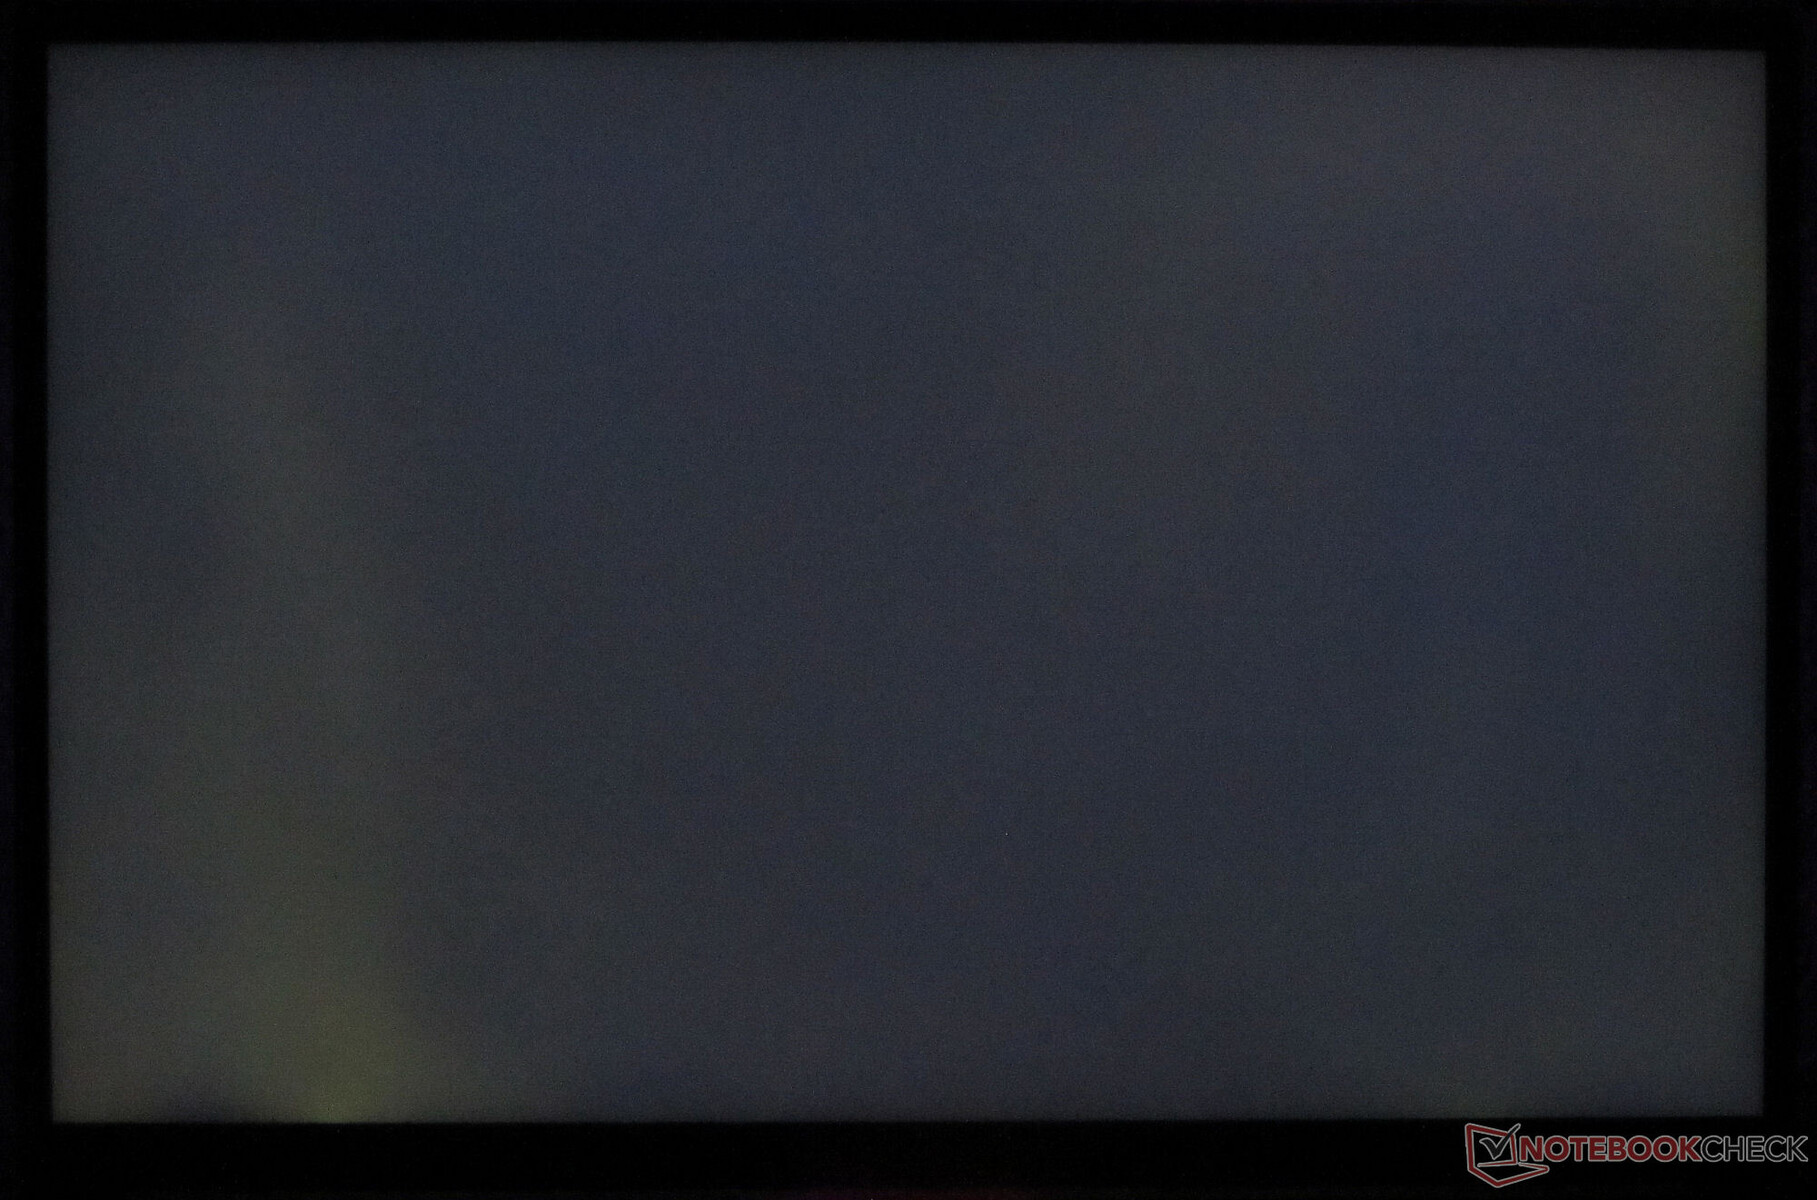
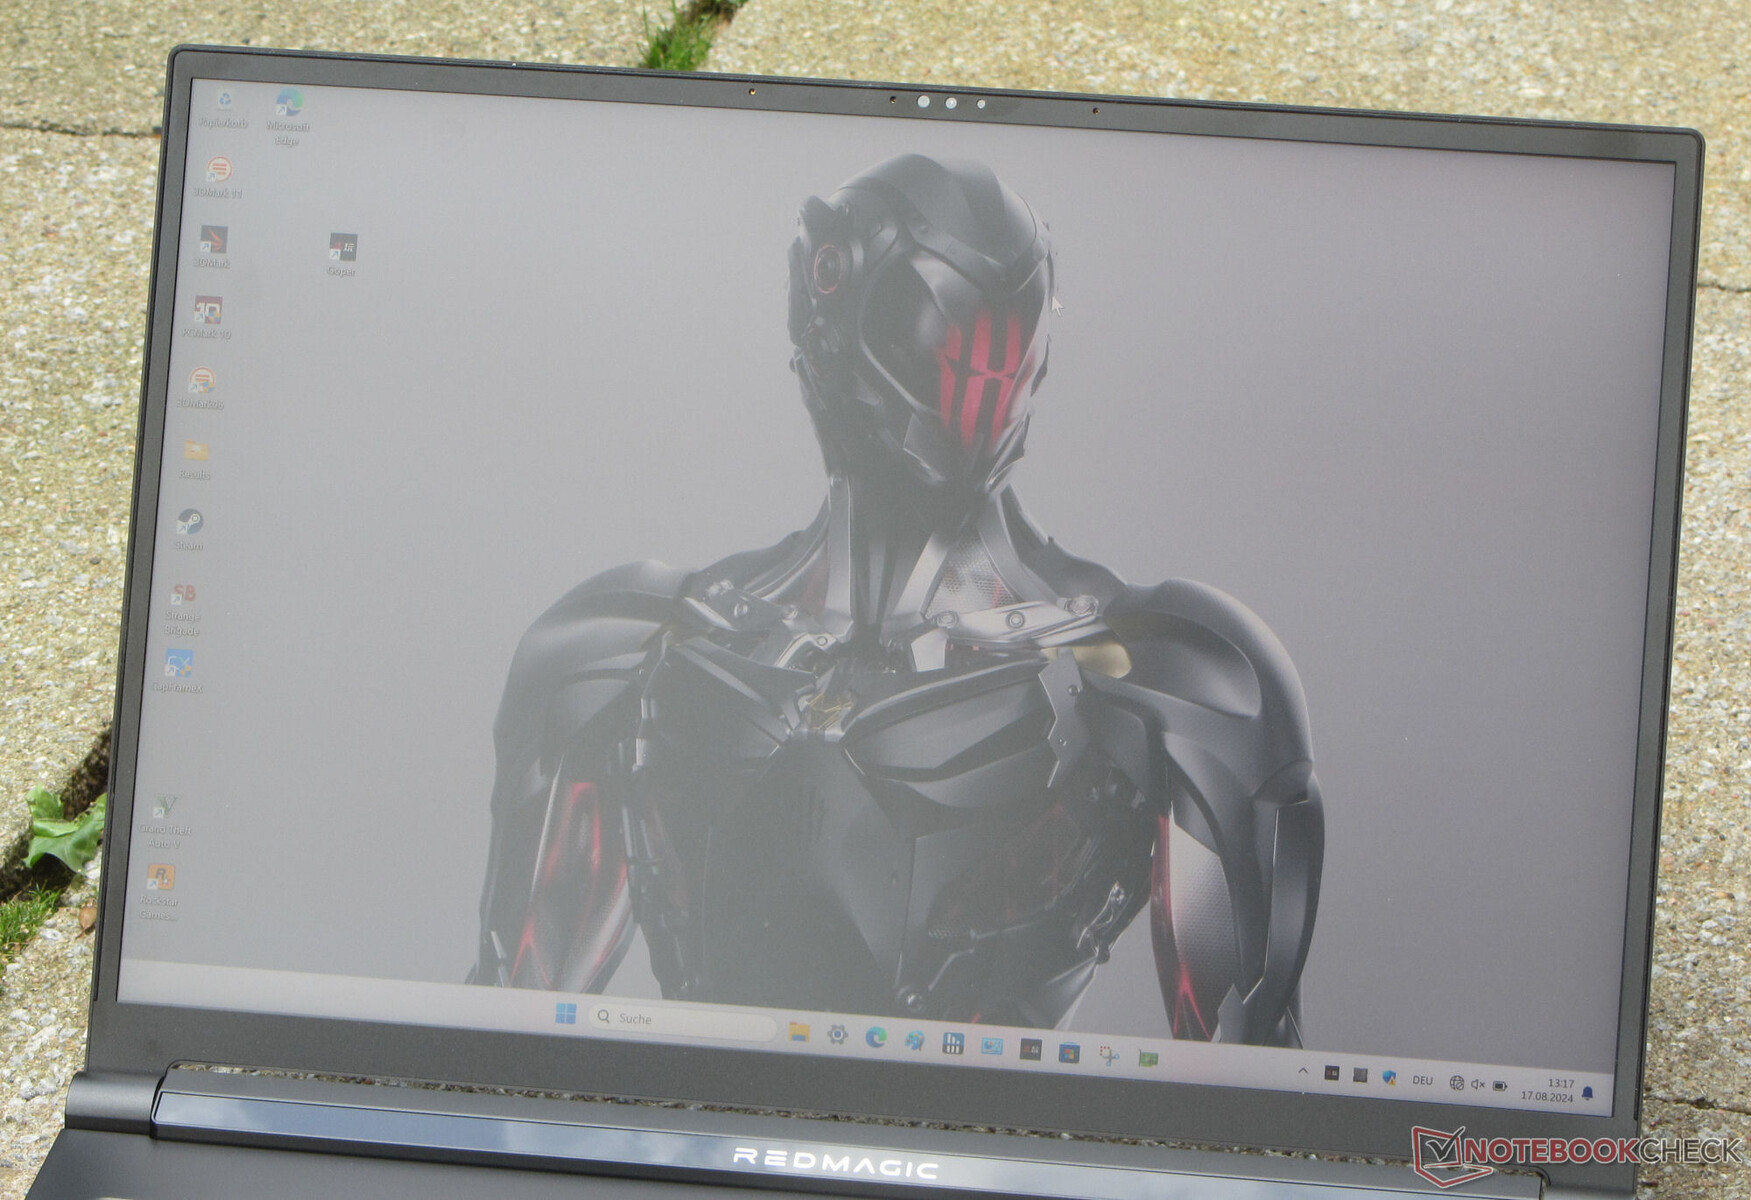
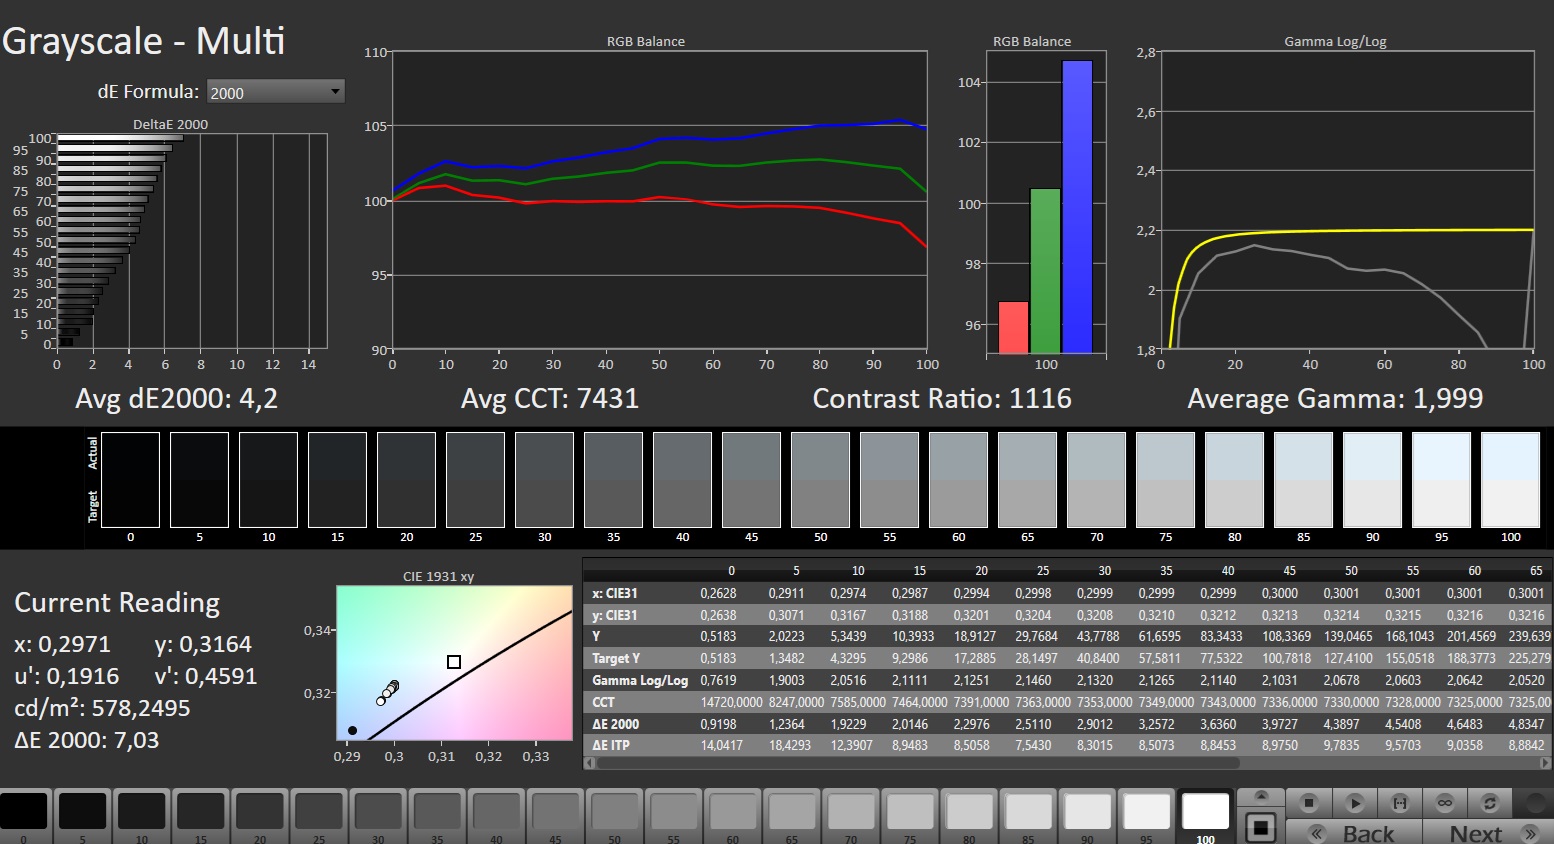
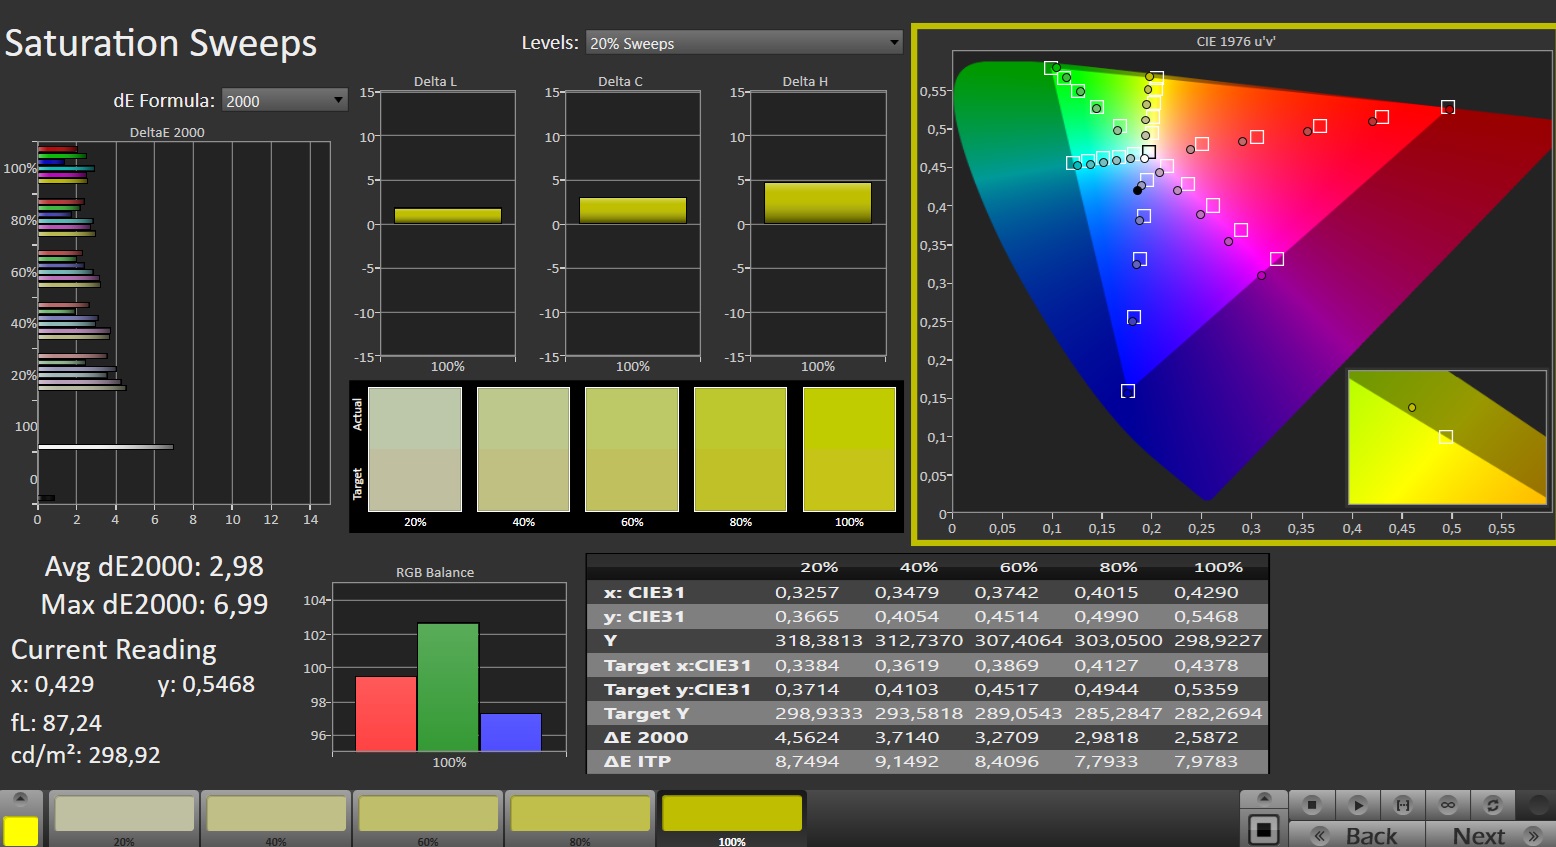
Das arbeitsfreundliche 16:10-Seitenverhältnis hat sich wohl durchgesetzt, die meisten Notebooks des Vergleichsfeldes haben entsprechende Bildschirme an Bord - so auch das Titan. Nubia spendiert dem Rechner ein mattes, blickwinkelstabiles IPS-Display (2.560 x 1.600 Pixel) mit einer Diagonale von 16 Zoll. Das Panel bietet eine große Leuchtkraft, der Kontrast erfüllt das Soll. Ein Ablesen des Bildschirms im Freien ist durchaus möglich. Gut: Das 240-Hz-Panel zeigt kein PWM-Flimmern und unterstützt G-Sync. Alternative Displays sind nicht verfügbar.

| |||||||||||||||||||||||||
Ausleuchtung: 86 %
Helligkeit Akku: 543 cd/m²
Kontrast: 1065:1 (Schwarzwert: 0.51 cd/m²)
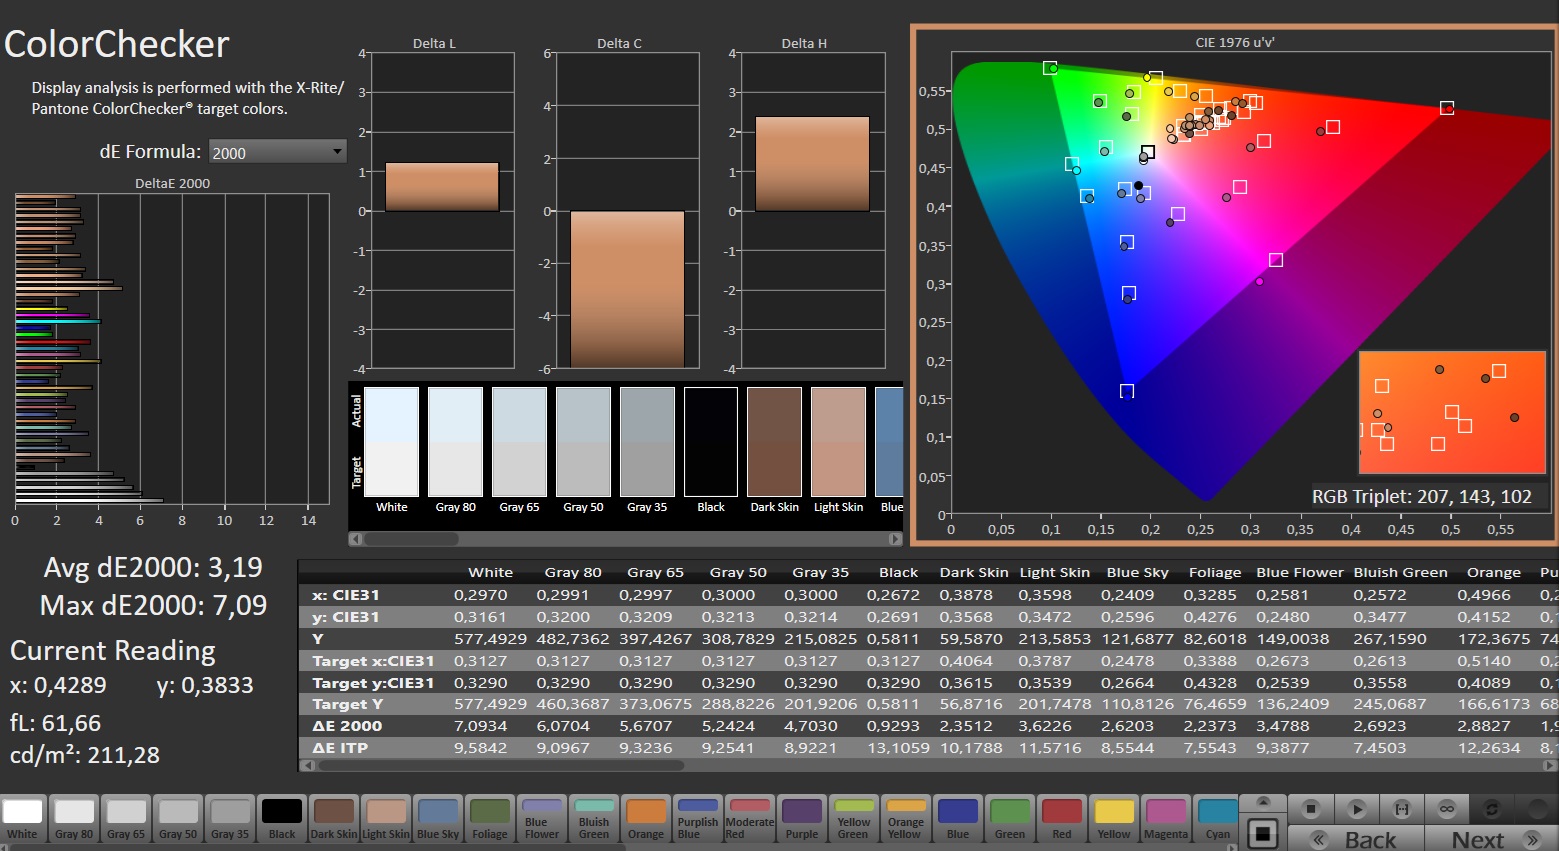
ΔE ColorChecker Calman: 3.19 | ∀{0.5-29.43 Ø4.78}
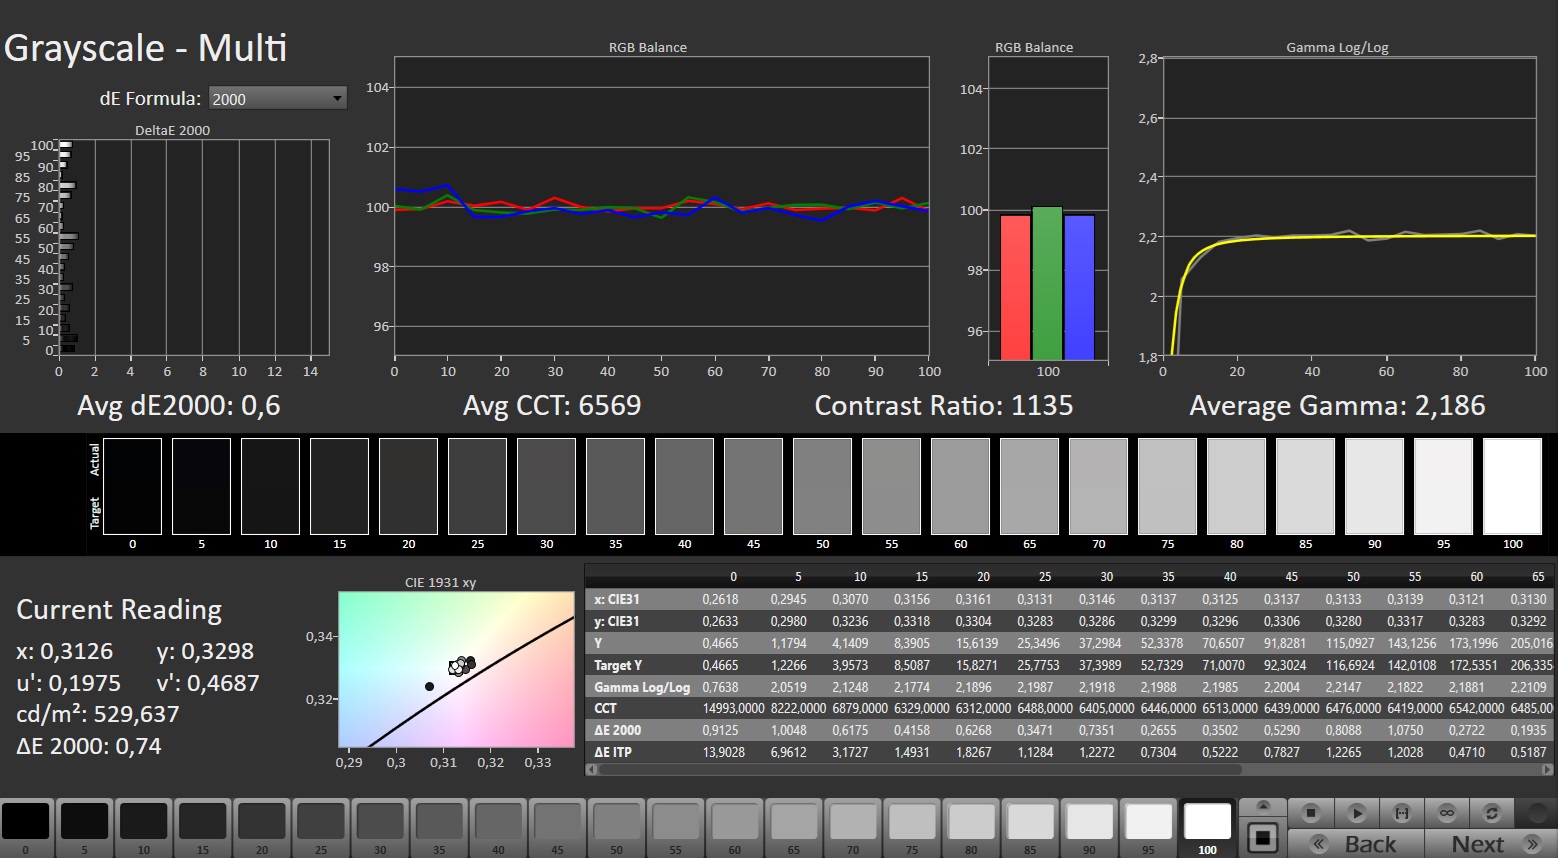
calibrated: 0.69
ΔE Greyscale Calman: 4.2 | ∀{0.09-98 Ø5}
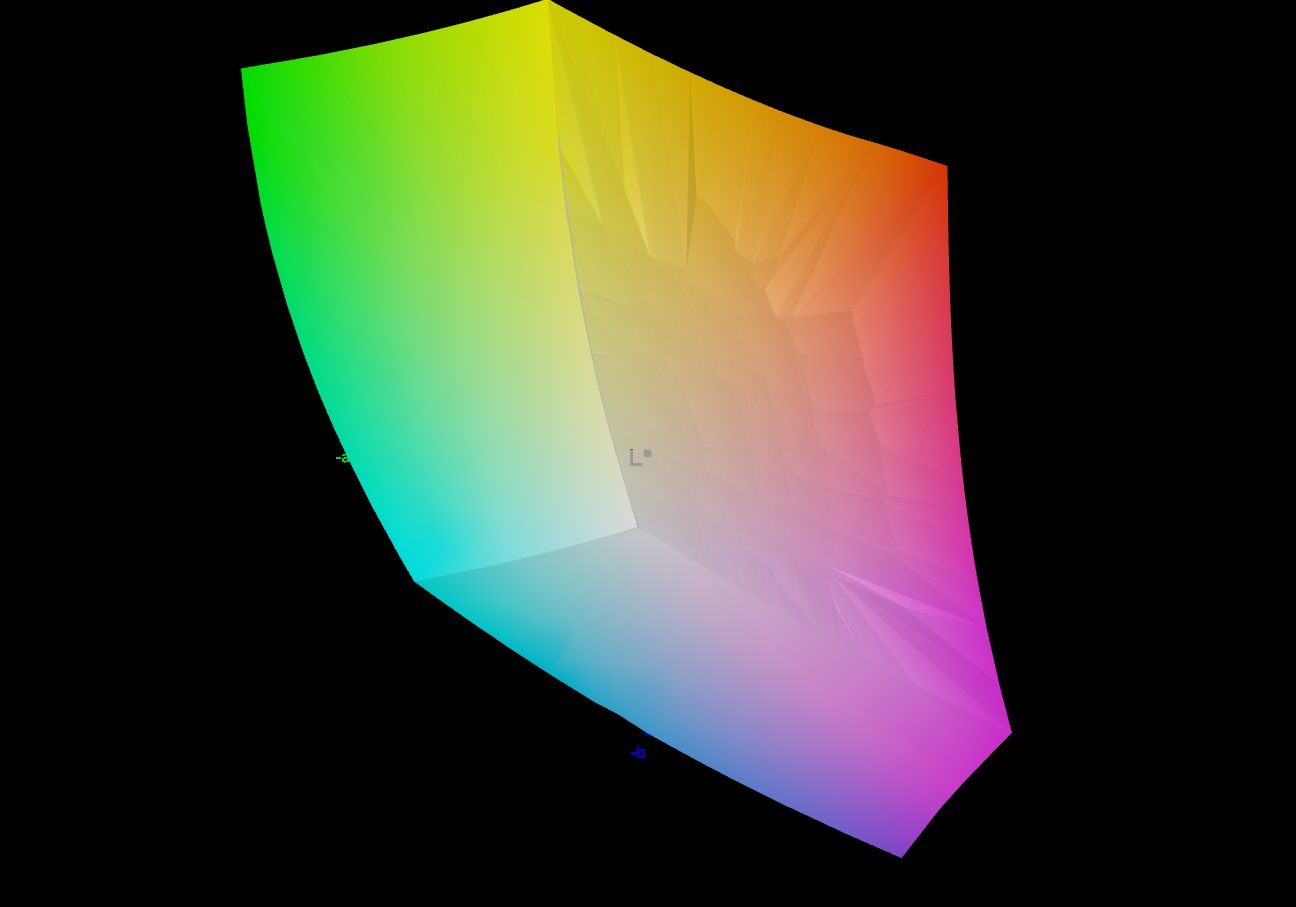
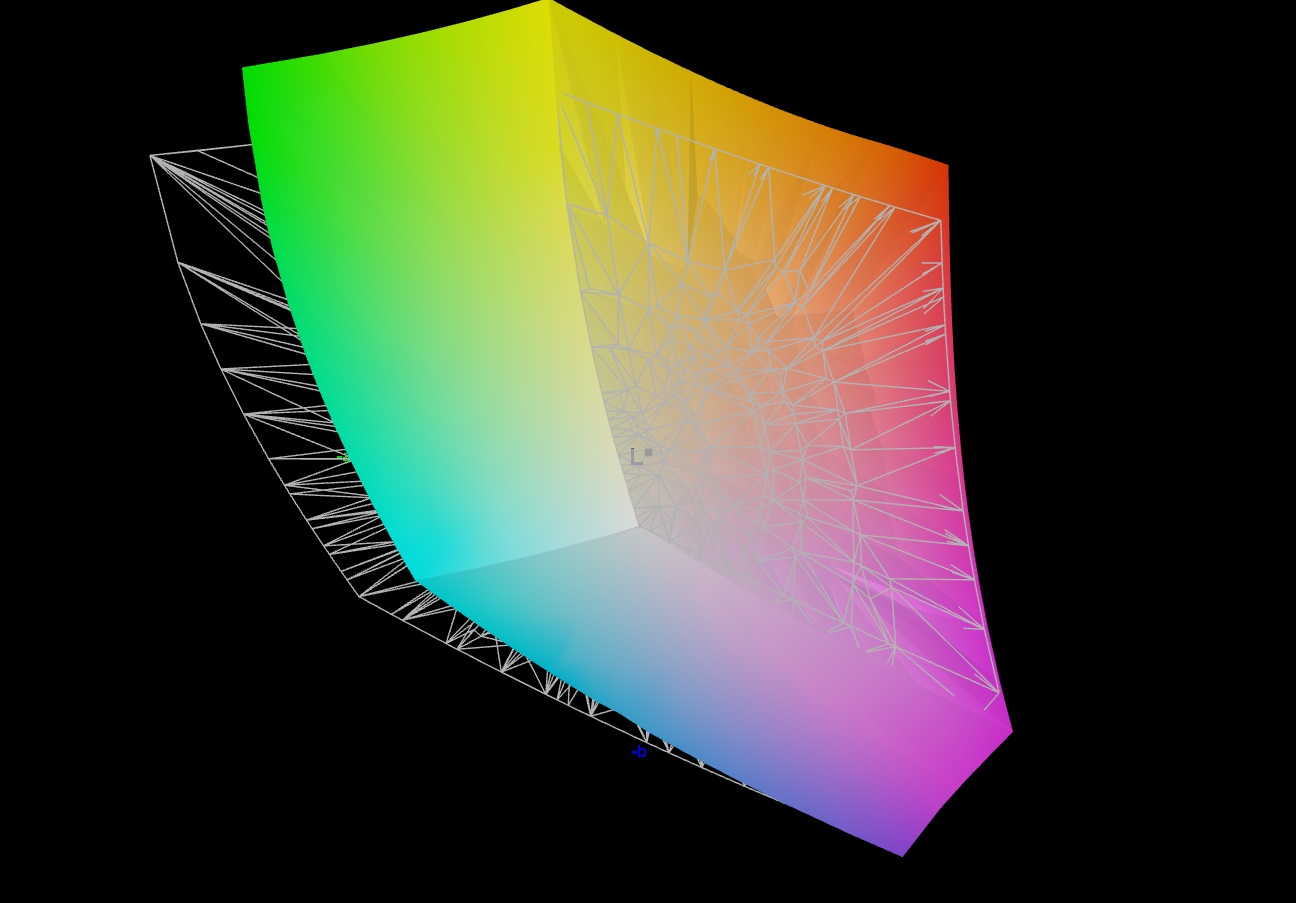
84.1% AdobeRGB 1998 (Argyll 3D)
100% sRGB (Argyll 3D)
96.3% Display P3 (Argyll 3D)
Gamma: 1.999
CCT: 7431 K
| Nubia RedMagic Titan 16 Pro BOE CQ NE160QDM-NZ2, IPS, 2560x1600, 16", 240 Hz | Lenovo Legion Pro 5 16IRX9 G9 BOE NE160QDM-NZB, IPS, 2560x1600, 16", 240 Hz | HP Victus 16 (2024) Chi Mei CMN163E, IPS, 1920x1080, 16.1", 144 Hz | Acer Predator Helios Neo 16 (2024) Chi Mei N160GME-GTB, LED, 2560x1600, 16", 240 Hz | Schenker XMG Pro 16 Studio (Mid 24) BOE CQ NE160QDM-NZ1, IPS, 2560x1600, 16", 240 Hz | Gigabyte G6X 9KG (2024) BOE NE160WUM-NX6, IPS, 1920x1200, 16", 165 Hz | |
|---|---|---|---|---|---|---|
| Display | 2% | -48% | 1% | -15% | -48% | |
| Display P3 Coverage (%) | 96.3 | 99.22 3% | 41.3 -57% | 95.9 0% | 68.8 -29% | 41.8 -57% |
| sRGB Coverage (%) | 100 | 99.93 0% | 61.7 -38% | 99.8 0% | 99.5 0% | 62.4 -38% |
| AdobeRGB 1998 Coverage (%) | 84.1 | 87.81 4% | 42.7 -49% | 86.4 3% | 70.8 -16% | 43.3 -49% |
| Response Times | -54% | -454% | -52% | -126% | -635% | |
| Response Time Grey 50% / Grey 80% * (ms) | 3.9 ? | 4.8 ? -23% | 28.6 ? -633% | 5 ? -28% | 12.7 ? -226% | 40.5 ? -938% |
| Response Time Black / White * (ms) | 5 ? | 9.2 ? -84% | 18.7 ? -274% | 8.8 ? -76% | 6.3 ? -26% | 21.6 ? -332% |
| PWM Frequency (Hz) | ||||||
| Bildschirm | 4% | -74% | 18% | -2% | -68% | |
| Helligkeit Bildmitte (cd/m²) | 543 | 518 -5% | 287 -47% | 521 -4% | 416 -23% | 353 -35% |
| Brightness (cd/m²) | 516 | 491 -5% | 288 -44% | 506 -2% | 392 -24% | 318 -38% |
| Brightness Distribution (%) | 86 | 90 5% | 86 0% | 85 -1% | 86 0% | 81 -6% |
| Schwarzwert * (cd/m²) | 0.51 | 0.36 29% | 0.19 63% | 0.44 14% | 0.38 25% | 0.21 59% |
| Kontrast (:1) | 1065 | 1439 35% | 1511 42% | 1184 11% | 1095 3% | 1681 58% |
| Delta E Colorchecker * | 3.19 | 4.32 -35% | 5.46 -71% | 1.74 45% | 2.33 27% | 5.21 -63% |
| Colorchecker dE 2000 max. * | 7.09 | 6.37 10% | 20.36 -187% | 3.88 45% | 6.07 14% | 19.95 -181% |
| Colorchecker dE 2000 calibrated * | 0.69 | 0.75 -9% | 3.52 -410% | 0.52 25% | 1.02 -48% | 3.61 -423% |
| Delta E Graustufen * | 4.2 | 3.66 13% | 4.8 -14% | 3 29% | 3.7 12% | 3.6 14% |
| Gamma | 1.999 110% | 2.19 100% | 2.108 104% | 2.164 102% | 2.161 102% | 2.367 93% |
| CCT | 7431 87% | 6841 95% | 6442 101% | 6816 95% | 7102 92% | 7138 91% |
| Durchschnitt gesamt (Programm / Settings) | -16% /
-4% | -192% /
-123% | -11% /
4% | -48% /
-22% | -250% /
-145% |
* ... kleinere Werte sind besser
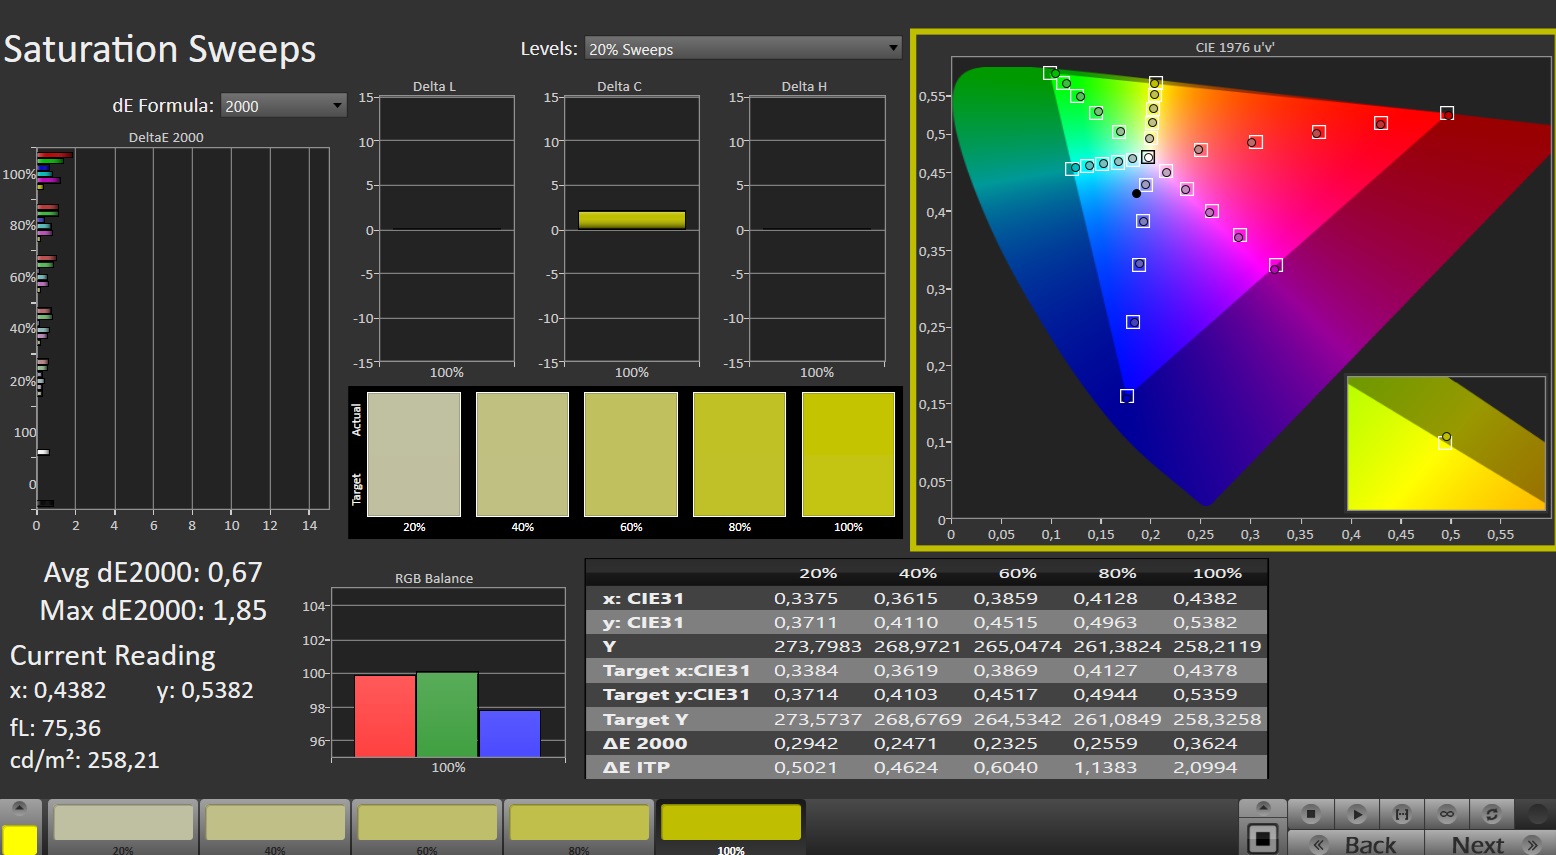
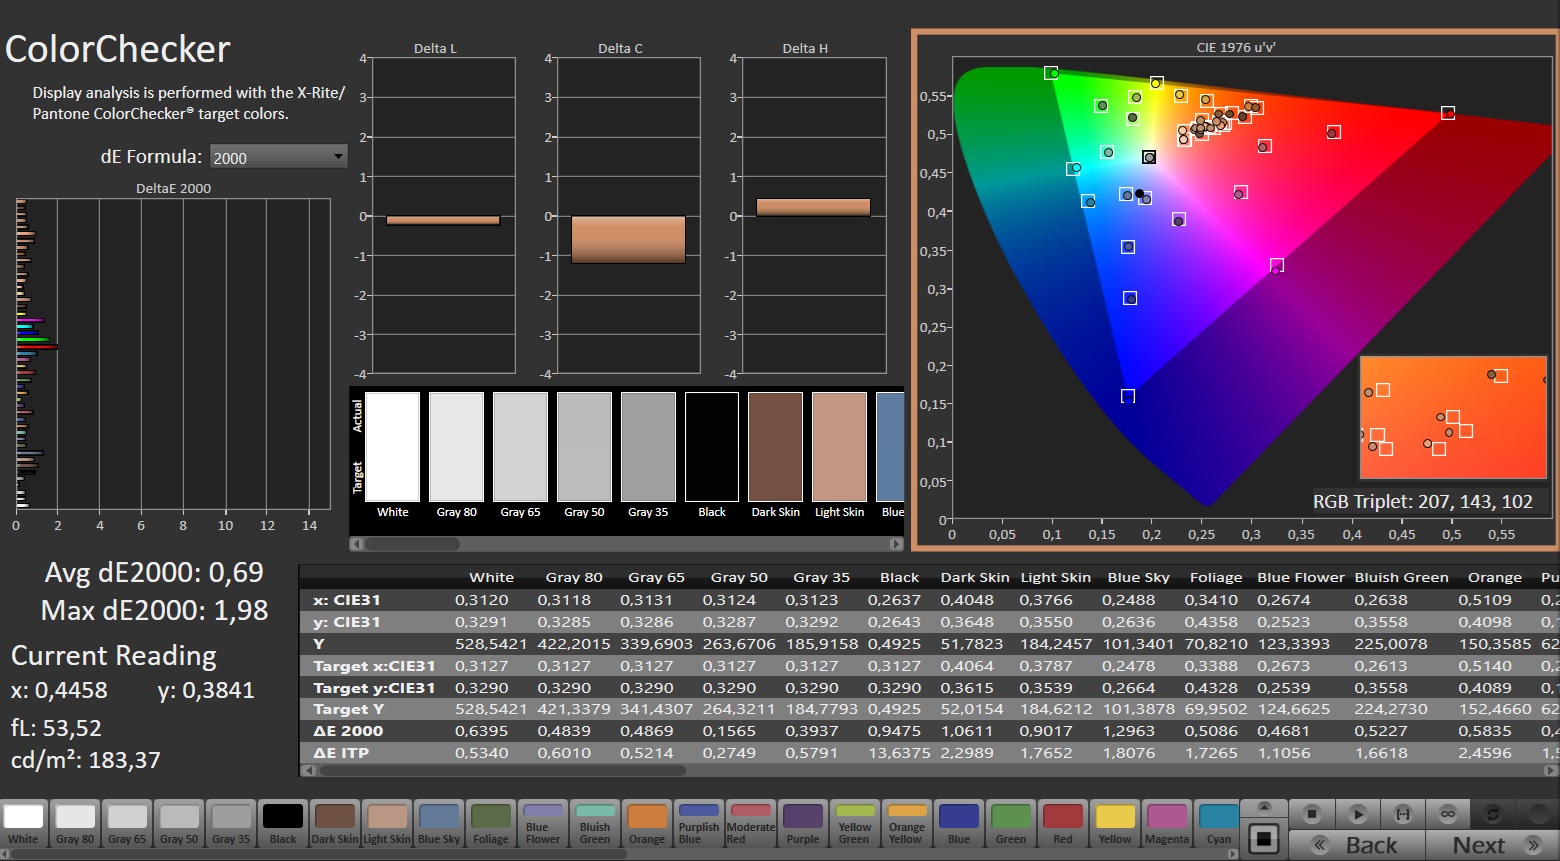
Das Panel bildet die Farbräume sRGB und DCI-P3 komplett bzw. nahezu komplett ab, den AdobeRGB-Raum nicht - das sieht bei den Bildschirmen der meisten Konkurrenten ähnlich aus. Die ab Werk ordentliche Farbdarstellung kann mittels Kalibrierung in den sehr guten Bereich gesteigert werden: Die Farbabweichung sinkt von 3,19 auf 0,69 (Soll: DeltaE < 3). Gleichzeitig werden die Graustufen deutlich ausgewogener dargestellt.
Das von uns erzeugte Farbprofil kann kostenlos heruntergeladen und genutzt werden. Ein Link findet sich in der Infobox des Displays.

Reaktionszeiten (Response Times) des Displays
| ↔ Reaktionszeiten Schwarz zu Weiß | ||
|---|---|---|
| 5 ms ... steigend ↗ und fallend ↘ kombiniert | ↗ 1.2 ms steigend | 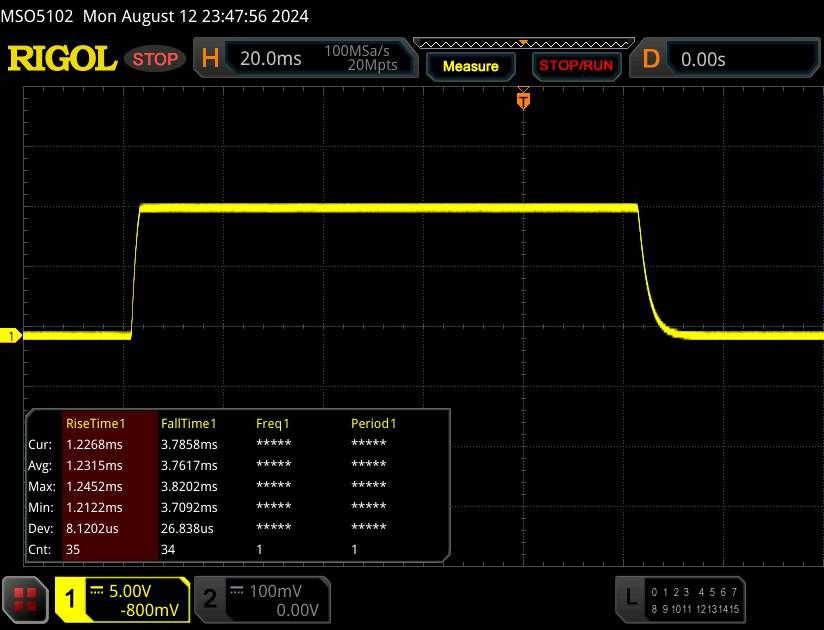 |
| ↘ 3.8 ms fallend | ||
| Die gemessenen Reaktionszeiten sind sehr kurz, wodurch sich der Bildschirm auch für schnelle 3D Spiele eignen sollte. Im Vergleich rangierten die bei uns getesteten Geräte von 0.1 (Minimum) zu 240 (Maximum) ms. » 16 % aller Screens waren schneller als der getestete. Daher sind die gemessenen Reaktionszeiten besser als der Durchschnitt aller vermessenen Geräte (20.2 ms). | ||
| ↔ Reaktionszeiten 50% Grau zu 80% Grau | ||
| 3.9 ms ... steigend ↗ und fallend ↘ kombiniert | ↗ 1.7 ms steigend | 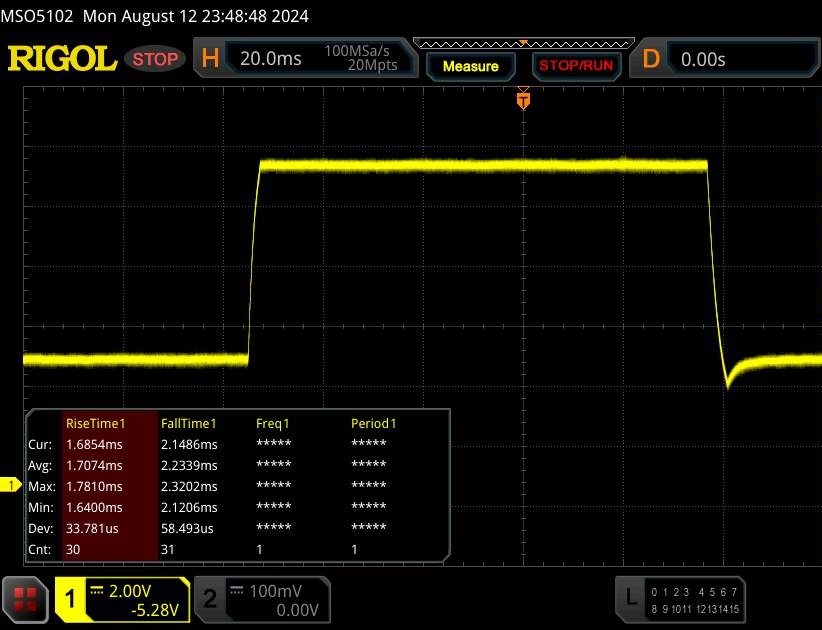 |
| ↘ 2.2 ms fallend | ||
| Die gemessenen Reaktionszeiten sind sehr kurz, wodurch sich der Bildschirm auch für schnelle 3D Spiele eignen sollte. Im Vergleich rangierten die bei uns getesteten Geräte von 0.165 (Minimum) zu 636 (Maximum) ms. » 14 % aller Screens waren schneller als der getestete. Daher sind die gemessenen Reaktionszeiten besser als der Durchschnitt aller vermessenen Geräte (31.6 ms). | ||
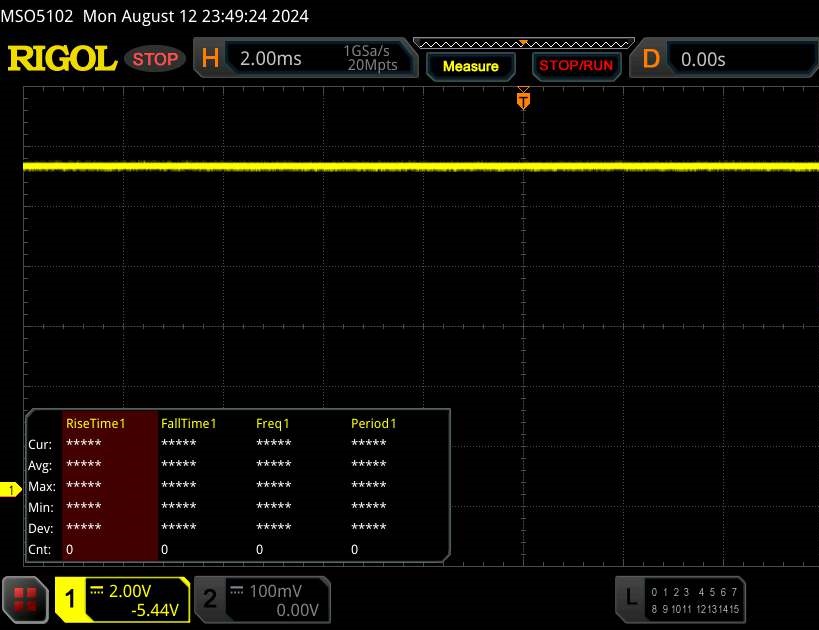
Bildschirm-Flackern / PWM (Pulse-Width Modulation)
| Flackern / PWM nicht festgestellt | 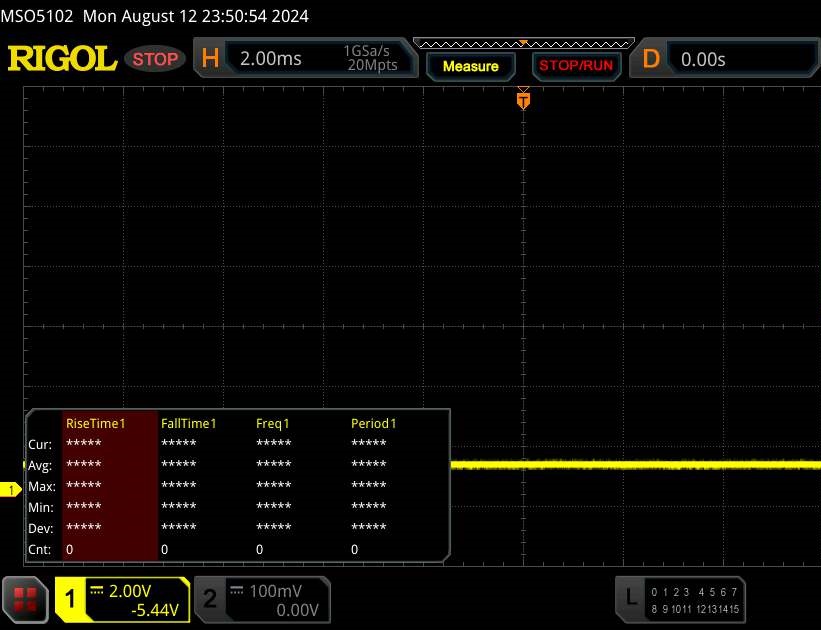 | ||
Im Vergleich: 53 % aller getesteten Geräte nutzten kein PWM um die Helligkeit zu reduzieren. Wenn PWM eingesetzt wurde, dann bei einer Frequenz von durchschnittlich 8108 (Minimum 5, Maximum 343500) Hz. | |||
Leistung - Raptor Lake und Ada Lovelace treiben den Rechner an
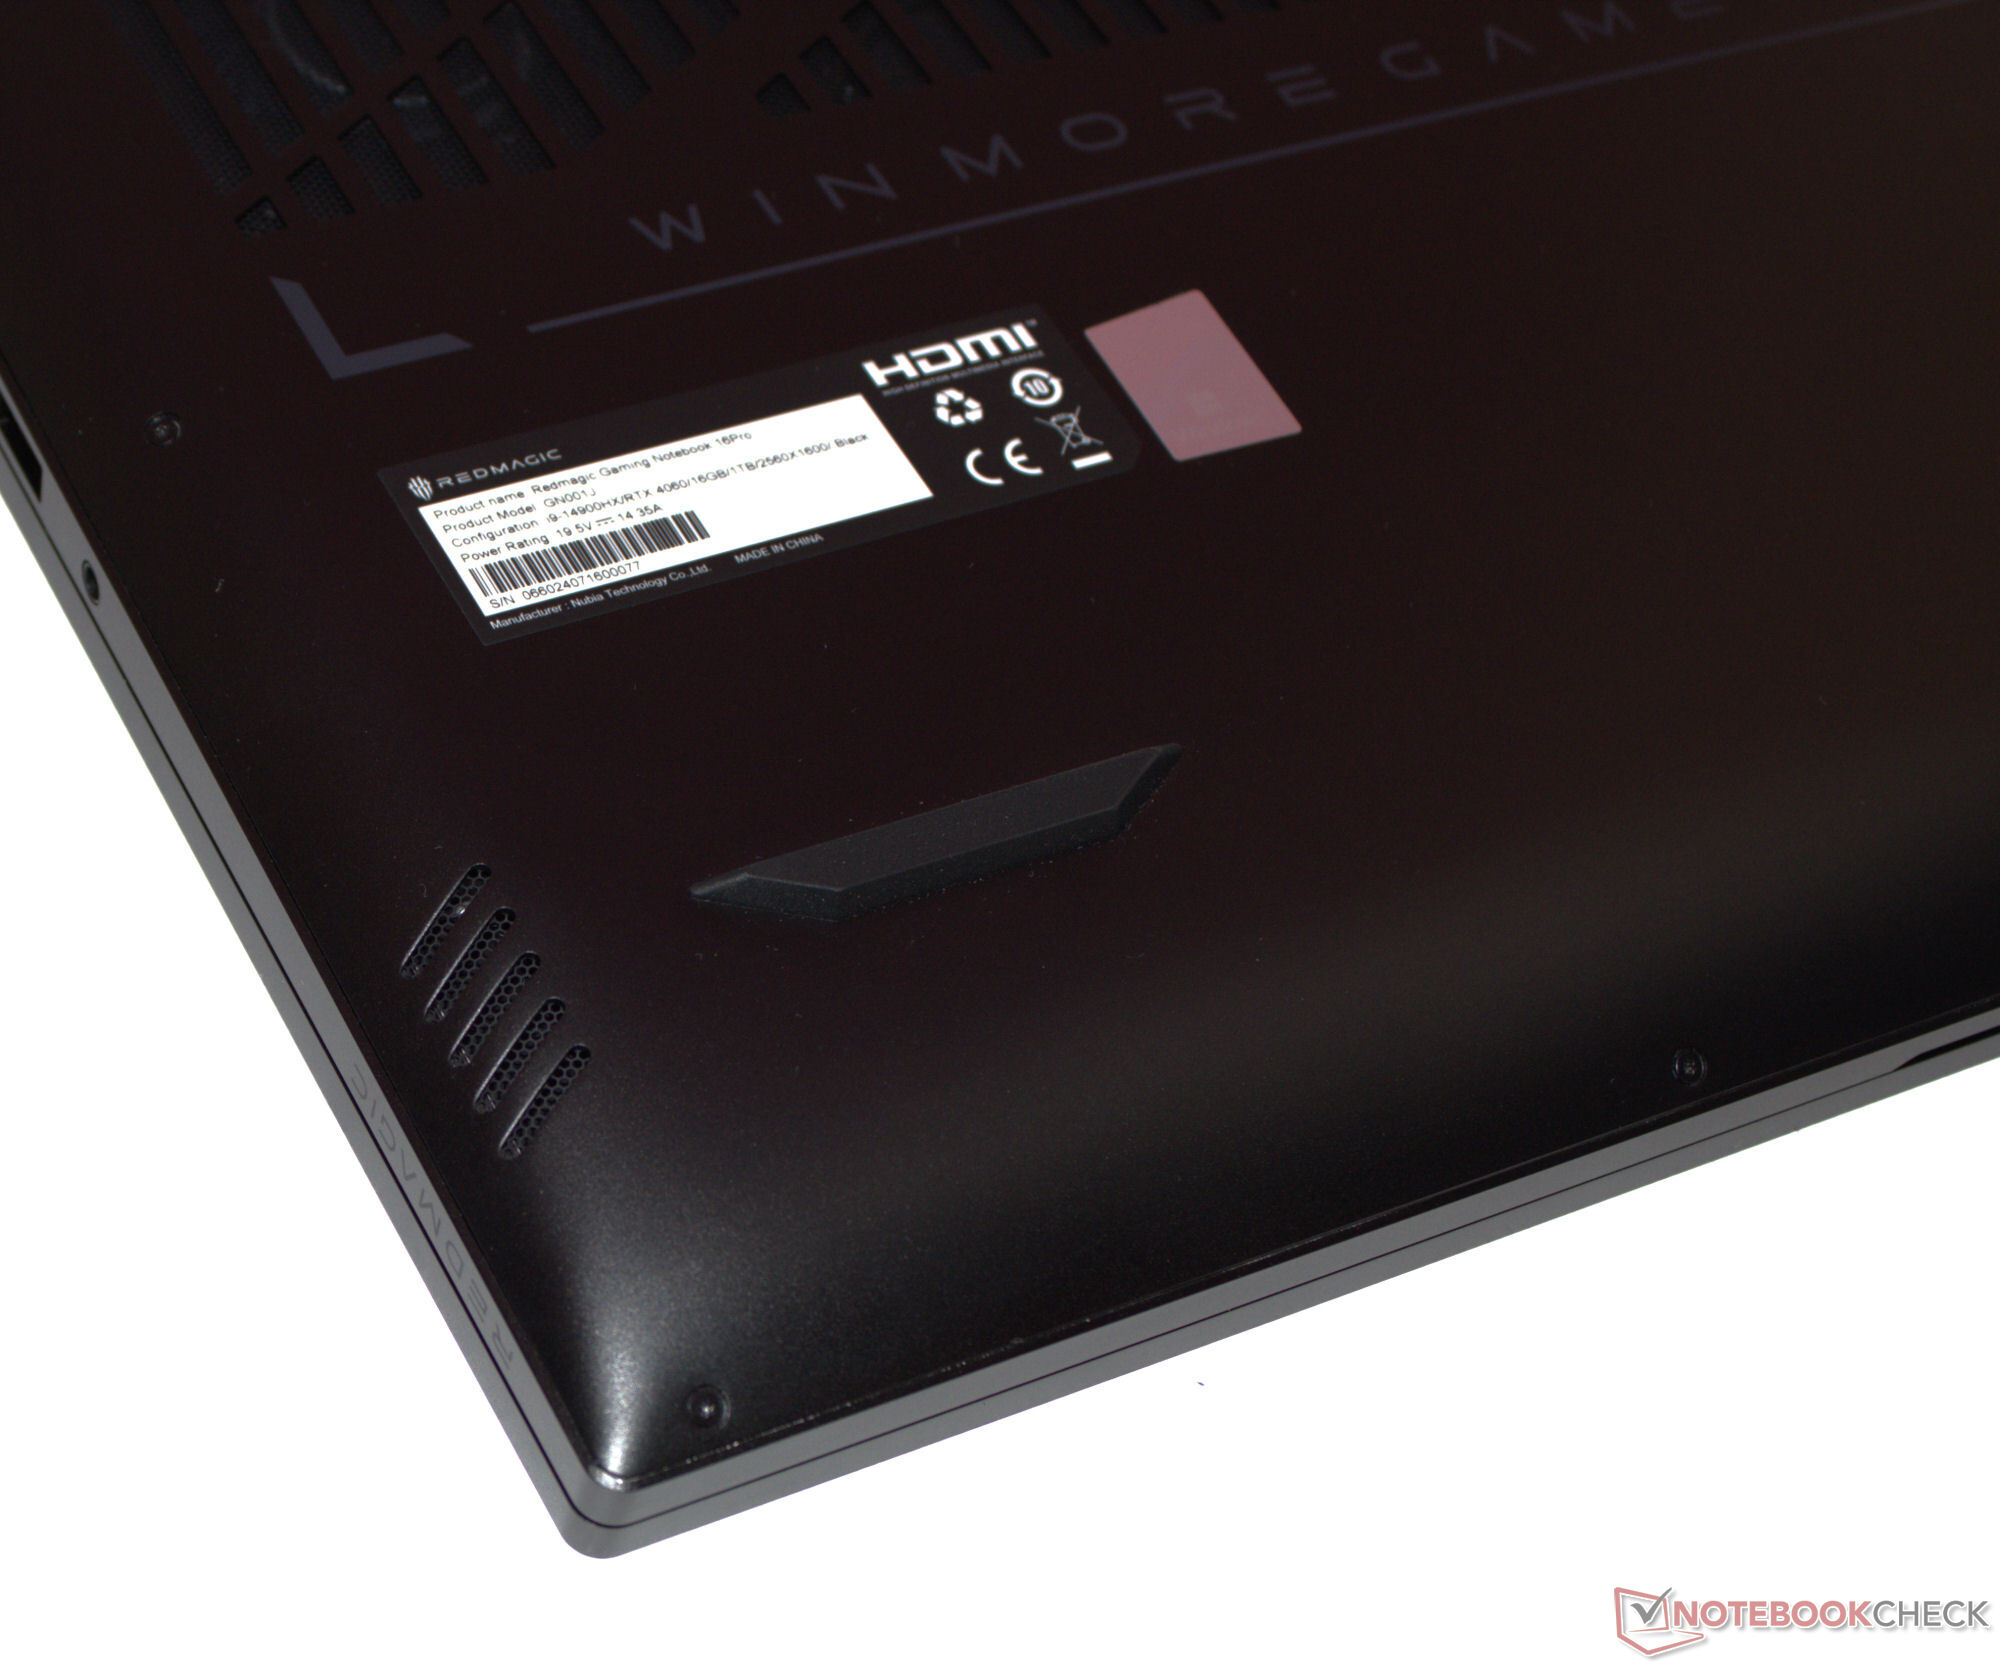
Das Titan 16 Pro zielt auf Gamer und Creator, wobei der Fokus wohl auf Ersteren liegt. Core i9-14900HX und GeForce RTX 4060 treiben den Rechner an. Der Kaufpreis liegt bei 1.759 Euro. Nubia hat noch andere Varianten im Sortiment, die aber nicht auf den internationalen Märkten angeboten werden.
Testbedingungen
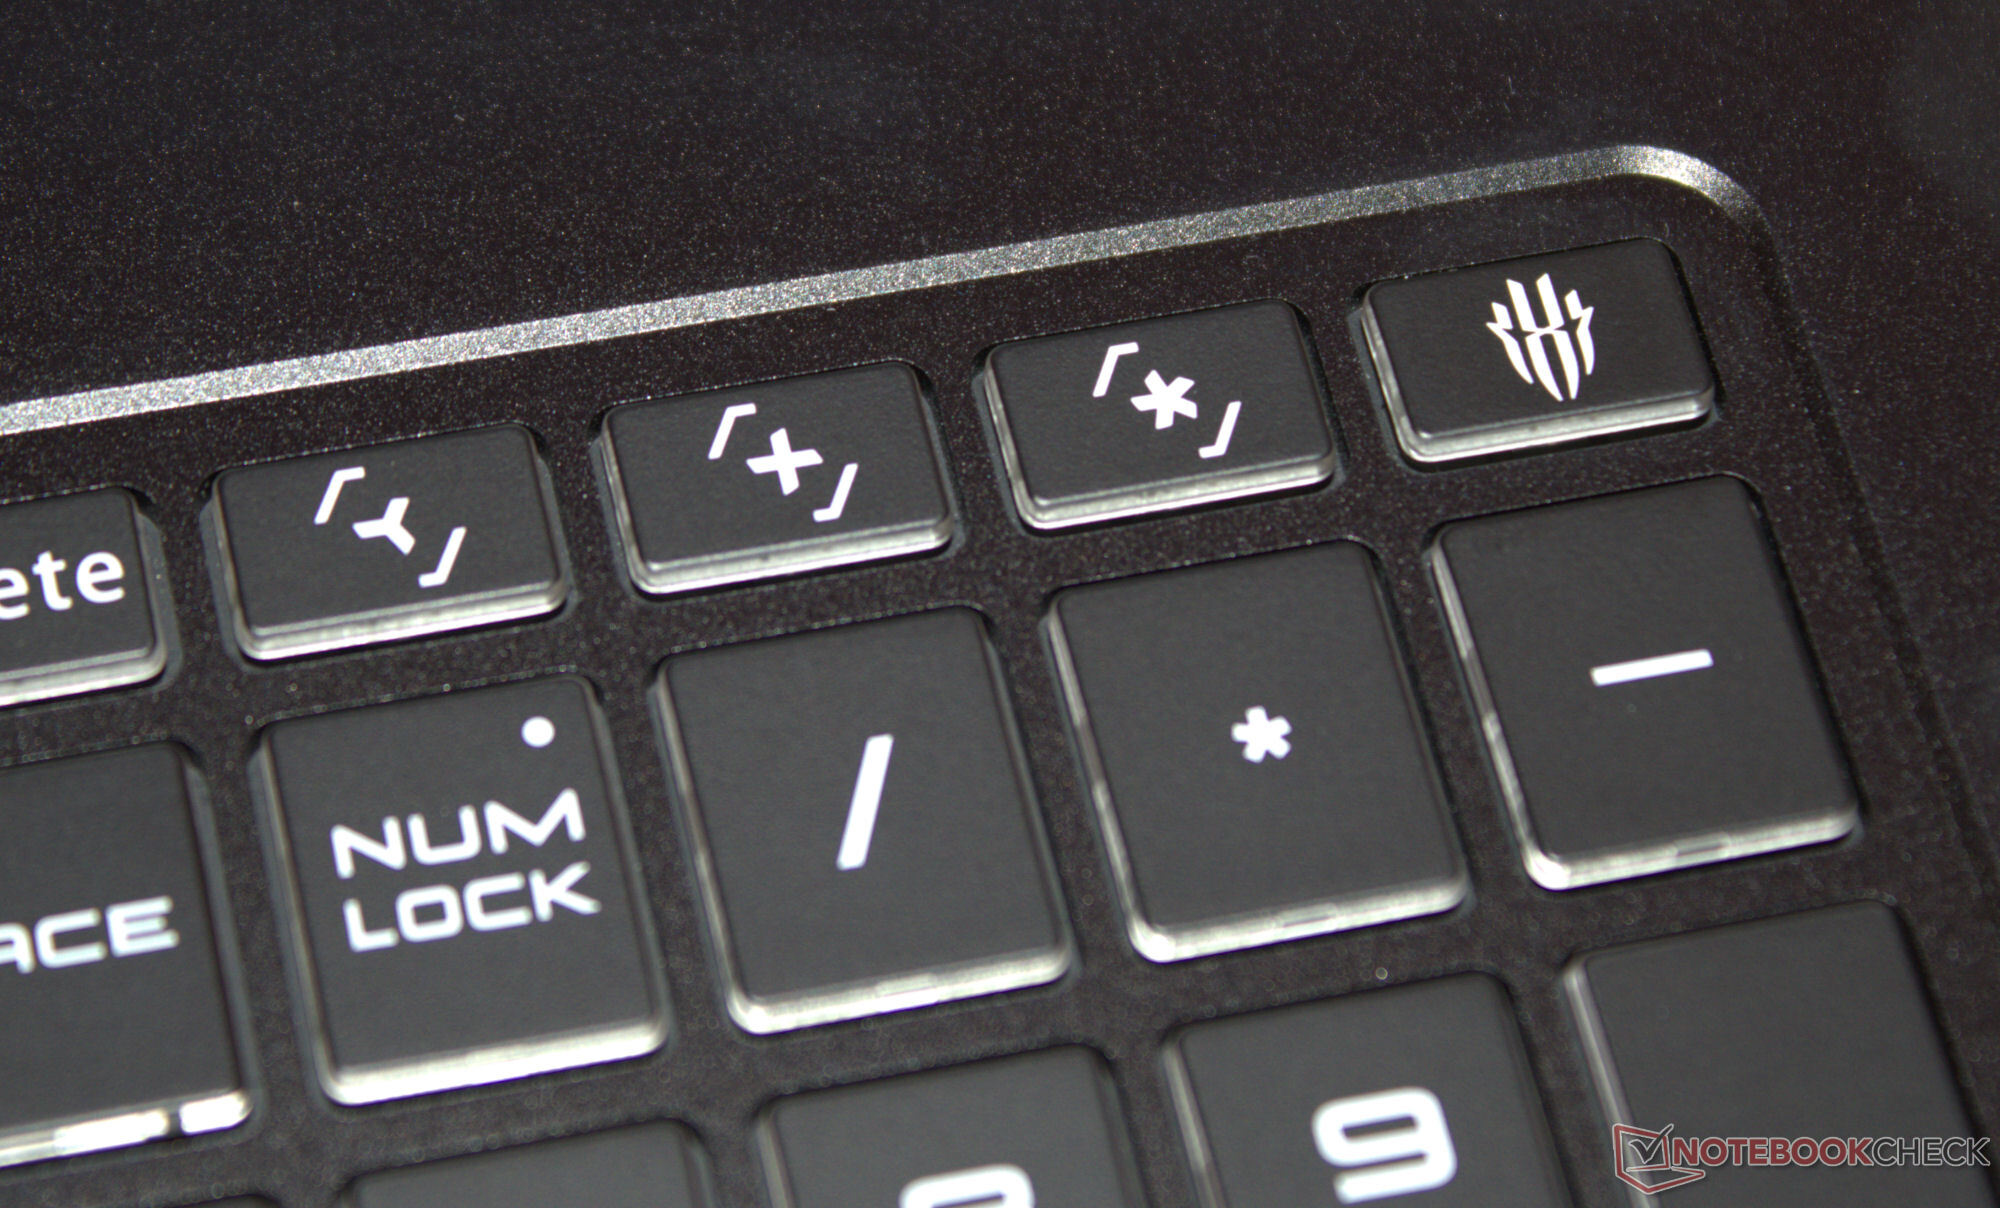
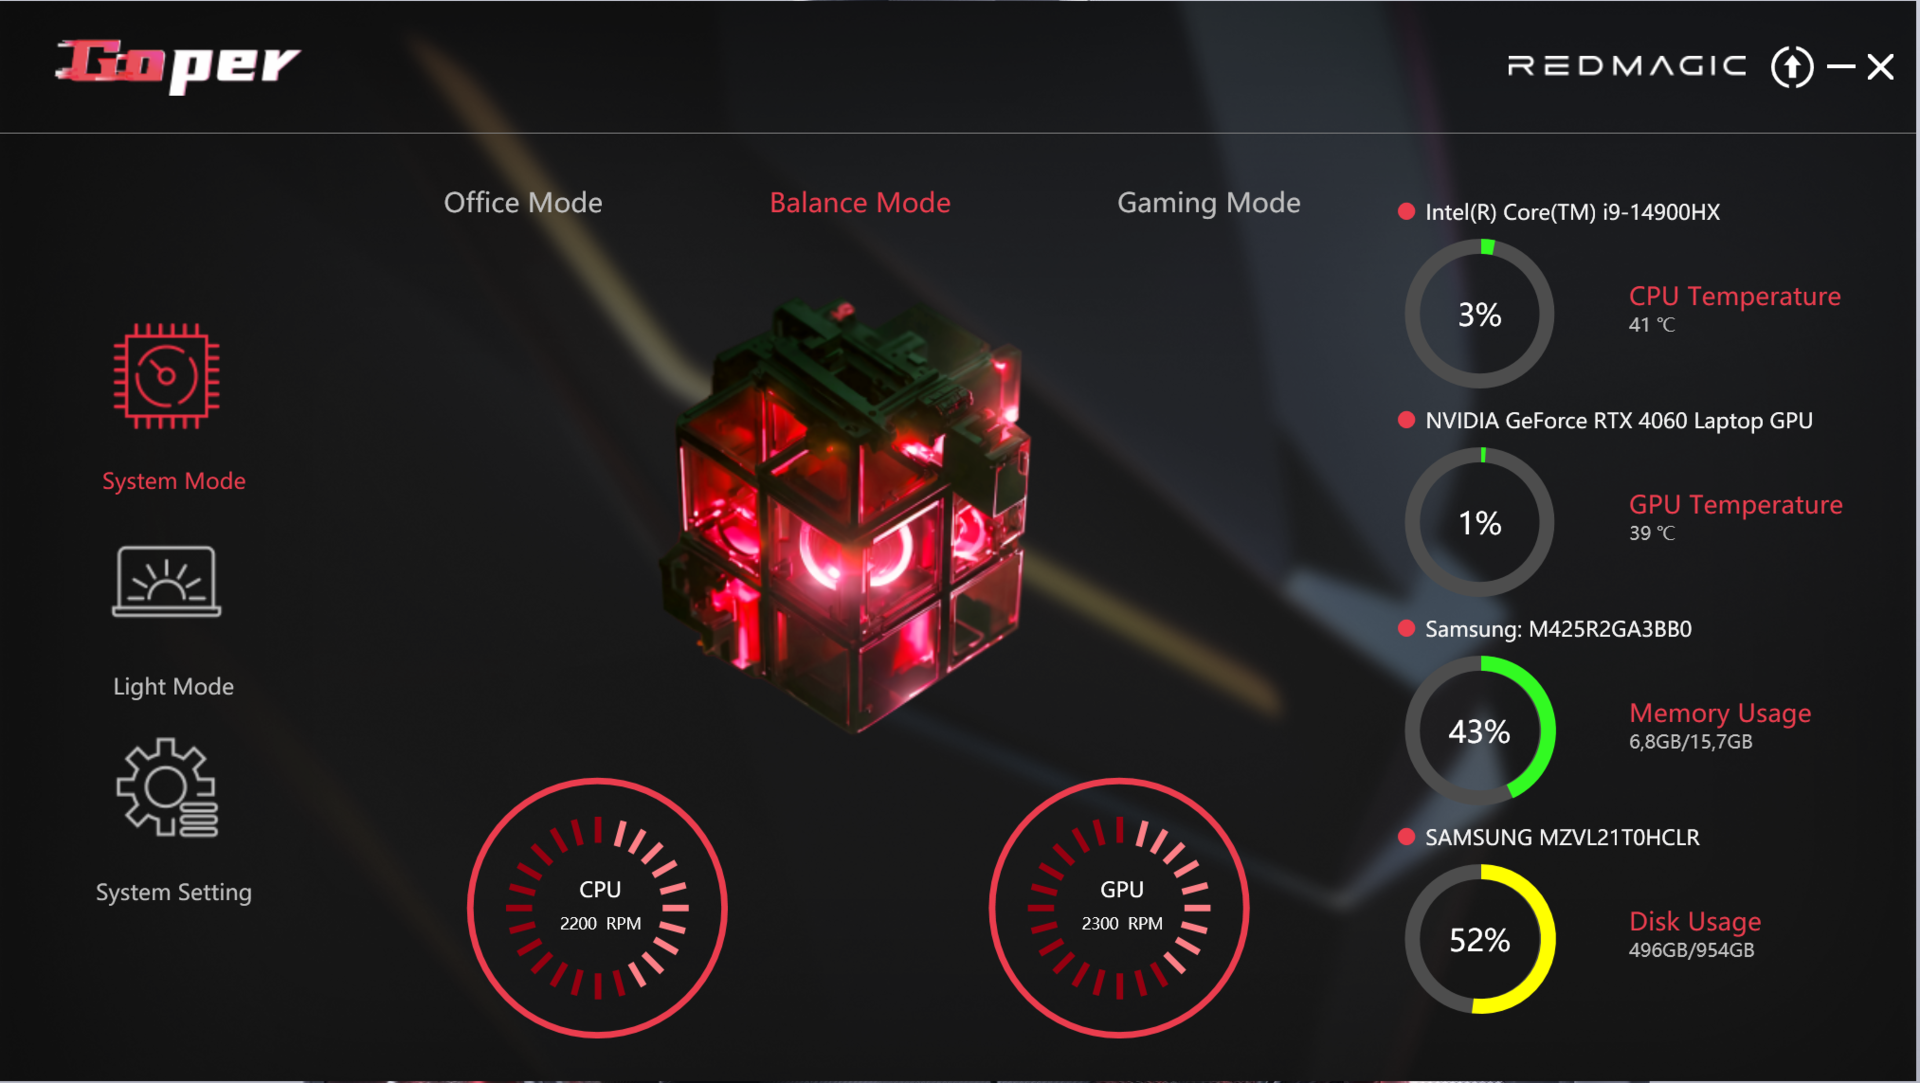
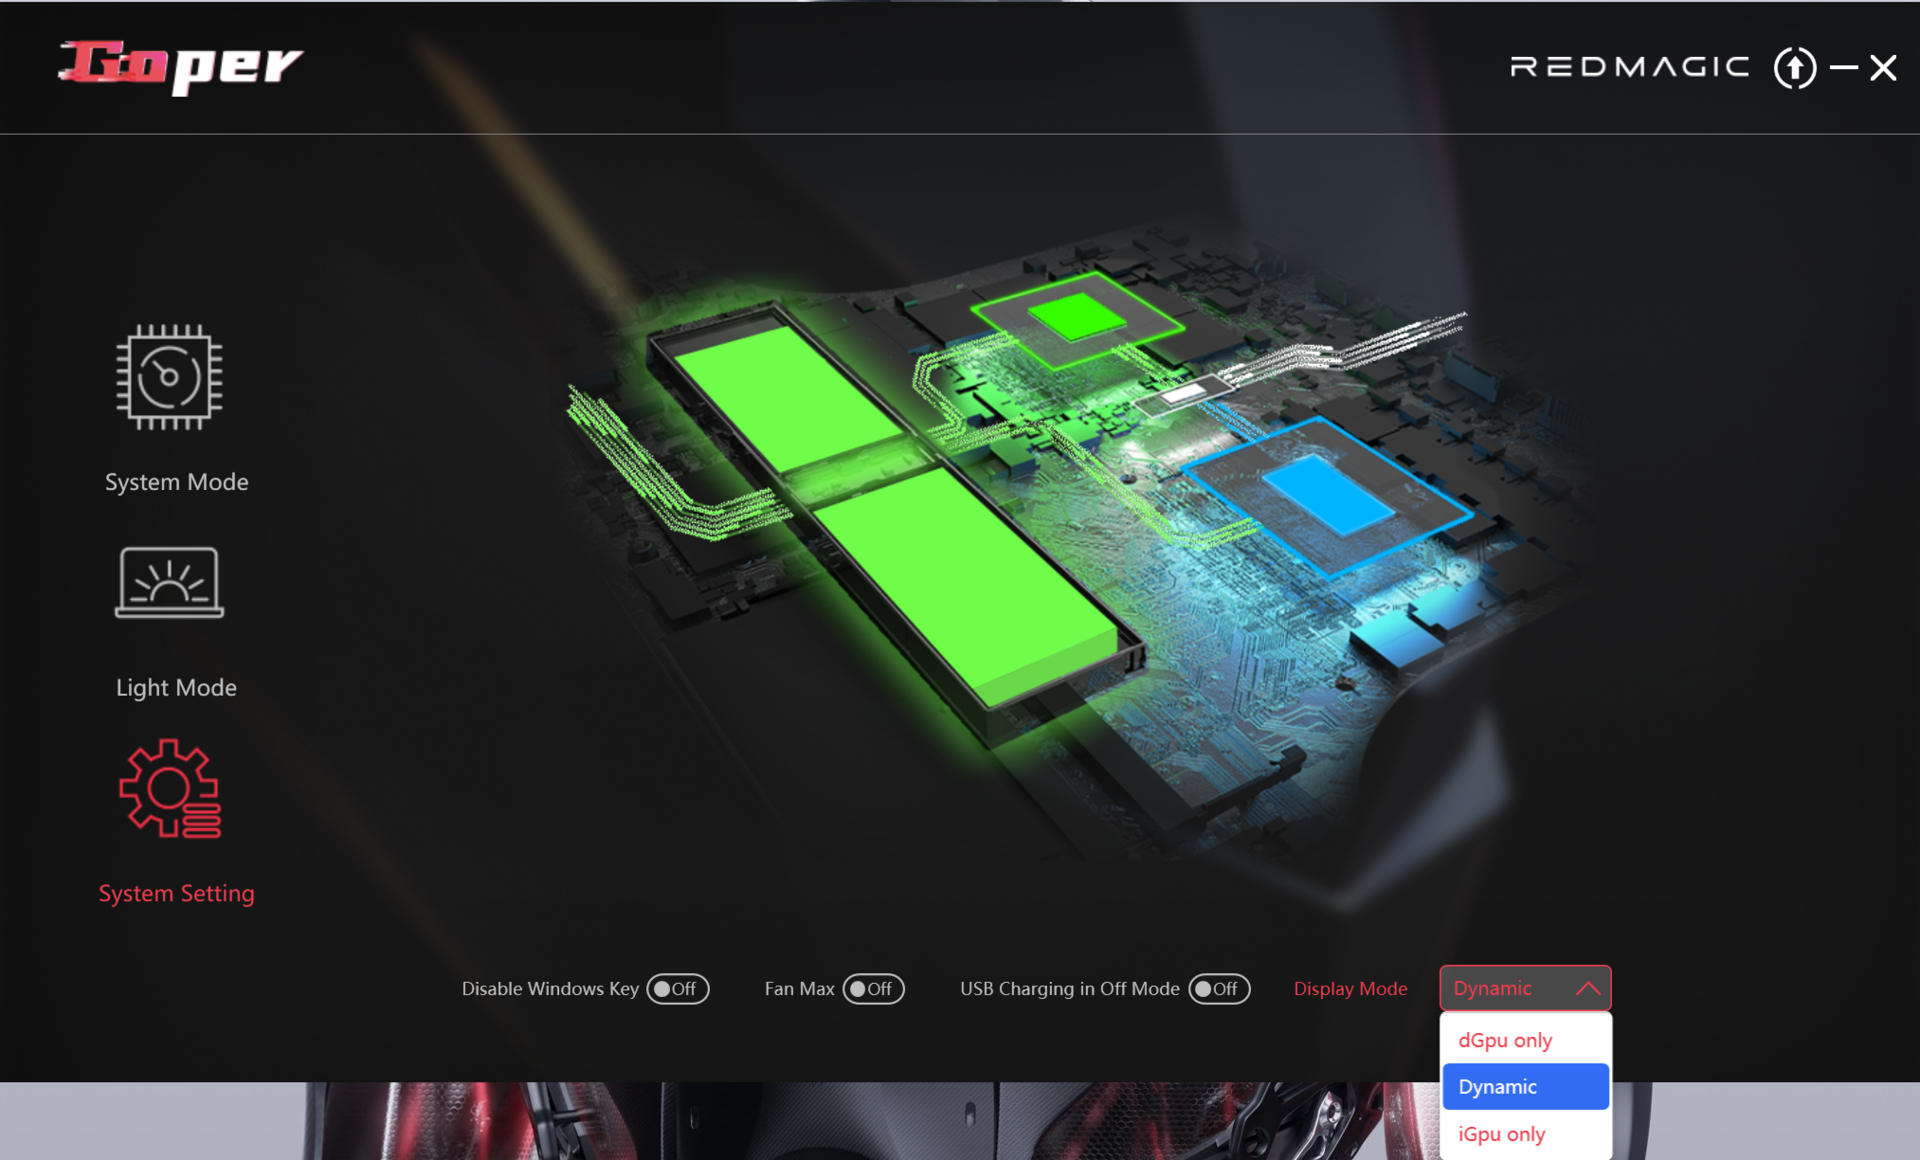
Drei herstellerspezifische Leistungsprofile (siehe Tabelle) stehen zur Auswahl. Während des Tests kamen die Profile "Balance Mode" (Benchmarks) und "Office Mode" (Akkutests) zum Einsatz. Der GPU-Modus war auf "Dynamic" (= Optimus) gesetzt. Jedes Profil ist über eine eigene Taste in der oberen Reihe des Nummernblocks direkt aufrufbar. Alternativ ist der Profilwechsel über die Anwendung "Goper" (Kontrollzentrum des Laptops) zu erreichen.

| Balance Mode | Gaming Mode | Office Mode | |
|---|---|---|---|
| Power Limit 1 (HWInfo) | 45 Watt | 100 Watt | 35 Watt |
| Power Limit 2 (HWInfo) | 140 Watt | 140 Watt | 140 Watt |
| Noise (Cyberpunk 2077) | 50 dB(A) | 53 dB(A) | 47 dB(A) |
| Performance (Cyberpunk 2077) | 66 fps | 66 fps | 60 fps |
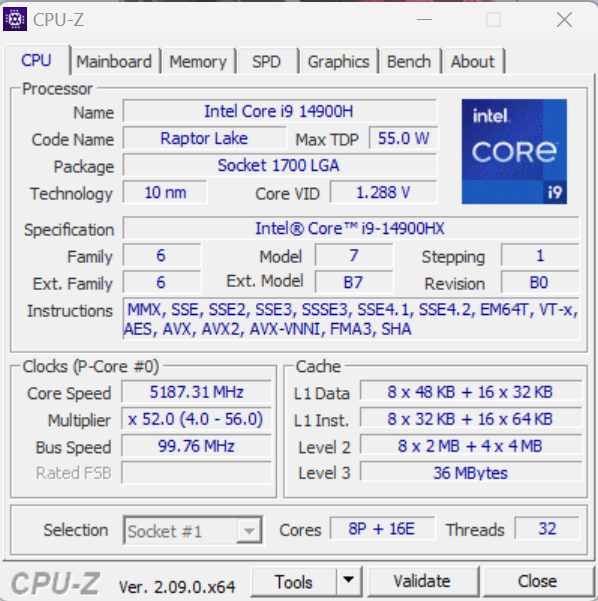
Prozessor
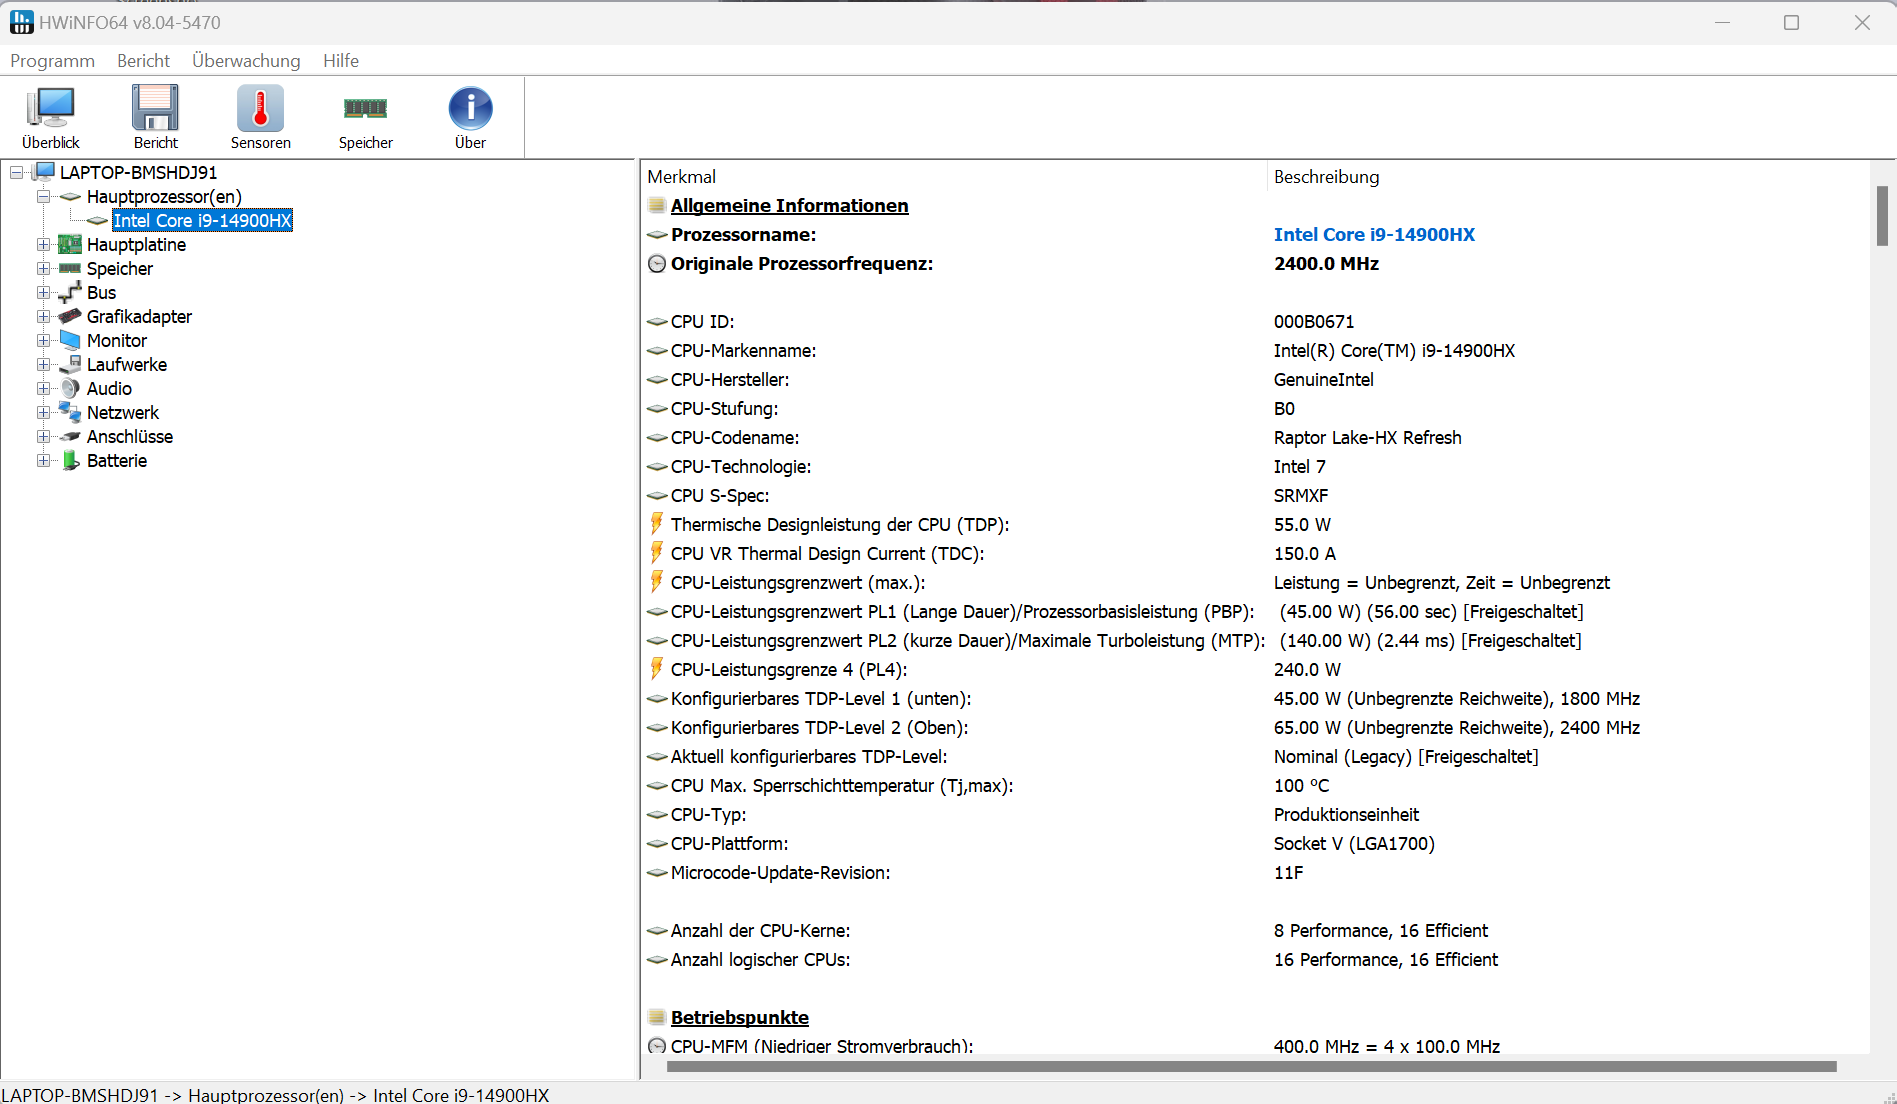
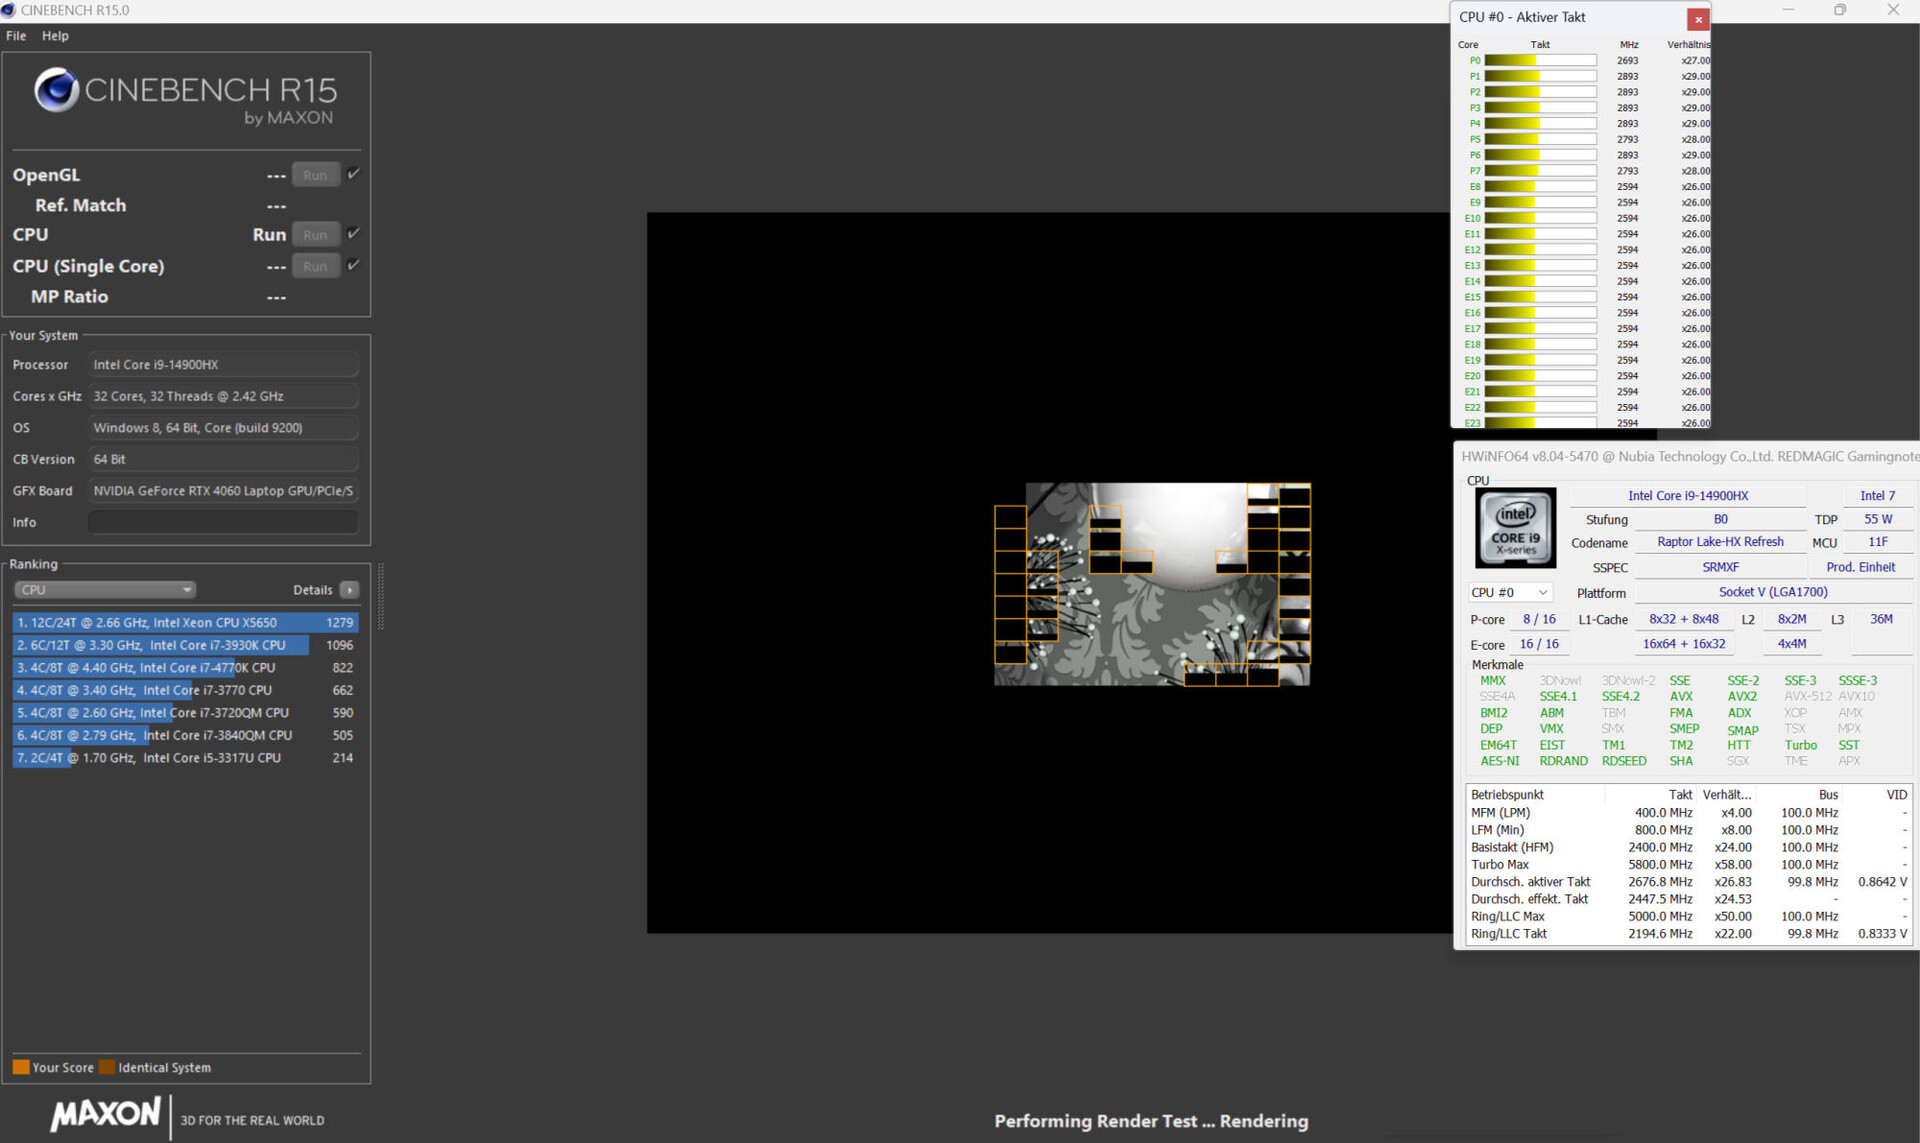
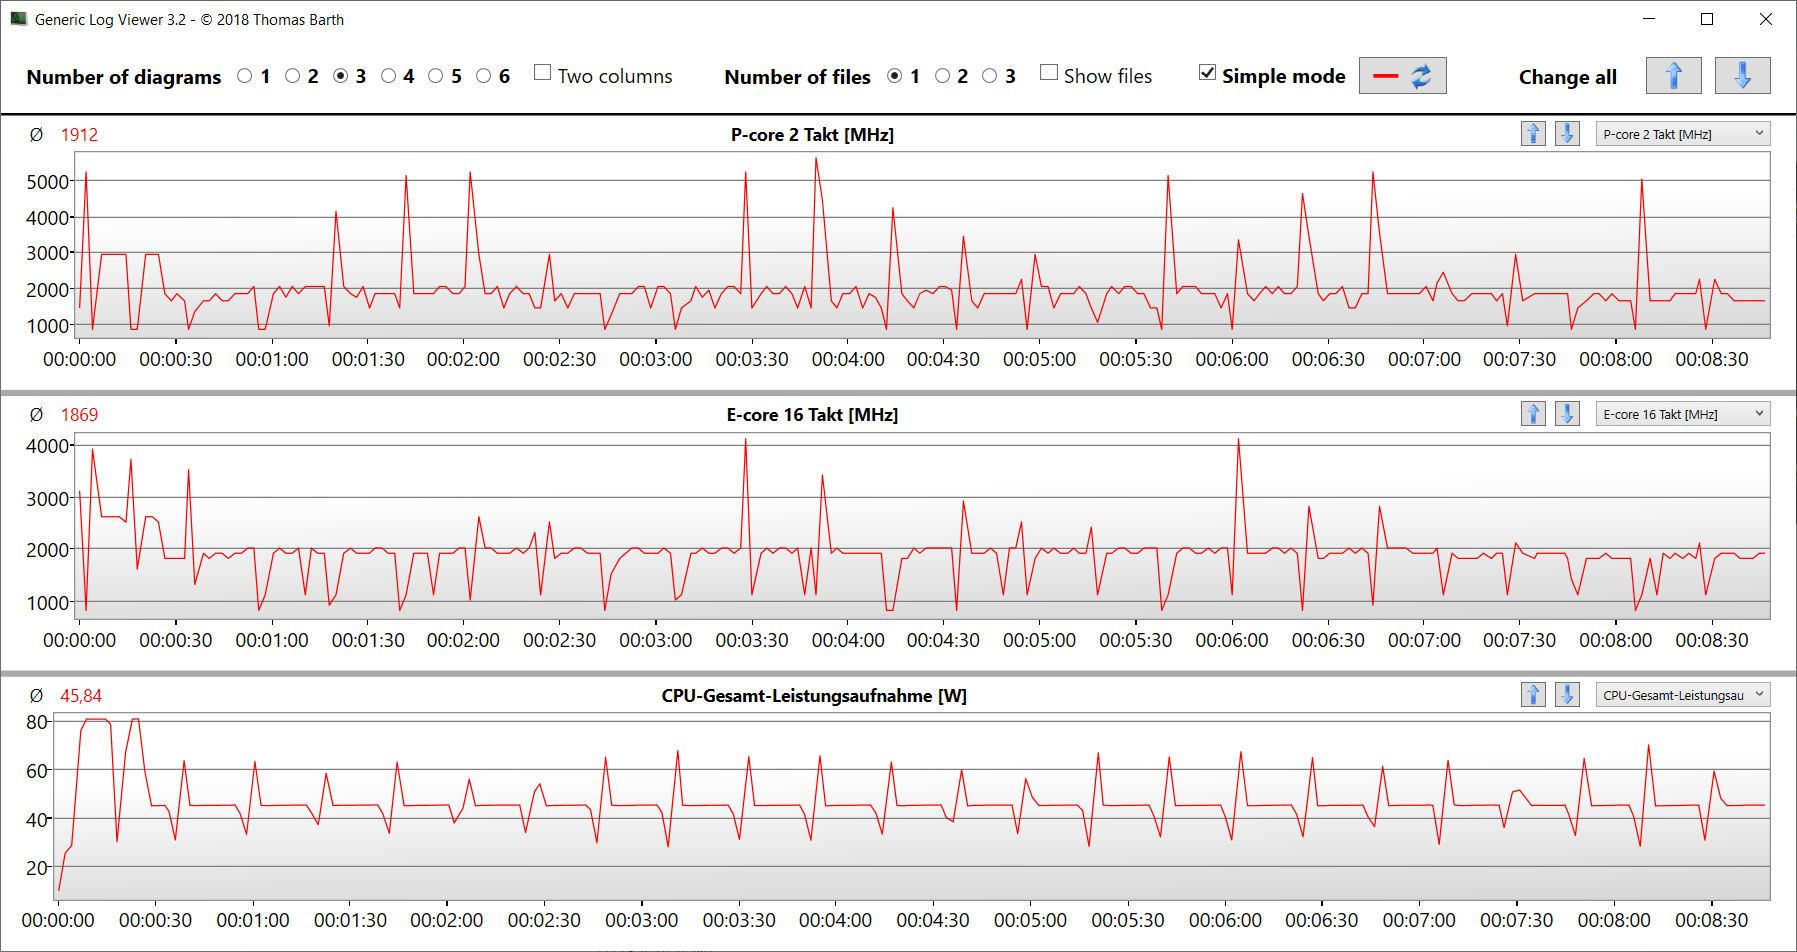
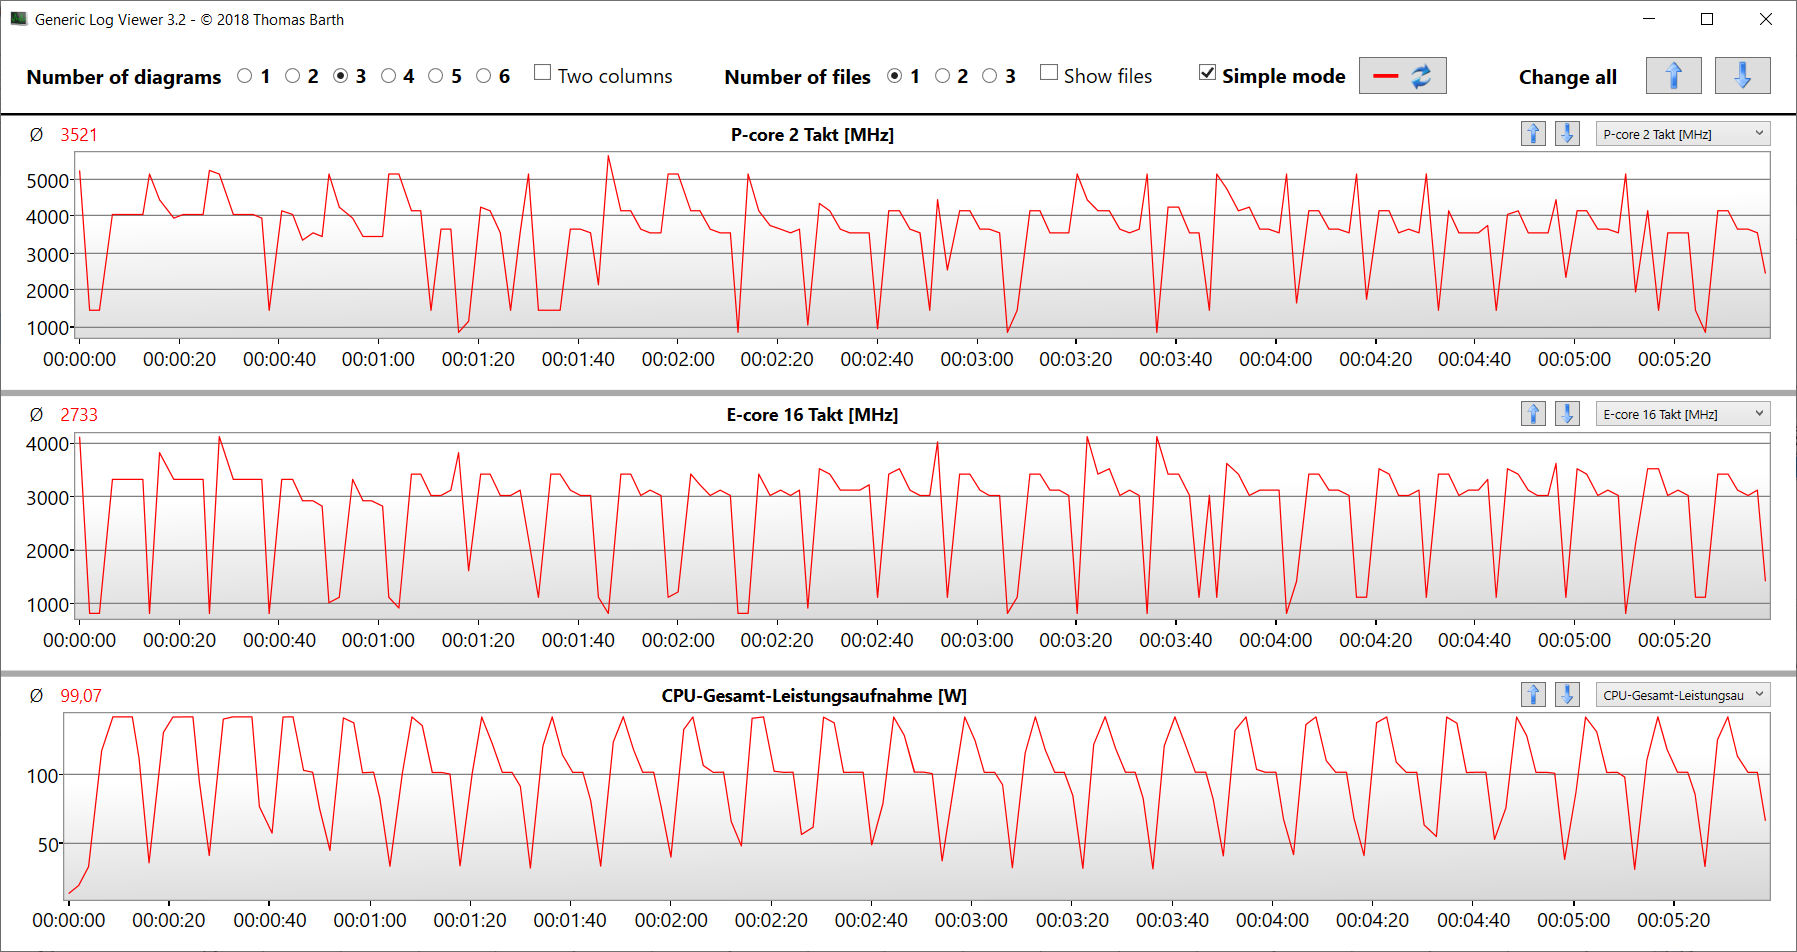
Das Titan hält mit dem Core i9-14900HX (Raptor Lake) nur eine CPU-Option bereit. Seine 24 CPU-Kerne (8P + 16E = 32 Threads) erreichen Maximaltakte von 5,8 GHz (P) bzw. 4,1 GHz (E). Dauerhafte Multi-Thread-Last (CB15 Loop) lässt den CPU-Takt vom ersten bis zum dritten Durchlauf deutlich sinken. Danach wird ein recht konstantes Niveau gehalten. Das Profil "Gaming Mode" sorgt für ein deutlich höheres Leistungsniveau.
Die drei Powermodi liefern eine recht ähnliche Single-Thread-Leistung etwa auf Höhe des CPU-Schnitts. Die Multi-Thread-Leistung differiert in deutlich stärkerem Maße: Lediglich "Gaming Mode" sorgt für Werte auf Höhe des CPU-Schnitts, die beiden anderen Modi liegen deutlich darunter.
Mehr Informationen zum Core i9 liefert ein Analyse-Artikel.
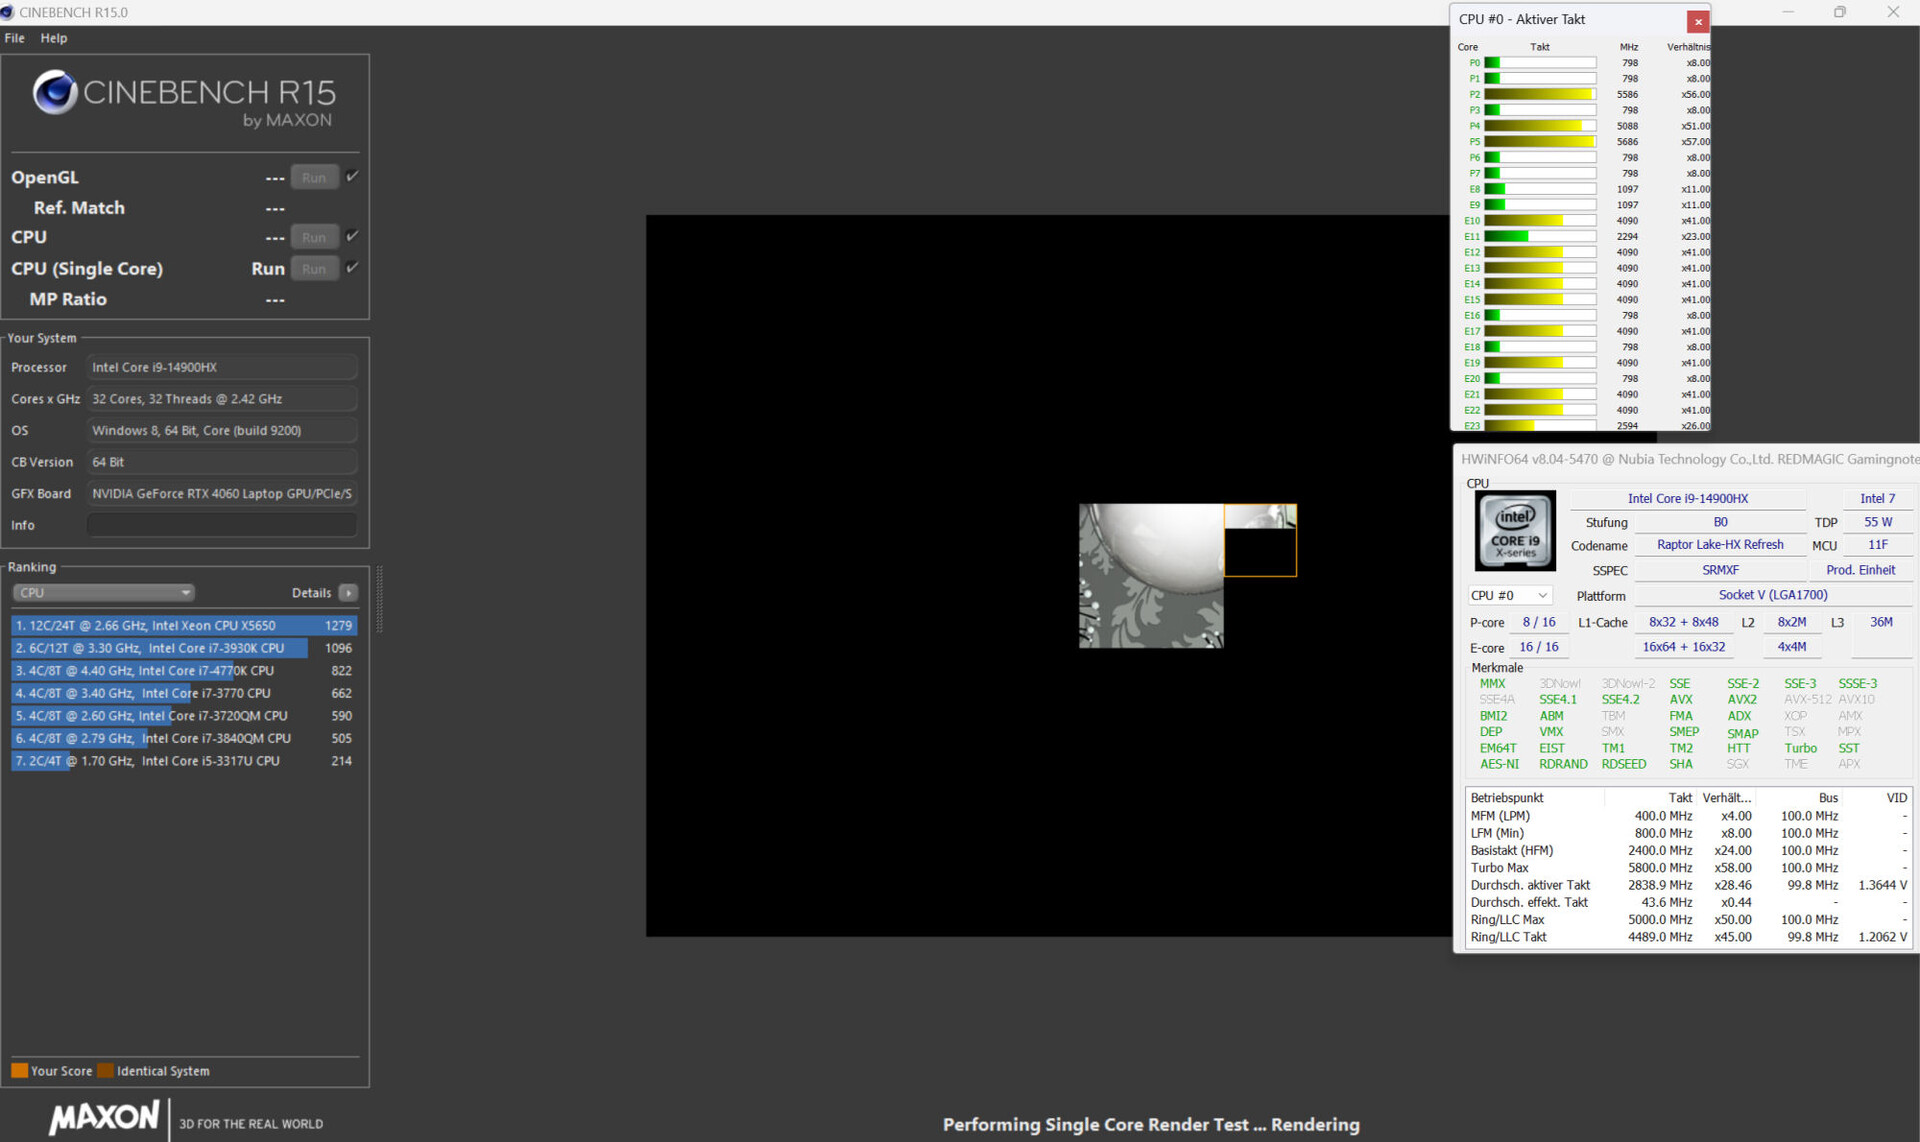
Cinebench R15 Multi Dauertest
| CPU Performance Rating - Percent | |
| Durchschnittliche Intel Core i9-14900HX | |
| Lenovo Legion Pro 5 16IRX9 G9 | |
| Nubia RedMagic Titan 16 Pro | |
| Schenker XMG Pro 16 Studio (Mid 24) | |
| Acer Predator Helios Neo 16 (2024) | |
| Durchschnitt der Klasse Gaming | |
| Nubia RedMagic Titan 16 Pro | |
| HP Victus 16 (2024) | |
| Gigabyte G6X 9KG (2024) | |
| Blender - v2.79 BMW27 CPU | |
| Gigabyte G6X 9KG (2024) | |
| Nubia RedMagic Titan 16 Pro | |
| HP Victus 16 (2024) | |
| Durchschnitt der Klasse Gaming (80 - 517, n=140, der letzten 2 Jahre) | |
| Acer Predator Helios Neo 16 (2024) | |
| Schenker XMG Pro 16 Studio (Mid 24) | |
| Nubia RedMagic Titan 16 Pro (Gaming Mode) | |
| Lenovo Legion Pro 5 16IRX9 G9 | |
| Durchschnittliche Intel Core i9-14900HX (91 - 206, n=37) | |
| Geekbench 6.5 | |
| Multi-Core | |
| Lenovo Legion Pro 5 16IRX9 G9 (6.2.1) | |
| Durchschnittliche Intel Core i9-14900HX (13158 - 19665, n=37) | |
| Acer Predator Helios Neo 16 (2024) (6.2.1) | |
| Schenker XMG Pro 16 Studio (Mid 24) (6.2.1) | |
| Durchschnitt der Klasse Gaming (5340 - 22104, n=142, der letzten 2 Jahre) | |
| HP Victus 16 (2024) (6.2.1) | |
| Nubia RedMagic Titan 16 Pro (6.2.1, Gaming Mode) | |
| Gigabyte G6X 9KG (2024) (6.2.1) | |
| Nubia RedMagic Titan 16 Pro (6.2.1) | |
| Single-Core | |
| Nubia RedMagic Titan 16 Pro (6.2.1) | |
| Nubia RedMagic Titan 16 Pro (6.2.1, Gaming Mode) | |
| Acer Predator Helios Neo 16 (2024) (6.2.1) | |
| Durchschnittliche Intel Core i9-14900HX (2419 - 3129, n=37) | |
| Lenovo Legion Pro 5 16IRX9 G9 (6.2.1) | |
| Durchschnitt der Klasse Gaming (1490 - 3253, n=142, der letzten 2 Jahre) | |
| Schenker XMG Pro 16 Studio (Mid 24) (6.2.1) | |
| Gigabyte G6X 9KG (2024) (6.2.1) | |
| HP Victus 16 (2024) (6.2.1) | |
| HWBOT x265 Benchmark v2.2 - 4k Preset | |
| Nubia RedMagic Titan 16 Pro (Gaming Mode) | |
| Durchschnittliche Intel Core i9-14900HX (16.8 - 38.9, n=37) | |
| Lenovo Legion Pro 5 16IRX9 G9 | |
| Durchschnitt der Klasse Gaming (7.7 - 44.3, n=142, der letzten 2 Jahre) | |
| Schenker XMG Pro 16 Studio (Mid 24) | |
| Acer Predator Helios Neo 16 (2024) | |
| HP Victus 16 (2024) | |
| Gigabyte G6X 9KG (2024) | |
| Nubia RedMagic Titan 16 Pro | |
| LibreOffice - 20 Documents To PDF | |
| HP Victus 16 (2024) (6.3.4.2) | |
| Lenovo Legion Pro 5 16IRX9 G9 (6.3.4.2) | |
| Durchschnitt der Klasse Gaming (19 - 88.8, n=141, der letzten 2 Jahre) | |
| Schenker XMG Pro 16 Studio (Mid 24) (6.3.4.2) | |
| Durchschnittliche Intel Core i9-14900HX (19 - 85.1, n=37) | |
| Acer Predator Helios Neo 16 (2024) (6.3.4.2) | |
| Nubia RedMagic Titan 16 Pro (6.3.4.2, Gaming Mode) | |
| Gigabyte G6X 9KG (2024) (6.3.4.2) | |
| Nubia RedMagic Titan 16 Pro (6.3.4.2) | |
| R Benchmark 2.5 - Overall mean | |
| HP Victus 16 (2024) | |
| Gigabyte G6X 9KG (2024) | |
| Durchschnitt der Klasse Gaming (0.3551 - 0.759, n=143, der letzten 2 Jahre) | |
| Schenker XMG Pro 16 Studio (Mid 24) | |
| Lenovo Legion Pro 5 16IRX9 G9 | |
| Durchschnittliche Intel Core i9-14900HX (0.3604 - 0.4859, n=37) | |
| Acer Predator Helios Neo 16 (2024) | |
| Nubia RedMagic Titan 16 Pro | |
| Nubia RedMagic Titan 16 Pro (Gaming Mode) | |
* ... kleinere Werte sind besser
AIDA64: FP32 Ray-Trace | FPU Julia | CPU SHA3 | CPU Queen | FPU SinJulia | FPU Mandel | CPU AES | CPU ZLib | FP64 Ray-Trace | CPU PhotoWorxx
| Performance Rating | |
| Durchschnittliche Intel Core i9-14900HX | |
| Nubia RedMagic Titan 16 Pro | |
| Durchschnitt der Klasse Gaming | |
| Lenovo Legion Pro 5 16IRX9 G9 | |
| Schenker XMG Pro 16 Studio (Mid 24) | |
| Acer Predator Helios Neo 16 (2024) | |
| HP Victus 16 (2024) | |
| Nubia RedMagic Titan 16 Pro | |
| Gigabyte G6X 9KG (2024) | |
| AIDA64 / FP32 Ray-Trace | |
| Durchschnitt der Klasse Gaming (7192 - 85542, n=141, der letzten 2 Jahre) | |
| Durchschnittliche Intel Core i9-14900HX (13098 - 33474, n=36) | |
| Nubia RedMagic Titan 16 Pro (v6.92.6600, Gaming Mode) | |
| Lenovo Legion Pro 5 16IRX9 G9 (v6.92.6600) | |
| Acer Predator Helios Neo 16 (2024) (v6.92.6600) | |
| Schenker XMG Pro 16 Studio (Mid 24) (v6.92.6600) | |
| HP Victus 16 (2024) (v6.92.6600) | |
| Gigabyte G6X 9KG (2024) (v6.92.6600) | |
| Nubia RedMagic Titan 16 Pro (v6.92.6600) | |
| AIDA64 / FPU Julia | |
| Durchschnitt der Klasse Gaming (35040 - 238426, n=141, der letzten 2 Jahre) | |
| Durchschnittliche Intel Core i9-14900HX (67573 - 166040, n=36) | |
| Nubia RedMagic Titan 16 Pro (v6.92.6600, Gaming Mode) | |
| Lenovo Legion Pro 5 16IRX9 G9 (v6.92.6600) | |
| Schenker XMG Pro 16 Studio (Mid 24) (v6.92.6600) | |
| Acer Predator Helios Neo 16 (2024) (v6.92.6600) | |
| HP Victus 16 (2024) (v6.92.6600) | |
| Gigabyte G6X 9KG (2024) (v6.92.6600) | |
| Nubia RedMagic Titan 16 Pro (v6.92.6600) | |
| AIDA64 / CPU SHA3 | |
| Nubia RedMagic Titan 16 Pro (v6.92.6600, Gaming Mode) | |
| Durchschnittliche Intel Core i9-14900HX (3589 - 7979, n=36) | |
| Durchschnitt der Klasse Gaming (1728 - 9817, n=141, der letzten 2 Jahre) | |
| Schenker XMG Pro 16 Studio (Mid 24) (v6.92.6600) | |
| Lenovo Legion Pro 5 16IRX9 G9 (v6.92.6600) | |
| Acer Predator Helios Neo 16 (2024) (v6.92.6600) | |
| HP Victus 16 (2024) (v6.92.6600) | |
| Nubia RedMagic Titan 16 Pro (v6.92.6600) | |
| Gigabyte G6X 9KG (2024) (v6.92.6600) | |
| AIDA64 / CPU Queen | |
| Lenovo Legion Pro 5 16IRX9 G9 (v6.92.6600) | |
| Acer Predator Helios Neo 16 (2024) (v6.92.6600) | |
| Nubia RedMagic Titan 16 Pro (v6.92.6600, Gaming Mode) | |
| Durchschnittliche Intel Core i9-14900HX (118405 - 148966, n=36) | |
| Schenker XMG Pro 16 Studio (Mid 24) (v6.92.6600) | |
| HP Victus 16 (2024) (v6.92.6600) | |
| Nubia RedMagic Titan 16 Pro (v6.92.6600) | |
| Durchschnitt der Klasse Gaming (50699 - 173351, n=141, der letzten 2 Jahre) | |
| Gigabyte G6X 9KG (2024) (v6.92.6600) | |
| AIDA64 / FPU SinJulia | |
| Nubia RedMagic Titan 16 Pro (v6.92.6600, Gaming Mode) | |
| Durchschnittliche Intel Core i9-14900HX (10475 - 18517, n=36) | |
| Lenovo Legion Pro 5 16IRX9 G9 (v6.92.6600) | |
| Durchschnitt der Klasse Gaming (5020 - 33636, n=141, der letzten 2 Jahre) | |
| Schenker XMG Pro 16 Studio (Mid 24) (v6.92.6600) | |
| Acer Predator Helios Neo 16 (2024) (v6.92.6600) | |
| HP Victus 16 (2024) (v6.92.6600) | |
| Nubia RedMagic Titan 16 Pro (v6.92.6600) | |
| Gigabyte G6X 9KG (2024) (v6.92.6600) | |
| AIDA64 / FPU Mandel | |
| Durchschnitt der Klasse Gaming (17585 - 128721, n=141, der letzten 2 Jahre) | |
| Durchschnittliche Intel Core i9-14900HX (32543 - 83662, n=36) | |
| Nubia RedMagic Titan 16 Pro (v6.92.6600, Gaming Mode) | |
| Lenovo Legion Pro 5 16IRX9 G9 (v6.92.6600) | |
| Acer Predator Helios Neo 16 (2024) (v6.92.6600) | |
| Schenker XMG Pro 16 Studio (Mid 24) (v6.92.6600) | |
| HP Victus 16 (2024) (v6.92.6600) | |
| Gigabyte G6X 9KG (2024) (v6.92.6600) | |
| Nubia RedMagic Titan 16 Pro | |
| AIDA64 / CPU AES | |
| Nubia RedMagic Titan 16 Pro (v6.92.6600, Gaming Mode) | |
| Durchschnittliche Intel Core i9-14900HX (86964 - 241777, n=36) | |
| Nubia RedMagic Titan 16 Pro (v6.92.6600) | |
| Lenovo Legion Pro 5 16IRX9 G9 (v6.92.6600) | |
| Durchschnitt der Klasse Gaming (19065 - 247074, n=141, der letzten 2 Jahre) | |
| Schenker XMG Pro 16 Studio (Mid 24) (v6.92.6600) | |
| Acer Predator Helios Neo 16 (2024) (v6.92.6600) | |
| HP Victus 16 (2024) (v6.92.6600) | |
| Gigabyte G6X 9KG (2024) (v6.92.6600) | |
| AIDA64 / CPU ZLib | |
| Nubia RedMagic Titan 16 Pro (v6.92.6600, Gaming Mode) | |
| Durchschnittliche Intel Core i9-14900HX (1054 - 2292, n=36) | |
| Lenovo Legion Pro 5 16IRX9 G9 (v6.92.6600) | |
| Schenker XMG Pro 16 Studio (Mid 24) (v6.92.6600) | |
| Durchschnitt der Klasse Gaming (373 - 2531, n=141, der letzten 2 Jahre) | |
| Acer Predator Helios Neo 16 (2024) (v6.92.6600) | |
| HP Victus 16 (2024) (v6.92.6600) | |
| Gigabyte G6X 9KG (2024) (v6.92.6600) | |
| Nubia RedMagic Titan 16 Pro (v6.92.6600) | |
| AIDA64 / FP64 Ray-Trace | |
| Durchschnitt der Klasse Gaming (3856 - 45446, n=141, der letzten 2 Jahre) | |
| Durchschnittliche Intel Core i9-14900HX (6809 - 18349, n=36) | |
| Lenovo Legion Pro 5 16IRX9 G9 (v6.92.6600) | |
| Nubia RedMagic Titan 16 Pro (v6.92.6600, Gaming Mode) | |
| Schenker XMG Pro 16 Studio (Mid 24) (v6.92.6600) | |
| Acer Predator Helios Neo 16 (2024) (v6.92.6600) | |
| HP Victus 16 (2024) (v6.92.6600) | |
| Gigabyte G6X 9KG (2024) (v6.92.6600) | |
| Nubia RedMagic Titan 16 Pro (v6.92.6600) | |
| AIDA64 / CPU PhotoWorxx | |
| Lenovo Legion Pro 5 16IRX9 G9 (v6.92.6600) | |
| Schenker XMG Pro 16 Studio (Mid 24) (v6.92.6600) | |
| Durchschnittliche Intel Core i9-14900HX (23903 - 54702, n=36) | |
| Acer Predator Helios Neo 16 (2024) (v6.92.6600) | |
| Durchschnitt der Klasse Gaming (10805 - 62916, n=141, der letzten 2 Jahre) | |
| HP Victus 16 (2024) (v6.92.6600) | |
| Gigabyte G6X 9KG (2024) (v6.92.6600) | |
| Nubia RedMagic Titan 16 Pro (v6.92.6600) | |
| Nubia RedMagic Titan 16 Pro (v6.92.6600, Gaming Mode) | |
System Performance
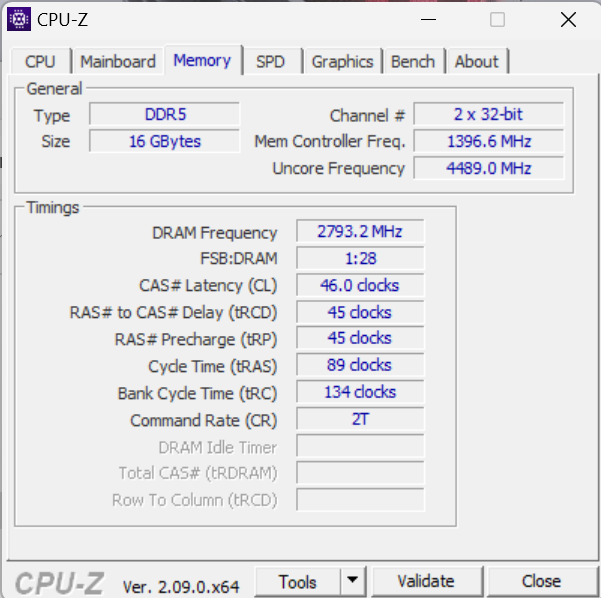
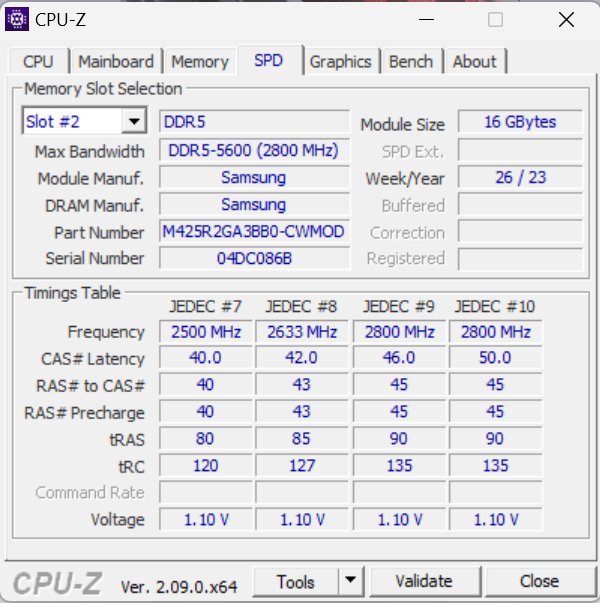
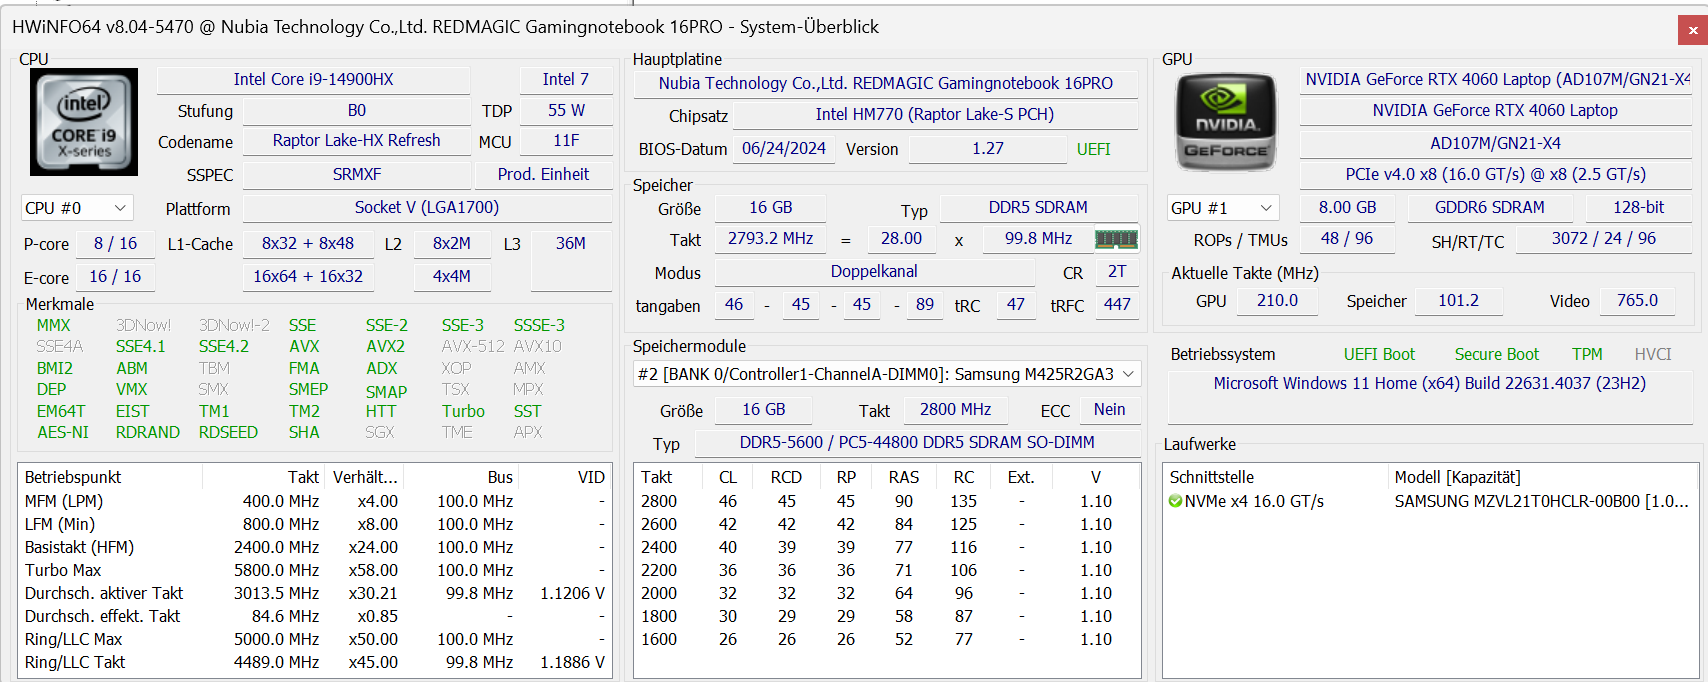
Das flüssig arbeitende System stellt genug Leistung für fordernde Anwendungsbereiche á la Gaming, Rendering, Streaming bereit. Allerdings bleibt ein Teil der Rechenpower brach liegen, da der Arbeitsspeicher (16 GB, DDR5-5600) nur im Single-Channel-Modus läuft - die im Vergleich zu den Werten der Konkurrenz niedrigen Transferraten des Speichers bestätigen es. Der Einbau eines zweiten Speichermoduls (= Dual-Channel-Modus aktiv) würde für Abhilfe sorgen.
CrossMark: Overall | Productivity | Creativity | Responsiveness
WebXPRT 3: Overall
WebXPRT 4: Overall
Mozilla Kraken 1.1: Total
| PCMark 10 / Score | |
| Acer Predator Helios Neo 16 (2024) | |
| Lenovo Legion Pro 5 16IRX9 G9 | |
| Schenker XMG Pro 16 Studio (Mid 24) | |
| Durchschnittliche Intel Core i9-14900HX, NVIDIA GeForce RTX 4060 Laptop GPU (7830 - 8322, n=2) | |
| Durchschnitt der Klasse Gaming (5776 - 9647, n=120, der letzten 2 Jahre) | |
| Nubia RedMagic Titan 16 Pro | |
| Gigabyte G6X 9KG (2024) | |
| HP Victus 16 (2024) | |
| PCMark 10 / Essentials | |
| Acer Predator Helios Neo 16 (2024) | |
| Durchschnittliche Intel Core i9-14900HX, NVIDIA GeForce RTX 4060 Laptop GPU (11022 - 11413, n=2) | |
| Lenovo Legion Pro 5 16IRX9 G9 | |
| Nubia RedMagic Titan 16 Pro | |
| HP Victus 16 (2024) | |
| Durchschnitt der Klasse Gaming (8840 - 12600, n=124, der letzten 2 Jahre) | |
| Schenker XMG Pro 16 Studio (Mid 24) | |
| Gigabyte G6X 9KG (2024) | |
| PCMark 10 / Productivity | |
| Schenker XMG Pro 16 Studio (Mid 24) | |
| Acer Predator Helios Neo 16 (2024) | |
| Gigabyte G6X 9KG (2024) | |
| Durchschnittliche Intel Core i9-14900HX, NVIDIA GeForce RTX 4060 Laptop GPU (9776 - 10558, n=2) | |
| HP Victus 16 (2024) | |
| Lenovo Legion Pro 5 16IRX9 G9 | |
| Durchschnitt der Klasse Gaming (6662 - 14612, n=120, der letzten 2 Jahre) | |
| Nubia RedMagic Titan 16 Pro | |
| PCMark 10 / Digital Content Creation | |
| Lenovo Legion Pro 5 16IRX9 G9 | |
| Durchschnitt der Klasse Gaming (7440 - 19351, n=120, der letzten 2 Jahre) | |
| Acer Predator Helios Neo 16 (2024) | |
| Durchschnittliche Intel Core i9-14900HX, NVIDIA GeForce RTX 4060 Laptop GPU (12091 - 12979, n=2) | |
| Schenker XMG Pro 16 Studio (Mid 24) | |
| Nubia RedMagic Titan 16 Pro | |
| Gigabyte G6X 9KG (2024) | |
| HP Victus 16 (2024) | |
| CrossMark / Overall | |
| Acer Predator Helios Neo 16 (2024) | |
| Durchschnittliche Intel Core i9-14900HX, NVIDIA GeForce RTX 4060 Laptop GPU (2103 - 2184, n=2) | |
| Lenovo Legion Pro 5 16IRX9 G9 | |
| Nubia RedMagic Titan 16 Pro | |
| Schenker XMG Pro 16 Studio (Mid 24) | |
| Durchschnitt der Klasse Gaming (1247 - 2344, n=115, der letzten 2 Jahre) | |
| Gigabyte G6X 9KG (2024) | |
| HP Victus 16 (2024) | |
| CrossMark / Productivity | |
| Acer Predator Helios Neo 16 (2024) | |
| Nubia RedMagic Titan 16 Pro | |
| Durchschnittliche Intel Core i9-14900HX, NVIDIA GeForce RTX 4060 Laptop GPU (2040 - 2042, n=2) | |
| Lenovo Legion Pro 5 16IRX9 G9 | |
| Schenker XMG Pro 16 Studio (Mid 24) | |
| Gigabyte G6X 9KG (2024) | |
| Durchschnitt der Klasse Gaming (1299 - 2211, n=115, der letzten 2 Jahre) | |
| HP Victus 16 (2024) | |
| CrossMark / Creativity | |
| Acer Predator Helios Neo 16 (2024) | |
| Lenovo Legion Pro 5 16IRX9 G9 | |
| Schenker XMG Pro 16 Studio (Mid 24) | |
| Durchschnittliche Intel Core i9-14900HX, NVIDIA GeForce RTX 4060 Laptop GPU (2240 - 2472, n=2) | |
| Nubia RedMagic Titan 16 Pro | |
| Durchschnitt der Klasse Gaming (1275 - 2729, n=115, der letzten 2 Jahre) | |
| HP Victus 16 (2024) | |
| Gigabyte G6X 9KG (2024) | |
| CrossMark / Responsiveness | |
| Acer Predator Helios Neo 16 (2024) | |
| Gigabyte G6X 9KG (2024) | |
| Nubia RedMagic Titan 16 Pro | |
| Lenovo Legion Pro 5 16IRX9 G9 | |
| Durchschnittliche Intel Core i9-14900HX, NVIDIA GeForce RTX 4060 Laptop GPU (1849 - 1899, n=2) | |
| HP Victus 16 (2024) | |
| Schenker XMG Pro 16 Studio (Mid 24) | |
| Durchschnitt der Klasse Gaming (1030 - 2330, n=115, der letzten 2 Jahre) | |
| WebXPRT 3 / Overall | |
| Durchschnittliche Intel Core i9-14900HX, NVIDIA GeForce RTX 4060 Laptop GPU (329 - 339, n=2) | |
| Nubia RedMagic Titan 16 Pro | |
| Acer Predator Helios Neo 16 (2024) | |
| Schenker XMG Pro 16 Studio (Mid 24) | |
| Durchschnitt der Klasse Gaming (237 - 532, n=120, der letzten 2 Jahre) | |
| Gigabyte G6X 9KG (2024) | |
| Lenovo Legion Pro 5 16IRX9 G9 | |
| HP Victus 16 (2024) | |
| WebXPRT 4 / Overall | |
| Durchschnittliche Intel Core i9-14900HX, NVIDIA GeForce RTX 4060 Laptop GPU (309 - 319, n=2) | |
| Nubia RedMagic Titan 16 Pro | |
| Acer Predator Helios Neo 16 (2024) | |
| Schenker XMG Pro 16 Studio (Mid 24) | |
| Durchschnitt der Klasse Gaming (176.4 - 345, n=115, der letzten 2 Jahre) | |
| Lenovo Legion Pro 5 16IRX9 G9 | |
| Gigabyte G6X 9KG (2024) | |
| HP Victus 16 (2024) | |
| Mozilla Kraken 1.1 / Total | |
| HP Victus 16 (2024) | |
| Gigabyte G6X 9KG (2024) | |
| Durchschnitt der Klasse Gaming (397 - 674, n=129, der letzten 2 Jahre) | |
| Lenovo Legion Pro 5 16IRX9 G9 | |
| Schenker XMG Pro 16 Studio (Mid 24) | |
| Acer Predator Helios Neo 16 (2024) | |
| Nubia RedMagic Titan 16 Pro | |
| Durchschnittliche Intel Core i9-14900HX, NVIDIA GeForce RTX 4060 Laptop GPU (430 - 439, n=2) | |
* ... kleinere Werte sind besser
| PCMark 10 Score | 7830 Punkte | |
Hilfe | ||
| AIDA64 / Memory Copy | |
| Schenker XMG Pro 16 Studio (Mid 24) | |
| Lenovo Legion Pro 5 16IRX9 G9 | |
| Acer Predator Helios Neo 16 (2024) | |
| Durchschnittliche Intel Core i9-14900HX (38028 - 83392, n=36) | |
| Durchschnitt der Klasse Gaming (21750 - 104987, n=141, der letzten 2 Jahre) | |
| HP Victus 16 (2024) | |
| Gigabyte G6X 9KG (2024) | |
| Nubia RedMagic Titan 16 Pro | |
| AIDA64 / Memory Read | |
| Lenovo Legion Pro 5 16IRX9 G9 | |
| Schenker XMG Pro 16 Studio (Mid 24) | |
| Acer Predator Helios Neo 16 (2024) | |
| Durchschnittliche Intel Core i9-14900HX (43306 - 87568, n=36) | |
| HP Victus 16 (2024) | |
| Durchschnitt der Klasse Gaming (22956 - 104349, n=141, der letzten 2 Jahre) | |
| Gigabyte G6X 9KG (2024) | |
| Nubia RedMagic Titan 16 Pro | |
| AIDA64 / Memory Write | |
| Lenovo Legion Pro 5 16IRX9 G9 | |
| Schenker XMG Pro 16 Studio (Mid 24) | |
| Durchschnitt der Klasse Gaming (22297 - 133486, n=141, der letzten 2 Jahre) | |
| Durchschnittliche Intel Core i9-14900HX (37146 - 80589, n=36) | |
| Acer Predator Helios Neo 16 (2024) | |
| HP Victus 16 (2024) | |
| Gigabyte G6X 9KG (2024) | |
| Nubia RedMagic Titan 16 Pro | |
| AIDA64 / Memory Latency | |
| Durchschnitt der Klasse Gaming (59.5 - 259, n=141, der letzten 2 Jahre) | |
| HP Victus 16 (2024) | |
| Acer Predator Helios Neo 16 (2024) | |
| Gigabyte G6X 9KG (2024) | |
| Durchschnittliche Intel Core i9-14900HX (76.1 - 105, n=36) | |
| Schenker XMG Pro 16 Studio (Mid 24) | |
| Lenovo Legion Pro 5 16IRX9 G9 | |
| Nubia RedMagic Titan 16 Pro | |
* ... kleinere Werte sind besser
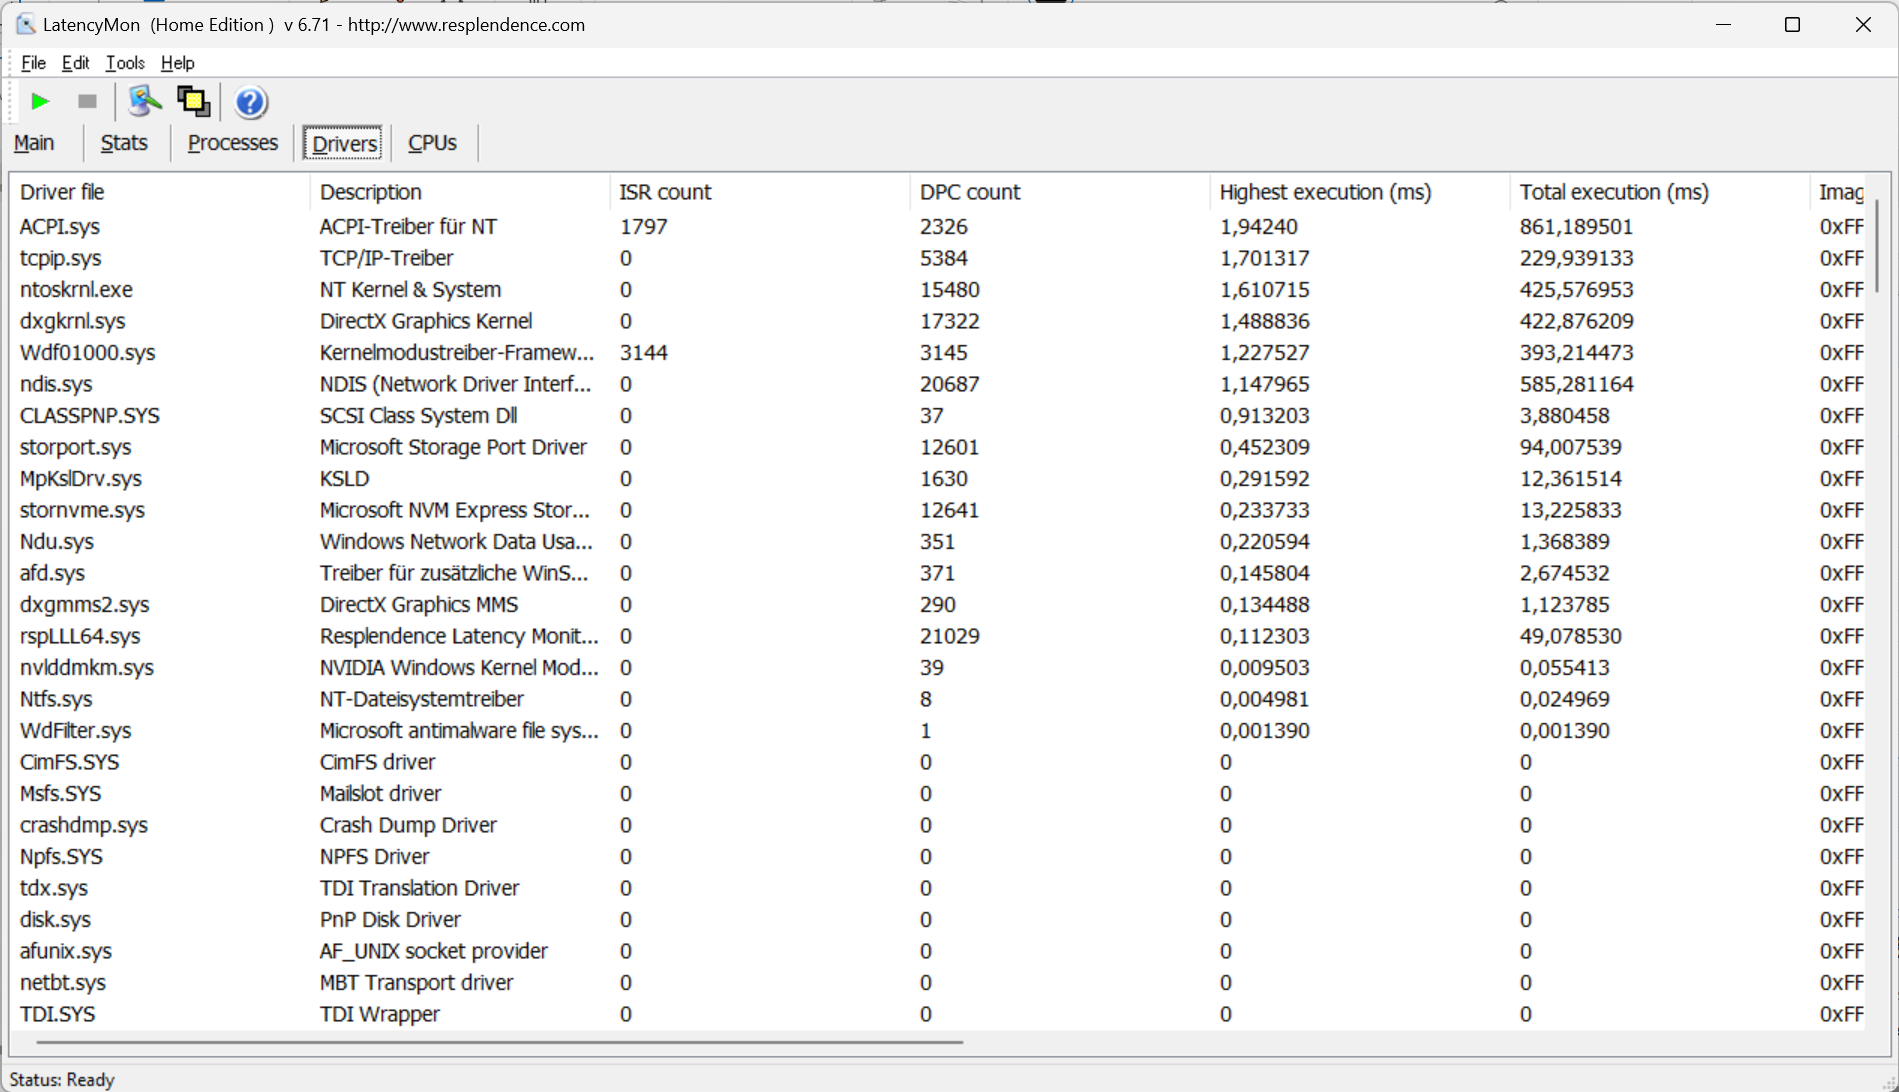
DPC-Latenzen
Hohe Latenzen verhindern Video- und Audiobearbeitung in Echtzeit. Zukünftige Software-Updates könnten zu Verbesserungen oder auch Verschlechterungen führen.
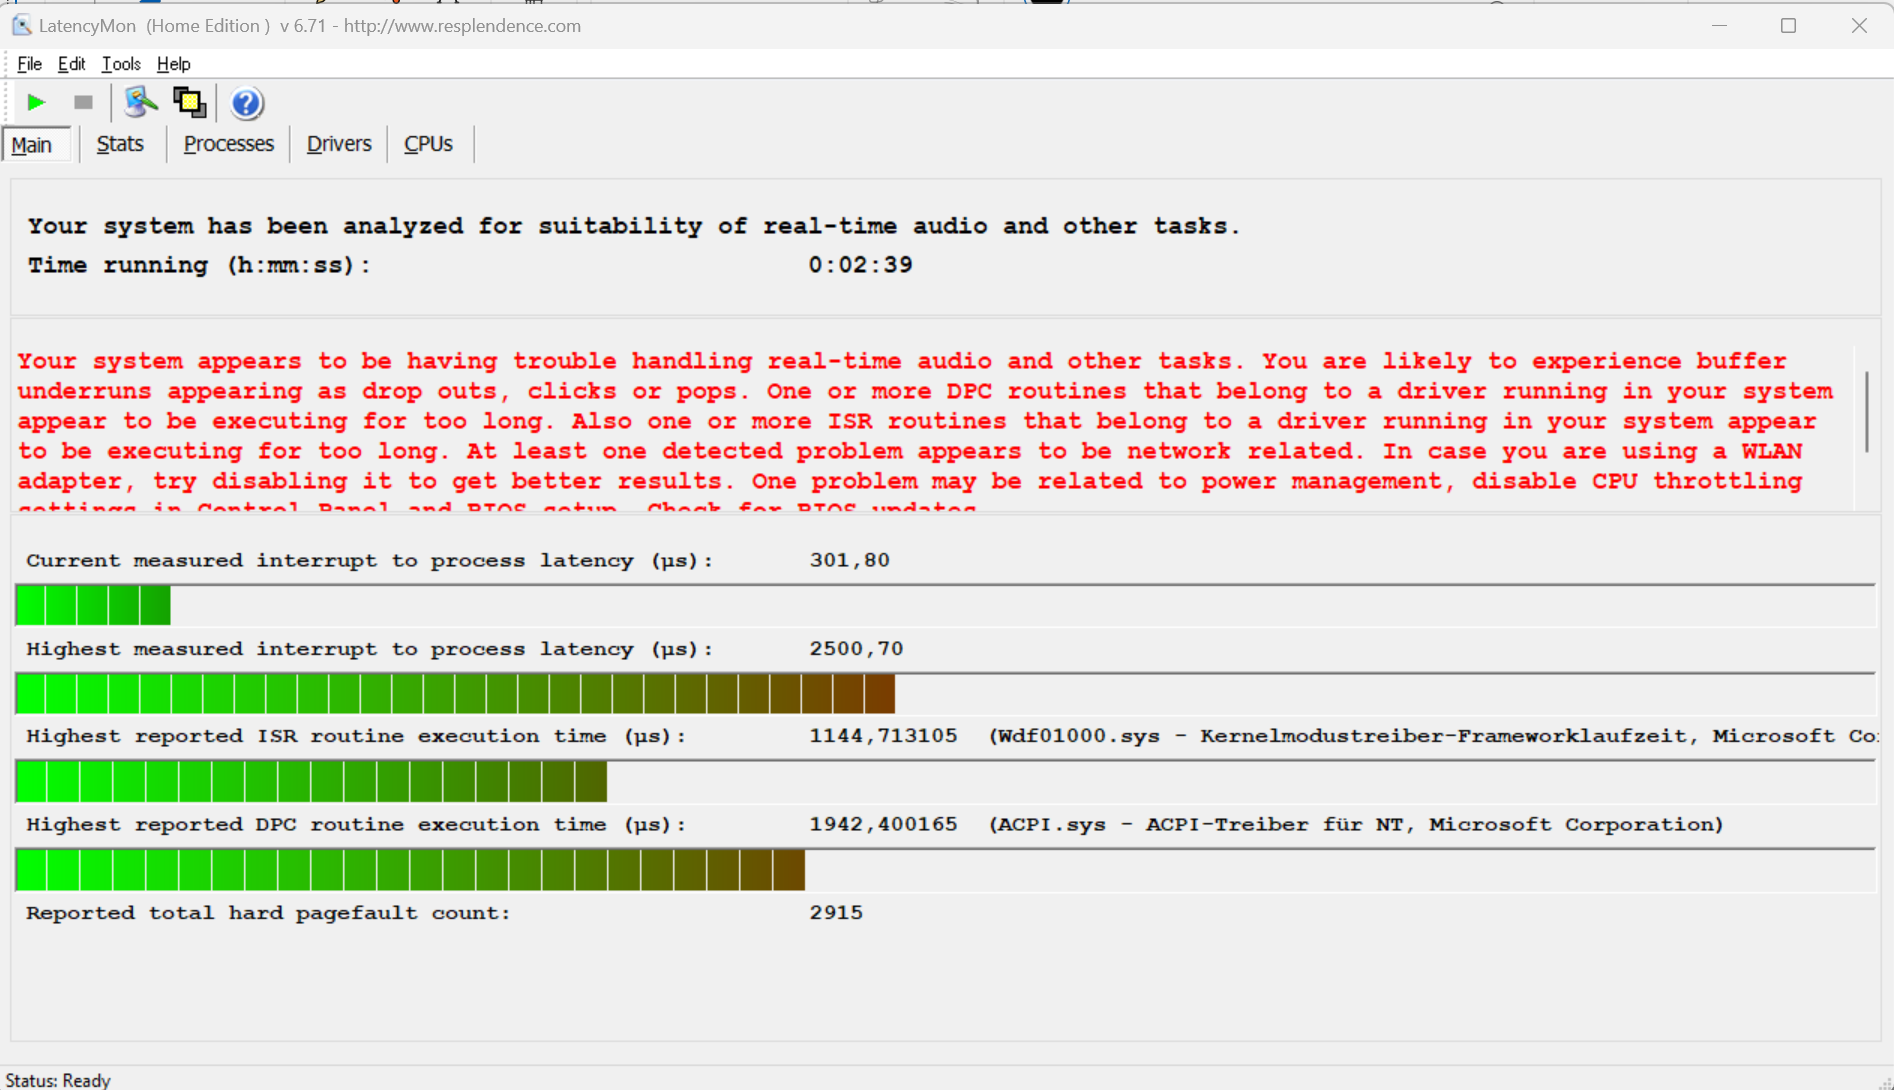
| DPC Latencies / LatencyMon - interrupt to process latency (max), Web, Youtube, Prime95 | |
| Nubia RedMagic Titan 16 Pro | |
| Gigabyte G6X 9KG (2024) | |
| Schenker XMG Pro 16 Studio (Mid 24) | |
| Acer Predator Helios Neo 16 (2024) | |
| Lenovo Legion Pro 5 16IRX9 G9 | |
| HP Victus 16 (2024) | |
* ... kleinere Werte sind besser
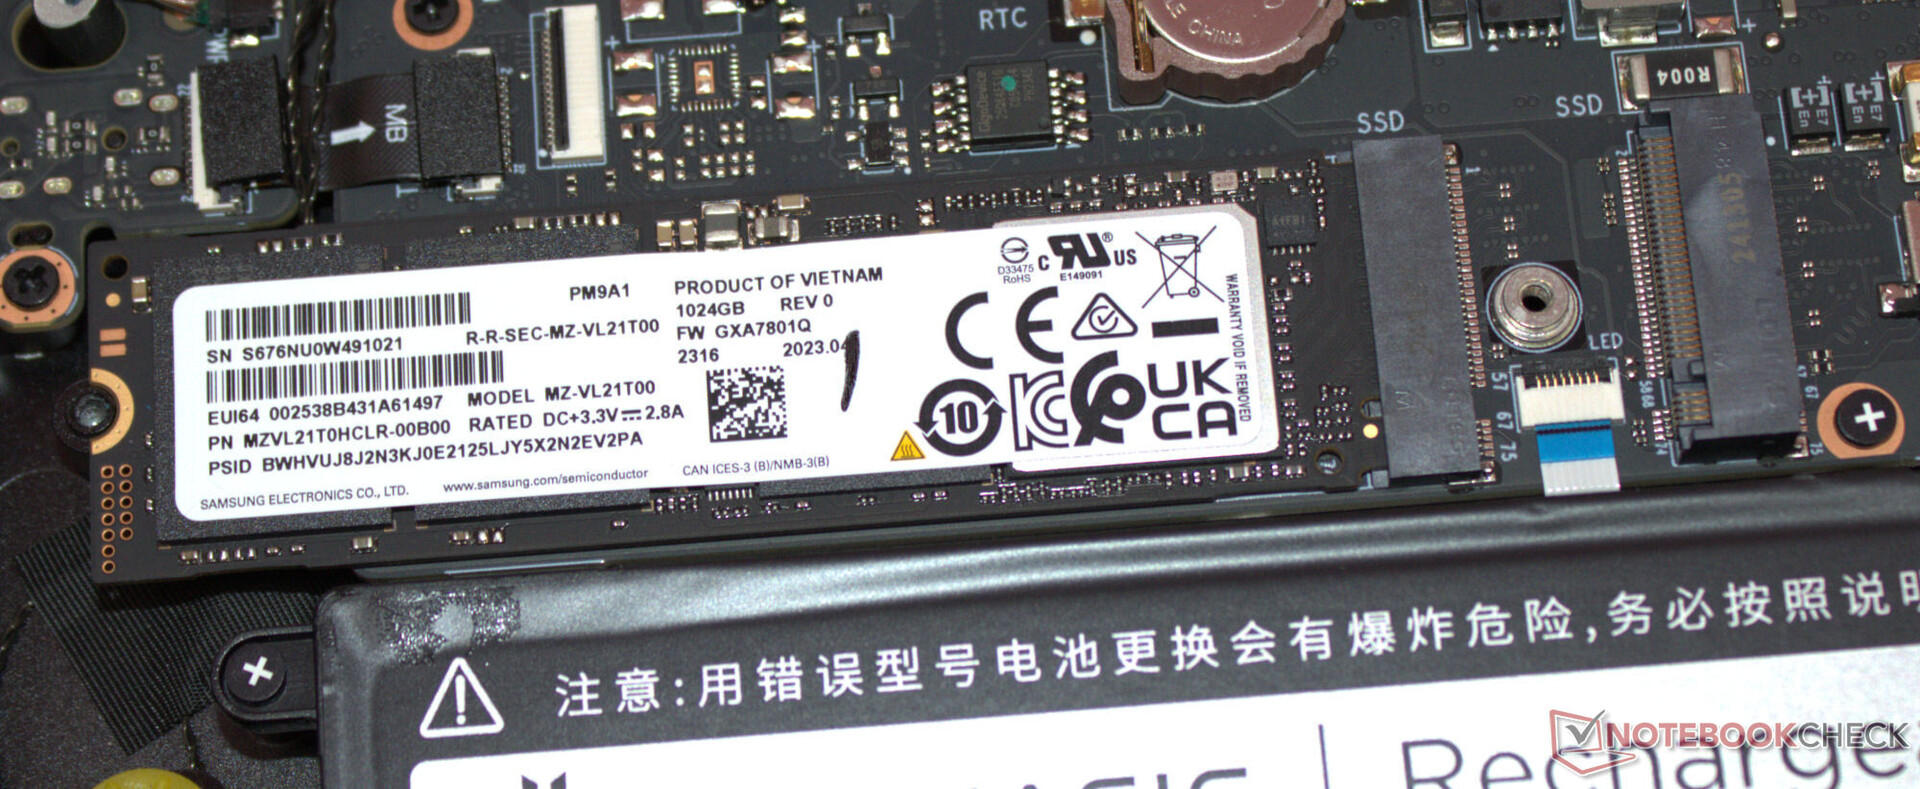
Massenspeicher
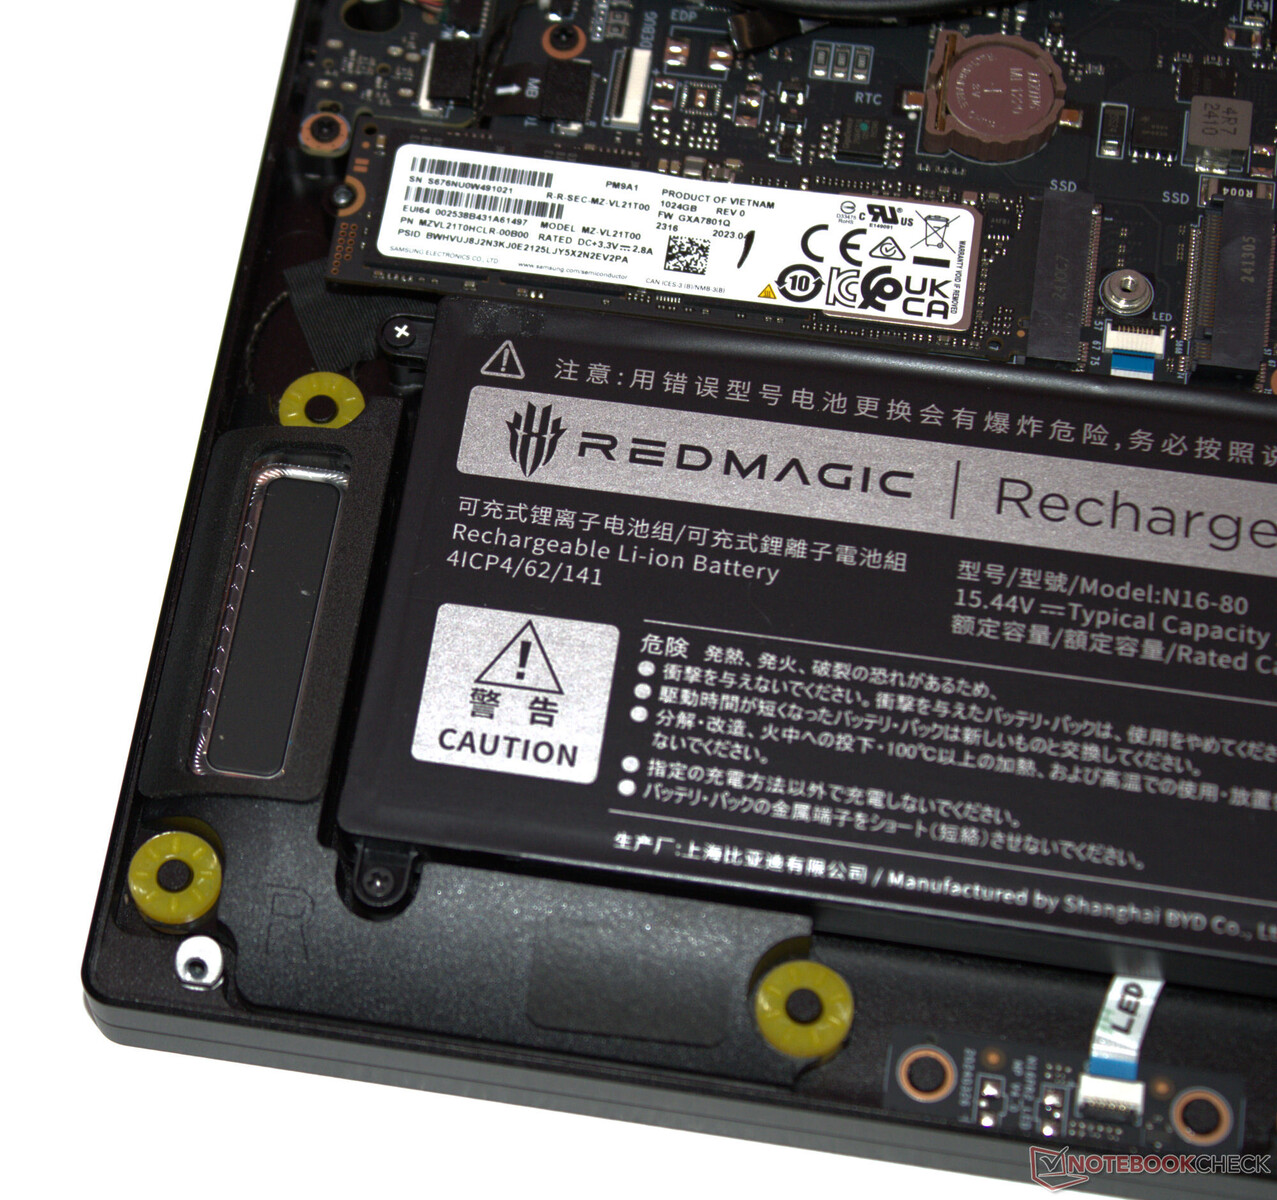
Die PCIe-4-SSD (M.2-2280) der Firma Samsung bietet eine Speicherkapazität von 1 TB und liefert sehr gute Datenraten. Positiv: Eine thermisch bedingte Drosselung konnte nicht beobachtet werden. Das Notebook bietet Platz für eine zweite PCIe-4-SSD.

* ... kleinere Werte sind besser
Dauerleistung Lesen: DiskSpd Read Loop, Queue Depth 8
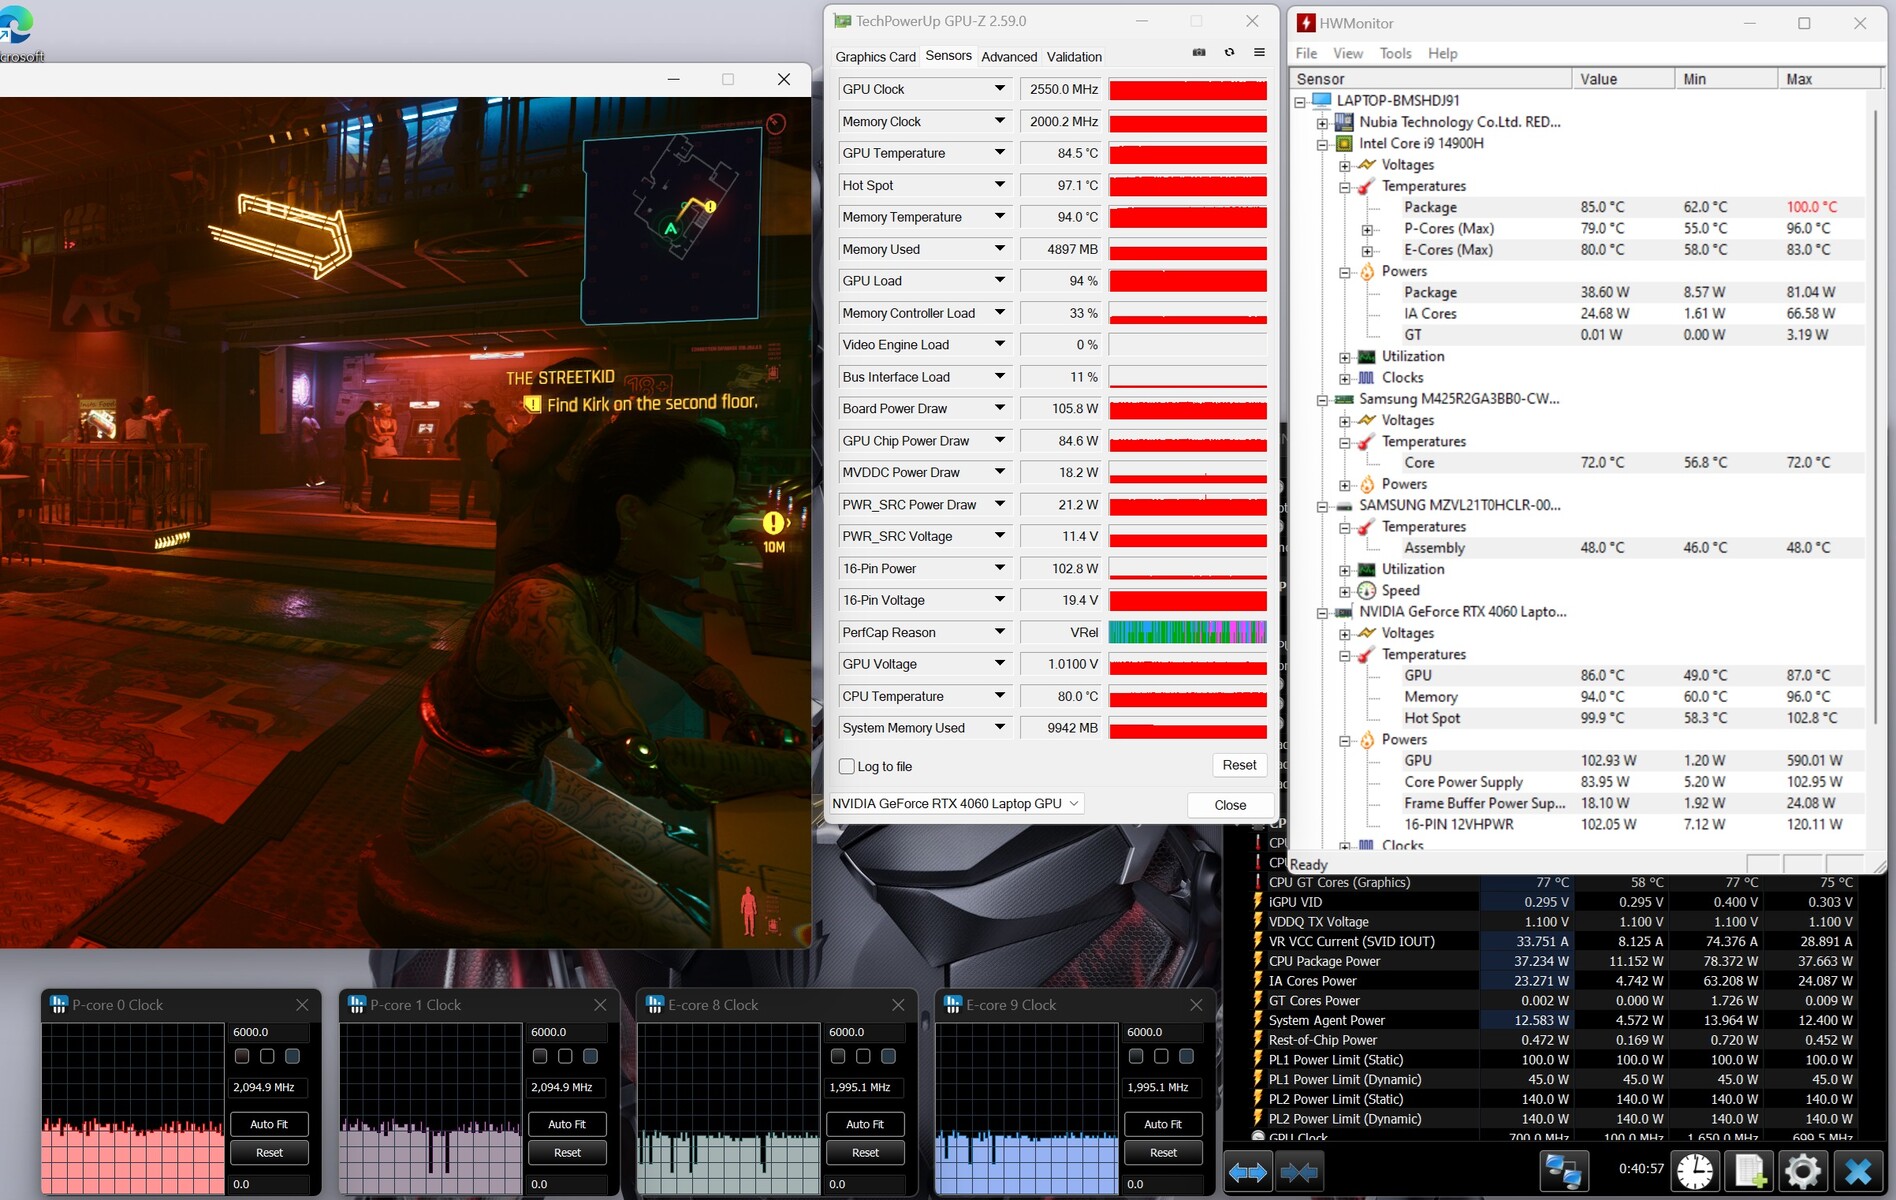
Grafikkarte
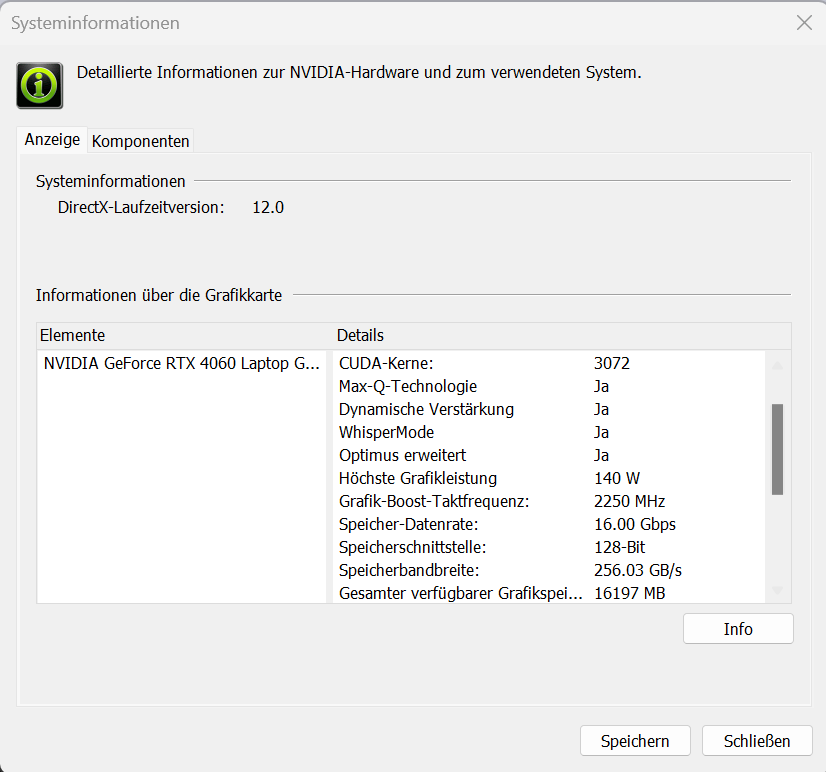
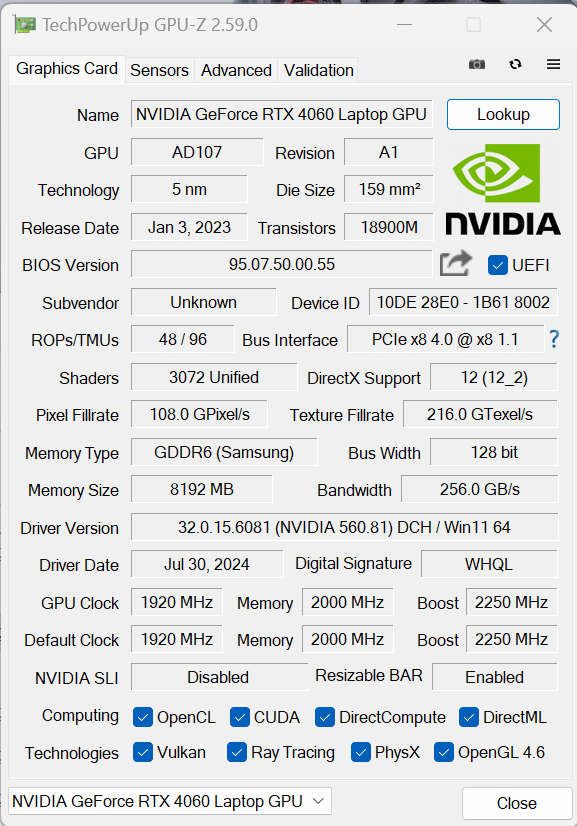
Die GeForce RTX 4060 (3.072 Shader, 128 Bit Bus, 8 GB GDDR6) repräsentiert aktuell die (untere) Gaming-Mittelklasse. Nubia gewährt eine maximale TGP von 140 Watt - mehr ist nicht möglich. Die Benchmarkresultate bewegen sich etwas oberhalb des RTX-4060-Schnitts ("Balance Mode"). "Gaming Mode" bewirkt keinen Anstieg. Der Wechsel zwischen dGPU und Optimus erfordert keinen Neustart - Advanced Optimus wird unterstützt.

| 3DMark Performance Rating - Percent | |
| Durchschnitt der Klasse Gaming | |
| Acer Predator Helios Neo 16 (2024) | |
| Schenker XMG Pro 16 Studio (Mid 24) | |
| Lenovo Legion Pro 5 16IRX9 G9 | |
| Nubia RedMagic Titan 16 Pro | |
| Nubia RedMagic Titan 16 Pro | |
| Gigabyte G6X 9KG (2024) | |
| HP Victus 16 (2024) | |
| Durchschnittliche NVIDIA GeForce RTX 4060 Laptop GPU | |
| 3DMark 11 - 1280x720 Performance GPU | |
| Durchschnitt der Klasse Gaming (13523 - 80022, n=137, der letzten 2 Jahre) | |
| Acer Predator Helios Neo 16 (2024) | |
| Schenker XMG Pro 16 Studio (Mid 24) | |
| Lenovo Legion Pro 5 16IRX9 G9 | |
| Nubia RedMagic Titan 16 Pro (Gaming Mode) | |
| Nubia RedMagic Titan 16 Pro | |
| Gigabyte G6X 9KG (2024) | |
| HP Victus 16 (2024) | |
| Durchschnittliche NVIDIA GeForce RTX 4060 Laptop GPU (28136 - 38912, n=57) | |
| 3DMark | |
| 1920x1080 Fire Strike Graphics | |
| Durchschnitt der Klasse Gaming (6487 - 62849, n=150, der letzten 2 Jahre) | |
| Acer Predator Helios Neo 16 (2024) | |
| Schenker XMG Pro 16 Studio (Mid 24) | |
| Lenovo Legion Pro 5 16IRX9 G9 | |
| Gigabyte G6X 9KG (2024) | |
| HP Victus 16 (2024) | |
| Nubia RedMagic Titan 16 Pro (Gaming Mode) | |
| Nubia RedMagic Titan 16 Pro | |
| Durchschnittliche NVIDIA GeForce RTX 4060 Laptop GPU (20533 - 29656, n=54) | |
| 2560x1440 Time Spy Graphics | |
| Durchschnitt der Klasse Gaming (2295 - 25984, n=147, der letzten 2 Jahre) | |
| Acer Predator Helios Neo 16 (2024) | |
| Schenker XMG Pro 16 Studio (Mid 24) | |
| Lenovo Legion Pro 5 16IRX9 G9 | |
| Nubia RedMagic Titan 16 Pro (Gaming Mode) | |
| Nubia RedMagic Titan 16 Pro | |
| Durchschnittliche NVIDIA GeForce RTX 4060 Laptop GPU (7484 - 11451, n=56) | |
| HP Victus 16 (2024) | |
| Gigabyte G6X 9KG (2024) | |
| 3DMark 06 Standard Score | 55770 Punkte | |
| 3DMark 11 Performance | 28427 Punkte | |
| 3DMark Fire Strike Score | 22307 Punkte | |
| 3DMark Time Spy Score | 10789 Punkte | |
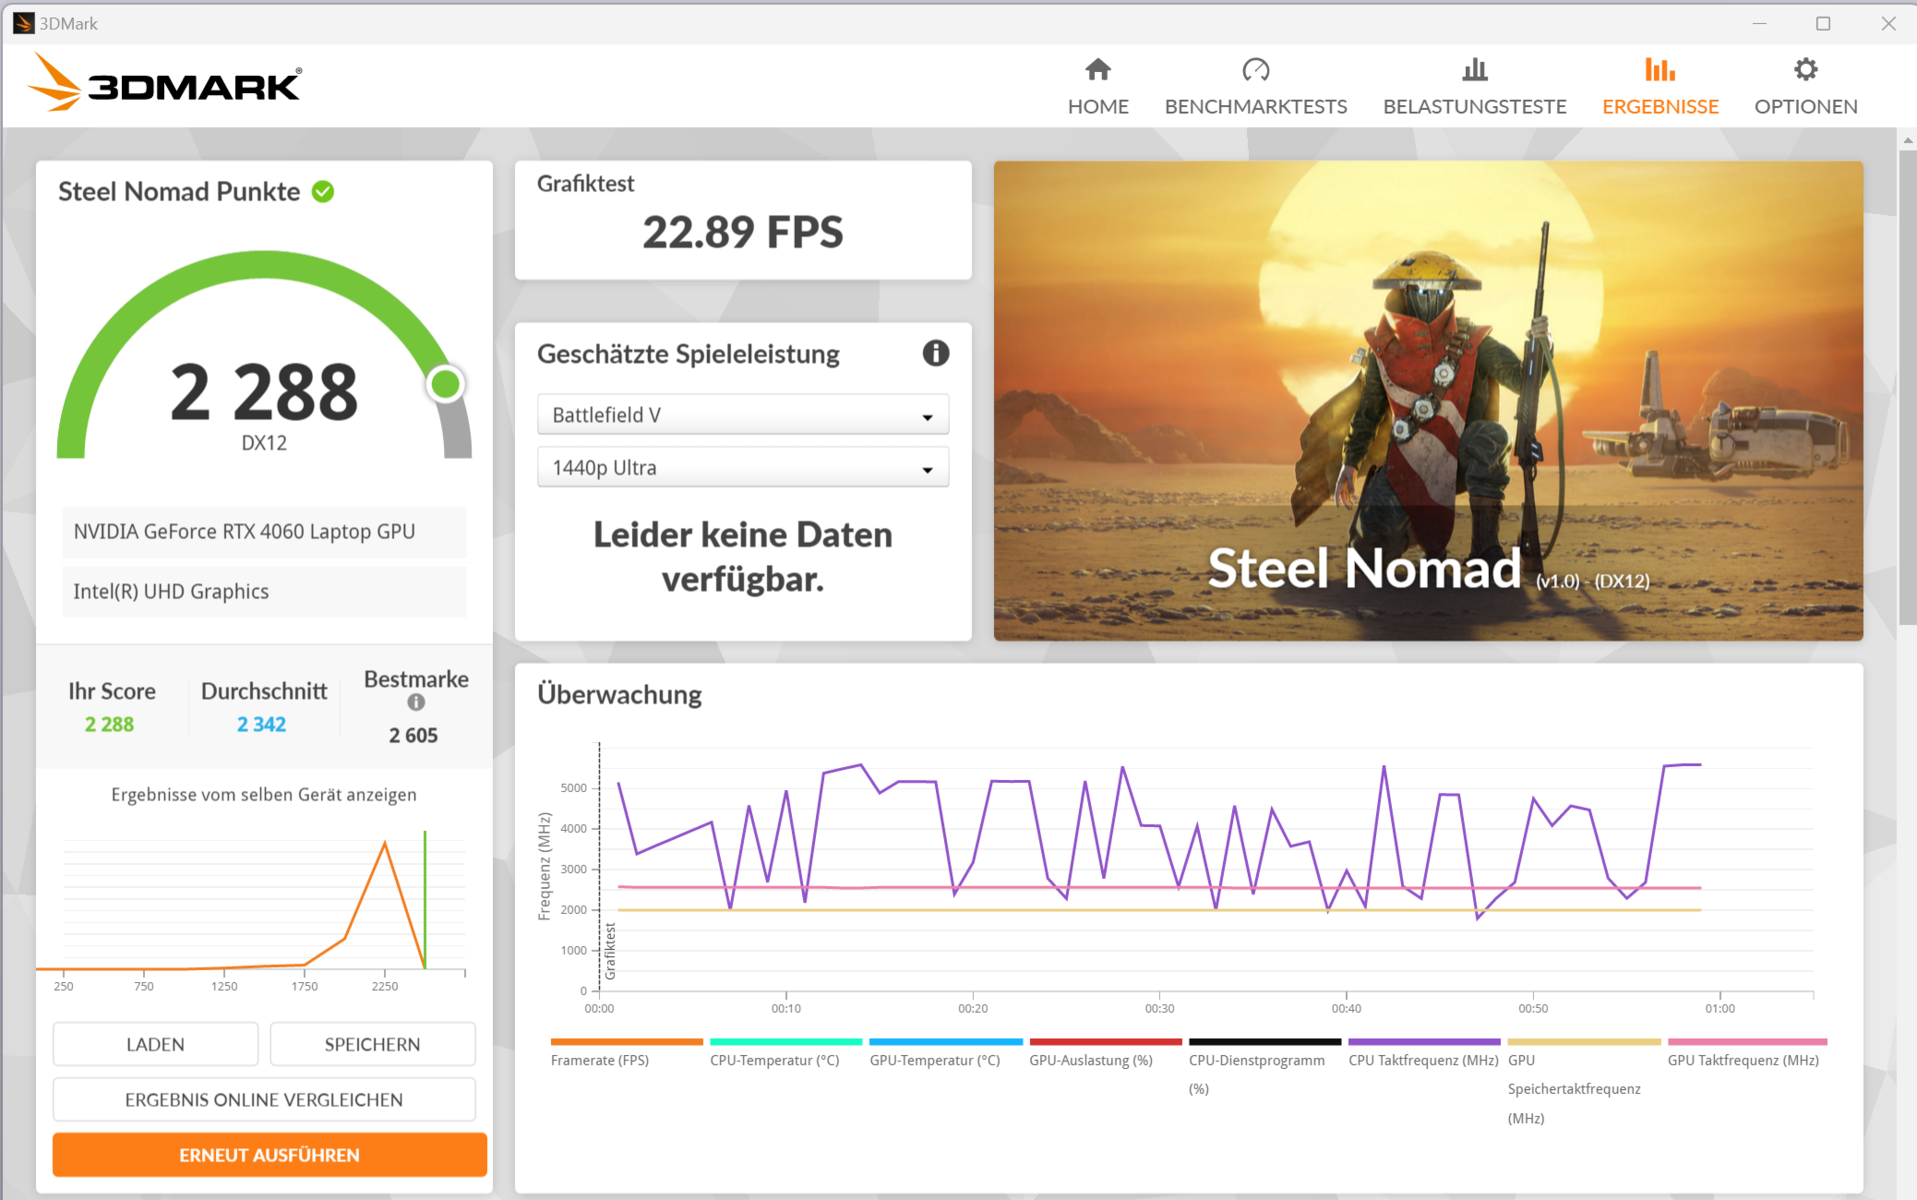
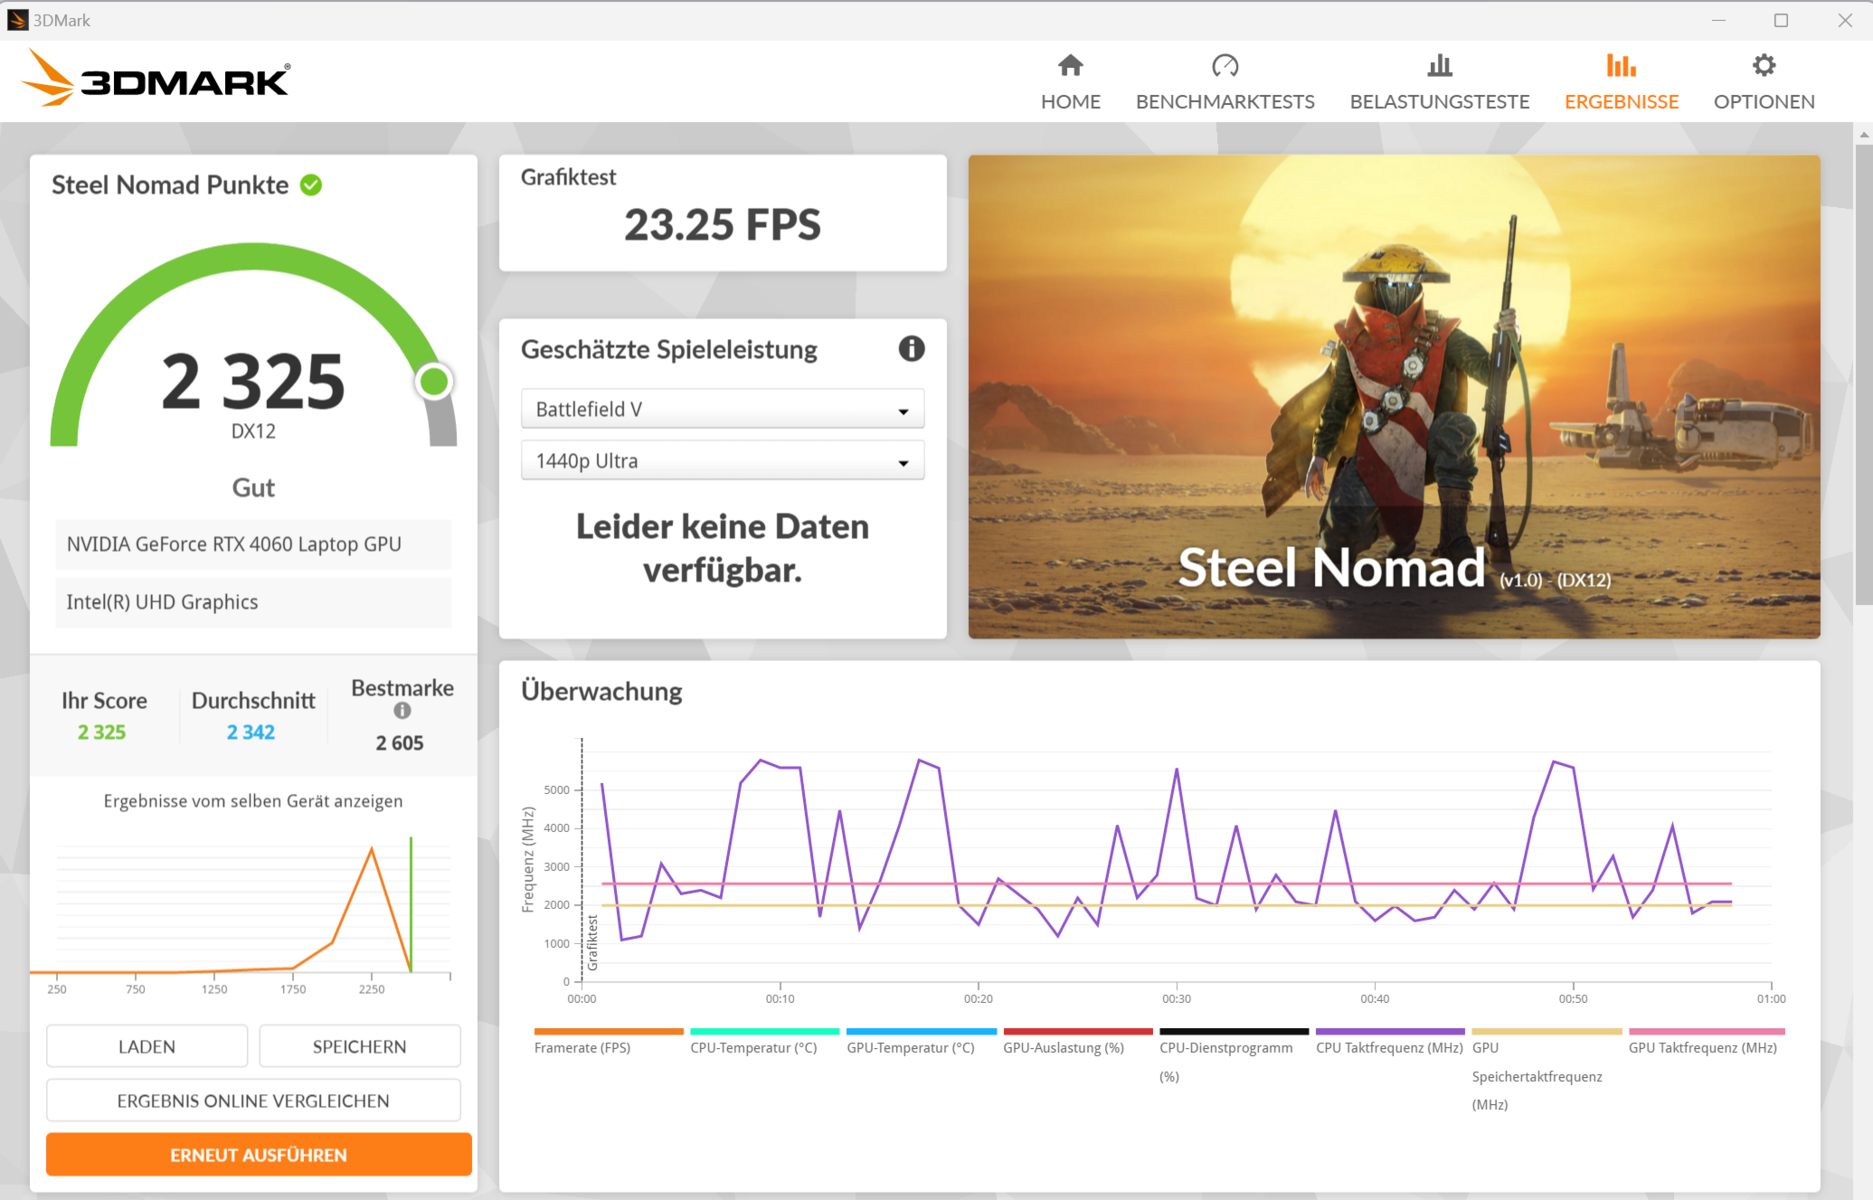
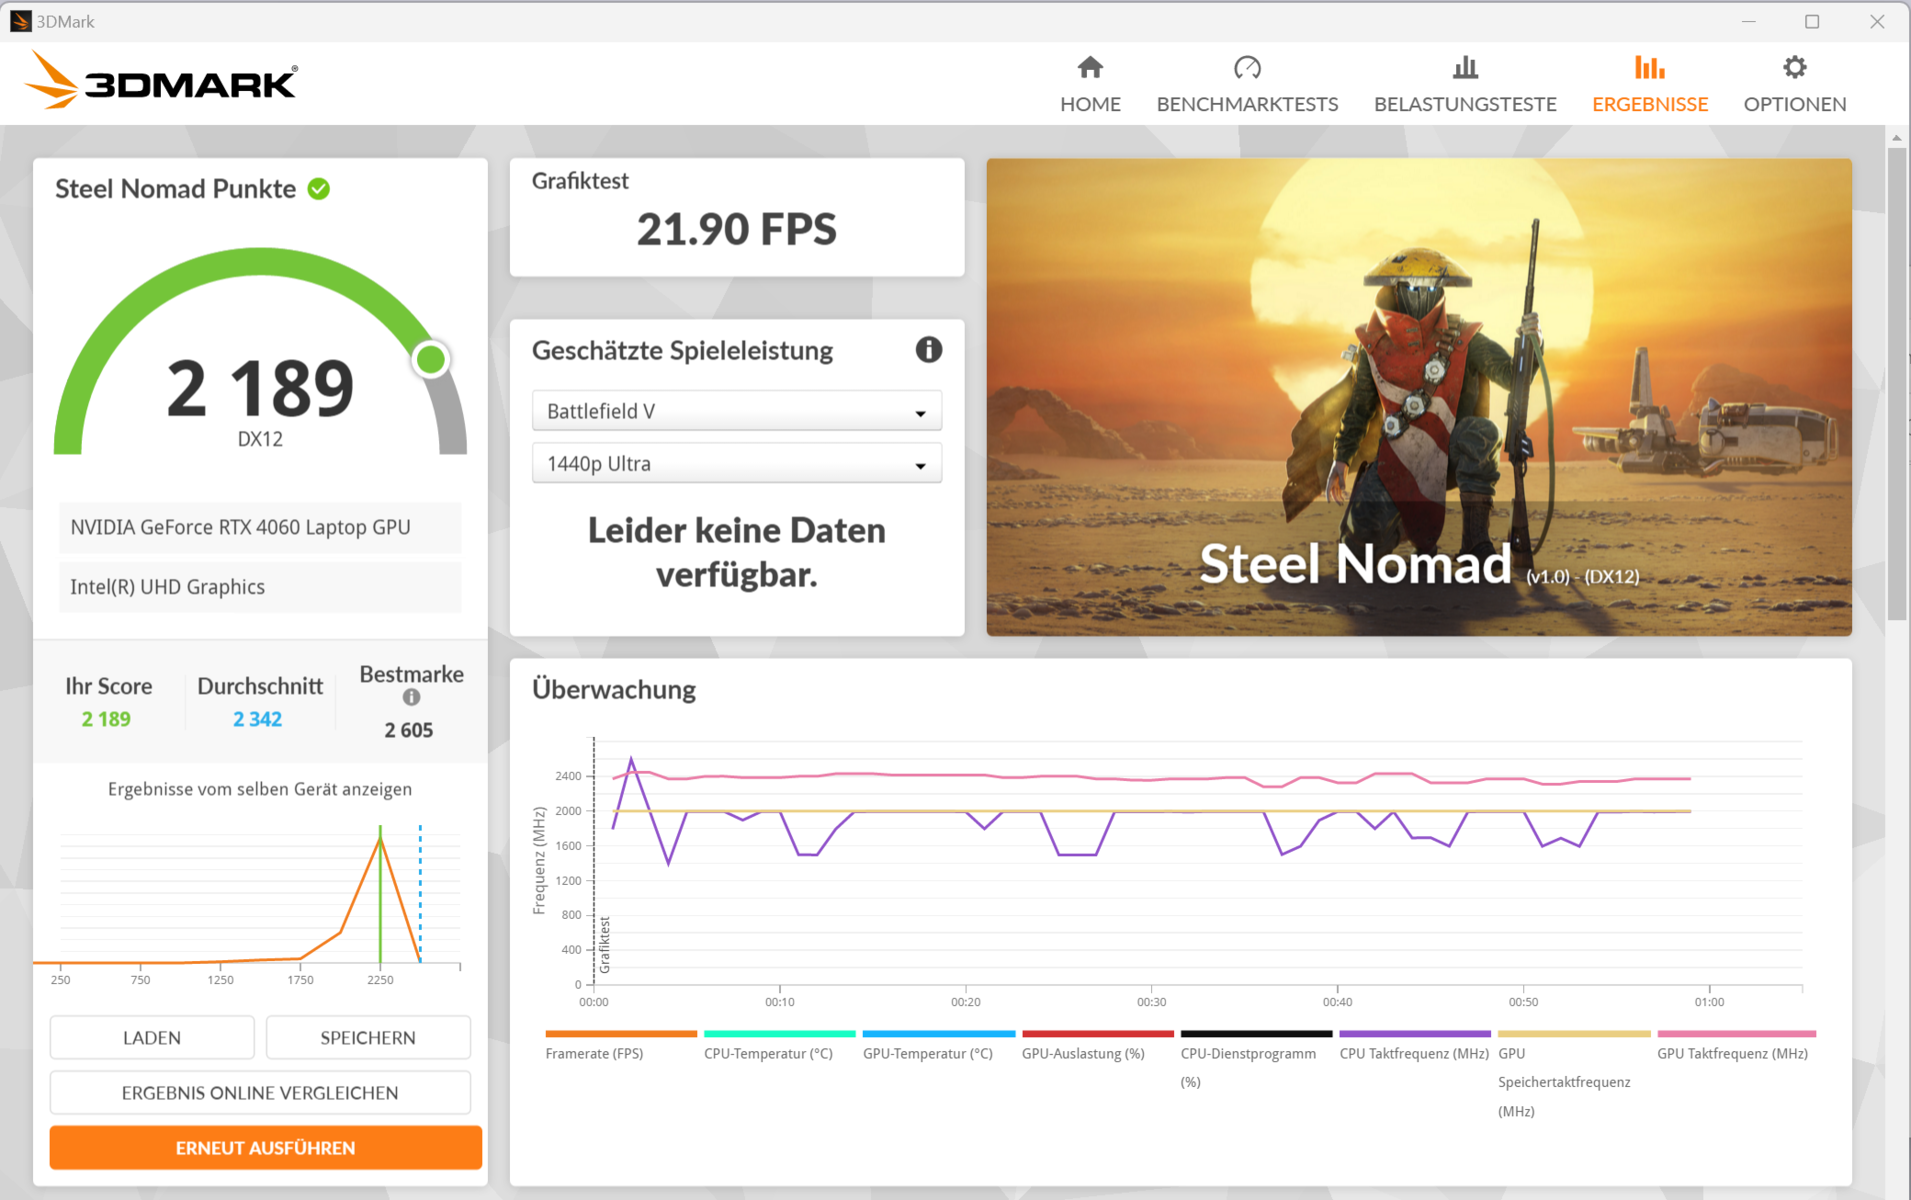
| 3DMark Steel Nomad Score | 2288 Punkte | |
Hilfe | ||
| Geekbench 6.5 | |
| GPU OpenCL | |
| Durchschnitt der Klasse Gaming (21284 - 253130, n=138, der letzten 2 Jahre) | |
| Acer Predator Helios Neo 16 (2024) (6.2.1) | |
| Schenker XMG Pro 16 Studio (Mid 24) (6.2.1) | |
| Nubia RedMagic Titan 16 Pro (6.2.1, Gaming Mode) | |
| Nubia RedMagic Titan 16 Pro (6.2.1) | |
| Gigabyte G6X 9KG (2024) (6.2.1) | |
| HP Victus 16 (2024) (6.2.1) | |
| Durchschnittliche NVIDIA GeForce RTX 4060 Laptop GPU (76525 - 100831, n=39) | |
| Lenovo Legion Pro 5 16IRX9 G9 (6.2.1) | |
| GPU Vulkan | |
| Schenker XMG Pro 16 Studio (Mid 24) (6.2.1) | |
| Nubia RedMagic Titan 16 Pro (6.2.1, Gaming Mode) | |
| Gigabyte G6X 9KG (2024) (6.2.1) | |
| Durchschnitt der Klasse Gaming (4787 - 231659, n=114, der letzten 2 Jahre) | |
| Acer Predator Helios Neo 16 (2024) (6.2.1) | |
| HP Victus 16 (2024) (6.2.1) | |
| Nubia RedMagic Titan 16 Pro (6.2.1) | |
| Lenovo Legion Pro 5 16IRX9 G9 (6.2.1) | |
| Durchschnittliche NVIDIA GeForce RTX 4060 Laptop GPU (15985 - 101001, n=32) | |
| V-Ray Benchmark Next 4.10 | |
| GPU | |
| Durchschnitt der Klasse Gaming (54 - 1333, n=128, der letzten 2 Jahre) | |
| Lenovo Legion Pro 5 16IRX9 G9 (v4.10.07 ) | |
| Acer Predator Helios Neo 16 (2024) (v4.10.07 ) | |
| Gigabyte G6X 9KG (2024) (v4.10.07 ) | |
| Nubia RedMagic Titan 16 Pro (v4.10.07 ) | |
| Nubia RedMagic Titan 16 Pro (v4.10.07, Gaming Mode ) | |
| Durchschnittliche NVIDIA GeForce RTX 4060 Laptop GPU (483 - 715, n=46) | |
| HP Victus 16 (2024) (v4.10.07 ) | |
| Schenker XMG Pro 16 Studio (Mid 24) (v4.10.07 ) | |
| CPU | |
| Nubia RedMagic Titan 16 Pro (v4.10.07, Gaming Mode) | |
| Lenovo Legion Pro 5 16IRX9 G9 (v4.10.07 ) | |
| Schenker XMG Pro 16 Studio (Mid 24) (v4.10.07 ) | |
| Durchschnitt der Klasse Gaming (6122 - 45327, n=128, der letzten 2 Jahre) | |
| Acer Predator Helios Neo 16 (2024) (v4.10.07 ) | |
| HP Victus 16 (2024) (v4.10.07 ) | |
| Durchschnittliche NVIDIA GeForce RTX 4060 Laptop GPU (12680 - 32360, n=46) | |
| Gigabyte G6X 9KG (2024) (v4.10.07 ) | |
| Nubia RedMagic Titan 16 Pro (v4.10.07 ) | |
* ... kleinere Werte sind besser
Gaming Performance
Das Titan ist auf QHD-Gaming bei hohen bis maximalen Settings ausgelegt. Die verbaute Hardware generiert Frameraten leicht oberhalb des RTX-4060-Schnitts ("Balance Mode"). Das Profil "Gaming Mode" bewirkt ein Plus bei Spielen, die von der dann größeren CPU-Leistung profitieren - namentlich Dota 2 Reborn und X-Plane 11. Die Grafikleistung fällt ansonsten identisch aus.
| Cyberpunk 2077 - 1920x1080 Ultra Preset (FSR off) | |
| Durchschnitt der Klasse Gaming (17.7 - 169.9, n=144, der letzten 2 Jahre) | |
| Acer Predator Helios Neo 16 (2024) (2.02) | |
| Schenker XMG Pro 16 Studio (Mid 24) (2.12) | |
| Lenovo Legion Pro 5 16IRX9 G9 (2.12) | |
| Nubia RedMagic Titan 16 Pro (2.12, Gaming Mode) | |
| Nubia RedMagic Titan 16 Pro (2.12) | |
| Durchschnittliche NVIDIA GeForce RTX 4060 Laptop GPU (56.4 - 93.1, n=31) | |
| Gigabyte G6X 9KG (2024) (2.02) | |
| HP Victus 16 (2024) (2.02) | |
| Final Fantasy XV Benchmark - 1920x1080 High Quality | |
| Durchschnitt der Klasse Gaming (19.2 - 215, n=140, der letzten 2 Jahre) | |
| Acer Predator Helios Neo 16 (2024) (1.3) | |
| Schenker XMG Pro 16 Studio (Mid 24) (1.3) | |
| Lenovo Legion Pro 5 16IRX9 G9 (1.3) | |
| Nubia RedMagic Titan 16 Pro (1.3) | |
| Nubia RedMagic Titan 16 Pro (1.3, Gaming Mode ) | |
| Gigabyte G6X 9KG (2024) (1.3) | |
| HP Victus 16 (2024) (1.3) | |
| Durchschnittliche NVIDIA GeForce RTX 4060 Laptop GPU (75.1 - 109.8, n=51) | |
| Strange Brigade - 1920x1080 ultra AA:ultra AF:16 | |
| Durchschnitt der Klasse Gaming (38.9 - 456, n=128, der letzten 2 Jahre) | |
| Acer Predator Helios Neo 16 (2024) (1.47.22.14 D3D12) | |
| Schenker XMG Pro 16 Studio (Mid 24) (1.47.22.14 D3D12) | |
| Lenovo Legion Pro 5 16IRX9 G9 (1.47.22.14 D3D12) | |
| Nubia RedMagic Titan 16 Pro (1.47.22.14 D3D12, Gaming Mode ) | |
| Nubia RedMagic Titan 16 Pro (1.47.22.14 D3D12) | |
| Gigabyte G6X 9KG (2024) (1.47.22.14 D3D12) | |
| Durchschnittliche NVIDIA GeForce RTX 4060 Laptop GPU (135.3 - 210, n=50) | |
| HP Victus 16 (2024) (1.47.22.14 D3D12) | |
| Dota 2 Reborn - 1920x1080 ultra (3/3) best looking | |
| Lenovo Legion Pro 5 16IRX9 G9 | |
| Acer Predator Helios Neo 16 (2024) | |
| Nubia RedMagic Titan 16 Pro (Gaming Mode) | |
| Schenker XMG Pro 16 Studio (Mid 24) | |
| Durchschnitt der Klasse Gaming (65.1 - 248, n=143, der letzten 2 Jahre) | |
| HP Victus 16 (2024) | |
| Nubia RedMagic Titan 16 Pro | |
| Durchschnittliche NVIDIA GeForce RTX 4060 Laptop GPU (115 - 183.8, n=53) | |
| Gigabyte G6X 9KG (2024) | |
| X-Plane 11.11 - 1920x1080 high (fps_test=3) | |
| Nubia RedMagic Titan 16 Pro (Gaming Mode) | |
| Lenovo Legion Pro 5 16IRX9 G9 | |
| Acer Predator Helios Neo 16 (2024) | |
| Schenker XMG Pro 16 Studio (Mid 24) | |
| Nubia RedMagic Titan 16 Pro | |
| Gigabyte G6X 9KG (2024) | |
| Durchschnitt der Klasse Gaming (33.4 - 150.2, n=146, der letzten 2 Jahre) | |
| Durchschnittliche NVIDIA GeForce RTX 4060 Laptop GPU (60.7 - 141.1, n=54) | |
| HP Victus 16 (2024) | |
| Once Human | |
| 1920x1080 Very High Preset | |
| Nubia RedMagic Titan 16 Pro | |
| Durchschnittliche NVIDIA GeForce RTX 4060 Laptop GPU (88.7 - 94.2, n=2) | |
| Durchschnitt der Klasse Gaming (14.2 - 94.2, n=2, der letzten 2 Jahre) | |
| 2560x1440 Very High Preset | |
| Nubia RedMagic Titan 16 Pro | |
| Durchschnitt der Klasse Gaming (n=1der letzten 2 Jahre) | |
| Durchschnittliche NVIDIA GeForce RTX 4060 Laptop GPU (59.1 - 62.3, n=2) | |
| 2560x1440 Very High Preset + Quality FSR | |
| Nubia RedMagic Titan 16 Pro | |
| Durchschnittliche NVIDIA GeForce RTX 4060 Laptop GPU (n=1) | |
| Durchschnitt der Klasse Gaming (n=1der letzten 2 Jahre) | |
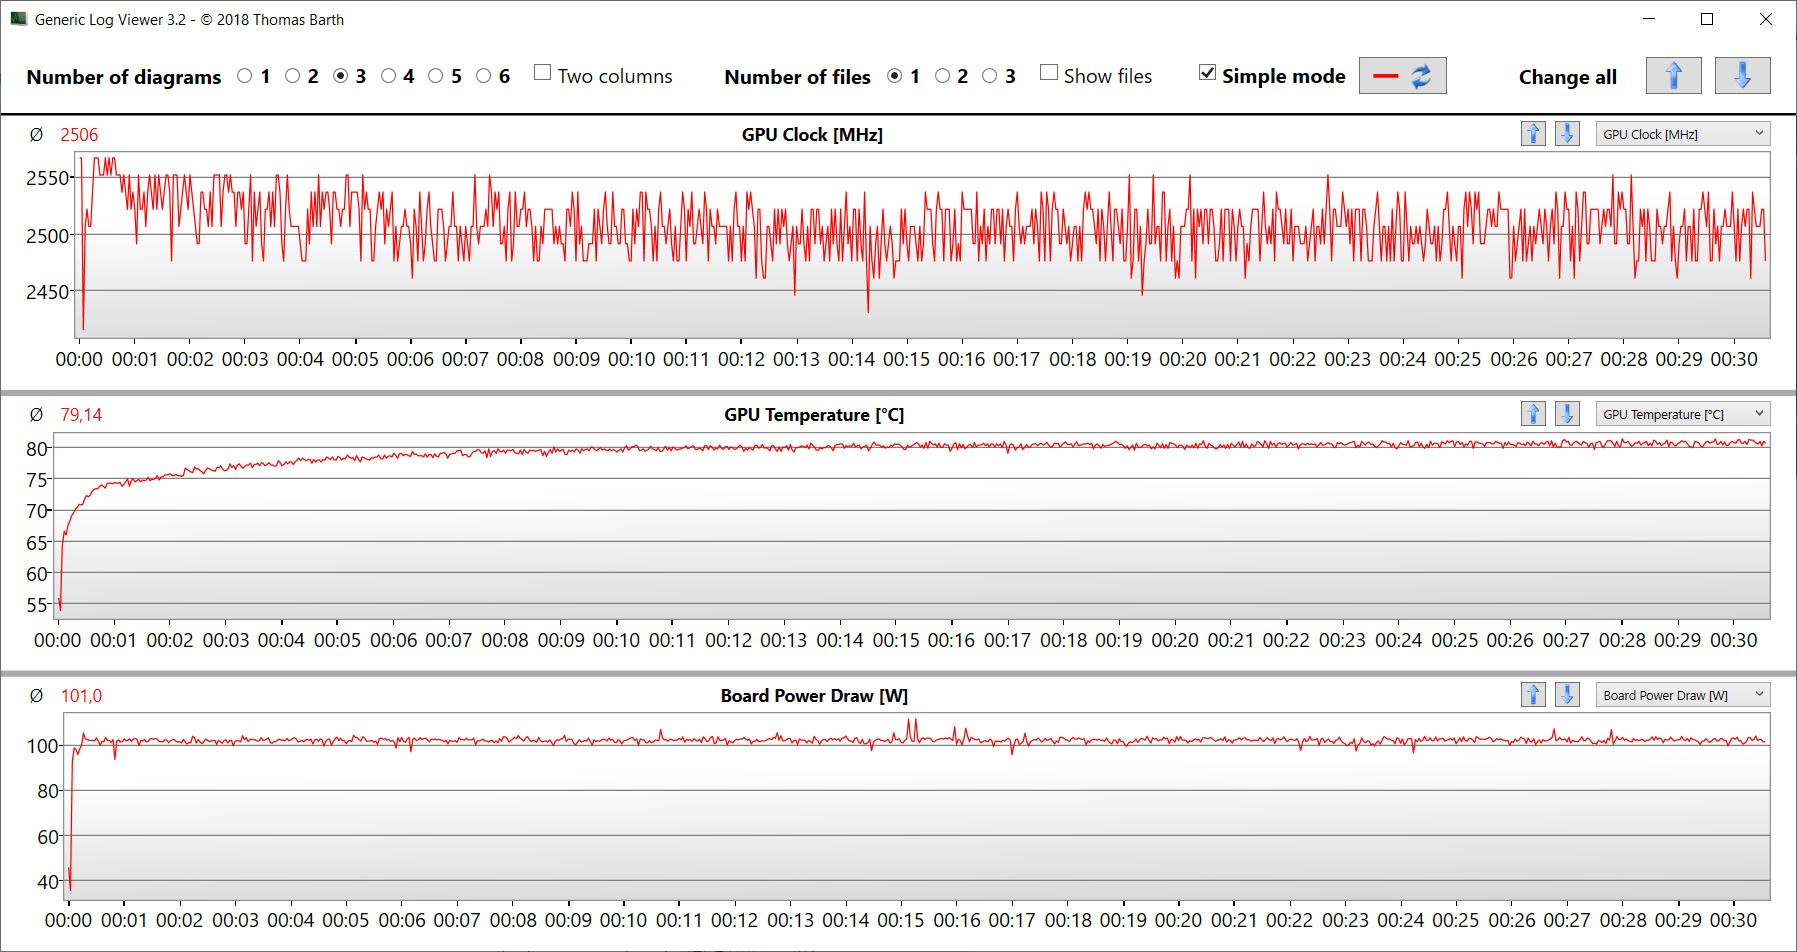
Cyberpunk 2077 Phantom Liberty liefert bei 30-minütiger Laufzeit (max. Settings, FHD) leicht schwankende Frameraten auf recht stabiler Höhe. Ein Einbruch der Leistung ist nicht festzustellen.
Cyberpunk 2077 ultra FPS-Diagramm
| min. | mittel | hoch | max. | QHD DLSS | QHD FSR | QHD | |
|---|---|---|---|---|---|---|---|
| GTA V (2015) | 186.1 | 184 | 177.7 | 118.4 | 89.3 | ||
| Dota 2 Reborn (2015) | 206 | 170.9 | 160.2 | 146.9 | |||
| Final Fantasy XV Benchmark (2018) | 199.7 | 146 | 105.4 | 76.9 | |||
| X-Plane 11.11 (2018) | 167 | 142.8 | 117.2 | ||||
| Strange Brigade (2018) | 480 | 277 | 219 | 189.2 | 126.9 | ||
| Baldur's Gate 3 (2023) | 140.3 | 110.8 | 97.5 | 96.5 | 65.9 | ||
| Cyberpunk 2077 (2023) | 121.4 | 101.1 | 86.2 | 74.7 | 46.9 | ||
| Dragon's Dogma 2 (2024) | 71.9 | 67.7 | 52.9 | ||||
| Ghost of Tsushima (2024) | 91.3 | 86.8 | 78.2 | 63.4 | 63.6 | 47.7 | |
| F1 24 (2024) | 243 | 225 | 175.8 | 58.8 | 59.2 | 36.7 | |
| The First Descendant (2024) | 159 | 100.9 | 80.6 | 69.4 | 43.7 | ||
| Once Human (2024) | 164.8 | 132.9 | 108.3 | 94.2 | 76.5 | 62.3 |
Emissionen - Zu laut, zu heiß
Geräuschemissionen
Ein leise werkelndes Notebook ist mit dem Titan nicht zu bekommen. Schon im Leerlauf arbeiten die zwei Lüfter permanent im deutlich hörbaren Bereich. Cyberpunk lässt den Pegel auf laute 50 dB(A) ("Balance Mode") bzw. noch lautere 53 dB(A) ("Gaming Mode") klettern. Der "Office Mode" liefert mit 47 dB(A) einen nur etwas moderateren Wert. Im Akkubetrieb gehen die Lüfter leiser zu Werke, gelegentlich stehen sie still.
Lautstärkediagramm
| Idle |
| 35 / 36 / 40 dB(A) |
| Last |
| 49 / 52 dB(A) |
 | ||
30 dB leise 40 dB(A) deutlich hörbar 50 dB(A) störend |
||
min: | ||
| Nubia RedMagic Titan 16 Pro GeForce RTX 4060 Laptop GPU, i9-14900HX, Samsung PM9A1 MZVL21T0HCLR | Lenovo Legion Pro 5 16IRX9 G9 GeForce RTX 4060 Laptop GPU, i7-14700HX, Samsung PM9A1 MZVL21T0HCLR | HP Victus 16 (2024) GeForce RTX 4060 Laptop GPU, i7-14700HX, Kioxia XG8 KXG80ZNV512G | Acer Predator Helios Neo 16 (2024) GeForce RTX 4070 Laptop GPU, i7-14700HX, Samsung PM9A1a MZVL21T0HDLU | Schenker XMG Pro 16 Studio (Mid 24) GeForce RTX 4070 Laptop GPU, i9-14900HX, Samsung 990 Pro 1 TB | Gigabyte G6X 9KG (2024) GeForce RTX 4060 Laptop GPU, i7-13650HX, Gigabyte AG450E1024-SI | |
|---|---|---|---|---|---|---|
| Geräuschentwicklung | 17% | 13% | 10% | 5% | 5% | |
| aus / Umgebung * (dB) | 26 | 23 12% | 25 4% | 25.2 3% | 25 4% | 26 -0% |
| Idle min * (dB) | 35 | 23 34% | 28 20% | 27.8 21% | 28 20% | 30 14% |
| Idle avg * (dB) | 36 | 23 36% | 29 19% | 32 11% | 31 14% | 32 11% |
| Idle max * (dB) | 40 | 25 37% | 33 17% | 29.6 26% | 35 12% | 35 12% |
| Last avg * (dB) | 49 | 45.18 8% | 45 8% | 45.2 8% | 52 -6% | 51 -4% |
| Cyberpunk 2077 ultra * (dB) | 50 | 52.69 -5% | 53 -6% | |||
| Last max * (dB) | 52 | 53.13 -2% | 48 8% | 55.8 -7% | 52 -0% | 54 -4% |
| Witcher 3 ultra * (dB) | 43 | 51 |
* ... kleinere Werte sind besser
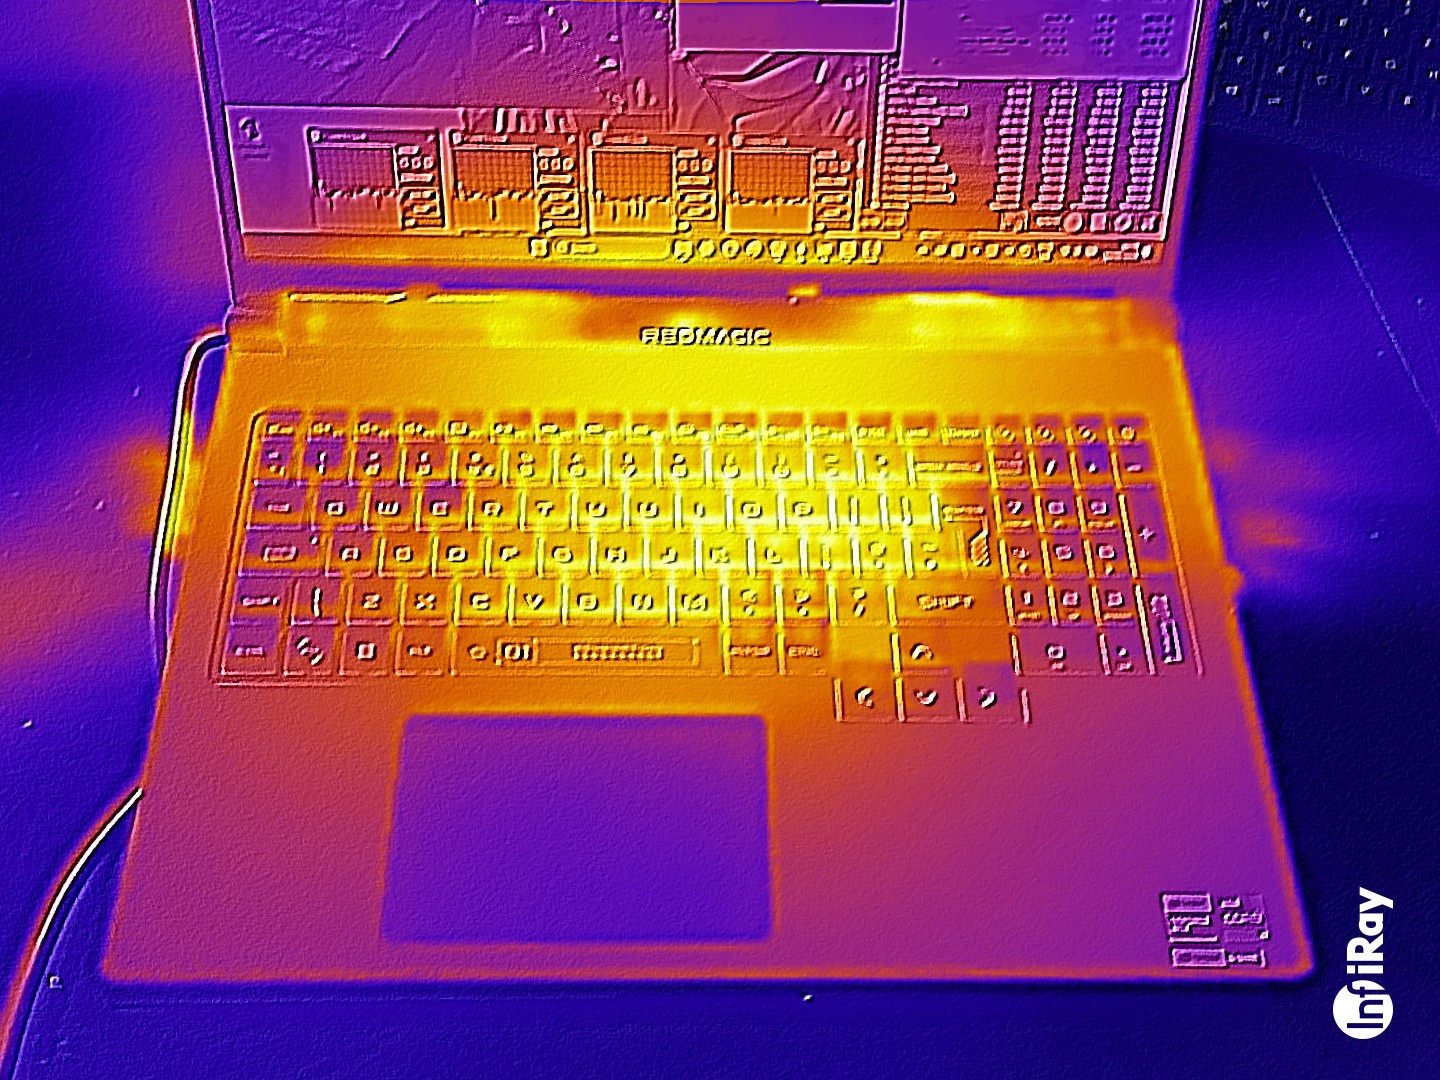
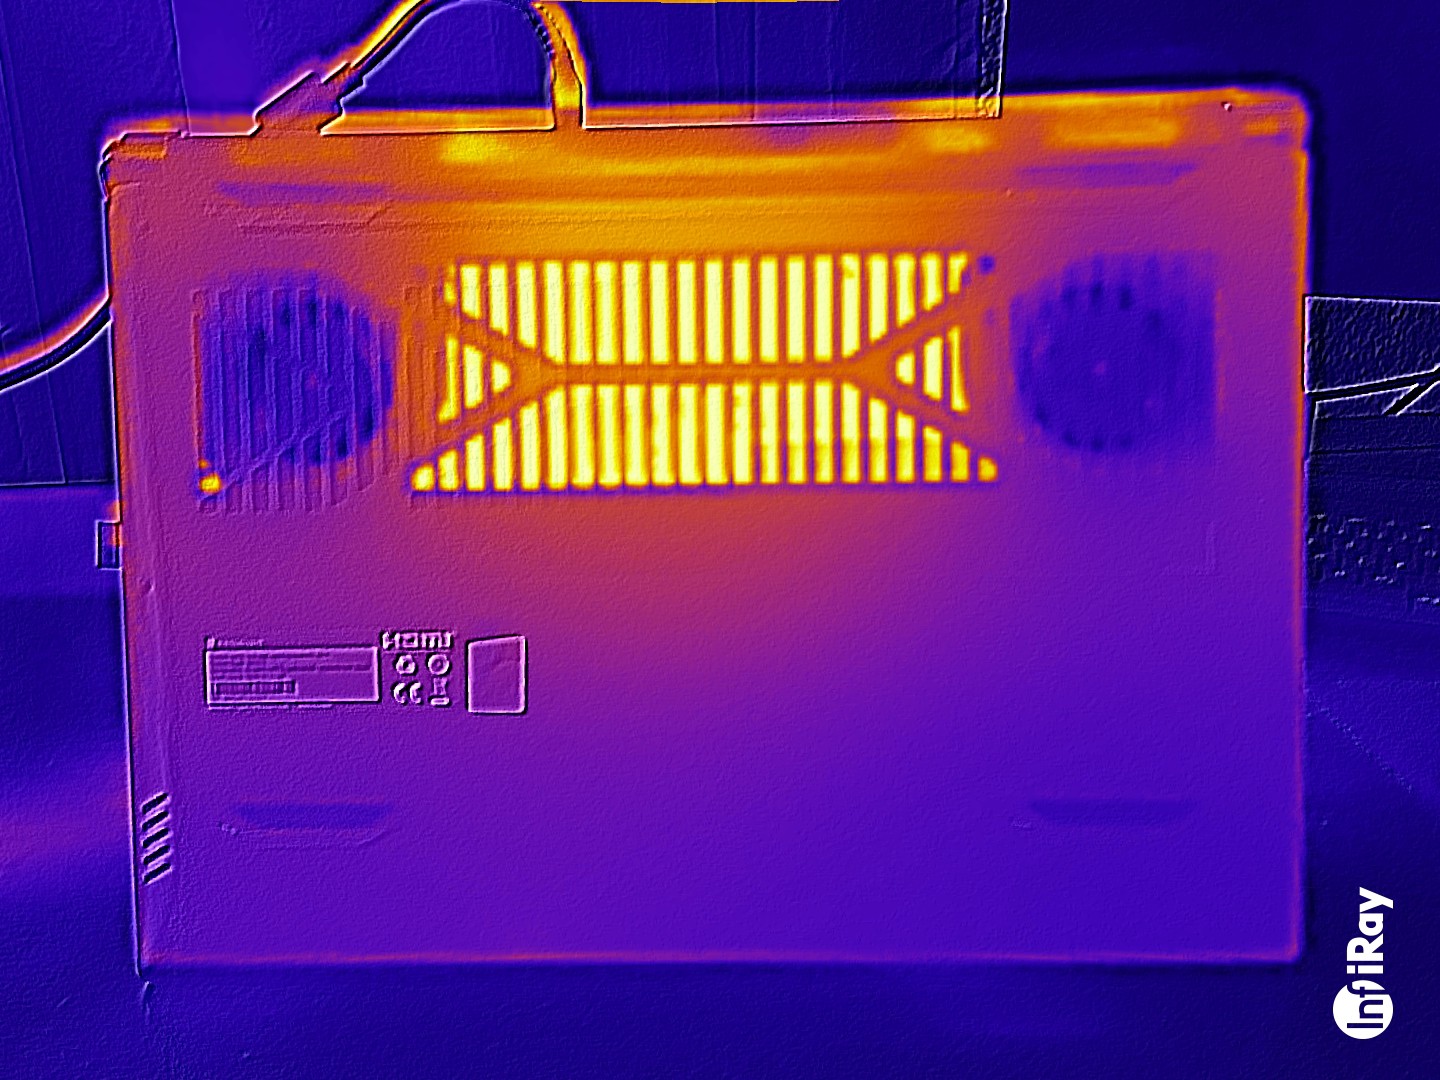
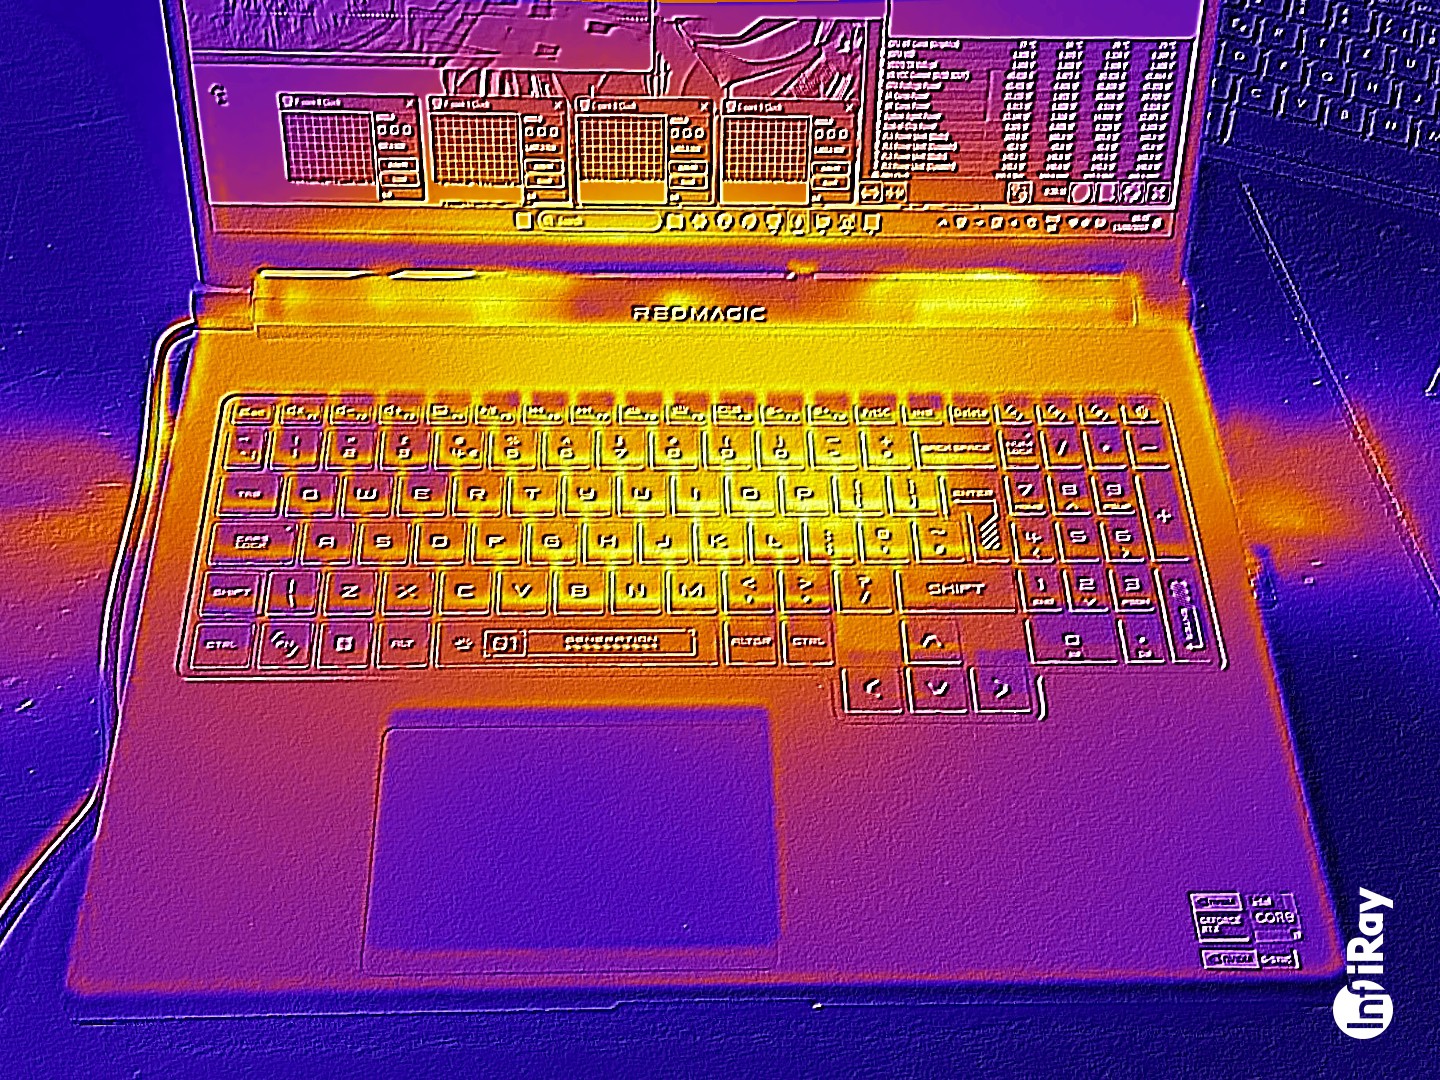
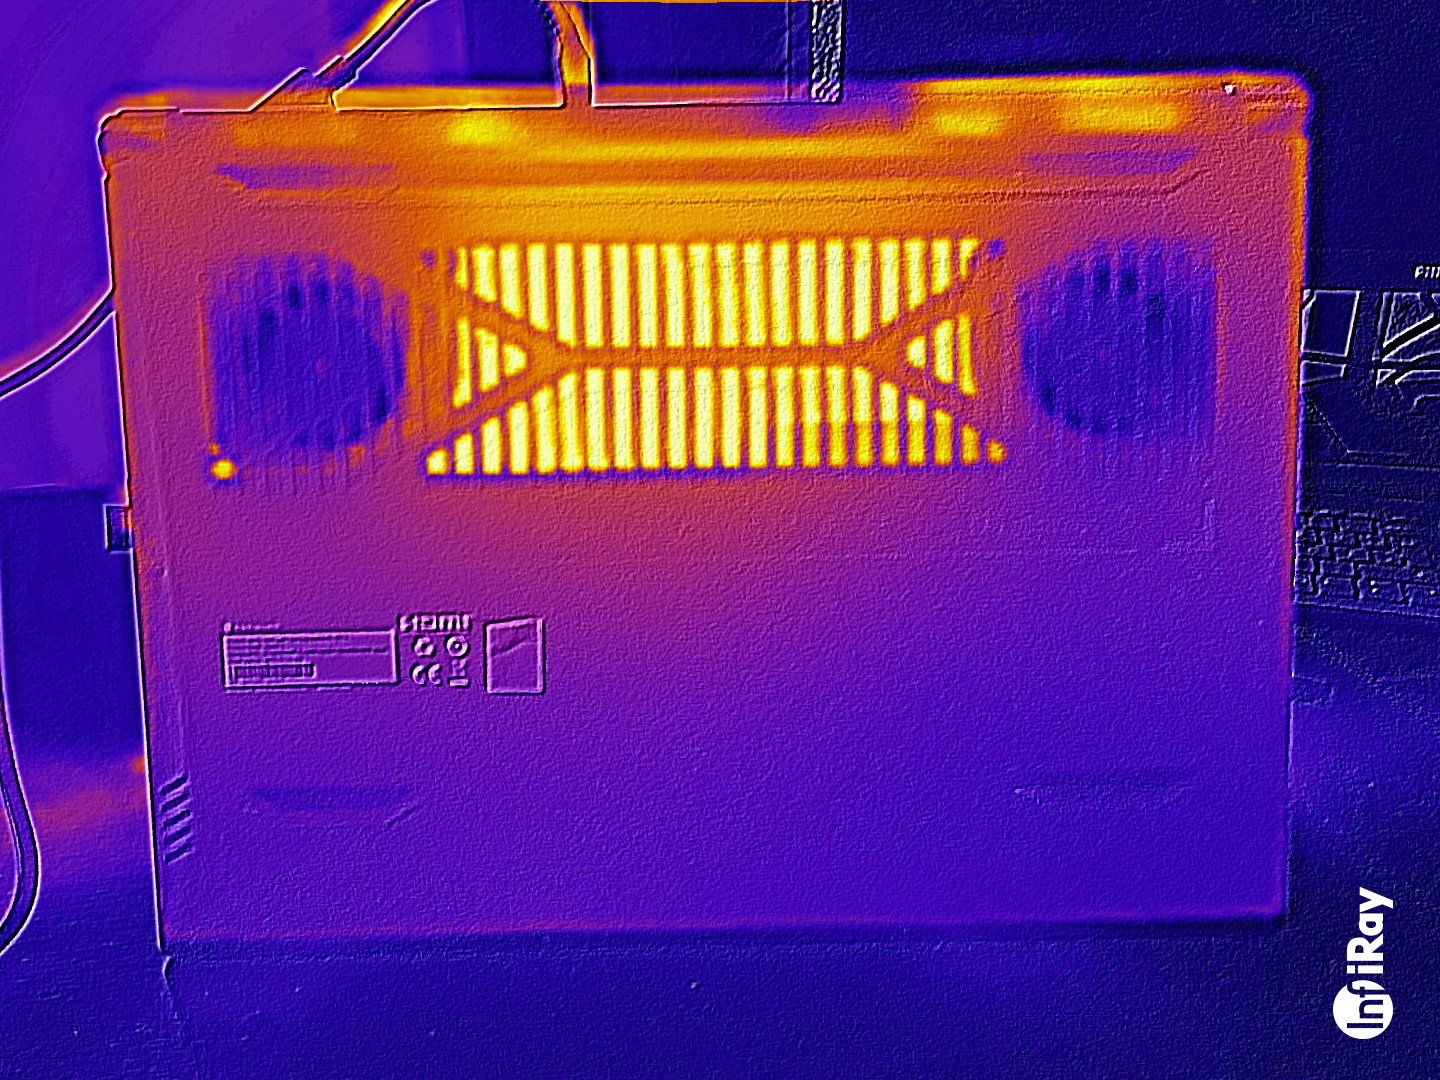
Temperatur
Unter Last erwärmt sich das Notebook deutlich: Cyberpunk 2077 und Stresstest sorgen punktuell für Temperaturen oberhalb von 50 Grad Celsius. Die Werte der Handablage bewegen sich teilweise im grenzwertigen Bereich. Auch im Leerlauf werden Werte jenseits des Durchschnitts erreicht.
(-) Die maximale Temperatur auf der Oberseite ist 50 °C. Im Vergleich liegt der Klassendurchschnitt bei 40.4 °C (von 21.2 bis 68.8 °C für die Klasse Gaming).
(-) Auf der Unterseite messen wir eine maximalen Wert von 58 °C (im Vergleich zum Durchschnitt von 43.3 °C).
(+) Ohne Last messen wir eine durchschnittliche Temperatur von 30.4 °C auf der Oberseite. Der Klassendurchschnitt erreicht 33.9 °C.
(-) 3: The average temperature for the upper side is 45.1 °C / 113 F, compared to the average of 33.9 °C / 93 F for the class Gaming.
(-) Die Handballen und der Touchpad-Bereich können sehr heiß werden mit maximal 40 °C.
(-) Die durchschnittliche Handballen-Temperatur anderer getesteter Geräte war 28.9 °C (-11.1 °C).
| Nubia RedMagic Titan 16 Pro Intel Core i9-14900HX, NVIDIA GeForce RTX 4060 Laptop GPU | Lenovo Legion Pro 5 16IRX9 G9 Intel Core i7-14700HX, NVIDIA GeForce RTX 4060 Laptop GPU | HP Victus 16 (2024) Intel Core i7-14700HX, NVIDIA GeForce RTX 4060 Laptop GPU | Acer Predator Helios Neo 16 (2024) Intel Core i7-14700HX, NVIDIA GeForce RTX 4070 Laptop GPU | Schenker XMG Pro 16 Studio (Mid 24) Intel Core i9-14900HX, NVIDIA GeForce RTX 4070 Laptop GPU | Gigabyte G6X 9KG (2024) Intel Core i7-13650HX, NVIDIA GeForce RTX 4060 Laptop GPU | |
|---|---|---|---|---|---|---|
| Hitze | -9% | 13% | -3% | -13% | 6% | |
| Last oben max * (°C) | 50 | 50 -0% | 50 -0% | 58 -16% | 51 -2% | 41 18% |
| Last unten max * (°C) | 58 | 57 2% | 50 14% | 45.2 22% | 66 -14% | 43 26% |
| Idle oben max * (°C) | 31 | 36 -16% | 25 19% | 31.1 -0% | 35 -13% | 32 -3% |
| Idle unten max * (°C) | 32 | 39 -22% | 26 19% | 37.2 -16% | 39 -22% | 37 -16% |
* ... kleinere Werte sind besser
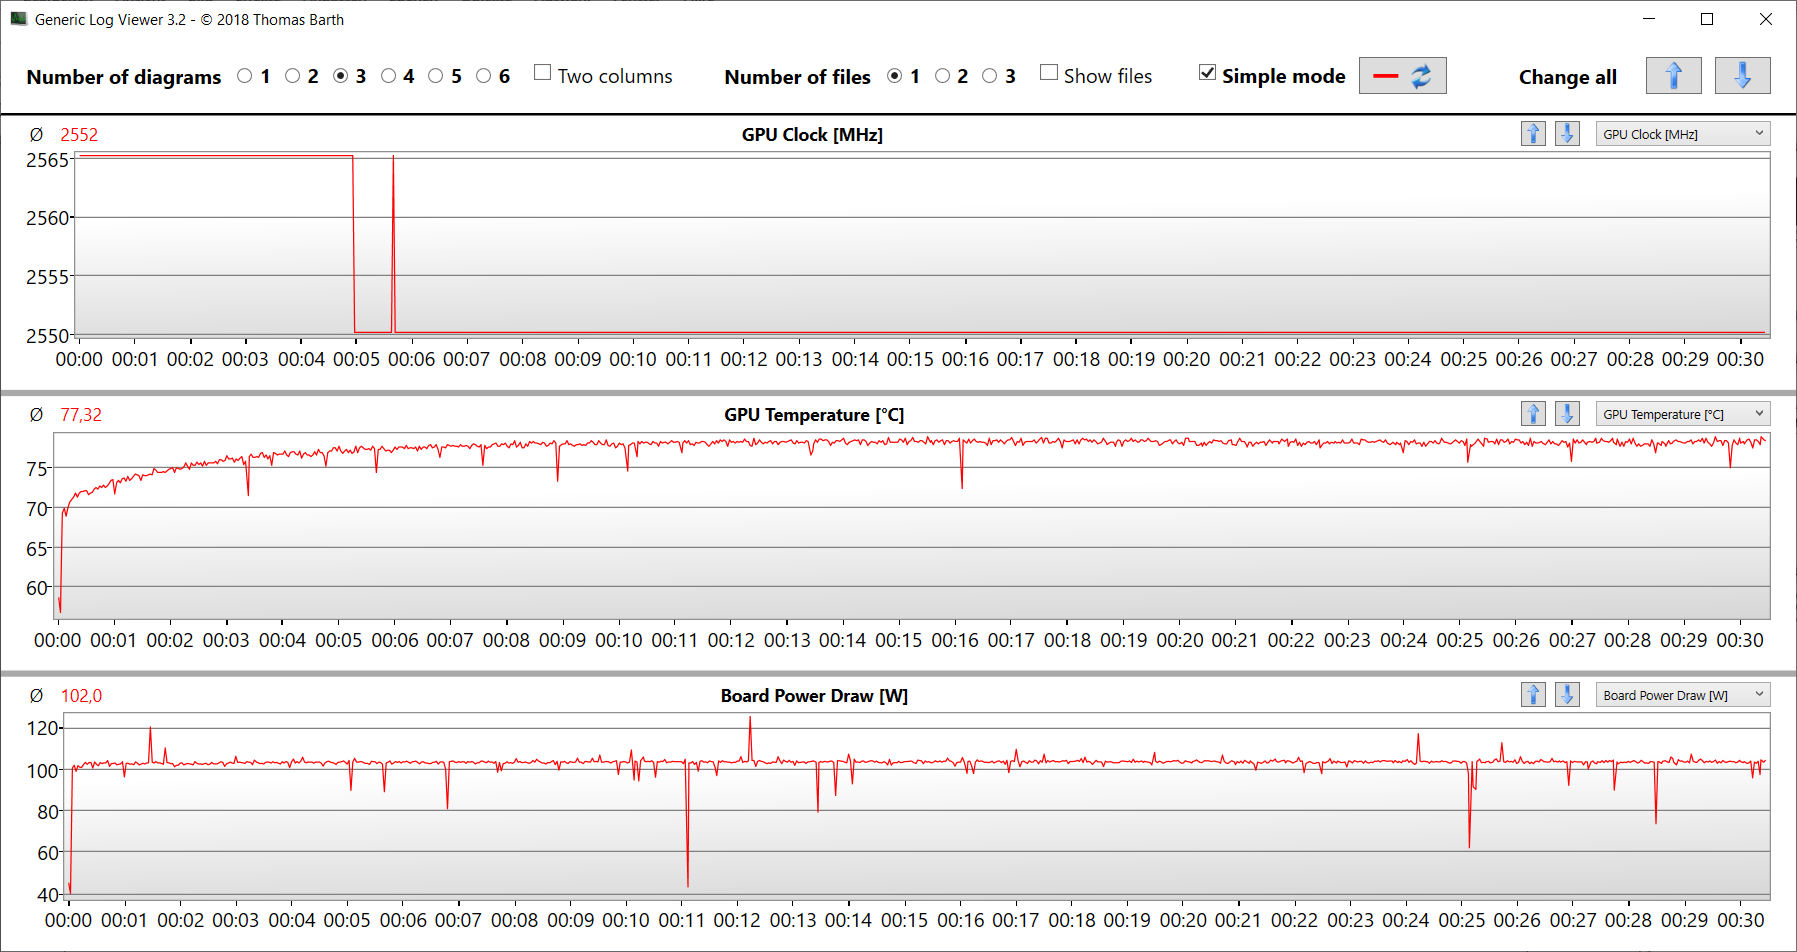
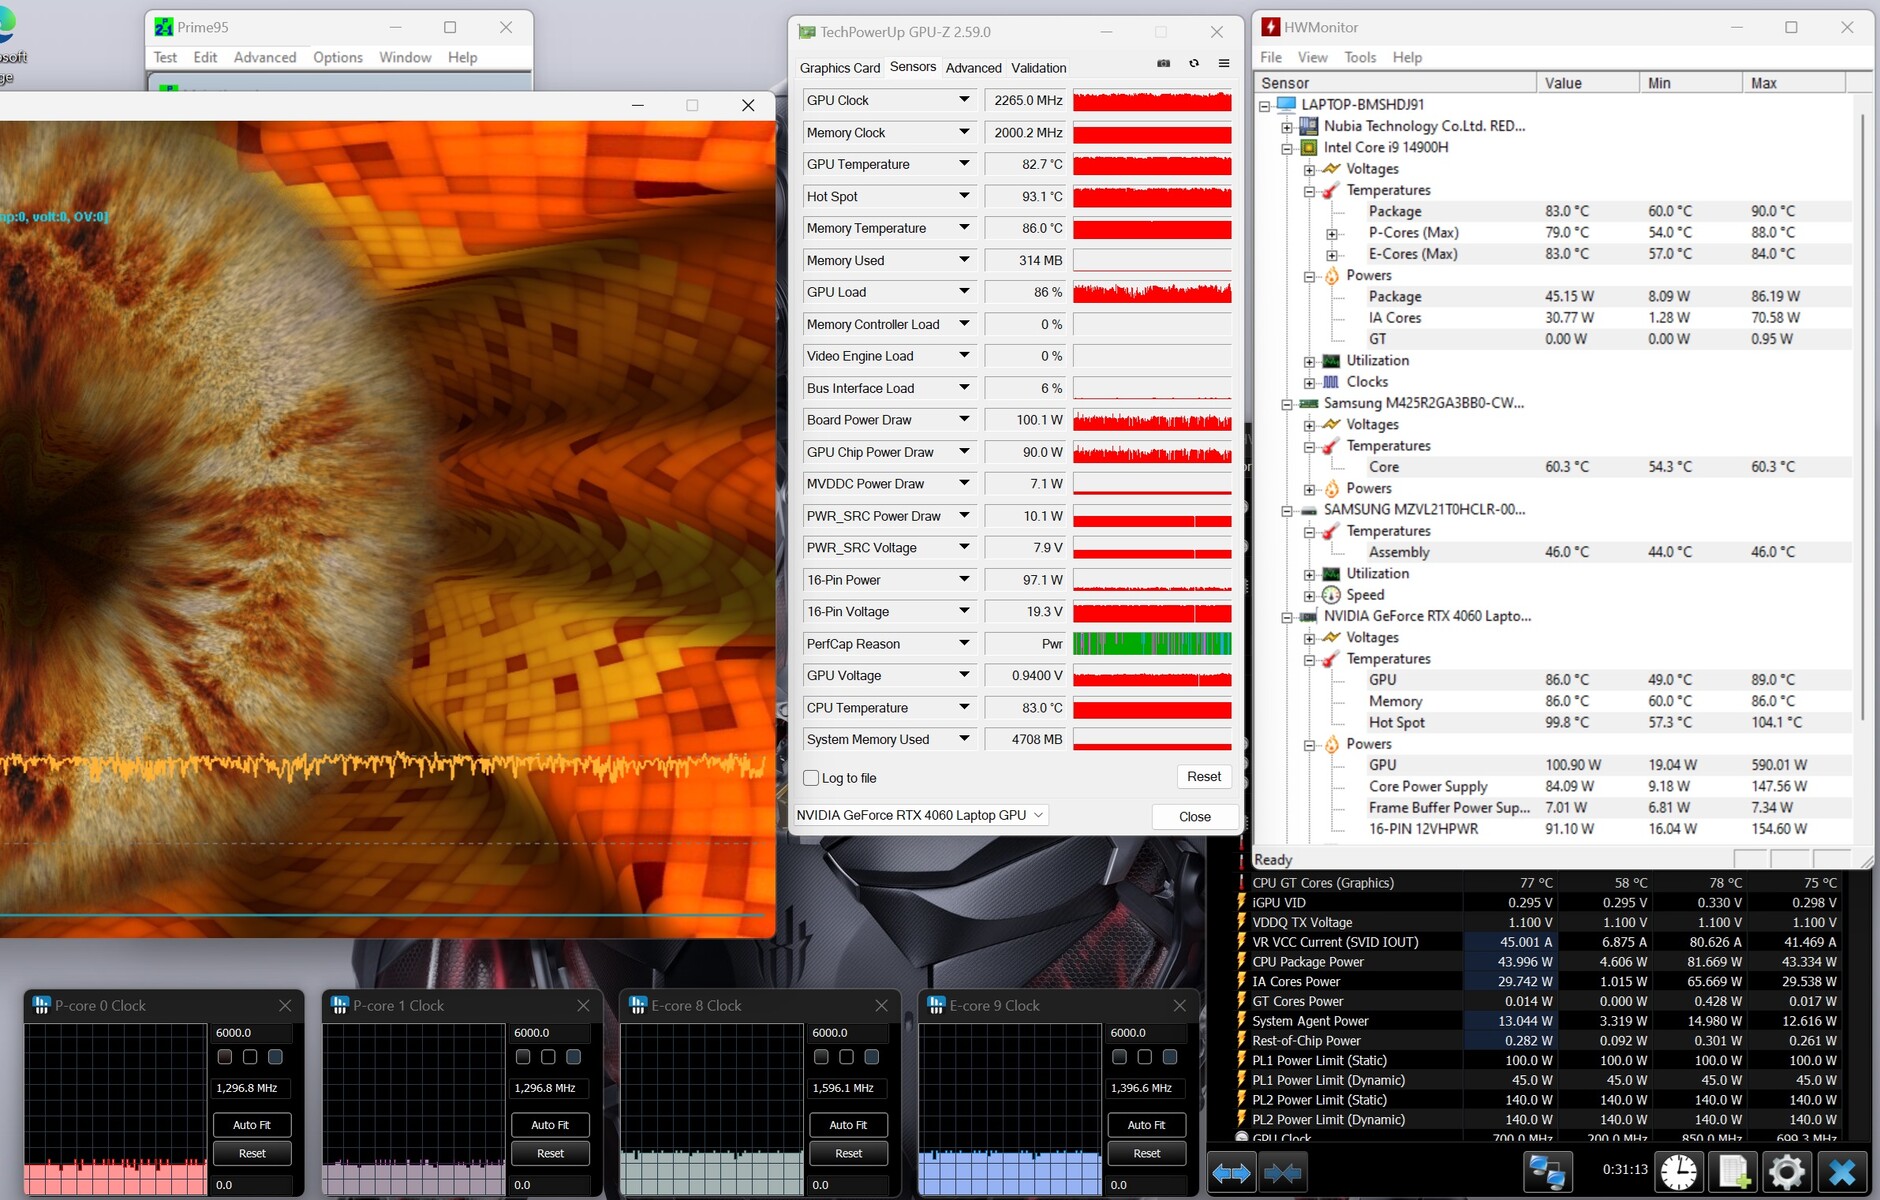
Stresstest
Das Extremszenario Stresstest (Prime95 und Furmark im Dauerbetrieb) überprüft die Systemstabilität unter Volllast. Die CPU arbeitet zu Beginn des Tests mit hohen Taktraten, wird dann aber auf Werte unterhalb von 2 GHz gedrosselt. Die GPU geht mit voller Kraft zu Werke.
Lautsprecher
Die Stereolautsprecher produzieren insgesamt einen sehr ordentlichen Klang. Der Bass dürfte etwas stärker ausgeprägt sein.
Nubia RedMagic Titan 16 Pro Audio Analyse
(+) | Die Lautsprecher können relativ laut spielen (84 dB)
Bass 100 - 315 Hz
(±) | abgesenkter Bass - 14.3% geringer als der Median
(±) | durchschnittlich lineare Bass-Wiedergabe (11.3% Delta zum Vorgänger)
Mitteltöne 400 - 2000 Hz
(+) | ausgeglichene Mitten, vom Median nur 1.8% abweichend
(+) | lineare Mitten (4.9% Delta zum Vorgänger)
Hochtöne 2 - 16 kHz
(+) | ausgeglichene Hochtöne, vom Median nur 2.7% abweichend
(+) | sehr lineare Hochtöne (5.4% Delta zum Vorgänger)
Gesamt im hörbaren Bereich 100 - 16.000 Hz
(+) | hörbarer Bereich ist sehr linear (11.5% Abstand zum Median
Im Vergleich zu allen Geräten derselben Klasse
» 10% aller getesteten Geräte dieser Klasse waren besser, 3% vergleichbar, 87% schlechter
» Das beste Gerät hat einen Delta-Wert von 6%, durchschnittlich ist 18%, das schlechteste Gerät hat 132%
Im Vergleich zu allen Geräten im Test
» 7% aller getesteten Geräte waren besser, 2% vergleichbar, 91% schlechter
» Das beste Gerät hat einen Delta-Wert von 4%, durchschnittlich ist 24%, das schlechteste Gerät hat 134%
Lenovo Legion Pro 5 16IRX9 G9 Audio Analyse
(±) | Mittelmäßig laut spielende Lautsprecher (77.13 dB)
Bass 100 - 315 Hz
(-) | kaum Bass - 18.3% niedriger als der Median
(±) | durchschnittlich lineare Bass-Wiedergabe (12% Delta zum Vorgänger)
Mitteltöne 400 - 2000 Hz
(±) | zu hohe Mitten, vom Median 6.9% abweichend
(+) | lineare Mitten (4.9% Delta zum Vorgänger)
Hochtöne 2 - 16 kHz
(+) | ausgeglichene Hochtöne, vom Median nur 4.5% abweichend
(±) | durchschnittlich lineare Hochtöne (9.5% Delta zum Vorgänger)
Gesamt im hörbaren Bereich 100 - 16.000 Hz
(±) | hörbarer Bereich ist durchschnittlich linear (21.6% Abstand zum Median)
Im Vergleich zu allen Geräten derselben Klasse
» 77% aller getesteten Geräte dieser Klasse waren besser, 5% vergleichbar, 18% schlechter
» Das beste Gerät hat einen Delta-Wert von 6%, durchschnittlich ist 18%, das schlechteste Gerät hat 132%
Im Vergleich zu allen Geräten im Test
» 60% aller getesteten Geräte waren besser, 7% vergleichbar, 33% schlechter
» Das beste Gerät hat einen Delta-Wert von 4%, durchschnittlich ist 24%, das schlechteste Gerät hat 134%
Energieverwaltung - Das Titan 16 liefert nur maue Laufzeiten
Energieaufnahme
Der Energiebedarf bewegt sich auf normaler Höhe für die hier verbaute Hardware. Cyberpunk 2077 und Stresstest werden mit konstanter Energieaufnahme durchlaufen. Das Netzteil (280 Watt) ist ausreichend dimensioniert.
| Aus / Standby | |
| Idle | |
| Last |
|
Legende:
min: | |
| Nubia RedMagic Titan 16 Pro i9-14900HX, GeForce RTX 4060 Laptop GPU | Lenovo Legion Pro 5 16IRX9 G9 i7-14700HX, GeForce RTX 4060 Laptop GPU | HP Victus 16 (2024) i7-14700HX, GeForce RTX 4060 Laptop GPU | Acer Predator Helios Neo 16 (2024) i7-14700HX, GeForce RTX 4070 Laptop GPU | Schenker XMG Pro 16 Studio (Mid 24) i9-14900HX, GeForce RTX 4070 Laptop GPU | Gigabyte G6X 9KG (2024) i7-13650HX, GeForce RTX 4060 Laptop GPU | Durchschnittliche NVIDIA GeForce RTX 4060 Laptop GPU | Durchschnitt der Klasse Gaming | |
|---|---|---|---|---|---|---|---|---|
| Stromverbrauch | -4% | 16% | -23% | -35% | 17% | 21% | 3% | |
| Idle min * (Watt) | 16 | 13.7 14% | 9 44% | 26.7 -67% | 31 -94% | 12 25% | 11.5 ? 28% | 13.6 ? 15% |
| Idle avg * (Watt) | 19 | 17.7 7% | 15 21% | 24.4 -28% | 33 -74% | 13 32% | 16 ? 16% | 19.5 ? -3% |
| Idle max * (Watt) | 27 | 18.5 31% | 23 15% | 32.7 -21% | 41 -52% | 27 -0% | 20.3 ? 25% | 26.1 ? 3% |
| Last avg * (Watt) | 123 | 124 -1% | 123 -0% | 122.1 1% | 114 7% | 105 15% | 92.9 ? 24% | 110.9 ? 10% |
| Cyberpunk 2077 ultra external monitor * (Watt) | 174.2 | 224 -29% | 196.8 -13% | |||||
| Cyberpunk 2077 ultra * (Watt) | 184.3 | 229 -24% | 218 -18% | |||||
| Last max * (Watt) | 240 | 297 -24% | 241 -0% | 241 -0% | 250 -4% | 210 12% | 210 ? 12% | 262 ? -9% |
| Witcher 3 ultra * (Watt) | 143.7 | 190.6 | 167.8 |
* ... kleinere Werte sind besser
Energieaufnahme Cyberpunk / Stresstest
Energieaufnahme mit externem Monitor
Akkulaufzeit
Der 16-Zöller erreicht im WiFi-Test (Aufruf von Webseiten mittels eines Skripts) bzw. Videotest (Kurzfilm Big Buck Bunny (H.264-Kodierung, FHD) in einer Schleife) Laufzeiten von 4:40 h bzw. 5:16 h - keine grandiosen Werte. Die Konkurrenten halten teilweise deutlich länger durch.
| Nubia RedMagic Titan 16 Pro i9-14900HX, GeForce RTX 4060 Laptop GPU, 80.1 Wh | Lenovo Legion Pro 5 16IRX9 G9 i7-14700HX, GeForce RTX 4060 Laptop GPU, 80 Wh | HP Victus 16 (2024) i7-14700HX, GeForce RTX 4060 Laptop GPU, 83 Wh | Acer Predator Helios Neo 16 (2024) i7-14700HX, GeForce RTX 4070 Laptop GPU, 90.61 Wh | Schenker XMG Pro 16 Studio (Mid 24) i9-14900HX, GeForce RTX 4070 Laptop GPU, 73 Wh | Gigabyte G6X 9KG (2024) i7-13650HX, GeForce RTX 4060 Laptop GPU, 73 Wh | Durchschnitt der Klasse Gaming | |
|---|---|---|---|---|---|---|---|
| Akkulaufzeit | 15% | 81% | -18% | 19% | 68% | 33% | |
| Idle (h) | 8 | 5.9 -26% | 9.99 ? 25% | ||||
| H.264 (h) | 5.3 | 5.2 -2% | 4 -25% | 8.1 ? 53% | |||
| WLAN (h) | 4.7 | 5.1 9% | 8.5 81% | 3.8 -19% | 5.6 19% | 7.9 68% | 6.76 ? 44% |
| Last (h) | 1.3 | 1.8 38% | 1.3 0% | 1.435 ? 10% |
Pro
Contra
Fazit - Luft nach oben
Core i9-14900HX und GeForce RTX 4060 ermöglichen QHD-Gaming bei hohen bis maximalen Settings. Das Potential der Hardware wird nicht ausgereizt, da der Arbeitsspeicher nur im Single-Channel-Modus arbeitet. Hier empfiehlt sich der Einbau eines zweiten Speichermoduls.
Nubias Erstlingswerk macht, wofür es gedacht ist: Spiele flüssig auf den Bildschirm bringen. Die Konkurrenz muss sich aber nicht wirklich fürchten.
Die Emissionswerte gefallen überhaupt nicht: Über den gesamten Lastbereich hinweg produziert der Rechner (zu) viel Lärm und erwärmt sich sehr stark. Der helle, farbtreue IPS-Bildschirm (16 Zoll, 2.560 x 1.600 Pixel, 240 Hz, G-Sync, DCI-P3) im arbeitsfreundlichen 16:10-Format hat hingegen einen guten Eindruck gemacht.
Die Akkulaufzeiten reißen niemanden vom Hocker. Hier darf von einem Gaming-Laptop mit 80-Wh-Akku (etwas) mehr erwartet werden. Immerhin: Der verbaute USB-C-Port (Thunderbolt 4) unterstützt Power Delivery (und den DP Alt-Mode). Somit müsste das wuchtige, proprietäre Netzteil nicht unbedingt mitgeführt werden.
Ein Umstand, der vor einem möglichen Kauf bedacht werden sollte: Im Gegensatz zu etablierten Herstellern wie etwa Acer, Lenovo oder HP ist Nubia in Europa nicht wirklich präsent. Daher lässt sich nicht abschätzen, wie es mit Ersatzteilversorgung, Support, Reparaturen aussehen wird.
Das Preisniveau von 1.759 Euro stellt kein Kaufargument dar: So ist das Acer Predator Helios Neo 16 in einer dem Titan nahezu identischen Ausstattung (Ausnahme: 32 GB RAM statt 16 RAM) aktuell für 1.649 Euro zu haben. Eine weitere Alternative wäre das XMG Pro 16 Studio (Mid 24). Hier läge der Preis für ein vergleichbares Modell bei 1.862 Euro (mit Windows 11) bzw. 1.763 Euro (ohne Windows-Betriebssystem).
Preis und Verfügbarkeit
Das Nubia RedMagic Titan 16 Pro ist ab dem 29.08.2024 zu einem Preis von 1.759 Euro im RedMagic-Store zu bekommen.
Hinweis: Wir haben unser Rating-System kürzlich aktualisiert und die Ergebnisse von Version 8 sind nicht mit den Ergebnissen von Version 7 vergleichbar. Weitere Informationen dazu sind hier verfügbar.
Nubia RedMagic Titan 16 Pro
- 21.08.2024 v8
Sascha Mölck
 Total Sustainability Score:
 Transparenz
Die Auswahl der zu testenden Geräte erfolgt innerhalb der Redaktion. Das vorliegende Testmuster wurde dem Autor vom Hersteller oder einem Shop zu Testzwecken leihweise zur Verfügung gestellt. Eine Einflussnahme des Leihstellers auf den Testbericht gab es nicht, der Hersteller erhielt keine Version des Reviews vor der Veröffentlichung. Es bestand keine Verpflichtung zur Publikation. Als eigenständiges, unabhängiges Unternehmen unterliegt Notebookcheck keiner Diktion von Herstellern, Shops und Verlagen.
So testet Notebookcheck
Pro Jahr werden von Notebookcheck hunderte Laptops und Smartphones unabhängig in von uns standardisierten technischen Verfahren getestet, um eine Vergleichbarkeit aller Testergebnisse zu gewährleisten. Seit rund 20 Jahren entwickeln wir diese Testmethoden kontinuierlich weiter und setzen damit Branchenstandards. In unseren Testlaboren kommt ausschließlich hochwertiges Messequipment in die Hände erfahrener Techniker und Redakteure. Die Tests unterliegen einer mehrstufigen Kontrolle. Unsere komplexe Gesamtbewertung basiert auf hunderten fundierten Messergebnissen und Benchmarks, womit Ihnen Objektivität garantiert ist. Weitere Informationen zu unseren Testmethoden gibt es hier.
Preisvergleich
