Notebookcheck Logo
Teaser

Geekom GT1 Mega im Test: Erster KI-Mini-PC von Geekom überzeugt nicht in allen Punkten

Wieviel Mega steckt im GT1 von Geekom?

Der Geekom GT1 Mega verspricht starke Leistung im Mini-PC-Format und richtet sich an Nutzer, die auf kleinstem Raum viel Leistung benötigen. Ausgestattet mit dem Intel Core Ultra 9 185H verbaut Geekom erstmals einen Meteor-Lake-Prozessor, der eine separate NPU mitbringt. Ob der Geekom GT1 Mega überzeugt, klären wir in diesem Test – von Performance über Ausstattung bis zur Kühlung.
Sebastian Bade 👁, Stefanie Voigt Veröffentlicht am 🇺🇸 🇫🇷 ...
Mini PC Desktop Intel Business

Fazit - zu wenig Premium für den Preis

Der Geekom GT1 Mega präsentiert sich als starker Mini-PC, der in vielen Bereichen überzeugt. Mit leistungsfähiger Hardware, bestehend aus dem Intel Core Ultra 9 185H, der zudem eine sehr leistungsstarke iGPU mitbringt, ist der Mini-PC sowohl für Office-Anwendungen als auch für Multimedia- und leichte Kreativaufgaben bestens geeignet. Besonders positiv fällt die Anschlussvielfalt auf, die für ein kompaktes Gerät dieser Größe selten ist. Die beiden USB4-Schnittstellen zählen dabei zu den sinnvollsten Ports, wenn es um das Thema Zukunftssicherheit geht. Auch die Erweiterbarkeit des Speichers und die makellose Verarbeitung machen den GT1 Mega zu einer attraktiven Lösung für Arbeitsplätze, die wenig Platz beanspruchen.

Kritisieren müssen wir jedoch die Lautstärke bei durchschnittlicher und hoher Belastung. Ein Mini-PC, welcher zwangsläufig im näheren Umfeld auf dem Schreibtisch steht, darf einfach keine 50 dB(A) erreichen. Warum Geekom hier nicht mehr Energie hineingesteckt hat, um das Produkt hinsichtlich der Lüfterkurve besser abzustimmen, ist uns ein Rätsel. Zudem fallen die BIOS-Optionen sehr rudimentär aus. Glücklicherweise lässt sich aber ein quiet mode aktivieren, welcher das Problem ein wenig verbessert. Ein Leistungsverlust muss dann allerdings in Kauf genommen werden. Eine endgültige Lösung kann das aber nicht sein, denn immerhin verlangt Geekom laut UVP weit über 1.000 Euro für den GT1 Mega. Abgesehen von der Lautstärke ist der Geekom GT1 Mega eine leistungsfähige, flexible und kompakte Lösung für alle, die auf wenig Raum einen zuverlässigen Allround-PC suchen – ideal für Büros und Home-Office, aber auch als Multimedia-Zentrale geeignet.

Pro

+ tolles Design
+ perferkte Verarbeitung
+ sehr stabil gebaut
+ 2x USB4
+ Dual 2.5G LAN
+ schneller SD-Kartenleser
+ Wi-Fi 7
+ gute Alltagsleistung des Intel Core Ultra 9 185H
+ leistungsstarke iGPU
+ großzügige 2-TB-SSD
+ 32-GB-RAM
+ geringe Energieaufnahme
+ stabile SSD-Performance
+ 36 Monate Garantie

Contra

- deutlich hörbar bei Teillast und Volllast
- eingeschränkte BIOS-Optionen
- keine manuell anpassbare Lüftersteuerung
- keine OCuLink-Schnittstelle
- sehr teuer

Preis und Verfügbarkeit

Der Geekom GT1 Mega in unserer Testausstattung kostet bei Geekom 1.149 Euro. Mit nur 899 Euro ist der GT1 Mega mit Intel Core Ultra 7 155H etwas preiswerter. Mit dem Code NBCGT1 lassen sich hier 5 Prozent sparen. Auch Amazon bietet beide Varianten an. Die Preise liegen bei 899 Euro für das Core-Ultra-7- und 1.249 Euro für das Core-Ultra-9-Modell. Mit dem Code E5KMMCV8 sinkt der Preis auch hier um 5 Prozent.

Amazon Logo
Amazon
GEEKOM AI Mini PC GT1 Mega - Intel Core U9 185H,16 Kerne 22 Threads, Bis zu 5.1GHz, 2.5Gbps Dualer LAN Port, Mini PC Windows 11 Pro 32GB DDR5+2TB SSD mit WiFi 7, Real-time AR, Vier 4K-Displays, BT5.4

Preisvergleich

Mögliche Alternativen im Vergleich

Bild
Modell / Test
Geizhals
Gewicht
Dicke
Display
1.
78.8%
Geekom GT1 Mega
Geekom GT1 Mega
Intel Core Ultra 9 185H ⎘
Intel Arc 8-Core iGPU ⎘
32 GB RAM, 2048 GB SSD
Listenpreis 1149 EUR
Geizhals Suche
693 g46.9 mmx
2.
78.4%
Geekom AX8 Pro
Geekom AX8 Pro
AMD Ryzen 9 8945H ⎘
AMD Radeon 780M ⎘
32 GB RAM, 2048 GB SSD
Listenpreis 999 EUR548 g37 mmx
3.
74.7%
Asus NUC 14 Pro
Asus NUC 14 Pro
Intel Core Ultra 5 125H ⎘
Intel Arc 7-Core iGPU ⎘
, 2048 GB SSD
Bestpreis 523.09€ Jacob Elektronik direkt
2. 523.1€ Easynotebooks.de
3. 523.11€ Notebook.de
525 g37 mmx
4.
74.5%
Minisforum UH125 Pro
Intel Core Ultra 5 125H ⎘
Intel Arc 7-Core iGPU ⎘
32 GB RAM, 1024 GB SSD
Listenpreis 879 EUR
Geizhals Suche
797 g49 mmx
5.
72.1%
Geekom GT13 Pro
Geekom GT13 Pro
Intel Core i9-13900H ⎘
Intel Iris Xe Graphics G7 96EUs ⎘
32 GB RAM, 2048 GB SSD
Listenpreis 930 EUR440 g37 mmx
6.
83.4% v7 (old)
Acemagic F2A
Acemagic F2A
Intel Core Ultra 7 155H ⎘
Intel Arc 8-Core iGPU ⎘
32 GB RAM, 1024 GB SSD
Listenpreis 1199 EUR768 g57 mmx

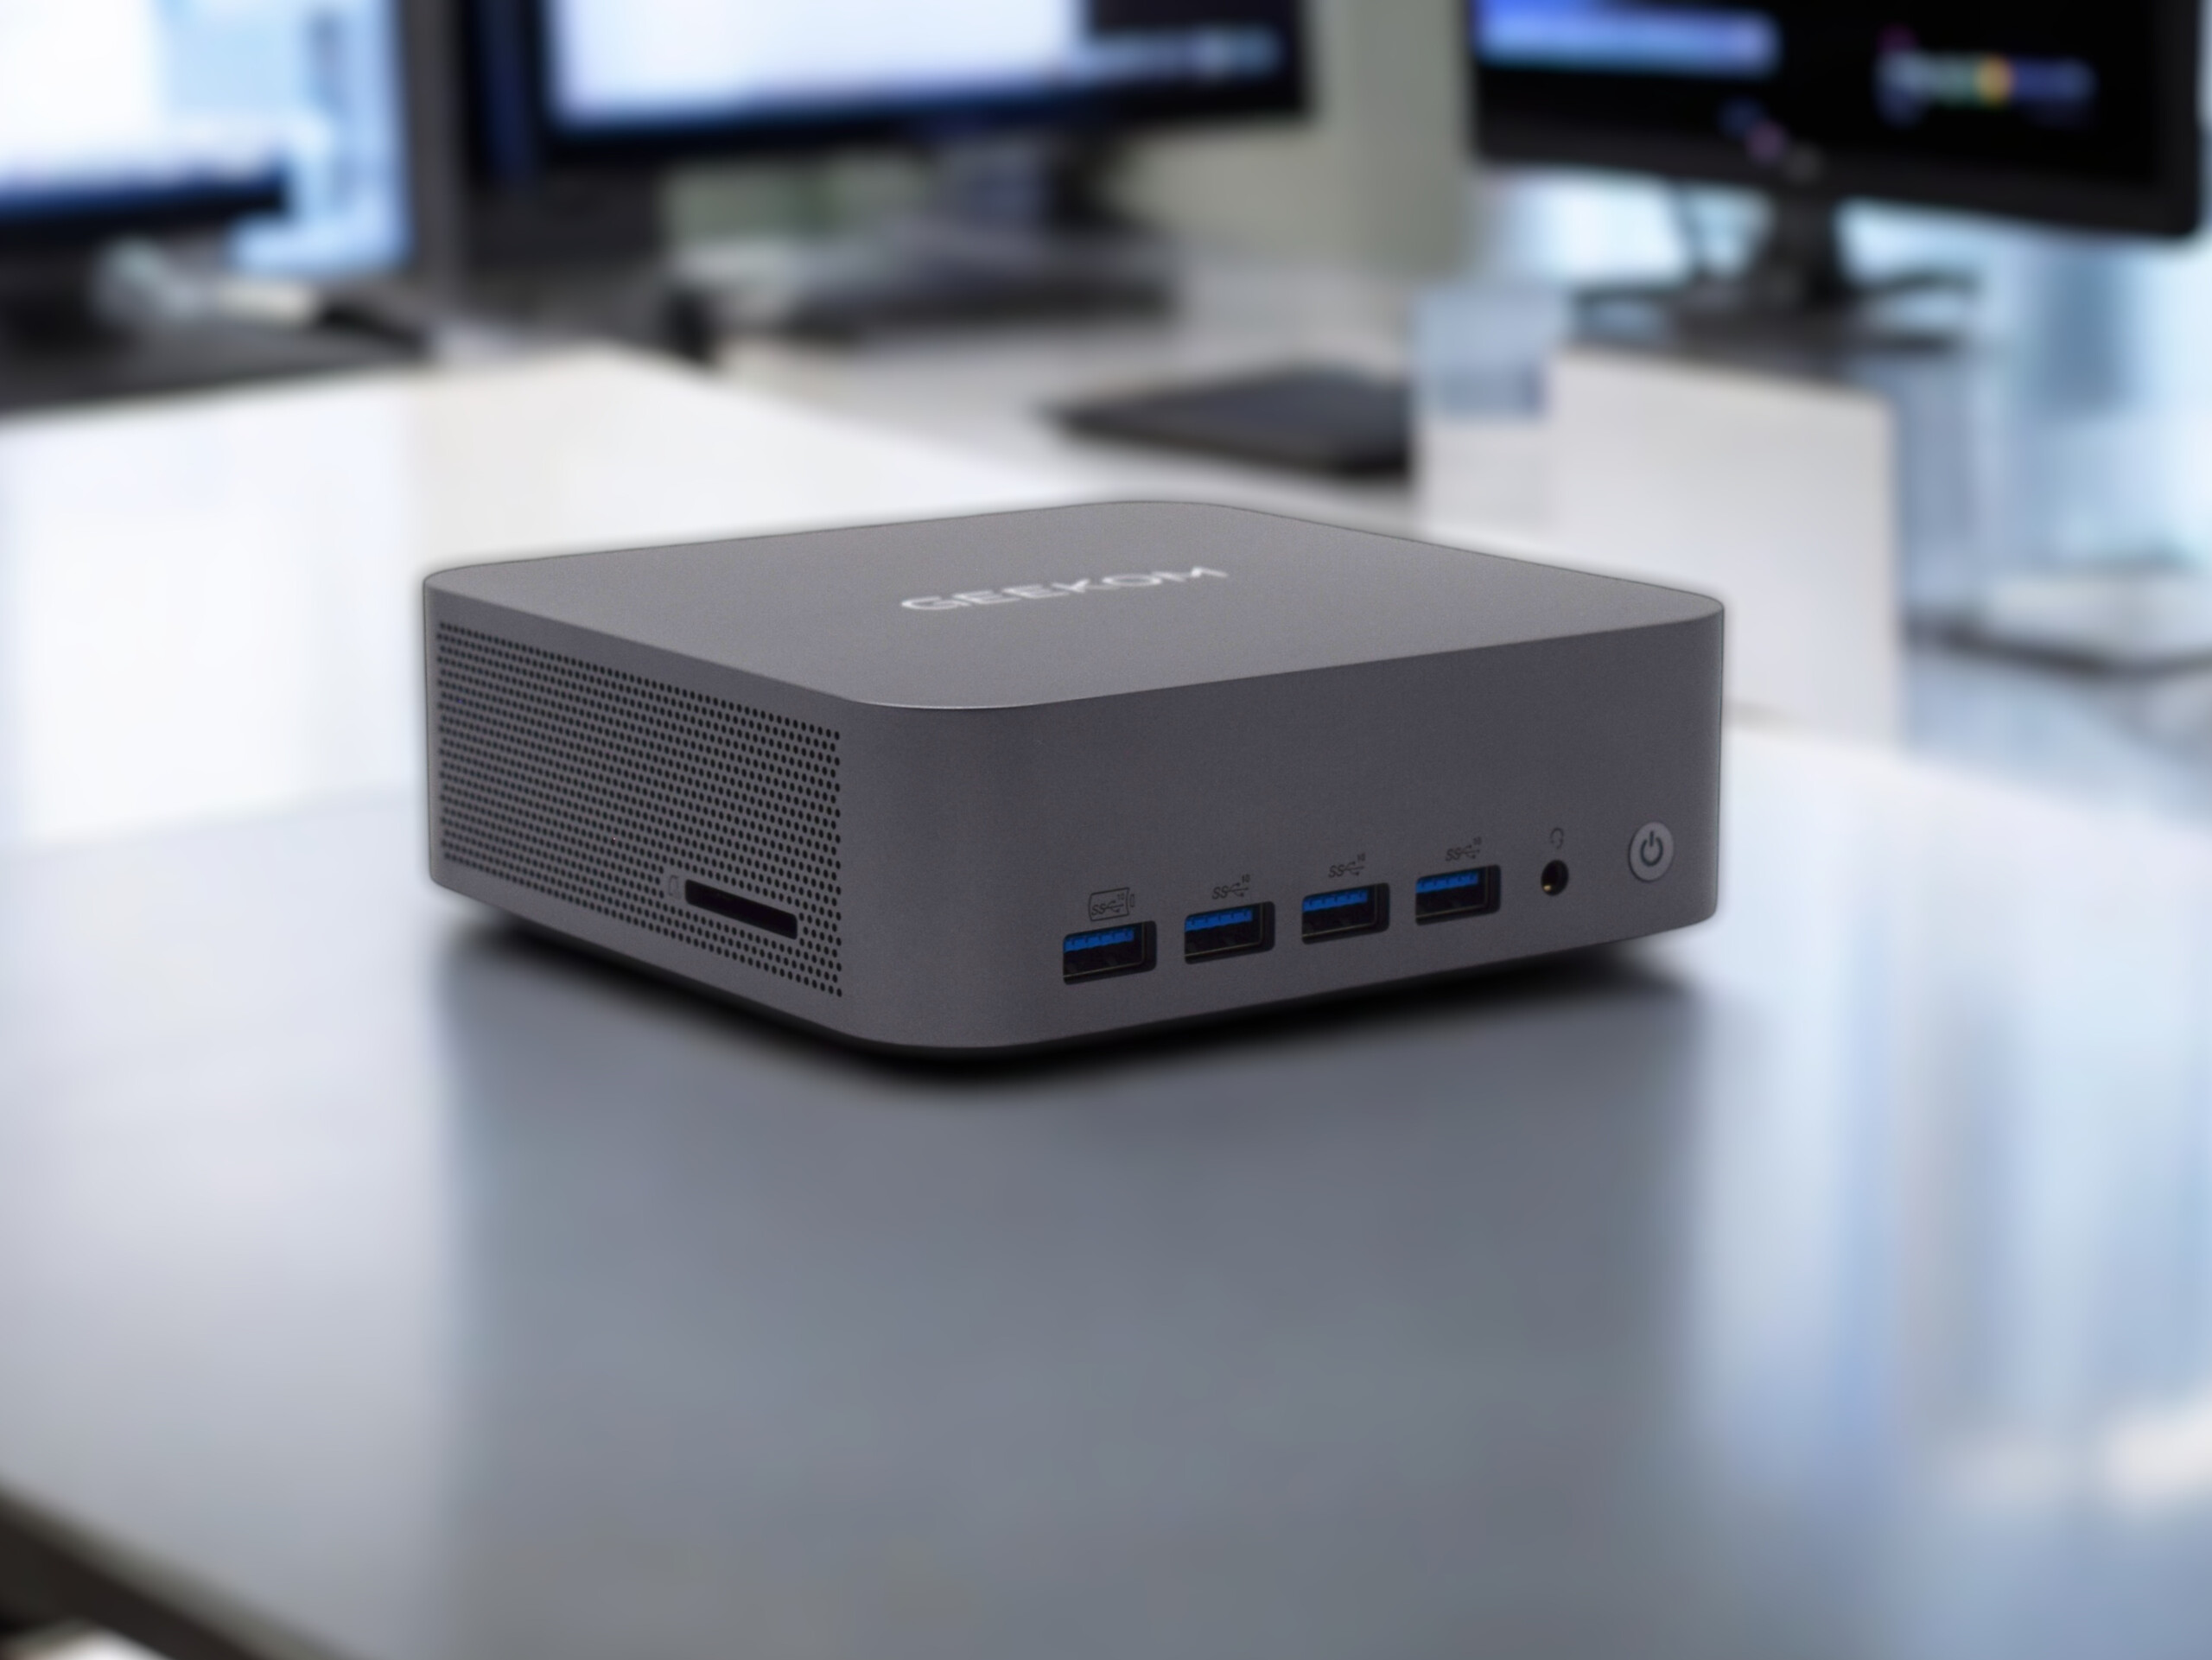
Der Geekom GT1 Mega ist das neueste Modell aus dem Hause Geekom und verfügt erstmals über einen Intel-Meteor-Lake-Prozessor. Optisch erinnert der Geekom GT1 Mega an einen Geekom GT13 Pro. Dennoch hat Geekom viel verändert, denn auf den ersten Blick fällt die deutlich größere Bauform ins Auge. Ob dies Vorteile mit sich bringt, erläutern wir peu à peu im vorliegenden Artikel.

In diesem Test widmen wir uns dem Geekom GT1 Mega in der Topausstattung. So kommt ein Intel Core Ultra 9 185H mit 32 GB RAM und einer 2-TB-SSD zum Einsatz. Preislich muss man allerdings tief in die Tasche greifen, denn mit 1.149 Euro ist der Mini-PC wahrlich kein Schnäppchen. In der Vergangenheit gab es allerdings gelegentlich Rabattaktionen, worauf man auch hier spekulieren kann, wenn man sich dieses Gerät zulegen möchte. Wer gewillt ist, ca. 899 Euro auszugeben, kann den Geekom GT1 Mega auch mit einem Intel Core Ultra 7 155H mit 32 GB RAM und einer 1-TB-SSD kombinieren. Oberflächlich betrachtet ist dieses eine sinnvollere Konfiguration, denn technisch gibt es nur minimale Unterschiede zwischen den beiden Prozessoren.

Der Geekom GT1 Mega tritt außerdem in Wettstreit zu etablierten Mini-PCs anderer Hersteller wie Asus, Minisforum und Acemagic. Konkurrenz bekommt der GT1 Mega jedoch auch aus den eigenen Reihen, denn Geekom selbst hat nach wie vor leistungsstarke Mini-PCs im aktuellen Portfolio.

Spezifikationen

Geekom GT1 Mega
Prozessor
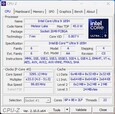
Intel Core Ultra 9 185H 16 x 3.8 - 5.1 GHz, 70 W PL2 / Short Burst, 45 W PL1 / Sustained, Meteor Lake-H
Grafikkarte
Intel Arc 8-Core iGPU, Kerntakt: 2350 MHz, 32.0.101.6079
RAM
32 GB 
, DDR5-5600, max 64 GB
Mainboard
Intel Meteor Lake-U/P/H PCH
Massenspeicher
Crucial P3 Plus CT2000P3PSSD8 , 2048 GB 
, 1760 GB verfügbar
Soundkarte
Intel Meteor Lake-U/P/H PCH - cAVS (Audio, Voice, Speech)
Anschlüsse
1 USB 2.0, 5 USB 3.1 Gen2, 2 USB 4.0 40 Gbps, USB-C Power Delivery (PD), 2 HDMI, 2 DisplayPort, 1 Kensington Lock, 1 Docking Station Anschluss, Audio Anschlüsse: 3.5mm combo, Card Reader: Full-Size-SD-Card (UHS II), Intel Ethernet Controller I226-V (10/2500MBit/s)
Netzwerk
Intel Ethernet Controller I226-V (10/2500MBit/s), Intel Wi-Fi 7 BE200 320MHz (a/b/g/n = Wi-Fi 4/ac = Wi-Fi 5/ax = Wi-Fi 6/ Wi-Fi 6E 6 GHz be = Wi-Fi 7), Bluetooth 5.4
Abmessungen
Höhe x Breite x Tiefe (in mm): 46.9 x 135 x 132
Betriebssystem
Microsoft Windows 11 Pro
Sonstiges
120-Watt-Power-Adapter, 36 Monate Garantie
Gewicht
693 g, Netzteil: 256 g
Preis
1149 EUR
Amazon
Hinweis: Der Hersteller kann abweichende Bauteile wie Bildschirme, Laufwerke und Speicherriegel mit ähnlichen Spezifikationen unter dem gleichen Modellnamen einsetzen.


Geekom GT1 Mega
Geekom GT1 Mega
Geekom GT1 Mega
Geekom GT1 Mega vs. Geekom GT13 Pro
Geekom GT1 Mega
Geekom GT1 Mega
Geekom GT1 Mega
Geekom GT1 Mega
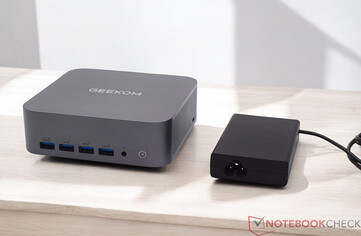
Geekom GT1 Mega mit Netzteil (19 V; 6,32 A)
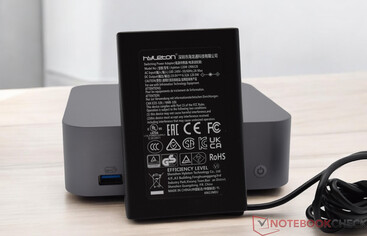
Netzteil (19 V; 6,32 A)

Gehäuse - perfekt verarbeitetes Aluminiumgehäuse

Der Geekom GT1 Mega ist deutlich größer als die bisherigen Mini-PCs von Geekom. Problematisch ist das nicht, denn das ermöglicht den Einsatz einer leistungsstärkeren Kühleinheit. Bei der Materialauswahl vertraut Geekom vorwiegend auf Aluminium, welches im dezenten Dunkelgrau sehr hochwertig wirkt. An der Verarbeitungsqualität gibt es nichts zu kritisieren, denn das Gerät ist rundum perfekt verarbeitet. Bei dem aufgerufenen Preis kann man das auch erwarten. Die Unterseite besteht aus Kunststoff, wie wir es schon vom Geekom GT13 Pro her kennen. Die größere Bauweise hat auch Auswirkungen auf das Gewicht. Mit knapp 700 Gramm ist unser Testsample aber doch noch ein wenig leichter als der Acemagic F2A oder der Minisforum UH125 Pro. Das Netzteil bringt 256 Gramm auf die Waage und ist damit etwa genauso schwer wie beim Geekom AX8 Pro oder dem Geekom GT13 Pro. Alle Geräte aus dem Hause Geekom, welche wir hier im Vergleich haben, werden mit dem gleichen Netzteil ausgeliefert. Übrigens lässt sich der Geekom GT1 Mega mit der mitgelieferten VESA-Halterung direkt an einem Monitor befestigen.

Größenvergleich

146 mm 146 mm 57 mm 768 g145 mm 145 mm 49 mm 797 g135 mm 132 mm 46.9 mm 693 g117 mm 112 mm 37 mm 548 g117 mm 112 mm 37 mm 525 g112.4 mm 112.4 mm 37 mm 440 g210 mm 148 mm 1 mm 2.9 g

Ausstattung - viele Anschlüsse inklusive 2x USB4

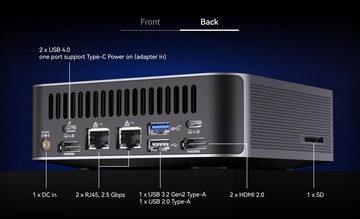
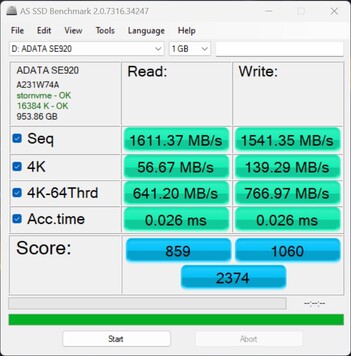
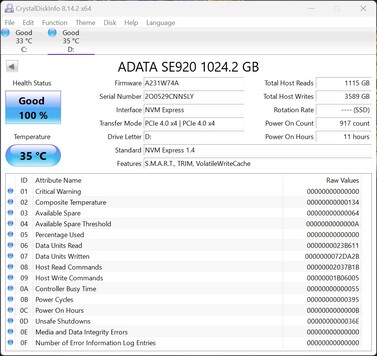
Die größere Bauform macht sich Geekom zunutze und stattet den Geekom GT1 Mega mit vielen Anschlüssen aus. An USB-Typ-A-Schnittstellen sollte es nicht mangeln, denn insgesamt gibt es diese gleich sechsmal. Die Frage, ob die vier Ports an der Vorderseite sinnvoll sind, muss sich jeder selbst beantworten. Zudem verbaut Geekom noch zwei weitere USB4-Schnittstellen auf der Rückseite, womit der Mini-PC beispielsweise auch mit einer externen Grafikkarte umgehen kann. Für die Bildausgabe lassen sich die beiden HDMI-Ausgänge auf der Rückseite nutzen. Gleichwohl besteht die Möglichkeit, in Kombination mit den beiden USB4-Anschlüssen bis zu vier Displays gleichzeitig zu betreiben. Nicht vergessen und positiv hervorzuheben ist der schnelle SD-Kartenleser, welcher sich auf der linken Seite befindet. Etwas ernüchternd ist die Leistung, die wir über die USB4-Schnittstelle ermitteln. Die sequenzielle Leserate unserer Test-SSD (ADATA SE920) fällt im Vergleich zum Minisforum MS-A1 oder einem Khadas Mind 2 deutlich geringer aus.

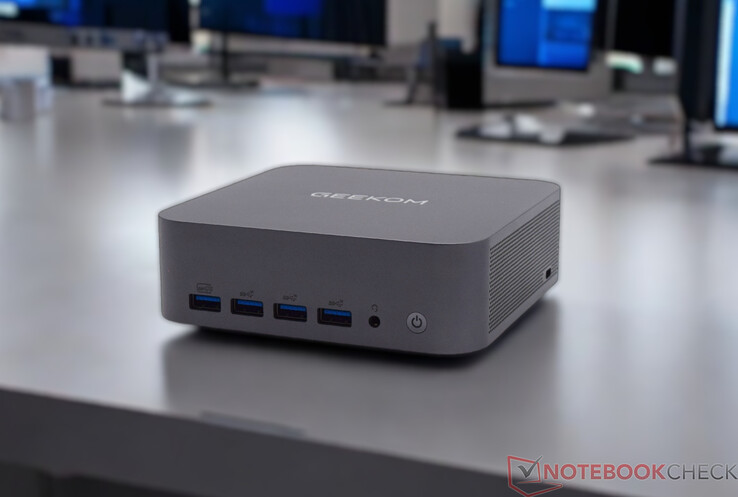
Die externen Anschlüsse am Geekom GT1 Mega - Vorderseite (Quelle: Geekom)
Die externen Anschlüsse am Geekom GT1 Mega - Rückseite (Quelle: Geekom)
Leistungscheck mit der ADATA SE920 über USB4
ADATA SE920 arbeitet mit PCIe 4.0 x4

SD-Kartenleser

SD Card Reader
average JPG Copy Test (av. of 3 runs)
Geekom GT1 Mega
Intel Core Ultra 9 185H
214.4 MB/s
Khadas Mind
Intel Core i7-1360P (AV Pro SD microSD 128 GB V60)
181.79 MB/s -15%
Geekom A5
AMD Ryzen 7 5800H (AV Pro SD microSD 128 GB V60)
176.8 MB/s -18%
Geekom Mini IT13
Intel Core i9-13900H
154.449 MB/s -28%
Geekom Mini IT12
Intel Core i7-1260P (AV Pro SD microSD 128 GB V60)
129.2 MB/s -40%
Durchschnitt der Klasse Mini PC
  (15.1 - 214, n=26, der letzten 2 Jahre)
97.7 MB/s -54%
Zotac ZBOX Magnus EN173070C
Intel Core i7-11800H (AV Pro SD microSD 128 GB V60)
65 MB/s -70%
maximum AS SSD Seq Read Test (1GB)
Geekom GT1 Mega
Intel Core Ultra 9 185H
220.9 MB/s
Khadas Mind
Intel Core i7-1360P (AV Pro SD microSD 128 GB V60)
200.48 MB/s -9%
Geekom A5
AMD Ryzen 7 5800H (AV Pro SD microSD 128 GB V60)
182.5 MB/s -17%
Geekom Mini IT13
Intel Core i9-13900H
180.4 MB/s -18%
Geekom Mini IT12
Intel Core i7-1260P (AV Pro SD microSD 128 GB V60)
176.8 MB/s -20%
Durchschnitt der Klasse Mini PC
  (18.2 - 221, n=26, der letzten 2 Jahre)
112.4 MB/s -49%
Zotac ZBOX Magnus EN173070C
Intel Core i7-11800H (AV Pro SD microSD 128 GB V60)
69.9 MB/s -68%
Connectivity - USB 3.x / USB4 / TB - AS SSD Seq Read Test (1GB)
Minisforum MS-A1
Radeon 780M, Ryzen 7 8700G, Kingston OM8PGP41024Q-A0
3245.45 MB/s
Khadas Mind 2
Arc 8-Core, Ultra 7 155H, WD PC SN740 SDDPTQD-1T00
3165.4 MB/s
Durchschnitt der Klasse Mini PC
  (1611 - 3245, n=6, der letzten 2 Jahre)
2831 MB/s
Geekom GT1 Mega
Arc 8-Core, Ultra 9 185H, Crucial P3 Plus CT2000P3PSSD8
1611.37 MB/s

Kommunikation

WLAN-Modul
WLAN-Modul

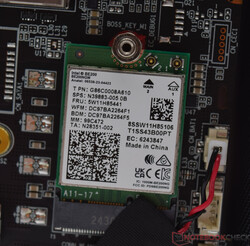
Im Geekom GT1 Mega verbaut der Hersteller ein Intel Wi-Fi 7 BE200, welches bereits Wi-Fi 7 unterstützt. Das WLAN-Modul ermöglicht, mit dem 2,4-GHz- als auch mit dem 5-GHz- und dem 6-GHz-Frequenzbereich zu arbeiten. Unsere Messungen beschränken sich in diesem Test auf das 5- und 6-GHz-Frequenzband. Die Ergebnisse fallen im Vergleich zu den Kontrahenten ernüchternd aus. Wie man den Ergebnissen entnehmen kann, sollte nach Möglichkeit das 6-GHz-Frequenzband genutzt werden, um die beste Leistung zu erzielen. Die Tests wurden in Kombination mit unserem Testrouter Asus ROG Rapture GT-AXE11000 ermittelt. Höhere Datenübertragungen sind via RJ45 möglich. Von den LAN-Buchsen, welche Datenübertragungsraten bis zu 2,5 GBit/s erlauben, verbaut Geekom beim GT1 Mega gleich zwei.

Networking
iperf3 receive AXE11000 6GHz
Acemagic F2A
Intel Wi-Fi 7 BE200 320MHz
1770 (1584min - 1790max) MBit/s +54%
Minisforum UH125 Pro
Intel Wi-Fi 6E AX210
1755 (1737min - 1766max) MBit/s +53%
Asus NUC 14 Pro
Intel Wi-Fi 6E AX211
1729 (1594min - 1755max) MBit/s +50%
Geekom AX8 Pro
MediaTek Wi-Fi 6E MT7922 160MHz Wireless LAN Card
1657 (1619min - 1670max) MBit/s +44%
Geekom GT13 Pro
MediaTek Wi-Fi 6E MT7922 160MHz Wireless LAN Card
1583 (1557min - 1611max) MBit/s +38%
Durchschnittliche Intel Wi-Fi 7 BE200 320MHz
  (1149 - 1770, n=15)
1537 MBit/s +34%
Durchschnitt der Klasse Mini PC
  (684 - 1771, n=55, der letzten 2 Jahre)
1380 MBit/s +20%
Geekom GT1 Mega
Intel Wi-Fi 7 BE200 320MHz
1149 (666min - 1346max) MBit/s
iperf3 transmit AXE11000 6GHz
Geekom AX8 Pro
MediaTek Wi-Fi 6E MT7922 160MHz Wireless LAN Card
1800 (1737min - 1904max) MBit/s +45%
Acemagic F2A
Intel Wi-Fi 7 BE200 320MHz
1615 (767min - 1670max) MBit/s +30%
Minisforum UH125 Pro
Intel Wi-Fi 6E AX210
1605 (1238min - 1652max) MBit/s +29%
Geekom GT13 Pro
MediaTek Wi-Fi 6E MT7922 160MHz Wireless LAN Card
1429 (1392min - 1511max) MBit/s +15%
Durchschnittliche Intel Wi-Fi 7 BE200 320MHz
  (943 - 1653, n=15)
1390 MBit/s +12%
Asus NUC 14 Pro
Intel Wi-Fi 6E AX211
1379 (1299min - 1425max) MBit/s +11%
Durchschnitt der Klasse Mini PC
  (394 - 1800, n=55, der letzten 2 Jahre)
1330 MBit/s +7%
Geekom GT1 Mega
Intel Wi-Fi 7 BE200 320MHz
1242 (1110min - 1348max) MBit/s
iperf3 receive AXE11000
Geekom GT13 Pro
MediaTek Wi-Fi 6E MT7922 160MHz Wireless LAN Card
1398 (1261min - 1453max) MBit/s +57%
Asus NUC 14 Pro
Intel Wi-Fi 6E AX211
1379 (1016min - 1613max) MBit/s +55%
Durchschnittliche Intel Wi-Fi 7 BE200 320MHz
  (838 - 1701, n=20)
1358 MBit/s +53%
Geekom AX8 Pro
MediaTek Wi-Fi 6E MT7922 160MHz Wireless LAN Card
979 (962min - 989max) MBit/s +10%
Durchschnitt der Klasse Mini PC
  (320 - 1796, n=113, der letzten 2 Jahre)
945 MBit/s +6%
Minisforum UH125 Pro
Intel Wi-Fi 6E AX210
936 (907min - 946max) MBit/s +5%
Geekom GT1 Mega
Intel Wi-Fi 7 BE200 320MHz
888 (825min - 926max) MBit/s
Acemagic F2A
Intel Wi-Fi 7 BE200 320MHz
838 (728min - 926max) MBit/s -6%
iperf3 transmit AXE11000
Asus NUC 14 Pro
Intel Wi-Fi 6E AX211
1331 (1187min - 1442max) MBit/s +80%
Durchschnittliche Intel Wi-Fi 7 BE200 320MHz
  (469 - 1642, n=20)
1192 MBit/s +61%
Geekom GT13 Pro
MediaTek Wi-Fi 6E MT7922 160MHz Wireless LAN Card
1146 (846min - 1308max) MBit/s +55%
Geekom AX8 Pro
MediaTek Wi-Fi 6E MT7922 160MHz Wireless LAN Card
966 (921min - 1008max) MBit/s +30%
Durchschnitt der Klasse Mini PC
  (184.1 - 1776, n=113, der letzten 2 Jahre)
874 MBit/s +18%
Minisforum UH125 Pro
Intel Wi-Fi 6E AX210
758 (727min - 793max) MBit/s +2%
Geekom GT1 Mega
Intel Wi-Fi 7 BE200 320MHz
741 (690min - 797max) MBit/s
Acemagic F2A
Intel Wi-Fi 7 BE200 320MHz
709 (369min - 977max) MBit/s -4%
0501001502002503003504004505005506006507007508008509009501000105011001150120012501300135014001450150015501600165017001750180018501900Tooltip
Geekom GT1 Mega Intel Wi-Fi 7 BE200 320MHz; iperf3 transmit AXE11000 6GHz; iperf 3.1.3: Ø1242 (1110-1348)
Geekom AX8 Pro MediaTek Wi-Fi 6E MT7922 160MHz Wireless LAN Card; iperf3 transmit AXE11000 6GHz; iperf 3.1.3: Ø1800 (1737-1904)
Geekom GT1 Mega Intel Wi-Fi 7 BE200 320MHz; iperf3 receive AXE11000 6GHz; iperf 3.1.3: Ø1126 (666-1346)
Geekom AX8 Pro MediaTek Wi-Fi 6E MT7922 160MHz Wireless LAN Card; iperf3 receive AXE11000 6GHz; iperf 3.1.3: Ø1656 (1619-1670)
Geekom GT1 Mega Intel Wi-Fi 7 BE200 320MHz; iperf3 receive AXE11000; iperf 3.1.3: Ø887 (825-926)
Geekom AX8 Pro MediaTek Wi-Fi 6E MT7922 160MHz Wireless LAN Card; iperf3 receive AXE11000; iperf 3.1.3: Ø978 (962-989)
Geekom GT1 Mega Intel Wi-Fi 7 BE200 320MHz; iperf3 transmit AXE11000; iperf 3.1.3: Ø741 (690-797)
Geekom AX8 Pro MediaTek Wi-Fi 6E MT7922 160MHz Wireless LAN Card; iperf3 transmit AXE11000; iperf 3.1.3: Ø966 (921-1008)

Zubehör

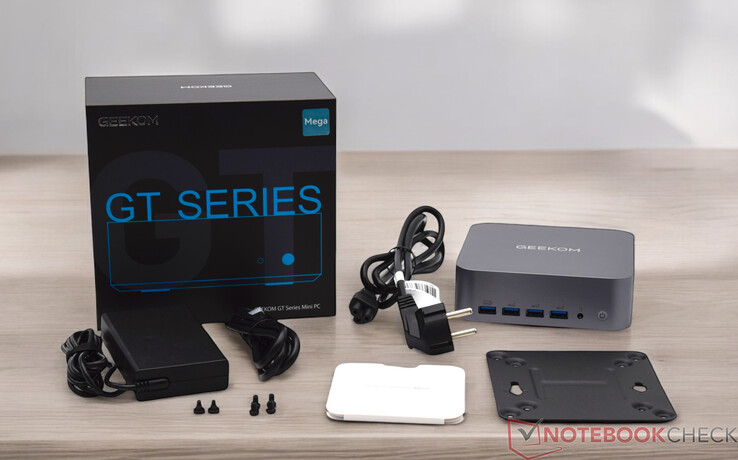
Im Lieferumfang finden wir den Geekom GT1 Mega zusammen mit dem 120-Watt-Netzteil. Weiterhin gibt es ein HDMI-Kabel sowie eine VESA-Halteplatte, was im Umkehrschluss einen Standardlieferumfang darstellt. Ebenfalls legt der Hersteller ein kleines User Manual bei, welches unter anderem die Anschlussmöglichkeiten sowie die Installation von RAM und SSD beschreibt.

Lieferumfang beim Geekom GT1 Mega

Wartung

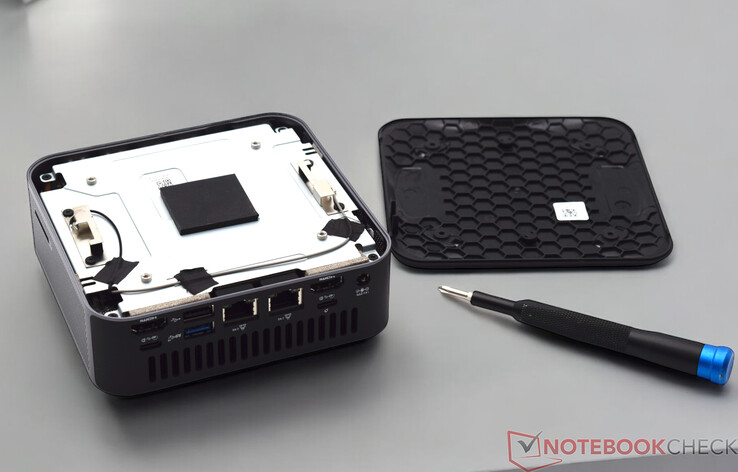
Der Geekom GT1 Mega wird immer in Kombination mit vorinstalliertem Arbeitsspeicher sowie einer SSD verkauft. Im Umkehrschluss bedeutet dies, dass der Geekom GT1 Mega direkt einsatzbereit ist. Das Gerät lässt sich aber dennoch mit etwas Geschick öffnen. Die Vorgehensweise gleicht hier dem Geekom GT13 Pro, wenngleich der G1 Mega nur etwas größer ist. Unter den aufgeklebten Gummifüßen verbergen sich vier kleine Schrauben, die zunächst herausgedreht werden müssen, um die Unterseite zu demontieren. Eine weitere Metallplatte versperrt den Weg zu den verbauten Komponenten, welche zunächst demontiert werden muss, wenn man an RAM, SSD oder das WLAN-Modul gelangen will. Ein freier M.2-Steckplatz ist noch vorhanden, womit der Geekom GT1 Mega mit zwei SSDs bestückt werden kann. Der zweite M.2-Steckplatz kann technisch sowohl NVMe als auch SATA-SSDs aufnehmen. Bei der Länge ist man hier jedoch auf 42 Millimeter beschränkt.

Geekom GT1 Mega mit geöffneter Unterseite
Die Schrauben befinden sich unter den Gummifüßen
Platine mit Kühleinheit des Geekom GT1 Mega
Platine des Geekom GT1 Mega
Geekom GT1 Mega zerlegt

Nachhaltigkeit

Der Geekom GT1 Mega ist ein kompakter Mini-PC, womit Reparaturarbeiten im Falle eines Defektes kaum möglich sind. Immerhin gewährt Geekom eine Garantie von 36 Monaten, womit sich Geekom in diesem Bereich von den meisten anderen Herstellern positiv abgrenzt. Lob bekommt Geekom für die kompakte Verpackung, die den Transport sicherlich erleichtert. In puncto Nachhaltigkeit bewirbt Geekom die geringe Leistungsaufnahme im Vergleich zu einem herkömmlichen Desktop-PC. Genauere Angaben zur Verwendung von recycelten Materialien für die Produktion gibt es allerdings nicht.

Leistung - Geekom verbaut erstmals einen AI-Prozessor

Geekom verbaut im GT1 Mega erstmals einen Intel Core Ultra 9 185H, welcher aufgrund seiner Bauweise auch spezielle KI-Berechnungen besonders effizient durchführen kann. Zusammen mit 32 GB DDR5 RAM ist man für fast alle Aufgaben gewappnet. Die alternative Ausstattungsvariante, auf Basis des Intel Core Ultra 7 155H, liefert eine ähnliche Leistung und bringt die gleichen Neuerungen mit sich.

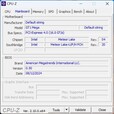
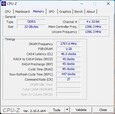
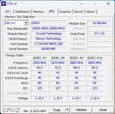
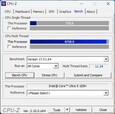
CPU-Z
CPU-Z
CPU-Z
CPU-Z
CPU-Z
CPU-Z
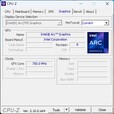
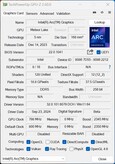
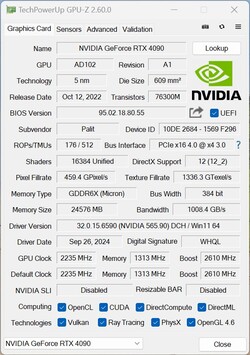
GPU-Z
GPU-Z
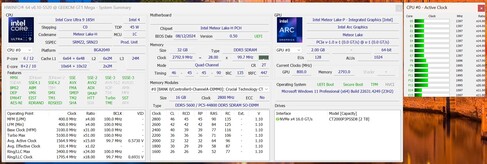
HWiNFO

Testbedingungen

Alle Leistungstests haben wir mit dem Energieprofil "Höchstleistung" durchgeführt. Die Leistung des Intel Core Ultra 9 185H haben wir nicht verändert und gemäß den BIOS-Einstellungen im normal mode belassen. Abweichende Energiesparpläne kamen nur bei den Energieverbrauchsmessungen gemäß unseren Testkriterien zum Tragen.

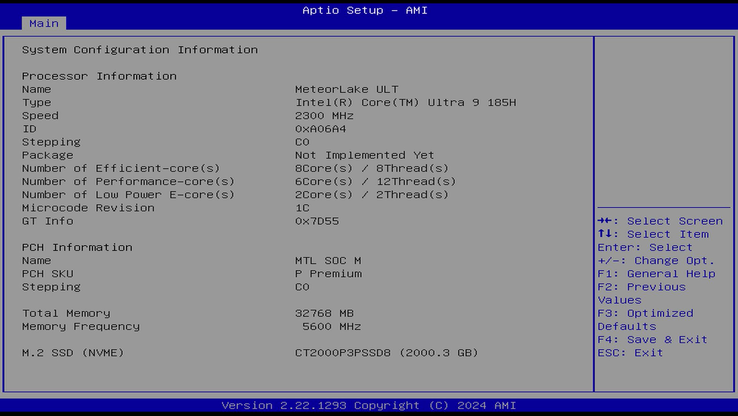
Geekom GT1 Mega - BIOS Optionen

Prozessor

Der Geekom GT1 Mega wird in der Topausstattung von einem Intel Core Ultra 9 185H angetrieben. 16 Kerne mit zusammen 22 Threads sorgen für ein hohes Arbeitstempo, was sich primär bei Multi-Thread-Aufgaben auszahlt. Bei der Single-Core-Performance braucht sich unser Testsample jedoch auch nicht zu verstecken. Oftmals führt der GT1 Mega die Benchmark-Ergebnisse an. Insgesamt kann sich unser Testmuster dann aber nur den zweiten Platz sichern. Der härteste Konkurrent ist hier der Geekom AX8 Pro, den wir mit AMD Ryzen 9 8945HS getestet haben.

Zur Leistungsaufnahme sei zu erwähnen, dass Geekom den Intel Core Ultra 9 185H gemäß den Herstellervorgaben betreibt. Im Auslieferungszustand ist im BIOS das Profil normal mode aktiv. Damit arbeitet das SoC mit 45 Watt unter Dauerlast, wenngleich bis zu 70 Watt im Turbo möglich sind. Neben dem normal mode kann man den Geekom GT1 Megan auch im quiet mode oder im performance mode betreiben. Das hat geringe Auswirkungen auf die Power-Limits des Prozessors, womit sich auch die Leistung etwas verändert. Wir haben einige Tests mit den verschiedenen Modi durchgeführt und in der Tabelle zusammengetragen. Den Ergebnissen kann man entnehmen, dass es keinen signifikanten Leistungsvorteil im performance mode gibt. Um die akustische Belastung zu verringern, würden wir den quiet mode empfehlen. Den hiermit einhergehenden Leistungsverlust kann man sicherlich verkraften.

Für weitere Vergleiche und Benchmarks verweisen wir auf unsere CPU-Vergleichstabelle.

Power Mode PL1/PL2 in W Cinebench R15 1T Cinebench R15 nT Cinebench R20 1T Cinebench R20 nT Cinebench R23 1T Cinebench R23 nT
quiet mode 45/50 260 2.430 696 6.403 1.820 16.536
normal mode 45/70 262 2.794 696 7.192 1.774 18.608
performance mode 65/70 264 2.800 704 7.213 1.826 18.739

Cinebench Ergebnisse - normal-Mode - PL2 70 W; PL1 45 W

Cinebench R15
Cinebench R15
Cinebench R20
Cinebench R20
Cinebench R23
Cinebench R23
Cinebench 2024
Cinebench 2024
Performance Rating - Percent
Geekom AX8 Pro
AMD Ryzen 9 8945H
56.6 pt
Geekom GT1 Mega
Intel Core Ultra 9 185H
56.1 pt
Acemagic F2A
Intel Core Ultra 7 155H
55.3 pt
Geekom GT13 Pro
Intel Core i9-13900H
53.5 pt
Asus NUC 14 Pro
Intel Core Ultra 5 125H
50.9 pt
Minisforum UH125 Pro
Intel Core Ultra 5 125H
50.1 pt
Cinebench 2024
CPU Multi Core
Acemagic F2A
Intel Core Ultra 7 155H
1022 Points +11%
Geekom GT1 Mega
Intel Core Ultra 9 185H
924 Points
Geekom AX8 Pro
AMD Ryzen 9 8945H
852 Points -8%
Asus NUC 14 Pro
Intel Core Ultra 5 125H
815 Points -12%
Minisforum UH125 Pro
Intel Core Ultra 5 125H
814 Points -12%
Geekom GT13 Pro
Intel Core i9-13900H
703 Points -24%
CPU Single Core
Geekom AX8 Pro
AMD Ryzen 9 8945H
107 Points 0%
Geekom GT1 Mega
Intel Core Ultra 9 185H
107 Points
Acemagic F2A
Intel Core Ultra 7 155H
106 Points -1%
Geekom GT13 Pro
Intel Core i9-13900H
104 Points -3%
Asus NUC 14 Pro
Intel Core Ultra 5 125H
102 Points -5%
Minisforum UH125 Pro
Intel Core Ultra 5 125H
97 Points -9%
Cinebench R23
Multi Core
Geekom GT1 Mega
Intel Core Ultra 9 185H
18608 Points
Acemagic F2A
Intel Core Ultra 7 155H
18497 Points -1%
Geekom AX8 Pro
AMD Ryzen 9 8945H
15516 Points -17%
Minisforum UH125 Pro
Intel Core Ultra 5 125H
14564 Points -22%
Asus NUC 14 Pro
Intel Core Ultra 5 125H
14516 Points -22%
Geekom GT13 Pro
Intel Core i9-13900H
13015 Points -30%
Single Core
Geekom AX8 Pro
AMD Ryzen 9 8945H
1808 Points +2%
Geekom GT1 Mega
Intel Core Ultra 9 185H
1774 Points
Acemagic F2A
Intel Core Ultra 7 155H
1771 Points 0%
Asus NUC 14 Pro
Intel Core Ultra 5 125H
1721 Points -3%
Geekom GT13 Pro
Intel Core i9-13900H
1715 Points -3%
Minisforum UH125 Pro
Intel Core Ultra 5 125H
1640 Points -8%
Cinebench R20
CPU (Single Core)
Geekom AX8 Pro
AMD Ryzen 9 8945H
703 Points +1%
Geekom GT1 Mega
Intel Core Ultra 9 185H
696 Points
Acemagic F2A
Intel Core Ultra 7 155H
679 Points -2%
Geekom GT13 Pro
Intel Core i9-13900H
659 Points -5%
Minisforum UH125 Pro
Intel Core Ultra 5 125H
629 Points -10%
Asus NUC 14 Pro
Intel Core Ultra 5 125H
622 Points -11%
CPU (Multi Core)
Geekom GT1 Mega
Intel Core Ultra 9 185H
7192 Points
Acemagic F2A
Intel Core Ultra 7 155H
7188 Points 0%
Geekom AX8 Pro
AMD Ryzen 9 8945H
6153 Points -14%
Minisforum UH125 Pro
Intel Core Ultra 5 125H
5618 Points -22%
Asus NUC 14 Pro
Intel Core Ultra 5 125H
5617 Points -22%
Geekom GT13 Pro
Intel Core i9-13900H
5013 Points -30%
Cinebench R15
CPU Single 64Bit
Geekom AX8 Pro
AMD Ryzen 9 8945H
284 Points +8%
Geekom GT1 Mega
Intel Core Ultra 9 185H
262 Points
Acemagic F2A
Intel Core Ultra 7 155H
258 Points -2%
Asus NUC 14 Pro
Intel Core Ultra 5 125H
248 Points -5%
Geekom GT13 Pro
Intel Core i9-13900H
245 Points -6%
Minisforum UH125 Pro
Intel Core Ultra 5 125H
235 Points -10%
CPU Multi 64Bit
Geekom GT1 Mega
Intel Core Ultra 9 185H
2794 Points
Acemagic F2A
Intel Core Ultra 7 155H
2738 Points -2%
Geekom AX8 Pro
AMD Ryzen 9 8945H
2521 Points -10%
Geekom GT13 Pro
Intel Core i9-13900H
2260 Points -19%
Minisforum UH125 Pro
Intel Core Ultra 5 125H
2245 Points -20%
Asus NUC 14 Pro
Intel Core Ultra 5 125H
2141 Points -23%
Cinebench R11.5
CPU Single 64Bit
Geekom AX8 Pro
AMD Ryzen 9 8945H
3.28 Points +5%
Acemagic F2A
Intel Core Ultra 7 155H
3.13 Points 0%
Geekom GT1 Mega
Intel Core Ultra 9 185H
3.13 Points
Asus NUC 14 Pro
Intel Core Ultra 5 125H
3.03 Points -3%
Geekom GT13 Pro
Intel Core i9-13900H
2.98 Points -5%
Minisforum UH125 Pro
Intel Core Ultra 5 125H
2.86 Points -9%
CPU Multi 64Bit
Geekom GT1 Mega
Intel Core Ultra 9 185H
34.34 Points
Acemagic F2A
Intel Core Ultra 7 155H
33.49 Points -2%
Geekom AX8 Pro
AMD Ryzen 9 8945H
29.14 Points -15%
Geekom GT13 Pro
Intel Core i9-13900H
27.48 Points -20%
Minisforum UH125 Pro
Intel Core Ultra 5 125H
27.02 Points -21%
Asus NUC 14 Pro
Intel Core Ultra 5 125H
26.92 Points -22%
Cinebench R10
Rendering Single CPUs 64Bit
Geekom AX8 Pro
AMD Ryzen 9 8945H
14451 Points +3%
Geekom GT1 Mega
Intel Core Ultra 9 185H
13997 Points
Acemagic F2A
Intel Core Ultra 7 155H
13938 Points 0%
Geekom GT13 Pro
Intel Core i9-13900H
13820 Points -1%
Asus NUC 14 Pro
Intel Core Ultra 5 125H
13281 Points -5%
Minisforum UH125 Pro
Intel Core Ultra 5 125H
12858 Points -8%
Rendering Multiple CPUs 64Bit
Acemagic F2A
Intel Core Ultra 7 155H
95005 Points +4%
Geekom GT1 Mega
Intel Core Ultra 9 185H
91553 Points
Geekom AX8 Pro
AMD Ryzen 9 8945H
84253 Points -8%
Geekom GT13 Pro
Intel Core i9-13900H
79014 Points -14%
Minisforum UH125 Pro
Intel Core Ultra 5 125H
78817 Points -14%
Asus NUC 14 Pro
Intel Core Ultra 5 125H
78788 Points -14%
Blender - v2.79 BMW27 CPU
Geekom GT13 Pro
Intel Core i9-13900H
262 Seconds * -37%
Minisforum UH125 Pro
Intel Core Ultra 5 125H
230 Seconds * -20%
Asus NUC 14 Pro
Intel Core Ultra 5 125H
228 Seconds * -19%
Geekom AX8 Pro
AMD Ryzen 9 8945H
206 Seconds * -8%
Geekom GT1 Mega
Intel Core Ultra 9 185H
191 Seconds *
Acemagic F2A
Intel Core Ultra 7 155H
178 Seconds * +7%
wPrime 2.10
32m
Minisforum UH125 Pro
Intel Core Ultra 5 125H
4.48 s * -37%
Asus NUC 14 Pro
Intel Core Ultra 5 125H
4.107 s * -26%
Acemagic F2A
Intel Core Ultra 7 155H
3.523 s * -8%
Geekom GT13 Pro
Intel Core i9-13900H
3.518 s * -8%
Geekom GT1 Mega
Intel Core Ultra 9 185H
3.271 s *
Geekom AX8 Pro
AMD Ryzen 9 8945H
2.688 s * +18%
1024m
Geekom GT13 Pro
Intel Core i9-13900H
412.775 s * -150%
Minisforum UH125 Pro
Intel Core Ultra 5 125H
246.982 s * -50%
Geekom GT1 Mega
Intel Core Ultra 9 185H
165.075 s *
Asus NUC 14 Pro
Intel Core Ultra 5 125H
148.994 s * +10%
Acemagic F2A
Intel Core Ultra 7 155H
139.617 s * +15%
Geekom AX8 Pro
AMD Ryzen 9 8945H
74.917 s * +55%
X264 HD Benchmark 4.0
Pass 1
Geekom GT1 Mega
Intel Core Ultra 9 185H
336.5 (329min - 346max) fps
Acemagic F2A
Intel Core Ultra 7 155H
325 (323min - 328max) fps -3%
Asus NUC 14 Pro
Intel Core Ultra 5 125H
308.5 (306min - 311max) fps -8%
Minisforum UH125 Pro
Intel Core Ultra 5 125H
304.5 (304min - 306max) fps -10%
Geekom GT13 Pro
Intel Core i9-13900H
300.5 (288min - 319max) fps -11%
Geekom AX8 Pro
AMD Ryzen 9 8945H
300 (299min - 301max) fps -11%
Pass 2
Geekom GT1 Mega
Intel Core Ultra 9 185H
161.5 (159.8min - 163.8max) fps
Acemagic F2A
Intel Core Ultra 7 155H
154.15 (153.8min - 154.3max) fps -5%
Geekom AX8 Pro
AMD Ryzen 9 8945H
141.2 (141min - 143.9max) fps -13%
Minisforum UH125 Pro
Intel Core Ultra 5 125H
134 (133.7min - 134.5max) fps -17%
Asus NUC 14 Pro
Intel Core Ultra 5 125H
132.3 (129.2min - 135max) fps -18%
Geekom GT13 Pro
Intel Core i9-13900H
113.95 (106.5min - 136.6max) fps -29%
WinRAR - Result
Geekom GT1 Mega
Intel Core Ultra 9 185H
8563 KB/s
Geekom AX8 Pro
AMD Ryzen 9 8945H
7744 KB/s -10%
Acemagic F2A
Intel Core Ultra 7 155H
7723 KB/s -10%
Geekom GT13 Pro
Intel Core i9-13900H
6800 KB/s -21%
Asus NUC 14 Pro
Intel Core Ultra 5 125H
6315 KB/s -26%
Minisforum UH125 Pro
Intel Core Ultra 5 125H
5594 KB/s -35%
TrueCrypt
AES Mean 100MB
Geekom AX8 Pro
AMD Ryzen 9 8945H
14.5 GB/s +32%
Geekom GT13 Pro
Intel Core i9-13900H
13.2 GB/s +20%
Geekom GT1 Mega
Intel Core Ultra 9 185H
11 GB/s
Acemagic F2A
Intel Core Ultra 7 155H
10.6 GB/s -4%
Minisforum UH125 Pro
Intel Core Ultra 5 125H
9 GB/s -18%
Asus NUC 14 Pro
Intel Core Ultra 5 125H
8.8 GB/s -20%
Twofish Mean 100MB
Geekom GT13 Pro
Intel Core i9-13900H
2.4 GB/s +26%
Geekom AX8 Pro
AMD Ryzen 9 8945H
2.1 GB/s +11%
Geekom GT1 Mega
Intel Core Ultra 9 185H
1.9 GB/s
Acemagic F2A
Intel Core Ultra 7 155H
1.7 GB/s -11%
Minisforum UH125 Pro
Intel Core Ultra 5 125H
1.4 GB/s -26%
Asus NUC 14 Pro
Intel Core Ultra 5 125H
1.4 GB/s -26%
Serpent Mean 100MB
Geekom AX8 Pro
AMD Ryzen 9 8945H
1.3 GB/s +18%
Geekom GT13 Pro
Intel Core i9-13900H
1.2 GB/s +9%
Geekom GT1 Mega
Intel Core Ultra 9 185H
1.1 GB/s
Acemagic F2A
Intel Core Ultra 7 155H
1 GB/s -9%
Asus NUC 14 Pro
Intel Core Ultra 5 125H
0.869 GB/s -21%
Minisforum UH125 Pro
Intel Core Ultra 5 125H
0.854 GB/s -22%
Geekbench 5.5
Multi-Core
Geekom GT1 Mega
Intel Core Ultra 9 185H
13763 Points
Acemagic F2A
Intel Core Ultra 7 155H
12662 Points -8%
Geekom AX8 Pro
AMD Ryzen 9 8945H
11980 Points -13%
Geekom GT13 Pro
Intel Core i9-13900H
11283 Points -18%
Asus NUC 14 Pro
Intel Core Ultra 5 125H
10856 Points -21%
Minisforum UH125 Pro
Intel Core Ultra 5 125H
10788 Points -22%
Single-Core
Geekom AX8 Pro
AMD Ryzen 9 8945H
1994 Points +8%
Geekom GT1 Mega
Intel Core Ultra 9 185H
1852 Points
Geekom GT13 Pro
Intel Core i9-13900H
1841 Points -1%
Acemagic F2A
Intel Core Ultra 7 155H
1746 Points -6%
Asus NUC 14 Pro
Intel Core Ultra 5 125H
1685 Points -9%
Minisforum UH125 Pro
Intel Core Ultra 5 125H
1593 Points -14%
Geekbench 5.0
5.0 Multi-Core
Geekom GT1 Mega
Intel Core Ultra 9 185H
13822 Points
Acemagic F2A
Intel Core Ultra 7 155H
12438 Points -10%
Geekom AX8 Pro
AMD Ryzen 9 8945H
11804 Points -15%
Geekom GT13 Pro
Intel Core i9-13900H
11168 Points -19%
Asus NUC 14 Pro
Intel Core Ultra 5 125H
10747 Points -22%
Minisforum UH125 Pro
Intel Core Ultra 5 125H
10676 Points -23%
5.0 Single-Core
Geekom AX8 Pro
AMD Ryzen 9 8945H
1907 Points +6%
Geekom GT13 Pro
Intel Core i9-13900H
1810 Points +1%
Geekom GT1 Mega
Intel Core Ultra 9 185H
1797 Points
Acemagic F2A
Intel Core Ultra 7 155H
1708 Points -5%
Asus NUC 14 Pro
Intel Core Ultra 5 125H
1659 Points -8%
Minisforum UH125 Pro
Intel Core Ultra 5 125H
1596 Points -11%
Geekbench 4.4
64 Bit Single-Core Score
Geekom AX8 Pro
AMD Ryzen 9 8945H
8140 Points +8%
Geekom GT13 Pro
Intel Core i9-13900H
7787 Points +4%
Geekom GT1 Mega
Intel Core Ultra 9 185H
7516 Points
Asus NUC 14 Pro
Intel Core Ultra 5 125H
6964 Points -7%
Acemagic F2A
Intel Core Ultra 7 155H
6927 Points -8%
Minisforum UH125 Pro
Intel Core Ultra 5 125H
6734 Points -10%
64 Bit Multi-Core Score
Geekom GT1 Mega
Intel Core Ultra 9 185H
49924 Points
Geekom AX8 Pro
AMD Ryzen 9 8945H
47917 Points -4%
Acemagic F2A
Intel Core Ultra 7 155H
45250 Points -9%
Geekom GT13 Pro
Intel Core i9-13900H
41851 Points -16%
Asus NUC 14 Pro
Intel Core Ultra 5 125H
38793 Points -22%
Minisforum UH125 Pro
Intel Core Ultra 5 125H
38648 Points -23%
3DMark 11 - 1280x720 Performance Physics
Geekom AX8 Pro
AMD Ryzen 9 8945H
22340 Points +23%
Acemagic F2A
Intel Core Ultra 7 155H
20846 Points +15%
Geekom GT13 Pro
Intel Core i9-13900H
18383 Points +1%
Geekom GT1 Mega
Intel Core Ultra 9 185H
18130 Points
Asus NUC 14 Pro
Intel Core Ultra 5 125H
17624 Points -3%
Minisforum UH125 Pro
Intel Core Ultra 5 125H
17138 Points -5%
7-Zip 18.03
7z b 4
Geekom GT1 Mega
Intel Core Ultra 9 185H
71050 MIPS
Geekom AX8 Pro
AMD Ryzen 9 8945H
66557 MIPS -6%
Acemagic F2A
Intel Core Ultra 7 155H
66438 MIPS -6%
Geekom GT13 Pro
Intel Core i9-13900H
52479 MIPS -26%
Minisforum UH125 Pro
Intel Core Ultra 5 125H
0 MIPS -100%
Asus NUC 14 Pro
Intel Core Ultra 5 125H
0 MIPS -100%
7z b 4 -mmt1
Geekom AX8 Pro
AMD Ryzen 9 8945H
6691 MIPS +18%
Geekom GT13 Pro
Intel Core i9-13900H
6321 MIPS +12%
Geekom GT1 Mega
Intel Core Ultra 9 185H
5657 MIPS
Acemagic F2A
Intel Core Ultra 7 155H
5485 MIPS -3%
Asus NUC 14 Pro
Intel Core Ultra 5 125H
5136 MIPS -9%
Minisforum UH125 Pro
Intel Core Ultra 5 125H
4699 MIPS -17%
HWBOT x265 Benchmark v2.2 - 4k Preset
Geekom AX8 Pro
AMD Ryzen 9 8945H
20.6 fps +2%
Geekom GT1 Mega
Intel Core Ultra 9 185H
20.2 fps
Acemagic F2A
Intel Core Ultra 7 155H
19.6 fps -3%
Minisforum UH125 Pro
Intel Core Ultra 5 125H
16.7 fps -17%
Asus NUC 14 Pro
Intel Core Ultra 5 125H
15.7 fps -22%
Geekom GT13 Pro
Intel Core i9-13900H
14.1 fps -30%
R Benchmark 2.5 - Overall mean
Minisforum UH125 Pro
Intel Core Ultra 5 125H
0.513 sec * -12%
Asus NUC 14 Pro
Intel Core Ultra 5 125H
0.4982 sec * -9%
Acemagic F2A
Intel Core Ultra 7 155H
0.4652 sec * -2%
Geekom AX8 Pro
AMD Ryzen 9 8945H
0.4576 sec * -0%
Geekom GT1 Mega
Intel Core Ultra 9 185H
0.4571 sec *
Geekom GT13 Pro
Intel Core i9-13900H
0.4395 sec * +4%
LibreOffice - 20 Documents To PDF
Minisforum UH125 Pro
Intel Core Ultra 5 125H
70.9 s * -36%
Asus NUC 14 Pro
Intel Core Ultra 5 125H
55.7 s * -7%
Geekom GT1 Mega
Intel Core Ultra 9 185H
52.1 s *
Geekom AX8 Pro
AMD Ryzen 9 8945H
49.8 s * +4%
Acemagic F2A
Intel Core Ultra 7 155H
44.5 s * +15%
Geekom GT13 Pro
Intel Core i9-13900H
39.4 s * +24%
WebXPRT 3 - Overall
Geekom AX8 Pro
AMD Ryzen 9 8945H
309 Points +8%
Geekom GT13 Pro
Intel Core i9-13900H
304 Points +6%
Geekom GT1 Mega
Intel Core Ultra 9 185H
286 Points
Acemagic F2A
Intel Core Ultra 7 155H
276 Points -3%
Minisforum UH125 Pro
Intel Core Ultra 5 125H
254 Points -11%
Asus NUC 14 Pro
Intel Core Ultra 5 125H
254 Points -11%
Mozilla Kraken 1.1 - Total
Minisforum UH125 Pro
Intel Core Ultra 5 125H
595 ms * -15%
Asus NUC 14 Pro
Intel Core Ultra 5 125H
567 ms * -9%
Acemagic F2A
Intel Core Ultra 7 155H
535 ms * -3%
Geekom GT1 Mega
Intel Core Ultra 9 185H
518 ms *
Geekom GT13 Pro
Intel Core i9-13900H
517 ms * -0%
Geekom AX8 Pro
AMD Ryzen 9 8945H
506 ms * +2%
3DMark
1920x1080 Fire Strike Physics
Geekom AX8 Pro
AMD Ryzen 9 8945H
27363 Points +12%
Acemagic F2A
Intel Core Ultra 7 155H
25043 Points +3%
Geekom GT1 Mega
Intel Core Ultra 9 185H
24366 Points
Geekom GT13 Pro
Intel Core i9-13900H
23626 Points -3%
Asus NUC 14 Pro
Intel Core Ultra 5 125H
22863 Points -6%
Minisforum UH125 Pro
Intel Core Ultra 5 125H
21391 Points -12%
2560x1440 Time Spy CPU
Geekom AX8 Pro
AMD Ryzen 9 8945H
10844 Points +12%
Acemagic F2A
Intel Core Ultra 7 155H
10014 Points +3%
Geekom GT1 Mega
Intel Core Ultra 9 185H
9687 Points
Geekom GT13 Pro
Intel Core i9-13900H
9347 Points -4%
Minisforum UH125 Pro
Intel Core Ultra 5 125H
9182 Points -5%
Asus NUC 14 Pro
Intel Core Ultra 5 125H
8719 Points -10%
Super Pi mod 1.5 XS 1M - 1M
Minisforum UH125 Pro
Intel Core Ultra 5 125H
7.744 s * -15%
Geekom GT13 Pro
Intel Core i9-13900H
7.445 s * -10%
Asus NUC 14 Pro
Intel Core Ultra 5 125H
7.444 s * -10%
Acemagic F2A
Intel Core Ultra 7 155H
7.168 s * -6%
Geekom AX8 Pro
AMD Ryzen 9 8945H
6.962 s * -3%
Geekom GT1 Mega
Intel Core Ultra 9 185H
6.762 s *
Super Pi mod 1.5 XS 2M - 2M
Geekom AX8 Pro
AMD Ryzen 9 8945H
17.404 s * -17%
Minisforum UH125 Pro
Intel Core Ultra 5 125H
16.967 s * -14%
Asus NUC 14 Pro
Intel Core Ultra 5 125H
16.446 s * -10%
Geekom GT13 Pro
Intel Core i9-13900H
16.234 s * -9%
Acemagic F2A
Intel Core Ultra 7 155H
16.125 s * -8%
Geekom GT1 Mega
Intel Core Ultra 9 185H
14.928 s *
Super Pi Mod 1.5 XS 32M - 32M
Geekom AX8 Pro
AMD Ryzen 9 8945H
644.49 s * -76%
Minisforum UH125 Pro
Intel Core Ultra 5 125H
423.565 s * -15%
Geekom GT13 Pro
Intel Core i9-13900H
417.103 s * -14%
Acemagic F2A
Intel Core Ultra 7 155H
394.754 s * -8%
Asus NUC 14 Pro
Intel Core Ultra 5 125H
394.697 s * -8%
Geekom GT1 Mega
Intel Core Ultra 9 185H
366.851 s *
Affinity Photo 2 - Combined (Multi CPU)
Geekom GT1 Mega
Intel Core Ultra 9 185H
792 Points
Acemagic F2A
Intel Core Ultra 7 155H
770 Points -3%
Minisforum UH125 Pro
Intel Core Ultra 5 125H
615 Points -22%
Geekom AX8 Pro
AMD Ryzen 9 8945H
603 Points -24%
Asus NUC 14 Pro
Intel Core Ultra 5 125H
594 Points -25%
Geekom GT13 Pro
Intel Core i9-13900H
547 Points -31%

* ... kleinere Werte sind besser

Cinebench R10 Rendering Single 32Bit
9719
Cinebench R10 Shading 64Bit
21485 Points
Cinebench R10 Rendering Multiple CPUs 64Bit
91553 Points
Cinebench R10 Rendering Single CPUs 64Bit
13997 Points
Cinebench R10 Shading 32Bit
19892
Cinebench R10 Rendering Multiple CPUs 32Bit
61959
Cinebench R11.5 CPU Single 32Bit
2.74 Points
Cinebench R11.5 CPU Multi 32Bit
30.5 Points
Cinebench R11.5 OpenGL 32Bit
111.51 fps
Cinebench R11.5 CPU Single 64Bit
3.13 Points
Cinebench R11.5 CPU Multi 64Bit
34.34 Points
Cinebench R11.5 OpenGL 64Bit
111.5 fps
Cinebench R15 CPU Single 64Bit
262 Points
Cinebench R15 CPU Multi 64Bit
2794 Points
Cinebench R15 Ref. Match 64Bit
97.8 %
Cinebench R15 OpenGL 64Bit
163.41 fps
Cinebench R20 CPU (Single Core)
696 Points
Cinebench R20 CPU (Multi Core)
7192 Points
Cinebench R23 Multi Core
18608 Points
Cinebench R23 Single Core
1774 Points
Cinebench 2024 CPU Single Core
107 Points
Cinebench 2024 CPU Multi Core
924 Points
Hilfe
Performance Rating
Geekom AX8 Pro
AMD Ryzen 9 8945H, Radeon 780M
96.7 pt
Acemagic F2A
Intel Core Ultra 7 155H, Arc 8-Core
80.2 pt
Geekom GT1 Mega
Intel Core Ultra 9 185H, Arc 8-Core
77.3 pt
Minisforum UH125 Pro
Intel Core Ultra 5 125H, Arc 7-Core
65.3 pt
Asus NUC 14 Pro
Intel Core Ultra 5 125H, Arc 7-Core
64.5 pt
Durchschnitt der Klasse Mini PC
 
59.2 pt
Geekom GT13 Pro
Intel Core i9-13900H, Iris Xe G7 96EUs
58.5 pt
AIDA64 / FP32 Ray-Trace
Geekom AX8 Pro
AMD Ryzen 9 8945H, Radeon 780M
24531 KRay/s +62%
Acemagic F2A
Intel Core Ultra 7 155H, Arc 8-Core
17544 KRay/s +16%
Geekom GT1 Mega
Intel Core Ultra 9 185H, Arc 8-Core
15184 KRay/s
Minisforum UH125 Pro
Intel Core Ultra 5 125H, Arc 7-Core
13639 KRay/s -10%
Asus NUC 14 Pro
Intel Core Ultra 5 125H, Arc 7-Core
13347 KRay/s -12%
Durchschnitt der Klasse Mini PC
  (646 - 51004, n=119, der letzten 2 Jahre)
12878 KRay/s -15%
Geekom GT13 Pro
Intel Core i9-13900H, Iris Xe G7 96EUs
11735 KRay/s -23%
AIDA64 / FPU Julia
Geekom AX8 Pro
AMD Ryzen 9 8945H, Radeon 780M
106518 Points +36%
Acemagic F2A
Intel Core Ultra 7 155H, Arc 8-Core
88829 Points +13%
Geekom GT1 Mega
Intel Core Ultra 9 185H, Arc 8-Core
78346 Points
Minisforum UH125 Pro
Intel Core Ultra 5 125H, Arc 7-Core
70880 Points -10%
Asus NUC 14 Pro
Intel Core Ultra 5 125H, Arc 7-Core
68551 Points -13%
Durchschnitt der Klasse Mini PC
  (3857 - 214250, n=119, der letzten 2 Jahre)
64921 Points -17%
Geekom GT13 Pro
Intel Core i9-13900H, Iris Xe G7 96EUs
59094 Points -25%
AIDA64 / CPU SHA3
Geekom AX8 Pro
AMD Ryzen 9 8945H, Radeon 780M
4684 MB/s +25%
Acemagic F2A
Intel Core Ultra 7 155H, Arc 8-Core
4246 MB/s +13%
Geekom GT1 Mega
Intel Core Ultra 9 185H, Arc 8-Core
3753 MB/s
Minisforum UH125 Pro
Intel Core Ultra 5 125H, Arc 7-Core
3404 MB/s -9%
Asus NUC 14 Pro
Intel Core Ultra 5 125H, Arc 7-Core
3323 MB/s -11%
Durchschnitt der Klasse Mini PC
  (260 - 9399, n=119, der letzten 2 Jahre)
2856 MB/s -24%
Geekom GT13 Pro
Intel Core i9-13900H, Iris Xe G7 96EUs
2718 MB/s -28%
AIDA64 / CPU Queen
Geekom AX8 Pro
AMD Ryzen 9 8945H, Radeon 780M
114586 Points +32%
Geekom GT13 Pro
Intel Core i9-13900H, Iris Xe G7 96EUs
93952 Points +8%
Acemagic F2A
Intel Core Ultra 7 155H, Arc 8-Core
89748 Points +3%
Geekom GT1 Mega
Intel Core Ultra 9 185H, Arc 8-Core
86969 Points
Durchschnitt der Klasse Mini PC
  (8172 - 184747, n=119, der letzten 2 Jahre)
80187 Points -8%
Asus NUC 14 Pro
Intel Core Ultra 5 125H, Arc 7-Core
79866 Points -8%
Minisforum UH125 Pro
Intel Core Ultra 5 125H, Arc 7-Core
78098 Points -10%
AIDA64 / FPU SinJulia
Geekom AX8 Pro
AMD Ryzen 9 8945H, Radeon 780M
14631 Points +42%
Geekom GT1 Mega
Intel Core Ultra 9 185H, Arc 8-Core
10289 Points
Acemagic F2A
Intel Core Ultra 7 155H, Arc 8-Core
10247 Points 0%
Durchschnitt der Klasse Mini PC
  (408 - 29064, n=119, der letzten 2 Jahre)
8812 Points -14%
Geekom GT13 Pro
Intel Core i9-13900H, Iris Xe G7 96EUs
8026 Points -22%
Asus NUC 14 Pro
Intel Core Ultra 5 125H, Arc 7-Core
7851 Points -24%
Minisforum UH125 Pro
Intel Core Ultra 5 125H, Arc 7-Core
7842 Points -24%
AIDA64 / FPU Mandel
Geekom AX8 Pro
AMD Ryzen 9 8945H, Radeon 780M
56505 Points +45%
Acemagic F2A
Intel Core Ultra 7 155H, Arc 8-Core
45718 Points +17%
Geekom GT1 Mega
Intel Core Ultra 9 185H, Arc 8-Core
38945 Points
Minisforum UH125 Pro
Intel Core Ultra 5 125H, Arc 7-Core
35321 Points -9%
Asus NUC 14 Pro
Intel Core Ultra 5 125H, Arc 7-Core
34225 Points -12%
Durchschnitt der Klasse Mini PC
  (1987 - 113499, n=119, der letzten 2 Jahre)
33863 Points -13%
Geekom GT13 Pro
Intel Core i9-13900H, Iris Xe G7 96EUs
29138 Points -25%
AIDA64 / CPU AES
Geekom AX8 Pro
AMD Ryzen 9 8945H, Radeon 780M
163032 MB/s +18%
Acemagic F2A
Intel Core Ultra 7 155H, Arc 8-Core
144741 MB/s +5%
Geekom GT1 Mega
Intel Core Ultra 9 185H, Arc 8-Core
138481 MB/s
Geekom GT13 Pro
Intel Core i9-13900H, Iris Xe G7 96EUs
102677 MB/s -26%
Durchschnitt der Klasse Mini PC
  (3691 - 325960, n=119, der letzten 2 Jahre)
88382 MB/s -36%
Minisforum UH125 Pro
Intel Core Ultra 5 125H, Arc 7-Core
65304 MB/s -53%
Asus NUC 14 Pro
Intel Core Ultra 5 125H, Arc 7-Core
64107 MB/s -54%
AIDA64 / CPU ZLib
Acemagic F2A
Intel Core Ultra 7 155H, Arc 8-Core
1183 MB/s 0%
Geekom GT1 Mega
Intel Core Ultra 9 185H, Arc 8-Core
1181 MB/s
Minisforum UH125 Pro
Intel Core Ultra 5 125H, Arc 7-Core
994 MB/s -16%
Geekom AX8 Pro
AMD Ryzen 9 8945H, Radeon 780M
976 MB/s -17%
Asus NUC 14 Pro
Intel Core Ultra 5 125H, Arc 7-Core
969 MB/s -18%
Geekom GT13 Pro
Intel Core i9-13900H, Iris Xe G7 96EUs
789 MB/s -33%
Durchschnitt der Klasse Mini PC
  (74.9 - 2039, n=119, der letzten 2 Jahre)
740 MB/s -37%
AIDA64 / FP64 Ray-Trace
Geekom AX8 Pro
AMD Ryzen 9 8945H, Radeon 780M
13609 KRay/s +72%
Acemagic F2A
Intel Core Ultra 7 155H, Arc 8-Core
9284 KRay/s +17%
Geekom GT1 Mega
Intel Core Ultra 9 185H, Arc 8-Core
7925 KRay/s
Minisforum UH125 Pro
Intel Core Ultra 5 125H, Arc 7-Core
7221 KRay/s -9%
Durchschnitt der Klasse Mini PC
  (350 - 26952, n=119, der letzten 2 Jahre)
6881 KRay/s -13%
Asus NUC 14 Pro
Intel Core Ultra 5 125H, Arc 7-Core
6786 KRay/s -14%
Geekom GT13 Pro
Intel Core i9-13900H, Iris Xe G7 96EUs
6205 KRay/s -22%
AIDA64 / CPU PhotoWorxx
Asus NUC 14 Pro
Intel Core Ultra 5 125H, Arc 7-Core
47377 MPixel/s +1%
Geekom GT1 Mega
Intel Core Ultra 9 185H, Arc 8-Core
47032 MPixel/s
Minisforum UH125 Pro
Intel Core Ultra 5 125H, Arc 7-Core
45789 MPixel/s -3%
Geekom AX8 Pro
AMD Ryzen 9 8945H, Radeon 780M
40114 MPixel/s -15%
Acemagic F2A
Intel Core Ultra 7 155H, Arc 8-Core
33092 MPixel/s -30%
Durchschnitt der Klasse Mini PC
  (4408 - 50500, n=119, der letzten 2 Jahre)
28301 MPixel/s -40%
Geekom GT13 Pro
Intel Core i9-13900H, Iris Xe G7 96EUs
28269 MPixel/s -40%

Cinebench R15 Multi Dauertest

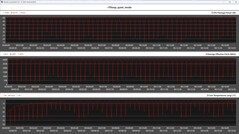
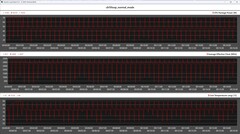
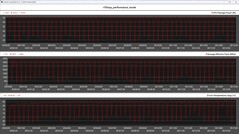
Beim Blick auf die Cinebench-R15-Dauerschleife ist zu erkennen, dass schon kurz nach Beginn die Einzelergebnisse etwas schlechter ausfallen. Im Leistungsvergleich reicht es trotzdem für einen stabilen zweiten Platz. Nur der Acemagic F2A erbringt eine durchweg höhere Leistung. Der Geekom AX8 Pro kann die hohe CPU-Leistung nicht aufrecht halten, weshalb dieser bei anhaltender Last spürbar mehr Leistung verliert und in das Mittelfeld abrutscht. Aus den Telemetriedaten der Cinebench-R15-Dauerschleife, welche wir einmal mit allen Leistungsmodi durchgeführt haben, ist zu erkennen, dass der Prozessor die gesetzten Leistungslimits erreicht.

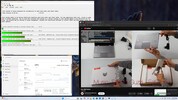
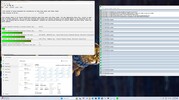
CPU-Metrik während der Cinebench-R15-Schleife (quiet mode)
CPU-Metrik während der Cinebench-R15-Schleife (normal mode)
CPU-Metrik während der Cinebench-R15-Schleife (performance mode)
01452904355807258701015116013051450159517401885203021752320246526102755Tooltip
Geekom GT1 Mega Intel Core Ultra 9 185H, Intel Core Ultra 9 185H: Ø2442 (2286.63-2795.05)
Geekom AX8 Pro AMD Ryzen 9 8945H, AMD Ryzen 9 8945H: Ø2223 (2100.4-2438.43)
Asus NUC 14 Pro Intel Core Ultra 5 125H, Intel Core Ultra 5 125H: Ø2021 (1900.15-2203.13)
Minisforum UH125 Pro Intel Core Ultra 5 125H, Intel Core Ultra 5 125H: Ø2186 (2040.4-2248.33)
Geekom GT13 Pro Intel Core i9-13900H, Intel Core i9-13900H: Ø1776 (1688.48-2326.12)
Acemagic F2A Intel Core Ultra 7 155H, Intel Core Ultra 7 155H: Ø2759 (2690.7-2800.92)

System Performance

Die Systemtests meistert der Geekom GT1 Mega hervorragend. Mit einer Ausnahme kann sich unser Testsample immer den ersten Platz sichern. Das spiegelt auch unser subjektives Leistungsempfinden während des Testzeitraums wider. Hinsichtlich der Leistung gab es keinerlei Probleme, und auch das gleichzeitige Installieren mehrerer Apps stellt den Mini-PCs nicht vor eine unlösbare Aufgabe. Aufgrund der großzügigen Arbeitsspeicherausstattung lassen sich auch viele Browsertabs gleichzeitig verwalten.

PCMark 10 / Score
Geekom AX8 Pro, AMD Ryzen 9 8945H
AMD Radeon 780M, Acer N7000
7553 Points +4%
Geekom GT1 Mega, Intel Core Ultra 9 185H
Intel Arc 8-Core iGPU, Crucial P3 Plus CT2000P3PSSD8
7232 Points
Acemagic F2A, Intel Core Ultra 7 155H
Intel Arc 8-Core iGPU, Kingston OM8SEP1024Q-A0
7120 Points -2%
Asus NUC 14 Pro, Intel Core Ultra 5 125H
Intel Arc 7-Core iGPU, Kingston KC3000 2048G SKC3000D2048G
6282 Points -13%
Minisforum UH125 Pro, Intel Core Ultra 5 125H
Intel Arc 7-Core iGPU, Kingston OM8PGP41024Q-A0
6194 Points -14%
Geekom GT13 Pro, Intel Core i9-13900H
Intel Iris Xe Graphics G7 96EUs, Acer N7000
5944 Points -18%
PCMark 10 / Essentials
Geekom AX8 Pro, AMD Ryzen 9 8945H
AMD Radeon 780M, Acer N7000
11227 Points +4%
Acemagic F2A, Intel Core Ultra 7 155H
Intel Arc 8-Core iGPU, Kingston OM8SEP1024Q-A0
11125 Points +3%
Geekom GT1 Mega, Intel Core Ultra 9 185H
Intel Arc 8-Core iGPU, Crucial P3 Plus CT2000P3PSSD8
10824 Points
Geekom GT13 Pro, Intel Core i9-13900H
Intel Iris Xe Graphics G7 96EUs, Acer N7000
10347 Points -4%
Asus NUC 14 Pro, Intel Core Ultra 5 125H
Intel Arc 7-Core iGPU, Kingston KC3000 2048G SKC3000D2048G
10050 Points -7%
Minisforum UH125 Pro, Intel Core Ultra 5 125H
Intel Arc 7-Core iGPU, Kingston OM8PGP41024Q-A0
9427 Points -13%
PCMark 10 / Productivity
Geekom AX8 Pro, AMD Ryzen 9 8945H
AMD Radeon 780M, Acer N7000
10774 Points +22%
Acemagic F2A, Intel Core Ultra 7 155H
Intel Arc 8-Core iGPU, Kingston OM8SEP1024Q-A0
8901 Points +1%
Geekom GT1 Mega, Intel Core Ultra 9 185H
Intel Arc 8-Core iGPU, Crucial P3 Plus CT2000P3PSSD8
8797 Points
Minisforum UH125 Pro, Intel Core Ultra 5 125H
Intel Arc 7-Core iGPU, Kingston OM8PGP41024Q-A0
7715 Points -12%
Geekom GT13 Pro, Intel Core i9-13900H
Intel Iris Xe Graphics G7 96EUs, Acer N7000
7319 Points -17%
Asus NUC 14 Pro, Intel Core Ultra 5 125H
Intel Arc 7-Core iGPU, Kingston KC3000 2048G SKC3000D2048G
7042 Points -20%
CrossMark / Overall
Geekom GT1 Mega, Intel Core Ultra 9 185H
Intel Arc 8-Core iGPU, Crucial P3 Plus CT2000P3PSSD8
1888 Points
Geekom AX8 Pro, AMD Ryzen 9 8945H
AMD Radeon 780M, Acer N7000
1865 Points -1%
Acemagic F2A, Intel Core Ultra 7 155H
Intel Arc 8-Core iGPU, Kingston OM8SEP1024Q-A0
1802 Points -5%
Geekom GT13 Pro, Intel Core i9-13900H
Intel Iris Xe Graphics G7 96EUs, Acer N7000
1766 Points -6%
Minisforum UH125 Pro, Intel Core Ultra 5 125H
Intel Arc 7-Core iGPU, Kingston OM8PGP41024Q-A0
1533 Points -19%
Asus NUC 14 Pro, Intel Core Ultra 5 125H
Intel Arc 7-Core iGPU, Kingston KC3000 2048G SKC3000D2048G
1522 Points -19%
CrossMark / Responsiveness
Geekom GT1 Mega, Intel Core Ultra 9 185H
Intel Arc 8-Core iGPU, Crucial P3 Plus CT2000P3PSSD8
1864 Points
Geekom GT13 Pro, Intel Core i9-13900H
Intel Iris Xe Graphics G7 96EUs, Acer N7000
1790 Points -4%
Acemagic F2A, Intel Core Ultra 7 155H
Intel Arc 8-Core iGPU, Kingston OM8SEP1024Q-A0
1700 Points -9%
Geekom AX8 Pro, AMD Ryzen 9 8945H
AMD Radeon 780M, Acer N7000
1583 Points -15%
Minisforum UH125 Pro, Intel Core Ultra 5 125H
Intel Arc 7-Core iGPU, Kingston OM8PGP41024Q-A0
1332 Points -29%
Asus NUC 14 Pro, Intel Core Ultra 5 125H
Intel Arc 7-Core iGPU, Kingston KC3000 2048G SKC3000D2048G
1171 Points -37%
CrossMark / Creativity
Geekom AX8 Pro, AMD Ryzen 9 8945H
AMD Radeon 780M, Acer N7000
2057 Points +5%
Geekom GT1 Mega, Intel Core Ultra 9 185H
Intel Arc 8-Core iGPU, Crucial P3 Plus CT2000P3PSSD8
1959 Points
Acemagic F2A, Intel Core Ultra 7 155H
Intel Arc 8-Core iGPU, Kingston OM8SEP1024Q-A0
1929 Points -2%
Geekom GT13 Pro, Intel Core i9-13900H
Intel Iris Xe Graphics G7 96EUs, Acer N7000
1789 Points -9%
Asus NUC 14 Pro, Intel Core Ultra 5 125H
Intel Arc 7-Core iGPU, Kingston KC3000 2048G SKC3000D2048G
1765 Points -10%
Minisforum UH125 Pro, Intel Core Ultra 5 125H
Intel Arc 7-Core iGPU, Kingston OM8PGP41024Q-A0
1683 Points -14%
CrossMark / Productivity
Geekom GT1 Mega, Intel Core Ultra 9 185H
Intel Arc 8-Core iGPU, Crucial P3 Plus CT2000P3PSSD8
1827 Points
Geekom AX8 Pro, AMD Ryzen 9 8945H
AMD Radeon 780M, Acer N7000
1786 Points -2%
Geekom GT13 Pro, Intel Core i9-13900H
Intel Iris Xe Graphics G7 96EUs, Acer N7000
1736 Points -5%
Acemagic F2A, Intel Core Ultra 7 155H
Intel Arc 8-Core iGPU, Kingston OM8SEP1024Q-A0
1717 Points -6%
Minisforum UH125 Pro, Intel Core Ultra 5 125H
Intel Arc 7-Core iGPU, Kingston OM8PGP41024Q-A0
1463 Points -20%
Asus NUC 14 Pro, Intel Core Ultra 5 125H
Intel Arc 7-Core iGPU, Kingston KC3000 2048G SKC3000D2048G
1432 Points -22%
AIDA64 / Memory Copy
Geekom GT1 Mega
Intel Core Ultra 9 185H, Arc 8-Core
73624 MB/s
Minisforum UH125 Pro
Intel Core Ultra 5 125H, Arc 7-Core
69592 MB/s -5%
Asus NUC 14 Pro
Intel Core Ultra 5 125H, Arc 7-Core
69264 MB/s -6%
Geekom AX8 Pro
AMD Ryzen 9 8945H, Radeon 780M
68924 MB/s -6%
Acemagic F2A
Intel Core Ultra 7 155H, Arc 8-Core
62397 MB/s -15%
Durchschnitt der Klasse Mini PC
  (6481 - 89287, n=119, der letzten 2 Jahre)
48357 MB/s -34%
Geekom GT13 Pro
Intel Core i9-13900H, Iris Xe G7 96EUs
45721 MB/s -38%
AIDA64 / Memory Read
Geekom GT1 Mega
Intel Core Ultra 9 185H, Arc 8-Core
79371 MB/s
Asus NUC 14 Pro
Intel Core Ultra 5 125H, Arc 7-Core
74415 MB/s -6%
Minisforum UH125 Pro
Intel Core Ultra 5 125H, Arc 7-Core
72711 MB/s -8%
Acemagic F2A
Intel Core Ultra 7 155H, Arc 8-Core
64323 MB/s -19%
Geekom AX8 Pro
AMD Ryzen 9 8945H, Radeon 780M
61624 MB/s -22%
Durchschnitt der Klasse Mini PC
  (6914 - 99171, n=119, der letzten 2 Jahre)
49177 MB/s -38%
Geekom GT13 Pro
Intel Core i9-13900H, Iris Xe G7 96EUs
45995 MB/s -42%
AIDA64 / Memory Write
Geekom AX8 Pro
AMD Ryzen 9 8945H, Radeon 780M
87138 MB/s +21%
Asus NUC 14 Pro
Intel Core Ultra 5 125H, Arc 7-Core
72443 MB/s 0%
Geekom GT1 Mega
Intel Core Ultra 9 185H, Arc 8-Core
72187 MB/s
Minisforum UH125 Pro
Intel Core Ultra 5 125H, Arc 7-Core
71514 MB/s -1%
Acemagic F2A
Intel Core Ultra 7 155H, Arc 8-Core
65057 MB/s -10%
Durchschnitt der Klasse Mini PC
  (6862 - 98583, n=119, der letzten 2 Jahre)
52856 MB/s -27%
Geekom GT13 Pro
Intel Core i9-13900H, Iris Xe G7 96EUs
45733 MB/s -37%
AIDA64 / Memory Latency
Minisforum UH125 Pro
Intel Core Ultra 5 125H, Arc 7-Core
184.8 ns * -35%
Acemagic F2A
Intel Core Ultra 7 155H, Arc 8-Core
149 ns * -9%
Geekom GT1 Mega
Intel Core Ultra 9 185H, Arc 8-Core
136.7 ns *
Asus NUC 14 Pro
Intel Core Ultra 5 125H, Arc 7-Core
127.3 ns * +7%
Durchschnitt der Klasse Mini PC
  (44.9 - 184.8, n=119, der letzten 2 Jahre)
92.1 ns * +33%
Geekom AX8 Pro
AMD Ryzen 9 8945H, Radeon 780M
91.4 ns * +33%
Geekom GT13 Pro
Intel Core i9-13900H, Iris Xe G7 96EUs
75.8 ns * +45%

* ... kleinere Werte sind besser

NPU-Leistung

Der Intel Core Ultra 9 185H ist mit einer NPU (Neural Processing Unit) ausgerüstet, welche es dem SoC erlaubt, KI-Anwendungen besonders effizient zu berechnen. Um den Leistungsvergleich zu verdeutlichen, nutzen wir den UL Procyon AI Interface Benchmark. Alle Vergleichsgeräte greifen auf die Intel Meteor-Lake-Prozessoren zurück, womit alle die gleiche NPU nutzen. Der Unterschied zwischen den einzelnen Kontrahenten fällt sehr gering aus. Mit einem kleinen Abstand kann sich der Geekom GT1 Mega an die Spitze setzen.

UL Procyon for Windows / Overall Score Integer NPU
Geekom GT1 Mega
Intel Core Ultra 9 185H, Arc 8-Core
529 Points
Asus NUC 14 Pro
Intel Core Ultra 5 125H, Arc 7-Core
508 Points -4%
Khadas Mind 2
Intel Core Ultra 7 155H, Arc 8-Core
504 Points -5%
Minisforum UH125 Pro
Intel Core Ultra 5 125H, Arc 7-Core
501 Points -5%
Acemagic F2A
Intel Core Ultra 7 155H, Arc 8-Core
499 Points -6%
UL Procyon for Windows / Overall Score Integer GPU
Acer Predator BiFrost Arc A770 OC, 16GB GDDR6
AMD Ryzen 9 7950X, Arc A770
1500 Points +87%
Acer Predator BiFrost Arc A750 OC
AMD Ryzen 9 7950X, Arc A750
1433 Points +79%
Geekom GT1 Mega
Intel Core Ultra 9 185H, Arc 8-Core
801 Points
Asus NUC 14 Pro
Intel Core Ultra 5 125H, Arc 7-Core
741 Points -7%
Khadas Mind 2
Intel Core Ultra 7 155H, Arc 8-Core
687 Points -14%
Acemagic F2A
Intel Core Ultra 7 155H, Arc 8-Core
684 Points -15%
Minisforum UH125 Pro
Intel Core Ultra 5 125H, Arc 7-Core
547 Points -32%

DPC-Latenzen

Beim Blick auf die Ergebnisse schneidet der Geekom GT1 Mega besser ab als die Vergleichsgeräte. Beim Surfen im Internet mit dem Edge Browser dokumentierten wir noch keine erhöhten DPC-Latenzen, was sich bei der Wiedergabe des 4K-Testvideos ändert. Extrem hoch fallen diese allerdings nicht aus, womit unser Testgerät im Vergleich noch immer die besten Ergebnisse abliefert.

Maximale Latenz beim Öffnen mehrerer Browser Tabs
Maximale Latenz beim Abspielen von 4K-Videomaterial
Maximale Latenz nach zehn Sekunden Prime95
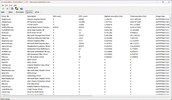
Treiber nach längster Ausführungsdauer gereiht
DPC Latencies / LatencyMon - interrupt to process latency (max), Web, Youtube, Prime95
Asus NUC 14 Pro
Arc 7-Core, Ultra 5 125H, Kingston KC3000 2048G SKC3000D2048G
2776 μs * -142%
Acemagic F2A
Arc 8-Core, Ultra 7 155H, Kingston OM8SEP1024Q-A0
2724 μs * -138%
Geekom AX8 Pro
Radeon 780M, R9 8945H, Acer N7000
1856 μs * -62%
Geekom GT13 Pro
Iris Xe G7 96EUs, i9-13900H, Acer N7000
1533.4 μs * -34%
Minisforum UH125 Pro
Arc 7-Core, Ultra 5 125H, Kingston OM8PGP41024Q-A0
1438 μs * -26%
Geekom GT1 Mega
Arc 8-Core, Ultra 9 185H, Crucial P3 Plus CT2000P3PSSD8
1145.7 μs *

* ... kleinere Werte sind besser

Massenspeicher

Crucial P3 Plus 2-TB-SSD

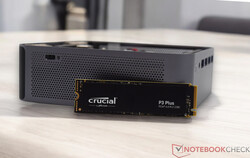
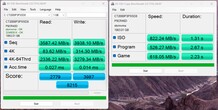
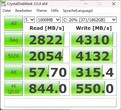
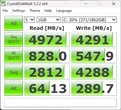
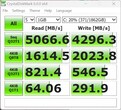
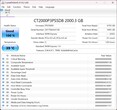
Wie schon mehrfach erwähnt, testen wir hier den Geekom GT1 Mega in der Topausstattung. Damit verfügt das Modell über eine 2-TB-SSD, die nahezu alle Möglichkeiten bietet, viele Daten zu speichern. Genauer handelt es sich um die Crucial P3 Plus, die zudem mit PCIe-4.0-x4-Geschwindigkeit arbeitet. Im Test erreicht der Massenspeicher tolle Ergebnisse, womit unser Testgerät die Kontrahenten allesamt auf die hinteren Plätze verweist. Unseren Stresstest meistert die Crucial P3 Plus ebenfalls mit Bravour, sodass keine Leistungseinbrüche zu erwarten sind. Im Geekom GT1 Mega lassen sich zwei SSD unterbringen. Neben der bereits installierten SSD kann noch eine weitere M.2-SSD eingebaut werden. Hierbei muss man jedoch auf die Baulänge von 42 Millimetern achten. Technisch unterstützt werden NVMe- SATA-SSDs.

Für weitere Vergleiche und Benchmarks verweisen wir auf unsere Vergleichstabelle.

AS SSD
AS SSD
CDM 3
CDM 3
CDM 5
CDM 5
CDM 6
CDM 6
CDI
CDI
Crucial P3 Plus CT2000P3PSSD8
Sequential Read: 2822 MB/s
Sequential Write: 4310 MB/s
512K Read: 2054 MB/s
512K Write: 4132 MB/s
4K Read: 57.7 MB/s
4K Write: 315.4 MB/s
4K QD32 Read: 844 MB/s
4K QD32 Write: 550 MB/s
Drive Performance Rating - Percent
Geekom GT1 Mega
Crucial P3 Plus CT2000P3PSSD8
88.4 pt
Geekom GT13 Pro
Acer N7000
80.8 pt
Geekom AX8 Pro
Acer N7000
67.3 pt
Asus NUC 14 Pro
Kingston KC3000 2048G SKC3000D2048G
61.8 pt
Minisforum UH125 Pro
Kingston OM8PGP41024Q-A0
51.6 pt
Durchschnitt der Klasse Mini PC
 
50.2 pt
Acemagic F2A
Kingston OM8SEP1024Q-A0
48.4 pt
DiskSpd
seq read
Geekom GT13 Pro
Acer N7000
4357 (4314.26min - 4356.72max) MB/s +59%
Geekom AX8 Pro
Acer N7000
3921 (3897.31min - 3920.75max) MB/s +43%
Asus NUC 14 Pro
Kingston KC3000 2048G SKC3000D2048G
3706 (3594.04min - 3706.37max) MB/s +36%
Geekom GT1 Mega
Crucial P3 Plus CT2000P3PSSD8
2734 (2730.27min - 2734.25max) MB/s
Minisforum UH125 Pro
Kingston OM8PGP41024Q-A0
2351 (2320.68min - 2350.61max) MB/s -14%
Durchschnitt der Klasse Mini PC
  (277 - 4357, n=119, der letzten 2 Jahre)
2333 MB/s -15%
Acemagic F2A
Kingston OM8SEP1024Q-A0
1674 (1242.56min - 1673.54max) MB/s -39%
seq write
Geekom GT13 Pro
Acer N7000
4544 (4380.79min - 4543.83max) MB/s +14%
Geekom GT1 Mega
Crucial P3 Plus CT2000P3PSSD8
3976 (425.08min - 3975.57max) MB/s
Geekom AX8 Pro
Acer N7000
3791 (3695.18min - 3790.57max) MB/s -5%
Minisforum UH125 Pro
Kingston OM8PGP41024Q-A0
3331 (3244.92min - 3330.75max) MB/s -16%
Asus NUC 14 Pro
Kingston KC3000 2048G SKC3000D2048G
2928 (1958.53min - 2927.62max) MB/s -26%
Durchschnitt der Klasse Mini PC
  (229 - 5595, n=119, der letzten 2 Jahre)
2509 MB/s -37%
Acemagic F2A
Kingston OM8SEP1024Q-A0
1348 (1117.85min - 1347.87max) MB/s -66%
seq q8 t1 read
Asus NUC 14 Pro
Kingston KC3000 2048G SKC3000D2048G
7110 (6058.21min - 7110.02max) MB/s +41%
Geekom AX8 Pro
Acer N7000
7012 (5624.01min - 7012.25max) MB/s +39%
Geekom GT13 Pro
Acer N7000
7007 (6166.72min - 7006.62max) MB/s +38%
Geekom GT1 Mega
Crucial P3 Plus CT2000P3PSSD8
5060 (4781.3min - 5060.16max) MB/s
Minisforum UH125 Pro
Kingston OM8PGP41024Q-A0
4802 (4169.19min - 4801.68max) MB/s -5%
Durchschnitt der Klasse Mini PC
  (236 - 8430, n=119, der letzten 2 Jahre)
3790 MB/s -25%
Acemagic F2A
Kingston OM8SEP1024Q-A0
3194 (2810.81min - 3194.17max) MB/s -37%
seq q8 t1 write
Geekom AX8 Pro
Acer N7000
5685 (5389.6min - 5684.54max) MB/s +43%
Geekom GT13 Pro
Acer N7000
5261 (5018.9min - 5261.3max) MB/s +32%
Asus NUC 14 Pro
Kingston KC3000 2048G SKC3000D2048G
4712 (3064.99min - 4711.88max) MB/s +18%
Geekom GT1 Mega
Crucial P3 Plus CT2000P3PSSD8
3985 (52.74min - 3985.01max) MB/s
Minisforum UH125 Pro
Kingston OM8PGP41024Q-A0
3902 (3839.68min - 3901.75max) MB/s -2%
Durchschnitt der Klasse Mini PC
  (239 - 6669, n=119, der letzten 2 Jahre)
2810 MB/s -29%
Acemagic F2A
Kingston OM8SEP1024Q-A0
2212 (1222.43min - 2212.27max) MB/s -44%
4k q1 t1 read
Geekom GT13 Pro
Acer N7000
85.3 (82.57min - 85.32max) MB/s +36%
Geekom GT1 Mega
Crucial P3 Plus CT2000P3PSSD8
62.5 (62.22min - 62.52max) MB/s
Geekom AX8 Pro
Acer N7000
62.2 (61.55min - 62.23max) MB/s 0%
Minisforum UH125 Pro
Kingston OM8PGP41024Q-A0
60 (58.44min - 60.02max) MB/s -4%
Durchschnitt der Klasse Mini PC
  (6.85 - 86.6, n=119, der letzten 2 Jahre)
55.3 MB/s -12%
Asus NUC 14 Pro
Kingston KC3000 2048G SKC3000D2048G
53.4 (49.89min - 53.35max) MB/s -15%
Acemagic F2A
Kingston OM8SEP1024Q-A0
47.3 (47.07min - 47.31max) MB/s -24%
4k q1 t1 write
Geekom GT1 Mega
Crucial P3 Plus CT2000P3PSSD8
353 (348.24min - 353.16max) MB/s
Geekom GT13 Pro
Acer N7000
327 (306.06min - 326.78max) MB/s -7%
Durchschnitt der Klasse Mini PC
  (30.4 - 435, n=119, der letzten 2 Jahre)
196.9 MB/s -44%
Acemagic F2A
Kingston OM8SEP1024Q-A0
187.2 (181.54min - 187.2max) MB/s -47%
Geekom AX8 Pro
Acer N7000
187 (185.73min - 187.04max) MB/s -47%
Minisforum UH125 Pro
Kingston OM8PGP41024Q-A0
136.8 (131.56min - 136.81max) MB/s -61%
Asus NUC 14 Pro
Kingston KC3000 2048G SKC3000D2048G
83.1 (75.3min - 83.11max) MB/s -76%
4k q32 t16 read
Geekom GT13 Pro
Acer N7000
3593 (3380.17min - 3593.41max) MB/s +25%
Geekom GT1 Mega
Crucial P3 Plus CT2000P3PSSD8
2876 (2861.34min - 2875.92max) MB/s
Acemagic F2A
Kingston OM8SEP1024Q-A0
1824 (1239.47min - 1824.09max) MB/s -37%
Geekom AX8 Pro
Acer N7000
1644 (1568.76min - 1643.51max) MB/s -43%
Durchschnitt der Klasse Mini PC
  (26.1 - 4158, n=119, der letzten 2 Jahre)
1411 MB/s -51%
Asus NUC 14 Pro
Kingston KC3000 2048G SKC3000D2048G
731 (660.89min - 731.29max) MB/s -75%
Minisforum UH125 Pro
Kingston OM8PGP41024Q-A0
698 (691.89min - 697.84max) MB/s -76%
4k q32 t16 write
Geekom GT1 Mega
Crucial P3 Plus CT2000P3PSSD8
2822 (709.76min - 2821.52max) MB/s
Acemagic F2A
Kingston OM8SEP1024Q-A0
1434 (1410.26min - 1433.71max) MB/s -49%
Durchschnitt der Klasse Mini PC
  (32.6 - 4288, n=119, der letzten 2 Jahre)
1332 MB/s -53%
Geekom GT13 Pro
Acer N7000
762 (700.88min - 761.76max) MB/s -73%
Geekom AX8 Pro
Acer N7000
647 (598.22min - 647.4max) MB/s -77%
Minisforum UH125 Pro
Kingston OM8PGP41024Q-A0
311 (252.72min - 310.91max) MB/s -89%
Asus NUC 14 Pro
Kingston KC3000 2048G SKC3000D2048G
186.7 (155.05min - 186.74max) MB/s -93%
AS SSD
Score Total
Geekom GT1 Mega
Crucial P3 Plus CT2000P3PSSD8
8215 Points
Geekom GT13 Pro
Acer N7000
6798 Points -17%
Geekom AX8 Pro
Acer N7000
5512 Points -33%
Asus NUC 14 Pro
Kingston KC3000 2048G SKC3000D2048G
5131 Points -38%
Acemagic F2A
Kingston OM8SEP1024Q-A0
4412 Points -46%
Durchschnitt der Klasse Mini PC
  (211 - 10021, n=117, der letzten 2 Jahre)
4244 Points -48%
Minisforum UH125 Pro
Kingston OM8PGP41024Q-A0
3878 Points -53%
Score Read
Geekom GT13 Pro
Acer N7000
2866 Points +3%
Geekom GT1 Mega
Crucial P3 Plus CT2000P3PSSD8
2779 Points
Geekom AX8 Pro
Acer N7000
1793 Points -35%
Durchschnitt der Klasse Mini PC
  (76 - 3741, n=117, der letzten 2 Jahre)
1578 Points -43%
Acemagic F2A
Kingston OM8SEP1024Q-A0
1561 Points -44%
Asus NUC 14 Pro
Kingston KC3000 2048G SKC3000D2048G
1275 Points -54%
Minisforum UH125 Pro
Kingston OM8PGP41024Q-A0
1096 Points -61%
Score Write
Geekom GT1 Mega
Crucial P3 Plus CT2000P3PSSD8
3987 Points
Asus NUC 14 Pro
Kingston KC3000 2048G SKC3000D2048G
3313 Points -17%
Geekom AX8 Pro
Acer N7000
2896 Points -27%
Geekom GT13 Pro
Acer N7000
2516 Points -37%
Minisforum UH125 Pro
Kingston OM8PGP41024Q-A0
2306 Points -42%
Acemagic F2A
Kingston OM8SEP1024Q-A0
2082 Points -48%
Durchschnitt der Klasse Mini PC
  (88 - 4371, n=117, der letzten 2 Jahre)
1902 Points -52%
Seq Read
Asus NUC 14 Pro
Kingston KC3000 2048G SKC3000D2048G
5158 MB/s +44%
Geekom AX8 Pro
Acer N7000
4902 MB/s +37%
Geekom GT13 Pro
Acer N7000
4546 MB/s +27%
Minisforum UH125 Pro
Kingston OM8PGP41024Q-A0
3808 MB/s +6%
Geekom GT1 Mega
Crucial P3 Plus CT2000P3PSSD8
3587 MB/s
Durchschnitt der Klasse Mini PC
  (291 - 6620, n=117, der letzten 2 Jahre)
3231 MB/s -10%
Acemagic F2A
Kingston OM8SEP1024Q-A0
3010 MB/s -16%
Seq Write
Geekom GT1 Mega
Crucial P3 Plus CT2000P3PSSD8
3938 MB/s
Geekom GT13 Pro
Acer N7000
3374 MB/s -14%
Geekom AX8 Pro
Acer N7000
2835 MB/s -28%
Asus NUC 14 Pro
Kingston KC3000 2048G SKC3000D2048G
2646 MB/s -33%
Acemagic F2A
Kingston OM8SEP1024Q-A0
2369 MB/s -40%
Durchschnitt der Klasse Mini PC
  (242 - 5783, n=117, der letzten 2 Jahre)
2292 MB/s -42%
Minisforum UH125 Pro
Kingston OM8PGP41024Q-A0
1787 MB/s -55%
4K Read
Geekom GT1 Mega
Crucial P3 Plus CT2000P3PSSD8
83.6 MB/s
Geekom GT13 Pro
Acer N7000
83.4 MB/s 0%
Asus NUC 14 Pro
Kingston KC3000 2048G SKC3000D2048G
63.6 MB/s -24%
Durchschnitt der Klasse Mini PC
  (21.4 - 104.3, n=117, der letzten 2 Jahre)
59.7 MB/s -29%
Geekom AX8 Pro
Acer N7000
59.1 MB/s -29%
Minisforum UH125 Pro
Kingston OM8PGP41024Q-A0
57.3 MB/s -31%
Acemagic F2A
Kingston OM8SEP1024Q-A0
41.8 MB/s -50%
4K Write
Geekom GT1 Mega
Crucial P3 Plus CT2000P3PSSD8
314 MB/s
Geekom GT13 Pro
Acer N7000
296 MB/s -6%
Acemagic F2A
Kingston OM8SEP1024Q-A0
196.9 MB/s -37%
Minisforum UH125 Pro
Kingston OM8PGP41024Q-A0
182.1 MB/s -42%
Geekom AX8 Pro
Acer N7000
181.4 MB/s -42%
Durchschnitt der Klasse Mini PC
  (30.9 - 366, n=117, der letzten 2 Jahre)
177.5 MB/s -43%
Asus NUC 14 Pro
Kingston KC3000 2048G SKC3000D2048G
169.5 MB/s -46%
4K-64 Read
Geekom GT1 Mega
Crucial P3 Plus CT2000P3PSSD8
2336 MB/s
Geekom GT13 Pro
Acer N7000
2328 MB/s 0%
Geekom AX8 Pro
Acer N7000
1244 MB/s -47%
Acemagic F2A
Kingston OM8SEP1024Q-A0
1218 MB/s -48%
Durchschnitt der Klasse Mini PC
  (23.4 - 3220, n=117, der letzten 2 Jahre)
1195 MB/s -49%
Asus NUC 14 Pro
Kingston KC3000 2048G SKC3000D2048G
695 MB/s -70%
Minisforum UH125 Pro
Kingston OM8PGP41024Q-A0
658 MB/s -72%
4K-64 Write
Geekom GT1 Mega
Crucial P3 Plus CT2000P3PSSD8
3279 MB/s
Asus NUC 14 Pro
Kingston KC3000 2048G SKC3000D2048G
2878 MB/s -12%
Geekom AX8 Pro
Acer N7000
2431 MB/s -26%
Minisforum UH125 Pro
Kingston OM8PGP41024Q-A0
1945 MB/s -41%
Geekom GT13 Pro
Acer N7000
1883 MB/s -43%
Acemagic F2A
Kingston OM8SEP1024Q-A0
1649 MB/s -50%
Durchschnitt der Klasse Mini PC
  (32.8 - 3731, n=117, der letzten 2 Jahre)
1495 MB/s -54%
Access Time Read
Geekom GT13 Pro
Acer N7000
0.127 ms * -370%
Minisforum UH125 Pro
Kingston OM8PGP41024Q-A0
0.101 ms * -274%
Durchschnitt der Klasse Mini PC
  (0.022 - 0.489, n=117, der letzten 2 Jahre)
0.09579 ms * -255%
Geekom AX8 Pro
Acer N7000
0.079 ms * -193%
Asus NUC 14 Pro
Kingston KC3000 2048G SKC3000D2048G
0.053 ms * -96%
Acemagic F2A
Kingston OM8SEP1024Q-A0
0.046 ms * -70%
Geekom GT1 Mega
Crucial P3 Plus CT2000P3PSSD8
0.027 ms *
Access Time Write
Acemagic F2A
Kingston OM8SEP1024Q-A0
0.126 ms * -800%
Durchschnitt der Klasse Mini PC
  (0.014 - 0.765, n=117, der letzten 2 Jahre)
0.1133 ms * -709%
Geekom AX8 Pro
Acer N7000
0.064 ms * -357%
Geekom GT13 Pro
Acer N7000
0.059 ms * -321%
Asus NUC 14 Pro
Kingston KC3000 2048G SKC3000D2048G
0.043 ms * -207%
Minisforum UH125 Pro
Kingston OM8PGP41024Q-A0
0.024 ms * -71%
Geekom GT1 Mega
Crucial P3 Plus CT2000P3PSSD8
0.014 ms *

* ... kleinere Werte sind besser

Dauerleistung Lesen: DiskSpd Read Loop, Queue Depth 8

036072010801440180021602520288032403600396043204680504054005760612064806840Tooltip
Geekom GT1 Mega Crucial P3 Plus CT2000P3PSSD8 ; diskspd 2.0.17 f: Ø5055 (4738.1-5067.7)
Geekom AX8 Pro Acer N7000; diskspd 2.0.17 f: Ø6996 (5972.7-7027.76)
Asus NUC 14 Pro Kingston KC3000 2048G SKC3000D2048G; diskspd 2.0.17 f: Ø6306 (1073.74-7111.48)
Minisforum UH125 Pro Kingston OM8PGP41024Q-A0; diskspd 2.0.17 f: Ø4790 (4223.81-4803.95)
Geekom GT13 Pro Acer N7000; diskspd 2.0.17 f: Ø5377 (3710.83-7006.62)
Acemagic F2A Kingston OM8SEP1024Q-A0; diskspd 2.0.17 f: Ø1320 (771.89-3141.95)

Grafikkarte

Die 3D-Leistung des Geekom GT1 Mega übernimmt die Intel Arc 8-Core iGPU des Intel Core Ultra 9 185H. Das Ergebnis fällt überaus positiv aus, denn im Vergleich kann sich der GT1 Mega auch in dieser Disziplin fast immer den ersten Platz ergattern. Die sonst sehr leistungsstarke AMD Radeon 780M kann teilweise deutlich abgehängt werden. Nur bei den Rendertests (SPECviewperf 2020) ist die iGPU aus dem Hause Intel nicht konkurrenzfähig und muss einen deutlichen Rückstand gegenüber dem Geekom AX8 Pro in Kauf nehmen.

Weitere Vergleiche und Benchmarks entnehmen Sie bitte unserer GPU-Vergleichstabelle.

3DMark Performance Rating - Percent
Geekom GT1 Mega
Intel Arc 8-Core iGPU, Intel Core Ultra 9 185H
100 pt
Geekom AX8 Pro
AMD Radeon 780M, AMD Ryzen 9 8945H
90.6 pt
Asus NUC 14 Pro
Intel Arc 7-Core iGPU, Intel Core Ultra 5 125H
89.3 pt
Acemagic F2A
Intel Arc 8-Core iGPU, Intel Core Ultra 7 155H
89.3 pt
Minisforum UH125 Pro
Intel Arc 7-Core iGPU, Intel Core Ultra 5 125H
78.5 pt
Geekom GT13 Pro
Intel Iris Xe Graphics G7 96EUs, Intel Core i9-13900H
56.4 pt
3DMark 11 - 1280x720 Performance GPU
Geekom GT1 Mega
Intel Arc 8-Core iGPU, Intel Core Ultra 9 185H
13309 Points
Geekom AX8 Pro
AMD Radeon 780M, AMD Ryzen 9 8945H
13281 Points 0%
Acemagic F2A
Intel Arc 8-Core iGPU, Intel Core Ultra 7 155H
12085 Points -9%
Asus NUC 14 Pro
Intel Arc 7-Core iGPU, Intel Core Ultra 5 125H
11785 Points -11%
Minisforum UH125 Pro
Intel Arc 7-Core iGPU, Intel Core Ultra 5 125H
10303 Points -23%
Geekom GT13 Pro
Intel Iris Xe Graphics G7 96EUs, Intel Core i9-13900H
7424 Points -44%
3DMark
2560x1440 Time Spy Graphics
Geekom GT1 Mega
Intel Arc 8-Core iGPU, Intel Core Ultra 9 185H
3610 Points
Acemagic F2A
Intel Arc 8-Core iGPU, Intel Core Ultra 7 155H
3205 Points -11%
Asus NUC 14 Pro
Intel Arc 7-Core iGPU, Intel Core Ultra 5 125H
3205 Points -11%
Geekom AX8 Pro
AMD Radeon 780M, AMD Ryzen 9 8945H
2852 Points -21%
Minisforum UH125 Pro
Intel Arc 7-Core iGPU, Intel Core Ultra 5 125H
2796 Points -23%
Geekom GT13 Pro
Intel Iris Xe Graphics G7 96EUs, Intel Core i9-13900H
1690 Points -53%
1920x1080 Fire Strike Graphics
Geekom GT1 Mega
Intel Arc 8-Core iGPU, Intel Core Ultra 9 185H
8726 Points
Geekom AX8 Pro
AMD Radeon 780M, AMD Ryzen 9 8945H
8117 Points -7%
Asus NUC 14 Pro
Intel Arc 7-Core iGPU, Intel Core Ultra 5 125H
7900 Points -9%
Acemagic F2A
Intel Arc 8-Core iGPU, Intel Core Ultra 7 155H
7710 Points -12%
Minisforum UH125 Pro
Intel Arc 7-Core iGPU, Intel Core Ultra 5 125H
7047 Points -19%
Geekom GT13 Pro
Intel Iris Xe Graphics G7 96EUs, Intel Core i9-13900H
5812 Points -33%
Unigine Heaven 4.0
Extreme Preset OpenGL
Geekom GT1 Mega
Intel Arc 8-Core iGPU, Intel Core Ultra 9 185H
36.4 fps
Asus NUC 14 Pro
Intel Arc 7-Core iGPU, Intel Core Ultra 5 125H
33.3 fps -9%
Acemagic F2A
Intel Arc 8-Core iGPU, Intel Core Ultra 7 155H
31.6 fps -13%
Geekom AX8 Pro
AMD Radeon 780M, AMD Ryzen 9 8945H
30 fps -18%
Minisforum UH125 Pro
Intel Arc 7-Core iGPU, Intel Core Ultra 5 125H
29.6 fps -19%
Geekom GT13 Pro
Intel Iris Xe Graphics G7 96EUs, Intel Core i9-13900H
25.1 fps -31%
Extreme Preset DX11
Geekom GT1 Mega
Intel Arc 8-Core iGPU, Intel Core Ultra 9 185H
37.5 fps
Geekom AX8 Pro
AMD Radeon 780M, AMD Ryzen 9 8945H
36.4 fps -3%
Asus NUC 14 Pro
Intel Arc 7-Core iGPU, Intel Core Ultra 5 125H
34.5 fps -8%
Acemagic F2A
Intel Arc 8-Core iGPU, Intel Core Ultra 7 155H
32.7 fps -13%
Minisforum UH125 Pro
Intel Arc 7-Core iGPU, Intel Core Ultra 5 125H
31.5 fps -16%
Geekom GT13 Pro
Intel Iris Xe Graphics G7 96EUs, Intel Core i9-13900H
26 fps -31%
Unigine Valley 1.0
1920x1080 Extreme HD DirectX AA:x8
Geekom AX8 Pro
AMD Radeon 780M, AMD Ryzen 9 8945H
23.1 fps +15%
Geekom GT1 Mega
Intel Arc 8-Core iGPU, Intel Core Ultra 9 185H
20.1 fps
Asus NUC 14 Pro
Intel Arc 7-Core iGPU, Intel Core Ultra 5 125H
18.8 fps -6%
Acemagic F2A
Intel Arc 8-Core iGPU, Intel Core Ultra 7 155H
17.1 fps -15%
Minisforum UH125 Pro
Intel Arc 7-Core iGPU, Intel Core Ultra 5 125H
16.9 fps -16%
Geekom GT13 Pro
Intel Iris Xe Graphics G7 96EUs, Intel Core i9-13900H
15.1 fps -25%
1920x1080 Extreme HD Preset OpenGL AA:x8
Geekom GT1 Mega
Intel Arc 8-Core iGPU, Intel Core Ultra 9 185H
21.9 fps
Geekom AX8 Pro
AMD Radeon 780M, AMD Ryzen 9 8945H
20.6 fps -6%
Asus NUC 14 Pro
Intel Arc 7-Core iGPU, Intel Core Ultra 5 125H
20.2 fps -8%
Acemagic F2A
Intel Arc 8-Core iGPU, Intel Core Ultra 7 155H
18.3 fps -16%
Minisforum UH125 Pro
Intel Arc 7-Core iGPU, Intel Core Ultra 5 125H
18.3 fps -16%
Geekom GT13 Pro
Intel Iris Xe Graphics G7 96EUs, Intel Core i9-13900H
15.7 fps -28%
Unigine Superposition
1280x720 720p Low
Geekom GT1 Mega
Intel Arc 8-Core iGPU, Intel Core Ultra 9 185H
12451 Points
Geekom AX8 Pro
AMD Radeon 780M, AMD Ryzen 9 8945H
12232 Points -2%
Asus NUC 14 Pro
Intel Arc 7-Core iGPU, Intel Core Ultra 5 125H
10872 Points -13%
Acemagic F2A
Intel Arc 8-Core iGPU, Intel Core Ultra 7 155H
10491 Points -16%
Minisforum UH125 Pro
Intel Arc 7-Core iGPU, Intel Core Ultra 5 125H
10026 Points -19%
Geekom GT13 Pro
Intel Iris Xe Graphics G7 96EUs, Intel Core i9-13900H
6619 Points -47%
1920x1080 1080p High
Geekom GT1 Mega
Intel Arc 8-Core iGPU, Intel Core Ultra 9 185H
3948 Points
Asus NUC 14 Pro
Intel Arc 7-Core iGPU, Intel Core Ultra 5 125H
3609 Points -9%
Geekom AX8 Pro
AMD Radeon 780M, AMD Ryzen 9 8945H
3559 Points -10%
Acemagic F2A
Intel Arc 8-Core iGPU, Intel Core Ultra 7 155H
3391 Points -14%
Minisforum UH125 Pro
Intel Arc 7-Core iGPU, Intel Core Ultra 5 125H
3066 Points -22%
Geekom GT13 Pro
Intel Iris Xe Graphics G7 96EUs, Intel Core i9-13900H
2306 Points -42%
1920x1080 1080p Extreme
Geekom GT1 Mega
Intel Arc 8-Core iGPU, Intel Core Ultra 9 185H
2119 Points
Asus NUC 14 Pro
Intel Arc 7-Core iGPU, Intel Core Ultra 5 125H
1981 Points -7%
Acemagic F2A
Intel Arc 8-Core iGPU, Intel Core Ultra 7 155H
1920 Points -9%
Minisforum UH125 Pro
Intel Arc 7-Core iGPU, Intel Core Ultra 5 125H
1686 Points -20%
Geekom AX8 Pro
AMD Radeon 780M, AMD Ryzen 9 8945H
1649 Points -22%
Geekom GT13 Pro
Intel Iris Xe Graphics G7 96EUs, Intel Core i9-13900H
1124 Points -47%
ComputeMark v2.1
1024x600 Normal, Score
Geekom AX8 Pro
AMD Radeon 780M, AMD Ryzen 9 8945H
8595 Points +8%
Geekom GT1 Mega
Intel Arc 8-Core iGPU, Intel Core Ultra 9 185H
7963 Points
Acemagic F2A
Intel Arc 8-Core iGPU, Intel Core Ultra 7 155H
7480 Points -6%
Asus NUC 14 Pro
Intel Arc 7-Core iGPU, Intel Core Ultra 5 125H
6698 Points -16%
Minisforum UH125 Pro
Intel Arc 7-Core iGPU, Intel Core Ultra 5 125H
5613 Points -30%
Geekom GT13 Pro
Intel Iris Xe Graphics G7 96EUs, Intel Core i9-13900H
3650 Points -54%
1024x600 Normal, Fluid 3DTex
Geekom GT1 Mega
Intel Arc 8-Core iGPU, Intel Core Ultra 9 185H
492 Points
Asus NUC 14 Pro
Intel Arc 7-Core iGPU, Intel Core Ultra 5 125H
490 Points 0%
Geekom AX8 Pro
AMD Radeon 780M, AMD Ryzen 9 8945H
488 Points -1%
Minisforum UH125 Pro
Intel Arc 7-Core iGPU, Intel Core Ultra 5 125H
471 Points -4%
Acemagic F2A
Intel Arc 8-Core iGPU, Intel Core Ultra 7 155H
427 Points -13%
Geekom GT13 Pro
Intel Iris Xe Graphics G7 96EUs, Intel Core i9-13900H
286 Points -42%
1024x600 Normal, Fluid 2DTexArr
Geekom GT1 Mega
Intel Arc 8-Core iGPU, Intel Core Ultra 9 185H
487 Points
Asus NUC 14 Pro
Intel Arc 7-Core iGPU, Intel Core Ultra 5 125H
472 Points -3%
Minisforum UH125 Pro
Intel Arc 7-Core iGPU, Intel Core Ultra 5 125H
439 Points -10%
Geekom AX8 Pro
AMD Radeon 780M, AMD Ryzen 9 8945H
427 Points -12%
Acemagic F2A
Intel Arc 8-Core iGPU, Intel Core Ultra 7 155H
422 Points -13%
Geekom GT13 Pro
Intel Iris Xe Graphics G7 96EUs, Intel Core i9-13900H
294 Points -40%
1024x600 Normal, Mandel Vector
Geekom AX8 Pro
AMD Radeon 780M, AMD Ryzen 9 8945H
2362 Points +16%
Geekom GT1 Mega
Intel Arc 8-Core iGPU, Intel Core Ultra 9 185H
2039 Points
Acemagic F2A
Intel Arc 8-Core iGPU, Intel Core Ultra 7 155H
1961 Points -4%
Asus NUC 14 Pro
Intel Arc 7-Core iGPU, Intel Core Ultra 5 125H
1715 Points -16%
Minisforum UH125 Pro
Intel Arc 7-Core iGPU, Intel Core Ultra 5 125H
1447 Points -29%
Geekom GT13 Pro
Intel Iris Xe Graphics G7 96EUs, Intel Core i9-13900H
873 Points -57%
1024x600 Normal, Mandel Scalar
Geekom AX8 Pro
AMD Radeon 780M, AMD Ryzen 9 8945H
2449 Points +44%
Geekom GT1 Mega
Intel Arc 8-Core iGPU, Intel Core Ultra 9 185H
1701 Points
Acemagic F2A
Intel Arc 8-Core iGPU, Intel Core Ultra 7 155H
1594 Points -6%
Asus NUC 14 Pro
Intel Arc 7-Core iGPU, Intel Core Ultra 5 125H
1360 Points -20%
Minisforum UH125 Pro
Intel Arc 7-Core iGPU, Intel Core Ultra 5 125H
1112 Points -35%
Geekom GT13 Pro
Intel Iris Xe Graphics G7 96EUs, Intel Core i9-13900H
888 Points -48%
1024x600 Normal, QJuliaRayTrace
Geekom GT1 Mega
Intel Arc 8-Core iGPU, Intel Core Ultra 9 185H
3244 Points
Acemagic F2A
Intel Arc 8-Core iGPU, Intel Core Ultra 7 155H
3076 Points -5%
Geekom AX8 Pro
AMD Radeon 780M, AMD Ryzen 9 8945H
2868 Points -12%
Asus NUC 14 Pro
Intel Arc 7-Core iGPU, Intel Core Ultra 5 125H
2662 Points -18%
Minisforum UH125 Pro
Intel Arc 7-Core iGPU, Intel Core Ultra 5 125H
2143 Points -34%
Geekom GT13 Pro
Intel Iris Xe Graphics G7 96EUs, Intel Core i9-13900H
1310 Points -60%
LuxMark v2.0 64Bit
Room GPUs-only
Geekom AX8 Pro
AMD Radeon 780M, AMD Ryzen 9 8945H
1068 Samples/s +63%
Asus NUC 14 Pro
Intel Arc 7-Core iGPU, Intel Core Ultra 5 125H
801 Samples/s +22%
Minisforum UH125 Pro
Intel Arc 7-Core iGPU, Intel Core Ultra 5 125H
710 Samples/s +8%
Geekom GT1 Mega
Intel Arc 8-Core iGPU, Intel Core Ultra 9 185H
656 Samples/s
Geekom GT13 Pro
Intel Iris Xe Graphics G7 96EUs, Intel Core i9-13900H
651 Samples/s -1%
Acemagic F2A
Intel Arc 8-Core iGPU, Intel Core Ultra 7 155H
549 Samples/s -16%
Sala GPUs-only
Geekom GT1 Mega
Intel Arc 8-Core iGPU, Intel Core Ultra 9 185H
2888 Samples/s
Asus NUC 14 Pro
Intel Arc 7-Core iGPU, Intel Core Ultra 5 125H
2807 Samples/s -3%
Minisforum UH125 Pro
Intel Arc 7-Core iGPU, Intel Core Ultra 5 125H
2517 Samples/s -13%
Acemagic F2A
Intel Arc 8-Core iGPU, Intel Core Ultra 7 155H
2319 Samples/s -20%
Geekom AX8 Pro
AMD Radeon 780M, AMD Ryzen 9 8945H
2218 Samples/s -23%
Geekom GT13 Pro
Intel Iris Xe Graphics G7 96EUs, Intel Core i9-13900H
2104 Samples/s -27%
Affinity Photo 2 - Combined (Single / Multi GPU)
Geekom GT1 Mega
Intel Arc 8-Core iGPU, Intel Core Ultra 9 185H
6468 Points
Minisforum UH125 Pro
Intel Arc 7-Core iGPU, Intel Core Ultra 5 125H
5244 Points -19%
Asus NUC 14 Pro
Intel Arc 7-Core iGPU, Intel Core Ultra 5 125H
5105 Points -21%
Acemagic F2A
Intel Arc 8-Core iGPU, Intel Core Ultra 7 155H
4928 Points -24%
Geekom GT13 Pro
Intel Iris Xe Graphics G7 96EUs, Intel Core i9-13900H
4460 Points -31%
Geekom AX8 Pro
AMD Radeon 780M, AMD Ryzen 9 8945H
1831 Points -72%
Geekom GT1 Mega, Intel Arc 8-Core iGPU
Ultra 9 185H
Geekom AX8 Pro, AMD Radeon 780M
R9 8945H
Asus NUC 14 Pro, Intel Arc 7-Core iGPU
Ultra 5 125H
Minisforum UH125 Pro, Intel Arc 7-Core iGPU
Ultra 5 125H
Geekom GT13 Pro, Intel Iris Xe Graphics G7 96EUs
i9-13900H
Acemagic F2A, Intel Arc 8-Core iGPU
Ultra 7 155H
Durchschnitt der Klasse Mini PC
 
SPECviewperf 2020
223%
-13%
-19%
-27%
-13%
129%
3840x2160 Medical (medical-03)
7.07
12.8
81%
5.87
-17%
4.8
-32%
2.69
-62%
5.05
-29%
3840x2160 Energy (energy-03)
5
13.3
166%
3.81
-24%
3.38
-32%
3.17
-37%
4.61
-8%
3840x2160 Creo (creo-03)
19.8
35.3
78%
15.3
-23%
15.4
-22%
16.3
-18%
17.9
-10%
3840x2160 CATIA (catia-06)
11.7
25.1
115%
10.4
-11%
9.7
-17%
8.53
-27%
10
-15%
3840x2160 3ds Max (3dsmax-07)
15.5
21.1
36%
14.5
-6%
13.2
-15%
10.3
-34%
12.9
-17%
3840x2160 Siemens NX (snx-04)
5.68
65.7
1057%
5.82
2%
5.54
-2%
6.62
17%
5.7
0%
3840x2160 Maya (maya-06)
38.8
49.6
28%
34.7
-11%
32.8
-15%
27.3
-30%
35.4
-9%
3DMark 05 Standard
53214 Punkte
3DMark 06 Standard Score
38204 Punkte
3DMark Vantage P Result
43259 Punkte
3DMark 11 Performance
13104 Punkte
3DMark Ice Storm Standard Score
145222 Punkte
3DMark Cloud Gate Standard Score
35142 Punkte
3DMark Fire Strike Score
7968 Punkte
3DMark Fire Strike Extreme Score
4087 Punkte
3DMark Time Spy Score
3984 Punkte
3DMark Steel Nomad Score
781 Punkte
3DMark Steel Nomad Light Score
3222 Punkte
Hilfe

Gaming Performance

Das hervorragende Ergebnis Intel Arc 8-Core iGPU der synthetischen Benchmarks spiegelt sich in den Spieletests leider nicht wider. Der Geekom GT1 Mega fällt teilweise sehr deutlich hinter den Geekom AX8 Pro. Die AMD Radeon 780M liefert allerdings auch nur eine eingeschränkte Spieleleistung, welche auch mit Einschränkungen in der Praxis einhergehen. Grundsätzlich zeigt die Intel Arc 8-Core iGPU aber genügend Leistung, wenn es um ältere oder anspruchslose Titel geht.

Für einen ausführlichen Überblick hinsichtlich der Leistung der iGPU im Vergleich zu anderen Grafikkarten verweisen wir hier auf unsere GPU-Spieleliste.

GTA V
1024x768 Lowest Settings possible
Geekom AX8 Pro
Radeon 780M, R9 8945H, Acer N7000
169.4 (3.69min, 125P1) fps +3%
Geekom GT1 Mega
Arc 8-Core, Ultra 9 185H, Crucial P3 Plus CT2000P3PSSD8
165.2 (3.77min, 100P1) fps
Acemagic F2A
Arc 8-Core, Ultra 7 155H, Kingston OM8SEP1024Q-A0
161 (4.76min, 100P1) fps -3%
Asus NUC 14 Pro
Arc 7-Core, Ultra 5 125H, Kingston KC3000 2048G SKC3000D2048G
156.3 (4.92min, 90.9P1) fps -5%
Minisforum UH125 Pro
Arc 7-Core, Ultra 5 125H, Kingston OM8PGP41024Q-A0
132.4 (4.93min, 90.9P1) fps -20%
Geekom GT13 Pro
Iris Xe G7 96EUs, i9-13900H, Acer N7000
119.7 (7.51min, 66.7P1) fps -28%
1920x1080 High/On (Advanced Graphics Off) AA:2xMSAA + FX AF:8x
Geekom AX8 Pro
Radeon 780M, R9 8945H, Acer N7000
65.9 (2.44min, 41.7P1) fps +51%
Geekom GT1 Mega
Arc 8-Core, Ultra 9 185H, Crucial P3 Plus CT2000P3PSSD8
43.5 (3.49min, 32.3P1) fps
Asus NUC 14 Pro
Arc 7-Core, Ultra 5 125H, Kingston KC3000 2048G SKC3000D2048G
39.9 (3.1min, 29.4P1) fps -8%
Minisforum UH125 Pro
Arc 7-Core, Ultra 5 125H, Kingston OM8PGP41024Q-A0
38.9 (3.15min, 28.6P1) fps -11%
Acemagic F2A
Arc 8-Core, Ultra 7 155H, Kingston OM8SEP1024Q-A0
31.3 (2.94min, 22.7P1) fps -28%
Geekom GT13 Pro
Iris Xe G7 96EUs, i9-13900H, Acer N7000
22 (6.3min, 16.4P1) fps -49%
Dota 2 Reborn
1280x720 min (0/3) fastest
Geekom AX8 Pro
Radeon 780M, R9 8945H, Acer N7000
157.5 (136min) fps +43%
Geekom GT1 Mega
Arc 8-Core, Ultra 9 185H, Crucial P3 Plus CT2000P3PSSD8
110.5 (63min) fps
Geekom GT13 Pro
Iris Xe G7 96EUs, i9-13900H, Acer N7000
109.8 (85min) fps -1%
Acemagic F2A
Arc 8-Core, Ultra 7 155H, Kingston OM8SEP1024Q-A0
103.2 (59.8min) fps -7%
Asus NUC 14 Pro
Arc 7-Core, Ultra 5 125H, Kingston KC3000 2048G SKC3000D2048G
97.1 (61.8min) fps -12%
Minisforum UH125 Pro
Arc 7-Core, Ultra 5 125H, Kingston OM8PGP41024Q-A0
95.5 (63.7min) fps -14%
1920x1080 high (2/3)
Geekom AX8 Pro
Radeon 780M, R9 8945H, Acer N7000
88 (69.2min) fps 0%
Geekom GT1 Mega
Arc 8-Core, Ultra 9 185H, Crucial P3 Plus CT2000P3PSSD8
87.8 (28.3min) fps
Acemagic F2A
Arc 8-Core, Ultra 7 155H, Kingston OM8SEP1024Q-A0
77.3 (52.5min) fps -12%
Asus NUC 14 Pro
Arc 7-Core, Ultra 5 125H, Kingston KC3000 2048G SKC3000D2048G
75.9 (45.7min) fps -14%
Minisforum UH125 Pro
Arc 7-Core, Ultra 5 125H, Kingston OM8PGP41024Q-A0
73.6 (47.5min) fps -16%
Geekom GT13 Pro
Iris Xe G7 96EUs, i9-13900H, Acer N7000
65.5 (56.1min) fps -25%
Cyberpunk 2077 2.1 Phantom Liberty
1920x1080 Low Preset (FSR off)
Geekom AX8 Pro
Radeon 780M, R9 8945H, Acer N7000
41.3 (34.5min) fps +9%
Geekom GT1 Mega
Arc 8-Core, Ultra 9 185H, Crucial P3 Plus CT2000P3PSSD8
38 (33.3min) fps
Asus NUC 14 Pro
Arc 7-Core, Ultra 5 125H, Kingston KC3000 2048G SKC3000D2048G
30.1 (25.8min) fps -21%
Acemagic F2A
Arc 8-Core, Ultra 7 155H, Kingston OM8SEP1024Q-A0
29.5 (24.1min) fps -22%
Minisforum UH125 Pro
Arc 7-Core, Ultra 5 125H, Kingston OM8PGP41024Q-A0
29.5 (25.4min) fps -22%
Geekom GT13 Pro
Iris Xe G7 96EUs, i9-13900H, Acer N7000
18.2 (14.7min) fps -52%
1920x1080 High Preset (FSR off)
Geekom GT1 Mega
Arc 8-Core, Ultra 9 185H, Crucial P3 Plus CT2000P3PSSD8
26 (22.6min) fps
Geekom AX8 Pro
Radeon 780M, R9 8945H, Acer N7000
25.8 (21.7min) fps -1%
Asus NUC 14 Pro
Arc 7-Core, Ultra 5 125H, Kingston KC3000 2048G SKC3000D2048G
21.7 (18.8min) fps -17%
Minisforum UH125 Pro
Arc 7-Core, Ultra 5 125H, Kingston OM8PGP41024Q-A0
20.6 (17.9min) fps -21%
Acemagic F2A
Arc 8-Core, Ultra 7 155H, Kingston OM8SEP1024Q-A0
20.4 (13.8min) fps -22%
Geekom GT13 Pro
Iris Xe G7 96EUs, i9-13900H, Acer N7000
12.8 (10.9min) fps -51%
Baldur's Gate 3
1280x720 Low Preset
Geekom AX8 Pro
Radeon 780M, R9 8945H, Acer N7000
60.8 (21.6min, 28.1P0.1, 35.6P1) fps +6%
Geekom GT1 Mega
Arc 8-Core, Ultra 9 185H, Crucial P3 Plus CT2000P3PSSD8
57.6 (31.7min, 33.6P0.1, 37.9P1) fps
Asus NUC 14 Pro
Arc 7-Core, Ultra 5 125H, Kingston KC3000 2048G SKC3000D2048G
50.2 (27.7min, 29.7P0.1, 32.6P1) fps -13%
Minisforum UH125 Pro
Arc 7-Core, Ultra 5 125H, Kingston OM8PGP41024Q-A0
45 (14.9min, 19.4P0.1, 29P1) fps -22%
Geekom GT13 Pro
Iris Xe G7 96EUs, i9-13900H, Acer N7000
26.2 (4.4min, 7.02P0.1, 18.4P1) fps -55%
1920x1080 High Preset
Geekom GT1 Mega
Arc 8-Core, Ultra 9 185H, Crucial P3 Plus CT2000P3PSSD8
25.4 (13.9min, 14.3P0.1, 16.3P1) fps
Geekom AX8 Pro
Radeon 780M, R9 8945H, Acer N7000
24.5 (17.7min, 17.7P0.1, 19.8P1) fps -4%
Asus NUC 14 Pro
Arc 7-Core, Ultra 5 125H, Kingston KC3000 2048G SKC3000D2048G
22.4 (14min, 14.2P0.1, 15.3P1) fps -12%
Minisforum UH125 Pro
Arc 7-Core, Ultra 5 125H, Kingston OM8PGP41024Q-A0
19.5 (9.2min, 10.4P0.1, 12.7P1) fps -23%
Geekom GT13 Pro
Iris Xe G7 96EUs, i9-13900H, Acer N7000
11.7 (3.43min, 3.51P0.1, 3.99P1) fps -54%
F1 24
1920x1080 Low Preset AA:T AF:16x
Geekom GT1 Mega
Arc 8-Core, Ultra 9 185H, Crucial P3 Plus CT2000P3PSSD8
84.3 (70min, 66P1) fps
Geekom AX8 Pro
Radeon 780M, R9 8945H, Acer N7000
83.4 (28min, 33P1) fps -1%
Asus NUC 14 Pro
Arc 7-Core, Ultra 5 125H, Kingston KC3000 2048G SKC3000D2048G
66.2 (56min, 54P1) fps -21%
Minisforum UH125 Pro
Arc 7-Core, Ultra 5 125H, Kingston OM8PGP41024Q-A0
64.3 (55min, 53P1) fps -24%
Geekom GT13 Pro
Iris Xe G7 96EUs, i9-13900H, Acer N7000
40.4 (34min, 33P1) fps -52%
1920x1080 High Preset AA:T AF:16x
Geekom GT1 Mega
Arc 8-Core, Ultra 9 185H, Crucial P3 Plus CT2000P3PSSD8
54.8 (43min, 45P1) fps
Geekom AX8 Pro
Radeon 780M, R9 8945H, Acer N7000
51.3 (23min, 15P1) fps -6%
Asus NUC 14 Pro
Arc 7-Core, Ultra 5 125H, Kingston KC3000 2048G SKC3000D2048G
43.4 (34min, 35P1) fps -21%
Minisforum UH125 Pro
Arc 7-Core, Ultra 5 125H, Kingston OM8PGP41024Q-A0
41.7 (34min, 34P1) fps -24%
Geekom GT13 Pro
Iris Xe G7 96EUs, i9-13900H, Acer N7000
25.6 (22min, 21P1) fps -53%

FPS-Diagramm - 30 Min. Cyberpunk 2077 1.920 x 1.080 Ultra Preset (FSR off)

05101520Tooltip
Geekom GT1 Mega Ultra 9 185H, Arc 8-Core: Ø22.1 (18.6-24)
Geekom AX8 Pro R9 8945H, Radeon 780M: Ø19.2 (17.9-20.3)
Asus NUC 14 Pro Ultra 5 125H, Arc 7-Core: Ø18.5 (12.6-20.7)
Geekom GT13 Pro i9-13900H, Iris Xe G7 96EUs: Ø11.1 (5.97-12.3)
min.mittelhochmax.
GTA V (2015) 165.2 151.8 43.5 16.6
Dota 2 Reborn (2015) 110.5 62.8 87.8 45.5
Final Fantasy XV Benchmark (2018) 79.2 41 28.9
X-Plane 11.11 (2018) 66.4 52.1 42.3
Baldur's Gate 3 (2023) 39.3 30.3 25.4 25.2
Cyberpunk 2077 2.1 Phantom Liberty (2023) 38 31.4 26 23.3
F1 24 (2024) 84.3 73.8 54.8

Geekom GT1 Mega im Leistungscheck mit einer Nvidia GeForce RTX 4090

GPU-Z
GPU-Z

Aufgrund der Anschlussausstattung ermöglicht der Geekom GT1 Mega via USB4 den Einsatz von externen Grafiklösungen. Ein wichtiger Punkt ist die Bandbreitenbeschränkung, womit eine externe Grafikkarte über eine USB4-Verbindung nur mit PCIe-3.0-x4-Geschwindigkeit arbeitet. In Kombination mit einer Nvidia GeForce RTX 4090 haben wir einige Benchmarks durchgeführt um aufzuzeigen, welcher Leistungszuwachs mit der aktuell schnellsten Consumer-Grafikkarte zu erwarten ist. Grundsätzlich kann die 3D-Leistung gegenüber der iGPU spürbar gesteigert werden. Im Vergleich liefert die Kombination mit dem Geekom GT1 Mega etwas mehr Leistung als der Mini-PC aus dem Hause Khadas. Gegenüber dem Minisforum MS-A1 muss sich unser Testsample jedoch geschlagen geben. Der technische Nachteil der USB4-Verbindung gegenüber einer OCuLink-Schnittstelle ist hier deutlich sichtbar. Eine OCuLink-Schnittstelle bietet PCIe-4.0-x4-Geschwindigkeit, was einer Verdoppelung der Bandbreite entspricht.

Performance Rating - Percent
AMD Ryzen 5 9600X
AMD Ryzen 5 9600X
98.7 pt
Intel Core i5-14600K
96.9 pt
Minisforum MS-A1 (Nvidia GeForce RTX 4090 @OCuLink)
AMD Ryzen 7 8700G
88.1 pt
Geekom GT1 Mega (Nvidia GeForce RTX 4090 @USB4)
Intel Core Ultra 9 185H
78.6 pt
Khadas Mind 2 (Nvidia GeForce RTX 4090 @USB4)
Intel Core Ultra 7 155H
75 pt
3DMark 11 - 1280x720 Performance GPU
Intel Core i5-14600K
110994 Points +734%
AMD Ryzen 5 9600X
AMD Ryzen 5 9600X
104516 Points +685%
Minisforum MS-A1 (Nvidia GeForce RTX 4090 @OCuLink)
AMD Ryzen 7 8700G
98454 Points +640%
Geekom GT1 Mega (Nvidia GeForce RTX 4090 @USB4)
Intel Core Ultra 9 185H
64648 Points +386%
Khadas Mind 2 (Nvidia GeForce RTX 4090 @USB4)
Intel Core Ultra 7 155H
62498 Points +370%

13309 Points
3DMark
2560x1440 Time Spy Graphics
Intel Core i5-14600K
37769 Points +946%
AMD Ryzen 5 9600X
AMD Ryzen 5 9600X
37161 Points +929%
Minisforum MS-A1 (Nvidia GeForce RTX 4090 @OCuLink)
AMD Ryzen 7 8700G
34984 Points +869%
Geekom GT1 Mega (Nvidia GeForce RTX 4090 @USB4)
Intel Core Ultra 9 185H
28844 Points +699%
Khadas Mind 2 (Nvidia GeForce RTX 4090 @USB4)
Intel Core Ultra 7 155H
23140 Points +541%

3610 Points
1920x1080 Fire Strike Graphics
Intel Core i5-14600K
86031 Points +886%
AMD Ryzen 5 9600X
AMD Ryzen 5 9600X
78579 Points +801%
Minisforum MS-A1 (Nvidia GeForce RTX 4090 @OCuLink)
AMD Ryzen 7 8700G
76191 Points +773%
Geekom GT1 Mega (Nvidia GeForce RTX 4090 @USB4)
Intel Core Ultra 9 185H
53367 Points +512%
Khadas Mind 2 (Nvidia GeForce RTX 4090 @USB4)
Intel Core Ultra 7 155H
40417 Points +363%

8726 Points
3840x2160 Fire Strike Ultra Graphics
Intel Core i5-14600K
25342 Points +1150%
AMD Ryzen 5 9600X
AMD Ryzen 5 9600X
24915 Points +1129%
Minisforum MS-A1 (Nvidia GeForce RTX 4090 @OCuLink)
AMD Ryzen 7 8700G
23565 Points +1062%
Geekom GT1 Mega (Nvidia GeForce RTX 4090 @USB4)
Intel Core Ultra 9 185H
21506 Points +960%
Khadas Mind 2 (Nvidia GeForce RTX 4090 @USB4)
Intel Core Ultra 7 155H
17047 Points +741%

2028 Points
Unigine Superposition
1280x720 720p Low
AMD Ryzen 5 9600X
AMD Ryzen 5 9600X
63603 Points +411%
Intel Core i5-14600K
49203 Points +295%
Minisforum MS-A1 (Nvidia GeForce RTX 4090 @OCuLink)
AMD Ryzen 7 8700G
35453 Points +185%
Geekom GT1 Mega (Nvidia GeForce RTX 4090 @USB4)
Intel Core Ultra 9 185H
33318 Points +168%
Khadas Mind 2 (Nvidia GeForce RTX 4090 @USB4)
Intel Core Ultra 7 155H
28104 Points +126%

12451 Points
1920x1080 1080p High
AMD Ryzen 5 9600X
AMD Ryzen 5 9600X
50230 Points +1172%
Intel Core i5-14600K
45162 Points +1044%
Minisforum MS-A1 (Nvidia GeForce RTX 4090 @OCuLink)
AMD Ryzen 7 8700G
32728 Points +729%
Geekom GT1 Mega (Nvidia GeForce RTX 4090 @USB4)
Intel Core Ultra 9 185H
30115 Points +663%
Khadas Mind 2 (Nvidia GeForce RTX 4090 @USB4)
Intel Core Ultra 7 155H
26890 Points +581%

3948 Points
1920x1080 1080p Extreme
Intel Core i5-14600K
21954 Points +936%
AMD Ryzen 5 9600X
AMD Ryzen 5 9600X
21586 Points +919%
Minisforum MS-A1 (Nvidia GeForce RTX 4090 @OCuLink)
AMD Ryzen 7 8700G
20934 Points +888%
Geekom GT1 Mega (Nvidia GeForce RTX 4090 @USB4)
Intel Core Ultra 9 185H
19915 Points +840%
Khadas Mind 2 (Nvidia GeForce RTX 4090 @USB4)
Intel Core Ultra 7 155H
19877 Points +838%

2119 Points
3840x2160 4k Optimized
Intel Core i5-14600K
33700 Points
AMD Ryzen 5 9600X
AMD Ryzen 5 9600X
33095 Points
Minisforum MS-A1 (Nvidia GeForce RTX 4090 @OCuLink)
AMD Ryzen 7 8700G
30190 Points
Geekom GT1 Mega (Nvidia GeForce RTX 4090 @USB4)
Intel Core Ultra 9 185H
27686 Points
Khadas Mind 2 (Nvidia GeForce RTX 4090 @USB4)
Intel Core Ultra 7 155H
25802 Points
7680x4320 8k Optimized
Intel Core i5-14600K
12791 Points
AMD Ryzen 5 9600X
AMD Ryzen 5 9600X
12498 Points
Minisforum MS-A1 (Nvidia GeForce RTX 4090 @OCuLink)
AMD Ryzen 7 8700G
12251 Points
Geekom GT1 Mega (Nvidia GeForce RTX 4090 @USB4)
Intel Core Ultra 9 185H
12132 Points
Khadas Mind 2 (Nvidia GeForce RTX 4090 @USB4)
Intel Core Ultra 7 155H
12050 Points
Unigine Valley 1.0
1920x1080 Extreme HD DirectX AA:x8
AMD Ryzen 5 9600X
AMD Ryzen 5 9600X
324 fps +1512%
Intel Core i5-14600K
283.4 fps +1310%
Minisforum MS-A1 (Nvidia GeForce RTX 4090 @OCuLink)
AMD Ryzen 7 8700G
216.1 fps +975%
Geekom GT1 Mega (Nvidia GeForce RTX 4090 @USB4)
Intel Core Ultra 9 185H
208.7 fps +938%
Khadas Mind 2 (Nvidia GeForce RTX 4090 @USB4)
Intel Core Ultra 7 155H
187.1 fps +831%

20.1 fps
1920x1080 Extreme HD Preset OpenGL AA:x8
AMD Ryzen 5 9600X
AMD Ryzen 5 9600X
331.8 fps +1415%
Intel Core i5-14600K
303.2 fps +1284%
Minisforum MS-A1 (Nvidia GeForce RTX 4090 @OCuLink)
AMD Ryzen 7 8700G
231.7 fps +958%
Geekom GT1 Mega (Nvidia GeForce RTX 4090 @USB4)
Intel Core Ultra 9 185H
224.4 fps +925%
Khadas Mind 2 (Nvidia GeForce RTX 4090 @USB4)
Intel Core Ultra 7 155H
200.5 fps +816%

21.9 fps
Unigine Heaven 4.0
Extreme Preset OpenGL
AMD Ryzen 5 9600X
AMD Ryzen 5 9600X
472.4 fps +1198%
Intel Core i5-14600K
456.3 fps +1154%
Minisforum MS-A1 (Nvidia GeForce RTX 4090 @OCuLink)
AMD Ryzen 7 8700G
441.5 fps +1113%
Geekom GT1 Mega (Nvidia GeForce RTX 4090 @USB4)
Intel Core Ultra 9 185H
386.5 fps +962%
Khadas Mind 2 (Nvidia GeForce RTX 4090 @USB4)
Intel Core Ultra 7 155H
372.8 fps +924%

36.4 fps
Extreme Preset DX11
AMD Ryzen 5 9600X
AMD Ryzen 5 9600X
473.9 fps +1164%
Intel Core i5-14600K
473 fps +1161%
Minisforum MS-A1 (Nvidia GeForce RTX 4090 @OCuLink)
AMD Ryzen 7 8700G
422.3 fps +1026%
Khadas Mind 2 (Nvidia GeForce RTX 4090 @USB4)
Intel Core Ultra 7 155H
344.6 fps +819%
Geekom GT1 Mega (Nvidia GeForce RTX 4090 @USB4)
Intel Core Ultra 9 185H
343 fps +815%

37.5 fps
ComputeMark v2.1
1024x600 Normal, Score
Intel Core i5-14600K
92397 Points +1060%
AMD Ryzen 5 9600X
AMD Ryzen 5 9600X
92222 Points +1058%
Minisforum MS-A1 (Nvidia GeForce RTX 4090 @OCuLink)
AMD Ryzen 7 8700G
90882 Points +1041%
Khadas Mind 2 (Nvidia GeForce RTX 4090 @USB4)
Intel Core Ultra 7 155H
86314 Points +984%
Geekom GT1 Mega (Nvidia GeForce RTX 4090 @USB4)
Intel Core Ultra 9 185H
83349 Points +947%

7963 Points
1024x600 Normal, Fluid 3DTex
Intel Core i5-14600K
10797 Points +2095%
AMD Ryzen 5 9600X
AMD Ryzen 5 9600X
10756 Points +2086%
Minisforum MS-A1 (Nvidia GeForce RTX 4090 @OCuLink)
AMD Ryzen 7 8700G
10664 Points +2067%
Khadas Mind 2 (Nvidia GeForce RTX 4090 @USB4)
Intel Core Ultra 7 155H
10373 Points +2008%
Geekom GT1 Mega (Nvidia GeForce RTX 4090 @USB4)
Intel Core Ultra 9 185H
9972 Points +1927%

492 Points
1024x600 Normal, Fluid 2DTexArr
AMD Ryzen 5 9600X
AMD Ryzen 5 9600X
6948 Points +1327%
Intel Core i5-14600K
6920 Points +1321%
Minisforum MS-A1 (Nvidia GeForce RTX 4090 @OCuLink)
AMD Ryzen 7 8700G
6907 Points +1318%
Khadas Mind 2 (Nvidia GeForce RTX 4090 @USB4)
Intel Core Ultra 7 155H
6771 Points +1290%
Geekom GT1 Mega (Nvidia GeForce RTX 4090 @USB4)
Intel Core Ultra 9 185H
6566 Points +1248%

487 Points
1024x600 Normal, Mandel Vector
Intel Core i5-14600K
17355 Points +751%
AMD Ryzen 5 9600X
AMD Ryzen 5 9600X
17307 Points +749%
Minisforum MS-A1 (Nvidia GeForce RTX 4090 @OCuLink)
AMD Ryzen 7 8700G
17088 Points +738%
Khadas Mind 2 (Nvidia GeForce RTX 4090 @USB4)
Intel Core Ultra 7 155H
16044 Points +687%
Geekom GT1 Mega (Nvidia GeForce RTX 4090 @USB4)
Intel Core Ultra 9 185H
15583 Points +664%

2039 Points
1024x600 Normal, Mandel Scalar
Intel Core i5-14600K
22992 Points +1252%
AMD Ryzen 5 9600X
AMD Ryzen 5 9600X
22843 Points +1243%
Minisforum MS-A1 (Nvidia GeForce RTX 4090 @OCuLink)
AMD Ryzen 7 8700G
22633 Points +1231%
Khadas Mind 2 (Nvidia GeForce RTX 4090 @USB4)
Intel Core Ultra 7 155H
21302 Points +1152%
Geekom GT1 Mega (Nvidia GeForce RTX 4090 @USB4)
Intel Core Ultra 9 185H
20574 Points +1110%

1701 Points
1024x600 Normal, QJuliaRayTrace
AMD Ryzen 5 9600X
AMD Ryzen 5 9600X
34367 Points +959%
Intel Core i5-14600K
34333 Points +958%
Minisforum MS-A1 (Nvidia GeForce RTX 4090 @OCuLink)
AMD Ryzen 7 8700G
33589 Points +935%
Khadas Mind 2 (Nvidia GeForce RTX 4090 @USB4)
Intel Core Ultra 7 155H
31824 Points +881%
Geekom GT1 Mega (Nvidia GeForce RTX 4090 @USB4)
Intel Core Ultra 9 185H
30654 Points +845%

3244 Points
Performance Rating - Percent
AMD Ryzen 5 9600X
AMD Ryzen 5 9600X
100 pt
Minisforum MS-A1 (Nvidia GeForce RTX 4090 @OCuLink)
AMD Ryzen 7 8700G
75.5 pt
Geekom GT1 Mega (Nvidia GeForce RTX 4090 @USB4)
Intel Core Ultra 9 185H
39.9 pt
Khadas Mind 2 (Nvidia GeForce RTX 4090 @USB4)
Intel Core Ultra 7 155H
32.4 pt
Cyberpunk 2077 2.1 Phantom Liberty
1280x720 Low Preset (FSR off)
AMD Ryzen 5 9600X
AMD Ryzen 5 9600X
256 (183.7min - 319max) fps +341%
Minisforum MS-A1 (Nvidia GeForce RTX 4090 @OCuLink)
AMD Ryzen 7 8700G
187.3 (143.6min - 225max) fps +223%
Geekom GT1 Mega (Nvidia GeForce RTX 4090 @USB4)
Intel Core Ultra 9 185H
88.9 (67.9min - 123.3max) fps +53%
Khadas Mind 2 (Nvidia GeForce RTX 4090 @USB4)
Intel Core Ultra 7 155H
79.7 (62.5min - 101.2max) fps +37%

58 (49.1min - 71.8max) fps
1920x1080 Medium Preset (FSR off)
AMD Ryzen 5 9600X
AMD Ryzen 5 9600X
252 (174.7min - 318max) fps +703%
Minisforum MS-A1 (Nvidia GeForce RTX 4090 @OCuLink)
AMD Ryzen 7 8700G
184.9 (141min - 225max) fps +489%
Geekom GT1 Mega (Nvidia GeForce RTX 4090 @USB4)
Intel Core Ultra 9 185H
87.8 (65.1min - 123max) fps +180%
Khadas Mind 2 (Nvidia GeForce RTX 4090 @USB4)
Intel Core Ultra 7 155H
77.5 (58.3min - 109.1max) fps +147%

31.4 (27.8min - 35.6max) fps
1920x1080 Ultra Preset (FSR off)
AMD Ryzen 5 9600X
AMD Ryzen 5 9600X
204 (126.1min - 264max) fps +776%
Minisforum MS-A1 (Nvidia GeForce RTX 4090 @OCuLink)
AMD Ryzen 7 8700G
161.8 (107min - 205max) fps +594%
Geekom GT1 Mega (Nvidia GeForce RTX 4090 @USB4)
Intel Core Ultra 9 185H
75 (50.3min - 110.2max) fps +222%
Khadas Mind 2 (Nvidia GeForce RTX 4090 @USB4)
Intel Core Ultra 7 155H
68.8 (46.7min - 98.6max) fps +195%

23.3 (20.1min - 28.1max) fps
Baldur's Gate 3
1920x1080 Low Preset
AMD Ryzen 5 9600X
AMD Ryzen 5 9600X
253 (30.2min, 76.7P0.1, 155.7P1 - 431max) fps +544%
Minisforum MS-A1 (Nvidia GeForce RTX 4090 @OCuLink)
AMD Ryzen 7 8700G
200 (109.4min, 129.1P0.1, 154.1P1 - 278max) fps +409%
Geekom GT1 Mega (Nvidia GeForce RTX 4090 @USB4)
Intel Core Ultra 9 185H
189.1 (95.1min, 108.7P0.1, 136.8P1 - 323max) fps +381%
Khadas Mind 2 (Nvidia GeForce RTX 4090 @USB4)
Intel Core Ultra 7 155H
142.8 (70.4min, 75.8P0.1, 97.6P1 - 236max) fps +263%

39.3 (24.3min, 25.4P0.1, 28P1 - 90.7max) fps
1920x1080 Medium Preset
AMD Ryzen 5 9600X
AMD Ryzen 5 9600X
231 (52.4min, 123P0.1, 150.8P1 - 382max) fps +662%
Minisforum MS-A1 (Nvidia GeForce RTX 4090 @OCuLink)
AMD Ryzen 7 8700G
194.4 (102.5min, 120P0.1, 151.2P1 - 274max) fps +542%
Geekom GT1 Mega (Nvidia GeForce RTX 4090 @USB4)
Intel Core Ultra 9 185H
168.3 (71.8min, 94P0.1, 117.8P1 - 266max) fps +455%
Khadas Mind 2 (Nvidia GeForce RTX 4090 @USB4)
Intel Core Ultra 7 155H
114 (35.5min, 44P0.1, 57.3P1 - 219max) fps +276%

30.3 (18.1min, 18.2P0.1, 20.2P1 - 85.2max) fps
1920x1080 Ultra Preset
AMD Ryzen 5 9600X
AMD Ryzen 5 9600X
212 (16.9min, 120.1P0.1, 151.8P1 - 372max) fps +741%
Minisforum MS-A1 (Nvidia GeForce RTX 4090 @OCuLink)
AMD Ryzen 7 8700G
190.9 (107.5min, 129.1P0.1, 148.8P1 - 259max) fps +658%
Geekom GT1 Mega (Nvidia GeForce RTX 4090 @USB4)
Intel Core Ultra 9 185H
151.8 (67.2min, 82P0.1, 101.9P1 - 254max) fps +502%
Khadas Mind 2 (Nvidia GeForce RTX 4090 @USB4)
Intel Core Ultra 7 155H
109.2 (29.8min, 38.6P0.1, 55.9P1 - 199max) fps +333%

25.2 (11.9min, 13P0.1, 16.6P1 - 75.3max) fps
F1 24
1920x1080 Low Preset AA:T AF:16x
AMD Ryzen 5 9600X
AMD Ryzen 5 9600X
405 (297min, 246P1 - 476max) fps +380%
Minisforum MS-A1 (Nvidia GeForce RTX 4090 @OCuLink)
AMD Ryzen 7 8700G
269 (203min, 181P1 - 313max) fps +219%

84.3 (70min, 66P1 - 97max) fps
Geekom GT1 Mega (Nvidia GeForce RTX 4090 @USB4)
Intel Core Ultra 9 185H
78.1 (43min, 45P1 - 98max) fps -7%
Khadas Mind 2 (Nvidia GeForce RTX 4090 @USB4)
Intel Core Ultra 7 155H
74.6 (42min, 44P1 - 94max) fps -12%
1920x1080 Medium Preset AA:T AF:16x
AMD Ryzen 5 9600X
AMD Ryzen 5 9600X
421 (328min, 262P1 - 470max) fps +470%
Minisforum MS-A1 (Nvidia GeForce RTX 4090 @OCuLink)
AMD Ryzen 7 8700G
285 (216min, 190P1 - 313max) fps +286%
Geekom GT1 Mega (Nvidia GeForce RTX 4090 @USB4)
Intel Core Ultra 9 185H
74.4 (42min, 44P1 - 86max) fps +1%

73.8 (61min, 59P1 - 88max) fps
Khadas Mind 2 (Nvidia GeForce RTX 4090 @USB4)
Intel Core Ultra 7 155H
72.1 (41min, 43P1 - 85max) fps -2%
1920x1080 High Preset AA:T AF:16x
AMD Ryzen 5 9600X
AMD Ryzen 5 9600X
401 (305min, 241P1 - 449max) fps +632%
Minisforum MS-A1 (Nvidia GeForce RTX 4090 @OCuLink)
AMD Ryzen 7 8700G
267 (203min, 176P1 - 297max) fps +387%
Geekom GT1 Mega (Nvidia GeForce RTX 4090 @USB4)
Intel Core Ultra 9 185H
61.7 (35min, 37P1 - 75max) fps +13%
Khadas Mind 2 (Nvidia GeForce RTX 4090 @USB4)
Intel Core Ultra 7 155H
60.1 (35min, 36P1 - 74max) fps +10%

54.8 (43min, 45P1 - 64max) fps
1920x1080 Ultra High Preset AA:T AF:16x
AMD Ryzen 5 9600X
AMD Ryzen 5 9600X
205 (90min, 114P1 - 235max) fps
Minisforum MS-A1 (Nvidia GeForce RTX 4090 @OCuLink)
AMD Ryzen 7 8700G
154.4 (74min, 88P1 - 171max) fps
Geekom GT1 Mega (Nvidia GeForce RTX 4090 @USB4)
Intel Core Ultra 9 185H
43.9 (24min, 26P1 - 52max) fps
Khadas Mind 2 (Nvidia GeForce RTX 4090 @USB4)
Intel Core Ultra 7 155H
41.7 (23min, 24P1 - 48max) fps
Geekom GT1 Mega, Intel Arc 8-Core iGPU
Ultra 9 185H
Geekom GT1 Mega (Nvidia GeForce RTX 4090 @USB4) ,
Ultra 9 185H
Khadas Mind 2 (Nvidia GeForce RTX 4090 @USB4) ,
Ultra 7 155H
Minisforum MS-A1 (Nvidia GeForce RTX 4090 @OCuLink) ,
Ryzen 7 8700G
AMD Ryzen 5 9600X, NVIDIA GeForce RTX 4090
Ryzen 5 9600X
Intel Core i5-14600K, NVIDIA GeForce RTX 4090
i5-14600K
Durchschnitt der Klasse Mini PC
 
SPECviewperf 2020
775%
786%
1064%
1037%
1398%
129%
3840x2160 Medical (medical-03)
7.07
42.1
495%
42.3
498%
43.2
511%
43.5
515%
40.2
469%
3840x2160 Energy (energy-03)
5
92.8
1756%
95.3
1806%
141
2720%
95.6
1812%
229
4480%
3840x2160 Creo (creo-03)
19.8
91.1
360%
83.8
323%
128
546%
143
622%
139
602%
3840x2160 CATIA (catia-06)
11.7
77.3
561%
75.7
547%
85.2
628%
94.2
705%
94.3
706%
3840x2160 3ds Max (3dsmax-07)
15.5
158
919%
160
932%
204
1216%
231
1390%
235
1416%
3840x2160 Siemens NX (snx-04)
5.68
31.9
462%
33
481%
40.3
610%
48.1
747%
46.3
715%
3840x2160 Maya (maya-06)
38.8
378
874%
393
913%
512
1220%
609
1470%
min.mittelhochmax.QHD4K
Dota 2 Reborn (2015) 182.3 156.9 153.6 143 136
Final Fantasy XV Benchmark (2018) 209 196.8 164.3 156.8 119.2
X-Plane 11.11 (2018) 143.6 134.1 101.8 87.2
Baldur's Gate 3 (2023) 189.1 168.3 152.7 151.8 136.9 96.1
Cyberpunk 2077 2.1 Phantom Liberty (2023) 88.8 87.8 79.3 75 74.3 53.1
F1 24 (2024) 78.1 74.4 61.7 43.9 43.2 42

Emissionen - nicht nutzerfreundlich und zu laut

Geräuschemissionen

Obwohl Geekom den GT1 Mega größer konstruiert und ihm infolgedessen eine größere Kühleinheit spendiert, arbeitet das System im Auslieferungszustand nur im Leerlauf leise. Sofern man dem Gerät etwas abverlangt, dreht der Lüfter auf und erzeugt ein nicht zu überhörendes Rauschen. Im Vergleich sehen wir Parallelen zum Geekom AX8 Pro, der allerdings deutlich kleiner konstruiert ist. Minisforum zeigt mit dem UH125 Pro, wie man es besser machen kann, wenn wir uns einmal auf den Schalldruckpegel unter Last beschränken. Angesichts dessen ist unsere Empfehlung, den quiet mode im BIOS zu aktivieren, um die Lautstärke unter Last etwas zu reduzieren. Insgesamt wirkt der Bereich Lüftersteuerung sehr unausgereift. Mehr Optionen, um die Lüfterdrehzahlen anzupassen, wäre sicherlich ein erster Schritt. Zudem wäre es sinnvoll, ein kleines Tool zu entwickeln, um die Lüftergeschwindigkeit aus dem Windows heraus zu verändern.

Lautstärkediagramm

Idle
25.4 / 27.2 / 27.5 dB(A)
Last
50.9 / 50.9 dB(A)
  red to green bar
 
 
30 dB
leise
40 dB(A)
deutlich hörbar
50 dB(A)
störend
 
min: dark, med: mid, max: light   Earthworks M23R (aus 15 cm gemessen)   Umgebungsgeräusche: 24.8 dB(A)
dB(A) 0102030405060708090Deep BassMiddle BassHigh BassLower RangeMidsHigher MidsLower HighsMid HighsUpper HighsSuper Highs2034.138.635.837.434.13734.12535.434.332.936.236.331.135.43139.738.139.640.338.64039.74026.629.625.426.423.223.926.650293428.630.426.225.3296327.832.533.93227.923.227.88024.525.922.424.622.722.724.510024.924.921.623.221.92124.912524.723.815.915.914.813.424.716022.72314.114.111.99.322.720025.525.214.715.614.210.525.525027.627.412.812.912.79.627.631526.826.911.11313.39.226.840026.926.91011.511.69.626.950030.430.310.813.412.38.830.463031.230.810.513.412.88.931.280034.734.811.314.514.19.334.7100039.138.512.716.816.69.939.1125040.940.612.917.51710.640.9160040.440.511.916.215.711.240.4200042.642.512.616.115.811.842.6250040.340.513.115.215.112.540.3315037.938.213.415.615.213.437.9400043.143.113.815.414.91443.150003736.914.314.414.214.237630029.429.614.614.814.814.529.4800029.73014.814.914.914.829.71000024.525.514.914.915.114.624.51250017.819.414.714.714.814.417.8160001617.514.314.314.31416SPL50.950.925.427.627.224.850.9N6.76.70.60.90.80.56.7median 29.7median 30median 13.4median 14.9median 14.8median 11.8median 29.7Delta6.57.21.70.90.82.46.5hearing rangehide median Fan NoiseGeekom GT1 Mega
Geekom GT1 Mega
Ultra 9 185H, Arc 8-Core
Geekom AX8 Pro
R9 8945H, Radeon 780M
Asus NUC 14 Pro
Ultra 5 125H, Arc 7-Core
Minisforum UH125 Pro
Ultra 5 125H, Arc 7-Core
Geekom GT13 Pro
i9-13900H, Iris Xe G7 96EUs
Acemagic F2A
Ultra 7 155H, Arc 8-Core
Geräuschentwicklung
3%
6%
-6%
2%
4%
aus / Umgebung *
24.8
24.9
-0%
24
3%
24.8
-0%
24.3
2%
24.9
-0%
Idle min *
25.4
24.9
2%
26
-2%
35
-38%
27.9
-10%
25.4
-0%
Idle avg *
27.2
24.9
8%
26.2
4%
35
-29%
27.9
-3%
25.7
6%
Idle max *
27.5
24.9
9%
26.2
5%
35
-27%
28
-2%
25.7
7%
Last avg *
50.9
50.1
2%
42.4
17%
42.2
17%
43.8
14%
47.8
6%
Cyberpunk 2077 ultra *
50.8
50
2%
47.7
6%
40.8
20%
45.4
11%
Last max *
50.9
50.2
1%
47.8
6%
43.9
14%
48.5
5%
49
4%
Witcher 3 ultra *
45.23

* ... kleinere Werte sind besser

Temperatur

Das Gehäuse des Geekom GT1 Mega erwärmt sich im Leerlauf nur geringfügig. Aufgrund des schnell drehenden Lüfters wird die entstehende Wärme unverzüglich aus dem Gehäuse geleitet, was auch unter Last zu geringen Oberflächentemperaturen führt. Der Intel Core Ultra 9 185H erreicht im Stresstest nicht ganz die 100 °C. Im Durchschnitt sinkt die Temperatur in einen unkritischen Bereich. Der Höchstwert wird nur erreicht, sofern das SoC von dem PL2 Gebrauch macht. Über einen längeren Zeitraum kann das Kühlsystem die 45 Watt gut abführen. Aufgrund der größeren Konstruktion des GT1 Mega im Vergleich zu vorherigen Geräten aus dem Hause Geekom ergibt sich leider kein großer Vorteil.

Stresstest Prime95, solo
Stresstest FurMark, solo
Stresstest Prime95 und FurMark
Geekom GT1 Mega beim Stresstest (Oberseite)
Geekom GT1 Mega beim Stresstest (Unterseite)
Geekom GT1 Mega beim Stresstest (Rückseite)
Netzteil während des Stresstests
Max. Last
 31.2 °C32.9 °C32.9 °C 
 28.9 °C30.7 °C30.1 °C 
 29.4 °C29.6 °C29.6 °C 
Maximal: 32.9 °C
Durchschnitt: 30.6 °C
34.3 °C33.6 °C32.2 °C
33 °C36.5 °C30.3 °C
31.6 °C28.8 °C28.8 °C
Maximal: 36.5 °C
Durchschnitt: 32.1 °C
Netzteil (max.)  44.3 °C | Raumtemperatur 21.9 °C | Fluke t3000FC (calibrated)
(+) Die Durchschnittstemperatur auf der Oberseite unter extremer Last ist 30.6 °C. Im Vergleich erhitzte sich der Durchschnitt der Geräteklasse Mini PC auf 32.3 °C.
(+) Die maximale Temperatur auf der Oberseite ist 32.9 °C. Im Vergleich liegt der Klassendurchschnitt bei 35.8 °C (von 24 bis 69.5 °C für die Klasse Mini PC).
(+) Auf der Unterseite messen wir eine maximalen Wert von 36.5 °C (im Vergleich zum Durchschnitt von 36.1 °C).
(+) Ohne Last messen wir eine durchschnittliche Temperatur von 29.7 °C auf der Oberseite. Der Klassendurchschnitt erreicht 32.3 °C.

Energieverwaltung - auf Augenhöhe mit dem Asus NUC 14 Pro

Der Geekom GT1 Mega ist ein sparsamer Mini-PC und beweist dies auch bei unseren Messungen. Schon im Leerlauf ist das Gerät sehr genügsam. Nur der Asus NUC 14 Pro kann mit dem Geekom GT1 Mega mithalten und ähnlich gute Werte erreichen. Unter Last ist unser Testsample mit durchschnittlich 65,8 Watt weiterhin relativ sparsam, wenngleich Spitzen bis zu 105 Watt möglich sind. In der Effizienzübersicht reicht es allerdings nur für den zweiten Platz. Hier kann der Geekom AX8 Pro mit AMD Ryzen 9 8945HS insgesamt besser abschneiden.

Das 120-Watt-Netzteil, welches dem Geekom GT1 Mega mitgeliefert wird, ist uns bei diversen Mini-PCs aus dem Haus Geekom begegnet. Die maximale Leistung ist ausreichend, und genügend Spielraum für einen optionalen zweiten Datenträger ist vorhanden.

Geekom GT1 Mega mit Netzteil (19 V; 6,32 A)
Netzteil (19 V; 6,32 A)
Stromverbrauch
Aus / Standbydarklight 1.35 / 5.4 Watt
Idledarkmidlight 4.1 / 6.6 / 11.3 Watt
Last midlight 65.8 / 104.8 Watt
 color bar
Legende: min: dark, med: mid, max: light        Metrahit Energy
Geekom GT1 Mega
Ultra 9 185H, Arc 8-Core
Geekom AX8 Pro
R9 8945H, Radeon 780M
Asus NUC 14 Pro
Ultra 5 125H, Arc 7-Core
Minisforum UH125 Pro
Ultra 5 125H, Arc 7-Core
Geekom GT13 Pro
i9-13900H, Iris Xe G7 96EUs
Acemagic F2A
Ultra 7 155H, Arc 8-Core
Durchschnittliche Intel Arc 8-Core iGPU
 
Durchschnitt der Klasse Mini PC
 
Stromverbrauch
-74%
-3%
-47%
-34%
-39%
-7%
-47%
Idle min *
4.1
14
-241%
5.1
-24%
11.9
-190%
7.9
-93%
9.1
-122%
5.41 ?(1.8 - 10.3, n=37)
-32%
Idle avg *
6.6
15.9
-141%
6.4
3%
14.6
-121%
10.3
-56%
10.3
-56%
8.64 ?(4.2 - 16, n=37)
-31%
Idle max *
11.3
19.5
-73%
14.7
-30%
15.4
-36%
22.3
-97%
14.4
-27%
12.1 ?(4.5 - 49, n=37)
-7%
Last avg *
65.8
76.4
-16%
55.5
16%
48.3
27%
57.44
13%
54.9
17%
Cyberpunk 2077 ultra external monitor *
69.4
54.3
22%
59.1
15%
52.7
24%
55.9
19%
Last max *
104.8
99.1
5%
103.3
1%
89.8
14%
93.4
11%
110.4
-5%

* ... kleinere Werte sind besser

Effizienzübersicht

Performance Rating - Percent
Geekom AX8 Pro
AMD Ryzen 9 8945H, Radeon 780M
94.7 pt
Geekom GT1 Mega
Intel Core Ultra 9 185H, Arc 8-Core
84 pt
Geekom GT13 Pro
Intel Core i9-13900H, Iris Xe G7 96EUs
81.1 pt
Minisforum UH125 Pro
Intel Core Ultra 5 125H, Arc 7-Core
81 pt
Asus NUC 14 Pro
Intel Core Ultra 5 125H, Arc 7-Core
80.5 pt
Acemagic F2A
Intel Core Ultra 7 155H, Arc 8-Core
78.7 pt
Power Consumption
Cinebench R23 Multi Power Efficiency - external Monitor
Geekom AX8 Pro
AMD Ryzen 9 8945H, Radeon 780M
219 Points per Watt +12%
Geekom GT13 Pro
Intel Core i9-13900H, Iris Xe G7 96EUs
210 Points per Watt +8%
Geekom GT1 Mega
Intel Core Ultra 9 185H, Arc 8-Core
194.8 Points per Watt
Acemagic F2A
Intel Core Ultra 7 155H, Arc 8-Core
183.7 Points per Watt -6%
Minisforum UH125 Pro
Intel Core Ultra 5 125H, Arc 7-Core
181.1 Points per Watt -7%
Asus NUC 14 Pro
Intel Core Ultra 5 125H, Arc 7-Core
163.7 Points per Watt -16%
Cinebench R23 Single Power Efficiency - external Monitor
Asus NUC 14 Pro
Intel Core Ultra 5 125H, Arc 7-Core
69.4 Points per Watt +22%
Geekom AX8 Pro
AMD Ryzen 9 8945H, Radeon 780M
58.3 Points per Watt +3%
Minisforum UH125 Pro
Intel Core Ultra 5 125H, Arc 7-Core
57.1 Points per Watt +1%
Geekom GT1 Mega
Intel Core Ultra 9 185H, Arc 8-Core
56.7 Points per Watt
Geekom GT13 Pro
Intel Core i9-13900H, Iris Xe G7 96EUs
54.3 Points per Watt -4%
Acemagic F2A
Intel Core Ultra 7 155H, Arc 8-Core
54.2 Points per Watt -4%
Cinebench R15 Multi Efficiency (external Monitor)
Geekom AX8 Pro
AMD Ryzen 9 8945H, Radeon 780M
35.9 Points per Watt +23%
Geekom GT1 Mega
Intel Core Ultra 9 185H, Arc 8-Core
29.2 Points per Watt
Minisforum UH125 Pro
Intel Core Ultra 5 125H, Arc 7-Core
28 Points per Watt -4%
Acemagic F2A
Intel Core Ultra 7 155H, Arc 8-Core
26.6 Points per Watt -9%
Geekom GT13 Pro
Intel Core i9-13900H, Iris Xe G7 96EUs
24.8 Points per Watt -15%
Asus NUC 14 Pro
Intel Core Ultra 5 125H, Arc 7-Core
24 Points per Watt -18%

Energieaufnahme mit externem Monitor

0102030405060708090100Tooltip
Geekom GT1 Mega Ultra 9 185H, Arc 8-Core; Idle 1min (external Monitor): Ø6.65 (4.54-11.3)
Geekom AX8 Pro R9 8945H, Radeon 780M; Idle 1min (external Monitor): Ø15.9 (14.3-19.4)
Asus NUC 14 Pro Ultra 5 125H, Arc 7-Core; Idle 1min (external Monitor): Ø6.48 (4.52-12)
Geekom GT1 Mega Ultra 9 185H, Arc 8-Core; 1280x720 Prime95 28.10 and Furmark 1.25: Ø75.4 (64.2-104.8)
Geekom AX8 Pro R9 8945H, Radeon 780M; 1280x720 Prime95 28.10 and Furmark 1.25: Ø89.4 (87.8-94.6)
Asus NUC 14 Pro Ultra 5 125H, Arc 7-Core; 1280x720 Prime95 28.10 and Furmark 1.25: Ø90.8 (85.1-98.5)
Geekom GT1 Mega Ultra 9 185H, Arc 8-Core; Cyberpunk 2077 FHD ultra no FSR (external Monitor): Ø69.4 (66.7-76.7)
Geekom AX8 Pro R9 8945H, Radeon 780M; Cyberpunk 2077 FHD ultra no FSR (external Monitor): Ø54.3 (43.7-67.1)
Asus NUC 14 Pro Ultra 5 125H, Arc 7-Core; Cyberpunk 2077 FHD ultra no FSR (external Monitor): Ø59.1 (55.8-67.9)
Geekom GT1 Mega Ultra 9 185H, Arc 8-Core; 3DMark06 Return To Proxycon: Ø65.8 (59-72.8)
Geekom AX8 Pro R9 8945H, Radeon 780M; 3DMark06 Return To Proxycon: Ø76.5 (55.7-96.2)
Asus NUC 14 Pro Ultra 5 125H, Arc 7-Core; 3DMark06 Return To Proxycon: Ø55.5 (51.2-61.4)

Energieaufnahme mit externem Monitor

0102030405060708090100Tooltip
Geekom GT1 Mega Ultra 9 185H, Arc 8-Core; Prime95 V2810 Stress (external Monitor): Ø75.6 (62.9-104.6)
Geekom AX8 Pro R9 8945H, Radeon 780M; Prime95 V2810 Stress (external Monitor): Ø75.9 (72.6-96)
Asus NUC 14 Pro Ultra 5 125H, Arc 7-Core; Prime95 V2810 Stress (external Monitor): Ø90.6 (79.2-103.3)
Geekom GT1 Mega Ultra 9 185H, Arc 8-Core; Cinebench R15 Multi (external Monitor): Ø95.8 (95-96.5)
Geekom AX8 Pro R9 8945H, Radeon 780M; Cinebench R15 Multi (external Monitor): Ø70.3 (63.2-83)
Asus NUC 14 Pro Ultra 5 125H, Arc 7-Core; Cinebench R15 Multi (external Monitor): Ø89.2 (88-90.9)
Geekom GT1 Mega Ultra 9 185H, Arc 8-Core; Cinebench R23 Single (external Monitor): Ø31.3 (15.7-81.3)
Geekom AX8 Pro R9 8945H, Radeon 780M; Cinebench R23 Single (external Monitor): Ø31 (25.6-51.4)
Asus NUC 14 Pro Ultra 5 125H, Arc 7-Core; Cinebench R23 Single (external Monitor): Ø24.8 (20.8-58)
Geekom GT1 Mega Ultra 9 185H, Arc 8-Core; Cinebench R23 Multi (external Monitor): Ø95.5 (94-96.6)
Geekom AX8 Pro R9 8945H, Radeon 780M; Cinebench R23 Multi (external Monitor): Ø70.9 (66.8-89.8)
Asus NUC 14 Pro Ultra 5 125H, Arc 7-Core; Cinebench R23 Multi (external Monitor): Ø88.7 (86.9-91.6)
Geekom GT1 Mega Ultra 9 185H, Arc 8-Core; 1280x720 FurMark 1.19 GPU Stress Test (external Monitor): Ø58.2 (56.2-74.2)
Geekom AX8 Pro R9 8945H, Radeon 780M; 1280x720 FurMark 1.19 GPU Stress Test (external Monitor): Ø85.7 (73.1-99.9)
Asus NUC 14 Pro Ultra 5 125H, Arc 7-Core; 1280x720 FurMark 1.19 GPU Stress Test (external Monitor): Ø56.9 (53.6-63.3)

Notebookcheck Gesamtbewertung

Der Geekom GT1 Mega überzeugt als leistungsstarker Mini-PC mit vielseitigen Einsatzmöglichkeiten. Dank modernster Hardware und der großzügigen Anschlussvielfalt ist der Mini-PC zukunftssicher. Auf Basis des Intel Core Ultra 9 185H und 32 GB RAM liefert er im Test eine tolle Leistung für Büroanwendungen und meistert auch leistungshungrige Multimedia-Aufgaben. Einziger Nachteil ist die teils laute Kühlung, die bereits bei durchschnittlicher Last deutlich hörbar ist.

Geekom GT1 Mega - 06.11.2024 v8
Sebastian Bade

Gehäuse
87 / 98 → 89%
Konnektivität
74 / 81 → 91%
Gewicht
80%
Leistung Spiele
48 / 80 → 60%
Leistung Anwendungen
84 / 92 → 91%
Workstation
34%
AI Performance
84%
Temperatur
93%
Lautstärke
73%
Durchschnitt
54%
79%
Mini PC - gewichteter Durchschnitt
Weitere Informationen über unsere Bewertung finden Sie hier.
CO2 Emissions
No Data
Materials
25%
Packaging
25%
Power Use
63.4%
Repairability
30%
Software Updates
39%
Recycle Logo Total Sustainability Score: 30.4%

Transparenz

Die Auswahl der zu testenden Geräte erfolgt innerhalb der Redaktion. Das vorliegende Testmuster wurde dem Autor vom Hersteller unentgeltlich zu Testzwecken überlassen. Eine Einflussnahme auf den Testbericht gab es nicht, der Hersteller erhielt keine Version des Reviews vor der Veröffentlichung. Es bestand keine Verpflichtung zur Publikation. Unsere Reviews erfolgen stets ohne Gegenleistung oder Kompensationen. Als eigenständiges, unabhängiges Unternehmen unterliegt Notebookcheck keiner Diktion von Herstellern, Shops und Verlagen.

So testet Notebookcheck

Pro Jahr werden von Notebookcheck hunderte Laptops und Smartphones unabhängig in von uns standardisierten technischen Verfahren getestet, um eine Vergleichbarkeit aller Testergebnisse zu gewährleisten. Seit rund 20 Jahren entwickeln wir diese Testmethoden kontinuierlich weiter und setzen damit Branchenstandards. In unseren Testlaboren kommt ausschließlich hochwertiges Messequipment in die Hände erfahrener Techniker und Redakteure. Die Tests unterliegen einer mehrstufigen Kontrolle. Unsere komplexe Gesamtbewertung basiert auf hunderten fundierten Messergebnissen und Benchmarks, womit Ihnen Objektivität garantiert ist. Weitere Informationen zu unseren Testmethoden gibt es hier.

static version load dynamic
Die Kommentare zum Artikel werden geladen
Diesen Artikel kommentieren / Antworten
Teilen Sie diesen Artikel, um uns zu unterstützen. Jeder Link hilft!
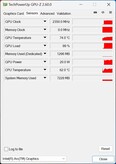
Mail Logo
> Notebook Test, Laptop Test und News > Tests > Notebook Testberichte > Geekom GT1 Mega im Test: Erster KI-Mini-PC von Geekom überzeugt nicht in allen Punkten
Autor: Sebastian Bade,  7.11.2024 (Update:  7.11.2024)