Notebookcheck Logo
Teaser

Asus NUC 14 Pro im Test: NUC-Mini-PC mit Intel Core Ultra 5 125H, schneller Intel-Arc-iGPU und 2x Thunderbolt 4

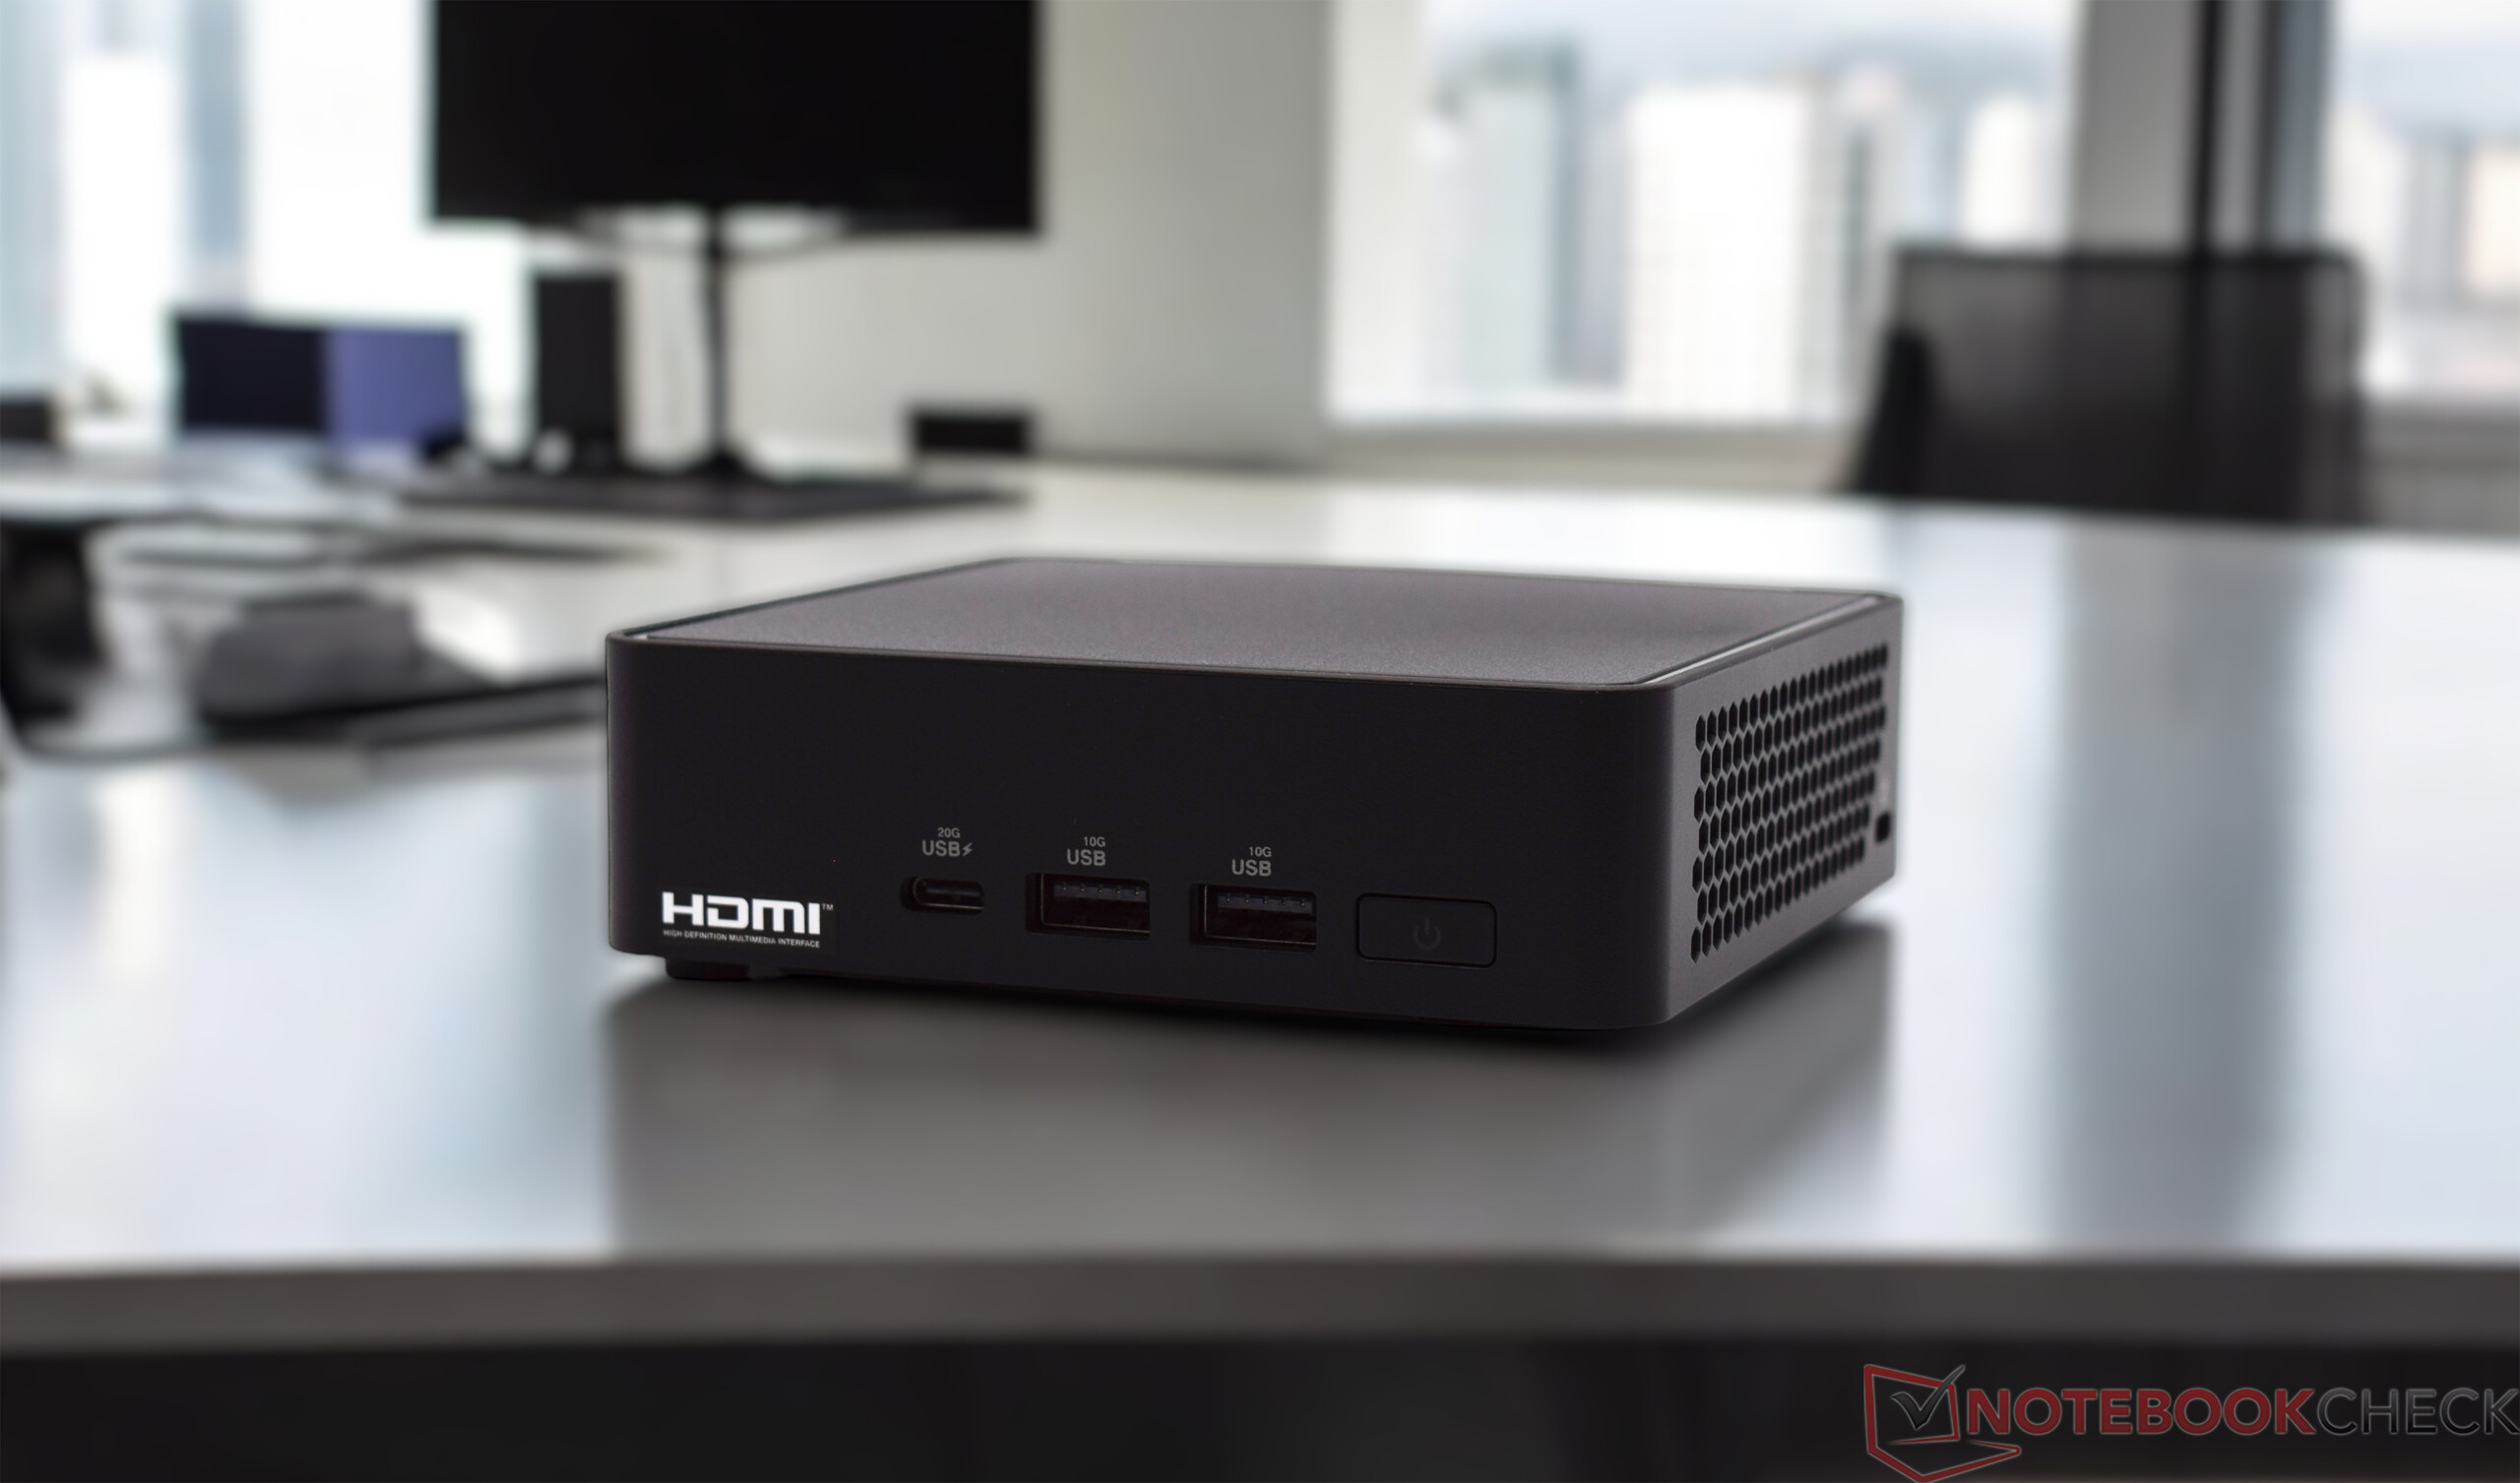
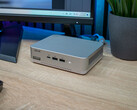
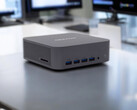
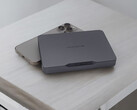
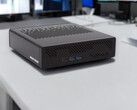
Kein optisches Highlight! Asus hat die NUC-Sparte von Intel übernommen und bietet nunmehr die beliebten Mini-PCs mit Intels Meteor-Lake-Prozessoren an. Damit bekommen die kleinen Desktop-Computer nicht nur mehr CPU-Leistung, sondern können aufgrund der überarbeiteten iGPU deutlich an 3D-Leistung zulegen. Wir haben den Asus NUC 14 Pro mit Intel Core Ultra 5 125H ausführlich getestet und bewerten die Leistung anhand zahlreicher Messungen und Benchmarks.
Sebastian Bade 👁, Stefanie Voigt Veröffentlicht am 🇺🇸 🇫🇷 ...
Mini PC Desktop Intel 3D Printing Meteor Lake Thunderbolt

Die einst durch Intel ins Leben gerufene NUC-Serie (Next Unit of Computing) wurde durch Asus übernommen. Im gleichen Stil bietet Asus nun die bereits bekannten Modelle an, wenngleich auch neuere Geräte Einzug halten. Auf Basis von Intel Meteor Lake erhalten die kompakten Rechenkünstler mehr Leistung und kommen vor allem in den Genuss der überarbeiteten iGPU mit Arc Architektur. Den Asus NUC 14 Pro gibt es mit verschiedenen Prozessoren und wie gewohnt in einer flachen und einer etwas dickeren Variante, welche zusätzlichen Platz für ein 2,5-Zoll-Laufwerk bietet. Im Test hatten wir den Asus NUC 14 Pro in der Slim-Option mit einem Intel Core Ultra 5 125H. Das Gerät erreichte uns als Barebone, womit wir vor der Inbetriebnahme noch RAM und SSD installieren mussten. Auch das Betriebssystem gehört somit nicht zum Lieferumfang. Etwas mehr als 500 Euro muss man für unser Testsample auf den Tisch legen. Im Vergleich zu den Kontrahenten ist das viel, wenn man bedenkt, dass zusätzliche Kosten aufgrund der Barebone-Option anstehen. Verglichen mit den anderen Marken ist Asus bekannter und bietet einen besseren Support.

Die Kontrahenten, gegen die wir den Asus NUC 14 Pro antreten lassen, sind in der folgenden Tabelle aufgelistet.

Asus NUC 14 Pro
Prozessor
Intel Core Ultra 5 125H 14 x 3.6 - 4.5 GHz, 64 W PL2 / Short Burst, 64 W PL1 / Sustained, Meteor Lake-H
Grafikkarte
Intel Arc 7-Core iGPU, Kerntakt: 2200 MHz, 32.0.101.5762 DCH
Mainboard
Intel Meteor Lake-U/P/H PCH
Massenspeicher
Kingston KC3000 2048G SKC3000D2048G, 2048 GB 
, 1750 GB verfügbar
Soundkarte
Intel Meteor Lake-U/P/H PCH - cAVS (Audio, Voice, Speech)
Anschlüsse
1 USB 2.0, 3 USB 3.0 / 3.1 Gen1, 1 USB 3.2 Gen 2x2 20Gbps, 2 USB 4.0 40 Gbps, 2 Thunderbolt, USB-C Power Delivery (PD), 2 HDMI, 2 DisplayPort, 1 Kensington Lock
Netzwerk
Intel Ethernet Controller I226-V (10/2500MBit/s), Intel Wi-Fi 6E AX211 (a/b/g/h/n = Wi-Fi 4/ac = Wi-Fi 5/ax = Wi-Fi 6/ Wi-Fi 6E 6 GHz), Bluetooth 5.3
Abmessungen
Höhe x Breite x Tiefe (in mm): 37 x 117 x 112
Sonstiges
120W power adapter, VESA-Mount, 36 Monate Garantie
Gewicht
525 g, Netzteil: 238 g
Preis
500 EUR
Hinweis: Der Hersteller kann abweichende Bauteile wie Bildschirme, Laufwerke und Speicherriegel mit ähnlichen Spezifikationen unter dem gleichen Modellnamen einsetzen.


Mögliche Konkurrenten im Vergleich

Bew.
Version
Datum
Modell
Gewicht
Dicke
Preis ab
74.7 %v8
08.2024
Asus NUC 14 Pro
Ultra 5 125H, Arc 7-Core
525 g37 mm
78 %v8
07.2024
Geekom AE7
R9 7940HS, Radeon 780M
578 g49.2 mm
74.5 %v8
07.2024
Minisforum UH125 Pro
Ultra 5 125H, Arc 7-Core
797 g49 mm
73.7 %v8
06.2024
Aoostar GEM10
R7 6800H, Radeon 680M
525 g60 mm
83.4 %v7 (old)
04.2024
Acemagic F2A
Ultra 7 155H, Arc 8-Core
768 g57 mm
81.2 %v7 (old)
10.2023
Geekom A5
R7 5800H, Vega 8
555 g49.2 mm

Hinweis: Wir haben unser Rating-System aktualisiert, und die Ergebnisse von Version 8 sind nicht vergleichbar mit den Ergebnissen von Version 7. Weitere Informationen dazu sind hier verfügbar.

Asus NUC 14 Pro
Asus NUC 14 Pro
Asus NUC 14 Pro
Asus NUC 14 Pro
Asus NUC 14 Pro
Asus NUC 14 Pro
Asus NUC 14 Pro
Asus NUC 14 Pro
Asus NUC 14 Pro
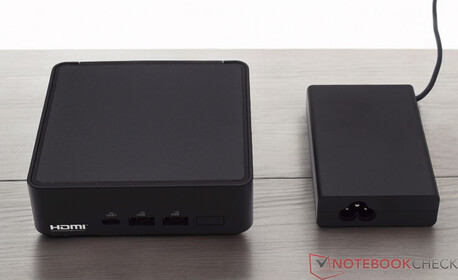
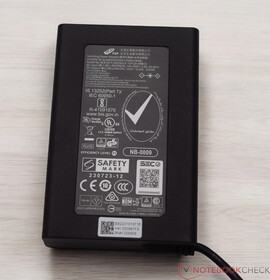
Asus NUC 14 Pro mit Netzteil (19 V; 6,32 A)
Netzteil (19 V; 6,32 A)

Gehäuse - schwarzes Kunststoffkleid umhüllt den Metallkäfig

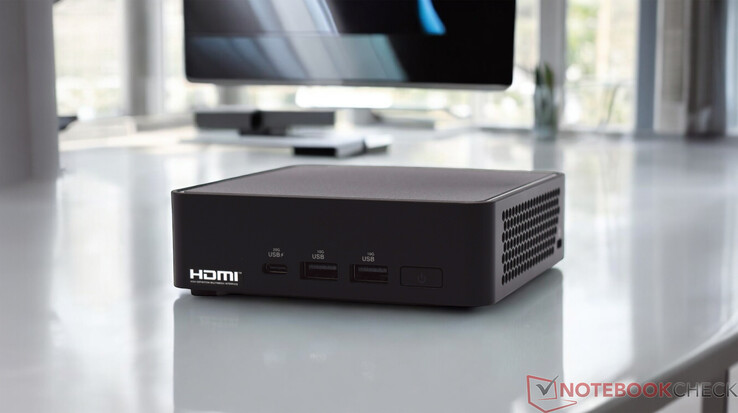
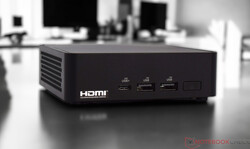
Optisch erinnert der Asus NUC 14 Pro an den Intel NUC 12 Pro Kit, wenngleich das Design etwas überarbeitet wurde. Die Materialauswahl ist allerdings die gleiche. Auch das grundsätzliche Konzept ist unverändert, denn unter dem schwarzen Kunststoff verbirgt sich ein stabiles Metallgestell. Haptisch ist der Asus NUC 14 Pro den Mini-PCs, welche auf ein Aluminiumgehäuse setzen, aber unterlegen. Als optischer Blickfang kann das Gerät von Asus ebenfalls nicht überzeugen, falls einem dies wichtig sein sollte. Die Verarbeitung bietet jedoch keinen Anlass zur Kritik. Überarbeitet wurde hingegen die Unterseite, welche einen mechanischen Verschluss beinhaltet, um das Gerät werkzeuglos zu öffnen. Die Slim-Version, welche wir hier im Test haben, ist mit einer Höhe von 37 Millimetern sehr flach konstruiert. Mit einer fast quadratischen Stellfläche von 11,7 x 11,2 Zentimetern beansprucht das Gerät auf dem Schreibtisch wenig Stellfläche. Die mitgelieferte VESA-Halterung ermöglicht zudem die Montage an einem Monitor.

Größenvergleich

146 mm 146 mm 57 mm 768 g145 mm 145 mm 49 mm 797 g107 mm 107 mm 60 mm 525 g117 mm 112 mm 49.2 mm 578 g117 mm 112 mm 49.2 mm 555 g117 mm 112 mm 37 mm 525 g210 mm 148 mm 1 mm 2.9 g

Ausstattung

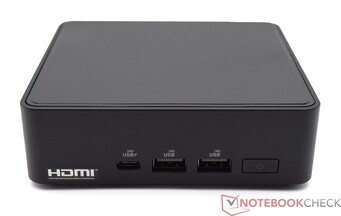
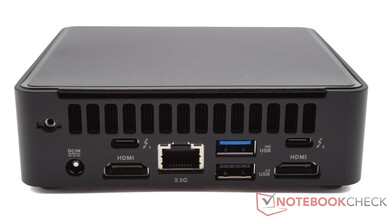
Der Asus NUC 14 Pro Mini-PC bietet trotz der kompakten Bauweise viele Schnittstellen. Insgesamt gibt es sechs USB-Schnittstellen, von denen vier als weitverbreitete TypA-Buchsen und zwei weitere als TypC-Buchsen vorhanden sind. Letztere bieten darüber hinaus vollwertigen Thunderbolt-Support. Damit hebt sich der Asus NUC 14 Pro von den anderen Mini-PCs ab, denn diese bieten oftmals nur einfache USB-4-Buchsen oder lediglich herkömmliche Typ-C-Anschlüsse. Weiterhin gibt es noch zwei HDMI-Ports und einen 2,5G-Netzwerkanschluss.

Vorderseite: 1x USB 3.2 Gen2x2 Type-C, 2 x USB 3.2 Gen2 Type-A
Rückseite: Netzanschluss, 2x Thunderbold (Type C), 1x USB 3.2, 1x USB 2.0, LAN 2,5G, 2x HDMI 2.1

Kommunikation

WLAN-Modul
WLAN-Modul

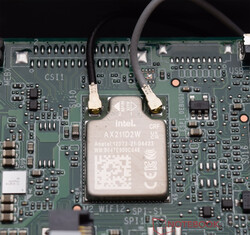
Asus verpasst dem NUC 14 Pro das Intel Wi-Fi 6E AX211 Modul, welches im Test hervorragende Ergebnisse liefert. Im Zusammenspiel mit dem ASUS ROG Rapture GT-AXE11000 Router dokumentieren wir durchweg bessere Ergebnisse als bei den Vergleichsgeräten.

Networking
iperf3 receive AXE11000 6GHz
Acemagic F2A
Intel Wi-Fi 7 BE200 320MHz
1770 (1584min - 1790max) MBit/s +2%
Minisforum UH125 Pro
Intel Wi-Fi 6E AX210
1755 (1737min - 1766max) MBit/s +2%
Asus NUC 14 Pro
Intel Wi-Fi 6E AX211
1729 (1594min - 1755max) MBit/s
Geekom AE7
MediaTek Wi-Fi 6E MT7922 160MHz Wireless LAN Card
1528 (1495min - 1552max) MBit/s -12%
Durchschnittliche Intel Wi-Fi 6E AX211
  (700 - 1857, n=197)
1488 MBit/s -14%
Durchschnitt der Klasse Mini PC
  (684 - 1771, n=54, der letzten 2 Jahre)
1355 MBit/s -22%
iperf3 transmit AXE11000 6GHz
Geekom AE7
MediaTek Wi-Fi 6E MT7922 160MHz Wireless LAN Card
1699 (1590min - 1792max) MBit/s +23%
Acemagic F2A
Intel Wi-Fi 7 BE200 320MHz
1615 (767min - 1670max) MBit/s +17%
Minisforum UH125 Pro
Intel Wi-Fi 6E AX210
1605 (1238min - 1652max) MBit/s +16%
Asus NUC 14 Pro
Intel Wi-Fi 6E AX211
1379 (1299min - 1425max) MBit/s
Durchschnittliche Intel Wi-Fi 6E AX211
  (632 - 1851, n=198)
1369 MBit/s -1%
Durchschnitt der Klasse Mini PC
  (394 - 1800, n=55, der letzten 2 Jahre)
1290 MBit/s -6%
iperf3 receive AXE11000
Durchschnittliche Intel Wi-Fi 6E AX211
  (582 - 1890, n=224)
1387 MBit/s +1%
Asus NUC 14 Pro
Intel Wi-Fi 6E AX211
1379 (1016min - 1613max) MBit/s
Geekom A5
Realtek RTL8852BE
946 (856min - 970max) MBit/s -31%
Minisforum UH125 Pro
Intel Wi-Fi 6E AX210
936 (907min - 946max) MBit/s -32%
Durchschnitt der Klasse Mini PC
  (192.9 - 1796, n=108, der letzten 2 Jahre)
933 MBit/s -32%
Acemagic F2A
Intel Wi-Fi 7 BE200 320MHz
838 (728min - 926max) MBit/s -39%
Geekom AE7
MediaTek Wi-Fi 6E MT7922 160MHz Wireless LAN Card
707 (631min - 811max) MBit/s -49%
Aoostar GEM10
Intel Wi-Fi 6 AX200
451 (228min - 466max) MBit/s -67%
iperf3 transmit AXE11000
Asus NUC 14 Pro
Intel Wi-Fi 6E AX211
1331 (1187min - 1442max) MBit/s
Durchschnittliche Intel Wi-Fi 6E AX211
  (464 - 1861, n=224)
1243 MBit/s -7%
Durchschnitt der Klasse Mini PC
  (184.1 - 1776, n=108, der letzten 2 Jahre)
860 MBit/s -35%
Geekom A5
Realtek RTL8852BE
834 (730min - 861max) MBit/s -37%
Minisforum UH125 Pro
Intel Wi-Fi 6E AX210
758 (727min - 793max) MBit/s -43%
Acemagic F2A
Intel Wi-Fi 7 BE200 320MHz
709 (369min - 977max) MBit/s -47%
Geekom AE7
MediaTek Wi-Fi 6E MT7922 160MHz Wireless LAN Card
573 (145min - 972max) MBit/s -57%
Aoostar GEM10
Intel Wi-Fi 6 AX200
429 (325min - 510max) MBit/s -68%
0501001502002503003504004505005506006507007508008509009501000105011001150120012501300135014001450150015501600165017001750Tooltip
Asus NUC 14 Pro Intel Wi-Fi 6E AX211; iperf3 transmit AXE11000 6GHz; iperf 3.1.3: Ø1379 (1299-1425)
Geekom AE7 MediaTek Wi-Fi 6E MT7922 160MHz Wireless LAN Card; iperf3 transmit AXE11000 6GHz; iperf 3.1.3: Ø1700 (1590-1792)
Minisforum UH125 Pro Intel Wi-Fi 6E AX210; iperf3 transmit AXE11000 6GHz; iperf 3.1.3: Ø1605 (1238-1652)
Acemagic F2A Intel Wi-Fi 7 BE200 320MHz; iperf3 transmit AXE11000 6GHz; iperf 3.1.3: Ø1590 (767-1670)
Asus NUC 14 Pro Intel Wi-Fi 6E AX211; iperf3 receive AXE11000 6GHz; iperf 3.1.3: Ø1728 (1594-1755)
Geekom AE7 MediaTek Wi-Fi 6E MT7922 160MHz Wireless LAN Card; iperf3 receive AXE11000 6GHz; iperf 3.1.3: Ø1527 (1495-1552)
Minisforum UH125 Pro Intel Wi-Fi 6E AX210; iperf3 receive AXE11000 6GHz; iperf 3.1.3: Ø1755 (1737-1766)
Acemagic F2A Intel Wi-Fi 7 BE200 320MHz; iperf3 receive AXE11000 6GHz; iperf 3.1.3: Ø1769 (1584-1790)
Asus NUC 14 Pro Intel Wi-Fi 6E AX211; iperf3 receive AXE11000; iperf 3.1.3: Ø1379 (1016-1613)
Geekom AE7 MediaTek Wi-Fi 6E MT7922 160MHz Wireless LAN Card; iperf3 receive AXE11000; iperf 3.1.3: Ø707 (631-811)
Minisforum UH125 Pro Intel Wi-Fi 6E AX210; iperf3 receive AXE11000; iperf 3.1.3: Ø935 (907-946)
Acemagic F2A Intel Wi-Fi 7 BE200 320MHz; iperf3 receive AXE11000; iperf 3.1.3: Ø838 (728-926)
Asus NUC 14 Pro Intel Wi-Fi 6E AX211; iperf3 transmit AXE11000; iperf 3.1.3: Ø1331 (1187-1442)
Geekom AE7 MediaTek Wi-Fi 6E MT7922 160MHz Wireless LAN Card; iperf3 transmit AXE11000; iperf 3.1.3: Ø558 (145-972)
Minisforum UH125 Pro Intel Wi-Fi 6E AX210; iperf3 transmit AXE11000; iperf 3.1.3: Ø758 (727-793)
Acemagic F2A Intel Wi-Fi 7 BE200 320MHz; iperf3 transmit AXE11000; iperf 3.1.3: Ø695 (369-977)

Zubehör

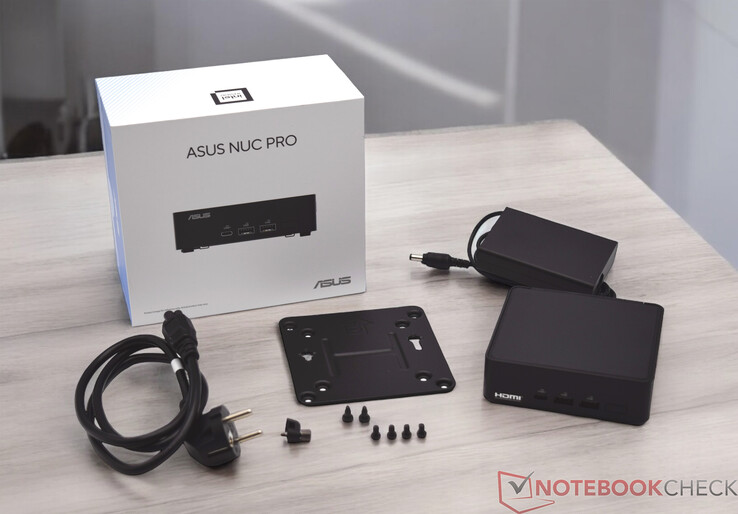
Zum Lieferumfang des Asus NUC 14 Pro gehören das 120-Watt-Netzteil sowie eine VESA-Halterung mit Montagematerial. Weiteres Zubehör wie eine Tastatur oder eine Maus legt der Hersteller nicht bei.

Lieferumfang des Asus NUC 14 Pro

Wartung

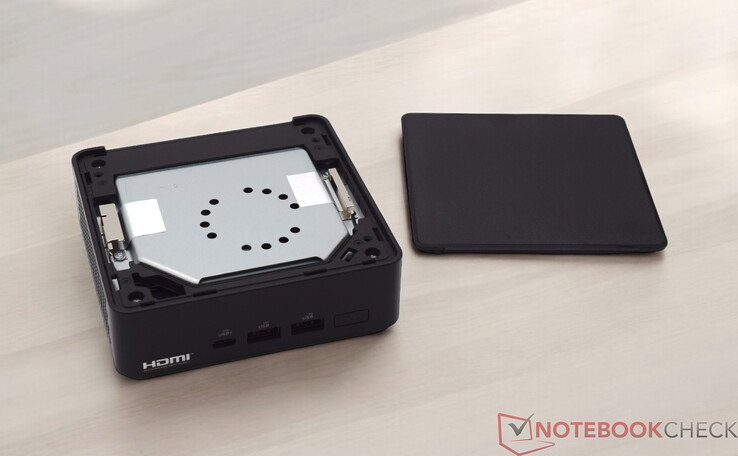
Den Asus NUC 14 Pro haben wir in der Barebone-Variante erhalten, was bedeutete, dass RAM, SSD und das Betriebssystem nicht zum Lieferumfang gehören. Demzufolge ist es wichtig, dass der Nutzer das Gerät leicht öffnen kann, um die fehlenden Bauteile selbst einzubauen. Beim Asus NUC 14 Pro lässt sich die Bodenplatte unkompliziert und ohne Werkzeug entfernen. Hier hat der Hersteller eine kleine mechanische Verriegelung integriert, welche dies ermöglicht: RAM und SSD lassen sich schnell einbauen, und dann ist der Mini-PC schon bereit für den ersten Start. Im Gerät können zwei SSDs verbaut werden, und für den Arbeitsspeicher sind zwei SO-DIMM-Steckplätze vorgesehen. Für den optimalen Betrieb sollten beide SO-DIMM-Slots belegt werden.

Asus NUC 14 Pro ohne Gehäusedeckel
Asus NUC 14 Pro mit geöffneter Unterseite
Platine mit Kühleinheit
Asus NUC 14 Pro zerlegt
Asus NUC 14 Pro ohne Plastikgehäuse
leeres Plastikgehäuse

Nachhaltigkeit

Beim Asus NUC 14 Pro handelt es sich um einen sehr kompakten Mini-PC, welcher im Vergleich zu einem herkömmlichen Desktop-PC deutliche Vorteile beim Thema Energiebedarf hat. Geliefert wird das Gerät in einem kleinen Karton, welcher nicht übermäßig groß ausfällt. Der Mini-PC selbst ist überwiegend aus Metall und Kunststoff gefertigt. Ob bei der Produktion speziell recycelte Materialien für die Herstellung verwendet werden, ist uns nicht bekannt. Lob bekommt Asus für die Garantiedauer von drei Jahren.

Leistung

Der Intel Core Ultra 5 125H ist ein solides und dennoch leistungsstarkes Mittelklasse-SoC aus Intels Meteor-Lake-Serie. Die Vielzahl an physischen Rechenkernen, welches das SoC mitbringt, sorgen schlussendlich für eine gute Multi-Thread-Leistung. Zudem bekommt das Meteor-Lake-SoC eine überarbeitete iGPU, die auf Basis der Arc Architektur spürbar mehr Leistung als die betagten Intel-Iris-Xe-iGPUs der Vorgängerserie bietet. Den Asus NUC 14 Pro kann man ebenso mit einem etwas schwächeren Intel Core 3 100U als auch in einer etwas leistungsstärkeren Variante mit Intel Core Ultra 7 SoC bekommen.

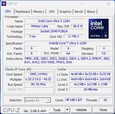
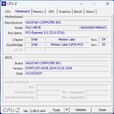
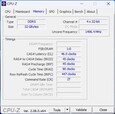
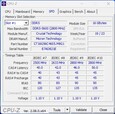
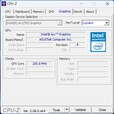
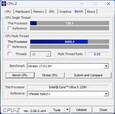
CPU-Z
CPU-Z
CPU-Z
CPU-Z
CPU-Z
CPU-Z
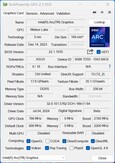
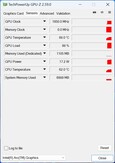
GPU-Z
GPU-Z
HWiNFO

Testbedingungen

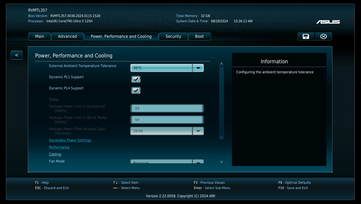
Alle Leistungstests haben wir mit dem Energieprofil Ausgeglichen durchgeführt. Die Leistung des SoC haben wir nicht verändert und gemäß den BIOS-Einstellungen (Balanced) im Auslieferungszustand belassen. Sehr umfangreich fallen die BIOS-Einstellungen aus. Im Vergleich zu den Mini-PCs von Geekom, Minisforum oder Acemagic hat Asus hier deutlich die Nase vorn. Neben der CPU-Leistungsaufnahme lassen sich sogar einzelne USB-Ports deaktivieren.

Prozessor

Der Asus NUC 14 Pro wird in unserem Fall von einem Intel Core Ultra 5 125H angetrieben. 14 Kerne mit zusammen 18 Threads sorgen für ein hohes Arbeitstempo, womit sich unser Testsample auf einem guten dritten Platz einsortiert. Das Leistungslimit des Prozessors beträgt 64 Watt und wird kurzzeitig immer wieder erreicht. Bei längeren Lastszenarien drosselt das SoC nur aufgrund von zu hohen Temperaturen. Diese liegen dann über 100 °C unter Last und sind keine Seltenheit. Hier scheint Asus das Intel SoC nicht weiter einzubremsen, denn gemäß den Spezifikationen ist das SoC mit einer maximalen Betriebstemperatur von 110 °C angegeben. Den direkten Vergleich mit dem Minisforum UH125 Pro gewinnt unser Testsample von Asus. In den Einzeltests kann sich der Asus NUC 14 Pro mit einer durchweg besseren Single-Core-Leistung einen kleinen Vorteil erarbeiten.

Für weitere Vergleiche und Benchmarks verweisen wir auf unsere CPU-Vergleichstabelle.

Cinebench R15
Cinebench R15
Cinebench R20
Cinebench R20
Cinebench R23
Cinebench R23
Cinebench 2024
Cinebench 2024
Performance Rating - Percent
Geekom AE7
AMD Ryzen 9 7940HS
58.2 pt
Acemagic F2A
Intel Core Ultra 7 155H
56.4 pt
Asus NUC 14 Pro
Intel Core Ultra 5 125H
51.9 pt
Aoostar GEM10
AMD Ryzen 7 6800H
51.3 pt
Minisforum UH125 Pro
Intel Core Ultra 5 125H
51.1 pt
Geekom A5
AMD Ryzen 7 5800H
49.5 pt
Cinebench 2024
CPU Multi Core
Acemagic F2A
Intel Core Ultra 7 155H
1022 Points +25%
Geekom AE7
AMD Ryzen 9 7940HS
946 Points +16%
Asus NUC 14 Pro
Intel Core Ultra 5 125H
815 Points
Minisforum UH125 Pro
Intel Core Ultra 5 125H
814 Points 0%
Aoostar GEM10
AMD Ryzen 7 6800H
709 Points -13%
Geekom A5
AMD Ryzen 7 5800H
618 Points -24%
CPU Single Core
Geekom AE7
AMD Ryzen 9 7940HS
108 Points +6%
Acemagic F2A
Intel Core Ultra 7 155H
106 Points +4%
Asus NUC 14 Pro
Intel Core Ultra 5 125H
102 Points
Minisforum UH125 Pro
Intel Core Ultra 5 125H
97 Points -5%
Aoostar GEM10
AMD Ryzen 7 6800H
88 Points -14%
Geekom A5
AMD Ryzen 7 5800H
86 Points -16%
Cinebench R23
Multi Core
Acemagic F2A
Intel Core Ultra 7 155H
18497 Points +27%
Geekom AE7
AMD Ryzen 9 7940HS
16099 Points +11%
Minisforum UH125 Pro
Intel Core Ultra 5 125H
14564 Points 0%
Asus NUC 14 Pro
Intel Core Ultra 5 125H
14516 Points
Aoostar GEM10
AMD Ryzen 7 6800H
13117 Points -10%
Geekom A5
AMD Ryzen 7 5800H
10819 Points -25%
Single Core
Geekom AE7
AMD Ryzen 9 7940HS
1788 Points +4%
Acemagic F2A
Intel Core Ultra 7 155H
1771 Points +3%
Asus NUC 14 Pro
Intel Core Ultra 5 125H
1721 Points
Minisforum UH125 Pro
Intel Core Ultra 5 125H
1640 Points -5%
Aoostar GEM10
AMD Ryzen 7 6800H
1542 Points -10%
Geekom A5
AMD Ryzen 7 5800H
1405 Points -18%
Cinebench R20
CPU (Single Core)
Geekom AE7
AMD Ryzen 9 7940HS
700 Points +13%
Acemagic F2A
Intel Core Ultra 7 155H
679 Points +9%
Minisforum UH125 Pro
Intel Core Ultra 5 125H
629 Points +1%
Asus NUC 14 Pro
Intel Core Ultra 5 125H
622 Points
Aoostar GEM10
AMD Ryzen 7 6800H
598 Points -4%
Geekom A5
AMD Ryzen 7 5800H
551 Points -11%
CPU (Multi Core)
Acemagic F2A
Intel Core Ultra 7 155H
7188 Points +28%
Geekom AE7
AMD Ryzen 9 7940HS
6321 Points +13%
Minisforum UH125 Pro
Intel Core Ultra 5 125H
5618 Points 0%
Asus NUC 14 Pro
Intel Core Ultra 5 125H
5617 Points
Aoostar GEM10
AMD Ryzen 7 6800H
5216 Points -7%
Geekom A5
AMD Ryzen 7 5800H
4229 Points -25%
Cinebench R15
CPU Single 64Bit
Geekom AE7
AMD Ryzen 9 7940HS
281 Points +13%
Acemagic F2A
Intel Core Ultra 7 155H
258 Points +4%
Asus NUC 14 Pro
Intel Core Ultra 5 125H
248 Points
Aoostar GEM10
AMD Ryzen 7 6800H
240 Points -3%
Minisforum UH125 Pro
Intel Core Ultra 5 125H
235 Points -5%
Geekom A5
AMD Ryzen 7 5800H
227 Points -8%
CPU Multi 64Bit
Acemagic F2A
Intel Core Ultra 7 155H
2738 Points +28%
Geekom AE7
AMD Ryzen 9 7940HS
2544 Points +19%
Minisforum UH125 Pro
Intel Core Ultra 5 125H
2245 Points +5%
Asus NUC 14 Pro
Intel Core Ultra 5 125H
2141 Points
Aoostar GEM10
AMD Ryzen 7 6800H
2117 Points -1%
Geekom A5
AMD Ryzen 7 5800H
1773 Points -17%
Cinebench R11.5
CPU Single 64Bit
Geekom AE7
AMD Ryzen 9 7940HS
3.38 Points +12%
Acemagic F2A
Intel Core Ultra 7 155H
3.13 Points +3%
Asus NUC 14 Pro
Intel Core Ultra 5 125H
3.03 Points
Aoostar GEM10
AMD Ryzen 7 6800H
2.86 Points -6%
Minisforum UH125 Pro
Intel Core Ultra 5 125H
2.86 Points -6%
Geekom A5
AMD Ryzen 7 5800H
2.69 Points -11%
CPU Multi 64Bit
Acemagic F2A
Intel Core Ultra 7 155H
33.49 Points +24%
Geekom AE7
AMD Ryzen 9 7940HS
30.49 Points +13%
Minisforum UH125 Pro
Intel Core Ultra 5 125H
27.02 Points 0%
Asus NUC 14 Pro
Intel Core Ultra 5 125H
26.92 Points
Aoostar GEM10
AMD Ryzen 7 6800H
24.57 Points -9%
Geekom A5
AMD Ryzen 7 5800H
21.25 Points -21%
Cinebench R10
Rendering Single CPUs 64Bit
Geekom AE7
AMD Ryzen 9 7940HS
14232 Points +7%
Acemagic F2A
Intel Core Ultra 7 155H
13938 Points +5%
Asus NUC 14 Pro
Intel Core Ultra 5 125H
13281 Points
Minisforum UH125 Pro
Intel Core Ultra 5 125H
12858 Points -3%
Aoostar GEM10
AMD Ryzen 7 6800H
12142 Points -9%
Geekom A5
AMD Ryzen 7 5800H
11378 Points -14%
Rendering Multiple CPUs 64Bit
Acemagic F2A
Intel Core Ultra 7 155H
95005 Points +21%
Geekom AE7
AMD Ryzen 9 7940HS
87296 Points +11%
Minisforum UH125 Pro
Intel Core Ultra 5 125H
78817 Points 0%
Asus NUC 14 Pro
Intel Core Ultra 5 125H
78788 Points
Aoostar GEM10
AMD Ryzen 7 6800H
70792 Points -10%
Geekom A5
AMD Ryzen 7 5800H
62312 Points -21%
Blender - v2.79 BMW27 CPU
Geekom A5
AMD Ryzen 7 5800H
293 Seconds * -29%
Aoostar GEM10
AMD Ryzen 7 6800H
259 Seconds * -14%
Minisforum UH125 Pro
Intel Core Ultra 5 125H
230 Seconds * -1%
Asus NUC 14 Pro
Intel Core Ultra 5 125H
228 Seconds *
Geekom AE7
AMD Ryzen 9 7940HS
197 Seconds * +14%
Acemagic F2A
Intel Core Ultra 7 155H
178 Seconds * +22%
wPrime 2.10
32m
Minisforum UH125 Pro
Intel Core Ultra 5 125H
4.48 s * -9%
Asus NUC 14 Pro
Intel Core Ultra 5 125H
4.107 s *
Geekom A5
AMD Ryzen 7 5800H
3.93 s * +4%
Aoostar GEM10
AMD Ryzen 7 6800H
3.55 s * +14%
Acemagic F2A
Intel Core Ultra 7 155H
3.523 s * +14%
Geekom AE7
AMD Ryzen 9 7940HS
2.699 s * +34%
1024m
Minisforum UH125 Pro
Intel Core Ultra 5 125H
246.982 s * -66%
Asus NUC 14 Pro
Intel Core Ultra 5 125H
148.994 s *
Acemagic F2A
Intel Core Ultra 7 155H
139.617 s * +6%
Geekom A5
AMD Ryzen 7 5800H
111.714 s * +25%
Aoostar GEM10
AMD Ryzen 7 6800H
97.298 s * +35%
Geekom AE7
AMD Ryzen 9 7940HS
96.95 s * +35%
X264 HD Benchmark 4.0
Pass 1
Acemagic F2A
Intel Core Ultra 7 155H
325 (323min - 328max) fps +5%
Asus NUC 14 Pro
Intel Core Ultra 5 125H
308.5 (306min - 311max) fps
Minisforum UH125 Pro
Intel Core Ultra 5 125H
304.5 (304min - 306max) fps -1%
Geekom AE7
AMD Ryzen 9 7940HS
288 (287min - 289max) fps -7%
Aoostar GEM10
AMD Ryzen 7 6800H
251.5 (250min - 256max) fps -18%
Geekom A5
AMD Ryzen 7 5800H
244 (242min - 246max) fps -21%
Pass 2
Acemagic F2A
Intel Core Ultra 7 155H
154.15 (153.8min - 154.3max) fps +17%
Geekom AE7
AMD Ryzen 9 7940HS
144.15 (143.5min - 146.6max) fps +9%
Minisforum UH125 Pro
Intel Core Ultra 5 125H
134 (133.7min - 134.5max) fps +1%
Asus NUC 14 Pro
Intel Core Ultra 5 125H
132.3 (129.2min - 135max) fps
Aoostar GEM10
AMD Ryzen 7 6800H
122.2 (120.3min - 126.1max) fps -8%
Geekom A5
AMD Ryzen 7 5800H
104.65 (104.1min - 106.9max) fps -21%
WinRAR - Result
Acemagic F2A
Intel Core Ultra 7 155H
7723 KB/s +22%
Geekom AE7
AMD Ryzen 9 7940HS
7580 KB/s +20%
Geekom A5
AMD Ryzen 7 5800H
7042 KB/s +12%
Asus NUC 14 Pro
Intel Core Ultra 5 125H
6315 KB/s
Aoostar GEM10
AMD Ryzen 7 6800H
5890 KB/s -7%
Minisforum UH125 Pro
Intel Core Ultra 5 125H
5594 KB/s -11%
TrueCrypt
AES Mean 100MB
Geekom AE7
AMD Ryzen 9 7940HS
15.2 GB/s +73%
Aoostar GEM10
AMD Ryzen 7 6800H
13.5 GB/s +53%
Geekom A5
AMD Ryzen 7 5800H
11.5 GB/s +31%
Acemagic F2A
Intel Core Ultra 7 155H
10.6 GB/s +20%
Minisforum UH125 Pro
Intel Core Ultra 5 125H
9 GB/s +2%
Asus NUC 14 Pro
Intel Core Ultra 5 125H
8.8 GB/s
Twofish Mean 100MB
Geekom AE7
AMD Ryzen 9 7940HS
2.1 GB/s +50%
Aoostar GEM10
AMD Ryzen 7 6800H
1.8 GB/s +29%
Acemagic F2A
Intel Core Ultra 7 155H
1.7 GB/s +21%
Geekom A5
AMD Ryzen 7 5800H
1.6 GB/s +14%
Minisforum UH125 Pro
Intel Core Ultra 5 125H
1.4 GB/s 0%
Asus NUC 14 Pro
Intel Core Ultra 5 125H
1.4 GB/s
Serpent Mean 100MB
Geekom AE7
AMD Ryzen 9 7940HS
1.4 GB/s +61%
Aoostar GEM10
AMD Ryzen 7 6800H
1.2 GB/s +38%
Geekom A5
AMD Ryzen 7 5800H
1 GB/s +15%
Acemagic F2A
Intel Core Ultra 7 155H
1 GB/s +15%
Asus NUC 14 Pro
Intel Core Ultra 5 125H
0.869 GB/s
Minisforum UH125 Pro
Intel Core Ultra 5 125H
0.854 GB/s -2%
Geekbench 5.5
Multi-Core
Acemagic F2A
Intel Core Ultra 7 155H
12662 Points +17%
Geekom AE7
AMD Ryzen 9 7940HS
12228 Points +13%
Asus NUC 14 Pro
Intel Core Ultra 5 125H
10856 Points
Minisforum UH125 Pro
Intel Core Ultra 5 125H
10788 Points -1%
Aoostar GEM10
AMD Ryzen 7 6800H
8898 Points -18%
Geekom A5
AMD Ryzen 7 5800H
8823 Points -19%
Single-Core
Geekom AE7
AMD Ryzen 9 7940HS
1986 Points +18%
Acemagic F2A
Intel Core Ultra 7 155H
1746 Points +4%
Asus NUC 14 Pro
Intel Core Ultra 5 125H
1685 Points
Minisforum UH125 Pro
Intel Core Ultra 5 125H
1593 Points -5%
Aoostar GEM10
AMD Ryzen 7 6800H
1552 Points -8%
Geekom A5
AMD Ryzen 7 5800H
1494 Points -11%
Geekbench 5.0
5.0 Multi-Core
Acemagic F2A
Intel Core Ultra 7 155H
12438 Points +16%
Geekom AE7
AMD Ryzen 9 7940HS
12141 Points +13%
Asus NUC 14 Pro
Intel Core Ultra 5 125H
10747 Points
Minisforum UH125 Pro
Intel Core Ultra 5 125H
10676 Points -1%
Aoostar GEM10
AMD Ryzen 7 6800H
8868 Points -17%
Geekom A5
AMD Ryzen 7 5800H
8568 Points -20%
5.0 Single-Core
Geekom AE7
AMD Ryzen 9 7940HS
1905 Points +15%
Acemagic F2A
Intel Core Ultra 7 155H
1708 Points +3%
Asus NUC 14 Pro
Intel Core Ultra 5 125H
1659 Points
Minisforum UH125 Pro
Intel Core Ultra 5 125H
1596 Points -4%
Aoostar GEM10
AMD Ryzen 7 6800H
1509 Points -9%
Geekom A5
AMD Ryzen 7 5800H
1421 Points -14%
Geekbench 4.4
64 Bit Single-Core Score
Geekom AE7
AMD Ryzen 9 7940HS
8125 Points +17%
Asus NUC 14 Pro
Intel Core Ultra 5 125H
6964 Points
Acemagic F2A
Intel Core Ultra 7 155H
6927 Points -1%
Minisforum UH125 Pro
Intel Core Ultra 5 125H
6734 Points -3%
Aoostar GEM10
AMD Ryzen 7 6800H
6341 Points -9%
Geekom A5
AMD Ryzen 7 5800H
6295 Points -10%
64 Bit Multi-Core Score
Geekom AE7
AMD Ryzen 9 7940HS
49341 Points +27%
Acemagic F2A
Intel Core Ultra 7 155H
45250 Points +17%
Asus NUC 14 Pro
Intel Core Ultra 5 125H
38793 Points
Minisforum UH125 Pro
Intel Core Ultra 5 125H
38648 Points 0%
Aoostar GEM10
AMD Ryzen 7 6800H
35898 Points -7%
Geekom A5
AMD Ryzen 7 5800H
34200 Points -12%
3DMark 11 - 1280x720 Performance Physics
Geekom AE7
AMD Ryzen 9 7940HS
22237 Points +26%
Acemagic F2A
Intel Core Ultra 7 155H
20846 Points +18%
Asus NUC 14 Pro
Intel Core Ultra 5 125H
17624 Points
Minisforum UH125 Pro
Intel Core Ultra 5 125H
17138 Points -3%
Geekom A5
AMD Ryzen 7 5800H
16933 Points -4%
Aoostar GEM10
AMD Ryzen 7 6800H
16034 Points -9%
7-Zip 18.03
7z b 4
Geekom AE7
AMD Ryzen 9 7940HS
71631 MIPS
Acemagic F2A
Intel Core Ultra 7 155H
66438 MIPS
Aoostar GEM10
AMD Ryzen 7 6800H
55067 MIPS
Geekom A5
AMD Ryzen 7 5800H
53954 MIPS
Minisforum UH125 Pro
Intel Core Ultra 5 125H
0 MIPS
Asus NUC 14 Pro
Intel Core Ultra 5 125H
0 MIPS
7z b 4 -mmt1
Geekom AE7
AMD Ryzen 9 7940HS
6661 MIPS +30%
Aoostar GEM10
AMD Ryzen 7 6800H
5521 MIPS +7%
Geekom A5
AMD Ryzen 7 5800H
5486 MIPS +7%
Acemagic F2A
Intel Core Ultra 7 155H
5485 MIPS +7%
Asus NUC 14 Pro
Intel Core Ultra 5 125H
5136 MIPS
Minisforum UH125 Pro
Intel Core Ultra 5 125H
4699 MIPS -9%
HWBOT x265 Benchmark v2.2 - 4k Preset
Geekom AE7
AMD Ryzen 9 7940HS
20.9 fps +33%
Acemagic F2A
Intel Core Ultra 7 155H
19.6 fps +25%
Minisforum UH125 Pro
Intel Core Ultra 5 125H
16.7 fps +6%
Asus NUC 14 Pro
Intel Core Ultra 5 125H
15.7 fps
Aoostar GEM10
AMD Ryzen 7 6800H
14.9 fps -5%
Geekom A5
AMD Ryzen 7 5800H
13.3 fps -15%
R Benchmark 2.5 - Overall mean
Geekom A5
AMD Ryzen 7 5800H
0.523 sec * -5%
Aoostar GEM10
AMD Ryzen 7 6800H
0.515 sec * -3%
Minisforum UH125 Pro
Intel Core Ultra 5 125H
0.513 sec * -3%
Asus NUC 14 Pro
Intel Core Ultra 5 125H
0.4982 sec *
Acemagic F2A
Intel Core Ultra 7 155H
0.4652 sec * +7%
Geekom AE7
AMD Ryzen 9 7940HS
0.4346 sec * +13%
LibreOffice - 20 Documents To PDF
Minisforum UH125 Pro
Intel Core Ultra 5 125H
70.9 s * -27%
Asus NUC 14 Pro
Intel Core Ultra 5 125H
55.7 s *
Geekom A5
AMD Ryzen 7 5800H
54.3 s * +3%
Geekom AE7
AMD Ryzen 9 7940HS
53.7 s * +4%
Aoostar GEM10
AMD Ryzen 7 6800H
51.2 s * +8%
Acemagic F2A
Intel Core Ultra 7 155H
44.5 s * +20%
WebXPRT 3 - Overall
Geekom AE7
AMD Ryzen 9 7940HS
323 Points +27%
Acemagic F2A
Intel Core Ultra 7 155H
276 Points +9%
Aoostar GEM10
AMD Ryzen 7 6800H
275 Points +8%
Geekom A5
AMD Ryzen 7 5800H
269 Points +6%
Minisforum UH125 Pro
Intel Core Ultra 5 125H
254 Points 0%
Asus NUC 14 Pro
Intel Core Ultra 5 125H
254 Points
Mozilla Kraken 1.1 - Total
Geekom A5
AMD Ryzen 7 5800H
653 ms * -15%
Minisforum UH125 Pro
Intel Core Ultra 5 125H
595 ms * -5%
Aoostar GEM10
AMD Ryzen 7 6800H
591 ms * -4%
Asus NUC 14 Pro
Intel Core Ultra 5 125H
567 ms *
Acemagic F2A
Intel Core Ultra 7 155H
535 ms * +6%
Geekom AE7
AMD Ryzen 9 7940HS
510 ms * +10%
3DMark
1920x1080 Fire Strike Physics
Geekom AE7
AMD Ryzen 9 7940HS
26617 Points +16%
Acemagic F2A
Intel Core Ultra 7 155H
25043 Points +10%
Aoostar GEM10
AMD Ryzen 7 6800H
23807 Points +4%
Asus NUC 14 Pro
Intel Core Ultra 5 125H
22863 Points
Geekom A5
AMD Ryzen 7 5800H
22433 Points -2%
Minisforum UH125 Pro
Intel Core Ultra 5 125H
21391 Points -6%
2560x1440 Time Spy CPU
Geekom AE7
AMD Ryzen 9 7940HS
11049 Points +27%
Acemagic F2A
Intel Core Ultra 7 155H
10014 Points +15%
Minisforum UH125 Pro
Intel Core Ultra 5 125H
9182 Points +5%
Asus NUC 14 Pro
Intel Core Ultra 5 125H
8719 Points
Geekom A5
AMD Ryzen 7 5800H
8481 Points -3%
Aoostar GEM10
AMD Ryzen 7 6800H
8128 Points -7%
Super Pi mod 1.5 XS 1M - 1M
Geekom A5
AMD Ryzen 7 5800H
9.415 s * -26%
Aoostar GEM10
AMD Ryzen 7 6800H
7.839 s * -5%
Minisforum UH125 Pro
Intel Core Ultra 5 125H
7.744 s * -4%
Asus NUC 14 Pro
Intel Core Ultra 5 125H
7.444 s *
Acemagic F2A
Intel Core Ultra 7 155H
7.168 s * +4%
Geekom AE7
AMD Ryzen 9 7940HS
7.158 s * +4%
Super Pi mod 1.5 XS 2M - 2M
Geekom A5
AMD Ryzen 7 5800H
20.257 s * -23%
Aoostar GEM10
AMD Ryzen 7 6800H
19.101 s * -16%
Geekom AE7
AMD Ryzen 9 7940HS
17.904 s * -9%
Minisforum UH125 Pro
Intel Core Ultra 5 125H
16.967 s * -3%
Asus NUC 14 Pro
Intel Core Ultra 5 125H
16.446 s *
Acemagic F2A
Intel Core Ultra 7 155H
16.125 s * +2%
Super Pi Mod 1.5 XS 32M - 32M
Aoostar GEM10
AMD Ryzen 7 6800H
694.152 s * -76%
Geekom AE7
AMD Ryzen 9 7940HS
653.976 s * -66%
Geekom A5
AMD Ryzen 7 5800H
472.992 s * -20%
Minisforum UH125 Pro
Intel Core Ultra 5 125H
423.565 s * -7%
Acemagic F2A
Intel Core Ultra 7 155H
394.754 s * -0%
Asus NUC 14 Pro
Intel Core Ultra 5 125H
394.697 s *
Affinity Photo 2 - Combined (Multi CPU)
Acemagic F2A
Intel Core Ultra 7 155H
770 Points +30%
Geekom AE7
AMD Ryzen 9 7940HS
623 Points +5%
Minisforum UH125 Pro
Intel Core Ultra 5 125H
615 Points +4%
Asus NUC 14 Pro
Intel Core Ultra 5 125H
594 Points
Aoostar GEM10
AMD Ryzen 7 6800H
513 Points -14%
Geekom A5
AMD Ryzen 7 5800H
439 Points -26%

* ... kleinere Werte sind besser

Cinebench R10 Rendering Single 32Bit
9561
Cinebench R10 Shading 64Bit
16957 Points
Cinebench R10 Rendering Multiple CPUs 64Bit
78788 Points
Cinebench R10 Rendering Single CPUs 64Bit
13281 Points
Cinebench R10 Shading 32Bit
16752
Cinebench R10 Rendering Multiple CPUs 32Bit
53390
Cinebench R11.5 CPU Multi 32Bit
24.31 Points
Cinebench R11.5 OpenGL 32Bit
101.29 fps
Cinebench R11.5 CPU Single 64Bit
3.03 Points
Cinebench R11.5 CPU Multi 64Bit
26.92 Points
Cinebench R11.5 OpenGL 64Bit
97.61 fps
Cinebench R11.5 CPU Single 32Bit
2.66 Points
Cinebench R15 CPU Single 64Bit
248 Points
Cinebench R15 Ref. Match 64Bit
97.8 %
Cinebench R15 OpenGL 64Bit
145.06 fps
Cinebench R15 CPU Multi 64Bit
2141 Points
Hilfe
Performance Rating
Geekom AE7
AMD Ryzen 9 7940HS, Radeon 780M
97.2 pt
Acemagic F2A
Intel Core Ultra 7 155H, Arc 8-Core
77.3 pt
Aoostar GEM10
AMD Ryzen 7 6800H, Radeon 680M
67.4 pt
Minisforum UH125 Pro
Intel Core Ultra 5 125H, Arc 7-Core
63.1 pt
Asus NUC 14 Pro
Intel Core Ultra 5 125H, Arc 7-Core
62.4 pt
Geekom A5
AMD Ryzen 7 5800H, Vega 8
61.4 pt
Durchschnitt der Klasse Mini PC
 
52.7 pt
AIDA64 / FP32 Ray-Trace
Geekom AE7
AMD Ryzen 9 7940HS, Radeon 780M
26514 KRay/s +99%
Acemagic F2A
Intel Core Ultra 7 155H, Arc 8-Core
17544 KRay/s +31%
Aoostar GEM10
AMD Ryzen 7 6800H, Radeon 680M
13726 KRay/s +3%
Minisforum UH125 Pro
Intel Core Ultra 5 125H, Arc 7-Core
13639 KRay/s +2%
Asus NUC 14 Pro
Intel Core Ultra 5 125H, Arc 7-Core
13347 KRay/s
Geekom A5
AMD Ryzen 7 5800H, Vega 8
12468 KRay/s -7%
Durchschnitt der Klasse Mini PC
  (561 - 51004, n=121, der letzten 2 Jahre)
11617 KRay/s -13%
AIDA64 / FPU Julia
Geekom AE7
AMD Ryzen 9 7940HS, Radeon 780M
112419 Points +64%
Acemagic F2A
Intel Core Ultra 7 155H, Arc 8-Core
88829 Points +30%
Aoostar GEM10
AMD Ryzen 7 6800H, Radeon 680M
86223 Points +26%
Geekom A5
AMD Ryzen 7 5800H, Vega 8
77847 Points +14%
Minisforum UH125 Pro
Intel Core Ultra 5 125H, Arc 7-Core
70880 Points +3%
Asus NUC 14 Pro
Intel Core Ultra 5 125H, Arc 7-Core
68551 Points
Durchschnitt der Klasse Mini PC
  (3604 - 214250, n=121, der letzten 2 Jahre)
59588 Points -13%
AIDA64 / CPU SHA3
Geekom AE7
AMD Ryzen 9 7940HS, Radeon 780M
4898 MB/s +47%
Acemagic F2A
Intel Core Ultra 7 155H, Arc 8-Core
4246 MB/s +28%
Minisforum UH125 Pro
Intel Core Ultra 5 125H, Arc 7-Core
3404 MB/s +2%
Asus NUC 14 Pro
Intel Core Ultra 5 125H, Arc 7-Core
3323 MB/s
Aoostar GEM10
AMD Ryzen 7 6800H, Radeon 680M
2953 MB/s -11%
Geekom A5
AMD Ryzen 7 5800H, Vega 8
2707 MB/s -19%
Durchschnitt der Klasse Mini PC
  (225 - 9399, n=121, der letzten 2 Jahre)
2617 MB/s -21%
AIDA64 / CPU Queen
Geekom AE7
AMD Ryzen 9 7940HS, Radeon 780M
119250 Points +49%
Aoostar GEM10
AMD Ryzen 7 6800H, Radeon 680M
98582 Points +23%
Geekom A5
AMD Ryzen 7 5800H, Vega 8
91846 Points +15%
Acemagic F2A
Intel Core Ultra 7 155H, Arc 8-Core
89748 Points +12%
Asus NUC 14 Pro
Intel Core Ultra 5 125H, Arc 7-Core
79866 Points
Minisforum UH125 Pro
Intel Core Ultra 5 125H, Arc 7-Core
78098 Points -2%
Durchschnitt der Klasse Mini PC
  (8172 - 184747, n=121, der letzten 2 Jahre)
76050 Points -5%
AIDA64 / FPU SinJulia
Geekom AE7
AMD Ryzen 9 7940HS, Radeon 780M
14976 Points +91%
Aoostar GEM10
AMD Ryzen 7 6800H, Radeon 680M
12159 Points +55%
Geekom A5
AMD Ryzen 7 5800H, Vega 8
10972 Points +40%
Acemagic F2A
Intel Core Ultra 7 155H, Arc 8-Core
10247 Points +31%
Durchschnitt der Klasse Mini PC
  (408 - 29064, n=121, der letzten 2 Jahre)
8128 Points +4%
Asus NUC 14 Pro
Intel Core Ultra 5 125H, Arc 7-Core
7851 Points
Minisforum UH125 Pro
Intel Core Ultra 5 125H, Arc 7-Core
7842 Points 0%
AIDA64 / FPU Mandel
Geekom AE7
AMD Ryzen 9 7940HS, Radeon 780M
60098 Points +76%
Aoostar GEM10
AMD Ryzen 7 6800H, Radeon 680M
47463 Points +39%
Acemagic F2A
Intel Core Ultra 7 155H, Arc 8-Core
45718 Points +34%
Geekom A5
AMD Ryzen 7 5800H, Vega 8
42543 Points +24%
Minisforum UH125 Pro
Intel Core Ultra 5 125H, Arc 7-Core
35321 Points +3%
Asus NUC 14 Pro
Intel Core Ultra 5 125H, Arc 7-Core
34225 Points
Durchschnitt der Klasse Mini PC
  (1958 - 113499, n=121, der letzten 2 Jahre)
31212 Points -9%
AIDA64 / CPU AES
Geekom AE7
AMD Ryzen 9 7940HS, Radeon 780M
167583 MB/s +161%
Acemagic F2A
Intel Core Ultra 7 155H, Arc 8-Core
144741 MB/s +126%
Aoostar GEM10
AMD Ryzen 7 6800H, Radeon 680M
119681 MB/s +87%
Geekom A5
AMD Ryzen 7 5800H, Vega 8
108262 MB/s +69%
Durchschnitt der Klasse Mini PC
  (3691 - 325960, n=121, der letzten 2 Jahre)
83023 MB/s +30%
Minisforum UH125 Pro
Intel Core Ultra 5 125H, Arc 7-Core
65304 MB/s +2%
Asus NUC 14 Pro
Intel Core Ultra 5 125H, Arc 7-Core
64107 MB/s
AIDA64 / CPU ZLib
Acemagic F2A
Intel Core Ultra 7 155H, Arc 8-Core
1183 MB/s +22%
Geekom AE7
AMD Ryzen 9 7940HS, Radeon 780M
1015 MB/s +5%
Minisforum UH125 Pro
Intel Core Ultra 5 125H, Arc 7-Core
994 MB/s +3%
Asus NUC 14 Pro
Intel Core Ultra 5 125H, Arc 7-Core
969 MB/s
Aoostar GEM10
AMD Ryzen 7 6800H, Radeon 680M
757 MB/s -22%
Geekom A5
AMD Ryzen 7 5800H, Vega 8
700 MB/s -28%
Durchschnitt der Klasse Mini PC
  (74.8 - 2039, n=121, der letzten 2 Jahre)
673 MB/s -31%
AIDA64 / FP64 Ray-Trace
Geekom AE7
AMD Ryzen 9 7940HS, Radeon 780M
14162 KRay/s +109%
Acemagic F2A
Intel Core Ultra 7 155H, Arc 8-Core
9284 KRay/s +37%
Aoostar GEM10
AMD Ryzen 7 6800H, Radeon 680M
7279 KRay/s +7%
Minisforum UH125 Pro
Intel Core Ultra 5 125H, Arc 7-Core
7221 KRay/s +6%
Asus NUC 14 Pro
Intel Core Ultra 5 125H, Arc 7-Core
6786 KRay/s
Geekom A5
AMD Ryzen 7 5800H, Vega 8
6380 KRay/s -6%
Durchschnitt der Klasse Mini PC
  (308 - 26952, n=121, der letzten 2 Jahre)
6213 KRay/s -8%
AIDA64 / CPU PhotoWorxx
Asus NUC 14 Pro
Intel Core Ultra 5 125H, Arc 7-Core
47377 MPixel/s
Minisforum UH125 Pro
Intel Core Ultra 5 125H, Arc 7-Core
45789 MPixel/s -3%
Geekom AE7
AMD Ryzen 9 7940HS, Radeon 780M
40690 MPixel/s -14%
Acemagic F2A
Intel Core Ultra 7 155H, Arc 8-Core
33092 MPixel/s -30%
Durchschnitt der Klasse Mini PC
  (4408 - 50500, n=121, der letzten 2 Jahre)
26668 MPixel/s -44%
Aoostar GEM10
AMD Ryzen 7 6800H, Radeon 680M
26496 MPixel/s -44%
Geekom A5
AMD Ryzen 7 5800H, Vega 8
25113 MPixel/s -47%

Cinebench R15 Multi Dauertest

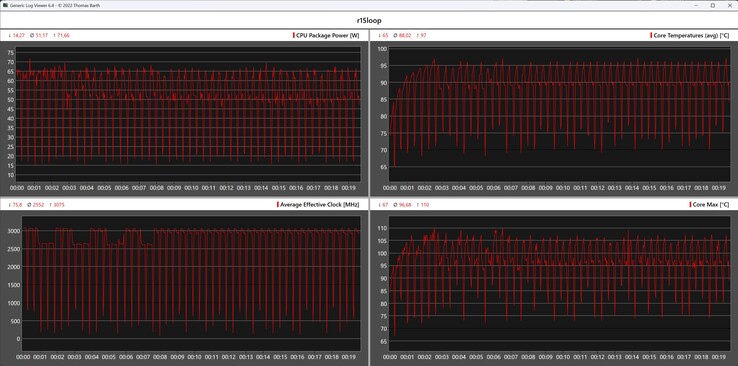
Die etwas bessere CPU-Leistung im Vergleich zum Minisforum UH125 Pro kann der Asus NUC 14 Pro bei der Cinebench-R15-Dauerschleife leider nicht aufrechterhalten. Die erhöhten CPU-Temperaturen sorgen immer wieder für kurzzeitige Leistungseinbrüche, weshalb die Ergebnisse nicht sehr konstant sind. Mit durchschnittlich 2.021 Punkten kann der Asus NUC 14 Pro den Minisforum UH125 Pro nicht schlagen.

CPU-Metrik während der Cinebench-R15-Schleife
01452904355807258701015116013051450159517401885203021752320246526102755Tooltip
Asus NUC 14 Pro Intel Core Ultra 5 125H, Intel Core Ultra 5 125H: Ø2021 (1900.15-2203.13)
Geekom AE7 AMD Ryzen 9 7940HS, AMD Ryzen 9 7940HS: Ø2563 (2486.79-2630.54)
Minisforum UH125 Pro Intel Core Ultra 5 125H, Intel Core Ultra 5 125H: Ø2186 (2040.4-2248.33)
Aoostar GEM10 AMD Ryzen 7 6800H, AMD Ryzen 7 6800H: Ø1983 (1919.75-2106.82)
Acemagic F2A Intel Core Ultra 7 155H, Intel Core Ultra 7 155H: Ø2759 (2690.7-2800.92)
Geekom A5 AMD Ryzen 7 5800H, AMD Ryzen 7 5800H: Ø1715 (1692.05-1838.74)

System Performance

Die Systemleistung spiegelt genau das wider, was auf Basis des Intel Core Ultra 5 125H zu erwarten ist. Auf Basis des gleichen SoC ist der Minisforum UH125 Pro der Hauptkonkurrent und liefert eine ähnliche Performance wie der Asus NUC 14 Pro. Subjektiv liefert der Asus NUC 14 Pro eine hervorragende Alltagsleistung und bei den RAM-Tests kann sich unser Testsample den zweiten Platz sichern.

PCMark 10 / Score
Geekom AE7, AMD Ryzen 9 7940HS
AMD Radeon 780M, Wodposit NVMe SSD 1024 GB
7520 Points +20%
Acemagic F2A, Intel Core Ultra 7 155H
Intel Arc 8-Core iGPU, Kingston OM8SEP1024Q-A0
7120 Points +13%
Aoostar GEM10, AMD Ryzen 7 6800H
AMD Radeon 680M, BIWIN CE980Y28900-1TB
6749 Points +7%
Asus NUC 14 Pro, Intel Core Ultra 5 125H
Intel Arc 7-Core iGPU, Kingston KC3000 2048G SKC3000D2048G
6282 Points
Minisforum UH125 Pro, Intel Core Ultra 5 125H
Intel Arc 7-Core iGPU, Kingston OM8PGP41024Q-A0
6194 Points -1%
Geekom A5, AMD Ryzen 7 5800H
AMD Radeon RX Vega 8 (Ryzen 4000/5000), Lexar NM620 512GB
6149 Points -2%
PCMark 10 / Essentials
Acemagic F2A, Intel Core Ultra 7 155H
Intel Arc 8-Core iGPU, Kingston OM8SEP1024Q-A0
11125 Points +11%
Geekom AE7, AMD Ryzen 9 7940HS
AMD Radeon 780M, Wodposit NVMe SSD 1024 GB
11058 Points +10%
Aoostar GEM10, AMD Ryzen 7 6800H
AMD Radeon 680M, BIWIN CE980Y28900-1TB
10522 Points +5%
Geekom A5, AMD Ryzen 7 5800H
AMD Radeon RX Vega 8 (Ryzen 4000/5000), Lexar NM620 512GB
10356 Points +3%
Asus NUC 14 Pro, Intel Core Ultra 5 125H
Intel Arc 7-Core iGPU, Kingston KC3000 2048G SKC3000D2048G
10050 Points
Minisforum UH125 Pro, Intel Core Ultra 5 125H
Intel Arc 7-Core iGPU, Kingston OM8PGP41024Q-A0
9427 Points -6%
PCMark 10 / Productivity
Geekom AE7, AMD Ryzen 9 7940HS
AMD Radeon 780M, Wodposit NVMe SSD 1024 GB
10717 Points +52%
Aoostar GEM10, AMD Ryzen 7 6800H
AMD Radeon 680M, BIWIN CE980Y28900-1TB
9367 Points +33%
Geekom A5, AMD Ryzen 7 5800H
AMD Radeon RX Vega 8 (Ryzen 4000/5000), Lexar NM620 512GB
9311 Points +32%
Acemagic F2A, Intel Core Ultra 7 155H
Intel Arc 8-Core iGPU, Kingston OM8SEP1024Q-A0
8901 Points +26%
Minisforum UH125 Pro, Intel Core Ultra 5 125H
Intel Arc 7-Core iGPU, Kingston OM8PGP41024Q-A0
7715 Points +10%
Asus NUC 14 Pro, Intel Core Ultra 5 125H
Intel Arc 7-Core iGPU, Kingston KC3000 2048G SKC3000D2048G
7042 Points
CrossMark / Overall
Geekom AE7, AMD Ryzen 9 7940HS
AMD Radeon 780M, Wodposit NVMe SSD 1024 GB
1813 Points +19%
Acemagic F2A, Intel Core Ultra 7 155H
Intel Arc 8-Core iGPU, Kingston OM8SEP1024Q-A0
1802 Points +18%
Aoostar GEM10, AMD Ryzen 7 6800H
AMD Radeon 680M, BIWIN CE980Y28900-1TB
1648 Points +8%
Minisforum UH125 Pro, Intel Core Ultra 5 125H
Intel Arc 7-Core iGPU, Kingston OM8PGP41024Q-A0
1533 Points +1%
Asus NUC 14 Pro, Intel Core Ultra 5 125H
Intel Arc 7-Core iGPU, Kingston KC3000 2048G SKC3000D2048G
1522 Points
Geekom A5, AMD Ryzen 7 5800H
AMD Radeon RX Vega 8 (Ryzen 4000/5000), Lexar NM620 512GB
1429 Points -6%
CrossMark / Responsiveness
Acemagic F2A, Intel Core Ultra 7 155H
Intel Arc 8-Core iGPU, Kingston OM8SEP1024Q-A0
1700 Points +45%
Aoostar GEM10, AMD Ryzen 7 6800H
AMD Radeon 680M, BIWIN CE980Y28900-1TB
1566 Points +34%
Geekom AE7, AMD Ryzen 9 7940HS
AMD Radeon 780M, Wodposit NVMe SSD 1024 GB
1527 Points +30%
Minisforum UH125 Pro, Intel Core Ultra 5 125H
Intel Arc 7-Core iGPU, Kingston OM8PGP41024Q-A0
1332 Points +14%
Geekom A5, AMD Ryzen 7 5800H
AMD Radeon RX Vega 8 (Ryzen 4000/5000), Lexar NM620 512GB
1233 Points +5%
Asus NUC 14 Pro, Intel Core Ultra 5 125H
Intel Arc 7-Core iGPU, Kingston KC3000 2048G SKC3000D2048G
1171 Points
CrossMark / Creativity
Geekom AE7, AMD Ryzen 9 7940HS
AMD Radeon 780M, Wodposit NVMe SSD 1024 GB
2011 Points +14%
Acemagic F2A, Intel Core Ultra 7 155H
Intel Arc 8-Core iGPU, Kingston OM8SEP1024Q-A0
1929 Points +9%
Asus NUC 14 Pro, Intel Core Ultra 5 125H
Intel Arc 7-Core iGPU, Kingston KC3000 2048G SKC3000D2048G
1765 Points
Aoostar GEM10, AMD Ryzen 7 6800H
AMD Radeon 680M, BIWIN CE980Y28900-1TB
1696 Points -4%
Minisforum UH125 Pro, Intel Core Ultra 5 125H
Intel Arc 7-Core iGPU, Kingston OM8PGP41024Q-A0
1683 Points -5%
Geekom A5, AMD Ryzen 7 5800H
AMD Radeon RX Vega 8 (Ryzen 4000/5000), Lexar NM620 512GB
1523 Points -14%
CrossMark / Productivity
Geekom AE7, AMD Ryzen 9 7940HS
AMD Radeon 780M, Wodposit NVMe SSD 1024 GB
1731 Points +21%
Acemagic F2A, Intel Core Ultra 7 155H
Intel Arc 8-Core iGPU, Kingston OM8SEP1024Q-A0
1717 Points +20%
Aoostar GEM10, AMD Ryzen 7 6800H
AMD Radeon 680M, BIWIN CE980Y28900-1TB
1629 Points +14%
Minisforum UH125 Pro, Intel Core Ultra 5 125H
Intel Arc 7-Core iGPU, Kingston OM8PGP41024Q-A0
1463 Points +2%
Asus NUC 14 Pro, Intel Core Ultra 5 125H
Intel Arc 7-Core iGPU, Kingston KC3000 2048G SKC3000D2048G
1432 Points
Geekom A5, AMD Ryzen 7 5800H
AMD Radeon RX Vega 8 (Ryzen 4000/5000), Lexar NM620 512GB
1408 Points -2%
AIDA64 / Memory Copy
Minisforum UH125 Pro
Intel Core Ultra 5 125H, Arc 7-Core
69592 MB/s 0%
Asus NUC 14 Pro
Intel Core Ultra 5 125H, Arc 7-Core
69264 MB/s
Geekom AE7
AMD Ryzen 9 7940HS, Radeon 780M
68449 MB/s -1%
Acemagic F2A
Intel Core Ultra 7 155H, Arc 8-Core
62397 MB/s -10%
Aoostar GEM10
AMD Ryzen 7 6800H, Radeon 680M
50829 MB/s -27%
Durchschnitt der Klasse Mini PC
  (6481 - 76462, n=121, der letzten 2 Jahre)
45817 MB/s -34%
Geekom A5
AMD Ryzen 7 5800H, Vega 8
43870 MB/s -37%
AIDA64 / Memory Read
Asus NUC 14 Pro
Intel Core Ultra 5 125H, Arc 7-Core
74415 MB/s
Minisforum UH125 Pro
Intel Core Ultra 5 125H, Arc 7-Core
72711 MB/s -2%
Acemagic F2A
Intel Core Ultra 7 155H, Arc 8-Core
64323 MB/s -14%
Geekom AE7
AMD Ryzen 9 7940HS, Radeon 780M
61836 MB/s -17%
Durchschnitt der Klasse Mini PC
  (6914 - 83287, n=121, der letzten 2 Jahre)
46245 MB/s -38%
Geekom A5
AMD Ryzen 7 5800H, Vega 8
46241 MB/s -38%
Aoostar GEM10
AMD Ryzen 7 6800H, Radeon 680M
43828 MB/s -41%
AIDA64 / Memory Write
Geekom AE7
AMD Ryzen 9 7940HS, Radeon 780M
87118 MB/s +20%
Asus NUC 14 Pro
Intel Core Ultra 5 125H, Arc 7-Core
72443 MB/s
Minisforum UH125 Pro
Intel Core Ultra 5 125H, Arc 7-Core
71514 MB/s -1%
Acemagic F2A
Intel Core Ultra 7 155H, Arc 8-Core
65057 MB/s -10%
Aoostar GEM10
AMD Ryzen 7 6800H, Radeon 680M
51116 MB/s -29%
Durchschnitt der Klasse Mini PC
  (6862 - 89318, n=121, der letzten 2 Jahre)
49957 MB/s -31%
Geekom A5
AMD Ryzen 7 5800H, Vega 8
46407 MB/s -36%
AIDA64 / Memory Latency
Minisforum UH125 Pro
Intel Core Ultra 5 125H, Arc 7-Core
184.8 ns * -45%
Acemagic F2A
Intel Core Ultra 7 155H, Arc 8-Core
149 ns * -17%
Asus NUC 14 Pro
Intel Core Ultra 5 125H, Arc 7-Core
127.3 ns *
Aoostar GEM10
AMD Ryzen 7 6800H, Radeon 680M
104.1 ns * +18%
Geekom AE7
AMD Ryzen 9 7940HS, Radeon 780M
90 ns * +29%
Durchschnitt der Klasse Mini PC
  (44.9 - 184.8, n=121, der letzten 2 Jahre)
89.9 ns * +29%
Geekom A5
AMD Ryzen 7 5800H, Vega 8
81.4 ns * +36%

* ... kleinere Werte sind besser

UL Procyon AI Inference for Windows
Overall Score Integer NPU
Asus NUC 14 Pro
Intel Core Ultra 5 125H, Arc 7-Core
508 Points
Minisforum UH125 Pro
Intel Core Ultra 5 125H, Arc 7-Core
501 Points -1%
Acemagic F2A
Intel Core Ultra 7 155H, Arc 8-Core
499 Points -2%
Overall Score Integer GPU
Asus NUC 14 Pro
Intel Core Ultra 5 125H, Arc 7-Core
741 Points
Acemagic F2A
Intel Core Ultra 7 155H, Arc 8-Core
684 Points -8%
Minisforum UH125 Pro
Intel Core Ultra 5 125H, Arc 7-Core
547 Points -26%

DPC-Latenzen

Bei den DPC-Latenzen kann der Asus NUC 14 Pro nicht überzeugen. Schon beim einfachen Surfen im Internet sehen wir hohe Werte, welche sich durch die Wiedergabe des 4K-Testvideos nochmals verschlechtern. Zukünftige BIOS- oder Treiber-Updates könnten hier zukünftig für Verbesserungen sorgen.

Maximale Latenz beim Öffnen mehrerer Browser-Tabs
Maximale Latenz beim Abspielen von 4K-Videomaterial
Maximale Latenz nach zehn Sekunden Prime95
Treiber nach längster Ausführungsdauer gereiht
DPC Latencies / LatencyMon - interrupt to process latency (max), Web, Youtube, Prime95
Asus NUC 14 Pro
Arc 7-Core, Ultra 5 125H, Kingston KC3000 2048G SKC3000D2048G
2776 μs *
Acemagic F2A
Arc 8-Core, Ultra 7 155H, Kingston OM8SEP1024Q-A0
2724 μs * +2%
Geekom AE7
Radeon 780M, R9 7940HS, Wodposit NVMe SSD 1024 GB
2198.8 μs * +21%
Minisforum UH125 Pro
Arc 7-Core, Ultra 5 125H, Kingston OM8PGP41024Q-A0
1438 μs * +48%
Geekom A5
Vega 8, R7 5800H, Lexar NM620 512GB
1310.5 μs * +53%
Aoostar GEM10
Radeon 680M, R7 6800H, BIWIN CE980Y28900-1TB
962.8 μs * +65%

* ... kleinere Werte sind besser

Massenspeicher

Test-SSD von Kingston

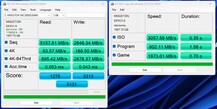
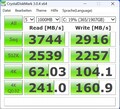
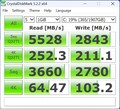
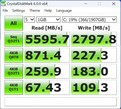
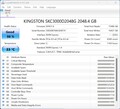
Das Testgerät haben wir mit einer Kingston-KC3000-SSD ausgestattet. Die theoretische Leistung der SSD kann in der Praxis nicht erreicht werden. Dennoch verzeichnen wir vergleichsweise gute Ergebnisse, welche in Summe einen guten dritten Platz bedeuten. Leichte Probleme zeigen sich beim Stresstest: In Kombination mit der verwendeten Kingston SC3000 kann die Leseleistung nicht dauerhaft auf demselben Niveau gehalten werden.

Für weitere Vergleiche und Benchmarks sehen Sie sich bitte unsere Vergleichstabelle an.

AS SSD
AS SSD
CDM 3
CDM 3
CDM 5
CDM 5
CDM 6
CDM 6
CDI
CDI
Kingston KC3000 2048G SKC3000D2048G
Sequential Read: 3744 MB/s
Sequential Write: 2916 MB/s
512K Read: 2539 MB/s
512K Write: 2257 MB/s
4K Read: 62.03 MB/s
4K Write: 104.1 MB/s
4K QD32 Read: 241 MB/s
4K QD32 Write: 160.9 MB/s
Drive Performance Rating - Percent
Aoostar GEM10
BIWIN CE980Y28900-1TB
86.9 pt
Geekom AE7
Wodposit NVMe SSD 1024 GB
76.3 pt
Asus NUC 14 Pro
Kingston KC3000 2048G SKC3000D2048G
70.7 pt
Minisforum UH125 Pro
Kingston OM8PGP41024Q-A0
59.8 pt
Acemagic F2A
Kingston OM8SEP1024Q-A0
59.2 pt
Geekom A5
Lexar NM620 512GB
59 pt
Durchschnitt der Klasse Mini PC
 
56.1 pt
DiskSpd
seq read
Aoostar GEM10
BIWIN CE980Y28900-1TB
4000 (3961.36min - 3999.66max) MB/s +8%
Asus NUC 14 Pro
Kingston KC3000 2048G SKC3000D2048G
3706 (3594.04min - 3706.37max) MB/s
Geekom AE7
Wodposit NVMe SSD 1024 GB
2411 (2346.63min - 2410.89max) MB/s -35%
Geekom A5
Lexar NM620 512GB
2371 (2315.68min - 2370.91max) MB/s -36%
Minisforum UH125 Pro
Kingston OM8PGP41024Q-A0
2351 (2320.68min - 2350.61max) MB/s -37%
Durchschnitt der Klasse Mini PC
  (233 - 4357, n=120, der letzten 2 Jahre)
2199 MB/s -41%
Acemagic F2A
Kingston OM8SEP1024Q-A0
1674 (1242.56min - 1673.54max) MB/s -55%
seq write
Aoostar GEM10
BIWIN CE980Y28900-1TB
4553 (4417.86min - 4552.92max) MB/s +55%
Geekom AE7
Wodposit NVMe SSD 1024 GB
3650 (3239.07min - 3649.71max) MB/s +25%
Minisforum UH125 Pro
Kingston OM8PGP41024Q-A0
3331 (3244.92min - 3330.75max) MB/s +14%
Asus NUC 14 Pro
Kingston KC3000 2048G SKC3000D2048G
2928 (1958.53min - 2927.62max) MB/s
Geekom A5
Lexar NM620 512GB
2668 (292.6min - 2668max) MB/s -9%
Durchschnitt der Klasse Mini PC
  (222 - 5595, n=120, der letzten 2 Jahre)
2309 MB/s -21%
Acemagic F2A
Kingston OM8SEP1024Q-A0
1348 (1117.85min - 1347.87max) MB/s -54%
seq q8 t1 read
Asus NUC 14 Pro
Kingston KC3000 2048G SKC3000D2048G
7110 (6058.21min - 7110.02max) MB/s
Geekom AE7
Wodposit NVMe SSD 1024 GB
4939 (4360.49min - 4938.56max) MB/s -31%
Aoostar GEM10
BIWIN CE980Y28900-1TB
4878 (4476.29min - 4877.98max) MB/s -31%
Minisforum UH125 Pro
Kingston OM8PGP41024Q-A0
4802 (4169.19min - 4801.68max) MB/s -32%
Durchschnitt der Klasse Mini PC
  (236 - 8430, n=120, der letzten 2 Jahre)
3524 MB/s -50%
Geekom A5
Lexar NM620 512GB
3444 (2979.63min - 3443.98max) MB/s -52%
Acemagic F2A
Kingston OM8SEP1024Q-A0
3194 (2810.81min - 3194.17max) MB/s -55%
seq q8 t1 write
Asus NUC 14 Pro
Kingston KC3000 2048G SKC3000D2048G
4712 (3064.99min - 4711.88max) MB/s
Aoostar GEM10
BIWIN CE980Y28900-1TB
4505 (4403.81min - 4505.09max) MB/s -4%
Geekom AE7
Wodposit NVMe SSD 1024 GB
4273 (4238.26min - 4272.58max) MB/s -9%
Minisforum UH125 Pro
Kingston OM8PGP41024Q-A0
3902 (3839.68min - 3901.75max) MB/s -17%
Geekom A5
Lexar NM620 512GB
3117 (3075.4min - 3117.21max) MB/s -34%
Durchschnitt der Klasse Mini PC
  (228 - 6669, n=120, der letzten 2 Jahre)
2587 MB/s -45%
Acemagic F2A
Kingston OM8SEP1024Q-A0
2212 (1222.43min - 2212.27max) MB/s -53%
4k q1 t1 read
Aoostar GEM10
BIWIN CE980Y28900-1TB
61.7 (61.26min - 61.71max) MB/s +16%
Minisforum UH125 Pro
Kingston OM8PGP41024Q-A0
60 (58.44min - 60.02max) MB/s +12%
Geekom A5
Lexar NM620 512GB
54.5 (37.15min - 54.54max) MB/s +2%
Durchschnitt der Klasse Mini PC
  (5.67 - 86.6, n=120, der letzten 2 Jahre)
53.6 MB/s 0%
Asus NUC 14 Pro
Kingston KC3000 2048G SKC3000D2048G
53.4 (49.89min - 53.35max) MB/s
Geekom AE7
Wodposit NVMe SSD 1024 GB
48.1 (43.1min - 48.11max) MB/s -10%
Acemagic F2A
Kingston OM8SEP1024Q-A0
47.3 (47.07min - 47.31max) MB/s -11%
4k q1 t1 write
Aoostar GEM10
BIWIN CE980Y28900-1TB
235 (230.8min - 235.02max) MB/s +183%
Durchschnitt der Klasse Mini PC
  (22 - 435, n=120, der letzten 2 Jahre)
189.9 MB/s +129%
Acemagic F2A
Kingston OM8SEP1024Q-A0
187.2 (181.54min - 187.2max) MB/s +125%
Geekom AE7
Wodposit NVMe SSD 1024 GB
184.8 (177.47min - 184.84max) MB/s +122%
Geekom A5
Lexar NM620 512GB
148.4 (147.43min - 148.38max) MB/s +79%
Minisforum UH125 Pro
Kingston OM8PGP41024Q-A0
136.8 (131.56min - 136.81max) MB/s +65%
Asus NUC 14 Pro
Kingston KC3000 2048G SKC3000D2048G
83.1 (75.3min - 83.11max) MB/s
4k q32 t16 read
Aoostar GEM10
BIWIN CE980Y28900-1TB
2004 (2002.37min - 2004.23max) MB/s +174%
Geekom A5
Lexar NM620 512GB
1960 MB/s +168%
Acemagic F2A
Kingston OM8SEP1024Q-A0
1824 (1239.47min - 1824.09max) MB/s +150%
Geekom AE7
Wodposit NVMe SSD 1024 GB
1580 (1549.8min - 1579.65max) MB/s +116%
Durchschnitt der Klasse Mini PC
  (26.1 - 4158, n=120, der letzten 2 Jahre)
1256 MB/s +72%
Asus NUC 14 Pro
Kingston KC3000 2048G SKC3000D2048G
731 (660.89min - 731.29max) MB/s
Minisforum UH125 Pro
Kingston OM8PGP41024Q-A0
698 (691.89min - 697.84max) MB/s -5%
4k q32 t16 write
Aoostar GEM10
BIWIN CE980Y28900-1TB
2681 (2560.18min - 2680.76max) MB/s +1336%
Acemagic F2A
Kingston OM8SEP1024Q-A0
1434 (1410.26min - 1433.71max) MB/s +668%
Geekom A5
Lexar NM620 512GB
1370 (84.65min - 1370.23max) MB/s +634%
Durchschnitt der Klasse Mini PC
  (30.2 - 4288, n=120, der letzten 2 Jahre)
1201 MB/s +543%
Geekom AE7
Wodposit NVMe SSD 1024 GB
627 (618.33min - 627.08max) MB/s +236%
Minisforum UH125 Pro
Kingston OM8PGP41024Q-A0
311 (252.72min - 310.91max) MB/s +67%
Asus NUC 14 Pro
Kingston KC3000 2048G SKC3000D2048G
186.7 (155.05min - 186.74max) MB/s
AS SSD
Score Total
Geekom AE7
Wodposit NVMe SSD 1024 GB
6354 Points +24%
Aoostar GEM10
BIWIN CE980Y28900-1TB
6147 Points +20%
Asus NUC 14 Pro
Kingston KC3000 2048G SKC3000D2048G
5131 Points
Acemagic F2A
Kingston OM8SEP1024Q-A0
4412 Points -14%
Geekom A5
Lexar NM620 512GB
4006 Points -22%
Durchschnitt der Klasse Mini PC
  (151.3 - 10021, n=118, der letzten 2 Jahre)
3898 Points -24%
Minisforum UH125 Pro
Kingston OM8PGP41024Q-A0
3878 Points -24%
Score Read
Aoostar GEM10
BIWIN CE980Y28900-1TB
2109 Points +65%
Geekom AE7
Wodposit NVMe SSD 1024 GB
1757 Points +38%
Acemagic F2A
Kingston OM8SEP1024Q-A0
1561 Points +22%
Geekom A5
Lexar NM620 512GB
1502 Points +18%
Durchschnitt der Klasse Mini PC
  (61 - 3741, n=118, der letzten 2 Jahre)
1454 Points +14%
Asus NUC 14 Pro
Kingston KC3000 2048G SKC3000D2048G
1275 Points
Minisforum UH125 Pro
Kingston OM8PGP41024Q-A0
1096 Points -14%
Score Write
Geekom AE7
Wodposit NVMe SSD 1024 GB
3759 Points +13%
Asus NUC 14 Pro
Kingston KC3000 2048G SKC3000D2048G
3313 Points
Aoostar GEM10
BIWIN CE980Y28900-1TB
2964 Points -11%
Minisforum UH125 Pro
Kingston OM8PGP41024Q-A0
2306 Points -30%
Acemagic F2A
Kingston OM8SEP1024Q-A0
2082 Points -37%
Durchschnitt der Klasse Mini PC
  (88 - 4371, n=118, der letzten 2 Jahre)
1751 Points -47%
Geekom A5
Lexar NM620 512GB
1739 Points -48%
Seq Read
Asus NUC 14 Pro
Kingston KC3000 2048G SKC3000D2048G
5158 MB/s
Aoostar GEM10
BIWIN CE980Y28900-1TB
4264 MB/s -17%
Geekom AE7
Wodposit NVMe SSD 1024 GB
3891 MB/s -25%
Minisforum UH125 Pro
Kingston OM8PGP41024Q-A0
3808 MB/s -26%
Durchschnitt der Klasse Mini PC
  (291 - 6620, n=118, der letzten 2 Jahre)
3037 MB/s -41%
Geekom A5
Lexar NM620 512GB
3020 MB/s -41%
Acemagic F2A
Kingston OM8SEP1024Q-A0
3010 MB/s -42%
Seq Write
Aoostar GEM10
BIWIN CE980Y28900-1TB
3970 MB/s +50%
Geekom A5
Lexar NM620 512GB
2714 MB/s +3%
Asus NUC 14 Pro
Kingston KC3000 2048G SKC3000D2048G
2646 MB/s
Geekom AE7
Wodposit NVMe SSD 1024 GB
2526 MB/s -5%
Acemagic F2A
Kingston OM8SEP1024Q-A0
2369 MB/s -10%
Durchschnitt der Klasse Mini PC
  (240 - 5783, n=118, der letzten 2 Jahre)
2097 MB/s -21%
Minisforum UH125 Pro
Kingston OM8PGP41024Q-A0
1787 MB/s -32%
4K Read
Aoostar GEM10
BIWIN CE980Y28900-1TB
68.4 MB/s +8%
Asus NUC 14 Pro
Kingston KC3000 2048G SKC3000D2048G
63.6 MB/s
Geekom A5
Lexar NM620 512GB
57.7 MB/s -9%
Durchschnitt der Klasse Mini PC
  (6.08 - 104.3, n=118, der letzten 2 Jahre)
57.5 MB/s -10%
Minisforum UH125 Pro
Kingston OM8PGP41024Q-A0
57.3 MB/s -10%
Geekom AE7
Wodposit NVMe SSD 1024 GB
55.2 MB/s -13%
Acemagic F2A
Kingston OM8SEP1024Q-A0
41.8 MB/s -34%
4K Write
Acemagic F2A
Kingston OM8SEP1024Q-A0
196.9 MB/s +16%
Aoostar GEM10
BIWIN CE980Y28900-1TB
196.5 MB/s +16%
Geekom AE7
Wodposit NVMe SSD 1024 GB
195.5 MB/s +15%
Minisforum UH125 Pro
Kingston OM8PGP41024Q-A0
182.1 MB/s +7%
Durchschnitt der Klasse Mini PC
  (30.9 - 366, n=118, der letzten 2 Jahre)
173 MB/s +2%
Asus NUC 14 Pro
Kingston KC3000 2048G SKC3000D2048G
169.5 MB/s
Geekom A5
Lexar NM620 512GB
125.5 MB/s -26%
4K-64 Read
Aoostar GEM10
BIWIN CE980Y28900-1TB
1614 MB/s +132%
Geekom AE7
Wodposit NVMe SSD 1024 GB
1313 MB/s +89%
Acemagic F2A
Kingston OM8SEP1024Q-A0
1218 MB/s +75%
Geekom A5
Lexar NM620 512GB
1143 MB/s +64%
Durchschnitt der Klasse Mini PC
  (23.4 - 3220, n=118, der letzten 2 Jahre)
1093 MB/s +57%
Asus NUC 14 Pro
Kingston KC3000 2048G SKC3000D2048G
695 MB/s
Minisforum UH125 Pro
Kingston OM8PGP41024Q-A0
658 MB/s -5%
4K-64 Write
Geekom AE7
Wodposit NVMe SSD 1024 GB
3311 MB/s +15%
Asus NUC 14 Pro
Kingston KC3000 2048G SKC3000D2048G
2878 MB/s
Aoostar GEM10
BIWIN CE980Y28900-1TB
2370 MB/s -18%
Minisforum UH125 Pro
Kingston OM8PGP41024Q-A0
1945 MB/s -32%
Acemagic F2A
Kingston OM8SEP1024Q-A0
1649 MB/s -43%
Durchschnitt der Klasse Mini PC
  (32.8 - 3731, n=118, der letzten 2 Jahre)
1368 MB/s -52%
Geekom A5
Lexar NM620 512GB
1342 MB/s -53%
Access Time Read
Durchschnitt der Klasse Mini PC
  (0.022 - 0.489, n=118, der letzten 2 Jahre)
0.1022 ms * -93%
Minisforum UH125 Pro
Kingston OM8PGP41024Q-A0
0.101 ms * -91%
Aoostar GEM10
BIWIN CE980Y28900-1TB
0.098 ms * -85%
Geekom A5
Lexar NM620 512GB
0.08 ms * -51%
Geekom AE7
Wodposit NVMe SSD 1024 GB
0.077 ms * -45%
Asus NUC 14 Pro
Kingston KC3000 2048G SKC3000D2048G
0.053 ms *
Acemagic F2A
Kingston OM8SEP1024Q-A0
0.046 ms * +13%
Access Time Write
Geekom A5
Lexar NM620 512GB
0.13 ms * -202%
Acemagic F2A
Kingston OM8SEP1024Q-A0
0.126 ms * -193%
Durchschnitt der Klasse Mini PC
  (0.016 - 0.765, n=118, der letzten 2 Jahre)
0.1145 ms * -166%
Aoostar GEM10
BIWIN CE980Y28900-1TB
0.061 ms * -42%
Asus NUC 14 Pro
Kingston KC3000 2048G SKC3000D2048G
0.043 ms *
Minisforum UH125 Pro
Kingston OM8PGP41024Q-A0
0.024 ms * +44%
Geekom AE7
Wodposit NVMe SSD 1024 GB
0.023 ms * +47%

* ... kleinere Werte sind besser

Dauerleistung Lesen: DiskSpd Read Loop, Queue Depth 8

036072010801440180021602520288032403600396043204680504054005760612064806840Tooltip
Asus NUC 14 Pro Kingston KC3000 2048G SKC3000D2048G; diskspd 2.0.17 f: Ø6306 (1073.74-7111.48)
Geekom AE7 Wodposit NVMe SSD 1024 GB; diskspd 2.0.17 f: Ø4932 (4634.29-4944.25)
Minisforum UH125 Pro Kingston OM8PGP41024Q-A0; diskspd 2.0.17 f: Ø4790 (4223.81-4803.95)
Aoostar GEM10 BIWIN CE980Y28900-1TB; diskspd 2.0.17 f: Ø4833 (4418.07-4847.99)
Acemagic F2A Kingston OM8SEP1024Q-A0; diskspd 2.0.17 f: Ø1320 (771.89-3141.95)
Geekom A5 Lexar NM620 512GB: Ø3437 (3126.47-3454.22)

Grafikkarte

Die 3D-Leistung des Asus NUC 14 Pro fällt aufgrund der überarbeiteten Intel-Arc-Architektur spürbar besser aus als im Vergleich zur älteren Intel Iris Xe G7 mit 96 EUs. Mit der AMD Radeon 780M kann die Intel-Arc-7-Core iGPU allerdings nicht mithalten. Dennoch erbringt der Asus NUC 14 Pro eine hervorragende Leistung, denn den Vergleich mit dem Acemagic F2A gewinnt unser Testsample in einigen Tests.

Weitere Vergleiche und Benchmarks entnehmen Sie bitte unserer GPU-Vergleichstabelle.

3DMark Performance Rating - Percent
Geekom AE7
AMD Radeon 780M, AMD Ryzen 9 7940HS
97.6 pt
Asus NUC 14 Pro
Intel Arc 7-Core iGPU, Intel Core Ultra 5 125H
93 pt
Acemagic F2A
Intel Arc 8-Core iGPU, Intel Core Ultra 7 155H
92.9 pt
Aoostar GEM10
AMD Radeon 680M, AMD Ryzen 7 6800H
84.6 pt
Minisforum UH125 Pro
Intel Arc 7-Core iGPU, Intel Core Ultra 5 125H
81.8 pt
Geekom A5
AMD Radeon RX Vega 8 (Ryzen 4000/5000), AMD Ryzen 7 5800H
49.9 pt
3DMark 11 - 1280x720 Performance GPU
Geekom AE7
AMD Radeon 780M, AMD Ryzen 9 7940HS
13824 Points +17%
Acemagic F2A
Intel Arc 8-Core iGPU, Intel Core Ultra 7 155H
12085 Points +3%
Asus NUC 14 Pro
Intel Arc 7-Core iGPU, Intel Core Ultra 5 125H
11785 Points
Aoostar GEM10
AMD Radeon 680M, AMD Ryzen 7 6800H
11668 Points -1%
Minisforum UH125 Pro
Intel Arc 7-Core iGPU, Intel Core Ultra 5 125H
10303 Points -13%
Geekom A5
AMD Radeon RX Vega 8 (Ryzen 4000/5000), AMD Ryzen 7 5800H
7101 Points -40%
3DMark
2560x1440 Time Spy Graphics
Acemagic F2A
Intel Arc 8-Core iGPU, Intel Core Ultra 7 155H
3205 Points 0%
Asus NUC 14 Pro
Intel Arc 7-Core iGPU, Intel Core Ultra 5 125H
3205 Points
Geekom AE7
AMD Radeon 780M, AMD Ryzen 9 7940HS
2970 Points -7%
Minisforum UH125 Pro
Intel Arc 7-Core iGPU, Intel Core Ultra 5 125H
2796 Points -13%
Aoostar GEM10
AMD Radeon 680M, AMD Ryzen 7 6800H
2518 Points -21%
Geekom A5
AMD Radeon RX Vega 8 (Ryzen 4000/5000), AMD Ryzen 7 5800H
1418 Points -56%
1920x1080 Fire Strike Graphics
Geekom AE7
AMD Radeon 780M, AMD Ryzen 9 7940HS
8437 Points +7%
Asus NUC 14 Pro
Intel Arc 7-Core iGPU, Intel Core Ultra 5 125H
7900 Points
Acemagic F2A
Intel Arc 8-Core iGPU, Intel Core Ultra 7 155H
7710 Points -2%
Aoostar GEM10
AMD Radeon 680M, AMD Ryzen 7 6800H
7653 Points -3%
Minisforum UH125 Pro
Intel Arc 7-Core iGPU, Intel Core Ultra 5 125H
7047 Points -11%
Geekom A5
AMD Radeon RX Vega 8 (Ryzen 4000/5000), AMD Ryzen 7 5800H
4567 Points -42%
Unigine Heaven 4.0
Extreme Preset OpenGL
Aoostar GEM10
AMD Radeon 680M, AMD Ryzen 7 6800H
37 fps +11%
Asus NUC 14 Pro
Intel Arc 7-Core iGPU, Intel Core Ultra 5 125H
33.3 fps
Geekom AE7
AMD Radeon 780M, AMD Ryzen 9 7940HS
33.2 fps 0%
Acemagic F2A
Intel Arc 8-Core iGPU, Intel Core Ultra 7 155H
31.6 fps -5%
Minisforum UH125 Pro
Intel Arc 7-Core iGPU, Intel Core Ultra 5 125H
29.6 fps -11%
Geekom A5
AMD Radeon RX Vega 8 (Ryzen 4000/5000), AMD Ryzen 7 5800H
22.8 fps -32%
Extreme Preset DX11
Geekom AE7
AMD Radeon 780M, AMD Ryzen 9 7940HS
36.1 fps +5%
Aoostar GEM10
AMD Radeon 680M, AMD Ryzen 7 6800H
34.7 fps +1%
Asus NUC 14 Pro
Intel Arc 7-Core iGPU, Intel Core Ultra 5 125H
34.5 fps
Acemagic F2A
Intel Arc 8-Core iGPU, Intel Core Ultra 7 155H
32.7 fps -5%
Minisforum UH125 Pro
Intel Arc 7-Core iGPU, Intel Core Ultra 5 125H
31.5 fps -9%
Geekom A5
AMD Radeon RX Vega 8 (Ryzen 4000/5000), AMD Ryzen 7 5800H
22 fps -36%
Unigine Valley 1.0
1920x1080 Extreme HD DirectX AA:x8
Geekom AE7
AMD Radeon 780M, AMD Ryzen 9 7940HS
24.5 fps +30%
Aoostar GEM10
AMD Radeon 680M, AMD Ryzen 7 6800H
23.7 fps +26%
Asus NUC 14 Pro
Intel Arc 7-Core iGPU, Intel Core Ultra 5 125H
18.8 fps
Acemagic F2A
Intel Arc 8-Core iGPU, Intel Core Ultra 7 155H
17.1 fps -9%
Minisforum UH125 Pro
Intel Arc 7-Core iGPU, Intel Core Ultra 5 125H
16.9 fps -10%
Geekom A5
AMD Radeon RX Vega 8 (Ryzen 4000/5000), AMD Ryzen 7 5800H
14.2 fps -24%
1920x1080 Extreme HD Preset OpenGL AA:x8
Aoostar GEM10
AMD Radeon 680M, AMD Ryzen 7 6800H
25.5 fps +26%
Asus NUC 14 Pro
Intel Arc 7-Core iGPU, Intel Core Ultra 5 125H
20.2 fps
Geekom AE7
AMD Radeon 780M, AMD Ryzen 9 7940HS
19.2 fps -5%
Acemagic F2A
Intel Arc 8-Core iGPU, Intel Core Ultra 7 155H
18.3 fps -9%
Minisforum UH125 Pro
Intel Arc 7-Core iGPU, Intel Core Ultra 5 125H
18.3 fps -9%
Geekom A5
AMD Radeon RX Vega 8 (Ryzen 4000/5000), AMD Ryzen 7 5800H
14.7 fps -27%
Unigine Superposition
1280x720 720p Low
Geekom AE7
AMD Radeon 780M, AMD Ryzen 9 7940HS
12146 Points +12%
Aoostar GEM10
AMD Radeon 680M, AMD Ryzen 7 6800H
11940 Points +10%
Asus NUC 14 Pro
Intel Arc 7-Core iGPU, Intel Core Ultra 5 125H
10872 Points
Acemagic F2A
Intel Arc 8-Core iGPU, Intel Core Ultra 7 155H
10491 Points -4%
Minisforum UH125 Pro
Intel Arc 7-Core iGPU, Intel Core Ultra 5 125H
10026 Points -8%
Geekom A5
AMD Radeon RX Vega 8 (Ryzen 4000/5000), AMD Ryzen 7 5800H
7952 Points -27%
1920x1080 1080p High
Geekom AE7
AMD Radeon 780M, AMD Ryzen 9 7940HS
3698 Points +2%
Asus NUC 14 Pro
Intel Arc 7-Core iGPU, Intel Core Ultra 5 125H
3609 Points
Acemagic F2A
Intel Arc 8-Core iGPU, Intel Core Ultra 7 155H
3391 Points -6%
Aoostar GEM10
AMD Radeon 680M, AMD Ryzen 7 6800H
3380 Points -6%
Minisforum UH125 Pro
Intel Arc 7-Core iGPU, Intel Core Ultra 5 125H
3066 Points -15%
Geekom A5
AMD Radeon RX Vega 8 (Ryzen 4000/5000), AMD Ryzen 7 5800H
1949 Points -46%
1920x1080 1080p Extreme
Asus NUC 14 Pro
Intel Arc 7-Core iGPU, Intel Core Ultra 5 125H
1981 Points
Acemagic F2A
Intel Arc 8-Core iGPU, Intel Core Ultra 7 155H
1920 Points -3%
Geekom AE7
AMD Radeon 780M, AMD Ryzen 9 7940HS
1803 Points -9%
Minisforum UH125 Pro
Intel Arc 7-Core iGPU, Intel Core Ultra 5 125H
1686 Points -15%
Aoostar GEM10
AMD Radeon 680M, AMD Ryzen 7 6800H
1424 Points -28%
Geekom A5
AMD Radeon RX Vega 8 (Ryzen 4000/5000), AMD Ryzen 7 5800H
914 Points -54%
ComputeMark v2.1
1024x600 Normal, Score
Geekom AE7
AMD Radeon 780M, AMD Ryzen 9 7940HS
9806 Points +46%
Acemagic F2A
Intel Arc 8-Core iGPU, Intel Core Ultra 7 155H
7480 Points +12%
Aoostar GEM10
AMD Radeon 680M, AMD Ryzen 7 6800H
6763 Points +1%
Asus NUC 14 Pro
Intel Arc 7-Core iGPU, Intel Core Ultra 5 125H
6698 Points
Minisforum UH125 Pro
Intel Arc 7-Core iGPU, Intel Core Ultra 5 125H
5613 Points -16%
Geekom A5
AMD Radeon RX Vega 8 (Ryzen 4000/5000), AMD Ryzen 7 5800H
4020 Points -40%
1024x600 Normal, Fluid 3DTex
Asus NUC 14 Pro
Intel Arc 7-Core iGPU, Intel Core Ultra 5 125H
490 Points
Geekom AE7
AMD Radeon 780M, AMD Ryzen 9 7940HS
481 Points -2%
Minisforum UH125 Pro
Intel Arc 7-Core iGPU, Intel Core Ultra 5 125H
471 Points -4%
Acemagic F2A
Intel Arc 8-Core iGPU, Intel Core Ultra 7 155H
427 Points -13%
Aoostar GEM10
AMD Radeon 680M, AMD Ryzen 7 6800H
427 Points -13%
Geekom A5
AMD Radeon RX Vega 8 (Ryzen 4000/5000), AMD Ryzen 7 5800H
296 Points -40%
1024x600 Normal, Fluid 2DTexArr
Geekom AE7
AMD Radeon 780M, AMD Ryzen 9 7940HS
486 Points +3%
Asus NUC 14 Pro
Intel Arc 7-Core iGPU, Intel Core Ultra 5 125H
472 Points
Aoostar GEM10
AMD Radeon 680M, AMD Ryzen 7 6800H
468 Points -1%
Minisforum UH125 Pro
Intel Arc 7-Core iGPU, Intel Core Ultra 5 125H
439 Points -7%
Acemagic F2A
Intel Arc 8-Core iGPU, Intel Core Ultra 7 155H
422 Points -11%
Geekom A5
AMD Radeon RX Vega 8 (Ryzen 4000/5000), AMD Ryzen 7 5800H
280 Points -41%
1024x600 Normal, Mandel Vector
Geekom AE7
AMD Radeon 780M, AMD Ryzen 9 7940HS
2560 Points +49%
Acemagic F2A
Intel Arc 8-Core iGPU, Intel Core Ultra 7 155H
1961 Points +14%
Aoostar GEM10
AMD Radeon 680M, AMD Ryzen 7 6800H
1900 Points +11%
Asus NUC 14 Pro
Intel Arc 7-Core iGPU, Intel Core Ultra 5 125H
1715 Points
Minisforum UH125 Pro
Intel Arc 7-Core iGPU, Intel Core Ultra 5 125H
1447 Points -16%
Geekom A5
AMD Radeon RX Vega 8 (Ryzen 4000/5000), AMD Ryzen 7 5800H
1236 Points -28%
1024x600 Normal, Mandel Scalar
Geekom AE7
AMD Radeon 780M, AMD Ryzen 9 7940HS
2614 Points +92%
Aoostar GEM10
AMD Radeon 680M, AMD Ryzen 7 6800H
1812 Points +33%
Acemagic F2A
Intel Arc 8-Core iGPU, Intel Core Ultra 7 155H
1594 Points +17%
Asus NUC 14 Pro
Intel Arc 7-Core iGPU, Intel Core Ultra 5 125H
1360 Points
Minisforum UH125 Pro
Intel Arc 7-Core iGPU, Intel Core Ultra 5 125H
1112 Points -18%
Geekom A5
AMD Radeon RX Vega 8 (Ryzen 4000/5000), AMD Ryzen 7 5800H
1062 Points -22%
1024x600 Normal, QJuliaRayTrace
Geekom AE7
AMD Radeon 780M, AMD Ryzen 9 7940HS
3665 Points +38%
Acemagic F2A
Intel Arc 8-Core iGPU, Intel Core Ultra 7 155H
3076 Points +16%
Asus NUC 14 Pro
Intel Arc 7-Core iGPU, Intel Core Ultra 5 125H
2662 Points
Aoostar GEM10
AMD Radeon 680M, AMD Ryzen 7 6800H
2157 Points -19%
Minisforum UH125 Pro
Intel Arc 7-Core iGPU, Intel Core Ultra 5 125H
2143 Points -19%
Geekom A5
AMD Radeon RX Vega 8 (Ryzen 4000/5000), AMD Ryzen 7 5800H
1145 Points -57%
LuxMark v2.0 64Bit
Room GPUs-only
Geekom AE7
AMD Radeon 780M, AMD Ryzen 9 7940HS
1025 Samples/s +28%
Asus NUC 14 Pro
Intel Arc 7-Core iGPU, Intel Core Ultra 5 125H
801 Samples/s
Minisforum UH125 Pro
Intel Arc 7-Core iGPU, Intel Core Ultra 5 125H
710 Samples/s -11%
Aoostar GEM10
AMD Radeon 680M, AMD Ryzen 7 6800H
567 Samples/s -29%
Acemagic F2A
Intel Arc 8-Core iGPU, Intel Core Ultra 7 155H
549 Samples/s -31%
Sala GPUs-only
Asus NUC 14 Pro
Intel Arc 7-Core iGPU, Intel Core Ultra 5 125H
2807 Samples/s
Minisforum UH125 Pro
Intel Arc 7-Core iGPU, Intel Core Ultra 5 125H
2517 Samples/s -10%
Acemagic F2A
Intel Arc 8-Core iGPU, Intel Core Ultra 7 155H
2319 Samples/s -17%
Geekom AE7
AMD Radeon 780M, AMD Ryzen 9 7940HS
2312 Samples/s -18%
Aoostar GEM10
AMD Radeon 680M, AMD Ryzen 7 6800H
1288 Samples/s -54%
Affinity Photo 2 - Combined (Single / Multi GPU)
Minisforum UH125 Pro
Intel Arc 7-Core iGPU, Intel Core Ultra 5 125H
5244 Points +3%
Asus NUC 14 Pro
Intel Arc 7-Core iGPU, Intel Core Ultra 5 125H
5105 Points
Acemagic F2A
Intel Arc 8-Core iGPU, Intel Core Ultra 7 155H
4928 Points -3%
Aoostar GEM10
AMD Radeon 680M, AMD Ryzen 7 6800H
2339 Points -54%
Geekom AE7
AMD Radeon 780M, AMD Ryzen 9 7940HS
1889 Points -63%
Geekom A5
AMD Radeon RX Vega 8 (Ryzen 4000/5000), AMD Ryzen 7 5800H
1683 Points -67%
Asus NUC 14 Pro, Intel Arc 7-Core iGPU
Ultra 5 125H
Geekom AE7, AMD Radeon 780M
R9 7940HS
Minisforum UH125 Pro, Intel Arc 7-Core iGPU
Ultra 5 125H
Aoostar GEM10, AMD Radeon 680M
R7 6800H
Acemagic F2A, Intel Arc 8-Core iGPU
Ultra 7 155H
Geekom A5, AMD Radeon RX Vega 8 (Ryzen 4000/5000)
R7 5800H
Durchschnitt der Klasse Mini PC
 
SPECviewperf 2020
236%
-8%
217%
1%
83%
165%
3840x2160 Medical (medical-03)
5.87
12.7
116%
4.8
-18%
10.7
82%
5.05
-14%
4.82
-18%
3840x2160 Energy (energy-03)
3.81
14.4
278%
3.38
-11%
10.6
178%
4.61
21%
5.33
40%
3840x2160 Creo (creo-03)
15.3
30.2
97%
15.4
1%
32
109%
17.9
17%
19.1
25%
3840x2160 CATIA (catia-06)
10.4
23.7
128%
9.7
-7%
22.8
119%
10
-4%
13.1
26%
3840x2160 3ds Max (3dsmax-07)
14.5
20.7
43%
13.2
-9%
18.9
30%
12.9
-11%
11.3
-22%
3840x2160 Siemens NX (snx-04)
5.82
61.3
953%
5.54
-5%
61.4
955%
5.7
-2%
38
553%
3840x2160 Maya (maya-06)
34.7
47.4
37%
32.8
-5%
49.7
43%
35.4
2%
25.8
-26%
3DMark 05 Standard
48550 Punkte
3DMark 06 Standard Score
40475 Punkte
3DMark Vantage P Result
39395 Punkte
3DMark 11 Performance
11870 Punkte
3DMark Ice Storm Standard Score
126152 Punkte
3DMark Cloud Gate Standard Score
29960 Punkte
3DMark Fire Strike Score
7302 Punkte
3DMark Fire Strike Extreme Score
3819 Punkte
3DMark Time Spy Score
3540 Punkte
3DMark Steel Nomad Score
699 Punkte
3DMark Steel Nomad Light Score
2798 Punkte
Hilfe

Gaming Performance

Für moderne Spiele ist der Asus NUC 14 Pro nur bedingt geeignet. Im Vergleich zur älteren Intel Iris Xe G7 mit 96 EUs kann die Spieleleistung aber spürbar zulegen. Das Duell mit AMDs iGPU verliert Intel deutlicher als noch bei den synthetischen Tests hinsichtlich der 3D-Leistung. Um die Leistung der iGPU besser einordnen zu können, verweisen wir auf unsere GPU-Spieleliste.

GTA V
1024x768 Lowest Settings possible
Geekom AE7
Radeon 780M, R9 7940HS, Wodposit NVMe SSD 1024 GB
168 (6.33min, 125P1) fps +7%
Acemagic F2A
Arc 8-Core, Ultra 7 155H, Kingston OM8SEP1024Q-A0
161 (4.76min, 100P1) fps +3%
Asus NUC 14 Pro
Arc 7-Core, Ultra 5 125H, Kingston KC3000 2048G SKC3000D2048G
156.3 (4.92min, 90.9P1) fps
Aoostar GEM10
Radeon 680M, R7 6800H, BIWIN CE980Y28900-1TB
145.3 (5.31min, 100P1) fps -7%
Geekom A5
Vega 8, R7 5800H, Lexar NM620 512GB
140.1 (17.4min, 90.9P1) fps -10%
Minisforum UH125 Pro
Arc 7-Core, Ultra 5 125H, Kingston OM8PGP41024Q-A0
132.4 (4.93min, 90.9P1) fps -15%
1920x1080 High/On (Advanced Graphics Off) AA:2xMSAA + FX AF:8x
Geekom AE7
Radeon 780M, R9 7940HS, Wodposit NVMe SSD 1024 GB
65.1 (2.93min, 29.4P1) fps +63%
Aoostar GEM10
Radeon 680M, R7 6800H, BIWIN CE980Y28900-1TB
53.9 (3.82min, 38.5P1) fps +35%
Asus NUC 14 Pro
Arc 7-Core, Ultra 5 125H, Kingston KC3000 2048G SKC3000D2048G
39.9 (3.1min, 29.4P1) fps
Minisforum UH125 Pro
Arc 7-Core, Ultra 5 125H, Kingston OM8PGP41024Q-A0
38.9 (3.15min, 28.6P1) fps -3%
Geekom A5
Vega 8, R7 5800H, Lexar NM620 512GB
35.1 (10.8min, 25.6P1) fps -12%
Acemagic F2A
Arc 8-Core, Ultra 7 155H, Kingston OM8SEP1024Q-A0
31.3 (2.94min, 22.7P1) fps -22%
Dota 2 Reborn
1280x720 min (0/3) fastest
Geekom AE7
Radeon 780M, R9 7940HS, Wodposit NVMe SSD 1024 GB
163 (143.1min) fps +68%
Geekom A5
Vega 8, R7 5800H, Lexar NM620 512GB
129.5 (112.6min) fps +33%
Aoostar GEM10
Radeon 680M, R7 6800H, BIWIN CE980Y28900-1TB
124 (8.9min) fps +28%
Acemagic F2A
Arc 8-Core, Ultra 7 155H, Kingston OM8SEP1024Q-A0
103.2 (59.8min) fps +6%
Asus NUC 14 Pro
Arc 7-Core, Ultra 5 125H, Kingston KC3000 2048G SKC3000D2048G
97.1 (61.8min) fps
Minisforum UH125 Pro
Arc 7-Core, Ultra 5 125H, Kingston OM8PGP41024Q-A0
95.5 (63.7min) fps -2%
1920x1080 high (2/3)
Geekom AE7
Radeon 780M, R9 7940HS, Wodposit NVMe SSD 1024 GB
89.8 (75.7min) fps +18%
Aoostar GEM10
Radeon 680M, R7 6800H, BIWIN CE980Y28900-1TB
81.6 (72.3min) fps +8%
Acemagic F2A
Arc 8-Core, Ultra 7 155H, Kingston OM8SEP1024Q-A0
77.3 (52.5min) fps +2%
Asus NUC 14 Pro
Arc 7-Core, Ultra 5 125H, Kingston KC3000 2048G SKC3000D2048G
75.9 (45.7min) fps
Minisforum UH125 Pro
Arc 7-Core, Ultra 5 125H, Kingston OM8PGP41024Q-A0
73.6 (47.5min) fps -3%
Geekom A5
Vega 8, R7 5800H, Lexar NM620 512GB
67.7 (59.9min) fps -11%
Cyberpunk 2077 2.1 Phantom Liberty
1920x1080 Low Preset (FSR off)
Geekom AE7
Radeon 780M, R9 7940HS, Wodposit NVMe SSD 1024 GB
45 (38min) fps +50%
Aoostar GEM10
Radeon 680M, R7 6800H, BIWIN CE980Y28900-1TB
34.8 (29.9min) fps +16%
Asus NUC 14 Pro
Arc 7-Core, Ultra 5 125H, Kingston KC3000 2048G SKC3000D2048G
30.1 (25.8min) fps
Acemagic F2A
Arc 8-Core, Ultra 7 155H, Kingston OM8SEP1024Q-A0
29.5 (24.1min) fps -2%
Minisforum UH125 Pro
Arc 7-Core, Ultra 5 125H, Kingston OM8PGP41024Q-A0
29.5 (25.4min) fps -2%
1920x1080 High Preset (FSR off)
Geekom AE7
Radeon 780M, R9 7940HS, Wodposit NVMe SSD 1024 GB
27.4 (23.1min) fps +26%
Asus NUC 14 Pro
Arc 7-Core, Ultra 5 125H, Kingston KC3000 2048G SKC3000D2048G
21.7 (18.8min) fps
Aoostar GEM10
Radeon 680M, R7 6800H, BIWIN CE980Y28900-1TB
21.3 (18.4min) fps -2%
Minisforum UH125 Pro
Arc 7-Core, Ultra 5 125H, Kingston OM8PGP41024Q-A0
20.6 (17.9min) fps -5%
Acemagic F2A
Arc 8-Core, Ultra 7 155H, Kingston OM8SEP1024Q-A0
20.4 (13.8min) fps -6%
Baldur's Gate 3
1280x720 Low Preset
Geekom AE7
Radeon 780M, R9 7940HS, Wodposit NVMe SSD 1024 GB
67.4 (22.7min, 28.3P0.1, 43.6P1) fps +34%
Asus NUC 14 Pro
Arc 7-Core, Ultra 5 125H, Kingston KC3000 2048G SKC3000D2048G
50.2 (27.7min, 29.7P0.1, 32.6P1) fps
Aoostar GEM10
Radeon 680M, R7 6800H, BIWIN CE980Y28900-1TB
48.9 (16.6min, 29.1P0.1, 36.8P1) fps -3%
Minisforum UH125 Pro
Arc 7-Core, Ultra 5 125H, Kingston OM8PGP41024Q-A0
45 (14.9min, 19.4P0.1, 29P1) fps -10%
1920x1080 High Preset
Geekom AE7
Radeon 780M, R9 7940HS, Wodposit NVMe SSD 1024 GB
25.7 (11min, 11.5P0.1, 14.5P1) fps +15%
Aoostar GEM10
Radeon 680M, R7 6800H, BIWIN CE980Y28900-1TB
23.3 (16.6min, 16.7P0.1, 18.3P1) fps +4%
Asus NUC 14 Pro
Arc 7-Core, Ultra 5 125H, Kingston KC3000 2048G SKC3000D2048G
22.4 (14min, 14.2P0.1, 15.3P1) fps
Minisforum UH125 Pro
Arc 7-Core, Ultra 5 125H, Kingston OM8PGP41024Q-A0
19.5 (9.2min, 10.4P0.1, 12.7P1) fps -13%
F1 24
1920x1080 Low Preset AA:T AF:16x
Geekom AE7
Radeon 780M, R9 7940HS, Wodposit NVMe SSD 1024 GB
94.8 (81min, 64P1) fps +43%
Asus NUC 14 Pro
Arc 7-Core, Ultra 5 125H, Kingston KC3000 2048G SKC3000D2048G
66.2 (56min, 54P1) fps
Minisforum UH125 Pro
Arc 7-Core, Ultra 5 125H, Kingston OM8PGP41024Q-A0
64.3 (55min, 53P1) fps -3%
1920x1080 High Preset AA:T AF:16x
Geekom AE7
Radeon 780M, R9 7940HS, Wodposit NVMe SSD 1024 GB
59.5 (50min, 41P1) fps +37%
Asus NUC 14 Pro
Arc 7-Core, Ultra 5 125H, Kingston KC3000 2048G SKC3000D2048G
43.4 (34min, 35P1) fps
Minisforum UH125 Pro
Arc 7-Core, Ultra 5 125H, Kingston OM8PGP41024Q-A0
41.7 (34min, 34P1) fps -4%

fps-Diagramm

05101520Tooltip
Asus NUC 14 Pro Ultra 5 125H, Arc 7-Core: Ø18.5 (12.6-20.7)
min. mittel hoch max.
GTA V (2015) 156.3 148.8 39.9 16.6
Dota 2 Reborn (2015) 97.1 79.2 75.9 72.9
Final Fantasy XV Benchmark (2018) 60.6 35.4 25.3
X-Plane 11.11 (2018) 47.5 38.5 32.9
Baldur's Gate 3 (2023) 33.5 25.9 22.4 21.5
Cyberpunk 2077 2.1 Phantom Liberty (2023) 30.1 25.2 21.7 19.6
F1 24 (2024) 66.2 57.6 43.4

Asus NUC 14 Pro im Leistungscheck mit einer Nvidia GeForce RTX 3060 Ti

Mit einer externen Grafikkarte lässt sich die 3D-Leistung spürbar verbessern. Externe 3D-Beschleuniger können hingegen nur über USB-C verbunden werden. Ohne Einfluss auf das Gesamt-Rating haben wir einige Tests in Kombination mit dem Razer Core X und einer Nvidia GeForce RTX 3060 Ti durchgeführt. Durchweg verzeichnen wir eine Verbesserung der 3D-Leistung, und selbst modere Spiele lassen sich nunmehr problemlos wiedergeben. Im Vergleich mit dem Minisforum UH125 Pro erbringt der Asus NUC 14 Pro eine identische Leistung.

Performance Rating - Percent
Geekom XT13 Pro (Nvidia GeForce RTX 3060 Ti FE)
Intel Core i9-13900H
99.2 pt
Geekom AX8 Pro (Nvidia GeForce RTX 3060 Ti FE)
AMD Ryzen 9 8945HS
98.6 pt
Asus NUC 14 Pro (Nvidia GeForce RTX 3060 Ti FE)
Intel Core Ultra 5 125H
97.4 pt
Minisforum UH125 Pro (Nvidia GeForce RTX 3060 Ti FE)
Intel Core Ultra 5 125H
96.8 pt
3DMark 11 - 1280x720 Performance GPU
Geekom AX8 Pro (Nvidia GeForce RTX 3060 Ti FE)
AMD Ryzen 9 8945HS
34907 Points +196%
Geekom XT13 Pro (Nvidia GeForce RTX 3060 Ti FE)
Intel Core i9-13900H
33454 Points +184%
Minisforum UH125 Pro (Nvidia GeForce RTX 3060 Ti FE)
Intel Core Ultra 5 125H
32085 Points +172%
Asus NUC 14 Pro (Nvidia GeForce RTX 3060 Ti FE)
Intel Core Ultra 5 125H
31917 Points +171%

11785 Points
3DMark
2560x1440 Time Spy Graphics
Geekom AX8 Pro (Nvidia GeForce RTX 3060 Ti FE)
AMD Ryzen 9 8945HS
11180 Points +249%
Geekom XT13 Pro (Nvidia GeForce RTX 3060 Ti FE)
Intel Core i9-13900H
11118 Points +247%
Minisforum UH125 Pro (Nvidia GeForce RTX 3060 Ti FE)
Intel Core Ultra 5 125H
10935 Points +241%
Asus NUC 14 Pro (Nvidia GeForce RTX 3060 Ti FE)
Intel Core Ultra 5 125H
10932 Points +241%

3205 Points
1920x1080 Fire Strike Graphics
Geekom AX8 Pro (Nvidia GeForce RTX 3060 Ti FE)
AMD Ryzen 9 8945HS
25665 Points +225%
Geekom XT13 Pro (Nvidia GeForce RTX 3060 Ti FE)
Intel Core i9-13900H
25415 Points +222%
Minisforum UH125 Pro (Nvidia GeForce RTX 3060 Ti FE)
Intel Core Ultra 5 125H
24809 Points +214%
Asus NUC 14 Pro (Nvidia GeForce RTX 3060 Ti FE)
Intel Core Ultra 5 125H
24767 Points +214%

7900 Points
3840x2160 Fire Strike Ultra Graphics
Geekom AX8 Pro (Nvidia GeForce RTX 3060 Ti FE)
AMD Ryzen 9 8945HS
7103 Points +274%
Geekom XT13 Pro (Nvidia GeForce RTX 3060 Ti FE)
Intel Core i9-13900H
7046 Points +271%
Asus NUC 14 Pro (Nvidia GeForce RTX 3060 Ti FE)
Intel Core Ultra 5 125H
7024 Points +270%
Minisforum UH125 Pro (Nvidia GeForce RTX 3060 Ti FE)
Intel Core Ultra 5 125H
6997 Points +268%

1899 Points
Unigine Superposition
1280x720 720p Low
Geekom AX8 Pro (Nvidia GeForce RTX 3060 Ti FE)
AMD Ryzen 9 8945HS
33452 Points +208%
Geekom XT13 Pro (Nvidia GeForce RTX 3060 Ti FE)
Intel Core i9-13900H
31986 Points +194%
Asus NUC 14 Pro (Nvidia GeForce RTX 3060 Ti FE)
Intel Core Ultra 5 125H
27554 Points +153%
Minisforum UH125 Pro (Nvidia GeForce RTX 3060 Ti FE)
Intel Core Ultra 5 125H
25121 Points +131%

10872 Points
1920x1080 1080p High
Geekom AX8 Pro (Nvidia GeForce RTX 3060 Ti FE)
AMD Ryzen 9 8945HS
15070 Points +318%
Geekom XT13 Pro (Nvidia GeForce RTX 3060 Ti FE)
Intel Core i9-13900H
14959 Points +314%
Asus NUC 14 Pro (Nvidia GeForce RTX 3060 Ti FE)
Intel Core Ultra 5 125H
14910 Points +313%
Minisforum UH125 Pro (Nvidia GeForce RTX 3060 Ti FE)
Intel Core Ultra 5 125H
14859 Points +312%

3609 Points
1920x1080 1080p Extreme
Geekom AX8 Pro (Nvidia GeForce RTX 3060 Ti FE)
AMD Ryzen 9 8945HS
7117 Points +259%
Asus NUC 14 Pro (Nvidia GeForce RTX 3060 Ti FE)
Intel Core Ultra 5 125H
7111 Points +259%
Geekom XT13 Pro (Nvidia GeForce RTX 3060 Ti FE)
Intel Core i9-13900H
7098 Points +258%
Minisforum UH125 Pro (Nvidia GeForce RTX 3060 Ti FE)
Intel Core Ultra 5 125H
7064 Points +257%

1981 Points
3840x2160 4k Optimized
Geekom XT13 Pro (Nvidia GeForce RTX 3060 Ti FE)
Intel Core i9-13900H
9315 Points
Asus NUC 14 Pro (Nvidia GeForce RTX 3060 Ti FE)
Intel Core Ultra 5 125H
9243 Points
Geekom AX8 Pro (Nvidia GeForce RTX 3060 Ti FE)
AMD Ryzen 9 8945HS
9206 Points
Minisforum UH125 Pro (Nvidia GeForce RTX 3060 Ti FE)
Intel Core Ultra 5 125H
9188 Points
7680x4320 8k Optimized
Geekom XT13 Pro (Nvidia GeForce RTX 3060 Ti FE)
Intel Core i9-13900H
4061 Points
Geekom AX8 Pro (Nvidia GeForce RTX 3060 Ti FE)
AMD Ryzen 9 8945HS
4047 Points
Minisforum UH125 Pro (Nvidia GeForce RTX 3060 Ti FE)
Intel Core Ultra 5 125H
4016 Points
Asus NUC 14 Pro (Nvidia GeForce RTX 3060 Ti FE)
Intel Core Ultra 5 125H
4013 Points
Unigine Valley 1.0
1920x1080 Extreme HD DirectX AA:x8
Geekom XT13 Pro (Nvidia GeForce RTX 3060 Ti FE)
Intel Core i9-13900H
142.2 fps +656%
Geekom AX8 Pro (Nvidia GeForce RTX 3060 Ti FE)
AMD Ryzen 9 8945HS
141.7 fps +654%
Asus NUC 14 Pro (Nvidia GeForce RTX 3060 Ti FE)
Intel Core Ultra 5 125H
137.3 fps +630%
Minisforum UH125 Pro (Nvidia GeForce RTX 3060 Ti FE)
Intel Core Ultra 5 125H
135.9 fps +623%

18.8 fps
1920x1080 Extreme HD Preset OpenGL AA:x8
Geekom XT13 Pro (Nvidia GeForce RTX 3060 Ti FE)
Intel Core i9-13900H
137.6 fps +581%
Geekom AX8 Pro (Nvidia GeForce RTX 3060 Ti FE)
AMD Ryzen 9 8945HS
137.6 fps +581%
Asus NUC 14 Pro (Nvidia GeForce RTX 3060 Ti FE)
Intel Core Ultra 5 125H
133.8 fps +562%
Minisforum UH125 Pro (Nvidia GeForce RTX 3060 Ti FE)
Intel Core Ultra 5 125H
133.5 fps +561%

20.2 fps
Unigine Heaven 4.0
Extreme Preset OpenGL
Geekom AX8 Pro (Nvidia GeForce RTX 3060 Ti FE)
AMD Ryzen 9 8945HS
174.9 fps +425%
Geekom XT13 Pro (Nvidia GeForce RTX 3060 Ti FE)
Intel Core i9-13900H
173.5 fps +421%
Asus NUC 14 Pro (Nvidia GeForce RTX 3060 Ti FE)
Intel Core Ultra 5 125H
172.4 fps +418%
Minisforum UH125 Pro (Nvidia GeForce RTX 3060 Ti FE)
Intel Core Ultra 5 125H
172.3 fps +417%

33.3 fps
Extreme Preset DX11
Geekom XT13 Pro (Nvidia GeForce RTX 3060 Ti FE)
Intel Core i9-13900H
164.2 fps +376%
Geekom AX8 Pro (Nvidia GeForce RTX 3060 Ti FE)
AMD Ryzen 9 8945HS
163.2 fps +373%
Minisforum UH125 Pro (Nvidia GeForce RTX 3060 Ti FE)
Intel Core Ultra 5 125H
158.8 fps +360%
Asus NUC 14 Pro (Nvidia GeForce RTX 3060 Ti FE)
Intel Core Ultra 5 125H
158.7 fps +360%

34.5 fps
ComputeMark v2.1
1024x600 Normal, Score
Geekom XT13 Pro (Nvidia GeForce RTX 3060 Ti FE)
Intel Core i9-13900H
27843 Points +316%
Asus NUC 14 Pro (Nvidia GeForce RTX 3060 Ti FE)
Intel Core Ultra 5 125H
27843 Points +316%
Minisforum UH125 Pro (Nvidia GeForce RTX 3060 Ti FE)
Intel Core Ultra 5 125H
27669 Points +313%
Geekom AX8 Pro (Nvidia GeForce RTX 3060 Ti FE)
AMD Ryzen 9 8945HS
26591 Points +297%

6698 Points
1024x600 Normal, Fluid 3DTex
Minisforum UH125 Pro (Nvidia GeForce RTX 3060 Ti FE)
Intel Core Ultra 5 125H
2708 Points +453%
Geekom AX8 Pro (Nvidia GeForce RTX 3060 Ti FE)
AMD Ryzen 9 8945HS
2683 Points +448%
Geekom XT13 Pro (Nvidia GeForce RTX 3060 Ti FE)
Intel Core i9-13900H
2681 Points +447%
Asus NUC 14 Pro (Nvidia GeForce RTX 3060 Ti FE)
Intel Core Ultra 5 125H
2681 Points +447%

490 Points
1024x600 Normal, Fluid 2DTexArr
Minisforum UH125 Pro (Nvidia GeForce RTX 3060 Ti FE)
Intel Core Ultra 5 125H
2641 Points +460%
Geekom AX8 Pro (Nvidia GeForce RTX 3060 Ti FE)
AMD Ryzen 9 8945HS
2618 Points +455%
Geekom XT13 Pro (Nvidia GeForce RTX 3060 Ti FE)
Intel Core i9-13900H
2614 Points +454%
Asus NUC 14 Pro (Nvidia GeForce RTX 3060 Ti FE)
Intel Core Ultra 5 125H
2614 Points +454%

472 Points
1024x600 Normal, Mandel Vector
Geekom XT13 Pro (Nvidia GeForce RTX 3060 Ti FE)
Intel Core i9-13900H
5726 Points +234%
Asus NUC 14 Pro (Nvidia GeForce RTX 3060 Ti FE)
Intel Core Ultra 5 125H
5726 Points +234%
Minisforum UH125 Pro (Nvidia GeForce RTX 3060 Ti FE)
Intel Core Ultra 5 125H
5652 Points +230%
Geekom AX8 Pro (Nvidia GeForce RTX 3060 Ti FE)
AMD Ryzen 9 8945HS
5358 Points +212%

1715 Points
1024x600 Normal, Mandel Scalar
Geekom XT13 Pro (Nvidia GeForce RTX 3060 Ti FE)
Intel Core i9-13900H
6275 Points +361%
Asus NUC 14 Pro (Nvidia GeForce RTX 3060 Ti FE)
Intel Core Ultra 5 125H
6275 Points +361%
Minisforum UH125 Pro (Nvidia GeForce RTX 3060 Ti FE)
Intel Core Ultra 5 125H
6223 Points +358%
Geekom AX8 Pro (Nvidia GeForce RTX 3060 Ti FE)
AMD Ryzen 9 8945HS
5949 Points +337%

1360 Points
1024x600 Normal, QJuliaRayTrace
Geekom XT13 Pro (Nvidia GeForce RTX 3060 Ti FE)
Intel Core i9-13900H
10548 Points +296%
Asus NUC 14 Pro (Nvidia GeForce RTX 3060 Ti FE)
Intel Core Ultra 5 125H
10548 Points +296%
Minisforum UH125 Pro (Nvidia GeForce RTX 3060 Ti FE)
Intel Core Ultra 5 125H
10445 Points +292%
Geekom AX8 Pro (Nvidia GeForce RTX 3060 Ti FE)
AMD Ryzen 9 8945HS
9982 Points +275%

2662 Points
Performance Rating - Percent
Geekom AX8 Pro (Nvidia GeForce RTX 3060 Ti FE)
AMD Ryzen 9 8945HS
99.5 pt
Geekom XT13 Pro (Nvidia GeForce RTX 3060 Ti FE)
Intel Core i9-13900H
94.6 pt
Minisforum UH125 Pro (Nvidia GeForce RTX 3060 Ti FE)
Intel Core Ultra 5 125H
88.3 pt
Asus NUC 14 Pro (Nvidia GeForce RTX 3060 Ti FE)
Intel Core Ultra 5 125H
88 pt
Cyberpunk 2077 2.1 Phantom Liberty
1280x720 Low Preset (FSR off)
Geekom AX8 Pro (Nvidia GeForce RTX 3060 Ti FE)
AMD Ryzen 9 8945HS
103.1 (80.9min - 132.1max) fps +123%
Geekom XT13 Pro (Nvidia GeForce RTX 3060 Ti FE)
Intel Core i9-13900H
88.7 (68min - 118.2max) fps +92%
Asus NUC 14 Pro (Nvidia GeForce RTX 3060 Ti FE)
Intel Core Ultra 5 125H
72.4 (53.9min - 101max) fps +56%
Minisforum UH125 Pro (Nvidia GeForce RTX 3060 Ti FE)
Intel Core Ultra 5 125H
70.2 (53.5min - 91.7max) fps +52%

46.3 (39.2min - 54.8max) fps
1920x1080 Medium Preset (FSR off)
Geekom AX8 Pro (Nvidia GeForce RTX 3060 Ti FE)
AMD Ryzen 9 8945HS
81.5 (65.7min - 103.4max) fps +223%
Geekom XT13 Pro (Nvidia GeForce RTX 3060 Ti FE)
Intel Core i9-13900H
81.4 (65.1min - 102max) fps +223%
Minisforum UH125 Pro (Nvidia GeForce RTX 3060 Ti FE)
Intel Core Ultra 5 125H
72.2 (55.8min - 97.4max) fps +187%
Asus NUC 14 Pro (Nvidia GeForce RTX 3060 Ti FE)
Intel Core Ultra 5 125H
69.8 (50min - 99.9max) fps +177%

25.2 (22.3min - 29max) fps
1920x1080 Ultra Preset (FSR off)
Geekom XT13 Pro (Nvidia GeForce RTX 3060 Ti FE)
Intel Core i9-13900H
64.4 (49.9min - 85.5max) fps +229%
Geekom AX8 Pro (Nvidia GeForce RTX 3060 Ti FE)
AMD Ryzen 9 8945HS
64.3 (50.9min - 85.8max) fps +228%
Minisforum UH125 Pro (Nvidia GeForce RTX 3060 Ti FE)
Intel Core Ultra 5 125H
60.8 (43.6min - 87max) fps +210%
Asus NUC 14 Pro (Nvidia GeForce RTX 3060 Ti FE)
Intel Core Ultra 5 125H
58.3 (36.6min - 87.8max) fps +197%

19.6 (16.7min - 23.6max) fps
Baldur's Gate 3
1920x1080 Low Preset
Geekom XT13 Pro (Nvidia GeForce RTX 3060 Ti FE)
Intel Core i9-13900H
113 (47.4min, 65.4P0.1, 77.5P1 - 215max) fps +237%
Asus NUC 14 Pro (Nvidia GeForce RTX 3060 Ti FE)
Intel Core Ultra 5 125H
111.6 (57.7min, 64.3P0.1, 75.6P1 - 248max) fps +233%
Geekom AX8 Pro (Nvidia GeForce RTX 3060 Ti FE)
AMD Ryzen 9 8945HS
110.9 (57.4min, 66.9P0.1, 76.7P1 - 233max) fps +231%
Minisforum UH125 Pro (Nvidia GeForce RTX 3060 Ti FE)
Intel Core Ultra 5 125H
109.5 (51.8min, 62.3P0.1, 74.4P1 - 198.7max) fps +227%

33.5 (20.9min, 21P0.1, 23.4P1 - 64.9max) fps
1920x1080 Medium Preset
Geekom XT13 Pro (Nvidia GeForce RTX 3060 Ti FE)
Intel Core i9-13900H
91.3 (51.4min, 53.4P0.1, 61.1P1 - 196.3max) fps +253%
Geekom AX8 Pro (Nvidia GeForce RTX 3060 Ti FE)
AMD Ryzen 9 8945HS
89.4 (43.6min, 53.5P0.1, 60P1 - 201max) fps +245%
Minisforum UH125 Pro (Nvidia GeForce RTX 3060 Ti FE)
Intel Core Ultra 5 125H
87.3 (36.9min, 43.6P0.1, 57.2P1 - 191.9max) fps +237%
Asus NUC 14 Pro (Nvidia GeForce RTX 3060 Ti FE)
Intel Core Ultra 5 125H
86 (30.5min, 43.2P0.1, 55.8P1 - 194.6max) fps +232%

25.9 (5.81min, 8.8P0.1, 15.9P1 - 97.2max) fps
1920x1080 Ultra Preset
Geekom XT13 Pro (Nvidia GeForce RTX 3060 Ti FE)
Intel Core i9-13900H
78.5 (46.2min, 47P0.1, 53.1P1 - 179.1max) fps +265%
Geekom AX8 Pro (Nvidia GeForce RTX 3060 Ti FE)
AMD Ryzen 9 8945HS
78.2 (23.4min, 47.3P0.1, 51.1P1 - 216max) fps +264%
Minisforum UH125 Pro (Nvidia GeForce RTX 3060 Ti FE)
Intel Core Ultra 5 125H
76.3 (41.3min, 43.7P0.1, 50P1 - 176.1max) fps +255%
Asus NUC 14 Pro (Nvidia GeForce RTX 3060 Ti FE)
Intel Core Ultra 5 125H
72.1 (20.2min, 24.7P0.1, 31.8P1 - 189.9max) fps +235%

21.5 (13.6min, 13.7P0.1, 14.1P1 - 66max) fps
F1 24
1920x1080 Low Preset AA:T AF:16x
Geekom AX8 Pro (Nvidia GeForce RTX 3060 Ti FE)
AMD Ryzen 9 8945HS
86.5 (48min, 51P1 - 108max) fps +31%
Geekom XT13 Pro (Nvidia GeForce RTX 3060 Ti FE)
Intel Core i9-13900H
76.9 (42min, 44P1 - 96max) fps +16%
Asus NUC 14 Pro (Nvidia GeForce RTX 3060 Ti FE)
Intel Core Ultra 5 125H
75.3 (42min, 44P1 - 92max) fps +14%
Minisforum UH125 Pro (Nvidia GeForce RTX 3060 Ti FE)
Intel Core Ultra 5 125H
72.6 (41min, 43P1 - 87max) fps +10%

66.2 (56min, 54P1 - 77max) fps
1920x1080 Medium Preset AA:T AF:16x
Geekom AX8 Pro (Nvidia GeForce RTX 3060 Ti FE)
AMD Ryzen 9 8945HS
82.3 (47min, 49P1 - 97max) fps +43%
Geekom XT13 Pro (Nvidia GeForce RTX 3060 Ti FE)
Intel Core i9-13900H
73.1 (42min, 43P1 - 86max) fps +27%
Asus NUC 14 Pro (Nvidia GeForce RTX 3060 Ti FE)
Intel Core Ultra 5 125H
71.7 (41min, 43P1 - 84max) fps +24%
Minisforum UH125 Pro (Nvidia GeForce RTX 3060 Ti FE)
Intel Core Ultra 5 125H
70 (41min, 42P1 - 81max) fps +22%

57.6 (47min, 46P1 - 68max) fps
1920x1080 High Preset AA:T AF:16x
Geekom AX8 Pro (Nvidia GeForce RTX 3060 Ti FE)
AMD Ryzen 9 8945HS
68.7 (40min, 40P1 - 82max) fps +58%
Geekom XT13 Pro (Nvidia GeForce RTX 3060 Ti FE)
Intel Core i9-13900H
60.5 (35min, 37P1 - 74max) fps +39%
Asus NUC 14 Pro (Nvidia GeForce RTX 3060 Ti FE)
Intel Core Ultra 5 125H
59.5 (35min, 35P1 - 72max) fps +37%
Minisforum UH125 Pro (Nvidia GeForce RTX 3060 Ti FE)
Intel Core Ultra 5 125H
58.2 (34min, 36P1 - 71max) fps +34%

43.4 (34min, 35P1 - 51max) fps
Asus NUC 14 Pro (Nvidia GeForce RTX 3060 Ti FE),
Ultra 5 125H
Minisforum UH125 Pro (Nvidia GeForce RTX 3060 Ti FE),
Ultra 5 125H
Geekom AX8 Pro (Nvidia GeForce RTX 3060 Ti FE),
R9 8945HS
Geekom XT13 Pro (Nvidia GeForce RTX 3060 Ti FE),
i9-13900H
Durchschnitt der Klasse Mini PC
 
SPECviewperf 2020
290%
126%
304%
300%
165%
3840x2160 Medical (medical-03)
13
121%
10.9
86%
13
121%
13
121%
3840x2160 Energy (energy-03)
20.9
449%
17.8
367%
21
451%
20.9
449%
3840x2160 Creo (creo-03)
68.3
346%
26.6
74%
77.2
405%
74.2
385%
3840x2160 CATIA (catia-06)
37.3
259%
23.6
127%
39.2
277%
39.4
279%
3840x2160 3ds Max (3dsmax-07)
46.5
221%
28.7
98%
46.1
218%
47.2
226%
3840x2160 Siemens NX (snx-04)
16.2
178%
11.4
96%
16.7
187%
16.5
184%
3840x2160 Maya (maya-06)
193
456%
47.5
37%
198
471%
194
459%
min. mittel hoch max.QHD4K
GTA V (2015) 178.7 174 162.9 100.6 90 102.6
Dota 2 Reborn (2015) 159 138.8 131 122.6 104.3
Final Fantasy XV Benchmark (2018) 163.8 141 97.3 75.6 47.4
X-Plane 11.11 (2018) 119.6 107.5 83.7 71.7
Baldur's Gate 3 (2023) 111.6 86 72.8 72.1 57.5 36.4
Cyberpunk 2077 2.1 Phantom Liberty (2023) 72.4 69.8 63.7 58.3 43.5 22.2
F1 24 (2024) 75.3 71.7 59.5 41.1 35.7 16.9

Emissionen

Geräuschemissionen

Die meiste Zeit verhält sich der Asus NUC 14 Pro sehr ruhig. Der Lüfter arbeitet allerdings auch im Leerlauf, sodass kein lautloser Betrieb gegeben ist. Bei durchschnittlicher Last verzeichnen wir einen Schalldruckpegel von 42,4 dB(A). Der Minisforum UH125 Pro und der Aoostar GEM10 liegen etwa auf demselben Level. Bei maximaler Last erreicht unser Testsample 47,8 dB(A). Damit ist der Asus NUC 14 Pro deutlich hörbar, wenngleich die subjektive Wahrnehmung der Lautstärke etwas geringer ausfällt.

Lautstärkediagramm

Idle
26 / 26.2 / 26.2 dB(A)
Last
42.4 / 47.8 dB(A)
  red to green bar
 
 
30 dB
leise
40 dB(A)
deutlich hörbar
50 dB(A)
störend
 
min: dark, med: mid, max: light   Earthworks M23R (aus 15 cm gemessen)   Umgebungsgeräusche: 24 dB(A)
dB(A) 0102030405060708090Deep BassMiddle BassHigh BassLower RangeMidsHigher MidsLower HighsMid HighsUpper HighsSuper Highs2035.53536.236.836.335.435.52533.235.836.532.935.733.733.23133.435.235.835.937.534.333.44029.224.131.53126.726.629.25032.727.625.426.326.327.732.76330.524.124.125.924.327.730.58023.518.318.920.415.120.523.510020.820.717.91817.822.520.812522.319.218.514.813.816.822.316021.219.611.610.911.315.321.220023.921.111.812.211.912.723.925027.322.512.31211.210.927.331526.223.816.916.517.39.326.240027.523.813.313.312.69.327.55002925.313.713.213.38.72963031.227.71312.512.38.931.280034.130.315.215.615.39.334.1100037.432.81514.914.79.837.412503632.312.812.812.410.936160038.734.411.912.3121138.7200040.733.812.312.512.511.740.7250039.233.113.213.613.112.439.2315035.528.913.413.513.313.235.5400033.826.214.214.114.113.833.8500030.524.314.314.314.41430.5630029.223.11514.814.814.929.2800022.117.515.114.91514.922.11000019.417.815.315.215.214.919.4125002424.217.617.717.716.2241600014.915.114.214.214.314.314.9SPL47.842.426.226.22624.947.8N5.43.60.70.70.70.65.4median 29median 24.2median 14.2median 14.1median 13.8median 12.7median 29Delta6.75.31.21.21.42.26.7hearing rangehide median Fan NoiseAsus NUC 14 Pro
Asus NUC 14 Pro
Ultra 5 125H, Arc 7-Core
Geekom AE7
R9 7940HS, Radeon 780M
Minisforum UH125 Pro
Ultra 5 125H, Arc 7-Core
Aoostar GEM10
R7 6800H, Radeon 680M
Acemagic F2A
Ultra 7 155H, Arc 8-Core
Geekom A5
R7 5800H, Vega 8
Geräuschentwicklung
-4%
-12%
-13%
-2%
-7%
aus / Umgebung *
24
24.4
-2%
24.8
-3%
24.3
-1%
24.9
-4%
25
-4%
Idle min *
26
24.9
4%
35
-35%
36.5
-40%
25.4
2%
28.2
-8%
Idle avg *
26.2
25
5%
35
-34%
36.6
-40%
25.7
2%
28.2
-8%
Idle max *
26.2
25
5%
35
-34%
36.6
-40%
25.7
2%
28.2
-8%
Last avg *
42.4
52
-23%
42.2
-0%
41.7
2%
47.8
-13%
47.8
-13%
Cyberpunk 2077 ultra *
47.7
52
-9%
40.8
14%
40.3
16%
Last max *
47.8
51.4
-8%
43.9
8%
40.8
15%
49
-3%
47.4
1%
Witcher 3 ultra *
40.18
45.23

* ... kleinere Werte sind besser

Temperatur

Das Gehäuse des Asus NUC 14 Pro erwärmt sich unter Last stellenweise deutlich. Maximal verzeichnen wir 55,1 °C auf der Oberseite. Im Leerlauf gibt es keine nennenswerten Auffälligkeiten. Beim SoC erreichen wir beim Stresstest problemlos Werte jenseits der 100-°C-Marke. Der Intel Core Ultra 5 125H ist laut Intel für eine Betriebstemperatur von bis zu 110 °C konzipiert. Diese erreichen wir beim Stresstest, wenngleich die Leistungsaufnahme infolgedessen auf etwa 50 Watt reduziert wird. Dauerhaft ist das Kühlsystem nicht in der Lage, die 64 Watt, welche als PL1 und PL2 definiert sind, dauerhaft abzuführen.

Stresstest Prime95, solo
Stresstest FurMark, solo
Stresstest Prime95 und FurMark
Asus NUC 14 Pro beim Stresstest (Oberseite)
Asus NUC 14 Pro beim Stresstest (Unterseite)
Asus NUC 14 Pro beim Stresstest (geöffnete Unterseite)
Asus NUC 14 Pro beim Stresstest (Rückseite)
Max. Last
 38.3 °C50.5 °C55.1 °C 
 34.9 °C39.3 °C32.9 °C 
 35.1 °C35.9 °C30.5 °C 
Maximal: 55.1 °C
Durchschnitt: 39.2 °C
36.6 °C38.2 °C39.3 °C
33.6 °C36.1 °C37.7 °C
31.1 °C32.7 °C36.6 °C
Maximal: 39.3 °C
Durchschnitt: 35.8 °C
Netzteil (max.)  45.4 °C | Raumtemperatur 21.4 °C | Fluke t3000FC (calibrated)
(-) Die Durchschnittstemperatur auf der Oberseite unter extremer Last ist 39.2 °C. Im Vergleich erhitzte sich der Durchschnitt der Geräteklasse Mini PC auf 31.9 °C.
(-) Die maximale Temperatur auf der Oberseite ist 55.1 °C. Im Vergleich liegt der Klassendurchschnitt bei 35.6 °C (von 24 bis 69.5 °C für die Klasse Mini PC).
(+) Auf der Unterseite messen wir eine maximalen Wert von 39.3 °C (im Vergleich zum Durchschnitt von 36.1 °C).
(+) Ohne Last messen wir eine durchschnittliche Temperatur von 30.8 °C auf der Oberseite. Der Klassendurchschnitt erreicht 31.9 °C.

Energieverwaltung

Den Energiebedarf hat Asus beim NUC 14 Pro relativ gut im Griff. Bei durchschnittlicher Last benötigt unser Testsample nur 55,5 Watt, was im Vergleich zum Miniforum UH125 Pro allerdings ein bisschen mehr ist. Der Grund ist das etwas höhere Power-Limit, welches Asus dem SoC einräumt. Kurzzeitig notieren wir 103,3 Watt, was das 120-Watt-Netzteil aber locker bewältigt.

Asus NUC 14 Pro mit Netzteil (19 V; 6,32 A)
Netzteil (19 V; 6,32 A)
Stromverbrauch
Aus / Standbydarklight 0.48 / 1 Watt
Idledarkmidlight 5.1 / 6.4 / 14.7 Watt
Last midlight 55.5 / 103.3 Watt
 color bar
Legende: min: dark, med: mid, max: light        Metrahit Energy
Derzeit nutzen wir das Metrahit Energy, ein professionelles TRMS Leistungs-Multimeter und PQ Analysator, für unsere Messungen. Mehr Details zu dem Messgerät finden Sie hier. Alle unsere Testmethoden beschreiben wir in diesem Artikel.
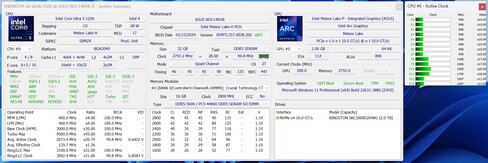
Asus NUC 14 Pro
Ultra 5 125H, Arc 7-Core
Geekom AE7
R9 7940HS, Radeon 780M
Minisforum UH125 Pro
Ultra 5 125H, Arc 7-Core
Aoostar GEM10
R7 6800H, Radeon 680M
Acemagic F2A
Ultra 7 155H, Arc 8-Core
Geekom A5
R7 5800H, Vega 8
Durchschnittliche Intel Arc 7-Core iGPU
 
Durchschnitt der Klasse Mini PC
 
Stromverbrauch
3%
-38%
-11%
-29%
-3%
-1%
-34%
Idle min *
5.1
4.5
12%
11.9
-133%
7.3
-43%
9.1
-78%
6.9
-35%
6.08 ?(3 - 11.9, n=5)
-19%
Idle avg *
6.4
4.7
27%
14.6
-128%
8.7
-36%
10.3
-61%
7.9
-23%
8.62 ?(6.3 - 14.6, n=5)
-35%
Idle max *
14.7
8.1
45%
15.4
-5%
10.4
29%
14.4
2%
8.9
39%
12.3 ?(6.5 - 16, n=5)
16%
Last avg *
55.5
81.8
-47%
48.3
13%
67.2
-21%
54.9
1%
60.8
-10%
Cyberpunk 2077 ultra external monitor *
59.1
71.2
-20%
52.7
11%
58.8
1%
Last max *
103.3
100.3
3%
89.8
13%
101.6
2%
110.4
-7%
89.7
13%

* ... kleinere Werte sind besser

Effizienzübersicht

Performance Rating - Percent
Geekom AE7
AMD Ryzen 9 7940HS, Radeon 780M
96.2 pt
Minisforum UH125 Pro
Intel Core Ultra 5 125H, Arc 7-Core
80.9 pt
Asus NUC 14 Pro
Intel Core Ultra 5 125H, Arc 7-Core
80.4 pt
Acemagic F2A
Intel Core Ultra 7 155H, Arc 8-Core
78.5 pt
Power Consumption
Cinebench R23 Multi Power Efficiency - external Monitor
Geekom AE7
AMD Ryzen 9 7940HS, Radeon 780M
238 Points per Watt +45%
Acemagic F2A
Intel Core Ultra 7 155H, Arc 8-Core
183.7 Points per Watt +12%
Minisforum UH125 Pro
Intel Core Ultra 5 125H, Arc 7-Core
181.1 Points per Watt +11%
Asus NUC 14 Pro
Intel Core Ultra 5 125H, Arc 7-Core
163.7 Points per Watt
Cinebench R23 Single Power Efficiency - external Monitor
Asus NUC 14 Pro
Intel Core Ultra 5 125H, Arc 7-Core
69.4 Points per Watt
Geekom AE7
AMD Ryzen 9 7940HS, Radeon 780M
61.4 Points per Watt -12%
Minisforum UH125 Pro
Intel Core Ultra 5 125H, Arc 7-Core
57.1 Points per Watt -18%
Acemagic F2A
Intel Core Ultra 7 155H, Arc 8-Core
54.2 Points per Watt -22%
Cinebench R15 Multi Efficiency (external Monitor)
Geekom AE7
AMD Ryzen 9 7940HS, Radeon 780M
33.2 Points per Watt +38%
Minisforum UH125 Pro
Intel Core Ultra 5 125H, Arc 7-Core
28 Points per Watt +17%
Acemagic F2A
Intel Core Ultra 7 155H, Arc 8-Core
26.6 Points per Watt +11%
Asus NUC 14 Pro
Intel Core Ultra 5 125H, Arc 7-Core
24 Points per Watt

Energieaufnahme mit externem Monitor

0102030405060708090100Tooltip
Asus NUC 14 Pro Ultra 5 125H, Arc 7-Core; Idle 1min (external Monitor): Ø6.48 (4.52-12)
Minisforum UH125 Pro Ultra 5 125H, Arc 7-Core; Idle 1min (external Monitor): Ø14.4 (13.7-16.8)
Aoostar GEM10 R7 6800H, Radeon 680M; Idle 1min (external Monitor): Ø9.01 (8.45-10.4)
Aoostar GEM10 R7 6800H, Radeon 680M; 1920x1080 The Witcher 3 ultra (external Monitor): Ø63.2 (61.3-86)
Asus NUC 14 Pro Ultra 5 125H, Arc 7-Core; 1280x720 Prime95 28.10 and Furmark 1.25: Ø90.8 (85.1-98.5)
Minisforum UH125 Pro Ultra 5 125H, Arc 7-Core; 1280x720 Prime95 28.10 and Furmark 1.25: Ø82.9 (81.3-87.6)
Aoostar GEM10 R7 6800H, Radeon 680M; 1280x720 Prime95 28.10 and Furmark 1.25: Ø87.3 (85-101.6)
Asus NUC 14 Pro Ultra 5 125H, Arc 7-Core; Cyberpunk 2077 FHD ultra no FSR - external Monitor: Ø59.1 (55.8-67.9)
Minisforum UH125 Pro Ultra 5 125H, Arc 7-Core; Cyberpunk 2077 FHD ultra no FSR - external Monitor: Ø52.7 (51.9-55.2)
Aoostar GEM10 R7 6800H, Radeon 680M; Cyberpunk 2077 FHD ultra no FSR - external Monitor: Ø58.8 (56.1-62.3)
Asus NUC 14 Pro Ultra 5 125H, Arc 7-Core; 3DMark06 Return To Proxycon: Ø55.5 (51.2-61.4)
Minisforum UH125 Pro Ultra 5 125H, Arc 7-Core; 3DMark06 Return To Proxycon: Ø48.4 (45.1-51.5)
Aoostar GEM10 R7 6800H, Radeon 680M; 3DMark06 Return To Proxycon: Ø67.2 (55.9-76)

Energieaufnahme mit externem Monitor

0102030405060708090100Tooltip
Asus NUC 14 Pro Ultra 5 125H, Arc 7-Core; Prime95 V2810 Stress (external Monitor): Ø90.6 (79.2-103.3)
Minisforum UH125 Pro Ultra 5 125H, Arc 7-Core; Prime95 V2810 Stress (external Monitor): Ø83 (67.7-89.8)
Aoostar GEM10 R7 6800H, Radeon 680M; Prime95 V2810 Stress (external Monitor): Ø76.4 (71.4-100.8)
Asus NUC 14 Pro Ultra 5 125H, Arc 7-Core; Cinebench R15 Multi (external Monitor): Ø89.2 (88-90.9)
Minisforum UH125 Pro Ultra 5 125H, Arc 7-Core; Cinebench R15 Multi (external Monitor): Ø80.3 (80-81.4)
Aoostar GEM10 R7 6800H, Radeon 680M; Cinebench R15 Multi (external Monitor): Ø87.9 (81.6-97.1)
Asus NUC 14 Pro Ultra 5 125H, Arc 7-Core; Cinebench R23 Single (external Monitor): Ø24.8 (20.8-58)
Minisforum UH125 Pro Ultra 5 125H, Arc 7-Core; Cinebench R23 Single (external Monitor): Ø28.7 (27-62.8)
Aoostar GEM10 R7 6800H, Radeon 680M; Cinebench R23 Single (external Monitor): Ø30.1 (28.4-45.5)
Asus NUC 14 Pro Ultra 5 125H, Arc 7-Core; Cinebench R23 Multi (external Monitor): Ø88.7 (86.9-91.6)
Minisforum UH125 Pro Ultra 5 125H, Arc 7-Core; Cinebench R23 Multi (external Monitor): Ø80.4 (79.8-81.1)
Aoostar GEM10 R7 6800H, Radeon 680M; Cinebench R23 Multi (external Monitor): Ø78.2 (71.1-95.8)
Asus NUC 14 Pro Ultra 5 125H, Arc 7-Core; 1280x720 FurMark 1.19 GPU Stress Test (external Monitor): Ø56.9 (53.6-63.3)
Minisforum UH125 Pro Ultra 5 125H, Arc 7-Core; 1280x720 FurMark 1.19 GPU Stress Test (external Monitor): Ø48 (46.2-53.5)
Aoostar GEM10 R7 6800H, Radeon 680M; 1280x720 FurMark 1.19 GPU Stress Test (external Monitor): Ø76.4 (69.1-84.4)

Pro

+ stabiles, kompaktes Gehäuse
+ modernes SoC mit P- und E-Kernen
+ gute Systemleistung
+ einfach zu Öffnen (werkzeuglos)
+ 2x Thunderbolt
+ schnelles WLAN
+ viele BIOS-Einstellungen
+ 36 Monate Garantie

Contra

- hörbar unter Last
- hohe DPC Latenzen
- Kühleinheit schnell am Limit

Fazit - Business-Mini-PC mit umfangreichen BIOS-Optionen

Asus NUC 14 Pro im Test: zur Verfügung gestellt von Asus Deutschand

Die bekannten NUC-Mini-PCs, welche einst direkt von Intel vermarktet wurden, werden nunmehr von Asus in gleicher Weise fortgeführt. Auf Basis der Meteor-Lake-Prozessoren bekommen die kompakten PCs einen spürbaren Leistungsschub hinsichtlich der 3D-Performance.

Beim Design hat sich im Vergleich zu den bekannten NUC-Mini-PCs nicht viel verändert. Ein komplett aus Metall gefertigtes Gehäuse wäre wünschenswert, denn im Vergleich zu einigen Kontrahenten hat der Asus NUC 14 Pro in diesem Punkt das Nachsehen. Bei den Dimensionen ist der Mini-PC kleiner als viele andere Geräte. Leider führt diese Bauweise zu einem Kompromiss, den alle Hersteller eingehen müssen. Die Leistung des SoC muss zuverlässig abgeführt werden. Das gelingt dem Asus NUC 14 Pro eigentlich recht gut, wenn keine Dauerlasten anliegen. Asus reizt das Temperaturlimit des Intel Core Ultra 5 125H komplett aus, was sicherlich einigen Anwendern Schweißperlen auf die Stirn treibt. Grundsätzlich sind die Prozessoren für diese Temperaturbereiche konzipiert. Das BIOS bietet unterdessen viele Optionen, welche unter anderem auch das Temperaturlimit des Prozessors beeinflussen. Hier lässt sich manuell ein Limit einstellen. Mit etwas weniger Leistung muss dann aber gerechnet werden. Positiv hervorzuheben ist die hervorragende Anschlussausstattung: Viele USB-Anschlüsse und zweimal Thunderbolt 4 sind an Bord. Schnelles WLAN und 2,5G-LAN sind mit dabei.

Der Asus NUC 14 Pro ist ein leistungsstarker NUC-Mini-PC. Die Anschlussausstattung ist besser als bei den meisten Kontrahenten, und auch die umfangreichen BIOS-Optionen sind ein echtes Kaufargument.

Preislich fällt der Asus NUC 14 Pro nicht komplett aus dem Rahmen. Mit 510 Euro ist das Barebone-Gerät sicherlich kein Schnäppchen. Allerdings kosten die Kontrahenten inklusive SSD, RAM und Betriebssystem schnell mehr als 700 Euro. Als Preis-Leistungs-Tipp kann man sich den Aoostar GEM10 genauer anschauen. Diesen gibt es bereits für 459 US-Dollar.

Hinweis: Wir haben unser Rating-System kürzlich aktualisiert, und die Ergebnisse von Version 8 sind nicht mit den Ergebnissen von Version 7 vergleichbar. Weitere Informationen dazu sind hier verfügbar.

Preis und Verfügbarkeit

Den Asus NUC 14 Pro gibt es in unterschiedlichen Konfigurationen. Der Mini-PC mit Intel Core Ultra 5 125H steht momentan für 500 Euro im virtuellen Regal. Bei Alternate und Notebooksbilliger ist unser Testgerät gelistet. Die Tall-Option mit gleichem SoC bietet zusätzlichen Platz für einen 2,5-Zoll-Datenträger und kann ebenfalls bei Alternate oder Notebooksbilliger geordert werden. Preislich liegt man hier bei ca. 520 Euro.

Asus NUC 14 Pro - 26.08.2024 v8
Sebastian Bade

Gehäuse
81 / 98 → 83%
Konnektivität
58 / 81 → 71%
Gewicht
83%
Leistung Spiele
47 / 80 → 59%
Leistung Anwendungen
80 / 92 → 87%
Workstation
28%
AI Performance
77%
Temperatur
87%
Lautstärke
80%
Durchschnitt
54%
75%
Mini PC - gewichteter Durchschnitt
Weitere Informationen über unsere Bewertung finden Sie hier.
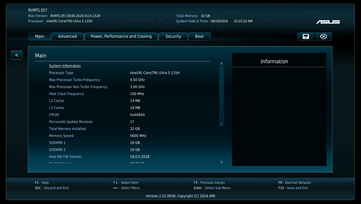
CO2 Emissions
No Data
Materials
25%
Packaging
25%
Power Use
77.5%
Repairability
30%
Software Updates
50%
Total Sustainability Score: 34.6%

Transparenz

Das vorliegende Testmuster wurde dem Autor vom Hersteller oder einem Shop zu Testzwecken leihweise zur Verfügung gestellt. Eine Einflussnahme des Leihstellers auf den Testbericht gab es nicht, der Hersteller hat keine Version des Reviews vor der Veröffentlichung erhalten. Es bestand keine Verpflichtung zur Veröffentlichung.

Preisvergleich

static version load dynamic
Die Kommentare zum Artikel werden geladen
Diesen Artikel kommentieren / Antworten
Teilen Sie diesen Artikel, um uns zu unterstützen. Jeder Link hilft!
> Notebook Test, Laptop Test und News > Tests > Notebook Testberichte > Asus NUC 14 Pro im Test: NUC-Mini-PC mit Intel Core Ultra 5 125H, schneller Intel-Arc-iGPU und 2x Thunderbolt 4
Autor: Sebastian Bade, 28.08.2024 (Update: 28.08.2024)