Notebookcheck Logo

Geekom GT13 Pro Mini-PC im Test - schicke NUC-Alternative mit Intel Core i9-13900H, 32 GB DDR4-RAM und 2-TB-SSD
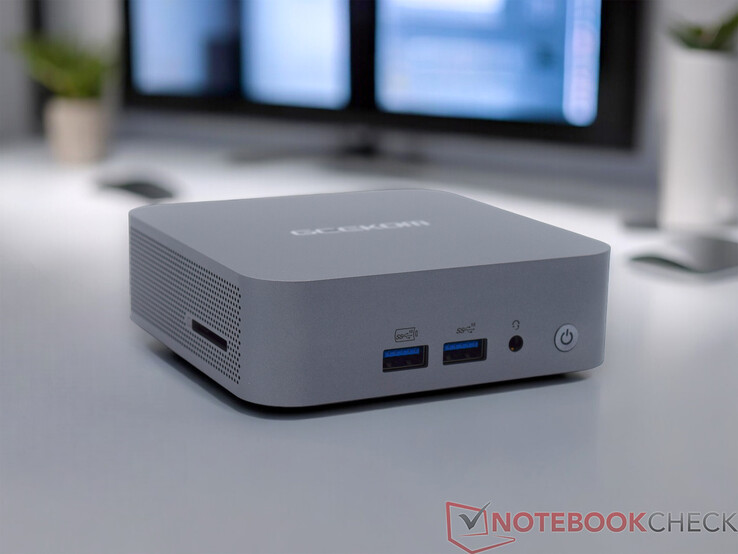
Minimalistischer Mini-PC!

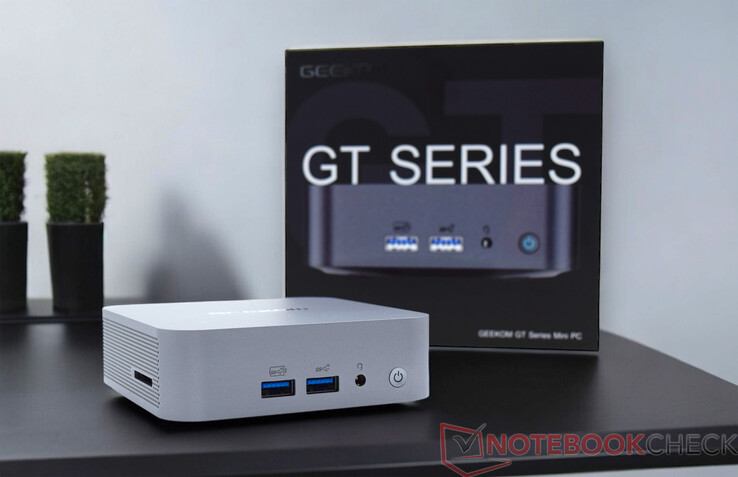
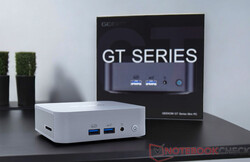
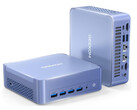
Mit einem schicken Design knüpft Geekom mit dem GT13 Pro an die bestehende Modellpalette an. Der Intel Core i9-13900H verspricht dabei viel, doch wie gut sich das High-End-SoC in dem kleinen 0,5-l-Gehäuse schlägt, schauen wir uns in diesem ausführlichen Review genauer an. Mit 32 GB RAM und einer 2-TB-SSD klotzt der Mini-PC mit einer guten Ausstattung, die sich auch bei den Anschlüssen mit zwei USB4-Ports widerspiegelt.

Mit dem Geekom GT13 Pro hat der Hersteller einen sehr leistungsstarken Mini-PC auf Basis von Intel Prozessoren in seinem Portfolio. Leider verbaut Geekom nur Raptor-Lake-H-Modelle, wenngleich Intel bereits die neueren Meteor-Lake-Prozessoren seit Kurzem auf dem Markt hat. In der besten Ausstattung kommt der Intel Core i9-13900H zum Einsatz, welcher zusammen mit 32 GB RAM und einer 2-TB-SSD gepaart wird. Preislich muss man tief in die Tasche greifen, denn auf der Rechnung stehen schlussendlich 930 Euro. Mit nur 721 Euro ist der Geekom GT13 Pro auf Basis des Intel Core i7-13620H deutlich preiswerter. Mit 32 GB RAM verfügt das preiswertere Modell über gleichviel Arbeitsspeicher, wenngleich der Massenspeicher mit 1 TB nur halb so groß ist.

Wie gut sich der Geekom GT13 Pro gegen andere leistungsstarke Mini-PCs behaupten kann, schauen wir uns nun einmal im Detail an. Aufgrund des Preises sind die Erwartungen an den Hersteller jedoch schon sehr hoch. Eine Übersicht der Vergleichsgeräte, die uns in diesem Review begleiten, haben wir in der folgenden Übersicht zusammengetragen.

Geekom GT13 Pro
Prozessor
Intel Core i9-13900H 14 x 1.9 - 5.4 GHz, 64 W PL2 / Short Burst, 35 W PL1 / Sustained, Raptor Lake-H
Grafikkarte
Intel Iris Xe Graphics G7 96EUs, Kerntakt: 1500 MHz, 31.0.101.5522 DCH
RAM
32 GB 
, DDR4-3200, 2 von 2 belegt, max. 64 GB
Mainboard
Intel Alder Lake-P PCH
Massenspeicher
Acer N7000, 2048 GB 
, 1800 GB verfügbar
Soundkarte
Intel Raptor Lake-P/U/H PCH - cAVS
Anschlüsse
1 USB 2.0, 3 USB 3.1 Gen2, 2 USB 4.0 40 Gbps, 2 Thunderbolt, USB-C Power Delivery (PD), 2 HDMI, 2 DisplayPort, 1 Docking Station Anschluss, Audio Anschlüsse: 3.5mm Klinke, Card Reader: SD-Card (Full-Size)
Netzwerk
Intel Ethernet Controller I225-V (10/100/1000/2500MBit/s), MediaTek Wi-Fi 6E MT7922 160MHz Wireless LAN Card (a/b/g/n = Wi-Fi 4/ac = Wi-Fi 5/ax = Wi-Fi 6/ Wi-Fi 6E 6 GHz), Bluetooth 5.2
Abmessungen
Höhe x Breite x Tiefe (in mm): 37 x 112.4 x 112.4
Betriebssystem
Microsoft Windows 11 Pro
Sonstiges
120-Watt-Power-Adapter, 36 Monate Garantie
Gewicht
440 g, Netzteil: 249 g
Preis
930 EUR
Hinweis: Der Hersteller kann abweichende Bauteile wie Bildschirme, Laufwerke und Speicherriegel mit ähnlichen Spezifikationen unter dem gleichen Modellnamen einsetzen.


mögliche Konkurrenten im Vergleich

Datum
Version
Modell
Memory
Gewicht
Dicke
Preis
06 / 2024
v8Geekom GT13 Pro
i9-13900H, Iris Xe G7 96EUs
32768 MB440 g37 mm930 EUR
06 / 2024
v8Aoostar GEM12
R7 8845HS, Radeon 780M
32768 MB653 g60 mm649 US-Dollar
05 / 2024
v7 (old)Minisforum AtomMan X7 Ti
Ultra 9 185H, Arc 8-Core
32768 MB863 g48.6 mm959 Euro
05 / 2024
v7 (old)Geekom A8
R9 8945HS, Radeon 780M
32768 MB432 g38 mm949 EUR
04 / 2024
v8Geekom XT12 Pro
i9-12900H, Iris Xe G7 96EUs
32768 MB545 g37 mm899 EUR
04 / 2024
v7 (old)Acemagic F2A
Ultra 7 155H, Arc 8-Core
32768 MB768 g57 mm1199 EUR
11 / 2023
v7 (old)Minisforum EliteMini UM780 XTX
R7 7840HS, Radeon 780M
32768 MB750 g52.3 mm879 EUR
08 / 2023
v7 (old)Khadas Mind
i7-1360P, Iris Xe G7 96EUs
32768 MB438 g20 mm799 Euro

Hinweis: Wir haben unser Rating-System aktualisiert und die Ergebnisse von Version 8 sind nicht vergleichbar mit den Ergebnissen von Version 7. Weitere Informationen dazu sind hier verfügbar.

Geekom GT13 Pro
Geekom GT13 Pro
Geekom GT13 Pro
Geekom GT13 Pro
Geekom GT13 Pro
Geekom GT13 Pro
Geekom GT13 Pro
Geekom GT13 Pro
Geekom GT13 Pro
Geekom GT13 Pro
Geekom GT13 Pro
Geekom GT13 Pro
Geekom GT13 Pro und das Netzteil (19 V; 6,32 A)
Netzteil (19 V; 6,32 A)
Geekom GT13 Pro - DDR4-RAM

Gehäuse - 0,5-l-Gehäuse aus Aluminium mit anderer Farbe

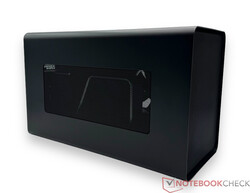
Wer bereits unsere Tests zum Geekom A7 oder dem Geekom A8 gelesen hat, wird beim Anblick des Geekom GT13 Pro sehr viele Gemeinsamkeiten feststellen. Und ja, die Geräte gleichen sich äußerlich. Optisch hebt sich der Geekom GT13 Pro nur durch eine andere Farbgestaltung ab. Gegenüber den beiden silbernen Geräten ist das Gehäuse der abgekupferten Intel Variante in einem Dunkelgrau gehalten. Geekom selbst nennt diese Farbe Basalt-Grau. Subjektiv gefällt uns das Design etwas besser. Schlussendlich teilt der Geekom GT13 Pro damit die gleichen Vor- und Nachteile. Die hervorragende Verarbeitung und die Materialauswahl sind sicherlich ein Argument, welches für das Geekom Gerät sprechen. Außerdem ist der Mini-PC extrem kompakt konstruiert, was hinsichtlich der verbauten Kühleinheit nicht unbedingt von Vorteil ist. Unser Testsample bringt nur 440 Gramm auf die Waage und gehört hier zu den leichtesten Geräten. Für das Netzteil fallen noch einmal 249 Gramm an.

Größenvergleich

146 mm 146 mm 57 mm 768 g145 mm 145 mm 48.6 mm 863 g130 mm 130 mm 60 mm 653 g130 mm 126 mm 52.3 mm 750 g146 mm 105 mm 20 mm 438 g117 mm 112 mm 37 mm 545 g112 mm 112 mm 38 mm 432 g112.4 mm 112.4 mm 37 mm 440 g210 mm 148 mm 1 mm 2.9 g

Ausstattung - gute Auswahl inklusive 2x USB4

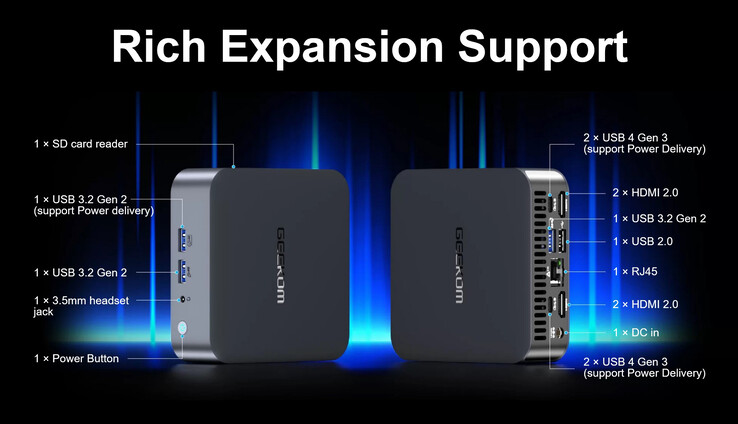
Dass Geekom trotz der extrem kompakten Bauweise viele Anschlussmöglichkeiten liefert, haben wir schon des Öfteren sehen können. Der Geekom GT13 Pro ist keine Ausnahme und bietet viele externe Konnektionsoptionen. Vier USB-A-Schnittstellen sind zahlenmäßig ausreichend, zumal es mit USB4 zwei weitere moderne Schnittstellen gibt, mit der die Einsatzmöglichkeiten des Mini-PC enorm erweitert werden können. Im weiteren Verlauf werfen wir auch wieder einen Blick auf die Leistungsfähigkeit mit einer externen Grafikkarte. Der Geekom GT13 Pro kann zeitgleich mit bis zu vier 4K-Displays umgehen. Auch die Möglichkeit, einen 8K-Bildschirm anzusteuern, besteht. Nicht vergessen und positiv hervorzuheben ist der schnelle SD-Kartenleser, welcher sich auf der linken Seite befindet.

Die externen Anschlüsse am Geekom GT13 Pro (Quelle: Geekom)
SD Card Reader
average JPG Copy Test (av. of 3 runs)
Khadas Mind
Intel Core i7-1360P (AV Pro SD microSD 128 GB V60)
181.79 MB/s +5%
Geekom A5
AMD Ryzen 7 5800H (AV Pro SD microSD 128 GB V60)
176.8 MB/s +2%
Geekom A8
AMD Ryzen 9 8945HS (AV Pro SD microSD 128 GB V60)
174.57 MB/s +1%
Geekom GT13 Pro
Intel Core i9-13900H (AV Pro SD microSD 128 GB V60)
172.63 MB/s
Geekom Mini IT13
Intel Core i9-13900H
154.449 MB/s -11%
Geekom Mini IT12
Intel Core i7-1260P (AV Pro SD microSD 128 GB V60)
129.2 MB/s -25%
Durchschnitt der Klasse Mini PC
  (15.1 - 214, n=26, der letzten 2 Jahre)
91.7 MB/s -47%
Zotac ZBOX Magnus EN173070C
Intel Core i7-11800H (AV Pro SD microSD 128 GB V60)
65 MB/s -62%
maximum AS SSD Seq Read Test (1GB)
Khadas Mind
Intel Core i7-1360P (AV Pro SD microSD 128 GB V60)
200.48 MB/s +12%
Geekom A8
AMD Ryzen 9 8945HS (AV Pro SD microSD 128 GB V60)
182.85 MB/s +2%
Geekom A5
AMD Ryzen 7 5800H (AV Pro SD microSD 128 GB V60)
182.5 MB/s +2%
Geekom Mini IT13
Intel Core i9-13900H
180.4 MB/s 0%
Geekom GT13 Pro
Intel Core i9-13900H (AV Pro SD microSD 128 GB V60)
179.64 MB/s
Geekom Mini IT12
Intel Core i7-1260P (AV Pro SD microSD 128 GB V60)
176.8 MB/s -2%
Durchschnitt der Klasse Mini PC
  (18.2 - 221, n=26, der letzten 2 Jahre)
106.6 MB/s -41%
Zotac ZBOX Magnus EN173070C
Intel Core i7-11800H (AV Pro SD microSD 128 GB V60)
69.9 MB/s -61%

Kommunikation

WLAN-Modul
WLAN-Modul

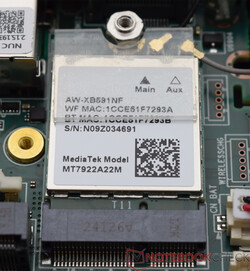
Im Geekom GT13 Pro stoßen wir auf das gleiche Funkmodul, was auch im Geekom A8 zum Einsatz kommt. Das MediaTek Wi-Fi 6E MT7922 WLAN-Modul ermöglicht, mit dem 2,4-GHz- als auch mit dem 5-GHz- und dem 6-GHz-Frequenzbereich zu arbeiten. Unsere Messungen beschränken sich auf das 5- und das 6-GHz-Frequenzband. Wir dokumentieren hier nur geringe Leistungsunterschiede in Verbindung mit unserem Testrouter Asus ROG Rapture GT-AXE11000. Auf ein modernes Wi-Fi-Modul verzichtet Geekom leider. Sowohl der Acemagic F2A als auch der Minisforum AtomMan X7 Ti können mit dem Intel Wi-Fi 7 BE200 durchweg etwas bessere Ergebnisse liefern. Über eine RJ45-Buchse verfügt der Geekom GT13 Pro ebenfalls. Hier sind Datenübertragungsraten bis zu 2,5 GBit/s möglich.

Networking
iperf3 receive AXE11000 6GHz
Acemagic F2A
Intel Wi-Fi 7 BE200 320MHz
1770 (1584min - 1790max) MBit/s +12%
Minisforum AtomMan X7 Ti
Intel Wi-Fi 7 BE200 320MHz
1761 (1734min - 1774max) MBit/s +11%
Geekom GT13 Pro
MediaTek Wi-Fi 6E MT7922 160MHz Wireless LAN Card
1583 (1557min - 1611max) MBit/s
Geekom A8
MediaTek Wi-Fi 6E MT7922 160MHz Wireless LAN Card
1458 (1382min - 1500max) MBit/s -8%
Khadas Mind
Intel Wi-Fi 6E AX211
1445 (1342min - 1468max) MBit/s -9%
Durchschnittliche MediaTek Wi-Fi 6E MT7922 160MHz Wireless LAN Card
  (684 - 1771, n=39)
1433 MBit/s -9%
Durchschnitt der Klasse Mini PC
  (684 - 1771, n=53, der letzten 2 Jahre)
1381 MBit/s -13%
Geekom XT12 Pro
MediaTek Wi-Fi 6E MT7922 160MHz Wireless LAN Card
1152 (576min - 1273max) MBit/s -27%
iperf3 transmit AXE11000 6GHz
Acemagic F2A
Intel Wi-Fi 7 BE200 320MHz
1615 (767min - 1670max) MBit/s +13%
Minisforum AtomMan X7 Ti
Intel Wi-Fi 7 BE200 320MHz
1562 (1198min - 1713max) MBit/s +9%
Geekom GT13 Pro
MediaTek Wi-Fi 6E MT7922 160MHz Wireless LAN Card
1429 (1392min - 1511max) MBit/s
Durchschnittliche MediaTek Wi-Fi 6E MT7922 160MHz Wireless LAN Card
  (394 - 1800, n=38)
1399 MBit/s -2%
Geekom A8
MediaTek Wi-Fi 6E MT7922 160MHz Wireless LAN Card
1356 (669min - 1390max) MBit/s -5%
Khadas Mind
Intel Wi-Fi 6E AX211
1348 (1293min - 1402max) MBit/s -6%
Durchschnitt der Klasse Mini PC
  (394 - 1800, n=53, der letzten 2 Jahre)
1328 MBit/s -7%
Geekom XT12 Pro
MediaTek Wi-Fi 6E MT7922 160MHz Wireless LAN Card
1315 (691min - 1352max) MBit/s -8%
iperf3 receive AXE11000
Minisforum AtomMan X7 Ti
Intel Wi-Fi 7 BE200 320MHz
1599 (802min - 1683max) MBit/s +14%
Geekom GT13 Pro
MediaTek Wi-Fi 6E MT7922 160MHz Wireless LAN Card
1398 (1261min - 1453max) MBit/s
Durchschnittliche MediaTek Wi-Fi 6E MT7922 160MHz Wireless LAN Card
  (707 - 1775, n=55)
1397 MBit/s 0%
Geekom A8
MediaTek Wi-Fi 6E MT7922 160MHz Wireless LAN Card
1101 (606min - 1257max) MBit/s -21%
Khadas Mind
Intel Wi-Fi 6E AX211
1059 (937min - 1173max) MBit/s -24%
Minisforum EliteMini UM780 XTX
Intel Killer Wi-Fi 6E AX1675x (210NGW)
934 (915min - 943max) MBit/s -33%
Durchschnitt der Klasse Mini PC
  (192.9 - 1796, n=113, der letzten 2 Jahre)
932 MBit/s -33%
Geekom XT12 Pro
MediaTek Wi-Fi 6E MT7922 160MHz Wireless LAN Card
892 (460min - 921max) MBit/s -36%
Acemagic F2A
Intel Wi-Fi 7 BE200 320MHz
838 (728min - 926max) MBit/s -40%
Aoostar GEM12
Intel Wi-Fi 6 AX200
740 (676min - 758max) MBit/s -47%
iperf3 transmit AXE11000
Minisforum AtomMan X7 Ti
Intel Wi-Fi 7 BE200 320MHz
1566 (904min - 1695max) MBit/s +37%
Durchschnittliche MediaTek Wi-Fi 6E MT7922 160MHz Wireless LAN Card
  (358 - 1785, n=55)
1279 MBit/s +12%
Geekom GT13 Pro
MediaTek Wi-Fi 6E MT7922 160MHz Wireless LAN Card
1146 (846min - 1308max) MBit/s
Khadas Mind
Intel Wi-Fi 6E AX211
1108 (703min - 1199max) MBit/s -3%
Geekom A8
MediaTek Wi-Fi 6E MT7922 160MHz Wireless LAN Card
1105 (489min - 1222max) MBit/s -4%
Durchschnitt der Klasse Mini PC
  (184.1 - 1776, n=113, der letzten 2 Jahre)
864 MBit/s -25%
Aoostar GEM12
Intel Wi-Fi 6 AX200
736 (369min - 756max) MBit/s -36%
Minisforum EliteMini UM780 XTX
Intel Killer Wi-Fi 6E AX1675x (210NGW)
729 (668min - 784max) MBit/s -36%
Acemagic F2A
Intel Wi-Fi 7 BE200 320MHz
709 (369min - 977max) MBit/s -38%
Geekom XT12 Pro
MediaTek Wi-Fi 6E MT7922 160MHz Wireless LAN Card
589 (295min - 624max) MBit/s -49%
0501001502002503003504004505005506006507007508008509009501000105011001150120012501300135014001450150015501600165017001750Tooltip
Geekom GT13 Pro MediaTek Wi-Fi 6E MT7922 160MHz Wireless LAN Card; iperf3 transmit AXE11000 6GHz; iperf 3.1.3: Ø1429 (1373-1511)
Minisforum AtomMan X7 Ti Intel Wi-Fi 7 BE200 320MHz; iperf3 transmit AXE11000 6GHz; iperf 3.1.3: Ø1562 (1198-1713)
Acemagic F2A Intel Wi-Fi 7 BE200 320MHz; iperf3 transmit AXE11000 6GHz; iperf 3.1.3: Ø1590 (767-1670)
Geekom GT13 Pro MediaTek Wi-Fi 6E MT7922 160MHz Wireless LAN Card; iperf3 receive AXE11000 6GHz; iperf 3.1.3: Ø1582 (1557-1611)
Minisforum AtomMan X7 Ti Intel Wi-Fi 7 BE200 320MHz; iperf3 receive AXE11000 6GHz; iperf 3.1.3: Ø1760 (1734-1774)
Acemagic F2A Intel Wi-Fi 7 BE200 320MHz; iperf3 receive AXE11000 6GHz; iperf 3.1.3: Ø1769 (1584-1790)
Geekom GT13 Pro MediaTek Wi-Fi 6E MT7922 160MHz Wireless LAN Card; iperf3 receive AXE11000; iperf 3.1.3: Ø1397 (1261-1453)
Minisforum AtomMan X7 Ti Intel Wi-Fi 7 BE200 320MHz; iperf3 receive AXE11000; iperf 3.1.3: Ø1572 (802-1683)
Acemagic F2A Intel Wi-Fi 7 BE200 320MHz; iperf3 receive AXE11000; iperf 3.1.3: Ø838 (728-926)
Geekom GT13 Pro MediaTek Wi-Fi 6E MT7922 160MHz Wireless LAN Card; iperf3 transmit AXE11000; iperf 3.1.3: Ø1146 (846-1308)
Minisforum AtomMan X7 Ti Intel Wi-Fi 7 BE200 320MHz; iperf3 transmit AXE11000; iperf 3.1.3: Ø1566 (904-1695)
Acemagic F2A Intel Wi-Fi 7 BE200 320MHz; iperf3 transmit AXE11000; iperf 3.1.3: Ø695 (369-977)

Zubehör

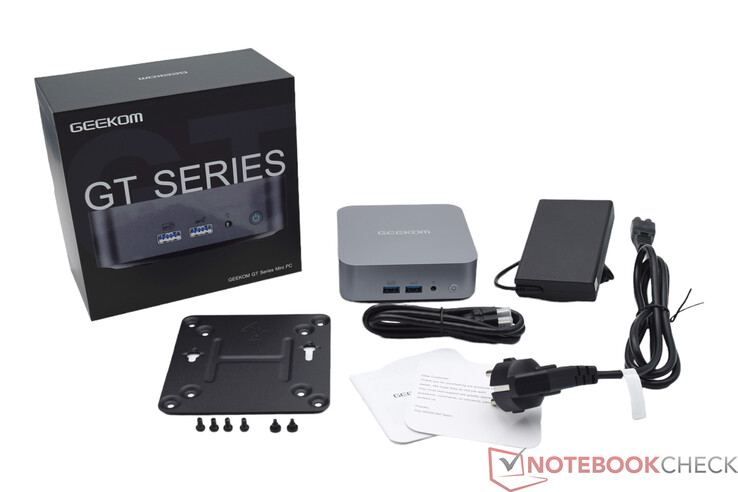
Im Lieferumfang finden wir den Geekom GT13 Pro zusammen mit dem 120-Watt-Netzteil. Des Weiteren befinden sich noch ein HDMI-Kabel sowie eine VESA-Halteplatte im Karton. Ebenfalls legt der Hersteller ein kleines User Manual bei, welches unter anderem die Anschlussmöglichkeiten sowie die Installation von RAM und SSD beschreibt. Alles zusammen liefert Geekom das Produkt in einer kleinen Kartonage. Der Plastikanteil ließe sich dennoch minimieren, denn das HDMI-Kabel und die VESA-Halteplatte sind nochmals separat verpackt.

Lieferumfang des Geekom GT13 Pro

Wartung

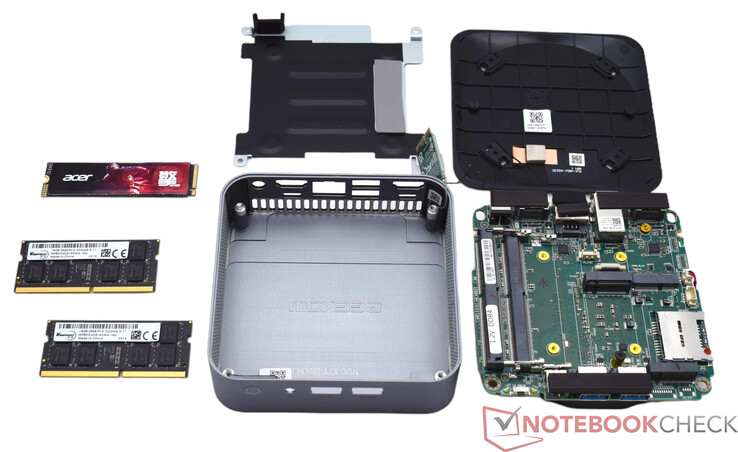
Der Geekom GT13 Pro wird immer zusammen mit RAM und SSD verkauft. Ergo muss das Gerät nicht unbedingt geöffnet werden, um noch fehlende Hardware-Komponenten zu installieren, wie es bei Barebone-Varianten der Fall ist. Wer trotzdem einmal an das Innerste muss, kann den Geekom GT13 Pro von der Unterseite her öffnen. Unter den aufgeklebten Gummifüßen verbergen sich vier Schrauben, welche die Plastikabdeckung fixieren. Mit Vorsicht sollte hier vorgegangen werden, um das WLAN-Antennenkabel nicht zu beschädigen. Unter der Plastikabdeckung befindet sich eine weitere Metallplatte, die ebenfalls demontiert werden muss, wenn man an die SSD oder den RAM gelangen möchte. Das WLAN-Modul lässt sich ebenfalls austauschen. Um an die Kühleinheit zu gelangen, welche der Hersteller als IceBlast 1.5 bewirbt, muss die Platine komplett aus dem Gehäuse genommen werden, was in der Praxis keine große Herausforderung darstellt.

Geekom GT13 Pro zerlegt
Geekom GT13 Pro mit geöffneter Unterseite
Leeres Gehäuse des Geekom GT13 Pro
Platine des Geekom GT13 Pro
Platine mit Kühleinheit des Geekom GT13 Pro

Leistung - Intel-Raptor-Lake-Prozessor mit bis zu 14 Kernen

Den Geekom GT13 Pro gibt es in zwei Versionen. Das Topmodell mit Intel Core i9-13900H sorgt zusammen mit den 14 Kernen für eine gute Multi-Thread-Leistung. Wer den Geldbeutel etwas schonen möchte, kann den schicken Mini-PC auch mit einem Intel Core i7-13620H bekommen. Mit zehn Kernen und 16 Threads sollte auch dieser Prozessor den Alltag gut meistern. 32 GB DDR4 RAM sind immer mit dabei und dient damit als eine solide Grundlage, um auch speicherhungrige Aufgaben zu bewältigen.

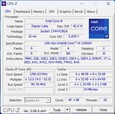
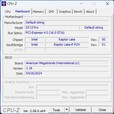
CPU-Z
CPU-Z
CPU-Z
CPU-Z
CPU-Z
CPU-Z
GPU-Z
GPU-Z
HWiNFO
Intel Extreme Tuning Utility

Testbedingungen

Für alle Leistungstests mit dem Geekom GT13 Pro nutzen wir das Energieprofil "Höchstleistung". Abweichungen hierzu gab es nur bei den Energie- und Lautstärkemessungen gemäß unserer Testkriterien. Die herstellerseitigen Power-Limits des Intel Core i9-13900H sind mit 64 Watt (PL2) respektive 35 Watt (PL1) definiert.

Prozessor

Intel Core i9-13900H (Quelle: Geekom)

Der Geekom GT13 Pro bekommt in der Topausstattung einen Intel Core i9-13900H. Im Leistungs-Rating sehen wir aber, dass sich unser Testsample nur im Mittelfeld einsortiert. Aufgrund der geringen Kühlleistung, welche mit der extrem kompakten Bauweise einhergeht, kann das SoC nur mit minimaler TDP von lediglich 35 Watt bei Dauerlast betrieben werden. Die gravierendsten Auswirkungen hat dies bei den Multi-Thread-Benchmarks, bei denen der Intel Core i9-13900H teilweise 20 bis 30 Prozent weniger Leistung abliefert als das, was wir bislang durchschnittlich bei diesem Prozessor dokumentiert haben.

Für weitere Vergleiche und Benchmarks verweisen wir auf unsere CPU-Vergleichstabelle.

Cinebench R15
Cinebench R15
Cinebench R20
Cinebench R20
Cinebench R23
Cinebench R23
Cinebench 2024
Cinebench 2024
Performance Rating - Percent
Geekom A8
AMD Ryzen 9 8945HS
58.2 pt
Minisforum EliteMini UM780 XTX
AMD Ryzen 7 7840HS
57.6 pt
Aoostar GEM12
AMD Ryzen 7 8845HS
57 pt
Minisforum AtomMan X7 Ti
Intel Core Ultra 9 185H
56.9 pt
Durchschnittliche Intel Core i9-13900H
 
56.3 pt
Acemagic F2A
Intel Core Ultra 7 155H
55.6 pt
Geekom GT13 Pro
Intel Core i9-13900H
54.1 pt
Geekom XT12 Pro
Intel Core i9-12900H
52.1 pt
Khadas Mind
Intel Core i7-1360P
51.7 pt
Cinebench 2024
CPU Multi Core
Minisforum AtomMan X7 Ti
Intel Core Ultra 9 185H
1067 Points +52%
Acemagic F2A
Intel Core Ultra 7 155H
1022 Points +45%
Geekom A8
AMD Ryzen 9 8945HS
967 Points +38%
Minisforum EliteMini UM780 XTX
AMD Ryzen 7 7840HS
956 Points +36%
Aoostar GEM12
AMD Ryzen 7 8845HS
933 Points +33%
Durchschnittliche Intel Core i9-13900H
  (680 - 818, n=3)
734 Points +4%
Geekom GT13 Pro
Intel Core i9-13900H
703 Points
Geekom XT12 Pro
Intel Core i9-12900H
578 Points -18%
Khadas Mind
Intel Core i7-1360P
560 Points -20%
CPU Single Core
Khadas Mind
Intel Core i7-1360P
113 Points +9%
Minisforum AtomMan X7 Ti
Intel Core Ultra 9 185H
110 Points +6%
Geekom XT12 Pro
Intel Core i9-12900H
108 Points +4%
Geekom A8
AMD Ryzen 9 8945HS
108 Points +4%
Aoostar GEM12
AMD Ryzen 7 8845HS
107 Points +3%
Minisforum EliteMini UM780 XTX
AMD Ryzen 7 7840HS
106 Points +2%
Acemagic F2A
Intel Core Ultra 7 155H
106 Points +2%
Geekom GT13 Pro
Intel Core i9-13900H
104 Points
Durchschnittliche Intel Core i9-13900H
  (101 - 104, n=3)
102.7 Points -1%
Cinebench R23
Multi Core
Acemagic F2A
Intel Core Ultra 7 155H
18497 Points +42%
Minisforum AtomMan X7 Ti
Intel Core Ultra 9 185H
18016 Points +38%
Durchschnittliche Intel Core i9-13900H
  (11997 - 20385, n=28)
16813 Points +29%
Geekom A8
AMD Ryzen 9 8945HS
16795 Points +29%
Minisforum EliteMini UM780 XTX
AMD Ryzen 7 7840HS
16706 Points +28%
Aoostar GEM12
AMD Ryzen 7 8845HS
16130 Points +24%
Geekom GT13 Pro
Intel Core i9-13900H
13015 Points
Geekom XT12 Pro
Intel Core i9-12900H
11036 Points -15%
Khadas Mind
Intel Core i7-1360P
9859 Points -24%
Single Core
Durchschnittliche Intel Core i9-13900H
  (1297 - 2054, n=26)
1887 Points +10%
Khadas Mind
Intel Core i7-1360P
1877 Points +9%
Minisforum AtomMan X7 Ti
Intel Core Ultra 9 185H
1851 Points +8%
Geekom A8
AMD Ryzen 9 8945HS
1825 Points +6%
Geekom XT12 Pro
Intel Core i9-12900H
1824 Points +6%
Aoostar GEM12
AMD Ryzen 7 8845HS
1783 Points +4%
Minisforum EliteMini UM780 XTX
AMD Ryzen 7 7840HS
1779 Points +4%
Acemagic F2A
Intel Core Ultra 7 155H
1771 Points +3%
Geekom GT13 Pro
Intel Core i9-13900H
1715 Points
Cinebench R15
CPU Single 64Bit
Geekom A8
AMD Ryzen 9 8945HS
287 Points +17%
Minisforum EliteMini UM780 XTX
AMD Ryzen 7 7840HS
279 Points +14%
Aoostar GEM12
AMD Ryzen 7 8845HS
279 Points +14%
Khadas Mind
Intel Core i7-1360P
270 Points +10%
Durchschnittliche Intel Core i9-13900H
  (211 - 297, n=26)
269 Points +10%
Minisforum AtomMan X7 Ti
Intel Core Ultra 9 185H
268 Points +9%
Acemagic F2A
Intel Core Ultra 7 155H
258 Points +5%
Geekom XT12 Pro
Intel Core i9-12900H
251 Points +2%
Geekom GT13 Pro
Intel Core i9-13900H
245 Points
CPU Multi 64Bit
Minisforum AtomMan X7 Ti
Intel Core Ultra 9 185H
2746 Points +22%
Acemagic F2A
Intel Core Ultra 7 155H
2738 Points +21%
Durchschnittliche Intel Core i9-13900H
  (2061 - 3100, n=26)
2676 Points +18%
Geekom A8
AMD Ryzen 9 8945HS
2640 Points +17%
Minisforum EliteMini UM780 XTX
AMD Ryzen 7 7840HS
2608 Points +15%
Aoostar GEM12
AMD Ryzen 7 8845HS
2537 Points +12%
Geekom GT13 Pro
Intel Core i9-13900H
2260 Points
Geekom XT12 Pro
Intel Core i9-12900H
2121 Points -6%
Khadas Mind
Intel Core i7-1360P
1642 Points -27%
Cinebench R20
CPU (Single Core)
Khadas Mind
Intel Core i7-1360P
724 Points +10%
Durchschnittliche Intel Core i9-13900H
  (428 - 792, n=25)
720 Points +9%
Minisforum AtomMan X7 Ti
Intel Core Ultra 9 185H
715 Points +8%
Geekom A8
AMD Ryzen 9 8945HS
711 Points +8%
Geekom XT12 Pro
Intel Core i9-12900H
701 Points +6%
Aoostar GEM12
AMD Ryzen 7 8845HS
691 Points +5%
Minisforum EliteMini UM780 XTX
AMD Ryzen 7 7840HS
690 Points +5%
Acemagic F2A
Intel Core Ultra 7 155H
679 Points +3%
Geekom GT13 Pro
Intel Core i9-13900H
659 Points
CPU (Multi Core)
Minisforum AtomMan X7 Ti
Intel Core Ultra 9 185H
7196 Points +44%
Acemagic F2A
Intel Core Ultra 7 155H
7188 Points +43%
Geekom A8
AMD Ryzen 9 8945HS
6591 Points +31%
Durchschnittliche Intel Core i9-13900H
  (4935 - 7716, n=25)
6533 Points +30%
Minisforum EliteMini UM780 XTX
AMD Ryzen 7 7840HS
6509 Points +30%
Aoostar GEM12
AMD Ryzen 7 8845HS
6346 Points +27%
Geekom GT13 Pro
Intel Core i9-13900H
5013 Points
Geekom XT12 Pro
Intel Core i9-12900H
4294 Points -14%
Khadas Mind
Intel Core i7-1360P
3820 Points -24%
Cinebench R11.5
CPU Single 64Bit
Geekom A8
AMD Ryzen 9 8945HS
3.45 Points +16%
Minisforum EliteMini UM780 XTX
AMD Ryzen 7 7840HS
3.33 Points +12%
Aoostar GEM12
AMD Ryzen 7 8845HS
3.32 Points +11%
Khadas Mind
Intel Core i7-1360P
3.27 Points +10%
Minisforum AtomMan X7 Ti
Intel Core Ultra 9 185H
3.27 Points +10%
Acemagic F2A
Intel Core Ultra 7 155H
3.13 Points +5%
Geekom XT12 Pro
Intel Core i9-12900H
2.99 Points 0%
Geekom GT13 Pro
Intel Core i9-13900H
2.98 Points
Durchschnittliche Intel Core i9-13900H
  (2.93 - 3, n=3)
2.97 Points 0%
CPU Multi 64Bit
Minisforum AtomMan X7 Ti
Intel Core Ultra 9 185H
33.95 Points +24%
Acemagic F2A
Intel Core Ultra 7 155H
33.49 Points +22%
Geekom A8
AMD Ryzen 9 8945HS
31.31 Points +14%
Minisforum EliteMini UM780 XTX
AMD Ryzen 7 7840HS
30.25 Points +10%
Aoostar GEM12
AMD Ryzen 7 8845HS
29.76 Points +8%
Durchschnittliche Intel Core i9-13900H
  (27.5 - 29.7, n=3)
28.5 Points +4%
Geekom GT13 Pro
Intel Core i9-13900H
27.48 Points
Geekom XT12 Pro
Intel Core i9-12900H
21.11 Points -23%
Khadas Mind
Intel Core i7-1360P
19.54 Points -29%
Cinebench R10
Rendering Single CPUs 64Bit
Khadas Mind
Intel Core i7-1360P
15227 Points +10%
Geekom A8
AMD Ryzen 9 8945HS
14561 Points +5%
Minisforum AtomMan X7 Ti
Intel Core Ultra 9 185H
14374 Points +4%
Minisforum EliteMini UM780 XTX
AMD Ryzen 7 7840HS
14177 Points +3%
Aoostar GEM12
AMD Ryzen 7 8845HS
14163 Points +2%
Acemagic F2A
Intel Core Ultra 7 155H
13938 Points +1%
Geekom GT13 Pro
Intel Core i9-13900H
13820 Points
Durchschnittliche Intel Core i9-13900H
  (13515 - 13820, n=3)
13696 Points -1%
Geekom XT12 Pro
Intel Core i9-12900H
13378 Points -3%
Rendering Multiple CPUs 64Bit
Acemagic F2A
Intel Core Ultra 7 155H
95005 Points +20%
Geekom A8
AMD Ryzen 9 8945HS
90144 Points +14%
Minisforum AtomMan X7 Ti
Intel Core Ultra 9 185H
88902 Points +13%
Minisforum EliteMini UM780 XTX
AMD Ryzen 7 7840HS
87064 Points +10%
Aoostar GEM12
AMD Ryzen 7 8845HS
85872 Points +9%
Geekom GT13 Pro
Intel Core i9-13900H
79014 Points
Durchschnittliche Intel Core i9-13900H
  (76558 - 79856, n=3)
78476 Points -1%
Geekom XT12 Pro
Intel Core i9-12900H
69621 Points -12%
Khadas Mind
Intel Core i7-1360P
61639 Points -22%
Blender - v2.79 BMW27 CPU
Khadas Mind
Intel Core i7-1360P
324 Seconds * -24%
Geekom XT12 Pro
Intel Core i9-12900H
296 Seconds * -13%
Geekom GT13 Pro
Intel Core i9-13900H
262 Seconds *
Durchschnittliche Intel Core i9-13900H
  (166 - 268, n=24)
205 Seconds * +22%
Aoostar GEM12
AMD Ryzen 7 8845HS
197 Seconds * +25%
Geekom A8
AMD Ryzen 9 8945HS
196 Seconds * +25%
Minisforum EliteMini UM780 XTX
AMD Ryzen 7 7840HS
192 Seconds * +27%
Acemagic F2A
Intel Core Ultra 7 155H
178 Seconds * +32%
Minisforum AtomMan X7 Ti
Intel Core Ultra 9 185H
171 Seconds * +35%
wPrime 2.10
32m
Khadas Mind
Intel Core i7-1360P
4.957 s * -41%
Geekom XT12 Pro
Intel Core i9-12900H
4.111 s * -17%
Acemagic F2A
Intel Core Ultra 7 155H
3.523 s * -0%
Geekom GT13 Pro
Intel Core i9-13900H
3.518 s *
Durchschnittliche Intel Core i9-13900H
  (3.14 - 3.52, n=3)
3.39 s * +4%
Minisforum AtomMan X7 Ti
Intel Core Ultra 9 185H
3.254 s * +8%
Aoostar GEM12
AMD Ryzen 7 8845HS
2.703 s * +23%
Minisforum EliteMini UM780 XTX
AMD Ryzen 7 7840HS
2.626 s * +25%
Geekom A8
AMD Ryzen 9 8945HS
2.563 s * +27%
1024m
Minisforum AtomMan X7 Ti
Intel Core Ultra 9 185H
441.275 s * -7%
Geekom GT13 Pro
Intel Core i9-13900H
412.775 s *
Durchschnittliche Intel Core i9-13900H
  (179.5 - 429, n=3)
341 s * +17%
Khadas Mind
Intel Core i7-1360P
240.083 s * +42%
Geekom XT12 Pro
Intel Core i9-12900H
202.68 s * +51%
Acemagic F2A
Intel Core Ultra 7 155H
139.617 s * +66%
Aoostar GEM12
AMD Ryzen 7 8845HS
98.896 s * +76%
Minisforum EliteMini UM780 XTX
AMD Ryzen 7 7840HS
72.819 s * +82%
Geekom A8
AMD Ryzen 9 8945HS
67.933 s * +84%
X264 HD Benchmark 4.0
Pass 1
Minisforum AtomMan X7 Ti
Intel Core Ultra 9 185H
335.5 (329min - 340max) fps +12%
Acemagic F2A
Intel Core Ultra 7 155H
325 (323min - 328max) fps +8%
Geekom GT13 Pro
Intel Core i9-13900H
300.5 (288min - 319max) fps
Minisforum EliteMini UM780 XTX
AMD Ryzen 7 7840HS
298 (288min - 300max) fps -1%
Geekom A8
AMD Ryzen 9 8945HS
298 (297min - 305max) fps -1%
Durchschnittliche Intel Core i9-13900H
  (284 - 301, n=3)
294 fps -2%
Aoostar GEM12
AMD Ryzen 7 8845HS
289 (286min - 292max) fps -4%
Khadas Mind
Intel Core i7-1360P
273 (264min - 275max) fps -9%
Geekom XT12 Pro
Intel Core i9-12900H
262 (259min - 282max) fps -13%
Pass 2
Minisforum AtomMan X7 Ti
Intel Core Ultra 9 185H
158.2 (157.4min - 158.8max) fps +39%
Acemagic F2A
Intel Core Ultra 7 155H
154.15 (153.8min - 154.3max) fps +35%
Geekom A8
AMD Ryzen 9 8945HS
150.65 (150.4min - 154.2max) fps +32%
Minisforum EliteMini UM780 XTX
AMD Ryzen 7 7840HS
149.3 (148.8min - 149.8max) fps +31%
Aoostar GEM12
AMD Ryzen 7 8845HS
143.7 (143min - 145.2max) fps +26%
Durchschnittliche Intel Core i9-13900H
  (110.2 - 138.6, n=3)
120.9 fps +6%
Geekom GT13 Pro
Intel Core i9-13900H
113.95 (106.5min - 136.6max) fps
Khadas Mind
Intel Core i7-1360P
94.7 (87.4min - 101.7max) fps -17%
Geekom XT12 Pro
Intel Core i9-12900H
92.2 (91min - 114.5max) fps -19%
WinRAR - Result
Geekom XT12 Pro
Intel Core i9-12900H
7945 KB/s +17%
Minisforum AtomMan X7 Ti
Intel Core Ultra 9 185H
7940 KB/s +17%
Geekom A8
AMD Ryzen 9 8945HS
7843 KB/s +15%
Acemagic F2A
Intel Core Ultra 7 155H
7723 KB/s +14%
Minisforum EliteMini UM780 XTX
AMD Ryzen 7 7840HS
7699 KB/s +13%
Durchschnittliche Intel Core i9-13900H
  (6365 - 9303, n=3)
7489 KB/s +10%
Aoostar GEM12
AMD Ryzen 7 8845HS
7327 KB/s +8%
Geekom GT13 Pro
Intel Core i9-13900H
6800 KB/s
Khadas Mind
Intel Core i7-1360P
6079 KB/s -11%
TrueCrypt
AES Mean 100MB
Geekom A8
AMD Ryzen 9 8945HS
15.4 GB/s +17%
Minisforum EliteMini UM780 XTX
AMD Ryzen 7 7840HS
14.9 GB/s +13%
Aoostar GEM12
AMD Ryzen 7 8845HS
14.4 GB/s +9%
Durchschnittliche Intel Core i9-13900H
  (13.2 - 14.8, n=3)
13.8 GB/s +5%
Geekom GT13 Pro
Intel Core i9-13900H
13.2 GB/s
Minisforum AtomMan X7 Ti
Intel Core Ultra 9 185H
11.3 GB/s -14%
Geekom XT12 Pro
Intel Core i9-12900H
11.2 GB/s -15%
Acemagic F2A
Intel Core Ultra 7 155H
10.6 GB/s -20%
Khadas Mind
Intel Core i7-1360P
9.5 GB/s -28%
Twofish Mean 100MB
Geekom GT13 Pro
Intel Core i9-13900H
2.4 GB/s
Durchschnittliche Intel Core i9-13900H
  (2.3 - 2.5, n=3)
2.4 GB/s 0%
Minisforum EliteMini UM780 XTX
AMD Ryzen 7 7840HS
2.1 GB/s -12%
Geekom A8
AMD Ryzen 9 8945HS
2 GB/s -17%
Aoostar GEM12
AMD Ryzen 7 8845HS
2 GB/s -17%
Geekom XT12 Pro
Intel Core i9-12900H
1.9 GB/s -21%
Minisforum AtomMan X7 Ti
Intel Core Ultra 9 185H
1.8 GB/s -25%
Khadas Mind
Intel Core i7-1360P
1.7 GB/s -29%
Acemagic F2A
Intel Core Ultra 7 155H
1.7 GB/s -29%
Serpent Mean 100MB
Geekom A8
AMD Ryzen 9 8945HS
1.4 GB/s +17%
Minisforum EliteMini UM780 XTX
AMD Ryzen 7 7840HS
1.3 GB/s +8%
Aoostar GEM12
AMD Ryzen 7 8845HS
1.3 GB/s +8%
Durchschnittliche Intel Core i9-13900H
  (1.2 - 1.4, n=3)
1.3 GB/s +8%
Geekom GT13 Pro
Intel Core i9-13900H
1.2 GB/s
Geekom XT12 Pro
Intel Core i9-12900H
1.1 GB/s -8%
Minisforum AtomMan X7 Ti
Intel Core Ultra 9 185H
1.1 GB/s -8%
Acemagic F2A
Intel Core Ultra 7 155H
1 GB/s -17%
Khadas Mind
Intel Core i7-1360P
0.935 GB/s -22%
Geekbench 5.5
Multi-Core
Minisforum AtomMan X7 Ti
Intel Core Ultra 9 185H
13392 Points +19%
Acemagic F2A
Intel Core Ultra 7 155H
12662 Points +12%
Durchschnittliche Intel Core i9-13900H
  (9094 - 15410, n=26)
12649 Points +12%
Geekom A8
AMD Ryzen 9 8945HS
12481 Points +11%
Minisforum EliteMini UM780 XTX
AMD Ryzen 7 7840HS
12177 Points +8%
Aoostar GEM12
AMD Ryzen 7 8845HS
12143 Points +8%
Geekom GT13 Pro
Intel Core i9-13900H
11283 Points
Geekom XT12 Pro
Intel Core i9-12900H
10028 Points -11%
Khadas Mind
Intel Core i7-1360P
9159 Points -19%
Single-Core
Geekom A8
AMD Ryzen 9 8945HS
1996 Points +8%
Aoostar GEM12
AMD Ryzen 7 8845HS
1958 Points +6%
Minisforum EliteMini UM780 XTX
AMD Ryzen 7 7840HS
1943 Points +6%
Durchschnittliche Intel Core i9-13900H
  (1140 - 2043, n=26)
1895 Points +3%
Minisforum AtomMan X7 Ti
Intel Core Ultra 9 185H
1856 Points +1%
Geekom GT13 Pro
Intel Core i9-13900H
1841 Points
Khadas Mind
Intel Core i7-1360P
1824 Points -1%
Geekom XT12 Pro
Intel Core i9-12900H
1790 Points -3%
Acemagic F2A
Intel Core Ultra 7 155H
1746 Points -5%
Geekbench 5.0
5.0 Multi-Core
Minisforum AtomMan X7 Ti
Intel Core Ultra 9 185H
13228 Points +18%
Acemagic F2A
Intel Core Ultra 7 155H
12438 Points +11%
Geekom A8
AMD Ryzen 9 8945HS
12386 Points +11%
Durchschnittliche Intel Core i9-13900H
  (11168 - 14172, n=8)
12381 Points +11%
Aoostar GEM12
AMD Ryzen 7 8845HS
12086 Points +8%
Minisforum EliteMini UM780 XTX
AMD Ryzen 7 7840HS
11933 Points +7%
Geekom GT13 Pro
Intel Core i9-13900H
11168 Points
Geekom XT12 Pro
Intel Core i9-12900H
9892 Points -11%
Khadas Mind
Intel Core i7-1360P
9000 Points -19%
5.0 Single-Core
Geekom A8
AMD Ryzen 9 8945HS
1906 Points +5%
Minisforum EliteMini UM780 XTX
AMD Ryzen 7 7840HS
1900 Points +5%
Aoostar GEM12
AMD Ryzen 7 8845HS
1900 Points +5%
Khadas Mind
Intel Core i7-1360P
1826 Points +1%
Minisforum AtomMan X7 Ti
Intel Core Ultra 9 185H
1821 Points +1%
Geekom GT13 Pro
Intel Core i9-13900H
1810 Points
Durchschnittliche Intel Core i9-13900H
  (1654 - 1958, n=8)
1801 Points 0%
Geekom XT12 Pro
Intel Core i9-12900H
1710 Points -6%
Acemagic F2A
Intel Core Ultra 7 155H
1708 Points -6%
Geekbench 4.4
64 Bit Single-Core Score
Geekom A8
AMD Ryzen 9 8945HS
8178 Points +5%
Khadas Mind
Intel Core i7-1360P
8084 Points +4%
Minisforum EliteMini UM780 XTX
AMD Ryzen 7 7840HS
8048 Points +3%
Aoostar GEM12
AMD Ryzen 7 8845HS
8034 Points +3%
Durchschnittliche Intel Core i9-13900H
  (7253 - 8498, n=9)
7955 Points +2%
Geekom GT13 Pro
Intel Core i9-13900H
7787 Points
Geekom XT12 Pro
Intel Core i9-12900H
7635 Points -2%
Minisforum AtomMan X7 Ti
Intel Core Ultra 9 185H
7602 Points -2%
Acemagic F2A
Intel Core Ultra 7 155H
6927 Points -11%
64 Bit Multi-Core Score
Geekom A8
AMD Ryzen 9 8945HS
49269 Points +18%
Minisforum EliteMini UM780 XTX
AMD Ryzen 7 7840HS
48743 Points +16%
Minisforum AtomMan X7 Ti
Intel Core Ultra 9 185H
47960 Points +15%
Aoostar GEM12
AMD Ryzen 7 8845HS
47777 Points +14%
Durchschnittliche Intel Core i9-13900H
  (41851 - 54848, n=9)
47143 Points +13%
Acemagic F2A
Intel Core Ultra 7 155H
45250 Points +8%
Geekom GT13 Pro
Intel Core i9-13900H
41851 Points
Geekom XT12 Pro
Intel Core i9-12900H
37359 Points -11%
Khadas Mind
Intel Core i7-1360P
33052 Points -21%
3DMark 11 - 1280x720 Performance Physics
Geekom A8
AMD Ryzen 9 8945HS
22978 Points +25%
Minisforum EliteMini UM780 XTX
AMD Ryzen 7 7840HS
22960 Points +25%
Minisforum AtomMan X7 Ti
Intel Core Ultra 9 185H
21875 Points +19%
Durchschnittliche Intel Core i9-13900H
  (15540 - 25420, n=29)
21781 Points +18%
Aoostar GEM12
AMD Ryzen 7 8845HS
21762 Points +18%
Acemagic F2A
Intel Core Ultra 7 155H
20846 Points +13%
Geekom GT13 Pro
Intel Core i9-13900H
18383 Points
Geekom XT12 Pro
Intel Core i9-12900H
16634 Points -10%
Khadas Mind
Intel Core i7-1360P
15245 Points -17%
7-Zip 18.03
7z b 4
Minisforum EliteMini UM780 XTX
AMD Ryzen 7 7840HS
72684 MIPS +39%
Minisforum AtomMan X7 Ti
Intel Core Ultra 9 185H
71934 MIPS +37%
Geekom A8
AMD Ryzen 9 8945HS
71874 MIPS +37%
Aoostar GEM12
AMD Ryzen 7 8845HS
70733 MIPS +35%
Acemagic F2A
Intel Core Ultra 7 155H
66438 MIPS +27%
Durchschnittliche Intel Core i9-13900H
  (45045 - 79032, n=25)
66435 MIPS +27%
Geekom GT13 Pro
Intel Core i9-13900H
52479 MIPS
Geekom XT12 Pro
Intel Core i9-12900H
47146 MIPS -10%
Khadas Mind
Intel Core i7-1360P
43201 MIPS -18%
7z b 4 -mmt1
Geekom A8
AMD Ryzen 9 8945HS
6668 MIPS +5%
Aoostar GEM12
AMD Ryzen 7 8845HS
6644 MIPS +5%
Minisforum EliteMini UM780 XTX
AMD Ryzen 7 7840HS
6563 MIPS +4%
Geekom GT13 Pro
Intel Core i9-13900H
6321 MIPS
Durchschnittliche Intel Core i9-13900H
  (3665 - 6600, n=25)
6054 MIPS -4%
Khadas Mind
Intel Core i7-1360P
5904 MIPS -7%
Geekom XT12 Pro
Intel Core i9-12900H
5881 MIPS -7%
Minisforum AtomMan X7 Ti
Intel Core Ultra 9 185H
5560 MIPS -12%
Acemagic F2A
Intel Core Ultra 7 155H
5485 MIPS -13%
HWBOT x265 Benchmark v2.2 - 4k Preset
Minisforum EliteMini UM780 XTX
AMD Ryzen 7 7840HS
20.9 fps +48%
Minisforum AtomMan X7 Ti
Intel Core Ultra 9 185H
20.9 fps +48%
Geekom A8
AMD Ryzen 9 8945HS
20.9 fps +48%
Aoostar GEM12
AMD Ryzen 7 8845HS
20.5 fps +45%
Acemagic F2A
Intel Core Ultra 7 155H
19.6 fps +39%
Durchschnittliche Intel Core i9-13900H
  (14.1 - 22.3, n=25)
18.5 fps +31%
Geekom GT13 Pro
Intel Core i9-13900H
14.1 fps
Geekom XT12 Pro
Intel Core i9-12900H
12.3 fps -13%
Khadas Mind
Intel Core i7-1360P
11.4 fps -19%
R Benchmark 2.5 - Overall mean
Acemagic F2A
Intel Core Ultra 7 155H
0.4652 sec * -6%
Geekom XT12 Pro
Intel Core i9-12900H
0.4632 sec * -5%
Minisforum AtomMan X7 Ti
Intel Core Ultra 9 185H
0.4627 sec * -5%
Durchschnittliche Intel Core i9-13900H
  (0.4052 - 0.723, n=25)
0.4493 sec * -2%
Khadas Mind
Intel Core i7-1360P
0.4463 sec * -2%
Geekom GT13 Pro
Intel Core i9-13900H
0.4395 sec *
Aoostar GEM12
AMD Ryzen 7 8845HS
0.4392 sec * -0%
Minisforum EliteMini UM780 XTX
AMD Ryzen 7 7840HS
0.4354 sec * +1%
Geekom A8
AMD Ryzen 9 8945HS
0.4346 sec * +1%
LibreOffice - 20 Documents To PDF
Minisforum EliteMini UM780 XTX
AMD Ryzen 7 7840HS
53.9 s * -37%
Geekom A8
AMD Ryzen 9 8945HS
49.9 s * -27%
Minisforum AtomMan X7 Ti
Intel Core Ultra 9 185H
49.5 s * -26%
Durchschnittliche Intel Core i9-13900H
  (34.4 - 82.8, n=25)
47.6 s * -21%
Aoostar GEM12
AMD Ryzen 7 8845HS
47.5 s * -21%
Acemagic F2A
Intel Core Ultra 7 155H
44.5 s * -13%
Khadas Mind
Intel Core i7-1360P
40.9 s * -4%
Geekom XT12 Pro
Intel Core i9-12900H
39.6 s * -1%
Geekom GT13 Pro
Intel Core i9-13900H
39.4 s *
WebXPRT 3 - Overall
Minisforum EliteMini UM780 XTX
AMD Ryzen 7 7840HS
324 Points +7%
Khadas Mind
Intel Core i7-1360P
316 Points +4%
Geekom A8
AMD Ryzen 9 8945HS
316 Points +4%
Geekom GT13 Pro
Intel Core i9-13900H
304 Points
Durchschnittliche Intel Core i9-13900H
  (171.4 - 340, n=20)
302 Points -1%
Aoostar GEM12
AMD Ryzen 7 8845HS
300 Points -1%
Geekom XT12 Pro
Intel Core i9-12900H
291 Points -4%
Acemagic F2A
Intel Core Ultra 7 155H
276 Points -9%
Minisforum AtomMan X7 Ti
Intel Core Ultra 9 185H
264 Points -13%
Mozilla Kraken 1.1 - Total
Acemagic F2A
Intel Core Ultra 7 155H
535 ms * -3%
Minisforum AtomMan X7 Ti
Intel Core Ultra 9 185H
532 ms * -3%
Minisforum EliteMini UM780 XTX
AMD Ryzen 7 7840HS
517 ms * -0%
Aoostar GEM12
AMD Ryzen 7 8845HS
517 ms * -0%
Geekom GT13 Pro
Intel Core i9-13900H
517 ms *
Geekom XT12 Pro
Intel Core i9-12900H
511 ms * +1%
Durchschnittliche Intel Core i9-13900H
  (456 - 828, n=24)
507 ms * +2%
Geekom A8
AMD Ryzen 9 8945HS
505 ms * +2%
Khadas Mind
Intel Core i7-1360P
502 ms * +3%
3DMark
1920x1080 Fire Strike Physics
Minisforum EliteMini UM780 XTX
AMD Ryzen 7 7840HS
28906 Points +22%
Geekom A8
AMD Ryzen 9 8945HS
27732 Points +17%
Durchschnittliche Intel Core i9-13900H
  (17733 - 32664, n=30)
26658 Points +13%
Aoostar GEM12
AMD Ryzen 7 8845HS
26194 Points +11%
Minisforum AtomMan X7 Ti
Intel Core Ultra 9 185H
26038 Points +10%
Acemagic F2A
Intel Core Ultra 7 155H
25043 Points +6%
Geekom GT13 Pro
Intel Core i9-13900H
23626 Points
Geekom XT12 Pro
Intel Core i9-12900H
22242 Points -6%
Khadas Mind
Intel Core i7-1360P
18564 Points -21%
2560x1440 Time Spy CPU
Durchschnittliche Intel Core i9-13900H
  (7863 - 13726, n=29)
11535 Points +23%
Minisforum AtomMan X7 Ti
Intel Core Ultra 9 185H
11481 Points +23%
Geekom A8
AMD Ryzen 9 8945HS
11298 Points +21%
Minisforum EliteMini UM780 XTX
AMD Ryzen 7 7840HS
11159 Points +19%
Aoostar GEM12
AMD Ryzen 7 8845HS
10824 Points +16%
Acemagic F2A
Intel Core Ultra 7 155H
10014 Points +7%
Geekom GT13 Pro
Intel Core i9-13900H
9347 Points
Geekom XT12 Pro
Intel Core i9-12900H
7985 Points -15%
Khadas Mind
Intel Core i7-1360P
7942 Points -15%
Super Pi mod 1.5 XS 1M - 1M
Minisforum EliteMini UM780 XTX
AMD Ryzen 7 7840HS
8.774 s * -18%
Geekom XT12 Pro
Intel Core i9-12900H
7.454 s * -0%
Geekom GT13 Pro
Intel Core i9-13900H
7.445 s *
Aoostar GEM12
AMD Ryzen 7 8845HS
7.331 s * +2%
Acemagic F2A
Intel Core Ultra 7 155H
7.168 s * +4%
Geekom A8
AMD Ryzen 9 8945HS
7.045 s * +5%
Durchschnittliche Intel Core i9-13900H
  (6.16 - 7.51, n=3)
7.04 s * +5%
Khadas Mind
Intel Core i7-1360P
6.784 s * +9%
Minisforum AtomMan X7 Ti
Intel Core Ultra 9 185H
6.751 s * +9%
Super Pi mod 1.5 XS 2M - 2M
Minisforum EliteMini UM780 XTX
AMD Ryzen 7 7840HS
21.271 s * -31%
Aoostar GEM12
AMD Ryzen 7 8845HS
18.138 s * -12%
Geekom A8
AMD Ryzen 9 8945HS
17.549 s * -8%
Geekom XT12 Pro
Intel Core i9-12900H
16.424 s * -1%
Geekom GT13 Pro
Intel Core i9-13900H
16.234 s *
Acemagic F2A
Intel Core Ultra 7 155H
16.125 s * +1%
Durchschnittliche Intel Core i9-13900H
  (13.8 - 16.4, n=3)
15.5 s * +5%
Minisforum AtomMan X7 Ti
Intel Core Ultra 9 185H
14.879 s * +8%
Khadas Mind
Intel Core i7-1360P
14.771 s * +9%
Super Pi Mod 1.5 XS 32M - 32M
Minisforum EliteMini UM780 XTX
AMD Ryzen 7 7840HS
724.411 s * -74%
Aoostar GEM12
AMD Ryzen 7 8845HS
665.289 s * -60%
Geekom A8
AMD Ryzen 9 8945HS
624.748 s * -50%
Geekom GT13 Pro
Intel Core i9-13900H
417.103 s *
Durchschnittliche Intel Core i9-13900H
  (350 - 425, n=3)
397 s * +5%
Geekom XT12 Pro
Intel Core i9-12900H
396.475 s * +5%
Acemagic F2A
Intel Core Ultra 7 155H
394.754 s * +5%
Khadas Mind
Intel Core i7-1360P
384.074 s * +8%
Minisforum AtomMan X7 Ti
Intel Core Ultra 9 185H
304.446 s * +27%

* ... kleinere Werte sind besser

Cinebench R10 Rendering Single 32Bit
9550
Cinebench R10 Shading 64Bit
15509 Points
Cinebench R10 Rendering Multiple CPUs 64Bit
79014 Points
Cinebench R10 Rendering Single CPUs 64Bit
13820 Points
Cinebench R10 Shading 32Bit
14766
Cinebench R10 Rendering Multiple CPUs 32Bit
53438
Cinebench R11.5 CPU Single 32Bit
2.66 Points
Cinebench R11.5 CPU Multi 32Bit
24.38 Points
Cinebench R11.5 OpenGL 32Bit
96.79 fps
Cinebench R11.5 CPU Single 64Bit
2.98 Points
Cinebench R11.5 CPU Multi 64Bit
27.48 Points
Cinebench R11.5 OpenGL 64Bit
98.43 fps
Cinebench R15 CPU Single 64Bit
245 Points
Cinebench R15 CPU Multi 64Bit
2260 Points
Cinebench R15 Ref. Match 64Bit
97.8 %
Cinebench R15 OpenGL 64Bit
103.95 fps
Cinebench R20 CPU (Single Core)
659 Points
Cinebench R20 CPU (Multi Core)
5013 Points
Cinebench R23 Multi Core
13015 Points
Cinebench R23 Single Core
1715 Points
Cinebench 2024 CPU Single Core
104 Points
Cinebench 2024 CPU Multi Core
703 Points
Hilfe
Performance Rating
Minisforum EliteMini UM780 XTX
AMD Ryzen 7 7840HS, Radeon 780M
98 pt
Minisforum Venus Series UM790 Pro
AMD Ryzen 9 7940HS, Radeon 780M
92.2 pt
ACEMagician Ace Magician AM08 Pro
AMD Ryzen 9 6900HX, Radeon 680M
68.8 pt
Geekom AS 6, R9 6900HX
AMD Ryzen 9 6900HX, Radeon 680M
68.6 pt
Geekom GT13 Pro
Intel Core i9-13900H, Iris Xe G7 96EUs
56.6 pt
Durchschnitt der Klasse Mini PC
 
55.3 pt
Intel NUC 13 Pro Desk Edition Kit
Intel Core i7-1360P, Iris Xe G7 96EUs
51.9 pt
Khadas Mind
Intel Core i7-1360P, Iris Xe G7 96EUs
49.6 pt
Geekom Mini IT12
Intel Core i7-1260P, Iris Xe G7 96EUs
42.3 pt
AIDA64 / FP32 Ray-Trace
Minisforum EliteMini UM780 XTX
AMD Ryzen 7 7840HS, Radeon 780M
26889 KRay/s +129%
Minisforum Venus Series UM790 Pro
AMD Ryzen 9 7940HS, Radeon 780M
26146 KRay/s +123%
Geekom AS 6, R9 6900HX
AMD Ryzen 9 6900HX, Radeon 680M
14418 KRay/s +23%
ACEMagician Ace Magician AM08 Pro
AMD Ryzen 9 6900HX, Radeon 680M
14406 KRay/s +23%
Durchschnitt der Klasse Mini PC
  (561 - 51004, n=119, der letzten 2 Jahre)
12449 KRay/s +6%
Geekom GT13 Pro
Intel Core i9-13900H, Iris Xe G7 96EUs
11735 KRay/s
Intel NUC 13 Pro Desk Edition Kit
Intel Core i7-1360P, Iris Xe G7 96EUs
11188 KRay/s -5%
Khadas Mind
Intel Core i7-1360P, Iris Xe G7 96EUs
9567 KRay/s -18%
Geekom Mini IT12
Intel Core i7-1260P, Iris Xe G7 96EUs
7933 KRay/s -32%
AIDA64 / FPU Julia
Minisforum Venus Series UM790 Pro
AMD Ryzen 9 7940HS, Radeon 780M
116269 Points +97%
Minisforum EliteMini UM780 XTX
AMD Ryzen 7 7840HS, Radeon 780M
113684 Points +92%
ACEMagician Ace Magician AM08 Pro
AMD Ryzen 9 6900HX, Radeon 680M
91475 Points +55%
Geekom AS 6, R9 6900HX
AMD Ryzen 9 6900HX, Radeon 680M
89540 Points +52%
Durchschnitt der Klasse Mini PC
  (3604 - 214250, n=119, der letzten 2 Jahre)
62645 Points +6%
Geekom GT13 Pro
Intel Core i9-13900H, Iris Xe G7 96EUs
59094 Points
Intel NUC 13 Pro Desk Edition Kit
Intel Core i7-1360P, Iris Xe G7 96EUs
56942 Points -4%
Khadas Mind
Intel Core i7-1360P, Iris Xe G7 96EUs
47763 Points -19%
Geekom Mini IT12
Intel Core i7-1260P, Iris Xe G7 96EUs
40251 Points -32%
AIDA64 / CPU SHA3
Minisforum EliteMini UM780 XTX
AMD Ryzen 7 7840HS, Radeon 780M
4953 MB/s +82%
Minisforum Venus Series UM790 Pro
AMD Ryzen 9 7940HS, Radeon 780M
4890 MB/s +80%
ACEMagician Ace Magician AM08 Pro
AMD Ryzen 9 6900HX, Radeon 680M
3117 MB/s +15%
Geekom AS 6, R9 6900HX
AMD Ryzen 9 6900HX, Radeon 680M
3065 MB/s +13%
Durchschnitt der Klasse Mini PC
  (225 - 9399, n=119, der letzten 2 Jahre)
2760 MB/s +2%
Geekom GT13 Pro
Intel Core i9-13900H, Iris Xe G7 96EUs
2718 MB/s
Intel NUC 13 Pro Desk Edition Kit
Intel Core i7-1360P, Iris Xe G7 96EUs
2669 MB/s -2%
Khadas Mind
Intel Core i7-1360P, Iris Xe G7 96EUs
2430 MB/s -11%
Geekom Mini IT12
Intel Core i7-1260P, Iris Xe G7 96EUs
2006 MB/s -26%
AIDA64 / CPU Queen
Minisforum Venus Series UM790 Pro
AMD Ryzen 9 7940HS, Radeon 780M
119569 Points +27%
Minisforum EliteMini UM780 XTX
AMD Ryzen 7 7840HS, Radeon 780M
117103 Points +25%
ACEMagician Ace Magician AM08 Pro
AMD Ryzen 9 6900HX, Radeon 680M
99180 Points +6%
Geekom GT13 Pro
Intel Core i9-13900H, Iris Xe G7 96EUs
93952 Points
Geekom AS 6, R9 6900HX
AMD Ryzen 9 6900HX, Radeon 680M
93870 Points 0%
Intel NUC 13 Pro Desk Edition Kit
Intel Core i7-1360P, Iris Xe G7 96EUs
86881 Points -8%
Durchschnitt der Klasse Mini PC
  (8172 - 184747, n=119, der letzten 2 Jahre)
77998 Points -17%
Geekom Mini IT12
Intel Core i7-1260P, Iris Xe G7 96EUs
73765 Points -21%
Khadas Mind
Intel Core i7-1360P, Iris Xe G7 96EUs
65324 Points -30%
AIDA64 / FPU SinJulia
Minisforum Venus Series UM790 Pro
AMD Ryzen 9 7940HS, Radeon 780M
15312 Points +91%
Minisforum EliteMini UM780 XTX
AMD Ryzen 7 7840HS, Radeon 780M
15145 Points +89%
ACEMagician Ace Magician AM08 Pro
AMD Ryzen 9 6900HX, Radeon 680M
12642 Points +58%
Geekom AS 6, R9 6900HX
AMD Ryzen 9 6900HX, Radeon 680M
11771 Points +47%
Durchschnitt der Klasse Mini PC
  (408 - 29064, n=119, der letzten 2 Jahre)
8538 Points +6%
Geekom GT13 Pro
Intel Core i9-13900H, Iris Xe G7 96EUs
8026 Points
Intel NUC 13 Pro Desk Edition Kit
Intel Core i7-1360P, Iris Xe G7 96EUs
7246 Points -10%
Khadas Mind
Intel Core i7-1360P, Iris Xe G7 96EUs
5734 Points -29%
Geekom Mini IT12
Intel Core i7-1260P, Iris Xe G7 96EUs
5567 Points -31%
AIDA64 / FPU Mandel
Minisforum Venus Series UM790 Pro
AMD Ryzen 9 7940HS, Radeon 780M
62219 Points +114%
Minisforum EliteMini UM780 XTX
AMD Ryzen 7 7840HS, Radeon 780M
60809 Points +109%
ACEMagician Ace Magician AM08 Pro
AMD Ryzen 9 6900HX, Radeon 680M
50025 Points +72%
Geekom AS 6, R9 6900HX
AMD Ryzen 9 6900HX, Radeon 680M
49558 Points +70%
Durchschnitt der Klasse Mini PC
  (1958 - 113499, n=119, der letzten 2 Jahre)
32689 Points +12%
Geekom GT13 Pro
Intel Core i9-13900H, Iris Xe G7 96EUs
29138 Points
Intel NUC 13 Pro Desk Edition Kit
Intel Core i7-1360P, Iris Xe G7 96EUs
28019 Points -4%
Khadas Mind
Intel Core i7-1360P, Iris Xe G7 96EUs
22832 Points -22%
Geekom Mini IT12
Intel Core i7-1260P, Iris Xe G7 96EUs
19857 Points -32%
AIDA64 / CPU AES
Minisforum EliteMini UM780 XTX
AMD Ryzen 7 7840HS, Radeon 780M
170745 MB/s +66%
ACEMagician Ace Magician AM08 Pro
AMD Ryzen 9 6900HX, Radeon 680M
124515 MB/s +21%
Geekom AS 6, R9 6900HX
AMD Ryzen 9 6900HX, Radeon 680M
119363 MB/s +16%
Geekom GT13 Pro
Intel Core i9-13900H, Iris Xe G7 96EUs
102677 MB/s
Minisforum Venus Series UM790 Pro
AMD Ryzen 9 7940HS, Radeon 780M
86346 MB/s -16%
Durchschnitt der Klasse Mini PC
  (3691 - 325960, n=119, der letzten 2 Jahre)
85358 MB/s -17%
Khadas Mind
Intel Core i7-1360P, Iris Xe G7 96EUs
80041 MB/s -22%
Geekom Mini IT12
Intel Core i7-1260P, Iris Xe G7 96EUs
74716 MB/s -27%
Intel NUC 13 Pro Desk Edition Kit
Intel Core i7-1360P, Iris Xe G7 96EUs
53328 MB/s -48%
AIDA64 / CPU ZLib
Minisforum Venus Series UM790 Pro
AMD Ryzen 9 7940HS, Radeon 780M
1114 MB/s +41%
Minisforum EliteMini UM780 XTX
AMD Ryzen 7 7840HS, Radeon 780M
1075 MB/s +36%
Geekom GT13 Pro
Intel Core i9-13900H, Iris Xe G7 96EUs
789 MB/s
Intel NUC 13 Pro Desk Edition Kit
Intel Core i7-1360P, Iris Xe G7 96EUs
775 MB/s -2%
Geekom AS 6, R9 6900HX
AMD Ryzen 9 6900HX, Radeon 680M
754 MB/s -4%
Durchschnitt der Klasse Mini PC
  (74.8 - 2039, n=119, der letzten 2 Jahre)
714 MB/s -10%
Khadas Mind
Intel Core i7-1360P, Iris Xe G7 96EUs
671 MB/s -15%
ACEMagician Ace Magician AM08 Pro
AMD Ryzen 9 6900HX, Radeon 680M
578 MB/s -27%
Geekom Mini IT12
Intel Core i7-1260P, Iris Xe G7 96EUs
575 MB/s -27%
AIDA64 / FP64 Ray-Trace
Minisforum Venus Series UM790 Pro
AMD Ryzen 9 7940HS, Radeon 780M
14472 KRay/s +133%
Minisforum EliteMini UM780 XTX
AMD Ryzen 7 7840HS, Radeon 780M
14284 KRay/s +130%
ACEMagician Ace Magician AM08 Pro
AMD Ryzen 9 6900HX, Radeon 680M
7680 KRay/s +24%
Geekom AS 6, R9 6900HX
AMD Ryzen 9 6900HX, Radeon 680M
7551 KRay/s +22%
Durchschnitt der Klasse Mini PC
  (308 - 26952, n=119, der letzten 2 Jahre)
6658 KRay/s +7%
Geekom GT13 Pro
Intel Core i9-13900H, Iris Xe G7 96EUs
6205 KRay/s
Intel NUC 13 Pro Desk Edition Kit
Intel Core i7-1360P, Iris Xe G7 96EUs
5957 KRay/s -4%
Khadas Mind
Intel Core i7-1360P, Iris Xe G7 96EUs
4975 KRay/s -20%
Geekom Mini IT12
Intel Core i7-1260P, Iris Xe G7 96EUs
4156 KRay/s -33%
AIDA64 / CPU PhotoWorxx
Khadas Mind
Intel Core i7-1360P, Iris Xe G7 96EUs
43544 MPixel/s +54%
Minisforum EliteMini UM780 XTX
AMD Ryzen 7 7840HS, Radeon 780M
40460 MPixel/s +43%
Minisforum Venus Series UM790 Pro
AMD Ryzen 9 7940HS, Radeon 780M
32647 MPixel/s +15%
Geekom AS 6, R9 6900HX
AMD Ryzen 9 6900HX, Radeon 680M
30049 MPixel/s +6%
ACEMagician Ace Magician AM08 Pro
AMD Ryzen 9 6900HX, Radeon 680M
30038 MPixel/s +6%
Intel NUC 13 Pro Desk Edition Kit
Intel Core i7-1360P, Iris Xe G7 96EUs
29263 MPixel/s +4%
Geekom GT13 Pro
Intel Core i9-13900H, Iris Xe G7 96EUs
28269 MPixel/s
Geekom Mini IT12
Intel Core i7-1260P, Iris Xe G7 96EUs
28118 MPixel/s -1%
Durchschnitt der Klasse Mini PC
  (4408 - 50500, n=119, der letzten 2 Jahre)
27805 MPixel/s -2%

Cinebench R15 Multi Dauertest

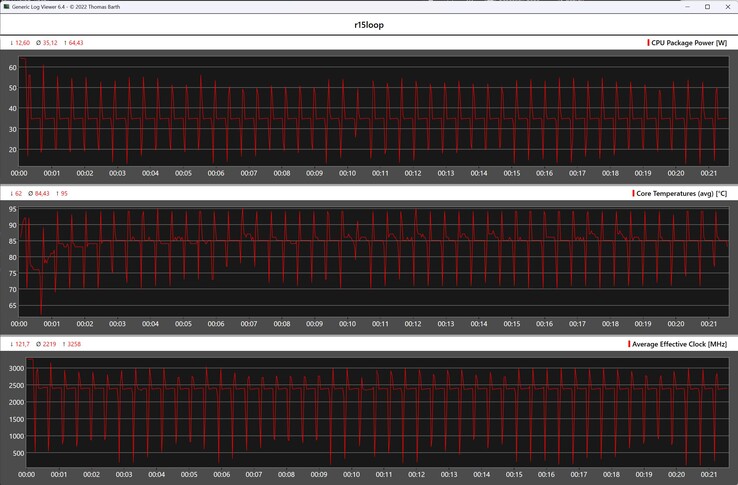
Beim Blick auf die Cinebench-R15-Dauerschleife ist zu erkennen, dass zu Beginn ein deutlich besseres Ergebnis erreicht werden kann. Beim ersten Durchlauf kann der Intel Core i9-13900H den PL2 Wert (64 Watt) etwas länger halten als bei den restlichen Durchläufen. Mit ein paar wenigen Ausnahmen erbringt das SoC dann aber eine stabile Leistung bei maximal 35 Watt.

CPU-Metrik während der Cinebench-R15-Schleife
0135270405540675810945108012151350148516201755189020252160229524302565Tooltip
Geekom GT13 Pro Intel Core i9-13900H, Intel Core i9-13900H: Ø1776 (1688.48-2326.12)
Minisforum EliteMini UM780 XTX AMD Ryzen 7 7840HS, AMD Ryzen 7 7840HS: Ø2605 (2564.1-2649.53)
Minisforum Venus Series UM790 Pro AMD Ryzen 9 7940HS, AMD Ryzen 9 7940HS: Ø2646 (2612.16-2667.2)
Geekom AS 6, R9 6900HX AMD Ryzen 9 6900HX, AMD Ryzen 9 6900HX: Ø1878 (1825.15-2068.58)
Intel NUC 13 Pro Desk Edition Kit Intel Core i7-1360P, Intel Core i7-1360P: Ø1753 (1686.77-2083.33)
Geekom Mini IT12 Intel Core i7-1260P, Intel Core i7-1260P: Ø1280 (1241-1619.37)
ACEMagician Ace Magician AM08 Pro AMD Ryzen 9 6900HX, AMD Ryzen 9 6900HX: Ø2050 (2014.91-2082.68)
Khadas Mind Intel Core i7-1360P, Intel Core i7-1360P: Ø1443 (1386.82-1627.54)

System Performance

Die Systemtests meistert der Geekom GT13 Pro im Großen und Ganzen recht gut. Gegenüber den Kontrahenten hat es das Testsystem allerdings schwer, sich zu behaupten. Die Leistungseinbußen, welche zum Teil selbst verursacht sind, tragen mit großer Wahrscheinlichkeit zu diesem Ergebnis bei. Trotzdem ist die Leistung bei alltäglichen Aufgaben auf einem guten Level. Der großzügige Arbeitsspeicher und der schnelle Massenspeicher sorgen subjektiv für ein gut arbeitendes System.

PCMark 10 / Score
Geekom A8, AMD Ryzen 9 8945HS
AMD Radeon 780M, Acer N5000
7705 Points +30%
Minisforum EliteMini UM780 XTX, AMD Ryzen 7 7840HS
AMD Radeon 780M, Kingston OM8PGP41024Q-A0
7526 Points +27%
Minisforum AtomMan X7 Ti, Intel Core Ultra 9 185H
Intel Arc 8-Core iGPU, Kingston OM8PGP41024Q-A0
7510 Points +26%
Aoostar GEM12, AMD Ryzen 7 8845HS
AMD Radeon 780M, Crucial P3 Plus CT1000P3PSSD8
7431 Points +25%
Acemagic F2A, Intel Core Ultra 7 155H
Intel Arc 8-Core iGPU, Kingston OM8SEP1024Q-A0
7120 Points +20%
Geekom XT12 Pro, Intel Core i9-12900H
Intel Iris Xe Graphics G7 96EUs, Lexar SSD NM7A1 1TB
6295 Points +6%
Geekom GT13 Pro, Intel Core i9-13900H
Intel Iris Xe Graphics G7 96EUs, Acer N7000
5944 Points
Khadas Mind, Intel Core i7-1360P
Intel Iris Xe Graphics G7 96EUs, WD PC SN740 SDDPTQD-1T00
5937 Points 0%
PCMark 10 / Essentials
Geekom A8, AMD Ryzen 9 8945HS
AMD Radeon 780M, Acer N5000
11333 Points +10%
Geekom XT12 Pro, Intel Core i9-12900H
Intel Iris Xe Graphics G7 96EUs, Lexar SSD NM7A1 1TB
11273 Points +9%
Acemagic F2A, Intel Core Ultra 7 155H
Intel Arc 8-Core iGPU, Kingston OM8SEP1024Q-A0
11125 Points +8%
Minisforum AtomMan X7 Ti, Intel Core Ultra 9 185H
Intel Arc 8-Core iGPU, Kingston OM8PGP41024Q-A0
11030 Points +7%
Minisforum EliteMini UM780 XTX, AMD Ryzen 7 7840HS
AMD Radeon 780M, Kingston OM8PGP41024Q-A0
11011 Points +6%
Aoostar GEM12, AMD Ryzen 7 8845HS
AMD Radeon 780M, Crucial P3 Plus CT1000P3PSSD8
10822 Points +5%
Khadas Mind, Intel Core i7-1360P
Intel Iris Xe Graphics G7 96EUs, WD PC SN740 SDDPTQD-1T00
10761 Points +4%
Geekom GT13 Pro, Intel Core i9-13900H
Intel Iris Xe Graphics G7 96EUs, Acer N7000
10347 Points
PCMark 10 / Productivity
Geekom A8, AMD Ryzen 9 8945HS
AMD Radeon 780M, Acer N5000
11082 Points +51%
Minisforum EliteMini UM780 XTX, AMD Ryzen 7 7840HS
AMD Radeon 780M, Kingston OM8PGP41024Q-A0
10832 Points +48%
Minisforum AtomMan X7 Ti, Intel Core Ultra 9 185H
Intel Arc 8-Core iGPU, Kingston OM8PGP41024Q-A0
10484 Points +43%
Aoostar GEM12, AMD Ryzen 7 8845HS
AMD Radeon 780M, Crucial P3 Plus CT1000P3PSSD8
10482 Points +43%
Acemagic F2A, Intel Core Ultra 7 155H
Intel Arc 8-Core iGPU, Kingston OM8SEP1024Q-A0
8901 Points +22%
Khadas Mind, Intel Core i7-1360P
Intel Iris Xe Graphics G7 96EUs, WD PC SN740 SDDPTQD-1T00
8161 Points +12%
Geekom XT12 Pro, Intel Core i9-12900H
Intel Iris Xe Graphics G7 96EUs, Lexar SSD NM7A1 1TB
8114 Points +11%
Geekom GT13 Pro, Intel Core i9-13900H
Intel Iris Xe Graphics G7 96EUs, Acer N7000
7319 Points
CrossMark / Overall
Aoostar GEM12, AMD Ryzen 7 8845HS
AMD Radeon 780M, Crucial P3 Plus CT1000P3PSSD8
1939 Points +10%
Geekom A8, AMD Ryzen 9 8945HS
AMD Radeon 780M, Acer N5000
1866 Points +6%
Geekom XT12 Pro, Intel Core i9-12900H
Intel Iris Xe Graphics G7 96EUs, Lexar SSD NM7A1 1TB
1860 Points +5%
Acemagic F2A, Intel Core Ultra 7 155H
Intel Arc 8-Core iGPU, Kingston OM8SEP1024Q-A0
1802 Points +2%
Geekom GT13 Pro, Intel Core i9-13900H
Intel Iris Xe Graphics G7 96EUs, Acer N7000
1766 Points
Minisforum EliteMini UM780 XTX, AMD Ryzen 7 7840HS
AMD Radeon 780M, Kingston OM8PGP41024Q-A0
1761 Points 0%
Minisforum AtomMan X7 Ti, Intel Core Ultra 9 185H
Intel Arc 8-Core iGPU, Kingston OM8PGP41024Q-A0
1675 Points -5%
Khadas Mind, Intel Core i7-1360P
Intel Iris Xe Graphics G7 96EUs, WD PC SN740 SDDPTQD-1T00
1564 Points -11%
CrossMark / Responsiveness
Geekom XT12 Pro, Intel Core i9-12900H
Intel Iris Xe Graphics G7 96EUs, Lexar SSD NM7A1 1TB
1919 Points +7%
Aoostar GEM12, AMD Ryzen 7 8845HS
AMD Radeon 780M, Crucial P3 Plus CT1000P3PSSD8
1849 Points +3%
Geekom GT13 Pro, Intel Core i9-13900H
Intel Iris Xe Graphics G7 96EUs, Acer N7000
1790 Points
Acemagic F2A, Intel Core Ultra 7 155H
Intel Arc 8-Core iGPU, Kingston OM8SEP1024Q-A0
1700 Points -5%
Khadas Mind, Intel Core i7-1360P
Intel Iris Xe Graphics G7 96EUs, WD PC SN740 SDDPTQD-1T00
1528 Points -15%
Geekom A8, AMD Ryzen 9 8945HS
AMD Radeon 780M, Acer N5000
1494 Points -17%
Minisforum AtomMan X7 Ti, Intel Core Ultra 9 185H
Intel Arc 8-Core iGPU, Kingston OM8PGP41024Q-A0
1378 Points -23%
Minisforum EliteMini UM780 XTX, AMD Ryzen 7 7840HS
AMD Radeon 780M, Kingston OM8PGP41024Q-A0
1361 Points -24%
CrossMark / Creativity
Geekom A8, AMD Ryzen 9 8945HS
AMD Radeon 780M, Acer N5000
2127 Points +19%
Minisforum EliteMini UM780 XTX, AMD Ryzen 7 7840HS
AMD Radeon 780M, Kingston OM8PGP41024Q-A0
2040 Points +14%
Aoostar GEM12, AMD Ryzen 7 8845HS
AMD Radeon 780M, Crucial P3 Plus CT1000P3PSSD8
2040 Points +14%
Acemagic F2A, Intel Core Ultra 7 155H
Intel Arc 8-Core iGPU, Kingston OM8SEP1024Q-A0
1929 Points +8%
Minisforum AtomMan X7 Ti, Intel Core Ultra 9 185H
Intel Arc 8-Core iGPU, Kingston OM8PGP41024Q-A0
1883 Points +5%
Geekom XT12 Pro, Intel Core i9-12900H
Intel Iris Xe Graphics G7 96EUs, Lexar SSD NM7A1 1TB
1870 Points +5%
Geekom GT13 Pro, Intel Core i9-13900H
Intel Iris Xe Graphics G7 96EUs, Acer N7000
1789 Points
Khadas Mind, Intel Core i7-1360P
Intel Iris Xe Graphics G7 96EUs, WD PC SN740 SDDPTQD-1T00
1600 Points -11%
CrossMark / Productivity
Aoostar GEM12, AMD Ryzen 7 8845HS
AMD Radeon 780M, Crucial P3 Plus CT1000P3PSSD8
1872 Points +8%
Geekom XT12 Pro, Intel Core i9-12900H
Intel Iris Xe Graphics G7 96EUs, Lexar SSD NM7A1 1TB
1831 Points +5%
Geekom A8, AMD Ryzen 9 8945HS
AMD Radeon 780M, Acer N5000
1764 Points +2%
Geekom GT13 Pro, Intel Core i9-13900H
Intel Iris Xe Graphics G7 96EUs, Acer N7000
1736 Points
Acemagic F2A, Intel Core Ultra 7 155H
Intel Arc 8-Core iGPU, Kingston OM8SEP1024Q-A0
1717 Points -1%
Minisforum EliteMini UM780 XTX, AMD Ryzen 7 7840HS
AMD Radeon 780M, Kingston OM8PGP41024Q-A0
1656 Points -5%
Minisforum AtomMan X7 Ti, Intel Core Ultra 9 185H
Intel Arc 8-Core iGPU, Kingston OM8PGP41024Q-A0
1589 Points -8%
Khadas Mind, Intel Core i7-1360P
Intel Iris Xe Graphics G7 96EUs, WD PC SN740 SDDPTQD-1T00
1541 Points -11%
AIDA64 / Memory Copy
Minisforum AtomMan X7 Ti
Intel Core Ultra 9 185H, Arc 8-Core
71990 MB/s +57%
Geekom A8
AMD Ryzen 9 8945HS, Radeon 780M
68603 MB/s +50%
Aoostar GEM12
AMD Ryzen 7 8845HS, Radeon 780M
67777 MB/s +48%
Minisforum EliteMini UM780 XTX
AMD Ryzen 7 7840HS, Radeon 780M
67039 MB/s +47%
Khadas Mind
Intel Core i7-1360P, Iris Xe G7 96EUs
65299 MB/s +43%
Acemagic F2A
Intel Core Ultra 7 155H, Arc 8-Core
62397 MB/s +36%
Durchschnitt der Klasse Mini PC
  (6481 - 89287, n=119, der letzten 2 Jahre)
47585 MB/s +4%
Geekom XT12 Pro
Intel Core i9-12900H, Iris Xe G7 96EUs
45792 MB/s 0%
Geekom GT13 Pro
Intel Core i9-13900H, Iris Xe G7 96EUs
45721 MB/s
AIDA64 / Memory Read
Minisforum AtomMan X7 Ti
Intel Core Ultra 9 185H, Arc 8-Core
75449 MB/s +64%
Acemagic F2A
Intel Core Ultra 7 155H, Arc 8-Core
64323 MB/s +40%
Minisforum EliteMini UM780 XTX
AMD Ryzen 7 7840HS, Radeon 780M
61867 MB/s +35%
Geekom A8
AMD Ryzen 9 8945HS, Radeon 780M
61710 MB/s +34%
Aoostar GEM12
AMD Ryzen 7 8845HS, Radeon 780M
61006 MB/s +33%
Khadas Mind
Intel Core i7-1360P, Iris Xe G7 96EUs
60668 MB/s +32%
Geekom XT12 Pro
Intel Core i9-12900H, Iris Xe G7 96EUs
48963 MB/s +6%
Durchschnitt der Klasse Mini PC
  (6914 - 99171, n=119, der letzten 2 Jahre)
48328 MB/s +5%
Geekom GT13 Pro
Intel Core i9-13900H, Iris Xe G7 96EUs
45995 MB/s
AIDA64 / Memory Write
Geekom A8
AMD Ryzen 9 8945HS, Radeon 780M
86974 MB/s +90%
Minisforum EliteMini UM780 XTX
AMD Ryzen 7 7840HS, Radeon 780M
86693 MB/s +90%
Aoostar GEM12
AMD Ryzen 7 8845HS, Radeon 780M
86677 MB/s +90%
Khadas Mind
Intel Core i7-1360P, Iris Xe G7 96EUs
74777 MB/s +64%
Minisforum AtomMan X7 Ti
Intel Core Ultra 9 185H, Arc 8-Core
70596 MB/s +54%
Acemagic F2A
Intel Core Ultra 7 155H, Arc 8-Core
65057 MB/s +42%
Durchschnitt der Klasse Mini PC
  (6862 - 98583, n=119, der letzten 2 Jahre)
52056 MB/s +14%
Geekom XT12 Pro
Intel Core i9-12900H, Iris Xe G7 96EUs
47201 MB/s +3%
Geekom GT13 Pro
Intel Core i9-13900H, Iris Xe G7 96EUs
45733 MB/s
AIDA64 / Memory Latency
Acemagic F2A
Intel Core Ultra 7 155H, Arc 8-Core
149 ns * -97%
Minisforum AtomMan X7 Ti
Intel Core Ultra 9 185H, Arc 8-Core
146.1 ns * -93%
Minisforum EliteMini UM780 XTX
AMD Ryzen 7 7840HS, Radeon 780M
92 ns * -21%
Durchschnitt der Klasse Mini PC
  (44.9 - 184.8, n=119, der letzten 2 Jahre)
91.9 ns * -21%
Geekom A8
AMD Ryzen 9 8945HS, Radeon 780M
91.2 ns * -20%
Khadas Mind
Intel Core i7-1360P, Iris Xe G7 96EUs
90.5 ns * -19%
Aoostar GEM12
AMD Ryzen 7 8845HS, Radeon 780M
88.6 ns * -17%
Geekom GT13 Pro
Intel Core i9-13900H, Iris Xe G7 96EUs
75.8 ns *
Geekom XT12 Pro
Intel Core i9-12900H, Iris Xe G7 96EUs
74.7 ns * +1%

* ... kleinere Werte sind besser

DPC-Latenzen

Optimale DPC-Latenzen erreicht der Geekom GT13 Pro leider nicht. Schon beim Surfen im Internet dokumentieren wir erhöhte Latenzen, welche durch die Wiedergabe des 4K-Testvideos nochmals leicht ansteigen. Nur zwei ausgelassene Frames sind okay und mindern die Qualität als Streaming-Client keineswegs. Die iGPU wird zugleich mit etwa 45 Prozent belastet.

Maximale Latenz beim Öffnen mehrerer Browser-Tabs und beim Abspielen von 4K-Videomaterial
Maximale Latenz nach zehn Sekunden Prime95
Treiber nach längster Ausführungsdauer gereiht
DPC Latencies / LatencyMon - interrupt to process latency (max), Web, Youtube, Prime95
Acemagic F2A
Arc 8-Core, Ultra 7 155H, Kingston OM8SEP1024Q-A0
2724 μs * -78%
Geekom XT12 Pro
Iris Xe G7 96EUs, i9-12900H, Lexar SSD NM7A1 1TB
2151 μs * -40%
Geekom A8
Radeon 780M, R9 8945HS, Acer N5000
2097.9 μs * -37%
Minisforum AtomMan X7 Ti
Arc 8-Core, Ultra 9 185H, Kingston OM8PGP41024Q-A0
2069.2 μs * -35%
Geekom GT13 Pro
Iris Xe G7 96EUs, i9-13900H, Acer N7000
1533.4 μs *
Minisforum EliteMini UM780 XTX
Radeon 780M, R7 7840HS, Kingston OM8PGP41024Q-A0
1178.9 μs * +23%
Aoostar GEM12
Radeon 780M, R7 8845HS, Crucial P3 Plus CT1000P3PSSD8
1001.9 μs * +35%
Khadas Mind
Iris Xe G7 96EUs, i7-1360P, WD PC SN740 SDDPTQD-1T00
962 μs * +37%

* ... kleinere Werte sind besser

Massenspeicher

Acer-N7000-2-TB-SSD
Acer-N7000-2-TB-SSD

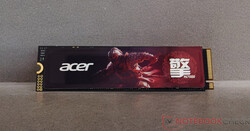
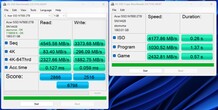
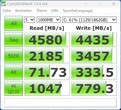
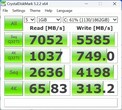
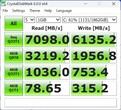
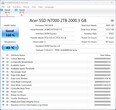
Mit 2 TB Speicherplatz ist der Geekom GT13 Pro hervorragend bestückt und bietet ausreichend Speicherplatz für viele Programme. Verbaut wird eine SSD aus dem Hause Acer, die sich hinsichtlich der Performance sehen lassen kann. Die dokumentierten Ergebnisse reichen, um sich hinter dem Aoostar GEM12 den zweiten Platz in unserem Rating zu sichern. Allerdings hat die SSD unter Dauerlast Probleme, die Leistung auf dem hohen Niveau zu halten. Obwohl der Hersteller für die SSD eine passive Kühlung verbaut, genügt diese letztendlich nicht ganz aus, um die Leistung stabil zu halten. Verglichen zu den Ausgangswerten bricht die Leserate um knapp 50 Prozent ein. Ein Totalausfall ist das aber nicht, wie man anhand der Grafik hinsichtlich der Dauerleistung entnehmen kann. Mit knapp 4.000 MB/s ist die Acer N7000 noch immer schneller als die Massenspeicher anderer Mini-PCs. Im Geekom GT13 Pro lassen sich insgesamt zwei SSDs installieren. Zu beachten ist, dass der zweite M.2-Slot unterstützt jedoch nur SATA-SSDs mit einer Länge von 42 Millimetern.

Für weitere Vergleiche und Benchmarks verweisen wir auf unsere Vergleichstabelle.

AS SSD
AS SSD
CDM 3
CDM 3
CDM 5
CDM 5
CDM 6
CDM 6
CDI
CDI
Acer N7000
Sequential Read: 4580 MB/s
Sequential Write: 4435 MB/s
512K Read: 2185 MB/s
512K Write: 3457 MB/s
4K Read: 71.73 MB/s
4K Write: 333.5 MB/s
4K QD32 Read: 1047 MB/s
4K QD32 Write: 779.3 MB/s
Drive Performance Rating - Percent
Aoostar GEM12
Crucial P3 Plus CT1000P3PSSD8
89 pt
Geekom GT13 Pro
Acer N7000
77 pt
Khadas Mind
WD PC SN740 SDDPTQD-1T00
75.4 pt
Geekom XT12 Pro
Lexar SSD NM7A1 1TB
65.8 pt
Minisforum EliteMini UM780 XTX
Kingston OM8PGP41024Q-A0
60.1 pt
Minisforum AtomMan X7 Ti
Kingston OM8PGP41024Q-A0
58.1 pt
Geekom A8
Acer N5000
55.2 pt
Durchschnitt der Klasse Mini PC
 
46.4 pt
Acemagic F2A
Kingston OM8SEP1024Q-A0
45.7 pt
DiskSpd
seq read
Geekom GT13 Pro
Acer N7000
4357 (4314.26min - 4356.72max) MB/s
Khadas Mind
WD PC SN740 SDDPTQD-1T00
3628 (3596.13min - 3627.65max) MB/s -17%
Geekom A8
Acer N5000
3114 (3080.09min - 3114.48max) MB/s -29%
Aoostar GEM12
Crucial P3 Plus CT1000P3PSSD8
3108 (3065.99min - 3107.56max) MB/s -29%
Minisforum EliteMini UM780 XTX
Kingston OM8PGP41024Q-A0
2896 (2845min - 2896.04max) MB/s -34%
Minisforum AtomMan X7 Ti
Kingston OM8PGP41024Q-A0
2315 (2293.84min - 2315.26max) MB/s -47%
Durchschnitt der Klasse Mini PC
  (233 - 4357, n=119, der letzten 2 Jahre)
2288 MB/s -47%
Geekom XT12 Pro
Lexar SSD NM7A1 1TB
2178 (2158.39min - 2177.68max) MB/s -50%
Acemagic F2A
Kingston OM8SEP1024Q-A0
1674 (1242.56min - 1673.54max) MB/s -62%
seq write
Aoostar GEM12
Crucial P3 Plus CT1000P3PSSD8
4619 (4584.79min - 4619.39max) MB/s +2%
Geekom GT13 Pro
Acer N7000
4544 (4380.79min - 4543.83max) MB/s
Khadas Mind
WD PC SN740 SDDPTQD-1T00
4121 (3696.6min - 4120.84max) MB/s -9%
Minisforum EliteMini UM780 XTX
Kingston OM8PGP41024Q-A0
3736 (3562.44min - 3735.53max) MB/s -18%
Minisforum AtomMan X7 Ti
Kingston OM8PGP41024Q-A0
3386 (3076.94min - 3385.64max) MB/s -25%
Geekom A8
Acer N5000
3271 (3235.73min - 3270.93max) MB/s -28%
Durchschnitt der Klasse Mini PC
  (222 - 5595, n=119, der letzten 2 Jahre)
2448 MB/s -46%
Geekom XT12 Pro
Lexar SSD NM7A1 1TB
2341 (2252.02min - 2341.4max) MB/s -48%
Acemagic F2A
Kingston OM8SEP1024Q-A0
1348 (1117.85min - 1347.87max) MB/s -70%
seq q8 t1 read
Geekom GT13 Pro
Acer N7000
7007 (6166.72min - 7006.62max) MB/s
Aoostar GEM12
Crucial P3 Plus CT1000P3PSSD8
5213 (4500.71min - 5212.95max) MB/s -26%
Khadas Mind
WD PC SN740 SDDPTQD-1T00
5168 (4831.21min - 5167.59max) MB/s -26%
Minisforum EliteMini UM780 XTX
Kingston OM8PGP41024Q-A0
4821 (4521.88min - 4820.93max) MB/s -31%
Geekom A8
Acer N5000
4800 (4387.45min - 4800.17max) MB/s -31%
Geekom XT12 Pro
Lexar SSD NM7A1 1TB
4769 (3791.02min - 4769.24max) MB/s -32%
Minisforum AtomMan X7 Ti
Kingston OM8PGP41024Q-A0
4676 (4310.07min - 4675.81max) MB/s -33%
Durchschnitt der Klasse Mini PC
  (236 - 8430, n=119, der letzten 2 Jahre)
3706 MB/s -47%
Acemagic F2A
Kingston OM8SEP1024Q-A0
3194 (2810.81min - 3194.17max) MB/s -54%
seq q8 t1 write
Geekom GT13 Pro
Acer N7000
5261 (5018.9min - 5261.3max) MB/s
Aoostar GEM12
Crucial P3 Plus CT1000P3PSSD8
4754 (4738.27min - 4754.03max) MB/s -10%
Khadas Mind
WD PC SN740 SDDPTQD-1T00
4212 (3767.95min - 4212.34max) MB/s -20%
Geekom A8
Acer N5000
4081 (3987.52min - 4081.49max) MB/s -22%
Minisforum EliteMini UM780 XTX
Kingston OM8PGP41024Q-A0
3910 (3902.59min - 3909.87max) MB/s -26%
Minisforum AtomMan X7 Ti
Kingston OM8PGP41024Q-A0
3729 (3700.15min - 3728.95max) MB/s -29%
Geekom XT12 Pro
Lexar SSD NM7A1 1TB
3255 (2485.13min - 3254.57max) MB/s -38%
Durchschnitt der Klasse Mini PC
  (228 - 6669, n=119, der letzten 2 Jahre)
2743 MB/s -48%
Acemagic F2A
Kingston OM8SEP1024Q-A0
2212 (1222.43min - 2212.27max) MB/s -58%
4k q1 t1 read
Geekom GT13 Pro
Acer N7000
85.3 (82.57min - 85.32max) MB/s
Khadas Mind
WD PC SN740 SDDPTQD-1T00
83.7 (81.47min - 83.67max) MB/s -2%
Aoostar GEM12
Crucial P3 Plus CT1000P3PSSD8
78.7 (78.09min - 78.69max) MB/s -8%
Minisforum EliteMini UM780 XTX
Kingston OM8PGP41024Q-A0
64.9 (64.71min - 64.94max) MB/s -24%
Geekom XT12 Pro
Lexar SSD NM7A1 1TB
64.1 (56.32min - 64.06max) MB/s -25%
Minisforum AtomMan X7 Ti
Kingston OM8PGP41024Q-A0
63.5 (59.81min - 63.5max) MB/s -26%
Durchschnitt der Klasse Mini PC
  (5.67 - 86.6, n=119, der letzten 2 Jahre)
54.7 MB/s -36%
Geekom A8
Acer N5000
54.4 (52.17min - 54.39max) MB/s -36%
Acemagic F2A
Kingston OM8SEP1024Q-A0
47.3 (47.07min - 47.31max) MB/s -45%
4k q1 t1 write
Geekom GT13 Pro
Acer N7000
327 (306.06min - 326.78max) MB/s
Khadas Mind
WD PC SN740 SDDPTQD-1T00
301 (296.91min - 301.44max) MB/s -8%
Geekom XT12 Pro
Lexar SSD NM7A1 1TB
279 (237.61min - 279.08max) MB/s -15%
Aoostar GEM12
Crucial P3 Plus CT1000P3PSSD8
274 (271.38min - 273.89max) MB/s -16%
Minisforum EliteMini UM780 XTX
Kingston OM8PGP41024Q-A0
196.1 (183.94min - 196.13max) MB/s -40%
Durchschnitt der Klasse Mini PC
  (30.4 - 435, n=119, der letzten 2 Jahre)
194.7 MB/s -40%
Acemagic F2A
Kingston OM8SEP1024Q-A0
187.2 (181.54min - 187.2max) MB/s -43%
Minisforum AtomMan X7 Ti
Kingston OM8PGP41024Q-A0
184.4 (177.6min - 184.36max) MB/s -44%
Geekom A8
Acer N5000
169.3 (157.77min - 169.29max) MB/s -48%
4k q32 t16 read
Geekom GT13 Pro
Acer N7000
3593 (3380.17min - 3593.41max) MB/s
Aoostar GEM12
Crucial P3 Plus CT1000P3PSSD8
3197 (3174.44min - 3196.85max) MB/s -11%
Khadas Mind
WD PC SN740 SDDPTQD-1T00
2300 (2238.78min - 2299.5max) MB/s -36%
Acemagic F2A
Kingston OM8SEP1024Q-A0
1824 (1239.47min - 1824.09max) MB/s -49%
Geekom A8
Acer N5000
1558 (1523.21min - 1557.75max) MB/s -57%
Minisforum EliteMini UM780 XTX
Kingston OM8PGP41024Q-A0
1557 (1529.87min - 1556.79max) MB/s -57%
Geekom XT12 Pro
Lexar SSD NM7A1 1TB
1452 (1402.67min - 1451.9max) MB/s -60%
Durchschnitt der Klasse Mini PC
  (26.1 - 4158, n=119, der letzten 2 Jahre)
1360 MB/s -62%
Minisforum AtomMan X7 Ti
Kingston OM8PGP41024Q-A0
1143 (1091.01min - 1142.98max) MB/s -68%
4k q32 t16 write
Aoostar GEM12
Crucial P3 Plus CT1000P3PSSD8
3639 (3534.46min - 3639.09max) MB/s +378%
Khadas Mind
WD PC SN740 SDDPTQD-1T00
2441 (2189.1min - 2441.28max) MB/s +220%
Geekom XT12 Pro
Lexar SSD NM7A1 1TB
1499 (1114.25min - 1499.4max) MB/s +97%
Acemagic F2A
Kingston OM8SEP1024Q-A0
1434 (1410.26min - 1433.71max) MB/s +88%
Durchschnitt der Klasse Mini PC
  (30.2 - 4288, n=119, der letzten 2 Jahre)
1287 MB/s +69%
Geekom GT13 Pro
Acer N7000
762 (700.88min - 761.76max) MB/s
Geekom A8
Acer N5000
600 (492.7min - 600.03max) MB/s -21%
Minisforum EliteMini UM780 XTX
Kingston OM8PGP41024Q-A0
565 (557.67min - 564.75max) MB/s -26%
Minisforum AtomMan X7 Ti
Kingston OM8PGP41024Q-A0
497 (467.49min - 497.28max) MB/s -35%
AS SSD
Score Total
Aoostar GEM12
Crucial P3 Plus CT1000P3PSSD8
10021 Points +47%
Geekom GT13 Pro
Acer N7000
6798 Points
Khadas Mind
WD PC SN740 SDDPTQD-1T00
6460 Points -5%
Geekom XT12 Pro
Lexar SSD NM7A1 1TB
5975 Points -12%
Minisforum EliteMini UM780 XTX
Kingston OM8PGP41024Q-A0
5863 Points -14%
Geekom A8
Acer N5000
5132 Points -25%
Minisforum AtomMan X7 Ti
Kingston OM8PGP41024Q-A0
4987 Points -27%
Acemagic F2A
Kingston OM8SEP1024Q-A0
4412 Points -35%
Durchschnitt der Klasse Mini PC
  (181.5 - 10021, n=117, der letzten 2 Jahre)
4121 Points -39%
Score Read
Aoostar GEM12
Crucial P3 Plus CT1000P3PSSD8
3741 Points +31%
Geekom GT13 Pro
Acer N7000
2866 Points
Khadas Mind
WD PC SN740 SDDPTQD-1T00
2658 Points -7%
Geekom XT12 Pro
Lexar SSD NM7A1 1TB
2119 Points -26%
Minisforum EliteMini UM780 XTX
Kingston OM8PGP41024Q-A0
1738 Points -39%
Geekom A8
Acer N5000
1643 Points -43%
Acemagic F2A
Kingston OM8SEP1024Q-A0
1561 Points -46%
Durchschnitt der Klasse Mini PC
  (61 - 3741, n=117, der letzten 2 Jahre)
1534 Points -46%
Minisforum AtomMan X7 Ti
Kingston OM8PGP41024Q-A0
1482 Points -48%
Score Write
Aoostar GEM12
Crucial P3 Plus CT1000P3PSSD8
4371 Points +74%
Minisforum EliteMini UM780 XTX
Kingston OM8PGP41024Q-A0
3294 Points +31%
Minisforum AtomMan X7 Ti
Kingston OM8PGP41024Q-A0
2807 Points +12%
Geekom XT12 Pro
Lexar SSD NM7A1 1TB
2777 Points +10%
Geekom A8
Acer N5000
2735 Points +9%
Geekom GT13 Pro
Acer N7000
2516 Points
Khadas Mind
WD PC SN740 SDDPTQD-1T00
2447 Points -3%
Acemagic F2A
Kingston OM8SEP1024Q-A0
2082 Points -17%
Durchschnitt der Klasse Mini PC
  (88 - 4371, n=117, der letzten 2 Jahre)
1851 Points -26%
Seq Read
Geekom GT13 Pro
Acer N7000
4546 MB/s
Khadas Mind
WD PC SN740 SDDPTQD-1T00
4496 MB/s -1%
Geekom XT12 Pro
Lexar SSD NM7A1 1TB
4349.85 MB/s -4%
Aoostar GEM12
Crucial P3 Plus CT1000P3PSSD8
4317 MB/s -5%
Minisforum EliteMini UM780 XTX
Kingston OM8PGP41024Q-A0
3822 MB/s -16%
Minisforum AtomMan X7 Ti
Kingston OM8PGP41024Q-A0
3779 MB/s -17%
Geekom A8
Acer N5000
3741 MB/s -18%
Durchschnitt der Klasse Mini PC
  (291 - 6620, n=117, der letzten 2 Jahre)
3161 MB/s -30%
Acemagic F2A
Kingston OM8SEP1024Q-A0
3010 MB/s -34%
Seq Write
Khadas Mind
WD PC SN740 SDDPTQD-1T00
4258 MB/s +26%
Aoostar GEM12
Crucial P3 Plus CT1000P3PSSD8
4188 MB/s +24%
Geekom XT12 Pro
Lexar SSD NM7A1 1TB
3936.64 MB/s +17%
Geekom GT13 Pro
Acer N7000
3374 MB/s
Minisforum EliteMini UM780 XTX
Kingston OM8PGP41024Q-A0
2463 MB/s -27%
Acemagic F2A
Kingston OM8SEP1024Q-A0
2369 MB/s -30%
Minisforum AtomMan X7 Ti
Kingston OM8PGP41024Q-A0
2285 MB/s -32%
Durchschnitt der Klasse Mini PC
  (240 - 5783, n=117, der letzten 2 Jahre)
2212 MB/s -34%
Geekom A8
Acer N5000
1897 MB/s -44%
4K Read
Aoostar GEM12
Crucial P3 Plus CT1000P3PSSD8
89.3 MB/s +7%
Geekom GT13 Pro
Acer N7000
83.4 MB/s
Geekom XT12 Pro
Lexar SSD NM7A1 1TB
80.89 MB/s -3%
Khadas Mind
WD PC SN740 SDDPTQD-1T00
76.3 MB/s -9%
Minisforum AtomMan X7 Ti
Kingston OM8PGP41024Q-A0
63.3 MB/s -24%
Minisforum EliteMini UM780 XTX
Kingston OM8PGP41024Q-A0
61.9 MB/s -26%
Durchschnitt der Klasse Mini PC
  (6.08 - 104.3, n=117, der letzten 2 Jahre)
58.9 MB/s -29%
Geekom A8
Acer N5000
50.3 MB/s -40%
Acemagic F2A
Kingston OM8SEP1024Q-A0
41.8 MB/s -50%
4K Write
Geekom XT12 Pro
Lexar SSD NM7A1 1TB
316.33 MB/s +7%
Geekom GT13 Pro
Acer N7000
296 MB/s
Khadas Mind
WD PC SN740 SDDPTQD-1T00
258 MB/s -13%
Minisforum AtomMan X7 Ti
Kingston OM8PGP41024Q-A0
238 MB/s -20%
Aoostar GEM12
Crucial P3 Plus CT1000P3PSSD8
221 MB/s -25%
Minisforum EliteMini UM780 XTX
Kingston OM8PGP41024Q-A0
208 MB/s -30%
Acemagic F2A
Kingston OM8SEP1024Q-A0
196.9 MB/s -33%
Durchschnitt der Klasse Mini PC
  (30.9 - 366, n=117, der letzten 2 Jahre)
175.1 MB/s -41%
Geekom A8
Acer N5000
171.7 MB/s -42%
4K-64 Read
Aoostar GEM12
Crucial P3 Plus CT1000P3PSSD8
3220 MB/s +38%
Geekom GT13 Pro
Acer N7000
2328 MB/s
Khadas Mind
WD PC SN740 SDDPTQD-1T00
2132 MB/s -8%
Geekom XT12 Pro
Lexar SSD NM7A1 1TB
1602.91 MB/s -31%
Minisforum EliteMini UM780 XTX
Kingston OM8PGP41024Q-A0
1293 MB/s -44%
Acemagic F2A
Kingston OM8SEP1024Q-A0
1218 MB/s -48%
Geekom A8
Acer N5000
1218 MB/s -48%
Durchschnitt der Klasse Mini PC
  (23.4 - 3220, n=117, der letzten 2 Jahre)
1159 MB/s -50%
Minisforum AtomMan X7 Ti
Kingston OM8PGP41024Q-A0
1041 MB/s -55%
4K-64 Write
Aoostar GEM12
Crucial P3 Plus CT1000P3PSSD8
3731 MB/s +98%
Minisforum EliteMini UM780 XTX
Kingston OM8PGP41024Q-A0
2840 MB/s +51%
Geekom A8
Acer N5000
2374 MB/s +26%
Minisforum AtomMan X7 Ti
Kingston OM8PGP41024Q-A0
2340 MB/s +24%
Geekom XT12 Pro
Lexar SSD NM7A1 1TB
2066.57 MB/s +10%
Geekom GT13 Pro
Acer N7000
1883 MB/s
Khadas Mind
WD PC SN740 SDDPTQD-1T00
1763 MB/s -6%
Acemagic F2A
Kingston OM8SEP1024Q-A0
1649 MB/s -12%
Durchschnitt der Klasse Mini PC
  (32.8 - 3731, n=117, der letzten 2 Jahre)
1455 MB/s -23%
Access Time Read
Minisforum EliteMini UM780 XTX
Kingston OM8PGP41024Q-A0
0.127 ms * -0%
Geekom GT13 Pro
Acer N7000
0.127 ms *
Durchschnitt der Klasse Mini PC
  (0.022 - 0.489, n=117, der letzten 2 Jahre)
0.09726 ms * +23%
Khadas Mind
WD PC SN740 SDDPTQD-1T00
0.094 ms * +26%
Aoostar GEM12
Crucial P3 Plus CT1000P3PSSD8
0.076 ms * +40%
Geekom A8
Acer N5000
0.069 ms * +46%
Minisforum AtomMan X7 Ti
Kingston OM8PGP41024Q-A0
0.067 ms * +47%
Geekom XT12 Pro
Lexar SSD NM7A1 1TB
0.049 ms * +61%
Acemagic F2A
Kingston OM8SEP1024Q-A0
0.046 ms * +64%
Access Time Write
Acemagic F2A
Kingston OM8SEP1024Q-A0
0.126 ms * -114%
Durchschnitt der Klasse Mini PC
  (0.014 - 0.765, n=117, der letzten 2 Jahre)
0.1153 ms * -95%
Geekom A8
Acer N5000
0.072 ms * -22%
Geekom XT12 Pro
Lexar SSD NM7A1 1TB
0.059 ms * -0%
Geekom GT13 Pro
Acer N7000
0.059 ms *
Minisforum EliteMini UM780 XTX
Kingston OM8PGP41024Q-A0
0.022 ms * +63%
Minisforum AtomMan X7 Ti
Kingston OM8PGP41024Q-A0
0.02 ms * +66%
Aoostar GEM12
Crucial P3 Plus CT1000P3PSSD8
0.017 ms * +71%
Khadas Mind
WD PC SN740 SDDPTQD-1T00
0.016 ms * +73%

* ... kleinere Werte sind besser

Dauerleistung Lesen: DiskSpd Read Loop, Queue Depth 8

035571010651420177521302485284031953550390542604615497053255680603563906745Tooltip
Geekom GT13 Pro Acer N7000; diskspd 2.0.17 f: Ø5377 (3710.83-7006.62)
Aoostar GEM12 Crucial P3 Plus CT1000P3PSSD8; diskspd 2.0.17 f: Ø5121 (4152.57-5218.34)
Minisforum AtomMan X7 Ti Kingston OM8PGP41024Q-A0; diskspd 2.0.17 f: Ø4683 (3872.18-4767.25)
Geekom A8 Acer N5000; diskspd 2.0.17 f: Ø4786 (4324.07-4802.27)
Geekom XT12 Pro Lexar SSD NM7A1 1TB; diskspd 2.0.17 f: Ø1764 (1425.22-4795.56)
Acemagic F2A Kingston OM8SEP1024Q-A0; diskspd 2.0.17 f: Ø1320 (771.89-3141.95)
Minisforum EliteMini UM780 XTX Kingston OM8PGP41024Q-A0; diskspd 2.0.17 f: Ø4795 (3366.33-4823.24)
Khadas Mind WD PC SN740 SDDPTQD-1T00: Ø5222 (4952.01-5235.75)

Grafikkarte

Die Wahl des Prozessors hat deutliche Auswirkungen auf die 3D-Leistung. Da Geekom beim GT13 Pro auf einen Intel Core i9-13900H setzt, handelt es sich bei der iGPU nur um die Intel Iris Xe Graphics G7. Immerhin kommt der Grafikadapter mit 96 EUs in der höchsten Ausbaustufe zum Einsatz. Vergleichen mit den neueren iGPUs der Meteor-Lake-Modelle kann die Intel Iris Xe Graphics G7 jedoch nicht mehr mithalten. Im Ranking sehen wir nahezu zwei Klassen. Im unteren Drittel tummeln sich all die Geräte, welche mit der Intel Iris Xe Graphics G7 ausgerüstete sind. Die Leistung zwischen den Geräten ist nahezu identisch. Alle andere Geräte können sich mit moderneren und leistungsstärkeren iGPUs (Intel Arc 8 und AMD Radeon 780) deutlich absetzen.

Weitere Vergleiche und Benchmarks entnehmen Sie bitte unserer GPU-Vergleichstabelle.

3DMark Performance Rating - Percent
Geekom A8
AMD Radeon 780M, AMD Ryzen 9 8945HS
96.8 pt
Minisforum EliteMini UM780 XTX
AMD Radeon 780M, AMD Ryzen 7 7840HS
95.6 pt
Aoostar GEM12
AMD Radeon 780M, AMD Ryzen 7 8845HS
94.6 pt
Acemagic F2A
Intel Arc 8-Core iGPU, Intel Core Ultra 7 155H
93.9 pt
Minisforum AtomMan X7 Ti
Intel Arc 8-Core iGPU, Intel Core Ultra 9 185H
92.3 pt
Geekom GT13 Pro
Intel Iris Xe Graphics G7 96EUs, Intel Core i9-13900H
59.1 pt
Khadas Mind
Intel Iris Xe Graphics G7 96EUs, Intel Core i7-1360P
55.8 pt
Geekom XT12 Pro
Intel Iris Xe Graphics G7 96EUs, Intel Core i9-12900H
55.3 pt
3DMark 11 - 1280x720 Performance GPU
Geekom A8
AMD Radeon 780M, AMD Ryzen 9 8945HS
13533 Points +82%
Aoostar GEM12
AMD Radeon 780M, AMD Ryzen 7 8845HS
13410 Points +81%
Minisforum EliteMini UM780 XTX
AMD Radeon 780M, AMD Ryzen 7 7840HS
13347 Points +80%
Acemagic F2A
Intel Arc 8-Core iGPU, Intel Core Ultra 7 155H
12085 Points +63%
Minisforum AtomMan X7 Ti
Intel Arc 8-Core iGPU, Intel Core Ultra 9 185H
11691 Points +57%
Geekom GT13 Pro
Intel Iris Xe Graphics G7 96EUs, Intel Core i9-13900H
7424 Points
Geekom XT12 Pro
Intel Iris Xe Graphics G7 96EUs, Intel Core i9-12900H
6975 Points -6%
Khadas Mind
Intel Iris Xe Graphics G7 96EUs, Intel Core i7-1360P
6722 Points -9%
3DMark
2560x1440 Time Spy Graphics
Acemagic F2A
Intel Arc 8-Core iGPU, Intel Core Ultra 7 155H
3205 Points +90%
Minisforum AtomMan X7 Ti
Intel Arc 8-Core iGPU, Intel Core Ultra 9 185H
3193 Points +89%
Geekom A8
AMD Radeon 780M, AMD Ryzen 9 8945HS
2901 Points +72%
Aoostar GEM12
AMD Radeon 780M, AMD Ryzen 7 8845HS
2846 Points +68%
Minisforum EliteMini UM780 XTX
AMD Radeon 780M, AMD Ryzen 7 7840HS
2832 Points +68%
Geekom GT13 Pro
Intel Iris Xe Graphics G7 96EUs, Intel Core i9-13900H
1690 Points
Khadas Mind
Intel Iris Xe Graphics G7 96EUs, Intel Core i7-1360P
1680 Points -1%
Geekom XT12 Pro
Intel Iris Xe Graphics G7 96EUs, Intel Core i9-12900H
1581 Points -6%
1920x1080 Fire Strike Graphics
Geekom A8
AMD Radeon 780M, AMD Ryzen 9 8945HS
8354 Points +44%
Minisforum EliteMini UM780 XTX
AMD Radeon 780M, AMD Ryzen 7 7840HS
8348 Points +44%
Aoostar GEM12
AMD Radeon 780M, AMD Ryzen 7 8845HS
8007 Points +38%
Acemagic F2A
Intel Arc 8-Core iGPU, Intel Core Ultra 7 155H
7710 Points +33%
Minisforum AtomMan X7 Ti
Intel Arc 8-Core iGPU, Intel Core Ultra 9 185H
7599 Points +31%
Geekom GT13 Pro
Intel Iris Xe Graphics G7 96EUs, Intel Core i9-13900H
5812 Points
Khadas Mind
Intel Iris Xe Graphics G7 96EUs, Intel Core i7-1360P
5461 Points -6%
Geekom XT12 Pro
Intel Iris Xe Graphics G7 96EUs, Intel Core i9-12900H
5421 Points -7%
Unigine Heaven 4.0
Extreme Preset OpenGL
Aoostar GEM12
AMD Radeon 780M, AMD Ryzen 7 8845HS
34.6 fps +38%
Minisforum EliteMini UM780 XTX
AMD Radeon 780M, AMD Ryzen 7 7840HS
34.5 fps +37%
Acemagic F2A
Intel Arc 8-Core iGPU, Intel Core Ultra 7 155H
31.6 fps +26%
Minisforum AtomMan X7 Ti
Intel Arc 8-Core iGPU, Intel Core Ultra 9 185H
29.7 fps +18%
Geekom A8
AMD Radeon 780M, AMD Ryzen 9 8945HS
27.3 fps +9%
Khadas Mind
Intel Iris Xe Graphics G7 96EUs, Intel Core i7-1360P
25.2 fps 0%
Geekom GT13 Pro
Intel Iris Xe Graphics G7 96EUs, Intel Core i9-13900H
25.1 fps
Geekom XT12 Pro
Intel Iris Xe Graphics G7 96EUs, Intel Core i9-12900H
21.8 fps -13%
Extreme Preset DX11
Aoostar GEM12
AMD Radeon 780M, AMD Ryzen 7 8845HS
36.3 fps +40%
Minisforum EliteMini UM780 XTX
AMD Radeon 780M, AMD Ryzen 7 7840HS
35.5 fps +37%
Minisforum AtomMan X7 Ti
Intel Arc 8-Core iGPU, Intel Core Ultra 9 185H
33.2 fps +28%
Geekom A8
AMD Radeon 780M, AMD Ryzen 9 8945HS
32.8 fps +26%
Acemagic F2A
Intel Arc 8-Core iGPU, Intel Core Ultra 7 155H
32.7 fps +26%
Geekom GT13 Pro
Intel Iris Xe Graphics G7 96EUs, Intel Core i9-13900H
26 fps
Khadas Mind
Intel Iris Xe Graphics G7 96EUs, Intel Core i7-1360P
25.6 fps -2%
Geekom XT12 Pro
Intel Iris Xe Graphics G7 96EUs, Intel Core i9-12900H
22.7 fps -13%
Unigine Valley 1.0
1920x1080 Extreme HD DirectX AA:x8
Aoostar GEM12
AMD Radeon 780M, AMD Ryzen 7 8845HS
24.5 fps +62%
Minisforum EliteMini UM780 XTX
AMD Radeon 780M, AMD Ryzen 7 7840HS
24 fps +59%
Geekom A8
AMD Radeon 780M, AMD Ryzen 9 8945HS
19.1 fps +26%
Minisforum AtomMan X7 Ti
Intel Arc 8-Core iGPU, Intel Core Ultra 9 185H
18.5 fps +23%
Khadas Mind
Intel Iris Xe Graphics G7 96EUs, Intel Core i7-1360P
17.2 fps +14%
Acemagic F2A
Intel Arc 8-Core iGPU, Intel Core Ultra 7 155H
17.1 fps +13%
Geekom GT13 Pro
Intel Iris Xe Graphics G7 96EUs, Intel Core i9-13900H
15.1 fps
Geekom XT12 Pro
Intel Iris Xe Graphics G7 96EUs, Intel Core i9-12900H
13.3 fps -12%
1920x1080 Extreme HD Preset OpenGL AA:x8
Minisforum AtomMan X7 Ti
Intel Arc 8-Core iGPU, Intel Core Ultra 9 185H
32.4 fps +106%
Aoostar GEM12
AMD Radeon 780M, AMD Ryzen 7 8845HS
21 fps +34%
Minisforum EliteMini UM780 XTX
AMD Radeon 780M, AMD Ryzen 7 7840HS
20.8 fps +32%
Khadas Mind
Intel Iris Xe Graphics G7 96EUs, Intel Core i7-1360P
20.4 fps +30%
Acemagic F2A
Intel Arc 8-Core iGPU, Intel Core Ultra 7 155H
18.3 fps +17%
Geekom GT13 Pro
Intel Iris Xe Graphics G7 96EUs, Intel Core i9-13900H
15.7 fps
Geekom A8
AMD Radeon 780M, AMD Ryzen 9 8945HS
15.2 fps -3%
Geekom XT12 Pro
Intel Iris Xe Graphics G7 96EUs, Intel Core i9-12900H
13.9 fps -11%
Unigine Superposition
1280x720 720p Low
Aoostar GEM12
AMD Radeon 780M, AMD Ryzen 7 8845HS
12174 Points +84%
Minisforum EliteMini UM780 XTX
AMD Radeon 780M, AMD Ryzen 7 7840HS
12023 Points +82%
Geekom A8
AMD Radeon 780M, AMD Ryzen 9 8945HS
10702 Points +62%
Acemagic F2A
Intel Arc 8-Core iGPU, Intel Core Ultra 7 155H
10491 Points +58%
Minisforum AtomMan X7 Ti
Intel Arc 8-Core iGPU, Intel Core Ultra 9 185H
10102 Points +53%
Geekom GT13 Pro
Intel Iris Xe Graphics G7 96EUs, Intel Core i9-13900H
6619 Points
Khadas Mind
Intel Iris Xe Graphics G7 96EUs, Intel Core i7-1360P
6265 Points -5%
Geekom XT12 Pro
Intel Iris Xe Graphics G7 96EUs, Intel Core i9-12900H
5950 Points -10%
1920x1080 1080p High
Minisforum EliteMini UM780 XTX
AMD Radeon 780M, AMD Ryzen 7 7840HS
3648 Points +58%
Aoostar GEM12
AMD Radeon 780M, AMD Ryzen 7 8845HS
3592 Points +56%
Acemagic F2A
Intel Arc 8-Core iGPU, Intel Core Ultra 7 155H
3391 Points +47%
Geekom A8
AMD Radeon 780M, AMD Ryzen 9 8945HS
3387 Points +47%
Minisforum AtomMan X7 Ti
Intel Arc 8-Core iGPU, Intel Core Ultra 9 185H
3341 Points +45%
Geekom GT13 Pro
Intel Iris Xe Graphics G7 96EUs, Intel Core i9-13900H
2306 Points
Khadas Mind
Intel Iris Xe Graphics G7 96EUs, Intel Core i7-1360P
2279 Points -1%
Geekom XT12 Pro
Intel Iris Xe Graphics G7 96EUs, Intel Core i9-12900H
2035 Points -12%
1920x1080 1080p Extreme
Acemagic F2A
Intel Arc 8-Core iGPU, Intel Core Ultra 7 155H
1920 Points +71%
Minisforum AtomMan X7 Ti
Intel Arc 8-Core iGPU, Intel Core Ultra 9 185H
1812 Points +61%
Minisforum EliteMini UM780 XTX
AMD Radeon 780M, AMD Ryzen 7 7840HS
1800 Points +60%
Aoostar GEM12
AMD Radeon 780M, AMD Ryzen 7 8845HS
1737 Points +55%
Geekom A8
AMD Radeon 780M, AMD Ryzen 9 8945HS
1585 Points +41%
Geekom GT13 Pro
Intel Iris Xe Graphics G7 96EUs, Intel Core i9-13900H
1124 Points
Khadas Mind
Intel Iris Xe Graphics G7 96EUs, Intel Core i7-1360P
1101 Points -2%
Geekom XT12 Pro
Intel Iris Xe Graphics G7 96EUs, Intel Core i9-12900H
1042 Points -7%
ComputeMark v2.1
1024x600 Normal, Score
Minisforum EliteMini UM780 XTX
AMD Radeon 780M, AMD Ryzen 7 7840HS
10102 Points +177%
Aoostar GEM12
AMD Radeon 780M, AMD Ryzen 7 8845HS
9494 Points +160%
Geekom A8
AMD Radeon 780M, AMD Ryzen 9 8945HS
8909 Points +144%
Acemagic F2A
Intel Arc 8-Core iGPU, Intel Core Ultra 7 155H
7480 Points +105%
Minisforum AtomMan X7 Ti
Intel Arc 8-Core iGPU, Intel Core Ultra 9 185H
6270 Points +72%
Geekom GT13 Pro
Intel Iris Xe Graphics G7 96EUs, Intel Core i9-13900H
3650 Points
Khadas Mind
Intel Iris Xe Graphics G7 96EUs, Intel Core i7-1360P
3605 Points -1%
Geekom XT12 Pro
Intel Iris Xe Graphics G7 96EUs, Intel Core i9-12900H
3390 Points -7%
1024x600 Normal, Fluid 3DTex
Geekom A8
AMD Radeon 780M, AMD Ryzen 9 8945HS
492 Points +72%
Aoostar GEM12
AMD Radeon 780M, AMD Ryzen 7 8845HS
483 Points +69%
Minisforum AtomMan X7 Ti
Intel Arc 8-Core iGPU, Intel Core Ultra 9 185H
469 Points +64%
Minisforum EliteMini UM780 XTX
AMD Radeon 780M, AMD Ryzen 7 7840HS
468 Points +64%
Acemagic F2A
Intel Arc 8-Core iGPU, Intel Core Ultra 7 155H
427 Points +49%
Khadas Mind
Intel Iris Xe Graphics G7 96EUs, Intel Core i7-1360P
385 Points +35%
Geekom GT13 Pro
Intel Iris Xe Graphics G7 96EUs, Intel Core i9-13900H
286 Points
Geekom XT12 Pro
Intel Iris Xe Graphics G7 96EUs, Intel Core i9-12900H
231 Points -19%
1024x600 Normal, Fluid 2DTexArr
Geekom A8
AMD Radeon 780M, AMD Ryzen 9 8945HS
492 Points +67%
Minisforum EliteMini UM780 XTX
AMD Radeon 780M, AMD Ryzen 7 7840HS
488 Points +66%
Aoostar GEM12
AMD Radeon 780M, AMD Ryzen 7 8845HS
481 Points +64%
Minisforum AtomMan X7 Ti
Intel Arc 8-Core iGPU, Intel Core Ultra 9 185H
462 Points +57%
Acemagic F2A
Intel Arc 8-Core iGPU, Intel Core Ultra 7 155H
422 Points +44%
Khadas Mind
Intel Iris Xe Graphics G7 96EUs, Intel Core i7-1360P
354 Points +20%
Geekom GT13 Pro
Intel Iris Xe Graphics G7 96EUs, Intel Core i9-13900H
294 Points
Geekom XT12 Pro
Intel Iris Xe Graphics G7 96EUs, Intel Core i9-12900H
246 Points -16%
1024x600 Normal, Mandel Vector
Minisforum EliteMini UM780 XTX
AMD Radeon 780M, AMD Ryzen 7 7840HS
2637 Points +202%
Aoostar GEM12
AMD Radeon 780M, AMD Ryzen 7 8845HS
2477 Points +184%
Geekom A8
AMD Radeon 780M, AMD Ryzen 9 8945HS
2356 Points +170%
Acemagic F2A
Intel Arc 8-Core iGPU, Intel Core Ultra 7 155H
1961 Points +125%
Minisforum AtomMan X7 Ti
Intel Arc 8-Core iGPU, Intel Core Ultra 9 185H
1620 Points +86%
Geekom GT13 Pro
Intel Iris Xe Graphics G7 96EUs, Intel Core i9-13900H
873 Points
Geekom XT12 Pro
Intel Iris Xe Graphics G7 96EUs, Intel Core i9-12900H
860 Points -1%
Khadas Mind
Intel Iris Xe Graphics G7 96EUs, Intel Core i7-1360P
830 Points -5%
1024x600 Normal, Mandel Scalar
Minisforum EliteMini UM780 XTX
AMD Radeon 780M, AMD Ryzen 7 7840HS
2757 Points +210%
Aoostar GEM12
AMD Radeon 780M, AMD Ryzen 7 8845HS
2519 Points +184%
Geekom A8
AMD Radeon 780M, AMD Ryzen 9 8945HS
2345 Points +164%
Acemagic F2A
Intel Arc 8-Core iGPU, Intel Core Ultra 7 155H
1594 Points +80%
Minisforum AtomMan X7 Ti
Intel Arc 8-Core iGPU, Intel Core Ultra 9 185H
1274 Points +43%
Geekom GT13 Pro
Intel Iris Xe Graphics G7 96EUs, Intel Core i9-13900H
888 Points
Geekom XT12 Pro
Intel Iris Xe Graphics G7 96EUs, Intel Core i9-12900H
872 Points -2%
Khadas Mind
Intel Iris Xe Graphics G7 96EUs, Intel Core i7-1360P
864 Points -3%
1024x600 Normal, QJuliaRayTrace
Minisforum EliteMini UM780 XTX
AMD Radeon 780M, AMD Ryzen 7 7840HS
3752 Points +186%
Aoostar GEM12
AMD Radeon 780M, AMD Ryzen 7 8845HS
3535 Points +170%
Geekom A8
AMD Radeon 780M, AMD Ryzen 9 8945HS
3225 Points +146%
Acemagic F2A
Intel Arc 8-Core iGPU, Intel Core Ultra 7 155H
3076 Points +135%
Minisforum AtomMan X7 Ti
Intel Arc 8-Core iGPU, Intel Core Ultra 9 185H
2444 Points +87%
Geekom GT13 Pro
Intel Iris Xe Graphics G7 96EUs, Intel Core i9-13900H
1310 Points
Geekom XT12 Pro
Intel Iris Xe Graphics G7 96EUs, Intel Core i9-12900H
1182 Points -10%
Khadas Mind
Intel Iris Xe Graphics G7 96EUs, Intel Core i7-1360P
1174 Points -10%
LuxMark v2.0 64Bit
Room GPUs-only
Geekom A8
AMD Radeon 780M, AMD Ryzen 9 8945HS
1173 Samples/s +80%
Minisforum EliteMini UM780 XTX
AMD Radeon 780M, AMD Ryzen 7 7840HS
807 Samples/s +24%
Aoostar GEM12
AMD Radeon 780M, AMD Ryzen 7 8845HS
801 Samples/s +23%
Geekom GT13 Pro
Intel Iris Xe Graphics G7 96EUs, Intel Core i9-13900H
651 Samples/s
Minisforum AtomMan X7 Ti
Intel Arc 8-Core iGPU, Intel Core Ultra 9 185H
640 Samples/s -2%
Acemagic F2A
Intel Arc 8-Core iGPU, Intel Core Ultra 7 155H
549 Samples/s -16%
Sala GPUs-only
Minisforum AtomMan X7 Ti
Intel Arc 8-Core iGPU, Intel Core Ultra 9 185H
2732 Samples/s +30%
Acemagic F2A
Intel Arc 8-Core iGPU, Intel Core Ultra 7 155H
2319 Samples/s +10%
Geekom GT13 Pro
Intel Iris Xe Graphics G7 96EUs, Intel Core i9-13900H
2104 Samples/s
Minisforum EliteMini UM780 XTX
AMD Radeon 780M, AMD Ryzen 7 7840HS
1546 Samples/s -27%
Aoostar GEM12
AMD Radeon 780M, AMD Ryzen 7 8845HS
1496 Samples/s -29%
Geekom A8
AMD Radeon 780M, AMD Ryzen 9 8945HS
991 Samples/s -53%
Affinity Photo 2 - Combined (Single / Multi GPU)
Minisforum AtomMan X7 Ti
Intel Arc 8-Core iGPU, Intel Core Ultra 9 185H
5308 Points +19%
Acemagic F2A
Intel Arc 8-Core iGPU, Intel Core Ultra 7 155H
4928 Points +10%
Geekom GT13 Pro
Intel Iris Xe Graphics G7 96EUs, Intel Core i9-13900H
4460 Points
Geekom XT12 Pro
Intel Iris Xe Graphics G7 96EUs, Intel Core i9-12900H
3830 Points -14%
Khadas Mind
Intel Iris Xe Graphics G7 96EUs, Intel Core i7-1360P
3724 Points -17%
Aoostar GEM12
AMD Radeon 780M, AMD Ryzen 7 8845HS
1709 Points -62%
Geekom A8
AMD Radeon 780M, AMD Ryzen 9 8945HS
1512 Points -66%
Minisforum EliteMini UM780 XTX
AMD Radeon 780M, AMD Ryzen 7 7840HS
1399 Points -69%
Photoshop PugetBench - GPU Score
Geekom A8
AMD Radeon 780M, AMD Ryzen 9 8945HS
114.5 Points +30%
Aoostar GEM12
AMD Radeon 780M, AMD Ryzen 7 8845HS
103.4 Points +17%
Acemagic F2A
Intel Arc 8-Core iGPU, Intel Core Ultra 7 155H
98 Points +11%
Minisforum AtomMan X7 Ti
Intel Arc 8-Core iGPU, Intel Core Ultra 9 185H
92.3 Points +4%
Geekom GT13 Pro
Intel Iris Xe Graphics G7 96EUs, Intel Core i9-13900H
88.4 Points
Geekom XT12 Pro
Intel Iris Xe Graphics G7 96EUs, Intel Core i9-12900H
79.4 Points -10%
Premiere Pro PugetBench - GPU 0.9
Acemagic F2A
Intel Arc 8-Core iGPU, Intel Core Ultra 7 155H
16.8 Points +107%
Aoostar GEM12
AMD Radeon 780M, AMD Ryzen 7 8845HS
11.4 Points +41%
Geekom A8
AMD Radeon 780M, AMD Ryzen 9 8945HS
11.2 Points +38%
Geekom GT13 Pro
Intel Iris Xe Graphics G7 96EUs, Intel Core i9-13900H
8.1 Points
Geekom XT12 Pro
Intel Iris Xe Graphics G7 96EUs, Intel Core i9-12900H
7.6 Points -6%
Khadas Mind
Intel Iris Xe Graphics G7 96EUs, Intel Core i7-1360P
7.2 Points -11%
Minisforum AtomMan X7 Ti
Intel Arc 8-Core iGPU, Intel Core Ultra 9 185H
6.8 Points -16%
DaVinci Resolve PugetBench - GPU Effects 0.93
Aoostar GEM12
AMD Radeon 780M, AMD Ryzen 7 8845HS
20 Points +67%
Minisforum AtomMan X7 Ti
Intel Arc 8-Core iGPU, Intel Core Ultra 9 185H
18 Points +50%
Acemagic F2A
Intel Arc 8-Core iGPU, Intel Core Ultra 7 155H
17 Points +42%
Geekom GT13 Pro
Intel Iris Xe Graphics G7 96EUs, Intel Core i9-13900H
12 Points
Geekom XT12 Pro
Intel Iris Xe Graphics G7 96EUs, Intel Core i9-12900H
11 Points -8%
Geekom GT13 Pro, Intel Iris Xe Graphics G7 96EUs
i9-13900H
Geekom XT12 Pro, Intel Iris Xe Graphics G7 96EUs
i9-12900H
Khadas Mind, Intel Iris Xe Graphics G7 96EUs
i7-1360P
Aoostar GEM12, AMD Radeon 780M
R7 8845HS
Minisforum AtomMan X7 Ti, Intel Arc 8-Core iGPU
Ultra 9 185H
Geekom A8, AMD Radeon 780M
R9 8945HS
Acemagic F2A, Intel Arc 8-Core iGPU
Ultra 7 155H
Minisforum EliteMini UM780 XTX, AMD Radeon 780M
R7 7840HS
Durchschnitt der Klasse Mini PC
 
SPECviewperf 12
-5%
-9%
662%
20%
674%
26%
725%
456%
1900x1060 3ds Max (3dsmax-05)
41.4
40.1
-3%
37.8
-9%
85.7
107%
49.7
20%
87.4
111%
49.8
20%
85
105%
1900x1060 Catia (catia-04)
38.6
37.1
-4%
39.4
2%
86.6
124%
51.3
33%
86.4
124%
48.2
25%
89.8
133%
1900x1060 Creo (creo-01)
28.2
26.9
-5%
7.37
-74%
53.3
89%
22.7
-20%
55.1
95%
23.1
-18%
51.1
81%
1900x1060 Energy (energy-01)
0.41
0.4
-2%
0.46
12%
18.4
4388%
0.67
63%
19
4534%
0.91
122%
20.1
4802%
1900x1060 Maya (maya-04)
42.4
38.3
-10%
41.3
-3%
67.3
59%
58
37%
75
77%
54.9
29%
73.4
73%
1900x1060 Medical (medical-01)
12.2
11.8
-3%
12
-2%
51.4
321%
15.9
30%
47.7
291%
16.9
39%
61.7
406%
1900x1060 Showcase (showcase-01)
19.1
16.6
-13%
21.2
11%
30.3
59%
19.9
4%
25.8
35%
18.2
-5%
30.1
58%
1900x1060 Solidworks (sw-03)
46.6
45.3
-3%
41.6
-11%
114
145%
43
-8%
106
127%
42.7
-8%
113
142%
SPECviewperf 13
-5%
-3%
165%
13%
160%
14%
186%
106%
3ds Max (3dsmax-06)
41.2
40.1
-3%
39
-5%
82.4
100%
48.5
18%
85.8
108%
46.4
13%
86.1
109%
Catia (catia-05)
54.7
51.3
-6%
57.1
4%
124
127%
76.8
40%
126
130%
71.6
31%
132
141%
Creo (creo-02)
42.7
41.1
-4%
37.5
-12%
90.7
112%
29.3
-31%
92.8
117%
29.6
-31%
93.6
119%
Energy (energy-02)
4.62
4.5
-3%
4.34
-6%
22.2
381%
5.27
14%
22.6
389%
5.69
23%
25.8
458%
Maya (maya-05)
51.6
47.5
-8%
46.3
-10%
109
111%
62.5
21%
103
100%
59.5
15%
108
109%
Medical (medical-02)
15.6
14.4
-8%
16
3%
70.5
352%
25
60%
69.2
344%
29.7
90%
79.8
412%
Showcase (showcase-02)
19.1
17.3
-9%
21.4
12%
29.9
57%
19.9
4%
24.2
27%
18.2
-5%
30
57%
Solidworks (sw-04)
58.3
57.1
-2%
53.7
-8%
104
78%
45.6
-22%
97.3
67%
44.8
-23%
107
84%
SPECviewperf 2020
-2%
-1%
309%
38%
367%
29%
288%
187%
3840x2160 Medical (medical-03)
2.69
3.49
30%
2.67
-1%
11.2
316%
4.23
57%
10.9
305%
5.05
88%
12
346%
3840x2160 Energy (energy-03)
3.17
3.05
-4%
2.97
-6%
19.9
528%
6.03
90%
31
878%
4.61
45%
15.4
386%
3840x2160 Creo (creo-03)
16.3
14.8
-9%
16.9
4%
33.4
105%
18.5
13%
35.6
118%
17.9
10%
31.4
93%
3840x2160 CATIA (catia-06)
8.53
7.78
-9%
8.82
3%
23.2
172%
11.1
30%
24.6
188%
10
17%
24.4
186%
3840x2160 3ds Max (3dsmax-07)
10.3
9.69
-6%
10.1
-2%
20.4
98%
14.9
45%
21
104%
12.9
25%
21
104%
3840x2160 Siemens NX (snx-04)
6.62
6.29
-5%
6.01
-9%
64.1
868%
6.24
-6%
65.9
895%
5.7
-14%
61.5
829%
3840x2160 Maya (maya-06)
27.3
23.9
-12%
27.8
2%
47.7
75%
37.7
38%
50.1
84%
35.4
30%
47.2
73%
Durchschnitt gesamt (Programm / Settings)
-4% / -4%
-4% / -5%
379% / 381%
24% / 23%
400% / 402%
23% / 23%
400% / 405%
250% / 252%
3DMark 05 Standard
43190 Punkte
3DMark 06 Standard Score
33774 Punkte
3DMark Vantage P Result
28241 Punkte
3DMark 11 Performance
8027 Punkte
3DMark Ice Storm Standard Score
147975 Punkte
3DMark Cloud Gate Standard Score
27505 Punkte
3DMark Fire Strike Score
5420 Punkte
3DMark Fire Strike Extreme Score
2573 Punkte
3DMark Time Spy Score
1926 Punkte
3DMark Steel Nomad Score
186 Punkte
3DMark Steel Nomad Light Score
1283 Punkte
Hilfe

Gaming Performance

Viele moderne Spiele überfordern die Intel Iris Xe iGPU. Dennoch sehen wir, dass sich in einigen Games noch spielbare Frame-Raten erreichen lassen, wenn man auf die Detailtreue verzichtet. Trotzdem können wir dem Geekom GT13 Pro keine Gaming-Tauglichkeit in dieser Ausstattung attestieren. Spürbar mehr 3D-Leistung erhält man beim Geekom A8 oder dem Aoostar GEM12. Alternativ dazu kann man auch einen Blick auf den Minisforum AtomMan X7 Ti werfen, welcher mit Intels Meteor Lake SoC eine deutlich leistungsstärkere iGPU spendiert bekommen hat.

Cyberpunk 2077 2.1 Phantom Liberty
1920x1080 Low Preset (FSR off)
Geekom A8
Radeon 780M, R9 8945HS, Acer N5000
44 (37.6min) fps +142%
Aoostar GEM12
Radeon 780M, R7 8845HS, Crucial P3 Plus CT1000P3PSSD8
42.4 (35.7min) fps +133%
Minisforum AtomMan X7 Ti
Arc 8-Core, Ultra 9 185H, Kingston OM8PGP41024Q-A0
34.3 (29.1min) fps +88%
Acemagic F2A
Arc 8-Core, Ultra 7 155H, Kingston OM8SEP1024Q-A0
29.5 (24.1min) fps +62%
Geekom GT13 Pro
Iris Xe G7 96EUs, i9-13900H, Acer N7000
18.2 (14.7min) fps
Geekom XT12 Pro
Iris Xe G7 96EUs, i9-12900H, Lexar SSD NM7A1 1TB
16.4 (13.6min) fps -10%
1920x1080 High Preset (FSR off)
Aoostar GEM12
Radeon 780M, R7 8845HS, Crucial P3 Plus CT1000P3PSSD8
26.3 (22.2min) fps +105%
Minisforum AtomMan X7 Ti
Arc 8-Core, Ultra 9 185H, Kingston OM8PGP41024Q-A0
24 (20.6min) fps +88%
Geekom A8
Radeon 780M, R9 8945HS, Acer N5000
22.4 (15.6min) fps +75%
Acemagic F2A
Arc 8-Core, Ultra 7 155H, Kingston OM8SEP1024Q-A0
20.4 (13.8min) fps +59%
Geekom GT13 Pro
Iris Xe G7 96EUs, i9-13900H, Acer N7000
12.8 (10.9min) fps
Geekom XT12 Pro
Iris Xe G7 96EUs, i9-12900H, Lexar SSD NM7A1 1TB
11.5 (10min) fps -10%
Baldur's Gate 3
1920x1080 Low Preset
Aoostar GEM12
Radeon 780M, R7 8845HS, Crucial P3 Plus CT1000P3PSSD8
38.6 (26.3min, 27.1P0.1, 29.9P1) fps +114%
Geekom GT13 Pro
Iris Xe G7 96EUs, i9-13900H, Acer N7000
18 (5.95min, 5.96P0.1, 6.91P1) fps
1920x1080 High Preset
Aoostar GEM12
Radeon 780M, R7 8845HS, Crucial P3 Plus CT1000P3PSSD8
24.7 (16.6min, 17.1P0.1, 19.4P1) fps +111%
Geekom GT13 Pro
Iris Xe G7 96EUs, i9-13900H, Acer N7000
11.7 (3.43min, 3.51P0.1, 3.99P1) fps
Borderlands 3
1280x720 Very Low Overall Quality (DX11)
Geekom A8
Radeon 780M, R9 8945HS, Acer N5000
102.5 fps +88%
Aoostar GEM12
Radeon 780M, R7 8845HS, Crucial P3 Plus CT1000P3PSSD8
100.3 fps +84%
Minisforum EliteMini UM780 XTX
Radeon 780M, R7 7840HS, Kingston OM8PGP41024Q-A0
97.3 fps +79%
Minisforum AtomMan X7 Ti
Arc 8-Core, Ultra 9 185H, Kingston OM8PGP41024Q-A0
93 fps +71%
Acemagic F2A
Arc 8-Core, Ultra 7 155H, Kingston OM8SEP1024Q-A0
68.5 fps +26%
Geekom GT13 Pro
Iris Xe G7 96EUs, i9-13900H, Acer N7000
54.4 fps
Khadas Mind
Iris Xe G7 96EUs, i7-1360P, WD PC SN740 SDDPTQD-1T00
50.7 fps -7%
Geekom XT12 Pro
Iris Xe G7 96EUs, i9-12900H, Lexar SSD NM7A1 1TB
49.2 fps -10%
1920x1080 High Overall Quality (DX11)
Minisforum EliteMini UM780 XTX
Radeon 780M, R7 7840HS, Kingston OM8PGP41024Q-A0
33.3 fps +99%
Aoostar GEM12
Radeon 780M, R7 8845HS, Crucial P3 Plus CT1000P3PSSD8
31.7 fps +90%
Minisforum AtomMan X7 Ti
Arc 8-Core, Ultra 9 185H, Kingston OM8PGP41024Q-A0
28.7 fps +72%
Geekom A8
Radeon 780M, R9 8945HS, Acer N5000
27.8 fps +66%
Acemagic F2A
Arc 8-Core, Ultra 7 155H, Kingston OM8SEP1024Q-A0
27.7 fps +66%
Geekom GT13 Pro
Iris Xe G7 96EUs, i9-13900H, Acer N7000
16.7 fps
Khadas Mind
Iris Xe G7 96EUs, i7-1360P, WD PC SN740 SDDPTQD-1T00
15.3 fps -8%
Geekom XT12 Pro
Iris Xe G7 96EUs, i9-12900H, Lexar SSD NM7A1 1TB
14.9 fps -11%
GTA V
1024x768 Lowest Settings possible
Geekom A8
Radeon 780M, R9 8945HS, Acer N5000
166.9 (5.05min, 125P1) fps +39%
Aoostar GEM12
Radeon 780M, R7 8845HS, Crucial P3 Plus CT1000P3PSSD8
165.1 (4.83min, 125P1) fps +38%
Minisforum EliteMini UM780 XTX
Radeon 780M, R7 7840HS, Kingston OM8PGP41024Q-A0
164.4 (4.9min, 111.1P1) fps +37%
Minisforum AtomMan X7 Ti
Arc 8-Core, Ultra 9 185H, Kingston OM8PGP41024Q-A0
163.6 (4.63min, 111.1P1) fps +37%
Acemagic F2A
Arc 8-Core, Ultra 7 155H, Kingston OM8SEP1024Q-A0
161 (4.76min, 100P1) fps +35%
Geekom GT13 Pro
Iris Xe G7 96EUs, i9-13900H, Acer N7000
119.7 (7.51min, 66.7P1) fps
Khadas Mind
Iris Xe G7 96EUs, i7-1360P, WD PC SN740 SDDPTQD-1T00
112.7 (9.9min, 71.4P1) fps -6%
1920x1080 High/On (Advanced Graphics Off) AA:2xMSAA + FX AF:8x
Minisforum EliteMini UM780 XTX
Radeon 780M, R7 7840HS, Kingston OM8PGP41024Q-A0
66.9 (3.09min, 45.5P1) fps +204%
Aoostar GEM12
Radeon 780M, R7 8845HS, Crucial P3 Plus CT1000P3PSSD8
65.3 (4.57min, 45.5P1) fps +197%
Geekom A8
Radeon 780M, R9 8945HS, Acer N5000
64.7 (4.56min, 31.3P1) fps +194%
Minisforum AtomMan X7 Ti
Arc 8-Core, Ultra 9 185H, Kingston OM8PGP41024Q-A0
41.2 (3.12min, 30.3P1) fps +87%
Acemagic F2A
Arc 8-Core, Ultra 7 155H, Kingston OM8SEP1024Q-A0
31.3 (2.94min, 22.7P1) fps +42%
Khadas Mind
Iris Xe G7 96EUs, i7-1360P, WD PC SN740 SDDPTQD-1T00
23.6 (10.9min, 18.2P1) fps +7%
Geekom GT13 Pro
Iris Xe G7 96EUs, i9-13900H, Acer N7000
22 (6.3min, 16.4P1) fps
Far Cry 5
1280x720 Low Preset AA:T
Geekom A8
Radeon 780M, R9 8945HS, Acer N5000
88 (77min) fps +52%
Minisforum EliteMini UM780 XTX
Radeon 780M, R7 7840HS, Kingston OM8PGP41024Q-A0
87 (75min) fps +50%
Aoostar GEM12
Radeon 780M, R7 8845HS, Crucial P3 Plus CT1000P3PSSD8
84 (73min) fps +45%
Minisforum AtomMan X7 Ti
Arc 8-Core, Ultra 9 185H, Kingston OM8PGP41024Q-A0
79 (39min) fps +36%
Acemagic F2A
Arc 8-Core, Ultra 7 155H, Kingston OM8SEP1024Q-A0
69 (25min) fps +19%
Geekom GT13 Pro
Iris Xe G7 96EUs, i9-13900H, Acer N7000
58 (52min) fps
Khadas Mind
Iris Xe G7 96EUs, i7-1360P, WD PC SN740 SDDPTQD-1T00
54 (44min) fps -7%
Geekom XT12 Pro
Iris Xe G7 96EUs, i9-12900H, Lexar SSD NM7A1 1TB
50 (45min) fps -14%
1920x1080 High Preset AA:T
Minisforum EliteMini UM780 XTX
Radeon 780M, R7 7840HS, Kingston OM8PGP41024Q-A0
47 (42min) fps +68%
Aoostar GEM12
Radeon 780M, R7 8845HS, Crucial P3 Plus CT1000P3PSSD8
45 (39min) fps +61%
Minisforum AtomMan X7 Ti
Arc 8-Core, Ultra 9 185H, Kingston OM8PGP41024Q-A0
42 (34min) fps +50%
Geekom A8
Radeon 780M, R9 8945HS, Acer N5000
42 (33min) fps +50%
Acemagic F2A
Arc 8-Core, Ultra 7 155H, Kingston OM8SEP1024Q-A0
37 (30min) fps +32%
Geekom GT13 Pro
Iris Xe G7 96EUs, i9-13900H, Acer N7000
28 (20min) fps
Khadas Mind
Iris Xe G7 96EUs, i7-1360P, WD PC SN740 SDDPTQD-1T00
26 (23min) fps -7%
Geekom XT12 Pro
Iris Xe G7 96EUs, i9-12900H, Lexar SSD NM7A1 1TB
23 (21min) fps -18%
Far Cry New Dawn
1280x720 Low Preset
Geekom A8
Radeon 780M, R9 8945HS, Acer N5000
76 (58min) fps +46%
Minisforum EliteMini UM780 XTX
Radeon 780M, R7 7840HS, Kingston OM8PGP41024Q-A0
75 (58min) fps +44%
Aoostar GEM12
Radeon 780M, R7 8845HS, Crucial P3 Plus CT1000P3PSSD8
72 (54min) fps +38%
Minisforum AtomMan X7 Ti
Arc 8-Core, Ultra 9 185H, Kingston OM8PGP41024Q-A0
69 (2min) fps +33%
Acemagic F2A
Arc 8-Core, Ultra 7 155H, Kingston OM8SEP1024Q-A0
65 (11min) fps +25%
Geekom GT13 Pro
Iris Xe G7 96EUs, i9-13900H, Acer N7000
52 (39min) fps
Khadas Mind
Iris Xe G7 96EUs, i7-1360P, WD PC SN740 SDDPTQD-1T00
49 (32min) fps -6%
Geekom XT12 Pro
Iris Xe G7 96EUs, i9-12900H, Lexar SSD NM7A1 1TB
47 (31min) fps -10%
1920x1080 High Preset
Minisforum EliteMini UM780 XTX
Radeon 780M, R7 7840HS, Kingston OM8PGP41024Q-A0
45 (37min) fps +55%
Geekom A8
Radeon 780M, R9 8945HS, Acer N5000
44 (37min) fps +52%
Aoostar GEM12
Radeon 780M, R7 8845HS, Crucial P3 Plus CT1000P3PSSD8
41 (32min) fps +41%
Minisforum AtomMan X7 Ti
Arc 8-Core, Ultra 9 185H, Kingston OM8PGP41024Q-A0
39 (25min) fps +34%
Acemagic F2A
Arc 8-Core, Ultra 7 155H, Kingston OM8SEP1024Q-A0
37 (25min) fps +28%
Geekom GT13 Pro
Iris Xe G7 96EUs, i9-13900H, Acer N7000
29 (23min) fps
Khadas Mind
Iris Xe G7 96EUs, i7-1360P, WD PC SN740 SDDPTQD-1T00
27 (20min) fps -7%
Geekom XT12 Pro
Iris Xe G7 96EUs, i9-12900H, Lexar SSD NM7A1 1TB
24 (18min) fps -17%
Dota 2 Reborn
1280x720 min (0/3) fastest
Minisforum EliteMini UM780 XTX
Radeon 780M, R7 7840HS, Kingston OM8PGP41024Q-A0
161.5 (141.6min) fps +47%
Geekom A8
Radeon 780M, R9 8945HS, Acer N5000
159.7 (142.1min) fps +45%
Aoostar GEM12
Radeon 780M, R7 8845HS, Crucial P3 Plus CT1000P3PSSD8
152.7 (134.2min) fps +39%
Geekom GT13 Pro
Iris Xe G7 96EUs, i9-13900H, Acer N7000
109.8 (85min) fps
Minisforum AtomMan X7 Ti
Arc 8-Core, Ultra 9 185H, Kingston OM8PGP41024Q-A0
106.5 (61min) fps -3%
Geekom XT12 Pro
Iris Xe G7 96EUs, i9-12900H, Lexar SSD NM7A1 1TB
106.3 (81.7min) fps -3%
Khadas Mind
Iris Xe G7 96EUs, i7-1360P, WD PC SN740 SDDPTQD-1T00
104.2 (79.7min) fps -5%
Acemagic F2A
Arc 8-Core, Ultra 7 155H, Kingston OM8SEP1024Q-A0
103.2 (59.8min) fps -6%
1920x1080 high (2/3)
Minisforum EliteMini UM780 XTX
Radeon 780M, R7 7840HS, Kingston OM8PGP41024Q-A0
97.45 (86.9min) fps +49%
Geekom A8
Radeon 780M, R9 8945HS, Acer N5000
88.3 (74.1min) fps +35%
Aoostar GEM12
Radeon 780M, R7 8845HS, Crucial P3 Plus CT1000P3PSSD8
86.6 (72.2min) fps +32%
Minisforum AtomMan X7 Ti
Arc 8-Core, Ultra 9 185H, Kingston OM8PGP41024Q-A0
79 (48.2min) fps +21%
Acemagic F2A
Arc 8-Core, Ultra 7 155H, Kingston OM8SEP1024Q-A0
77.3 (52.5min) fps +18%
Geekom GT13 Pro
Iris Xe G7 96EUs, i9-13900H, Acer N7000
65.5 (56.1min) fps
Khadas Mind
Iris Xe G7 96EUs, i7-1360P, WD PC SN740 SDDPTQD-1T00
61.7 (51.7min) fps -6%
Geekom XT12 Pro
Iris Xe G7 96EUs, i9-12900H, Lexar SSD NM7A1 1TB
61.3 (54.1min) fps -6%
F1 2020
1280x720 Ultra Low Preset
Minisforum EliteMini UM780 XTX
Radeon 780M, R7 7840HS, Kingston OM8PGP41024Q-A0
201 (180min) fps +114%
Geekom A8
Radeon 780M, R9 8945HS, Acer N5000
197.3 (171min) fps +110%
Aoostar GEM12
Radeon 780M, R7 8845HS, Crucial P3 Plus CT1000P3PSSD8
184.7 (163min) fps +97%
Minisforum AtomMan X7 Ti
Arc 8-Core, Ultra 9 185H, Kingston OM8PGP41024Q-A0
139.1 (126min) fps +48%
Geekom GT13 Pro
Iris Xe G7 96EUs, i9-13900H, Acer N7000
93.8 (83min) fps
Geekom XT12 Pro
Iris Xe G7 96EUs, i9-12900H, Lexar SSD NM7A1 1TB
84.5 (74min) fps -10%
1920x1080 High Preset AA:T AF:16x
Minisforum EliteMini UM780 XTX
Radeon 780M, R7 7840HS, Kingston OM8PGP41024Q-A0
79.3 (67min) fps +105%
Geekom A8
Radeon 780M, R9 8945HS, Acer N5000
76.4 (67min) fps +97%
Aoostar GEM12
Radeon 780M, R7 8845HS, Crucial P3 Plus CT1000P3PSSD8
73.6 (62min) fps +90%
Minisforum AtomMan X7 Ti
Arc 8-Core, Ultra 9 185H, Kingston OM8PGP41024Q-A0
60.5 (51min) fps +56%
Geekom GT13 Pro
Iris Xe G7 96EUs, i9-13900H, Acer N7000
38.7 (32min) fps
Geekom XT12 Pro
Iris Xe G7 96EUs, i9-12900H, Lexar SSD NM7A1 1TB
34.2 (29min) fps -12%
GRID Legends
1280x720 Low Preset
Minisforum EliteMini UM780 XTX
Radeon 780M, R7 7840HS, Kingston OM8PGP41024Q-A0
150.6 (52.6min) fps +115%
Geekom A8
Radeon 780M, R9 8945HS, Acer N5000
141.4 (2.69min) fps +102%
Aoostar GEM12
Radeon 780M, R7 8845HS, Crucial P3 Plus CT1000P3PSSD8
136.2 (6.48min) fps +95%
Minisforum AtomMan X7 Ti
Arc 8-Core, Ultra 9 185H, Kingston OM8PGP41024Q-A0
86.6 (7.26min) fps +24%
Acemagic F2A
Arc 8-Core, Ultra 7 155H, Kingston OM8SEP1024Q-A0
80 (35min) fps +14%
Geekom GT13 Pro
Iris Xe G7 96EUs, i9-13900H, Acer N7000
69.9 (30min) fps
Khadas Mind
Iris Xe G7 96EUs, i7-1360P, WD PC SN740 SDDPTQD-1T00
53.5 (25.6min) fps -23%
1920x1080 High Preset
Minisforum EliteMini UM780 XTX
Radeon 780M, R7 7840HS, Kingston OM8PGP41024Q-A0
68.8 (34.8min) fps +123%
Aoostar GEM12
Radeon 780M, R7 8845HS, Crucial P3 Plus CT1000P3PSSD8
62.3 (30.5min) fps +102%
Geekom A8
Radeon 780M, R9 8945HS, Acer N5000
56.4 (21.6min) fps +83%
Minisforum AtomMan X7 Ti
Arc 8-Core, Ultra 9 185H, Kingston OM8PGP41024Q-A0
44.8 (29.3min) fps +45%
Acemagic F2A
Arc 8-Core, Ultra 7 155H, Kingston OM8SEP1024Q-A0
41.7 (24min) fps +35%
Geekom GT13 Pro
Iris Xe G7 96EUs, i9-13900H, Acer N7000
30.8 (20.2min) fps
Khadas Mind
Iris Xe G7 96EUs, i7-1360P, WD PC SN740 SDDPTQD-1T00
27.1 (19.2min) fps -12%
Shadow of the Tomb Raider
1280x720 Lowest Preset
Acemagic F2A
Arc 8-Core, Ultra 7 155H, Kingston OM8SEP1024Q-A0
131.4 fps +130%
Minisforum EliteMini UM780 XTX
Radeon 780M, R7 7840HS, Kingston OM8PGP41024Q-A0
109.2 fps +91%
Aoostar GEM12
Radeon 780M, R7 8845HS, Crucial P3 Plus CT1000P3PSSD8
103.8 fps +82%
Minisforum AtomMan X7 Ti
Arc 8-Core, Ultra 9 185H, Kingston OM8PGP41024Q-A0
79.3 fps +39%
Geekom A8
Radeon 780M, R9 8945HS, Acer N5000
65.9 fps +15%
Geekom GT13 Pro
Iris Xe G7 96EUs, i9-13900H, Acer N7000
57.1 fps
Khadas Mind
Iris Xe G7 96EUs, i7-1360P, WD PC SN740 SDDPTQD-1T00
43.7 fps -23%
Geekom XT12 Pro
Iris Xe G7 96EUs, i9-12900H, Lexar SSD NM7A1 1TB
39.6 fps -31%
1920x1080 High Preset AA:SM
Acemagic F2A
Arc 8-Core, Ultra 7 155H, Kingston OM8SEP1024Q-A0
49.5 fps +137%
Minisforum EliteMini UM780 XTX
Radeon 780M, R7 7840HS, Kingston OM8PGP41024Q-A0
41.2 fps +97%
Aoostar GEM12
Radeon 780M, R7 8845HS, Crucial P3 Plus CT1000P3PSSD8
39.5 fps +89%
Minisforum AtomMan X7 Ti
Arc 8-Core, Ultra 9 185H, Kingston OM8PGP41024Q-A0
35.8 fps +71%
Geekom A8
Radeon 780M, R9 8945HS, Acer N5000
23.4 fps +12%
Khadas Mind
Iris Xe G7 96EUs, i7-1360P, WD PC SN740 SDDPTQD-1T00
22.5 fps +8%
Geekom GT13 Pro
Iris Xe G7 96EUs, i9-13900H, Acer N7000
20.9 fps
Geekom XT12 Pro
Iris Xe G7 96EUs, i9-12900H, Lexar SSD NM7A1 1TB
18.8 fps -10%

FPS-Diagramm

05101520Tooltip
Geekom GT13 Pro i9-13900H, Iris Xe G7 96EUs: Ø11.1 (5.97-12.3)
Aoostar GEM12 R7 8845HS, Radeon 780M: Ø21.7 (20.1-23.3)
min.mittelhochmax.
GTA V (2015) 119.7 97.4 22 9.07
Dota 2 Reborn (2015) 109.8 80.2 65.5 58.6
Final Fantasy XV Benchmark (2018) 45.1 25.3 18.2
Far Cry 5 (2018) 58 30 28 27
Strange Brigade (2018) 98.7 42.5 33.8 26.9
Shadow of the Tomb Raider (2018) 57.1 22.2 20.9 18
Far Cry New Dawn (2019) 52 31 29 27
Metro Exodus (2019) 38.5 19.1 14.2 11.2
Total War: Three Kingdoms (2019) 100.3 39.6 30.2 22.2
Borderlands 3 (2019) 54.4 26.5 16.7 12.7
F1 2020 (2020) 93.8 49.1 38.7 24.9
F1 2021 (2021) 105.6 52.2 39.9 29.4
GRID Legends (2022) 58.8 40.2 30.8 27.9
Tiny Tina's Wonderlands (2022) 34 26.4 16.7 13.2
F1 22 (2022) 46.3 43.1 31.2 24.9
F1 23 (2023) 43.2 39.4 28 21.9
Baldur's Gate 3 (2023) 18 14 11.7 11.2
Cyberpunk 2077 2.1 Phantom Liberty (2023) 18.2 14.7 12.8 11.5
Total War Pharaoh (2023) 68.9 48.8 34.8 30.9
Prince of Persia The Lost Crown (2024) 132.8 93.4 87.8
F1 24 (2024) 40.4 35.4 25.6 20.4

Der Geekom GT13 Pro mit dem Razer Core X im Leistungs-Check

Razer Core X mit Nvidia GeForce RTX 3060 Ti

Der Geekom GT13 Pro ermöglicht den Einsatz von externen Grafikkarten, die sich per USB4 anschließen lassen. Wir haben uns die Leistung zusammen mit dem Razer Core X und einer Nvidia GeForce RTX 3060 Ti genauer angeschaut. Wie zu erwarten, kann die 3D-Performance massiv gesteigert werden. Mit dieser Kombination deckt der Mini-PC ein breites Aufgabenspektrum ab und eignet sich sowohl zum Spielen als auch für das Bearbeiten von Videos. Die Leistung der Nvidia GeForce RTX 3060 Ti, welche hier nur über USB4 angebunden ist, kann nicht mit der Leistung in einem herkömmlichen Desktop-PC mithalten. Die zur Verfügung stehende Bandbreite zur Kommunikation mit der externen Grafikkarte liegt lediglich bei PCIe-x4-3.0-Geschwindigkeit.

Geekom GT13 Pro mit Razer Core X und Nvidia GeForce RTX 3060 Ti

Performance Rating - Percent
Geekom A8 (Nvidia GeForce RTX 3060 Ti FE)
AMD Ryzen 9 8945HS
99.2 pt
Geekom GT13 Pro (Nvidia GeForce RTX 3060 Ti FE)
Intel Core i9-13900H
98 pt
Geekom XT12 Pro (Nvidia GeForce RTX 3060 Ti FE)
Intel Core i9-12900H
95.4 pt
3DMark 11 - 1280x720 Performance GPU
Geekom A8 (Nvidia GeForce RTX 3060 Ti FE)
AMD Ryzen 9 8945HS
34666 Points +367%
Geekom GT13 Pro (Nvidia GeForce RTX 3060 Ti FE)
Intel Core i9-13900H
33219 Points +347%
Geekom XT12 Pro (Nvidia GeForce RTX 3060 Ti FE)
Intel Core i9-12900H
32654 Points +340%

7424 Points
3DMark
2560x1440 Time Spy Graphics
Geekom A8 (Nvidia GeForce RTX 3060 Ti FE)
AMD Ryzen 9 8945HS
11182 Points +562%
Geekom GT13 Pro (Nvidia GeForce RTX 3060 Ti FE)
Intel Core i9-13900H
11085 Points +556%
Geekom XT12 Pro (Nvidia GeForce RTX 3060 Ti FE)
Intel Core i9-12900H
11062 Points +555%

1690 Points
1920x1080 Fire Strike Graphics
Geekom GT13 Pro (Nvidia GeForce RTX 3060 Ti FE)
Intel Core i9-13900H
25468 Points +338%
Geekom A8 (Nvidia GeForce RTX 3060 Ti FE)
AMD Ryzen 9 8945HS
25462 Points +338%
Geekom XT12 Pro (Nvidia GeForce RTX 3060 Ti FE)
Intel Core i9-12900H
24796 Points +327%

5812 Points
3840x2160 Fire Strike Ultra Graphics
Geekom GT13 Pro (Nvidia GeForce RTX 3060 Ti FE)
Intel Core i9-13900H
7139 Points +471%
Geekom XT12 Pro (Nvidia GeForce RTX 3060 Ti FE)
Intel Core i9-12900H
7047 Points +463%
Geekom A8 (Nvidia GeForce RTX 3060 Ti FE)
AMD Ryzen 9 8945HS
7044 Points +463%

1251 Points
Unigine Superposition
1280x720 720p Low
Geekom GT13 Pro (Nvidia GeForce RTX 3060 Ti FE)
Intel Core i9-13900H
34168 Points +416%
Geekom A8 (Nvidia GeForce RTX 3060 Ti FE)
AMD Ryzen 9 8945HS
33894 Points +412%
Geekom XT12 Pro (Nvidia GeForce RTX 3060 Ti FE)
Intel Core i9-12900H
31903 Points +382%

6619 Points
1920x1080 1080p High
Geekom GT13 Pro (Nvidia GeForce RTX 3060 Ti FE)
Intel Core i9-13900H
15240 Points +561%
Geekom A8 (Nvidia GeForce RTX 3060 Ti FE)
AMD Ryzen 9 8945HS
15076 Points +554%
Geekom XT12 Pro (Nvidia GeForce RTX 3060 Ti FE)
Intel Core i9-12900H
14853 Points +544%

2306 Points
1920x1080 1080p Extreme
Geekom GT13 Pro (Nvidia GeForce RTX 3060 Ti FE)
Intel Core i9-13900H
7193 Points +540%
Geekom XT12 Pro (Nvidia GeForce RTX 3060 Ti FE)
Intel Core i9-12900H
7089 Points +531%
Geekom A8 (Nvidia GeForce RTX 3060 Ti FE)
AMD Ryzen 9 8945HS
7055 Points +528%

1124 Points
3840x2160 4k Optimized
Geekom GT13 Pro (Nvidia GeForce RTX 3060 Ti FE)
Intel Core i9-13900H
9419 Points
Geekom XT12 Pro (Nvidia GeForce RTX 3060 Ti FE)
Intel Core i9-12900H
9240 Points
Geekom A8 (Nvidia GeForce RTX 3060 Ti FE)
AMD Ryzen 9 8945HS
9205 Points
7680x4320 8k Optimized
Geekom GT13 Pro (Nvidia GeForce RTX 3060 Ti FE)
Intel Core i9-13900H
4079 Points
Geekom XT12 Pro (Nvidia GeForce RTX 3060 Ti FE)
Intel Core i9-12900H
4042 Points
Geekom A8 (Nvidia GeForce RTX 3060 Ti FE)
AMD Ryzen 9 8945HS
4013 Points
Unigine Valley 1.0
1920x1080 Extreme HD DirectX AA:x8
Geekom XT12 Pro (Nvidia GeForce RTX 3060 Ti FE)
Intel Core i9-12900H
144.5 fps +857%
Geekom GT13 Pro (Nvidia GeForce RTX 3060 Ti FE)
Intel Core i9-13900H
143.9 fps +853%
Geekom A8 (Nvidia GeForce RTX 3060 Ti FE)
AMD Ryzen 9 8945HS
141.6 fps +838%

15.1 fps
1920x1080 Extreme HD Preset OpenGL AA:x8
Geekom GT13 Pro (Nvidia GeForce RTX 3060 Ti FE)
Intel Core i9-13900H
138.6 fps +783%
Geekom XT12 Pro (Nvidia GeForce RTX 3060 Ti FE)
Intel Core i9-12900H
138.2 fps +780%
Geekom A8 (Nvidia GeForce RTX 3060 Ti FE)
AMD Ryzen 9 8945HS
137.5 fps +776%

15.7 fps
Unigine Heaven 4.0
Extreme Preset OpenGL
Geekom A8 (Nvidia GeForce RTX 3060 Ti FE)
AMD Ryzen 9 8945HS
174.9 fps +597%
Geekom GT13 Pro (Nvidia GeForce RTX 3060 Ti FE)
Intel Core i9-13900H
173.6 fps +592%
Geekom XT12 Pro (Nvidia GeForce RTX 3060 Ti FE)
Intel Core i9-12900H
172.1 fps +586%

25.1 fps
Extreme Preset DX11
Geekom GT13 Pro (Nvidia GeForce RTX 3060 Ti FE)
Intel Core i9-13900H
163.6 fps +529%
Geekom A8 (Nvidia GeForce RTX 3060 Ti FE)
AMD Ryzen 9 8945HS
163.2 fps +528%
Geekom XT12 Pro (Nvidia GeForce RTX 3060 Ti FE)
Intel Core i9-12900H
162.5 fps +525%

26 fps
ComputeMark v2.1
1024x600 Normal, Score
Geekom GT13 Pro (Nvidia GeForce RTX 3060 Ti FE)
Intel Core i9-13900H
28156 Points +671%
Geekom A8 (Nvidia GeForce RTX 3060 Ti FE)
AMD Ryzen 9 8945HS
27929 Points +665%
Geekom XT12 Pro (Nvidia GeForce RTX 3060 Ti FE)
Intel Core i9-12900H
25975 Points +612%

3650 Points
1024x600 Normal, Fluid 3DTex
Geekom GT13 Pro (Nvidia GeForce RTX 3060 Ti FE)
Intel Core i9-13900H
2719 Points +851%
Geekom A8 (Nvidia GeForce RTX 3060 Ti FE)
AMD Ryzen 9 8945HS
2687 Points +840%
Geekom XT12 Pro (Nvidia GeForce RTX 3060 Ti FE)
Intel Core i9-12900H
2527 Points +784%

286 Points
1024x600 Normal, Fluid 2DTexArr
Geekom GT13 Pro (Nvidia GeForce RTX 3060 Ti FE)
Intel Core i9-13900H
2663 Points +806%
Geekom A8 (Nvidia GeForce RTX 3060 Ti FE)
AMD Ryzen 9 8945HS
2622 Points +792%
Geekom XT12 Pro (Nvidia GeForce RTX 3060 Ti FE)
Intel Core i9-12900H
2463 Points +738%

294 Points
1024x600 Normal, Mandel Vector
Geekom GT13 Pro (Nvidia GeForce RTX 3060 Ti FE)
Intel Core i9-13900H
5769 Points +561%
Geekom A8 (Nvidia GeForce RTX 3060 Ti FE)
AMD Ryzen 9 8945HS
5742 Points +558%
Geekom XT12 Pro (Nvidia GeForce RTX 3060 Ti FE)
Intel Core i9-12900H
5342 Points +512%

873 Points
1024x600 Normal, Mandel Scalar
Geekom GT13 Pro (Nvidia GeForce RTX 3060 Ti FE)
Intel Core i9-13900H
6335 Points +613%
Geekom A8 (Nvidia GeForce RTX 3060 Ti FE)
AMD Ryzen 9 8945HS
6283 Points +608%
Geekom XT12 Pro (Nvidia GeForce RTX 3060 Ti FE)
Intel Core i9-12900H
5881 Points +562%

888 Points
1024x600 Normal, QJuliaRayTrace
Geekom GT13 Pro (Nvidia GeForce RTX 3060 Ti FE)
Intel Core i9-13900H
10671 Points +715%
Geekom A8 (Nvidia GeForce RTX 3060 Ti FE)
AMD Ryzen 9 8945HS
10594 Points +709%
Geekom XT12 Pro (Nvidia GeForce RTX 3060 Ti FE)
Intel Core i9-12900H
9762 Points +645%

1310 Points
DaVinci Resolve PugetBench - GPU Effects 0.93
Geekom A8 (Nvidia GeForce RTX 3060 Ti FE)
AMD Ryzen 9 8945HS
72 Points +500%
Geekom XT12 Pro (Nvidia GeForce RTX 3060 Ti FE)
Intel Core i9-12900H
69 Points +475%
Geekom GT13 Pro (Nvidia GeForce RTX 3060 Ti FE)
Intel Core i9-13900H
69 Points +475%

12 Points
Photoshop PugetBench - GPU Score
Geekom A8 (Nvidia GeForce RTX 3060 Ti FE)
AMD Ryzen 9 8945HS
100.6 Points +14%
Geekom XT12 Pro (Nvidia GeForce RTX 3060 Ti FE)
Intel Core i9-12900H
93.7 Points +6%

88.4 Points
Geekom GT13 Pro (Nvidia GeForce RTX 3060 Ti FE)
Intel Core i9-13900H
81.6 Points -8%
Premiere Pro PugetBench - GPU 0.9
Geekom A8 (Nvidia GeForce RTX 3060 Ti FE)
AMD Ryzen 9 8945HS
55.8 Points +589%
Geekom GT13 Pro (Nvidia GeForce RTX 3060 Ti FE)
Intel Core i9-13900H
48 Points +493%
Geekom XT12 Pro (Nvidia GeForce RTX 3060 Ti FE)
Intel Core i9-12900H
45.6 Points +463%

8.1 Points
min.mittelhochmax.QHD4K DLSS4K
GTA V (2015) 182.1 178 170.7 103.6 91.6 103.8
Dota 2 Reborn (2015) 180.5 157.2 146.6 133.3 108.6
Final Fantasy XV Benchmark (2018) 188 142.7 98.6 78 48.3
X-Plane 11.11 (2018) 151.3 135 106.6 95.4
Far Cry 5 (2018) 160 138 132 121 99 58
Strange Brigade (2018) 214 160.5 156.8 152.9 130.2 84.5
Shadow of the Tomb Raider (2018) 118.5 101 100.8 98.5 85.9 49.6
Far Cry New Dawn (2019) 138 119 115 104 93 60
Metro Exodus (2019) 144.8 91.6 69.6 52.5 45.8 33.7
Total War: Three Kingdoms (2019) 300.4 145.6 95 70.1 49.3 26.7
Borderlands 3 (2019) 155.8 132.4 104.8 84.6 64.6 38.3
F1 2020 (2020) 207 127.8 128.9 105.5 90.6 61.4
F1 2021 (2021) 143.5 110.1 69.1 51.7 48.1 41.4
Far Cry 6 (2021) 78 65 53.9 46.9 45.8
GRID Legends (2022) 119.2 99.7 84 70.9 64.7 51
Tiny Tina's Wonderlands (2022) 178.2 138.7 100.2 81.4 61.7 36.1
F1 22 (2022) 61.4 56.1 43.2 27.6 26.2 19.6
F1 23 (2023) 67.9 66.2 54.6 33.3 31.9 10.3
Baldur's Gate 3 (2023) 113.4 90.8 78.9 79 61.4 54.7 36.9
Cyberpunk 2077 2.1 Phantom Liberty (2023) 85.3 80.4 71.3 63.9 44.9 22.1
Assassin's Creed Mirage (2023) 88 82 77 63 59 56
Avatar Frontiers of Pandora (2023) 53 49 43 30 23 9.7
Skull & Bones (2024) 83 77 64 54 45 31
F1 24 (2024) 77.3 72.8 61.3 42 36.5 28.9 19.6
Geekom GT13 Pro, Intel Iris Xe Graphics G7 96EUs
i9-13900H
Geekom GT13 Pro (Nvidia GeForce RTX 3060 Ti FE),
i9-13900H
Geekom A8 (Nvidia GeForce RTX 3060 Ti FE),
R9 8945HS
Minisforum MS-01 (Nvidia GeForce RTX 3060 Ti FE),
i9-13900H
Geekom XT12 Pro (Nvidia GeForce RTX 3060 Ti FE),
i9-12900H
SPECviewperf 12
679%
674%
687%
630%
1900x1060 3ds Max (3dsmax-05)
41.4
147
255%
146
253%
147
255%
124
200%
1900x1060 Catia (catia-04)
38.6
116
201%
112
190%
116
201%
95.2
147%
1900x1060 Creo (creo-01)
28.2
62.9
123%
62.9
123%
64.2
128%
53.5
90%
1900x1060 Energy (energy-01)
0.41
13.4
3168%
13.3
3144%
13.4
3168%
13.4
3168%
1900x1060 Maya (maya-04)
42.4
228
438%
235
454%
235
454%
182
329%
1900x1060 Medical (medical-01)
12.2
73.4
502%
74.8
513%
76.4
526%
74.4
510%
1900x1060 Showcase (showcase-01)
19.1
149
680%
141
638%
149
680%
123
544%
1900x1060 Solidworks (sw-03)
46.6
77.2
66%
81.6
75%
84.6
82%
71.7
54%
SPECviewperf 13
386%
374%
385%
311%
3ds Max (3dsmax-06)
41.2
147
257%
145
252%
147
257%
124
201%
Catia (catia-05)
54.7
164
200%
163
198%
163
198%
135
147%
Creo (creo-02)
42.7
232
443%
231
441%
231
441%
194
354%
Energy (energy-02)
4.62
25.9
461%
25.9
461%
25.9
461%
24
419%
Maya (maya-05)
51.6
363
603%
351
580%
361
600%
298
478%
Medical (medical-02)
15.6
65.2
318%
64.1
311%
64.9
316%
56.7
263%
Showcase (showcase-02)
19.1
151
691%
141
638%
150
685%
125
554%
Solidworks (sw-04)
58.3
127
118%
125
114%
129
121%
102
75%
SPECviewperf 2020
390%
518%
436%
327%
3840x2160 Medical (medical-03)
2.69
10.8
301%
10.8
301%
10.8
301%
11.8
339%
3840x2160 Energy (energy-03)
3.17
21
562%
50.3
1487%
31.1
881%
18.9
496%
3840x2160 Creo (creo-03)
16.3
76.4
369%
76.6
370%
76.8
371%
62.7
285%
3840x2160 CATIA (catia-06)
8.53
40.1
370%
38.8
355%
39.7
365%
32.8
285%
3840x2160 3ds Max (3dsmax-07)
10.3
47.3
359%
45.9
346%
47.6
362%
40
288%
3840x2160 Siemens NX (snx-04)
6.62
16.5
149%
16.6
151%
16.6
151%
15.2
130%
3840x2160 Maya (maya-06)
27.3
196
618%
195
614%
197
622%
155
468%
Durchschnitt gesamt (Programm / Settings)
485% / 489%
522% / 522%
503% / 505%
423% / 427%

Emissionen - IceBlast 1.5 ist schnell am Limit

Geräuschemissionen

Hinsichtlich der Kühlung ist der Geekom GT13 Pro aufgrund seiner Bauweise sehr eingeschränkt. Im Leerlauf agiert der Mini-PC jedoch noch ausgesprochen leise, wenngleich der kleine Lüfter bei Belastung deutlich hörbar werden kann. Im Test messen wir einen maximalen Schalldruckpegel von 48,5 dB(A). Diese Lautstärke erreicht der GT13 Pro nur kurzfristig, sofern der PL2-Wert erreicht wird. Bei längerer Last arbeitet das SoC mit dem PL1-Limit, womit sich die Lautstärke dann bei ca. 39 dB(A) einpendelt. Liegt keine dauerhafte Last an, die wir zum Beispiel mit Prime95 simulieren, arbeitet der Lüfter sehr nervös. Der Schalldruckpegel bei durchschnittlicher Last schwankt bei unserem Testsample von 38 bis 44 dB(A).

Lautstärkediagramm

Idle
27.9 / 27.9 / 28 dB(A)
Last
43.8 / 48.5 dB(A)
  red to green bar
 
 
30 dB
leise
40 dB(A)
deutlich hörbar
50 dB(A)
störend
 
min: dark, med: mid, max: light   Earthworks M23R (aus 15 cm gemessen)   Umgebungsgeräusche: 24.3 dB(A)
dB(A) 0102030405060708090Deep BassMiddle BassHigh BassLower RangeMidsHigher MidsLower HighsMid HighsUpper HighsSuper Highs2036.733.235.638.931.831.838.72530.931.431.333.43030.133.13134.236.137.738.537.831.238.24024.324.627.226.223.423.930.55034.935.535.334.33533.828.46330.825.824.727.328.624.525.98026.726.926.226.326.924.427.210025.725.322.622.422.821.524.812528.124.619.919.819.112.22416025.324.115.615.615.29.92220027.832.417.117.61812.523.325028.527.413.714.614.19.62331528.425.214.213.314.39.625.940029.32614.714.716.39.424.550029.826.613.613.713.78.724.263031.829.313.513.513.89.126.480034.431.213.613.713.410.129.2100038.533.61515.215.112.228.7125039.334.816.215.815.910.429.7160039.134.615.615.315.210.728.6200039.634.919.118.818.711.528.7250040.234.720.120.220.411.828.2315034.428.813.613.513.312.623.5400035.231.113.913.613.51325500035.528.714.113.513.413.320.5630030.123.314.213.813.813.617800025.218.31413.813.713.514.8100002216.714.21413.913.814.61250017.616.414.314.214.113.915.31600014.616.113.913.713.713.815.3SPL48.543.82827.927.924.338.4N5.94.20.90.90.90.52.7median 29.8median 27.4median 14.2median 14.2median 14.1median 12.2median 24.2Delta4.84.21.21.41.31.85.2hearing rangehide median Fan NoiseGeekom GT13 Pro
Geekom GT13 Pro
i9-13900H, Iris Xe G7 96EUs
Aoostar GEM12
R7 8845HS, Radeon 780M
Minisforum AtomMan X7 Ti
Ultra 9 185H, Arc 8-Core
Geekom A8
R9 8945HS, Radeon 780M
Geekom XT12 Pro
i9-12900H, Iris Xe G7 96EUs
Acemagic F2A
Ultra 7 155H, Arc 8-Core
Minisforum EliteMini UM780 XTX
R7 7840HS, Radeon 780M
Khadas Mind
i7-1360P, Iris Xe G7 96EUs
Geräuschentwicklung
9%
1%
4%
2%
2%
6%
-13%
aus / Umgebung *
24.3
24.3
-0%
24.1
1%
24.4
-0%
25.4
-5%
24.9
-2%
24.8
-2%
25.2
-4%
Idle min *
27.9
27.5
1%
29.8
-7%
24.5
12%
28
-0%
25.4
9%
28.5
-2%
34.4
-23%
Idle avg *
27.9
27.6
1%
29.9
-7%
24.7
11%
28.1
-1%
25.7
8%
28.5
-2%
34.4
-23%
Idle max *
28
27.6
1%
30
-7%
24.7
12%
28.5
-2%
25.7
8%
28.7
-3%
34.5
-23%
Last avg *
43.8
36
18%
37.3
15%
48.5
-11%
39.6
10%
47.8
-9%
32.4
26%
44.7
-2%
Cyberpunk 2077 ultra *
45.4
35.4
22%
Last max *
48.5
38.2
21%
43.5
10%
49.2
-1%
44.2
9%
49
-1%
39.6
18%
50.4
-4%
Witcher 3 ultra *
35.4
40.2
47
47.2
45.23
32.7
49

* ... kleinere Werte sind besser

Temperatur

Das Gehäuse des Geekom GT13 Pro erwärmt sich sowohl im Leerlauf als auch unter Last spürbar. Unter Belastung steigen die Oberflächentemperaturen abermals leicht an. Die 50 °C werden jedoch nicht ganz erreicht. Beim Intel Core i9-13900H verzeichnen wir relativ hohe Temperaturen, was der schlechten Belüftung der kompakten Kühleinheit geschuldet ist. Mit 100 °C erreicht das SoC den Maximalwert, den Intel selbst in den Spezifikationen angibt. Wichtig zu wissen ist, dass die 100 °C nur kurzzeitig erreicht werden. Sofern das PL1 mit maximal 35 Watt greift, sinkt die CPU-Temperatur leicht ab. Im Durchschnitt pendelt sich die Temperatur des Intel Core i9-13900H bei ca. 90 °C ein.

Stresstest Prime95, solo
Stresstest FurMark, solo
Stresstest Prime95 und FurMark
Geekom GT13 Pro beim Stresstest (Oberseite)
Geekom GT13 Pro beim Stresstest (Unterseite)
Geekom GT13 Pro beim Stresstest (Rückseite)
Netzteil während des Stresstests
Max. Last
 47.9 °C46.8 °C48.2 °C 
 39.3 °C41.7 °C38.5 °C 
 37.7 °C38.4 °C38.1 °C 
Maximal: 48.2 °C
Durchschnitt: 41.8 °C
42.4 °C42.4 °C39.8 °C
38.1 °C45.7 °C34.7 °C
39.8 °C35.9 °C32.4 °C
Maximal: 45.7 °C
Durchschnitt: 39 °C
Netzteil (max.)  40.6 °C | Raumtemperatur 21.3 °C | Fluke t3000FC (calibrated)
(-) Die Durchschnittstemperatur auf der Oberseite unter extremer Last ist 41.8 °C. Im Vergleich erhitzte sich der Durchschnitt der Geräteklasse Mini PC auf 32.2 °C.
(-) Die maximale Temperatur auf der Oberseite ist 48.2 °C. Im Vergleich liegt der Klassendurchschnitt bei 35.8 °C (von 24 bis 69.5 °C für die Klasse Mini PC).
(-) Auf der Unterseite messen wir eine maximalen Wert von 45.7 °C (im Vergleich zum Durchschnitt von 36.2 °C).
(-) Ohne Last messen wir eine durchschnittliche Temperatur von 38.2 °C auf der Oberseite. Der Klassendurchschnitt erreicht 32.2 °C.

Energieverwaltung

Mini-PCs sind grundsätzlich sparsam und benötigen deutlich weniger Energie als ein herkömmlicher Desktop-PC. Unterschiede zwischen den Mini-PCs hinsichtlich der Energieaufnahme gibt es dennoch. Mit 7,9 bis 22,3 Watt ist der Geekom GT13 Pro im Leerlauf nicht sonderlich sparsam, wenn man sich ihn im Vergleich mit den Kontrahenten anschaut. Bei durchschnittlicher Last benötigt unser Testgerät 57 Watt, und in der Spitze muss das 120-Watt-Netzteil 93,4 Watt bereitstellen.

Stromverbrauch
Aus / Standbydarklight 1.6 / 1.9 Watt
Idledarkmidlight 7.9 / 10.3 / 22.3 Watt
Last midlight 57.44 / 93.4 Watt
 color bar
Legende: min: dark, med: mid, max: light        Metrahit Energy
Geekom GT13 Pro
i9-13900H, Iris Xe G7 96EUs
Aoostar GEM12
R7 8845HS, Radeon 780M
Minisforum AtomMan X7 Ti
Ultra 9 185H, Arc 8-Core
Geekom A8
R9 8945HS, Radeon 780M
Geekom XT12 Pro
i9-12900H, Iris Xe G7 96EUs
Acemagic F2A
Ultra 7 155H, Arc 8-Core
Minisforum EliteMini UM780 XTX
R7 7840HS, Radeon 780M
Khadas Mind
i7-1360P, Iris Xe G7 96EUs
Durchschnittliche Intel Iris Xe Graphics G7 96EUs
 
Durchschnitt der Klasse Mini PC
 
Stromverbrauch
-7%
3%
31%
15%
1%
2%
18%
30%
-0%
Idle min *
7.9
8.2
-4%
8.2
-4%
3.2
59%
5.7
28%
9.1
-15%
8.5
-8%
7.8
1%
Idle avg *
10.3
10
3%
12.1
-17%
4.9
52%
9.5
8%
10.3
-0%
10.5
-2%
10.9
-6%
8.55 ?(3.8 - 63, n=193)
17%
Idle max *
22.3
14.6
35%
14
37%
6.8
70%
16.5
26%
14.4
35%
12.9
42%
11.8
47%
Last avg *
57.44
73.9
-29%
53.1
8%
71.3
-24%
53.3
7%
54.9
4%
67.2
-17%
39.2
32%
Cyberpunk 2077 ultra external monitor *
55.9
79.9
-43%
Last max *
93.4
95.3
-2%
100.4
-7%
93.2
-0%
87.8
6%
110.4
-18%
97.2
-4%
76.4
18%

* ... kleinere Werte sind besser

Effizienzübersicht

Power Consumption / Cinebench R15 Multi Efficiency (external Monitor)
Geekom A8
35.8 Points per Watt +44%
Minisforum AtomMan X7 Ti
31.2 Points per Watt +26%
Acemagic F2A
26.6 Points per Watt +7%
Geekom GT13 Pro
24.8 Points per Watt
Geekom XT12 Pro
24.7 Points per Watt 0%
Power Consumption / Cinebench R23 Single Power Efficiency - external Monitor
Geekom A8
61.7 Points per Watt +14%
Minisforum AtomMan X7 Ti
55.6 Points per Watt +2%
Geekom GT13 Pro
54.3 Points per Watt
Acemagic F2A
54.2 Points per Watt 0%
Geekom XT12 Pro
37.1 Points per Watt -32%
Power Consumption / Cinebench R23 Multi Power Efficiency - external Monitor
Geekom A8
251 Points per Watt +20%
Geekom GT13 Pro
210 Points per Watt
Minisforum AtomMan X7 Ti
205 Points per Watt -2%
Acemagic F2A
183.7 Points per Watt -13%
Geekom XT12 Pro
182.7 (48.6min, 48.7P1 - 81.3max) Points per Watt -13%

Energieaufnahme mit externem Monitor

0102030405060708090100110Tooltip
Geekom GT13 Pro i9-13900H, Iris Xe G7 96EUs; Idle 1min (external Monitor): Ø17.4 (12.6-22.4)
Aoostar GEM12 R7 8845HS, Radeon 780M; Idle 1min (external Monitor): Ø10 (9.28-14.3)
Minisforum AtomMan X7 Ti Ultra 9 185H, Arc 8-Core; Idle 1min (external Monitor): Ø12.2 (10.9-14.1)
Acemagic F2A Ultra 7 155H, Arc 8-Core; Idle 1min (external Monitor): Ø10.4 (9.08-14.4)
Aoostar GEM12 R7 8845HS, Radeon 780M; 1920x1080 The Witcher 3 ultra (external Monitor): Ø79.6 (76-85.2)
Minisforum AtomMan X7 Ti Ultra 9 185H, Arc 8-Core; 1920x1080 The Witcher 3 ultra (external Monitor): Ø43.8 (42.6-45.7)
Acemagic F2A Ultra 7 155H, Arc 8-Core; 1920x1080 The Witcher 3 ultra (external Monitor): Ø48.4 (45.6-52.4)
Geekom GT13 Pro i9-13900H, Iris Xe G7 96EUs; 1280x720 Prime95 28.10 and Furmark 1.25: Ø60.2 (57-86.6)
Aoostar GEM12 R7 8845HS, Radeon 780M; 1280x720 Prime95 28.10 and Furmark 1.25: Ø84.4 (83.6-85.1)
Minisforum AtomMan X7 Ti Ultra 9 185H, Arc 8-Core; 1280x720 Prime95 28.10 and Furmark 1.25: Ø91.8 (87.6-95.4)
Acemagic F2A Ultra 7 155H, Arc 8-Core; 1280x720 Prime95 28.10 and Furmark 1.25: Ø92.2 (78.7-114)
Geekom GT13 Pro i9-13900H, Iris Xe G7 96EUs; Cyberpunk 2077 FHD ultra no FSR - external Monitor: Ø55.9 (54.2-59.2)
Aoostar GEM12 R7 8845HS, Radeon 780M; Cyberpunk 2077 FHD ultra no FSR - external Monitor: Ø79.9 (75.5-83.5)

Energieaufnahme mit externem Monitor

0102030405060708090100110Tooltip
Geekom GT13 Pro i9-13900H, Iris Xe G7 96EUs; Prime95 V2810 Stress (external Monitor): Ø59.5 (53.5-84.7)
Aoostar GEM12 R7 8845HS, Radeon 780M; Prime95 V2810 Stress (external Monitor): Ø83.6 (80.7-95.3)
Minisforum AtomMan X7 Ti Ultra 9 185H, Arc 8-Core; Prime95 V2810 Stress (external Monitor): Ø98.1 (94.2-100.4)
Acemagic F2A Ultra 7 155H, Arc 8-Core; Prime95 V2810 Stress (external Monitor): Ø99.6 (92-110.4)
Geekom GT13 Pro i9-13900H, Iris Xe G7 96EUs; Cinebench R15 Multi (external Monitor): Ø91.2 (88.5-93.4)
Aoostar GEM12 R7 8845HS, Radeon 780M; Cinebench R15 Multi (external Monitor): Ø82.1 (74.2-89.2)
Minisforum AtomMan X7 Ti Ultra 9 185H, Arc 8-Core; Cinebench R15 Multi (external Monitor): Ø88 (87.7-88.3)
Acemagic F2A Ultra 7 155H, Arc 8-Core; Cinebench R15 Multi (external Monitor): Ø103 (99.2-107)
Geekom GT13 Pro i9-13900H, Iris Xe G7 96EUs; Cinebench R23 Single (external Monitor): Ø31.6 (29-59.5)
Aoostar GEM12 R7 8845HS, Radeon 780M; Cinebench R23 Single (external Monitor): Ø34 (31.1-57.1)
Minisforum AtomMan X7 Ti Ultra 9 185H, Arc 8-Core; Cinebench R23 Single (external Monitor): Ø33.3 (28.9-63)
Acemagic F2A Ultra 7 155H, Arc 8-Core; Cinebench R23 Single (external Monitor): Ø32.7 (19.4-55.3)
Geekom GT13 Pro i9-13900H, Iris Xe G7 96EUs; Cinebench R23 Multi (external Monitor): Ø62.1 (50.4-89.7)
Aoostar GEM12 R7 8845HS, Radeon 780M; Cinebench R23 Multi (external Monitor): Ø75.3 (72.3-87.5)
Minisforum AtomMan X7 Ti Ultra 9 185H, Arc 8-Core; Cinebench R23 Multi (external Monitor): Ø87.7 (87.3-88.3)
Acemagic F2A Ultra 7 155H, Arc 8-Core; Cinebench R23 Multi (external Monitor): Ø100.7 (97.2-108.6)
Geekom GT13 Pro i9-13900H, Iris Xe G7 96EUs; 1280x720 FurMark 1.19 GPU Stress Test (external Monitor): Ø54.6 (51.3-69.7)
Aoostar GEM12 R7 8845HS, Radeon 780M; 1280x720 FurMark 1.19 GPU Stress Test (external Monitor): Ø83.1 (79.2-88.5)
Minisforum AtomMan X7 Ti Ultra 9 185H, Arc 8-Core; 1280x720 FurMark 1.19 GPU Stress Test (external Monitor): Ø50.3 (47.7-65.3)
Acemagic F2A Ultra 7 155H, Arc 8-Core; 1280x720 FurMark 1.19 GPU Stress Test (external Monitor): Ø49.7 (47.3-60.6)

Pro

+ extrem kompaktes und stabiles 0,5L Gehäuse
+ hochwertige Materialauswahl
+ schnelles WLAN
+ 2x USB4
+ maximal vier Bildschirme gleichzeitig nutzbar
+ vergleichsweise geringer Energiebedarf
+ großzügige SSD mit 2 TB Speicherplatz
+ SD-Kartenleser mit UHS-Support
+ 36 Monate Garantie

Contra

- Kühleinheit arbeitet schnell am Limit
- deutlich hörbar unter Last
- geringe Turbo-Nutzung des Prozessors
- vergleichsweise teuer

Fazit - tolle Optik mit durchschnittlicher Leistung zum Premiumpreis

Geekom GT13 Pro im Test - zur Verfügung gestellt von Geekom

Als Geekom GT13 Pro vermarktet der Hersteller einen schicken und sehr kompakten PC. Auf Basis des Intel Core i9-13900H gibt es ein leistungsstarkes SoC, welches allerdings nicht auf der aktuellen Meteor-Lake-Architektur basiert. Grundsätzlich liefert der Prozessor eine angemessene Leistung, wenn nicht unbedingt Dauerlasten erzeugt werden. Aufgrund der kleinen Bauform kann der Intel Core i9-13900H nur mit einer sehr geringen Leistungsaufnahme betrieben werden.

Der Geekom GT13 Pro ist ein schicker, leistungsfähiger Mini-PC und überzeugt mit seiner tollen Ausstattung. Die Preisgestaltung passt leider nicht so ganz zur Leistung des Geekom GT13 Pro.

Optisch kann der Geekom GT13 Pro mit einem schicken Design überzeugen. Komplett neu ist das Aussehen nicht, denn schon der Geekom A7 und der Geekom A8 basieren auf dem gleichen Gehäuse. Farblich geht Geekom beim GT13 Pro einen anderen Weg und hebt sich damit von den AMD Pendants ab. Die Anschlussausstattung gehört zu den Stärken des Geekom GT13 Pro und fällt sogar etwas besser aus als bei den eben genannten Kontrahenten aus dem eigenen Hause. Zwei USB4-Anschlüsse sind gut und können in der Praxis den Unterschied machen, wenn viele externe Geräte angeschlossen werden sollten. Den Test mit einer externen Grafikkarte hat der Geekom GT13 Pro perfekt gemeistert, wenngleich die Gegenspieler hier ebenfalls nicht patzen. Um den Anschluss gegenüber einigen Gegnern nicht zu verlieren, sollte Geekom die Möglichkeit, eine OCuLink-Schnittstelle anzubieten, nicht aus den Augen verlieren. Solange Thunderbolt 5 nicht verfügbar ist, ist die OCuLink-Schnittstelle momentan die bessere Option, wenn es darum geht, externe Grafikkarten zu betreiben.

Das kompakte Design ist schick, und auch die Materialauswahl ist hochwertig. Dennoch muss sich Geekom fragen, ob das Konzept das richtige ist, wenn es darum geht, sehr leistungsstarke Komponenten auf engstem Raum unterzubringen. Das Gehäuse bietet einen begrenzten Airflow, weshalb der Prozessor nur schwer zu kühlen ist. Das führt letzten Endes dazu, dass der Geekom GT13 Pro unter Last deutlich hörbar ist. Minisforum und Aoostar zeigen mit ihren Geräten, dass selbst leistungsstarke Komponenten bedeutend leiser gekühlt werden können.

Schlussendlich müssen wir uns auch dem Preis noch einmal widmen: Zum Testzeitpunkt kostet der Geekom GT13 Pro in unserer Konfiguration 930 Euro. Damit ist der GT13 Pro wahrlich kein Schnäppchen und wird es vermutlich schwer haben, sich gegen die teilweise deutlich preiswerteren Kontrahenten durchzusetzen.

Hinweis: Wir haben unser Rating-System kürzlich aktualisiert und die Ergebnisse von Version 8 sind nicht mit den Ergebnissen von Version 7 vergleichbar. Weitere Informationen dazu sind hier verfügbar.

Preise und Verfügbarkeit

Der Geekom GT13 Pro kann in unserer Testausstattung bei Geekom oder Amazon geordert werden. Preislich werden hier 930 Euro fällig. Fünf Prozent Rabatt gibt es aktuell bei Verwendung der folgenden Codes: Geekom-Shop: "NBCGT13", Amazon: "NBCGT130612".

Geekom GT13 Pro - 21.06.2024 v8
Sebastian Bade

Gehäuse
87 / 98 → 89%
Konnektivität
71 / 81 → 88%
Gewicht
84%
Leistung Spiele
27 / 80 → 34%
Leistung Anwendungen
80 / 92 → 87%
Workstation
24%
AI Performance
80%
Temperatur
81%
Lautstärke
75%
Durchschnitt
53%
72%
Mini PC - gewichteter Durchschnitt
Weitere Informationen über unsere Bewertung finden Sie hier.
CO2 Emissions
No Data
Materials
0%
Packaging
50%
Power Use
62.7%
Repairability
50%
Software Updates
39%
Recycle Logo Total Sustainability Score: 33.6%
Alle 4 Beträge lesen / Antworten
static version load dynamic
Die Kommentare zum Artikel werden geladen
Diesen Artikel kommentieren / Antworten

Transparenz

Die Auswahl der zu testenden Geräte erfolgt innerhalb der Redaktion. Das vorliegende Testmuster wurde dem Autor vom Hersteller unentgeltlich zu Testzwecken überlassen. Eine Einflussnahme auf den Testbericht gab es nicht, der Hersteller erhielt keine Version des Reviews vor der Veröffentlichung. Es bestand keine Verpflichtung zur Publikation. Unsere Reviews erfolgen stets ohne Gegenleistung oder Kompensationen. Als eigenständiges, unabhängiges Unternehmen unterliegt Notebookcheck keiner Diktion von Herstellern, Shops und Verlagen.

So testet Notebookcheck

Pro Jahr werden von Notebookcheck hunderte Laptops und Smartphones unabhängig in von uns standardisierten technischen Verfahren getestet, um eine Vergleichbarkeit aller Testergebnisse zu gewährleisten. Seit rund 20 Jahren entwickeln wir diese Testmethoden kontinuierlich weiter und setzen damit Branchenstandards. In unseren Testlaboren kommt ausschließlich hochwertiges Messequipment in die Hände erfahrener Techniker und Redakteure. Die Tests unterliegen einer mehrstufigen Kontrolle. Unsere komplexe Gesamtbewertung basiert auf hunderten fundierten Messergebnissen und Benchmarks, womit Ihnen Objektivität garantiert ist. Weitere Informationen zu unseren Testmethoden gibt es hier.

Teilen Sie diesen Artikel, um uns zu unterstützen. Jeder Link hilft!
Mail Logo
> Notebook Test, Laptop Test und News > Tests > Notebook Testberichte > Geekom GT13 Pro Mini-PC im Test - schicke NUC-Alternative mit Intel Core i9-13900H, 32 GB DDR4-RAM und 2-TB-SSD
Autor: Sebastian Bade, 16.06.2024 (Update: 26.06.2024)