GMK NucBox K9 Mini-PC im Test: Core Ultra 5 125H mit Arc 7 Grafik

Nachdem wir vor einigen Monaten die GMK NucBox K6 getestet haben, widmen wir uns nun der NucBox K9 mit dem neueren, KI-fähigen Meteor Lake-H-Prozessor. Abgesehen vom Wechsel der CPU von AMD zu Intel bleibt das Gehäuse der beiden Modelle unverändert. Deshalb empfehlen wir, unseren Test der NucBox K6 zu lesen, um mehr über die physischen Eigenschaften des Systems zu erfahren.
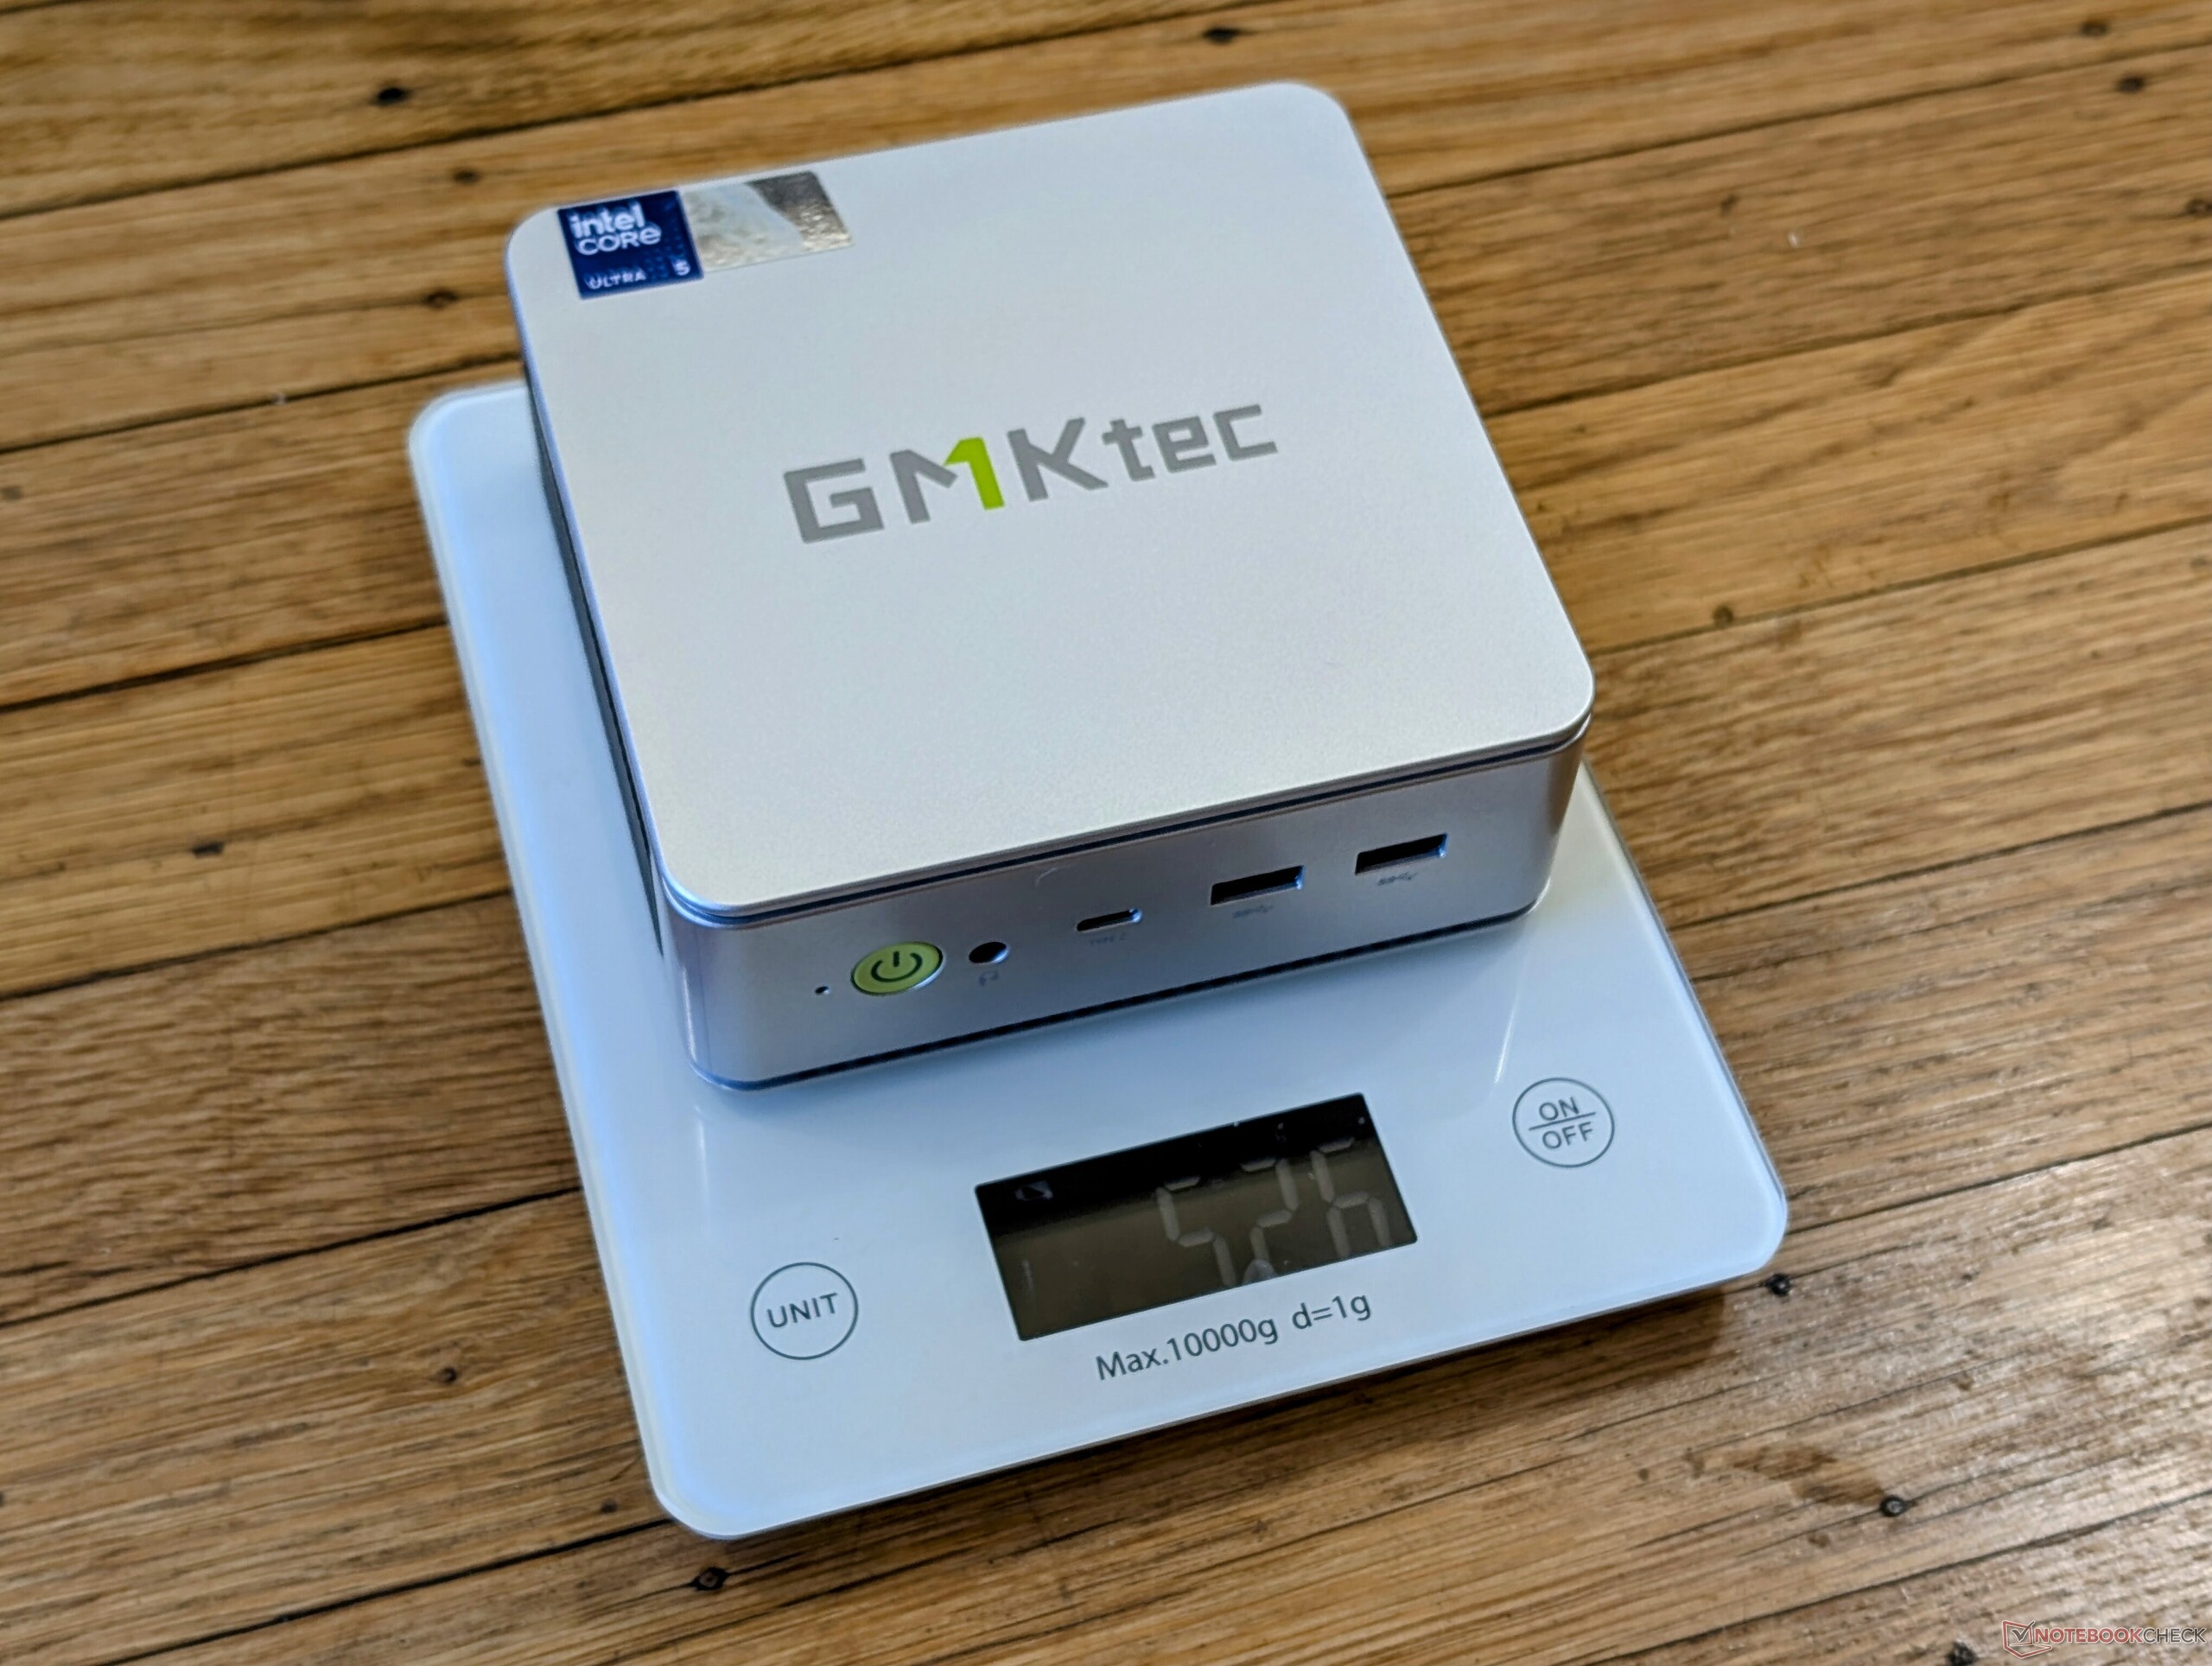
Unser Testgerät ist mit einem Core Ultra 5 125H, einer 1-TB-SSD und 32 GB RAM ausgestattet und kostet etwa 512,5 Euro. Das System kann auch ohne RAM oder SSD konfiguriert werden, jedoch ist die Core Ultra 5 CPU in allen Varianten fest verbaut.
Zu den Alternativen gehören leistungsstarke Mini-PCs wie der Beelink SER8, Bosgame M1 oder Geekom AX8 Pro.
Weitere GMKtec Bewertungen:
Mögliche Konkurrenten im Vergleich
Bew. | Version | Datum | Modell | Gewicht | Dicke | Größe | Auflösung | Preis ab |
|---|---|---|---|---|---|---|---|---|
| 67.3 % | v8 | 09 / 2024 | GMK NucBox K9 Ultra 5 125H, Arc 7-Core | 528 g | 47 mm | x | ||
| 83.6 % v7 (old) | v7 (old) | 04 / 2024 | GMK NucBox K6 R7 7840HS, Radeon 780M | 514 g | 47 mm | x | ||
| 63.6 % | v8 | 07 / 2024 | GMK NucBox M6 R5 6600H, Radeon 660M | 526 g | 48 mm | x | ||
| 74.9 % | v8 | 07 / 2024 | Beelink SER8 R7 8845HS, Radeon 780M | 776 g | 44.7 mm | x | ||
v (old) | Beelink SEi12 Core i5-1235U i5-1235U, Iris Xe G7 80EUs | 465 g | 42 mm | x | ||||
| 84.5 % v7 (old) | v7 (old) | 05 / 2024 | BOSGAME M1 R7 7840HS, Radeon 780M | 766 g | 51 mm | x |
Hinweis: Wir haben unser Rating-System kürzlich aktualisiert und die Ergebnisse von Version 8 sind nicht mit den Ergebnissen von Version 7 vergleichbar. Weitere Informationen dazu sind hier verfügbar.
Gehäuse — Ein Farbwechsel
Das Kunststoff- und Metallgehäuse ist identisch mit dem der AMD-betriebenen NucBox K6, jedoch in einem matten Grau-/Silberton gehalten.
Ausstattung — Schnellere USB-Anschlüsse
Während sich die Anschlussoptionen und die Positionierung gegenüber der NucBox K6 nicht geändert haben, wurden die USB-Anschlüsse aufgerüstet. Alle USB-A-Anschlüsse unterstützen nun USB4 statt der vorherigen 2.0- oder 3.2-Standards. Außerdem unterstützt der USB-C-Anschluss jetzt offiziell Thunderbolt 4.
USB-C-Netzteile von Drittanbietern können das System anstelle des mitgelieferten Netzteils mit Strom versorgen, sofern sie ausreichend Leistung liefern. Allerdings sind Leistung und Kompatibilität nicht bei allen USB-C-Netzteil garantiert.
Kommunikation
Anstelle des MediaTek RZ616 wird standardmäßig ein Intel AX201-Modul für Wi-Fi 6 und Bluetooth 5.2 verwendet. Wi-Fi 6E und Wi-Fi 7 werden nicht unterstützt, um die Kosten niedrig zu halten.
| Networking | |
| iperf3 transmit AXE11000 | |
| GMK NucBox M6 | |
| Beelink SEi12 Core i5-1235U | |
| BOSGAME M1 | |
| GMK NucBox K9 | |
| Beelink SER8 | |
| GMK NucBox K6 | |
| iperf3 receive AXE11000 | |
| BOSGAME M1 | |
| GMK NucBox M6 | |
| Beelink SEi12 Core i5-1235U | |
| GMK NucBox K6 | |
| Beelink SER8 | |
| GMK NucBox K9 | |
| iperf3 transmit AXE11000 6GHz | |
| BOSGAME M1 | |
| GMK NucBox K6 | |
| GMK NucBox M6 | |
| iperf3 receive AXE11000 6GHz | |
| BOSGAME M1 | |
| GMK NucBox K6 | |
| GMK NucBox M6 | |
Wartung
Die aufrüstbaren Komponenten sind identisch mit denen der NucBox K6.
Nachhaltigkeit
Der Hersteller wirbt mit einem „nachhaltig hergestellten“ System, ohne jedoch näher darauf einzugehen, was genau damit gemeint ist. Die Verpackung besteht größtenteils aus Pappe, enthält jedoch auch einige Plastikelemente.
Zubehör und Garantie
Im Lieferumfang befinden sich neben den üblichen Unterlagen und dem Netzteil auch eine VESA-Halterung sowie ein HDMI-Kabel. Die Garantie erstreckt sich über nur 12 Monate.
Performance — Standard Meteor Lake
Testbedingungen
Wir haben Windows auf den Performance-Modus eingestellt, bevor wir die folgenden Benchmarks durchgeführt haben.
Prozessor
Die CPU-Leistung liegt genau dort, wo wir sie im Vergleich zu anderen PCs mit demselben Core Ultra 5 125H-Prozessor in unserer Datenbank erwarten würden. Die Meteor Lake-CPU kann es mit der letzten Generation des Core i9-13900H aufnehmen, was auf dem Papier beeindruckend klingt. Allerdings sollte man beachten, dass die AMD-betriebene NucBox K6 mit dem älteren Ryzen 7 7840HS sogar schneller ist als beide Intel-Lösungen. Es ist daher verwunderlich, dass keine Core Ultra 7-Option angeboten wird, zumal die NucBox K9 das neuere Modell ist.
Obwohl die integrierte KI enthalten ist, ist sie nicht mit Co-Pilot+ kompatibel.
Cinebench R15 Multi Dauertest
Cinebench R23: Multi Core | Single Core
Cinebench R20: CPU (Multi Core) | CPU (Single Core)
Cinebench R15: CPU Multi 64Bit | CPU Single 64Bit
Blender: v2.79 BMW27 CPU
7-Zip 18.03: 7z b 4 | 7z b 4 -mmt1
Geekbench 6.5: Multi-Core | Single-Core
Geekbench 5.5: Multi-Core | Single-Core
HWBOT x265 Benchmark v2.2: 4k Preset
LibreOffice : 20 Documents To PDF
R Benchmark 2.5: Overall mean
| CPU Performance Rating | |
| HP Z2 Mini G9-996Q4ET | |
| Minisforum G7 PT | |
| Lenovo ThinkStation P3 Tiny-30H0006AGE | |
| Beelink SER8 | |
| GMK NucBox K6 | |
| Asus ROG NUC 14-90AS0051 | |
| Geekom AE7 | |
| Geekom AX8 Pro | |
| Acemagic F2A | |
| HP Elite Mini 800 G9-5M9X6EA | |
| Geekom XT13 Pro | |
| GMK NucBox K9 -1! | |
| HP Pro Mini 400 G9-937U0EA | |
| Asus NUC 14 Pro | |
| Durchschnittliche Intel Core Ultra 5 125H | |
| GMK NucBox M6 | |
| Beelink SEi12 Core i5-1235U -2! | |
| Newsmay AC8F-POE | |
| Cinebench R23 / Multi Core | |
| Lenovo ThinkStation P3 Tiny-30H0006AGE | |
| HP Z2 Mini G9-996Q4ET | |
| Minisforum G7 PT | |
| Asus ROG NUC 14-90AS0051 | |
| Acemagic F2A | |
| Beelink SER8 | |
| Geekom AE7 | |
| GMK NucBox K6 | |
| Geekom AX8 Pro | |
| HP Elite Mini 800 G9-5M9X6EA | |
| Asus NUC 14 Pro | |
| GMK NucBox K9 | |
| Durchschnittliche Intel Core Ultra 5 125H (9194 - 14564, n=7) | |
| Geekom XT13 Pro | |
| HP Pro Mini 400 G9-937U0EA | |
| GMK NucBox M6 | |
| Beelink SEi12 Core i5-1235U | |
| Newsmay AC8F-POE | |
| Cinebench R23 / Single Core | |
| Lenovo ThinkStation P3 Tiny-30H0006AGE | |
| HP Z2 Mini G9-996Q4ET | |
| Minisforum G7 PT | |
| HP Elite Mini 800 G9-5M9X6EA | |
| HP Pro Mini 400 G9-937U0EA | |
| Asus ROG NUC 14-90AS0051 | |
| Geekom AX8 Pro | |
| Geekom AE7 | |
| Beelink SER8 | |
| Acemagic F2A | |
| GMK NucBox K6 | |
| GMK NucBox K9 | |
| Asus NUC 14 Pro | |
| Geekom XT13 Pro | |
| Durchschnittliche Intel Core Ultra 5 125H (1549 - 1735, n=7) | |
| Beelink SEi12 Core i5-1235U | |
| GMK NucBox M6 | |
| Newsmay AC8F-POE | |
| Cinebench R20 / CPU (Multi Core) | |
| Minisforum G7 PT | |
| HP Z2 Mini G9-996Q4ET | |
| Lenovo ThinkStation P3 Tiny-30H0006AGE | |
| Asus ROG NUC 14-90AS0051 | |
| Acemagic F2A | |
| Beelink SER8 | |
| Geekom AE7 | |
| GMK NucBox K6 | |
| Geekom AX8 Pro | |
| HP Elite Mini 800 G9-5M9X6EA | |
| Asus NUC 14 Pro | |
| GMK NucBox K9 | |
| Geekom XT13 Pro | |
| Durchschnittliche Intel Core Ultra 5 125H (3673 - 5618, n=7) | |
| HP Pro Mini 400 G9-937U0EA | |
| GMK NucBox M6 | |
| Beelink SEi12 Core i5-1235U | |
| Newsmay AC8F-POE | |
| Cinebench R20 / CPU (Single Core) | |
| Lenovo ThinkStation P3 Tiny-30H0006AGE | |
| HP Z2 Mini G9-996Q4ET | |
| Minisforum G7 PT | |
| HP Elite Mini 800 G9-5M9X6EA | |
| HP Pro Mini 400 G9-937U0EA | |
| Geekom AX8 Pro | |
| Geekom AE7 | |
| Asus ROG NUC 14-90AS0051 | |
| Beelink SER8 | |
| GMK NucBox K6 | |
| Acemagic F2A | |
| GMK NucBox K9 | |
| Geekom XT13 Pro | |
| Durchschnittliche Intel Core Ultra 5 125H (622 - 664, n=7) | |
| Asus NUC 14 Pro | |
| Beelink SEi12 Core i5-1235U | |
| GMK NucBox M6 | |
| Newsmay AC8F-POE | |
| Cinebench R15 / CPU Multi 64Bit | |
| Minisforum G7 PT | |
| Lenovo ThinkStation P3 Tiny-30H0006AGE | |
| HP Z2 Mini G9-996Q4ET | |
| Asus ROG NUC 14-90AS0051 | |
| Acemagic F2A | |
| Beelink SER8 | |
| Geekom AE7 | |
| GMK NucBox K6 | |
| Geekom AX8 Pro | |
| Geekom XT13 Pro | |
| HP Elite Mini 800 G9-5M9X6EA | |
| Asus NUC 14 Pro | |
| HP Pro Mini 400 G9-937U0EA | |
| Durchschnittliche Intel Core Ultra 5 125H (1700 - 2245, n=7) | |
| GMK NucBox K9 | |
| GMK NucBox M6 | |
| Beelink SEi12 Core i5-1235U | |
| Newsmay AC8F-POE | |
| Cinebench R15 / CPU Single 64Bit | |
| Lenovo ThinkStation P3 Tiny-30H0006AGE | |
| HP Z2 Mini G9-996Q4ET | |
| Minisforum G7 PT | |
| Geekom AX8 Pro | |
| Beelink SER8 | |
| Geekom AE7 | |
| GMK NucBox K6 | |
| HP Elite Mini 800 G9-5M9X6EA | |
| Asus ROG NUC 14-90AS0051 | |
| Acemagic F2A | |
| HP Pro Mini 400 G9-937U0EA | |
| GMK NucBox K9 | |
| Asus NUC 14 Pro | |
| Geekom XT13 Pro | |
| GMK NucBox M6 | |
| Durchschnittliche Intel Core Ultra 5 125H (235 - 251, n=7) | |
| Beelink SEi12 Core i5-1235U | |
| Newsmay AC8F-POE | |
| Blender / v2.79 BMW27 CPU | |
| Newsmay AC8F-POE | |
| Beelink SEi12 Core i5-1235U | |
| GMK NucBox M6 | |
| HP Pro Mini 400 G9-937U0EA | |
| Durchschnittliche Intel Core Ultra 5 125H (228 - 364, n=7) | |
| Geekom XT13 Pro | |
| GMK NucBox K9 | |
| Asus NUC 14 Pro | |
| HP Elite Mini 800 G9-5M9X6EA | |
| Geekom AX8 Pro | |
| GMK NucBox K6 | |
| Geekom AE7 | |
| Beelink SER8 | |
| Acemagic F2A | |
| Asus ROG NUC 14-90AS0051 | |
| Lenovo ThinkStation P3 Tiny-30H0006AGE | |
| HP Z2 Mini G9-996Q4ET | |
| Minisforum G7 PT | |
| 7-Zip 18.03 / 7z b 4 | |
| Minisforum G7 PT | |
| HP Z2 Mini G9-996Q4ET | |
| Lenovo ThinkStation P3 Tiny-30H0006AGE | |
| Asus ROG NUC 14-90AS0051 | |
| Geekom AE7 | |
| Beelink SER8 | |
| GMK NucBox K6 | |
| Geekom AX8 Pro | |
| Acemagic F2A | |
| Geekom XT13 Pro | |
| HP Elite Mini 800 G9-5M9X6EA | |
| GMK NucBox M6 | |
| HP Pro Mini 400 G9-937U0EA | |
| Beelink SEi12 Core i5-1235U | |
| Newsmay AC8F-POE | |
| Asus NUC 14 Pro | |
| Durchschnittliche Intel Core Ultra 5 125H (0 - 0, n=3) | |
| 7-Zip 18.03 / 7z b 4 -mmt1 | |
| Minisforum G7 PT | |
| Lenovo ThinkStation P3 Tiny-30H0006AGE | |
| HP Z2 Mini G9-996Q4ET | |
| Beelink SER8 | |
| Geekom AX8 Pro | |
| GMK NucBox K6 | |
| Geekom AE7 | |
| HP Elite Mini 800 G9-5M9X6EA | |
| HP Pro Mini 400 G9-937U0EA | |
| Geekom XT13 Pro | |
| GMK NucBox M6 | |
| Acemagic F2A | |
| Asus ROG NUC 14-90AS0051 | |
| Beelink SEi12 Core i5-1235U | |
| Asus NUC 14 Pro | |
| GMK NucBox K9 | |
| Durchschnittliche Intel Core Ultra 5 125H (4663 - 5136, n=7) | |
| Newsmay AC8F-POE | |
| Geekbench 5.5 / Multi-Core | |
| HP Z2 Mini G9-996Q4ET | |
| Minisforum G7 PT | |
| Lenovo ThinkStation P3 Tiny-30H0006AGE | |
| Asus ROG NUC 14-90AS0051 | |
| Acemagic F2A | |
| Geekom AE7 | |
| Beelink SER8 | |
| Geekom AX8 Pro | |
| GMK NucBox K6 | |
| Geekom XT13 Pro | |
| Asus NUC 14 Pro | |
| HP Elite Mini 800 G9-5M9X6EA | |
| Durchschnittliche Intel Core Ultra 5 125H (9069 - 10856, n=7) | |
| GMK NucBox K9 | |
| HP Pro Mini 400 G9-937U0EA | |
| GMK NucBox M6 | |
| Beelink SEi12 Core i5-1235U | |
| Newsmay AC8F-POE | |
| Geekbench 5.5 / Single-Core | |
| Minisforum G7 PT | |
| Lenovo ThinkStation P3 Tiny-30H0006AGE | |
| HP Z2 Mini G9-996Q4ET | |
| Beelink SER8 | |
| Geekom AX8 Pro | |
| GMK NucBox K6 | |
| Geekom AE7 | |
| HP Elite Mini 800 G9-5M9X6EA | |
| Asus ROG NUC 14-90AS0051 | |
| HP Pro Mini 400 G9-937U0EA | |
| Acemagic F2A | |
| Geekom XT13 Pro | |
| Asus NUC 14 Pro | |
| GMK NucBox K9 | |
| Durchschnittliche Intel Core Ultra 5 125H (1593 - 1699, n=7) | |
| Beelink SEi12 Core i5-1235U | |
| GMK NucBox M6 | |
| Newsmay AC8F-POE | |
| HWBOT x265 Benchmark v2.2 / 4k Preset | |
| Minisforum G7 PT | |
| HP Z2 Mini G9-996Q4ET | |
| Lenovo ThinkStation P3 Tiny-30H0006AGE | |
| Asus ROG NUC 14-90AS0051 | |
| Beelink SER8 | |
| Geekom AE7 | |
| Geekom AX8 Pro | |
| GMK NucBox K6 | |
| Acemagic F2A | |
| HP Elite Mini 800 G9-5M9X6EA | |
| Asus NUC 14 Pro | |
| Geekom XT13 Pro | |
| GMK NucBox M6 | |
| GMK NucBox K9 | |
| Durchschnittliche Intel Core Ultra 5 125H (9.7 - 16.7, n=7) | |
| HP Pro Mini 400 G9-937U0EA | |
| Beelink SEi12 Core i5-1235U | |
| Newsmay AC8F-POE | |
| LibreOffice / 20 Documents To PDF | |
| Newsmay AC8F-POE | |
| Asus ROG NUC 14-90AS0051 | |
| Asus NUC 14 Pro | |
| Durchschnittliche Intel Core Ultra 5 125H (42.7 - 70.9, n=7) | |
| Geekom AE7 | |
| GMK NucBox M6 | |
| Geekom AX8 Pro | |
| Minisforum G7 PT | |
| Beelink SEi12 Core i5-1235U | |
| HP Pro Mini 400 G9-937U0EA | |
| Geekom XT13 Pro | |
| Beelink SER8 | |
| HP Elite Mini 800 G9-5M9X6EA | |
| HP Z2 Mini G9-996Q4ET | |
| Acemagic F2A | |
| GMK NucBox K6 | |
| GMK NucBox K9 | |
| Lenovo ThinkStation P3 Tiny-30H0006AGE | |
| R Benchmark 2.5 / Overall mean | |
| Newsmay AC8F-POE | |
| Durchschnittliche Intel Core Ultra 5 125H (0.4898 - 0.565, n=7) | |
| Beelink SEi12 Core i5-1235U | |
| GMK NucBox M6 | |
| Asus NUC 14 Pro | |
| GMK NucBox K9 | |
| Geekom XT13 Pro | |
| Acemagic F2A | |
| Geekom AX8 Pro | |
| Asus ROG NUC 14-90AS0051 | |
| HP Pro Mini 400 G9-937U0EA | |
| HP Elite Mini 800 G9-5M9X6EA | |
| Geekom AE7 | |
| GMK NucBox K6 | |
| Beelink SER8 | |
| Minisforum G7 PT | |
| Lenovo ThinkStation P3 Tiny-30H0006AGE | |
| HP Z2 Mini G9-996Q4ET | |
Cinebench R23: Multi Core | Single Core
Cinebench R20: CPU (Multi Core) | CPU (Single Core)
Cinebench R15: CPU Multi 64Bit | CPU Single 64Bit
Blender: v2.79 BMW27 CPU
7-Zip 18.03: 7z b 4 | 7z b 4 -mmt1
Geekbench 6.5: Multi-Core | Single-Core
Geekbench 5.5: Multi-Core | Single-Core
HWBOT x265 Benchmark v2.2: 4k Preset
LibreOffice : 20 Documents To PDF
R Benchmark 2.5: Overall mean
* ... kleinere Werte sind besser
AIDA64: FP32 Ray-Trace | FPU Julia | CPU SHA3 | CPU Queen | FPU SinJulia | FPU Mandel | CPU AES | CPU ZLib | FP64 Ray-Trace | CPU PhotoWorxx
| Performance Rating | |
| Beelink SER8 | |
| BOSGAME M1 | |
| GMK NucBox K6 | |
| GMK NucBox M6 | |
| GMK NucBox K9 | |
| Durchschnittliche Intel Core Ultra 5 125H | |
| Beelink SEi12 Core i5-1235U | |
| AIDA64 / FP32 Ray-Trace | |
| Beelink SER8 | |
| BOSGAME M1 | |
| GMK NucBox K6 | |
| GMK NucBox M6 | |
| Durchschnittliche Intel Core Ultra 5 125H (8430 - 13639, n=7) | |
| GMK NucBox K9 | |
| Beelink SEi12 Core i5-1235U | |
| AIDA64 / FPU Julia | |
| Beelink SER8 | |
| BOSGAME M1 | |
| GMK NucBox K6 | |
| GMK NucBox M6 | |
| GMK NucBox K9 | |
| Durchschnittliche Intel Core Ultra 5 125H (43652 - 70880, n=7) | |
| Beelink SEi12 Core i5-1235U | |
| AIDA64 / CPU SHA3 | |
| Beelink SER8 | |
| BOSGAME M1 | |
| GMK NucBox K6 | |
| GMK NucBox K9 | |
| Durchschnittliche Intel Core Ultra 5 125H (2047 - 3404, n=7) | |
| GMK NucBox M6 | |
| Beelink SEi12 Core i5-1235U | |
| AIDA64 / CPU Queen | |
| BOSGAME M1 | |
| Beelink SER8 | |
| GMK NucBox K6 | |
| GMK NucBox M6 | |
| GMK NucBox K9 | |
| Durchschnittliche Intel Core Ultra 5 125H (76983 - 79986, n=7) | |
| Beelink SEi12 Core i5-1235U | |
| AIDA64 / FPU SinJulia | |
| Beelink SER8 | |
| BOSGAME M1 | |
| GMK NucBox K6 | |
| GMK NucBox M6 | |
| GMK NucBox K9 | |
| Durchschnittliche Intel Core Ultra 5 125H (6588 - 7851, n=7) | |
| Beelink SEi12 Core i5-1235U | |
| AIDA64 / FPU Mandel | |
| Beelink SER8 | |
| BOSGAME M1 | |
| GMK NucBox K6 | |
| GMK NucBox M6 | |
| Durchschnittliche Intel Core Ultra 5 125H (21210 - 35321, n=7) | |
| GMK NucBox K9 | |
| Beelink SEi12 Core i5-1235U | |
| AIDA64 / CPU AES | |
| Beelink SER8 | |
| BOSGAME M1 | |
| GMK NucBox K6 | |
| GMK NucBox K9 | |
| GMK NucBox M6 | |
| Beelink SEi12 Core i5-1235U | |
| Durchschnittliche Intel Core Ultra 5 125H (45524 - 108402, n=7) | |
| AIDA64 / CPU ZLib | |
| Beelink SER8 | |
| BOSGAME M1 | |
| GMK NucBox K6 | |
| GMK NucBox K9 | |
| Durchschnittliche Intel Core Ultra 5 125H (594 - 994, n=7) | |
| GMK NucBox M6 | |
| Beelink SEi12 Core i5-1235U | |
| AIDA64 / FP64 Ray-Trace | |
| Beelink SER8 | |
| BOSGAME M1 | |
| GMK NucBox K6 | |
| GMK NucBox M6 | |
| Durchschnittliche Intel Core Ultra 5 125H (4345 - 7221, n=7) | |
| GMK NucBox K9 | |
| Beelink SEi12 Core i5-1235U | |
| AIDA64 / CPU PhotoWorxx | |
| GMK NucBox K9 | |
| Durchschnittliche Intel Core Ultra 5 125H (23499 - 49844, n=7) | |
| BOSGAME M1 | |
| GMK NucBox K6 | |
| Beelink SER8 | |
| GMK NucBox M6 | |
| Beelink SEi12 Core i5-1235U | |
Stresstest
Beim Starten des Prime95-Stresstests erhöhte sich die CPU auf 2,3 GHz und 45 W und hielt diese Werte während der gesamten Dauer des Tests. Die Kerntemperatur erreichte ein Plateau von 80 °C, was etwas kühler ist als das, was wir auf der schnelleren, AMD-betriebenen NucBox K6 gemessen haben.
Zur Darstellung des Gaming-Stresses stabilisierte sich die Kerntemperatur bei 72 °C, als Cyberpunk 2077 ausgeführt wurde. Dies ist vergleichbar mit der NucBox K6, obwohl die NucBox K9 Spiele langsamer ausführt, wie unser Abschnitt zur Gaming-Performance weiter unten zeigen wird.

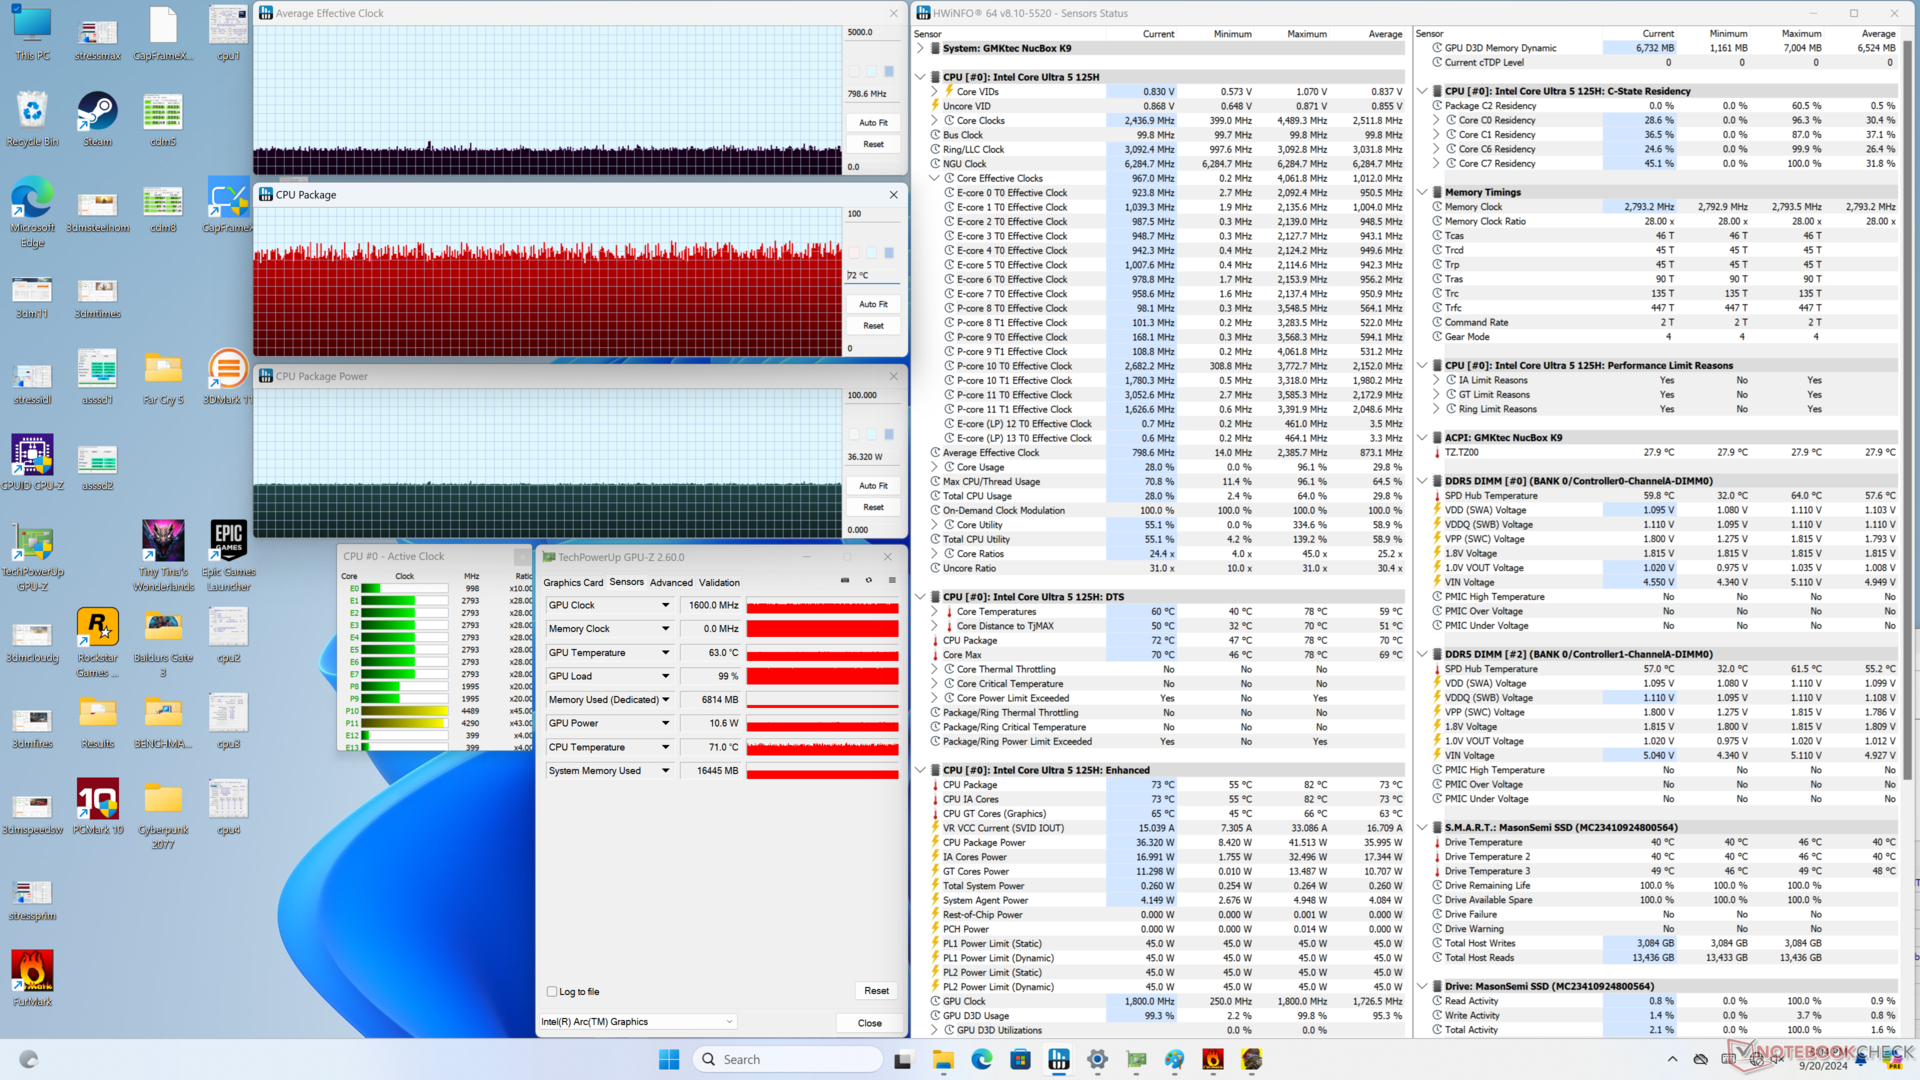
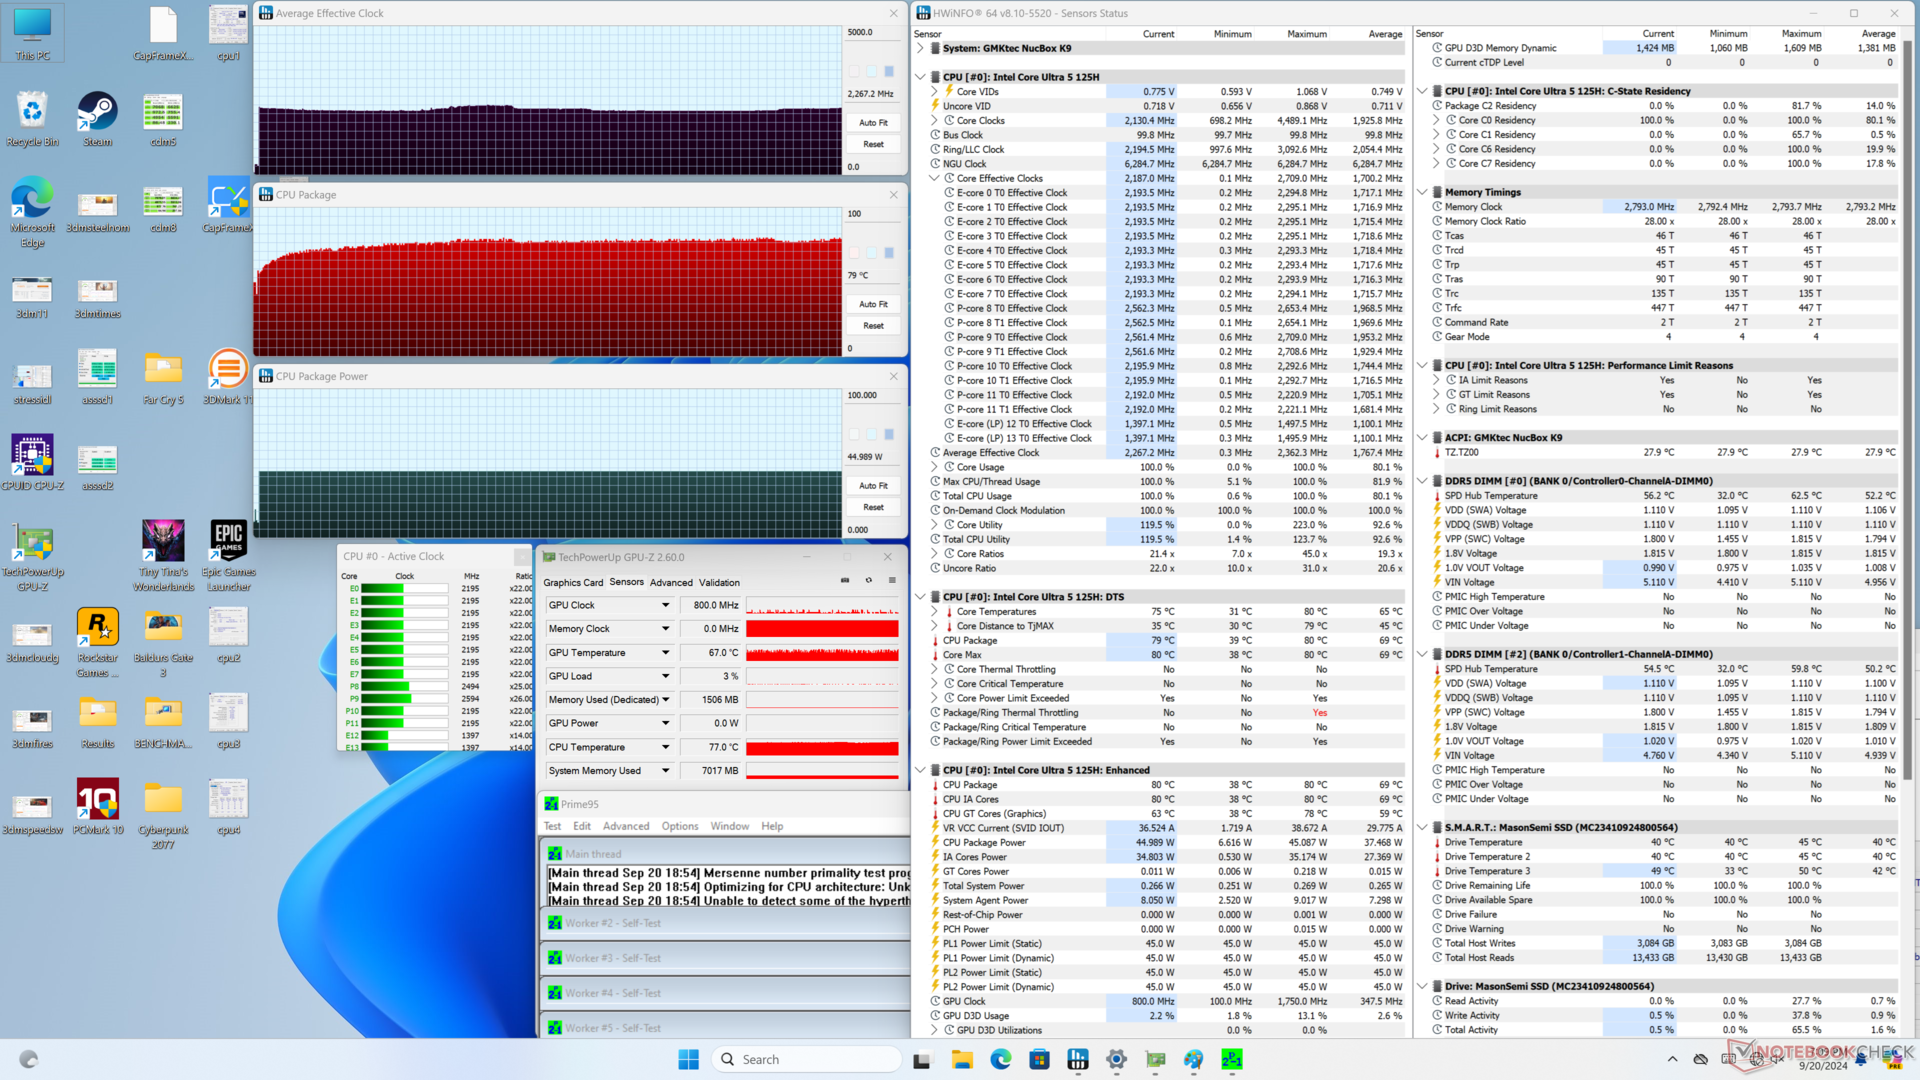
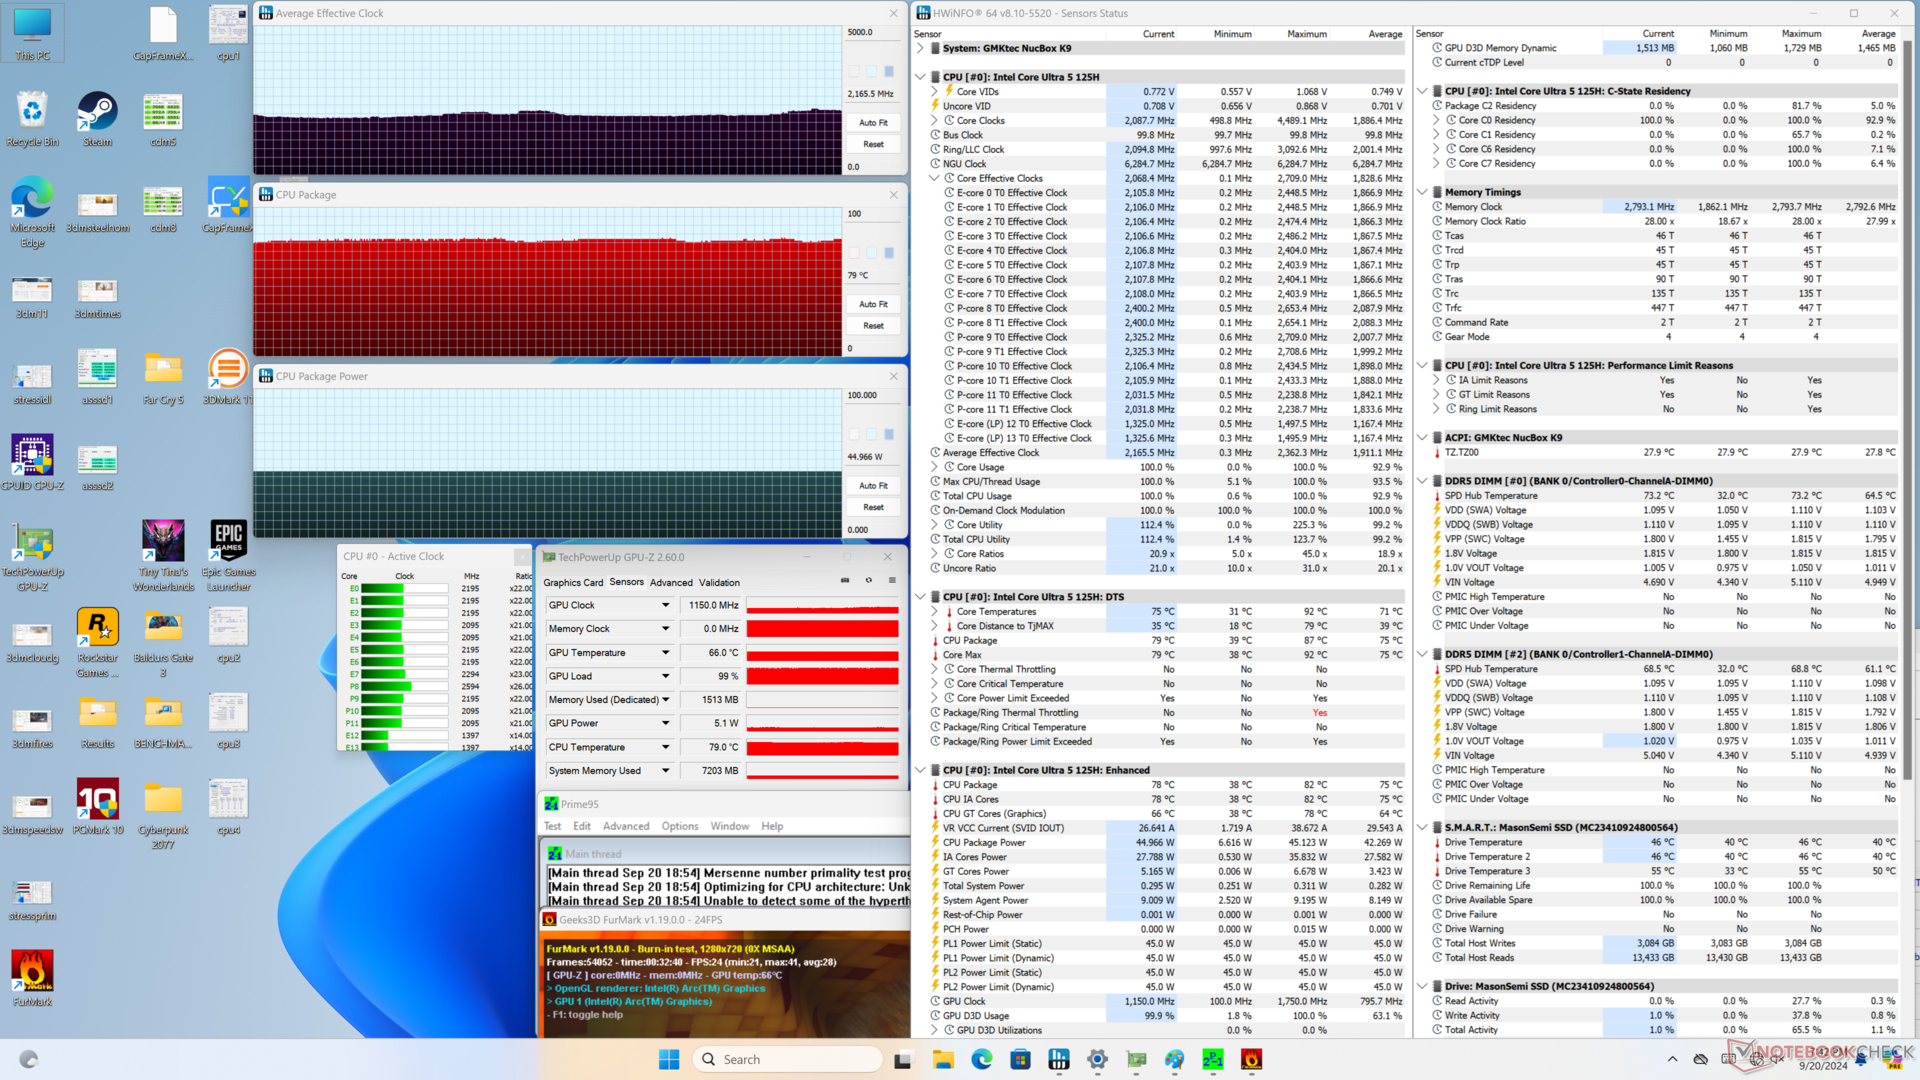
| Durchschnittlicher CPU-Takt (GHz) | GPU-Takt (MHz) | Durchschnittliche CPU-Temperatur (°C) | |
| System im Leerlauf | -- | -- | 40 |
| Prime95 Stresstest | 2.3 | -- | 79 |
| Prime95 + FurMark Stresstest | 2.2 | 1150 | 79 |
| Cyberpunk 2077 Stresstest | 0.9 | 1600 | 72 |
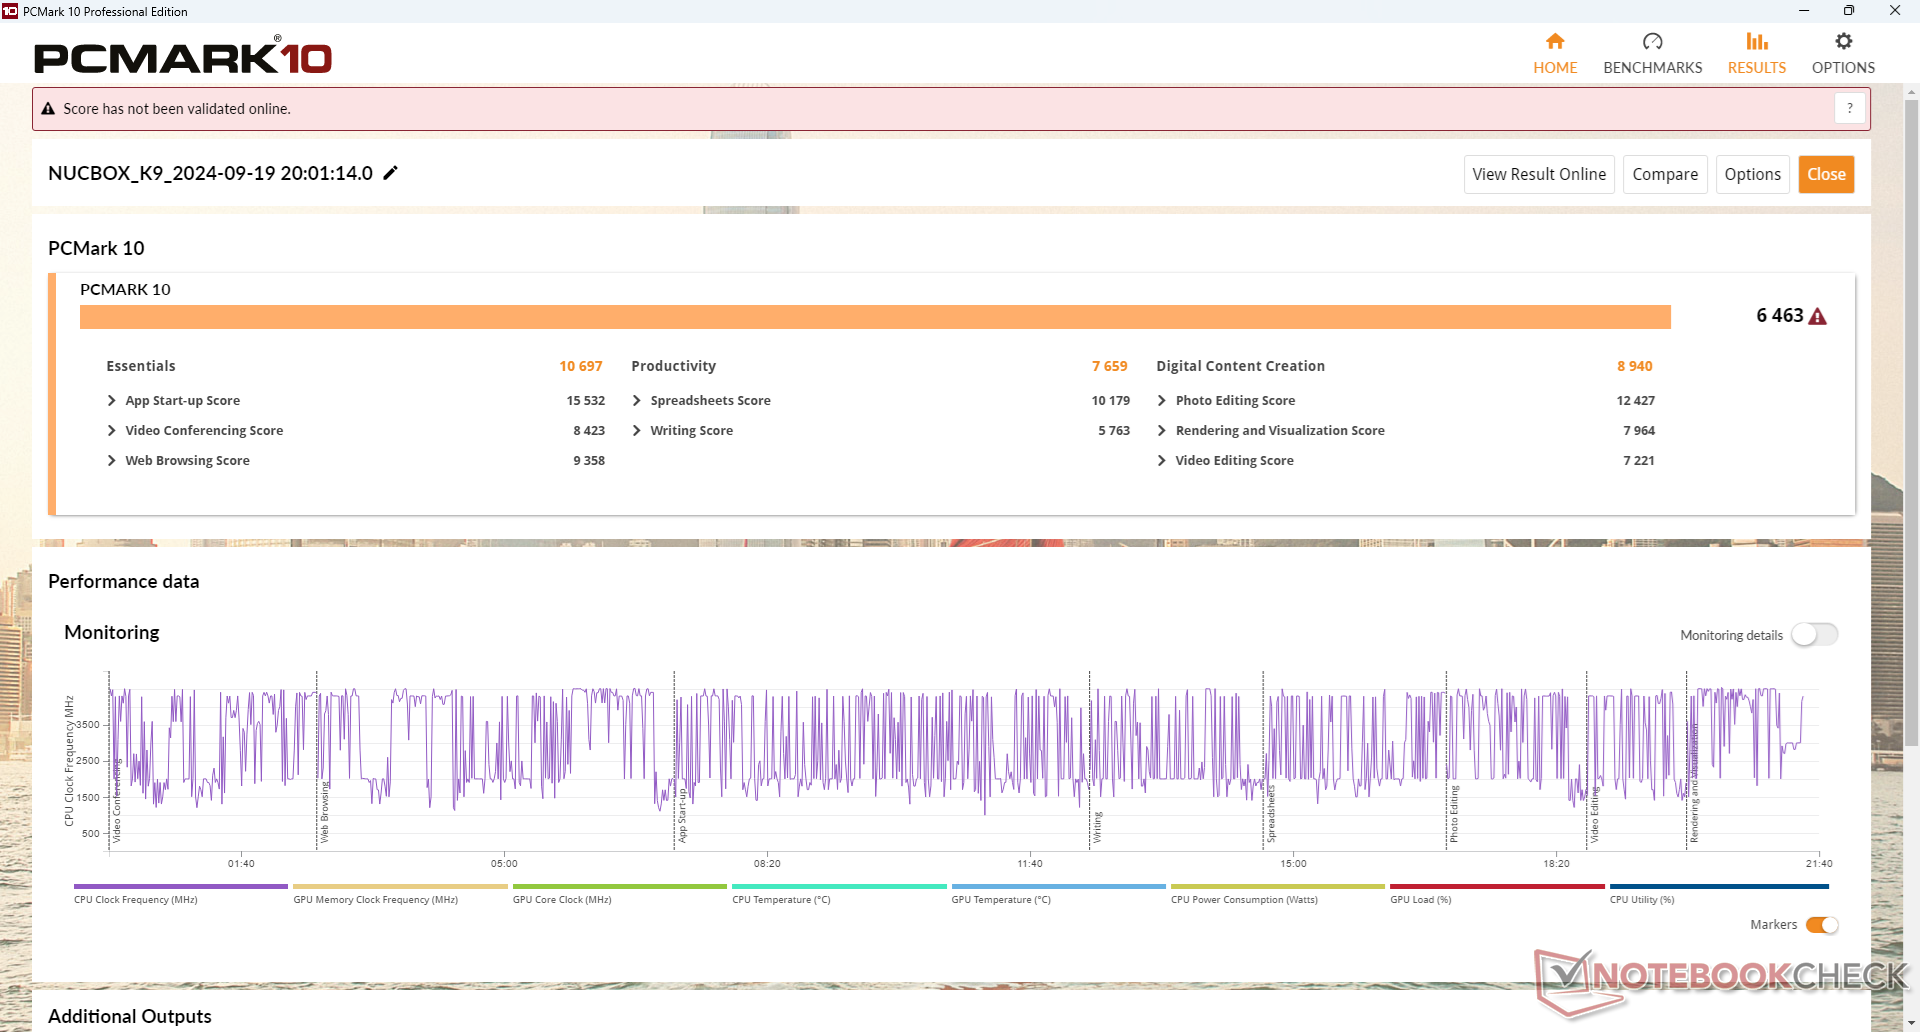
System Performance
CrossMark: Overall | Productivity | Creativity | Responsiveness
WebXPRT 3: Overall
WebXPRT 4: Overall
Mozilla Kraken 1.1: Total
| PCMark 10 / Score | |
| Beelink SER8 | |
| GMK NucBox K6 | |
| BOSGAME M1 | |
| GMK NucBox K9 | |
| Durchschnittliche Intel Core Ultra 5 125H, Intel Arc 7-Core iGPU (6024 - 6463, n=7) | |
| GMK NucBox M6 | |
| Beelink SEi12 Core i5-1235U | |
| PCMark 10 / Essentials | |
| Beelink SER8 | |
| GMK NucBox K6 | |
| BOSGAME M1 | |
| Beelink SEi12 Core i5-1235U | |
| GMK NucBox K9 | |
| GMK NucBox M6 | |
| Durchschnittliche Intel Core Ultra 5 125H, Intel Arc 7-Core iGPU (9427 - 10697, n=7) | |
| PCMark 10 / Productivity | |
| GMK NucBox K6 | |
| Beelink SER8 | |
| BOSGAME M1 | |
| GMK NucBox M6 | |
| Durchschnittliche Intel Core Ultra 5 125H, Intel Arc 7-Core iGPU (7042 - 8000, n=7) | |
| GMK NucBox K9 | |
| Beelink SEi12 Core i5-1235U | |
| PCMark 10 / Digital Content Creation | |
| Beelink SER8 | |
| BOSGAME M1 | |
| GMK NucBox K6 | |
| GMK NucBox K9 | |
| Durchschnittliche Intel Core Ultra 5 125H, Intel Arc 7-Core iGPU (8149 - 9506, n=7) | |
| GMK NucBox M6 | |
| Beelink SEi12 Core i5-1235U | |
| CrossMark / Overall | |
| BOSGAME M1 | |
| Beelink SER8 | |
| GMK NucBox K6 | |
| Beelink SEi12 Core i5-1235U | |
| GMK NucBox K9 | |
| Durchschnittliche Intel Core Ultra 5 125H, Intel Arc 7-Core iGPU (1480 - 1633, n=6) | |
| GMK NucBox M6 | |
| CrossMark / Productivity | |
| BOSGAME M1 | |
| GMK NucBox K6 | |
| Beelink SER8 | |
| Beelink SEi12 Core i5-1235U | |
| GMK NucBox K9 | |
| GMK NucBox M6 | |
| Durchschnittliche Intel Core Ultra 5 125H, Intel Arc 7-Core iGPU (1432 - 1594, n=6) | |
| CrossMark / Creativity | |
| BOSGAME M1 | |
| Beelink SER8 | |
| GMK NucBox K6 | |
| GMK NucBox K9 | |
| Durchschnittliche Intel Core Ultra 5 125H, Intel Arc 7-Core iGPU (1520 - 1765, n=6) | |
| GMK NucBox M6 | |
| Beelink SEi12 Core i5-1235U | |
| CrossMark / Responsiveness | |
| Beelink SEi12 Core i5-1235U | |
| BOSGAME M1 | |
| Beelink SER8 | |
| GMK NucBox K6 | |
| GMK NucBox K9 | |
| GMK NucBox M6 | |
| Durchschnittliche Intel Core Ultra 5 125H, Intel Arc 7-Core iGPU (1171 - 1520, n=6) | |
| WebXPRT 3 / Overall | |
| Beelink SER8 | |
| GMK NucBox K6 | |
| BOSGAME M1 | |
| Beelink SEi12 Core i5-1235U | |
| GMK NucBox K9 | |
| Durchschnittliche Intel Core Ultra 5 125H, Intel Arc 7-Core iGPU (245 - 263, n=7) | |
| GMK NucBox M6 | |
| WebXPRT 4 / Overall | |
| GMK NucBox K6 | |
| Beelink SER8 | |
| BOSGAME M1 | |
| Beelink SEi12 Core i5-1235U | |
| GMK NucBox K9 | |
| Durchschnittliche Intel Core Ultra 5 125H, Intel Arc 7-Core iGPU (222 - 240, n=6) | |
| GMK NucBox M6 | |
| Mozilla Kraken 1.1 / Total | |
| GMK NucBox M6 | |
| Beelink SEi12 Core i5-1235U | |
| Durchschnittliche Intel Core Ultra 5 125H, Intel Arc 7-Core iGPU (560 - 607, n=7) | |
| GMK NucBox K9 | |
| GMK NucBox K6 | |
| BOSGAME M1 | |
| Beelink SER8 | |
* ... kleinere Werte sind besser
| PCMark 10 Score | 6463 Punkte | |
Hilfe | ||
| AIDA64 / Memory Copy | |
| Durchschnittliche Intel Core Ultra 5 125H (37664 - 87473, n=7) | |
| BOSGAME M1 | |
| GMK NucBox K6 | |
| Beelink SER8 | |
| GMK NucBox K9 | |
| GMK NucBox M6 | |
| Beelink SEi12 Core i5-1235U | |
| AIDA64 / Memory Read | |
| GMK NucBox K9 | |
| Durchschnittliche Intel Core Ultra 5 125H (41700 - 76803, n=7) | |
| Beelink SER8 | |
| BOSGAME M1 | |
| GMK NucBox K6 | |
| GMK NucBox M6 | |
| Beelink SEi12 Core i5-1235U | |
| AIDA64 / Memory Write | |
| BOSGAME M1 | |
| GMK NucBox K6 | |
| Beelink SER8 | |
| GMK NucBox K9 | |
| Durchschnittliche Intel Core Ultra 5 125H (35730 - 72443, n=7) | |
| GMK NucBox M6 | |
| Beelink SEi12 Core i5-1235U | |
| AIDA64 / Memory Latency | |
| Durchschnittliche Intel Core Ultra 5 125H (127.3 - 184.8, n=7) | |
| GMK NucBox K9 | |
| Beelink SEi12 Core i5-1235U | |
| BOSGAME M1 | |
| Beelink SER8 | |
| GMK NucBox K6 | |
| GMK NucBox M6 | |
* ... kleinere Werte sind besser
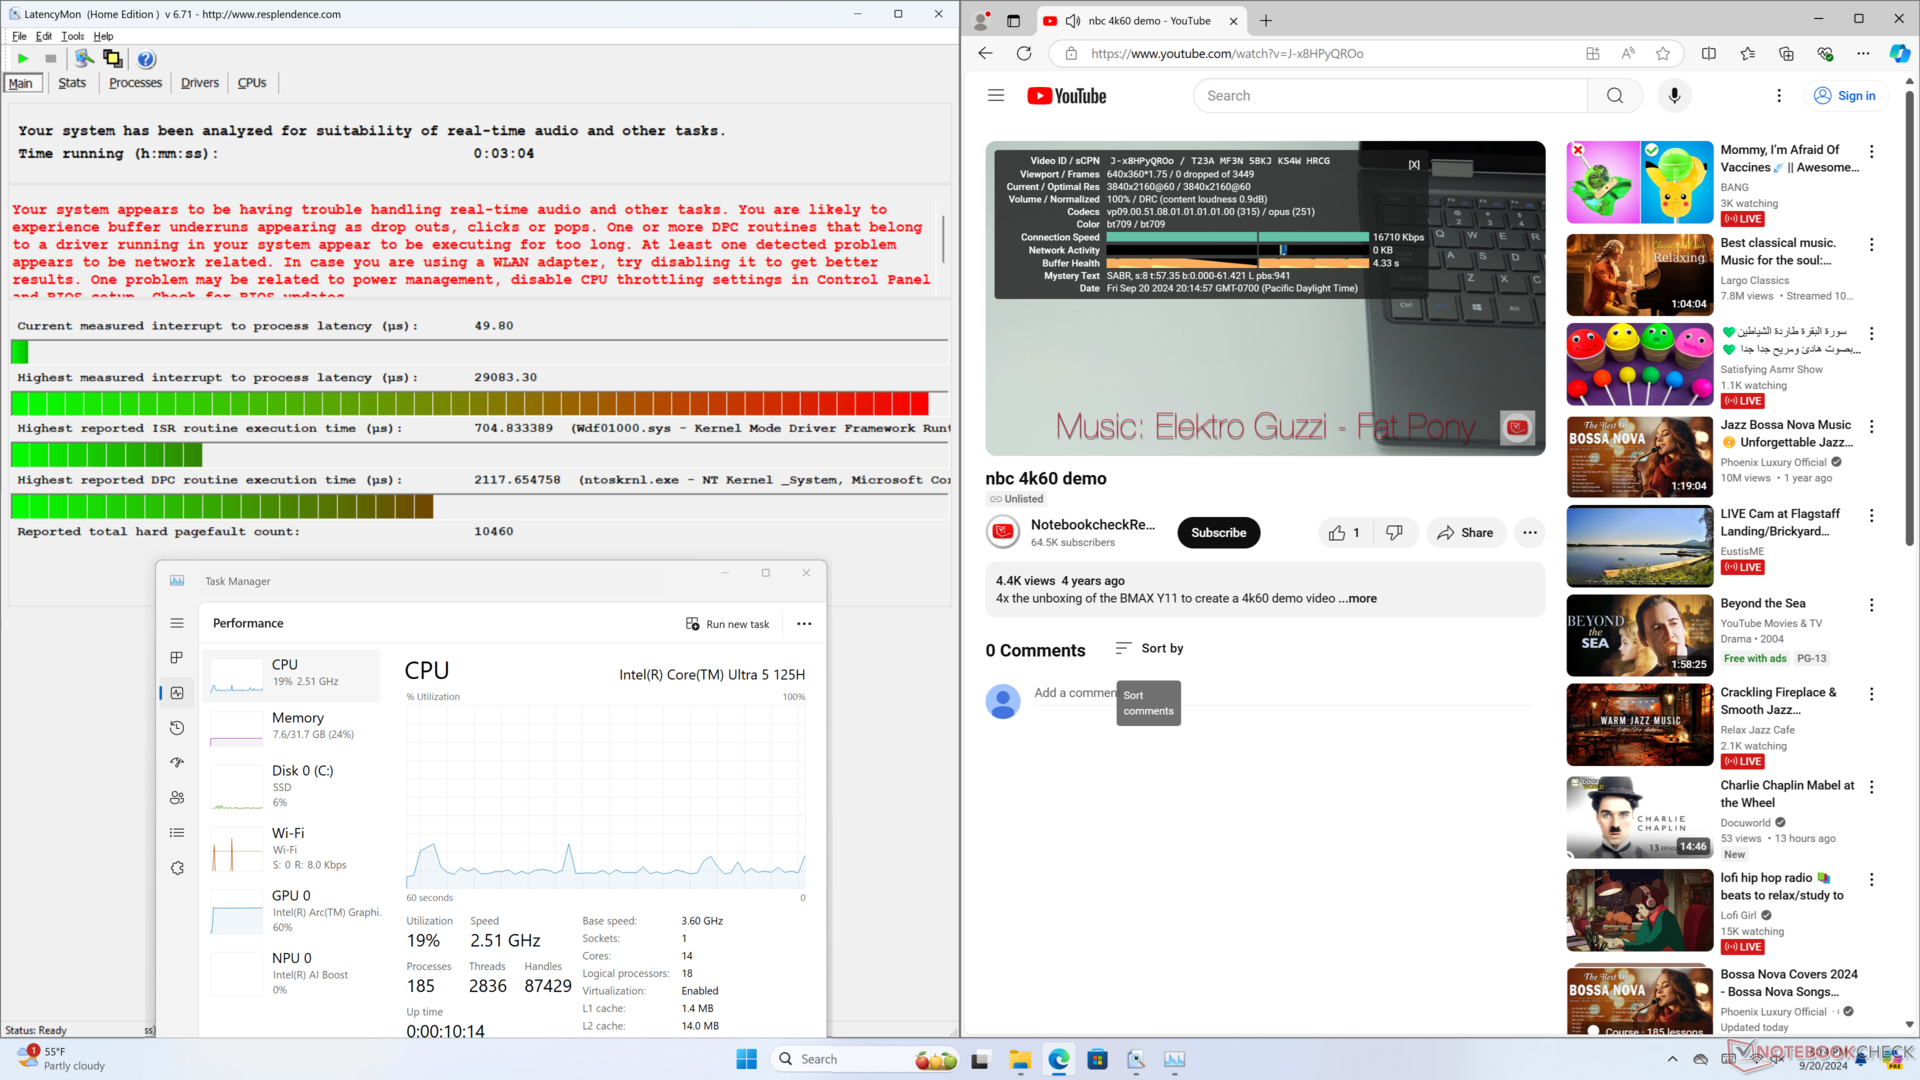
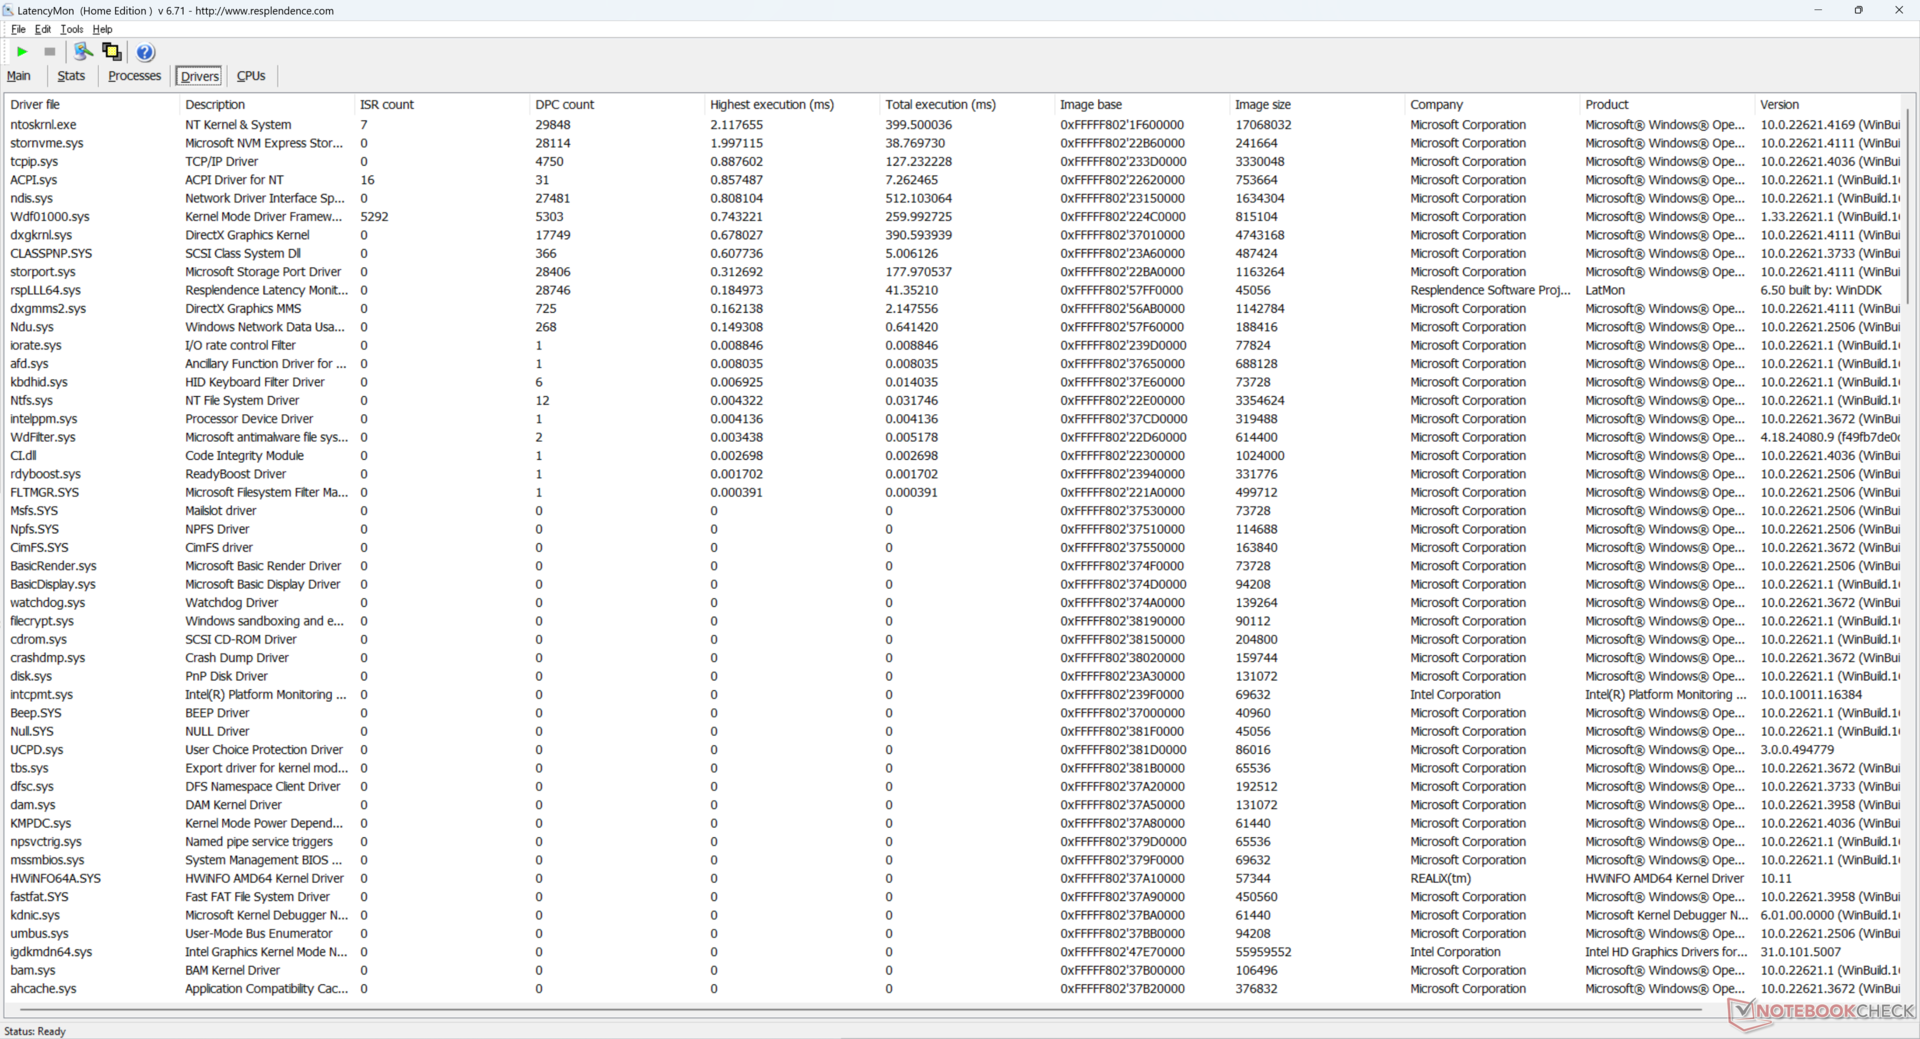
DPC-Latenzen
LatencyMon zeigt DPC-Probleme im Zusammenhang mit ntoskrnl.exe, wenn mehrere Tabs unserer Homepage geöffnet sind. Die 4K-Videowiedergabe bei 60 FPS funktioniert jedoch einwandfrei, ohne dass es zu Frame-Drops kommt.
| DPC Latencies / LatencyMon - interrupt to process latency (max), Web, Youtube, Prime95 | |
| GMK NucBox K9 | |
| GMK NucBox M6 | |
| GMK NucBox K6 | |
| BOSGAME M1 | |
| Beelink SER8 | |
| Beelink SEi12 Core i5-1235U | |
* ... kleinere Werte sind besser
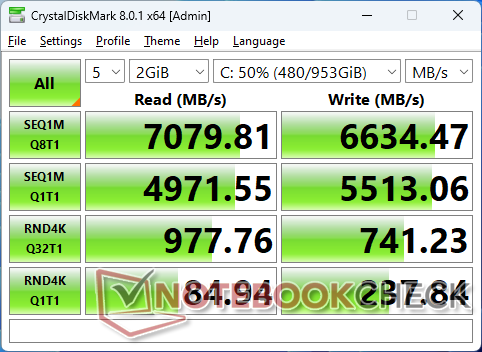
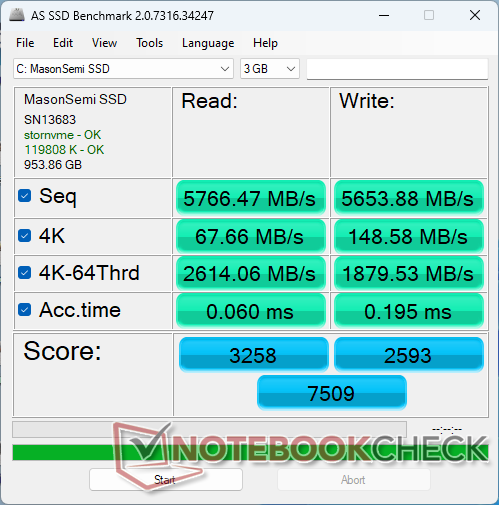
Massenspeicher
GMK verwendet die gleiche 1 TB MasonSemi MC7000 PCIe4 x4 NVMe SSD für seine NucBox K6- und K9-Modelle. Die Leistung ist schnell und trotz des weniger bekannten Markennamens mit der Samsung PM9A1-Serie vergleichbar, die häufig in High-End-PCs eingesetzt wird. Bei unseren Tests konnten wir keine nennenswerte Leistungsdrosselung feststellen, als wir DiskSpd in einer Schleife laufen ließen.

| Drive Performance Rating - Percent | |
| GMK NucBox K6 | |
| GMK NucBox K9 | |
| Beelink SEi12 Core i5-1235U | |
| Beelink SER8 | |
| BOSGAME M1 | |
| GMK NucBox M6 | |
| DiskSpd | |
| seq read | |
| GMK NucBox K9 | |
| GMK NucBox K6 | |
| Beelink SER8 | |
| BOSGAME M1 | |
| Beelink SEi12 Core i5-1235U | |
| GMK NucBox M6 | |
| seq write | |
| GMK NucBox K6 | |
| GMK NucBox K9 | |
| Beelink SER8 | |
| BOSGAME M1 | |
| Beelink SEi12 Core i5-1235U | |
| GMK NucBox M6 | |
| seq q8 t1 read | |
| GMK NucBox K6 | |
| GMK NucBox K9 | |
| Beelink SER8 | |
| BOSGAME M1 | |
| Beelink SEi12 Core i5-1235U | |
| GMK NucBox M6 | |
| seq q8 t1 write | |
| GMK NucBox K6 | |
| GMK NucBox K9 | |
| Beelink SER8 | |
| BOSGAME M1 | |
| Beelink SEi12 Core i5-1235U | |
| GMK NucBox M6 | |
| 4k q1 t1 read | |
| Beelink SER8 | |
| GMK NucBox K9 | |
| Beelink SEi12 Core i5-1235U | |
| GMK NucBox K6 | |
| BOSGAME M1 | |
| GMK NucBox M6 | |
| 4k q1 t1 write | |
| Beelink SEi12 Core i5-1235U | |
| Beelink SER8 | |
| BOSGAME M1 | |
| GMK NucBox K6 | |
| GMK NucBox M6 | |
| GMK NucBox K9 | |
| 4k q32 t16 read | |
| Beelink SER8 | |
| GMK NucBox K6 | |
| GMK NucBox K9 | |
| Beelink SEi12 Core i5-1235U | |
| GMK NucBox M6 | |
| BOSGAME M1 | |
| 4k q32 t16 write | |
| Beelink SER8 | |
| GMK NucBox K6 | |
| GMK NucBox K9 | |
| BOSGAME M1 | |
| Beelink SEi12 Core i5-1235U | |
| GMK NucBox M6 | |
* ... kleinere Werte sind besser
Dauerleistung Lesen: DiskSpd Read Loop, Queue Depth 8
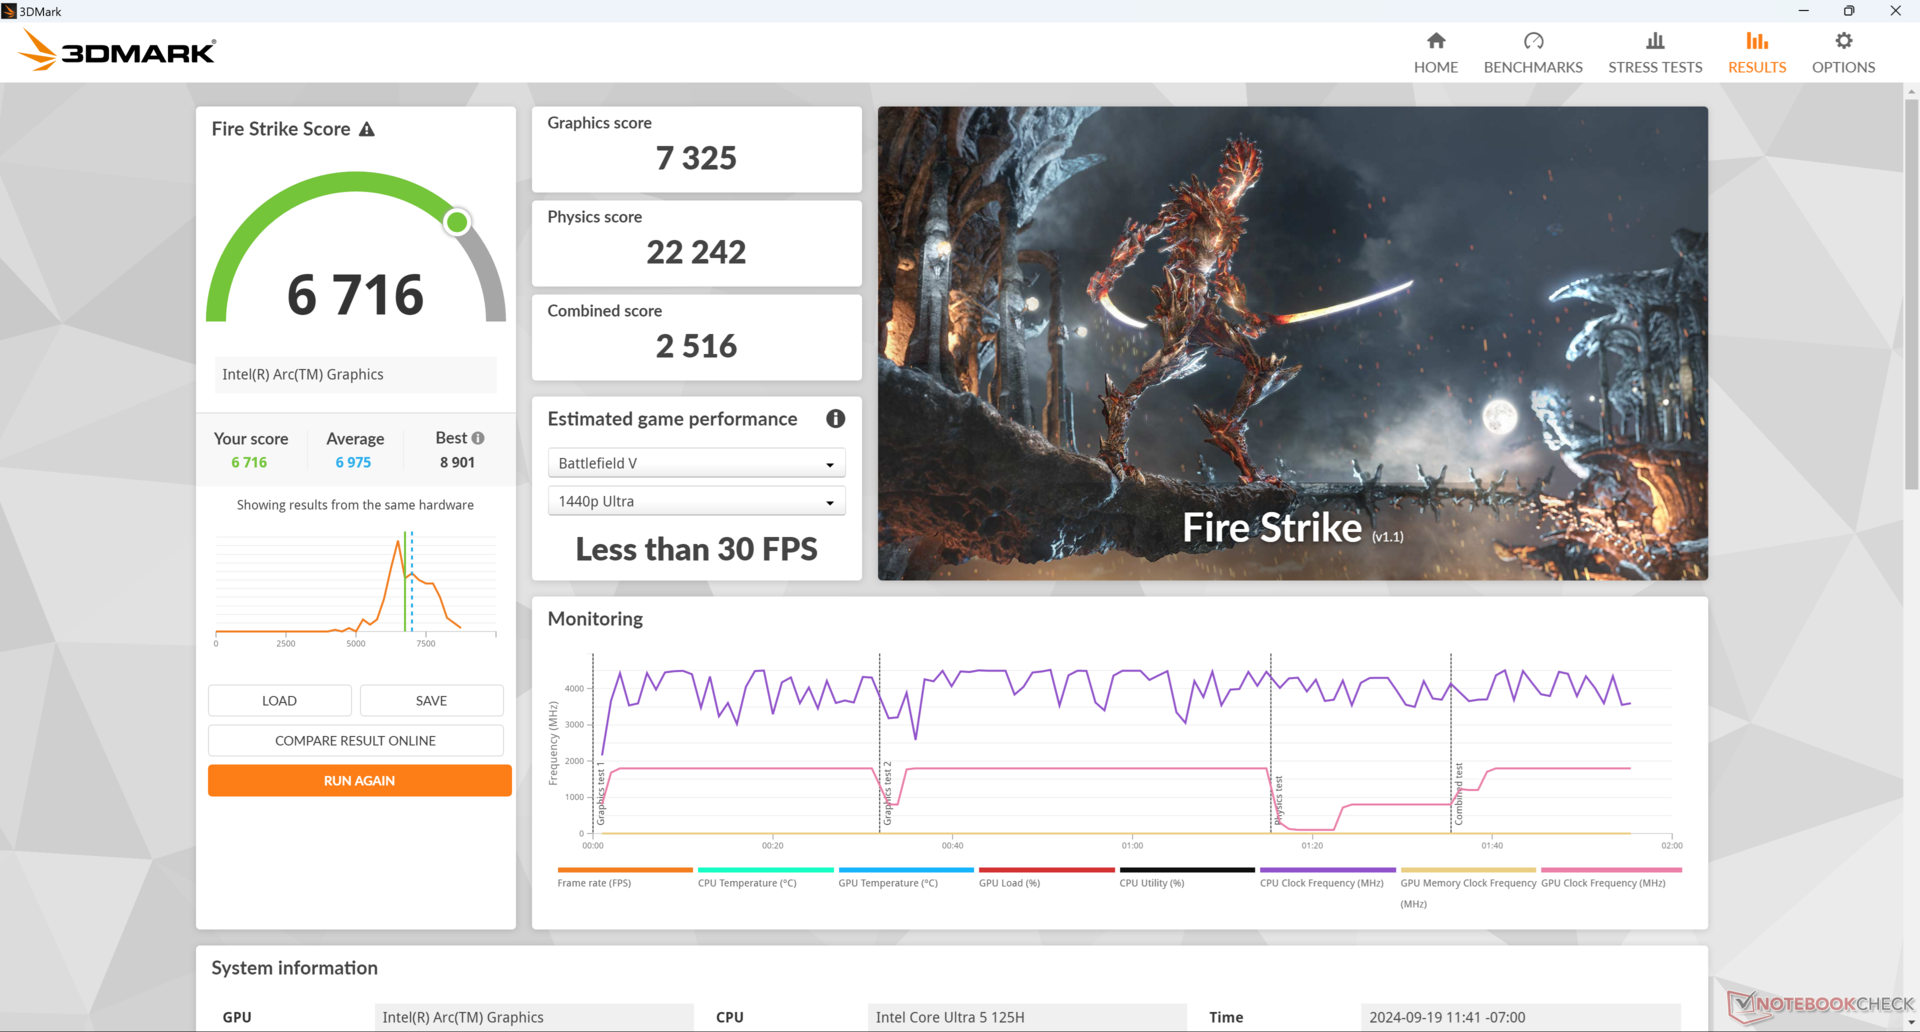
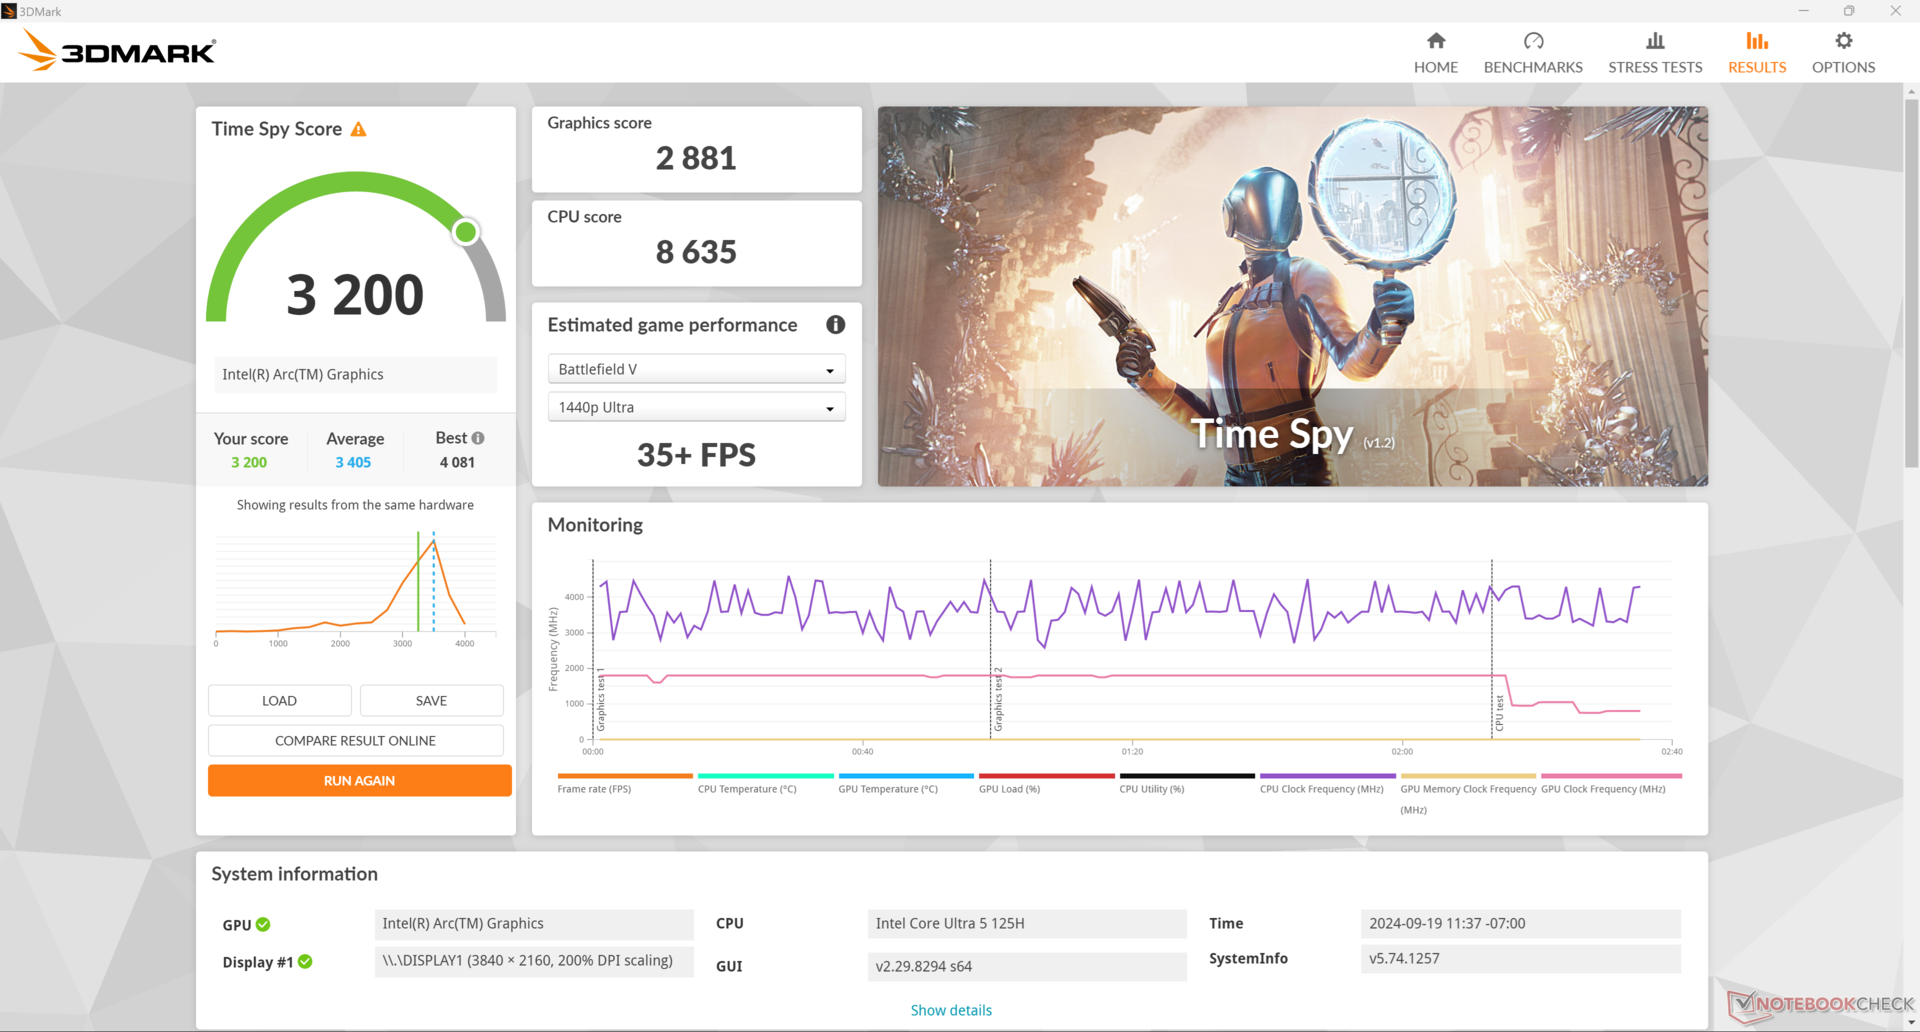
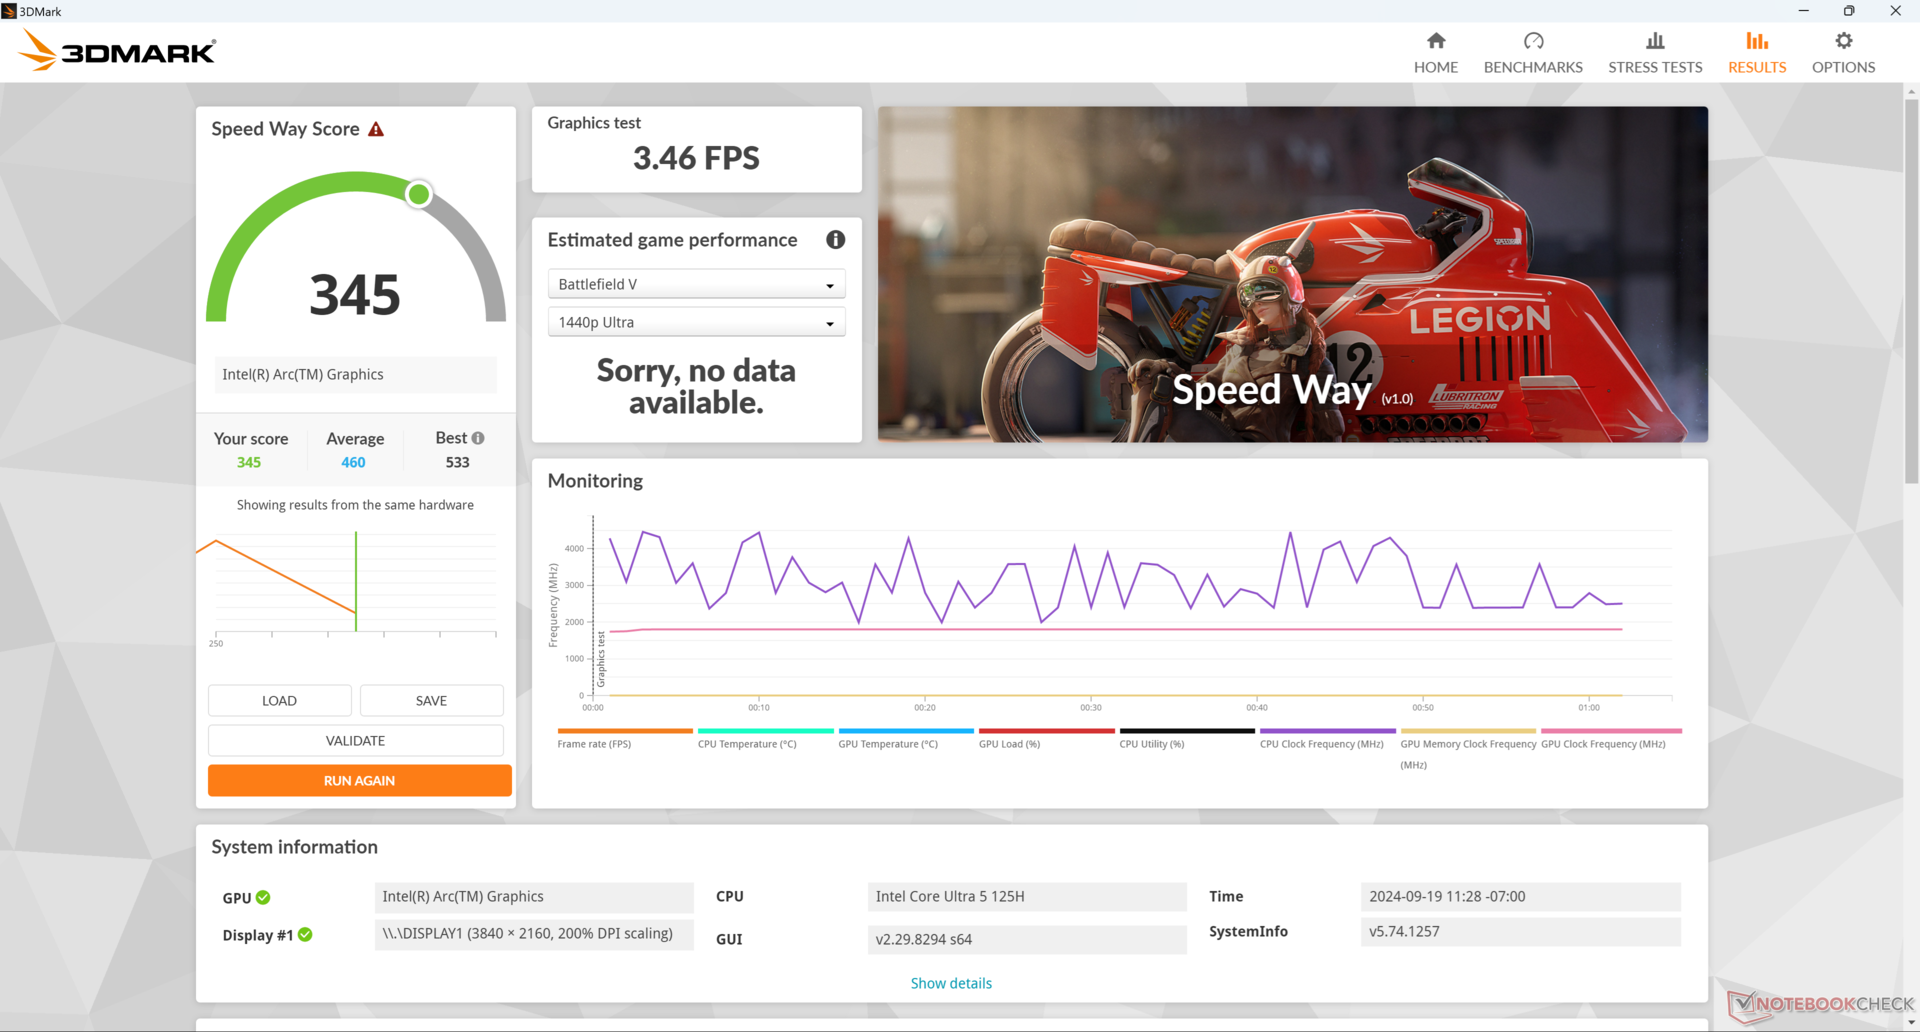
GPU Performance
Die Grafikleistung ist etwas langsamer als die durchschnittliche Leistung vergleichbarer PCs in unserer Datenbank mit der gleichen integrierten Arc 7-GPU, und zwar um etwa 5 Prozent. Die integrierte Arc 8 GPU in den leistungsstärkeren Core Ultra 7-H und Core Ultra 9-H Prozessoren ist etwa 15 Prozent schneller als unsere Arc 7-Lösung. Leider sind solche SKUs jedoch nicht mit der NucBox K9 erhältlich. Nichtsdestotrotz ist die Gesamtleistung laut 3DMark-Benchmarks mit der der konkurrierenden Radeon 780M der letzten Generation vergleichbar.
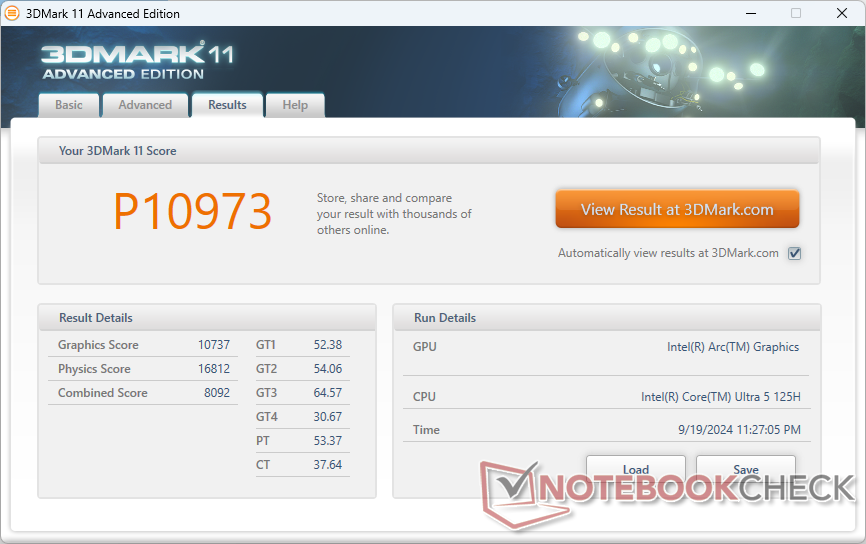
| 3DMark 11 Performance | 10973 Punkte | |
| 3DMark Cloud Gate Standard Score | 28997 Punkte | |
| 3DMark Fire Strike Score | 6716 Punkte | |
| 3DMark Time Spy Score | 3200 Punkte | |
| 3DMark Steel Nomad Score | 581 Punkte | |
Hilfe | ||
| Blender | |
| v3.3 Classroom OPTIX/RTX | |
| Lenovo ThinkStation P3 Tiny-30H0006AGE | |
| v3.3 Classroom CUDA | |
| Lenovo ThinkStation P3 Tiny-30H0006AGE | |
| v3.3 Classroom CPU | |
| Newsmay AC8F-POE | |
| Beelink SEi12 Core i5-1235U | |
| HP Pro Mini 400 G9-937U0EA | |
| Durchschnittliche Intel Arc 7-Core iGPU (391 - 671, n=7) | |
| GMK NucBox M6 | |
| Geekom XT13 Pro | |
| Framework Laptop 13.5 Core Ultra 7 155H | |
| GMK NucBox K9 | |
| Asus NUC 14 Pro | |
| HP Elite Mini 800 G9-5M9X6EA | |
| GMK NucBox K6 | |
| Geekom AX8 Pro | |
| Geekom AE7 | |
| Beelink SER8 | |
| Lenovo ThinkStation P3 Tiny-30H0006AGE | |
| v3.3 Classroom oneAPI/Intel | |
| GMK NucBox K9 | |
| Durchschnittliche Intel Arc 7-Core iGPU (n=1) | |
| Framework Laptop 13.5 Core Ultra 7 155H | |
* ... kleinere Werte sind besser
Gaming Performance
Leider ist die Spieleleistung im Vergleich zur NucBox K6 deutlich langsamer, auch wenn die oben genannten 3DMark-Ergebnisse etwas anderes vermuten lassen. Die meisten getesteten Titel, darunter GTA V, DOTA 2 Reborn, Final Fantasy XV, F1 22 und Baldur's Gate 3, laufen zwischen 10 und 40 Prozent langsamer auf unserer Intel-betriebenen NucBox K9. Auch bei Cyberpunk 2077 stotterten die Frameraten im Leerlauf, wie unsere Grafik unten zeigt.
| Performance Rating - Percent | |
| BOSGAME M1 -1! | |
| Beelink SER8 -1! | |
| GMK NucBox K6 | |
| GMK NucBox K9 | |
| GMK NucBox M6 -1! | |
| Beelink SEi12 Core i5-1235U -1! | |
| GTA V - 1920x1080 Highest AA:4xMSAA + FX AF:16x | |
| GMK NucBox K6 | |
| GMK NucBox K9 | |
| Beelink SEi12 Core i5-1235U | |
| Final Fantasy XV Benchmark - 1920x1080 High Quality | |
| BOSGAME M1 | |
| Beelink SER8 | |
| GMK NucBox K6 | |
| GMK NucBox K9 | |
| GMK NucBox M6 | |
| Beelink SEi12 Core i5-1235U | |
| Strange Brigade - 1920x1080 ultra AA:ultra AF:16 | |
| BOSGAME M1 | |
| Beelink SER8 | |
| GMK NucBox K6 | |
| GMK NucBox K9 | |
| GMK NucBox M6 | |
| Beelink SEi12 Core i5-1235U | |
| Dota 2 Reborn - 1920x1080 ultra (3/3) best looking | |
| Beelink SER8 | |
| BOSGAME M1 | |
| GMK NucBox K6 | |
| GMK NucBox K9 | |
| GMK NucBox M6 | |
| Beelink SEi12 Core i5-1235U | |
| X-Plane 11.11 - 1920x1080 high (fps_test=3) | |
| GMK NucBox K6 | |
| Beelink SER8 | |
| BOSGAME M1 | |
| GMK NucBox K9 | |
| GMK NucBox M6 | |
| Beelink SEi12 Core i5-1235U | |
| Far Cry 5 - 1920x1080 Ultra Preset AA:T | |
| BOSGAME M1 | |
| Beelink SER8 | |
| GMK NucBox K6 | |
| GMK NucBox K9 | |
| GMK NucBox M6 | |
| Strange Brigade | |
| 1280x720 lowest AF:1 | |
| Lenovo ThinkStation P3 Tiny-30H0006AGE | |
| Beelink SER8 | |
| GMK NucBox K6 | |
| Framework Laptop 13.5 Core Ultra 7 155H | |
| GMK NucBox K9 | |
| Durchschnittliche Intel Arc 7-Core iGPU (133 - 149, n=4) | |
| GMK NucBox M6 | |
| Beelink SEi12 Core i5-1235U | |
| 1920x1080 medium AA:medium AF:4 | |
| Lenovo ThinkStation P3 Tiny-30H0006AGE | |
| Framework Laptop 13.5 Core Ultra 7 155H | |
| Beelink SER8 | |
| GMK NucBox K6 | |
| Durchschnittliche Intel Arc 7-Core iGPU (63 - 69.5, n=4) | |
| GMK NucBox K9 | |
| GMK NucBox M6 | |
| Beelink SEi12 Core i5-1235U | |
| 1920x1080 high AA:high AF:8 | |
| Lenovo ThinkStation P3 Tiny-30H0006AGE | |
| Framework Laptop 13.5 Core Ultra 7 155H | |
| Beelink SER8 | |
| GMK NucBox K6 | |
| Durchschnittliche Intel Arc 7-Core iGPU (50 - 57.7, n=4) | |
| GMK NucBox K9 | |
| GMK NucBox M6 | |
| Beelink SEi12 Core i5-1235U | |
| 1920x1080 ultra AA:ultra AF:16 | |
| Lenovo ThinkStation P3 Tiny-30H0006AGE | |
| Beelink SER8 | |
| GMK NucBox K6 | |
| Framework Laptop 13.5 Core Ultra 7 155H | |
| Durchschnittliche Intel Arc 7-Core iGPU (40 - 47.3, n=4) | |
| GMK NucBox K9 | |
| GMK NucBox M6 | |
| Beelink SEi12 Core i5-1235U | |
| F1 22 | |
| 1280x720 Ultra Low Preset AA:T AF:16x | |
| GMK NucBox K6 | |
| Beelink SER8 | |
| GMK NucBox K9 | |
| Durchschnittliche Intel Arc 7-Core iGPU (n=1) | |
| Framework Laptop 13.5 Core Ultra 7 155H | |
| GMK NucBox M6 | |
| 1920x1080 Low Preset AA:T AF:16x | |
| GMK NucBox K6 | |
| Beelink SER8 | |
| GMK NucBox K9 | |
| Durchschnittliche Intel Arc 7-Core iGPU (n=1) | |
| Framework Laptop 13.5 Core Ultra 7 155H | |
| GMK NucBox M6 | |
| 1920x1080 Medium Preset AA:T AF:16x | |
| GMK NucBox K6 | |
| Beelink SER8 | |
| GMK NucBox K9 | |
| Durchschnittliche Intel Arc 7-Core iGPU (n=1) | |
| Framework Laptop 13.5 Core Ultra 7 155H | |
| GMK NucBox M6 | |
| 1920x1080 High Preset AA:T AF:16x | |
| GMK NucBox K6 | |
| Beelink SER8 | |
| Framework Laptop 13.5 Core Ultra 7 155H | |
| GMK NucBox K9 | |
| Durchschnittliche Intel Arc 7-Core iGPU (n=1) | |
| GMK NucBox M6 | |
Cyberpunk 2077 ultra FPS-Diagramm
| min. | mittel | hoch | max. | |
|---|---|---|---|---|
| GTA V (2015) | 143.6 | 125.5 | 33.6 | 12.7 |
| Dota 2 Reborn (2015) | 97.7 | 83.1 | 75.6 | 73.3 |
| Final Fantasy XV Benchmark (2018) | 59.6 | 33.3 | 22.3 | |
| X-Plane 11.11 (2018) | 57 | 44.8 | 37.3 | |
| Far Cry 5 (2018) | 71 | 40 | 37 | 35 |
| Strange Brigade (2018) | 148.6 | 63.9 | 53.5 | 43.5 |
| Tiny Tina's Wonderlands (2022) | 50.7 | 39.4 | 26.8 | 22.4 |
| F1 22 (2022) | 79.4 | 71.9 | 52.9 | |
| Baldur's Gate 3 (2023) | 33.7 | 27.9 | 24.2 | 23.1 |
| Cyberpunk 2077 (2023) | 30.9 | 25.2 | 21.3 | 18.8 |
Emissionen — Die Lüfter sind immer an
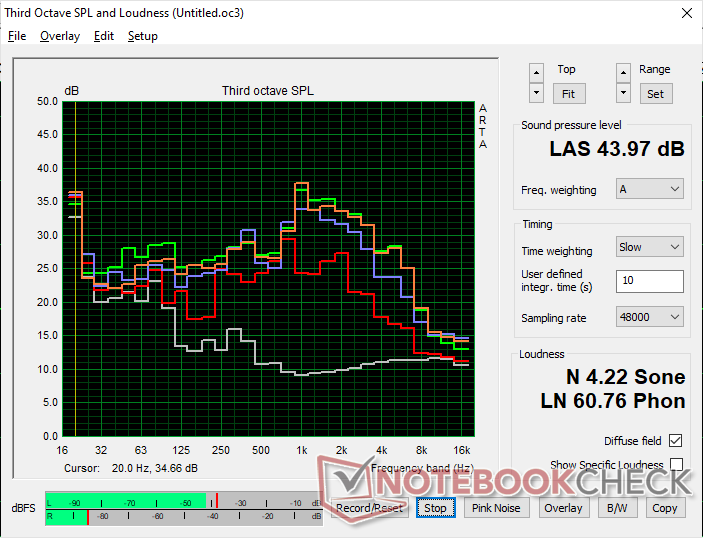
Geräuschemissionen
Das Lüftergeräusch ist unabhängig von der Auslastung des Geräts immer vorhanden, ähnlich wie bei der NucBox K6. Bereits im Leerlauf auf dem Desktop beträgt der Geräuschpegel 30 bis 36 dB(A) im Vergleich zu einem leisen Hintergrund von 23 dB(A), selbst wenn der Energiesparmodus aktiviert ist. Bei Spielen oder anderen anspruchsvollen Aufgaben sind die Lüftergeräusche der NucBox K9 mit etwa 44 dB(A) deutlich leiser als die fast 48 dB(A) der NucBox K6.
Lautstärkediagramm
| Idle |
| 29.8 / 35.7 / 35.7 dB(A) |
| Last |
| 41.9 / 44 dB(A) |
 | ||
30 dB leise 40 dB(A) deutlich hörbar 50 dB(A) störend |
||
min: | ||
| GMK NucBox K9 Arc 7-Core, Ultra 5 125H, MasonSemi 1TB MC7000 | GMK NucBox K6 Radeon 780M, R7 7840HS, MasonSemi 1TB MC7000 | GMK NucBox M6 Radeon 660M, R5 6600H, AirDisk APF 10-512G | Beelink SER8 Radeon 780M, R7 8845HS, Crucial P3 Plus CT1000P3PSSD8 | Beelink SEi12 Core i5-1235U Iris Xe G7 80EUs, i5-1235U, Kingston NV1 SNVS/500GCN | BOSGAME M1 Radeon 780M, R7 7840HS, Kingston OM8PGP41024N-A0 | |
|---|---|---|---|---|---|---|
| Geräuschentwicklung | -2% | -4% | 14% | 14% | 4% | |
| aus / Umgebung * (dB) | 23 | 23.2 -1% | 24.2 -5% | 23.6 -3% | 23.3 -1% | 23.2 -1% |
| Idle min * (dB) | 29.8 | 31.3 -5% | 31.9 -7% | 28.8 3% | 27.8 7% | 32 -7% |
| Idle avg * (dB) | 35.7 | 31.3 12% | 32 10% | 28.8 19% | 27.8 22% | 32 10% |
| Idle max * (dB) | 35.7 | 33.4 6% | 33.8 5% | 30.5 15% | 27.8 22% | 32 10% |
| Last avg * (dB) | 41.9 | 47.5 -13% | 48.5 -16% | 34.6 17% | 32 24% | 38.7 8% |
| Cyberpunk 2077 ultra * (dB) | 43.8 | 34.1 22% | ||||
| Last max * (dB) | 44 | 47.7 -8% | 48.5 -10% | 34.5 22% | 39.2 11% | 42 5% |
| Witcher 3 ultra * (dB) | 43.6 | 48.5 | 34.1 | 41.7 |
* ... kleinere Werte sind besser
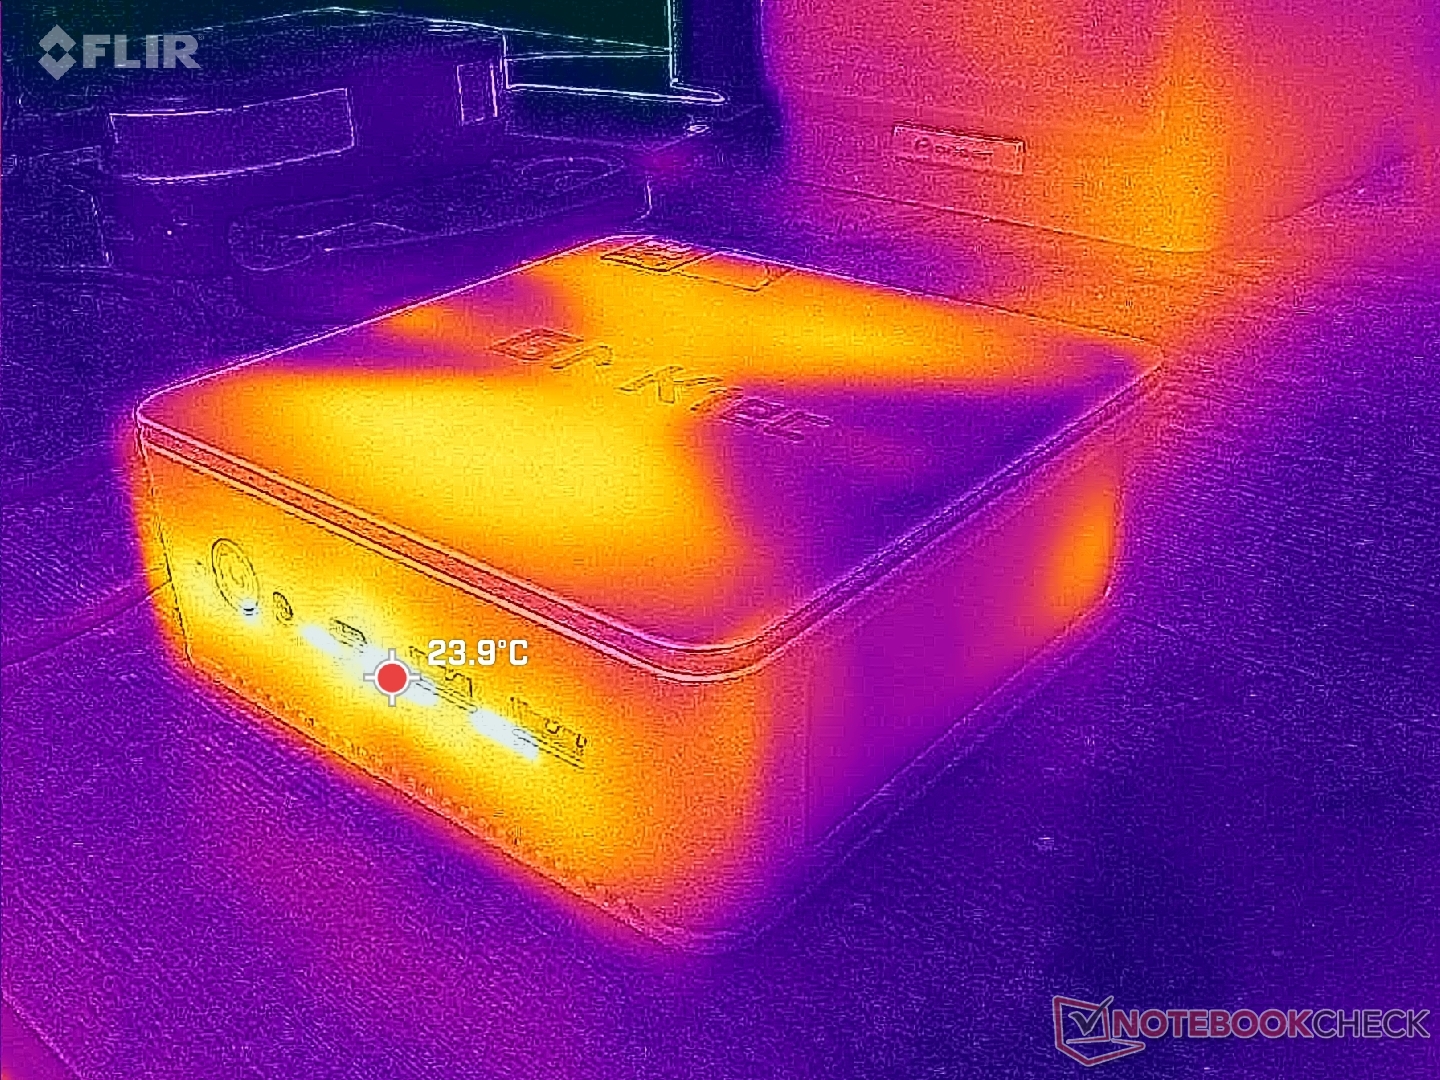
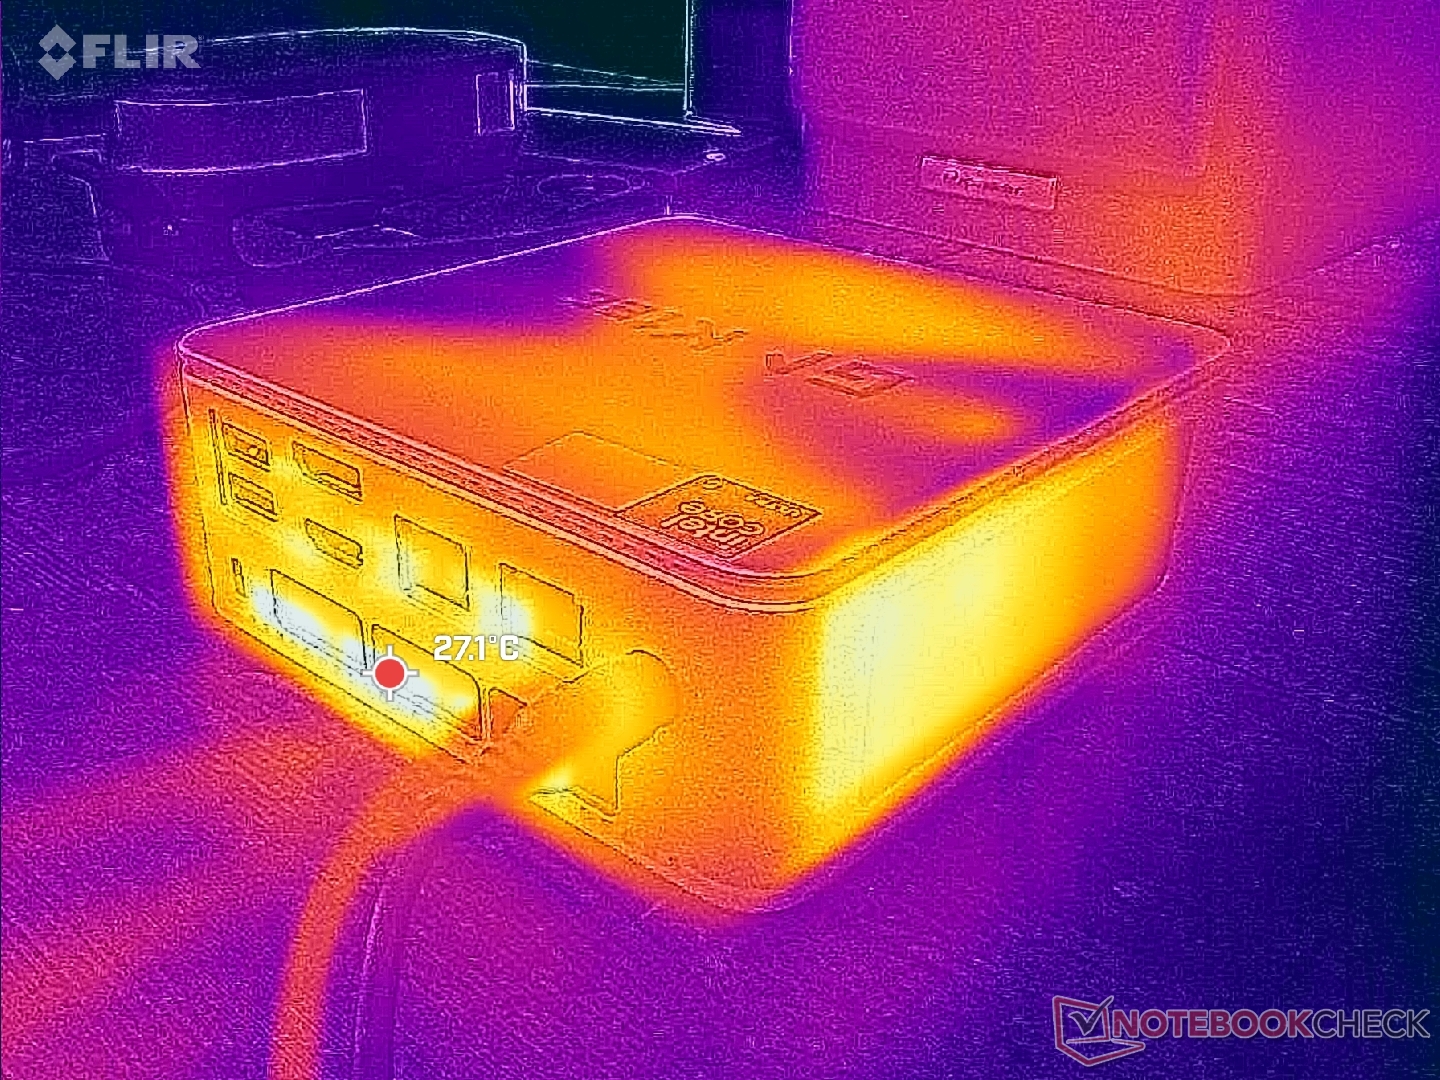
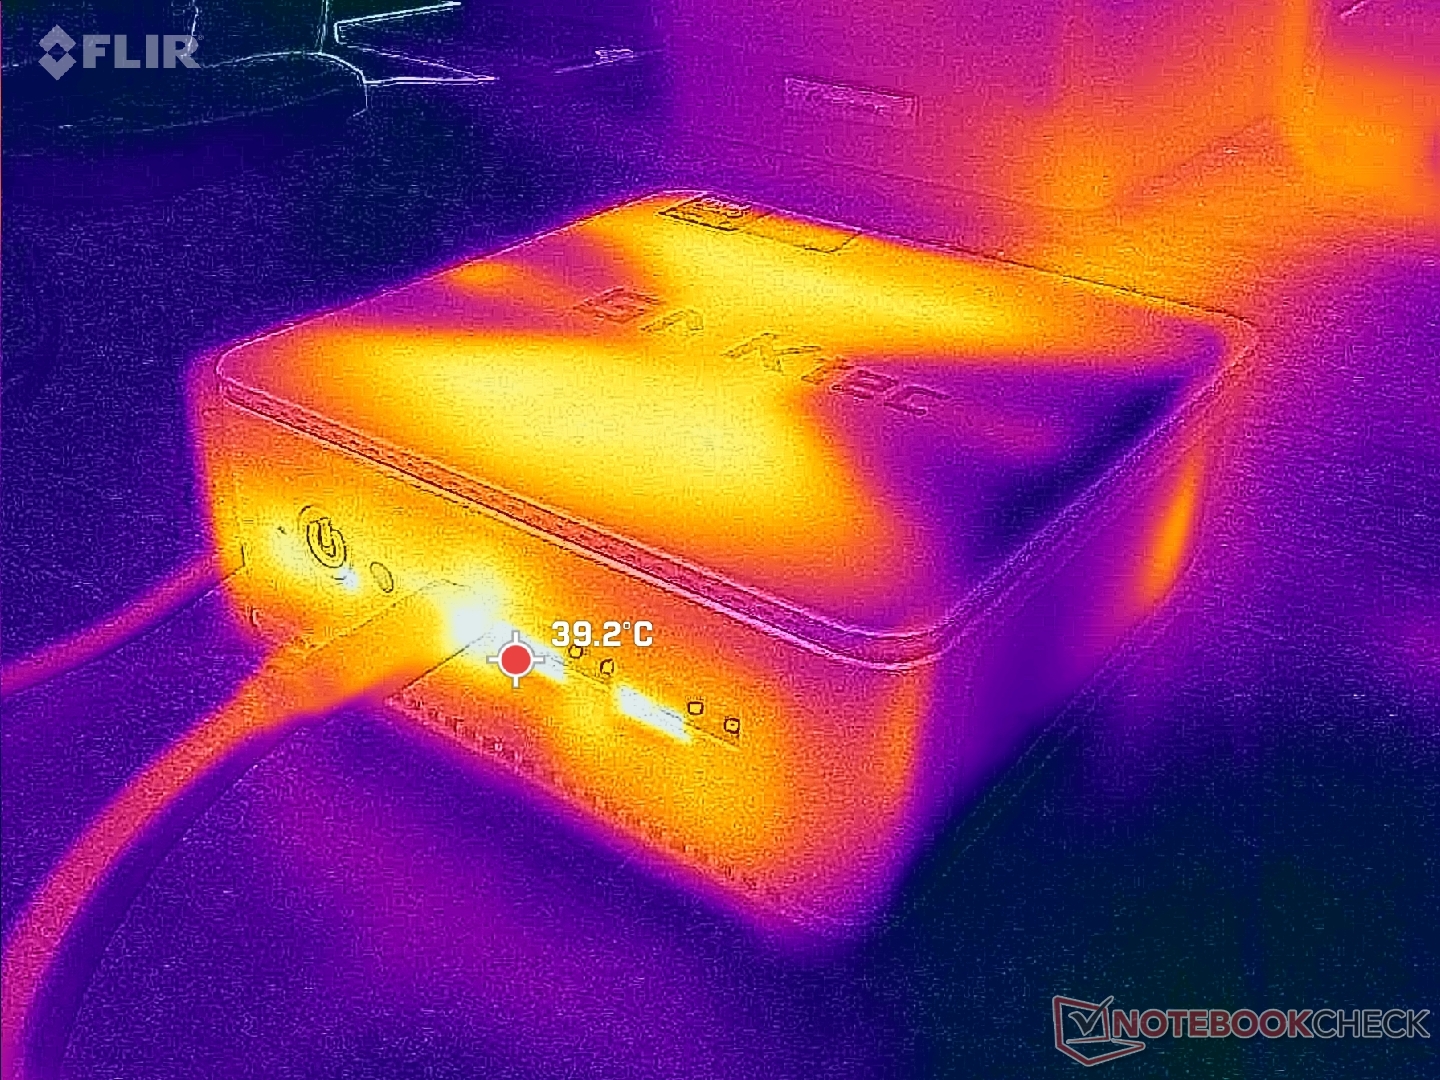
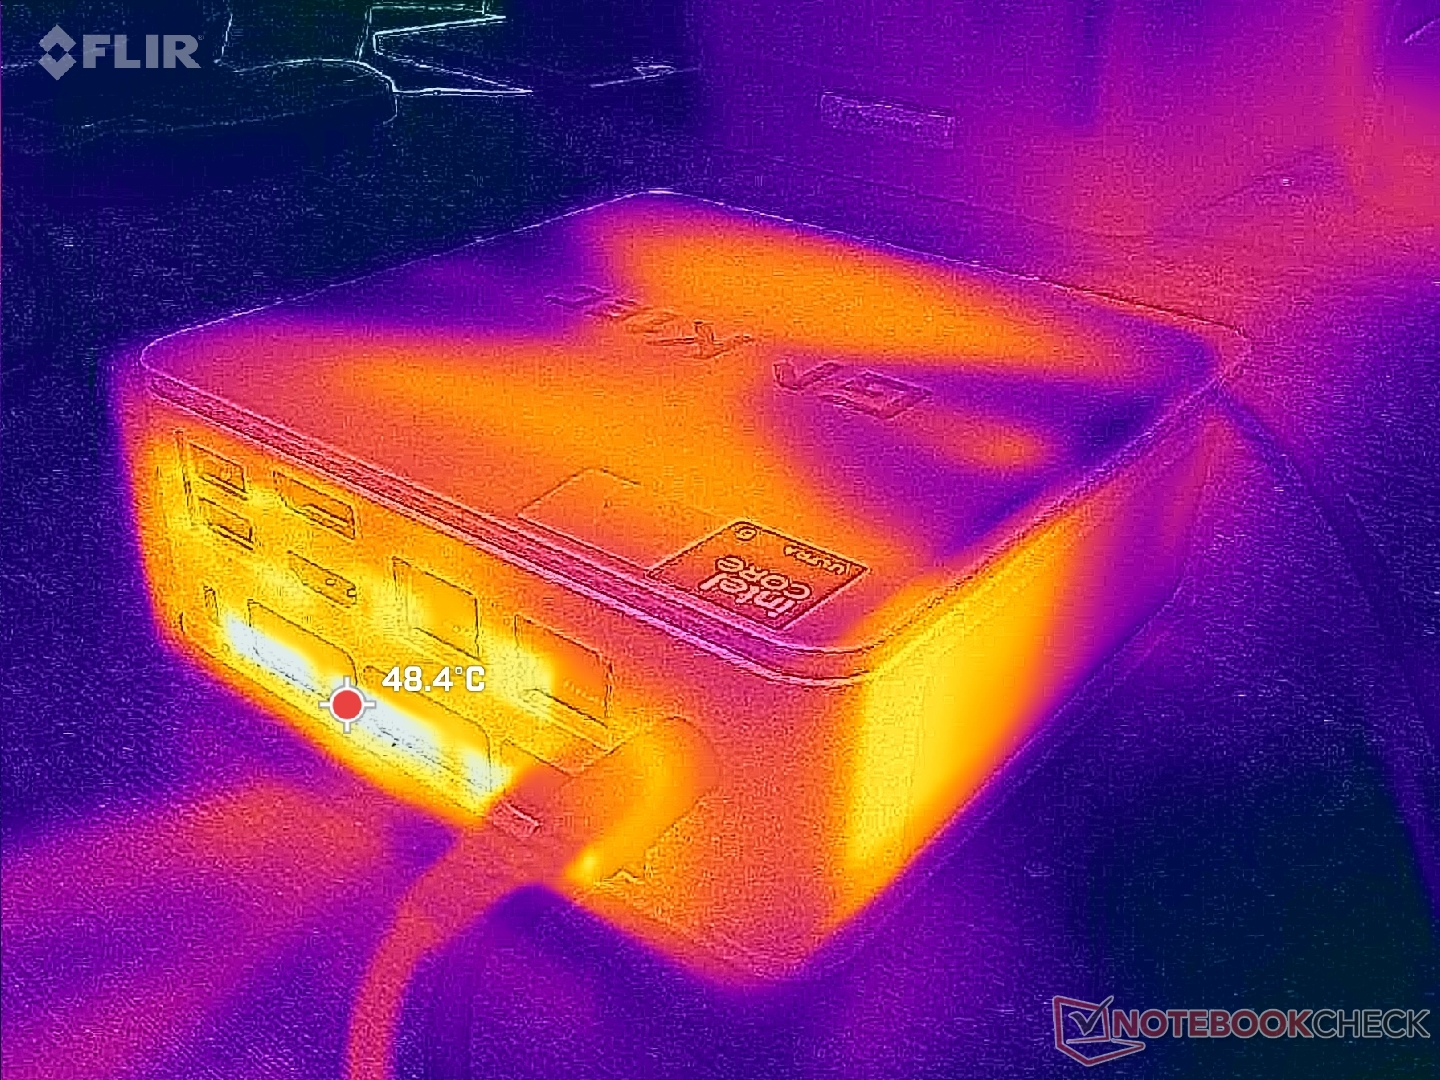
Temperatur
Die Oberflächentemperaturen sind unproblematisch. Die Lüftungsgitter befinden sich an jeder Seite des Geräts, mit Ausnahme der Oberseite, sodass Sie Notebooks und andere kleine Gegenstände darauf abstellen können, ohne den Luftstrom zu behindern.
Energieverwaltung
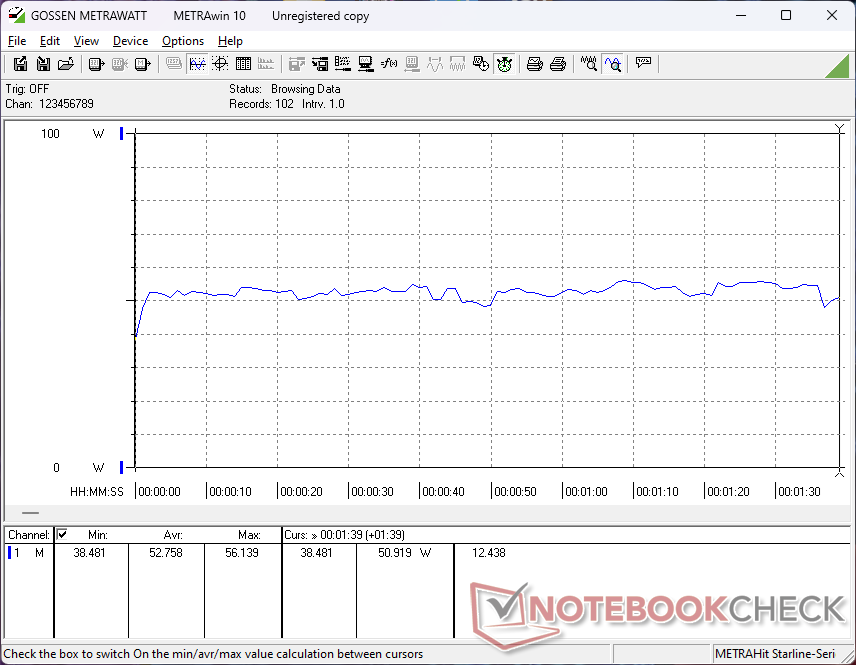
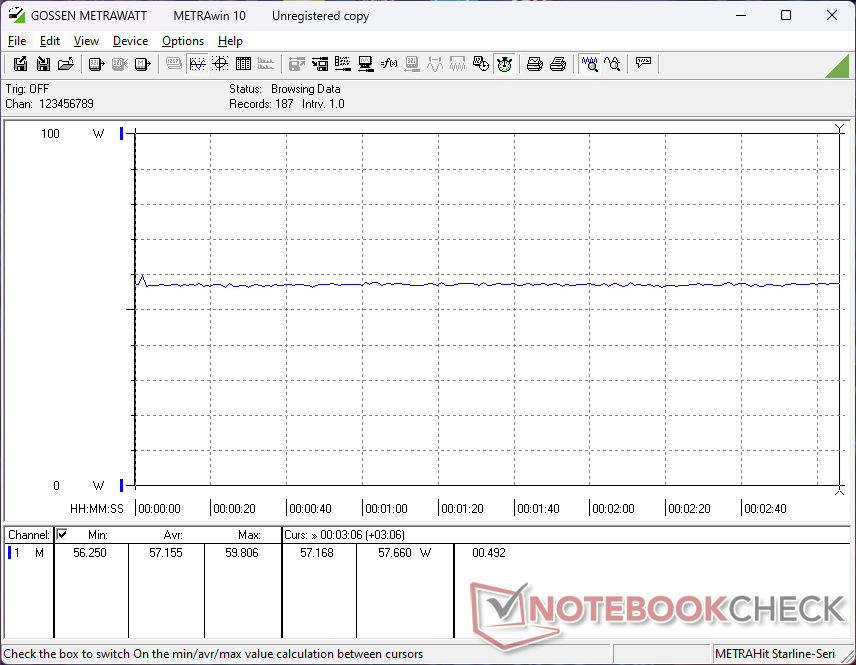
Energieaufnahme
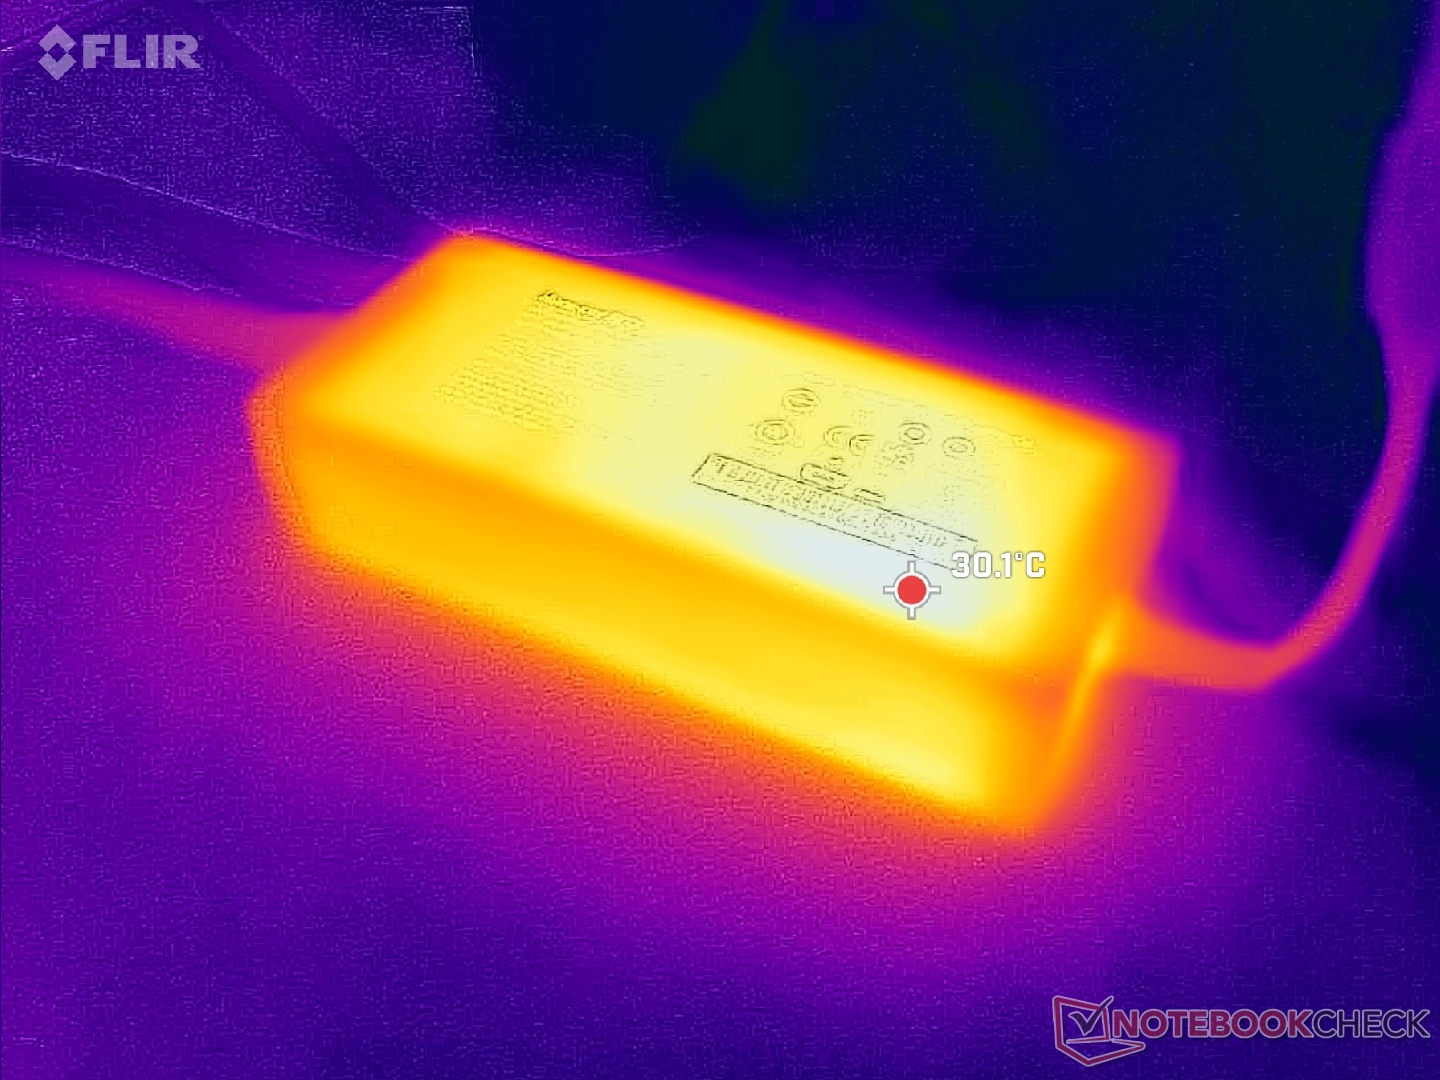
Der Verbrauch im Leerlauf auf dem Desktop liegt mit rund 11 W höher als erwartet, selbst im Power Save-Modus, im Vergleich zu 6 W bis 8 W bei anderen Modellen wie der NucBox M6 oder der Beelink SER8. Bei anspruchsvolleren Aufgaben wie 3DMark 06 oder Cyberpunk 2077 ist der Verbrauch jedoch merklich geringer als bei der schnelleren NucBox K6.
Mit dem kleinen bis mittelgroßen (~14,5 x 6,4 x 3 cm) 120-W-Netzteil konnten wir einen maximalen Verbrauch von 73 W messen. Der große Spielraum kann dem Thunderbolt-4-Anschluss zugeschrieben werden, falls angeschlossene Monitore oder Zubehör zusätzliche Leistung benötigen.
| Aus / Standby | |
| Idle | |
| Last |
|
Legende:
min: | |
| GMK NucBox K9 Ultra 5 125H, Arc 7-Core, MasonSemi 1TB MC7000, , x, | GMK NucBox K6 R7 7840HS, Radeon 780M, MasonSemi 1TB MC7000, , x, | GMK NucBox M6 R5 6600H, Radeon 660M, AirDisk APF 10-512G, , x, | Beelink SER8 R7 8845HS, Radeon 780M, Crucial P3 Plus CT1000P3PSSD8, , x, | Beelink SEi12 Core i5-1235U i5-1235U, Iris Xe G7 80EUs, Kingston NV1 SNVS/500GCN, , x, | BOSGAME M1 R7 7840HS, Radeon 780M, Kingston OM8PGP41024N-A0, , x, | |
|---|---|---|---|---|---|---|
| Stromverbrauch | 10% | 10% | 9% | -43% | 4% | |
| Idle min * (Watt) | 10.9 | 6.7 39% | 7.9 28% | 7.3 33% | 15.8 -45% | 7.3 33% |
| Idle avg * (Watt) | 11 | 7 36% | 8 27% | 7.3 34% | 16.8 -53% | 7.3 34% |
| Idle max * (Watt) | 11.4 | 7.6 33% | 8.3 27% | 8.4 26% | 17 -49% | 8.4 26% |
| Last avg * (Watt) | 52.8 | 74.3 -41% | 61.5 -16% | 68.2 -29% | 54.4 -3% | 72.7 -38% |
| Cyberpunk 2077 ultra external monitor * (Watt) | 57.1 | |||||
| Last max * (Watt) | 72.2 | 85.7 -19% | 84.6 -17% | 84.3 -17% | 119.1 -65% | 99.1 -37% |
| Witcher 3 ultra * (Watt) | 75 | 47.3 | 75.1 | 50.7 | 80.5 |
* ... kleinere Werte sind besser
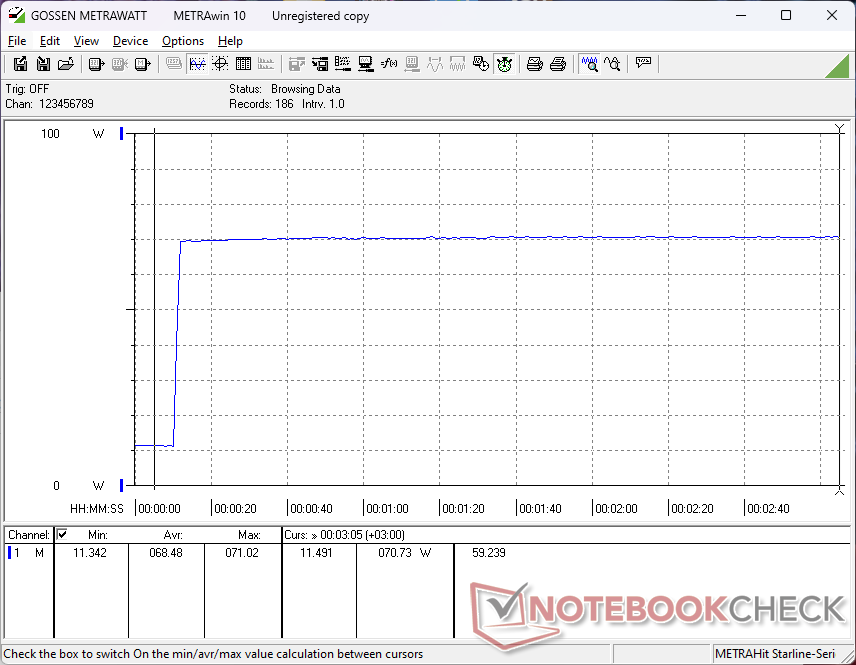
Energieaufnahme Prime95+FurMark Stresstest
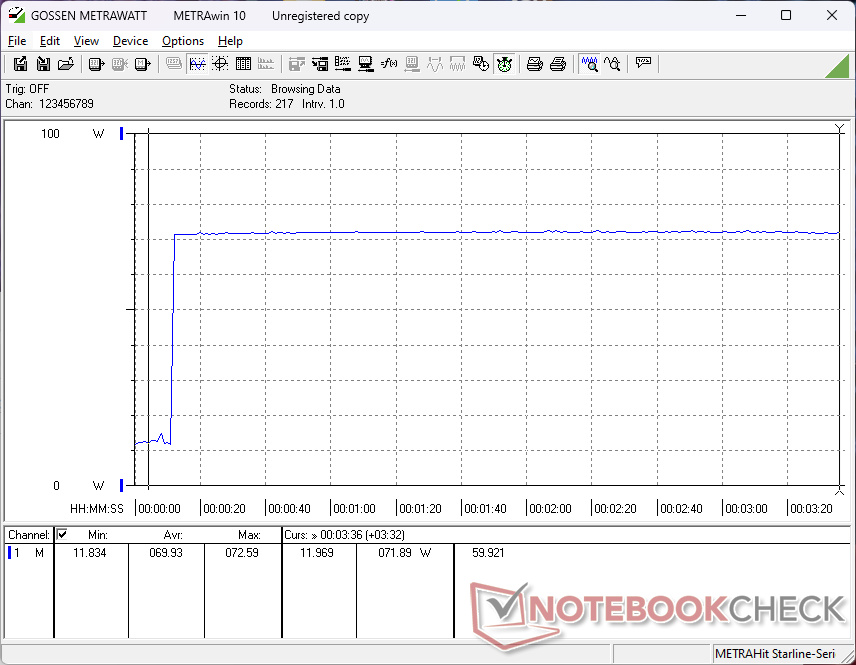
Energieaufnahme externer Monitor
Pro
Contra
Fazit — Neuer, aber nicht schneller
Für 512,5 Euro im Angebot mit 32 GB RAM und 1 TB Speicherplatz ist die NucBox K9 ein gutes Preis-Leistungs-Verhältnis im Vergleich zur Beelink SER8. Der größte Feind von GMK ist wahrscheinlich GMK selbst, da Modelle wie die NucBox K6 sowohl billiger als auch schneller sind als die NucBox K9, und das bei im Wesentlichen gleichem Gehäusedesign und gleichen physikalischen Eigenschaften. In diesem Szenario gibt es fast keinen Grund, die NucBox K9 der K6 vorzuziehen, es sei denn, Sie legen mehr Wert auf die integrierte NPU als auf die reine CPU- und GPU-Leistung. Sogar die konkurrierende Bosgame M1 ist derzeit billiger und schneller. Es stimmt zwar, dass die NucBox K9 etwas leiser läuft, aber das liegt nur daran, dass das Modell auch etwas langsamer ist.
DieNucBox K9 ist beileibe kein schlechter Mini-PC, aber ihr höherer Preis und ihre langsamere Leistung als die ältere NucBox K6 werden viele Käufer verwirren, vor allem diejenigen, die nicht an KI-Beschleunigung interessiert sind.
Abgesehen von den Preis- und Leistungsunterschieden zwischen den Modellen NucBox K6 und K9 ist auch das Design der Serie in die Jahre gekommen. Konkurrenten wie Bosgame haben stärkere Metallgehäuse, während Beelink kürzlich seine SER-Serie überarbeitet hat, um professioneller und sogar luxuriöser zu wirken. Die GMK NucBox, die größtenteils aus Kunststoff besteht, funktioniert gut genug, aber es ist vielleicht an der Zeit für eine Überholung mit hochwertigeren Materialien oder einer möglichen werkzeuglosen Wartung.
Preis und Verfügbarkeit
GMKtec NucBox K9 ist jetzt, wie in diesem Testbericht konfiguriert, direkt vom Hersteller für 512,5 Euro erhältlich. Eine Barebone-SKU ist ebenfalls für 359,3 Euro erhältlich.
Hinweis: Wir haben unser Rating-System kürzlich aktualisiert und die Ergebnisse von Version 8 sind nicht mit den Ergebnissen von Version 7 vergleichbar. Weitere Informationen dazu sind hier verfügbar.
GMK NucBox K9
- 30.10.2024 v8
Allen Ngo
 Total Sustainability Score:
 Transparenz
Die Auswahl der zu testenden Geräte erfolgt innerhalb der Redaktion. Das vorliegende Testmuster wurde dem Autor vom Hersteller oder einem Shop zu Testzwecken leihweise zur Verfügung gestellt. Eine Einflussnahme des Leihstellers auf den Testbericht gab es nicht, der Hersteller erhielt keine Version des Reviews vor der Veröffentlichung. Es bestand keine Verpflichtung zur Publikation. Als eigenständiges, unabhängiges Unternehmen unterliegt Notebookcheck keiner Diktion von Herstellern, Shops und Verlagen.
So testet Notebookcheck
Pro Jahr werden von Notebookcheck hunderte Laptops und Smartphones unabhängig in von uns standardisierten technischen Verfahren getestet, um eine Vergleichbarkeit aller Testergebnisse zu gewährleisten. Seit rund 20 Jahren entwickeln wir diese Testmethoden kontinuierlich weiter und setzen damit Branchenstandards. In unseren Testlaboren kommt ausschließlich hochwertiges Messequipment in die Hände erfahrener Techniker und Redakteure. Die Tests unterliegen einer mehrstufigen Kontrolle. Unsere komplexe Gesamtbewertung basiert auf hunderten fundierten Messergebnissen und Benchmarks, womit Ihnen Objektivität garantiert ist. Weitere Informationen zu unseren Testmethoden gibt es hier.
Preisvergleich

