

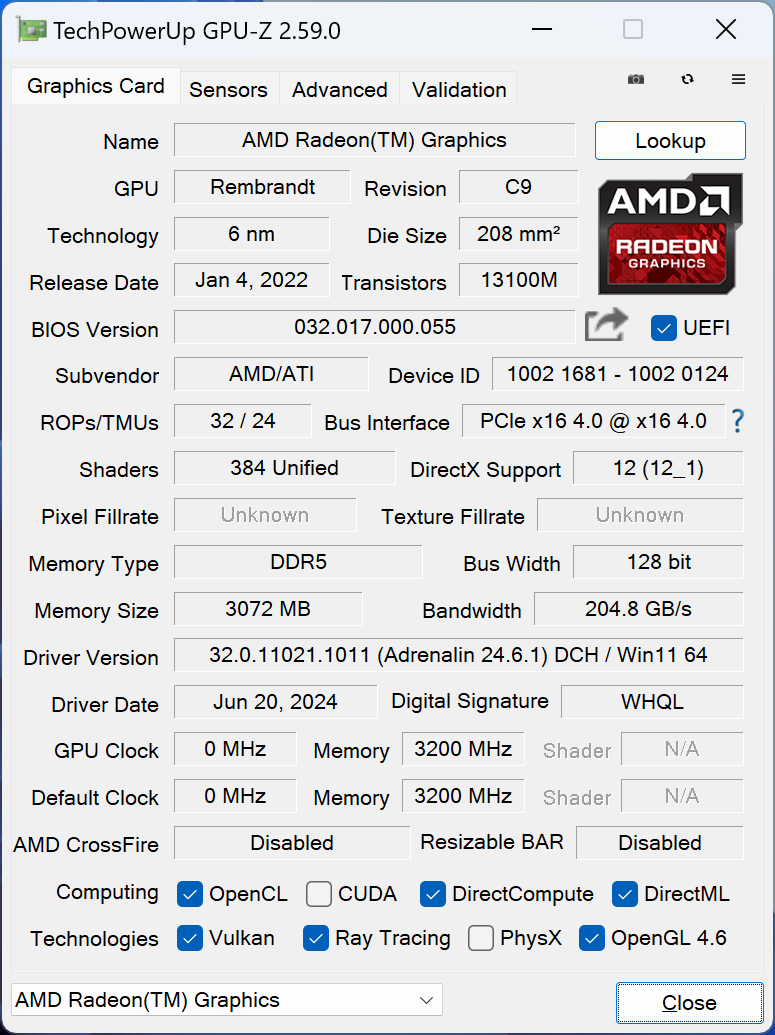
GMK NucBox M6 im Test: Ein robuster Mini-PC für unter 300 Euro

Die schnellere Ausführung der NucBox M5 ist die NucBox M6. GMK tauschte den neueren Ryzen 5 6600H aus der H-Serie in der M6 gegen den Ryzen 7 5700U der U-Serie aus. Das Gehäusedesign und die physikalischen Eigenschaften sind ansonsten unverändert, weshalb wir empfehlen, unseren Test der M5 zu lesen, um mehr über die Serie zu erfahren.
Unsere Testkonfiguration kostet 277 Euro mit 16 GB RAM, 512 GB SSD und Windows 11 Pro. Der Einstiegspreis kann sogar noch niedriger sein und liegt bei nur 212 Euro für ein Barebones-Kit. Alle SKUs werden mit der gleichen schwarzen Farboption und dem Ryzen 5 6600H Prozessor geliefert.
Zu den Konkurrenten der NucBox M6 gehören andere erschwingliche Mini-PCs wie der Beelink SER5, Maxtang MTN-FP750 oder Geekom Mini IT12.
Weitere GMK Bewertungen:
Mögliche Konkurrenten im Vergleich
Bew. | Version | Datum | Modell | Gewicht | Dicke | Größe | Auflösung | Preis ab |
|---|---|---|---|---|---|---|---|---|
| 63.6 % | v8 | 07 / 2024 | GMK NucBox M6 R5 6600H, Radeon 660M | 526 g | 48 mm | x | ||
| 78.9 % v7 (old) | v7 (old) | 04 / 2024 | GMK NucBox M5 R7 5700U, Vega 8 | 505 g | 48 mm | x | ||
| 83.6 % v7 (old) | v7 (old) | 04 / 2024 | GMK NucBox K6 R7 7840HS, Radeon 780M | 514 g | 47 mm | x | ||
| 84.5 % v7 (old) | v7 (old) | 05 / 2024 | BOSGAME M1 R7 7840HS, Radeon 780M | 766 g | 51 mm | x | ||
| 82.1 % v7 (old) | v7 (old) | 11 / 2023 | Beelink SER5 R5 5560U, Vega 6 | 439 g | 42 mm | x | ||
| 80.8 % v7 (old) | v7 (old) | 04 / 2023 | Intel NUC 13 Pro Kit NUC13ANK i7-1360P, Iris Xe G7 96EUs | 538 g | 37 mm | x | ab EUR 0 |
Hinweis: Wir haben unser Rating-System kürzlich aktualisiert und die Ergebnisse von Version 8 sind nicht mit den Ergebnissen von Version 7 vergleichbar. Weitere Informationen dazu sind hier verfügbar.
Note: We have recently updated our rating system and the results of version 8 are not comparable with the results of version 7. More information is available here .
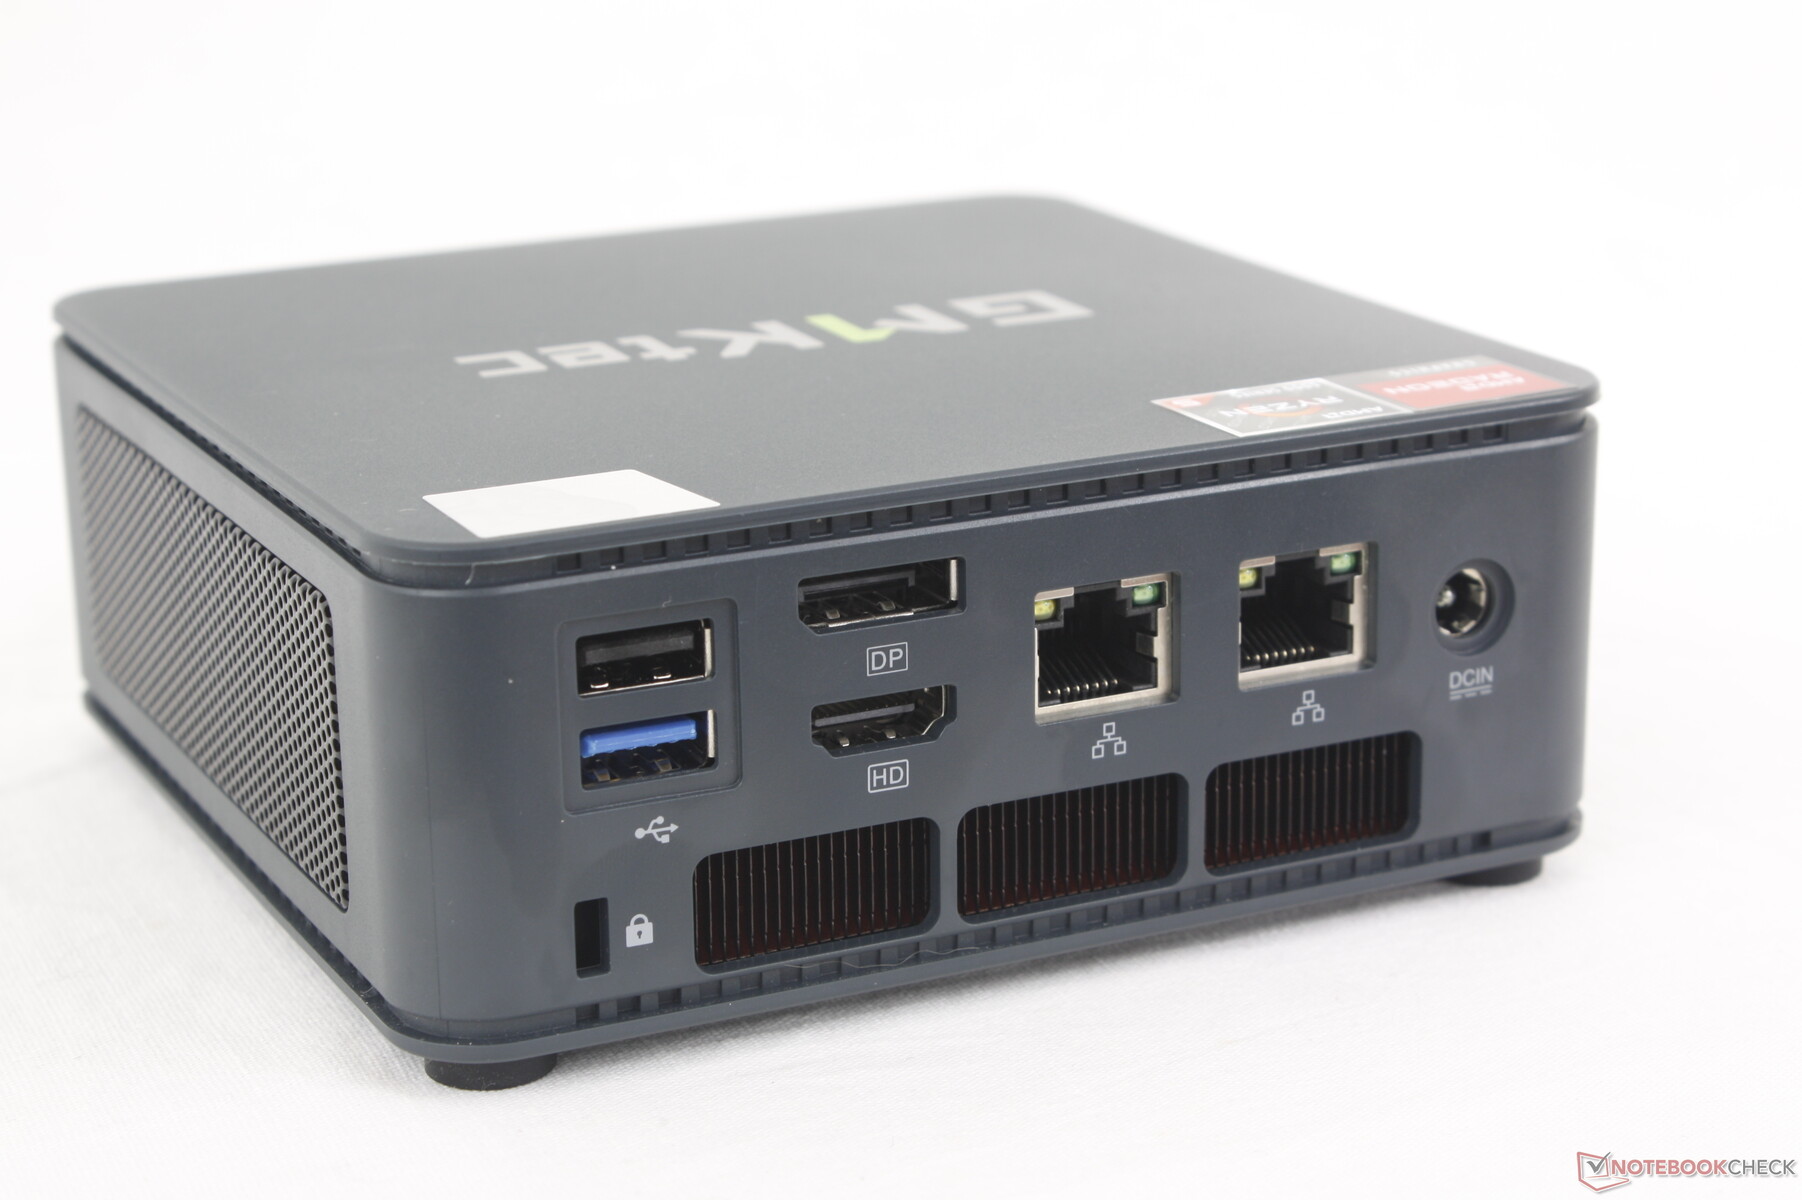
Gehäuse — Vertrautes Kunststoffdesign
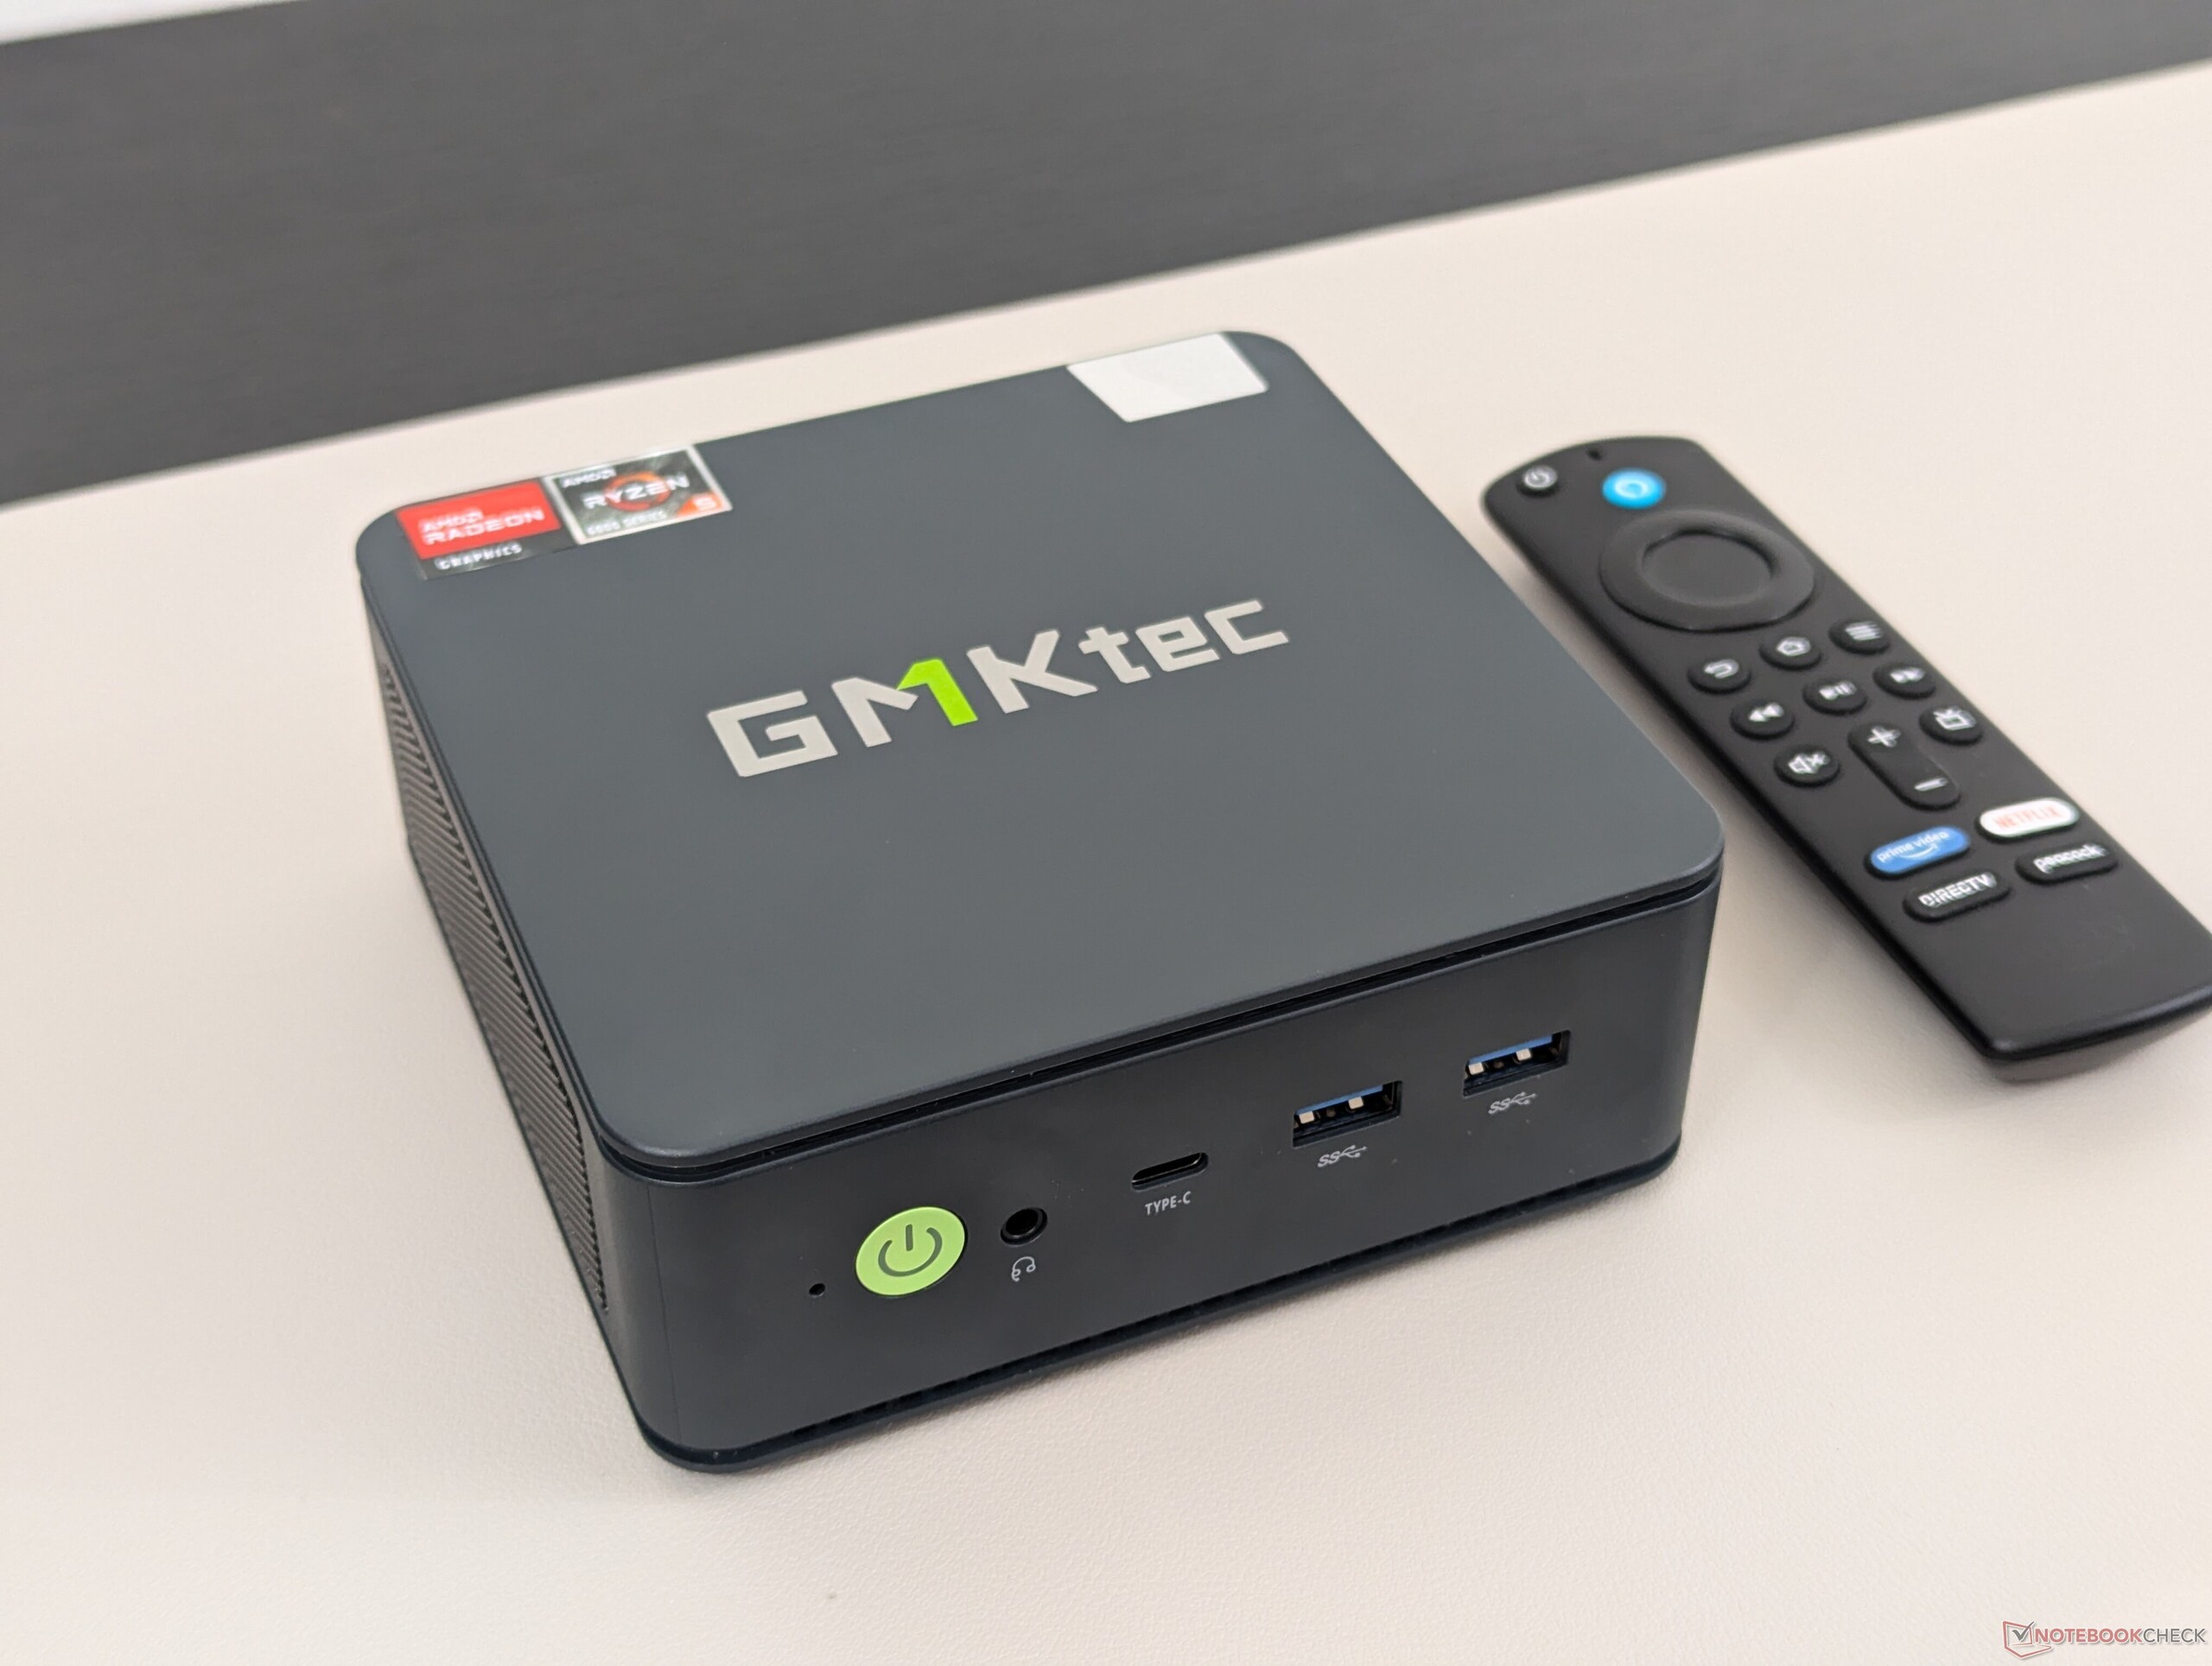
Ausstattung
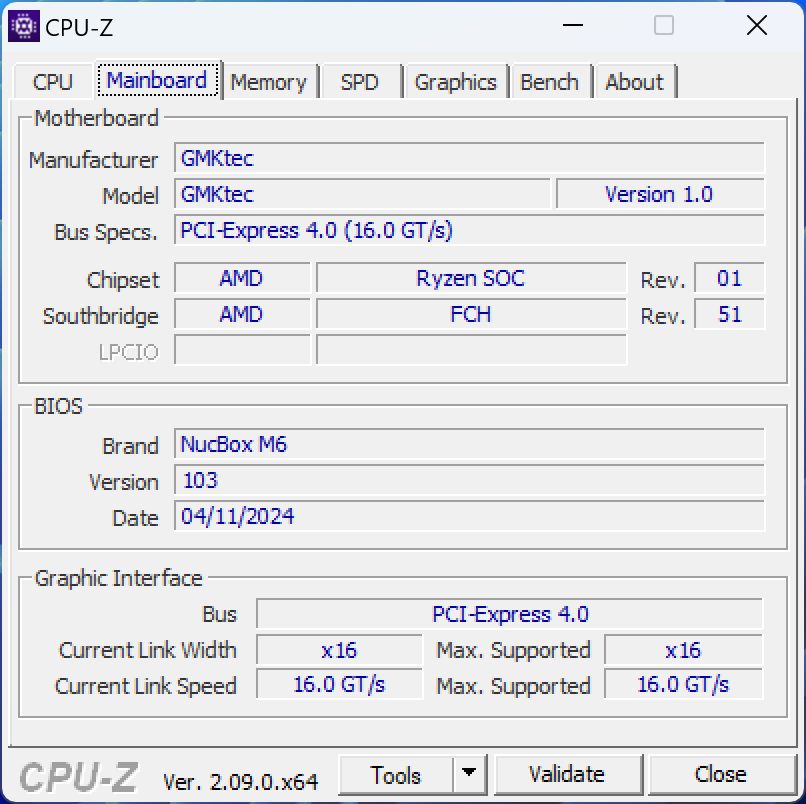
Während die Anschlussoptionen mit der NucBox M5 identisch sind, ist es wichtig zu wissen, dass die M6 entgegen der Herstellerwerbung kein USB4 unterstützt. Der Geräte-Manager listet nur USB-3.2-Unterstützung auf und kein USB4. Power Delivery und DisplayPort über USB-C werden glücklicherweise weiterhin unterstützt.

Kommunikation
Unsere WiFi-Tests zeigen, dass die Leistung mit Wi-Fi 6 schneller ist als mit Wi-Fi 6E, selbst nach mehreren Wiederholungsversuchen. Die Wi-Fi 6E-Geschwindigkeiten sind abnormal langsam, was auf mögliche Antennenprobleme mit dem MediaTek MT7922-Modul in unserem Testgerät hindeutet.
| Networking | |
| iperf3 transmit AXE11000 | |
| GMK NucBox M6 | |
| BOSGAME M1 | |
| GMK NucBox M5 | |
| Beelink SER5 | |
| Intel NUC 13 Pro Kit NUC13ANK | |
| GMK NucBox K6 | |
| iperf3 receive AXE11000 | |
| BOSGAME M1 | |
| GMK NucBox M6 | |
| Beelink SER5 | |
| GMK NucBox M5 | |
| GMK NucBox K6 | |
| Intel NUC 13 Pro Kit NUC13ANK | |
| iperf3 transmit AXE11000 6GHz | |
| Intel NUC 13 Pro Kit NUC13ANK | |
| GMK NucBox M5 | |
| BOSGAME M1 | |
| GMK NucBox K6 | |
| GMK NucBox M6 | |
| iperf3 receive AXE11000 6GHz | |
| Intel NUC 13 Pro Kit NUC13ANK | |
| GMK NucBox M5 | |
| BOSGAME M1 | |
| GMK NucBox K6 | |
| GMK NucBox M6 | |
Wartung
Die obere Abdeckung lässt sich zur einfachen Wartung mit einem Kreuzschlitzschraubendreher entfernen.

Zubehör und Garantie
Die Lieferung umfasst neben den üblichen Handbüchern und dem Netzteil auch eine abnehmbare VESA-Halterung und ein HDMI-Kabel. Beachten Sie, dass USB-C-Netzteile von Drittanbietern ebenfalls verwendet werden können, sofern sie die Stromanforderungen des Mini-PCs erfüllen.
In Deutschland wird die standardmäßige einjährige eingeschränkte Herstellergarantie gewährt.
Performance — Preiswerte CPU
Testbedingungen
We set Windows to Performance mode prior to running the benchmarks below. Wir haben den Performance-Modus in Windows aktiviert, bevor wir die folgenden Benchmarks durchgeführt haben.
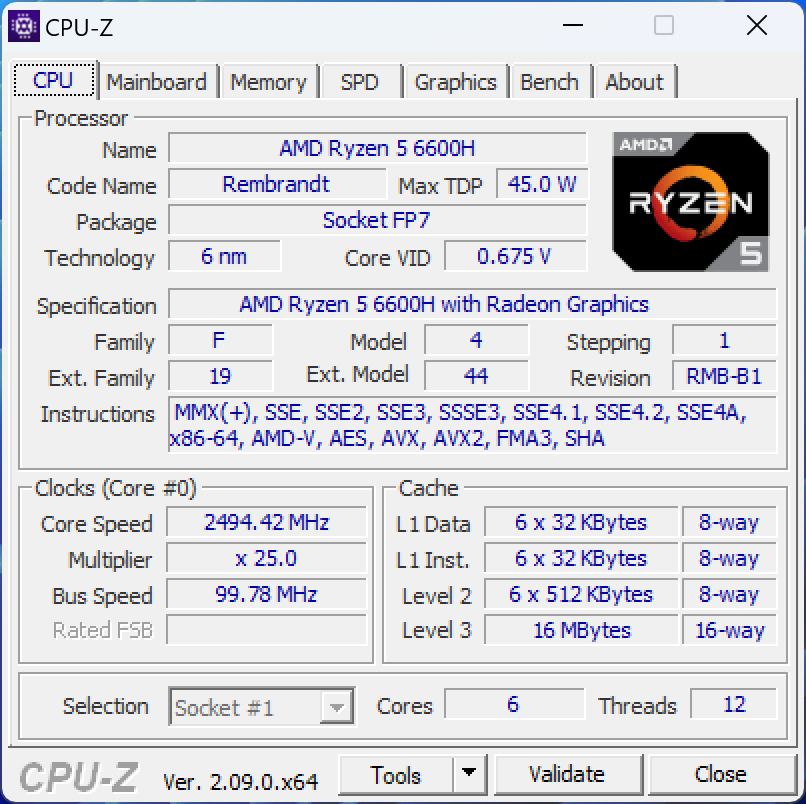
Prozessor
Für einen Mittelklasse-Prozessor aus dem Jahr 2022 bietet der Ryzen 5 6600H nach wie vor eine gute Leistung mit Multi-Thread-Ergebnissen, die zwischen denen der konkurrierenden Core i5-12450H und Core i5-12500H liegen. Nutzer, die sich zwischen der NucBox M5 oder M6 nicht entscheiden können, werden feststellen, dass der Ryzen 5 6600H etwa 60 Prozent schneller ist als der Ryzen 7 5700U.
Cinebench R15 Multi Dauertest
Cinebench R23: Multi Core | Single Core
Cinebench R20: CPU (Multi Core) | CPU (Single Core)
Cinebench R15: CPU Multi 64Bit | CPU Single 64Bit
Blender: v2.79 BMW27 CPU
7-Zip 18.03: 7z b 4 | 7z b 4 -mmt1
Geekbench 6.4: Multi-Core | Single-Core
Geekbench 5.5: Multi-Core | Single-Core
HWBOT x265 Benchmark v2.2: 4k Preset
LibreOffice : 20 Documents To PDF
R Benchmark 2.5: Overall mean
* ... kleinere Werte sind besser
AIDA64: FP32 Ray-Trace | FPU Julia | CPU SHA3 | CPU Queen | FPU SinJulia | FPU Mandel | CPU AES | CPU ZLib | FP64 Ray-Trace | CPU PhotoWorxx
| Performance Rating | |
| BOSGAME M1 | |
| GMK NucBox K6 | |
| GMK NucBox M6 | |
| Durchschnittliche AMD Ryzen 5 6600H | |
| Intel NUC 13 Pro Kit NUC13ANK | |
| Beelink SER5 | |
| GMK NucBox M5 | |
Stresstest
Unter Prime95-Stress erreichte die CPU eine Geschwindigkeit von 4,1 GHz bei 54 W und 78 °C, bevor sie nach wenigen Sekunden auf 3,9 GHz und 50 W zurückfiel und sich stabilisierte. Obwohl die maximale Turbo-Core-Leistung begrenzt ist, ist der Abfall überraschend gering.
Die Kerntemperatur stabilisierte sich bei nur 64 °C, während Witcher 3 lief, was eine typische Spielelast darstellt und mit der langsameren NucBox M5 vergleichbar ist.
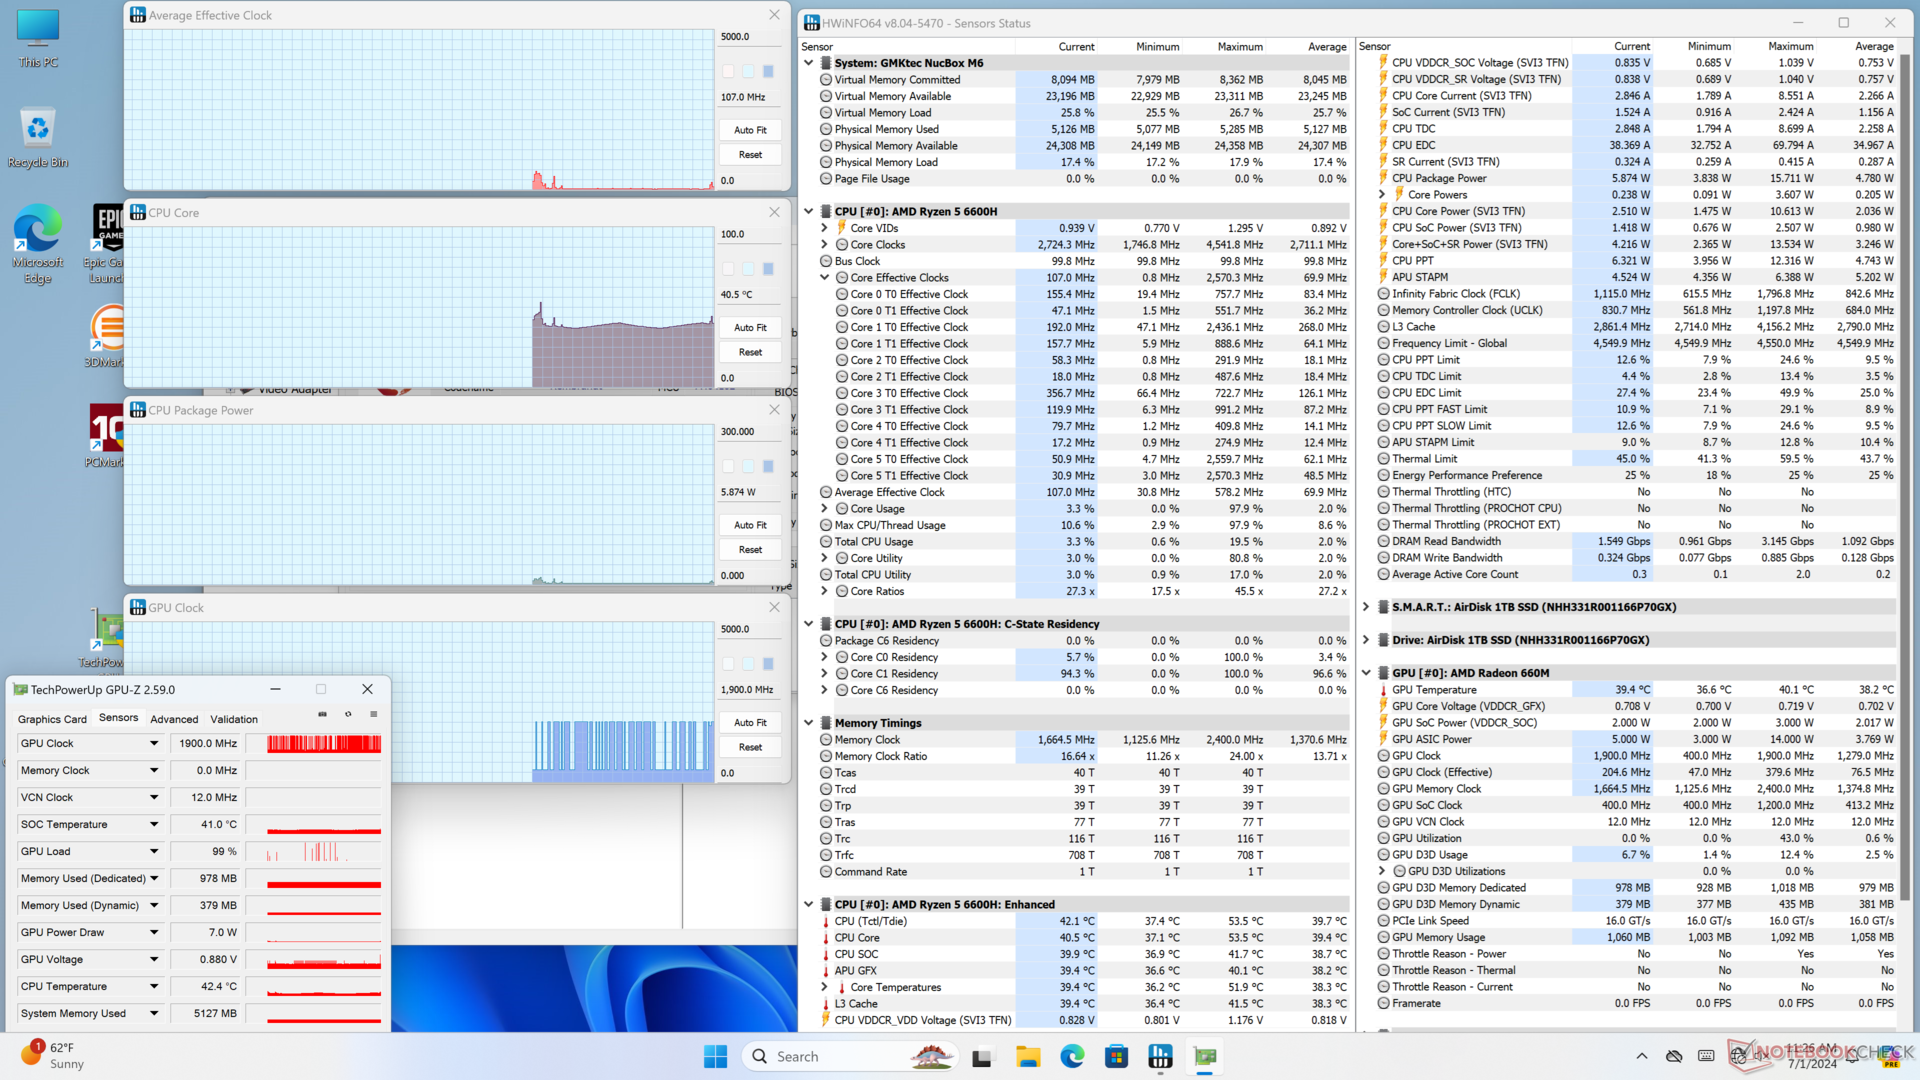
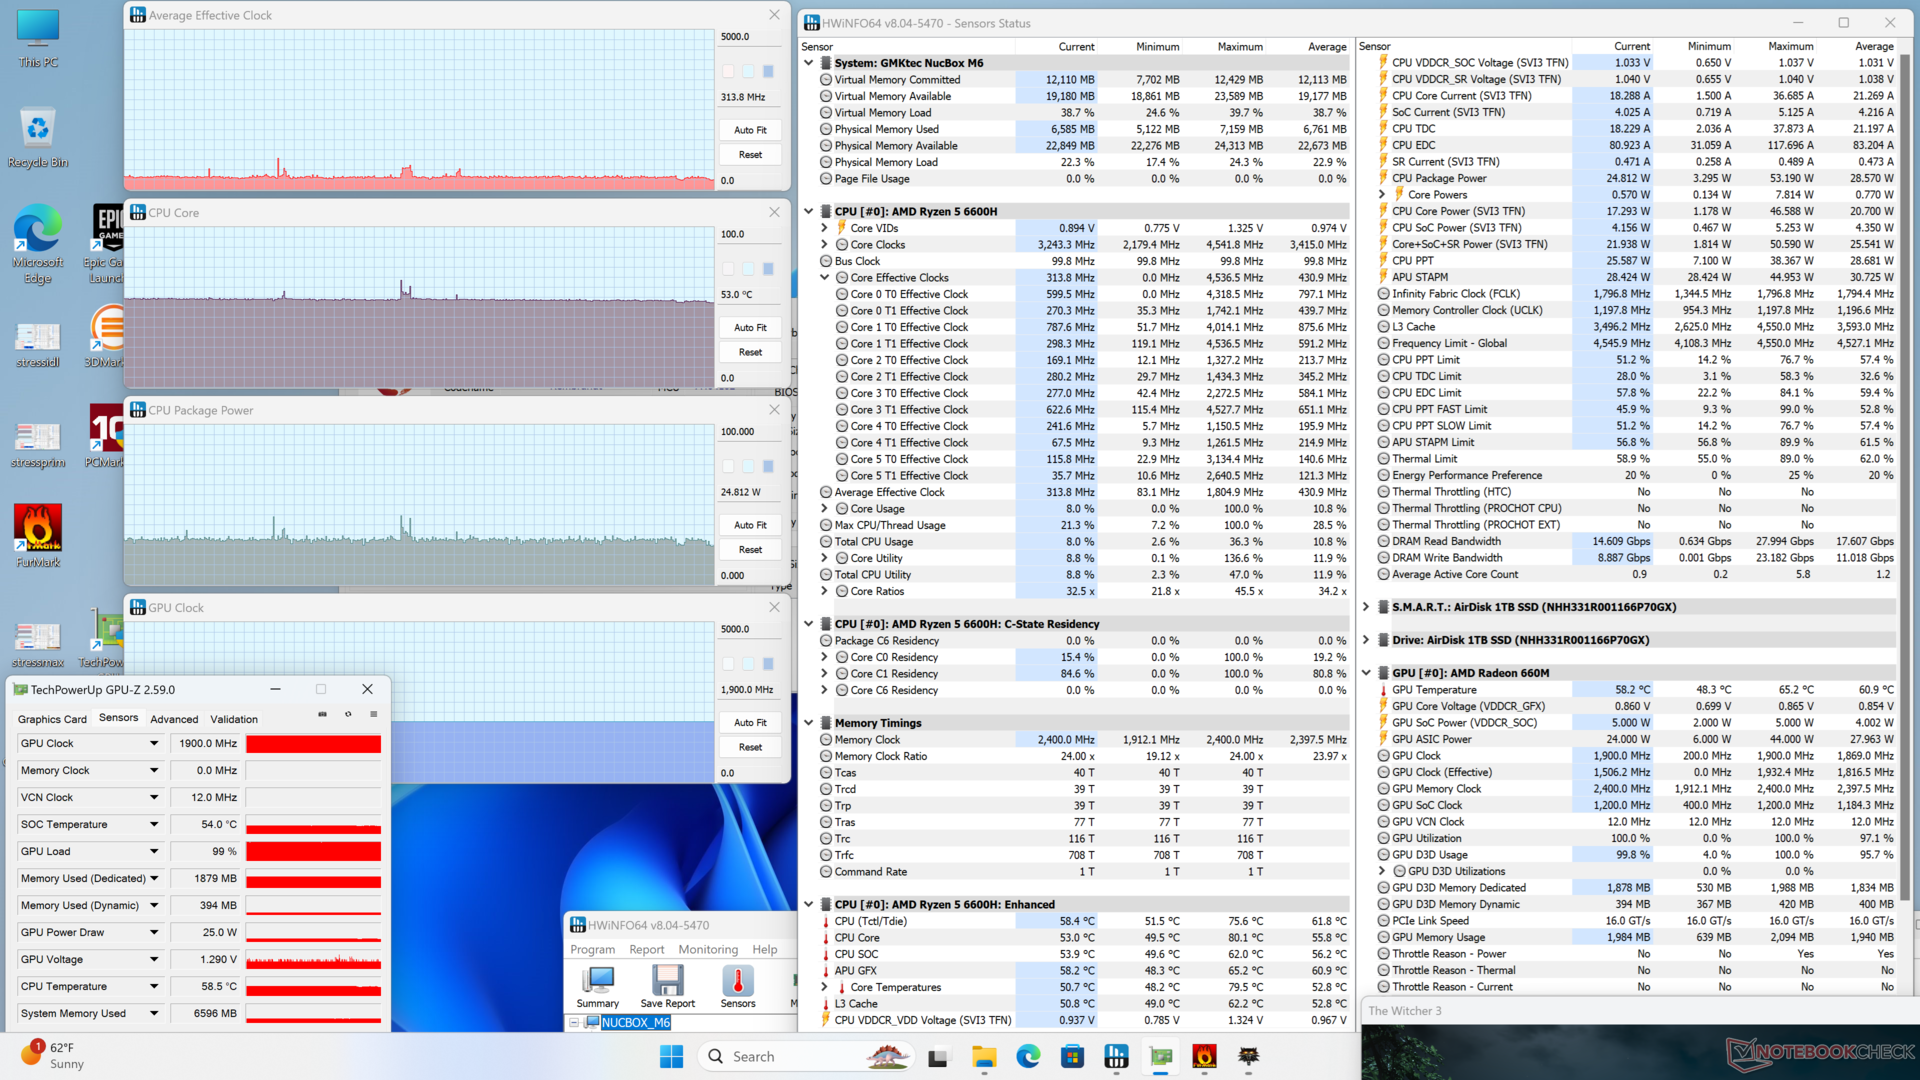

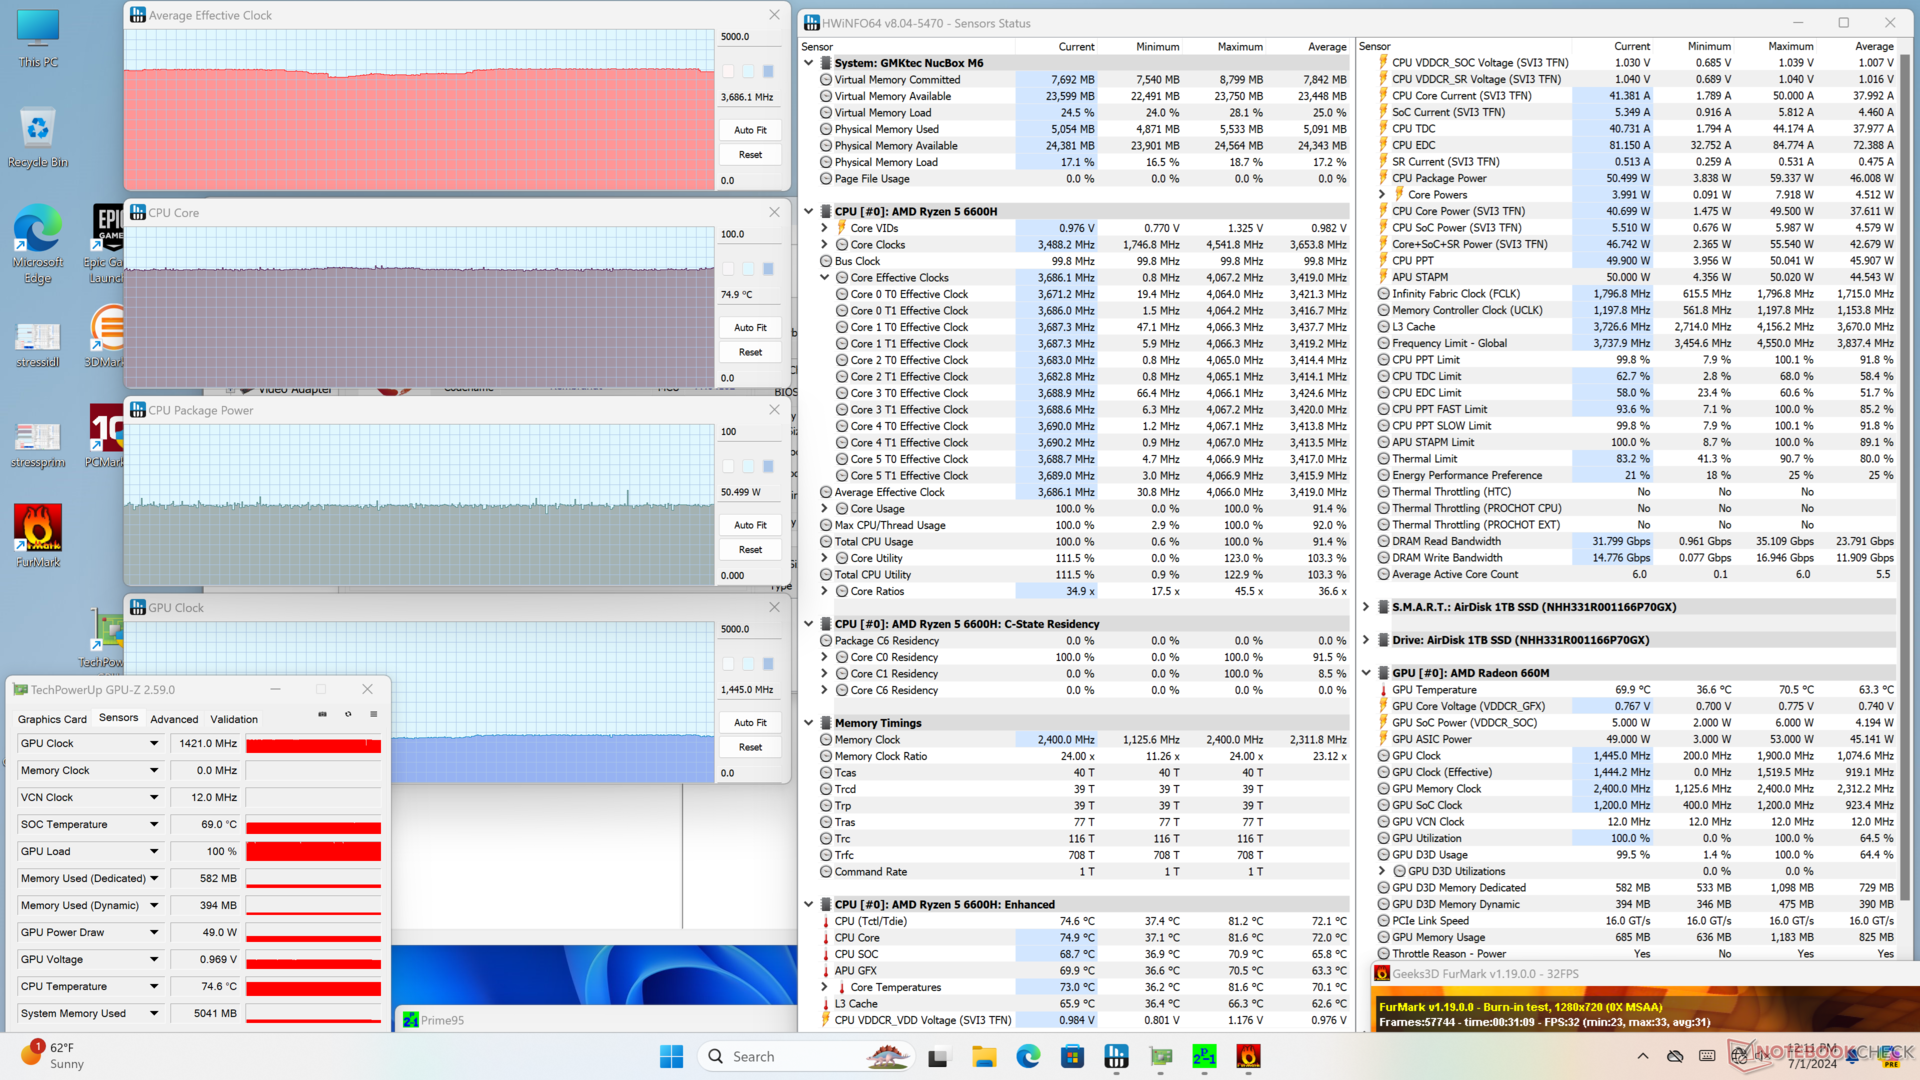
| Durchschnittliche CPU-Takt (GHz) | GPU-Takt (MHz) | Durchschnittliche CPU Temperatur (°C) | |
| System im Leerlauf | -- | -- | 40 |
| Prime95 Stresstest | ~3.9 | -- | 80 |
| Prime95 + FurMark Stresstest | ~3.7 | 1421 | 75 |
| Witcher 3 Stresstest | ~0.3 | 1900 | 54 |
System Performance
CrossMark: Overall | Productivity | Creativity | Responsiveness
WebXPRT 3: Overall
WebXPRT 4: Overall
Mozilla Kraken 1.1: Total
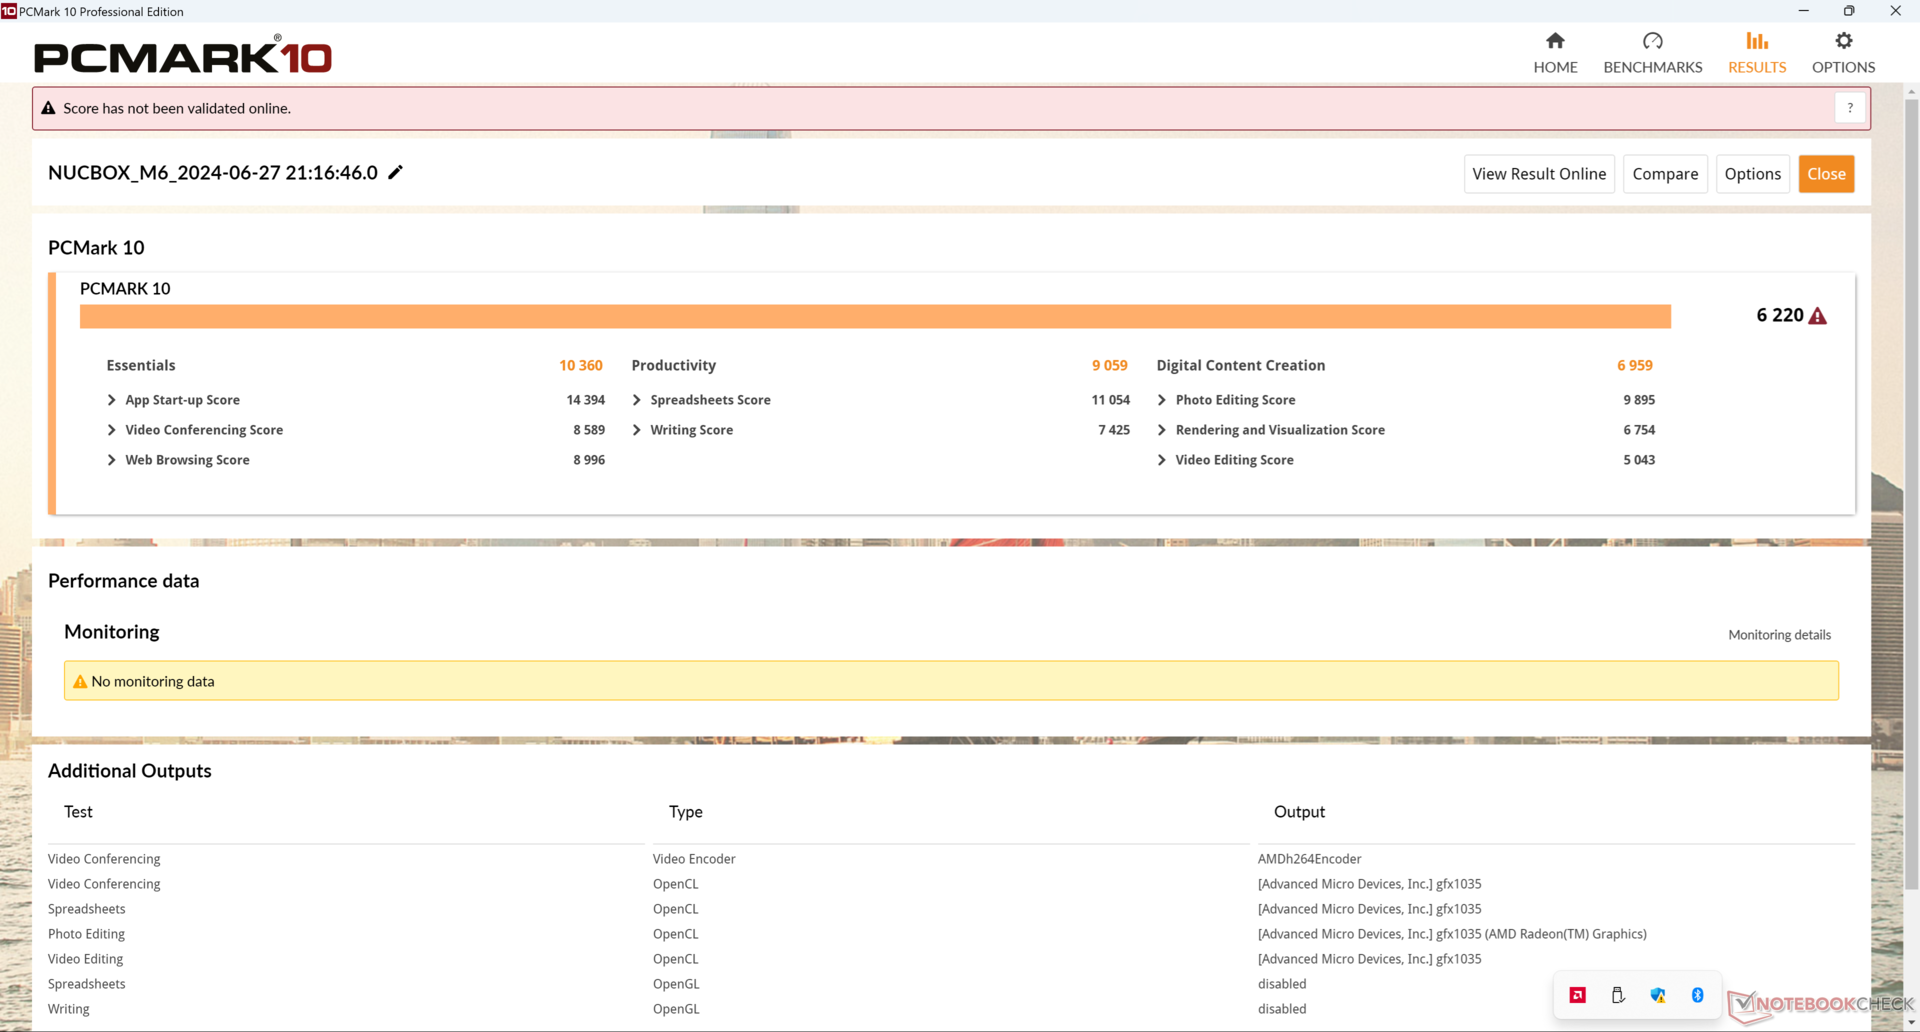
| PCMark 10 / Score | |
| GMK NucBox K6 | |
| BOSGAME M1 | |
| Intel NUC 13 Pro Kit NUC13ANK | |
| GMK NucBox M6 | |
| Durchschnittliche AMD Ryzen 5 6600H, AMD Radeon 660M (n=1) | |
| Beelink SER5 | |
| GMK NucBox M5 | |
* ... kleinere Werte sind besser
| PCMark 10 Score | 6220 Punkte | |
Hilfe | ||
| AIDA64 / Memory Copy | |
| BOSGAME M1 | |
| GMK NucBox K6 | |
| GMK NucBox M6 | |
| Intel NUC 13 Pro Kit NUC13ANK | |
| Durchschnittliche AMD Ryzen 5 6600H (28335 - 50886, n=3) | |
| GMK NucBox M5 | |
| Beelink SER5 | |
* ... kleinere Werte sind besser
DPC-Latenzen
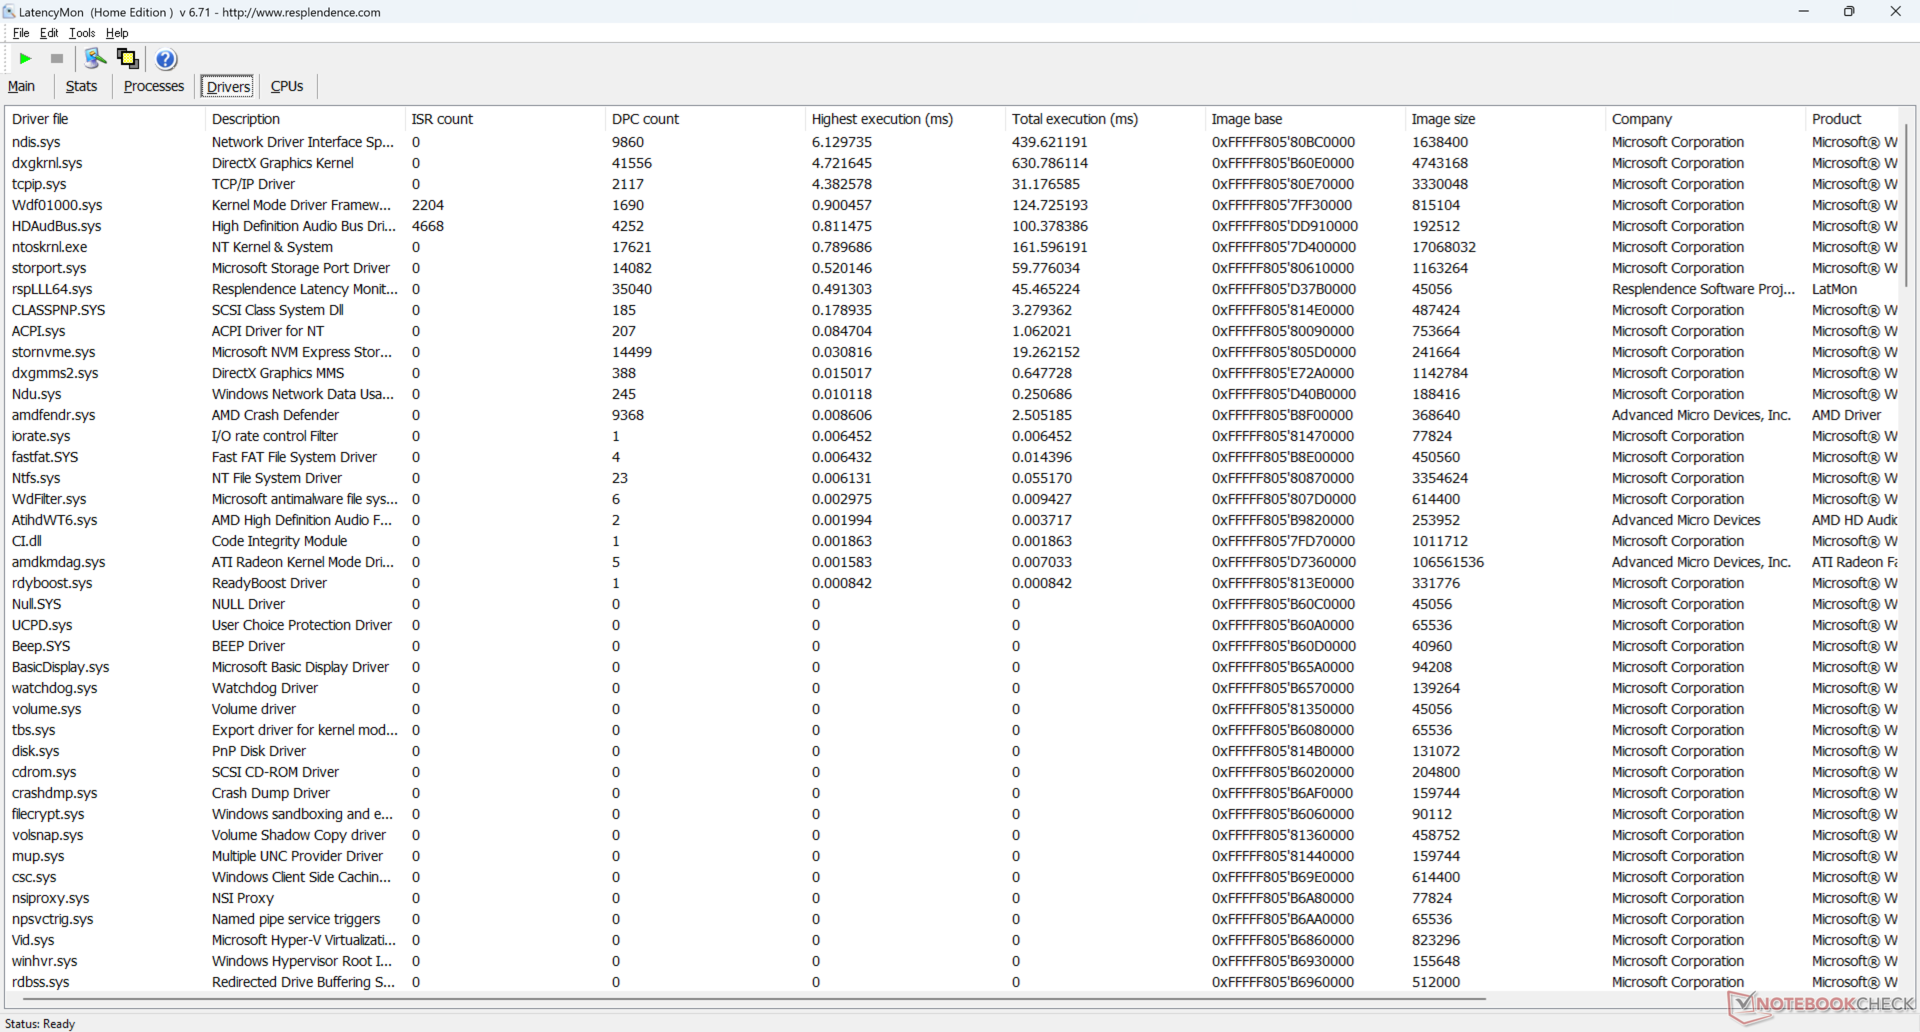
LatencyMon zeigt signifikante DPC-Probleme beim Öffnen mehrerer Browser-Tabs unserer Homepage, selbst nach wiederholten Tests. Auch die Wiedergabe von 4K-Videos bei 60 FPS ist problematisch, wobei über einen Zeitraum von 60 Sekunden 15 abgebrochene Frames aufgezeichnet wurden. Diese Probleme bestanden weiterhin, obwohl Windows- und AMD-Treiber auf die aktuellsten Versionen zum Zeitpunkt der Überprüfung aktualisiert wurden.
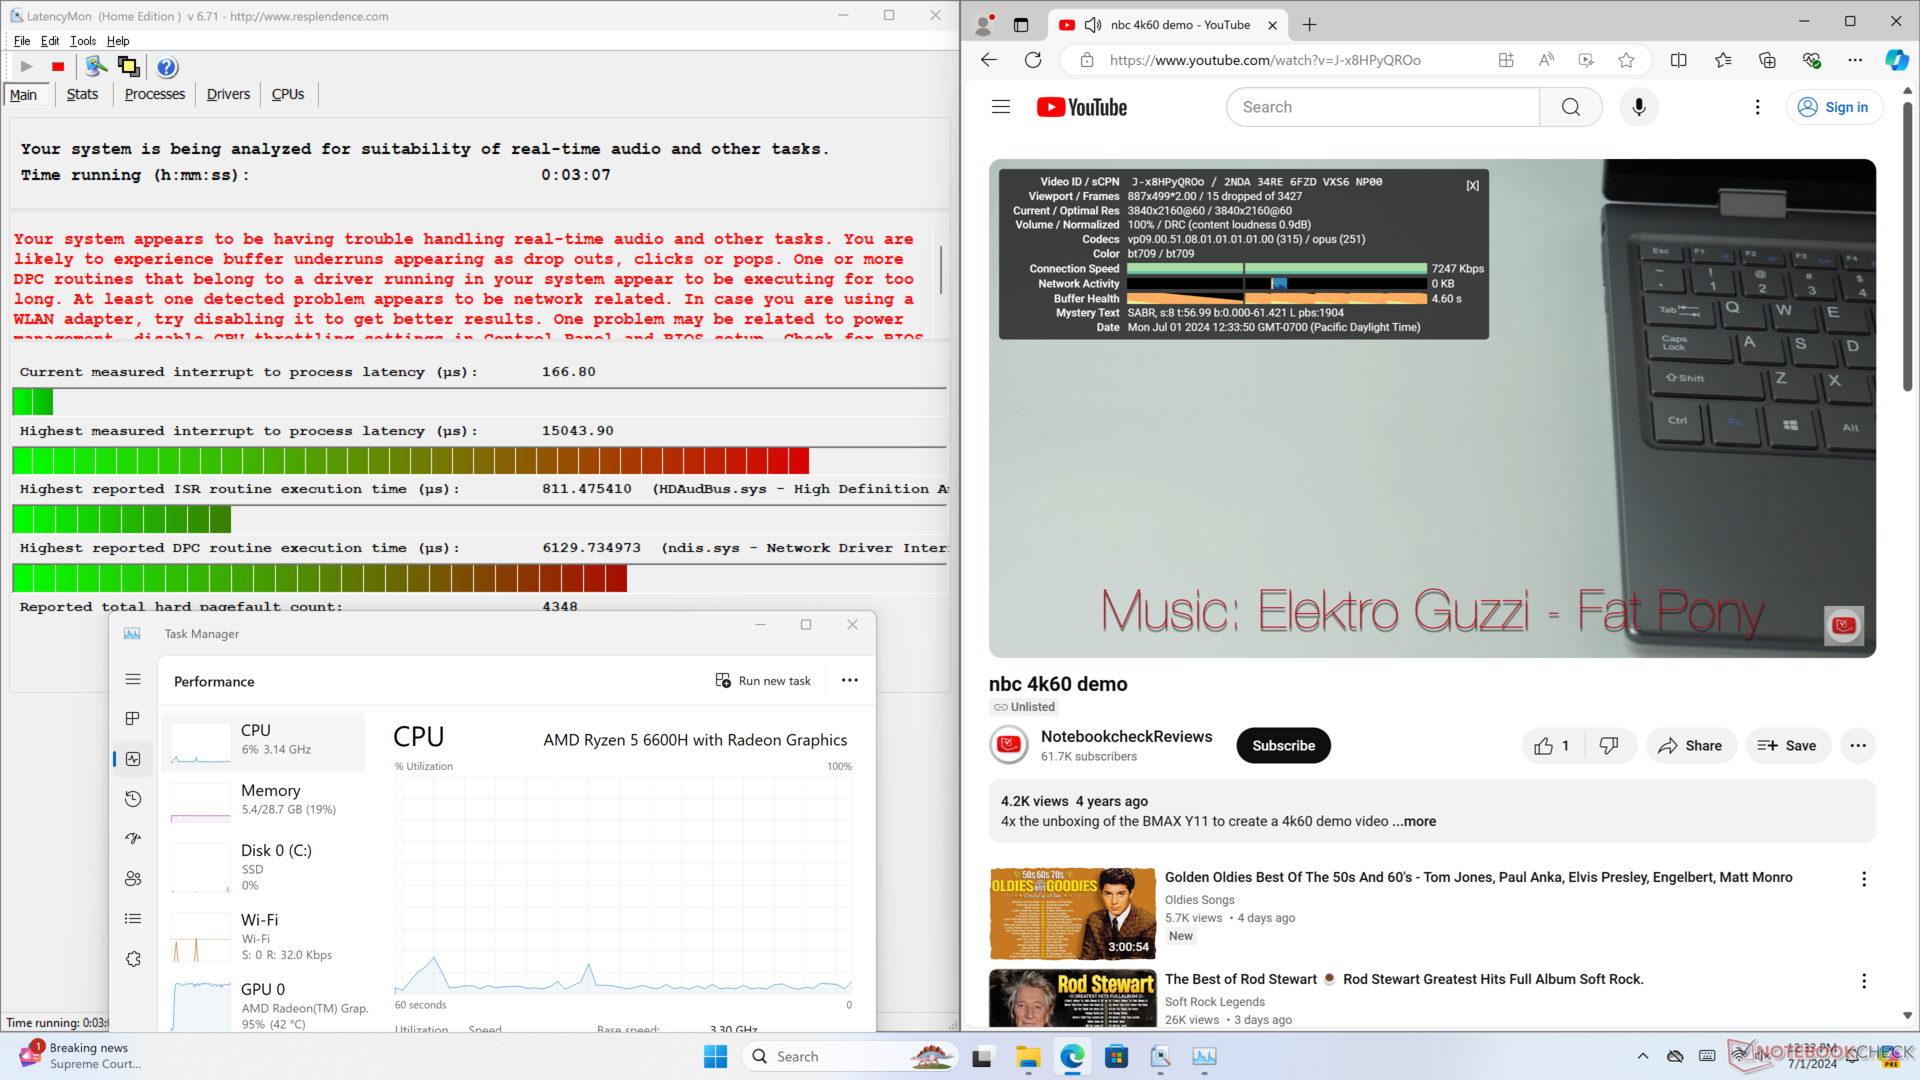
| DPC Latencies / LatencyMon - interrupt to process latency (max), Web, Youtube, Prime95 | |
| GMK NucBox M6 | |
| GMK NucBox K6 | |
| GMK NucBox M5 | |
| BOSGAME M1 | |
| Intel NUC 13 Pro Kit NUC13ANK | |
| Beelink SER5 | |
* ... kleinere Werte sind besser
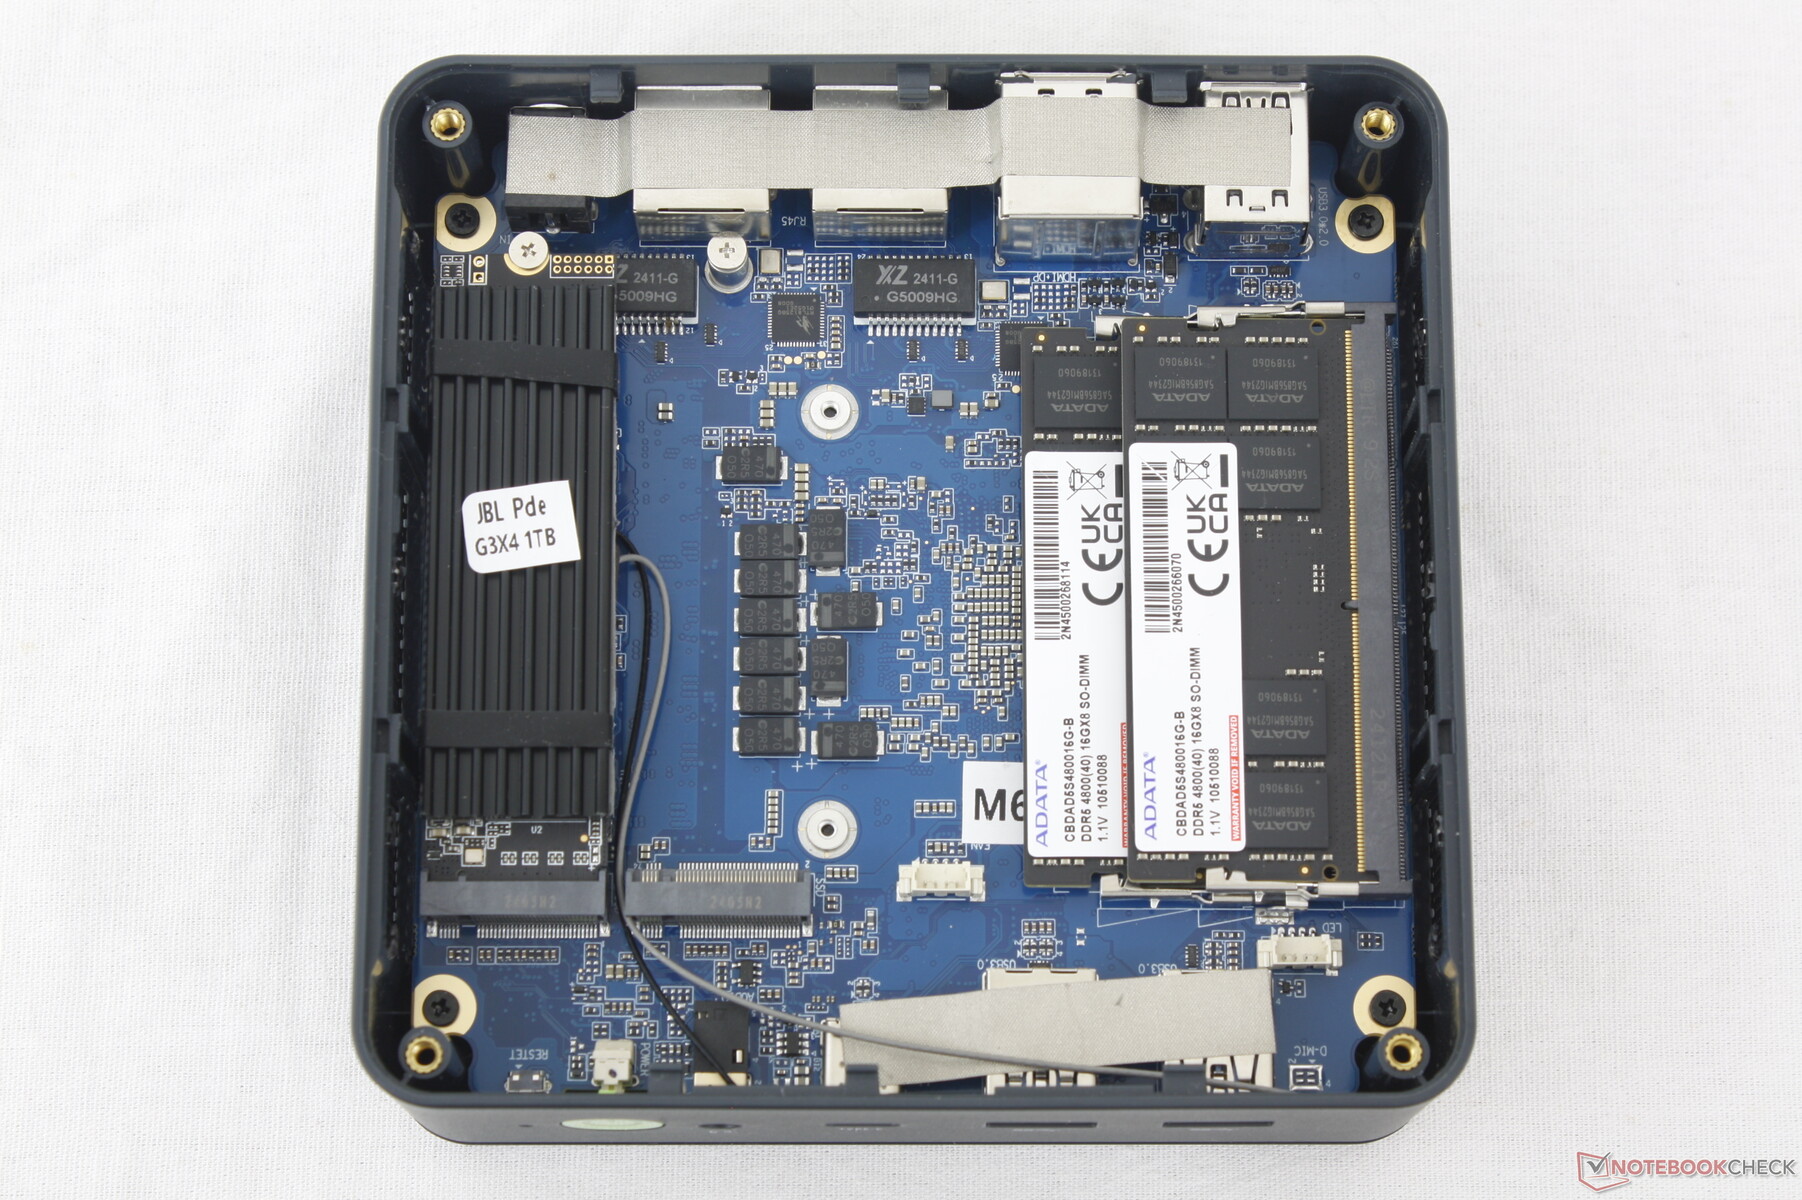
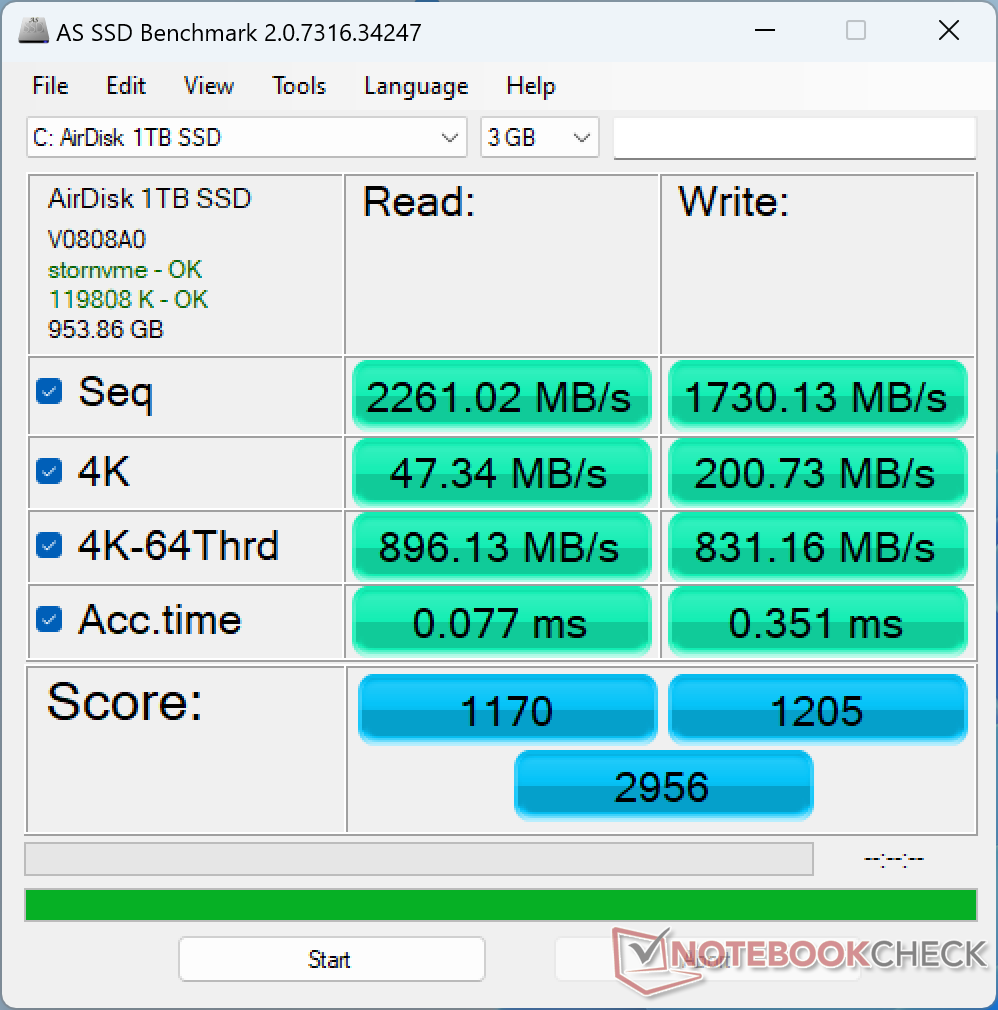
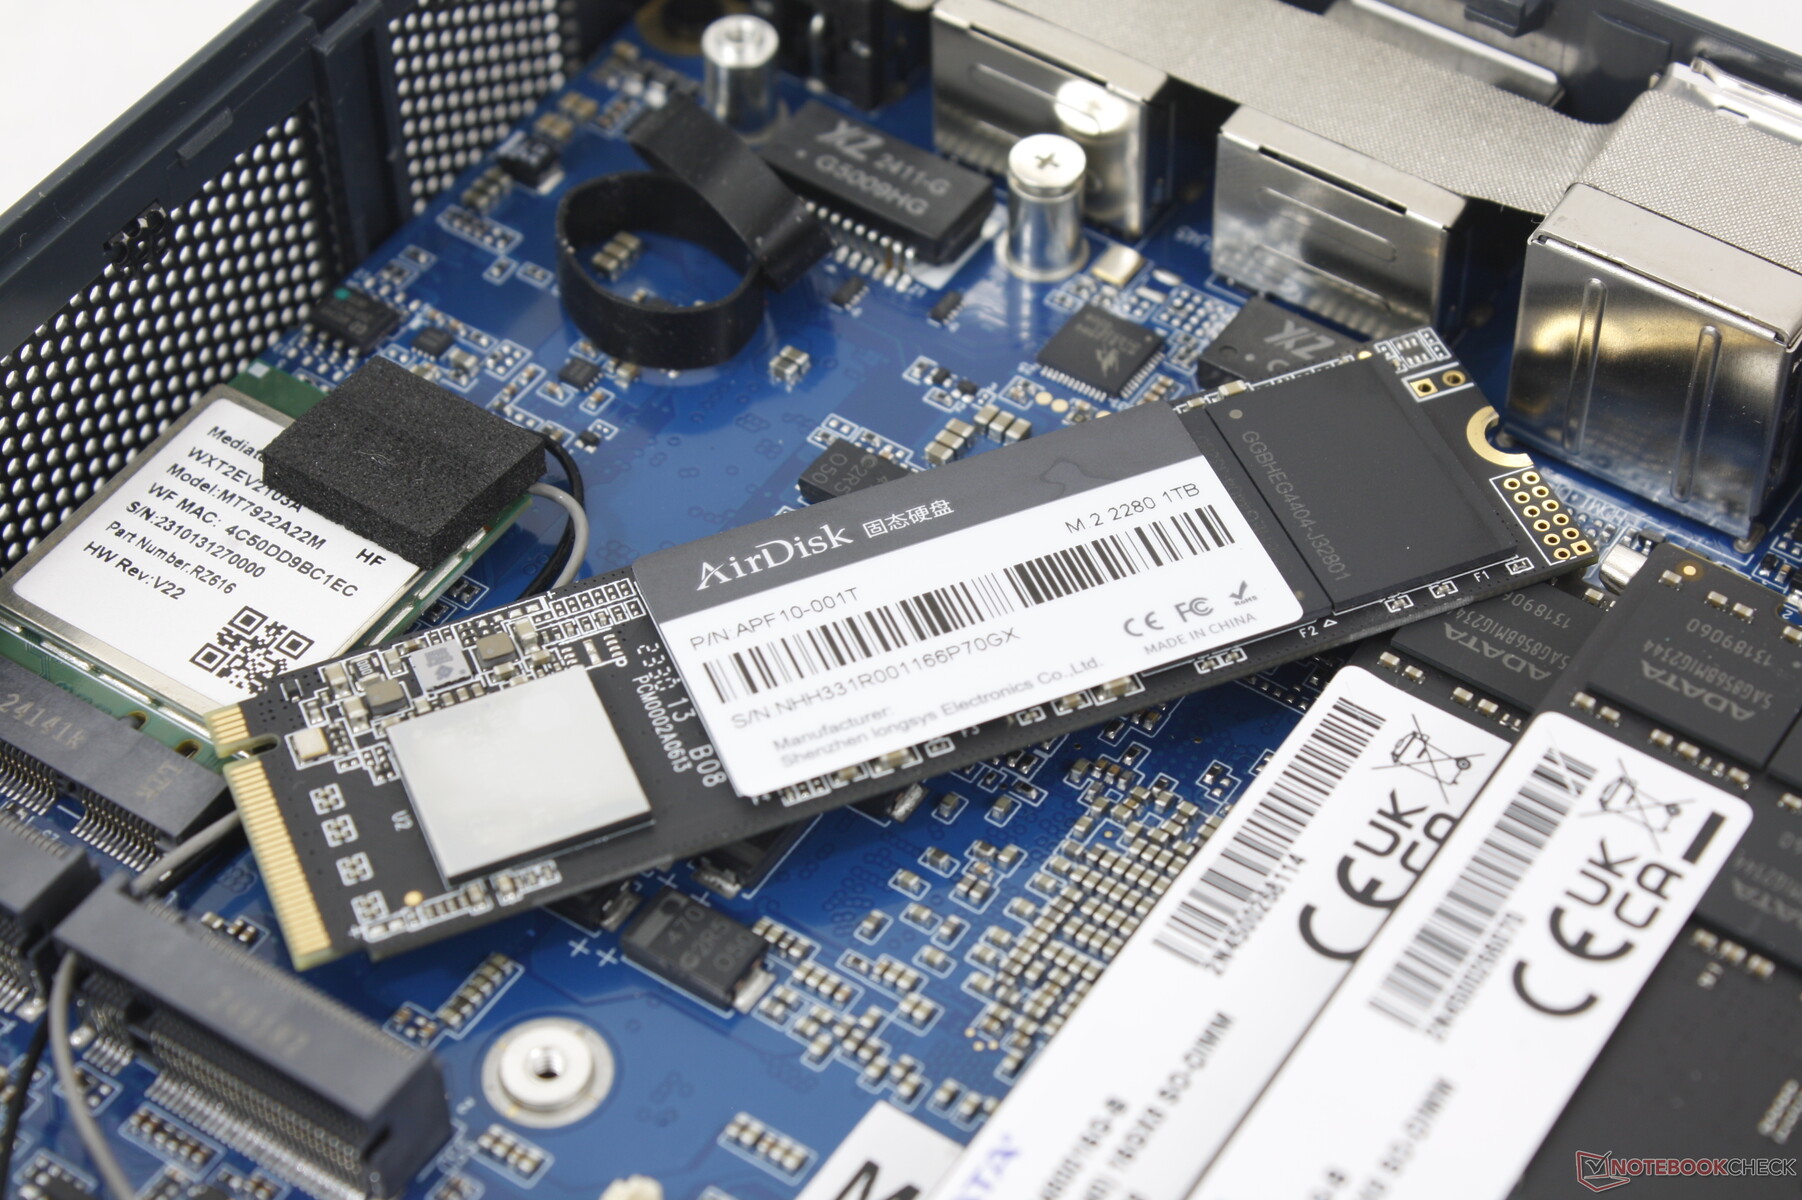
Massenspeicher
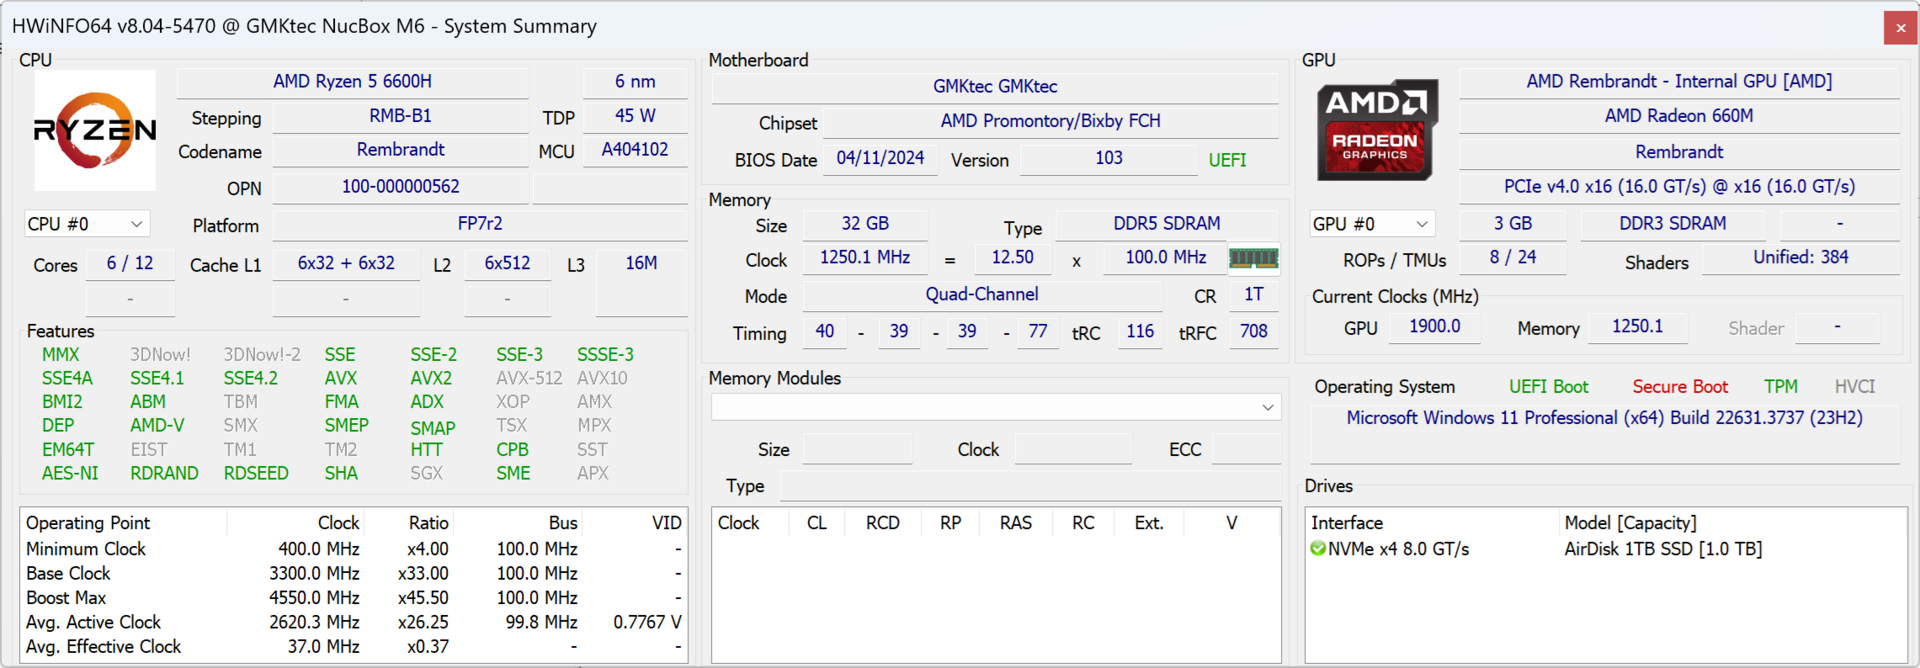
Das System wird mit einer PCIe3 x4 NVMe-SSD von AirDisk statt einer häufigeren PCIe4-Lösung geliefert, vermutlich zur Kostenersparnis. Die mittelklassige SSD bietet eine stabile Lesegeschwindigkeit von 2600 MB/s, was in Anbetracht der CPU, mit der sie verbunden ist, ausreichend ist.
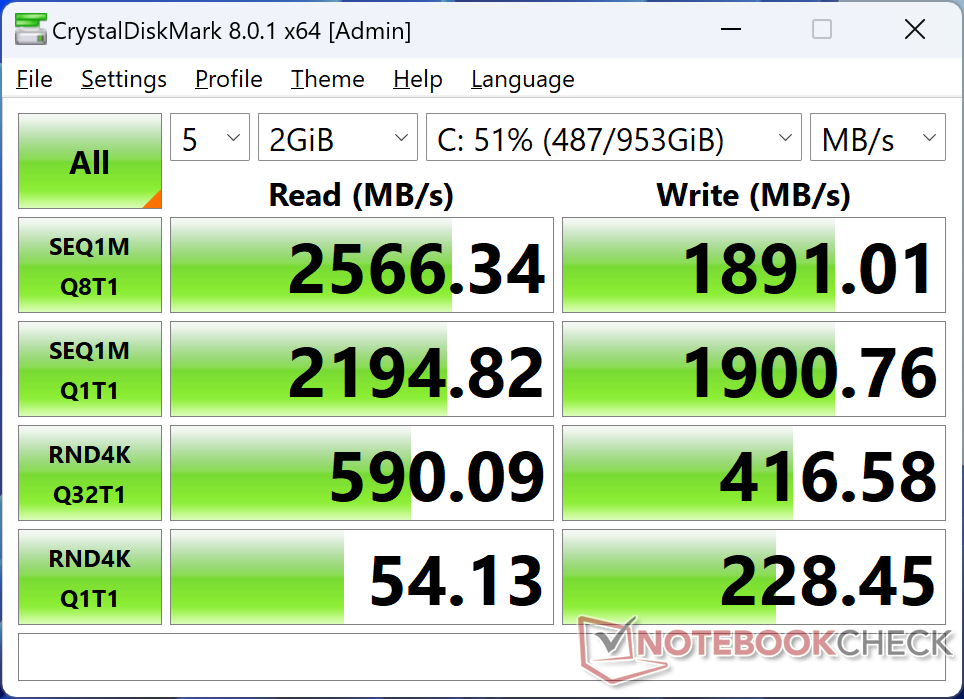

| Drive Performance Rating - Percent | |
| GMK NucBox K6 | |
| Intel NUC 13 Pro Kit NUC13ANK | |
| Beelink SER5 | |
| BOSGAME M1 | |
| GMK NucBox M5 | |
| GMK NucBox M6 | |
* ... kleinere Werte sind besser
Dauerleistung Lesen: DiskSpd Read Loop, Queue Depth 8
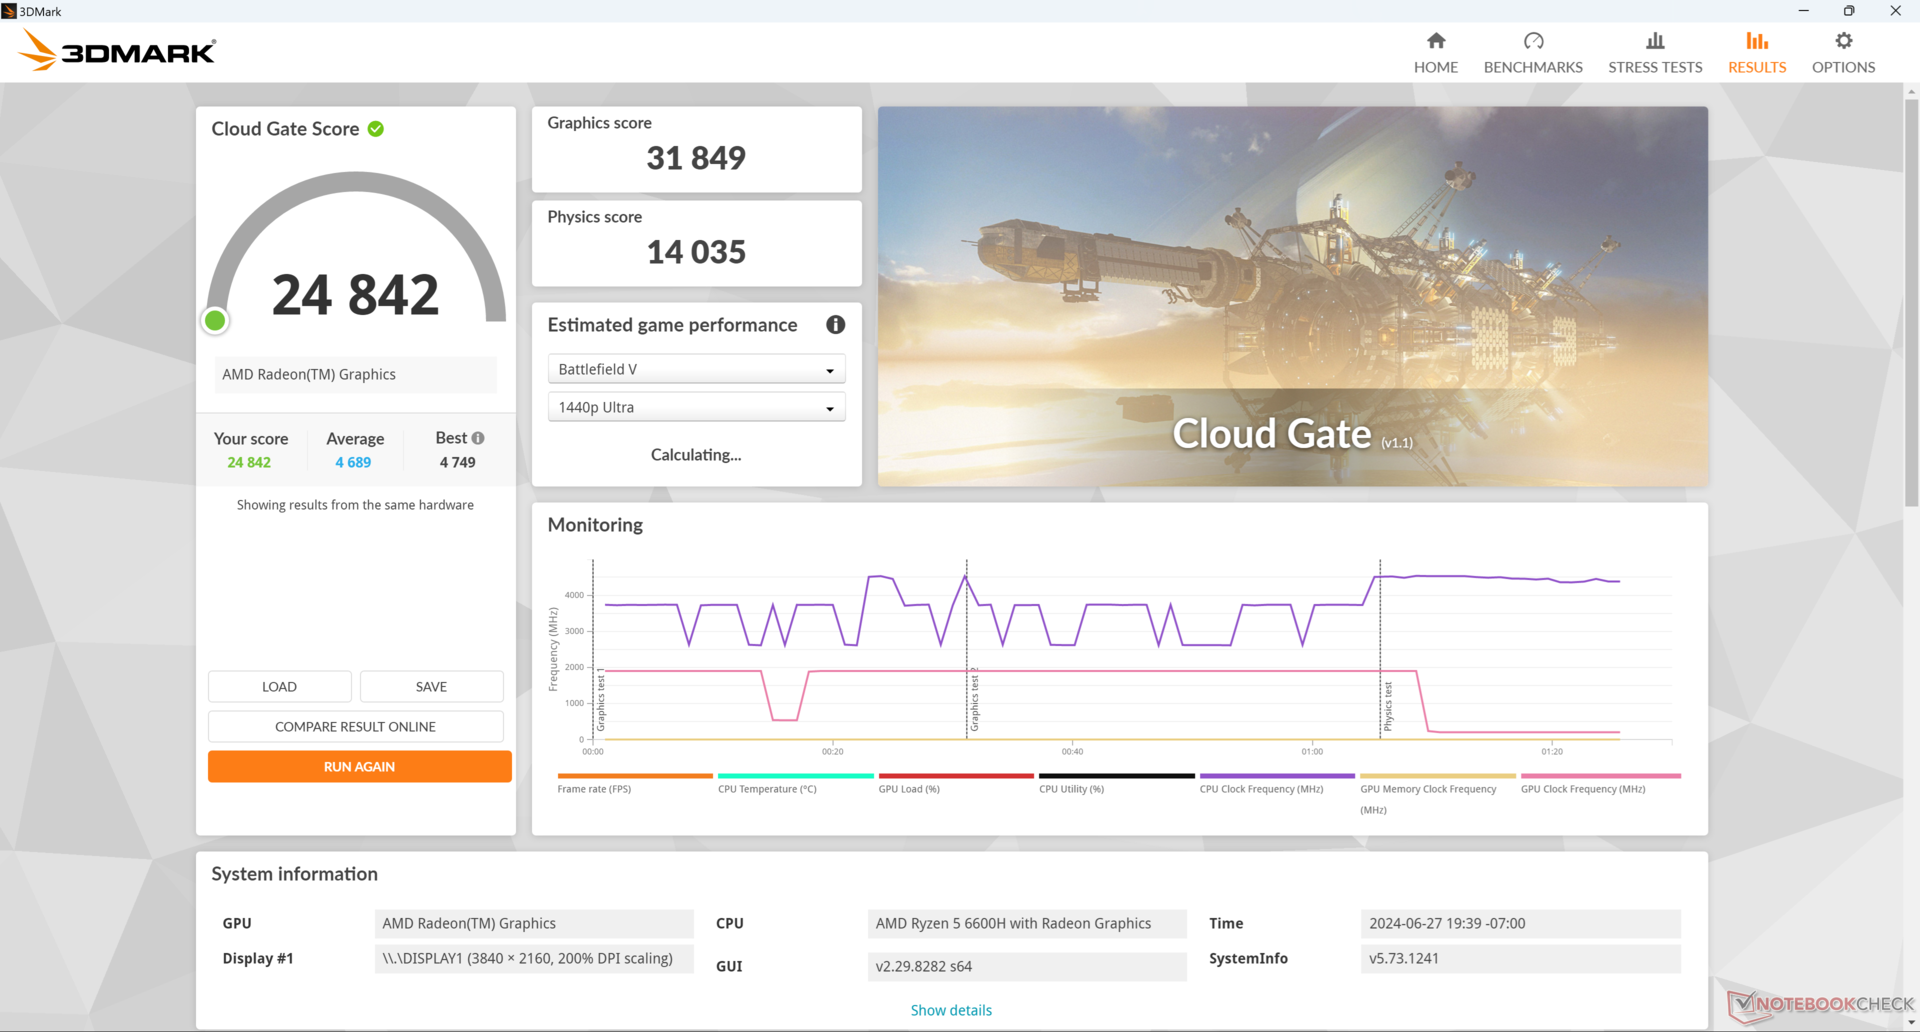
GPU Performance — Die Radeon 660M zeigt in den meisten Spielen Probleme
Die Radeon 660M ist etwa 35 Prozent langsamer als die Radeon 680M und befindet sich damit ungefähr auf dem Niveau der häufigeren Iris Xe 96 EUs. Obwohl sie für die meisten Spiele nicht besonders geeignet ist, stellt sie dennoch einen respektablen Fortschritt gegenüber der Radeon RX Vega 8 auf älteren Zen-Prozessoren dar.
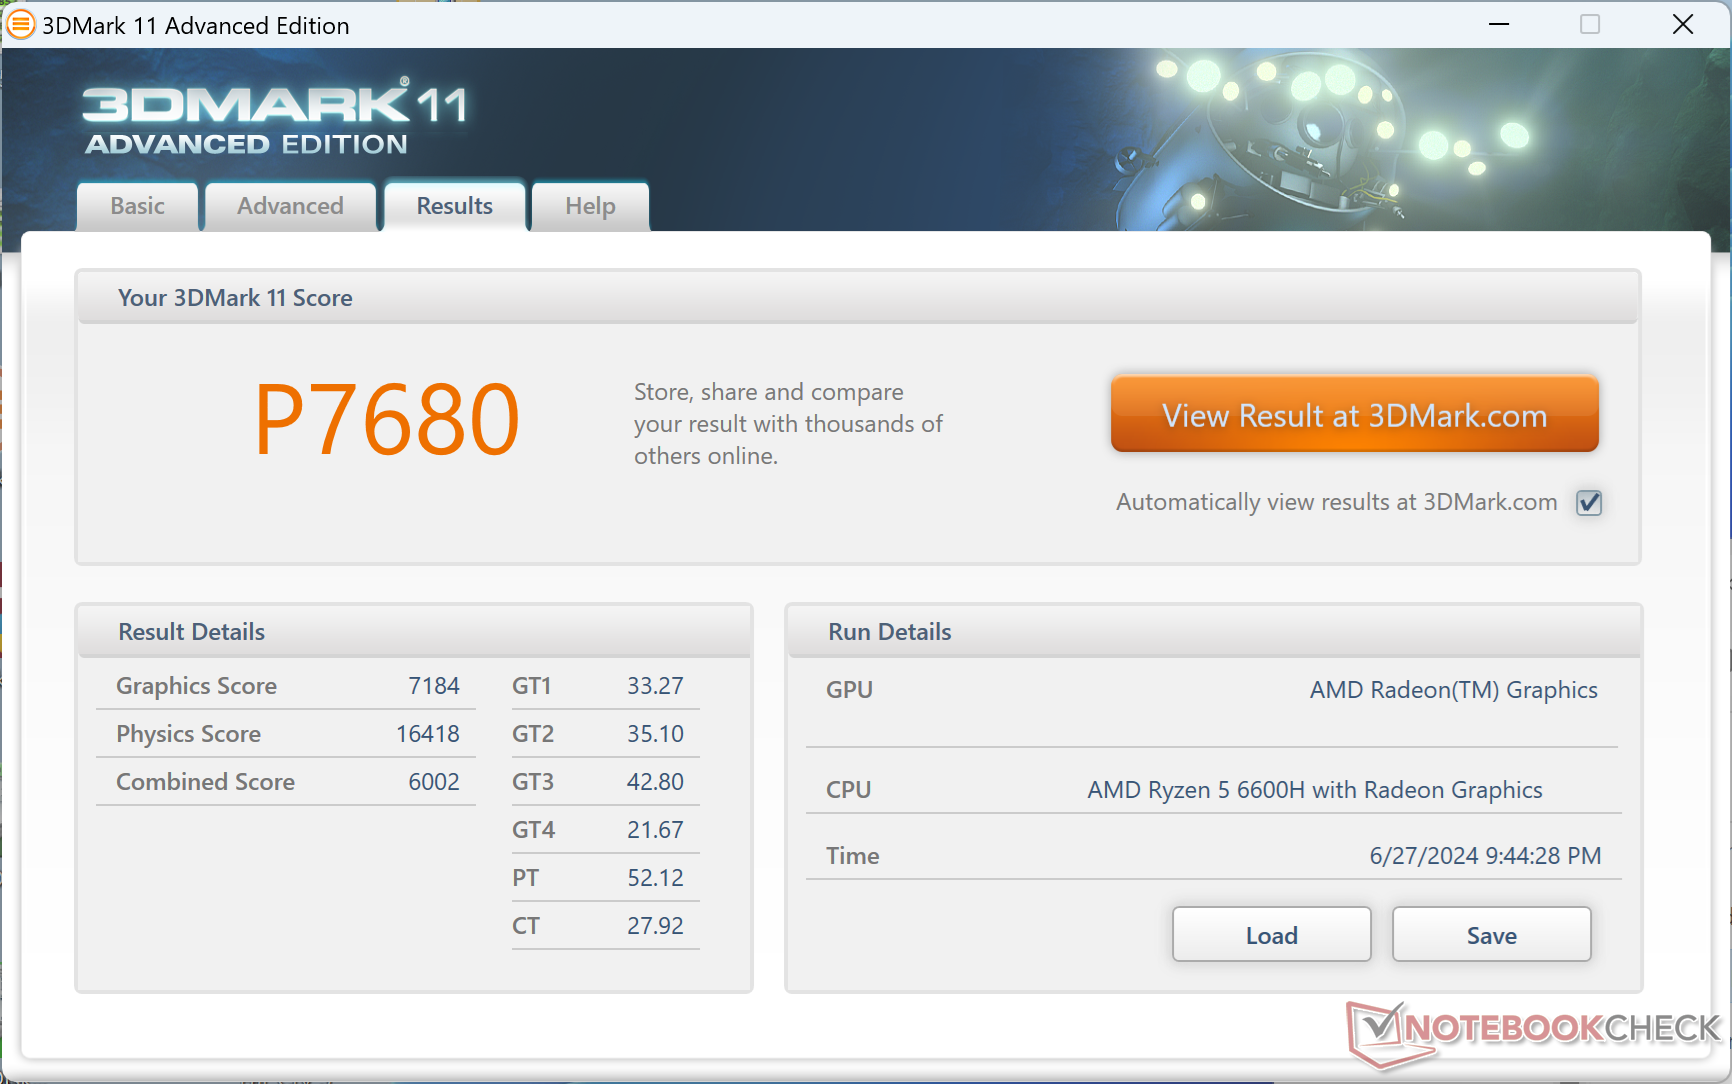
| 3DMark 11 Performance | 7680 Punkte | |
| 3DMark Cloud Gate Standard Score | 24842 Punkte | |
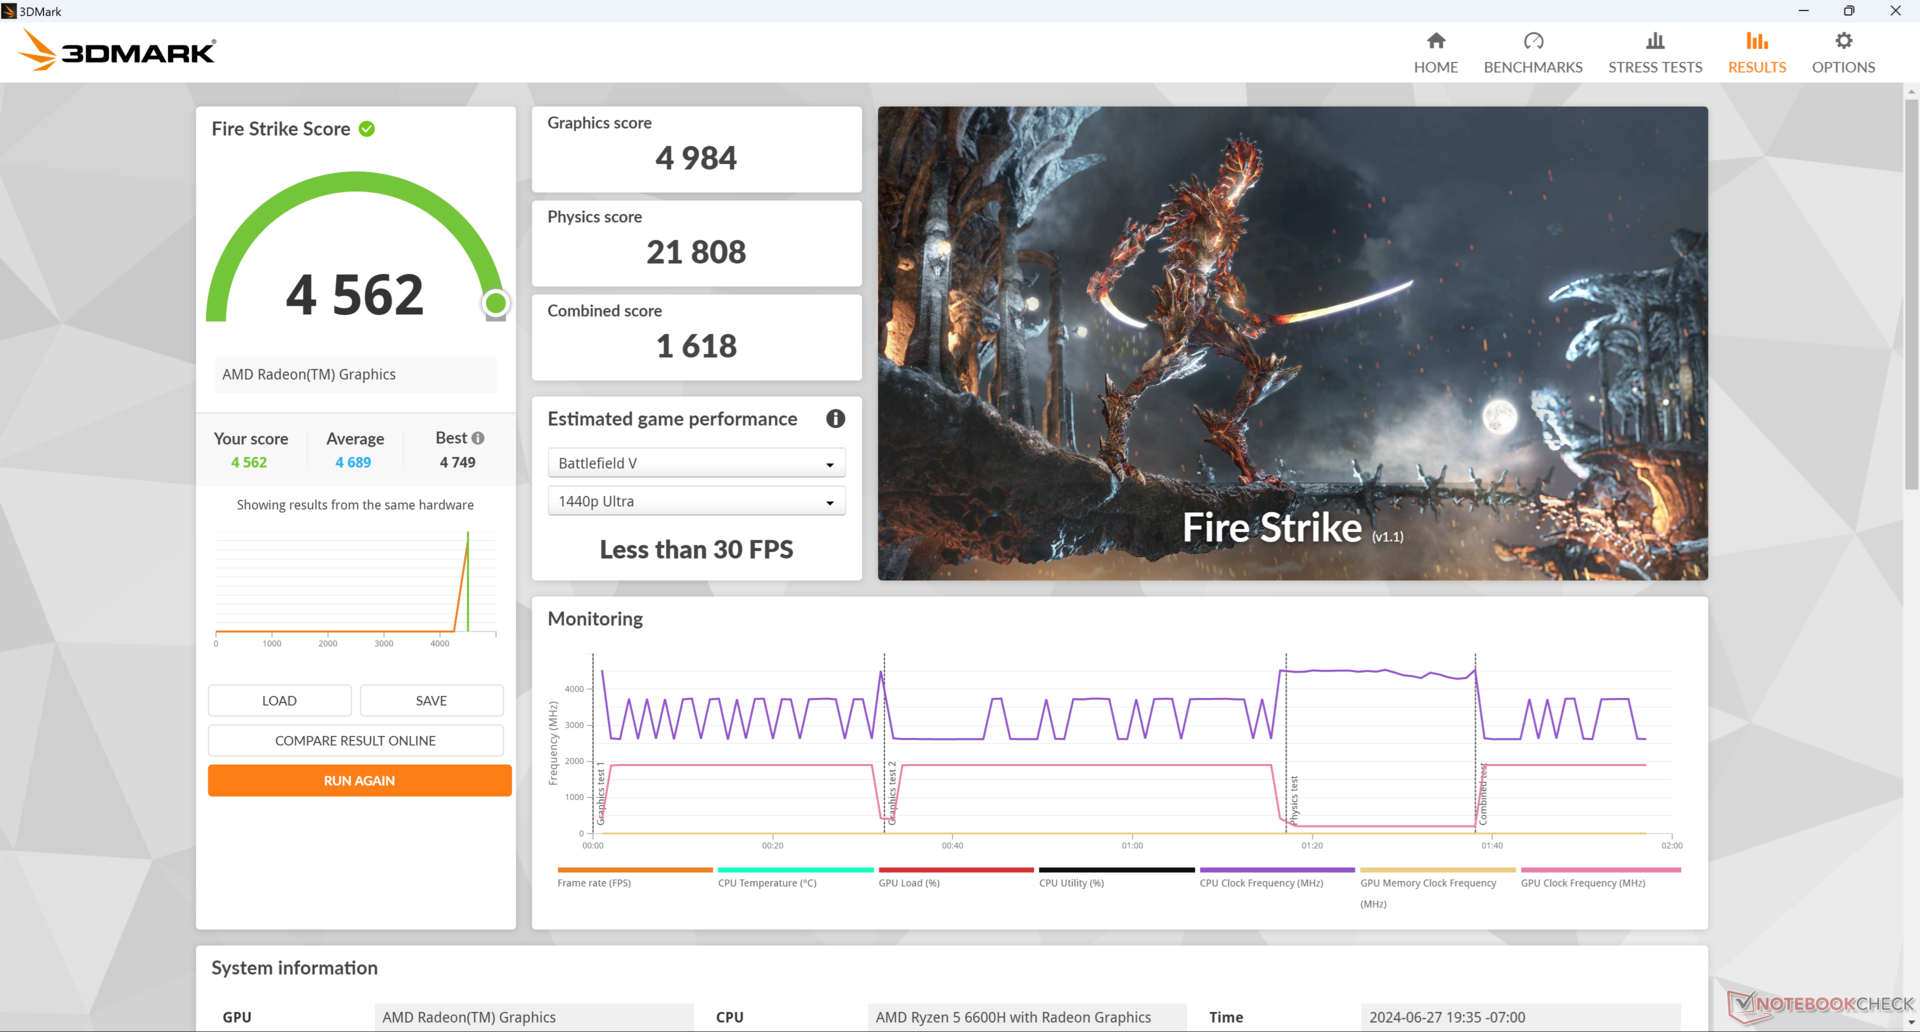
| 3DMark Fire Strike Score | 4562 Punkte | |
| 3DMark Time Spy Score | 1793 Punkte | |
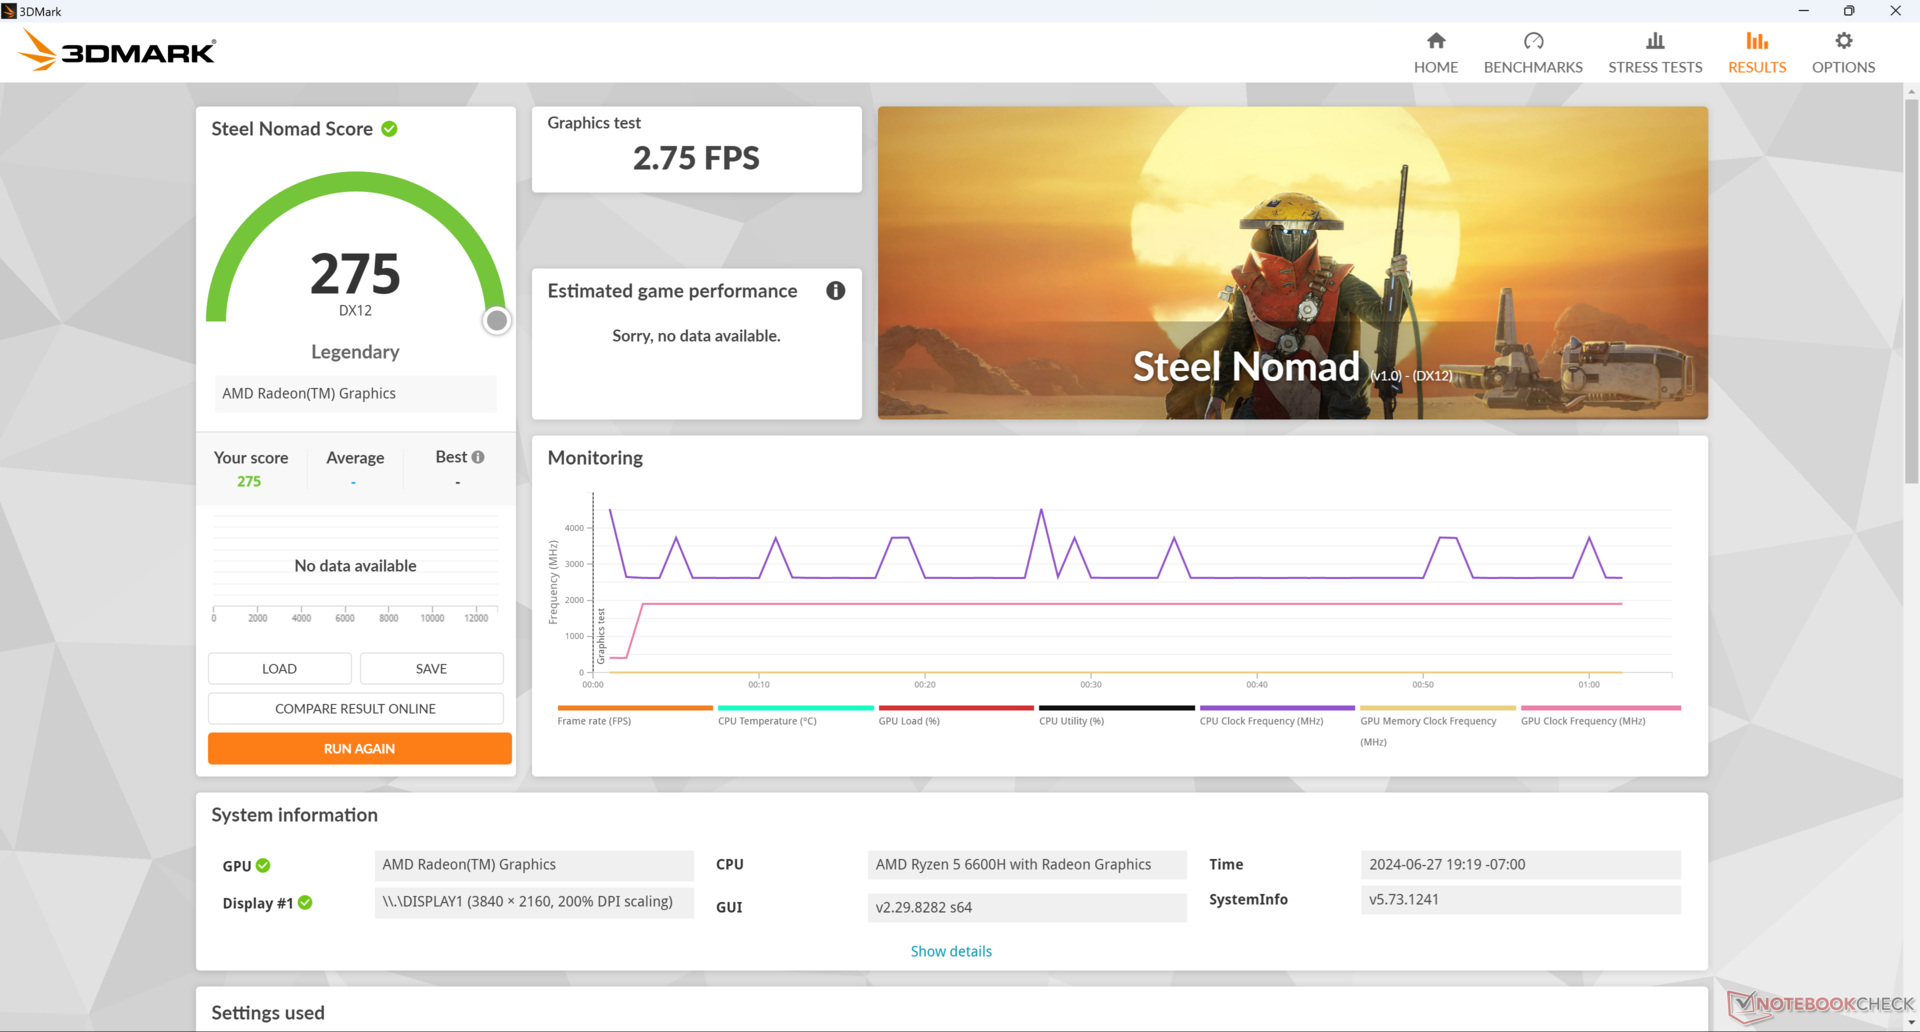
| 3DMark Steel Nomad Score | 275 Punkte | |
Hilfe | ||
* ... kleinere Werte sind besser
| Performance Rating - Percent | |
| BOSGAME M1 | |
| GMK NucBox K6 | |
| GMK NucBox M6 | |
| Intel NUC 13 Pro Kit NUC13ANK -2! | |
| GMK NucBox M5 | |
| Beelink SER5 | |
| The Witcher 3 | |
| 1024x768 Low Graphics & Postprocessing | |
| BOSGAME M1 | |
| GMK NucBox K6 | |
| Intel NUC 13 Pro Kit NUC13ANK | |
| GMK NucBox M6 | |
| Durchschnittliche AMD Radeon 660M (32.2 - 98.2, n=8) | |
| GMK NucBox M5 | |
| Beelink SER5 | |
| 1366x768 Medium Graphics & Postprocessing | |
| BOSGAME M1 | |
| GMK NucBox K6 | |
| GMK NucBox M6 | |
| Durchschnittliche AMD Radeon 660M (40.2 - 58.5, n=7) | |
| GMK NucBox M5 | |
| Beelink SER5 | |
| 1920x1080 High Graphics & Postprocessing (Nvidia HairWorks Off) | |
| BOSGAME M1 | |
| GMK NucBox K6 | |
| Intel NUC 13 Pro Kit NUC13ANK | |
| GMK NucBox M6 | |
| Durchschnittliche AMD Radeon 660M (18.5 - 28.6, n=8) | |
| GMK NucBox M5 | |
| Beelink SER5 | |
| 1920x1080 Ultra Graphics & Postprocessing (HBAO+) | |
| BOSGAME M1 | |
| GMK NucBox K6 | |
| GMK NucBox M6 | |
| Intel NUC 13 Pro Kit NUC13ANK | |
| Durchschnittliche AMD Radeon 660M (12.3 - 17.9, n=8) | |
| GMK NucBox M5 | |
| Beelink SER5 | |
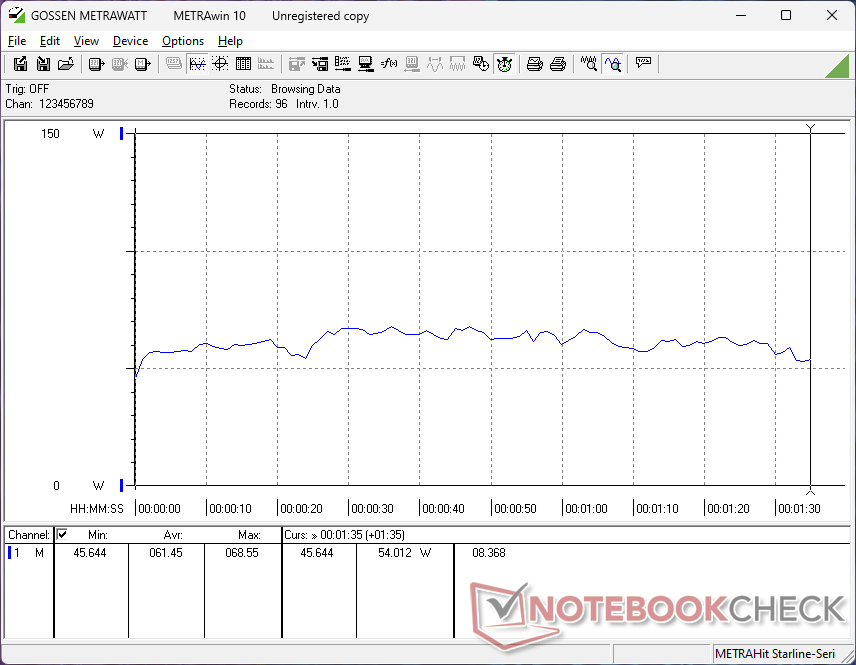
Der Leerlauf von Witcher 3 zeigt Probleme bei der Aufrechterhaltung konstanter Bildraten, was möglicherweise auf eine unzureichende Handhabung von Hintergrundaktivitäten oder schlechte Treiber zurückzuführen ist. Wie aus unserem Diagramm unten ersichtlich ist, fielen die Frameraten gelegentlich ohne erkennbaren Grund von etwa 30 FPS auf etwa 24 FPS ab, obwohl sie eigentlich konstant bleiben sollten.
Witcher 3 FPS Diagramm
| min. | mittel | hoch | max. | |
|---|---|---|---|---|
| The Witcher 3 (2015) | 98.2 | 52.6 | 25.7 | 17.8 |
| Dota 2 Reborn (2015) | 144.9 | 107.9 | 70 | 60.8 |
| Final Fantasy XV Benchmark (2018) | 48.3 | 24.7 | 17.9 | |
| X-Plane 11.11 (2018) | 51.8 | 38.5 | 33.2 | |
| Far Cry 5 (2018) | 71 | 33 | 30 | 27 |
| Strange Brigade (2018) | 120.2 | 43 | 35.9 | 29.6 |
| Tiny Tina's Wonderlands (2022) | 40 | 31.3 | 20.5 | 15.6 |
| F1 22 (2022) | 58.3 | 52.3 | 37.2 | 8.43 |
| Baldur's Gate 3 (2023) | 22.9 | 15.1 | 13.3 | 12.6 |
| Cyberpunk 2077 2.2 Phantom Liberty (2023) | 24.3 | 18.1 | 11.6 |
Emissionen
Geräuschemissionen
Das Lüftergeräusch ist lauter als bei der NucBox M5. Angesichts der Tatsache, dass die M6 eine anspruchsvollere CPU verwendet, ohne Änderungen an der Kühllösung vorzunehmen, ist dieses lautere Geräusch keine Überraschung. Selbst bei mittlerer Belastung wie dem 3DMark 06 erreicht der Lüfter bereits nach 30 Sekunden seine maximale Drehzahl, während es bei der langsameren M5 nur 37 dB(A) sind. Das Pulsieren des Lüfters tritt häufiger auf, als uns lieb ist.
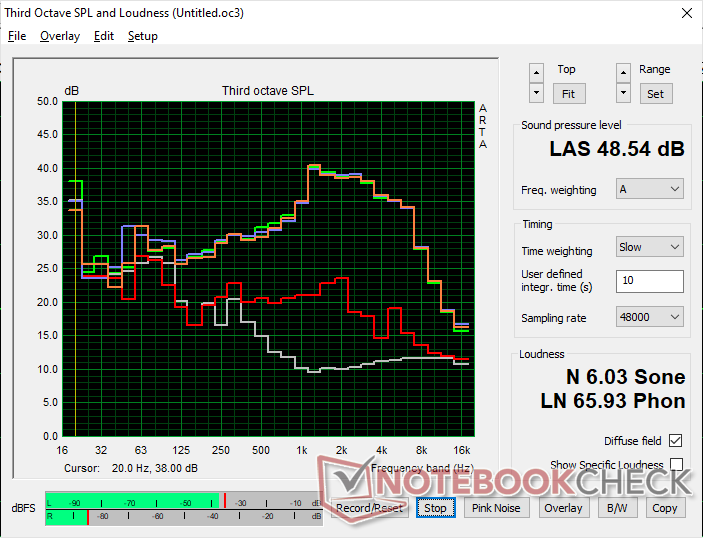
Lautstärkediagramm
| Idle |
| 31.9 / 32 / 33.8 dB(A) |
| Last |
| 48.5 / 48.5 dB(A) |
 | ||
30 dB leise 40 dB(A) deutlich hörbar 50 dB(A) störend |
||
min: | ||
| GMK NucBox M6 Radeon 660M, R5 6600H, AirDisk APF 10-512G | GMK NucBox M5 Vega 8, R7 5700U, Lexar 1024GB LNM6A1X001T-HNNNG | GMK NucBox K6 Radeon 780M, R7 7840HS, MasonSemi 1TB MC7000 | BOSGAME M1 Radeon 780M, R7 7840HS | Beelink SER5 Vega 6, R5 5560U, Crucial P3 Plus CT1000P3PSSD8 | Intel NUC 13 Pro Kit NUC13ANK Iris Xe G7 96EUs, i7-1360P, Samsung PM9A1 MZVL2512HCJQ | |
|---|---|---|---|---|---|---|
| Geräuschentwicklung | 9% | 3% | 8% | 28% | 4% | |
| aus / Umgebung * | 24.2 | 23.4 3% | 23.2 4% | 23.2 4% | 23.7 2% | 29.8 -23% |
| Idle min * | 31.9 | 33.8 -6% | 31.3 2% | 32 -0% | 23.9 25% | 30.2 5% |
| Idle avg * | 32 | 33.8 -6% | 31.3 2% | 32 -0% | 23.9 25% | 31.1 3% |
| Idle max * | 33.8 | 33.8 -0% | 33.4 1% | 32 5% | 23.9 29% | 31.9 6% |
| Last avg * | 48.5 | 36.5 25% | 47.5 2% | 38.7 20% | 28 42% | 40 18% |
| Witcher 3 ultra * | 48.5 | 36.8 24% | 43.6 10% | 41.7 14% | 27.6 43% | |
| Last max * | 48.5 | 36.9 24% | 47.7 2% | 42 13% | 32.8 32% | 40.5 16% |
* ... kleinere Werte sind besser
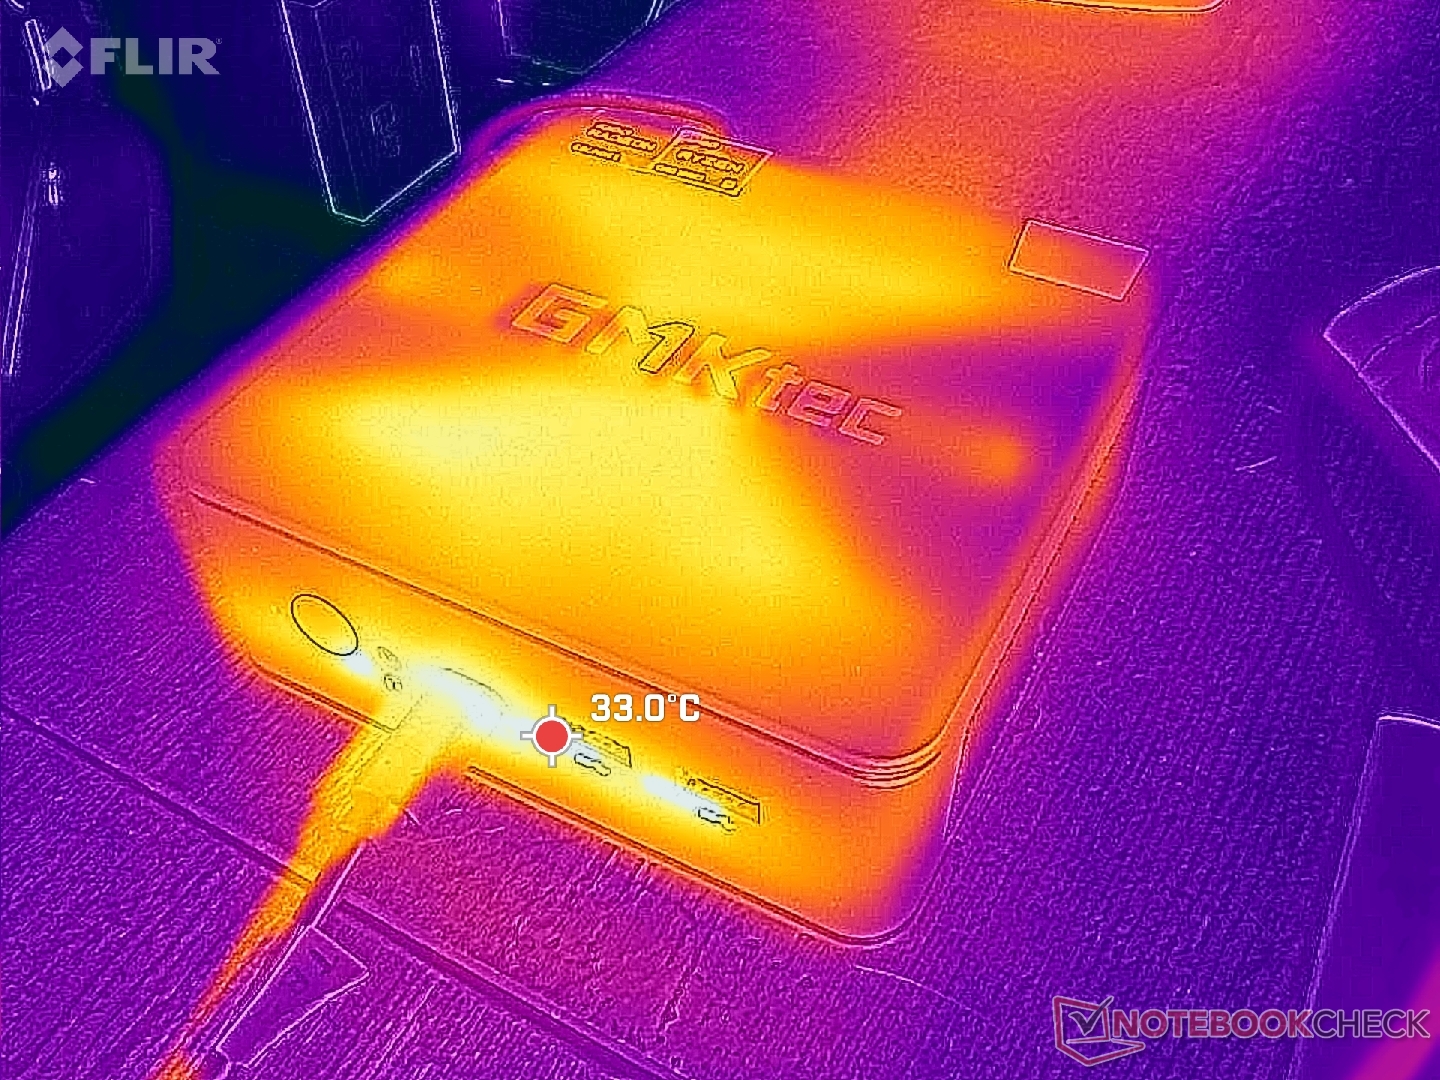
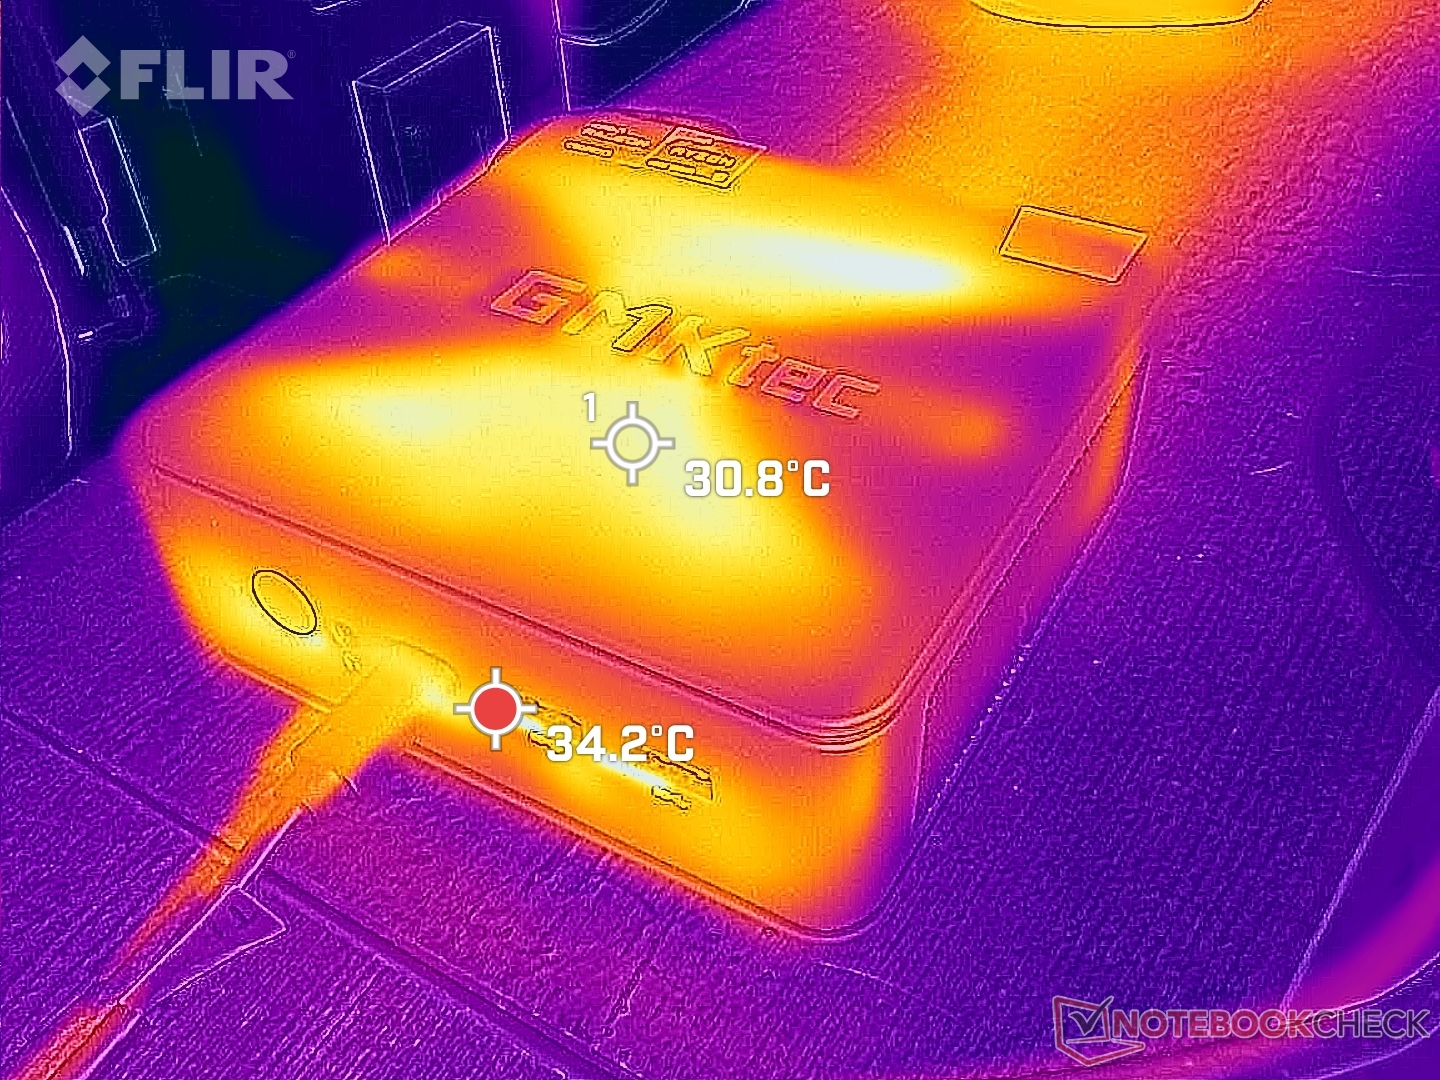
Temperatur
Die Oberflächentemperaturen bleiben stets angenehm kühl. Im Gegensatz zu einigen Beelink-Modellen verfügt die NucBox M6 nicht über Gitter auf der Oberseite, sondern zieht die Frischluft durch schmale Schlitze entlang des Umfangs. Auch bei vertikaler Positionierung des Geräts bleibt die Luftzirkulation sicher, selbst wenn einige Lüftungsschlitze teilweise blockiert sind.
Energieverwaltung — Mehr Leistung, mehr Energieverbrauch
Energieaufnahme
Das System ist aufgrund der Umstellung auf eine CPU der H-Serie wesentlich anspruchsvoller als die NucBox M5. Die Ausführung von Witcher 3 würde zum Beispiel 75 Prozent mehr Leistung erfordern, während Prime95 mehr als das 2,5-fache an Leistung benötigen würde. Der Ryzen 5 6600H ist sicherlich schneller als der Ryzen 7 5700U in der NucBox M5, aber die Leistung pro Watt ist immer noch deutlich zugunsten der M5.
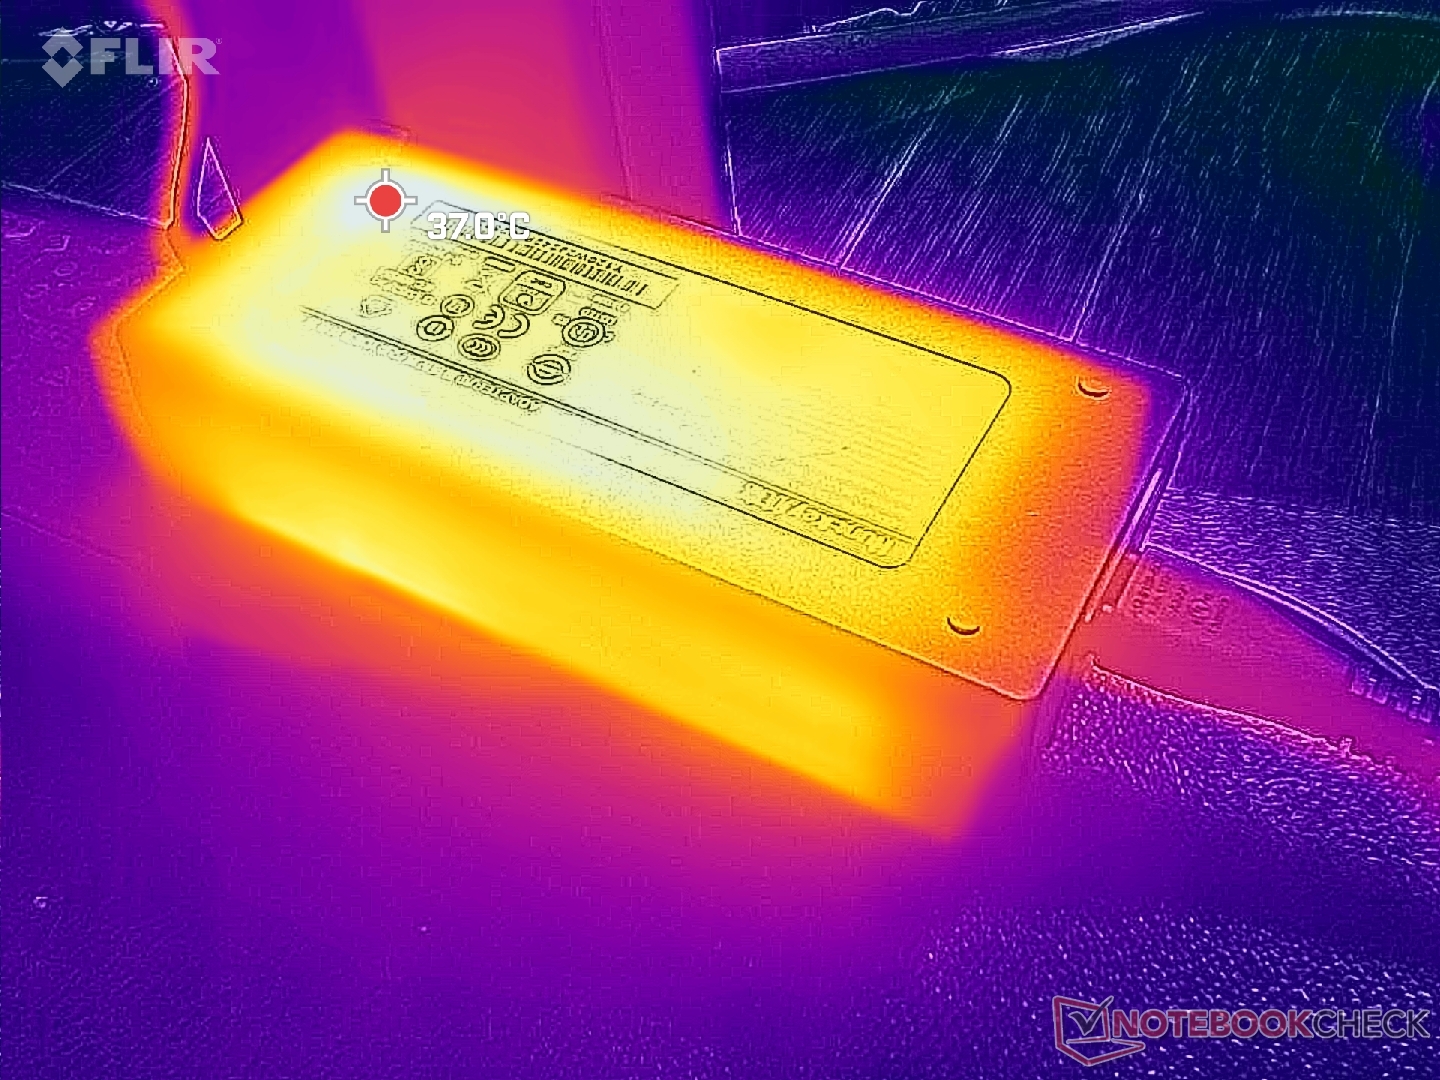
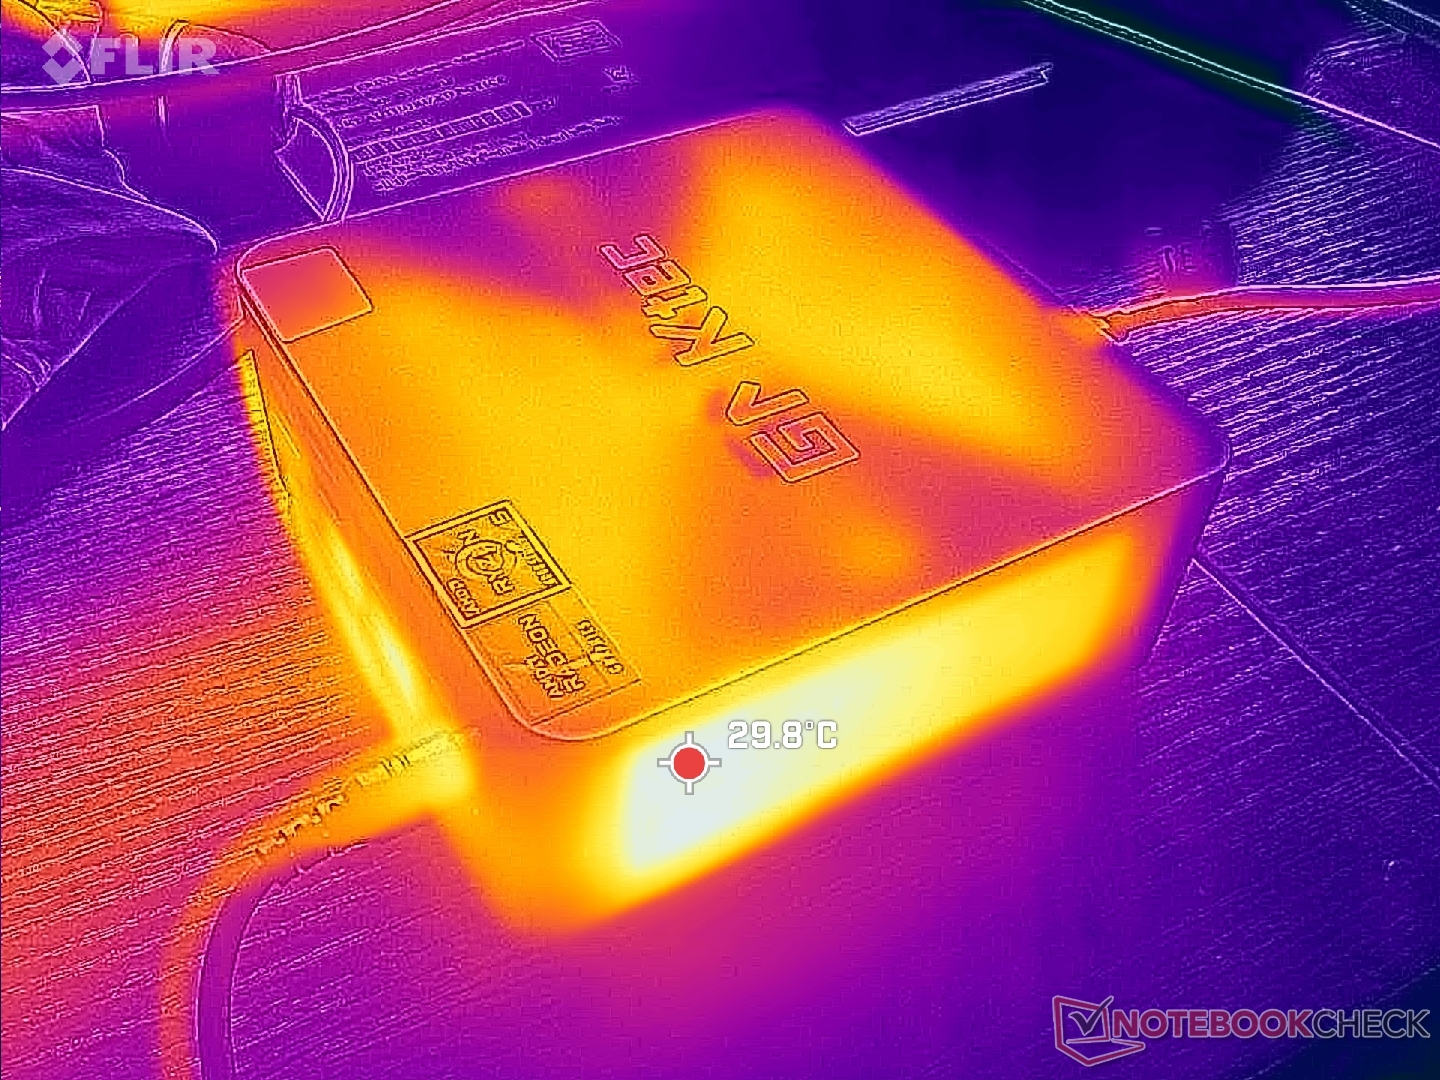
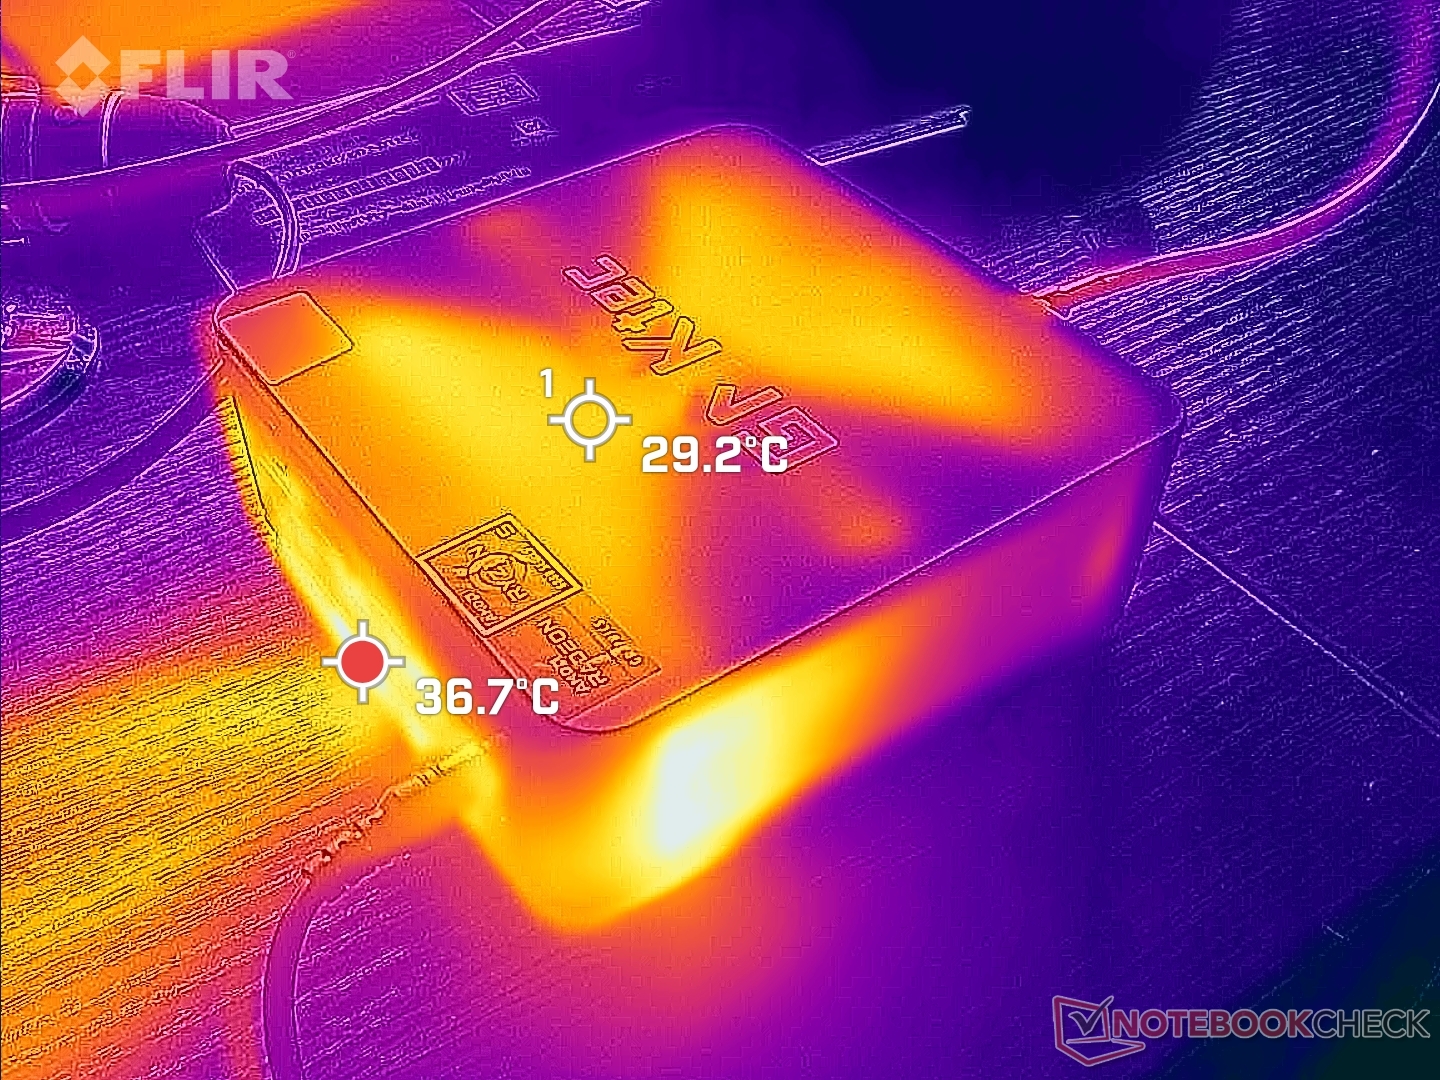
Wir konnten eine maximale Leistungsaufnahme von 85 W aus dem mittelgroßen (~14,5 x 6,4 x 3,2 cm) 120-W-Netzteil aufzeichnen, wenn die CPU voll ausgelastet ist. Beachten Sie, dass dieses Netzteil aufgrund des anspruchsvolleren Prozessors der NucBox M6 größer ist als das 65-W-Netzteil, das mit der NucBox M5 geliefert wird.

| Aus / Standby | |
| Idle | |
| Last |
|
Legende:
min: | |
| GMK NucBox M6 R5 6600H, Radeon 660M, AirDisk APF 10-512G, , x, | GMK NucBox M5 R7 5700U, Vega 8, Lexar 1024GB LNM6A1X001T-HNNNG, , x, | GMK NucBox K6 R7 7840HS, Radeon 780M, MasonSemi 1TB MC7000, , x, | BOSGAME M1 R7 7840HS, Radeon 780M, , , x, | Beelink SER5 R5 5560U, Vega 6, Crucial P3 Plus CT1000P3PSSD8, , x, | Intel NUC 13 Pro Kit NUC13ANK i7-1360P, Iris Xe G7 96EUs, Samsung PM9A1 MZVL2512HCJQ, , x, | |
|---|---|---|---|---|---|---|
| Stromverbrauch | 39% | -8% | -15% | 43% | 0% | |
| Idle min * | 7.9 | 5.9 25% | 6.7 15% | 7.3 8% | 4.4 44% | 5.1 35% |
| Idle avg * | 8 | 6.2 22% | 7 12% | 7.3 9% | 5 37% | 5.8 27% |
| Idle max * | 8.3 | 6.4 23% | 7.6 8% | 8.4 -1% | 5.3 36% | 10.2 -23% |
| Last avg * | 61.5 | 28.2 54% | 74.3 -21% | 72.7 -18% | 29.8 52% | 68.1 -11% |
| Witcher 3 ultra * | 47.3 | 27.5 42% | 75 -59% | 80.5 -70% | 28.8 39% | |
| Last max * | 84.6 | 29.5 65% | 85.7 -1% | 99.1 -17% | 40.4 52% | 108.3 -28% |
* ... kleinere Werte sind besser
Energieverbrauch Witcher 3 / Stresstest
Energieverbrauch externer Monitor
Pro
Contra
Fazit — Toller Preis- und Größenwert
Ähnlich wie der Rest der Produktpalette bietet die NucBox M6 ein unschlagbares Preis-Leistungs-Verhältnis. Der Ryzen 5 6600H übertrifft jeden Core i3 oder Celeron in der Preisklasse unter 277 Euro. HTPC-Benutzer, die maximale Leistung zu einem erschwinglichen Preis suchen, sollten die NucBox M5 in Betracht ziehen.
Bei der GMKtec NucBox M6 liegt der Fokus auf dem besten Preis-Leistungs-Verhältnis, ohne Kompromisse bei langsameren U-Serien-CPUs aus der Core i3- oder Celeron-Familie einzugehen. Allerdings kann das Lüftergeräusch für einen Mini-PC etwas lauter sein.
Es gibt einige Nachteile, darunter das Fehlen von USB4-Unterstützung und das lautere Lüftergeräusch, das mit der schnelleren CPU der H-Serie einhergeht. Die Wi-Fi 6E-Kompatibilität ist zwar nett, kann aber zu Leistungsproblemen führen, ebenso wie die Wiedergabe von 4K-Videoinhalten mit 60 FPS. Diese Probleme zeigen, dass man sich nicht um die kleinen Details des Modells gekümmert hat. Für die Zielgruppe der Heimanwender und einfachen HTPC-Streaming-Aufgaben wird jedoch meist das Lüftergeräusch das auffälligste Manko sein.
Preis und Verfügbarkeit
Die NucBox M6 wird ab sofort direkt vom Hersteller für 212 Euro als Barebone-Kit oder für 277 Euromit 16 GB RAM, 512 GB SSD und Windows 11 Pro angeboten. Auf Amazon ist das Modell ebenfalls zu höheren Startpreisen erhältlich.
Hinweis: Wir haben unser Rating-System kürzlich aktualisiert und die Ergebnisse von Version 8 sind nicht mit den Ergebnissen von Version 7 vergleichbar. Weitere Informationen dazu sind hier verfügbar.
Note: We have recently updated our rating system and the results of version 8 are not comparable with the results of version 7. More information is available here .
GMK NucBox M6
- 04.07.2024 v8
Allen Ngo
 Total Sustainability Score:
 Weitere Artikel zur Serie
GMK NucBox M6 (NucBox Serie)Verwandte Artikel

Transparenz
Die Auswahl der zu testenden Geräte erfolgt innerhalb der Redaktion. Das vorliegende Testmuster wurde dem Autor vom Hersteller oder einem Shop zu Testzwecken leihweise zur Verfügung gestellt. Eine Einflussnahme des Leihstellers auf den Testbericht gab es nicht, der Hersteller erhielt keine Version des Reviews vor der Veröffentlichung. Es bestand keine Verpflichtung zur Publikation. Unsere Reviews erfolgen stets ohne Gegenleistung oder Kompensationen. Als eigenständiges, unabhängiges Unternehmen unterliegt Notebookcheck keiner Diktion von Herstellern, Shops und Verlagen.
So testet Notebookcheck
Pro Jahr werden von Notebookcheck hunderte Laptops und Smartphones unabhängig in von uns standardisierten technischen Verfahren getestet, um eine Vergleichbarkeit aller Testergebnisse zu gewährleisten. Seit rund 20 Jahren entwickeln wir diese Testmethoden kontinuierlich weiter und setzen damit Branchenstandards. In unseren Testlaboren kommt ausschließlich hochwertiges Messequipment in die Hände erfahrener Techniker und Redakteure. Die Tests unterliegen einer mehrstufigen Kontrolle. Unsere komplexe Gesamtbewertung basiert auf hunderten fundierten Messergebnissen und Benchmarks, womit Ihnen Objektivität garantiert ist. Weitere Informationen zu unseren Testmethoden gibt es hier.
Preisvergleich

