Notebookcheck Logo

Leistungsdebut des Ryzen 5 5560U: Mini-PC Beelink SER5 im Test
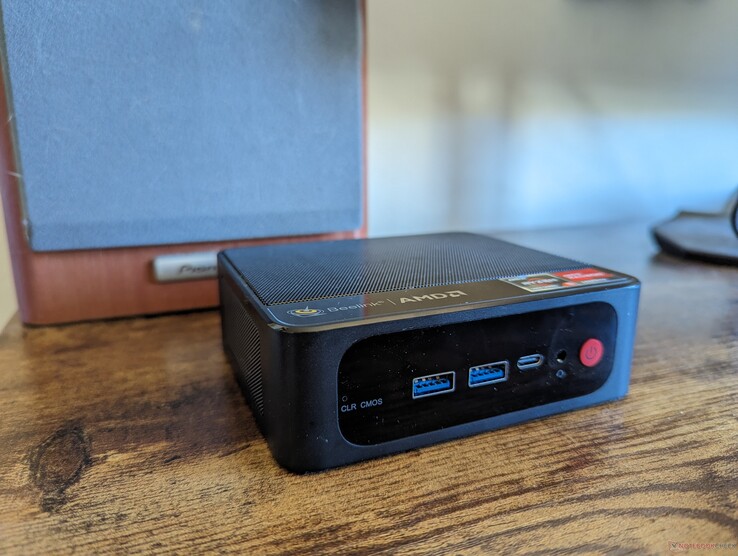
Intel-NUC-Leistung ohne NUC-Preis.

Der Ryzen 5560U mag zwar schon ein paar Jahre alt sein, seine Leistung ist aber so nahe an der eines neuen Ryzen 5 7530U, dass die meisten Nutzer kaum den Unterschied bemerken dürften, insbesondere angesichts der Einsatzzwecke nicht. Und so ist der SER5 für nur $230 USD geradezu ein Schnäppchen und kommt zudem mit Windows 11.
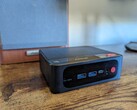
Beelink SER5
Beelink SER5

Der Beelink SER5 ist ein preiswerter Mini-PC und steht so im Kontrast zu den teureren GTR- oder SER-Pro-Serien, welche eher mit schnelleren CPUs der H-Serie ausgestattet sind. Dem gegenüber ist der SER5 einer der wenigen Mini-PCs, die mit einem AMD Zen 3 Ryzen 5 5560U ausgeliefert werden.

Unsere Testeinheit beinhaltet einen Ryzen 5 5560U, 16 GB RAM, 500 GB SSD und Windows 11 zum Preis von nur $230 USD. Hierzulande führt ihn derzeit allerdings nur Amazon für happige 369 Euro. Es konkurriert mit anderen Budget-orientierten Mini-PCs wie dem Geekom A5, dem GMKtec NucBox series oder dem Minisforum EM680.

Weitere Beelink-Tests:

Beelink SER5
Prozessor
AMD Ryzen 5 5560U 6 x 2.3 - 4 GHz, 25 W PL2 / Short Burst, 25 W PL1 / Sustained, Cezanne-U (Zen 3)
Grafikkarte
AMD Radeon RX Vega 6 (Ryzen 4000/5000) - 3 GB VRAM, Speichertakt: 1600 MHz, DDR4, 31.0.21902.5
RAM
16 GB 
, Micron DDR4-3200, 22-22-22-52, Dual-Channel
Mainboard
AMD Promontory/Bixby FCH
Massenspeicher
Crucial P3 Plus CT1000P3PSSD8, 1024 GB 
Soundkarte
AMD Zen - Audio Processor - HD Audio Controller
Anschlüsse
1 USB 2.0, 4 USB 3.0 / 3.1 Gen1, 1 HDMI, 2 DisplayPort, Audio Anschlüsse: 3.5 mm headset
Netzwerk
Realtek RTL8168/8111 Gigabit-LAN (10/100/1000MBit/s), Intel Wi-Fi 6 AX200 (a/b/g/n = Wi-Fi 4/ac = Wi-Fi 5/ax = Wi-Fi 6/), Bluetooth 5.1
Abmessungen
Höhe x Breite x Tiefe (in mm): 42 x 126 x 113
Betriebssystem
Microsoft Windows 11 Pro
Sonstiges
12 Monate Garantie
Gewicht
439 g, Netzteil: 289 g
Preis
230 USD
Hinweis: Der Hersteller kann abweichende Bauteile wie Bildschirme, Laufwerke und Speicherriegel mit ähnlichen Spezifikationen unter dem gleichen Modellnamen einsetzen.


Potentielle Konkurrenten im Vergleich

Bew.
Datum
Modell
Gewicht
Dicke
Größe
Auflösung
Preis ab
82.1 %
v7 (old)
11 / 2023
Beelink SER5
R5 5560U, Vega 6
439 g42 mmx
86.6 %
v7 (old)
09 / 2023
Beelink SER7
R7 7840HS, Radeon 780M
640 g49 mmx

v (old)
Beelink SEi12 Core i5-1235U
i5-1235U, Iris Xe G7 80EUs
465 g42 mmx
81.2 %
v7 (old)
10 / 2023
Geekom A5
R7 5800H, Vega 8
555 g49.2 mmx
82.8 %
v7 (old)
10 / 2023
GMK NucBox K3 Pro
i7-12650H, UHD Graphics 64EUs
396 g43.2 mmx
83.1 %
v7 (old)
08 / 2023
Intel NUC 13 Pro Desk Edition Kit
i7-1360P, Iris Xe G7 96EUs
558 g37 mmx

Gehäuse - Guter Mix aus Kunststoff und Metall

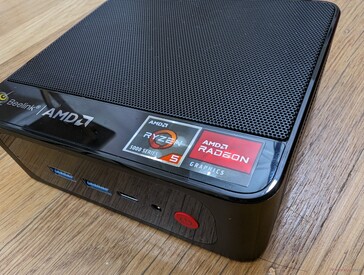
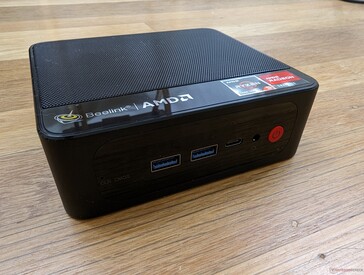
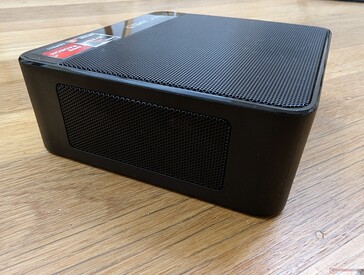
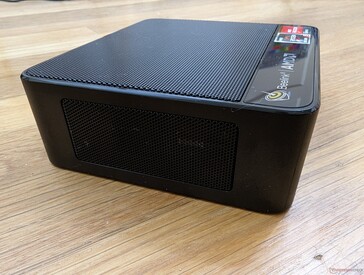
Beelink schafft es die Preise der meisten seiner Mini-PCs niedrig zu halten, indem es das Gehäusedesign auch über mehrere Modelle hinweg recht konstant hält und nur einige äußere Merkmale abändert. Beispielsweise hat der SER5 die exakt gleichen Abmessungen wie der SER6  und muss nur auf die abnehmbare Oberseite verzichten. Auch dem SER7 gleicht es stark, dieser ist nur wenige Millimeter dicker, um besser für die schnelleren HS-CPUs gerüstet zu sein. Der Mix aus Kunststoff und Metall ist ansonsten identisch, sorgt für einen guten Ersteindruck und steht der Intel NUC Serie kaum nach.

Spiegelnde Plastikoberseite mit Metallgitternetz für den Frischlufteintritt
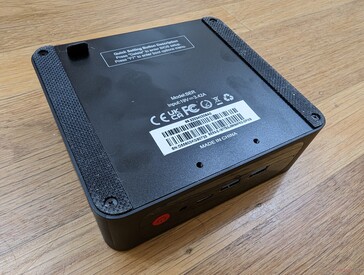
Gummifüße an der Unterseite und einem kleinen "Griff" für die Bodenplatte
Zwei Schraublöcher zum Anbringen an den VESA-Anschluss
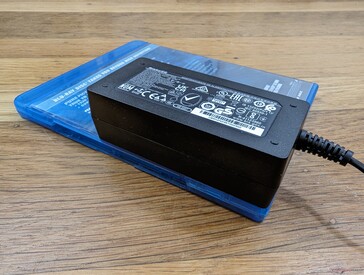
Kleines (9,5 x 4,5 x 2,9 cm) 65-W-Netzteil

Größenvergleich

126 mm 113 mm 49 mm 640 g126 mm 113 mm 42 mm 439 g126 mm 113 mm 42 mm 465 g117 mm 112 mm 49.2 mm 555 g123 mm 112 mm 43.2 mm 396 g117 mm 112 mm 37 mm 558 g210 mm 148 mm 1 mm 2.9 g

Anschlüsse - Weder USB 4 noch Thunderbolt

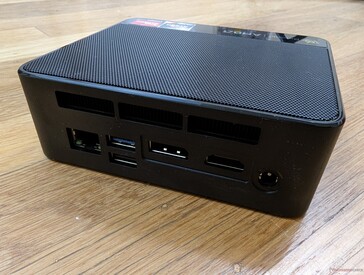
Leider unterstützt das System weder USB4 noch Thunderbolt. Sein USB-C-Anschluss integriert DisplayPort aber kein Power Delivery, sodass man den Mini-PC nicht via USB-C-Ladeadapter mit Strom versorgen kann.

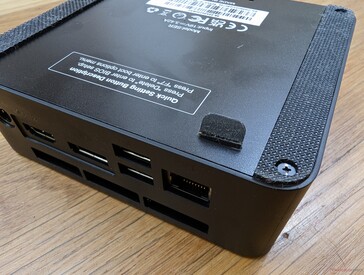
Vorne: 2x USB-A 3.2, USB-C mit DisplayPort, 3,5 mm Headset, Power Button
Rechts: Keine Anschlüsse
Hinten: Gigabit RJ-45, USB-A 3.2, USB-A 2.0, DisplayPort 1.4, HDMI 2.0
Links: Keine Anschlüsse

Kommunikation

Das WLAN-Modul Intel AX200 sorgt für Wi-Fi 6 and Bluetooth 5.2. Wi-Fi 6E wird aus Kostengründen leider nicht unterstützt.

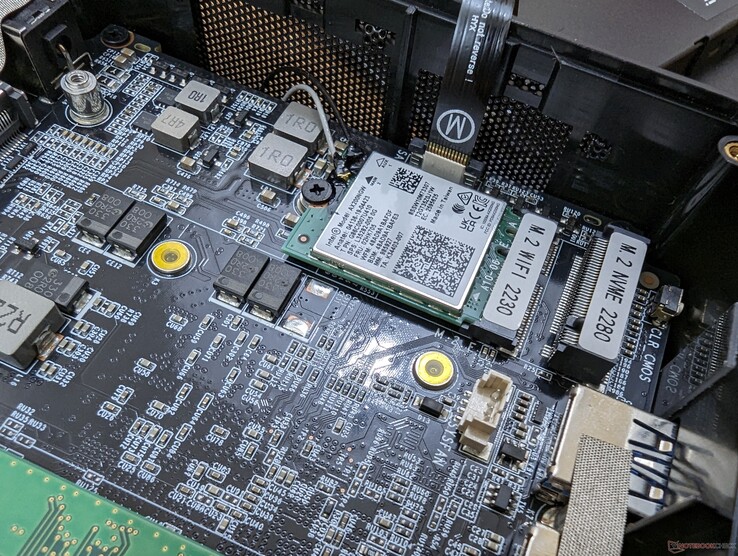
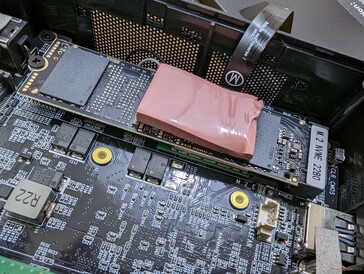
Austauschbares M.2-WLAN-Modul sitzt unterhalb der M.2-SSD
Networking
iperf3 transmit AXE11000
Beelink SEi12 Core i5-1235U
Intel Wi-Fi 6 AX201
1491 (1413min - 1572max) MBit/s +17%
Beelink SER7
Intel Wi-Fi 6 AX200
1324 (665min - 1408max) MBit/s +4%
Intel NUC 13 Pro Desk Edition Kit
Intel Wi-Fi 6E AX211
1301 (514min - 1422max) MBit/s +2%
Beelink SER5
Intel Wi-Fi 6 AX200
1278 (649min - 1345max) MBit/s
GMK NucBox K3 Pro
Intel Wi-Fi 6 AX201
1171 (923min - 1342max) MBit/s -8%
Geekom A5
Realtek RTL8852BE
834 (730min - 861max) MBit/s -35%
iperf3 receive AXE11000
Beelink SER5
Intel Wi-Fi 6 AX200
1411 (1230min - 1580max) MBit/s
Beelink SEi12 Core i5-1235U
Intel Wi-Fi 6 AX201
1384 (1200min - 1495max) MBit/s -2%
GMK NucBox K3 Pro
Intel Wi-Fi 6 AX201
1297 (1164min - 1393max) MBit/s -8%
Beelink SER7
Intel Wi-Fi 6 AX200
1193 (588min - 1333max) MBit/s -15%
Intel NUC 13 Pro Desk Edition Kit
Intel Wi-Fi 6E AX211
1117 (884min - 1368max) MBit/s -21%
Geekom A5
Realtek RTL8852BE
946 (856min - 970max) MBit/s -33%
iperf3 transmit AXE11000 6GHz
Intel NUC 13 Pro Desk Edition Kit
Intel Wi-Fi 6E AX211
1511 (1451min - 1552max) MBit/s
iperf3 receive AXE11000 6GHz
Intel NUC 13 Pro Desk Edition Kit
Intel Wi-Fi 6E AX211
1448 (1357min - 1490max) MBit/s
050100150200250300350400450500550600650700750800850900950100010501100115012001250130013501400145015001550Tooltip
Beelink SER5; iperf3 transmit AXE11000; iperf 3.1.3: Ø1256 (649-1345)
Beelink SER5; iperf3 receive AXE11000; iperf 3.1.3: Ø1410 (1230-1580)

Wartung

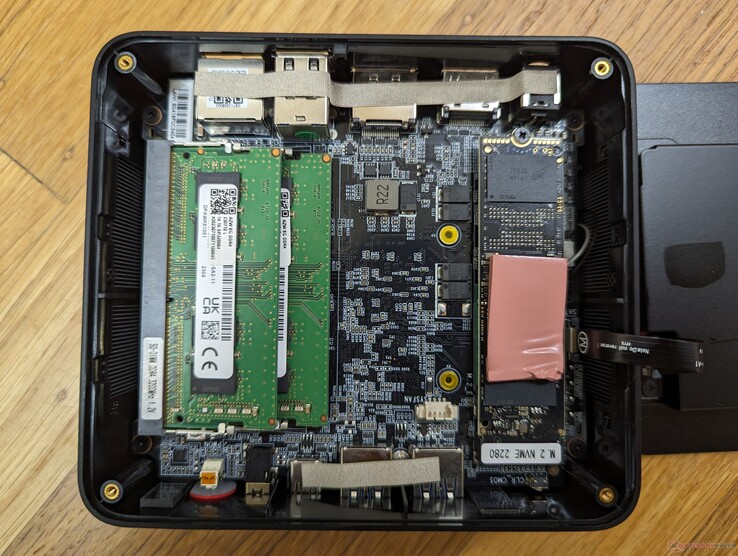
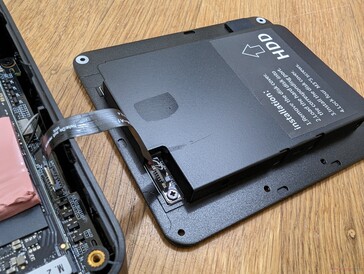
Leichter Zugang zu 2x SODIMM Slots, 1x M.2 2280 SSD Slot, 1x 2,5 Zoll SATA Slot und dem M.2-WLAN-Modul

Zubehör und Garantie

In der Verpackung befinden sich zwei HDMI-Kabel, eine VESA-Halterung für den Wandanschluss, das Netzteil und eine Bedienungsanleitung. In Deutschland greift standardmäßig eine 1-Jahres-Garantie.

Leistung - Fast wie der Ryzen 5 7530U


Testbedingungen

Wir haben Windows in den Leistungsmodus versetzt. Beelink installiert, anders als andere Hersteller, kein spezifisches Control Center.

Prozessor

Der Ryzen 5 5560U performt nahezu identisch mit dem Ryzen 5 7530U, nur mit einer etwas niedrigeren Single-Thread-Leistung. Beide CPUs haben 6 Kerne und basieren auf der gleichen Zen-3-Architektur mit ähnlichen TDPs. Schaut man sich bei Intel um, so ist der Ryzen 5 5560U am ehesten mit dem Core i5-1235U vergleichbar.

Cinebench R15 Multi Loop

0130260390520650780910104011701300143015601690182019502080221023402470Tooltip
Beelink SER5 AMD Ryzen 5 5560U: Ø1274 (1263.74-1280.29)
Beelink SER7 AMD Ryzen 7 7840HS: Ø2544 (2511.62-2564.76)
Beelink SEi12 Core i5-1235U Intel Core i5-1235U: Ø1219 (1203.04-1409.15)
Geekom A5 AMD Ryzen 7 5800H: Ø1715 (1692.05-1838.74)
GMK NucBox K3 Pro Intel Core i7-12650H: Ø1420 (1391.69-1691.83)
Intel NUC 13 Pro Desk Edition Kit Intel Core i7-1360P: Ø1753 (1686.77-2083.33)
Cinebench R23: Multi Core | Single Core
Cinebench R20: CPU (Multi Core) | CPU (Single Core)
Cinebench R15: CPU Multi 64Bit | CPU Single 64Bit
Blender: v2.79 BMW27 CPU
7-Zip 18.03: 7z b 4 | 7z b 4 -mmt1
Geekbench 5.5: Multi-Core | Single-Core
HWBOT x265 Benchmark v2.2: 4k Preset
LibreOffice : 20 Documents To PDF
R Benchmark 2.5: Overall mean
Cinebench R23 / Multi Core
Beelink SER7
AMD Ryzen 7 7840HS
16105 (15785.6min - 16105.2max) Points +110%
Lenovo IdeaCentre Mini 01IRH8
Intel Core i7-13700H
14465 (9293.64min - 14465.4max) Points +89%
Intel NUC 13 Pro Desk Edition Kit
Intel Core i7-1360P
12155 Points +59%
Lenovo ThinkPad T14s G4-21F8002TGE
AMD Ryzen 7 7840U
11797 Points +54%
GMK NucBox K2
AMD Ryzen 7 7735HS
11584 (11082.5min - 11584.2max) Points +51%
Acemagic AM20
AMD Ryzen 7 7735H
10920 Points +42%
Geekom A5
AMD Ryzen 7 5800H
10819 Points +41%
GMK NucBox K3 Pro
Intel Core i7-12650H
10691 (9260.68min - 10691.5max) Points +39%
Minisforum Venus Series UM560 XT
AMD Ryzen 5 5600H
9564 Points +25%
Acemagic AD15
Intel Core i7-11800H
9503 Points +24%
NiPoGi CK10
Intel Core i5-12450H
8129 Points +6%
Beelink SEi12 Core i5-1235U
Intel Core i5-1235U
8128 (7685.59min - 8128.32max) Points +6%
HP ProBook 445 G10
AMD Ryzen 5 7530U
7859 Points +3%
Beelink SER5
AMD Ryzen 5 5560U
7667 (7546.82min - 7667.18max) Points
Durchschnittliche AMD Ryzen 5 5560U
  ()
7667 Points 0%
Cinebench R23 / Single Core
Lenovo IdeaCentre Mini 01IRH8
Intel Core i7-13700H
1898 Points +51%
Intel NUC 13 Pro Desk Edition Kit
Intel Core i7-1360P
1878 Points +49%
GMK NucBox K3 Pro
Intel Core i7-12650H
1792 Points +42%
Beelink SER7
AMD Ryzen 7 7840HS
1774 Points +41%
Lenovo ThinkPad T14s G4-21F8002TGE
AMD Ryzen 7 7840U
1742 Points +38%
NiPoGi CK10
Intel Core i5-12450H
1667 Points +32%
Beelink SEi12 Core i5-1235U
Intel Core i5-1235U
1610 Points +28%
Acemagic AM20
AMD Ryzen 7 7735H
1536 Points +22%
GMK NucBox K2
AMD Ryzen 7 7735HS
1499 Points +19%
Acemagic AD15
Intel Core i7-11800H
1496 Points +19%
HP ProBook 445 G10
AMD Ryzen 5 7530U
1452 Points +15%
Geekom A5
AMD Ryzen 7 5800H
1405 Points +12%
Minisforum Venus Series UM560 XT
AMD Ryzen 5 5600H
1375 Points +9%
Beelink SER5
AMD Ryzen 5 5560U
1260 Points
Durchschnittliche AMD Ryzen 5 5560U
  ()
1260 Points 0%
Cinebench R20 / CPU (Multi Core)
Beelink SER7
AMD Ryzen 7 7840HS
6344 Points +110%
Lenovo IdeaCentre Mini 01IRH8
Intel Core i7-13700H
5800 Points +92%
Intel NUC 13 Pro Desk Edition Kit
Intel Core i7-1360P
4687 Points +55%
Lenovo ThinkPad T14s G4-21F8002TGE
AMD Ryzen 7 7840U
4618 Points +53%
GMK NucBox K2
AMD Ryzen 7 7735HS
4533 Points +50%
Acemagic AM20
AMD Ryzen 7 7735H
4354 Points +44%
Geekom A5
AMD Ryzen 7 5800H
4229 Points +40%
GMK NucBox K3 Pro
Intel Core i7-12650H
4058 Points +34%
Acemagic AD15
Intel Core i7-11800H
3779 Points +25%
Minisforum Venus Series UM560 XT
AMD Ryzen 5 5600H
3768 Points +25%
NiPoGi CK10
Intel Core i5-12450H
3237 Points +7%
Beelink SEi12 Core i5-1235U
Intel Core i5-1235U
3111 Points +3%
HP ProBook 445 G10
AMD Ryzen 5 7530U
3043 Points +1%
Beelink SER5
AMD Ryzen 5 5560U
3019 Points
Durchschnittliche AMD Ryzen 5 5560U
  ()
3019 Points 0%
Cinebench R20 / CPU (Single Core)
Intel NUC 13 Pro Desk Edition Kit
Intel Core i7-1360P
723 Points +45%
Lenovo IdeaCentre Mini 01IRH8
Intel Core i7-13700H
721 Points +45%
Beelink SER7
AMD Ryzen 7 7840HS
698 Points +40%
GMK NucBox K3 Pro
Intel Core i7-12650H
691 Points +39%
Lenovo ThinkPad T14s G4-21F8002TGE
AMD Ryzen 7 7840U
677 Points +36%
NiPoGi CK10
Intel Core i5-12450H
644 Points +29%
Beelink SEi12 Core i5-1235U
Intel Core i5-1235U
620 Points +24%
Acemagic AM20
AMD Ryzen 7 7735H
601 Points +21%
GMK NucBox K2
AMD Ryzen 7 7735HS
591 Points +19%
Acemagic AD15
Intel Core i7-11800H
574 Points +15%
HP ProBook 445 G10
AMD Ryzen 5 7530U
566 Points +14%
Geekom A5
AMD Ryzen 7 5800H
551 Points +11%
Minisforum Venus Series UM560 XT
AMD Ryzen 5 5600H
533 Points +7%
Beelink SER5
AMD Ryzen 5 5560U
498 Points
Durchschnittliche AMD Ryzen 5 5560U
  ()
498 Points 0%
Cinebench R15 / CPU Multi 64Bit
Beelink SER7
AMD Ryzen 7 7840HS
2565 (2511.62min - 2564.76max) Points +100%
Lenovo IdeaCentre Mini 01IRH8
Intel Core i7-13700H
2240 (1862.02min - 2240.14max) Points +75%
Intel NUC 13 Pro Desk Edition Kit
Intel Core i7-1360P
1990 Points +55%
GMK NucBox K2
AMD Ryzen 7 7735HS
1972 (1875.64min - 1972max) Points +54%
Lenovo ThinkPad T14s G4-21F8002TGE
AMD Ryzen 7 7840U
1932 (1798.56min - 1931.99max) Points +51%
Acemagic AM20
AMD Ryzen 7 7735H
1825 Points +43%
Geekom A5
AMD Ryzen 7 5800H
1773 Points +39%
GMK NucBox K3 Pro
Intel Core i7-12650H
1692 (1391.69min - 1691.83max) Points +32%
Minisforum Venus Series UM560 XT
AMD Ryzen 5 5600H
1596 Points +25%
Acemagic AD15
Intel Core i7-11800H
1591 Points +24%
Beelink SEi12 Core i5-1235U
Intel Core i5-1235U
1409 (1203.04min - 1409.15max) Points +10%
HP ProBook 445 G10
AMD Ryzen 5 7530U
1328 (1245.87min - 1328.42max) Points +4%
Beelink SER5
AMD Ryzen 5 5560U
1280 (1263.74min - 1280.29max) Points
Durchschnittliche AMD Ryzen 5 5560U
  ()
1280 Points 0%
NiPoGi CK10
Intel Core i5-12450H
1211 Points -5%
Cinebench R15 / CPU Single 64Bit
Beelink SER7
AMD Ryzen 7 7840HS
283 Points +40%
Lenovo ThinkPad T14s G4-21F8002TGE
AMD Ryzen 7 7840U
272 Points +35%
Intel NUC 13 Pro Desk Edition Kit
Intel Core i7-1360P
267 Points +32%
Lenovo IdeaCentre Mini 01IRH8
Intel Core i7-13700H
260 Points +29%
GMK NucBox K3 Pro
Intel Core i7-12650H
256 Points +27%
Acemagic AM20
AMD Ryzen 7 7735H
246 Points +22%
GMK NucBox K2
AMD Ryzen 7 7735HS
244 Points +21%
NiPoGi CK10
Intel Core i5-12450H
238 Points +18%
HP ProBook 445 G10
AMD Ryzen 5 7530U
234 Points +16%
Beelink SEi12 Core i5-1235U
Intel Core i5-1235U
231 Points +14%
Geekom A5
AMD Ryzen 7 5800H
227 Points +12%
Acemagic AD15
Intel Core i7-11800H
226 Points +12%
Minisforum Venus Series UM560 XT
AMD Ryzen 5 5600H
225 Points +11%
Beelink SER5
AMD Ryzen 5 5560U
202 Points
Durchschnittliche AMD Ryzen 5 5560U
  ()
202 Points 0%
Blender / v2.79 BMW27 CPU
NiPoGi CK10
Intel Core i5-12450H
422 Seconds * -8%
Beelink SER5
AMD Ryzen 5 5560U
392 Seconds *
Durchschnittliche AMD Ryzen 5 5560U
  ()
392 Seconds * -0%
Beelink SEi12 Core i5-1235U
Intel Core i5-1235U
390 Seconds * +1%
HP ProBook 445 G10
AMD Ryzen 5 7530U
384 Seconds * +2%
GMK NucBox K3 Pro
Intel Core i7-12650H
330 Seconds * +16%
Minisforum Venus Series UM560 XT
AMD Ryzen 5 5600H
319 Seconds * +19%
Acemagic AD15
Intel Core i7-11800H
319 Seconds * +19%
Geekom A5
AMD Ryzen 7 5800H
293 Seconds * +25%
Acemagic AM20
AMD Ryzen 7 7735H
280 Seconds * +29%
Lenovo ThinkPad T14s G4-21F8002TGE
AMD Ryzen 7 7840U
270 Seconds * +31%
Intel NUC 13 Pro Desk Edition Kit
Intel Core i7-1360P
268 Seconds * +32%
GMK NucBox K2
AMD Ryzen 7 7735HS
259 Seconds * +34%
Lenovo IdeaCentre Mini 01IRH8
Intel Core i7-13700H
216 Seconds * +45%
Beelink SER7
AMD Ryzen 7 7840HS
196 Seconds * +50%
7-Zip 18.03 / 7z b 4
Beelink SER7
AMD Ryzen 7 7840HS
69882 MIPS +83%
GMK NucBox K2
AMD Ryzen 7 7735HS
57785 MIPS +51%
Lenovo IdeaCentre Mini 01IRH8
Intel Core i7-13700H
54733 MIPS +43%
Geekom A5
AMD Ryzen 7 5800H
53954 MIPS +41%
Lenovo ThinkPad T14s G4-21F8002TGE
AMD Ryzen 7 7840U
53700 MIPS +40%
Acemagic AM20
AMD Ryzen 7 7735H
52518 MIPS +37%
Intel NUC 13 Pro Desk Edition Kit
Intel Core i7-1360P
51340 MIPS +34%
Minisforum Venus Series UM560 XT
AMD Ryzen 5 5600H
46562 MIPS +22%
Acemagic AD15
Intel Core i7-11800H
43146 MIPS +13%
GMK NucBox K3 Pro
Intel Core i7-12650H
43031 MIPS +12%
Beelink SER5
AMD Ryzen 5 5560U
38281 MIPS
Durchschnittliche AMD Ryzen 5 5560U
  ()
38281 MIPS 0%
HP ProBook 445 G10
AMD Ryzen 5 7530U
37983 MIPS -1%
Beelink SEi12 Core i5-1235U
Intel Core i5-1235U
35580 MIPS -7%
NiPoGi CK10
Intel Core i5-12450H
33549 MIPS -12%
7-Zip 18.03 / 7z b 4 -mmt1
Beelink SER7
AMD Ryzen 7 7840HS
6734 MIPS +42%
Lenovo ThinkPad T14s G4-21F8002TGE
AMD Ryzen 7 7840U
6082 MIPS +28%
Lenovo IdeaCentre Mini 01IRH8
Intel Core i7-13700H
6014 MIPS +27%
Intel NUC 13 Pro Desk Edition Kit
Intel Core i7-1360P
5840 MIPS +23%
GMK NucBox K2
AMD Ryzen 7 7735HS
5790 MIPS +22%
GMK NucBox K3 Pro
Intel Core i7-12650H
5772 MIPS +22%
Acemagic AD15
Intel Core i7-11800H
5732 MIPS +21%
Acemagic AM20
AMD Ryzen 7 7735H
5621 MIPS +19%
Geekom A5
AMD Ryzen 7 5800H
5486 MIPS +16%
HP ProBook 445 G10
AMD Ryzen 5 7530U
5434 MIPS +15%
Minisforum Venus Series UM560 XT
AMD Ryzen 5 5600H
5369 MIPS +13%
NiPoGi CK10
Intel Core i5-12450H
5278 MIPS +11%
Beelink SEi12 Core i5-1235U
Intel Core i5-1235U
5192 MIPS +10%
Beelink SER5
AMD Ryzen 5 5560U
4740 MIPS
Durchschnittliche AMD Ryzen 5 5560U
  ()
4740 MIPS 0%
Geekbench 5.5 / Multi-Core
Beelink SER7
AMD Ryzen 7 7840HS
11423 Points +92%
Lenovo IdeaCentre Mini 01IRH8
Intel Core i7-13700H
10361 Points +74%
Intel NUC 13 Pro Desk Edition Kit
Intel Core i7-1360P
10269 Points +72%
GMK NucBox K3 Pro
Intel Core i7-12650H
9810 Points +65%
Lenovo ThinkPad T14s G4-21F8002TGE
AMD Ryzen 7 7840U
9644 Points +62%
GMK NucBox K2
AMD Ryzen 7 7735HS
9436 Points +58%
Geekom A5
AMD Ryzen 7 5800H
8823 Points +48%
Acemagic AM20
AMD Ryzen 7 7735H
8612 Points +45%
Acemagic AD15
Intel Core i7-11800H
7976 Points +34%
Beelink SEi12 Core i5-1235U
Intel Core i5-1235U
7804 Points +31%
Minisforum Venus Series UM560 XT
AMD Ryzen 5 5600H
7253 Points +22%
NiPoGi CK10
Intel Core i5-12450H
6804 Points +14%
Beelink SER5
AMD Ryzen 5 5560U
5955 Points
Durchschnittliche AMD Ryzen 5 5560U
  ()
5955 Points 0%
HP ProBook 445 G10
AMD Ryzen 5 7530U
5608 Points -6%
Geekbench 5.5 / Single-Core
Beelink SER7
AMD Ryzen 7 7840HS
1983 Points +50%
Lenovo IdeaCentre Mini 01IRH8
Intel Core i7-13700H
1842 Points +40%
Intel NUC 13 Pro Desk Edition Kit
Intel Core i7-1360P
1832 Points +39%
GMK NucBox K3 Pro
Intel Core i7-12650H
1790 Points +36%
Lenovo ThinkPad T14s G4-21F8002TGE
AMD Ryzen 7 7840U
1775 Points +35%
NiPoGi CK10
Intel Core i5-12450H
1665 Points +26%
Beelink SEi12 Core i5-1235U
Intel Core i5-1235U
1633 Points +24%
Acemagic AD15
Intel Core i7-11800H
1603 Points +22%
GMK NucBox K2
AMD Ryzen 7 7735HS
1564 Points +19%
Acemagic AM20
AMD Ryzen 7 7735H
1563 Points +19%
Geekom A5
AMD Ryzen 7 5800H
1494 Points +13%
HP ProBook 445 G10
AMD Ryzen 5 7530U
1462 Points +11%
Minisforum Venus Series UM560 XT
AMD Ryzen 5 5600H
1443 Points +9%
Beelink SER5
AMD Ryzen 5 5560U
1318 Points
Durchschnittliche AMD Ryzen 5 5560U
  ()
1318 Points 0%
HWBOT x265 Benchmark v2.2 / 4k Preset
Beelink SER7
AMD Ryzen 7 7840HS
20.4 fps +104%
Lenovo IdeaCentre Mini 01IRH8
Intel Core i7-13700H
17.6 fps +76%
GMK NucBox K2
AMD Ryzen 7 7735HS
15.1 fps +51%
Lenovo ThinkPad T14s G4-21F8002TGE
AMD Ryzen 7 7840U
14.4 fps +44%
Acemagic AM20
AMD Ryzen 7 7735H
14.1 fps +41%
Intel NUC 13 Pro Desk Edition Kit
Intel Core i7-1360P
13.9 fps +39%
Geekom A5
AMD Ryzen 7 5800H
13.3 fps +33%
Minisforum Venus Series UM560 XT
AMD Ryzen 5 5600H
12.4 fps +24%
GMK NucBox K3 Pro
Intel Core i7-12650H
12.3 fps +23%
Acemagic AD15
Intel Core i7-11800H
12 fps +20%
Beelink SER5
AMD Ryzen 5 5560U
10 fps
Durchschnittliche AMD Ryzen 5 5560U
  ()
10 fps 0%
HP ProBook 445 G10
AMD Ryzen 5 7530U
9.95 fps 0%
NiPoGi CK10
Intel Core i5-12450H
9.47 fps -5%
Beelink SEi12 Core i5-1235U
Intel Core i5-1235U
9.43 fps -6%
LibreOffice / 20 Documents To PDF
Beelink SER5
AMD Ryzen 5 5560U
57.1 s *
Durchschnittliche AMD Ryzen 5 5560U
  ()
57.1 s * -0%
Minisforum Venus Series UM560 XT
AMD Ryzen 5 5600H
56.7 s * +1%
HP ProBook 445 G10
AMD Ryzen 5 7530U
54.4 s * +5%
Geekom A5
AMD Ryzen 7 5800H
54.3 s * +5%
Beelink SEi12 Core i5-1235U
Intel Core i5-1235U
48.7 s * +15%
Intel NUC 13 Pro Desk Edition Kit
Intel Core i7-1360P
46.9 s * +18%
Acemagic AD15
Intel Core i7-11800H
46.3 s * +19%
Acemagic AM20
AMD Ryzen 7 7735H
46.1 s * +19%
GMK NucBox K2
AMD Ryzen 7 7735HS
46 s * +19%
Lenovo ThinkPad T14s G4-21F8002TGE
AMD Ryzen 7 7840U
45.6 s * +20%
NiPoGi CK10
Intel Core i5-12450H
42.8 s * +25%
GMK NucBox K3 Pro
Intel Core i7-12650H
40 s * +30%
Beelink SER7
AMD Ryzen 7 7840HS
39.7 s * +30%
Lenovo IdeaCentre Mini 01IRH8
Intel Core i7-13700H
37.6 s * +34%
R Benchmark 2.5 / Overall mean
Beelink SER5
AMD Ryzen 5 5560U
0.584 sec *
Durchschnittliche AMD Ryzen 5 5560U
  ()
0.584 sec * -0%
Acemagic AD15
Intel Core i7-11800H
0.559 sec * +4%
Acemagic AM20
AMD Ryzen 7 7735H
0.536 sec * +8%
HP ProBook 445 G10
AMD Ryzen 5 7530U
0.528 sec * +10%
Minisforum Venus Series UM560 XT
AMD Ryzen 5 5600H
0.526 sec * +10%
Geekom A5
AMD Ryzen 7 5800H
0.523 sec * +10%
NiPoGi CK10
Intel Core i5-12450H
0.517 sec * +11%
Beelink SEi12 Core i5-1235U
Intel Core i5-1235U
0.512 sec * +12%
GMK NucBox K2
AMD Ryzen 7 7735HS
0.4924 sec * +16%
GMK NucBox K3 Pro
Intel Core i7-12650H
0.4701 sec * +20%
Lenovo ThinkPad T14s G4-21F8002TGE
AMD Ryzen 7 7840U
0.4653 sec * +20%
Lenovo IdeaCentre Mini 01IRH8
Intel Core i7-13700H
0.4512 sec * +23%
Intel NUC 13 Pro Desk Edition Kit
Intel Core i7-1360P
0.45 sec * +23%
Beelink SER7
AMD Ryzen 7 7840HS
0.4446 sec * +24%
Cinebench R23: Multi Core | Single Core
Cinebench R20: CPU (Multi Core) | CPU (Single Core)
Cinebench R15: CPU Multi 64Bit | CPU Single 64Bit
Blender: v2.79 BMW27 CPU
7-Zip 18.03: 7z b 4 | 7z b 4 -mmt1
Geekbench 5.5: Multi-Core | Single-Core
HWBOT x265 Benchmark v2.2: 4k Preset
LibreOffice : 20 Documents To PDF
R Benchmark 2.5: Overall mean

* ... kleinere Werte sind besser

Cinebench R15 CPU Multi 64Bit
1280 Points
Cinebench R15 OpenGL 64Bit
91.3 fps
Cinebench R15 Ref. Match 64Bit
97.9 %
Cinebench R15 CPU Single 64Bit
202 Points
Cinebench R20 CPU (Multi Core)
3019 Points
Cinebench R20 CPU (Single Core)
498 Points
Cinebench R23 Multi Core
7667 Points
Cinebench R23 Single Core
1260 Points
Hilfe
Performance Rating
Beelink SER7
AMD Ryzen 7 7840HS, Radeon 780M
99.3 pt
Geekom A5
AMD Ryzen 7 5800H, Vega 8
64.9 pt
Intel NUC 13 Pro Desk Edition Kit
Intel Core i7-1360P, Iris Xe G7 96EUs
55 pt
GMK NucBox K3 Pro
Intel Core i7-12650H, UHD Graphics 64EUs
53.2 pt
Beelink SER5
AMD Ryzen 5 5560U, Vega 6
47.4 pt
Beelink SEi12 Core i5-1235U
Intel Core i5-1235U, Iris Xe G7 80EUs
41.1 pt
AIDA64 / FP32 Ray-Trace
Beelink SER7
AMD Ryzen 7 7840HS, Radeon 780M
25685 KRay/s +189%
Geekom A5
AMD Ryzen 7 5800H, Vega 8
12468 KRay/s +40%
Intel NUC 13 Pro Desk Edition Kit
Intel Core i7-1360P, Iris Xe G7 96EUs
11188 KRay/s +26%
GMK NucBox K3 Pro
Intel Core i7-12650H, UHD Graphics 64EUs
9406 KRay/s +6%
Beelink SER5
AMD Ryzen 5 5560U, Vega 6
8895 KRay/s
Beelink SEi12 Core i5-1235U
Intel Core i5-1235U, Iris Xe G7 80EUs
6784 KRay/s -24%
AIDA64 / FPU Julia
Beelink SER7
AMD Ryzen 7 7840HS, Radeon 780M
109853 Points +93%
Geekom A5
AMD Ryzen 7 5800H, Vega 8
77847 Points +37%
Intel NUC 13 Pro Desk Edition Kit
Intel Core i7-1360P, Iris Xe G7 96EUs
56942 Points 0%
Beelink SER5
AMD Ryzen 5 5560U, Vega 6
56914 Points
GMK NucBox K3 Pro
Intel Core i7-12650H, UHD Graphics 64EUs
48790 Points -14%
Beelink SEi12 Core i5-1235U
Intel Core i5-1235U, Iris Xe G7 80EUs
34444 Points -39%
AIDA64 / CPU SHA3
Beelink SER7
AMD Ryzen 7 7840HS, Radeon 780M
4783 MB/s +146%
Geekom A5
AMD Ryzen 7 5800H, Vega 8
2707 MB/s +39%
Intel NUC 13 Pro Desk Edition Kit
Intel Core i7-1360P, Iris Xe G7 96EUs
2669 MB/s +37%
GMK NucBox K3 Pro
Intel Core i7-12650H, UHD Graphics 64EUs
2094 MB/s +8%
Beelink SER5
AMD Ryzen 5 5560U, Vega 6
1943 MB/s
Beelink SEi12 Core i5-1235U
Intel Core i5-1235U, Iris Xe G7 80EUs
1884 MB/s -3%
AIDA64 / CPU Queen
Beelink SER7
AMD Ryzen 7 7840HS, Radeon 780M
111969 Points +66%
Geekom A5
AMD Ryzen 7 5800H, Vega 8
91846 Points +36%
Intel NUC 13 Pro Desk Edition Kit
Intel Core i7-1360P, Iris Xe G7 96EUs
86881 Points +29%
GMK NucBox K3 Pro
Intel Core i7-12650H, UHD Graphics 64EUs
78091 Points +16%
Beelink SER5
AMD Ryzen 5 5560U, Vega 6
67352 Points
Beelink SEi12 Core i5-1235U
Intel Core i5-1235U, Iris Xe G7 80EUs
59756 Points -11%
AIDA64 / FPU SinJulia
Beelink SER7
AMD Ryzen 7 7840HS, Radeon 780M
14705 Points +73%
Geekom A5
AMD Ryzen 7 5800H, Vega 8
10972 Points +29%
Beelink SER5
AMD Ryzen 5 5560U, Vega 6
8505 Points
Intel NUC 13 Pro Desk Edition Kit
Intel Core i7-1360P, Iris Xe G7 96EUs
7246 Points -15%
GMK NucBox K3 Pro
Intel Core i7-12650H, UHD Graphics 64EUs
6561 Points -23%
Beelink SEi12 Core i5-1235U
Intel Core i5-1235U, Iris Xe G7 80EUs
4644 Points -45%
AIDA64 / FPU Mandel
Beelink SER7
AMD Ryzen 7 7840HS, Radeon 780M
58699 Points +87%
Geekom A5
AMD Ryzen 7 5800H, Vega 8
42543 Points +36%
Beelink SER5
AMD Ryzen 5 5560U, Vega 6
31339 Points
Intel NUC 13 Pro Desk Edition Kit
Intel Core i7-1360P, Iris Xe G7 96EUs
28019 Points -11%
GMK NucBox K3 Pro
Intel Core i7-12650H, UHD Graphics 64EUs
23640 Points -25%
Beelink SEi12 Core i5-1235U
Intel Core i5-1235U, Iris Xe G7 80EUs
16394 Points -48%
AIDA64 / CPU AES
Beelink SER7
AMD Ryzen 7 7840HS, Radeon 780M
161216 MB/s +104%
Geekom A5
AMD Ryzen 7 5800H, Vega 8
108262 MB/s +37%
GMK NucBox K3 Pro
Intel Core i7-12650H, UHD Graphics 64EUs
82548 MB/s +5%
Beelink SER5
AMD Ryzen 5 5560U, Vega 6
78948 MB/s
Beelink SEi12 Core i5-1235U
Intel Core i5-1235U, Iris Xe G7 80EUs
67140 MB/s -15%
Intel NUC 13 Pro Desk Edition Kit
Intel Core i7-1360P, Iris Xe G7 96EUs
53328 MB/s -32%
AIDA64 / CPU ZLib
Beelink SER7
AMD Ryzen 7 7840HS, Radeon 780M
949 MB/s +86%
Intel NUC 13 Pro Desk Edition Kit
Intel Core i7-1360P, Iris Xe G7 96EUs
775 MB/s +52%
Geekom A5
AMD Ryzen 7 5800H, Vega 8
700 MB/s +38%
Beelink SEi12 Core i5-1235U
Intel Core i5-1235U, Iris Xe G7 80EUs
633 MB/s +24%
GMK NucBox K3 Pro
Intel Core i7-12650H, UHD Graphics 64EUs
601 MB/s +18%
Beelink SER5
AMD Ryzen 5 5560U, Vega 6
509 MB/s
AIDA64 / FP64 Ray-Trace
Beelink SER7
AMD Ryzen 7 7840HS, Radeon 780M
13904 KRay/s +206%
Geekom A5
AMD Ryzen 7 5800H, Vega 8
6380 KRay/s +41%
Intel NUC 13 Pro Desk Edition Kit
Intel Core i7-1360P, Iris Xe G7 96EUs
5957 KRay/s +31%
GMK NucBox K3 Pro
Intel Core i7-12650H, UHD Graphics 64EUs
5237 KRay/s +15%
Beelink SER5
AMD Ryzen 5 5560U, Vega 6
4540 KRay/s
Beelink SEi12 Core i5-1235U
Intel Core i5-1235U, Iris Xe G7 80EUs
3532 KRay/s -22%
AIDA64 / CPU PhotoWorxx
GMK NucBox K3 Pro
Intel Core i7-12650H, UHD Graphics 64EUs
44164 MPixel/s +146%
Beelink SER7
AMD Ryzen 7 7840HS, Radeon 780M
41088 MPixel/s +129%
Beelink SEi12 Core i5-1235U
Intel Core i5-1235U, Iris Xe G7 80EUs
29523 MPixel/s +65%
Intel NUC 13 Pro Desk Edition Kit
Intel Core i7-1360P, Iris Xe G7 96EUs
29263 MPixel/s +63%
Geekom A5
AMD Ryzen 7 5800H, Vega 8
25113 MPixel/s +40%
Beelink SER5
AMD Ryzen 5 5560U, Vega 6
17917 MPixel/s

Systemleistung

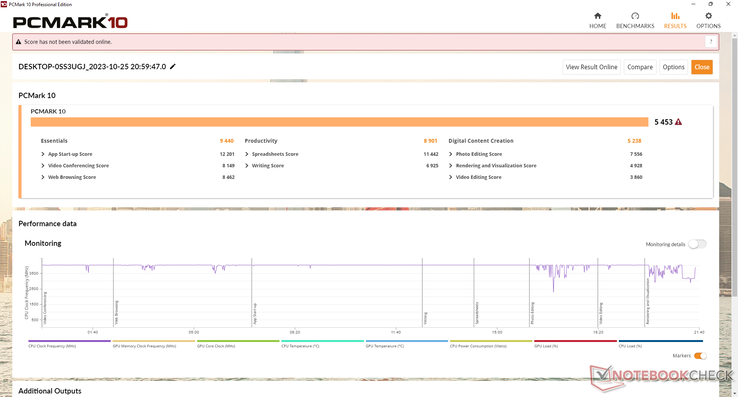
PCMark 10 Standard
PCMark 10 Standard
PCMark 10 / Score
Beelink SER7
Radeon 780M, R7 7840HS, Crucial P3 Plus CT1000P3PSSD8
7225 Points +32%
Geekom A5
Vega 8, R7 5800H, Lexar NM620 512GB
6149 Points +13%
Intel NUC 13 Pro Desk Edition Kit
Iris Xe G7 96EUs, i7-1360P, Samsung PM9A1 MZVL2512HCJQ
5882 Points +8%
GMK NucBox K3 Pro
UHD Graphics 64EUs, i7-12650H, Lexar NM610 Pro NM610P001T-HNNNG
5855 Points +7%
Beelink SEi12 Core i5-1235U
Iris Xe G7 80EUs, i5-1235U, Kingston NV1 SNVS/500GCN
5543 Points +2%
Beelink SER5
Vega 6, R5 5560U, Crucial P3 Plus CT1000P3PSSD8
5453 Points
PCMark 10 / Essentials
Intel NUC 13 Pro Desk Edition Kit
Iris Xe G7 96EUs, i7-1360P, Samsung PM9A1 MZVL2512HCJQ
11035 Points +17%
Beelink SEi12 Core i5-1235U
Iris Xe G7 80EUs, i5-1235U, Kingston NV1 SNVS/500GCN
10845 Points +15%
Beelink SER7
Radeon 780M, R7 7840HS, Crucial P3 Plus CT1000P3PSSD8
10819 Points +15%
GMK NucBox K3 Pro
UHD Graphics 64EUs, i7-12650H, Lexar NM610 Pro NM610P001T-HNNNG
10797 Points +14%
Geekom A5
Vega 8, R7 5800H, Lexar NM620 512GB
10356 Points +10%
Beelink SER5
Vega 6, R5 5560U, Crucial P3 Plus CT1000P3PSSD8
9440 Points
PCMark 10 / Productivity
Beelink SER7
Radeon 780M, R7 7840HS, Crucial P3 Plus CT1000P3PSSD8
10452 Points +17%
Geekom A5
Vega 8, R7 5800H, Lexar NM620 512GB
9311 Points +5%
Beelink SER5
Vega 6, R5 5560U, Crucial P3 Plus CT1000P3PSSD8
8901 Points
GMK NucBox K3 Pro
UHD Graphics 64EUs, i7-12650H, Lexar NM610 Pro NM610P001T-HNNNG
7803 Points -12%
Beelink SEi12 Core i5-1235U
Iris Xe G7 80EUs, i5-1235U, Kingston NV1 SNVS/500GCN
7354 Points -17%
Intel NUC 13 Pro Desk Edition Kit
Iris Xe G7 96EUs, i7-1360P, Samsung PM9A1 MZVL2512HCJQ
6576 Points -26%
PCMark 10 / Digital Content Creation
Beelink SER7
Radeon 780M, R7 7840HS, Crucial P3 Plus CT1000P3PSSD8
9052 Points +73%
Intel NUC 13 Pro Desk Edition Kit
Iris Xe G7 96EUs, i7-1360P, Samsung PM9A1 MZVL2512HCJQ
7612 Points +45%
Geekom A5
Vega 8, R7 5800H, Lexar NM620 512GB
6544 Points +25%
GMK NucBox K3 Pro
UHD Graphics 64EUs, i7-12650H, Lexar NM610 Pro NM610P001T-HNNNG
6468 Points +23%
Beelink SEi12 Core i5-1235U
Iris Xe G7 80EUs, i5-1235U, Kingston NV1 SNVS/500GCN
5798 Points +11%
Beelink SER5
Vega 6, R5 5560U, Crucial P3 Plus CT1000P3PSSD8
5238 Points
CrossMark / Overall
Beelink SER7
Radeon 780M, R7 7840HS, Crucial P3 Plus CT1000P3PSSD8
1700 Points +42%
Beelink SEi12 Core i5-1235U
Iris Xe G7 80EUs, i5-1235U, Kingston NV1 SNVS/500GCN
1644 Points +37%
Intel NUC 13 Pro Desk Edition Kit
Iris Xe G7 96EUs, i7-1360P, Samsung PM9A1 MZVL2512HCJQ
1596 Points +33%
GMK NucBox K3 Pro
UHD Graphics 64EUs, i7-12650H, Lexar NM610 Pro NM610P001T-HNNNG
1573 Points +32%
Geekom A5
Vega 8, R7 5800H, Lexar NM620 512GB
1429 Points +19%
Beelink SER5
Vega 6, R5 5560U, Crucial P3 Plus CT1000P3PSSD8
1196 Points
CrossMark / Productivity
Beelink SEi12 Core i5-1235U
Iris Xe G7 80EUs, i5-1235U, Kingston NV1 SNVS/500GCN
1676 Points +33%
Beelink SER7
Radeon 780M, R7 7840HS, Crucial P3 Plus CT1000P3PSSD8
1621 Points +29%
Intel NUC 13 Pro Desk Edition Kit
Iris Xe G7 96EUs, i7-1360P, Samsung PM9A1 MZVL2512HCJQ
1537 Points +22%
GMK NucBox K3 Pro
UHD Graphics 64EUs, i7-12650H, Lexar NM610 Pro NM610P001T-HNNNG
1503 Points +19%
Geekom A5
Vega 8, R7 5800H, Lexar NM620 512GB
1408 Points +12%
Beelink SER5
Vega 6, R5 5560U, Crucial P3 Plus CT1000P3PSSD8
1259 Points
CrossMark / Creativity
Beelink SER7
Radeon 780M, R7 7840HS, Crucial P3 Plus CT1000P3PSSD8
1953 Points +69%
Intel NUC 13 Pro Desk Edition Kit
Iris Xe G7 96EUs, i7-1360P, Samsung PM9A1 MZVL2512HCJQ
1769 Points +53%
GMK NucBox K3 Pro
UHD Graphics 64EUs, i7-12650H, Lexar NM610 Pro NM610P001T-HNNNG
1753 Points +52%
Beelink SEi12 Core i5-1235U
Iris Xe G7 80EUs, i5-1235U, Kingston NV1 SNVS/500GCN
1546 Points +34%
Geekom A5
Vega 8, R7 5800H, Lexar NM620 512GB
1523 Points +32%
Beelink SER5
Vega 6, R5 5560U, Crucial P3 Plus CT1000P3PSSD8
1153 Points
CrossMark / Responsiveness
Beelink SEi12 Core i5-1235U
Iris Xe G7 80EUs, i5-1235U, Kingston NV1 SNVS/500GCN
1867 Points +63%
Intel NUC 13 Pro Desk Edition Kit
Iris Xe G7 96EUs, i7-1360P, Samsung PM9A1 MZVL2512HCJQ
1311 Points +15%
GMK NucBox K3 Pro
UHD Graphics 64EUs, i7-12650H, Lexar NM610 Pro NM610P001T-HNNNG
1301 Points +14%
Beelink SER7
Radeon 780M, R7 7840HS, Crucial P3 Plus CT1000P3PSSD8
1293 Points +13%
Geekom A5
Vega 8, R7 5800H, Lexar NM620 512GB
1233 Points +8%
Beelink SER5
Vega 6, R5 5560U, Crucial P3 Plus CT1000P3PSSD8
1144 Points
PCMark 10 Score
5453 Punkte
Hilfe
AIDA64 / Memory Copy
GMK NucBox K3 Pro
Intel Core i7-12650H, UHD Graphics 64EUs
69735 MB/s +80%
Beelink SER7
AMD Ryzen 7 7840HS, Radeon 780M
69325 MB/s +79%
Intel NUC 13 Pro Desk Edition Kit
Intel Core i7-1360P, Iris Xe G7 96EUs
44299 MB/s +14%
Geekom A5
AMD Ryzen 7 5800H, Vega 8
43870 MB/s +13%
Beelink SEi12 Core i5-1235U
Intel Core i5-1235U, Iris Xe G7 80EUs
43215 MB/s +12%
Beelink SER5
AMD Ryzen 5 5560U, Vega 6
38690 MB/s
AIDA64 / Memory Read
GMK NucBox K3 Pro
Intel Core i7-12650H, UHD Graphics 64EUs
67412 MB/s +69%
Beelink SER7
AMD Ryzen 7 7840HS, Radeon 780M
61911 MB/s +56%
Beelink SEi12 Core i5-1235U
Intel Core i5-1235U, Iris Xe G7 80EUs
46616 MB/s +17%
Geekom A5
AMD Ryzen 7 5800H, Vega 8
46241 MB/s +16%
Intel NUC 13 Pro Desk Edition Kit
Intel Core i7-1360P, Iris Xe G7 96EUs
44751 MB/s +12%
Beelink SER5
AMD Ryzen 5 5560U, Vega 6
39794 MB/s
AIDA64 / Memory Write
Beelink SER7
AMD Ryzen 7 7840HS, Radeon 780M
87358 MB/s +112%
GMK NucBox K3 Pro
Intel Core i7-12650H, UHD Graphics 64EUs
59361 MB/s +44%
Beelink SEi12 Core i5-1235U
Intel Core i5-1235U, Iris Xe G7 80EUs
46475 MB/s +13%
Geekom A5
AMD Ryzen 7 5800H, Vega 8
46407 MB/s +13%
Intel NUC 13 Pro Desk Edition Kit
Intel Core i7-1360P, Iris Xe G7 96EUs
45887 MB/s +11%
Beelink SER5
AMD Ryzen 5 5560U, Vega 6
41162 MB/s
AIDA64 / Memory Latency
GMK NucBox K3 Pro
Intel Core i7-12650H, UHD Graphics 64EUs
97.2 ns * -4%
Intel NUC 13 Pro Desk Edition Kit
Intel Core i7-1360P, Iris Xe G7 96EUs
96.2 ns * -3%
Beelink SER5
AMD Ryzen 5 5560U, Vega 6
93.1 ns *
Beelink SEi12 Core i5-1235U
Intel Core i5-1235U, Iris Xe G7 80EUs
91.6 ns * +2%
Beelink SER7
AMD Ryzen 7 7840HS, Radeon 780M
85.1 ns * +9%
Geekom A5
AMD Ryzen 7 5800H, Vega 8
81.4 ns * +13%

* ... kleinere Werte sind besser

DPC Latency

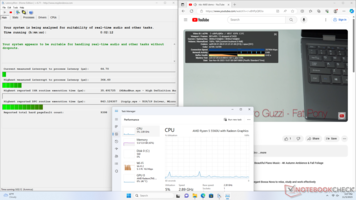
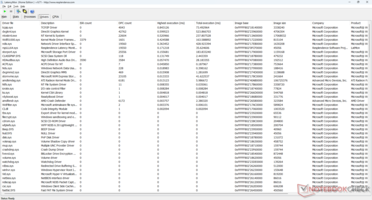
LatencyMon entdeckt keine größeren DPC-Probleme. Leider wird unser 4K/60-fps-YouTubevideo nicht perfekt wiedergegeben, wir messen 12 ausgelassene Bilder innerhalb einer Minute und das obwohl wir auf den neuesten Adrenalin-Treiber aufgerüstet haben.

LatencyMon
LatencyMon
Treiberliste
Treiberliste
DPC Latencies / LatencyMon - interrupt to process latency (max), Web, Youtube, Prime95
GMK NucBox K3 Pro
UHD Graphics 64EUs, i7-12650H, Lexar NM610 Pro NM610P001T-HNNNG
1415.8 μs * -288%
Geekom A5
Vega 8, R7 5800H, Lexar NM620 512GB
1310.5 μs * -259%
Intel NUC 13 Pro Desk Edition Kit
Iris Xe G7 96EUs, i7-1360P, Samsung PM9A1 MZVL2512HCJQ
1068.7 μs * -193%
Beelink SEi12 Core i5-1235U
Iris Xe G7 80EUs, i5-1235U, Kingston NV1 SNVS/500GCN
830.3 μs * -128%
Beelink SER7
Radeon 780M, R7 7840HS, Crucial P3 Plus CT1000P3PSSD8
647.9 μs * -78%
Beelink SER5
Vega 6, R5 5560U, Crucial P3 Plus CT1000P3PSSD8
364.6 μs *

* ... kleinere Werte sind besser

Massenspeicher

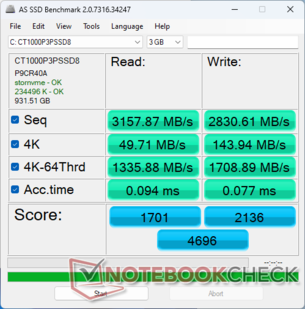
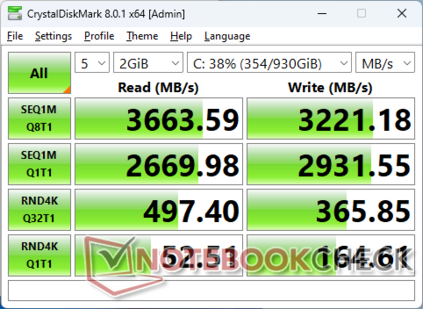
Unser Testmodell kommt mit der gleichen Crucial P3 Plus CT1000P3PSSD8, die auch im SER7 und im GTR7 zu finden ist. Die Geschwindigkeiten sind durch PCIe3 limitiert, der schnellere PCIe4-Standard könnte hier Abhilfe schaffen.

AS SSD
AS SSD
CDM 8
CDM 8
Primary M.2 PCIe3 x4 SSD
Sekundärer 2,5-Zoll-SATA-III-Slot
Crucial P3 Plus CT1000P3PSSD8
CDM 5/6 Read Seq Q32T1: 3667 MB/s
CDM 5/6 Write Seq Q32T1: 3215 MB/s
CDM 5/6 Read 4K Q32T1: 497.8 MB/s
CDM 5/6 Write 4K Q32T1: 367 MB/s
CDM 5 Read Seq: 2666 MB/s
CDM 5 Write Seq: 2911 MB/s
CDM 5/6 Read 4K: 52.16 MB/s
CDM 5/6 Write 4K: 160.6 MB/s
Drive Performance Rating - Percent
Intel NUC 13 Pro Desk Edition Kit
Samsung PM9A1 MZVL2512HCJQ
78.4 pt
Beelink SEi12 Core i5-1235U
Kingston NV1 SNVS/500GCN
76.6 pt
Beelink SER5
Crucial P3 Plus CT1000P3PSSD8
71.9 pt
Geekom A5
Lexar NM620 512GB
63.7 pt
Beelink SER7
Crucial P3 Plus CT1000P3PSSD8
59.6 pt
GMK NucBox K3 Pro
Lexar NM610 Pro NM610P001T-HNNNG
50.5 pt
DiskSpd
seq read
Intel NUC 13 Pro Desk Edition Kit
Samsung PM9A1 MZVL2512HCJQ
3337 (3301.03min - 3337.16max) MB/s +28%
Beelink SER7
Crucial P3 Plus CT1000P3PSSD8
2718 (2645.56min - 2717.91max) MB/s +4%
Beelink SER5
Crucial P3 Plus CT1000P3PSSD8
2615 (2607.21min - 2614.94max) MB/s
Beelink SEi12 Core i5-1235U
Kingston NV1 SNVS/500GCN
2512 (2493.51min - 2511.76max) MB/s -4%
Geekom A5
Lexar NM620 512GB
2371 (2315.68min - 2370.91max) MB/s -9%
GMK NucBox K3 Pro
Lexar NM610 Pro NM610P001T-HNNNG
2003 (1792.88min - 2003.18max) MB/s -23%
seq write
Beelink SER7
Crucial P3 Plus CT1000P3PSSD8
3404 (38.3min - 3403.58max) MB/s +18%
Intel NUC 13 Pro Desk Edition Kit
Samsung PM9A1 MZVL2512HCJQ
3356 (3181.73min - 3356.49max) MB/s +17%
Beelink SER5
Crucial P3 Plus CT1000P3PSSD8
2878 (2868.83min - 2877.62max) MB/s
Beelink SEi12 Core i5-1235U
Kingston NV1 SNVS/500GCN
2848 (2821.72min - 2847.93max) MB/s -1%
Geekom A5
Lexar NM620 512GB
2668 (292.6min - 2668max) MB/s -7%
GMK NucBox K3 Pro
Lexar NM610 Pro NM610P001T-HNNNG
1919 (1852.07min - 1919.04max) MB/s -33%
seq q8 t1 read
Intel NUC 13 Pro Desk Edition Kit
Samsung PM9A1 MZVL2512HCJQ
5438 (4937.74min - 5438.31max) MB/s +48%
Beelink SER7
Crucial P3 Plus CT1000P3PSSD8
4893 (3920.33min - 4893.08max) MB/s +33%
Beelink SER5
Crucial P3 Plus CT1000P3PSSD8
3673 (3327.76min - 3673.17max) MB/s
Beelink SEi12 Core i5-1235U
Kingston NV1 SNVS/500GCN
3632 (3373.44min - 3632.06max) MB/s -1%
GMK NucBox K3 Pro
Lexar NM610 Pro NM610P001T-HNNNG
3481 (3104.12min - 3480.68max) MB/s -5%
Geekom A5
Lexar NM620 512GB
3444 (2979.63min - 3443.98max) MB/s -6%
seq q8 t1 write
Intel NUC 13 Pro Desk Edition Kit
Samsung PM9A1 MZVL2512HCJQ
4955 (4929.56min - 4955.41max) MB/s +54%
Beelink SER5
Crucial P3 Plus CT1000P3PSSD8
3220 (3120.61min - 3219.7max) MB/s
Geekom A5
Lexar NM620 512GB
3117 (3075.4min - 3117.21max) MB/s -3%
Beelink SEi12 Core i5-1235U
Kingston NV1 SNVS/500GCN
2841 (2828.64min - 2841.01max) MB/s -12%
GMK NucBox K3 Pro
Lexar NM610 Pro NM610P001T-HNNNG
2408 (2336.17min - 2407.96max) MB/s -25%
Beelink SER7
Crucial P3 Plus CT1000P3PSSD8
739 (52.85min - 739.46max) MB/s -77%
4k q1 t1 read
Intel NUC 13 Pro Desk Edition Kit
Samsung PM9A1 MZVL2512HCJQ
84.5 (83.02min - 84.54max) MB/s +61%
Beelink SEi12 Core i5-1235U
Kingston NV1 SNVS/500GCN
79.3 (78.06min - 79.29max) MB/s +51%
Geekom A5
Lexar NM620 512GB
54.5 (37.15min - 54.54max) MB/s +4%
Beelink SER5
Crucial P3 Plus CT1000P3PSSD8
52.5 (52.31min - 52.46max) MB/s
GMK NucBox K3 Pro
Lexar NM610 Pro NM610P001T-HNNNG
50.3 (48.8min - 50.32max) MB/s -4%
Beelink SER7
Crucial P3 Plus CT1000P3PSSD8
44.2 (41.58min - 44.2max) MB/s -16%
4k q1 t1 write
Beelink SEi12 Core i5-1235U
Kingston NV1 SNVS/500GCN
391 (374.32min - 390.86max) MB/s +125%
Beelink SER5
Crucial P3 Plus CT1000P3PSSD8
173.4 (172.45min - 173.36max) MB/s
GMK NucBox K3 Pro
Lexar NM610 Pro NM610P001T-HNNNG
163.5 (154.58min - 163.51max) MB/s -6%
Geekom A5
Lexar NM620 512GB
148.4 (147.43min - 148.38max) MB/s -14%
Intel NUC 13 Pro Desk Edition Kit
Samsung PM9A1 MZVL2512HCJQ
144.6 (143.6min - 144.57max) MB/s -17%
Beelink SER7
Crucial P3 Plus CT1000P3PSSD8
139.4 (137.92min - 139.38max) MB/s -20%
4k q32 t16 read
Beelink SER7
Crucial P3 Plus CT1000P3PSSD8
2810 (2697.36min - 2809.61max) MB/s +1%
Beelink SER5
Crucial P3 Plus CT1000P3PSSD8
2781 (2776.44min - 2781.48max) MB/s
Geekom A5
Lexar NM620 512GB
1960 MB/s -30%
Beelink SEi12 Core i5-1235U
Kingston NV1 SNVS/500GCN
1942 (1940.61min - 1941.63max) MB/s -30%
GMK NucBox K3 Pro
Lexar NM610 Pro NM610P001T-HNNNG
1132 (1079.47min - 1132.07max) MB/s -59%
Intel NUC 13 Pro Desk Edition Kit
Samsung PM9A1 MZVL2512HCJQ
808 (792.58min - 807.51max) MB/s -71%
4k q32 t16 write
Beelink SEi12 Core i5-1235U
Kingston NV1 SNVS/500GCN
2219 (2197.25min - 2218.83max) MB/s 0%
Beelink SER5
Crucial P3 Plus CT1000P3PSSD8
2218 (2164.78min - 2217.8max) MB/s
Geekom A5
Lexar NM620 512GB
1370 (84.65min - 1370.23max) MB/s -38%
Beelink SER7
Crucial P3 Plus CT1000P3PSSD8
1066 (54.15min - 1066.13max) MB/s -52%
GMK NucBox K3 Pro
Lexar NM610 Pro NM610P001T-HNNNG
535 (489.88min - 535.49max) MB/s -76%
Intel NUC 13 Pro Desk Edition Kit
Samsung PM9A1 MZVL2512HCJQ
454 (443.2min - 453.53max) MB/s -80%
AS SSD
Score Total
Intel NUC 13 Pro Desk Edition Kit
Samsung PM9A1 MZVL2512HCJQ
5249 Points +12%
Beelink SER5
Crucial P3 Plus CT1000P3PSSD8
4696 Points
Beelink SEi12 Core i5-1235U
Kingston NV1 SNVS/500GCN
4619 Points -2%
Geekom A5
Lexar NM620 512GB
4006 Points -15%
GMK NucBox K3 Pro
Lexar NM610 Pro NM610P001T-HNNNG
3294 Points -30%
Beelink SER7
Crucial P3 Plus CT1000P3PSSD8
2617 Points -44%
Score Read
Beelink SER5
Crucial P3 Plus CT1000P3PSSD8
1701 Points
Beelink SEi12 Core i5-1235U
Kingston NV1 SNVS/500GCN
1633 Points -4%
Geekom A5
Lexar NM620 512GB
1502 Points -12%
GMK NucBox K3 Pro
Lexar NM610 Pro NM610P001T-HNNNG
1367 Points -20%
Intel NUC 13 Pro Desk Edition Kit
Samsung PM9A1 MZVL2512HCJQ
1320 Points -22%
Beelink SER7
Crucial P3 Plus CT1000P3PSSD8
1215 Points -29%
Score Write
Intel NUC 13 Pro Desk Edition Kit
Samsung PM9A1 MZVL2512HCJQ
3326 Points +56%
Beelink SEi12 Core i5-1235U
Kingston NV1 SNVS/500GCN
2278 Points +7%
Beelink SER5
Crucial P3 Plus CT1000P3PSSD8
2136 Points
Geekom A5
Lexar NM620 512GB
1739 Points -19%
GMK NucBox K3 Pro
Lexar NM610 Pro NM610P001T-HNNNG
1282 Points -40%
Beelink SER7
Crucial P3 Plus CT1000P3PSSD8
800 Points -63%
Seq Read
Intel NUC 13 Pro Desk Edition Kit
Samsung PM9A1 MZVL2512HCJQ
4536 MB/s +44%
Beelink SER7
Crucial P3 Plus CT1000P3PSSD8
3900.61 MB/s +24%
Beelink SEi12 Core i5-1235U
Kingston NV1 SNVS/500GCN
3206.84 MB/s +2%
Beelink SER5
Crucial P3 Plus CT1000P3PSSD8
3157.87 MB/s
Geekom A5
Lexar NM620 512GB
3020 MB/s -4%
GMK NucBox K3 Pro
Lexar NM610 Pro NM610P001T-HNNNG
2968.96 MB/s -6%
Seq Write
Beelink SER7
Crucial P3 Plus CT1000P3PSSD8
3390.67 MB/s +20%
Beelink SER5
Crucial P3 Plus CT1000P3PSSD8
2830.61 MB/s
Geekom A5
Lexar NM620 512GB
2714 MB/s -4%
Intel NUC 13 Pro Desk Edition Kit
Samsung PM9A1 MZVL2512HCJQ
2698 MB/s -5%
GMK NucBox K3 Pro
Lexar NM610 Pro NM610P001T-HNNNG
1698.68 MB/s -40%
Beelink SEi12 Core i5-1235U
Kingston NV1 SNVS/500GCN
463.76 MB/s -84%
4K Read
Intel NUC 13 Pro Desk Edition Kit
Samsung PM9A1 MZVL2512HCJQ
72 MB/s +45%
Beelink SEi12 Core i5-1235U
Kingston NV1 SNVS/500GCN
59.54 MB/s +20%
Geekom A5
Lexar NM620 512GB
57.7 MB/s +16%
GMK NucBox K3 Pro
Lexar NM610 Pro NM610P001T-HNNNG
51.31 MB/s +3%
Beelink SER5
Crucial P3 Plus CT1000P3PSSD8
49.71 MB/s
Beelink SER7
Crucial P3 Plus CT1000P3PSSD8
37.69 MB/s -24%
4K Write
Beelink SEi12 Core i5-1235U
Kingston NV1 SNVS/500GCN
280.94 MB/s +95%
GMK NucBox K3 Pro
Lexar NM610 Pro NM610P001T-HNNNG
205.98 MB/s +43%
Intel NUC 13 Pro Desk Edition Kit
Samsung PM9A1 MZVL2512HCJQ
166.8 MB/s +16%
Beelink SER5
Crucial P3 Plus CT1000P3PSSD8
143.94 MB/s
Beelink SER7
Crucial P3 Plus CT1000P3PSSD8
129.29 MB/s -10%
Geekom A5
Lexar NM620 512GB
125.5 MB/s -13%
4K-64 Read
Beelink SER5
Crucial P3 Plus CT1000P3PSSD8
1335.88 MB/s
Beelink SEi12 Core i5-1235U
Kingston NV1 SNVS/500GCN
1252.33 MB/s -6%
Geekom A5
Lexar NM620 512GB
1143 MB/s -14%
GMK NucBox K3 Pro
Lexar NM610 Pro NM610P001T-HNNNG
1018.3 MB/s -24%
Intel NUC 13 Pro Desk Edition Kit
Samsung PM9A1 MZVL2512HCJQ
794 MB/s -41%
Beelink SER7
Crucial P3 Plus CT1000P3PSSD8
787.73 MB/s -41%
4K-64 Write
Intel NUC 13 Pro Desk Edition Kit
Samsung PM9A1 MZVL2512HCJQ
2889 MB/s +69%
Beelink SEi12 Core i5-1235U
Kingston NV1 SNVS/500GCN
1950.21 MB/s +14%
Beelink SER5
Crucial P3 Plus CT1000P3PSSD8
1708.89 MB/s
Geekom A5
Lexar NM620 512GB
1342 MB/s -21%
GMK NucBox K3 Pro
Lexar NM610 Pro NM610P001T-HNNNG
906.2 MB/s -47%
Beelink SER7
Crucial P3 Plus CT1000P3PSSD8
331.93 MB/s -81%
Access Time Read
Beelink SER5
Crucial P3 Plus CT1000P3PSSD8
0.094 ms *
Geekom A5
Lexar NM620 512GB
0.08 ms * +15%
GMK NucBox K3 Pro
Lexar NM610 Pro NM610P001T-HNNNG
0.079 ms * +16%
Beelink SER7
Crucial P3 Plus CT1000P3PSSD8
0.066 ms * +30%
Intel NUC 13 Pro Desk Edition Kit
Samsung PM9A1 MZVL2512HCJQ
0.06 ms * +36%
Beelink SEi12 Core i5-1235U
Kingston NV1 SNVS/500GCN
0.049 ms * +48%
Access Time Write
GMK NucBox K3 Pro
Lexar NM610 Pro NM610P001T-HNNNG
0.367 ms * -377%
Geekom A5
Lexar NM620 512GB
0.13 ms * -69%
Beelink SER5
Crucial P3 Plus CT1000P3PSSD8
0.077 ms *
Beelink SER7
Crucial P3 Plus CT1000P3PSSD8
0.076 ms * +1%
Beelink SEi12 Core i5-1235U
Kingston NV1 SNVS/500GCN
0.07 ms * +9%
Intel NUC 13 Pro Desk Edition Kit
Samsung PM9A1 MZVL2512HCJQ
0.024 ms * +69%

* ... kleinere Werte sind besser

Disk Throttling: DiskSpd Read Loop, Queue Depth 8

018537055574092511101295148016651850203522202405259027752960314533303515Tooltip
Beelink SER5: Ø3663 (3379.77-3671.48)

Grafikleistung

Der Ryzen 5 5560U nutzt noch die ältere Radeon RX Vega 6 anstelle der Radeon 680M oder 780M, welche man in den neueren Zen-4-CPUs findet. Die RX Vega 6 lässt sich mit der Iris Xe 80 EUs vergleichen, die in den meisten Mini-PCs mit Core i5  zum Einsatz kommt. Die GPU ist dafür gedacht 4K-Inhalte zu streamen, die meisten 3D-Spiele laufen hingegen eher nicht flüssig. 

Cloud Gate
Cloud Gate
3DMark 11
3DMark 11
Fire Strike
Fire Strike
Time Spy
Time Spy
3DMark Performance Rating - Percent
Beelink SER7 -1!
AMD Radeon 780M, AMD Ryzen 7 7840HS
100 pt
Acemagic AM20
AMD Radeon 680M, AMD Ryzen 7 7735H
89.4 pt
GMK NucBox K2 -1!
AMD Radeon 680M, AMD Ryzen 7 7735HS
85.8 pt
Intel NUC 13 Pro Desk Edition Kit
Intel Iris Xe Graphics G7 96EUs, Intel Core i7-1360P
62.8 pt
Geekom A5
AMD Radeon RX Vega 8 (Ryzen 4000/5000), AMD Ryzen 7 5800H
56.6 pt
Lenovo IdeaCentre Mini 01IRH8 -1!
Intel Iris Xe Graphics G7 96EUs, Intel Core i7-13700H
54.6 pt
Minisforum Venus Series UM560 XT
AMD Radeon RX Vega 7, AMD Ryzen 5 5600H
49.8 pt
GMK NucBox K3 Pro -1!
Intel UHD Graphics 64EUs (Alder Lake 12th Gen), Intel Core i7-12650H
47.5 pt
Dell Inspiron 14 7435 2-in-1
AMD Radeon RX Vega 7, AMD Ryzen 5 7530U
46.7 pt
Beelink SEi12 Core i5-1235U
Intel Iris Xe Graphics G7 80EUs, Intel Core i5-1235U
43.4 pt
Beelink SER5
AMD Radeon RX Vega 6 (Ryzen 4000/5000), AMD Ryzen 5 5560U
38.4 pt
NiPoGi CK10
Intel UHD Graphics 64EUs (Alder Lake 12th Gen), Intel Core i5-12450H
34.3 pt
Durchschnittliche AMD Radeon RX Vega 6 (Ryzen 4000/5000)
 
33.6 pt
Acemagic AD15
Intel UHD Graphics Xe 32EUs (Tiger Lake-H), Intel Core i7-11800H
27.2 pt
3DMark 11 - 1280x720 Performance GPU
Beelink SER7
AMD Radeon 780M, AMD Ryzen 7 7840HS
12845 Points +189%
Acemagic AM20
AMD Radeon 680M, AMD Ryzen 7 7735H
11116 Points +150%
GMK NucBox K2
AMD Radeon 680M, AMD Ryzen 7 7735HS
10439 Points +135%
Intel NUC 13 Pro Desk Edition Kit
Intel Iris Xe Graphics G7 96EUs, Intel Core i7-1360P
7321 Points +65%
Geekom A5
AMD Radeon RX Vega 8 (Ryzen 4000/5000), AMD Ryzen 7 5800H
7101 Points +60%
Lenovo IdeaCentre Mini 01IRH8
Intel Iris Xe Graphics G7 96EUs, Intel Core i7-13700H
6914 Points +56%
Minisforum Venus Series UM560 XT
AMD Radeon RX Vega 7, AMD Ryzen 5 5600H
6079 Points +37%
Dell Inspiron 14 7435 2-in-1
AMD Radeon RX Vega 7, AMD Ryzen 5 7530U
6024 Points +36%
GMK NucBox K3 Pro
Intel UHD Graphics 64EUs (Alder Lake 12th Gen), Intel Core i7-12650H
5566 Points +25%
Beelink SEi12 Core i5-1235U
Intel Iris Xe Graphics G7 80EUs, Intel Core i5-1235U
5054 Points +14%
Beelink SER5
AMD Radeon RX Vega 6 (Ryzen 4000/5000), AMD Ryzen 5 5560U
4439 Points
Durchschnittliche AMD Radeon RX Vega 6 (Ryzen 4000/5000)
  (3401 - 4713, n=23)
4146 Points -7%
NiPoGi CK10
Intel UHD Graphics 64EUs (Alder Lake 12th Gen), Intel Core i5-12450H
3886 Points -12%
Acemagic AD15
Intel UHD Graphics Xe 32EUs (Tiger Lake-H), Intel Core i7-11800H
3168 Points -29%
3DMark
1280x720 Cloud Gate Standard Graphics
Acemagic AM20
AMD Radeon 680M, AMD Ryzen 7 7735H
45528 Points +99%
Geekom A5
AMD Radeon RX Vega 8 (Ryzen 4000/5000), AMD Ryzen 7 5800H
32875 Points +44%
Intel NUC 13 Pro Desk Edition Kit
Intel Iris Xe Graphics G7 96EUs, Intel Core i7-1360P
32427 Points +42%
Minisforum Venus Series UM560 XT
AMD Radeon RX Vega 7, AMD Ryzen 5 5600H
29927 Points +31%
Dell Inspiron 14 7435 2-in-1
AMD Radeon RX Vega 7, AMD Ryzen 5 7530U
28931 Points +27%
Beelink SER5
AMD Radeon RX Vega 6 (Ryzen 4000/5000), AMD Ryzen 5 5560U
22822 Points
Beelink SEi12 Core i5-1235U
Intel Iris Xe Graphics G7 80EUs, Intel Core i5-1235U
22363 Points -2%
Durchschnittliche AMD Radeon RX Vega 6 (Ryzen 4000/5000)
  (15227 - 24163, n=16)
20712 Points -9%
NiPoGi CK10
Intel UHD Graphics 64EUs (Alder Lake 12th Gen), Intel Core i5-12450H
19949 Points -13%
Acemagic AD15
Intel UHD Graphics Xe 32EUs (Tiger Lake-H), Intel Core i7-11800H
15662 Points -31%
1920x1080 Fire Strike Graphics
Beelink SER7
AMD Radeon 780M, AMD Ryzen 7 7840HS
8001 Points +162%
GMK NucBox K2
AMD Radeon 680M, AMD Ryzen 7 7735HS
7570 Points +148%
Acemagic AM20
AMD Radeon 680M, AMD Ryzen 7 7735H
7530 Points +146%
Intel NUC 13 Pro Desk Edition Kit
Intel Iris Xe Graphics G7 96EUs, Intel Core i7-1360P
5616 Points +84%
Lenovo IdeaCentre Mini 01IRH8
Intel Iris Xe Graphics G7 96EUs, Intel Core i7-13700H
4808 Points +57%
GMK NucBox K3 Pro
Intel UHD Graphics 64EUs (Alder Lake 12th Gen), Intel Core i7-12650H
4567 Points +49%
Geekom A5
AMD Radeon RX Vega 8 (Ryzen 4000/5000), AMD Ryzen 7 5800H
4567 Points +49%
Minisforum Venus Series UM560 XT
AMD Radeon RX Vega 7, AMD Ryzen 5 5600H
3971 Points +30%
Beelink SEi12 Core i5-1235U
Intel Iris Xe Graphics G7 80EUs, Intel Core i5-1235U
3939 Points +29%
Dell Inspiron 14 7435 2-in-1
AMD Radeon RX Vega 7, AMD Ryzen 5 7530U
3663 Points +20%
Beelink SER5
AMD Radeon RX Vega 6 (Ryzen 4000/5000), AMD Ryzen 5 5560U
3056 Points
NiPoGi CK10
Intel UHD Graphics 64EUs (Alder Lake 12th Gen), Intel Core i5-12450H
3026 Points -1%
Durchschnittliche AMD Radeon RX Vega 6 (Ryzen 4000/5000)
  (2122 - 3239, n=23)
2673 Points -13%
Acemagic AD15
Intel UHD Graphics Xe 32EUs (Tiger Lake-H), Intel Core i7-11800H
2495 Points -18%
2560x1440 Time Spy Graphics
Beelink SER7
AMD Radeon 780M, AMD Ryzen 7 7840HS
2908 Points +192%
GMK NucBox K2
AMD Radeon 680M, AMD Ryzen 7 7735HS
2436 Points +145%
Acemagic AM20
AMD Radeon 680M, AMD Ryzen 7 7735H
2429 Points +144%
Intel NUC 13 Pro Desk Edition Kit
Intel Iris Xe Graphics G7 96EUs, Intel Core i7-1360P
1672 Points +68%
Lenovo IdeaCentre Mini 01IRH8
Intel Iris Xe Graphics G7 96EUs, Intel Core i7-13700H
1508 Points +51%
Geekom A5
AMD Radeon RX Vega 8 (Ryzen 4000/5000), AMD Ryzen 7 5800H
1418 Points +42%
GMK NucBox K3 Pro
Intel UHD Graphics 64EUs (Alder Lake 12th Gen), Intel Core i7-12650H
1288 Points +29%
Minisforum Venus Series UM560 XT
AMD Radeon RX Vega 7, AMD Ryzen 5 5600H
1247 Points +25%
Beelink SEi12 Core i5-1235U
Intel Iris Xe Graphics G7 80EUs, Intel Core i5-1235U
1147 Points +15%
Dell Inspiron 14 7435 2-in-1
AMD Radeon RX Vega 7, AMD Ryzen 5 7530U
1118 Points +12%
Beelink SER5
AMD Radeon RX Vega 6 (Ryzen 4000/5000), AMD Ryzen 5 5560U
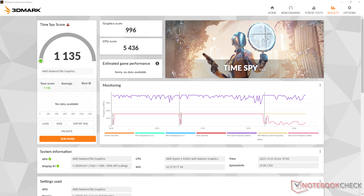
996 Points
NiPoGi CK10
Intel UHD Graphics 64EUs (Alder Lake 12th Gen), Intel Core i5-12450H
855 Points -14%
Durchschnittliche AMD Radeon RX Vega 6 (Ryzen 4000/5000)
  (650 - 996, n=22)
821 Points -18%
Acemagic AD15
Intel UHD Graphics Xe 32EUs (Tiger Lake-H), Intel Core i7-11800H
658 Points -34%
2560x1440 Time Spy Score
Beelink SER7
AMD Radeon 780M, AMD Ryzen 7 7840HS
3270 Points +188%
GMK NucBox K2
AMD Radeon 680M, AMD Ryzen 7 7735HS
2738 Points +141%
Acemagic AM20
AMD Radeon 680M, AMD Ryzen 7 7735H
2712 Points +139%
Intel NUC 13 Pro Desk Edition Kit
Intel Iris Xe Graphics G7 96EUs, Intel Core i7-1360P
1903 Points +68%
Lenovo IdeaCentre Mini 01IRH8
Intel Iris Xe Graphics G7 96EUs, Intel Core i7-13700H
1724 Points +52%
Geekom A5
AMD Radeon RX Vega 8 (Ryzen 4000/5000), AMD Ryzen 7 5800H
1620 Points +43%
GMK NucBox K3 Pro
Intel UHD Graphics 64EUs (Alder Lake 12th Gen), Intel Core i7-12650H
1478 Points +30%
Minisforum Venus Series UM560 XT
AMD Radeon RX Vega 7, AMD Ryzen 5 5600H
1420 Points +25%
Beelink SEi12 Core i5-1235U
Intel Iris Xe Graphics G7 80EUs, Intel Core i5-1235U
1311 Points +16%
Dell Inspiron 14 7435 2-in-1
AMD Radeon RX Vega 7, AMD Ryzen 5 7530U
1270 Points +12%
Beelink SER5
AMD Radeon RX Vega 6 (Ryzen 4000/5000), AMD Ryzen 5 5560U
1135 Points
NiPoGi CK10
Intel UHD Graphics 64EUs (Alder Lake 12th Gen), Intel Core i5-12450H
981 Points -14%
Durchschnittliche AMD Radeon RX Vega 6 (Ryzen 4000/5000)
  (744 - 1135, n=24)
938 Points -17%
Acemagic AD15
Intel UHD Graphics Xe 32EUs (Tiger Lake-H), Intel Core i7-11800H
763 Points -33%
3DMark 11 Performance
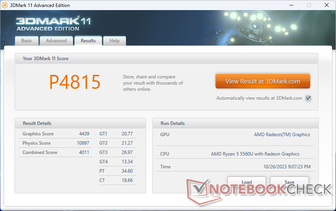
4815 Punkte
3DMark Cloud Gate Standard Score
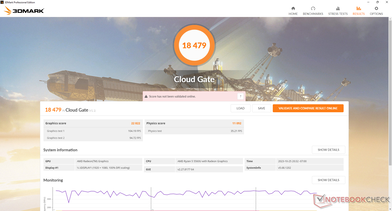
18479 Punkte
3DMark Fire Strike Score
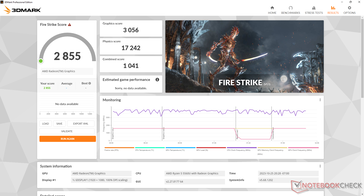
2855 Punkte
3DMark Time Spy Score
1135 Punkte
Hilfe
Blender
v3.3 Classroom HIP/AMD
Durchschnittliche AMD Radeon RX Vega 6 (Ryzen 4000/5000)
  (675 - 813, n=2)
744 Seconds * -10%
Beelink SER5
AMD Radeon RX Vega 6 (Ryzen 4000/5000), AMD Ryzen 5 5560U
675 Seconds *
Minisforum Venus Series UM560 XT
AMD Radeon RX Vega 7, AMD Ryzen 5 5600H
570 Seconds * +16%
Geekom A5
AMD Radeon RX Vega 8 (Ryzen 4000/5000), AMD Ryzen 7 5800H
477 Seconds * +29%
Acemagic AM20
AMD Radeon 680M, AMD Ryzen 7 7735H
284 Seconds * +58%
GMK NucBox K2
AMD Radeon 680M, AMD Ryzen 7 7735HS
270 Seconds * +60%
v3.3 Classroom CPU
Durchschnittliche AMD Radeon RX Vega 6 (Ryzen 4000/5000)
  (677 - 1170, n=3)
938 Seconds * -39%
NiPoGi CK10
Intel UHD Graphics 64EUs (Alder Lake 12th Gen), Intel Core i5-12450H
767 Seconds * -13%
Beelink SEi12 Core i5-1235U
Intel Iris Xe Graphics G7 80EUs, Intel Core i5-1235U
707 Seconds * -4%
Beelink SER5
AMD Radeon RX Vega 6 (Ryzen 4000/5000), AMD Ryzen 5 5560U
677 Seconds *
GMK NucBox K3 Pro
Intel UHD Graphics 64EUs (Alder Lake 12th Gen), Intel Core i7-12650H
570 Seconds * +16%
Acemagic AD15
Intel UHD Graphics Xe 32EUs (Tiger Lake-H), Intel Core i7-11800H
559 Seconds * +17%
Minisforum Venus Series UM560 XT
AMD Radeon RX Vega 7, AMD Ryzen 5 5600H
556 Seconds * +18%
Geekom A5
AMD Radeon RX Vega 8 (Ryzen 4000/5000), AMD Ryzen 7 5800H
513 Seconds * +24%
Acemagic AM20
AMD Radeon 680M, AMD Ryzen 7 7735H
487 Seconds * +28%
Intel NUC 13 Pro Desk Edition Kit
Intel Iris Xe Graphics G7 96EUs, Intel Core i7-1360P
477 Seconds * +30%
Lenovo IdeaCentre Mini 01IRH8
Intel Iris Xe Graphics G7 96EUs, Intel Core i7-13700H
441 Seconds * +35%
GMK NucBox K2
AMD Radeon 680M, AMD Ryzen 7 7735HS
438 Seconds * +35%
Beelink SER7
AMD Radeon 780M, AMD Ryzen 7 7840HS
318 Seconds * +53%

* ... kleinere Werte sind besser

Final Fantasy XV Benchmark
1280x720 Lite Quality
Beelink SER7
AMD Ryzen 7 7840HS, AMD Radeon 780M
76.5 fps +138%
Acemagic AM20
AMD Ryzen 7 7735H, AMD Radeon 680M
64.7 fps +101%
GMK NucBox K2
AMD Ryzen 7 7735HS, AMD Radeon 680M
63.4 fps +97%
Intel NUC 13 Pro Desk Edition Kit
Intel Core i7-1360P, Intel Iris Xe Graphics G7 96EUs
45.6 fps +42%
Geekom A5
AMD Ryzen 7 5800H, AMD Radeon RX Vega 8 (Ryzen 4000/5000)
45.3 fps +41%
Minisforum Venus Series UM560 XT
AMD Ryzen 5 5600H, AMD Radeon RX Vega 7
40.8 fps +27%
GMK NucBox K3 Pro
Intel Core i7-12650H, Intel UHD Graphics 64EUs (Alder Lake 12th Gen)
39.6 fps +23%
Lenovo IdeaCentre Mini 01IRH8
Intel Core i7-13700H, Intel Iris Xe Graphics G7 96EUs
37.4 fps +16%
Beelink SEi12 Core i5-1235U
Intel Core i5-1235U, Intel Iris Xe Graphics G7 80EUs
35.7 fps +11%
Beelink SER5
AMD Ryzen 5 5560U, AMD Radeon RX Vega 6 (Ryzen 4000/5000)
32.2 fps
NiPoGi CK10
Intel Core i5-12450H, Intel UHD Graphics 64EUs (Alder Lake 12th Gen)
28.1 fps -13%
Durchschnittliche AMD Radeon RX Vega 6 (Ryzen 4000/5000)
  (15.6 - 32.2, n=9)
25.9 fps -20%
Acemagic AD15
Intel Core i7-11800H, Intel UHD Graphics Xe 32EUs (Tiger Lake-H)
23.6 fps -27%
1920x1080 Standard Quality
Beelink SER7
AMD Ryzen 7 7840HS, AMD Radeon 780M
38.2 fps +137%
Acemagic AM20
AMD Ryzen 7 7735H, AMD Radeon 680M
35.5 fps +120%
GMK NucBox K2
AMD Ryzen 7 7735HS, AMD Radeon 680M
33 fps +105%
Intel NUC 13 Pro Desk Edition Kit
Intel Core i7-1360P, Intel Iris Xe Graphics G7 96EUs
24.3 fps +51%
Geekom A5
AMD Ryzen 7 5800H, AMD Radeon RX Vega 8 (Ryzen 4000/5000)
22.4 fps +39%
GMK NucBox K3 Pro
Intel Core i7-12650H, Intel UHD Graphics 64EUs (Alder Lake 12th Gen)
21.9 fps +36%
Minisforum Venus Series UM560 XT
AMD Ryzen 5 5600H, AMD Radeon RX Vega 7
20.2 fps +25%
Lenovo IdeaCentre Mini 01IRH8
Intel Core i7-13700H, Intel Iris Xe Graphics G7 96EUs
20 fps +24%
Beelink SEi12 Core i5-1235U
Intel Core i5-1235U, Intel Iris Xe Graphics G7 80EUs
19.3 fps +20%
Beelink SER5
AMD Ryzen 5 5560U, AMD Radeon RX Vega 6 (Ryzen 4000/5000)
16.1 fps
NiPoGi CK10
Intel Core i5-12450H, Intel UHD Graphics 64EUs (Alder Lake 12th Gen)
14.5 fps -10%
Durchschnittliche AMD Radeon RX Vega 6 (Ryzen 4000/5000)
  (10.6 - 16.1, n=8)
13.4 fps -17%
Acemagic AD15
Intel Core i7-11800H, Intel UHD Graphics Xe 32EUs (Tiger Lake-H)
12.4 fps -23%
1920x1080 High Quality
Beelink SER7
AMD Ryzen 7 7840HS, AMD Radeon 780M
28.5 fps +148%
Acemagic AM20
AMD Ryzen 7 7735H, AMD Radeon 680M
25.7 fps +123%
GMK NucBox K2
AMD Ryzen 7 7735HS, AMD Radeon 680M
24.8 fps +116%
Intel NUC 13 Pro Desk Edition Kit
Intel Core i7-1360P, Intel Iris Xe Graphics G7 96EUs
17.4 fps +51%
Geekom A5
AMD Ryzen 7 5800H, AMD Radeon RX Vega 8 (Ryzen 4000/5000)
15.9 fps +38%
GMK NucBox K3 Pro
Intel Core i7-12650H, Intel UHD Graphics 64EUs (Alder Lake 12th Gen)
15.2 fps +32%
Lenovo IdeaCentre Mini 01IRH8
Intel Core i7-13700H, Intel Iris Xe Graphics G7 96EUs
14.6 fps +27%
Minisforum Venus Series UM560 XT
AMD Ryzen 5 5600H, AMD Radeon RX Vega 7
14.3 fps +24%
Beelink SEi12 Core i5-1235U
Intel Core i5-1235U, Intel Iris Xe Graphics G7 80EUs
13.5 fps +17%
Beelink SER5
AMD Ryzen 5 5560U, AMD Radeon RX Vega 6 (Ryzen 4000/5000)
11.5 fps
NiPoGi CK10
Intel Core i5-12450H, Intel UHD Graphics 64EUs (Alder Lake 12th Gen)
10.4 fps -10%
Durchschnittliche AMD Radeon RX Vega 6 (Ryzen 4000/5000)
  (4.82 - 11.5, n=6)
8.6 fps -25%
Acemagic AD15
Intel Core i7-11800H, Intel UHD Graphics Xe 32EUs (Tiger Lake-H)
8.57 fps -25%
The Witcher 3
1024x768 Low Graphics & Postprocessing
Beelink SER7
AMD Ryzen 7 7840HS, AMD Radeon 780M
148.1 (121min) fps +152%
GMK NucBox K2
AMD Ryzen 7 7735HS, AMD Radeon 680M
121.6 (89min) fps +107%
Acemagic AM20
AMD Ryzen 7 7735H, AMD Radeon 680M
116.4 (10.1min, 21.9P0.1, 75.6P1) fps +98%
Intel NUC 13 Pro Desk Edition Kit
Intel Core i7-1360P, Intel Iris Xe Graphics G7 96EUs
102 fps +73%
Lenovo IdeaCentre Mini 01IRH8
Intel Core i7-13700H, Intel Iris Xe Graphics G7 96EUs
85.8 (61min) fps +46%
Geekom A5
AMD Ryzen 7 5800H, AMD Radeon RX Vega 8 (Ryzen 4000/5000)
85.6 (16min, 36.2P0.1, 60.2P1) fps +46%
GMK NucBox K3 Pro
Intel Core i7-12650H, Intel UHD Graphics 64EUs (Alder Lake 12th Gen)
85.3 (69min) fps +45%
Beelink SEi12 Core i5-1235U
Intel Core i5-1235U, Intel Iris Xe Graphics G7 80EUs
77.7 (46min) fps +32%
Minisforum Venus Series UM560 XT
AMD Ryzen 5 5600H, AMD Radeon RX Vega 7
75.4 fps +28%
NiPoGi CK10
Intel Core i5-12450H, Intel UHD Graphics 64EUs (Alder Lake 12th Gen)
59.5 (19.9min, 24.7P0.1, 33.7P1) fps +1%
Beelink SER5
AMD Ryzen 5 5560U, AMD Radeon RX Vega 6 (Ryzen 4000/5000)
58.8 (52min) fps
Acemagic AD15
Intel Core i7-11800H, Intel UHD Graphics Xe 32EUs (Tiger Lake-H)
47.3 (4.78min, 19.9P0.1, 25.3P1) fps -20%
Durchschnittliche AMD Radeon RX Vega 6 (Ryzen 4000/5000)
  (32.8 - 60, n=21)
46.9 fps -20%
1366x768 Medium Graphics & Postprocessing
Beelink SER7
AMD Ryzen 7 7840HS, AMD Radeon 780M
97.1 (91min) fps +149%
GMK NucBox K2
AMD Ryzen 7 7735HS, AMD Radeon 680M
75.9 (71min) fps +95%
GMK NucBox K3 Pro
Intel Core i7-12650H, Intel UHD Graphics 64EUs (Alder Lake 12th Gen)
56 (53min) fps +44%
Lenovo IdeaCentre Mini 01IRH8
Intel Core i7-13700H, Intel Iris Xe Graphics G7 96EUs
54.3 (52min) fps +39%
Geekom A5
AMD Ryzen 7 5800H, AMD Radeon RX Vega 8 (Ryzen 4000/5000)
54.1 (16.8min, 34.9P0.1, 43.7P1) fps +39%
Acemagic AM20
AMD Ryzen 7 7735H, AMD Radeon 680M
51.4 (16.6min, 27.5P0.1, 43.3P1) fps +32%
Beelink SEi12 Core i5-1235U
Intel Core i5-1235U, Intel Iris Xe Graphics G7 80EUs
48.7 (43min) fps +25%
Minisforum Venus Series UM560 XT
AMD Ryzen 5 5600H, AMD Radeon RX Vega 7
45.4 fps +16%
Beelink SER5
AMD Ryzen 5 5560U, AMD Radeon RX Vega 6 (Ryzen 4000/5000)
39 (36min) fps
NiPoGi CK10
Intel Core i5-12450H, Intel UHD Graphics 64EUs (Alder Lake 12th Gen)
36.4 (17.3min, 17.8P0.1, 20.4P1) fps -7%
Durchschnittliche AMD Radeon RX Vega 6 (Ryzen 4000/5000)
  (21.3 - 39, n=13)
29.6 fps -24%
1920x1080 High Graphics & Postprocessing (Nvidia HairWorks Off)
Beelink SER7
AMD Ryzen 7 7840HS, AMD Radeon 780M
49 (45min) fps +161%
Acemagic AM20
AMD Ryzen 7 7735H, AMD Radeon 680M
40.2 (12.2min, 17.8P0.1, 30.7P1) fps +114%
GMK NucBox K2
AMD Ryzen 7 7735HS, AMD Radeon 680M
37.9 (35min) fps +102%
Intel NUC 13 Pro Desk Edition Kit
Intel Core i7-1360P, Intel Iris Xe Graphics G7 96EUs
33.5 fps +78%
GMK NucBox K3 Pro
Intel Core i7-12650H, Intel UHD Graphics 64EUs (Alder Lake 12th Gen)
30.1 (28min) fps +60%
Lenovo IdeaCentre Mini 01IRH8
Intel Core i7-13700H, Intel Iris Xe Graphics G7 96EUs
26.8 (26min) fps +43%
Beelink SEi12 Core i5-1235U
Intel Core i5-1235U, Intel Iris Xe Graphics G7 80EUs
26 (23min) fps +38%
Geekom A5
AMD Ryzen 7 5800H, AMD Radeon RX Vega 8 (Ryzen 4000/5000)
26 (20.8min, 21.4P0.1, 22.6P1) fps +38%
Minisforum Venus Series UM560 XT
AMD Ryzen 5 5600H, AMD Radeon RX Vega 7
23 fps +22%
NiPoGi CK10
Intel Core i5-12450H, Intel UHD Graphics 64EUs (Alder Lake 12th Gen)
19.2 (9.37min, 9.7P0.1, 10.7P1) fps +2%
Beelink SER5
AMD Ryzen 5 5560U, AMD Radeon RX Vega 6 (Ryzen 4000/5000)
18.8 (17min) fps
Acemagic AD15
Intel Core i7-11800H, Intel UHD Graphics Xe 32EUs (Tiger Lake-H)
16.1 (8.34min, 8.6P0.1, 8.83P1) fps -14%
Durchschnittliche AMD Radeon RX Vega 6 (Ryzen 4000/5000)
  (10.7 - 19.4, n=20)
15 fps -20%
1920x1080 Ultra Graphics & Postprocessing (HBAO+)
Beelink SER7
AMD Ryzen 7 7840HS, AMD Radeon 780M
30.5 (28min) fps +158%
Acemagic AM20
AMD Ryzen 7 7735H, AMD Radeon 680M
26.3 (13.4min, 14.2P0.1, 16.7P1) fps +123%
GMK NucBox K2
AMD Ryzen 7 7735HS, AMD Radeon 680M
22.7 (20min) fps +92%
Geekom A5
AMD Ryzen 7 5800H, AMD Radeon RX Vega 8 (Ryzen 4000/5000)
17.6 (14.7min, 14.7P0.1, 15.4P1) fps +49%
Intel NUC 13 Pro Desk Edition Kit
Intel Core i7-1360P, Intel Iris Xe Graphics G7 96EUs
16.9 fps +43%
Minisforum Venus Series UM560 XT
AMD Ryzen 5 5600H, AMD Radeon RX Vega 7
14.8 fps +25%
GMK NucBox K3 Pro
Intel Core i7-12650H, Intel UHD Graphics 64EUs (Alder Lake 12th Gen)
13.8 (12min) fps +17%
Lenovo IdeaCentre Mini 01IRH8
Intel Core i7-13700H, Intel Iris Xe Graphics G7 96EUs
12.4 (11min) fps +5%
Beelink SEi12 Core i5-1235U
Intel Core i5-1235U, Intel Iris Xe Graphics G7 80EUs
12.2 (11min) fps +3%
Beelink SER5
AMD Ryzen 5 5560U, AMD Radeon RX Vega 6 (Ryzen 4000/5000)
11.8 (11min) fps
Durchschnittliche AMD Radeon RX Vega 6 (Ryzen 4000/5000)
  (8.6 - 11.8, n=9)
10.4 fps -12%
NiPoGi CK10
Intel Core i5-12450H, Intel UHD Graphics 64EUs (Alder Lake 12th Gen)
9.57 (4.5min, 5.38P0.1, 5.84P1) fps -19%
Acemagic AD15
Intel Core i7-11800H, Intel UHD Graphics Xe 32EUs (Tiger Lake-H)
8.22 (4.84min, 4.86P0.1, 5.03P1) fps -30%
GTA V
1024x768 Lowest Settings possible
Beelink SER7
AMD Ryzen 7 7840HS, AMD Radeon 780M
166 (4.54min, 125P1) fps +49%
GMK NucBox K2
AMD Ryzen 7 7735HS, AMD Radeon 680M
152.3 (5.63min, 100P1) fps +37%
Acemagic AM20
AMD Ryzen 7 7735H, AMD Radeon 680M
144.2 (9.88min, 90.9P1) fps +30%
Minisforum Venus Series UM560 XT
AMD Ryzen 5 5600H, AMD Radeon RX Vega 7
140.7 (5.04min, 90.9P1) fps +27%
Geekom A5
AMD Ryzen 7 5800H, AMD Radeon RX Vega 8 (Ryzen 4000/5000)
140.1 (17.4min, 90.9P1) fps +26%
Intel NUC 13 Pro Desk Edition Kit
Intel Core i7-1360P, Intel Iris Xe Graphics G7 96EUs
124.5 (12.7min, 76.9P1) fps +12%
Beelink SEi12 Core i5-1235U
Intel Core i5-1235U, Intel Iris Xe Graphics G7 80EUs
117.5 (24.8min, 71.4P1) fps +6%
Beelink SER5
AMD Ryzen 5 5560U, AMD Radeon RX Vega 6 (Ryzen 4000/5000)
111.2 (8.07min, 76.9P1) fps
NiPoGi CK10
Intel Core i5-12450H, Intel UHD Graphics 64EUs (Alder Lake 12th Gen)
108.8 (14.4min, 71.4P1) fps -2%
Lenovo IdeaCentre Mini 01IRH8
Intel Core i7-13700H, Intel Iris Xe Graphics G7 96EUs
103.8 (6.31min, 71.4P1) fps -7%
Acemagic AD15
Intel Core i7-11800H, Intel UHD Graphics Xe 32EUs (Tiger Lake-H)
100.8 (23.7min, 71.4P1) fps -9%
Durchschnittliche AMD Radeon RX Vega 6 (Ryzen 4000/5000)
  (78.2 - 111.2, n=6)
89.3 fps -20%
1920x1080 Lowest Settings possible
Beelink SER7
AMD Ryzen 7 7840HS, AMD Radeon 780M
129.1 (9.37min, 90.9P1) fps +102%
GMK NucBox K2
AMD Ryzen 7 7735HS, AMD Radeon 680M
112.4 (25min, 76.9P1) fps +76%
Acemagic AM20
AMD Ryzen 7 7735H, AMD Radeon 680M
112.4 (11.6min, 76.9P1) fps +76%
Intel NUC 13 Pro Desk Edition Kit
Intel Core i7-1360P, Intel Iris Xe Graphics G7 96EUs
87.6 (30.9min, 58.8P1) fps +37%
Geekom A5
AMD Ryzen 7 5800H, AMD Radeon RX Vega 8 (Ryzen 4000/5000)
86.7 (18.2min, 58.8P1) fps +35%
Minisforum Venus Series UM560 XT
AMD Ryzen 5 5600H, AMD Radeon RX Vega 7
81.3 (8.33min, 58.8P1) fps +27%
Beelink SEi12 Core i5-1235U
Intel Core i5-1235U, Intel Iris Xe Graphics G7 80EUs
67.2 (25.1min, 45.5P1) fps +5%
Lenovo IdeaCentre Mini 01IRH8
Intel Core i7-13700H, Intel Iris Xe Graphics G7 96EUs
64.6 (20.6min, 45.5P1) fps +1%
Beelink SER5
AMD Ryzen 5 5560U, AMD Radeon RX Vega 6 (Ryzen 4000/5000)
64 (8.04min, 45.5P1) fps
NiPoGi CK10
Intel Core i5-12450H, Intel UHD Graphics 64EUs (Alder Lake 12th Gen)
58.8 (28.4min, 43.5P1) fps -8%
Durchschnittliche AMD Radeon RX Vega 6 (Ryzen 4000/5000)
  (49.5 - 64, n=4)
54.9 fps -14%
Acemagic AD15
Intel Core i7-11800H, Intel UHD Graphics Xe 32EUs (Tiger Lake-H)
51.2 (9.34min, 38.5P1) fps -20%
1366x768 Normal/Off AF:4x
Beelink SER7
AMD Ryzen 7 7840HS, AMD Radeon 780M
158.4 (14.6min, 111.1P1) fps +62%
GMK NucBox K2
AMD Ryzen 7 7735HS, AMD Radeon 680M
139.1 (7.31min, 90.9P1) fps +43%
Acemagic AM20
AMD Ryzen 7 7735H, AMD Radeon 680M
130.5 (10.5min, 83.3P1) fps +34%
Minisforum Venus Series UM560 XT
AMD Ryzen 5 5600H, AMD Radeon RX Vega 7
123 (64.2min, 83.3P1) fps +26%
Geekom A5
AMD Ryzen 7 5800H, AMD Radeon RX Vega 8 (Ryzen 4000/5000)
122.2 (9.95min, 76.9P1) fps +25%
Intel NUC 13 Pro Desk Edition Kit
Intel Core i7-1360P, Intel Iris Xe Graphics G7 96EUs
101.9 (27.6min, 62.5P1) fps +5%
Beelink SEi12 Core i5-1235U
Intel Core i5-1235U, Intel Iris Xe Graphics G7 80EUs
98.7 (7.72min, 66.7P1) fps +1%
Beelink SER5
AMD Ryzen 5 5560U, AMD Radeon RX Vega 6 (Ryzen 4000/5000)
97.5 (36.1min, 62.5P1) fps
NiPoGi CK10
Intel Core i5-12450H, Intel UHD Graphics 64EUs (Alder Lake 12th Gen)
91.9 (52.8min, 62.5P1) fps -6%
Acemagic AD15
Intel Core i7-11800H, Intel UHD Graphics Xe 32EUs (Tiger Lake-H)
89.6 (7.2min, 62.5P1) fps -8%
Lenovo IdeaCentre Mini 01IRH8
Intel Core i7-13700H, Intel Iris Xe Graphics G7 96EUs
84 (16.1min, 55.6P1) fps -14%
Durchschnittliche AMD Radeon RX Vega 6 (Ryzen 4000/5000)
  (69.9 - 97.5, n=5)
80.7 fps -17%
1920x1080 Normal/Off AF:4x
Beelink SER7
AMD Ryzen 7 7840HS, AMD Radeon 780M
132.3 (14.1min, 83.3P1) fps +106%
GMK NucBox K2
AMD Ryzen 7 7735HS, AMD Radeon 680M
113.3 (11.4min, 71.4P1) fps +77%
Acemagic AM20
AMD Ryzen 7 7735H, AMD Radeon 680M
111.3 (10.5min, 71.4P1) fps +74%
Geekom A5
AMD Ryzen 7 5800H, AMD Radeon RX Vega 8 (Ryzen 4000/5000)
88.2 (28.6min, 55.6P1) fps +38%
Minisforum Venus Series UM560 XT
AMD Ryzen 5 5600H, AMD Radeon RX Vega 7
82.7 (12.3min, 58.8P1) fps +29%
Intel NUC 13 Pro Desk Edition Kit
Intel Core i7-1360P, Intel Iris Xe Graphics G7 96EUs
74.8 (27min, 47.6P1) fps +17%
Beelink SEi12 Core i5-1235U
Intel Core i5-1235U, Intel Iris Xe Graphics G7 80EUs
64.7 (21.2min, 43.5P1) fps +1%
Beelink SER5
AMD Ryzen 5 5560U, AMD Radeon RX Vega 6 (Ryzen 4000/5000)
64.1 (29.4min, 45.5P1) fps
NiPoGi CK10
Intel Core i5-12450H, Intel UHD Graphics 64EUs (Alder Lake 12th Gen)
59.2 (24min, 43.5P1) fps -8%
Lenovo IdeaCentre Mini 01IRH8
Intel Core i7-13700H, Intel Iris Xe Graphics G7 96EUs
57.5 (17.4min, 38.5P1) fps -10%
Durchschnittliche AMD Radeon RX Vega 6 (Ryzen 4000/5000)
  (50.1 - 64.1, n=5)
54.8 fps -15%
Acemagic AD15
Intel Core i7-11800H, Intel UHD Graphics Xe 32EUs (Tiger Lake-H)
52 (25.2min, 37P1) fps -19%
1920x1080 High/On (Advanced Graphics Off) AA:2xMSAA + FX AF:8x
Beelink SER7
AMD Ryzen 7 7840HS, AMD Radeon 780M
68.3 (4.5min, 45.5P1) fps +178%
Acemagic AM20
AMD Ryzen 7 7735H, AMD Radeon 680M
52.9 (4min, 35.7P1) fps +115%
GMK NucBox K2
AMD Ryzen 7 7735HS, AMD Radeon 680M
51.9 (5.75min, 35.7P1) fps +111%
Geekom A5
AMD Ryzen 7 5800H, AMD Radeon RX Vega 8 (Ryzen 4000/5000)
35.1 (10.8min, 25.6P1) fps +43%
Minisforum Venus Series UM560 XT
AMD Ryzen 5 5600H, AMD Radeon RX Vega 7
31.7 (15.9min, 23.3P1) fps +29%
Beelink SER5
AMD Ryzen 5 5560U, AMD Radeon RX Vega 6 (Ryzen 4000/5000)
24.6 (11.1min, 17.9P1) fps
Durchschnittliche AMD Radeon RX Vega 6 (Ryzen 4000/5000)
  (20.1 - 24.6, n=6)
21.5 fps -13%
Intel NUC 13 Pro Desk Edition Kit
Intel Core i7-1360P, Intel Iris Xe Graphics G7 96EUs
20.9 (10.5min, 16.7P1) fps -15%
Beelink SEi12 Core i5-1235U
Intel Core i5-1235U, Intel Iris Xe Graphics G7 80EUs
17.2 (9.35min, 13.5P1) fps -30%
Lenovo IdeaCentre Mini 01IRH8
Intel Core i7-13700H, Intel Iris Xe Graphics G7 96EUs
15.9 (6.66min, 12.5P1) fps -35%
Acemagic AD15
Intel Core i7-11800H, Intel UHD Graphics Xe 32EUs (Tiger Lake-H)
13.7 (7.54min, 9.71P1) fps -44%
1920x1080 Highest Settings possible AA:4xMSAA + FX AF:16x
Beelink SER7
AMD Ryzen 7 7840HS, AMD Radeon 780M
27.5 (3.06min, 18.9P1) fps +146%
GMK NucBox K2
AMD Ryzen 7 7735HS, AMD Radeon 680M
24 (5.07min, 15.9P1) fps +114%
Acemagic AM20
AMD Ryzen 7 7735H, AMD Radeon 680M
23.2 (3.58min, 16.4P1) fps +107%
Geekom A5
AMD Ryzen 7 5800H, AMD Radeon RX Vega 8 (Ryzen 4000/5000)
15.5 (4.68min, 11.4P1) fps +38%
Minisforum Venus Series UM560 XT
AMD Ryzen 5 5600H, AMD Radeon RX Vega 7
15 (2.37min, 10.6P1) fps +34%
Beelink SER5
AMD Ryzen 5 5560U, AMD Radeon RX Vega 6 (Ryzen 4000/5000)
11.2 (6.84min, 7.58P1) fps
Durchschnittliche AMD Radeon RX Vega 6 (Ryzen 4000/5000)
  (8 - 11.2, n=6)
9.37 fps -16%
Intel NUC 13 Pro Desk Edition Kit
Intel Core i7-1360P, Intel Iris Xe Graphics G7 96EUs
8.8 (4.66min, 7.35P1) fps -21%
Beelink SEi12 Core i5-1235U
Intel Core i5-1235U, Intel Iris Xe Graphics G7 80EUs
7.41 (3.52min, 4.12P1) fps -34%
Lenovo IdeaCentre Mini 01IRH8
Intel Core i7-13700H, Intel Iris Xe Graphics G7 96EUs
6.8 (3.29min, 3.76P1) fps -39%
X-Plane 11.11
1280x720 low (fps_test=1)
GMK NucBox K2
AMD Ryzen 7 7735HS, AMD Radeon 680M
66.7 fps +76%
Beelink SER7
AMD Ryzen 7 7840HS, AMD Radeon 780M
57.8 fps +52%
Acemagic AM20
AMD Ryzen 7 7735H, AMD Radeon 680M
56.7 fps +49%
Intel NUC 13 Pro Desk Edition Kit
Intel Core i7-1360P, Intel Iris Xe Graphics G7 96EUs
54.6 fps +44%
Geekom A5
AMD Ryzen 7 5800H, AMD Radeon RX Vega 8 (Ryzen 4000/5000)
52.6 fps +38%
Minisforum Venus Series UM560 XT
AMD Ryzen 5 5600H, AMD Radeon RX Vega 7
49.5 fps +30%
Beelink SEi12 Core i5-1235U
Intel Core i5-1235U, Intel Iris Xe Graphics G7 80EUs
48.4 fps +27%
Lenovo IdeaCentre Mini 01IRH8
Intel Core i7-13700H, Intel Iris Xe Graphics G7 96EUs
43.4 fps +14%
GMK NucBox K3 Pro
Intel Core i7-12650H, Intel UHD Graphics 64EUs (Alder Lake 12th Gen)
41.3 fps +9%
Acemagic AD15
Intel Core i7-11800H, Intel UHD Graphics Xe 32EUs (Tiger Lake-H)
38.4 fps +1%
Durchschnittliche AMD Radeon RX Vega 6 (Ryzen 4000/5000)
  (33.1 - 45.6, n=20)
38.2 fps +1%
Beelink SER5
AMD Ryzen 5 5560U, AMD Radeon RX Vega 6 (Ryzen 4000/5000)
38 fps
NiPoGi CK10
Intel Core i5-12450H, Intel UHD Graphics 64EUs (Alder Lake 12th Gen)
36.2 fps -5%
1920x1080 med (fps_test=2)
GMK NucBox K2
AMD Ryzen 7 7735HS, AMD Radeon 680M
52.8 fps +93%
Acemagic AM20
AMD Ryzen 7 7735H, AMD Radeon 680M
44 fps +61%
Beelink SER7
AMD Ryzen 7 7840HS, AMD Radeon 780M
43.5 fps +59%
Intel NUC 13 Pro Desk Edition Kit
Intel Core i7-1360P, Intel Iris Xe Graphics G7 96EUs
41 fps +50%
Geekom A5
AMD Ryzen 7 5800H, AMD Radeon RX Vega 8 (Ryzen 4000/5000)
39.3 fps +43%
Minisforum Venus Series UM560 XT
AMD Ryzen 5 5600H, AMD Radeon RX Vega 7
37 fps +35%
GMK NucBox K3 Pro
Intel Core i7-12650H, Intel UHD Graphics 64EUs (Alder Lake 12th Gen)
33.1 fps +21%
Lenovo IdeaCentre Mini 01IRH8
Intel Core i7-13700H, Intel Iris Xe Graphics G7 96EUs
32.9 fps +20%
Beelink SEi12 Core i5-1235U
Intel Core i5-1235U, Intel Iris Xe Graphics G7 80EUs
32.8 fps +20%
Durchschnittliche AMD Radeon RX Vega 6 (Ryzen 4000/5000)
  (25.2 - 33.8, n=20)
28.8 fps +5%
Beelink SER5
AMD Ryzen 5 5560U, AMD Radeon RX Vega 6 (Ryzen 4000/5000)
27.4 fps
Acemagic AD15
Intel Core i7-11800H, Intel UHD Graphics Xe 32EUs (Tiger Lake-H)
25.8 fps -6%
NiPoGi CK10
Intel Core i5-12450H, Intel UHD Graphics 64EUs (Alder Lake 12th Gen)
24.2 fps -12%
1920x1080 high (fps_test=3)
GMK NucBox K2
AMD Ryzen 7 7735HS, AMD Radeon 680M
42.4 fps +75%
Beelink SER7
AMD Ryzen 7 7840HS, AMD Radeon 780M
36.5 fps +51%
Intel NUC 13 Pro Desk Edition Kit
Intel Core i7-1360P, Intel Iris Xe Graphics G7 96EUs
35.4 fps +46%
Acemagic AM20
AMD Ryzen 7 7735H, AMD Radeon 680M
35.4 fps +46%
Geekom A5
AMD Ryzen 7 5800H, AMD Radeon RX Vega 8 (Ryzen 4000/5000)
34.2 fps +41%
Minisforum Venus Series UM560 XT
AMD Ryzen 5 5600H, AMD Radeon RX Vega 7
31.9 fps +32%
Beelink SEi12 Core i5-1235U
Intel Core i5-1235U, Intel Iris Xe Graphics G7 80EUs
29.5 fps +22%
Lenovo IdeaCentre Mini 01IRH8
Intel Core i7-13700H, Intel Iris Xe Graphics G7 96EUs
28.5 fps +18%
GMK NucBox K3 Pro
Intel Core i7-12650H, Intel UHD Graphics 64EUs (Alder Lake 12th Gen)
26 fps +7%
Durchschnittliche AMD Radeon RX Vega 6 (Ryzen 4000/5000)
  (22.6 - 29.9, n=20)
25.8 fps +7%
Beelink SER5
AMD Ryzen 5 5560U, AMD Radeon RX Vega 6 (Ryzen 4000/5000)
24.2 fps
Acemagic AD15
Intel Core i7-11800H, Intel UHD Graphics Xe 32EUs (Tiger Lake-H)
22.5 fps -7%
NiPoGi CK10
Intel Core i5-12450H, Intel UHD Graphics 64EUs (Alder Lake 12th Gen)
21.5 fps -11%
Dota 2 Reborn
1280x720 min (0/3) fastest
Beelink SER7
AMD Ryzen 7 7840HS, AMD Radeon 780M
156.9 (136.5min) fps +42%
GMK NucBox K2
AMD Ryzen 7 7735HS, AMD Radeon 680M
141.2 (122.4min) fps +28%
Minisforum Venus Series UM560 XT
AMD Ryzen 5 5600H, AMD Radeon RX Vega 7
137.7 (114.5min) fps +24%
Geekom A5
AMD Ryzen 7 5800H, AMD Radeon RX Vega 8 (Ryzen 4000/5000)
129.5 (112.6min) fps +17%
Acemagic AM20
AMD Ryzen 7 7735H, AMD Radeon 680M
125.7 (106.9min) fps +14%
GMK NucBox K3 Pro
Intel Core i7-12650H, Intel UHD Graphics 64EUs (Alder Lake 12th Gen)
119.5 (88.3min) fps +8%
Acemagic AD15
Intel Core i7-11800H, Intel UHD Graphics Xe 32EUs (Tiger Lake-H)
116 (101.7min) fps +5%
Intel NUC 13 Pro Desk Edition Kit
Intel Core i7-1360P, Intel Iris Xe Graphics G7 96EUs
113.8 (8.3min) fps +3%
Beelink SER5
AMD Ryzen 5 5560U, AMD Radeon RX Vega 6 (Ryzen 4000/5000)
110.7 (97.6min) fps
Lenovo IdeaCentre Mini 01IRH8
Intel Core i7-13700H, Intel Iris Xe Graphics G7 96EUs
110.5 (89min) fps 0%
NiPoGi CK10
Intel Core i5-12450H, Intel UHD Graphics 64EUs (Alder Lake 12th Gen)
106.2 (84.2min) fps -4%
Durchschnittliche AMD Radeon RX Vega 6 (Ryzen 4000/5000)
  (81.6 - 134.4, n=21)
96.2 fps -13%
Beelink SEi12 Core i5-1235U
Intel Core i5-1235U, Intel Iris Xe Graphics G7 80EUs
93.8 (8.8min) fps -15%
1366x768 med (1/3)
Beelink SER7
AMD Ryzen 7 7840HS, AMD Radeon 780M
121.1 (100.6min) fps +33%
GMK NucBox K2
AMD Ryzen 7 7735HS, AMD Radeon 680M
113.5 (96.1min) fps +25%
Geekom A5
AMD Ryzen 7 5800H, AMD Radeon RX Vega 8 (Ryzen 4000/5000)
108.6 (88.6min) fps +20%
Minisforum Venus Series UM560 XT
AMD Ryzen 5 5600H, AMD Radeon RX Vega 7
107.8 (86.5min) fps +19%
Acemagic AM20
AMD Ryzen 7 7735H, AMD Radeon 680M
102.8 (86.7min) fps +13%
GMK NucBox K3 Pro
Intel Core i7-12650H, Intel UHD Graphics 64EUs (Alder Lake 12th Gen)
93.4 (69.8min) fps +3%
Beelink SER5
AMD Ryzen 5 5560U, AMD Radeon RX Vega 6 (Ryzen 4000/5000)
90.8 (71min) fps
Beelink SEi12 Core i5-1235U
Intel Core i5-1235U, Intel Iris Xe Graphics G7 80EUs
88.7 (71min) fps -2%
Intel NUC 13 Pro Desk Edition Kit
Intel Core i7-1360P, Intel Iris Xe Graphics G7 96EUs
86.4 (68.3min) fps -5%
Lenovo IdeaCentre Mini 01IRH8
Intel Core i7-13700H, Intel Iris Xe Graphics G7 96EUs
82.8 (69min) fps -9%
NiPoGi CK10
Intel Core i5-12450H, Intel UHD Graphics 64EUs (Alder Lake 12th Gen)
79.2 (64.2min) fps -13%
Durchschnittliche AMD Radeon RX Vega 6 (Ryzen 4000/5000)
  (62.6 - 119.5, n=21)
76.1 fps -16%
Acemagic AD15
Intel Core i7-11800H, Intel UHD Graphics Xe 32EUs (Tiger Lake-H)
73.6 (65.4min) fps -19%
1920x1080 high (2/3)
Beelink SER7
AMD Ryzen 7 7840HS, AMD Radeon 780M
95.5 (85.2min) fps +96%
GMK NucBox K2
AMD Ryzen 7 7735HS, AMD Radeon 680M
84.2 (74.4min) fps +73%
Acemagic AM20
AMD Ryzen 7 7735H, AMD Radeon 680M
79.5 (69.9min) fps +63%
Geekom A5
AMD Ryzen 7 5800H, AMD Radeon RX Vega 8 (Ryzen 4000/5000)
67.7 (59.9min) fps +39%
Intel NUC 13 Pro Desk Edition Kit
Intel Core i7-1360P, Intel Iris Xe Graphics G7 96EUs
67.6 (58.9min) fps +39%
GMK NucBox K3 Pro
Intel Core i7-12650H, Intel UHD Graphics 64EUs (Alder Lake 12th Gen)
62.7 (57.3min) fps +29%
Minisforum Venus Series UM560 XT
AMD Ryzen 5 5600H, AMD Radeon RX Vega 7
62.1 (57.1min) fps +28%
Lenovo IdeaCentre Mini 01IRH8
Intel Core i7-13700H, Intel Iris Xe Graphics G7 96EUs
56.9 (52.4min) fps +17%
Beelink SER5
AMD Ryzen 5 5560U, AMD Radeon RX Vega 6 (Ryzen 4000/5000)
48.7 (44.8min) fps
Beelink SEi12 Core i5-1235U
Intel Core i5-1235U, Intel Iris Xe Graphics G7 80EUs
45.5 (42.6min) fps -7%
NiPoGi CK10
Intel Core i5-12450H, Intel UHD Graphics 64EUs (Alder Lake 12th Gen)
43.3 (40.5min) fps -11%
Durchschnittliche AMD Radeon RX Vega 6 (Ryzen 4000/5000)
  (32 - 70.9, n=21)
42.7 fps -12%
Acemagic AD15
Intel Core i7-11800H, Intel UHD Graphics Xe 32EUs (Tiger Lake-H)
37.1 (33.3min) fps -24%
1920x1080 ultra (3/3) best looking
Beelink SER7
AMD Ryzen 7 7840HS, AMD Radeon 780M
85.6 (74.9min) fps +89%
GMK NucBox K2
AMD Ryzen 7 7735HS, AMD Radeon 680M
73.7 (65.4min) fps +62%
Acemagic AM20
AMD Ryzen 7 7735H, AMD Radeon 680M
69.2 (61min) fps +52%
Geekom A5
AMD Ryzen 7 5800H, AMD Radeon RX Vega 8 (Ryzen 4000/5000)
63.7 (56min) fps +40%
Intel NUC 13 Pro Desk Edition Kit
Intel Core i7-1360P, Intel Iris Xe Graphics G7 96EUs
60.5 (52.3min) fps +33%
Minisforum Venus Series UM560 XT
AMD Ryzen 5 5600H, AMD Radeon RX Vega 7
58.2 (54min) fps +28%
GMK NucBox K3 Pro
Intel Core i7-12650H, Intel UHD Graphics 64EUs (Alder Lake 12th Gen)
57.5 (52.3min) fps +27%
Lenovo IdeaCentre Mini 01IRH8
Intel Core i7-13700H, Intel Iris Xe Graphics G7 96EUs
52 (47.1min) fps +15%
Beelink SER5
AMD Ryzen 5 5560U, AMD Radeon RX Vega 6 (Ryzen 4000/5000)
45.4 (42.4min) fps
Beelink SEi12 Core i5-1235U
Intel Core i5-1235U, Intel Iris Xe Graphics G7 80EUs
42.2 (39.3min) fps -7%
NiPoGi CK10
Intel Core i5-12450H, Intel UHD Graphics 64EUs (Alder Lake 12th Gen)
40.4 (37.2min) fps -11%
Durchschnittliche AMD Radeon RX Vega 6 (Ryzen 4000/5000)
  (30.4 - 66.1, n=21)
40 fps -12%
Acemagic AD15
Intel Core i7-11800H, Intel UHD Graphics Xe 32EUs (Tiger Lake-H)
33.8 (30.9min) fps -26%
F1 22
1280x720 Ultra Low Preset AA:T AF:16x
Beelink SER7
AMD Ryzen 7 7840HS, AMD Radeon 780M
164.2 (129min, 114P1) fps +167%
GMK NucBox K2
AMD Ryzen 7 7735HS, AMD Radeon 680M
147.3 (118min, 96P1) fps +140%
Acemagic AM20
AMD Ryzen 7 7735H, AMD Radeon 680M
136.4 (113min, 90P1) fps +122%
Geekom A5
AMD Ryzen 7 5800H, AMD Radeon RX Vega 8 (Ryzen 4000/5000)
89.3 (78min, 72P1) fps +45%
Minisforum Venus Series UM560 XT
AMD Ryzen 5 5600H, AMD Radeon RX Vega 7
80.8 (68min, 67P1) fps +31%
Intel NUC 13 Pro Desk Edition Kit
Intel Core i7-1360P, Intel Iris Xe Graphics G7 96EUs
80.1 (65min, 63P1) fps +30%
Lenovo IdeaCentre Mini 01IRH8
Intel Core i7-13700H, Intel Iris Xe Graphics G7 96EUs
71.6 (59min, 58P1) fps +16%
Beelink SER5
AMD Ryzen 5 5560U, AMD Radeon RX Vega 6 (Ryzen 4000/5000)
61.5 (52min, 51P1) fps
NiPoGi CK10
Intel Core i5-12450H, Intel UHD Graphics 64EUs (Alder Lake 12th Gen)
48.4 (40min, 39P1) fps -21%
Durchschnittliche AMD Radeon RX Vega 6 (Ryzen 4000/5000)
  (27.1 - 61.5, n=3)
48 fps -22%
Acemagic AD15
Intel Core i7-11800H, Intel UHD Graphics Xe 32EUs (Tiger Lake-H)
40.5 (33min, 33P1) fps -34%
1920x1080 Low Preset AA:T AF:16x
Beelink SER7
AMD Ryzen 7 7840HS, AMD Radeon 780M
94.6 (81min, 71P1) fps +192%
GMK NucBox K2
AMD Ryzen 7 7735HS, AMD Radeon 680M
82.6 (71min, 57P1) fps +155%
Acemagic AM20
AMD Ryzen 7 7735H, AMD Radeon 680M
80.2 (68min, 59P1) fps +148%
Geekom A5
AMD Ryzen 7 5800H, AMD Radeon RX Vega 8 (Ryzen 4000/5000)
48.8 (40min, 38P1) fps +51%
Intel NUC 13 Pro Desk Edition Kit
Intel Core i7-1360P, Intel Iris Xe Graphics G7 96EUs
47.6 (39min, 39P1) fps +47%
Minisforum Venus Series UM560 XT
AMD Ryzen 5 5600H, AMD Radeon RX Vega 7
42.3 (37min, 33P1) fps +31%
Lenovo IdeaCentre Mini 01IRH8
Intel Core i7-13700H, Intel Iris Xe Graphics G7 96EUs
39.2 (32min, 31P1) fps +21%
Beelink SER5
AMD Ryzen 5 5560U, AMD Radeon RX Vega 6 (Ryzen 4000/5000)
32.4 (28min, 26P1) fps
Durchschnittliche AMD Radeon RX Vega 6 (Ryzen 4000/5000)
  (17.4 - 40.9, n=4)
29.7 fps -8%
NiPoGi CK10
Intel Core i5-12450H, Intel UHD Graphics 64EUs (Alder Lake 12th Gen)
27.1 (21min, 21P1) fps -16%
Acemagic AD15
Intel Core i7-11800H, Intel UHD Graphics Xe 32EUs (Tiger Lake-H)
21.8 (18min, 18P1) fps -33%
1920x1080 Medium Preset AA:T AF:16x
Beelink SER7
AMD Ryzen 7 7840HS, AMD Radeon 780M
85.7 (72min, 66P1) fps +200%
GMK NucBox K2
AMD Ryzen 7 7735HS, AMD Radeon 680M
74.1 (61min, 47P1) fps +159%
Acemagic AM20
AMD Ryzen 7 7735H, AMD Radeon 680M
69.9 (60min, 45P1) fps +144%
Intel NUC 13 Pro Desk Edition Kit
Intel Core i7-1360P, Intel Iris Xe Graphics G7 96EUs
43.4 (36min, 36P1) fps +52%
Geekom A5
AMD Ryzen 7 5800H, AMD Radeon RX Vega 8 (Ryzen 4000/5000)
42.4 (33min, 35P1) fps +48%
Geekom A5
AMD Ryzen 7 5800H, AMD Radeon RX Vega 8 (Ryzen 4000/5000)
31.7 (28min, 27P1) fps +11%
Minisforum Venus Series UM560 XT
AMD Ryzen 5 5600H, AMD Radeon RX Vega 7
38 (31min, 31P1) fps +33%
Lenovo IdeaCentre Mini 01IRH8
Intel Core i7-13700H, Intel Iris Xe Graphics G7 96EUs
36.7 (30min, 30P1) fps +28%
Beelink SER5
AMD Ryzen 5 5560U, AMD Radeon RX Vega 6 (Ryzen 4000/5000)
28.6 (25min, 24P1) fps
Durchschnittliche AMD Radeon RX Vega 6 (Ryzen 4000/5000)
  (25.6 - 28.6, n=2)
27.1 fps -5%
NiPoGi CK10
Intel Core i5-12450H, Intel UHD Graphics 64EUs (Alder Lake 12th Gen)
24.3 (19min, 19P1) fps -15%
Acemagic AD15
Intel Core i7-11800H, Intel UHD Graphics Xe 32EUs (Tiger Lake-H)
19.6 (16min, 16P1) fps -31%
1920x1080 High Preset AA:T AF:16x
Beelink SER7
AMD Ryzen 7 7840HS, AMD Radeon 780M
63 (48min, 51P1) fps +192%
GMK NucBox K2
AMD Ryzen 7 7735HS, AMD Radeon 680M
54.7 (47min, 37P1) fps +153%
Acemagic AM20
AMD Ryzen 7 7735H, AMD Radeon 680M
50.5 (44min, 37P1) fps +134%
Intel NUC 13 Pro Desk Edition Kit
Intel Core i7-1360P, Intel Iris Xe Graphics G7 96EUs
31.7 (27min, 26P1) fps +47%
Minisforum Venus Series UM560 XT
AMD Ryzen 5 5600H, AMD Radeon RX Vega 7
28.2 (24min, 23P1) fps +31%
Lenovo IdeaCentre Mini 01IRH8
Intel Core i7-13700H, Intel Iris Xe Graphics G7 96EUs
27 (22min, 22P1) fps +25%
Beelink SER5
AMD Ryzen 5 5560U, AMD Radeon RX Vega 6 (Ryzen 4000/5000)
21.6 (18min, 18P1) fps
Durchschnittliche AMD Radeon RX Vega 6 (Ryzen 4000/5000)
  (18.9 - 21.6, n=2)
20.3 fps -6%
NiPoGi CK10
Intel Core i5-12450H, Intel UHD Graphics 64EUs (Alder Lake 12th Gen)
17.2 (14min, 13P1) fps -20%
Acemagic AD15
Intel Core i7-11800H, Intel UHD Graphics Xe 32EUs (Tiger Lake-H)
13.8 (11min, 11P1) fps -36%
1920x1080 Ultra High Preset AA:T AF:16x
Intel NUC 13 Pro Desk Edition Kit
Intel Core i7-1360P, Intel Iris Xe Graphics G7 96EUs
24 (20min, 20P1) fps +57%
Geekom A5
AMD Ryzen 7 5800H, AMD Radeon RX Vega 8 (Ryzen 4000/5000)
22.5 (19min, 19P1) fps +47%
Lenovo IdeaCentre Mini 01IRH8
Intel Core i7-13700H, Intel Iris Xe Graphics G7 96EUs
20.7 (17min, 17P1) fps +35%
Minisforum Venus Series UM560 XT
AMD Ryzen 5 5600H, AMD Radeon RX Vega 7
19.7 fps +29%
Beelink SER7
AMD Ryzen 7 7840HS, AMD Radeon 780M
17.7 (13min, 13P1) fps +16%
Beelink SER5
AMD Ryzen 5 5560U, AMD Radeon RX Vega 6 (Ryzen 4000/5000)
15.3 (13min, 13P1) fps
Durchschnittliche AMD Radeon RX Vega 6 (Ryzen 4000/5000)
  (13.5 - 15.3, n=2)
14.4 fps -6%
GMK NucBox K2
AMD Ryzen 7 7735HS, AMD Radeon 680M
13.9 (9min, 9P1) fps -9%
NiPoGi CK10
Intel Core i5-12450H, Intel UHD Graphics 64EUs (Alder Lake 12th Gen)
13.4 (9min, 10P1) fps -12%
Acemagic AM20
AMD Ryzen 7 7735H, AMD Radeon 680M
12.3 (9min, 9P1) fps -20%
Acemagic AD15
Intel Core i7-11800H, Intel UHD Graphics Xe 32EUs (Tiger Lake-H)
10.6 (9min, 9P1) fps -31%
Strange Brigade
1280x720 lowest AF:1
Beelink SER7
AMD Ryzen 7 7840HS, AMD Radeon 780M
163.2 (109.1min, 139.7P1) fps +107%
Acemagic AM20
AMD Ryzen 7 7735H, AMD Radeon 680M
148.9 (66.1min, 117.4P1) fps +89%
GMK NucBox K2
AMD Ryzen 7 7735HS, AMD Radeon 680M
147.3 (85.9min, 124P1) fps +87%
Geekom A5
AMD Ryzen 7 5800H, AMD Radeon RX Vega 8 (Ryzen 4000/5000)
100.9 (66.3min, 84.2P1) fps +28%
Intel NUC 13 Pro Desk Edition Kit
Intel Core i7-1360P, Intel Iris Xe Graphics G7 96EUs
99 (21.7min, 36.5P1) fps +25%
Minisforum Venus Series UM560 XT
AMD Ryzen 5 5600H, AMD Radeon RX Vega 7
94.4 (16.2min, 81.3P1) fps +20%
Lenovo IdeaCentre Mini 01IRH8
Intel Core i7-13700H, Intel Iris Xe Graphics G7 96EUs
89.2 (21.3min, 32.1P1) fps +13%
Beelink SER5
AMD Ryzen 5 5560U, AMD Radeon RX Vega 6 (Ryzen 4000/5000)
78.9 (56.9min, 66.5P1) fps
Beelink SEi12 Core i5-1235U
Intel Core i5-1235U, Intel Iris Xe Graphics G7 80EUs
65.9 (14.2min, 19.7P1) fps -16%
Durchschnittliche AMD Radeon RX Vega 6 (Ryzen 4000/5000)
  (41 - 78.9, n=6)
62.9 fps -20%
NiPoGi CK10
Intel Core i5-12450H, Intel UHD Graphics 64EUs (Alder Lake 12th Gen)
61.7 (14.2min, 18.8P1) fps -22%
Acemagic AD15
Intel Core i7-11800H, Intel UHD Graphics Xe 32EUs (Tiger Lake-H)
55.6 (12.4min, 18P1) fps -30%
1920x1080 medium AA:medium AF:4
Beelink SER7
AMD Ryzen 7 7840HS, AMD Radeon 780M
65.6 (52.2min, 57P1) fps +117%
Acemagic AM20
AMD Ryzen 7 7735H, AMD Radeon 680M
60.5 (41.9min, 54.2P1) fps +100%
GMK NucBox K2
AMD Ryzen 7 7735HS, AMD Radeon 680M
56 (46.4min, 49.2P1) fps +85%
Intel NUC 13 Pro Desk Edition Kit
Intel Core i7-1360P, Intel Iris Xe Graphics G7 96EUs
39.4 (14.1min, 23P1) fps +30%
Geekom A5
AMD Ryzen 7 5800H, AMD Radeon RX Vega 8 (Ryzen 4000/5000)
38.8 (24.2min, 34.3P1) fps +28%
Minisforum Venus Series UM560 XT
AMD Ryzen 5 5600H, AMD Radeon RX Vega 7
36.1 (25.4min, 31.7P1) fps +19%
Lenovo IdeaCentre Mini 01IRH8
Intel Core i7-13700H, Intel Iris Xe Graphics G7 96EUs
34.7 (12.5min, 20P1) fps +15%
Beelink SER5
AMD Ryzen 5 5560U, AMD Radeon RX Vega 6 (Ryzen 4000/5000)
30.3 (25.6min, 27.4P1) fps
Beelink SEi12 Core i5-1235U
Intel Core i5-1235U, Intel Iris Xe Graphics G7 80EUs
26.5 (7min, 12.6P1) fps -13%
NiPoGi CK10
Intel Core i5-12450H, Intel UHD Graphics 64EUs (Alder Lake 12th Gen)
25.1 (8.8min, 12.7P1) fps -17%
Durchschnittliche AMD Radeon RX Vega 6 (Ryzen 4000/5000)
  (17 - 30.3, n=6)
24.7 fps -18%
Acemagic AD15
Intel Core i7-11800H, Intel UHD Graphics Xe 32EUs (Tiger Lake-H)
21.6 (6.8min, 10.4P1) fps -29%
1920x1080 high AA:high AF:8
Beelink SER7
AMD Ryzen 7 7840HS, AMD Radeon 780M
55.6 (39.2min, 42.9P1) fps +126%
Acemagic AM20
AMD Ryzen 7 7735H, AMD Radeon 680M
49.5 (29.9min, 38P1) fps +101%
GMK NucBox K2
AMD Ryzen 7 7735HS, AMD Radeon 680M
45.9 (25.6min, 35.7P1) fps +87%
Geekom A5
AMD Ryzen 7 5800H, AMD Radeon RX Vega 8 (Ryzen 4000/5000)
32.4 (23.8min, 25.8P1) fps +32%
Intel NUC 13 Pro Desk Edition Kit
Intel Core i7-1360P, Intel Iris Xe Graphics G7 96EUs
32 (8.4min, 15.8P1) fps +30%
Minisforum Venus Series UM560 XT
AMD Ryzen 5 5600H, AMD Radeon RX Vega 7
30.1 (19.6min, 24.1P1) fps +22%
Lenovo IdeaCentre Mini 01IRH8
Intel Core i7-13700H, Intel Iris Xe Graphics G7 96EUs
29.2 (9min, 13.5P1) fps +19%
Beelink SER5
AMD Ryzen 5 5560U, AMD Radeon RX Vega 6 (Ryzen 4000/5000)
24.6 (19.8min, 20.3P1) fps
Beelink SEi12 Core i5-1235U
Intel Core i5-1235U, Intel Iris Xe Graphics G7 80EUs
21.4 (5min, 7.98P1) fps -13%
Durchschnittliche AMD Radeon RX Vega 6 (Ryzen 4000/5000)
  (15 - 24.6, n=6)
20.5 fps -17%
NiPoGi CK10
Intel Core i5-12450H, Intel UHD Graphics 64EUs (Alder Lake 12th Gen)
19.8 (5min, 6.19P1) fps -20%
Acemagic AD15
Intel Core i7-11800H, Intel UHD Graphics Xe 32EUs (Tiger Lake-H)
16.6 (5min, 5.93P1) fps -33%
1920x1080 ultra AA:ultra AF:16
Beelink SER7
AMD Ryzen 7 7840HS, AMD Radeon 780M
48.2 (23.8min, 32P1) fps +135%
GMK NucBox K2
AMD Ryzen 7 7735HS, AMD Radeon 680M
42.5 (15.8min, 22.3P1) fps +107%
Acemagic AM20
AMD Ryzen 7 7735H, AMD Radeon 680M
42.5 (28.1min, 30.2P1) fps +107%
Geekom A5
AMD Ryzen 7 5800H, AMD Radeon RX Vega 8 (Ryzen 4000/5000)
27.4 (19.7min, 22.4P1) fps +34%
Intel NUC 13 Pro Desk Edition Kit
Intel Core i7-1360P, Intel Iris Xe Graphics G7 96EUs
26.1 (5.3min, 8.13P1) fps +27%
Minisforum Venus Series UM560 XT
AMD Ryzen 5 5600H, AMD Radeon RX Vega 7
25.4 (14.8min, 17.6P1) fps +24%
Lenovo IdeaCentre Mini 01IRH8
Intel Core i7-13700H, Intel Iris Xe Graphics G7 96EUs
22.9 (5min, 5.96P1) fps +12%
Beelink SER5
AMD Ryzen 5 5560U, AMD Radeon RX Vega 6 (Ryzen 4000/5000)
20.5 (12.2min, 14.6P1) fps
Durchschnittliche AMD Radeon RX Vega 6 (Ryzen 4000/5000)
  (16.7 - 20.5, n=5)
18.3 fps -11%
Beelink SEi12 Core i5-1235U
Intel Core i5-1235U, Intel Iris Xe Graphics G7 80EUs
17.5 (5min, 5P1) fps -15%
NiPoGi CK10
Intel Core i5-12450H, Intel UHD Graphics 64EUs (Alder Lake 12th Gen)
16.8 (5min, 5P1) fps -18%
Acemagic AD15
Intel Core i7-11800H, Intel UHD Graphics Xe 32EUs (Tiger Lake-H)
15.6 (5min, 5P1) fps -24%
Cyberpunk 2077 1.6
1280x720 Low Preset
Beelink SER7
AMD Ryzen 7 7840HS, AMD Radeon 780M
71.5 (19.7min) fps +187%
GMK NucBox K2
AMD Ryzen 7 7735HS, AMD Radeon 680M
59.5 (21.9min) fps +139%
Lenovo IdeaCentre Mini 01IRH8
Intel Core i7-13700H, Intel Iris Xe Graphics G7 96EUs
27.9 (19.9min) fps +12%
Beelink SER5
AMD Ryzen 5 5560U, AMD Radeon RX Vega 6 (Ryzen 4000/5000)
24.9 (14.3min) fps
Durchschnittliche AMD Radeon RX Vega 6 (Ryzen 4000/5000)
  (22 - 24.9, n=2)
23.5 fps -6%
1920x1080 Low Preset
Beelink SER7
AMD Ryzen 7 7840HS, AMD Radeon 780M
43.9 (20.7min) fps +218%
GMK NucBox K2
AMD Ryzen 7 7735HS, AMD Radeon 680M
35.8 (14.4min) fps +159%
Lenovo IdeaCentre Mini 01IRH8
Intel Core i7-13700H, Intel Iris Xe Graphics G7 96EUs
16.4 (7.3min) fps +19%
Beelink SER5
AMD Ryzen 5 5560U, AMD Radeon RX Vega 6 (Ryzen 4000/5000)
13.8 (9.9min) fps
Beelink SEi12 Core i5-1235U
Intel Core i5-1235U, Intel Iris Xe Graphics G7 80EUs
13.4 (8.9min) fps -3%
Durchschnittliche AMD Radeon RX Vega 6 (Ryzen 4000/5000)
  (11.2 - 13.8, n=2)
12.5 fps -9%
1920x1080 Medium Preset
Beelink SER7
AMD Ryzen 7 7840HS, AMD Radeon 780M
34.6 (17.5min) fps +239%
GMK NucBox K2
AMD Ryzen 7 7735HS, AMD Radeon 680M
27.4 (12.8min) fps +169%
Lenovo IdeaCentre Mini 01IRH8
Intel Core i7-13700H, Intel Iris Xe Graphics G7 96EUs
13.3 (10.5min) fps +30%
Beelink SEi12 Core i5-1235U
Intel Core i5-1235U, Intel Iris Xe Graphics G7 80EUs
11.4 (8min) fps +12%
Beelink SER5
AMD Ryzen 5 5560U, AMD Radeon RX Vega 6 (Ryzen 4000/5000)
10.2 (8min) fps
Durchschnittliche AMD Radeon RX Vega 6 (Ryzen 4000/5000)
  (9.2 - 10.2, n=2)
9.7 fps -5%
1920x1080 High Preset
Beelink SER7
AMD Ryzen 7 7840HS, AMD Radeon 780M
26.9 (6.5min) fps +224%
GMK NucBox K2
AMD Ryzen 7 7735HS, AMD Radeon 680M
21 (9.9min) fps +153%
Lenovo IdeaCentre Mini 01IRH8
Intel Core i7-13700H, Intel Iris Xe Graphics G7 96EUs
10.9 (8.7min) fps +31%
Beelink SEi12 Core i5-1235U
Intel Core i5-1235U, Intel Iris Xe Graphics G7 80EUs
9 (6.7min) fps +8%
Beelink SER5
AMD Ryzen 5 5560U, AMD Radeon RX Vega 6 (Ryzen 4000/5000)
8.3 (5.5min) fps
Durchschnittliche AMD Radeon RX Vega 6 (Ryzen 4000/5000)
  (6.4 - 8.3, n=2)
7.35 fps -11%
1920x1080 Ultra Preset
Beelink SER7
AMD Ryzen 7 7840HS, AMD Radeon 780M
24.8 (6.1min) fps +226%
GMK NucBox K2
AMD Ryzen 7 7735HS, AMD Radeon 680M
19.2 (5min) fps +153%
Lenovo IdeaCentre Mini 01IRH8
Intel Core i7-13700H, Intel Iris Xe Graphics G7 96EUs
10.3 fps +36%
Beelink SER5
AMD Ryzen 5 5560U, AMD Radeon RX Vega 6 (Ryzen 4000/5000)
7.6 (4.9min) fps
Durchschnittliche AMD Radeon RX Vega 6 (Ryzen 4000/5000)
  ()
7.6 fps 0%
Beelink SEi12 Core i5-1235U
Intel Core i5-1235U, Intel Iris Xe Graphics G7 80EUs
7.4 (5.3min) fps -3%
Far Cry 5
1280x720 Low Preset AA:T
Beelink SER7
AMD Ryzen 7 7840HS, AMD Radeon 780M
84 (73min) fps +83%
GMK NucBox K2
AMD Ryzen 7 7735HS, AMD Radeon 680M
69 (62min) fps +50%
Acemagic AM20
AMD Ryzen 7 7735H, AMD Radeon 680M
67 (61min) fps +46%
Geekom A5
AMD Ryzen 7 5800H, AMD Radeon RX Vega 8 (Ryzen 4000/5000)
62 (56min) fps +35%
Minisforum Venus Series UM560 XT
AMD Ryzen 5 5600H, AMD Radeon RX Vega 7
57 (51min) fps +24%
Beelink SER5
AMD Ryzen 5 5560U, AMD Radeon RX Vega 6 (Ryzen 4000/5000)
46 (41min) fps
Intel NUC 13 Pro Desk Edition Kit
Intel Core i7-1360P, Intel Iris Xe Graphics G7 96EUs
45 (40min) fps -2%
Lenovo IdeaCentre Mini 01IRH8
Intel Core i7-13700H, Intel Iris Xe Graphics G7 96EUs
45 (41min) fps -2%
NiPoGi CK10
Intel Core i5-12450H, Intel UHD Graphics 64EUs (Alder Lake 12th Gen)
36 (32min) fps -22%
Durchschnittliche AMD Radeon RX Vega 6 (Ryzen 4000/5000)
  (24 - 46, n=12)
33.2 fps -28%
Acemagic AD15
Intel Core i7-11800H, Intel UHD Graphics Xe 32EUs (Tiger Lake-H)
30 (26min) fps -35%
1920x1080 Medium Preset AA:T
Beelink SER7
AMD Ryzen 7 7840HS, AMD Radeon 780M
50 (45min) fps +138%
GMK NucBox K2
AMD Ryzen 7 7735HS, AMD Radeon 680M
41 (36min) fps +95%
Acemagic AM20
AMD Ryzen 7 7735H, AMD Radeon 680M
41 (37min) fps +95%
Intel NUC 13 Pro Desk Edition Kit
Intel Core i7-1360P, Intel Iris Xe Graphics G7 96EUs
29 (27min) fps +38%
Geekom A5
AMD Ryzen 7 5800H, AMD Radeon RX Vega 8 (Ryzen 4000/5000)
29 (26min) fps +38%
Minisforum Venus Series UM560 XT
AMD Ryzen 5 5600H, AMD Radeon RX Vega 7
27 (24min) fps +29%
Lenovo IdeaCentre Mini 01IRH8
Intel Core i7-13700H, Intel Iris Xe Graphics G7 96EUs
22 (20min) fps +5%
Beelink SER5
AMD Ryzen 5 5560U, AMD Radeon RX Vega 6 (Ryzen 4000/5000)
21 (18min) fps
NiPoGi CK10
Intel Core i5-12450H, Intel UHD Graphics 64EUs (Alder Lake 12th Gen)
17 (15min) fps -19%
Durchschnittliche AMD Radeon RX Vega 6 (Ryzen 4000/5000)
  (11 - 21, n=10)
15.8 fps -25%
Acemagic AD15
Intel Core i7-11800H, Intel UHD Graphics Xe 32EUs (Tiger Lake-H)
13 (11min) fps -38%
1920x1080 High Preset AA:T
Beelink SER7
AMD Ryzen 7 7840HS, AMD Radeon 780M
46 (41min) fps +142%
GMK NucBox K2
AMD Ryzen 7 7735HS, AMD Radeon 680M
38 (33min) fps +100%
Acemagic AM20
AMD Ryzen 7 7735H, AMD Radeon 680M
38 (35min) fps +100%
Intel NUC 13 Pro Desk Edition Kit
Intel Core i7-1360P, Intel Iris Xe Graphics G7 96EUs
27 (25min) fps +42%
Geekom A5
AMD Ryzen 7 5800H, AMD Radeon RX Vega 8 (Ryzen 4000/5000)
27 (24min) fps +42%
Minisforum Venus Series UM560 XT
AMD Ryzen 5 5600H, AMD Radeon RX Vega 7
25 (22min) fps +32%
Lenovo IdeaCentre Mini 01IRH8
Intel Core i7-13700H, Intel Iris Xe Graphics G7 96EUs
21 (19min) fps +11%
Beelink SER5
AMD Ryzen 5 5560U, AMD Radeon RX Vega 6 (Ryzen 4000/5000)
19 (17min) fps
NiPoGi CK10
Intel Core i5-12450H, Intel UHD Graphics 64EUs (Alder Lake 12th Gen)
16 (13min) fps -16%
Durchschnittliche AMD Radeon RX Vega 6 (Ryzen 4000/5000)
  (11 - 19, n=7)
15.4 fps -19%
Acemagic AD15
Intel Core i7-11800H, Intel UHD Graphics Xe 32EUs (Tiger Lake-H)
12 (10min) fps -37%
1920x1080 Ultra Preset AA:T
Beelink SER7
AMD Ryzen 7 7840HS, AMD Radeon 780M
44 (39min) fps +144%
GMK NucBox K2
AMD Ryzen 7 7735HS, AMD Radeon 680M
36 (31min) fps +100%
Acemagic AM20
AMD Ryzen 7 7735H, AMD Radeon 680M
36 (30min) fps +100%
Intel NUC 13 Pro Desk Edition Kit
Intel Core i7-1360P, Intel Iris Xe Graphics G7 96EUs
26 (23min) fps +44%
Geekom A5
AMD Ryzen 7 5800H, AMD Radeon RX Vega 8 (Ryzen 4000/5000)
25 (23min) fps +39%
Minisforum Venus Series UM560 XT
AMD Ryzen 5 5600H, AMD Radeon RX Vega 7
23 (20min) fps +28%
Lenovo IdeaCentre Mini 01IRH8
Intel Core i7-13700H, Intel Iris Xe Graphics G7 96EUs
20 (18min) fps +11%
Beelink SER5
AMD Ryzen 5 5560U, AMD Radeon RX Vega 6 (Ryzen 4000/5000)
18 (16min) fps
Durchschnittliche AMD Radeon RX Vega 6 (Ryzen 4000/5000)
  (14 - 18, n=4)
15.8 fps -12%
NiPoGi CK10
Intel Core i5-12450H, Intel UHD Graphics 64EUs (Alder Lake 12th Gen)
15 (13min) fps -17%
Acemagic AD15
Intel Core i7-11800H, Intel UHD Graphics Xe 32EUs (Tiger Lake-H)
12 (10min) fps -33%
Tiny Tina's Wonderlands
1280x720 Lowest Preset (DX12)
Beelink SER7
AMD Ryzen 7 7840HS, AMD Radeon 780M
140.6 fps +160%
GMK NucBox K2
AMD Ryzen 7 7735HS, AMD Radeon 680M
114.6 fps +112%
Acemagic AM20
AMD Ryzen 7 7735H, AMD Radeon 680M
106 fps +96%
Geekom A5
AMD Ryzen 7 5800H, AMD Radeon RX Vega 8 (Ryzen 4000/5000)
79.2 fps +47%
Minisforum Venus Series UM560 XT
AMD Ryzen 5 5600H, AMD Radeon RX Vega 7
70.4 fps +30%
Intel NUC 13 Pro Desk Edition Kit
Intel Core i7-1360P, Intel Iris Xe Graphics G7 96EUs
57.7 fps +7%
Lenovo IdeaCentre Mini 01IRH8
Intel Core i7-13700H, Intel Iris Xe Graphics G7 96EUs
54.3 fps +1%
Beelink SER5
AMD Ryzen 5 5560U, AMD Radeon RX Vega 6 (Ryzen 4000/5000)
54 fps
Durchschnittliche AMD Radeon RX Vega 6 (Ryzen 4000/5000)
  (38.7 - 54, n=2)
46.4 fps -14%
NiPoGi CK10
Intel Core i5-12450H, Intel UHD Graphics 64EUs (Alder Lake 12th Gen)
29.4 fps -46%
Acemagic AD15
Intel Core i7-11800H, Intel UHD Graphics Xe 32EUs (Tiger Lake-H)
25.7 fps -52%
1920x1080 Low Preset (DX12)
Beelink SER7
AMD Ryzen 7 7840HS, AMD Radeon 780M
71.6 fps +180%
GMK NucBox K2
AMD Ryzen 7 7735HS, AMD Radeon 680M
61 fps +138%
Acemagic AM20
AMD Ryzen 7 7735H, AMD Radeon 680M
56.2 fps +120%
Geekom A5
AMD Ryzen 7 5800H, AMD Radeon RX Vega 8 (Ryzen 4000/5000)
38 fps +48%
Minisforum Venus Series UM560 XT
AMD Ryzen 5 5600H, AMD Radeon RX Vega 7
33.1 fps +29%
Intel NUC 13 Pro Desk Edition Kit
Intel Core i7-1360P, Intel Iris Xe Graphics G7 96EUs
32.3 fps +26%
Lenovo IdeaCentre Mini 01IRH8
Intel Core i7-13700H, Intel Iris Xe Graphics G7 96EUs
27.5 fps +7%
Beelink SER5
AMD Ryzen 5 5560U, AMD Radeon RX Vega 6 (Ryzen 4000/5000)
25.6 fps
Durchschnittliche AMD Radeon RX Vega 6 (Ryzen 4000/5000)
  (18.8 - 25.6, n=2)
22.2 fps -13%
NiPoGi CK10
Intel Core i5-12450H, Intel UHD Graphics 64EUs (Alder Lake 12th Gen)
16.7 fps -35%
Acemagic AD15
Intel Core i7-11800H, Intel UHD Graphics Xe 32EUs (Tiger Lake-H)
13.1 fps -49%
1920x1080 Medium Preset (DX12)
Beelink SER7
AMD Ryzen 7 7840HS, AMD Radeon 780M
52 fps +167%
GMK NucBox K2
AMD Ryzen 7 7735HS, AMD Radeon 680M
45.1 fps +131%
Acemagic AM20
AMD Ryzen 7 7735H, AMD Radeon 680M
42.2 fps +116%
Geekom A5
AMD Ryzen 7 5800H, AMD Radeon RX Vega 8 (Ryzen 4000/5000)
28.9 fps +48%
Intel NUC 13 Pro Desk Edition Kit
Intel Core i7-1360P, Intel Iris Xe Graphics G7 96EUs
25.4 fps +30%
Minisforum Venus Series UM560 XT
AMD Ryzen 5 5600H, AMD Radeon RX Vega 7
25.1 fps +29%
Lenovo IdeaCentre Mini 01IRH8
Intel Core i7-13700H, Intel Iris Xe Graphics G7 96EUs
20.9 fps +7%
Beelink SER5
AMD Ryzen 5 5560U, AMD Radeon RX Vega 6 (Ryzen 4000/5000)
19.5 fps
Durchschnittliche AMD Radeon RX Vega 6 (Ryzen 4000/5000)
  ()
19.5 fps 0%
NiPoGi CK10
Intel Core i5-12450H, Intel UHD Graphics 64EUs (Alder Lake 12th Gen)
12.7 fps -35%
Acemagic AD15
Intel Core i7-11800H, Intel UHD Graphics Xe 32EUs (Tiger Lake-H)
9.82 fps -50%
1920x1080 High Preset (DX12)
Beelink SER7
AMD Ryzen 7 7840HS, AMD Radeon 780M
37.1 fps +207%
GMK NucBox K2
AMD Ryzen 7 7735HS, AMD Radeon 680M
31.2 fps +158%
Acemagic AM20
AMD Ryzen 7 7735H, AMD Radeon 680M
28.6 fps +136%
Geekom A5
AMD Ryzen 7 5800H, AMD Radeon RX Vega 8 (Ryzen 4000/5000)
18.1 fps +50%
Intel NUC 13 Pro Desk Edition Kit
Intel Core i7-1360P, Intel Iris Xe Graphics G7 96EUs
15.9 fps +31%
Minisforum Venus Series UM560 XT
AMD Ryzen 5 5600H, AMD Radeon RX Vega 7
15.7 fps +30%
Lenovo IdeaCentre Mini 01IRH8
Intel Core i7-13700H, Intel Iris Xe Graphics G7 96EUs
13.5 fps +12%
Beelink SER5
AMD Ryzen 5 5560U, AMD Radeon RX Vega 6 (Ryzen 4000/5000)
12.1 fps
Durchschnittliche AMD Radeon RX Vega 6 (Ryzen 4000/5000)
  ()
12.1 fps 0%
NiPoGi CK10
Intel Core i5-12450H, Intel UHD Graphics 64EUs (Alder Lake 12th Gen)
8.33 fps -31%
Acemagic AD15
Intel Core i7-11800H, Intel UHD Graphics Xe 32EUs (Tiger Lake-H)
6.35 fps -48%
1920x1080 Badass Preset (DX12)
Beelink SER7
AMD Ryzen 7 7840HS, AMD Radeon 780M
30 fps +237%
GMK NucBox K2
AMD Ryzen 7 7735HS, AMD Radeon 680M
24.4 fps +174%
Acemagic AM20
AMD Ryzen 7 7735H, AMD Radeon 680M
22.5 fps +153%
Intel NUC 13 Pro Desk Edition Kit
Intel Core i7-1360P, Intel Iris Xe Graphics G7 96EUs
13.5 fps +52%
Geekom A5
AMD Ryzen 7 5800H, AMD Radeon RX Vega 8 (Ryzen 4000/5000)
13.3 fps +49%
Minisforum Venus Series UM560 XT
AMD Ryzen 5 5600H, AMD Radeon RX Vega 7
11.5 fps +29%
Lenovo IdeaCentre Mini 01IRH8
Intel Core i7-13700H, Intel Iris Xe Graphics G7 96EUs
10.6 fps +19%
Beelink SER5
AMD Ryzen 5 5560U, AMD Radeon RX Vega 6 (Ryzen 4000/5000)
8.9 fps
Durchschnittliche AMD Radeon RX Vega 6 (Ryzen 4000/5000)
  ()
8.9 fps 0%
NiPoGi CK10
Intel Core i5-12450H, Intel UHD Graphics 64EUs (Alder Lake 12th Gen)
6.44 fps -28%

Witcher 3 FPS Chart

051015202530354045505560Tooltip
Beelink SER5: Ø56.3 (48-61)
min.mittelhochmax.
GTA V (2015) 111.2 97.5 24.6 11.2
The Witcher 3 (2015) 58.8 39 18.8 11.8
Dota 2 Reborn (2015) 110.7 90.8 48.7 45.4
Final Fantasy XV Benchmark (2018) 32.2 16.1 11.5
X-Plane 11.11 (2018) 38 27.4 24.2
Far Cry 5 (2018) 46 21 19 18
Strange Brigade (2018) 78.9 30.3 24.6 20.5
Cyberpunk 2077 1.6 (2022) 13.8 10.2 8.3 7.6
Tiny Tina's Wonderlands (2022) 25.6 19.5 12.1 8.9
F1 22 (2022) 32.4 28.6 21.6 15.3

Emissionen - Leiser und kühler Beelink SER5

Systemlautstärke

Der Lüfter im Beelink gehört zu den leisesten, die wir je in einem Mini-PC gehört haben. Für gewöhnlich bewegt sich die Lautstärke zwischen 28 und 33 dB(A), selbst unter shr anspruchsvollen Lasten wir Games oder unserem Prime95-Stress. Zum Vergleich: Der Beelink SEi12 mit Core i5 wird mit bis zu 40 dB(A) deutlich lauter.

Lüfterprofil (Weiß: Hintergrund, Rot: Idle, Blau: 3DMark 06, Orange: Witcher 3, Grün: Prime95-Stress)

Lautstärkediagramm

Idle
23.9 / 23.9 / 23.9 dB(A)
Last
28 / 32.8 dB(A)
  red to green bar
 
 
30 dB
leise
40 dB(A)
deutlich hörbar
50 dB(A)
störend
 
min: dark, med: mid, max: light   Earthworks M23R, Arta (aus 15 cm gemessen)   Umgebungsgeräusche: 23.7 dB(A)
dB(A) 0102030405060708090Deep BassMiddle BassHigh BassLower RangeMidsHigher MidsLower HighsMid HighsUpper HighsSuper Highs2035.733.13335.834.12527.130.427.327.5303126.826.423.623.625.24025.325.422.523.925.2502526.922.623.825.96324.625.821.321.424.98028.130.624.626.229.310023.227.82222.325.51252123.11819.321.41601819.416.616.523.720018.81917.117.120.925018.819.615.21719.631519.62217.717.921.840020.121.515.115.520.450015.817.212.913.320.563015.515.911.912.820.380016.716.410.810.721.4100015.616.410.89.421.9125014.514.910.49.822160015.215.510.79.722200020.118.911.11023.5250013.914.510.410.422.7315013.514.211.210.821400012.813.411.511.219.9500012.112.611.911.518.4630011.911.911.511.614.4800012.112.611.711.512.2100001314.512.611.512.21250013.114.312.511.512.21600012.916.11210.713.2SPL27.62823.923.732.8N0.910.50.51.7median 15.5median 16.1median 11.9median 11.5median 20.9Delta32.62.22.73hearing rangehide median Fan NoiseBeelink SER5
Beelink SER5
Vega 6, R5 5560U, Crucial P3 Plus CT1000P3PSSD8
Beelink SER7
Radeon 780M, R7 7840HS, Crucial P3 Plus CT1000P3PSSD8
Beelink SEi12 Core i5-1235U
Iris Xe G7 80EUs, i5-1235U, Kingston NV1 SNVS/500GCN
Geekom A5
Vega 8, R7 5800H, Lexar NM620 512GB
GMK NucBox K3 Pro
UHD Graphics 64EUs, i7-12650H, Lexar NM610 Pro NM610P001T-HNNNG
Intel NUC 13 Pro Desk Edition Kit
Iris Xe G7 96EUs, i7-1360P, Samsung PM9A1 MZVL2512HCJQ
Geräuschentwicklung
-16%
-15%
-29%
-18%
-23%
aus / Umgebung *
23.7
24.5
-3%
23.3
2%
25
-5%
23.1
3%
25.2
-6%
Idle min *
23.9
25.1
-5%
27.8
-16%
28.2
-18%
25
-5%
28.1
-18%
Idle avg *
23.9
25.1
-5%
27.8
-16%
28.2
-18%
25.5
-7%
28.2
-18%
Idle max *
23.9
25.1
-5%
27.8
-16%
28.2
-18%
25.5
-7%
28.3
-18%
Last avg *
28
35.9
-28%
32
-14%
47.8
-71%
39.9
-43%
42
-50%
Witcher 3 ultra *
27.6
35.6
-29%
34.1
-24%
39.9
-45%
Last max *
32.8
45.4
-38%
39.2
-20%
47.4
-45%
39.9
-22%
42.1
-28%

* ... kleinere Werte sind besser

Temperatur

Netzteil kann unter großen Lasten bis zu 39 °C erreichen

Solange die Oberseite frei von Hindernissen bleibt und die Luft so gut strömen kann, sind die Oberflächentemperaturen kein Problem. 

Idle (vorne)
Idle (vorne)
Idle (hinten)
Idle (hinten)
Prime95+FurMark-Stress (vorne)
Prime95+FurMark-Stress (hinten)

Stresstest

Beim Starten unseres Prime95-Stresstests boosten die CPU-Kerne kurz auf 3,1 GHz hoch und fallen anschließend leicht auf 2,9 GHz für den Rest des Durchganges zurück. Dabei genehmigt sich das Board stabile 25 W, genau wie es für den Ryzen 5 5560U auch angegeben ist.

Unter Witcher 3 stabilisiert sich die GPU auf 1.600 MHz und 64 °C, was etwas kühler ist als der lautere Beelink SEi12 mit Core i5.

Idle
Idle
Witcher-3-Stress
Witcher-3-Stress
Prime95-Stress
Prime95-Stress
Prime95+FurMark-Stress
CPU-Takt(GHz) GPU-Takt (MHz) Durchschnittliche CPU-Temperaturen (°C)
Idle -- -- 42
Prime95-Stress 2,8 -- 74
Prime95 + FurMark-Stress 3,2 1.100 75
Witcher-3-Stress ~0,5 1.600 64

Energiemanagement - Halbierter Verbrauch zur Intel-Variante

Energieverbrauch

Insgesamt ist der Verbrauch sehr niedrig, was in einem sehr hohen Leistung-pro-Watt-Verhältnis resultiert. Beispielsweise verlangt der Intel-SEi12 unter Witcher 3 51 W oder anders gesagt beinahe zweimal so viel wie unser SER5 und das obwohl die Grafikleistung beider Modelle auf Augenhöhe ist. Der niedrige Verbrauch ist gleichermaßen für das leise Arbeitsgeräusch verantwortlich (s. oben).

Verbrauch unter 3DMark 06
Verbrauch unter Witcher 3 1080p Ultra
Prime95-Stress bei 10 s gestartet
Prime95+FurMark-Stress bei 10 s gestartet
Stromverbrauch
Aus / Standbydarklight 0.98 / 1.06 Watt
Idledarkmidlight 4.4 / 5 / 5.3 Watt
Last midlight 29.8 / 40.4 Watt
 color bar
Legende: min: dark, med: mid, max: light        Metrahit Energy
Beelink SER5
R5 5560U, Vega 6, Crucial P3 Plus CT1000P3PSSD8, , x,
Beelink SER7
R7 7840HS, Radeon 780M, Crucial P3 Plus CT1000P3PSSD8, , x,
Beelink SEi12 Core i5-1235U
i5-1235U, Iris Xe G7 80EUs, Kingston NV1 SNVS/500GCN, , x,
Geekom A5
R7 5800H, Vega 8, Lexar NM620 512GB, , x,
GMK NucBox K3 Pro
i7-12650H, UHD Graphics 64EUs, Lexar NM610 Pro NM610P001T-HNNNG, , x,
Intel NUC 13 Pro Desk Edition Kit
i7-1360P, Iris Xe G7 96EUs, Samsung PM9A1 MZVL2512HCJQ, , x,
Stromverbrauch
-105%
-178%
-82%
-98%
-92%
Idle min *
4.4
6.7
-52%
15.8
-259%
6.9
-57%
7.1
-61%
7
-59%
Idle avg *
5
7.3
-46%
16.8
-236%
7.9
-58%
10.1
-102%
9.2
-84%
Idle max *
5.3
11.6
-119%
17
-221%
8.9
-68%
18.6
-251%
11.8
-123%
Last avg *
29.8
64.1
-115%
54.4
-83%
60.8
-104%
45.3
-52%
45
-51%
Witcher 3 ultra *
28.8
75.8
-163%
50.7
-76%
55.2
-92%
Last max *
40.4
94.8
-135%
119.1
-195%
89.7
-122%
52.9
-31%
97.2
-141%

* ... kleinere Werte sind besser

Energieverbrauch unter Witcher 3 / Stresstest

0102030405060708090100110Tooltip
Beelink SER5 R5 5560U, Vega 6; Witcher 3 ultra: Ø28.8 (28.3-30.6)
Beelink SEi12 Core i5-1235U i5-1235U, Iris Xe G7 80EUs; Witcher 3 ultra: Ø50.7 (49.7-63.2)
Beelink SER5 R5 5560U, Vega 6; 1280x720 Prime95 28.10 and Furmark 1.25: Ø39 (38.6-40.4)
Beelink SEi12 Core i5-1235U i5-1235U, Iris Xe G7 80EUs; 1280x720 Prime95 28.10 and Furmark 1.25: Ø78.5 (72.1-119.1)

Energieverbrauch mit externem Monitor

0102030405060708090100Tooltip
Beelink SER5 R5 5560U, Vega 6; Prime95 V2810 Stress (external Monitor): Ø39.5 (39-39.9)
Beelink SEi12 Core i5-1235U i5-1235U, Iris Xe G7 80EUs; Prime95 V2810 Stress (external Monitor): Ø63.2 (57.9-102.6)
Beelink SER5 R5 5560U, Vega 6; Cinebench R15 Multi (external Monitor): Ø35.2 (34.9-35.4)
Beelink SEi12 Core i5-1235U i5-1235U, Iris Xe G7 80EUs; Cinebench R15 Multi (external Monitor): Ø69.5 (56-93.5)
Beelink SER5 R5 5560U, Vega 6; 1280x720 FurMark 1.19 GPU Stress Test (external Monitor): Ø31.2 (30.5-32)
Beelink SEi12 Core i5-1235U i5-1235U, Iris Xe G7 80EUs; 1280x720 FurMark 1.19 GPU Stress Test (external Monitor): Ø43.8 (39.3-47.7)
Beelink SER5 R5 5560U, Vega 6; 1920x1080 The Witcher 3 ultra (external Monitor): Ø28.8 (28.3-30.6)
Beelink SEi12 Core i5-1235U i5-1235U, Iris Xe G7 80EUs; 1920x1080 The Witcher 3 ultra (external Monitor): Ø50.7 (49.7-63.2)
Beelink SER5 R5 5560U, Vega 6; Idle 1min (external Monitor): Ø4.46 (4.19-5.88)
Beelink SEi12 Core i5-1235U i5-1235U, Iris Xe G7 80EUs; Idle 1min (external Monitor): Ø16.6 (15.8-19.1)

Pro

+ zugängliche 2x SSD- und 2x SODIMM-Steckplätze
+ respektable Ryzen-5-Leistung
+ hohe Leistung pro Watt
+ leise Lüfter
+ preiswert

Contra

- relativ langsame Single-Thread-Leistung
- kleinere Probleme bei der Wiedergabe von 4K-Videos
- kein USB-C PD oder USB4
- kein Wi-Fi 6E
- kein Kensington-Schloss

Fazit — Beeindruckende Leistung-pro-Euro und leise Lüfter

Im Test: Beelink SER5, zur Verfügung gestellt von Beelink

Die zwei auffälligsten Merkmale des SER5 sind seine leisen Lüfter und die hohe Leistung angesichts des niedrigen Preises. In Deutschland relativiert sich Letzteres allerdings ein wenig. Sein direkter Konkurrent mit Core i5-1235U bietet zwar eine etwas höhere Single-Thread-Leistungbut, erkauft diese jedoch mit einem deutlich schlechteren Leistung-pro-Watt-Verhältnis und signifikant lauteren Lüftern. Folglich ist der SER5 einer der leisesten Mini-PCs, den wir je getestet haben, einmal abgesehen von furchtbar langsamen Atom- oder Celeron-Alternativen.

Der Beelink SER5 bietet eine Leistung auf Höhe eines Core i5 bei nahezu nicht wahrnehmbarer Lüfterlautstärke.

Nutzer, denen Thunderbolt besonders wichtig ist, werden wohl dennoch auf die Intel-Alternativen oder zumindest die neueren AMD-CPUs schielen. Modelle wie der SER6 Pro unterstützen USB4. Allerdings sind diese Alternativen mindestens doppelt so teuer. In seiner Preisklasse ist der SER5 einer der besten Mini-PCs, wenn man alle Aspekte bedenkt.

Preis und Verfügbarkeit

In Deutschland ist unser Testmodell derzeit nur über den Beelink-Shop bei Amazon für happige 369 Euro zu bekommen. In den USA kostet das gleiche Gerät bei Amazon nur 230 Euro.

Beelink SER5 - 06.11.2023 v7 (old)
Allen Ngo

Gehäuse
79 / 98 → 80%
Konnektivität
59 / 81 → 73%
Gewicht
84%
Display
83%
Leistung Spiele
62%
Leistung Anwendungen
93%
Lautstärke
98%
Durchschnitt
80%
82%
Mini PC - gewichteter Durchschnitt
Weitere Informationen über unsere Bewertung finden Sie hier.

Transparenz

Die Auswahl der zu testenden Geräte erfolgt innerhalb der Redaktion. Das vorliegende Testmuster wurde dem Autor vom Hersteller oder einem Shop zu Testzwecken leihweise zur Verfügung gestellt. Eine Einflussnahme des Leihstellers auf den Testbericht gab es nicht, der Hersteller erhielt keine Version des Reviews vor der Veröffentlichung. Es bestand keine Verpflichtung zur Publikation. Unsere Reviews erfolgen stets ohne Gegenleistung oder Kompensationen. Als eigenständiges, unabhängiges Unternehmen unterliegt Notebookcheck keiner Diktion von Herstellern, Shops und Verlagen.

So testet Notebookcheck

Pro Jahr werden von Notebookcheck hunderte Laptops und Smartphones unabhängig in von uns standardisierten technischen Verfahren getestet, um eine Vergleichbarkeit aller Testergebnisse zu gewährleisten. Seit rund 20 Jahren entwickeln wir diese Testmethoden kontinuierlich weiter und setzen damit Branchenstandards. In unseren Testlaboren kommt ausschließlich hochwertiges Messequipment in die Hände erfahrener Techniker und Redakteure. Die Tests unterliegen einer mehrstufigen Kontrolle. Unsere komplexe Gesamtbewertung basiert auf hunderten fundierten Messergebnissen und Benchmarks, womit Ihnen Objektivität garantiert ist. Weitere Informationen zu unseren Testmethoden gibt es hier.

Preisvergleich

Alle 2 Beträge lesen / Antworten
static version load dynamic
Loading Comments
Diesen Artikel kommentieren / Antworten
Teilen Sie diesen Artikel, um uns zu unterstützen. Jeder Link hilft!
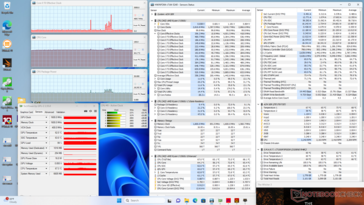
Mail Logo
> Notebook Test, Laptop Test und News > Tests > Notebook Testberichte > Leistungsdebut des Ryzen 5 5560U: Mini-PC Beelink SER5 im Test
Autor: Allen Ngo,  8.11.2023 (Update:  8.11.2023)