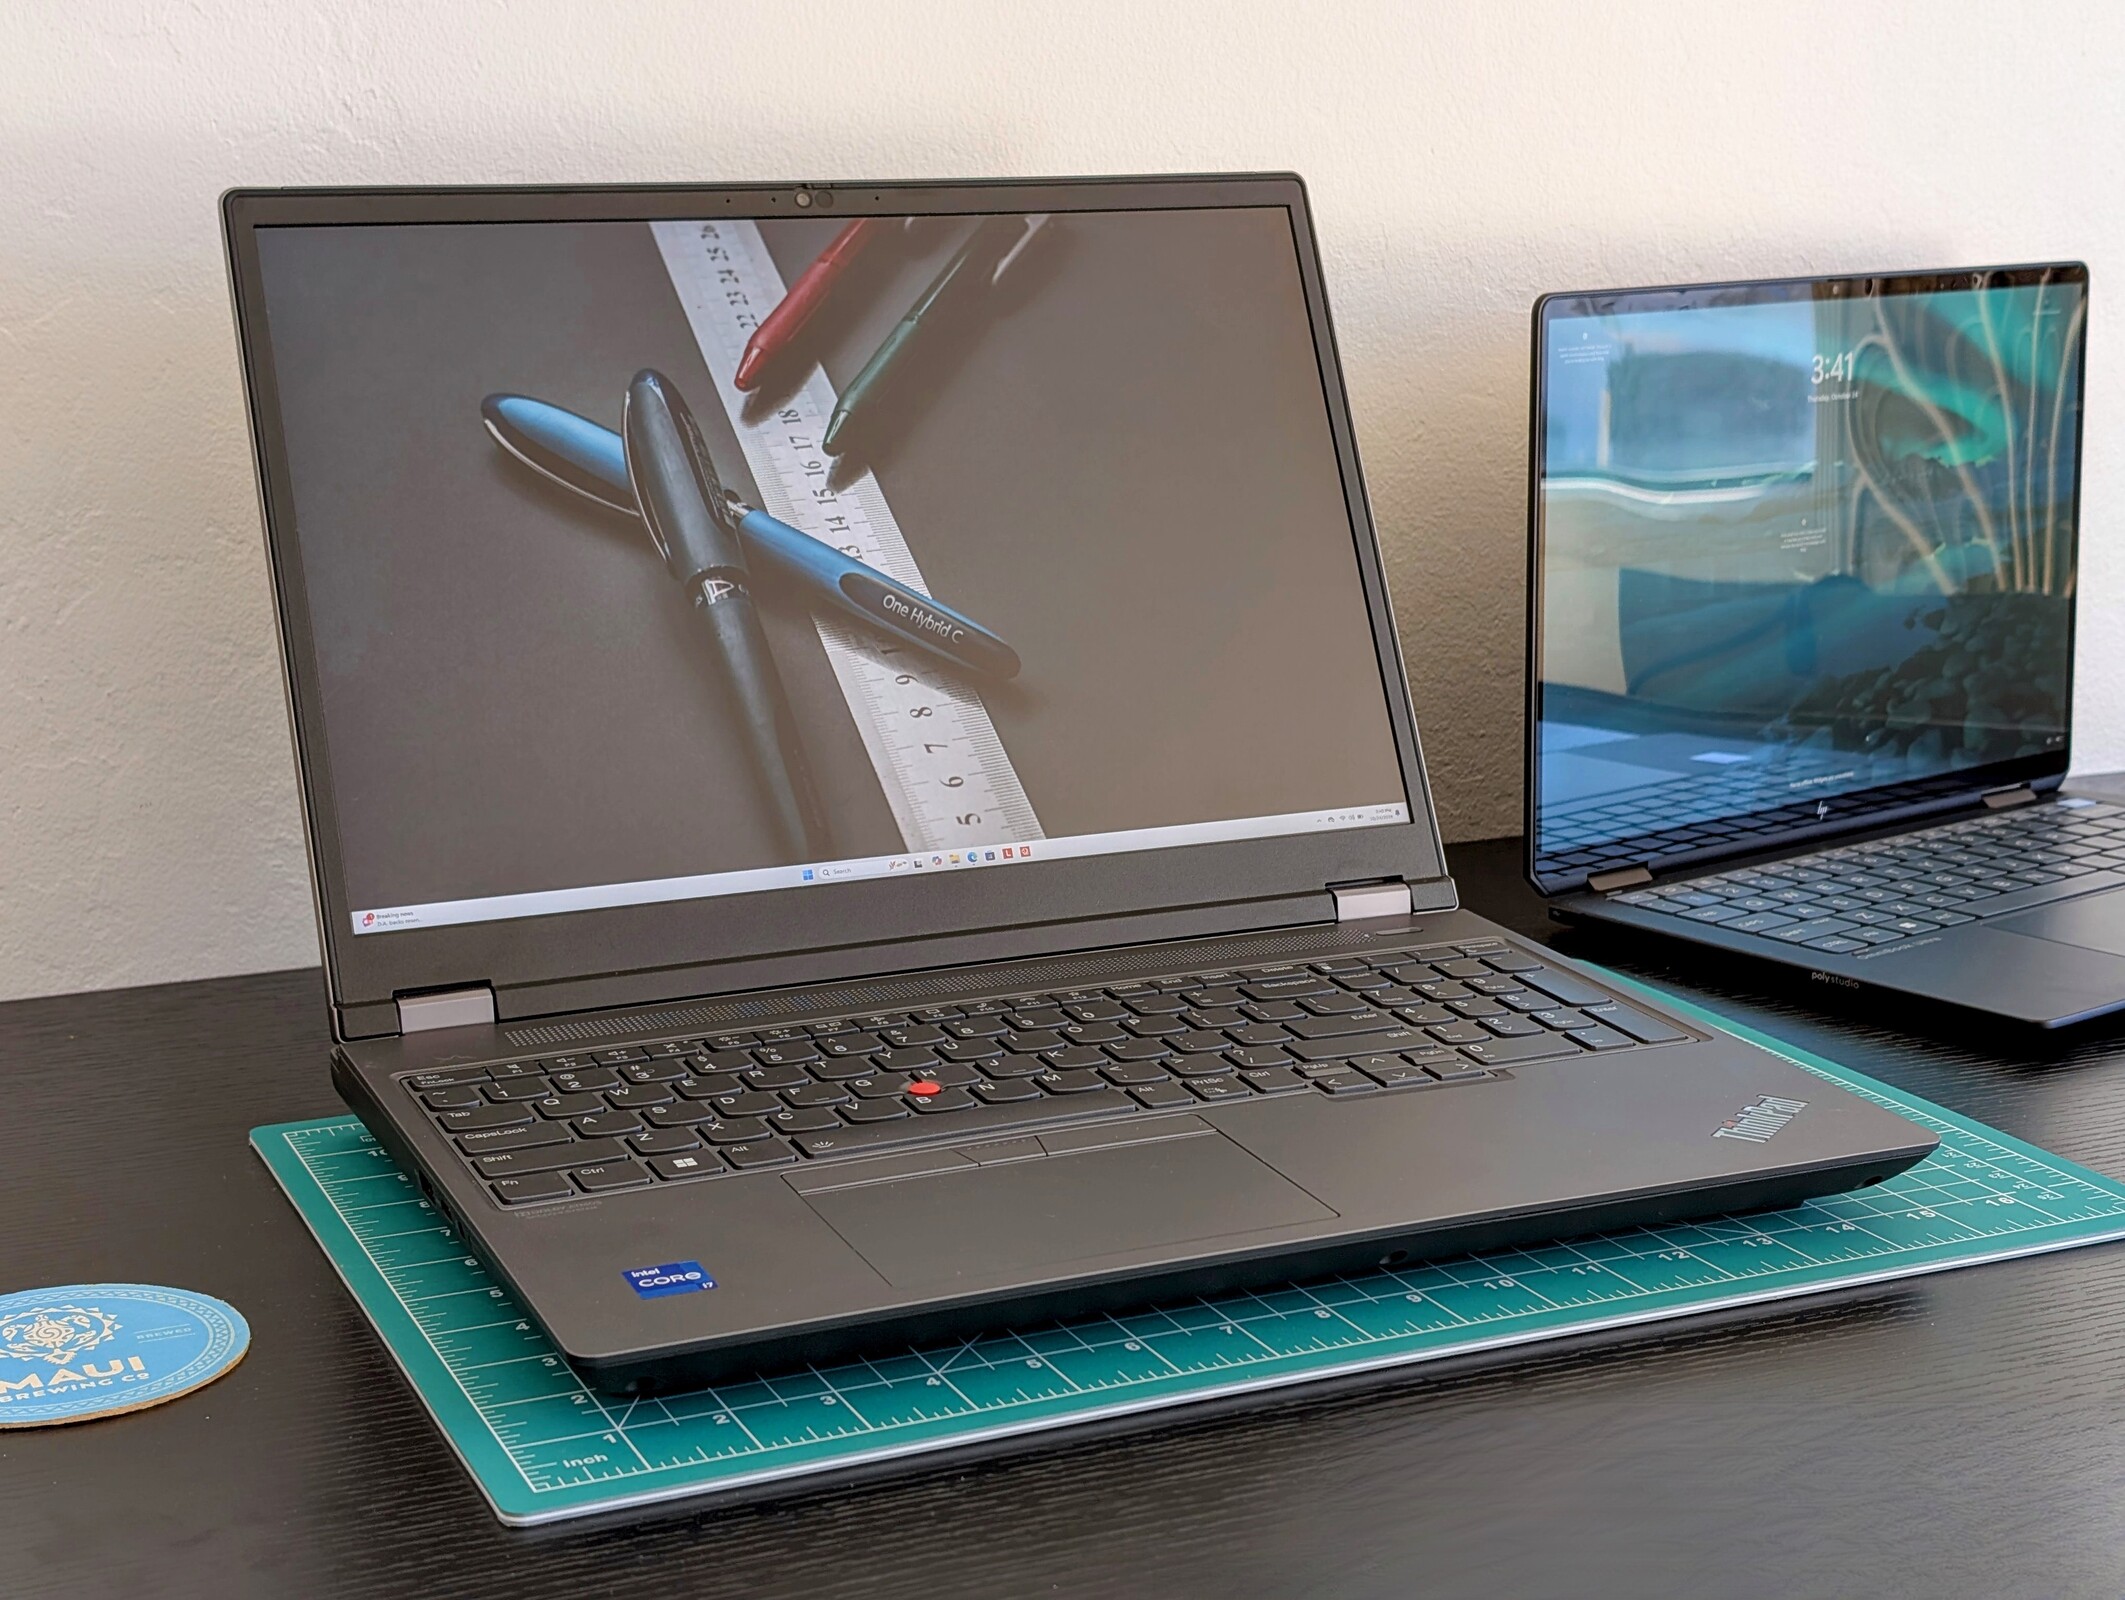
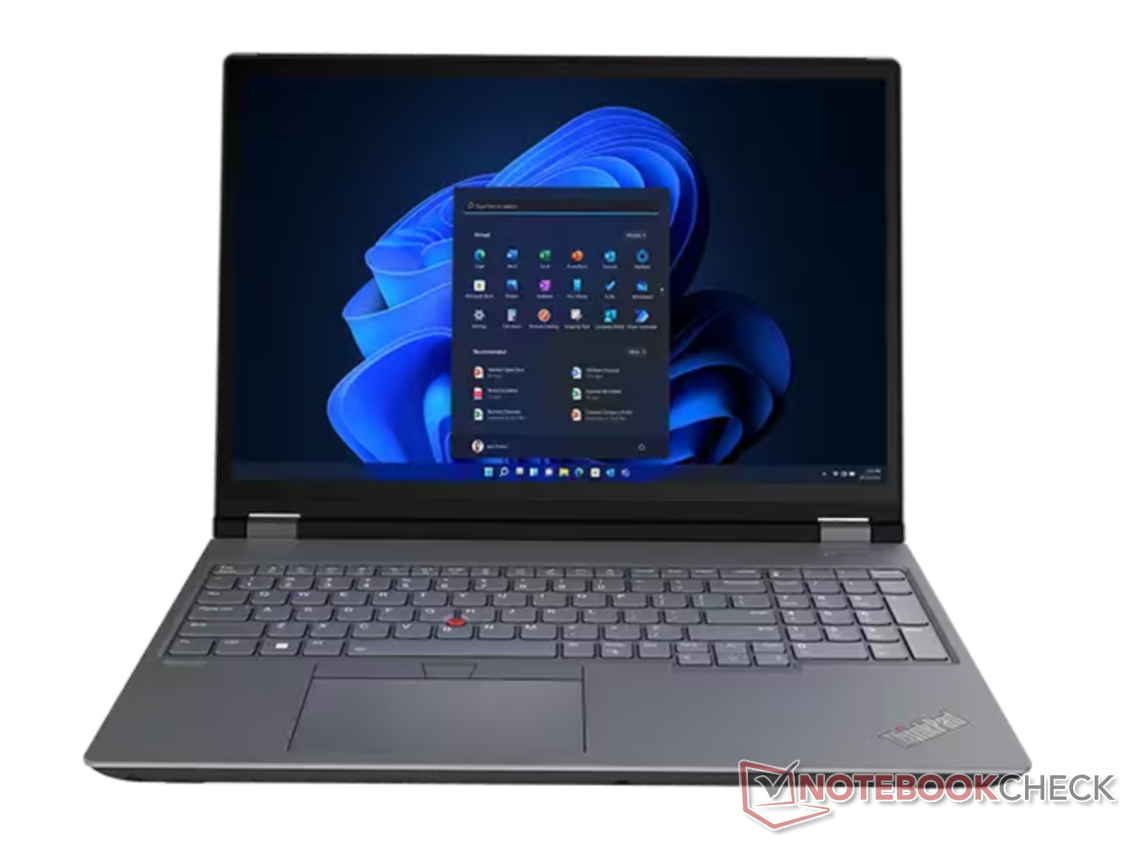
Lenovo ThinkPad P16 Gen 2 Workstation im Test: Robust mit Power-Grafik
Nvidia RTX 4000 Ada startet mit beeindruckenden Leistungsdaten.
Die 130-W-TGP-Grafikoption macht das Notebook zu einer der leistungsstärksten 16-Zoll-Workstations in Lenovos Portfolio. Allerdings führen die hohe GPU-Auslastung und -Leistung zu überdurchschnittlichen Temperaturen und Lüftergeräuschen.Allen Ngo (übersetzt von Carmen Pol) Veröffentlicht am 🇺🇸 🇫🇷 ...
Fazit — Leistung hat ihren Preis
The ThinkPad P16 Gen 2 prioritizes performance even if it means a bigger, heavier, louder, and warmer system. If you can cope with the disadvantages, then you'll find its 130 W RTX 4000 Ada to be a monster of a mobile workstation.
Mit seiner leistungsstarken 130-W-TGP-Grafik meistert das ThinkPad P16 Gen 2 anspruchsvolle Workloads und übertrifft die meisten anderen 16-Zoll-Workstations.
Ein bemerkenswerter Nachteil ist jedoch, dass die GPU nach wenigen Minuten Belastung um etwa 10 Prozent gedrosselt wird, was darauf hinweist, dass die Kühlung die vollen Anforderungen der GPU nicht dauerhaft halten kann. Auch die Akkulaufzeit ist mit maximal wenigen Stunden recht kurz. Dennoch zählt das ThinkPad P16 Gen 2 zu den schnellsten Workstations in seiner 16-Zoll-Klasse.
Pro
Contra
Preis und Verfügbarkeit
Lenovo bietet das ThinkPad P16 Gen 2 ab sofort direkt über seinen Online-Shop an. Der Einstiegspreis liegt bei 2.029 Euro, während die Konfiguration mit der RTX 4000 bei 3.359 Euro. Eine begrenzte Auswahl von SKUs ist ebenfalls über Amazon verfügbar.
Preisvergleich
Mögliche Konkurrenten im Vergleich
Bild | Modell / Test | Geizhals | Gewicht | Dicke | Display |
|---|---|---|---|---|---|
1. 85.9%  | Lenovo ThinkPad P16 Gen 2 Intel Core i7-14700HX ⎘ NVIDIA RTX 4000 Ada Generation Laptop ⎘ 32 GB RAM, 1024 GB SSD | Listenpreis 3500 USD Geizhals Suche | 3.1 kg | 30.23 mm | 16.00" 2560x1600 189 PPI IPS |
2. 90.2% v7 (old)  | Lenovo ThinkPad P16 G2 21FA000FGE Intel Core i7-13700HX ⎘ NVIDIA RTX 2000 Ada Generation Laptop ⎘ 32 GB RAM, 1024 GB SSD | 3 kg | 30.23 mm | 16.00" 2560x1600 189 PPI IPS LED | |
3. 88.6% v7 (old)  | Lenovo ThinkPad P16s G2 21K9000CGE AMD Ryzen 7 PRO 7840U ⎘ AMD Radeon 780M ⎘ 32 GB RAM, 1024 GB SSD | 1.8 kg | 24.4 mm | 16.00" 3840x2400 283 PPI OLED | |
4. 91% v7 (old)  | Lenovo ThinkPad P16 G1 RTX A5500 Intel Core i9-12950HX ⎘ NVIDIA RTX A5500 Laptop GPU ⎘ 64 GB RAM, 2048 GB SSD | Listenpreis 9000 USD | 3 kg | 30.23 mm | 16.00" 3840x2400 283 PPI IPS |
5. 85.4%  | HP ZBook Power 16 G11 A AMD Ryzen 7 8845HS ⎘ NVIDIA RTX 2000 Ada Generation Laptop ⎘ 64 GB RAM, 2048 GB SSD | 2.2 kg | 22.9 mm | 16.00" 2560x1600 189 PPI IPS | |
6. 88.3% v7 (old)  | Dell Precision 5690 Intel Core Ultra 9 185H ⎘ Nvidia RTX 5000 Ada Generation Laptop ⎘ 32 GB RAM, 2048 GB SSD | 2.3 kg | 22.17 mm | 16.00" 3840x2400 283 PPI OLED |
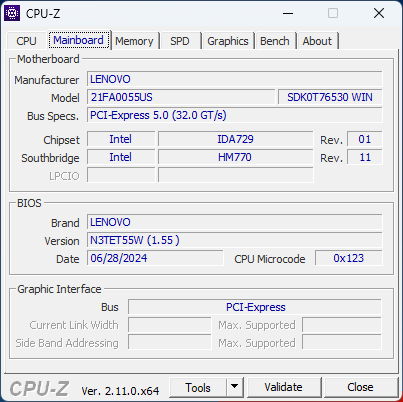
Lenovo bringt für Q4 2024 eine aktualisierte Version seiner Premium-ThinkPad-P16-Gen-2-Serie heraus, ausgestattet mit den neuen Raptor Lake-HX-Refresh-CPUs, die die zu Jahresbeginn erschienenen Raptor Lake-HX-Prozessoren ablösen. Das Gehäusedesign bleibt unverändert, sodass alle Eindrücke aus unserem ursprünglichen Test des ThinkPad P16 Gen 2 weiterhin gültig sind, einschließlich der verfügbaren Anschlüsse.
Unser aktuelles Testgerät ist mit einem Core i7-14700HX und einer 130-Watt-Nvidia-RTX-4000-Ada-GPU ausgestattet, im Vergleich zum Core i7-13700HX und der 80-Watt-RTX-2000-GPU im ursprünglichen ThinkPad-P16-Gen-2-Test. Der Leistungszuwachs ist dabei deutlich, wie unsere Daten unten zeigen.
Zu den Konkurrenten des ThinkPad P16 Gen 2 gehören andere leistungsstarke mobile 16-Zoll-Workstations wie das HP ZBook Power 16 G11 A und das Dell Precision 5690.
Weitere Lenovo Bewertungen:
Spezifikationen
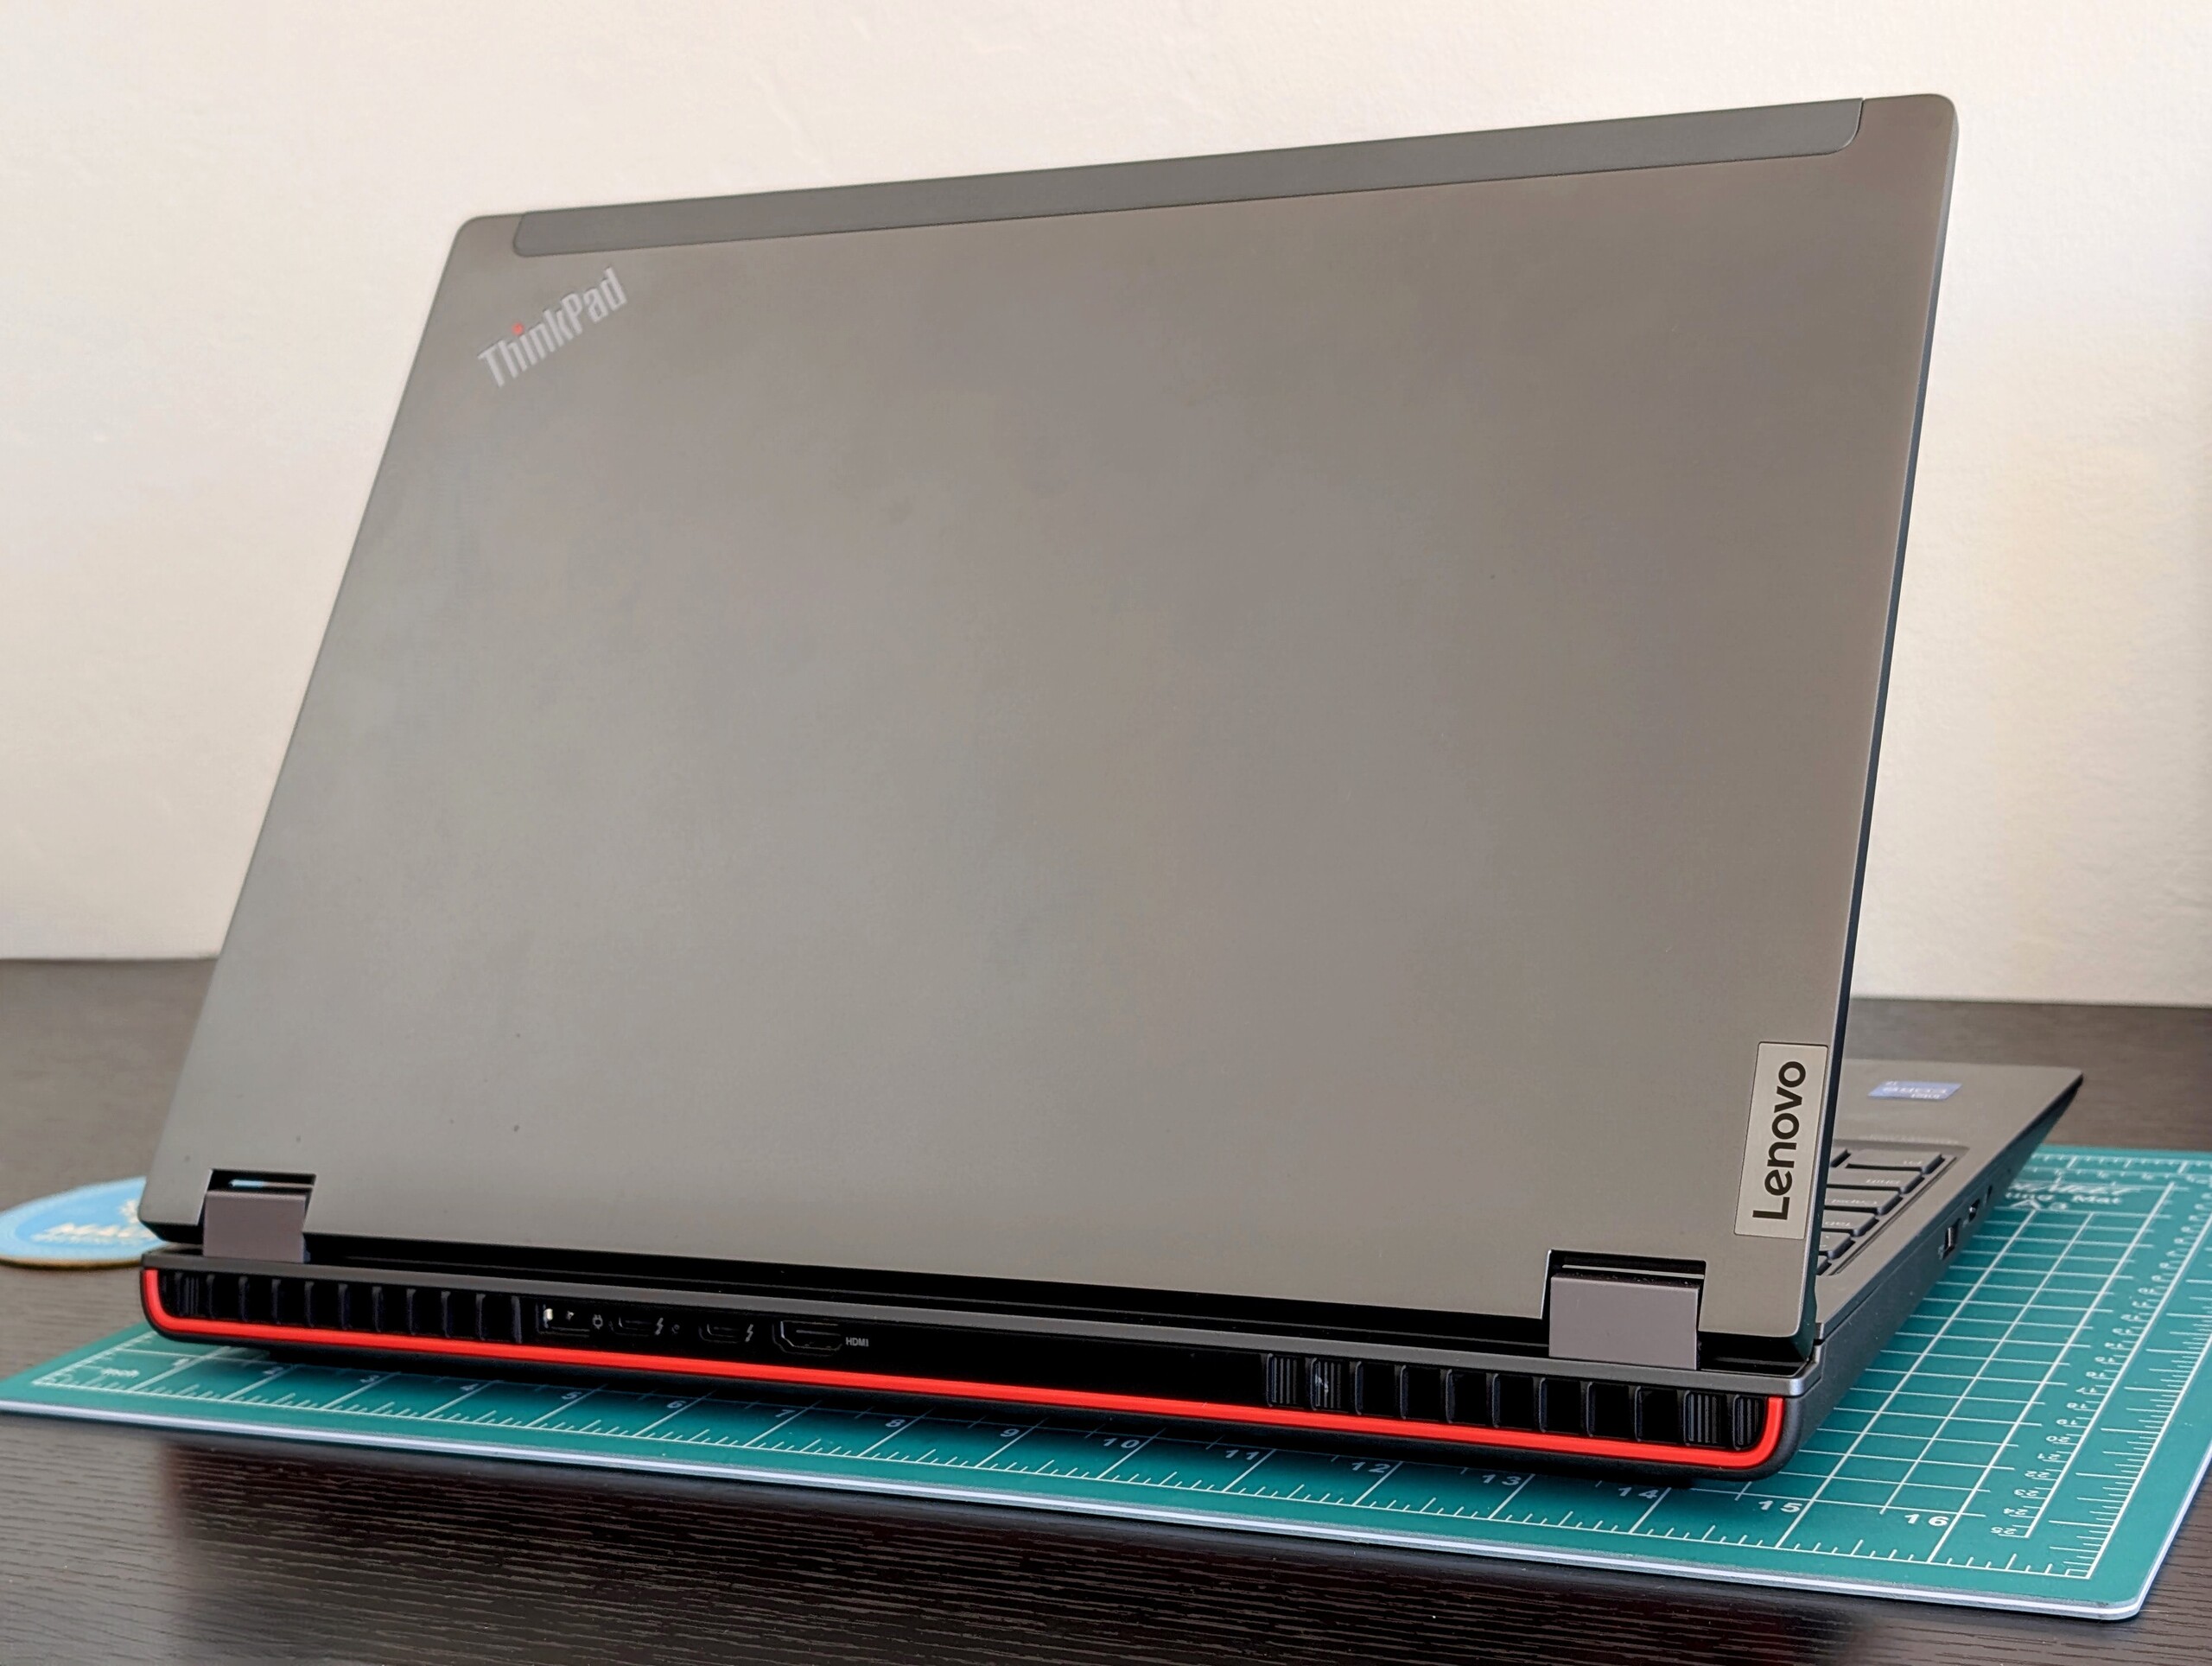
Gehäuse
SD Card Reader
| SD Card Reader | |
| average JPG Copy Test (av. of 3 runs) | |
| HP ZBook Power 16 G11 A (Toshiba Exceria Pro SDXC 64 GB UHS-II) | |
| Lenovo ThinkPad P16 Gen 2 (Toshiba Exceria Pro SDXC 64 GB UHS-II) | |
| Lenovo ThinkPad P16 G1 RTX A5500 (Toshiba Exceria Pro SDXC 64 GB UHS-II) | |
| Lenovo ThinkPad P16 G2 21FA000FGE | |
| maximum AS SSD Seq Read Test (1GB) | |
| HP ZBook Power 16 G11 A (Toshiba Exceria Pro SDXC 64 GB UHS-II) | |
| Lenovo ThinkPad P16 Gen 2 (Toshiba Exceria Pro SDXC 64 GB UHS-II) | |
| Lenovo ThinkPad P16 G2 21FA000FGE | |
| Lenovo ThinkPad P16 G1 RTX A5500 (Toshiba Exceria Pro SDXC 64 GB UHS-II) | |
Kommunikation
Webcam


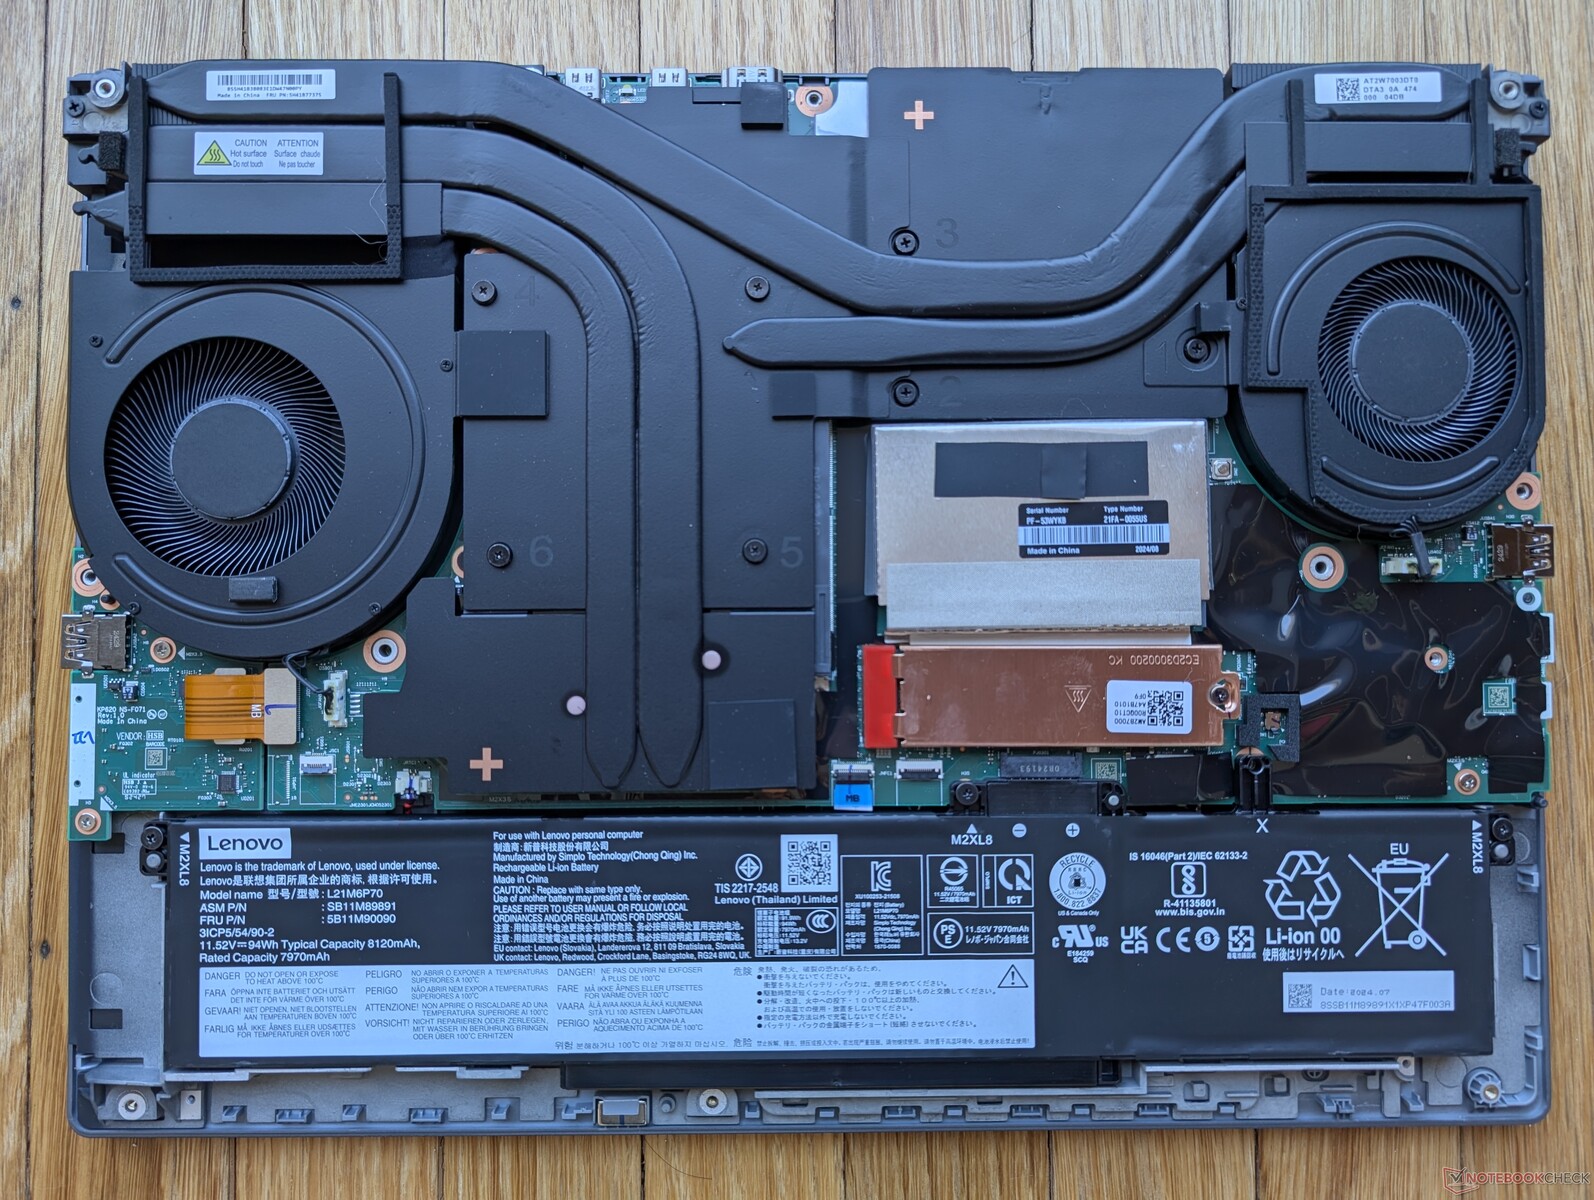
Wartung
Nachhaltigkeit
Lenovo setzt in der Produktion auf einen hohen Anteil an recycelten Materialien: Der Außendeckel (Abdeckung-A) besteht zu 50 Prozent aus recyceltem Aluminium, das Tastaturdeck (Abdeckung-C) enthält 90 Prozent recyceltes Magnesium, und über 85 Prozent des Kunststoffs für die Tastenkappen, den Akku und die Lautsprecher stammen aus Post-Consumer-Recycling.
Zudem ist die Verpackung plastikfrei und vollständig recycelbar.
Zubehör und Garantie
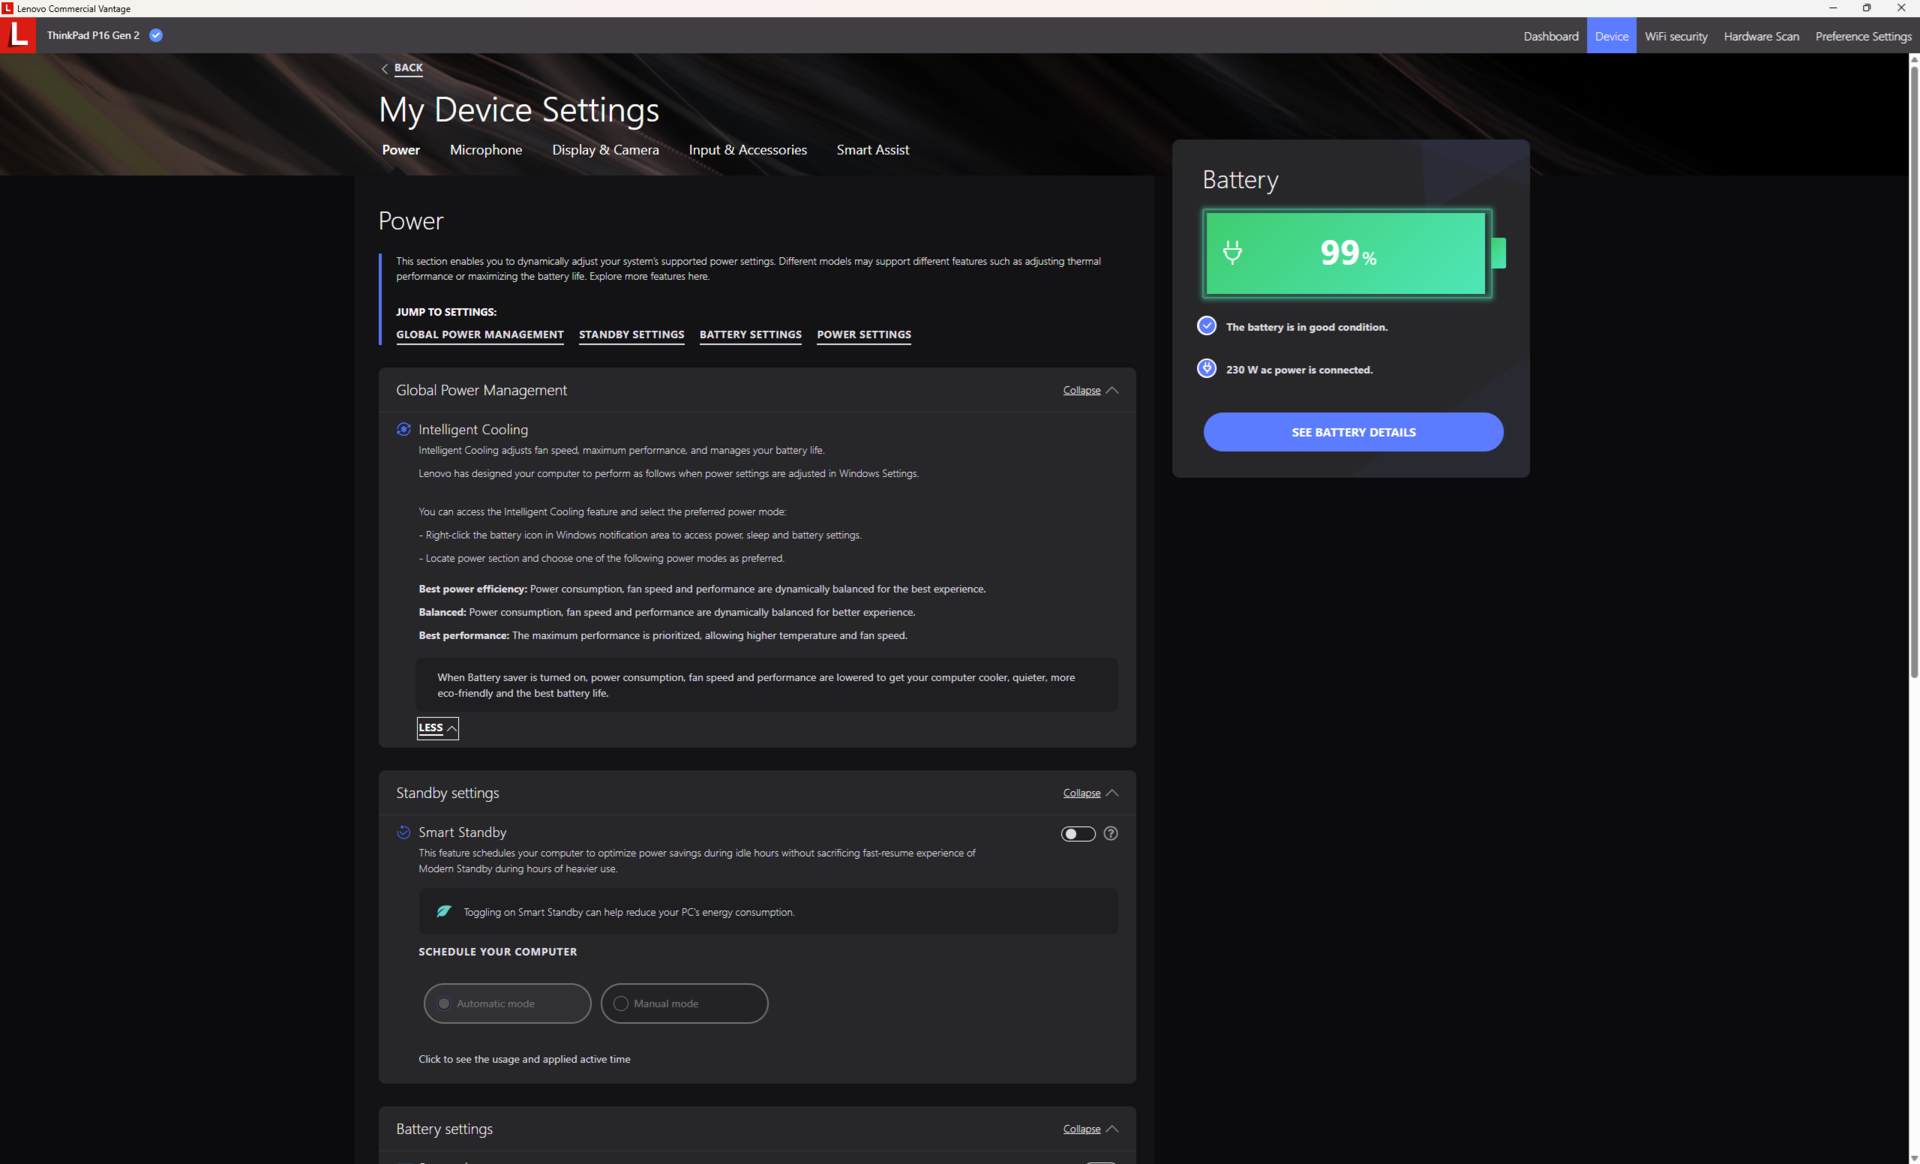
Neben dem Netzteil und der üblichen Dokumentation enthält die Verpackung keine weiteren Extras. Aufgrund der leistungsstärkeren RTX 4000 Ada GPU wurde unser Gerät jedoch mit einem größeren 230-Watt-Netzteil geliefert, im Gegensatz zum 170-Watt-Netzteil des ersten ThinkPad P16 Gen 2.
Das Gerät wird standardmäßig mit einer dreijährigen Herstellergarantie ausgeliefert.
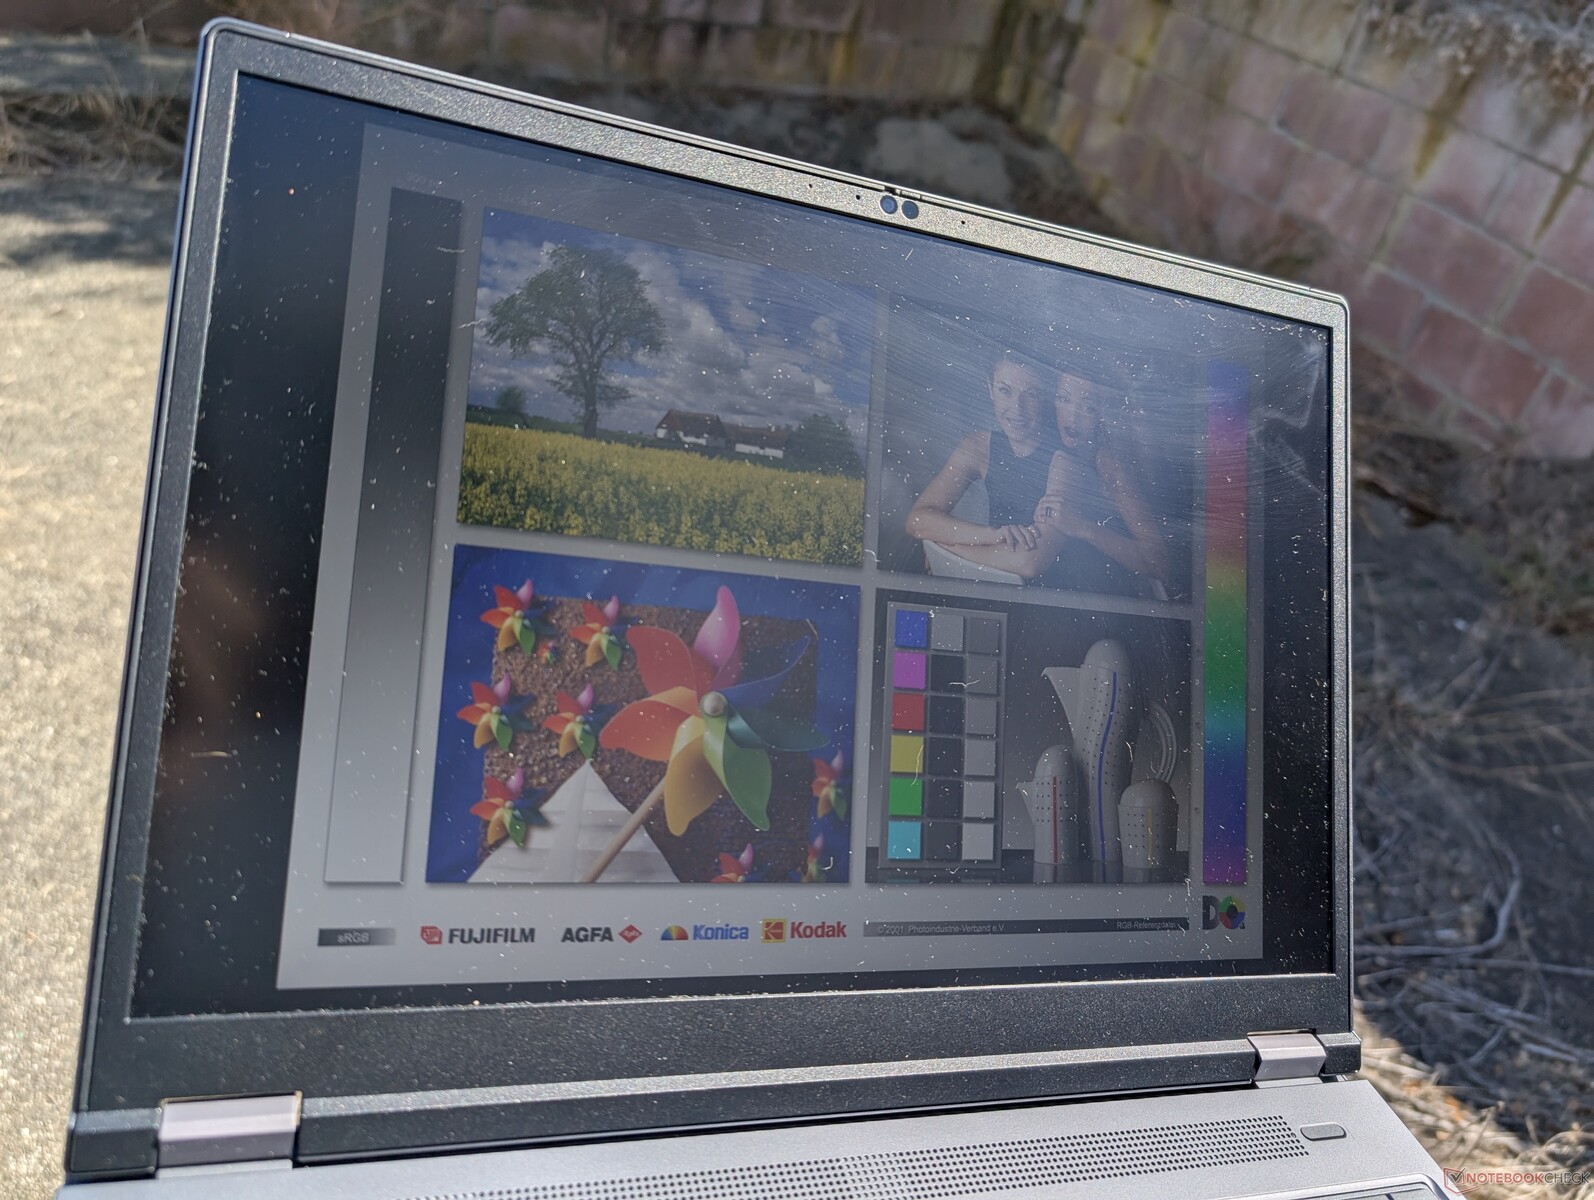
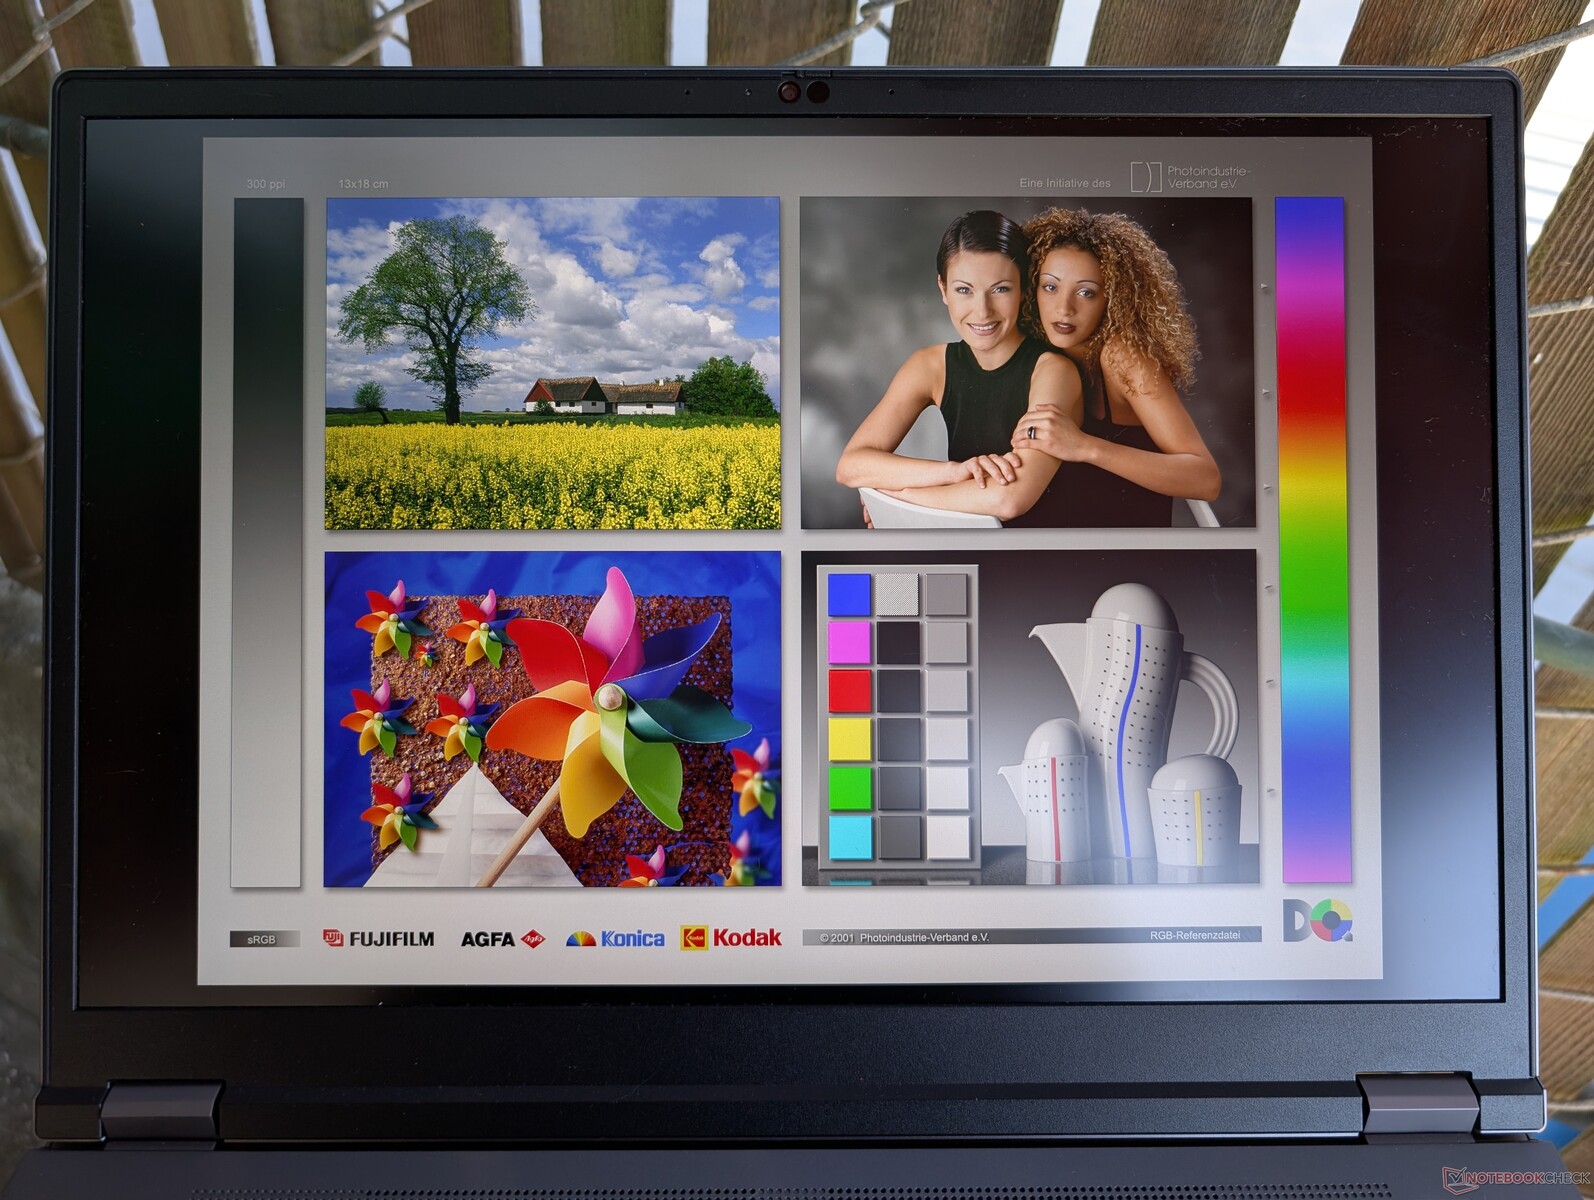
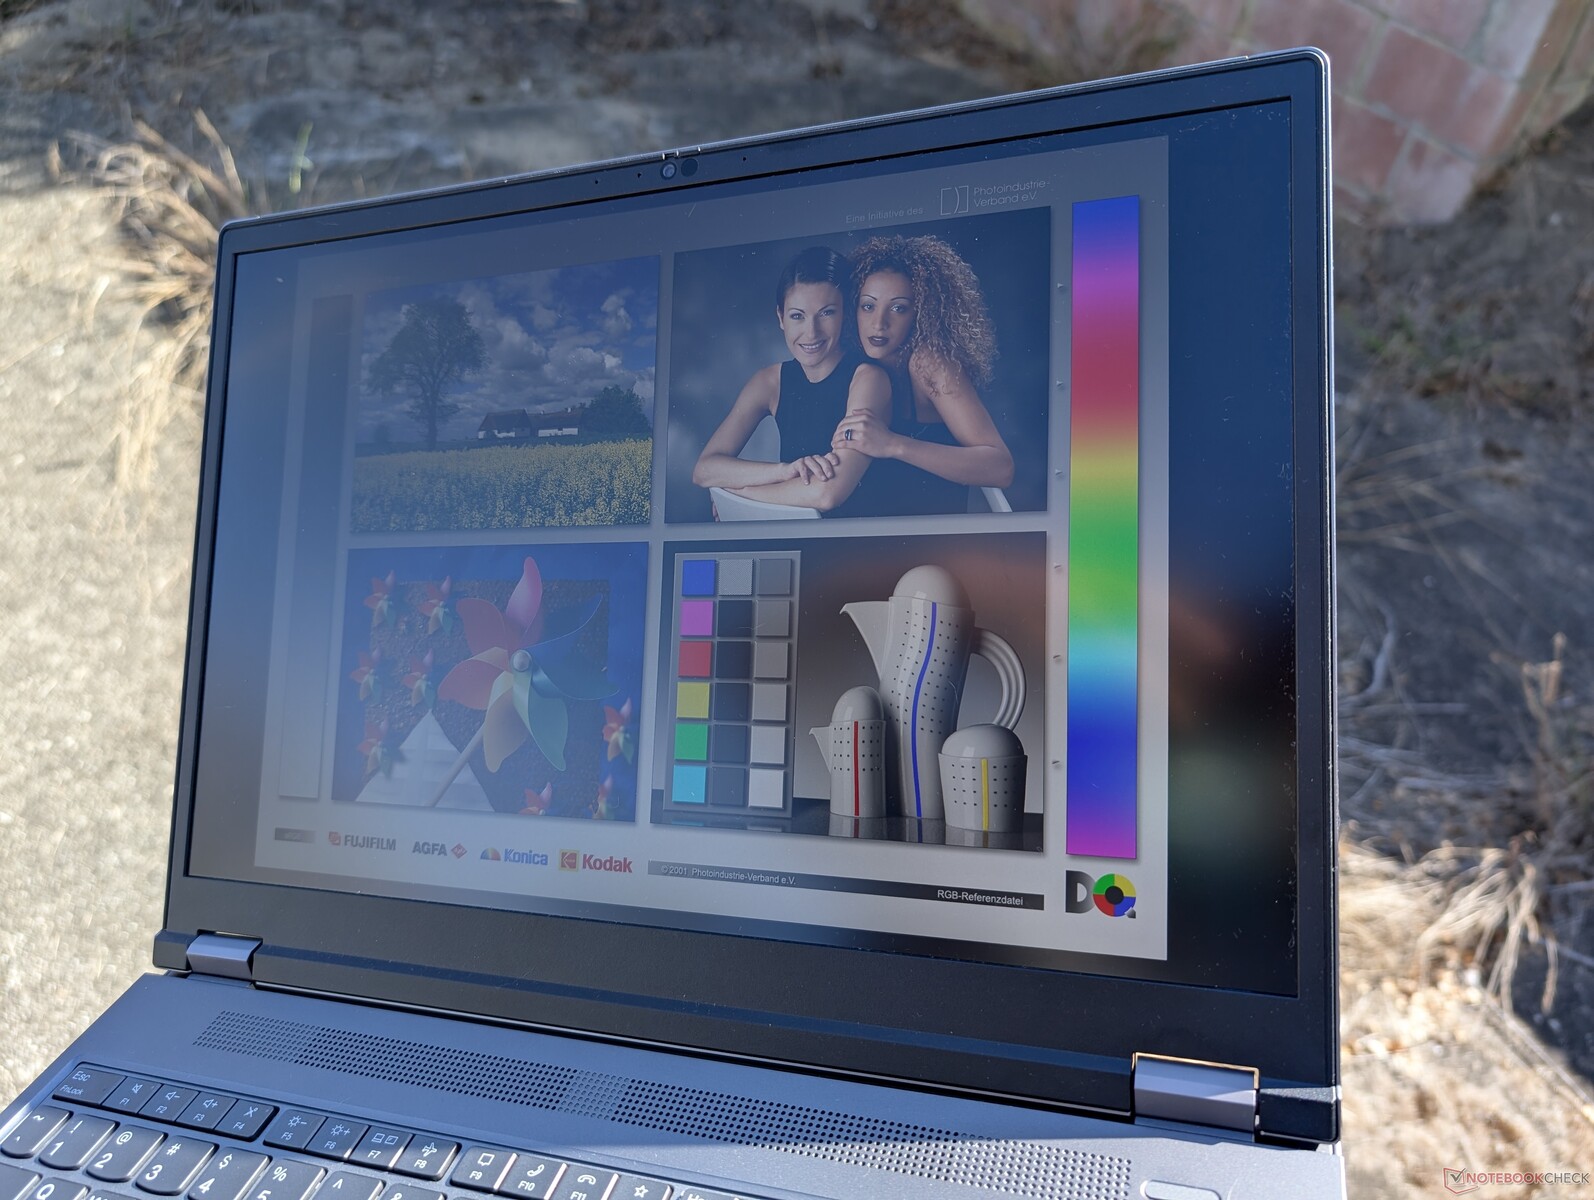
Display
Interessanterweise stammt unser 1600p165 IPS-Panel von einem anderen Hersteller als das im ersten ThinkPad P16 Gen 2 verwendete (NE160QDM-NY1 vs. MNG007DA1-9). Abgesehen von der Herstellerunterschiedlichkeit sind die Kerneigenschaften und die Helligkeit nahezu identisch. Darüber hinaus sind weitere Display-Optionen erhältlich, darunter ein 2400p OLED-Panel und ein 1200p IPS-Panel.


| |||||||||||||||||||||||||
Ausleuchtung: 89 %
Helligkeit Akku: 531.5 cd/m²
Kontrast: 1399:1 (Schwarzwert: 0.38 cd/m²)
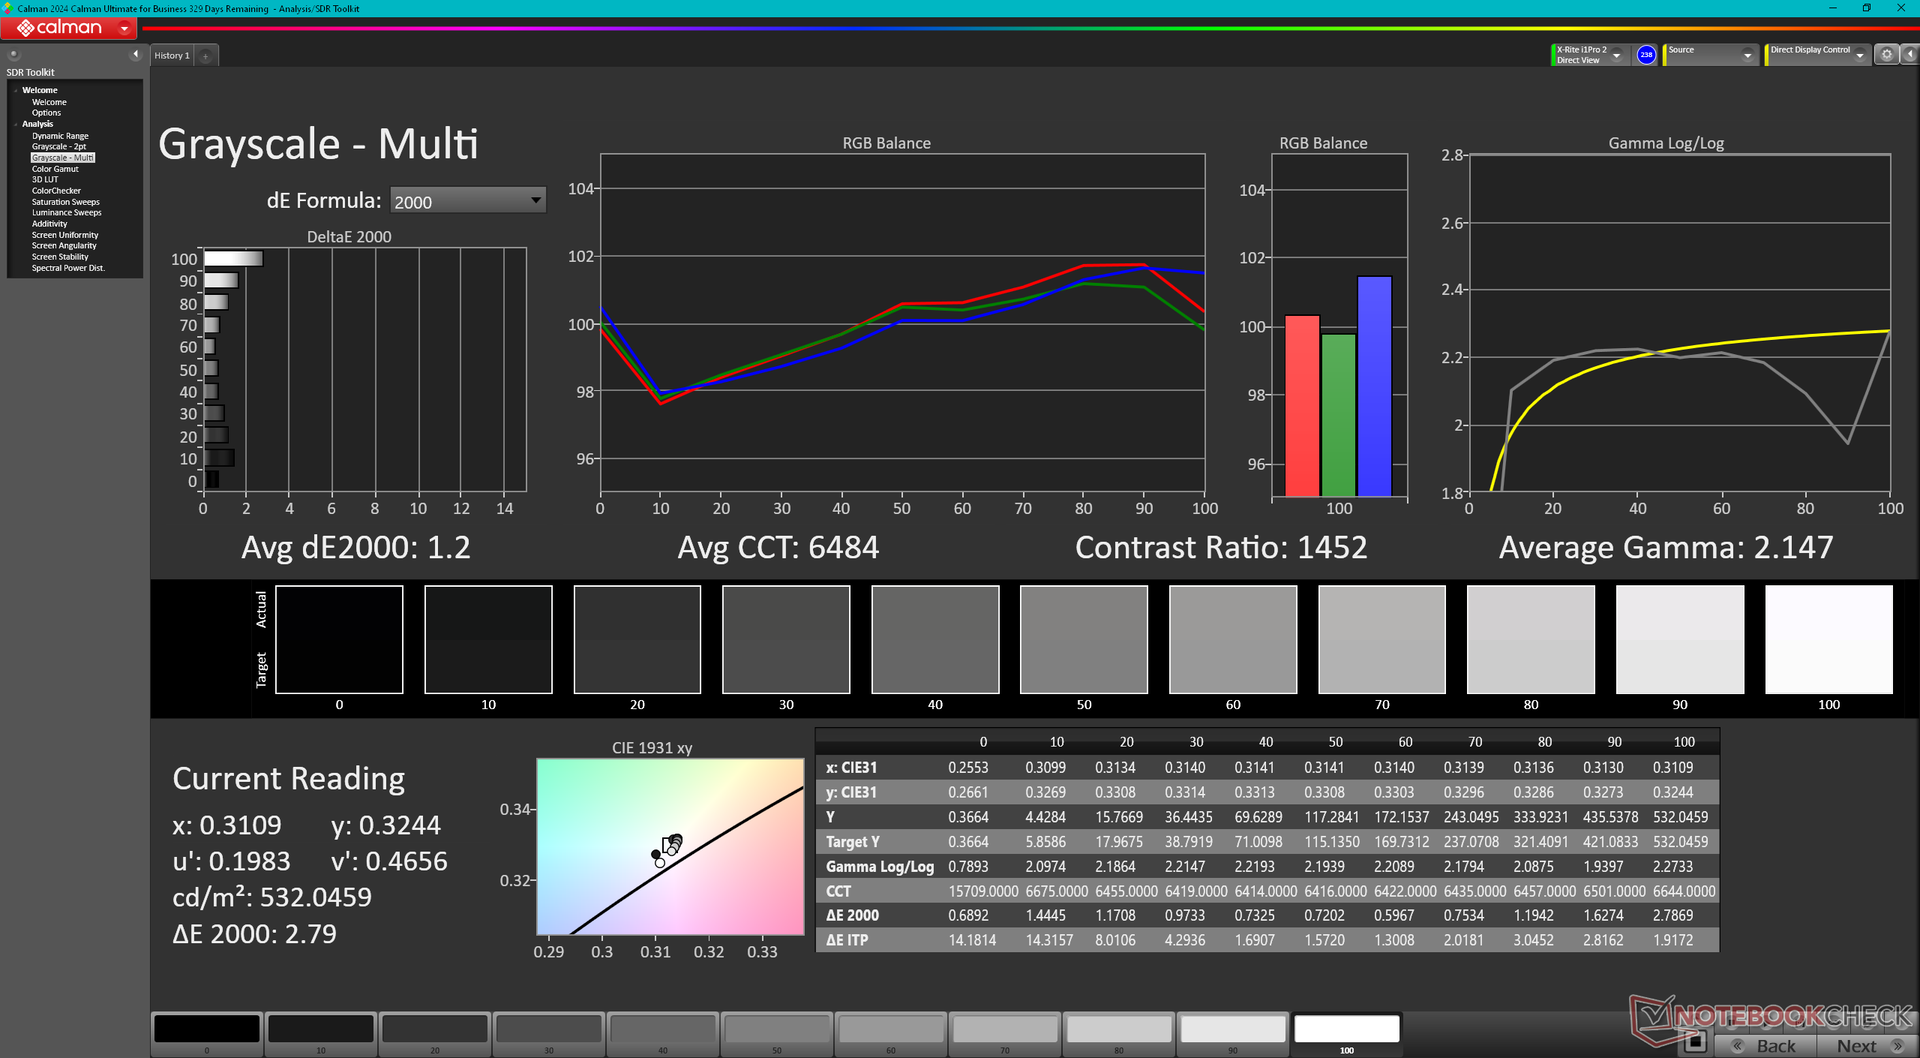
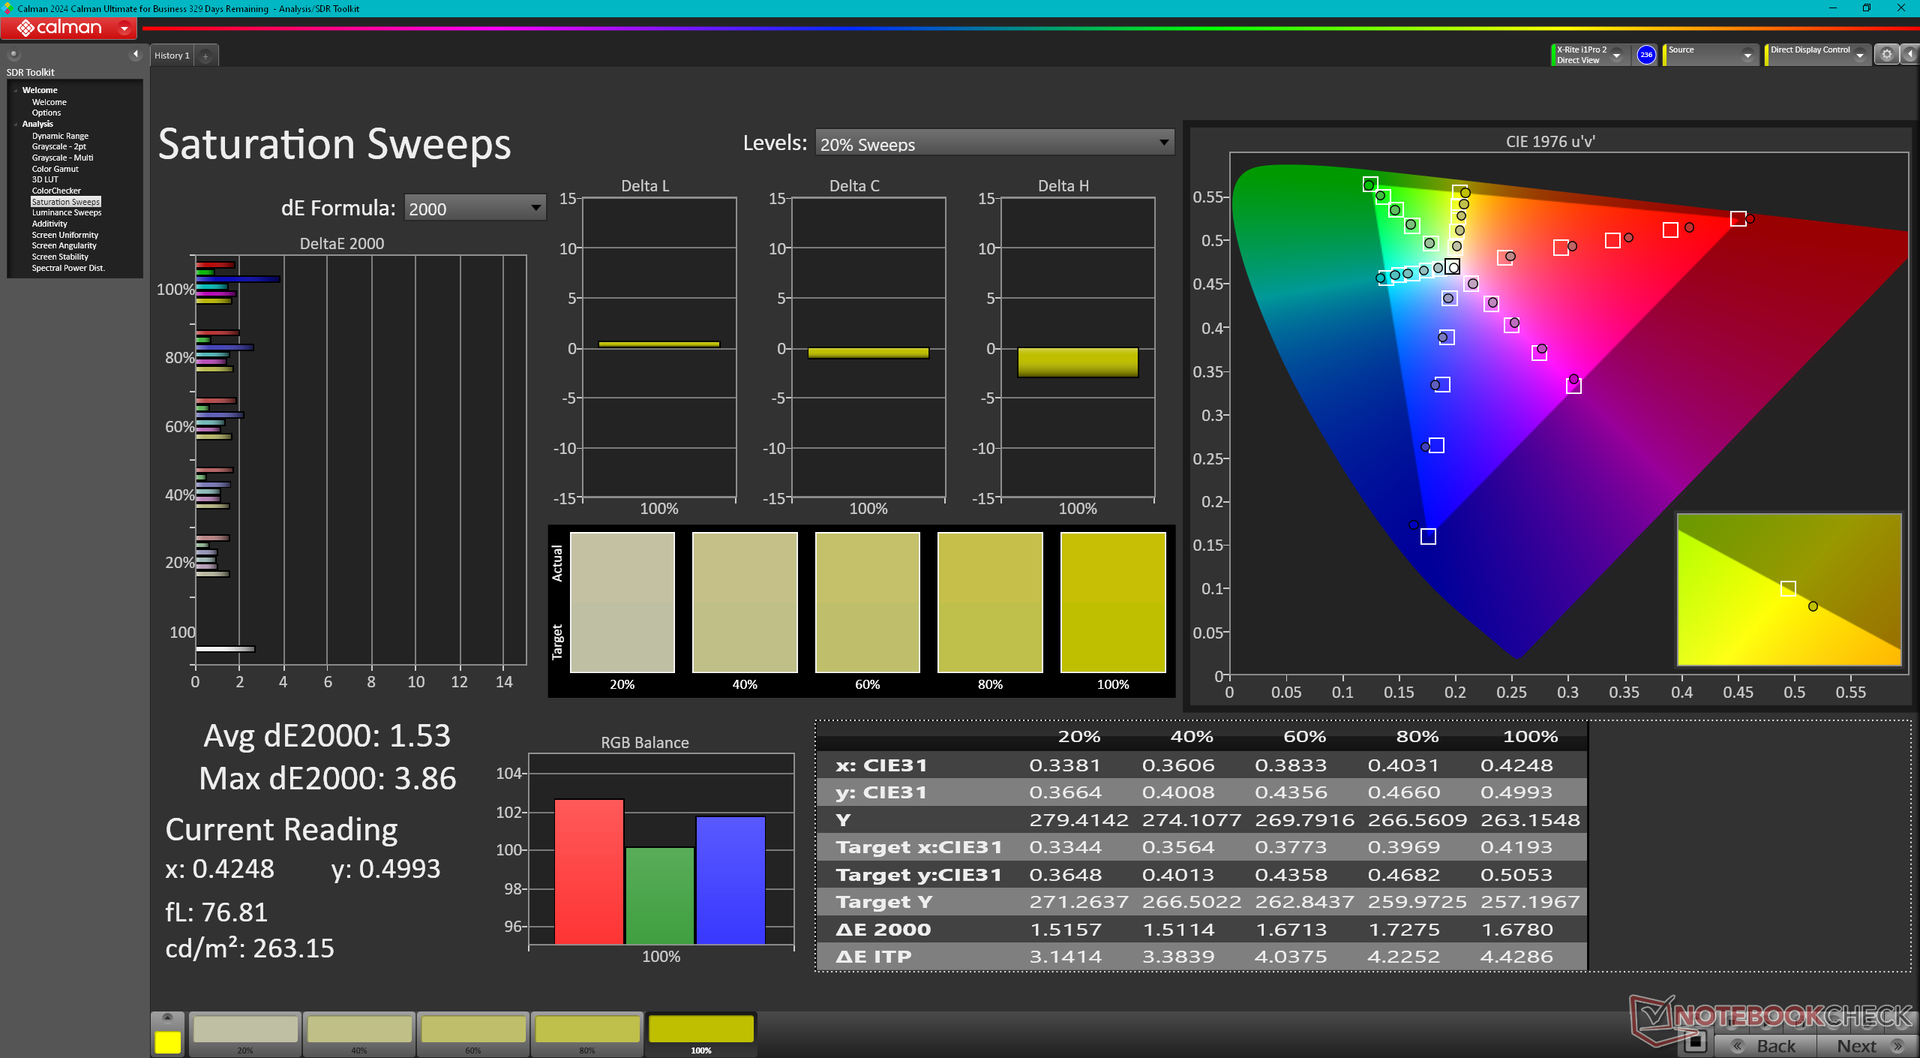
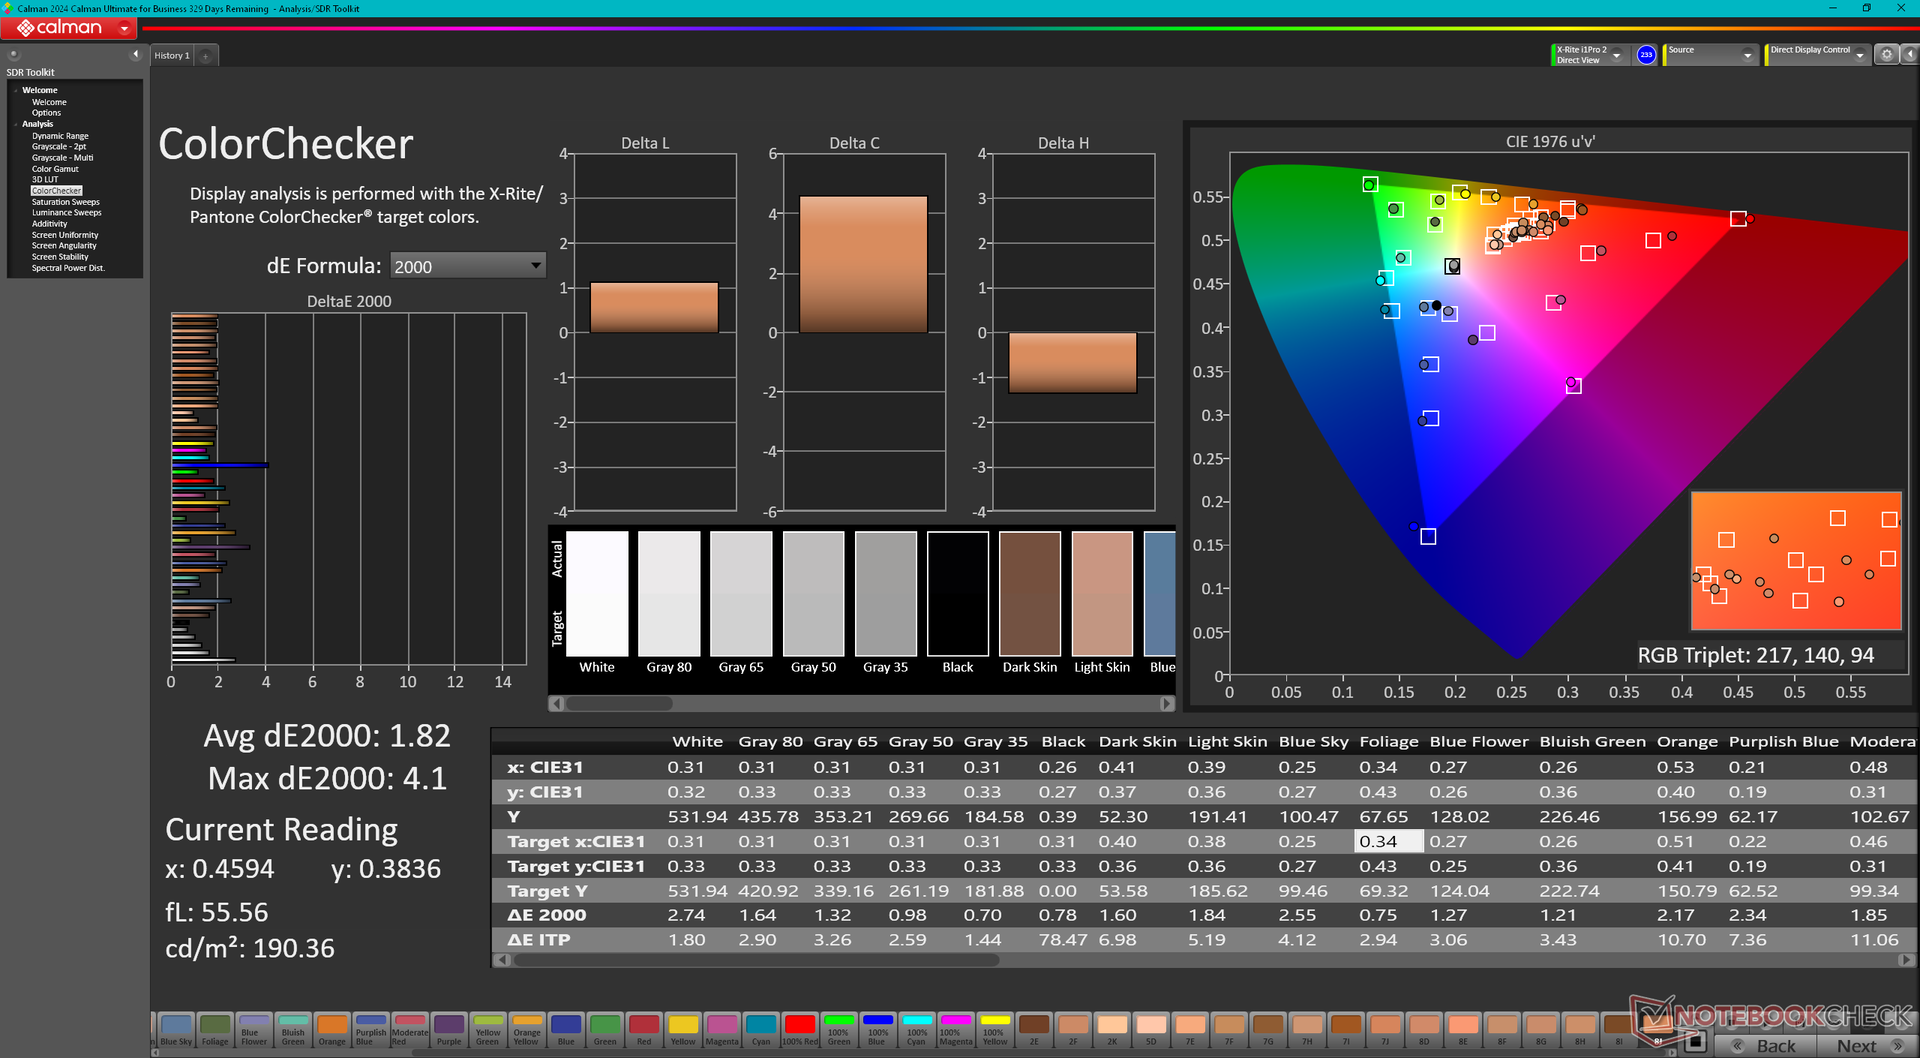
ΔE ColorChecker Calman: 1.82 | ∀{0.5-29.43 Ø4.78}
calibrated: 0.63
ΔE Greyscale Calman: 1.2 | ∀{0.09-98 Ø5}
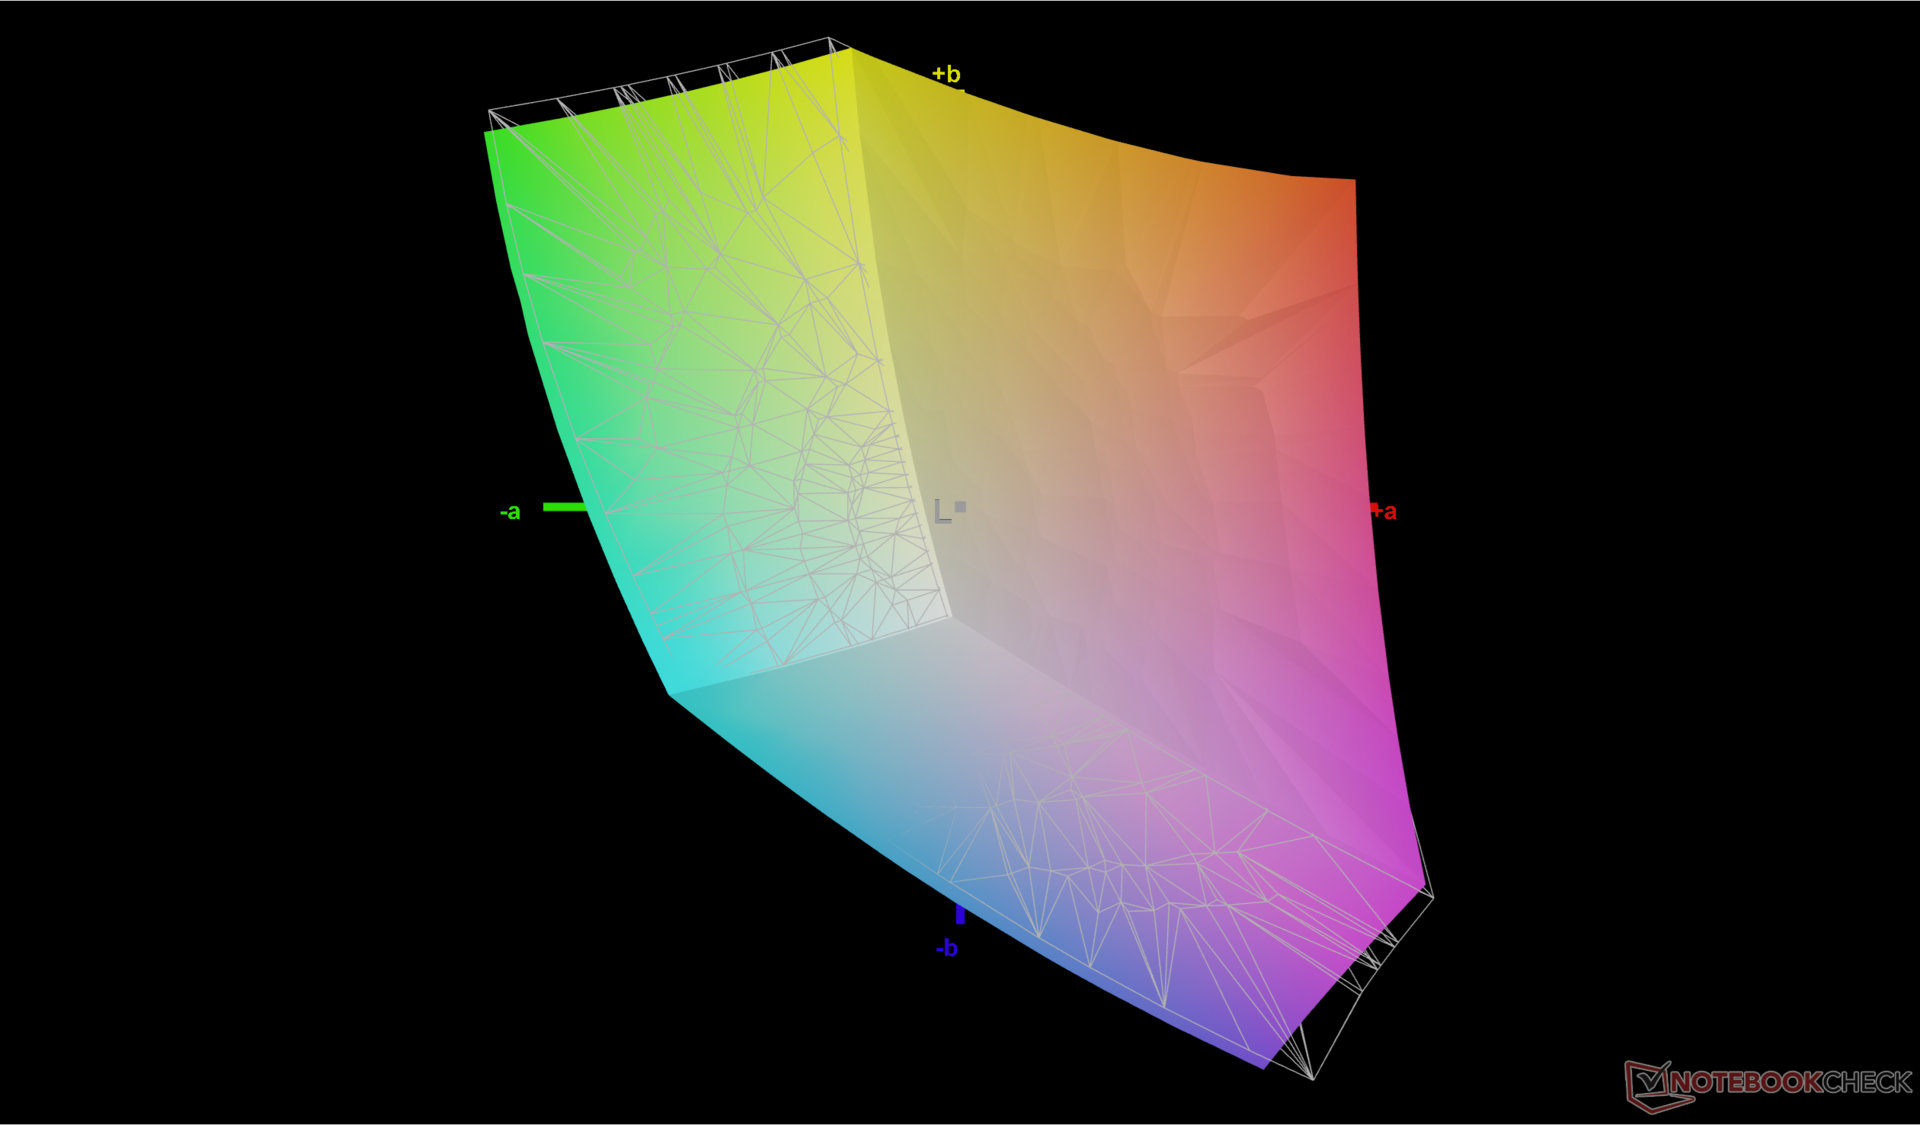
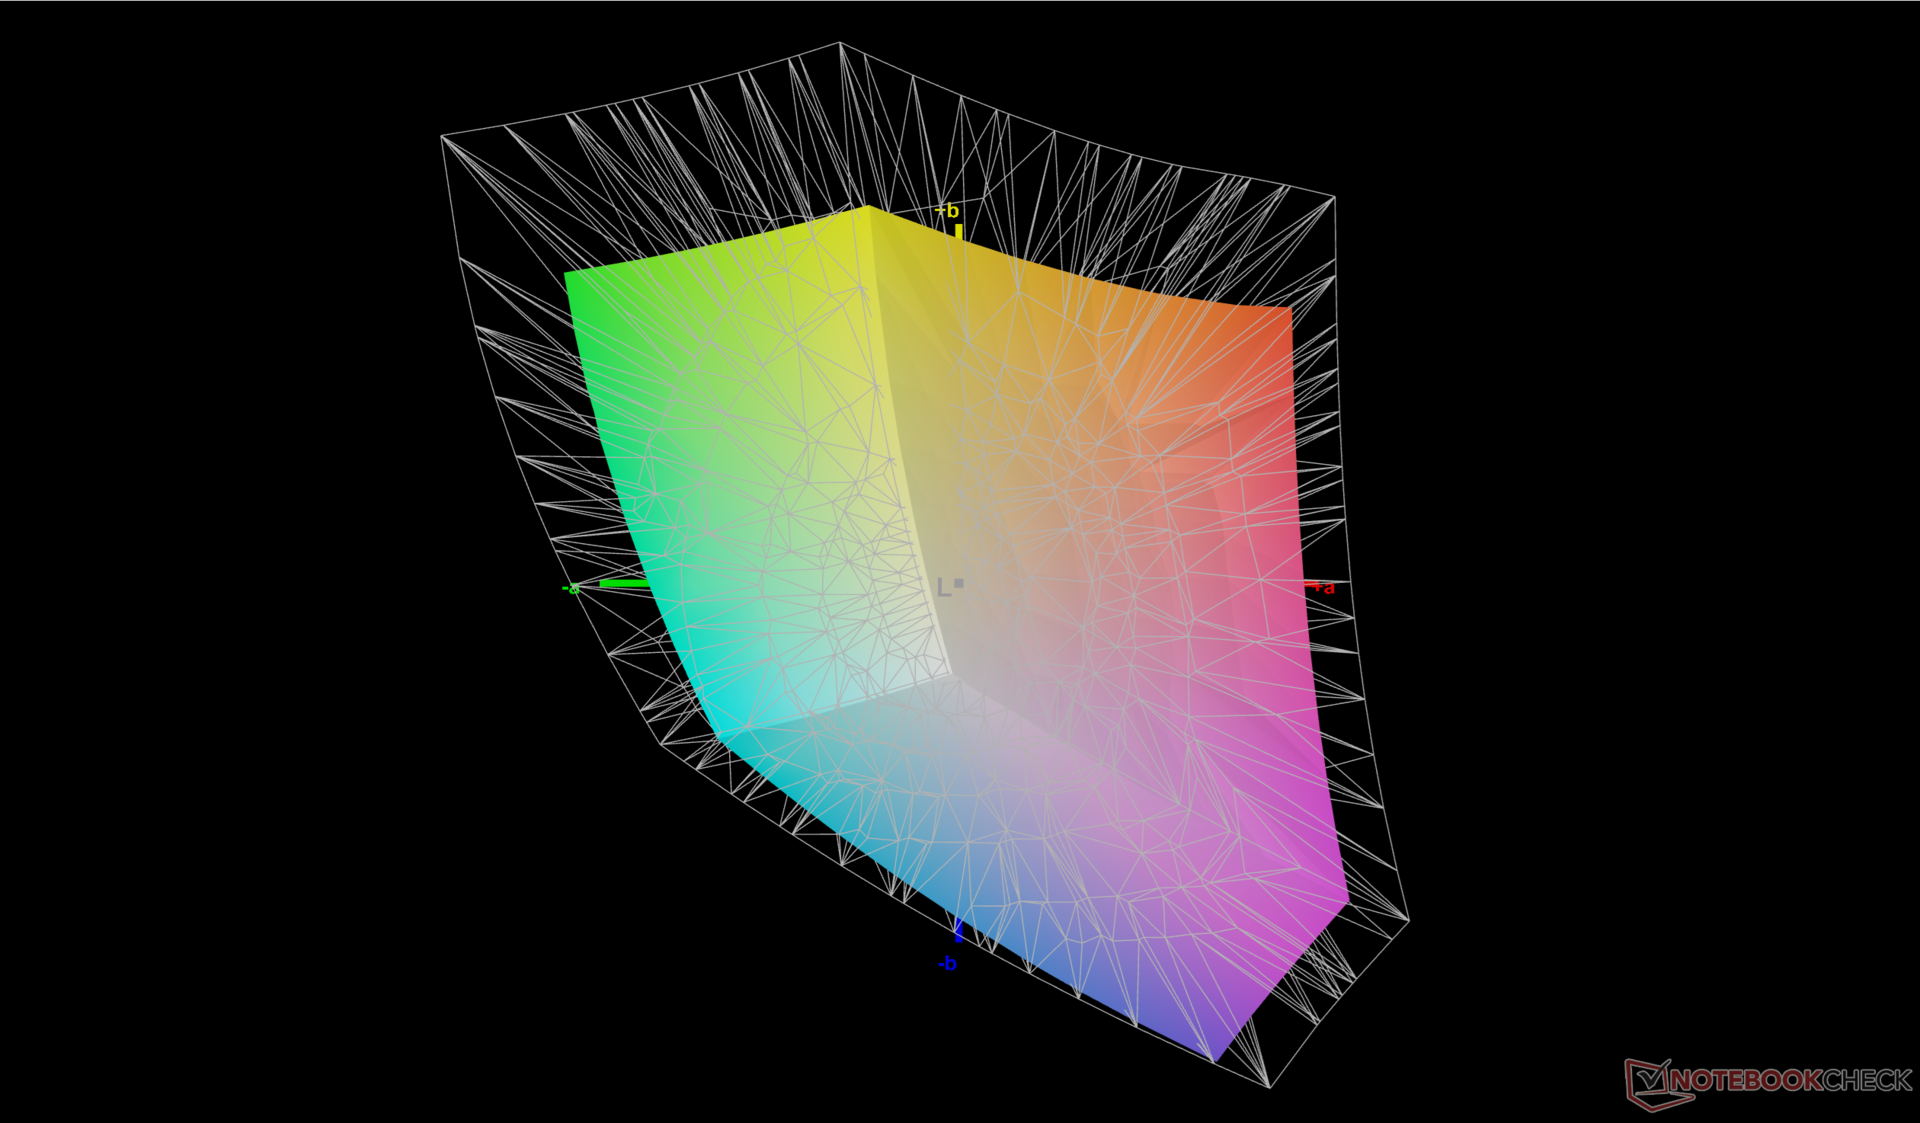
70.6% AdobeRGB 1998 (Argyll 3D)
96.9% sRGB (Argyll 3D)
68.4% Display P3 (Argyll 3D)
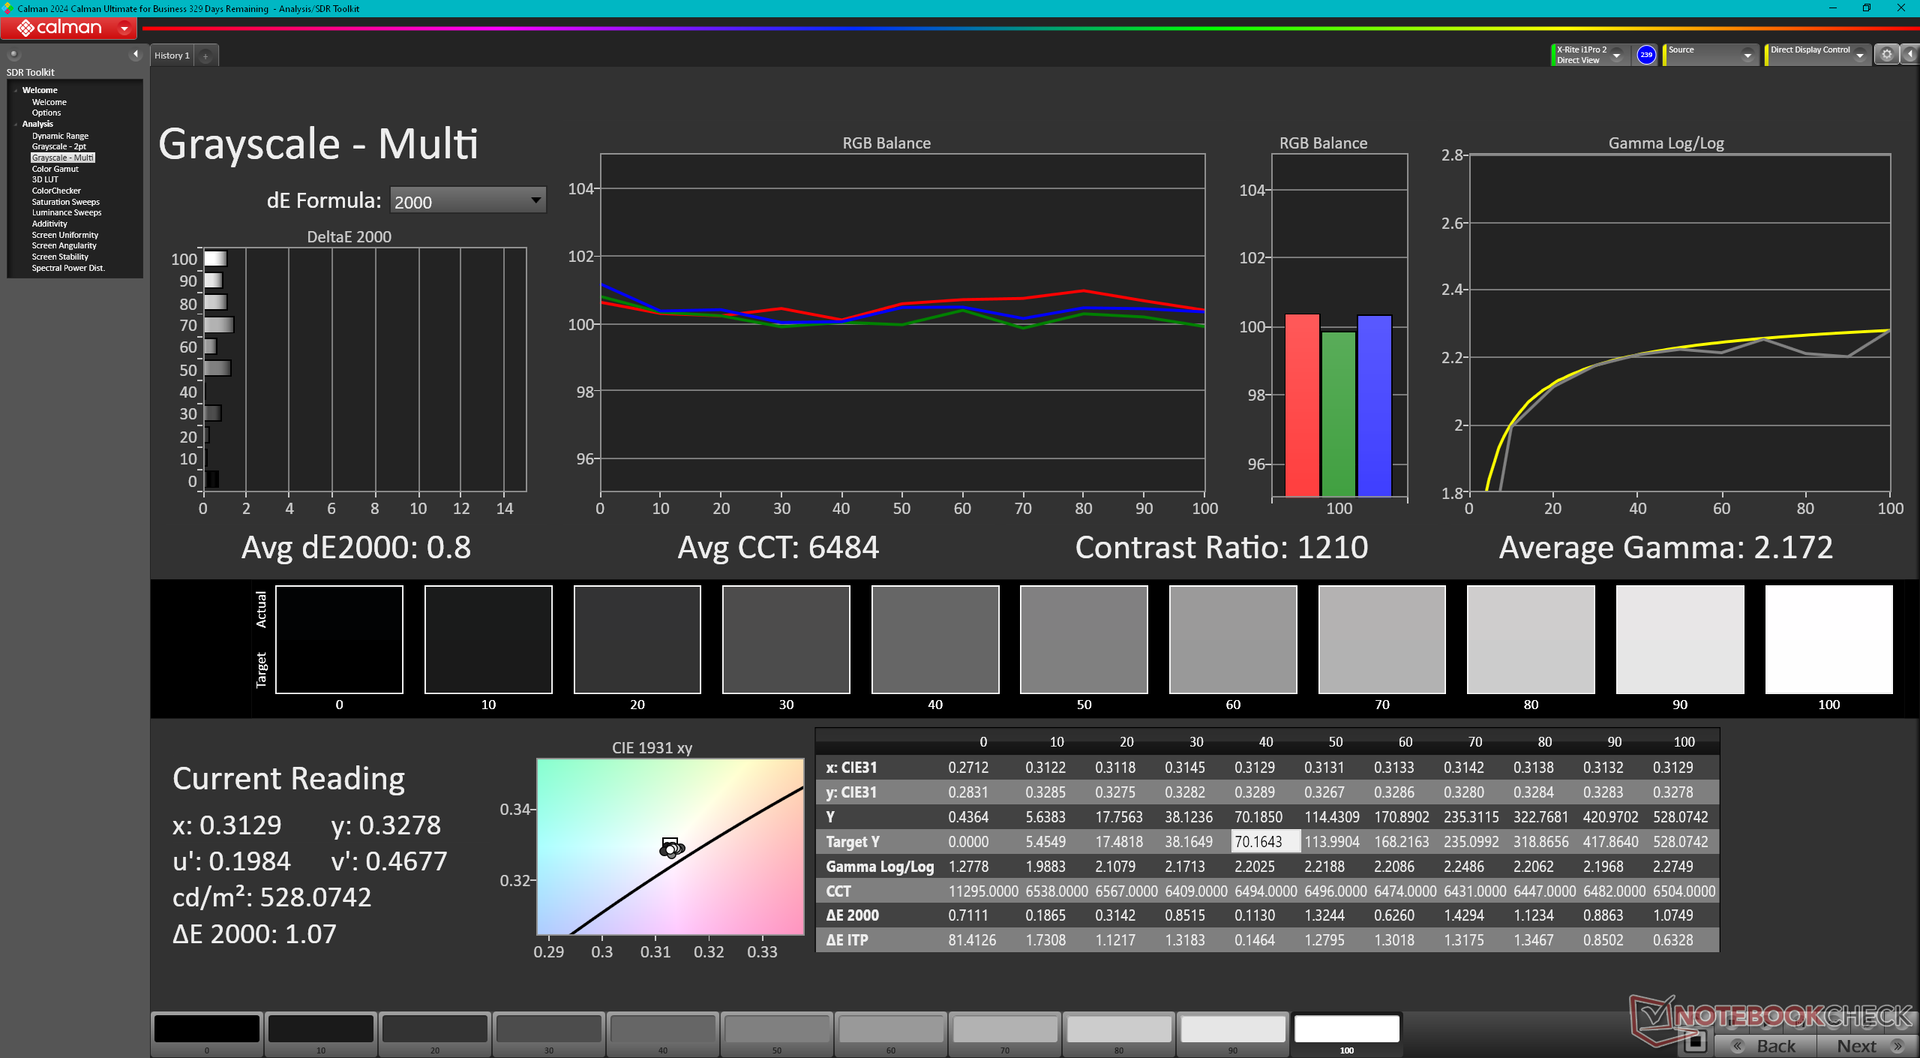
Gamma: 2.15
CCT: 6484 K
| Lenovo ThinkPad P16 Gen 2 NE160QDM-NY1, IPS, 2560x1600, 16", 165 Hz | Lenovo ThinkPad P16 G2 21FA000FGE MNG007DA1-9, IPS LED, 2560x1600, 16", 165 Hz | Lenovo ThinkPad P16s G2 21K9000CGE ATNA60YV04-0, OLED, 3840x2400, 16", 60 Hz | Lenovo ThinkPad P16 G1 RTX A5500 LP160UQ1-SPB1, IPS, 3840x2400, 16", 60 Hz | HP ZBook Power 16 G11 A AUOA0A9, IPS, 2560x1600, 16", 120 Hz | Dell Precision 5690 Samsung 160YV03, OLED, 3840x2400, 16", 60 Hz | |
|---|---|---|---|---|---|---|
| Display | 3% | 29% | 20% | 1% | 29% | |
| Display P3 Coverage (%) | 68.4 | 71 4% | 99.9 46% | 82.9 21% | 69.1 1% | 99.8 46% |
| sRGB Coverage (%) | 96.9 | 99.2 2% | 100 3% | 98.9 2% | 97.7 1% | 100 3% |
| AdobeRGB 1998 Coverage (%) | 70.6 | 73.2 4% | 96.9 37% | 95.9 36% | 71 1% | 96.6 37% |
| Response Times | 4% | 88% | -248% | 10% | 86% | |
| Response Time Grey 50% / Grey 80% * (ms) | 14.1 ? | 12.8 ? 9% | 1.5 ? 89% | 45.6 ? -223% | 13.6 ? 4% | 1.7 ? 88% |
| Response Time Black / White * (ms) | 9.9 ? | 10.1 ? -2% | 1.3 ? 87% | 36.8 ? -272% | 8.4 ? 15% | 1.7 ? 83% |
| PWM Frequency (Hz) | 60 | 60 ? | ||||
| Bildschirm | -59% | -54% | -22% | -52% | -49% | |
| Helligkeit Bildmitte (cd/m²) | 531.5 | 510 -4% | 416 -22% | 601.9 13% | 470.7 -11% | 348.1 -35% |
| Brightness (cd/m²) | 499 | 517 4% | 421 -16% | 569 14% | 431 -14% | 351 -30% |
| Brightness Distribution (%) | 89 | 89 0% | 98 10% | 77 -13% | 88 -1% | 97 9% |
| Schwarzwert * (cd/m²) | 0.38 | 0.37 3% | 0.47 -24% | 0.57 -50% | ||
| Kontrast (:1) | 1399 | 1378 -2% | 1281 -8% | 826 -41% | ||
| Delta E Colorchecker * | 1.82 | 2.6 -43% | 1.3 29% | 2.45 -35% | 2.16 -19% | 4.18 -130% |
| Colorchecker dE 2000 max. * | 4.1 | 5.2 -27% | 2.8 32% | 4.46 -9% | 4.39 -7% | 6.68 -63% |
| Colorchecker dE 2000 calibrated * | 0.63 | 2.3 -265% | 2.9 -360% | 1.37 -117% | 0.97 -54% | |
| Delta E Graustufen * | 1.2 | 3.6 -200% | 1.8 -50% | 2.6 -117% | 3.7 -208% | 1.7 -42% |
| Gamma | 2.15 102% | 2.26 97% | 2.25 98% | 2.3 96% | 2.38 92% | 2.2 100% |
| CCT | 6484 100% | 5969 109% | 6574 99% | 6805 96% | 6765 96% | 6198 105% |
| Durchschnitt gesamt (Programm / Settings) | -17% /
-37% | 21% /
-10% | -83% /
-47% | -14% /
-32% | 22% /
-7% |
* ... kleinere Werte sind besser
Das Display wird vorkalibriert nach dem sRGB-Standard mit durchschnittlichen Graustufen-DeltaE-Werten von nur 1,2 bzw. 1,82 geliefert. Eine Kalibrierung durch den Endbenutzer ist daher in den meisten Fällen nicht notwendig.

Reaktionszeiten (Response Times) des Displays
| ↔ Reaktionszeiten Schwarz zu Weiß | ||
|---|---|---|
| 9.9 ms ... steigend ↗ und fallend ↘ kombiniert | ↗ 5 ms steigend | 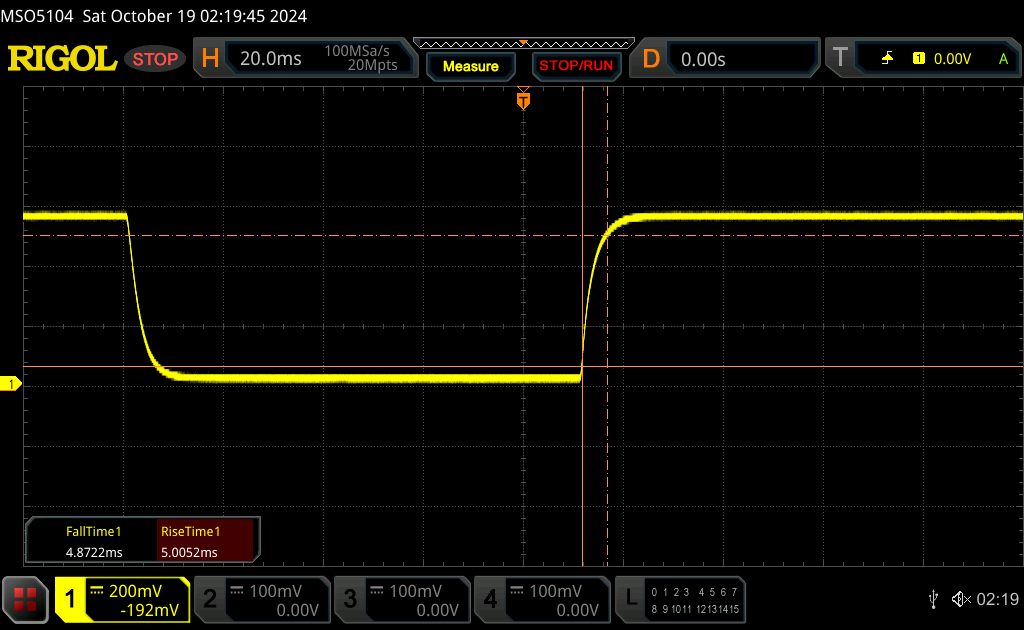 |
| ↘ 4.9 ms fallend | ||
| Die gemessenen Reaktionszeiten sind kurz wodurch sich der Bildschirm auch für Spiele gut eignen sollte. Im Vergleich rangierten die bei uns getesteten Geräte von 0.1 (Minimum) zu 240 (Maximum) ms. » 26 % aller Screens waren schneller als der getestete. Daher sind die gemessenen Reaktionszeiten besser als der Durchschnitt aller vermessenen Geräte (20.2 ms). | ||
| ↔ Reaktionszeiten 50% Grau zu 80% Grau | ||
| 14.1 ms ... steigend ↗ und fallend ↘ kombiniert | ↗ 6.7 ms steigend | 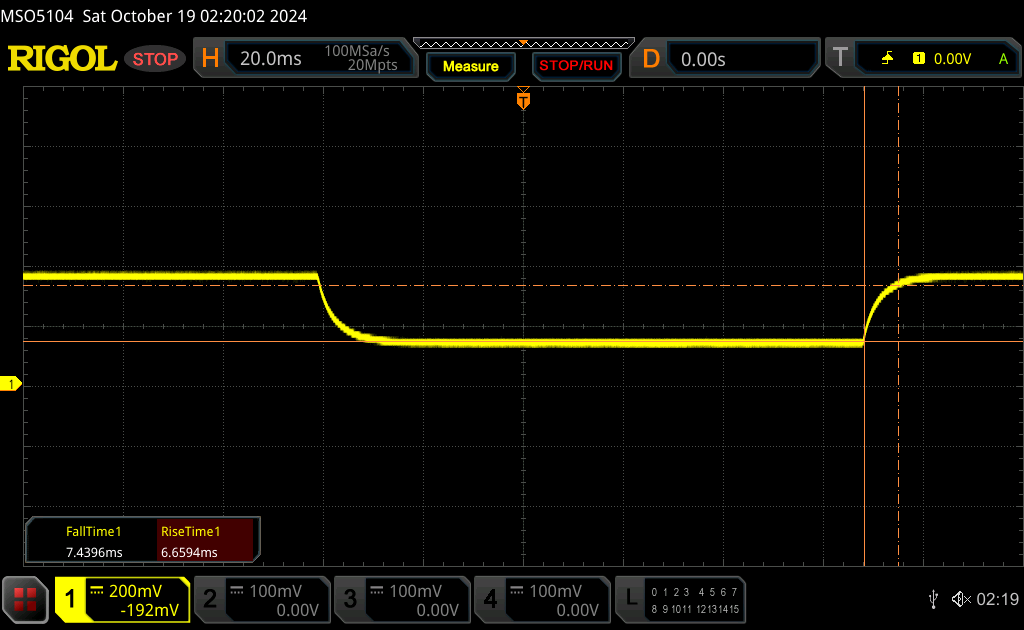 |
| ↘ 7.4 ms fallend | ||
| Die gemessenen Reaktionszeiten sind gut, für anspruchsvolle Spieler könnten der Bildschirm jedoch zu langsam sein. Im Vergleich rangierten die bei uns getesteten Geräte von 0.165 (Minimum) zu 636 (Maximum) ms. » 27 % aller Screens waren schneller als der getestete. Daher sind die gemessenen Reaktionszeiten besser als der Durchschnitt aller vermessenen Geräte (31.6 ms). | ||
Bildschirm-Flackern / PWM (Pulse-Width Modulation)
| Flackern / PWM nicht festgestellt |  | ||
Im Vergleich: 53 % aller getesteten Geräte nutzten kein PWM um die Helligkeit zu reduzieren. Wenn PWM eingesetzt wurde, dann bei einer Frequenz von durchschnittlich 8111 (Minimum 5, Maximum 343500) Hz. | |||


Performance
Testbedingungen
Wir haben Windows auf den Performance-Modus und die GPU auf den diskreten Modus eingestellt, bevor wir die folgenden Benchmarks durchgeführt haben. Laut dem Nvidia Control Panel wird Advanced Optimus von dem System nicht unterstützt.
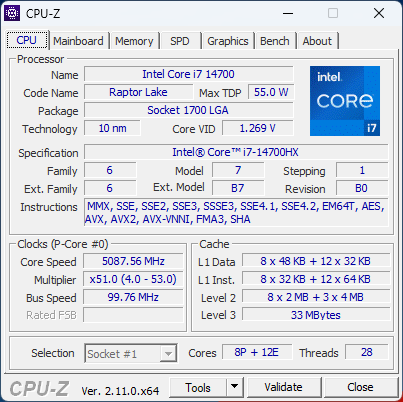
Prozessor
Der Core i7-14700HX bietet einen deutlichen Leistungssprung im Vergleich zum Core i7-13700HX, mit einer Steigerung der Multi-Thread-Leistung um 20 bis 25 Prozent. SKUs mit dem Core i9-13980HX sind weiterhin erhältlich und können trotz des älteren Prozessors eine noch schnellere Leistung als unser Core i7-14700HX bieten.
Die Nachhaltigkeit der Leistung ist gut, könnte jedoch noch besser sein. Wenn wir beispielsweise den CineBench R15 xT in einer Schleife ausführen, sinkt unser anfänglicher Score von 3930 Punkten bereits nach wenigen Durchläufen um 10 Prozent.
Cinebench R15 Multi Dauertest
Cinebench R23: Multi Core | Single Core
Cinebench R20: CPU (Multi Core) | CPU (Single Core)
Cinebench R15: CPU Multi 64Bit | CPU Single 64Bit
Blender: v2.79 BMW27 CPU
7-Zip 18.03: 7z b 4 | 7z b 4 -mmt1
Geekbench 6.5: Multi-Core | Single-Core
Geekbench 5.5: Multi-Core | Single-Core
HWBOT x265 Benchmark v2.2: 4k Preset
LibreOffice : 20 Documents To PDF
R Benchmark 2.5: Overall mean
| CPU Performance Rating | |
| HP ZBook Fury 16 G11 | |
| Lenovo ThinkPad P16 Gen 2 | |
| Durchschnittliche Intel Core i7-14700HX | |
| Durchschnitt der Klasse Workstation | |
| Lenovo ThinkPad P16 G1 RTX A5500 -2! | |
| Lenovo ThinkPad P1 G6 21FV001KUS | |
| Lenovo ThinkPad P16 G2 21FA000FGE -2! | |
| Dell Precision 5690 | |
| Lenovo ThinkPad P1 G6-21FV000DGE | |
| Lenovo ThinkPad P1 Gen 7 21KV001SGE | |
| HP ZBook Fury 16 G9 -2! | |
| HP ZBook Power 16 G11 A | |
| MSI CreatorPro Z16P B12UKST -2! | |
| Lenovo ThinkPad P16v G1 AMD | |
| Lenovo ThinkPad P16s G2 21K9000CGE | |
| HP ZBook Firefly 16 G9-6B897EA -2! | |
| Cinebench R20 / CPU (Multi Core) | |
| HP ZBook Fury 16 G11 | |
| Lenovo ThinkPad P16 Gen 2 | |
| Durchschnittliche Intel Core i7-14700HX (7988 - 10540, n=9) | |
| Durchschnitt der Klasse Workstation (5471 - 15043, n=28, der letzten 2 Jahre) | |
| Lenovo ThinkPad P16 G2 21FA000FGE | |
| Lenovo ThinkPad P16 G1 RTX A5500 | |
| Dell Precision 5690 | |
| HP ZBook Fury 16 G9 | |
| Lenovo ThinkPad P1 Gen 7 21KV001SGE | |
| Lenovo ThinkPad P1 G6-21FV000DGE | |
| MSI CreatorPro Z16P B12UKST | |
| Lenovo ThinkPad P1 G6 21FV001KUS | |
| HP ZBook Power 16 G11 A | |
| Lenovo ThinkPad P16s G2 21K9000CGE | |
| Lenovo ThinkPad P16v G1 AMD | |
| HP ZBook Firefly 16 G9-6B897EA | |
| Cinebench R20 / CPU (Single Core) | |
| HP ZBook Fury 16 G11 | |
| Lenovo ThinkPad P16 Gen 2 | |
| Lenovo ThinkPad P1 G6-21FV000DGE | |
| Lenovo ThinkPad P1 G6 21FV001KUS | |
| Durchschnittliche Intel Core i7-14700HX (651 - 821, n=9) | |
| Durchschnitt der Klasse Workstation (652 - 849, n=28, der letzten 2 Jahre) | |
| HP ZBook Fury 16 G9 | |
| Lenovo ThinkPad P16 G2 21FA000FGE | |
| Lenovo ThinkPad P16 G1 RTX A5500 | |
| Dell Precision 5690 | |
| Lenovo ThinkPad P1 Gen 7 21KV001SGE | |
| HP ZBook Power 16 G11 A | |
| MSI CreatorPro Z16P B12UKST | |
| Lenovo ThinkPad P16s G2 21K9000CGE | |
| Lenovo ThinkPad P16v G1 AMD | |
| HP ZBook Firefly 16 G9-6B897EA | |
| Cinebench R15 / CPU Multi 64Bit | |
| HP ZBook Fury 16 G11 | |
| Lenovo ThinkPad P16 Gen 2 | |
| Durchschnittliche Intel Core i7-14700HX (3328 - 4248, n=9) | |
| Durchschnitt der Klasse Workstation (2240 - 5810, n=28, der letzten 2 Jahre) | |
| Dell Precision 5690 | |
| Lenovo ThinkPad P16 G1 RTX A5500 | |
| Lenovo ThinkPad P16 G2 21FA000FGE | |
| Lenovo ThinkPad P1 Gen 7 21KV001SGE | |
| Lenovo ThinkPad P1 G6 21FV001KUS | |
| Lenovo ThinkPad P1 G6-21FV000DGE | |
| HP ZBook Power 16 G11 A | |
| HP ZBook Fury 16 G9 | |
| Lenovo ThinkPad P16s G2 21K9000CGE | |
| Lenovo ThinkPad P16v G1 AMD | |
| MSI CreatorPro Z16P B12UKST | |
| HP ZBook Firefly 16 G9-6B897EA | |
| Cinebench R15 / CPU Single 64Bit | |
| HP ZBook Fury 16 G11 | |
| Lenovo ThinkPad P16 Gen 2 | |
| Lenovo ThinkPad P1 G6-21FV000DGE | |
| Lenovo ThinkPad P1 G6 21FV001KUS | |
| Durchschnitt der Klasse Workstation (191.4 - 328, n=28, der letzten 2 Jahre) | |
| Durchschnittliche Intel Core i7-14700HX (238 - 304, n=9) | |
| Lenovo ThinkPad P16 G2 21FA000FGE | |
| HP ZBook Power 16 G11 A | |
| Lenovo ThinkPad P16 G1 RTX A5500 | |
| Dell Precision 5690 | |
| Lenovo ThinkPad P1 Gen 7 21KV001SGE | |
| Lenovo ThinkPad P16s G2 21K9000CGE | |
| Lenovo ThinkPad P16v G1 AMD | |
| MSI CreatorPro Z16P B12UKST | |
| HP ZBook Firefly 16 G9-6B897EA | |
| HP ZBook Fury 16 G9 | |
| Geekbench 6.5 / Multi-Core | |
| Lenovo ThinkPad P16 Gen 2 | |
| Durchschnittliche Intel Core i7-14700HX (14163 - 17562, n=9) | |
| HP ZBook Fury 16 G11 | |
| Durchschnitt der Klasse Workstation (10931 - 20887, n=27, der letzten 2 Jahre) | |
| Dell Precision 5690 | |
| Lenovo ThinkPad P1 Gen 7 21KV001SGE | |
| Lenovo ThinkPad P1 G6 21FV001KUS | |
| HP ZBook Power 16 G11 A | |
| Lenovo ThinkPad P1 G6-21FV000DGE | |
| Lenovo ThinkPad P16s G2 21K9000CGE | |
| Lenovo ThinkPad P16v G1 AMD | |
| Geekbench 6.5 / Single-Core | |
| HP ZBook Fury 16 G11 | |
| Lenovo ThinkPad P16 Gen 2 | |
| Durchschnittliche Intel Core i7-14700HX (2378 - 2975, n=9) | |
| Lenovo ThinkPad P1 G6 21FV001KUS | |
| Lenovo ThinkPad P1 G6-21FV000DGE | |
| Durchschnitt der Klasse Workstation (2384 - 3028, n=27, der letzten 2 Jahre) | |
| HP ZBook Power 16 G11 A | |
| Lenovo ThinkPad P16v G1 AMD | |
| Dell Precision 5690 | |
| Lenovo ThinkPad P16s G2 21K9000CGE | |
| Lenovo ThinkPad P1 Gen 7 21KV001SGE | |
| HWBOT x265 Benchmark v2.2 / 4k Preset | |
| HP ZBook Fury 16 G11 | |
| Lenovo ThinkPad P16 Gen 2 | |
| Durchschnittliche Intel Core i7-14700HX (19.5 - 27.4, n=9) | |
| Durchschnitt der Klasse Workstation (14.4 - 40.5, n=28, der letzten 2 Jahre) | |
| Lenovo ThinkPad P16 G1 RTX A5500 | |
| Lenovo ThinkPad P16 G2 21FA000FGE | |
| Dell Precision 5690 | |
| Lenovo ThinkPad P1 Gen 7 21KV001SGE | |
| Lenovo ThinkPad P1 G6 21FV001KUS | |
| HP ZBook Fury 16 G9 | |
| HP ZBook Power 16 G11 A | |
| MSI CreatorPro Z16P B12UKST | |
| Lenovo ThinkPad P1 G6-21FV000DGE | |
| Lenovo ThinkPad P16v G1 AMD | |
| Lenovo ThinkPad P16s G2 21K9000CGE | |
| HP ZBook Firefly 16 G9-6B897EA | |
| LibreOffice / 20 Documents To PDF | |
| HP ZBook Firefly 16 G9-6B897EA | |
| Lenovo ThinkPad P16s G2 21K9000CGE | |
| HP ZBook Power 16 G11 A | |
| Lenovo ThinkPad P16 G2 21FA000FGE | |
| Durchschnitt der Klasse Workstation (37.1 - 74.7, n=28, der letzten 2 Jahre) | |
| HP ZBook Fury 16 G11 | |
| Durchschnittliche Intel Core i7-14700HX (41.9 - 55.3, n=9) | |
| Lenovo ThinkPad P1 G6-21FV000DGE | |
| Lenovo ThinkPad P16v G1 AMD | |
| Lenovo ThinkPad P16 Gen 2 | |
| Lenovo ThinkPad P1 G6 21FV001KUS | |
| Lenovo ThinkPad P1 Gen 7 21KV001SGE | |
| Dell Precision 5690 | |
| Lenovo ThinkPad P16 G1 RTX A5500 | |
| MSI CreatorPro Z16P B12UKST | |
| HP ZBook Fury 16 G9 | |
Cinebench R23: Multi Core | Single Core
Cinebench R20: CPU (Multi Core) | CPU (Single Core)
Cinebench R15: CPU Multi 64Bit | CPU Single 64Bit
Blender: v2.79 BMW27 CPU
7-Zip 18.03: 7z b 4 | 7z b 4 -mmt1
Geekbench 6.5: Multi-Core | Single-Core
Geekbench 5.5: Multi-Core | Single-Core
HWBOT x265 Benchmark v2.2: 4k Preset
LibreOffice : 20 Documents To PDF
R Benchmark 2.5: Overall mean
* ... kleinere Werte sind besser
AIDA64: FP32 Ray-Trace | FPU Julia | CPU SHA3 | CPU Queen | FPU SinJulia | FPU Mandel | CPU AES | CPU ZLib | FP64 Ray-Trace | CPU PhotoWorxx
| Performance Rating | |
| Lenovo ThinkPad P16 Gen 2 | |
| HP ZBook Power 16 G11 A | |
| Durchschnittliche Intel Core i7-14700HX | |
| Lenovo ThinkPad P16s G2 21K9000CGE | |
| Dell Precision 5690 | |
| Lenovo ThinkPad P16 G1 RTX A5500 | |
| Lenovo ThinkPad P16 G2 21FA000FGE | |
| AIDA64 / FP32 Ray-Trace | |
| HP ZBook Power 16 G11 A | |
| Lenovo ThinkPad P16s G2 21K9000CGE | |
| Lenovo ThinkPad P16 Gen 2 | |
| Durchschnittliche Intel Core i7-14700HX (14147 - 23676, n=9) | |
| Dell Precision 5690 | |
| Lenovo ThinkPad P16 G2 21FA000FGE | |
| Lenovo ThinkPad P16 G1 RTX A5500 | |
| AIDA64 / FPU Julia | |
| HP ZBook Power 16 G11 A | |
| Lenovo ThinkPad P16 Gen 2 | |
| Durchschnittliche Intel Core i7-14700HX (71875 - 116556, n=9) | |
| Lenovo ThinkPad P16s G2 21K9000CGE | |
| Dell Precision 5690 | |
| Lenovo ThinkPad P16 G2 21FA000FGE | |
| Lenovo ThinkPad P16 G1 RTX A5500 | |
| AIDA64 / CPU SHA3 | |
| Lenovo ThinkPad P16 Gen 2 | |
| Durchschnittliche Intel Core i7-14700HX (3388 - 5567, n=9) | |
| HP ZBook Power 16 G11 A | |
| Lenovo ThinkPad P16s G2 21K9000CGE | |
| Dell Precision 5690 | |
| Lenovo ThinkPad P16 G2 21FA000FGE | |
| Lenovo ThinkPad P16 G1 RTX A5500 | |
| AIDA64 / CPU Queen | |
| Lenovo ThinkPad P16 Gen 2 | |
| Durchschnittliche Intel Core i7-14700HX (129134 - 152200, n=9) | |
| HP ZBook Power 16 G11 A | |
| Lenovo ThinkPad P16 G2 21FA000FGE | |
| Lenovo ThinkPad P16 G1 RTX A5500 | |
| Lenovo ThinkPad P16s G2 21K9000CGE | |
| Dell Precision 5690 | |
| AIDA64 / FPU SinJulia | |
| HP ZBook Power 16 G11 A | |
| Lenovo ThinkPad P16s G2 21K9000CGE | |
| Lenovo ThinkPad P16 Gen 2 | |
| Durchschnittliche Intel Core i7-14700HX (10266 - 14434, n=9) | |
| Lenovo ThinkPad P16 G1 RTX A5500 | |
| Lenovo ThinkPad P16 G2 21FA000FGE | |
| Dell Precision 5690 | |
| AIDA64 / FPU Mandel | |
| HP ZBook Power 16 G11 A | |
| Lenovo ThinkPad P16s G2 21K9000CGE | |
| Lenovo ThinkPad P16 Gen 2 | |
| Durchschnittliche Intel Core i7-14700HX (35155 - 58380, n=9) | |
| Dell Precision 5690 | |
| Lenovo ThinkPad P16 G1 RTX A5500 | |
| Lenovo ThinkPad P16 G2 21FA000FGE | |
| AIDA64 / CPU AES | |
| Lenovo ThinkPad P16 Gen 2 | |
| Durchschnittliche Intel Core i7-14700HX (68616 - 113157, n=9) | |
| Dell Precision 5690 | |
| Lenovo ThinkPad P16 G2 21FA000FGE | |
| Lenovo ThinkPad P16 G1 RTX A5500 | |
| HP ZBook Power 16 G11 A | |
| Lenovo ThinkPad P16s G2 21K9000CGE | |
| AIDA64 / CPU ZLib | |
| Lenovo ThinkPad P16 Gen 2 | |
| Durchschnittliche Intel Core i7-14700HX (1003 - 1682, n=9) | |
| Dell Precision 5690 | |
| Lenovo ThinkPad P16 G1 RTX A5500 | |
| Lenovo ThinkPad P16 G2 21FA000FGE | |
| HP ZBook Power 16 G11 A | |
| Lenovo ThinkPad P16s G2 21K9000CGE | |
| AIDA64 / FP64 Ray-Trace | |
| HP ZBook Power 16 G11 A | |
| Lenovo ThinkPad P16s G2 21K9000CGE | |
| Lenovo ThinkPad P16 Gen 2 | |
| Durchschnittliche Intel Core i7-14700HX (7585 - 12928, n=9) | |
| Lenovo ThinkPad P16 G1 RTX A5500 | |
| Lenovo ThinkPad P16 G2 21FA000FGE | |
| Dell Precision 5690 | |
| AIDA64 / CPU PhotoWorxx | |
| Dell Precision 5690 | |
| Durchschnittliche Intel Core i7-14700HX (24276 - 49671, n=9) | |
| Lenovo ThinkPad P16 G1 RTX A5500 | |
| HP ZBook Power 16 G11 A | |
| Lenovo ThinkPad P16 Gen 2 | |
| Lenovo ThinkPad P16s G2 21K9000CGE | |
| Lenovo ThinkPad P16 G2 21FA000FGE | |
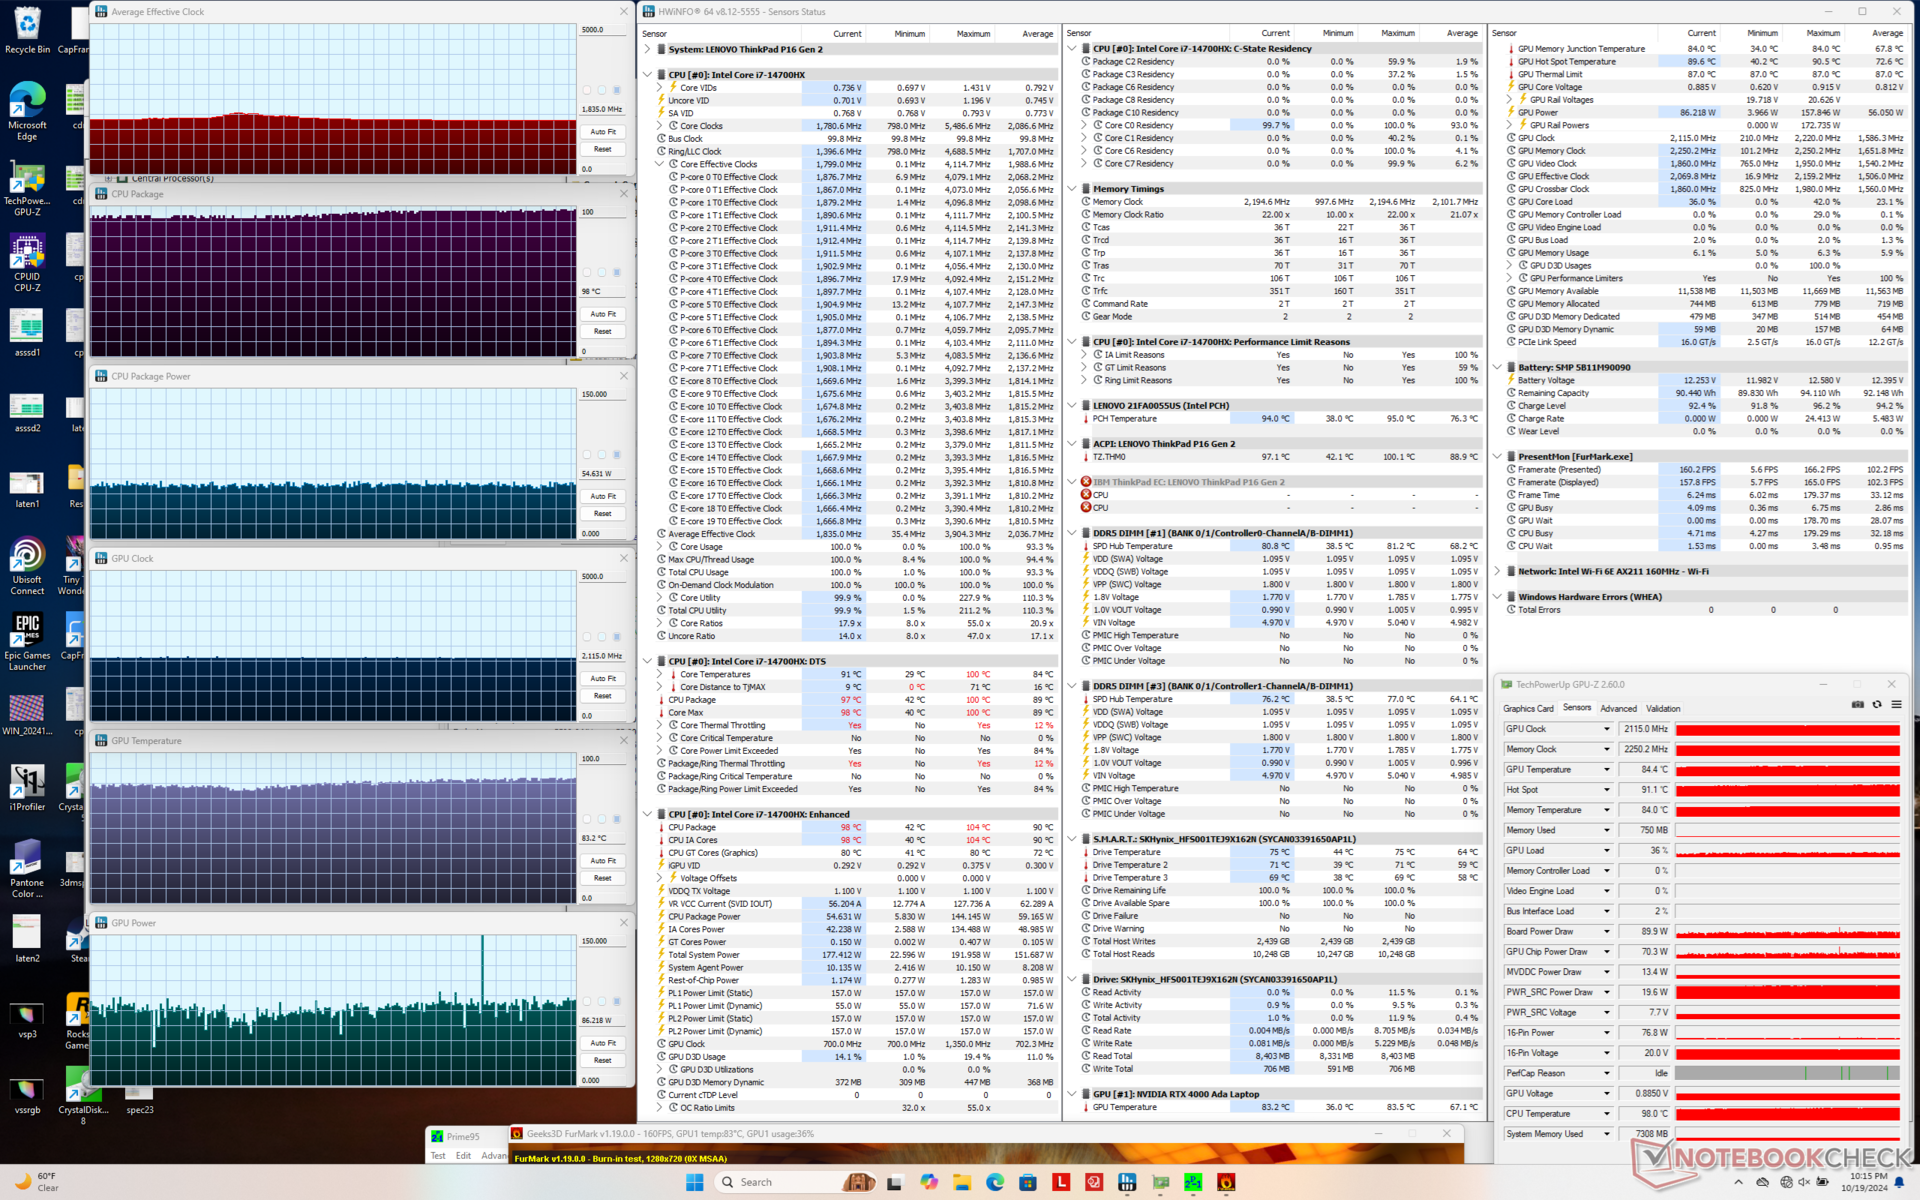
Stresstest
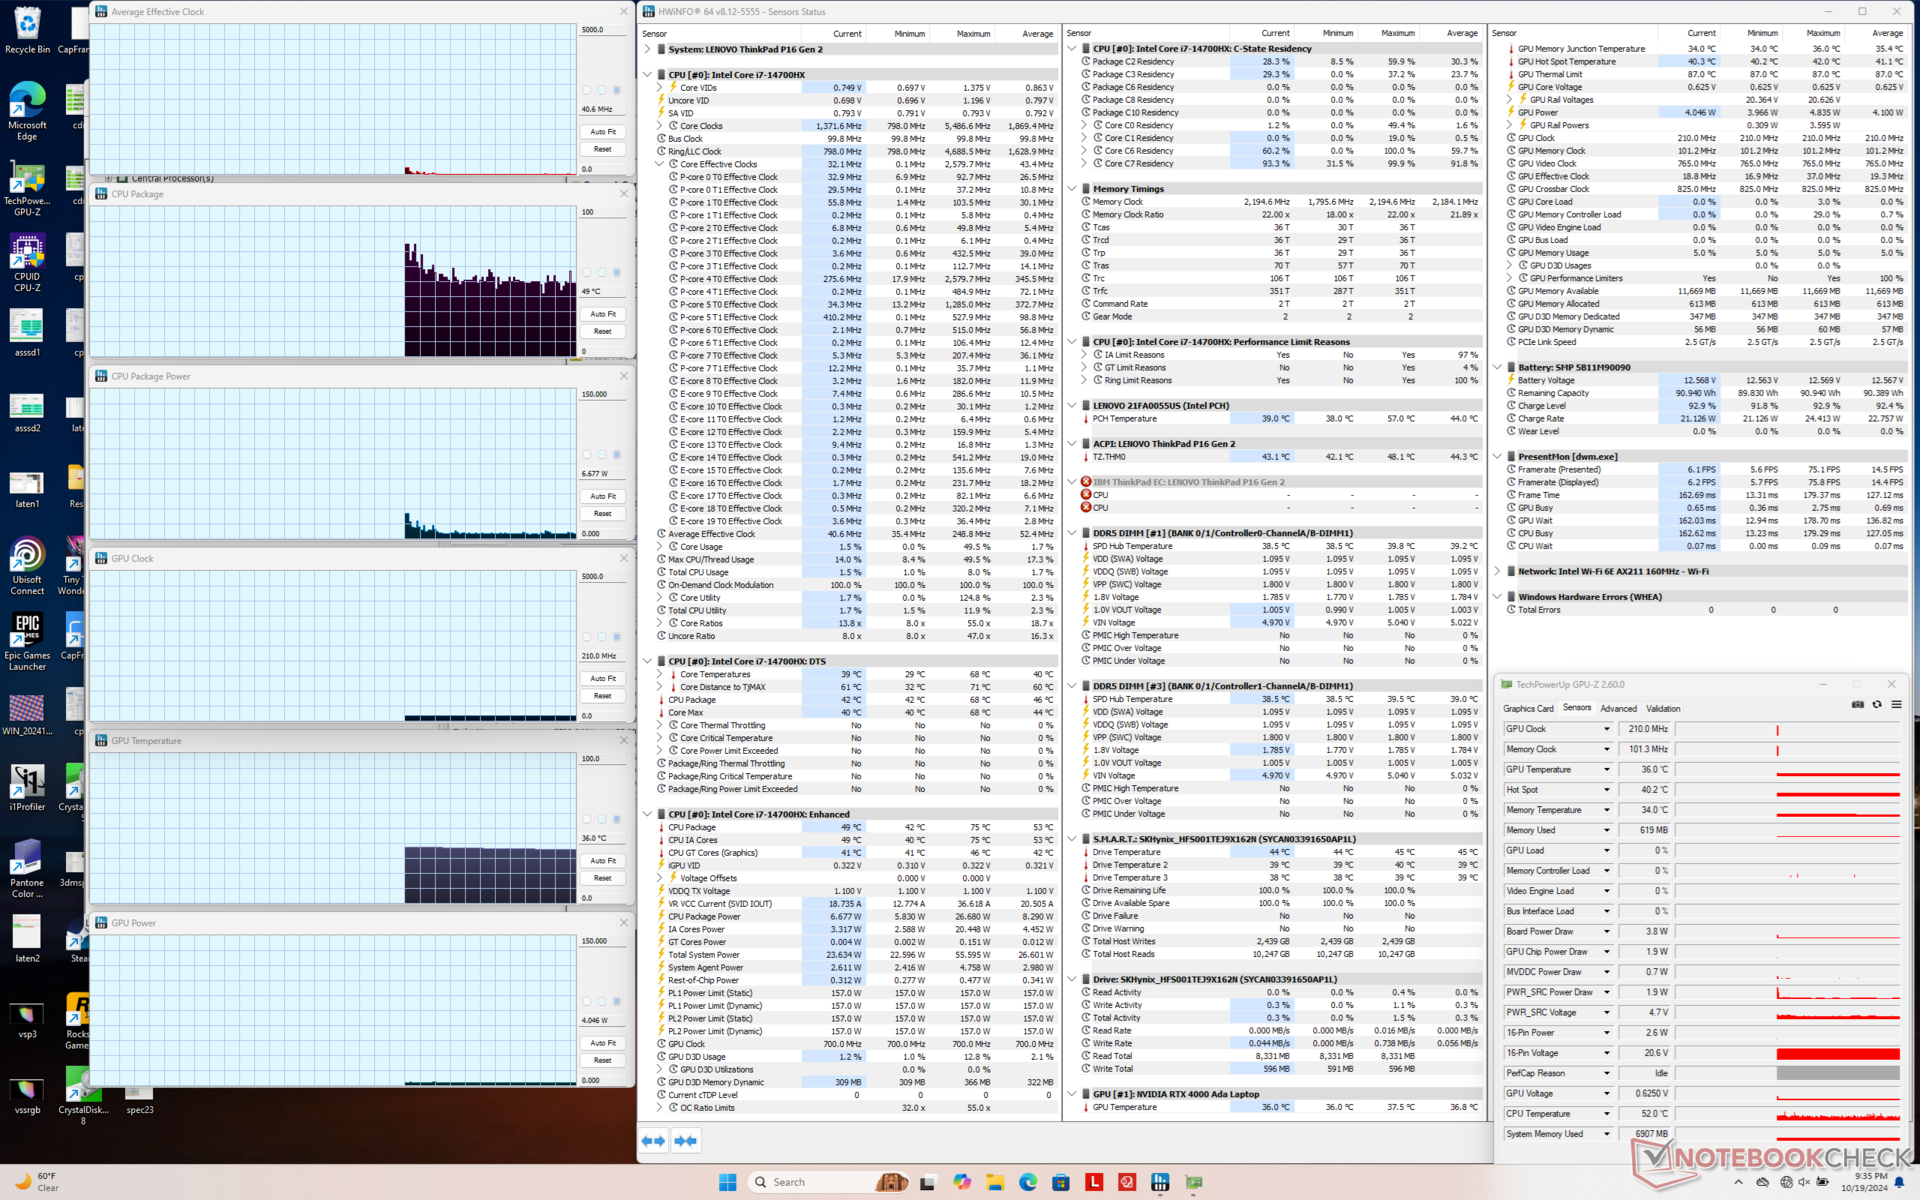
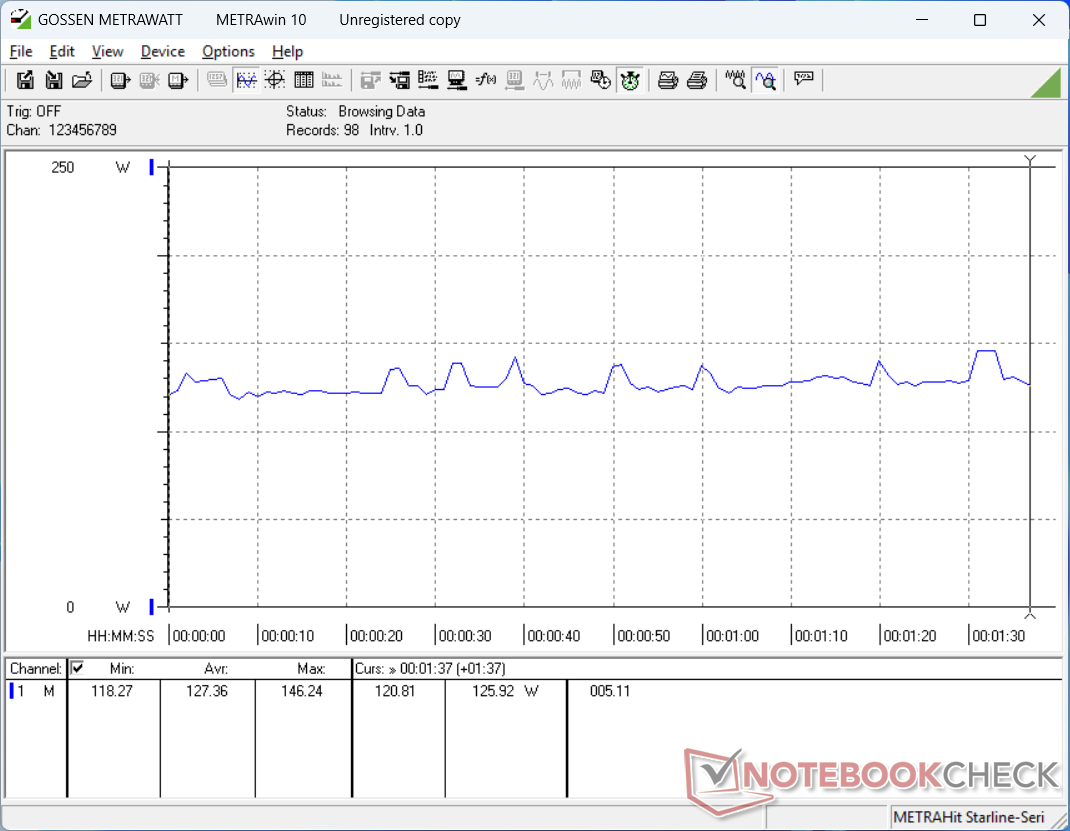
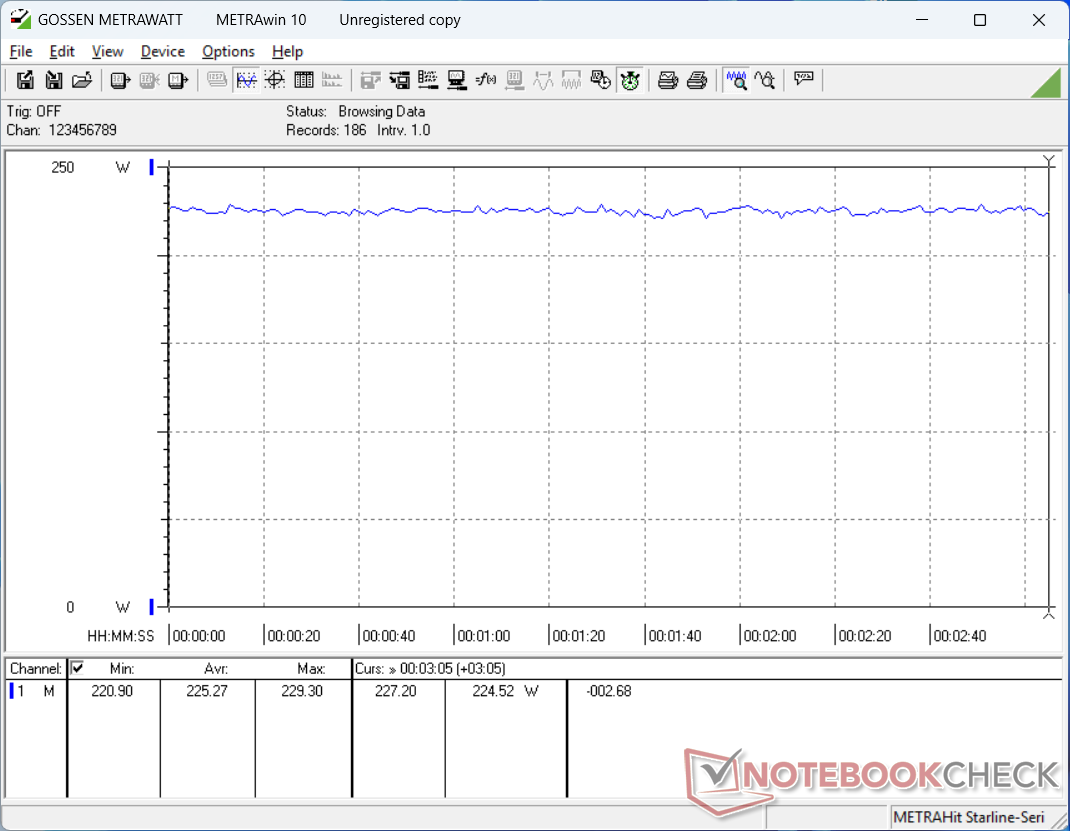
Die Kerntemperaturen sind recht hoch, wenn das System belastet wird, was zu sehr warmen Oberflächentemperaturen führt, wie im Abschnitt über die Temperaturen unten beschrieben. Bei der Ausführung von Prime95 oder Cyberpunk 2077 erreicht die CPU beispielsweise weit über 80 °C und manchmal sogar 100 °C. Die Leistungsaufnahme des Gehäuses und damit die Taktrate schwanken zwischen 66 W und 90 W, um die Temperaturen in Schach zu halten, wie unsere Screenshots zeigen.
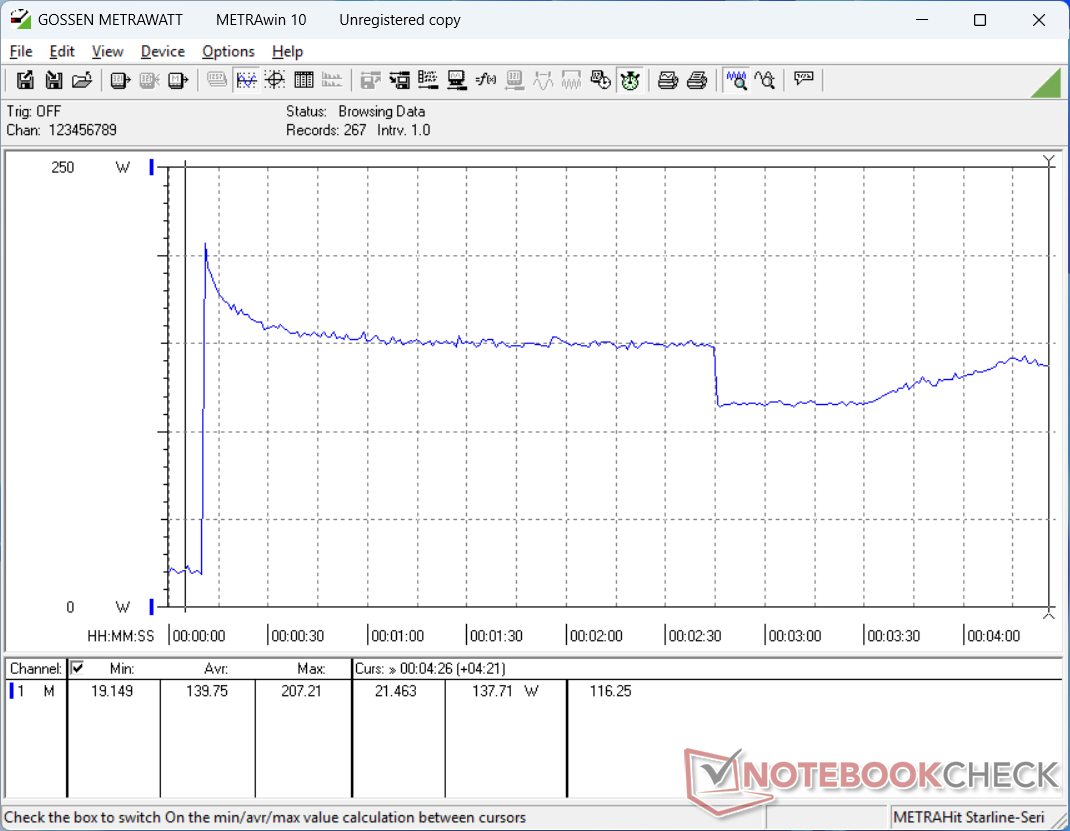
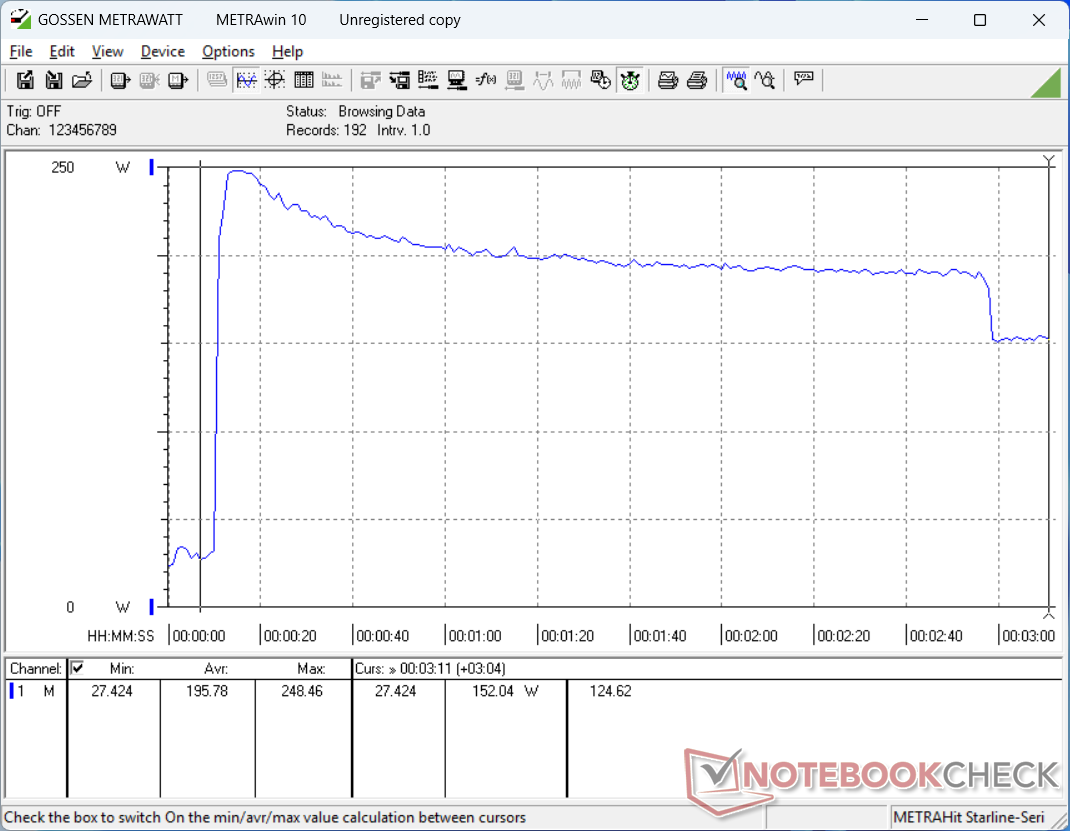
Wie angekündigt, kann die Leistungsaufnahme der GPU-Platine beim Laufen von Cyberpunk 2077 im Performance-Modus die vollen 130 W erreichen. Allerdings wäre die GPU-Temperatur mit über 85 °C relativ hoch, und die Frameraten würden, wie im Abschnitt zur GPU-Leistung erwähnt, sinken. Der Kerntakt, der Speichertakt und die Leistungsaufnahme der Platine würden sogar noch weiter sinken, wenn man stattdessen im Balanced-Modus spielt.
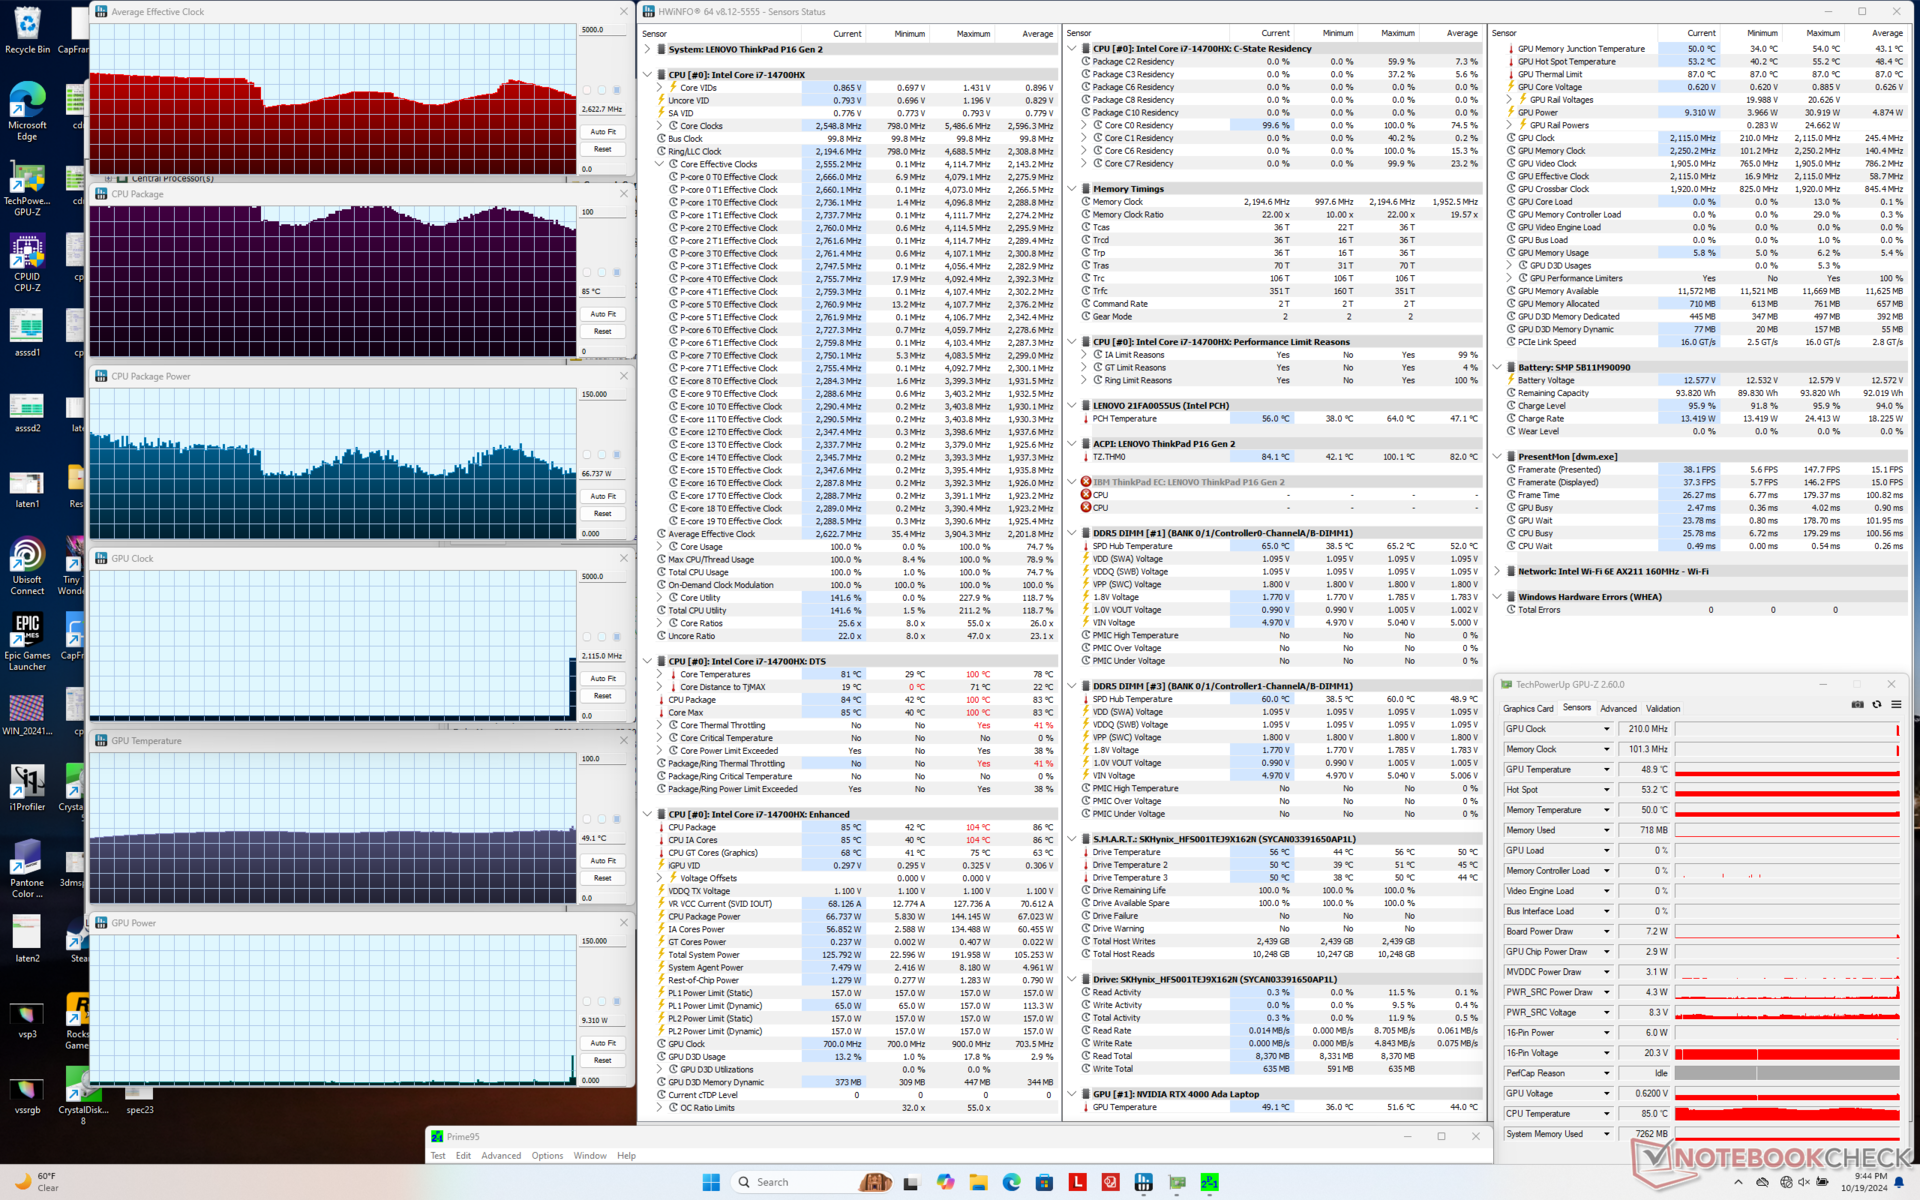
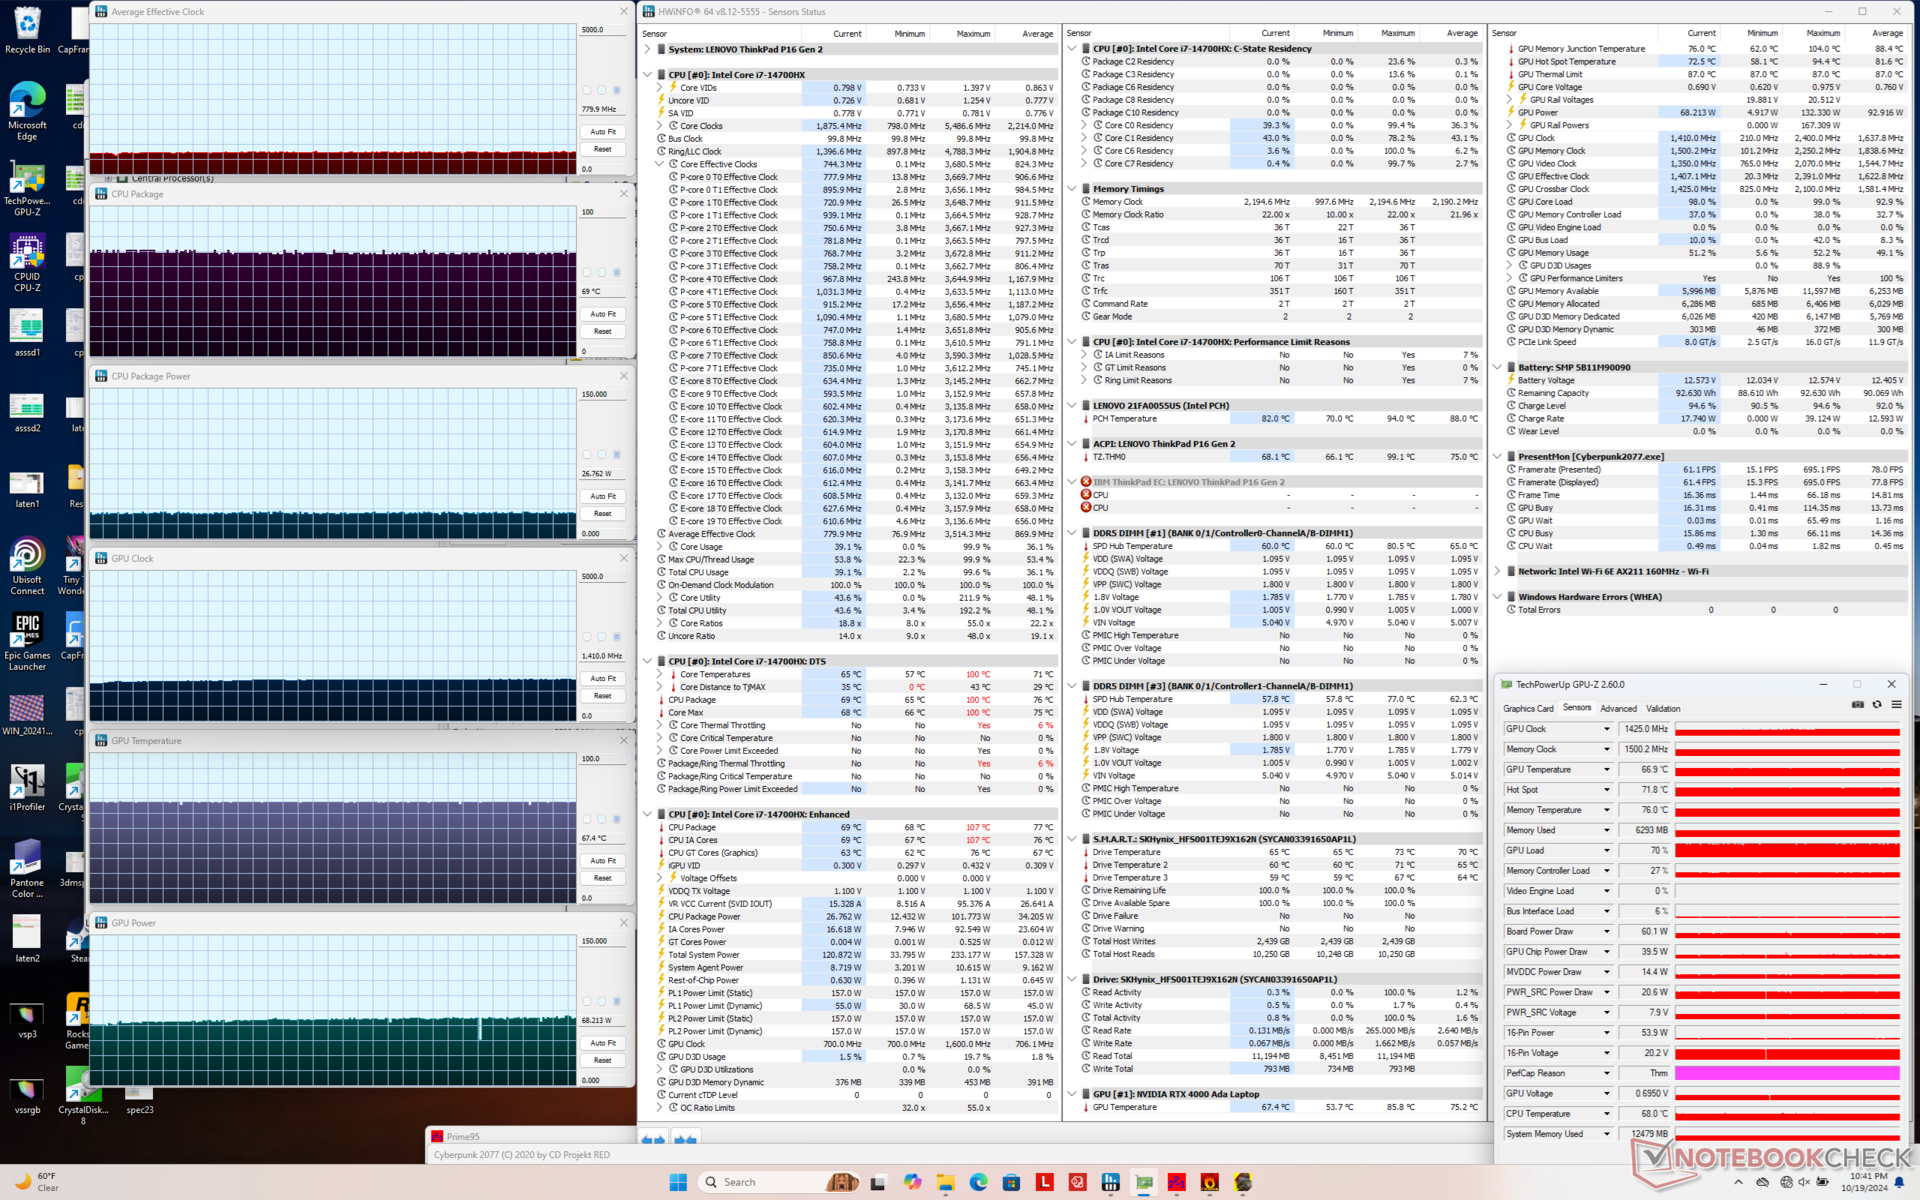
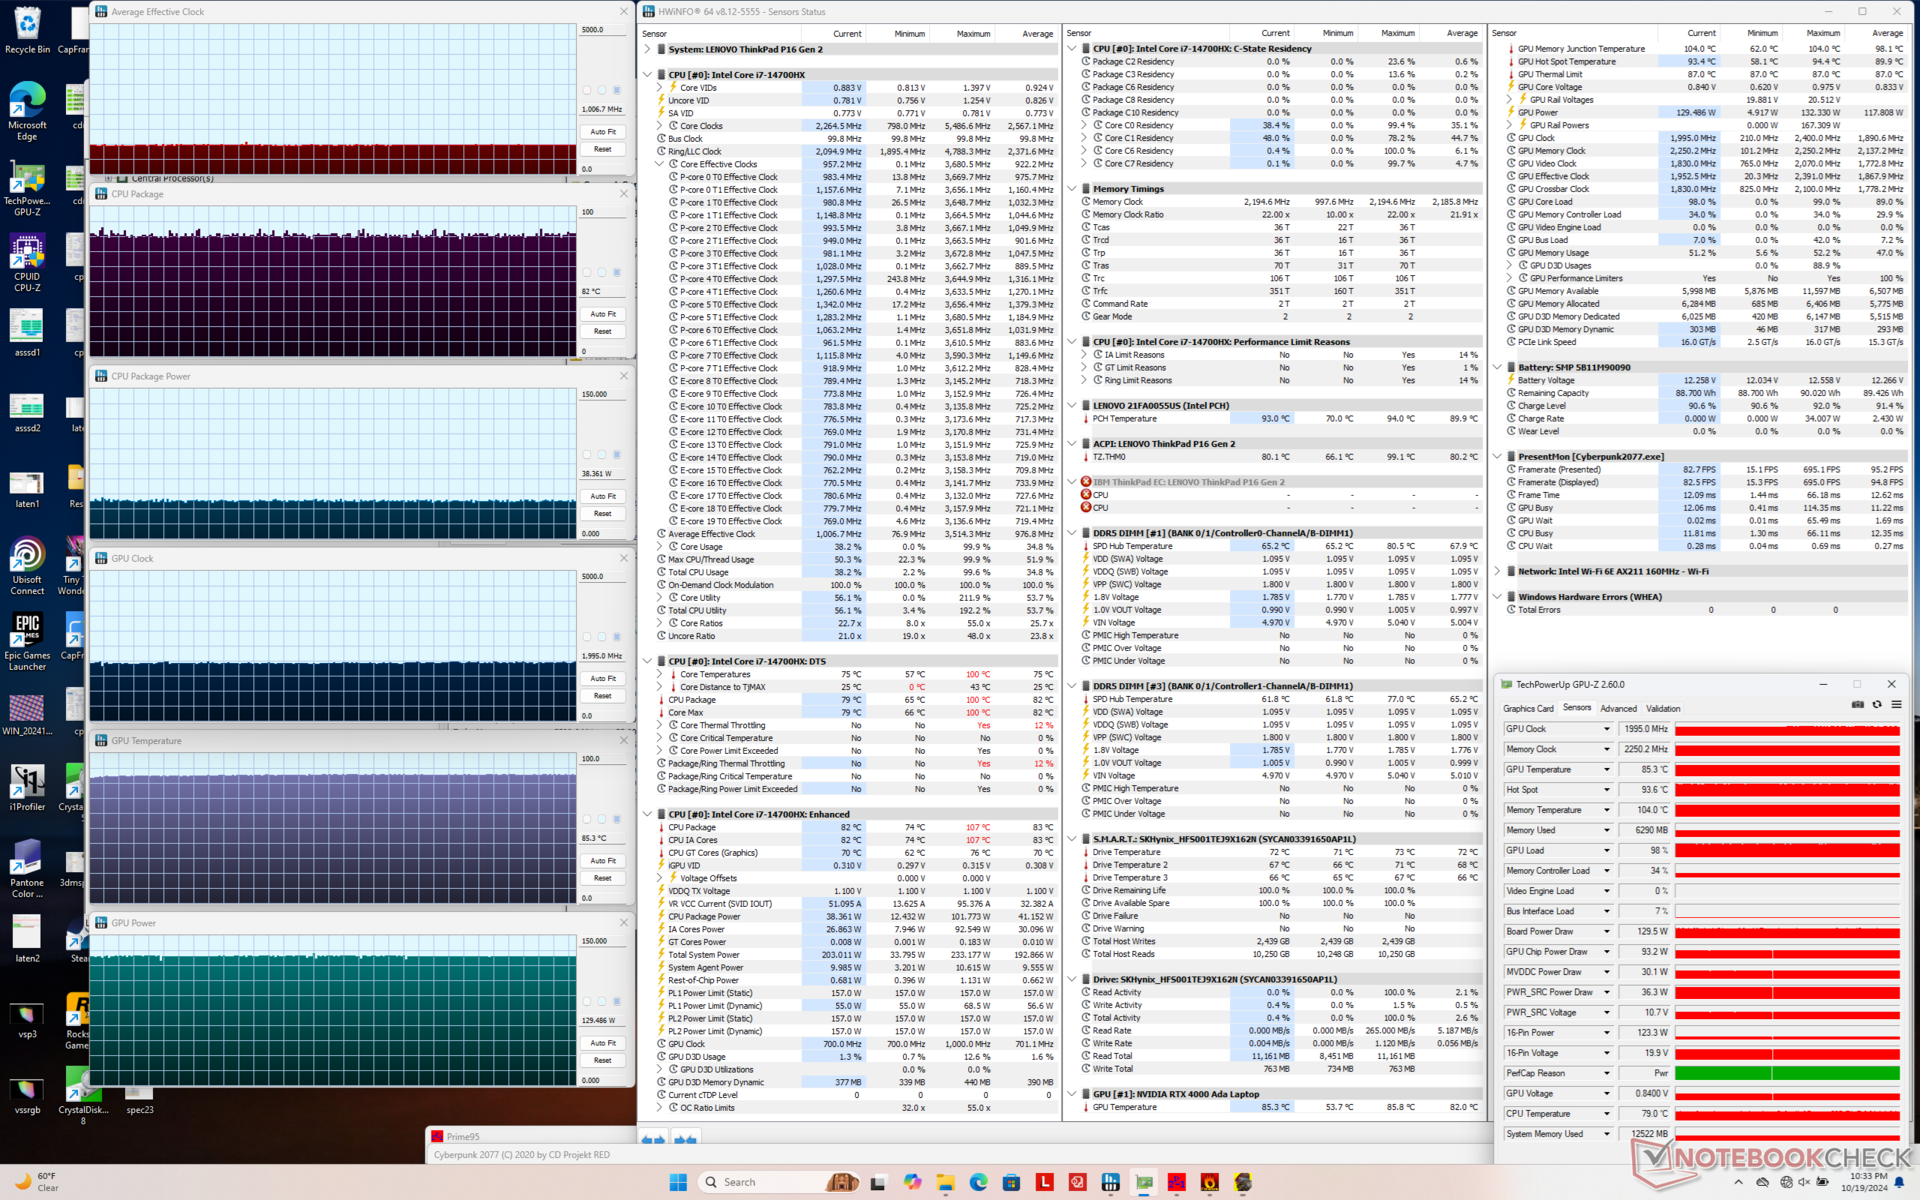
| CPU-Takt (GHz) | GPU-Takt (MHz) | Durchschnittliche CPU-Temperatur (°C) | Durchschnittliche GPU-Temperatur (°C) | |
| System im Leerlauf | -- | -- | 49 | 36 |
| Prime95 Stresstest | 2,6 - 3,1 | -- | 85 - 100 | 49 |
| Prime95 + FurMark Stresstest | 1,8 | 2115 | 98 | 83 |
| Cyberpunk 2077 Stresstest (Balanced-Modus) | 0,8 | 1425 | 69 | 67 |
| Cyberpunk 2077 Stresstest (Performance-Modus) | 1,0 | 1995 | 82 | 85 |
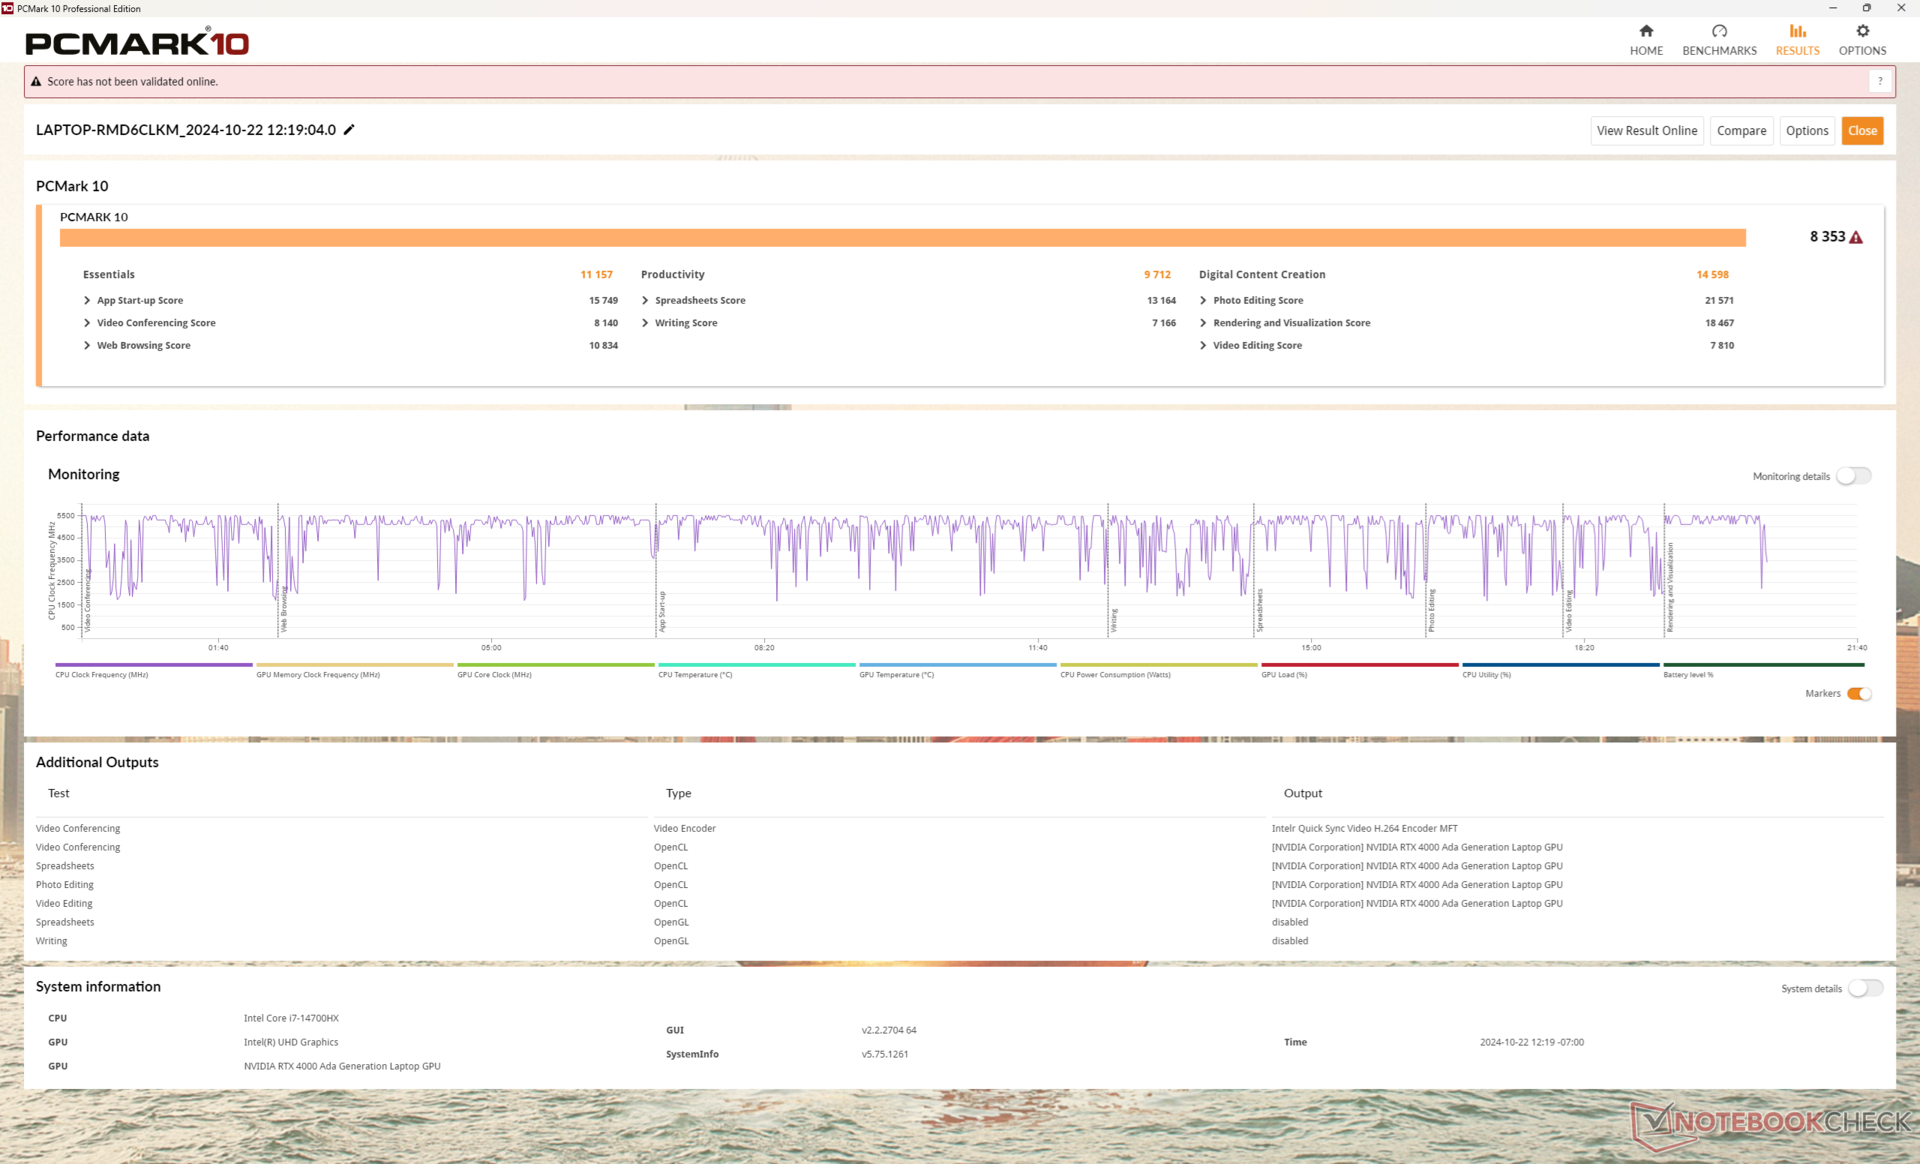
System Performance
CrossMark: Overall | Productivity | Creativity | Responsiveness
WebXPRT 3: Overall
WebXPRT 4: Overall
Mozilla Kraken 1.1: Total
| PCMark 10 / Score | |
| Lenovo ThinkPad P16 Gen 2 | |
| Durchschnittliche Intel Core i7-14700HX, NVIDIA RTX 4000 Ada Generation Laptop (n=1) | |
| Dell Precision 5690 | |
| HP ZBook Power 16 G11 A | |
| Lenovo ThinkPad P16 G1 RTX A5500 | |
| Lenovo ThinkPad P16 G2 21FA000FGE | |
| Lenovo ThinkPad P16s G2 21K9000CGE | |
| PCMark 10 / Essentials | |
| Lenovo ThinkPad P16 Gen 2 | |
| Durchschnittliche Intel Core i7-14700HX, NVIDIA RTX 4000 Ada Generation Laptop (n=1) | |
| Dell Precision 5690 | |
| Lenovo ThinkPad P16 G2 21FA000FGE | |
| Lenovo ThinkPad P16 G1 RTX A5500 | |
| HP ZBook Power 16 G11 A | |
| Lenovo ThinkPad P16s G2 21K9000CGE | |
| PCMark 10 / Productivity | |
| Dell Precision 5690 | |
| Lenovo ThinkPad P16 Gen 2 | |
| Durchschnittliche Intel Core i7-14700HX, NVIDIA RTX 4000 Ada Generation Laptop (n=1) | |
| HP ZBook Power 16 G11 A | |
| Lenovo ThinkPad P16 G1 RTX A5500 | |
| Lenovo ThinkPad P16 G2 21FA000FGE | |
| Lenovo ThinkPad P16s G2 21K9000CGE | |
| PCMark 10 / Digital Content Creation | |
| Lenovo ThinkPad P16 Gen 2 | |
| Durchschnittliche Intel Core i7-14700HX, NVIDIA RTX 4000 Ada Generation Laptop (n=1) | |
| Dell Precision 5690 | |
| HP ZBook Power 16 G11 A | |
| Lenovo ThinkPad P16 G1 RTX A5500 | |
| Lenovo ThinkPad P16 G2 21FA000FGE | |
| Lenovo ThinkPad P16s G2 21K9000CGE | |
| CrossMark / Overall | |
| Lenovo ThinkPad P16 Gen 2 | |
| Durchschnittliche Intel Core i7-14700HX, NVIDIA RTX 4000 Ada Generation Laptop (n=1) | |
| Lenovo ThinkPad P16 G1 RTX A5500 | |
| Lenovo ThinkPad P16 G2 21FA000FGE | |
| Dell Precision 5690 | |
| HP ZBook Power 16 G11 A | |
| Lenovo ThinkPad P16s G2 21K9000CGE | |
| CrossMark / Productivity | |
| Lenovo ThinkPad P16 Gen 2 | |
| Durchschnittliche Intel Core i7-14700HX, NVIDIA RTX 4000 Ada Generation Laptop (n=1) | |
| Lenovo ThinkPad P16 G1 RTX A5500 | |
| Dell Precision 5690 | |
| Lenovo ThinkPad P16 G2 21FA000FGE | |
| HP ZBook Power 16 G11 A | |
| Lenovo ThinkPad P16s G2 21K9000CGE | |
| CrossMark / Creativity | |
| Lenovo ThinkPad P16 Gen 2 | |
| Durchschnittliche Intel Core i7-14700HX, NVIDIA RTX 4000 Ada Generation Laptop (n=1) | |
| Lenovo ThinkPad P16 G1 RTX A5500 | |
| Lenovo ThinkPad P16 G2 21FA000FGE | |
| HP ZBook Power 16 G11 A | |
| Dell Precision 5690 | |
| Lenovo ThinkPad P16s G2 21K9000CGE | |
| CrossMark / Responsiveness | |
| Lenovo ThinkPad P16 Gen 2 | |
| Durchschnittliche Intel Core i7-14700HX, NVIDIA RTX 4000 Ada Generation Laptop (n=1) | |
| Dell Precision 5690 | |
| Lenovo ThinkPad P16 G1 RTX A5500 | |
| Lenovo ThinkPad P16 G2 21FA000FGE | |
| HP ZBook Power 16 G11 A | |
| Lenovo ThinkPad P16s G2 21K9000CGE | |
| WebXPRT 3 / Overall | |
| Lenovo ThinkPad P16 Gen 2 | |
| Durchschnittliche Intel Core i7-14700HX, NVIDIA RTX 4000 Ada Generation Laptop (n=1) | |
| Lenovo ThinkPad P16 G2 21FA000FGE | |
| Lenovo ThinkPad P16 G1 RTX A5500 | |
| HP ZBook Power 16 G11 A | |
| Dell Precision 5690 | |
| Lenovo ThinkPad P16s G2 21K9000CGE | |
| WebXPRT 4 / Overall | |
| Lenovo ThinkPad P16 Gen 2 | |
| Durchschnittliche Intel Core i7-14700HX, NVIDIA RTX 4000 Ada Generation Laptop (n=1) | |
| Lenovo ThinkPad P16 G1 RTX A5500 | |
| Dell Precision 5690 | |
| HP ZBook Power 16 G11 A | |
| Mozilla Kraken 1.1 / Total | |
| Lenovo ThinkPad P16s G2 21K9000CGE | |
| HP ZBook Power 16 G11 A | |
| Dell Precision 5690 | |
| Lenovo ThinkPad P16 G1 RTX A5500 | |
| Lenovo ThinkPad P16 G2 21FA000FGE | |
| Lenovo ThinkPad P16 Gen 2 | |
| Durchschnittliche Intel Core i7-14700HX, NVIDIA RTX 4000 Ada Generation Laptop (n=1) | |
* ... kleinere Werte sind besser
| PCMark 10 Score | 8353 Punkte | |
Hilfe | ||
| AIDA64 / Memory Copy | |
| Dell Precision 5690 | |
| Durchschnittliche Intel Core i7-14700HX (41617 - 78742, n=9) | |
| Lenovo ThinkPad P16s G2 21K9000CGE | |
| Lenovo ThinkPad P16 Gen 2 | |
| Lenovo ThinkPad P16 G1 RTX A5500 | |
| HP ZBook Power 16 G11 A | |
| Lenovo ThinkPad P16 G2 21FA000FGE | |
| AIDA64 / Memory Read | |
| Dell Precision 5690 | |
| Durchschnittliche Intel Core i7-14700HX (46627 - 86175, n=9) | |
| Lenovo ThinkPad P16 Gen 2 | |
| Lenovo ThinkPad P16 G1 RTX A5500 | |
| HP ZBook Power 16 G11 A | |
| Lenovo ThinkPad P16 G2 21FA000FGE | |
| Lenovo ThinkPad P16s G2 21K9000CGE | |
| AIDA64 / Memory Write | |
| Lenovo ThinkPad P16s G2 21K9000CGE | |
| HP ZBook Power 16 G11 A | |
| Dell Precision 5690 | |
| Durchschnittliche Intel Core i7-14700HX (39155 - 76976, n=9) | |
| Lenovo ThinkPad P16 Gen 2 | |
| Lenovo ThinkPad P16 G1 RTX A5500 | |
| Lenovo ThinkPad P16 G2 21FA000FGE | |
| AIDA64 / Memory Latency | |
| Dell Precision 5690 | |
| Lenovo ThinkPad P16s G2 21K9000CGE | |
| Lenovo ThinkPad P16 G2 21FA000FGE | |
| HP ZBook Power 16 G11 A | |
| Lenovo ThinkPad P16 Gen 2 | |
| Lenovo ThinkPad P16 G1 RTX A5500 | |
| Durchschnittliche Intel Core i7-14700HX (82.7 - 96.4, n=9) | |
* ... kleinere Werte sind besser
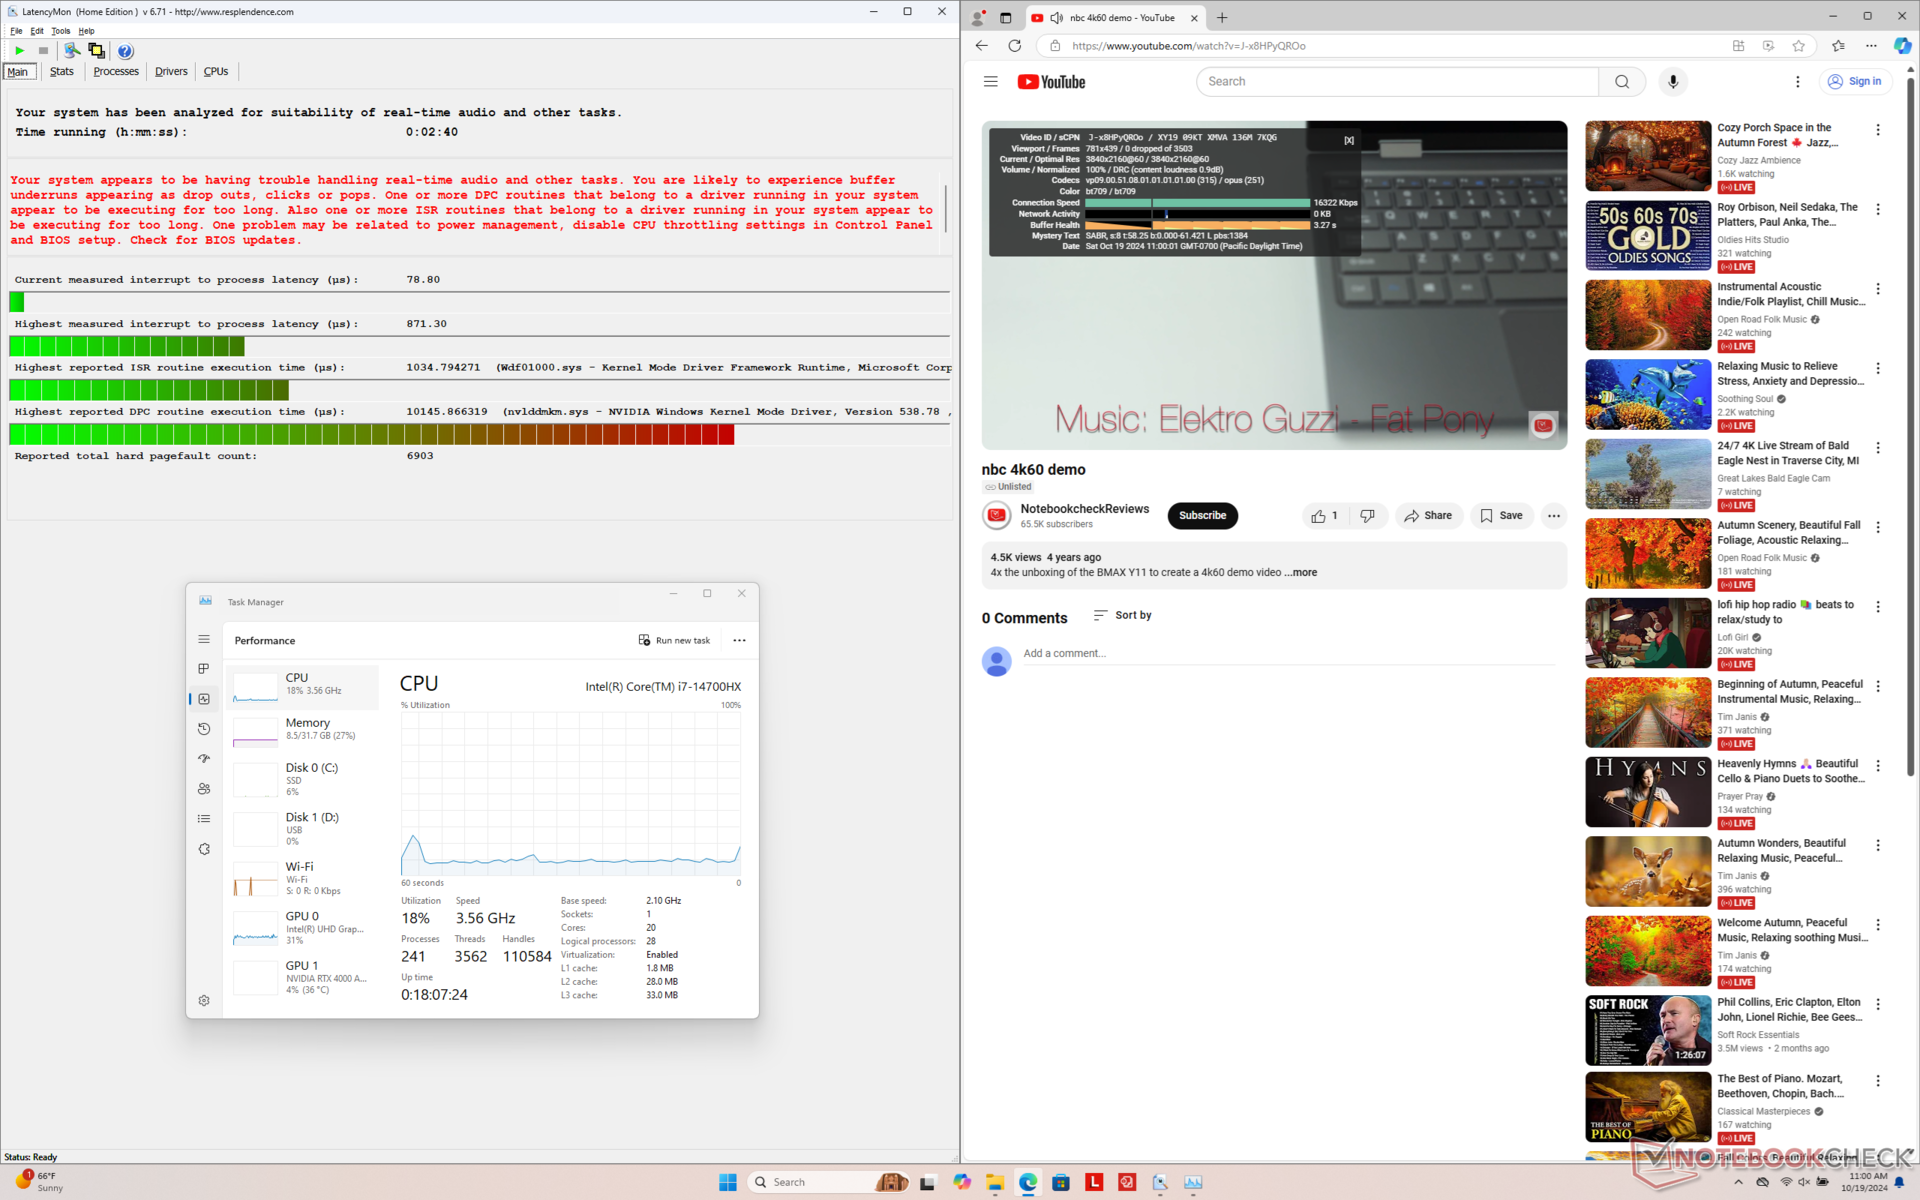
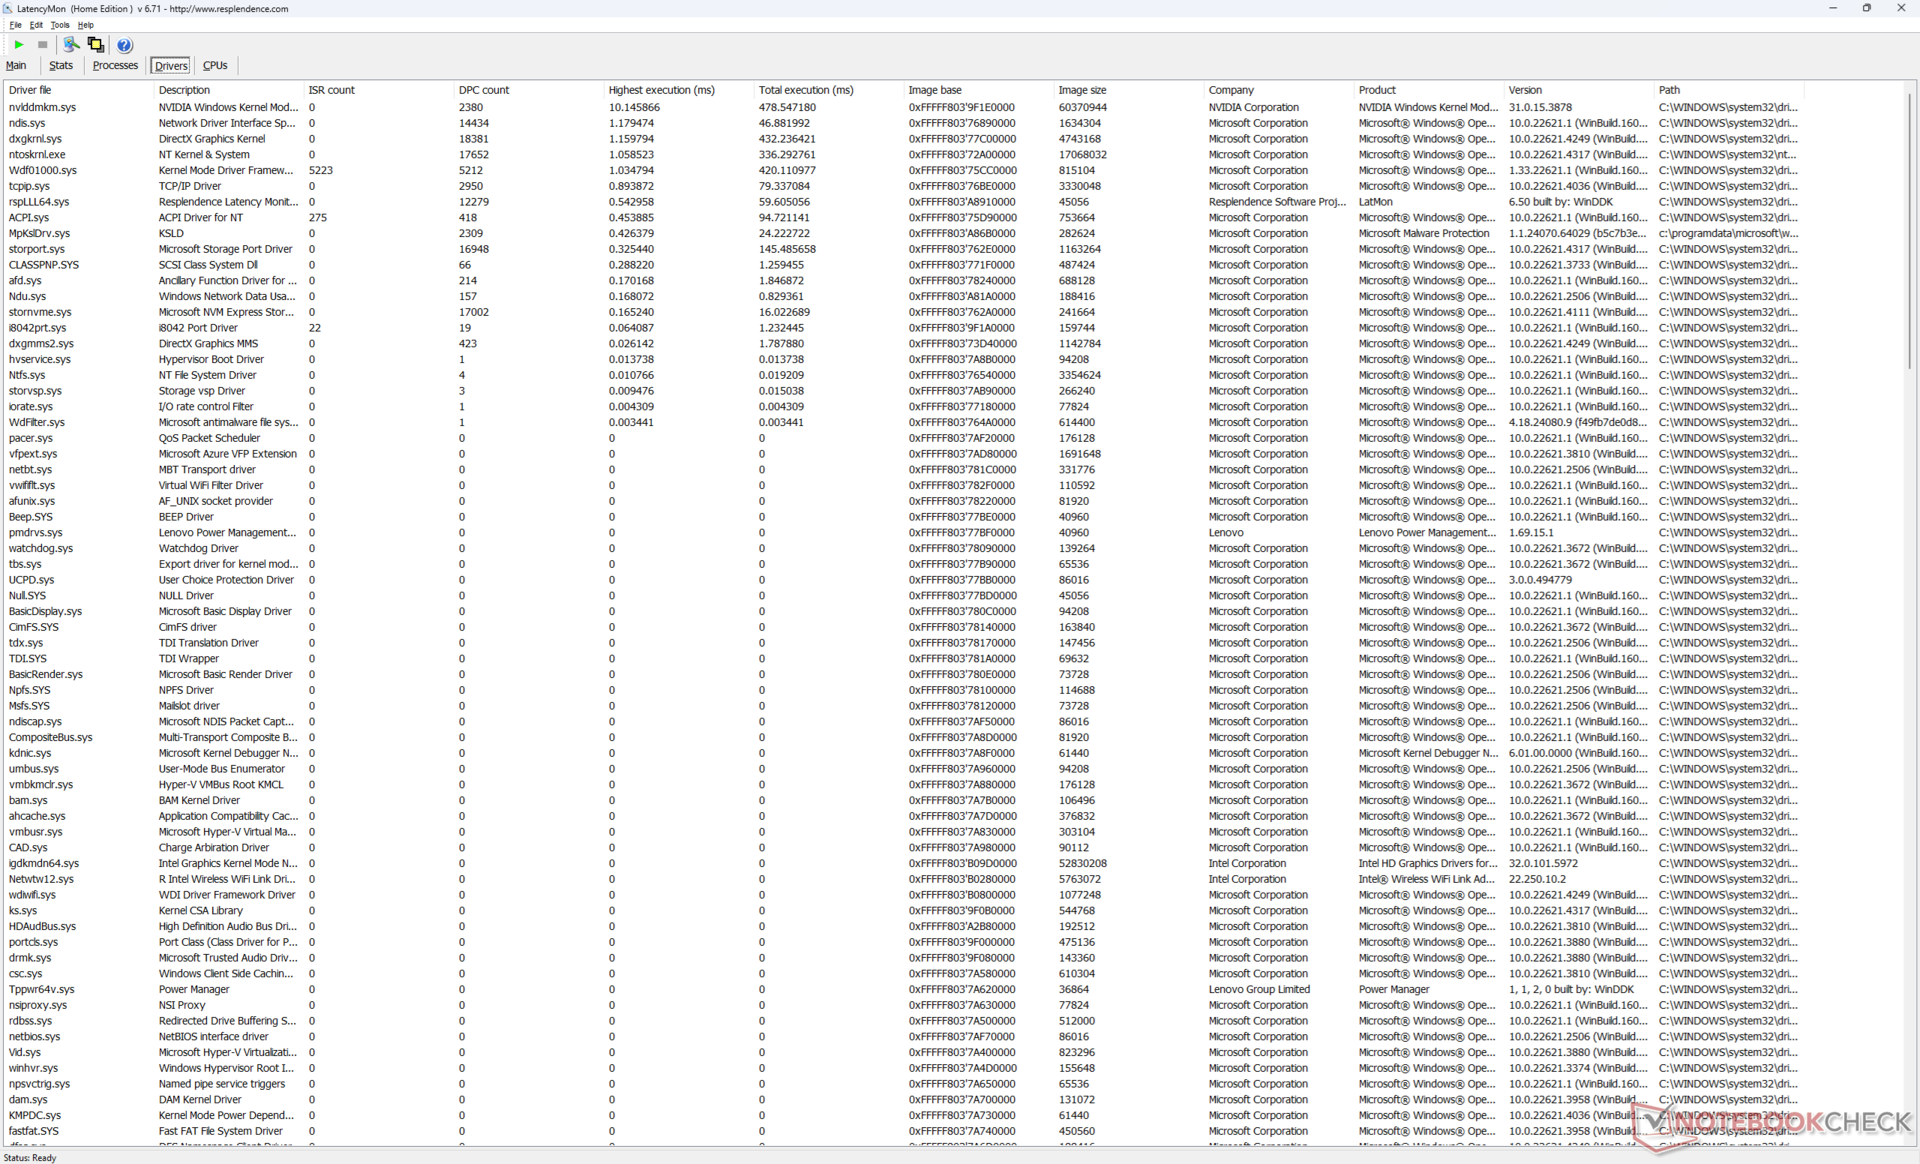
DPC-Latenzen
LatencyMon zeigt geringfügige DPC-Probleme, wenn mehrere Browser-Tabs unserer Homepage geöffnet sind. Die 4K-Videowiedergabe bei 60 FPS läuft jedoch einwandfrei, ohne dass es zu verloren gegangenen Frames kommt.
| DPC Latencies / LatencyMon - interrupt to process latency (max), Web, Youtube, Prime95 | |
| HP ZBook Power 16 G11 A | |
| Lenovo ThinkPad P16 G1 RTX A5500 | |
| Lenovo ThinkPad P16s G2 21K9000CGE | |
| Lenovo ThinkPad P16 G2 21FA000FGE | |
| Lenovo ThinkPad P16 Gen 2 | |
| Dell Precision 5690 | |
* ... kleinere Werte sind besser
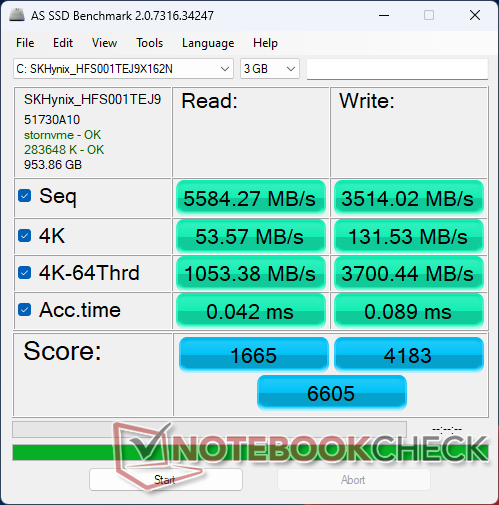
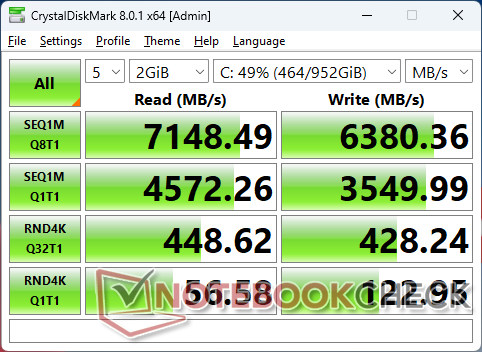
Massenspeicher
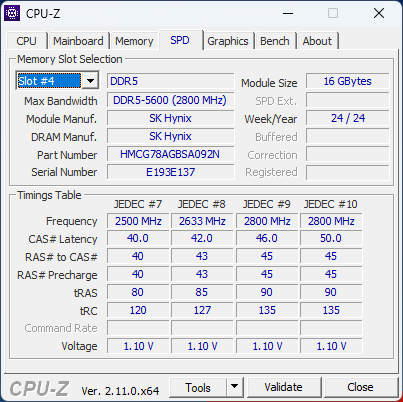
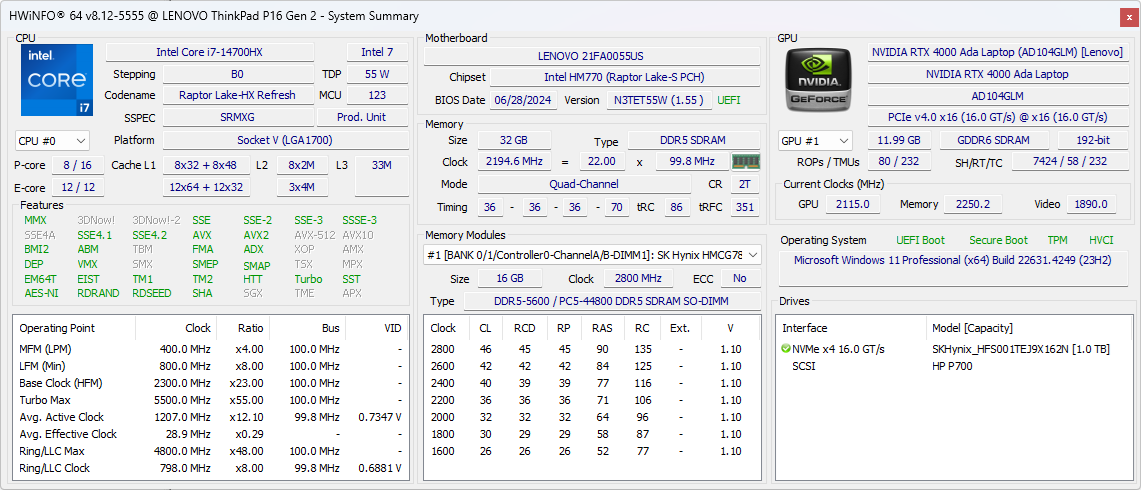
Es wurden keine Unterschiede bei den Speicheroptionen oder der SSD-Leistung zwischen unseren beiden Testgeräten des ThinkPad P16 Gen 2 festgestellt.

* ... kleinere Werte sind besser
Dauerleistung Lesen: DiskSpd Read Loop, Queue Depth 8
GPU Performance
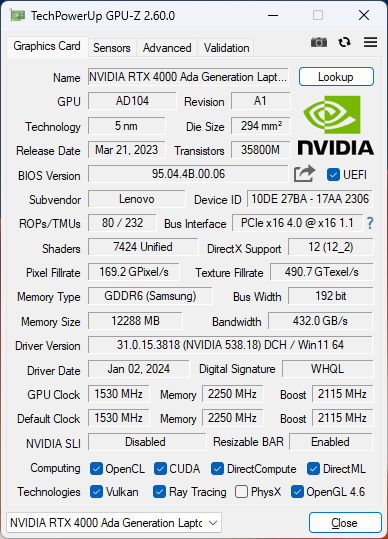
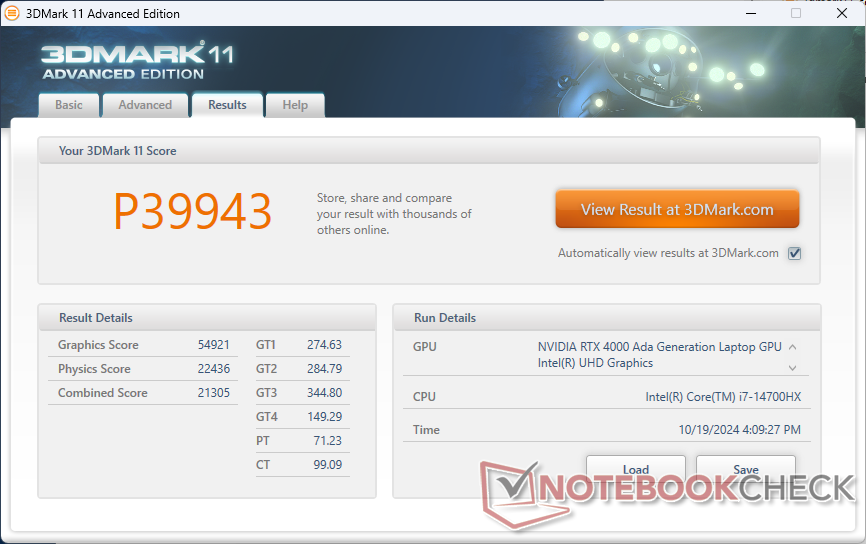
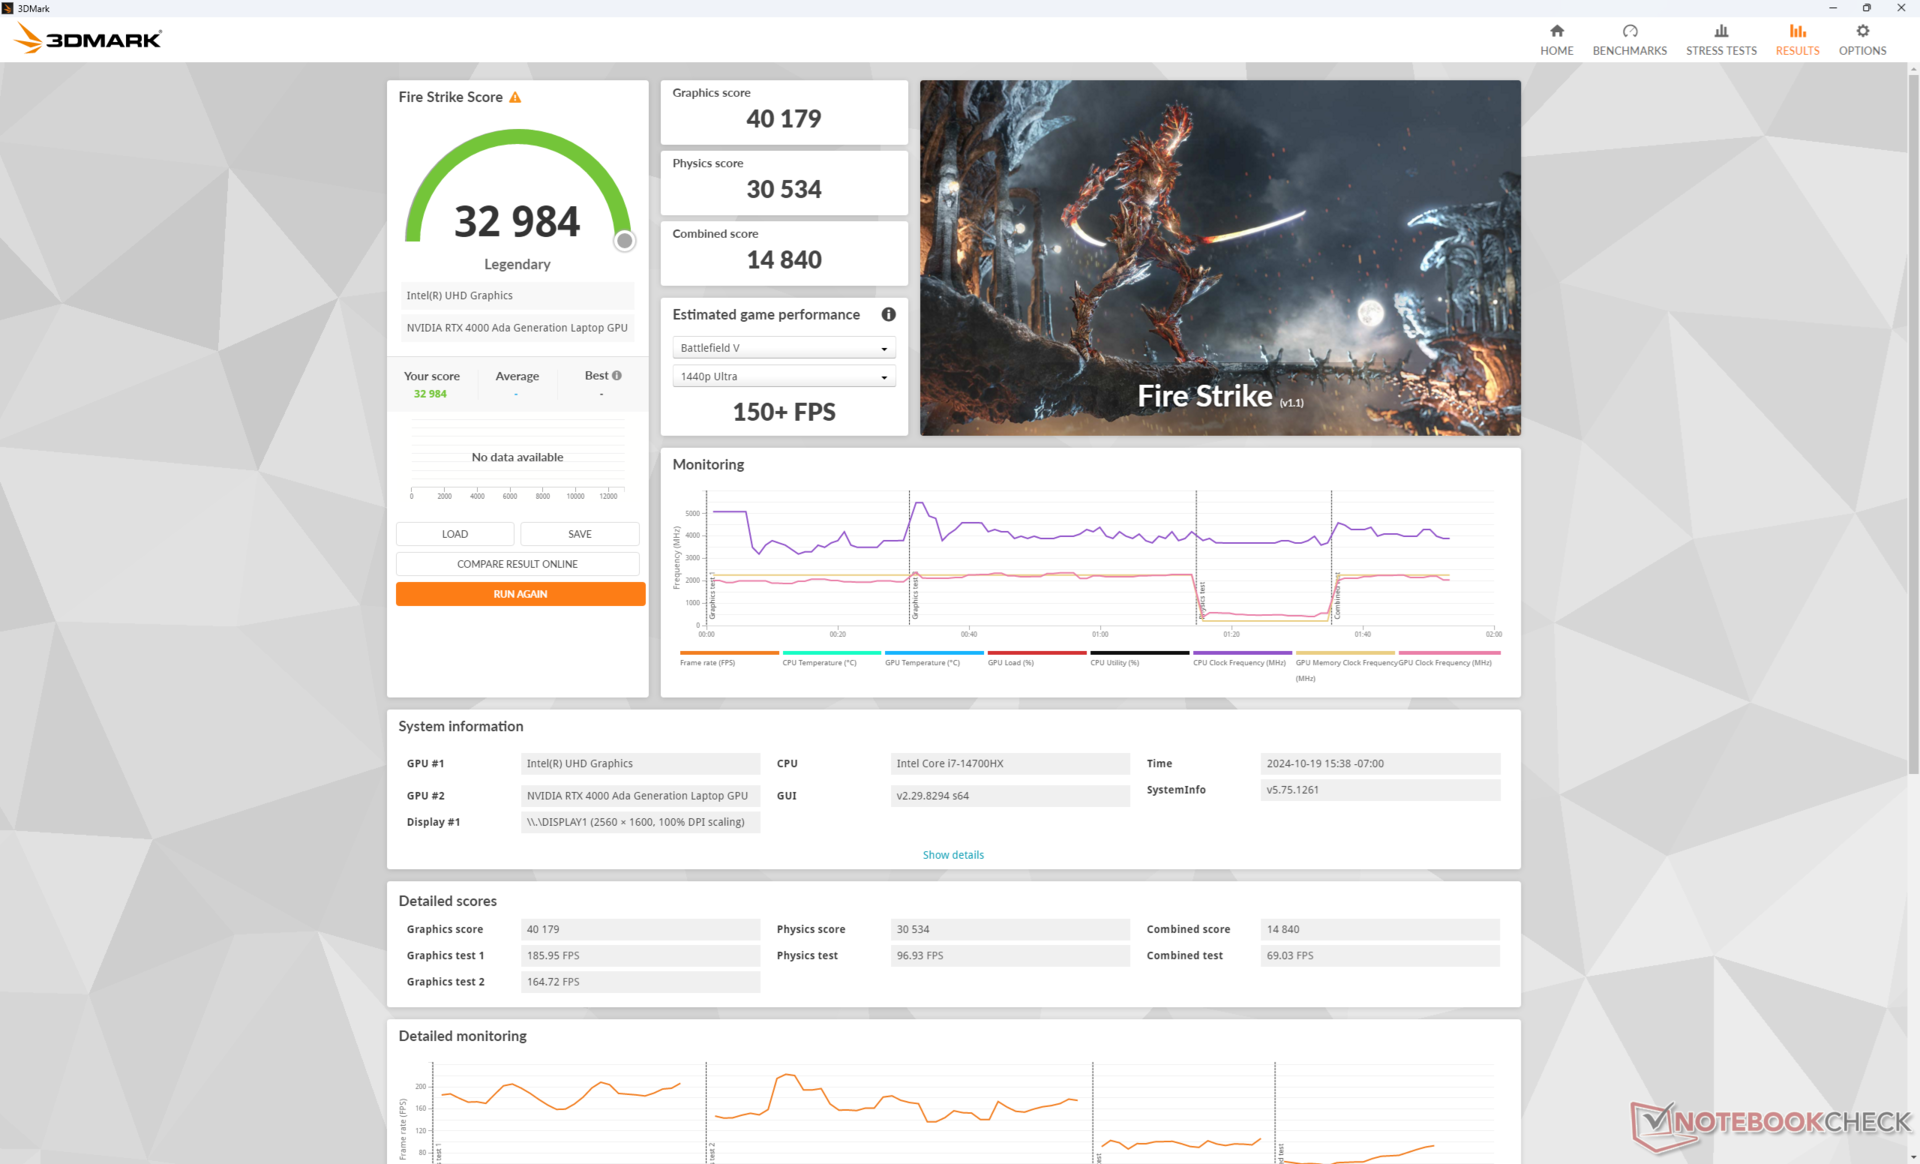
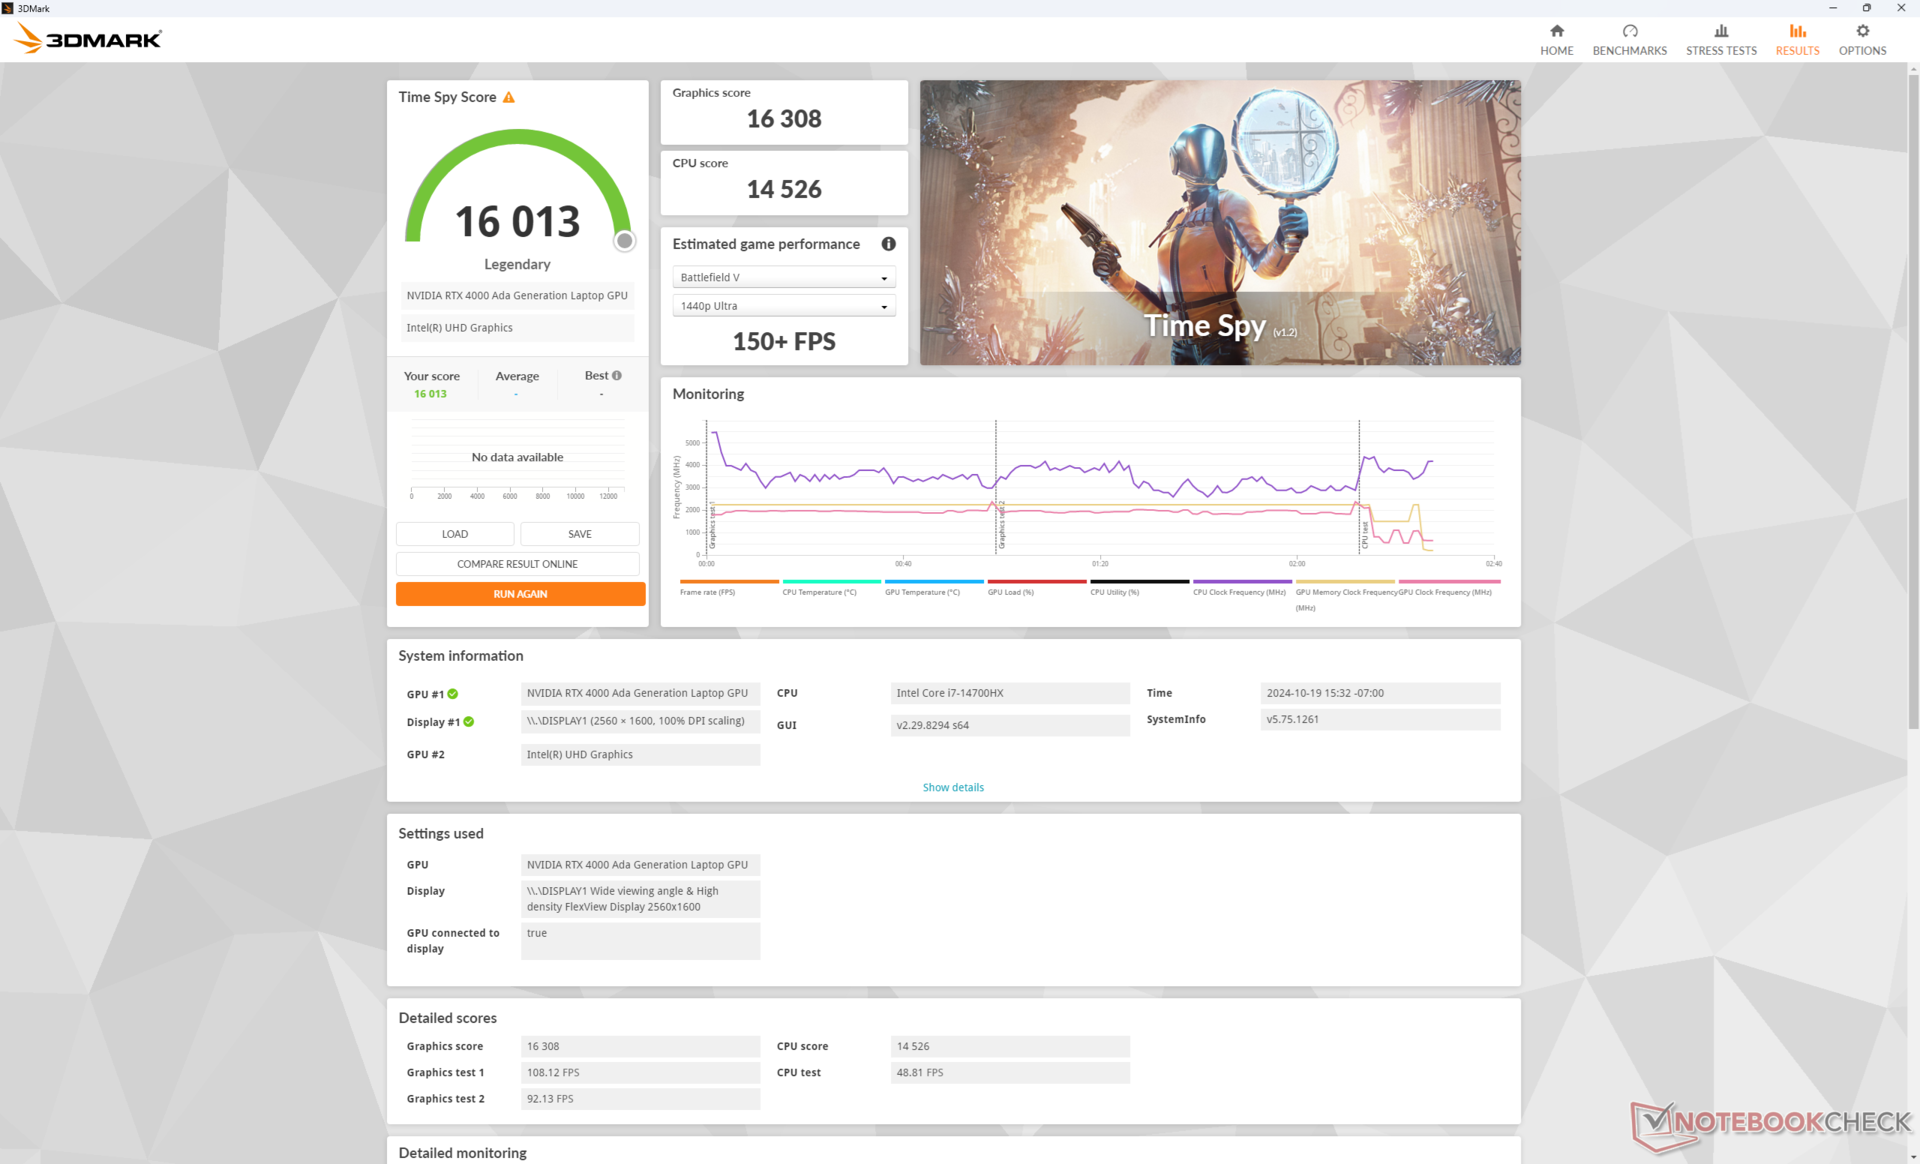
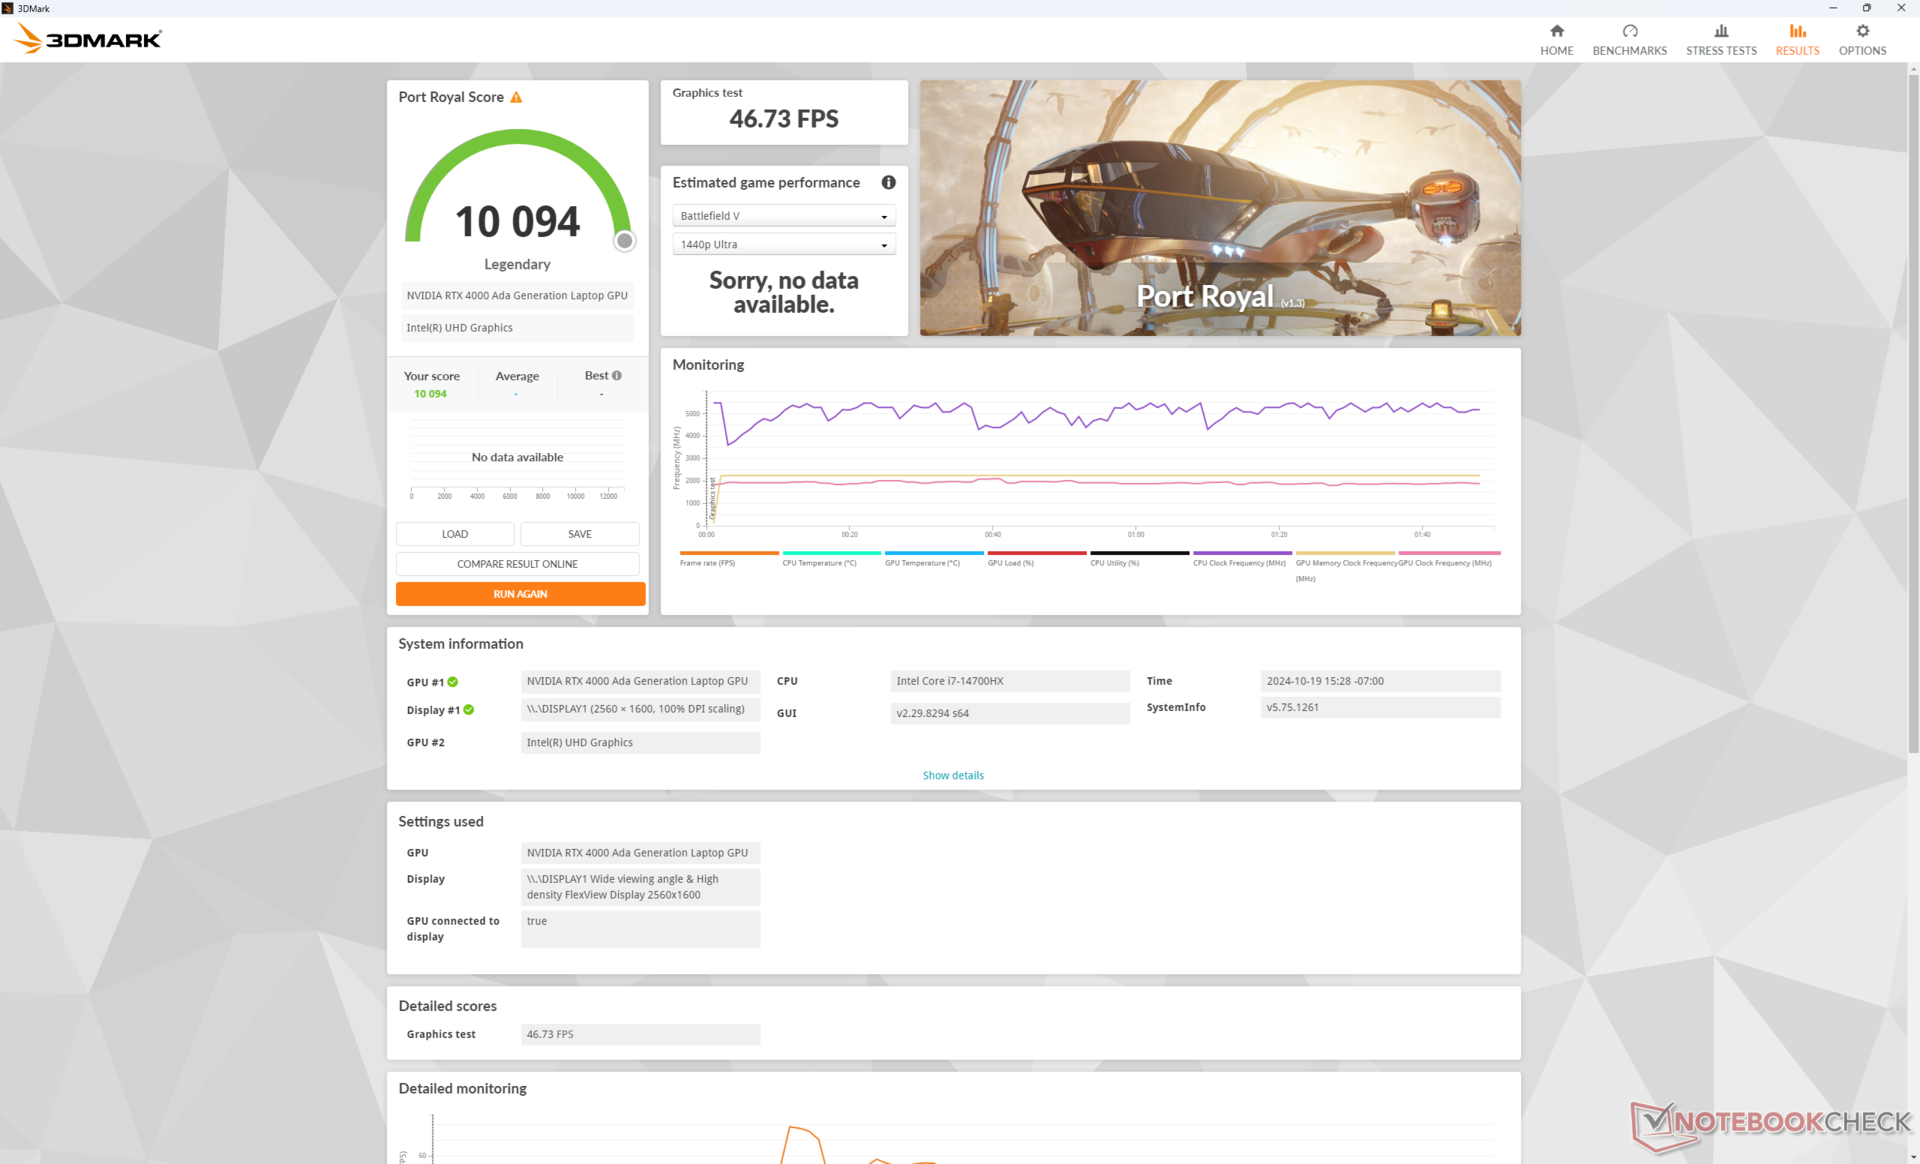
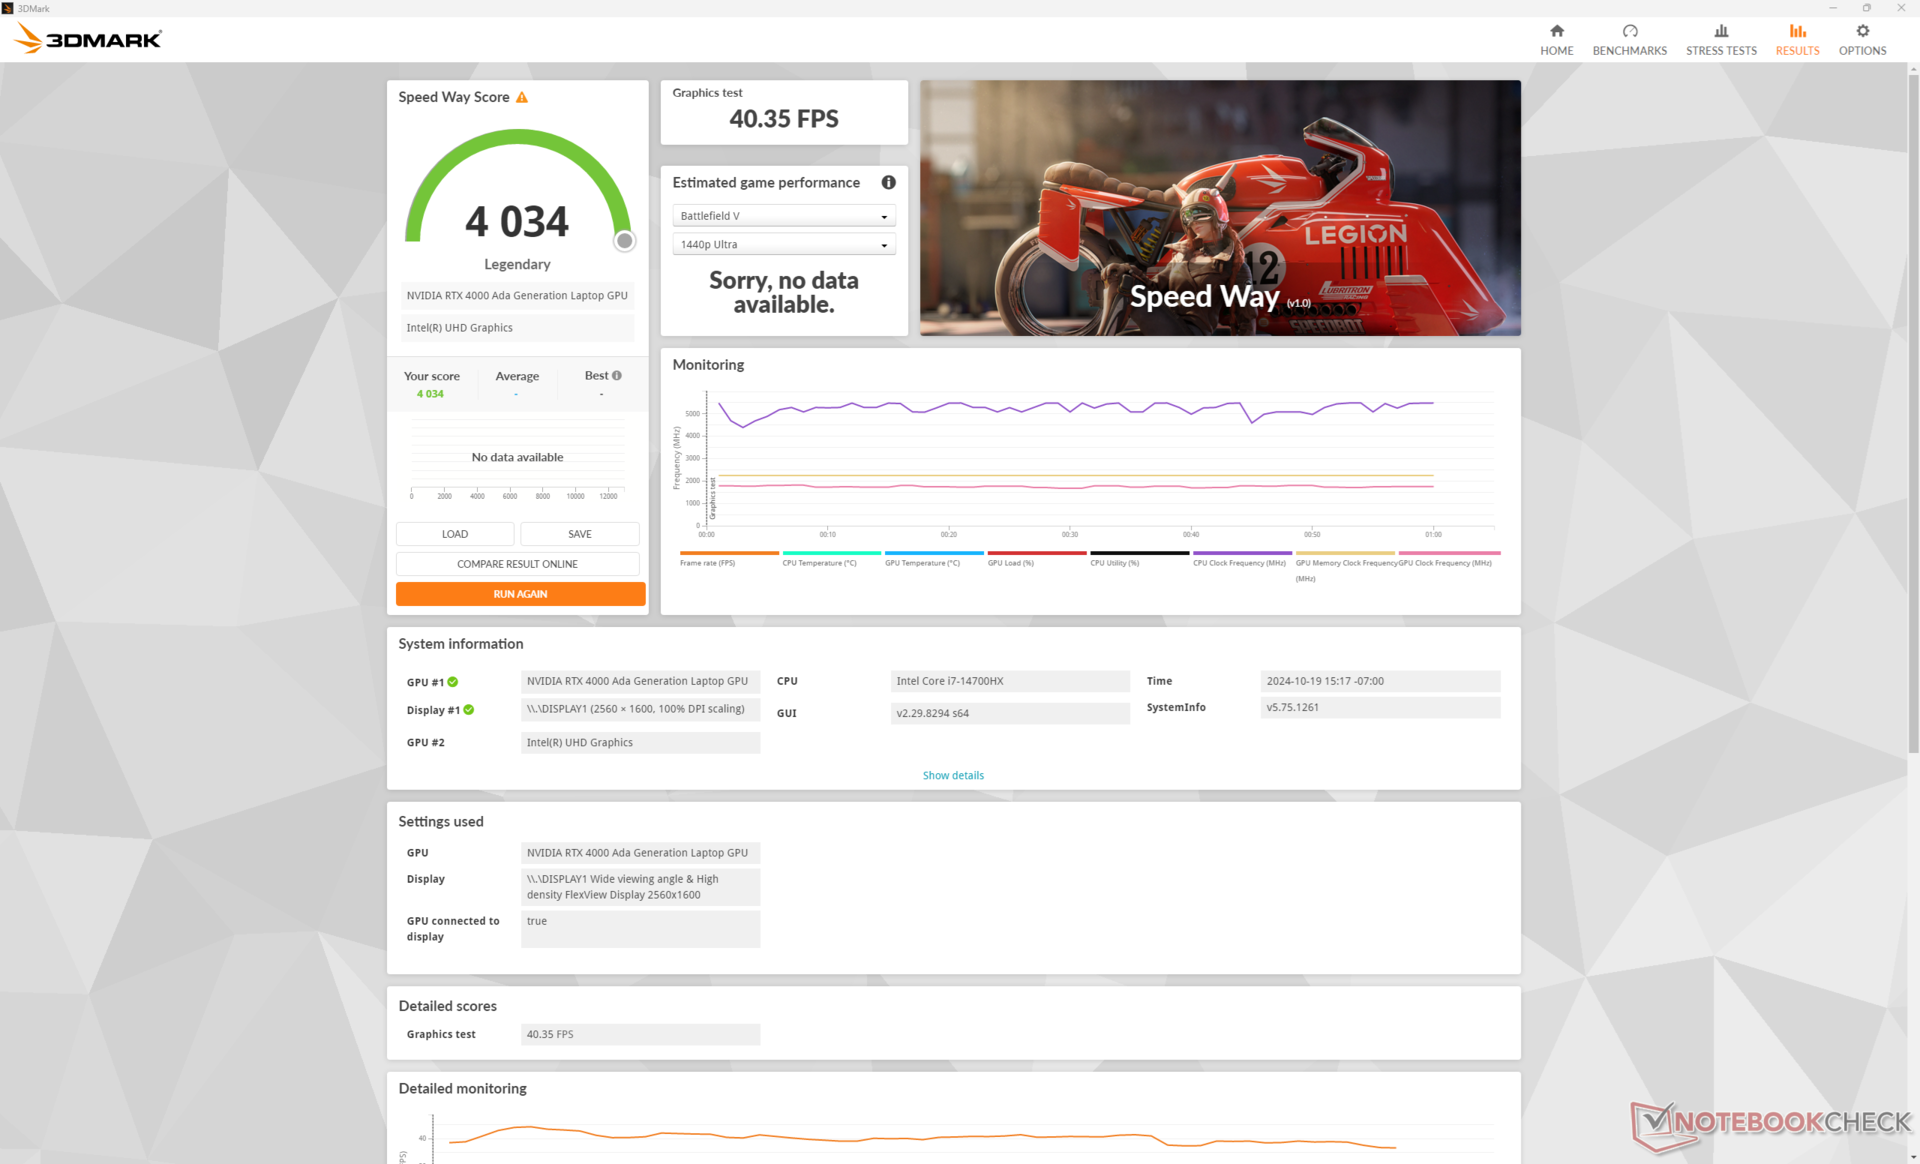
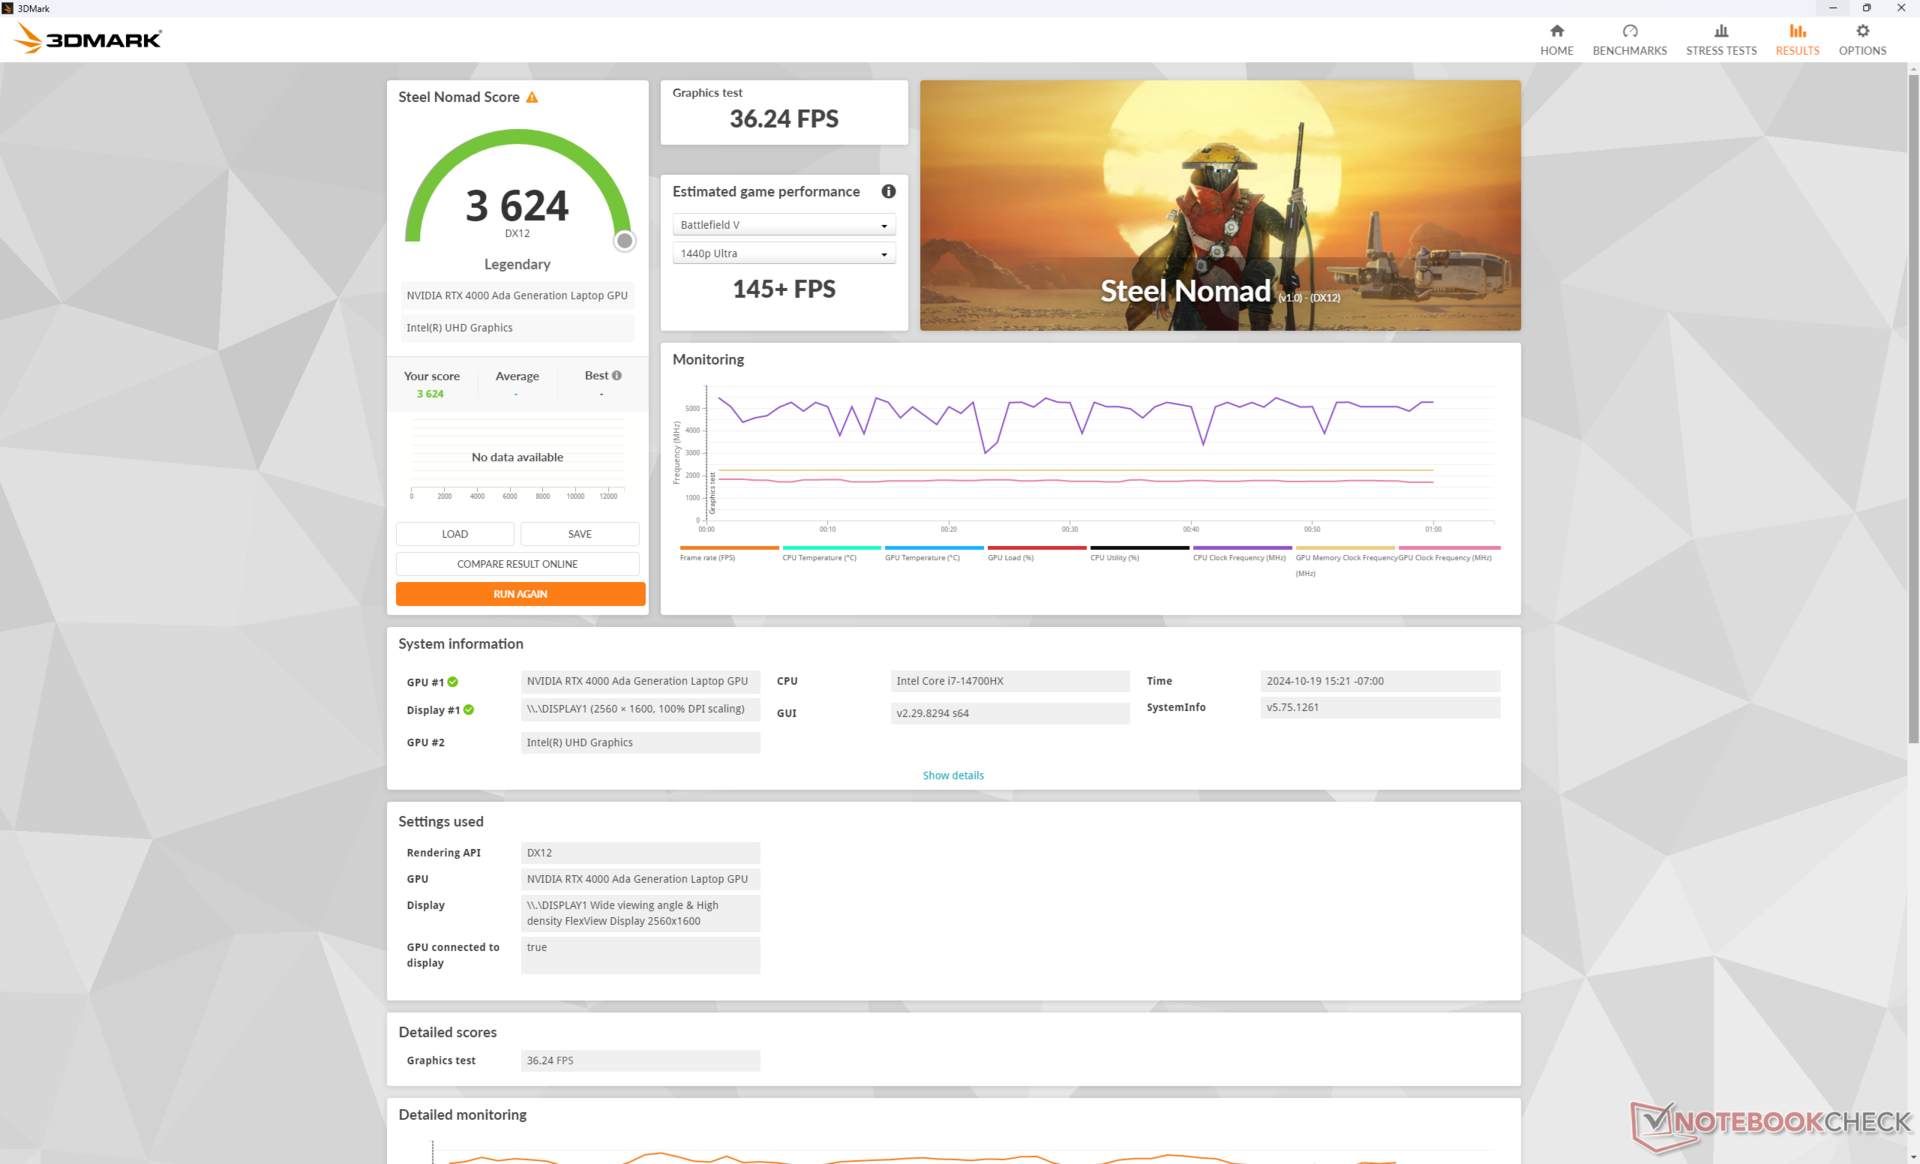
Die 130 W RTX 4000 Ada in unserem Lenovo bietet eine beeindruckende Leistung für eine mobile GPU und übertrifft die 95 W RTX 5000 Ada im Precision 5690 deutlich. Beispielsweise liegen die 3DMark-Ergebnisse zwischen 10 und 40 Prozent über denen der Konkurrenz, und auch bei den SpecViewPerf-Tests sind vergleichbare Leistungsgewinne zu verzeichnen.
Energieprofile | Grafikleistung | CPU-Leistung | Gesamtwert | |
Performance-Modus | 40179 | 30534 | 14840 | |
Balanced-Modus | 32889 (-18%) | 29923 (-2%) | 13007 (-12%) | |
Battery-Modus | 23401 (-42%) | 27793 (-9%) | 8510 (-42%) |
Der Wechsel vom Performance-Modus in den Balanced-Modus hat erhebliche Auswirkungen auf die Grafikleistung, wie die oben dargestellten Fire Strike-Ergebnisse verdeutlichen.
| 3DMark Performance Rating - Percent | |
| Lenovo ThinkPad P16 Gen 2 -3! | |
| Durchschnittliche NVIDIA RTX 4000 Ada Generation Laptop -3! | |
| Dell Precision 5690 -3! | |
| HP ZBook Fury 16 G11 | |
| HP ZBook Fury 16 G9 -3! | |
| Dell Precision 5000 5490 -3! | |
| MSI CreatorPro Z16P B12UKST -19! | |
| HP ZBook Power 15 G10 -11! | |
| Asus ExpertBook B6 Flip B6602FC2 -19! | |
| Lenovo ThinkPad P16v G1 AMD -18! | |
| Lenovo ThinkPad P1 G4-20Y4Z9DVUS -19! | |
| Lenovo ThinkPad P16s G2 21K9000CGE -19! | |
| HP ZBook Firefly 16 G9-6B897EA -19! | |
| 3DMark 11 Performance | 39943 Punkte | |
| 3DMark Cloud Gate Standard Score | 61459 Punkte | |
| 3DMark Fire Strike Score | 32984 Punkte | |
| 3DMark Time Spy Score | 16013 Punkte | |
| 3DMark Steel Nomad Score | 3624 Punkte | |
Hilfe | ||
* ... kleinere Werte sind besser
Gaming Performance
Obwohl die RTX 4000 Ada nicht speziell für Spiele optimiert ist, bleibt sie dennoch ein leistungsstarkes Grafikwerkzeug, insbesondere wenn man ihre Obergrenze von 130 W TGP berücksichtigt. In puncto Spieleleistung erreicht sie vergleichbare Werte wie ein High-End-Gaming-Laptop mit einer mobilen GeForce RTX 4080.
| Performance Rating - Percent | |
| Lenovo ThinkPad P16 Gen 2 | |
| Dell Precision 5690 -1! | |
| Lenovo ThinkPad P16 G1 RTX A5500 -1! | |
| Lenovo ThinkPad P16 G2 21FA000FGE -1! | |
| HP ZBook Power 16 G11 A | |
| Lenovo ThinkPad P16s G2 21K9000CGE -1! | |
| Baldur's Gate 3 - 1920x1080 Ultra Preset AA:T | |
| Lenovo ThinkPad P16 Gen 2 | |
| Dell Precision 5690 | |
| HP ZBook Power 16 G11 A | |
| GTA V - 1920x1080 Highest AA:4xMSAA + FX AF:16x | |
| Lenovo ThinkPad P16 Gen 2 | |
| Lenovo ThinkPad P16 G1 RTX A5500 | |
| Lenovo ThinkPad P16 G2 21FA000FGE | |
| HP ZBook Power 16 G11 A | |
| Lenovo ThinkPad P16s G2 21K9000CGE | |
| Final Fantasy XV Benchmark - 1920x1080 High Quality | |
| Lenovo ThinkPad P16 Gen 2 | |
| Dell Precision 5690 | |
| Lenovo ThinkPad P16 G1 RTX A5500 | |
| Lenovo ThinkPad P16 G2 21FA000FGE | |
| HP ZBook Power 16 G11 A | |
| Lenovo ThinkPad P16s G2 21K9000CGE | |
| Strange Brigade - 1920x1080 ultra AA:ultra AF:16 | |
| Lenovo ThinkPad P16 Gen 2 | |
| Dell Precision 5690 | |
| Lenovo ThinkPad P16 G1 RTX A5500 | |
| Lenovo ThinkPad P16 G2 21FA000FGE | |
| HP ZBook Power 16 G11 A | |
| Lenovo ThinkPad P16s G2 21K9000CGE | |
| Dota 2 Reborn - 1920x1080 ultra (3/3) best looking | |
| Lenovo ThinkPad P16 Gen 2 | |
| Lenovo ThinkPad P16 G1 RTX A5500 | |
| Lenovo ThinkPad P16 G2 21FA000FGE | |
| Dell Precision 5690 | |
| HP ZBook Power 16 G11 A | |
| Lenovo ThinkPad P16s G2 21K9000CGE | |
| Baldur's Gate 3 | |
| 1920x1080 High Preset AA:T | |
| Lenovo ThinkPad P16 Gen 2 | |
| Durchschnittliche NVIDIA RTX 4000 Ada Generation Laptop (n=1) | |
| Dell Precision 5690 | |
| HP ZBook Fury 16 G11 | |
| Dell Precision 5000 5490 | |
| 1920x1080 Ultra Preset AA:T | |
| Lenovo ThinkPad P16 Gen 2 | |
| Durchschnittliche NVIDIA RTX 4000 Ada Generation Laptop (n=1) | |
| Dell Precision 5690 | |
| HP ZBook Fury 16 G11 | |
| Dell Precision 5000 5490 | |
| 2560x1440 Ultra Preset AA:T | |
| Dell Precision 5690 | |
| Lenovo ThinkPad P16 Gen 2 | |
| Durchschnittliche NVIDIA RTX 4000 Ada Generation Laptop (n=1) | |
| HP ZBook Fury 16 G11 | |
Leider sind bei Cyberpunk 2077 leichte Leistungseinbußen zu verzeichnen. Die Frameraten fielen bereits nach wenigen Minuten im Spiel von etwa 103 auf etwa 96, und die Ergebnisse verbesserten sich auch nach mehreren Tests nicht. Dies deutet darauf hin, dass die GPU möglicherweise von einer leistungsstärkeren Kühllösung profitieren könnte.
Cyberpunk 2077 ultra FPS-Diagramm
| min. | mittel | hoch | max. | QHD | |
|---|---|---|---|---|---|
| GTA V (2015) | 185.8 | 183.9 | 179.4 | 125.6 | 118.7 |
| Dota 2 Reborn (2015) | 215.4 | 189.7 | 185.2 | 164.4 | |
| Final Fantasy XV Benchmark (2018) | 207 | 185.3 | 150 | 119.5 | |
| X-Plane 11.11 (2018) | 166.8 | 144 | 113.1 | ||
| Far Cry 5 (2018) | 168 | 148 | 138 | 128 | 125 |
| Strange Brigade (2018) | 452 | 372 | 323 | 292 | 210 |
| Tiny Tina's Wonderlands (2022) | 275.4 | 232.6 | 171.4 | 137.1 | 92 |
| F1 22 (2022) | 275 | 264 | 238 | 95.5 | 65.7 |
| Baldur's Gate 3 (2023) | 178.3 | 160.6 | 141.6 | 137 | 90.7 |
| Cyberpunk 2077 (2023) | 129.3 | 115.1 | 108.4 | 98.3 | 68.5 |
Emissionen — Laut und frech
Geräuschemissionen
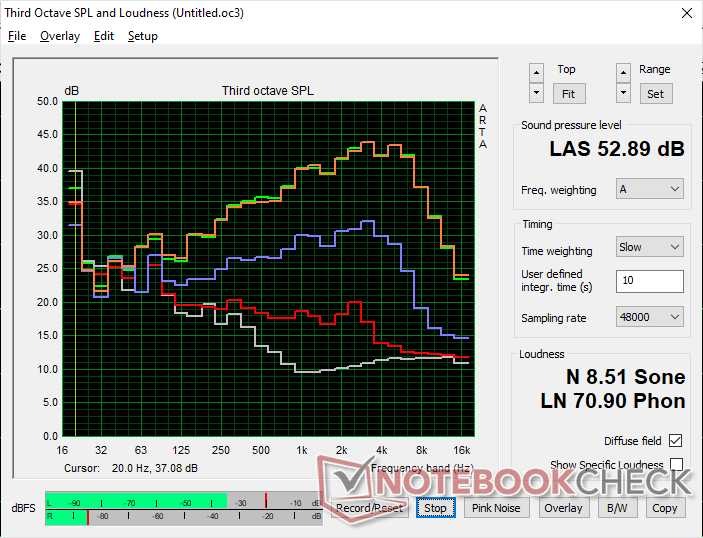
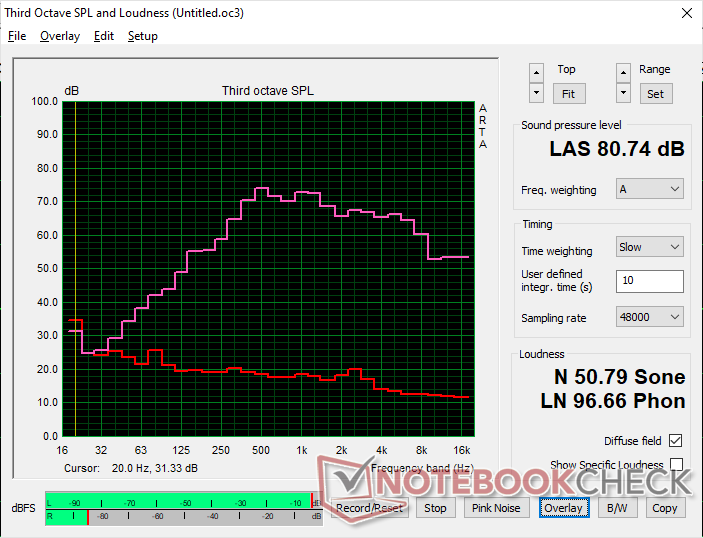
Die Lüfter in unserem Gerät neigen dazu, die Drehzahl und die Geräuschentwicklung im Vergleich zu unserer kleineren RTX 2000 Ada-Konfiguration schneller zu erhöhen. Daher müssen die Nutzer mit mehr Lüfterpulsationen und Veränderungen des Lüftergeräuschs rechnen, wenn unterschiedliche Lasten ausgeführt werden. Anspruchsvolle Anwendungen wie Spiele führen zu einem Lüftergeräusch von 53 dB(A), was diese Workstation zu einer der lautesten 16-Zoll-Modelle macht, die wir getestet haben.
Wenn Cyberpunk 2077 im Balanced-Modus statt im Performance-Modus läuft, sinkt das Lüftergeräusch deutlich von 52,8 dB(A) auf 47,9 dB(A). Allerdings geschieht dies auf Kosten der Leistung, wie im Abschnitt zur GPU-Leistung weiter oben erwähnt.
Lautstärkediagramm
| Idle |
| 29.1 / 29.1 / 29.1 dB(A) |
| Last |
| 41 / 52.9 dB(A) |
 | ||
30 dB leise 40 dB(A) deutlich hörbar 50 dB(A) störend |
||
min: | ||
| Lenovo ThinkPad P16 Gen 2 RTX 4000 Ada Generation Laptop, i7-14700HX, SK hynix PC801 HFS001TEJ9X162N | Lenovo ThinkPad P16 G2 21FA000FGE RTX 2000 Ada Generation Laptop, i7-13700HX, SK hynix PC801 HFS001TEJ9X162N | Lenovo ThinkPad P16s G2 21K9000CGE Radeon 780M, R7 PRO 7840U, SK hynix PC801 HFS001TEJ9X162N | Lenovo ThinkPad P16 G1 RTX A5500 RTX A5500 Laptop GPU, i9-12950HX, WDC PC SN810 2TB | HP ZBook Power 16 G11 A RTX 2000 Ada Generation Laptop, R7 8845HS, Samsung PM9A1 MZVL22T0HBLB | Dell Precision 5690 RTX 5000 Ada Generation Laptop, Ultra 9 185H, 2x Samsung PM9A1 1TB (RAID 0) | |
|---|---|---|---|---|---|---|
| Geräuschentwicklung | 6% | 17% | 17% | 18% | 5% | |
| aus / Umgebung * (dB) | 23.9 | 23.5 2% | 22.6 5% | 23.1 3% | 23.5 2% | 23.4 2% |
| Idle min * (dB) | 29.1 | 23.5 19% | 22.6 22% | 23.1 21% | 23.8 18% | 23.6 19% |
| Idle avg * (dB) | 29.1 | 29.2 -0% | 22.6 22% | 23.1 21% | 24.2 17% | 24.9 14% |
| Idle max * (dB) | 29.1 | 29.5 -1% | 22.6 22% | 23.1 21% | 24.2 17% | 30.9 -6% |
| Last avg * (dB) | 41 | 32.7 20% | 37.8 8% | 28.9 30% | 25.4 38% | 40.4 1% |
| Cyberpunk 2077 ultra * (dB) | 52.8 | 43 19% | ||||
| Last max * (dB) | 52.9 | 56.6 -7% | 40.5 23% | 51.4 3% | 45 15% | 51.9 2% |
| Witcher 3 ultra * (dB) | 50.6 | 40.3 | 51.6 | 48.3 |
* ... kleinere Werte sind besser
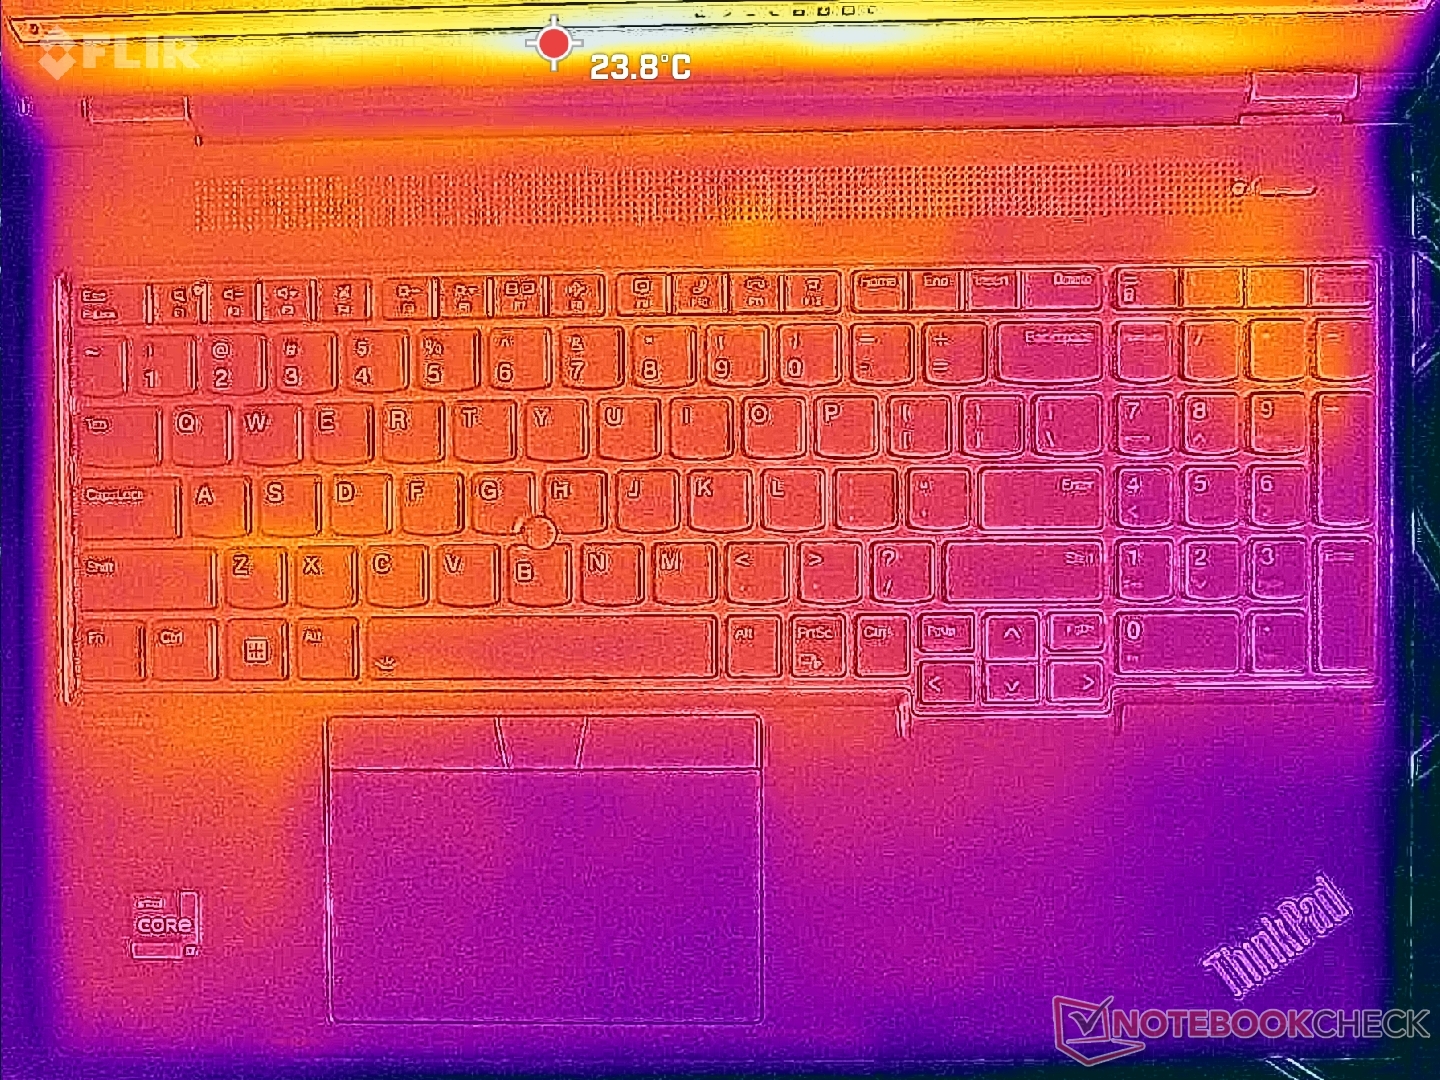
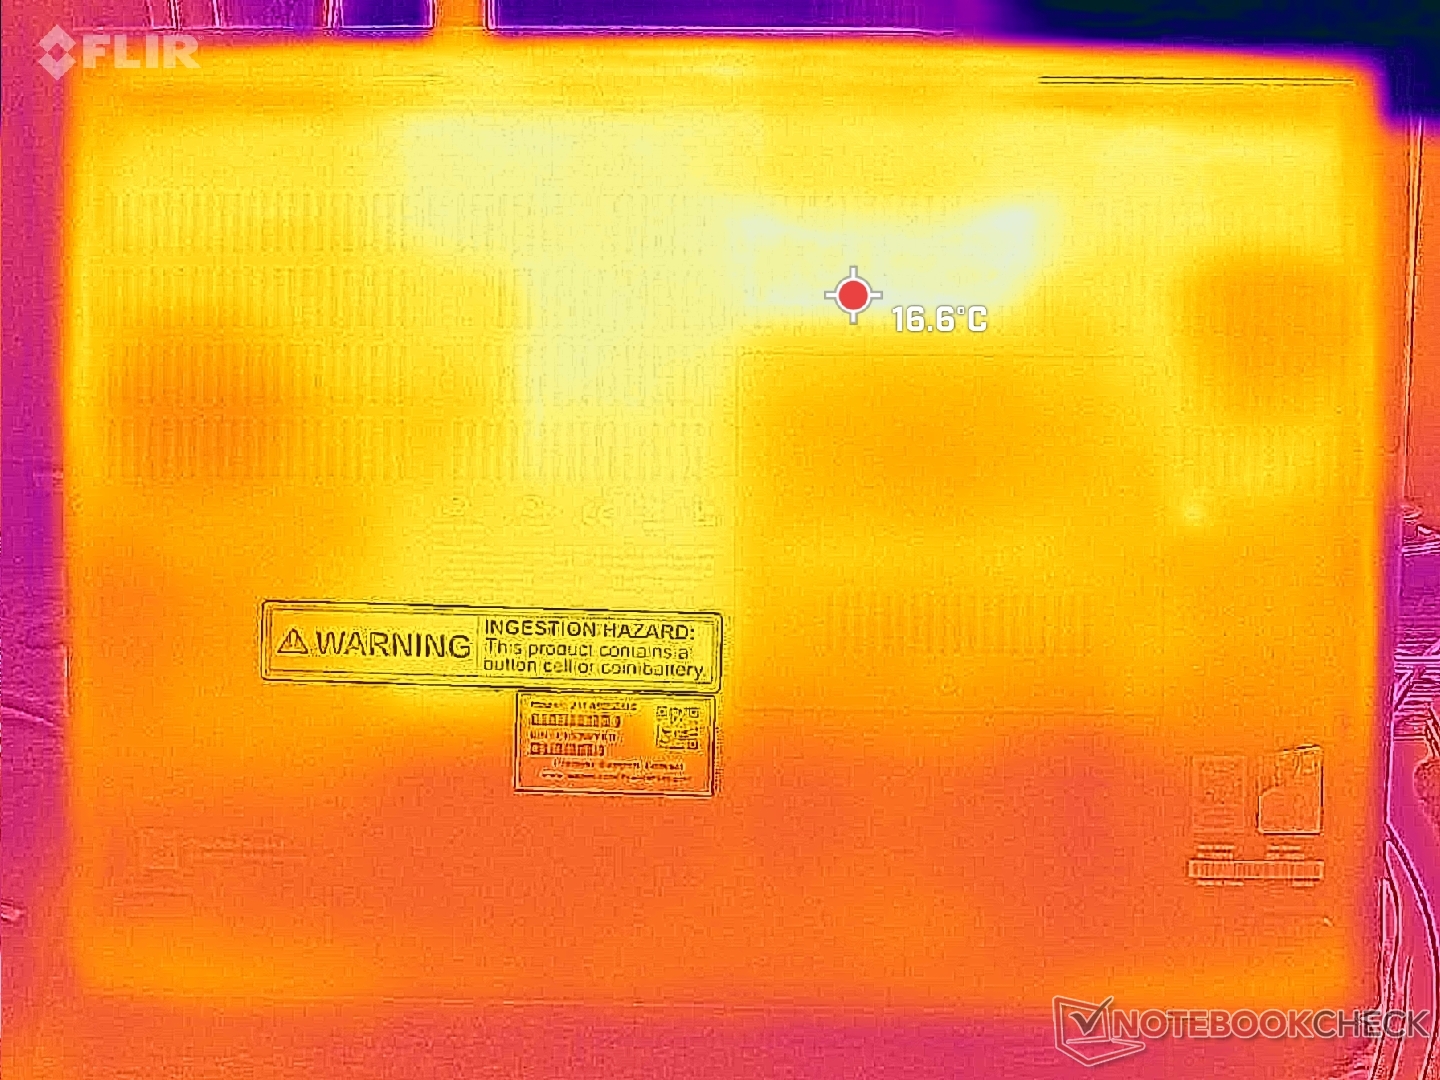
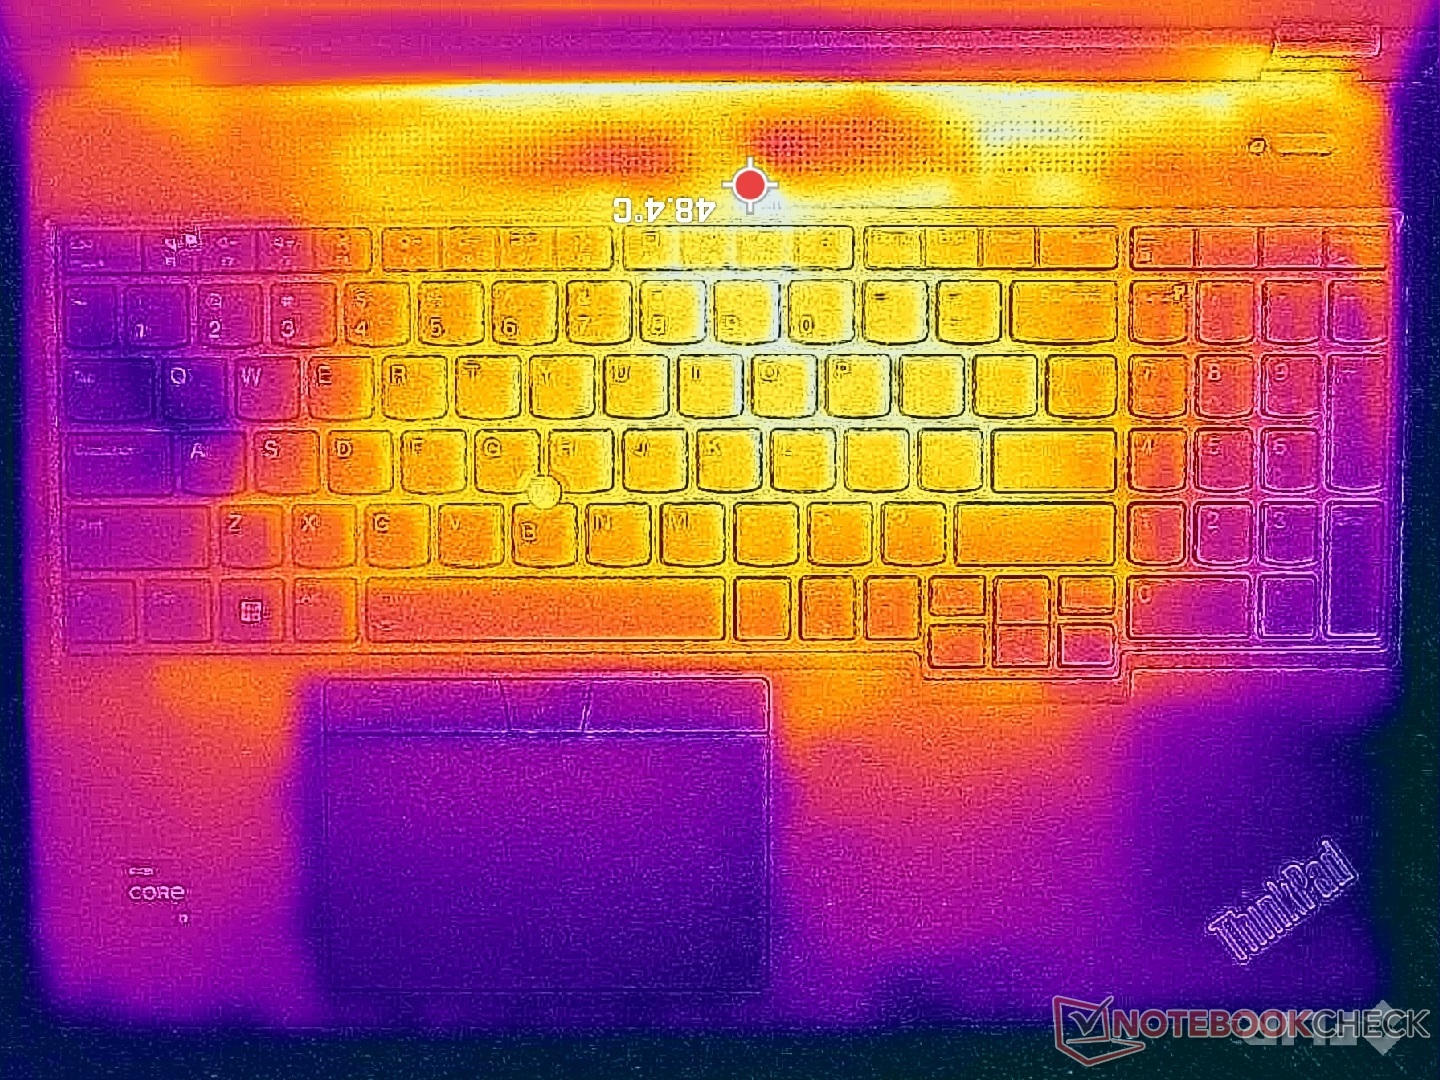
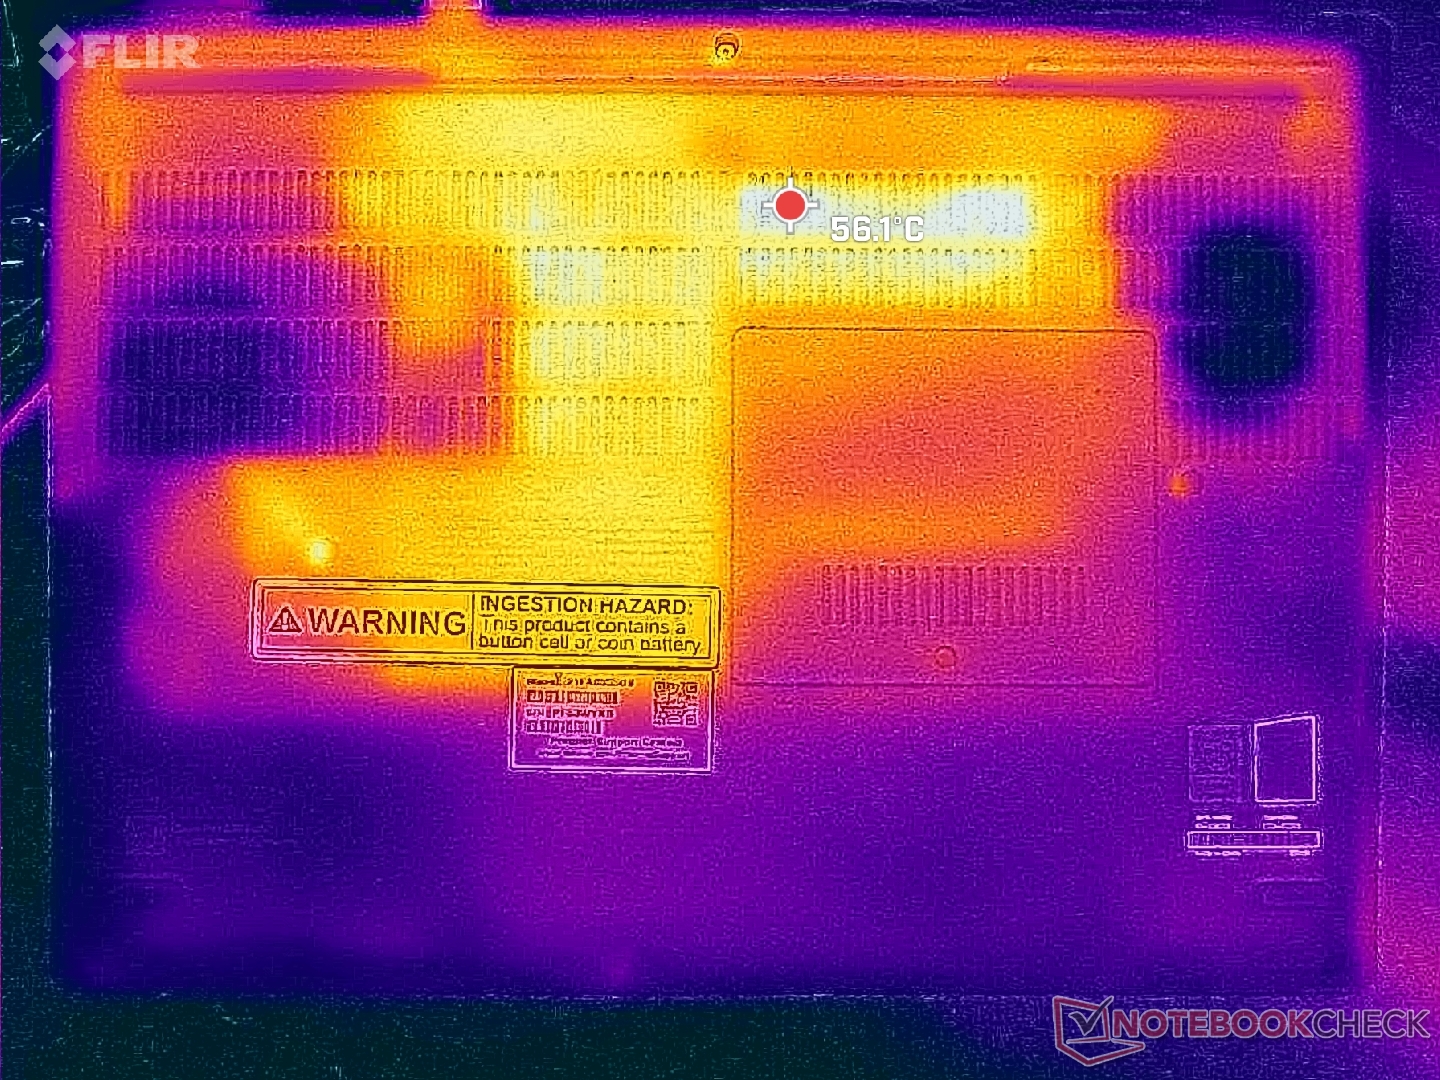
Temperatur
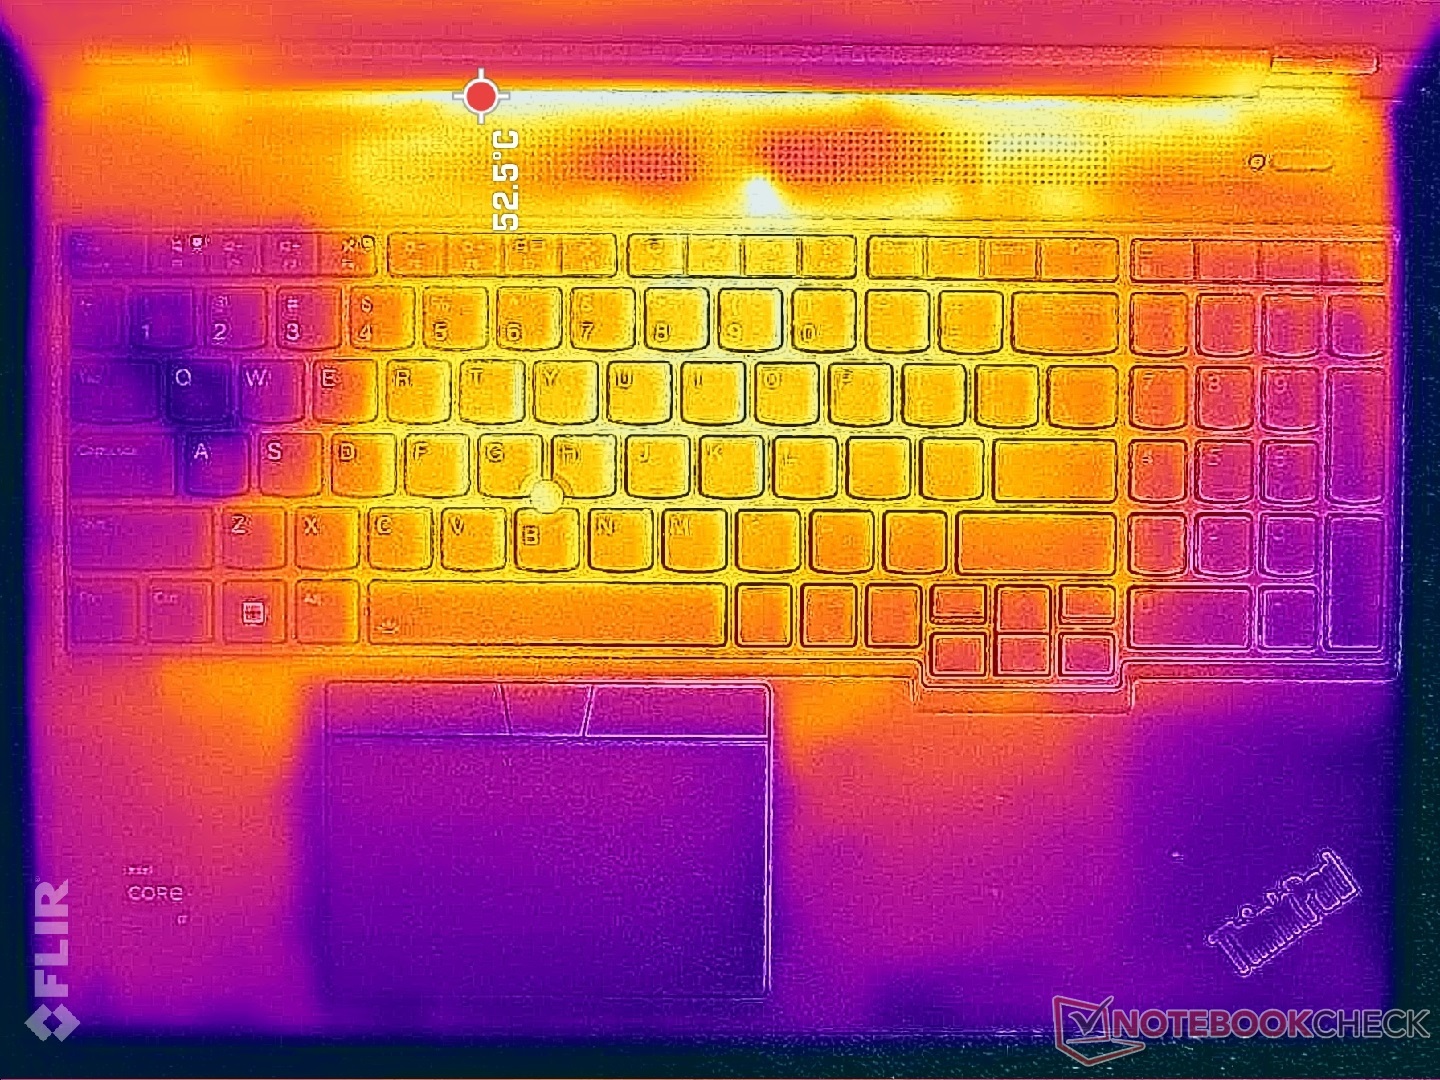
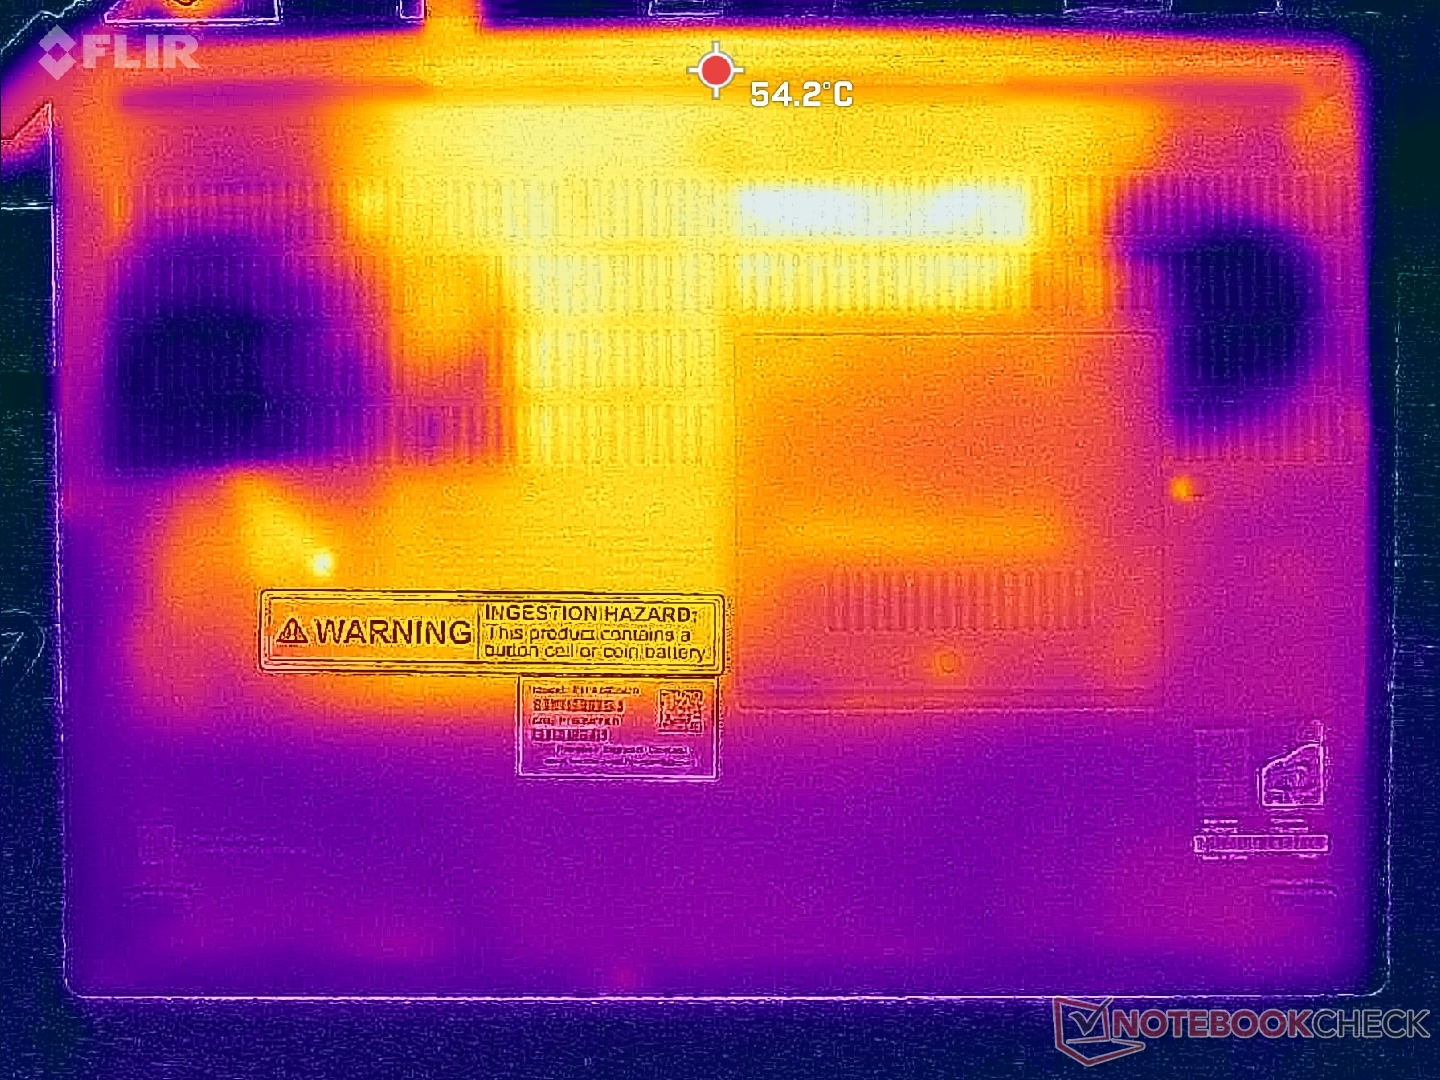
Die Oberflächentemperaturen sind aufgrund der anspruchsvolleren 130-Watt-RTX-4000-Ada-GPU erwartungsgemäß höher als bei unserem ersten ThinkPad P16 Gen 2 Testgerät, jedoch ist der Unterschied größer als erwartet. Diese durchschnittliche Temperatur auf den C- und D-Abdeckungen kann 43 °C erreichen, während unsere weniger leistungsstarke Konfiguration lediglich 32 °C verzeichnete, wenn anspruchsvolle Lasten ausgeführt werden.
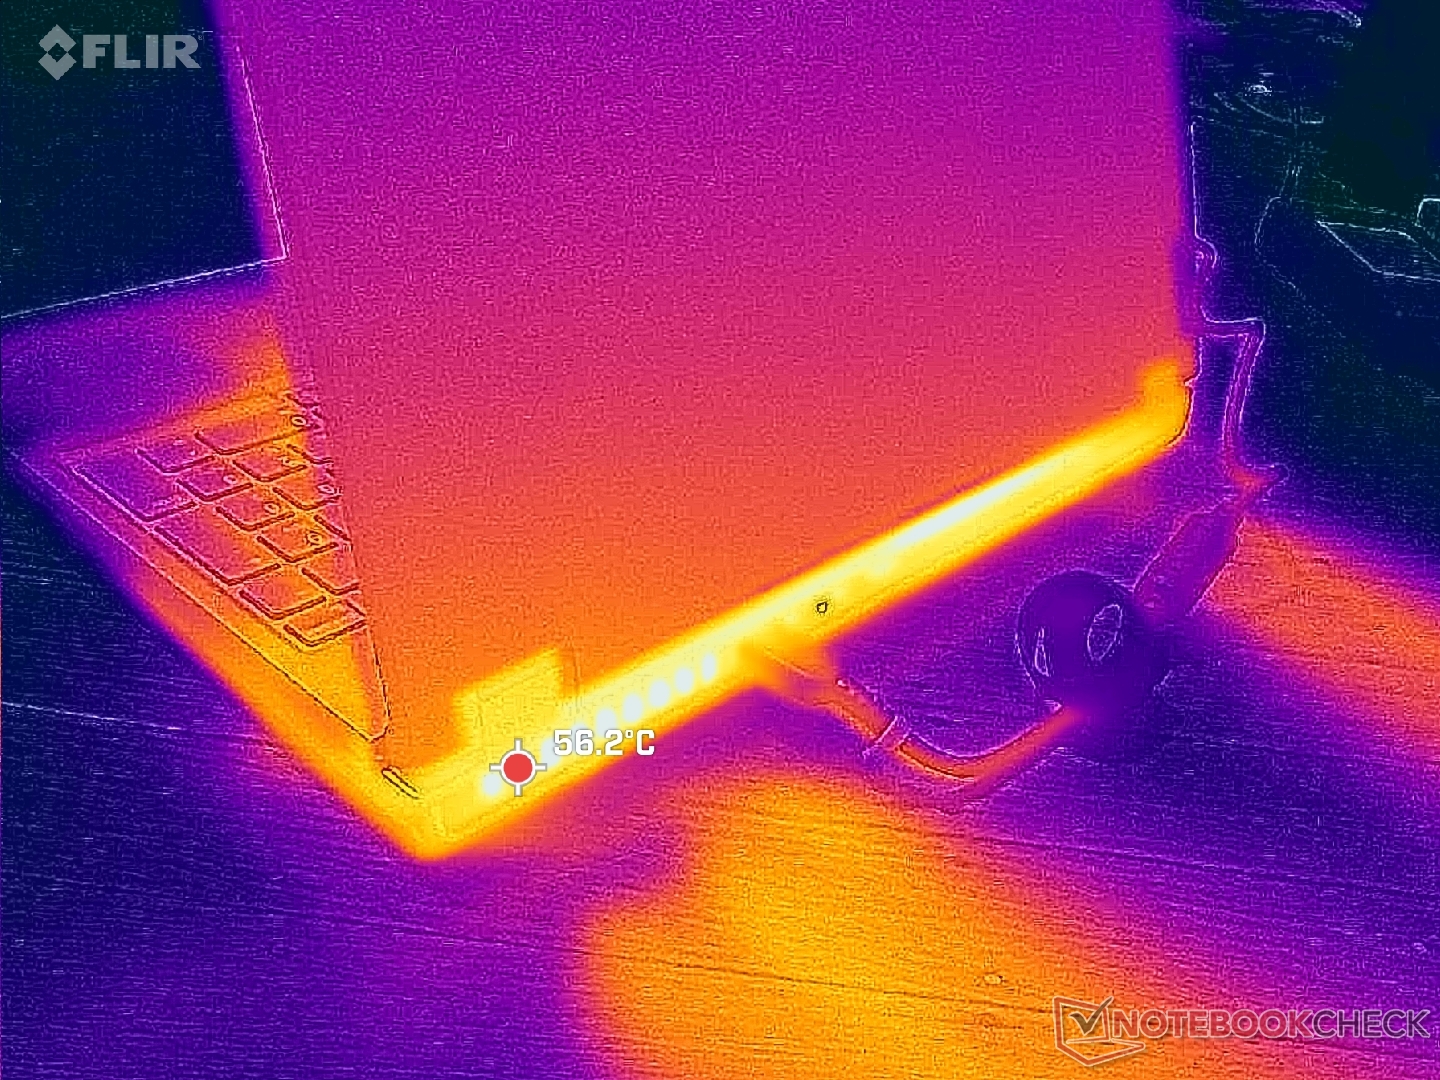
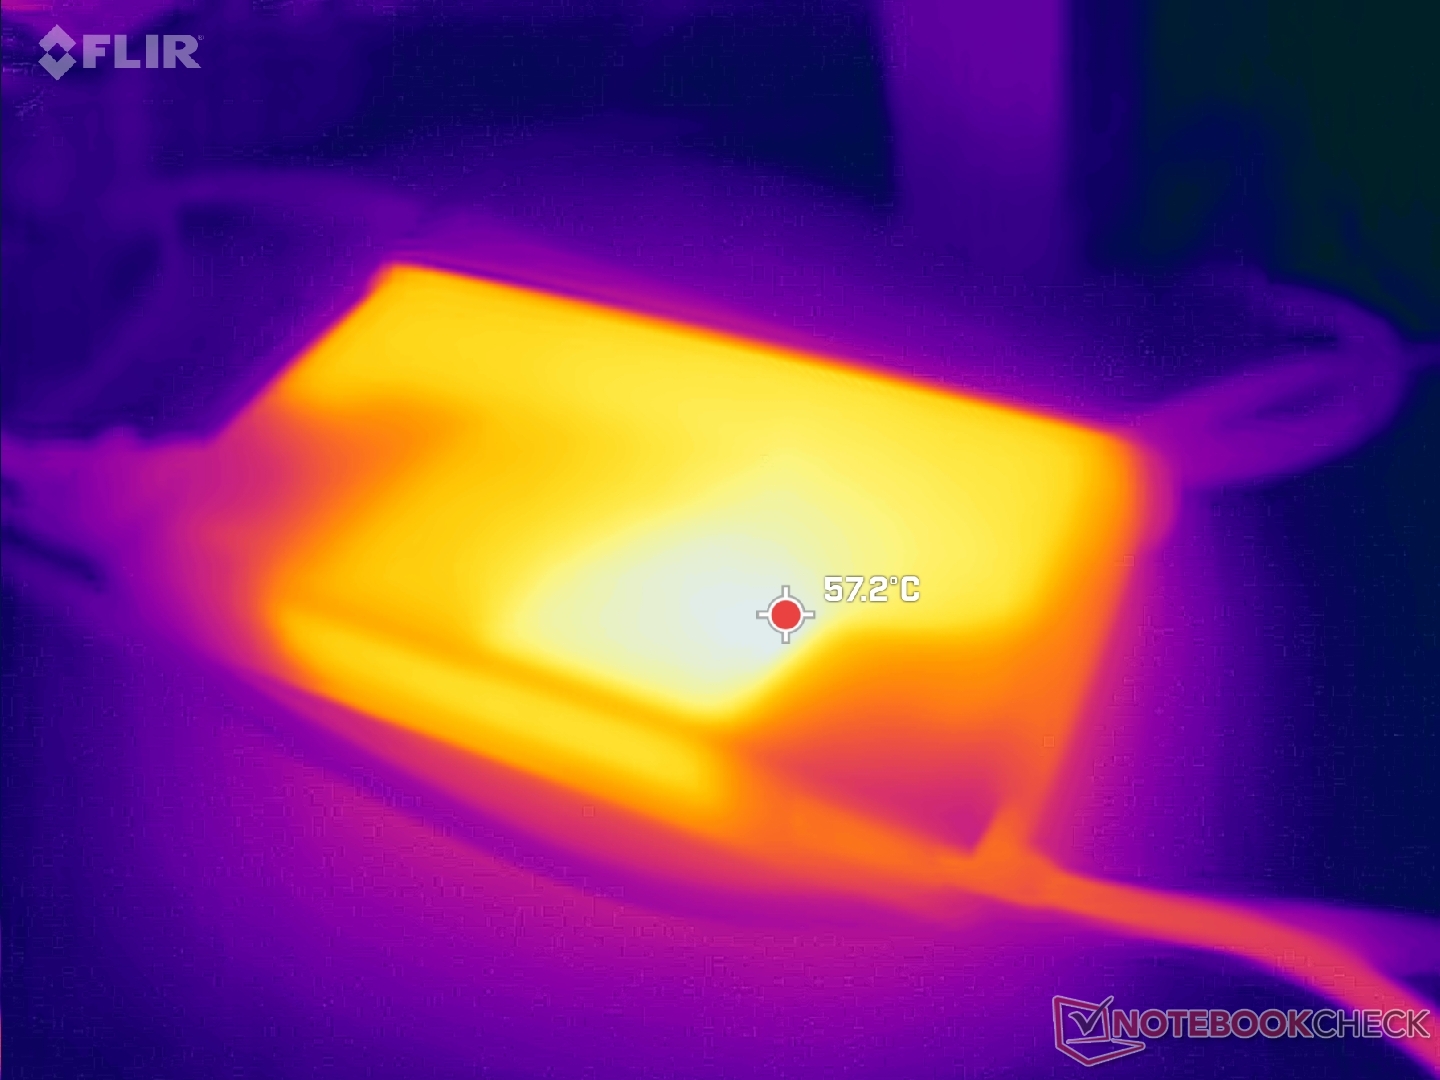
(-) Die maximale Temperatur auf der Oberseite ist 46.6 °C. Im Vergleich liegt der Klassendurchschnitt bei 38.2 °C (von 22.2 bis 69.8 °C für die Klasse Workstation).
(-) Auf der Unterseite messen wir eine maximalen Wert von 51 °C (im Vergleich zum Durchschnitt von 41.1 °C).
(+) Ohne Last messen wir eine durchschnittliche Temperatur von 23.9 °C auf der Oberseite. Der Klassendurchschnitt erreicht 32 °C.
(-) 3: The average temperature for the upper side is 39.6 °C / 103 F, compared to the average of 32 °C / 90 F for the class Workstation.
(+) Die Handballen und der Touchpad-Bereich erreichen maximal 35.6 °C und damit die typische Hauttemperatur und fühlen sich daher nicht heiß an.
(-) Die durchschnittliche Handballen-Temperatur anderer getesteter Geräte war 27.8 °C (-7.8 °C).
| Lenovo ThinkPad P16 Gen 2 Intel Core i7-14700HX, NVIDIA RTX 4000 Ada Generation Laptop | Lenovo ThinkPad P16 G2 21FA000FGE Intel Core i7-13700HX, NVIDIA RTX 2000 Ada Generation Laptop | Lenovo ThinkPad P16s G2 21K9000CGE AMD Ryzen 7 PRO 7840U, AMD Radeon 780M | Lenovo ThinkPad P16 G1 RTX A5500 Intel Core i9-12950HX, NVIDIA RTX A5500 Laptop GPU | HP ZBook Power 16 G11 A AMD Ryzen 7 8845HS, NVIDIA RTX 2000 Ada Generation Laptop | Dell Precision 5690 Intel Core Ultra 9 185H, Nvidia RTX 5000 Ada Generation Laptop | |
|---|---|---|---|---|---|---|
| Hitze | 3% | -2% | -17% | 6% | -3% | |
| Last oben max * (°C) | 46.6 | 47.2 -1% | 42.7 8% | 44.8 4% | 40.6 13% | 46.6 -0% |
| Last unten max * (°C) | 51 | 39.5 23% | 47.2 7% | 49.8 2% | 40.6 20% | 33 35% |
| Idle oben max * (°C) | 24.8 | 28.1 -13% | 27.8 -12% | 30.6 -23% | 26 -5% | 32.4 -31% |
| Idle unten max * (°C) | 25.6 | 25.3 1% | 28.4 -11% | 38.6 -51% | 26.6 -4% | 29.4 -15% |
* ... kleinere Werte sind besser
Lautsprecher
Lenovo ThinkPad P16 Gen 2 Audio Analyse
(±) | Mittelmäßig laut spielende Lautsprecher (80.7 dB)
Bass 100 - 315 Hz
(±) | abgesenkter Bass - 10.8% geringer als der Median
(±) | durchschnittlich lineare Bass-Wiedergabe (8% Delta zum Vorgänger)
Mitteltöne 400 - 2000 Hz
(±) | zu hohe Mitten, vom Median 5.4% abweichend
(+) | lineare Mitten (6.2% Delta zum Vorgänger)
Hochtöne 2 - 16 kHz
(+) | ausgeglichene Hochtöne, vom Median nur 3.3% abweichend
(+) | sehr lineare Hochtöne (5.5% Delta zum Vorgänger)
Gesamt im hörbaren Bereich 100 - 16.000 Hz
(±) | hörbarer Bereich ist durchschnittlich linear (15.6% Abstand zum Median)
Im Vergleich zu allen Geräten derselben Klasse
» 35% aller getesteten Geräte dieser Klasse waren besser, 10% vergleichbar, 55% schlechter
» Das beste Gerät hat einen Delta-Wert von 7%, durchschnittlich ist 17%, das schlechteste Gerät hat 35%
Im Vergleich zu allen Geräten im Test
» 23% aller getesteten Geräte waren besser, 4% vergleichbar, 73% schlechter
» Das beste Gerät hat einen Delta-Wert von 4%, durchschnittlich ist 24%, das schlechteste Gerät hat 134%
Apple MacBook Pro 16 2021 M1 Pro Audio Analyse
(+) | Die Lautsprecher können relativ laut spielen (84.7 dB)
Bass 100 - 315 Hz
(+) | guter Bass - nur 3.8% Abweichung vom Median
(+) | lineare Bass-Wiedergabe (5.2% Delta zum Vorgänger)
Mitteltöne 400 - 2000 Hz
(+) | ausgeglichene Mitten, vom Median nur 1.3% abweichend
(+) | lineare Mitten (2.1% Delta zum Vorgänger)
Hochtöne 2 - 16 kHz
(+) | ausgeglichene Hochtöne, vom Median nur 1.9% abweichend
(+) | sehr lineare Hochtöne (2.7% Delta zum Vorgänger)
Gesamt im hörbaren Bereich 100 - 16.000 Hz
(+) | hörbarer Bereich ist sehr linear (4.6% Abstand zum Median
Im Vergleich zu allen Geräten derselben Klasse
» 0% aller getesteten Geräte dieser Klasse waren besser, 0% vergleichbar, 100% schlechter
» Das beste Gerät hat einen Delta-Wert von 5%, durchschnittlich ist 17%, das schlechteste Gerät hat 45%
Im Vergleich zu allen Geräten im Test
» 0% aller getesteten Geräte waren besser, 0% vergleichbar, 100% schlechter
» Das beste Gerät hat einen Delta-Wert von 4%, durchschnittlich ist 24%, das schlechteste Gerät hat 134%
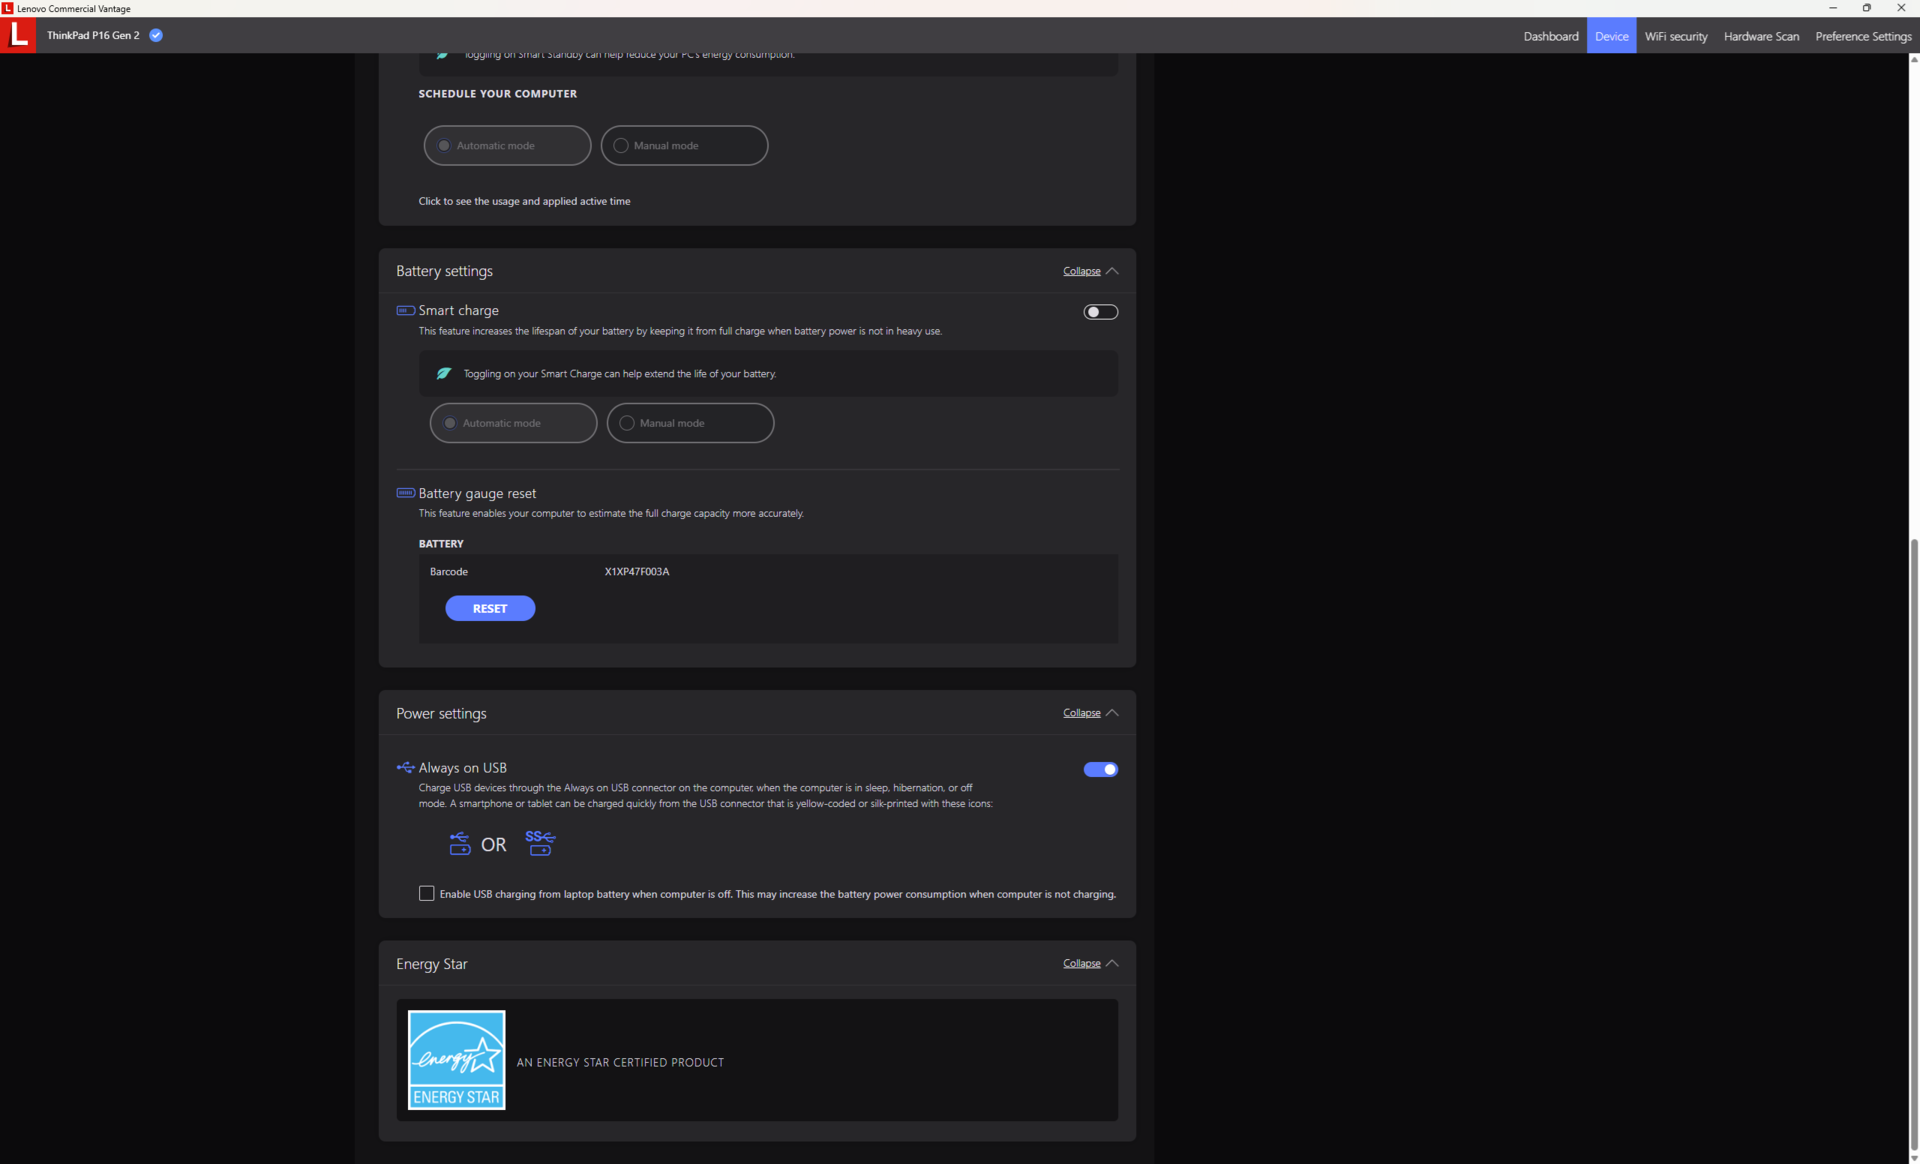
Energieverwaltung
Energieaufnahme
Im Leerlauf auf dem Desktop kann der Verbrauch bis zu 25 W erreichen, während die weniger leistungsstarke RTX 2000-Konfiguration nur 16 W benötigt. Bei anspruchsvollen Anwendungen wie Spielen kann der Unterschied sogar bis zu 80 W betragen, was einem Anstieg des Verbrauchs um 55 % entspricht. Achten Sie darauf, das leistungsstärkere 230-W-Netzteil zu verwenden, um die volle Leistung der RTX 4000-Konfiguration auszuschöpfen.
| Aus / Standby | |
| Idle | |
| Last |
|
Legende:
min: | |
| Lenovo ThinkPad P16 Gen 2 i7-14700HX, RTX 4000 Ada Generation Laptop, SK hynix PC801 HFS001TEJ9X162N, IPS, 2560x1600, 16" | Lenovo ThinkPad P16 G2 21FA000FGE i7-13700HX, RTX 2000 Ada Generation Laptop, SK hynix PC801 HFS001TEJ9X162N, IPS LED, 2560x1600, 16" | Lenovo ThinkPad P16s G2 21K9000CGE R7 PRO 7840U, Radeon 780M, SK hynix PC801 HFS001TEJ9X162N, OLED, 3840x2400, 16" | Lenovo ThinkPad P16 G1 RTX A5500 i9-12950HX, RTX A5500 Laptop GPU, WDC PC SN810 2TB, IPS, 3840x2400, 16" | HP ZBook Power 16 G11 A R7 8845HS, RTX 2000 Ada Generation Laptop, Samsung PM9A1 MZVL22T0HBLB, IPS, 2560x1600, 16" | Dell Precision 5690 Ultra 9 185H, RTX 5000 Ada Generation Laptop, 2x Samsung PM9A1 1TB (RAID 0), OLED, 3840x2400, 16" | |
|---|---|---|---|---|---|---|
| Stromverbrauch | 7% | 55% | -27% | 47% | 8% | |
| Idle min * (Watt) | 7.9 | 9.3 -18% | 6.1 23% | 7.5 5% | 4.6 42% | 7.9 -0% |
| Idle avg * (Watt) | 13.1 | 14.1 -8% | 6.5 50% | 20.1 -53% | 10 24% | 12 8% |
| Idle max * (Watt) | 24.2 | 15.5 36% | 7 71% | 40 -65% | 10.6 56% | 28.6 -18% |
| Last avg * (Watt) | 127.4 | 133.6 -5% | 56.6 56% | 137 -8% | 60.9 52% | 98.8 22% |
| Cyberpunk 2077 ultra external monitor * (Watt) | 219 | 92.8 58% | ||||
| Cyberpunk 2077 ultra * (Watt) | 225 | 96.8 57% | ||||
| Last max * (Watt) | 248.5 | 179.6 28% | 68.3 73% | 285.9 -15% | 154.8 38% | 174.8 30% |
| Witcher 3 ultra * (Watt) | 144.9 | 61.2 | 208 | 144.5 |
* ... kleinere Werte sind besser
Energieaufnahme Cyberpunk / Stresstest
Energieaufnahme externer Monitor
Akkulaufzeit
Die Laufzeiten sind um mehr als die Hälfte schlechter als bei der kleineren ThinkPad P16 Gen 2-Konfiguration, selbst wenn der Balanced-Modus und die Helligkeit auf 150 Nit eingestellt sind. Der Unterschied ist hauptsächlich auf das Fehlen der Advanced-Optimus-Unterstützung unserer RTX-4000-Ada-GPU zurückzuführen, wodurch die diskrete GPU nie vollständig deaktiviert wird.
Das Aufladen von 0 auf 100 Prozent dauert etwa 130 Minuten, selbst wenn Lenovo Quick Charge aktiviert ist.
| Lenovo ThinkPad P16 Gen 2 i7-14700HX, RTX 4000 Ada Generation Laptop, 94 Wh | Lenovo ThinkPad P16 G2 21FA000FGE i7-13700HX, RTX 2000 Ada Generation Laptop, 94 Wh | Lenovo ThinkPad P16s G2 21K9000CGE R7 PRO 7840U, Radeon 780M, 84 Wh | Lenovo ThinkPad P16 G1 RTX A5500 i9-12950HX, RTX A5500 Laptop GPU, 94 Wh | HP ZBook Power 16 G11 A R7 8845HS, RTX 2000 Ada Generation Laptop, 83 Wh | Dell Precision 5690 Ultra 9 185H, RTX 5000 Ada Generation Laptop, 98 Wh | |
|---|---|---|---|---|---|---|
| Akkulaufzeit | 244% | 324% | 132% | 288% | 268% | |
| WLAN (h) | 2.5 | 8.6 244% | 10.6 324% | 5.8 132% | 9.7 288% | 9.2 268% |
| H.264 (h) | 13.3 | |||||
| Last (h) | 1.5 | 1.7 | ||||
| Idle (h) | 26.1 |
Lenovo ThinkPad P16 Gen 2
- 25.10.2024 v8
Allen Ngo
 Total Sustainability Score:
 Transparenz
Die Auswahl der zu testenden Geräte erfolgt innerhalb der Redaktion. Das vorliegende Testmuster wurde dem Autor vom Hersteller oder einem Shop zu Testzwecken leihweise zur Verfügung gestellt. Eine Einflussnahme des Leihstellers auf den Testbericht gab es nicht, der Hersteller erhielt keine Version des Reviews vor der Veröffentlichung. Es bestand keine Verpflichtung zur Publikation. Als eigenständiges, unabhängiges Unternehmen unterliegt Notebookcheck keiner Diktion von Herstellern, Shops und Verlagen.
So testet Notebookcheck
Pro Jahr werden von Notebookcheck hunderte Laptops und Smartphones unabhängig in von uns standardisierten technischen Verfahren getestet, um eine Vergleichbarkeit aller Testergebnisse zu gewährleisten. Seit rund 20 Jahren entwickeln wir diese Testmethoden kontinuierlich weiter und setzen damit Branchenstandards. In unseren Testlaboren kommt ausschließlich hochwertiges Messequipment in die Hände erfahrener Techniker und Redakteure. Die Tests unterliegen einer mehrstufigen Kontrolle. Unsere komplexe Gesamtbewertung basiert auf hunderten fundierten Messergebnissen und Benchmarks, womit Ihnen Objektivität garantiert ist. Weitere Informationen zu unseren Testmethoden gibt es hier.

