Geekom XT13 Pro im Test: NUC-Mini-PC verzichtet auf Meteor Lake und bekommt nur einen Intel Core i9-13900H
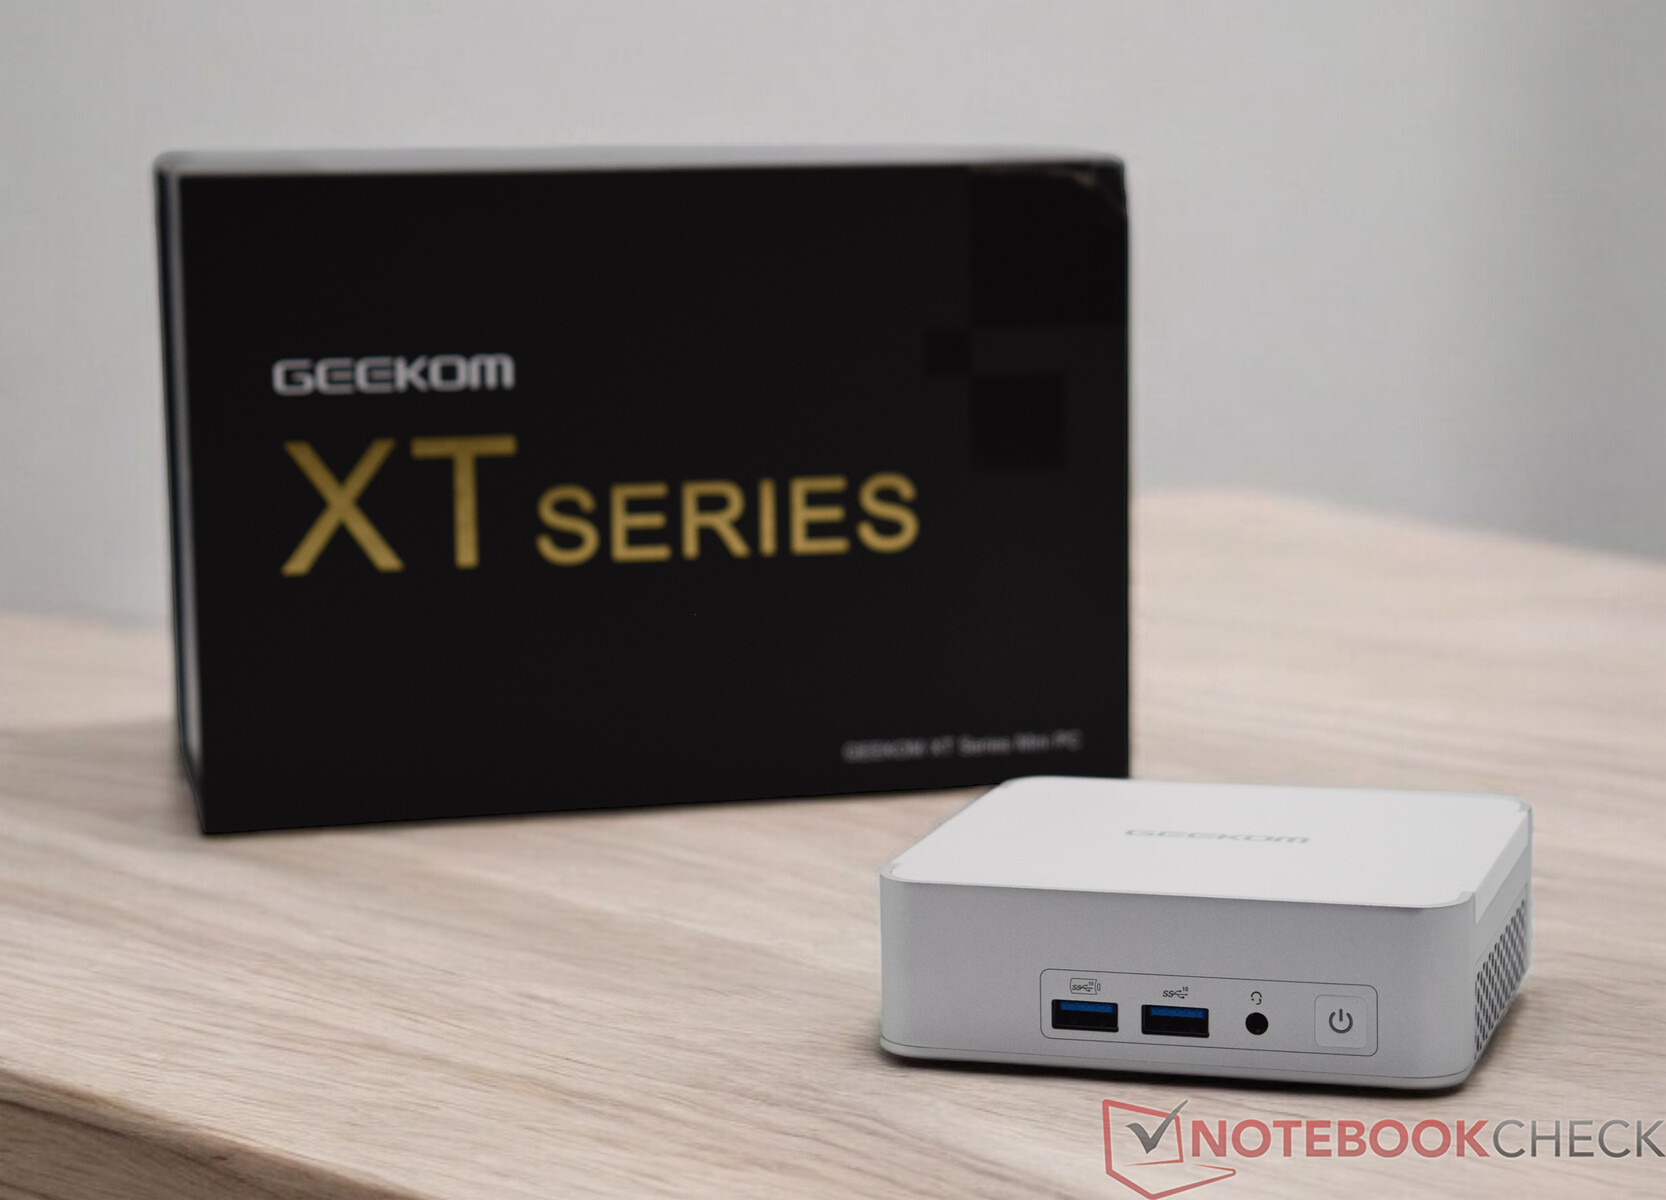
Der Geekom XT13 Pro beerbt den Geekom XT12 Pro und wird in der Topausstattung mit einem Intel Core i9-13900H bestückt. Weiterhin gibt es 32 GB DDR4-RAM und eine 2-TB-SSD, was allerdings seinen Preis hat. Derweil liegt dieser bei 999 Euro, also wahrlich kein Schnäppchen. Für 769 Euro gibt es den Geekom XT13 Pro mit Intel Core i7-13620H und einer 1-TB-SSD. Geekom verzichtet auf den Einsatz der neueren Meteor-Lake-Prozessoren und hält weiterhin an den älteren Raptor-Lake-Prozessoren fest. Ob das der richtige Weg ist, um gegen die Kontrahenten zu bestehen, wird sich in diesem Test zeigen.
Zudem stellt sich die Frage, ob diese Preisgestaltung gerechtfertigt ist. Auch diesem wichtigen Punkt widmen wir uns gezielt nach der Leistungsanalyse. Die Messlatte legt der Hersteller jedenfalls selbst sehr hoch.
mögliche Konkurrenten im Vergleich
Bew. | Version | Datum | Modell | Memory | Gewicht | Dicke |
|---|---|---|---|---|---|---|
| 72.8 % | v8 | 08 / 2024 | Geekom XT13 Pro i9-13900H, Iris Xe G7 96EUs | 32768 MB | 555 g | 37 mm |
| 80.8 % | v8 | 06 / 2024 | Aoostar GEM12 R7 8845HS, Radeon 780M | 32768 MB | 653 g | 60 mm |
| 87.5 % v7 (old) | v7 (old) | 05 / 2024 | Minisforum AtomMan X7 Ti Ultra 9 185H, Arc 8-Core | 32768 MB | 863 g | 48.6 mm |
| 83.4 % v7 (old) | v7 (old) | 04 / 2024 | Acemagic F2A Ultra 7 155H, Arc 8-Core | 32768 MB | 768 g | 57 mm |
| 84.1 % | v8 | 04 / 2024 | Geekom XT12 Pro i9-12900H, Iris Xe G7 96EUs | 32768 MB | 545 g | 37 mm |
| 82.6 % v7 (old) | v7 (old) | 02 / 2024 | Geekom A7 R9 7940HS, Radeon 780M | 32768 MB | 417 g | 38 mm |
Hinweis: Wir haben unser Rating-System aktualisiert und die Ergebnisse von Version 8 sind nicht vergleichbar mit den Ergebnissen von Version 7. Weitere Informationen dazu sind hier verfügbar.

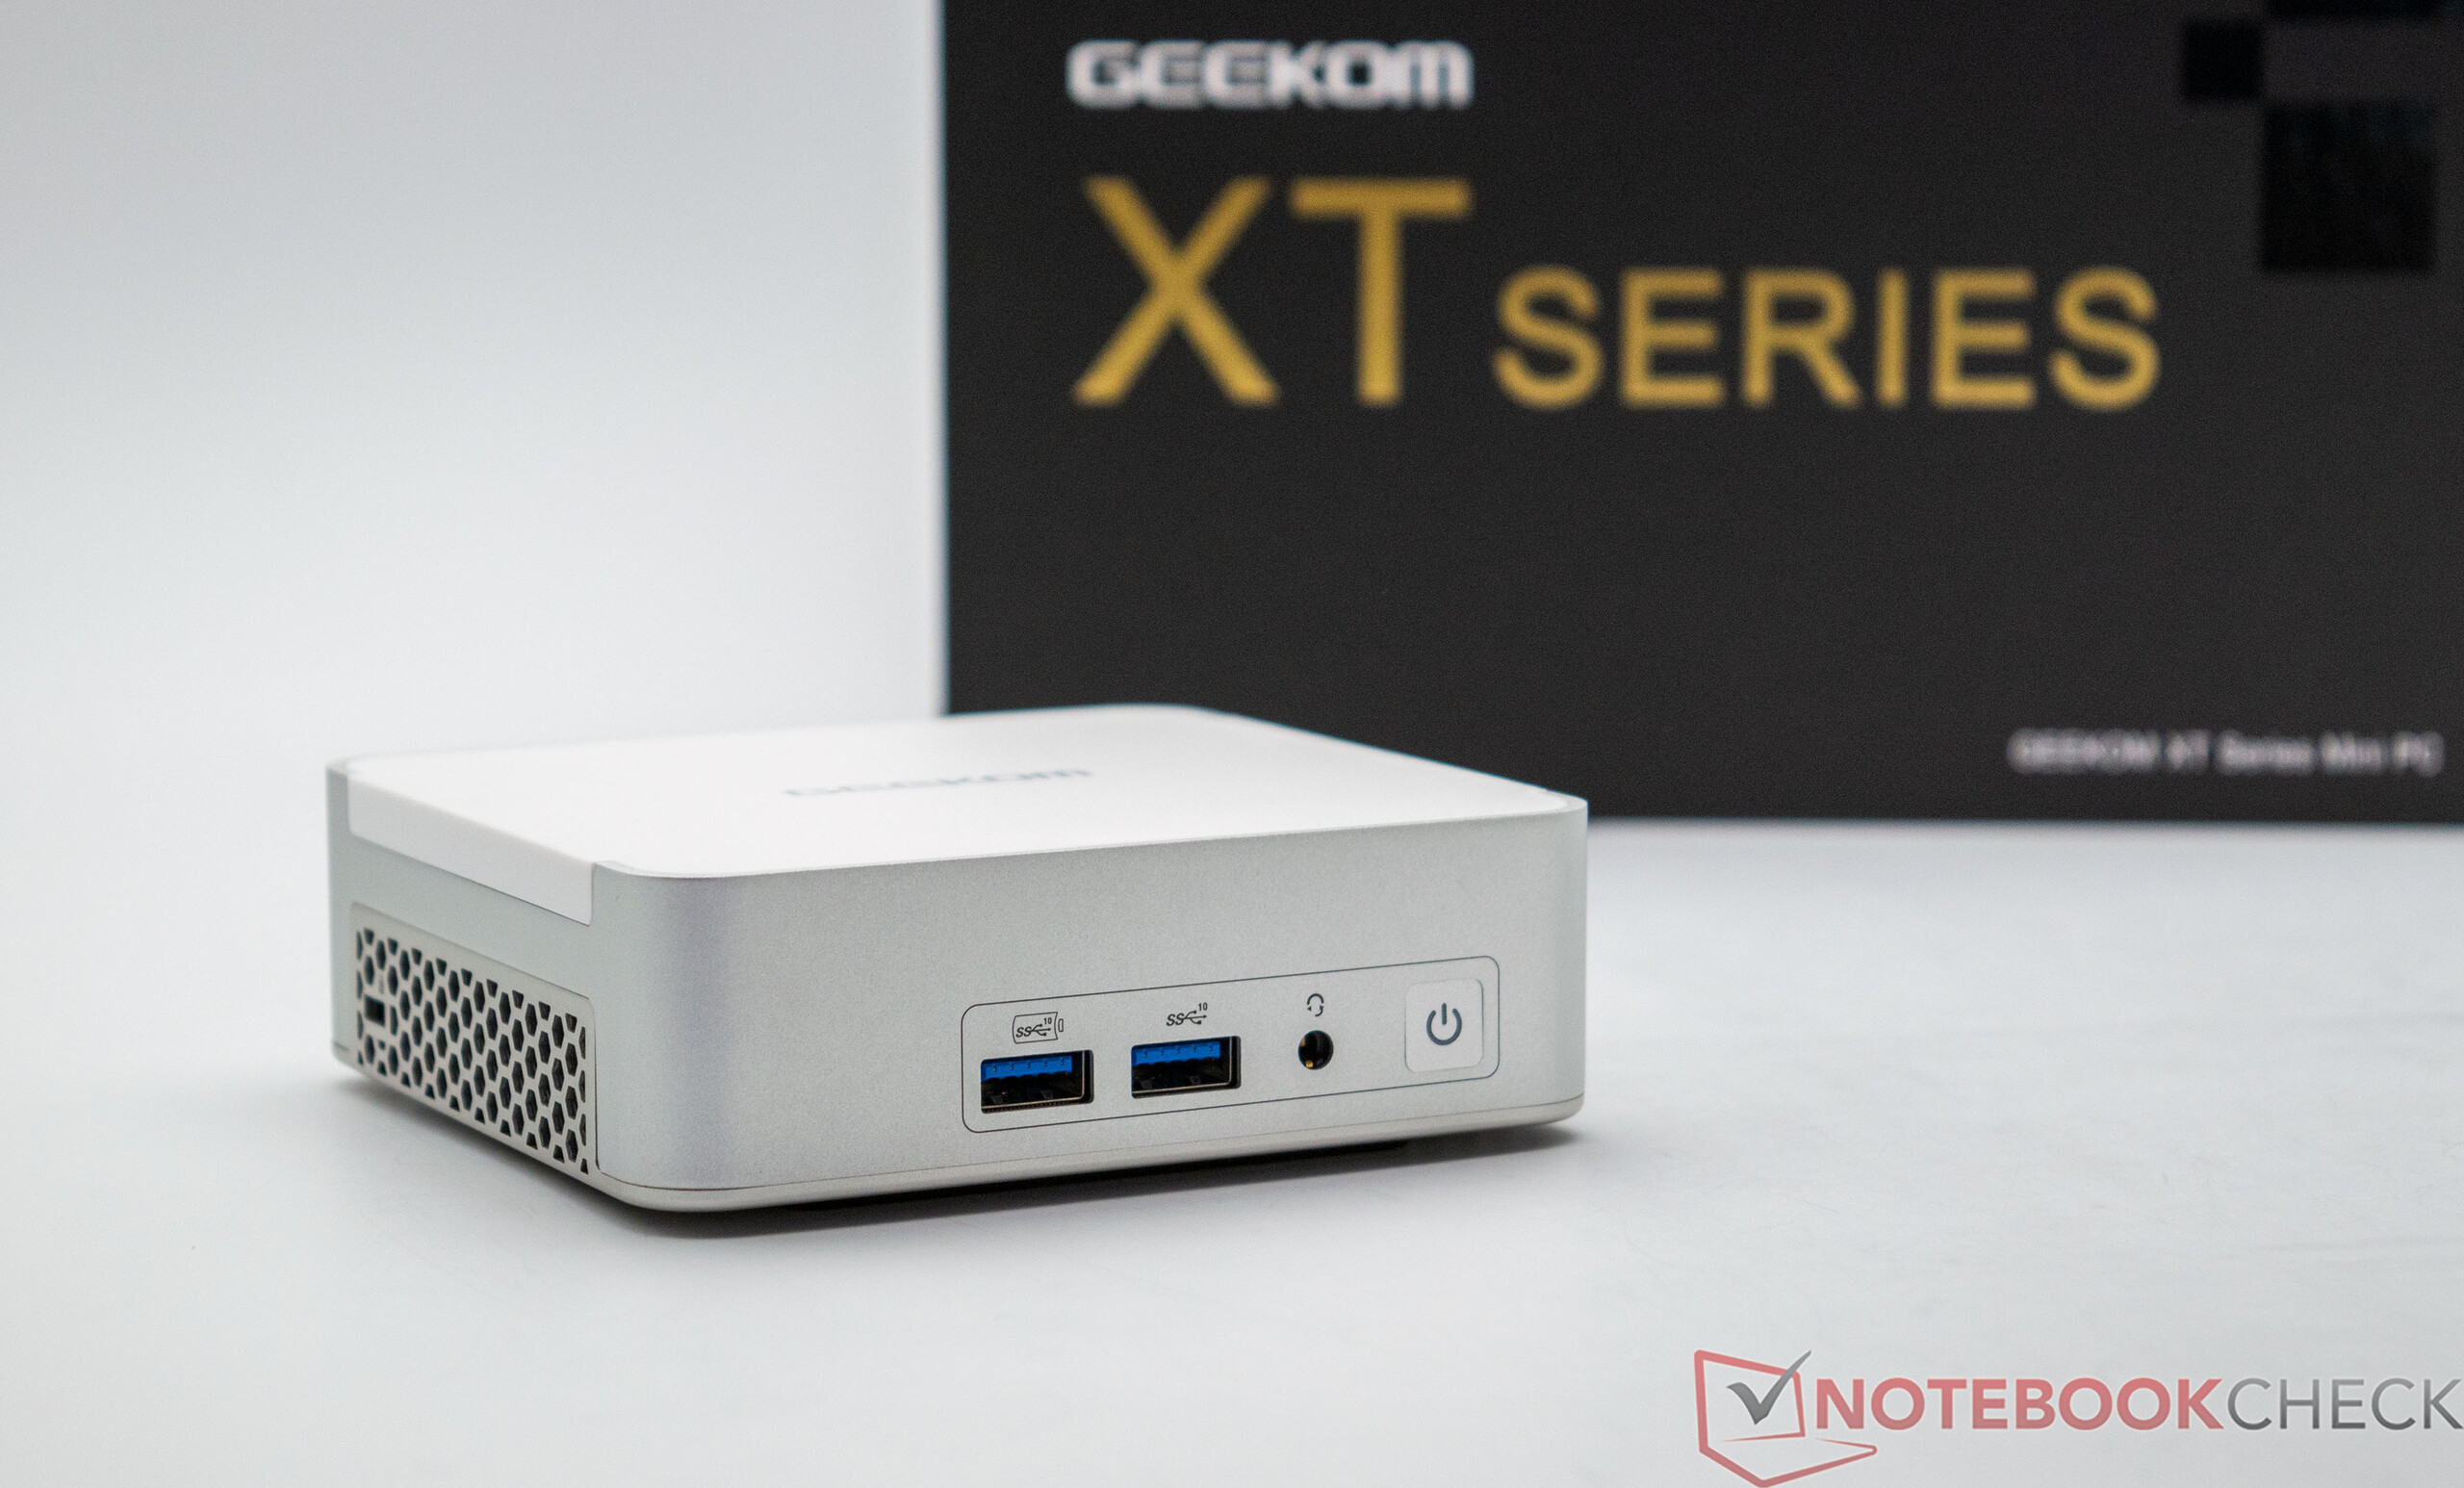
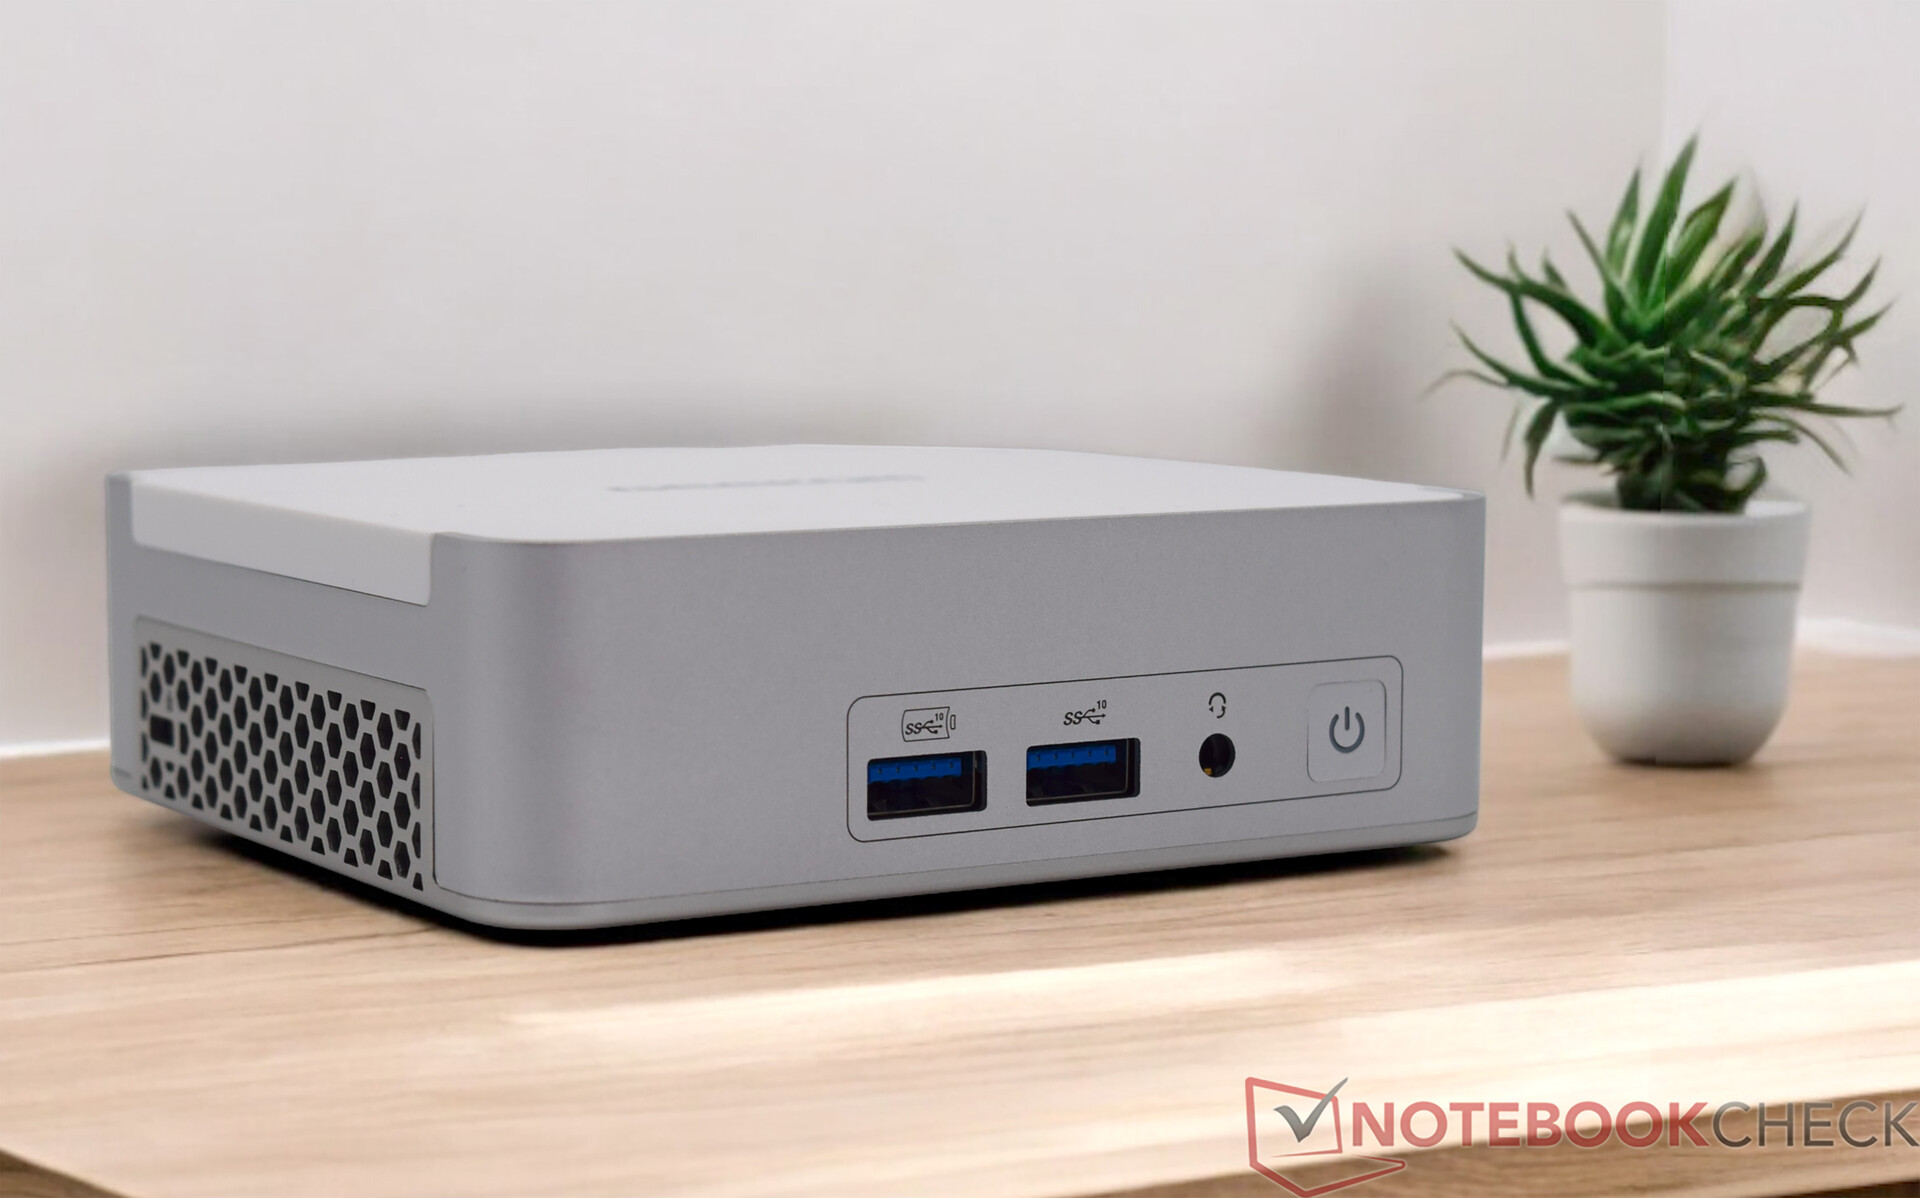
Gehäuse - Perfekte Verarbeitung von Metall und Kunststoff
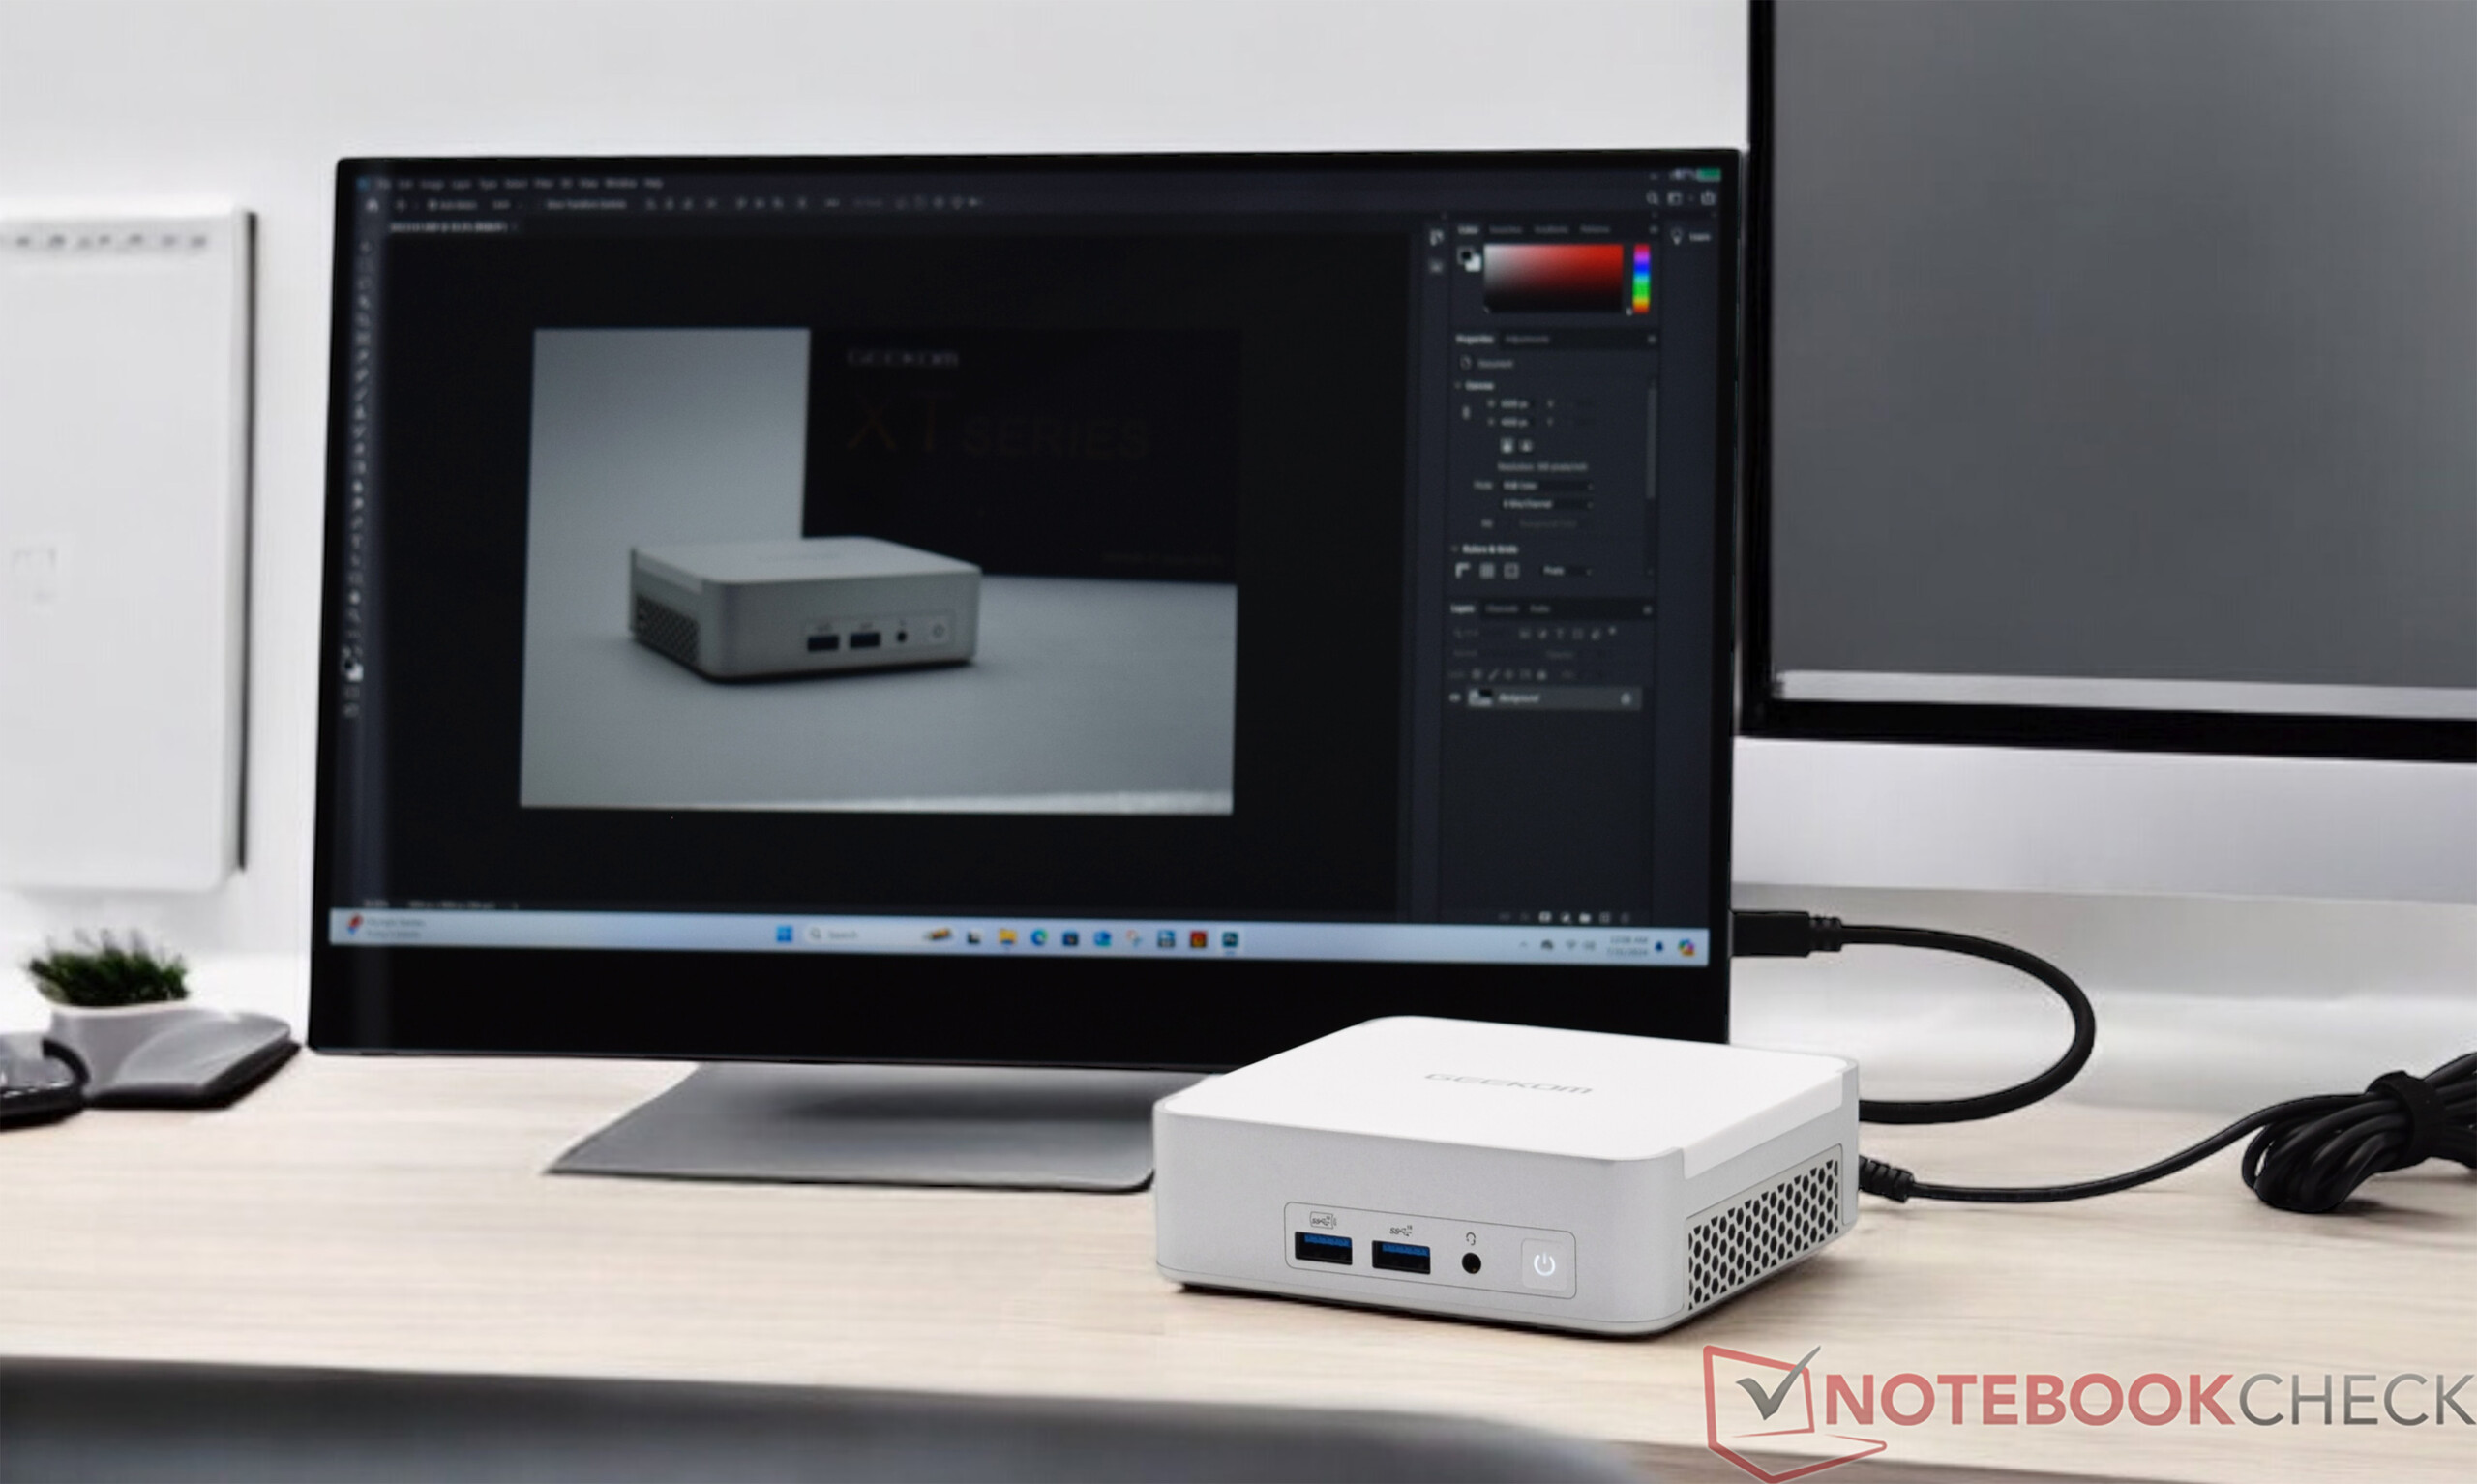
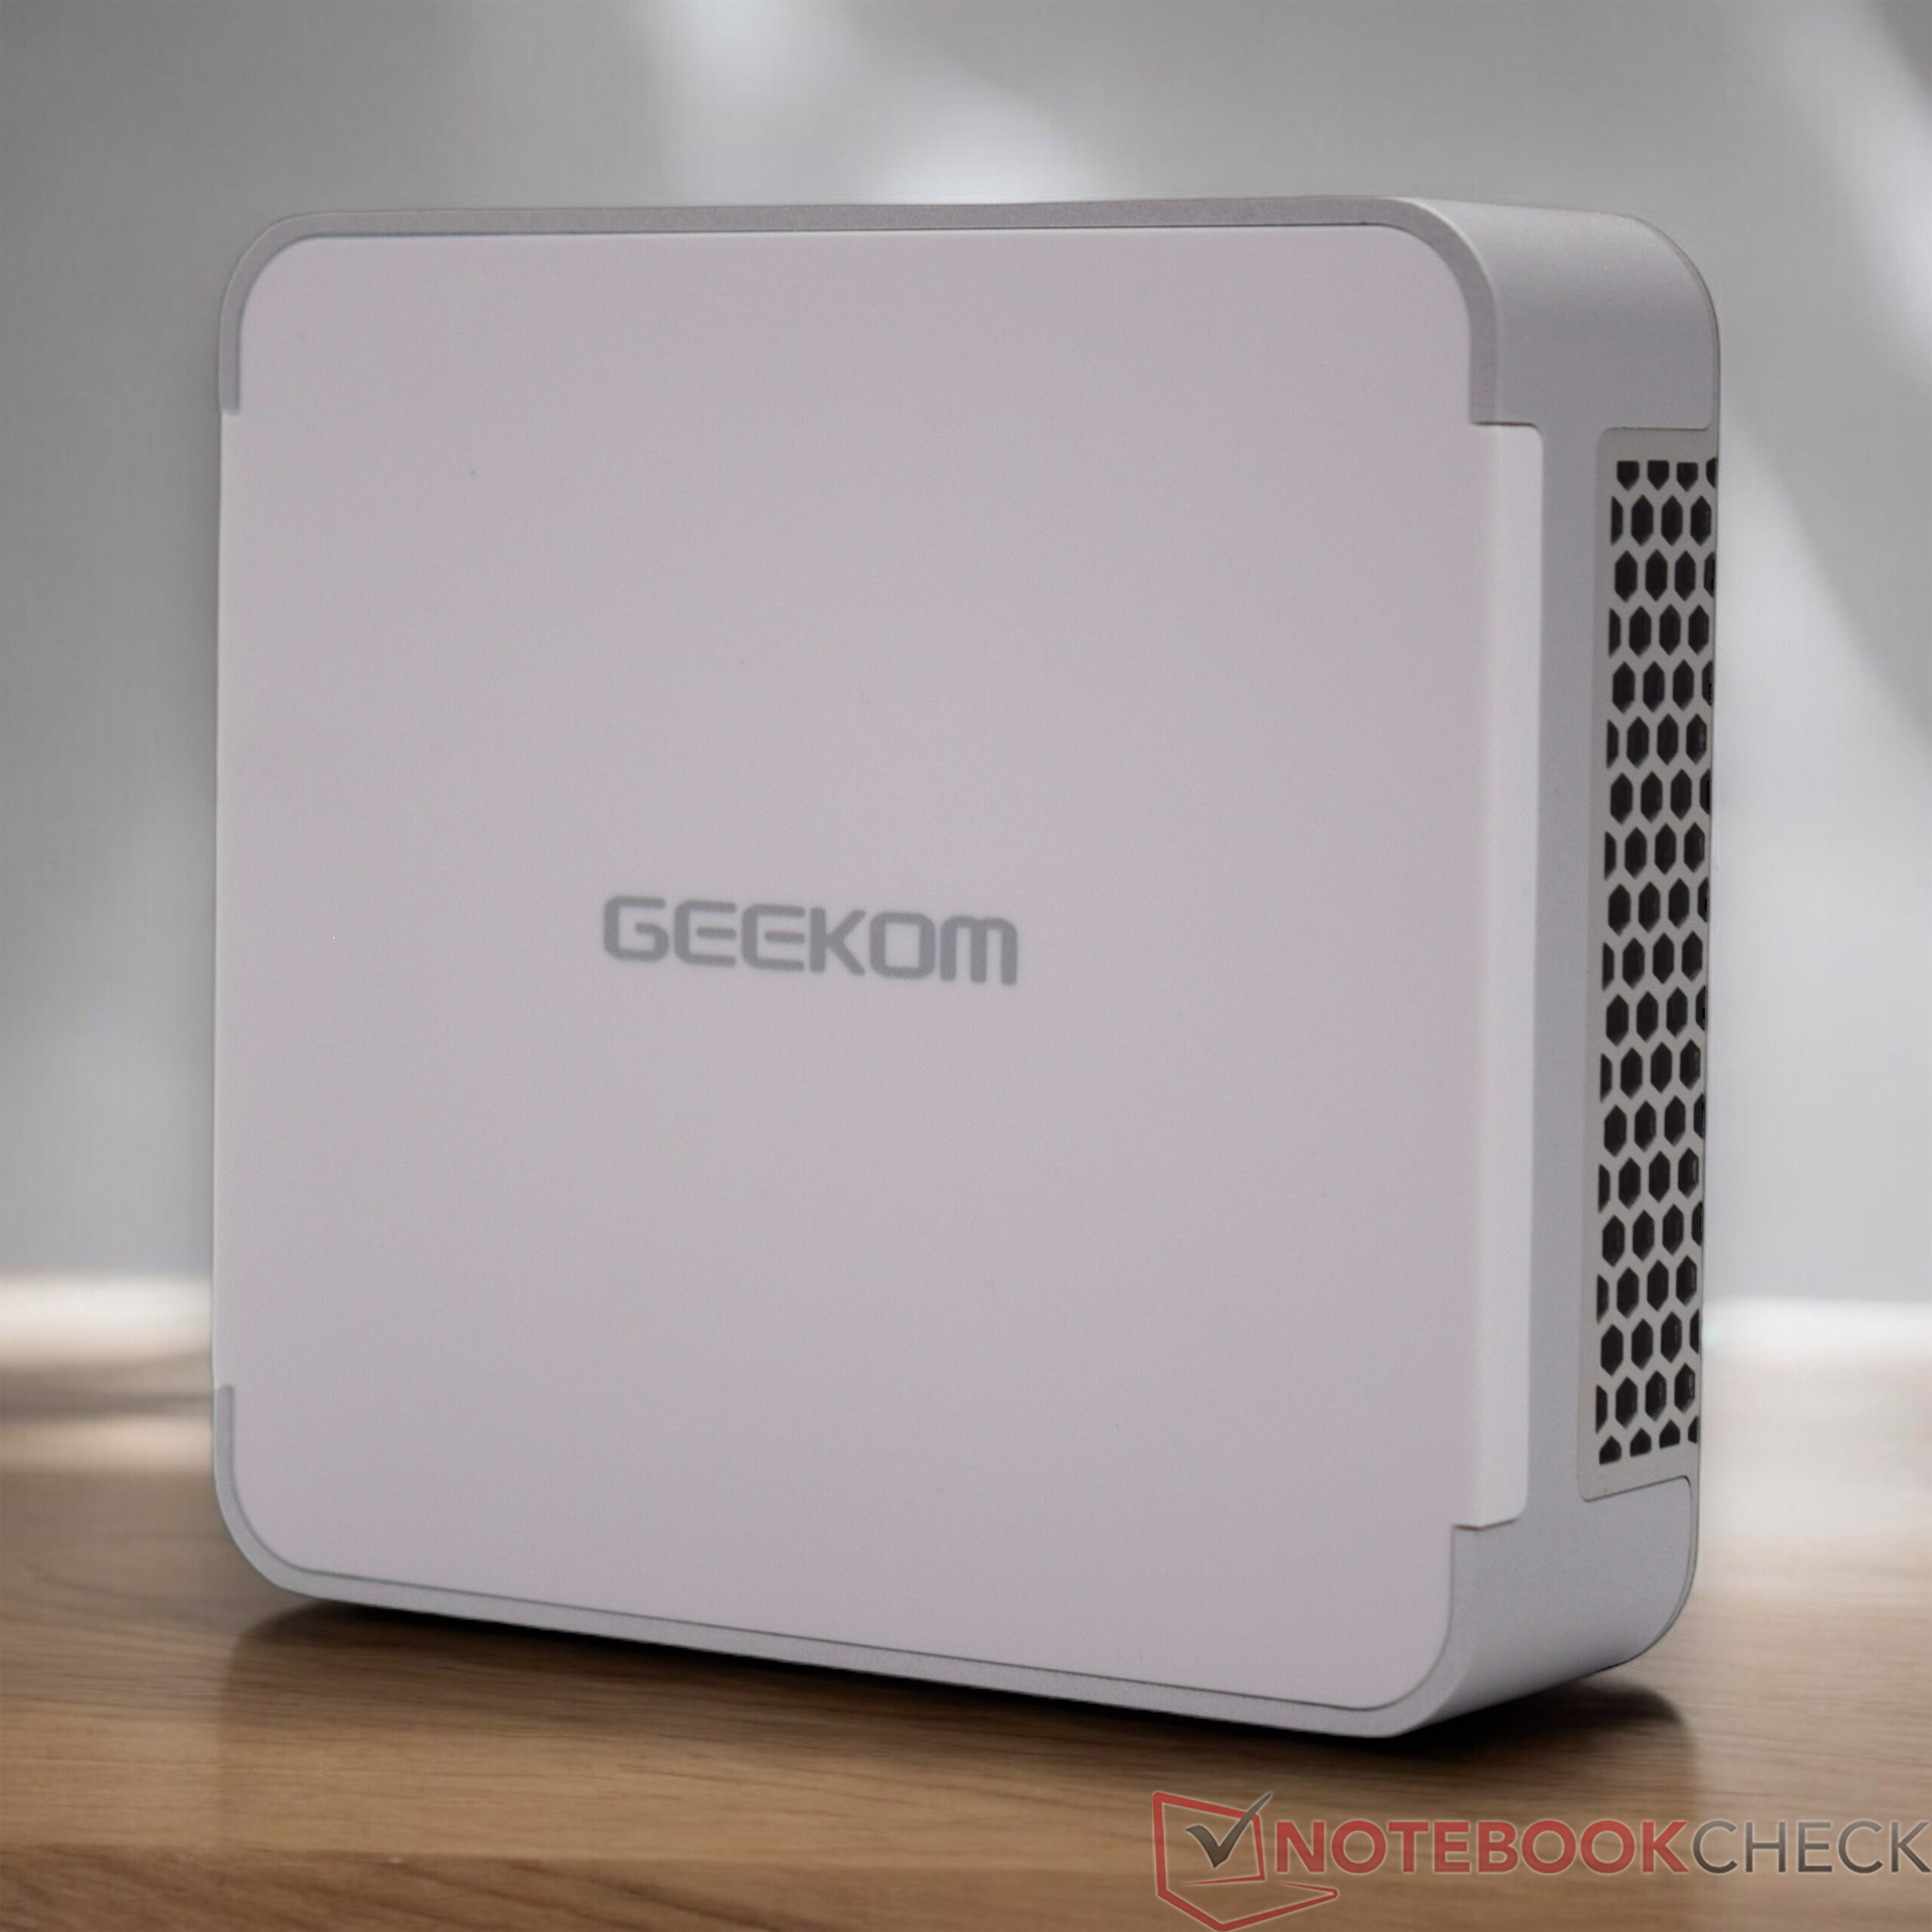
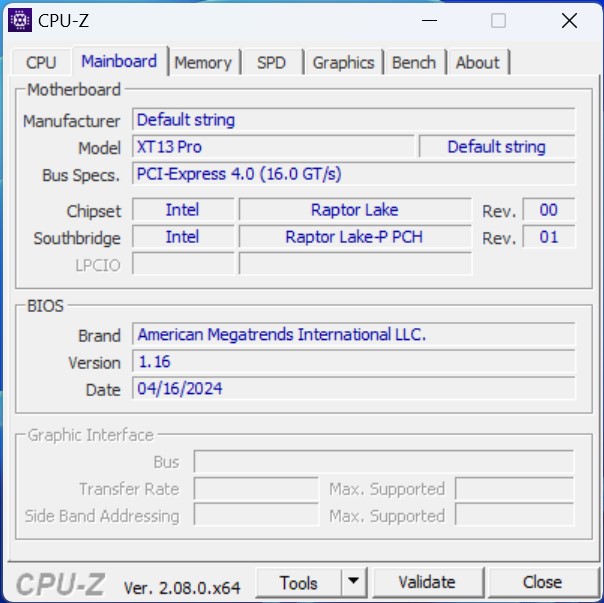
Das Gehäuse des Geekom XT13 Pro ist bekannt, es wurde beim Geekom XT12 Pro verwendet. Auch eine Ähnlichkeit mit dem Intel NUC 13 Pro Desk Edition Kit kann nicht abgestritten werden. Grundsätzlich gibt es an der Optik nichts auszusetzen. Unser Testsample ist wieder perfekt verarbeitet und alles passt wunderbar zusammen. Ein neues Gehäuse hätten wir uns dennoch gewünscht, um sich etwas mehr von der internen Konkurrenz abzugrenzen. Nur 11,7 x 11,2 Zentimeter benötigt der Mini-PC auf dem Schreibtisch und gehört damit zu den kompakteren Geräten. Der Geekom XT13 Pro kann mit der mitgelieferten VESA-Halterung auch direkt an einem Monitor befestigt werden.
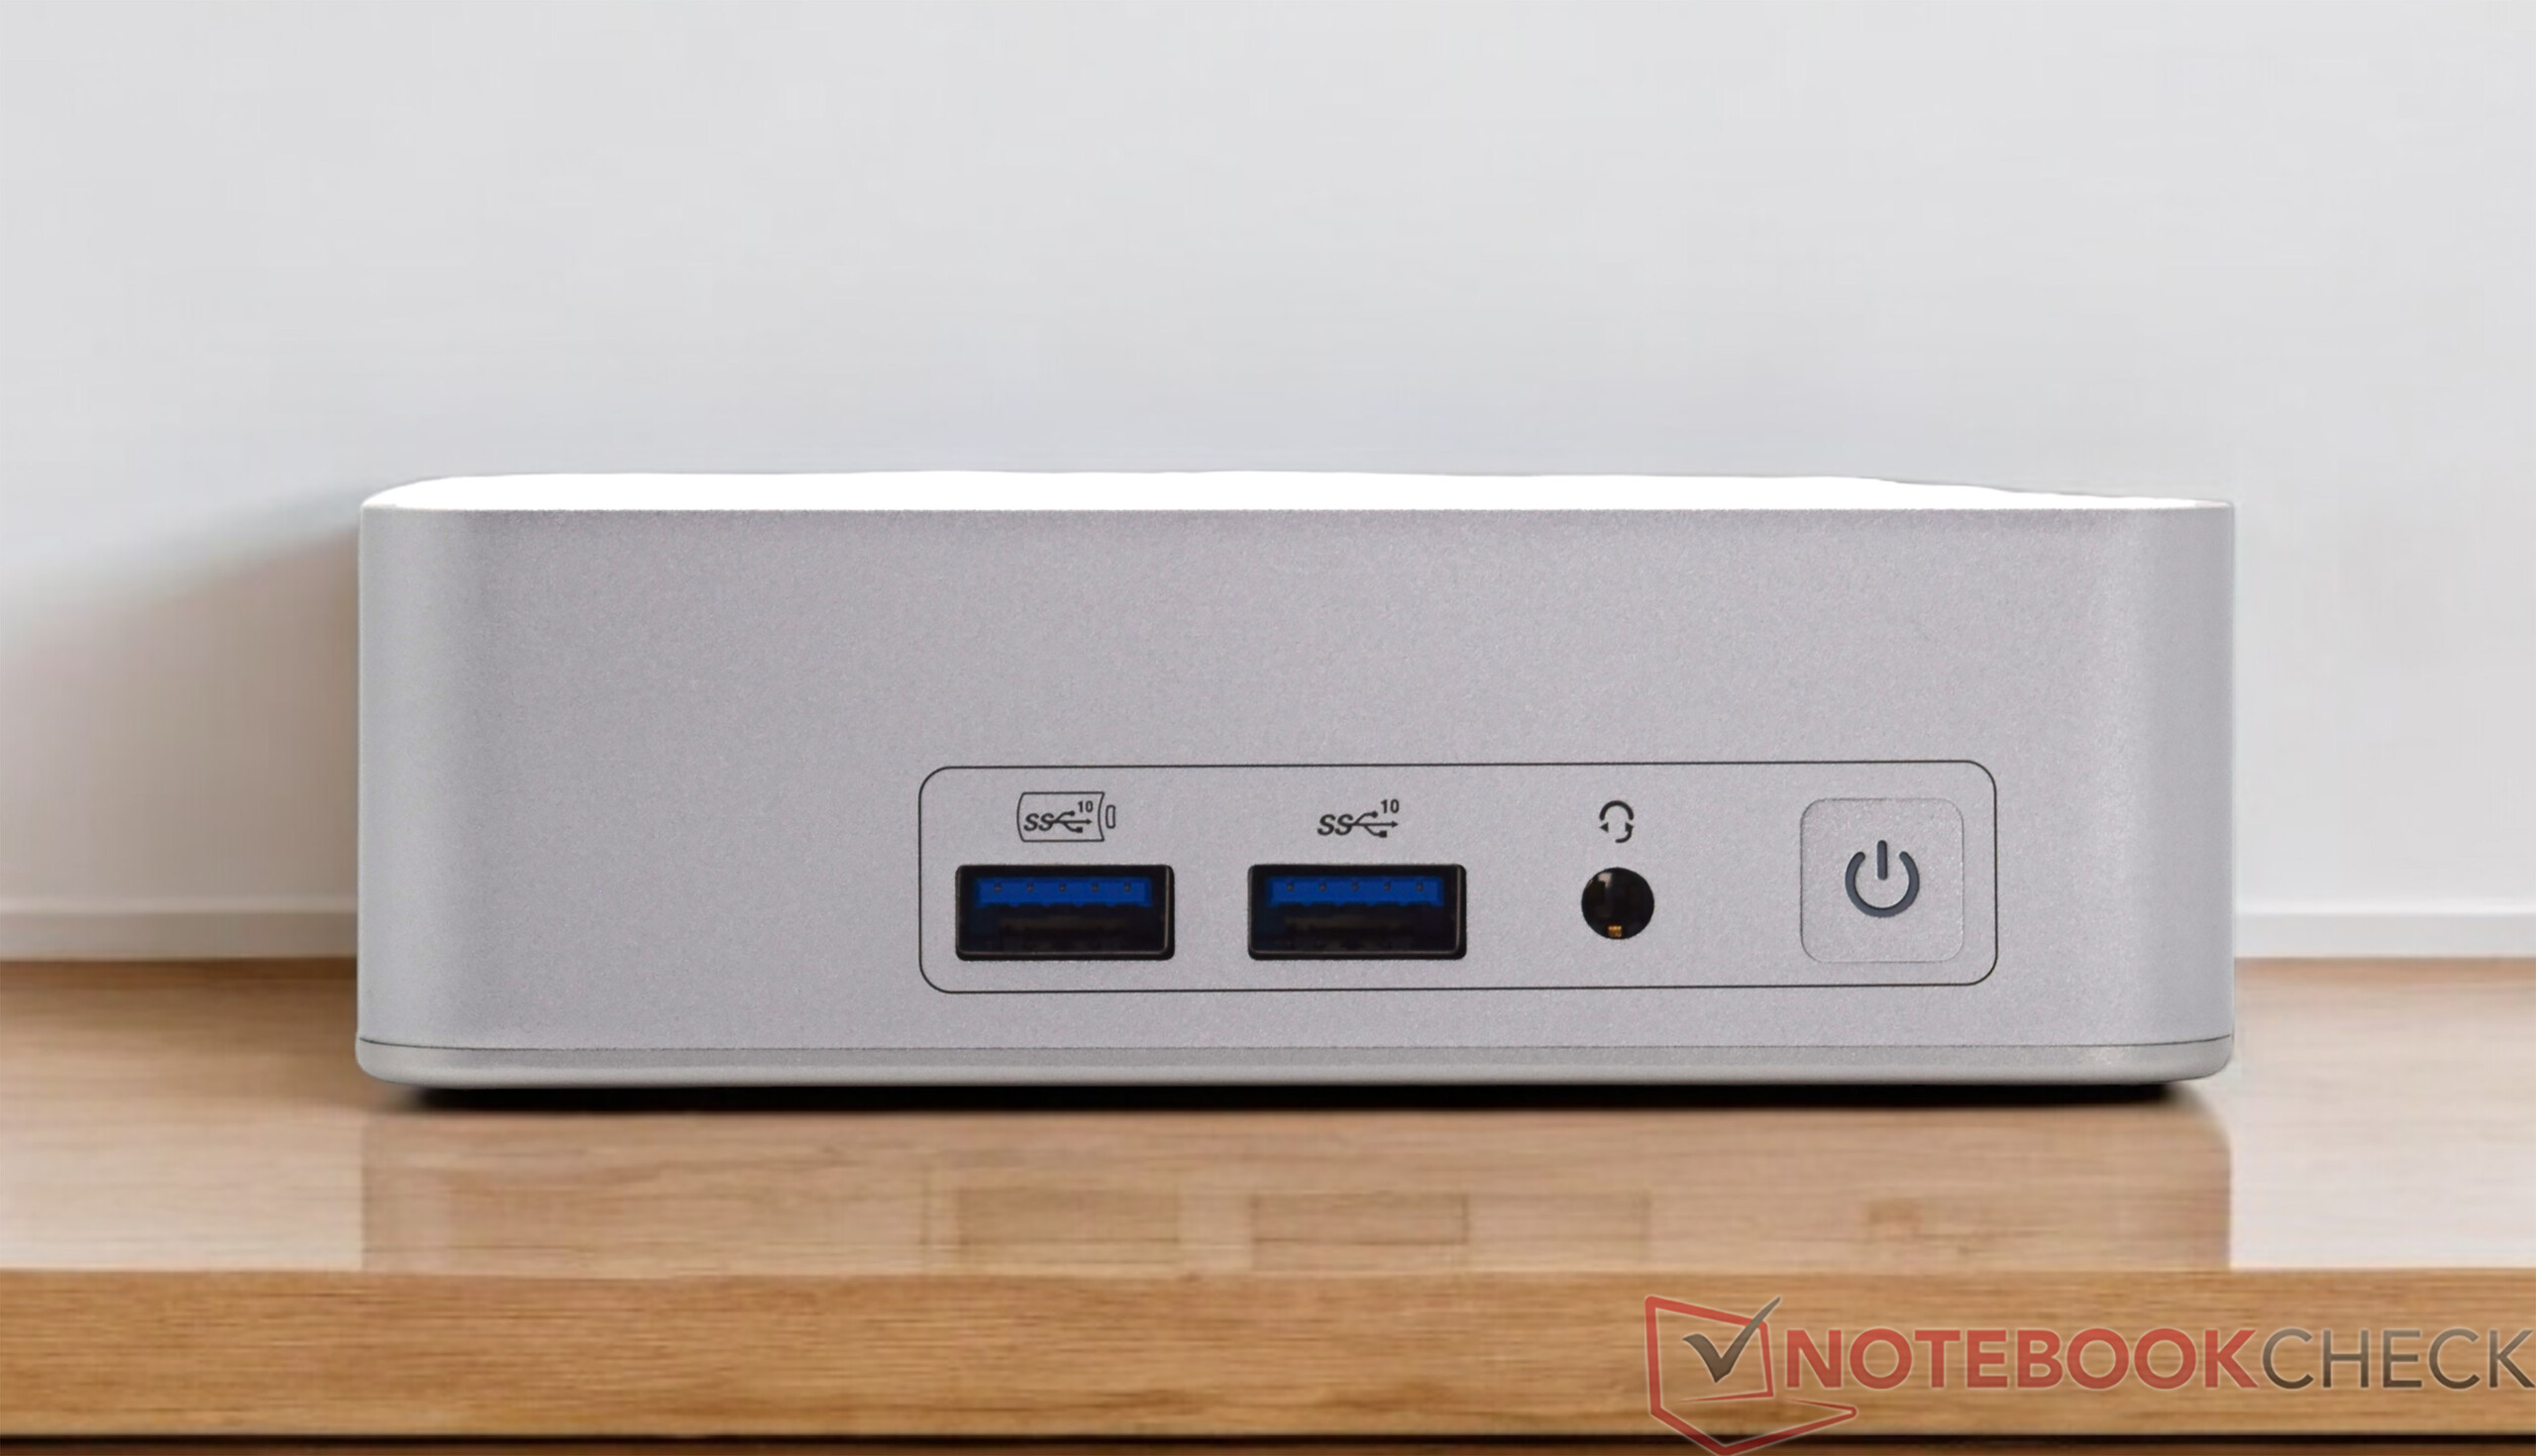
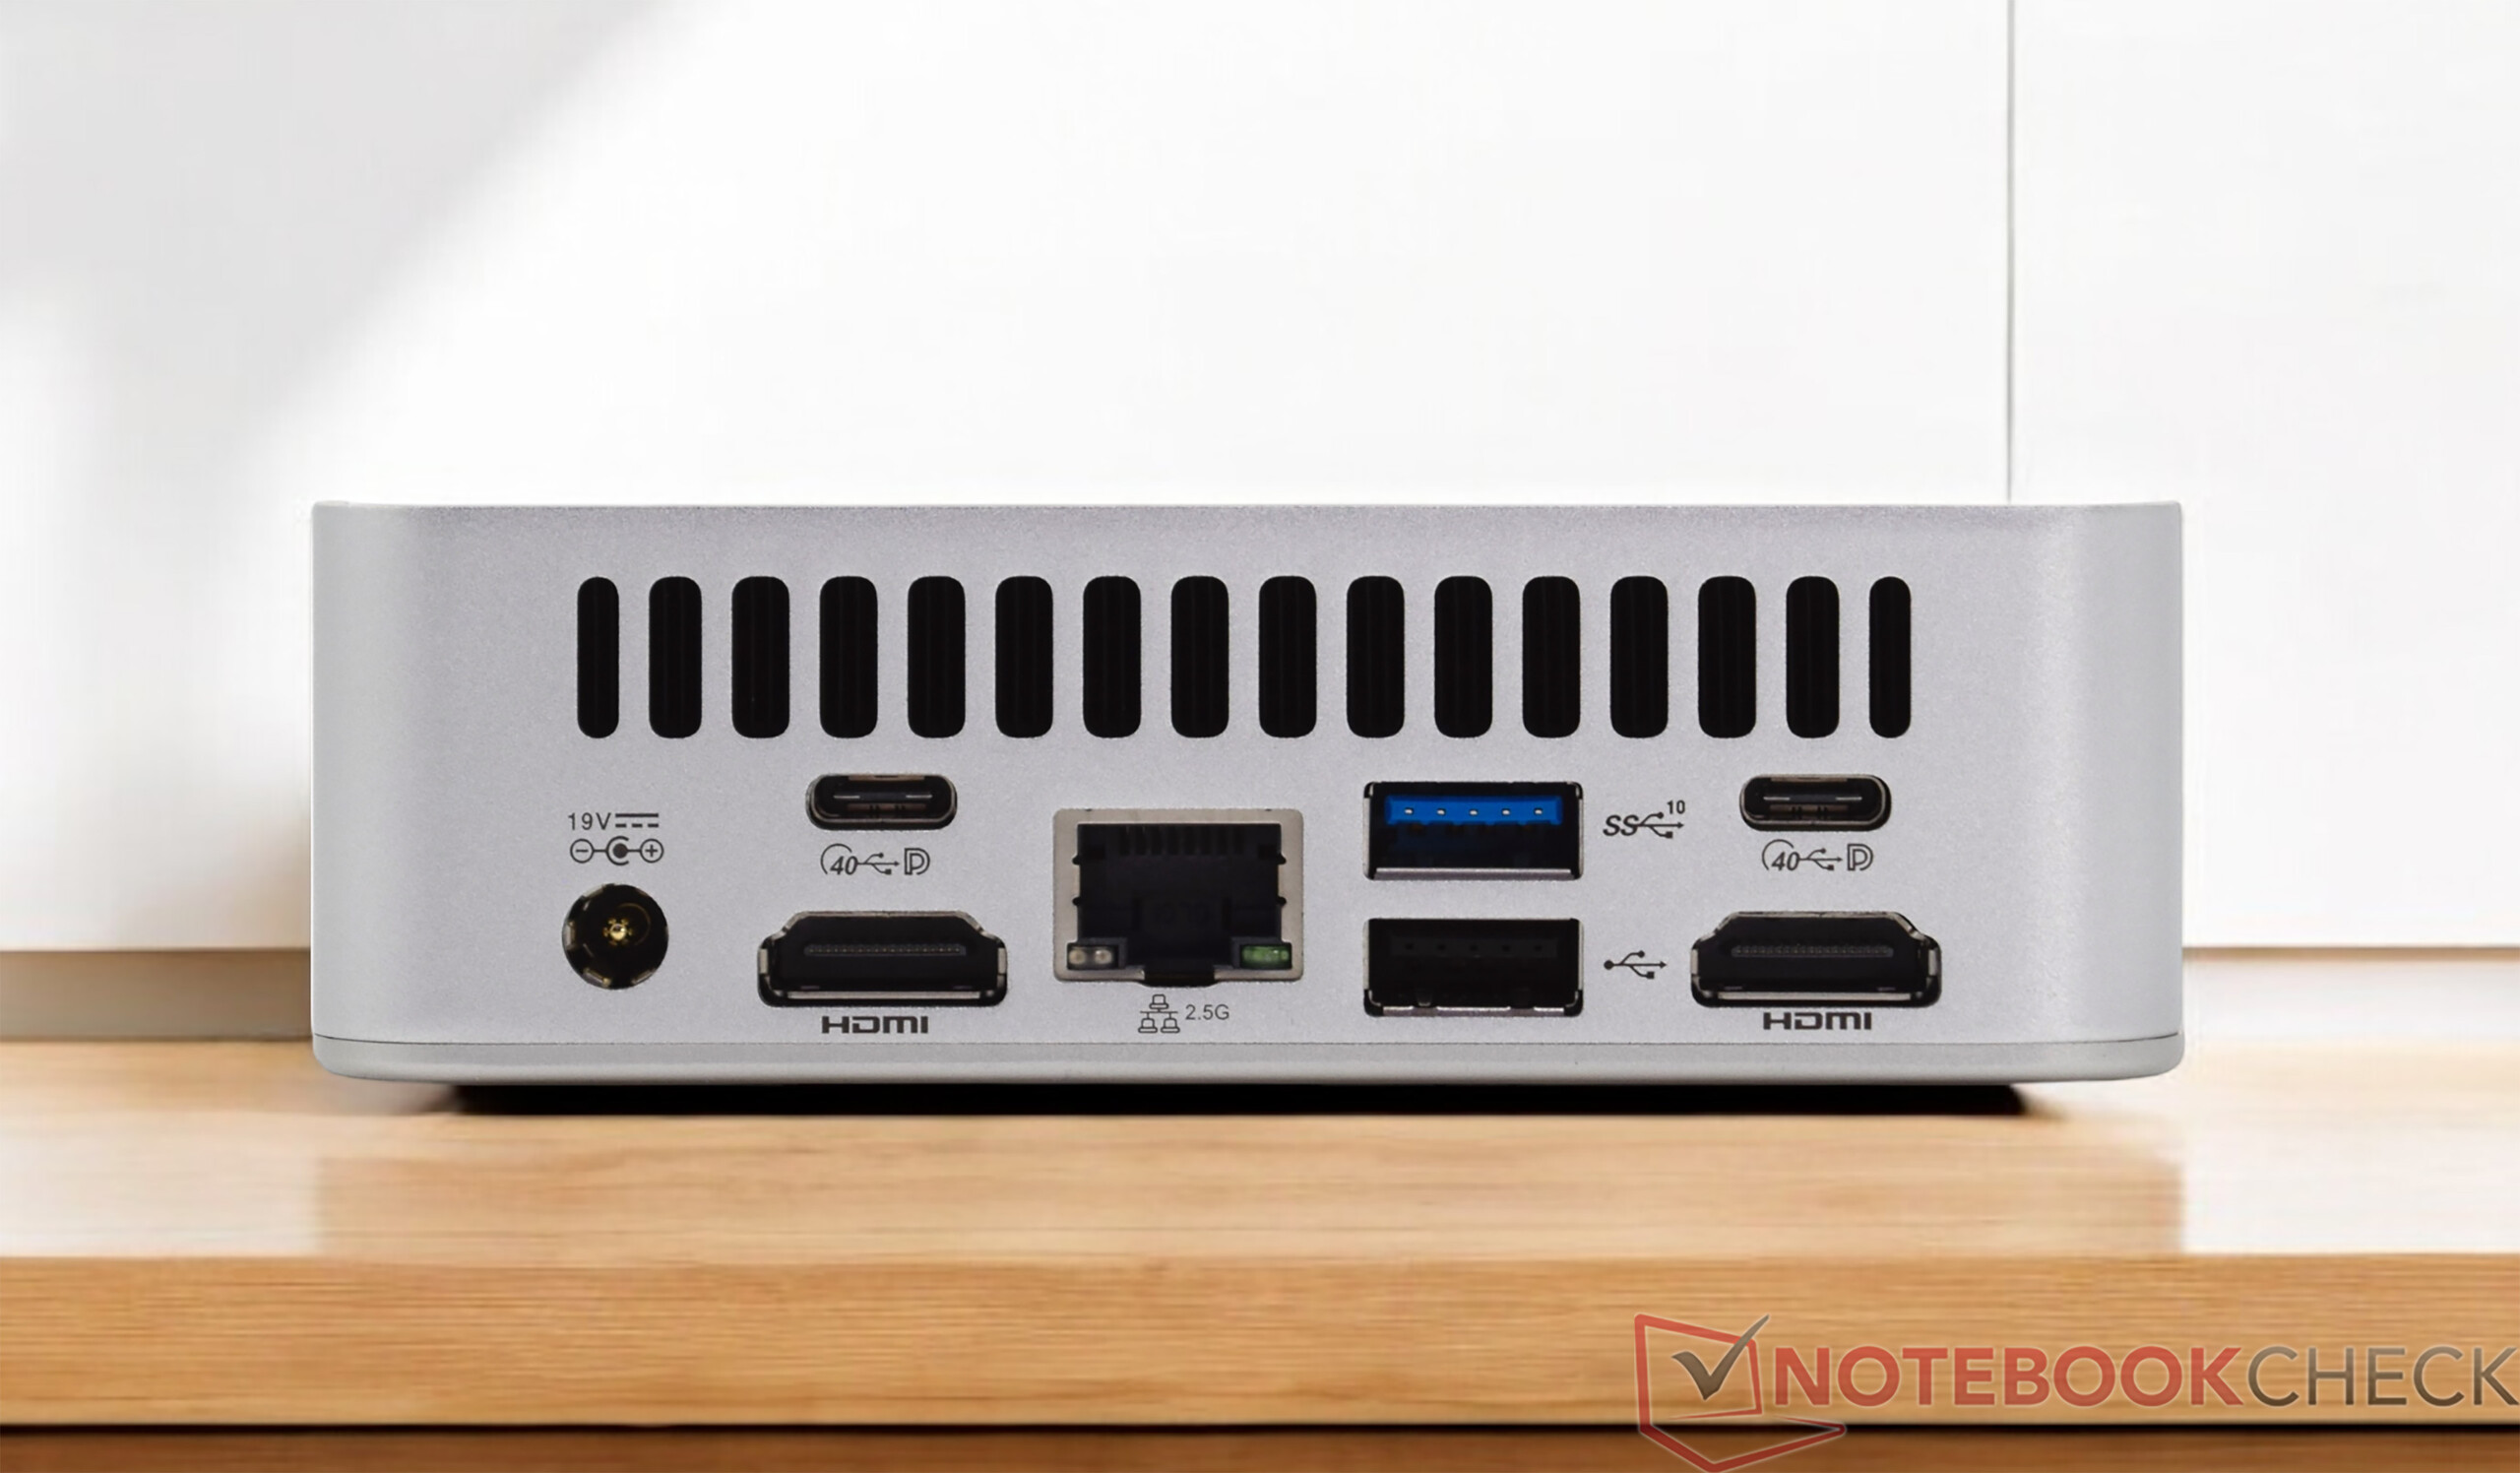
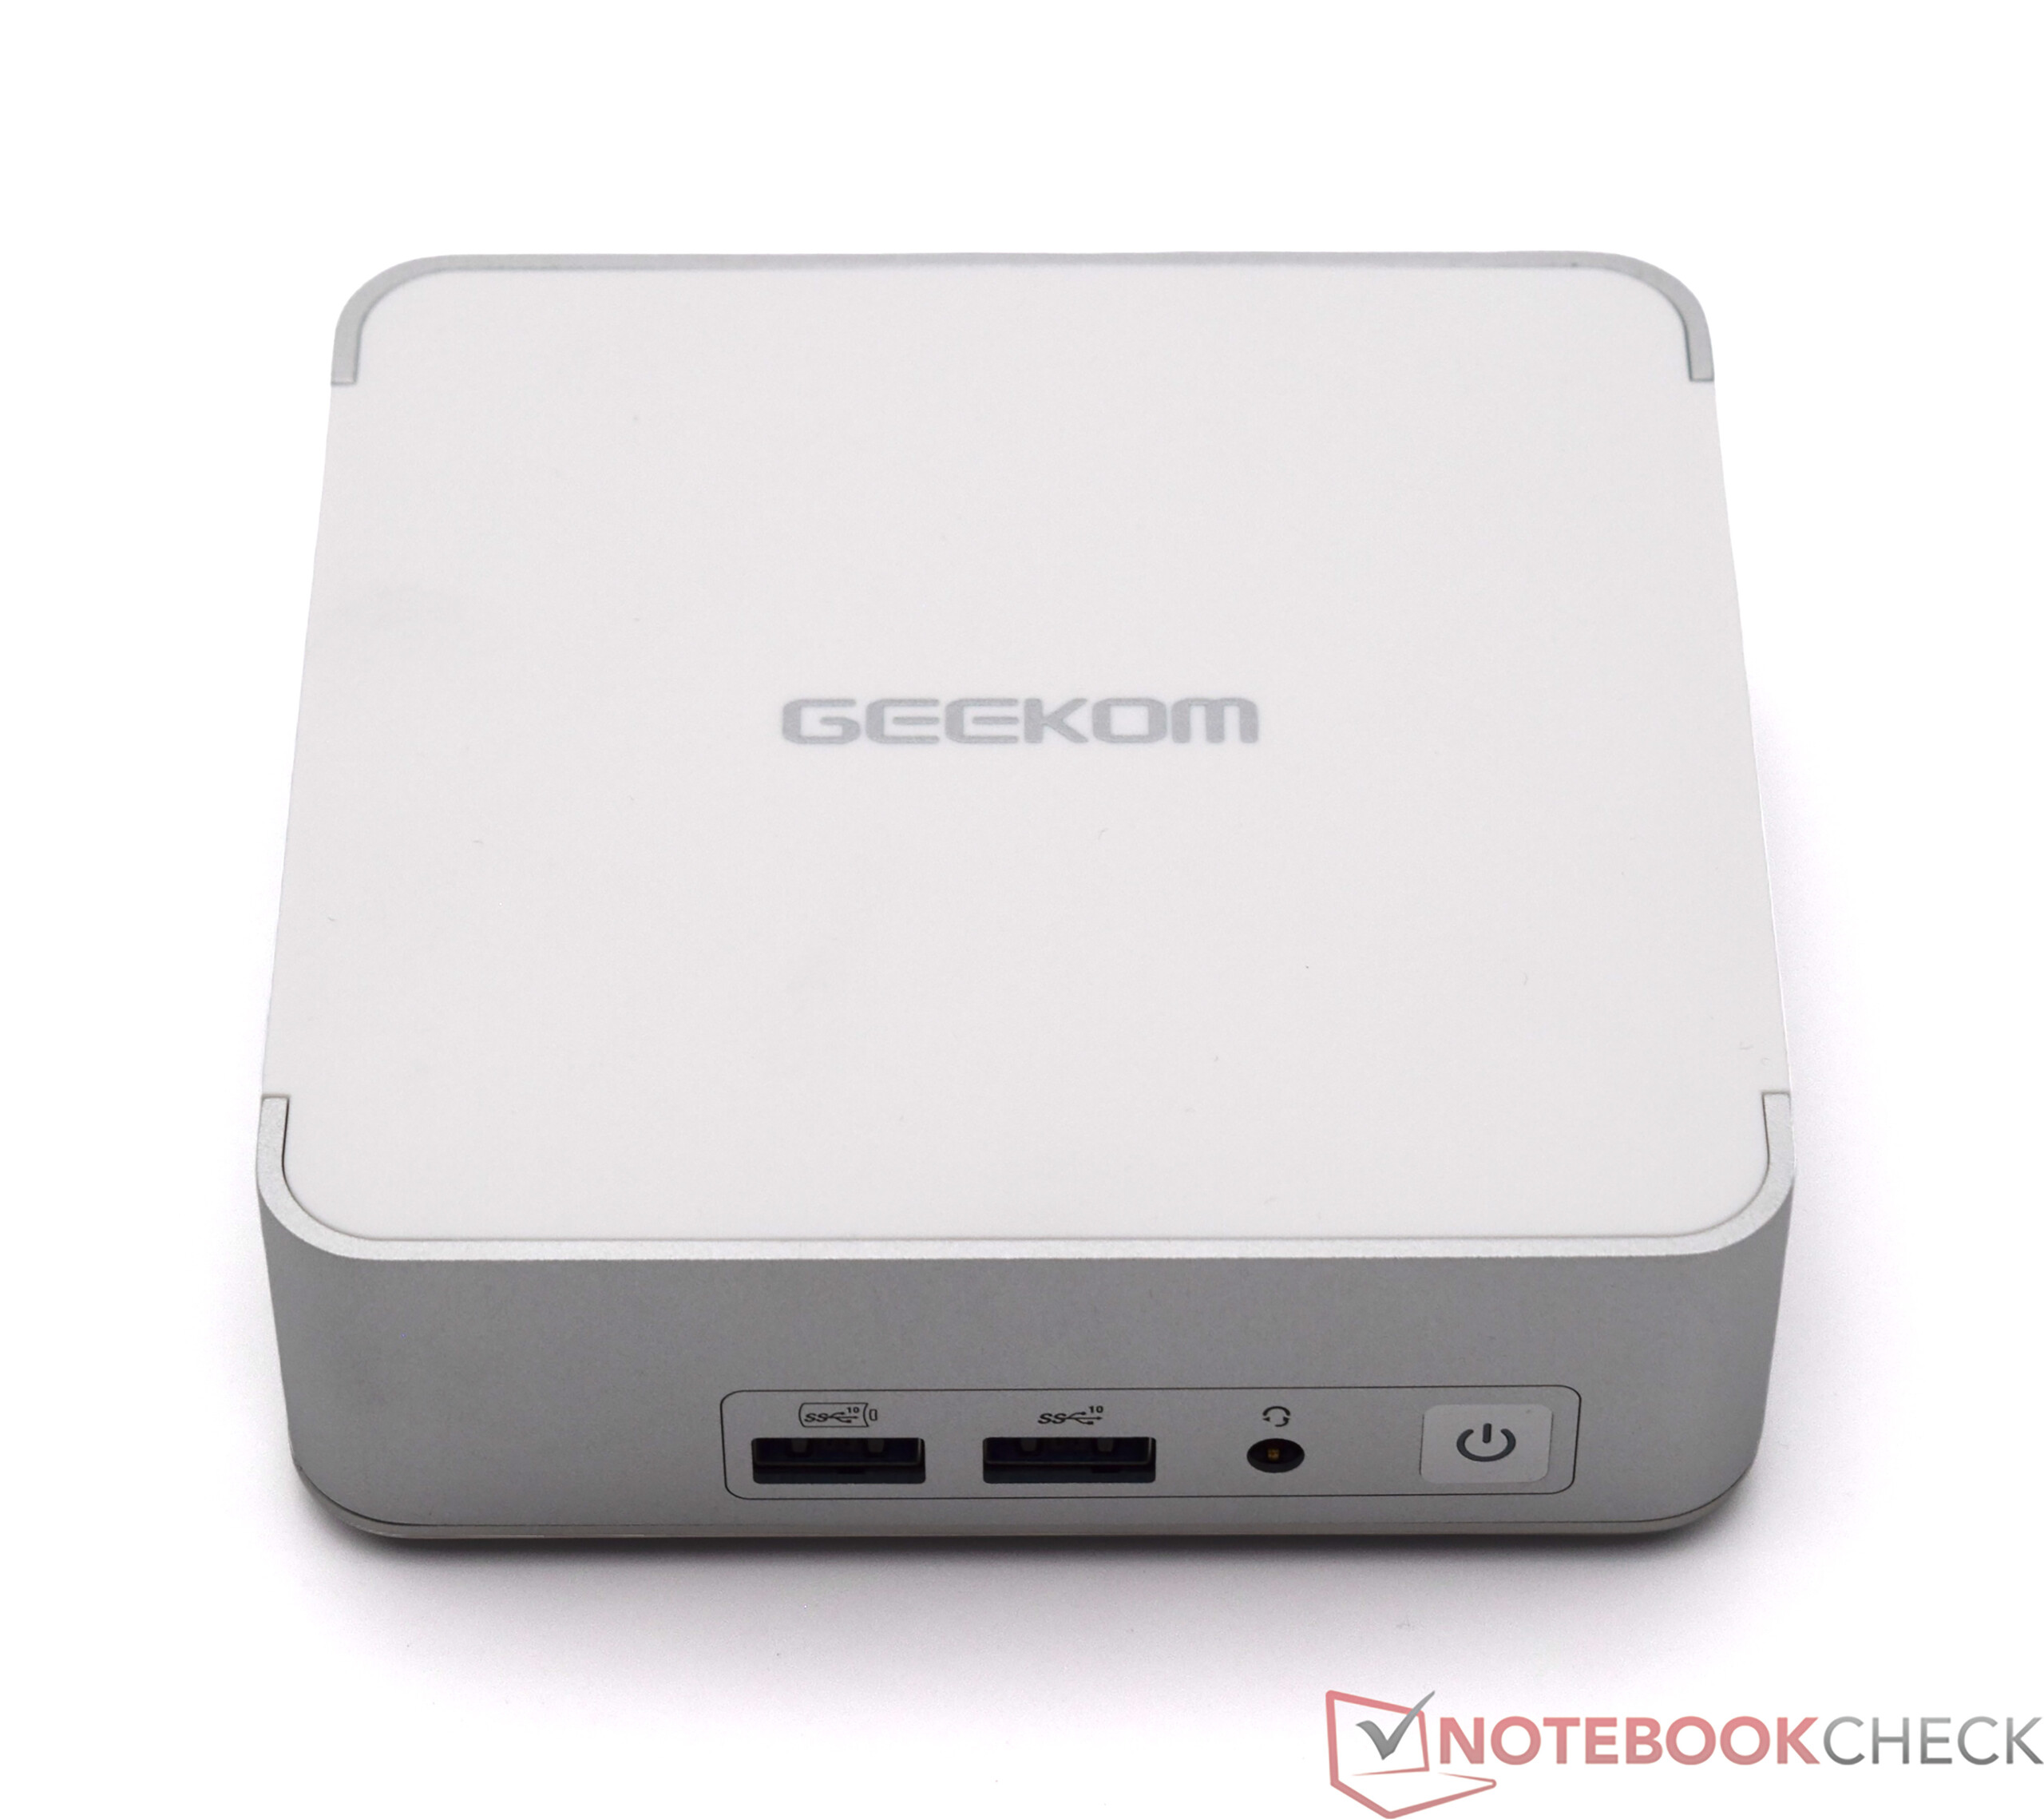
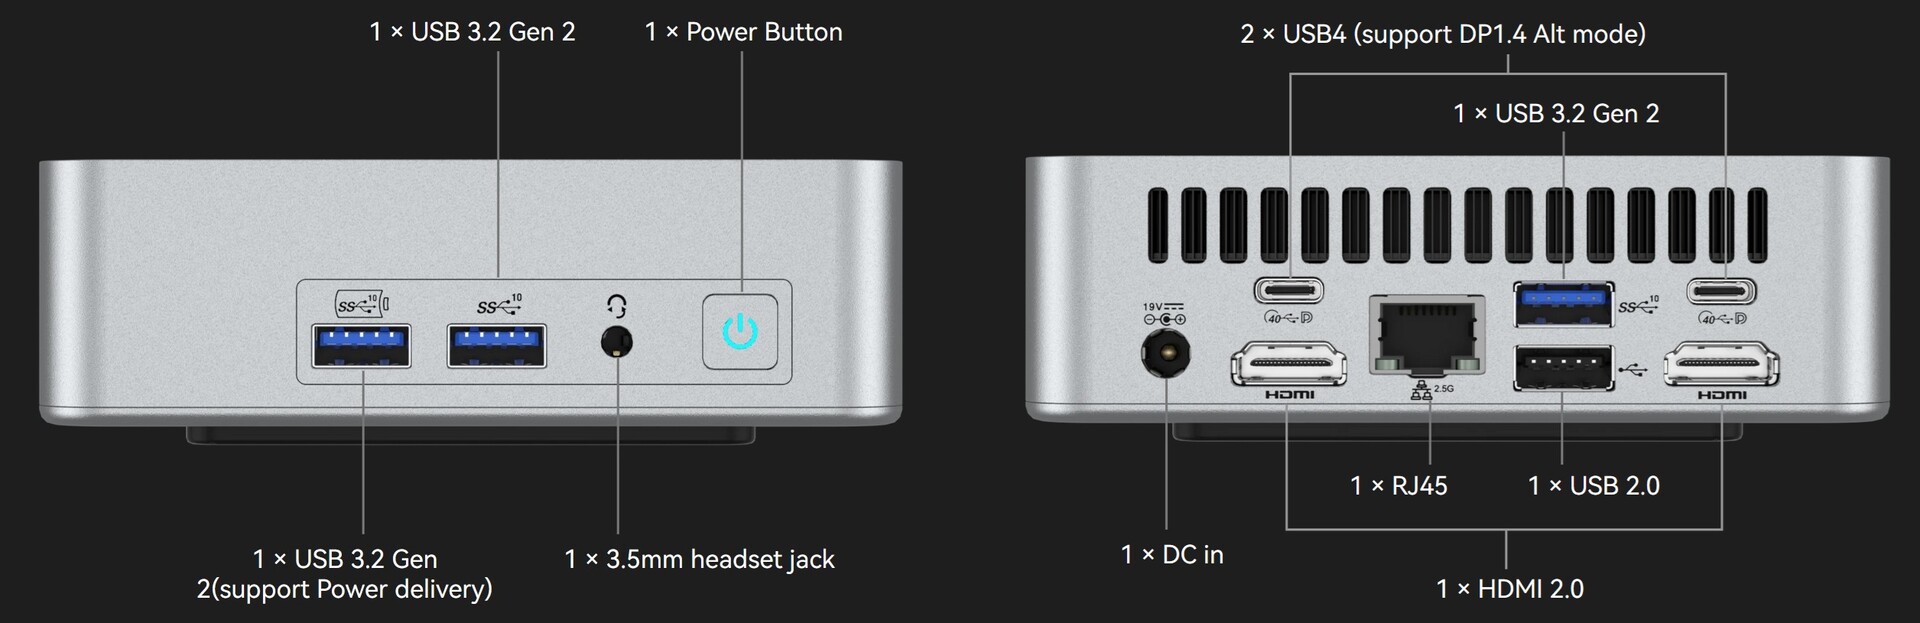
Ausstattung - Gute Auswahl und 2x USB4
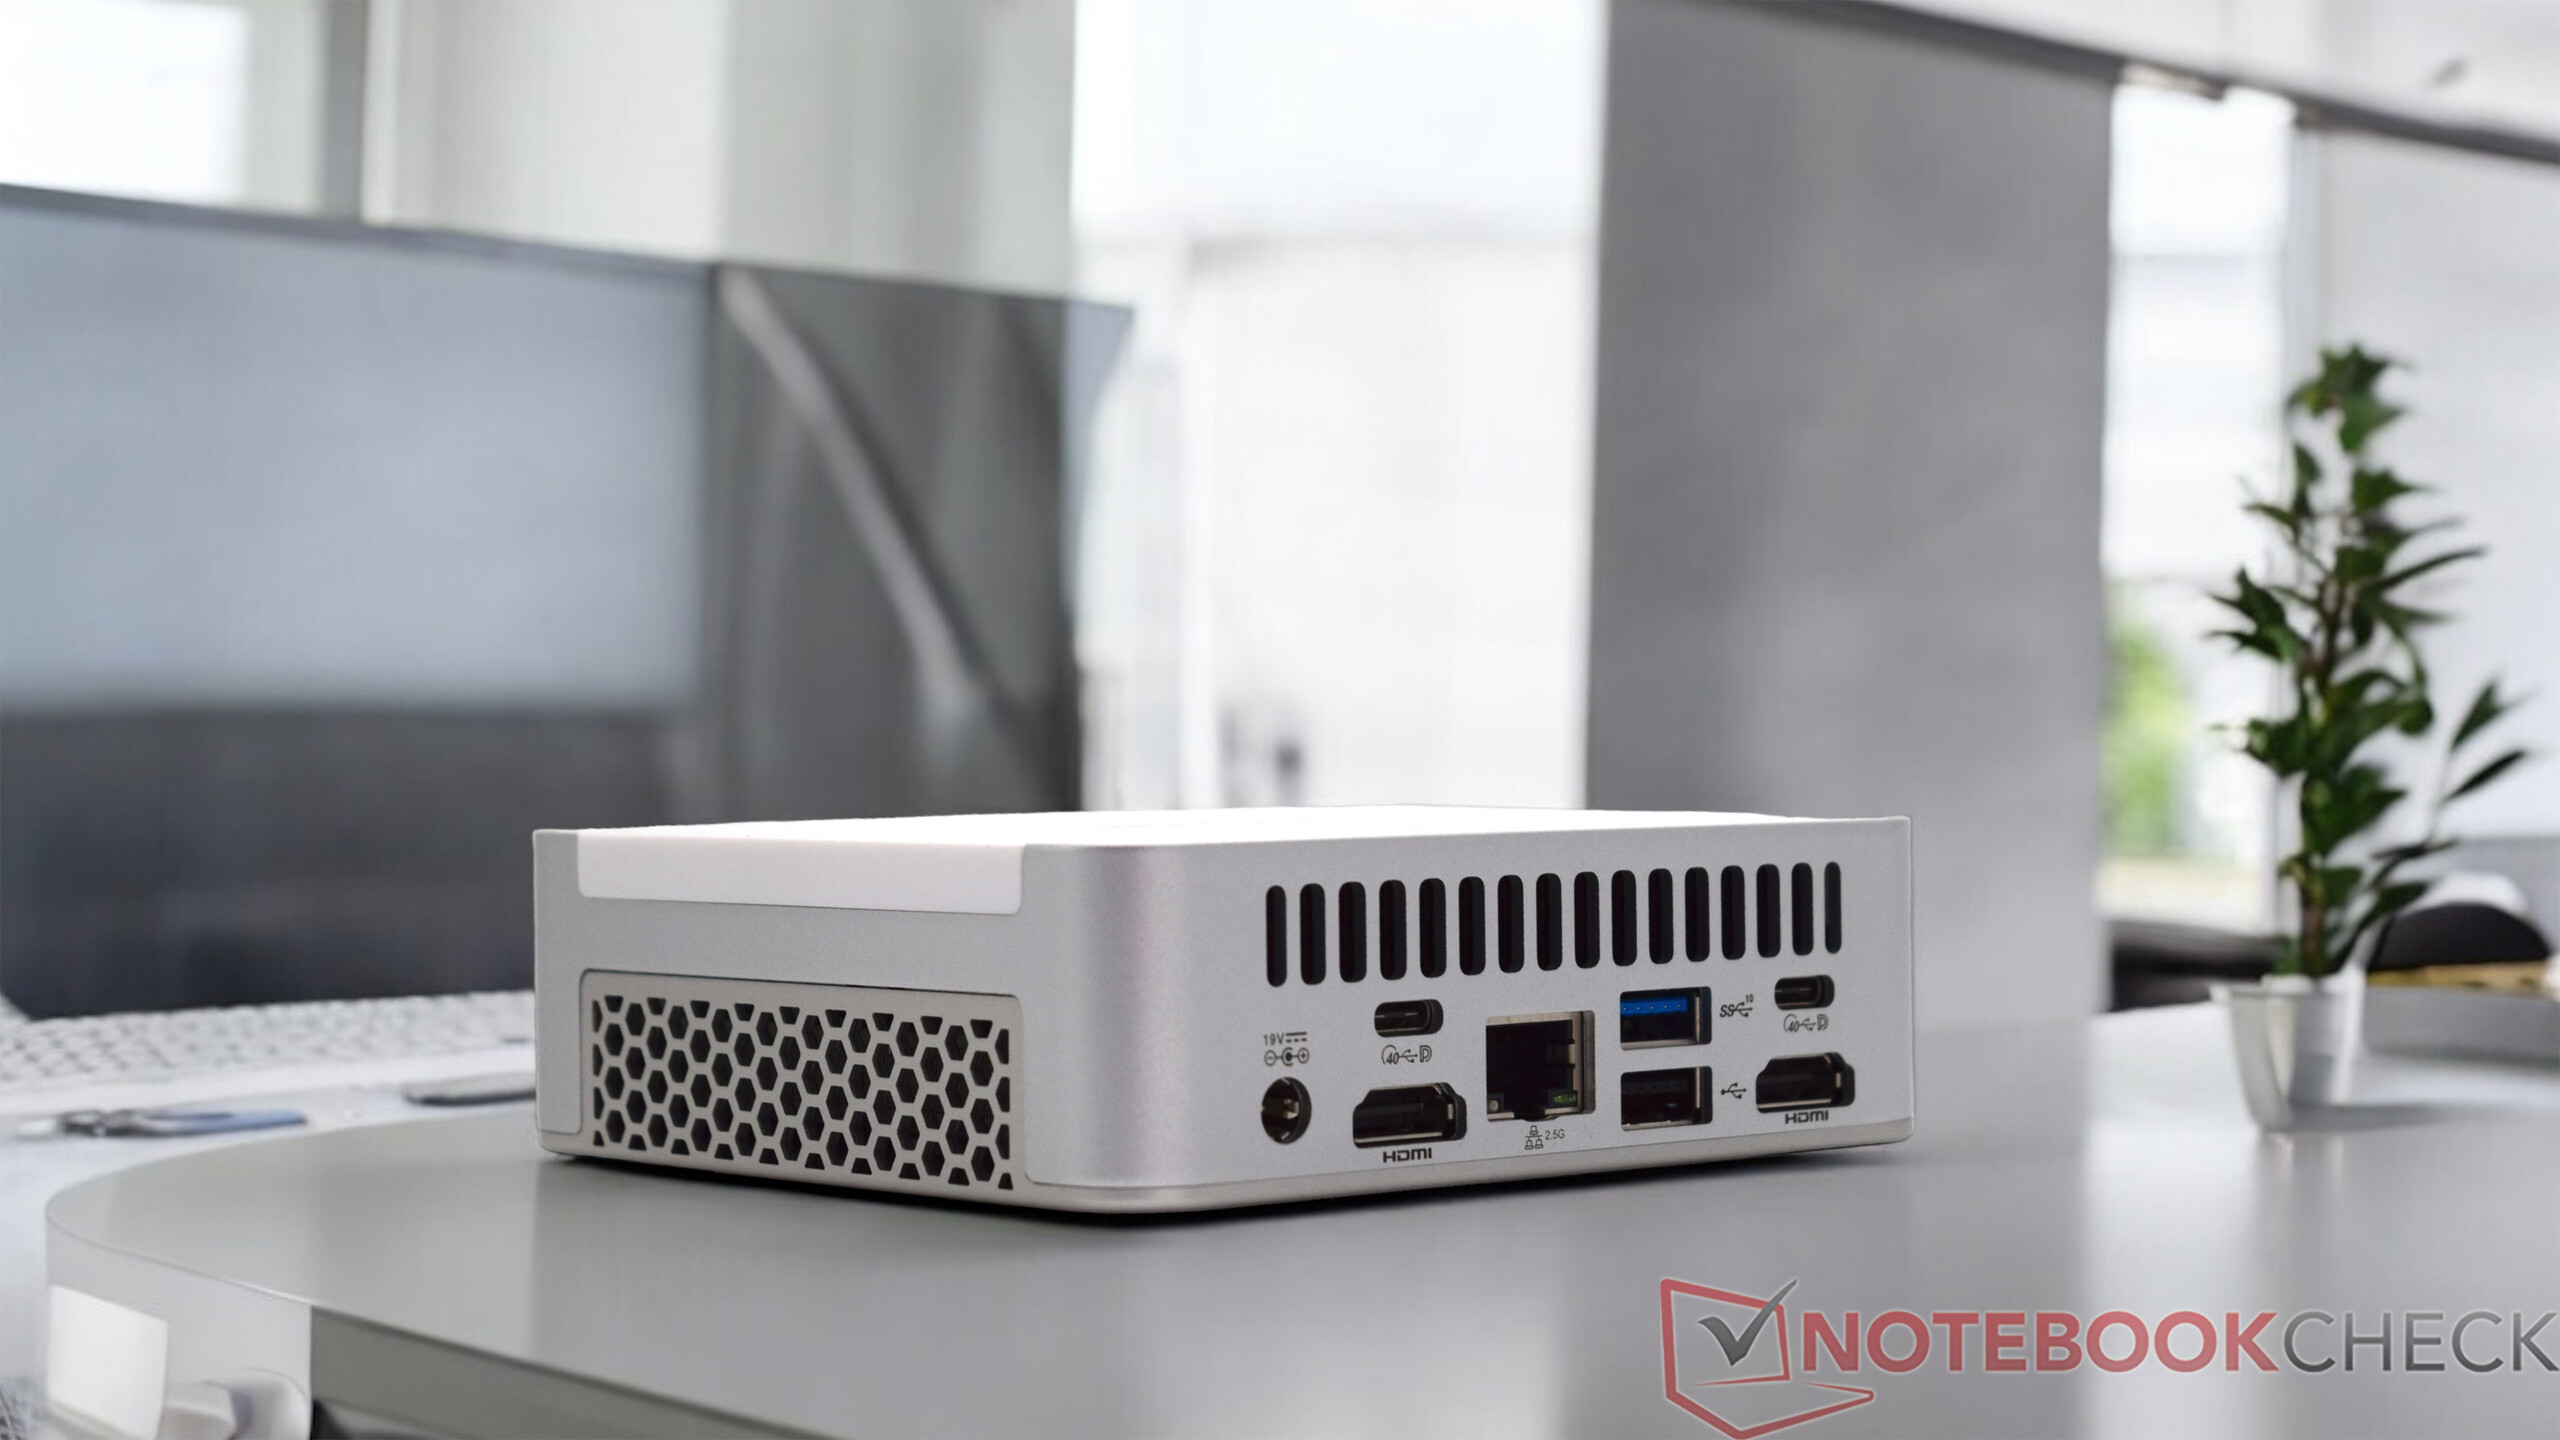
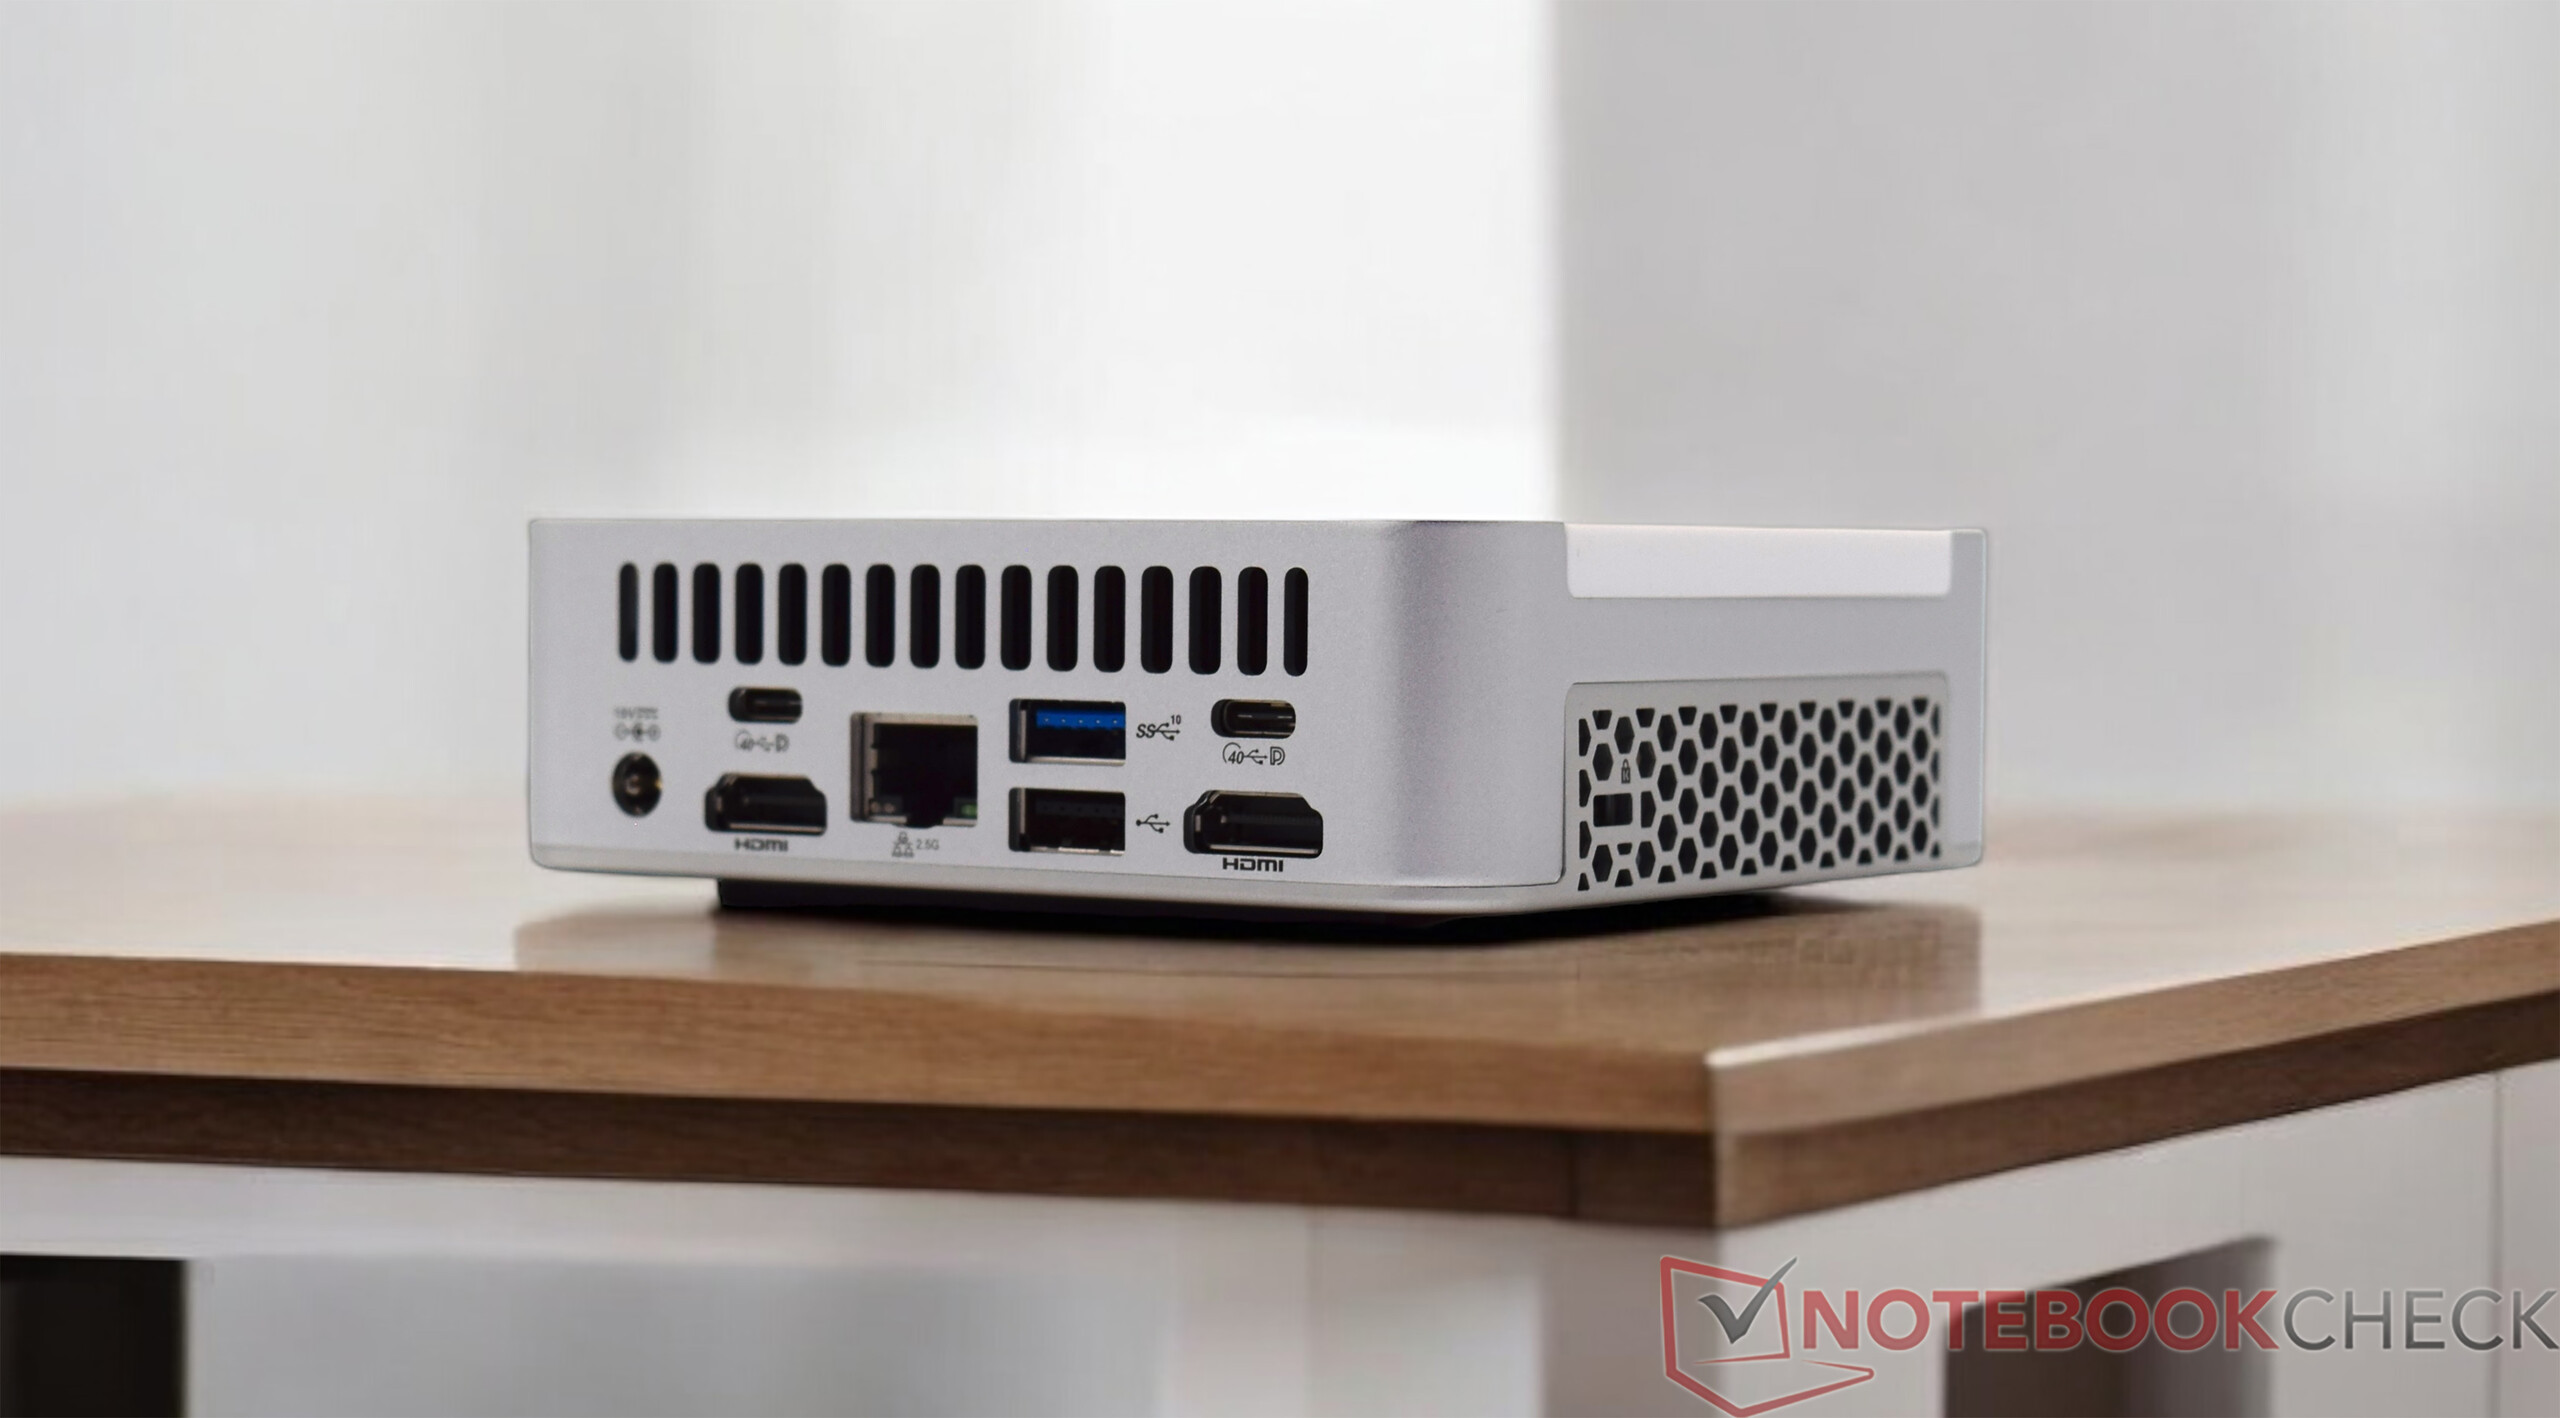
Bei den externen Schnittstellen verfügt der Geekom XT13 Pro über die gleichen Optionen wie der Geekom XT12 Pro. Obwohl das Gerät sehr kompakt gebaut ist, gibt es viele verschiedene Anschlüsse. Bei den beiden USB-C-Buchsen auf der Rückseite handelt es sich um moderne USB4-Ports, welche die Einsatzmöglichkeiten mit dem richtigen Zubehör enorm erweitern. Insgesamt lassen sich vier Bildschirme gleichzeitig betreiben und auch auf einen LAN-Anschluss muss nicht verzichtet werden.
Kommunikation
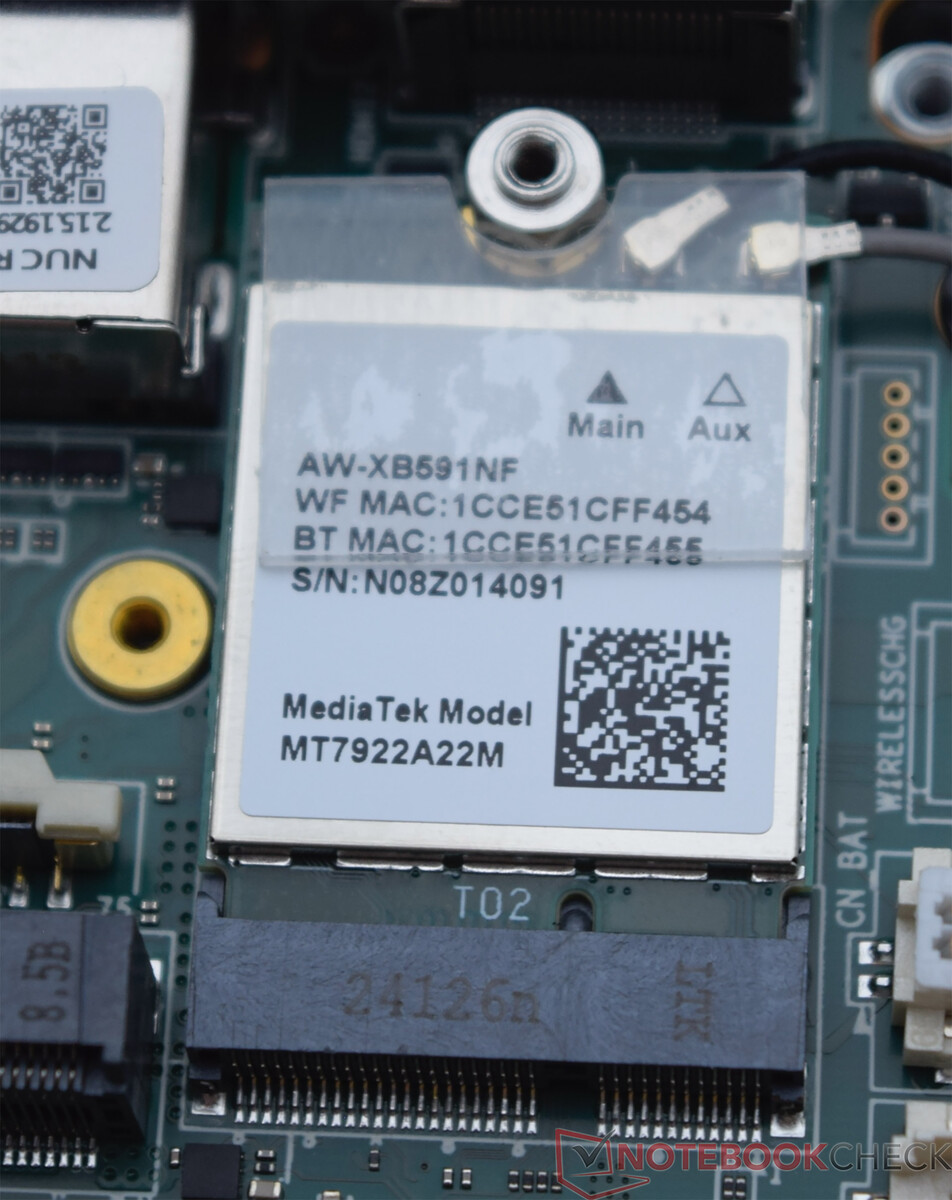
Im Geekom XT13 Pro werkelt ein bekanntes Funkmodul, welches Geekom in vielen seiner Geräte verbaut. Das MediaTek Wi-Fi 6E MT7922 WLAN-Modul kann in unserem Testgerät eine adäquate Leistung erbringen. Nach Möglichkeit sollte jedoch vorrangig der 6-GHz-Frequenzbereich verwendet werden. Alternativ kann auch die Kabelverbindung genutzt werden. Dann sind sogar Datenraten von bis zu 2,5 GBit/s möglich.
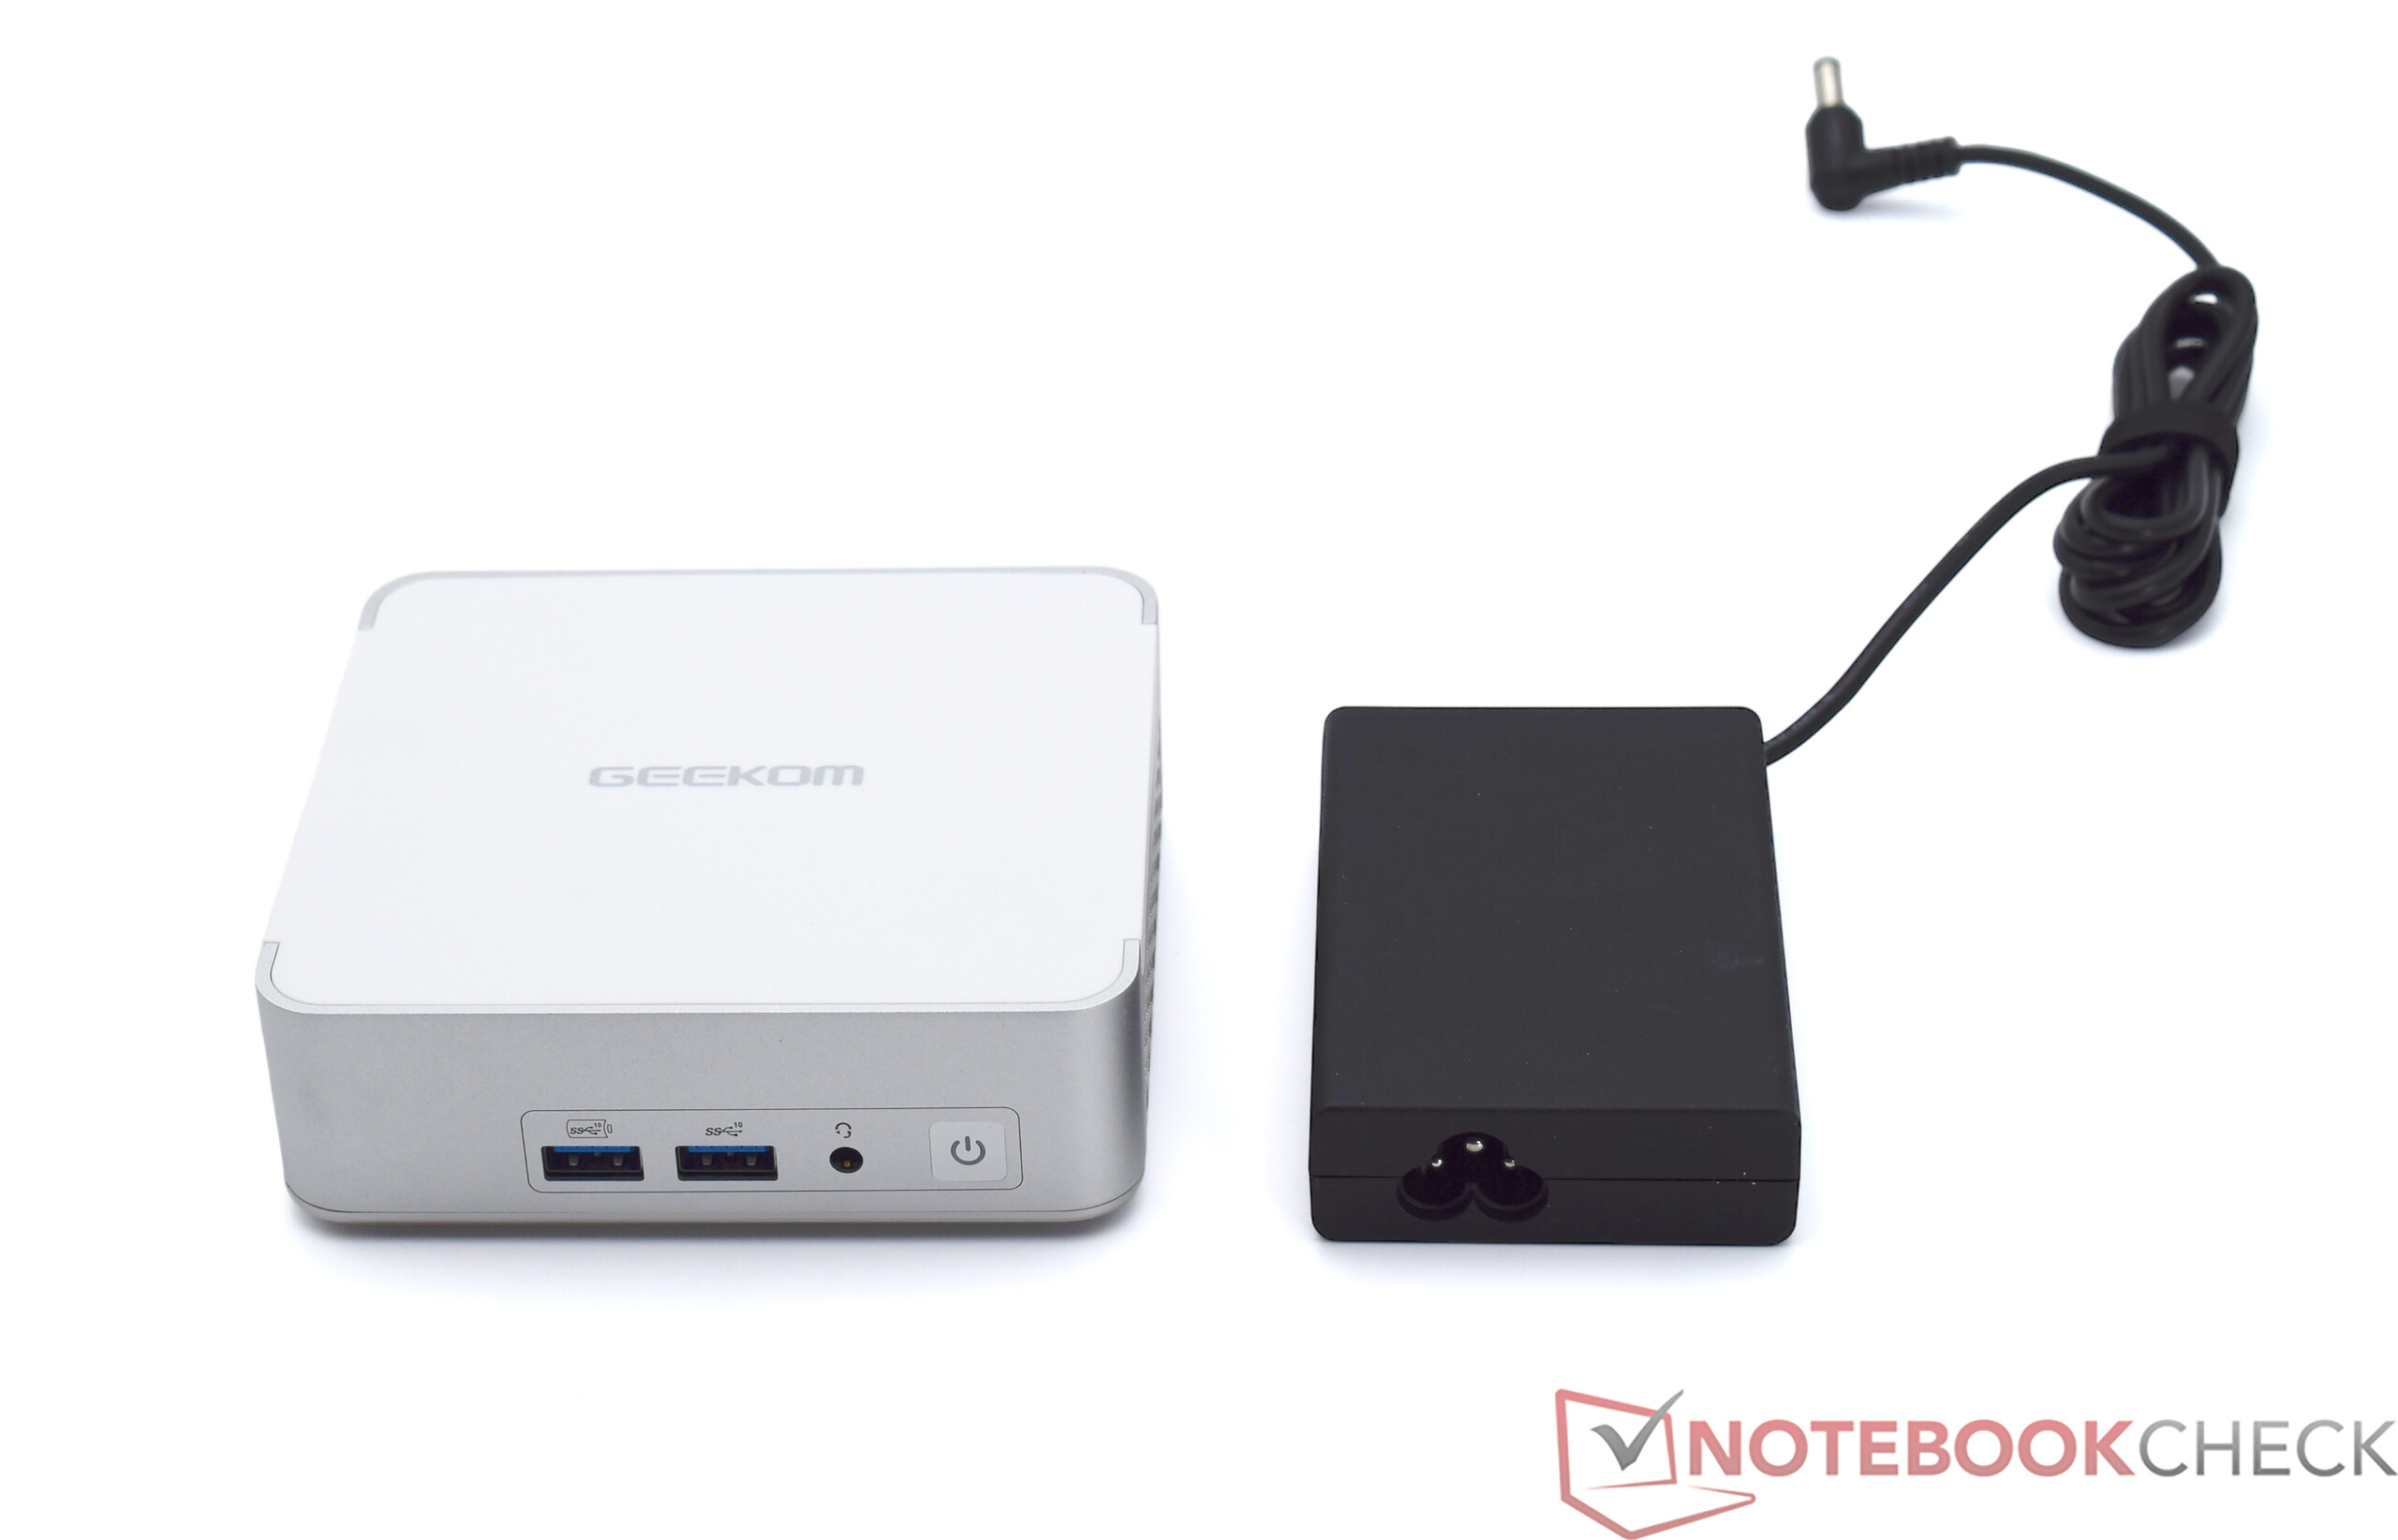
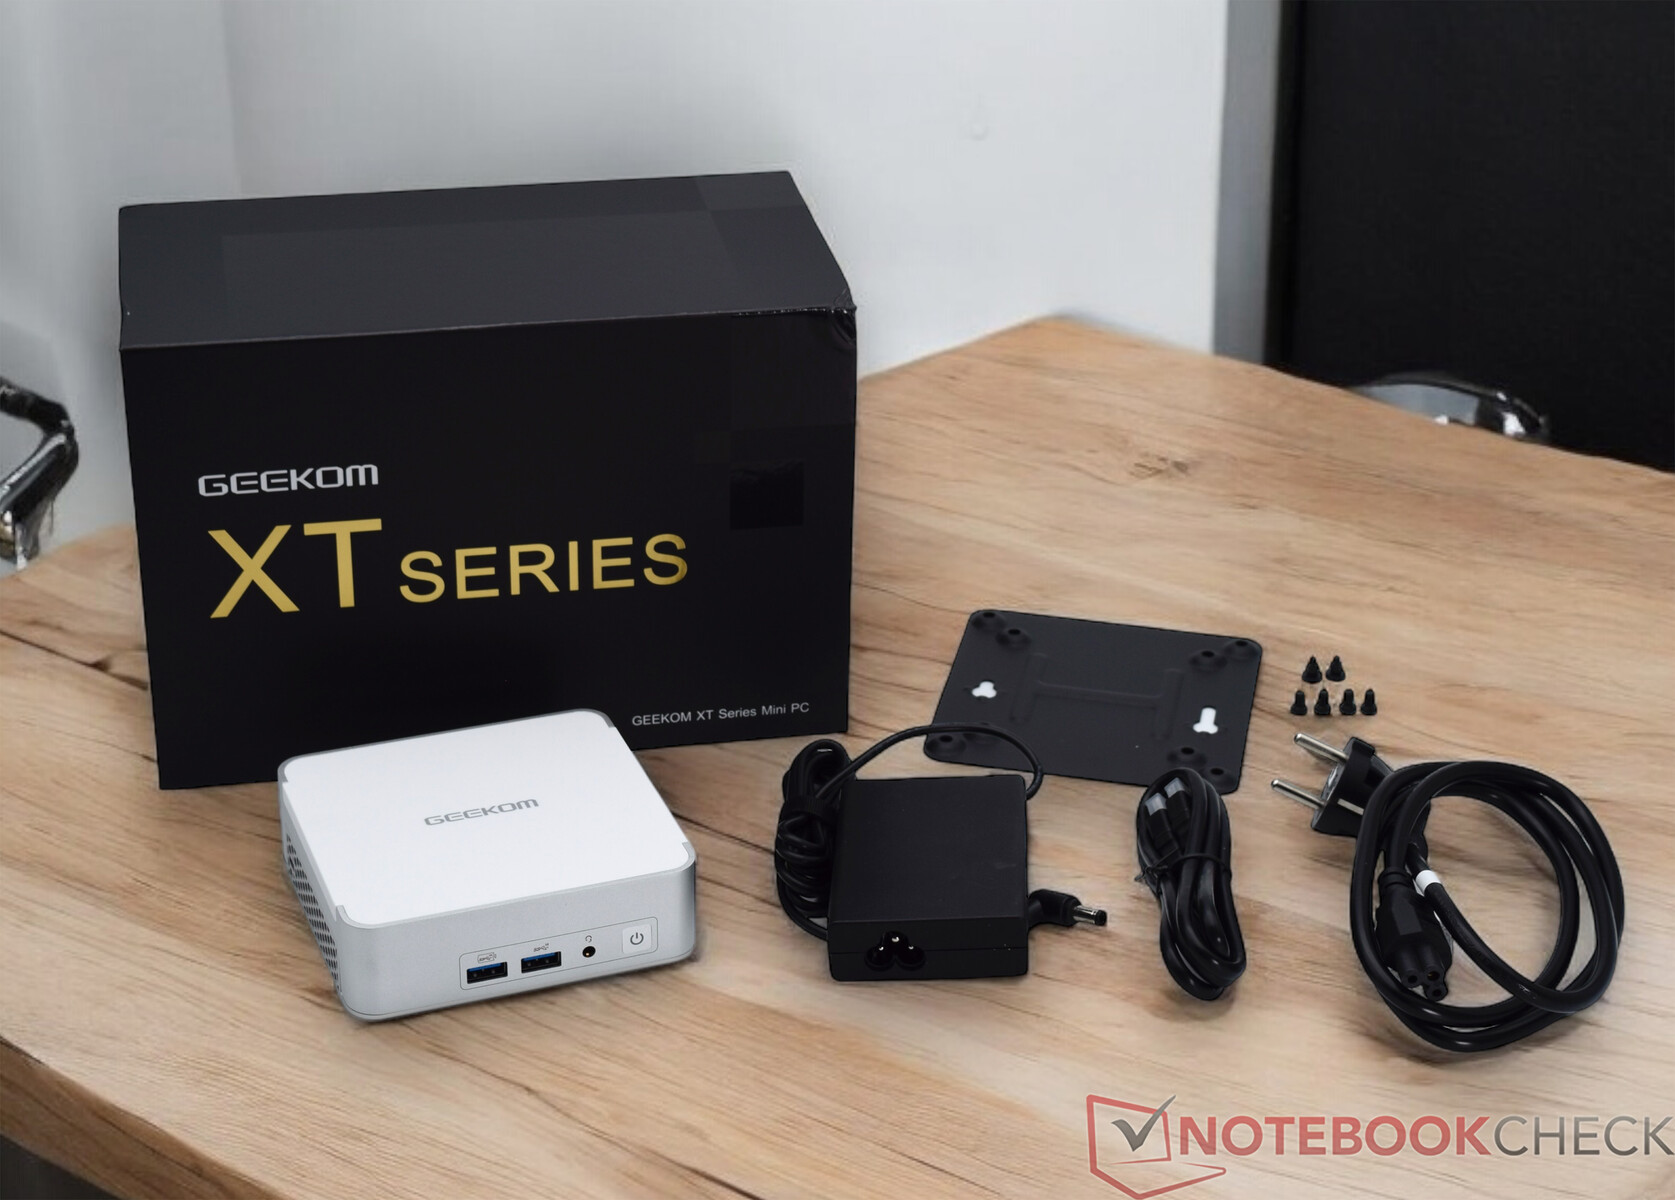
Zubehör
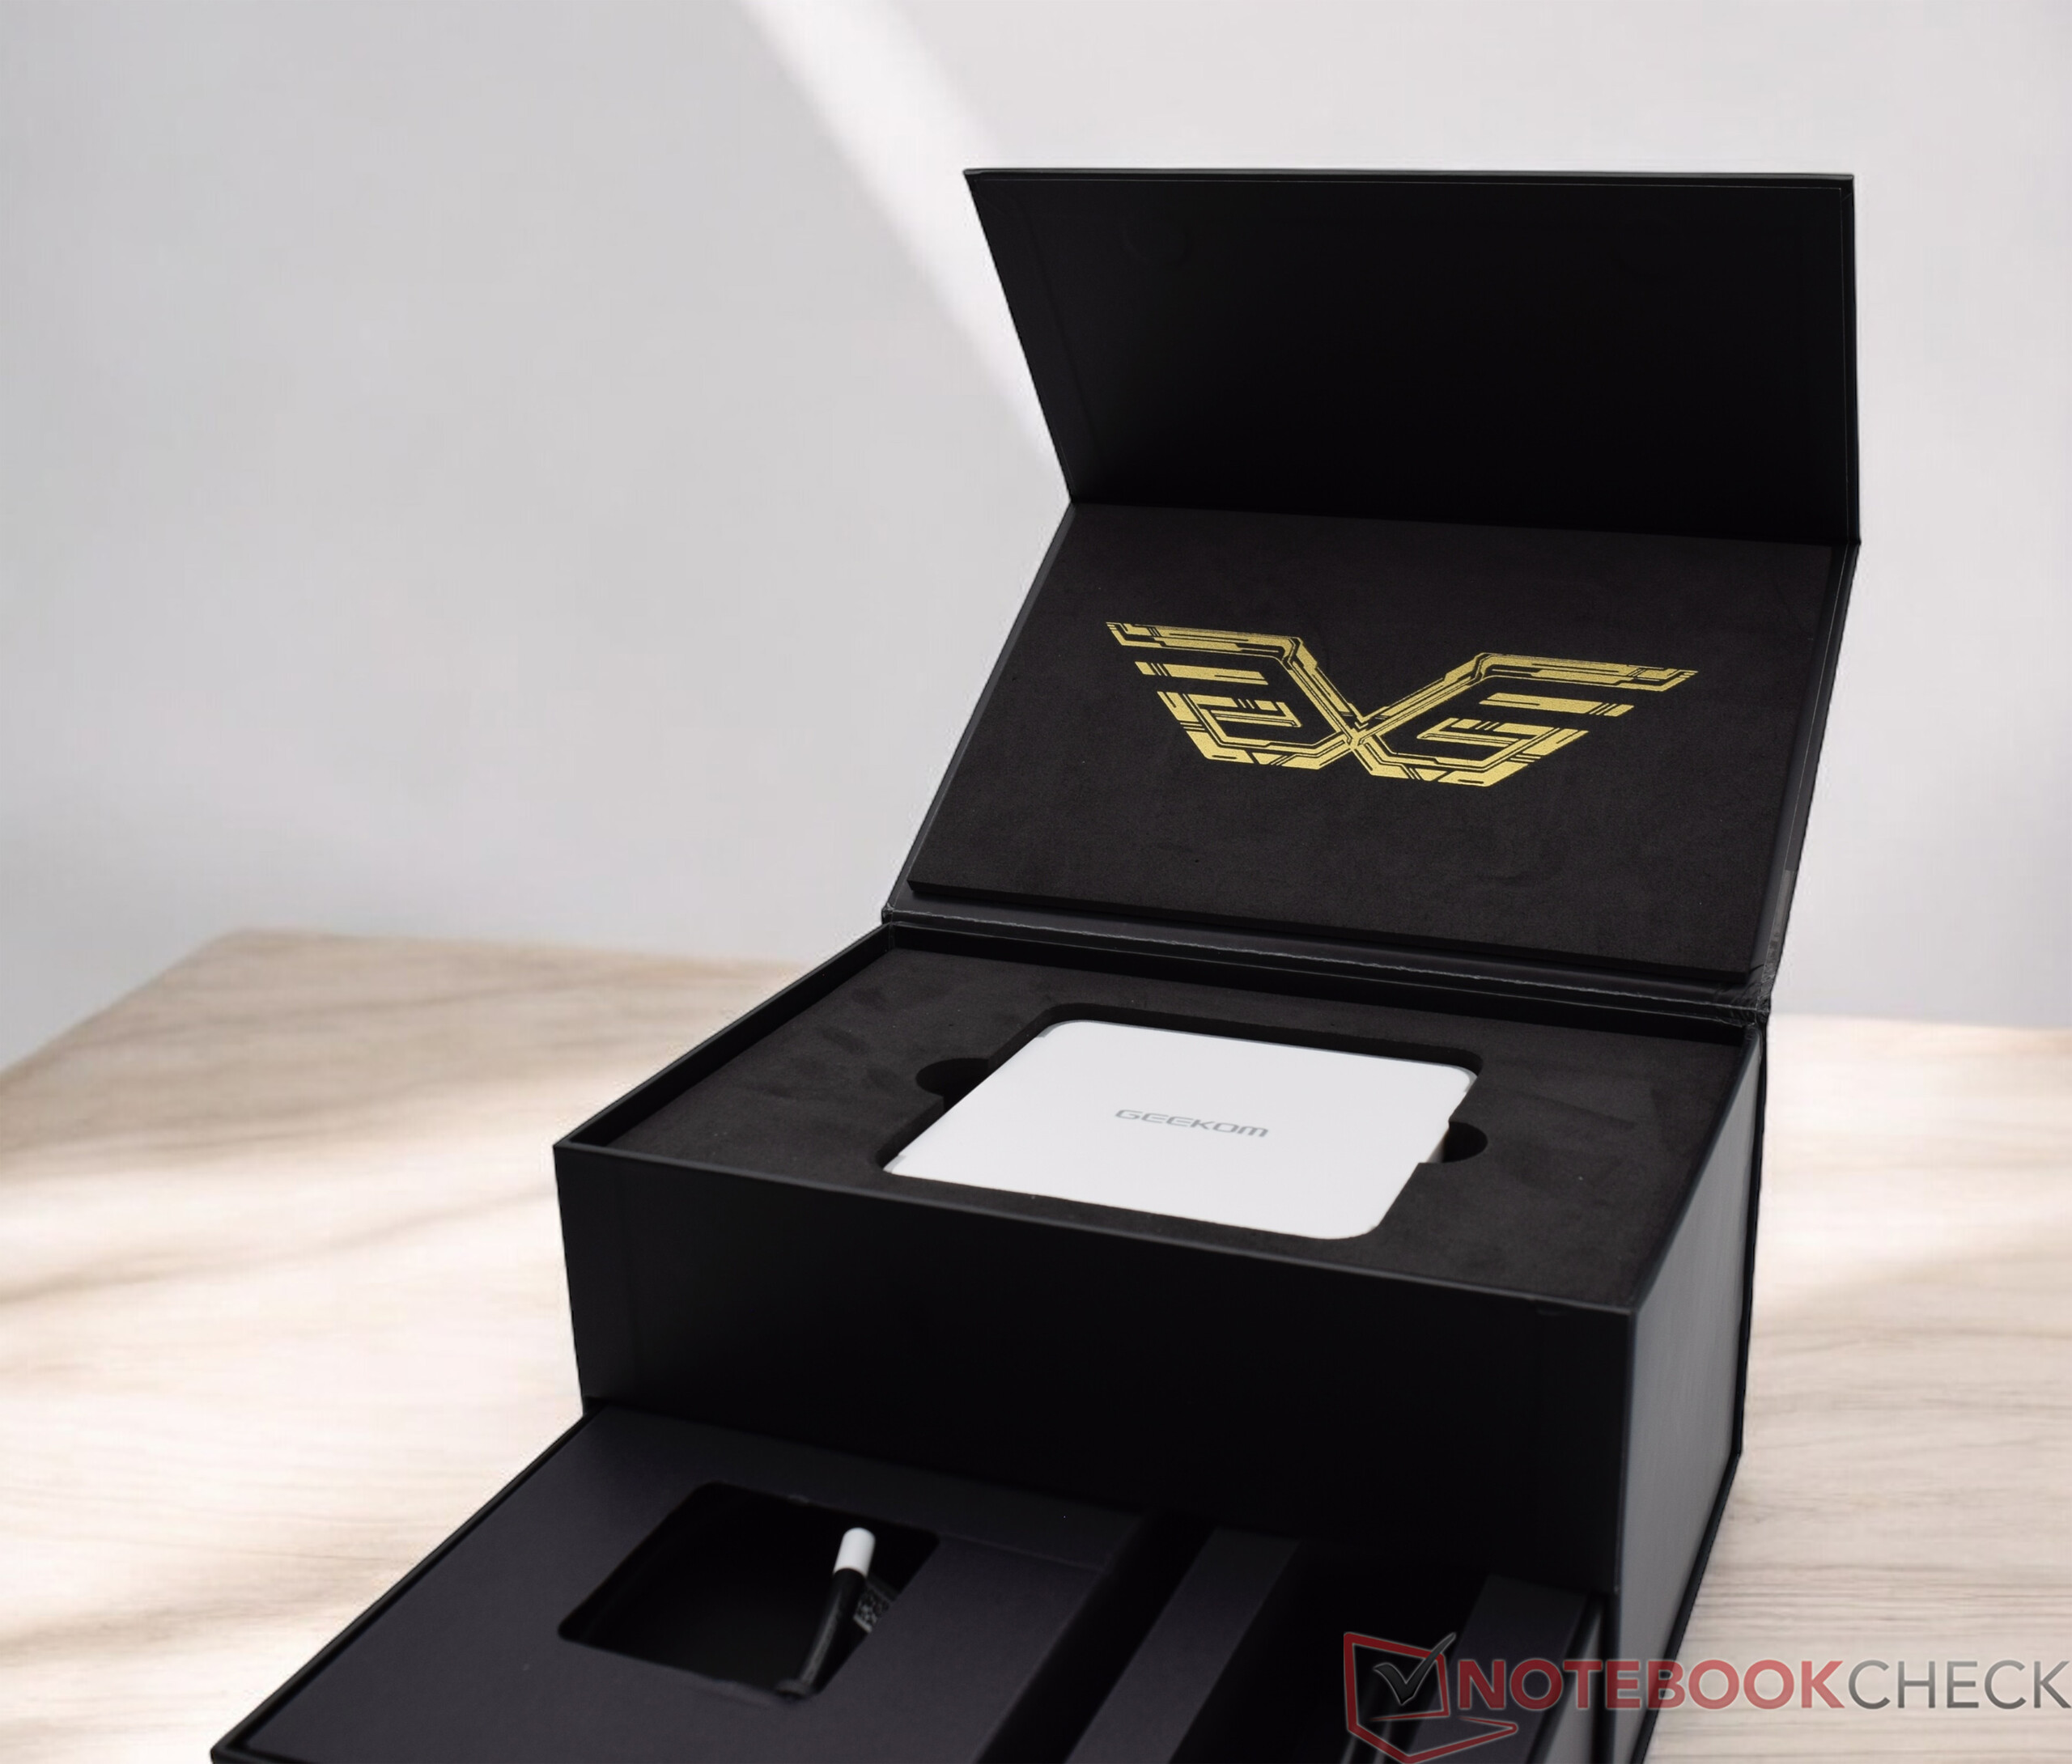
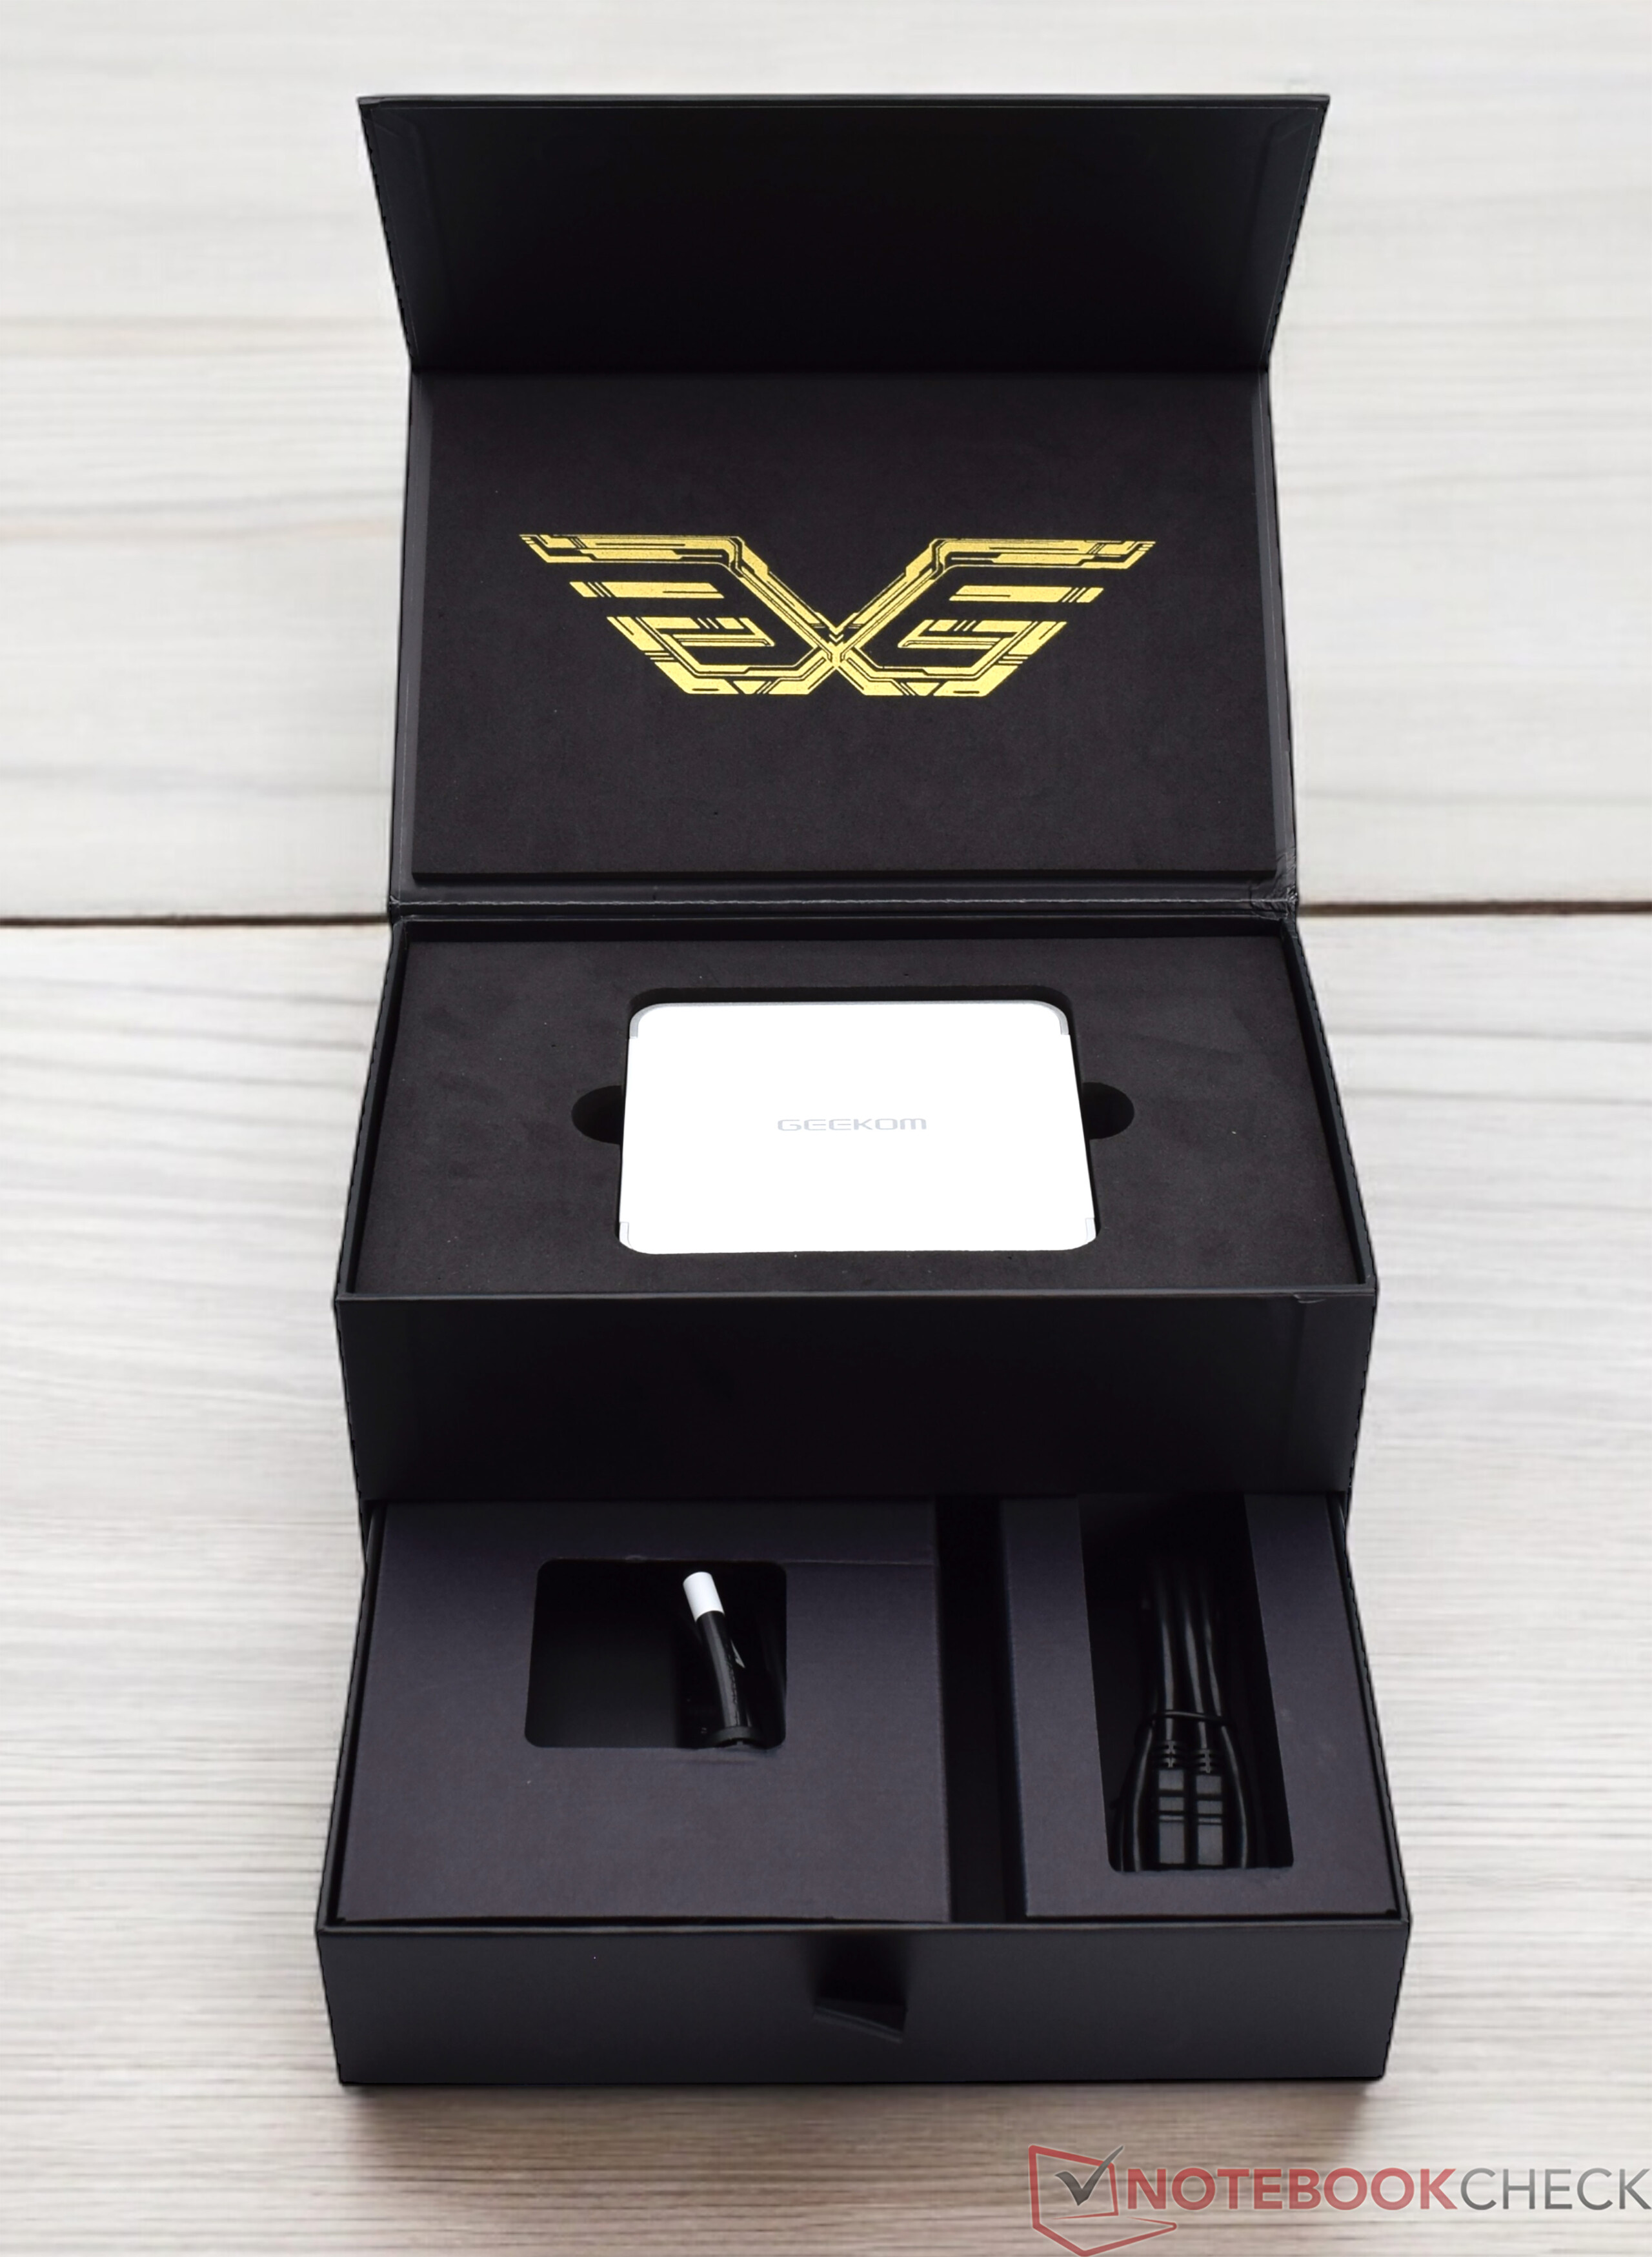
Der Lieferumfang des Geekom XT13 Pro bietet den gewohnten Standard. Neben dem Gerät selbst befindet sich noch das 120-Watt-Netzteil und eine VESA-Halterung samt Montagematerial im Karton. Ein HDMI-Kabel sowie die obligatorische Dankeskarte von Geekom gehören auch dazu.
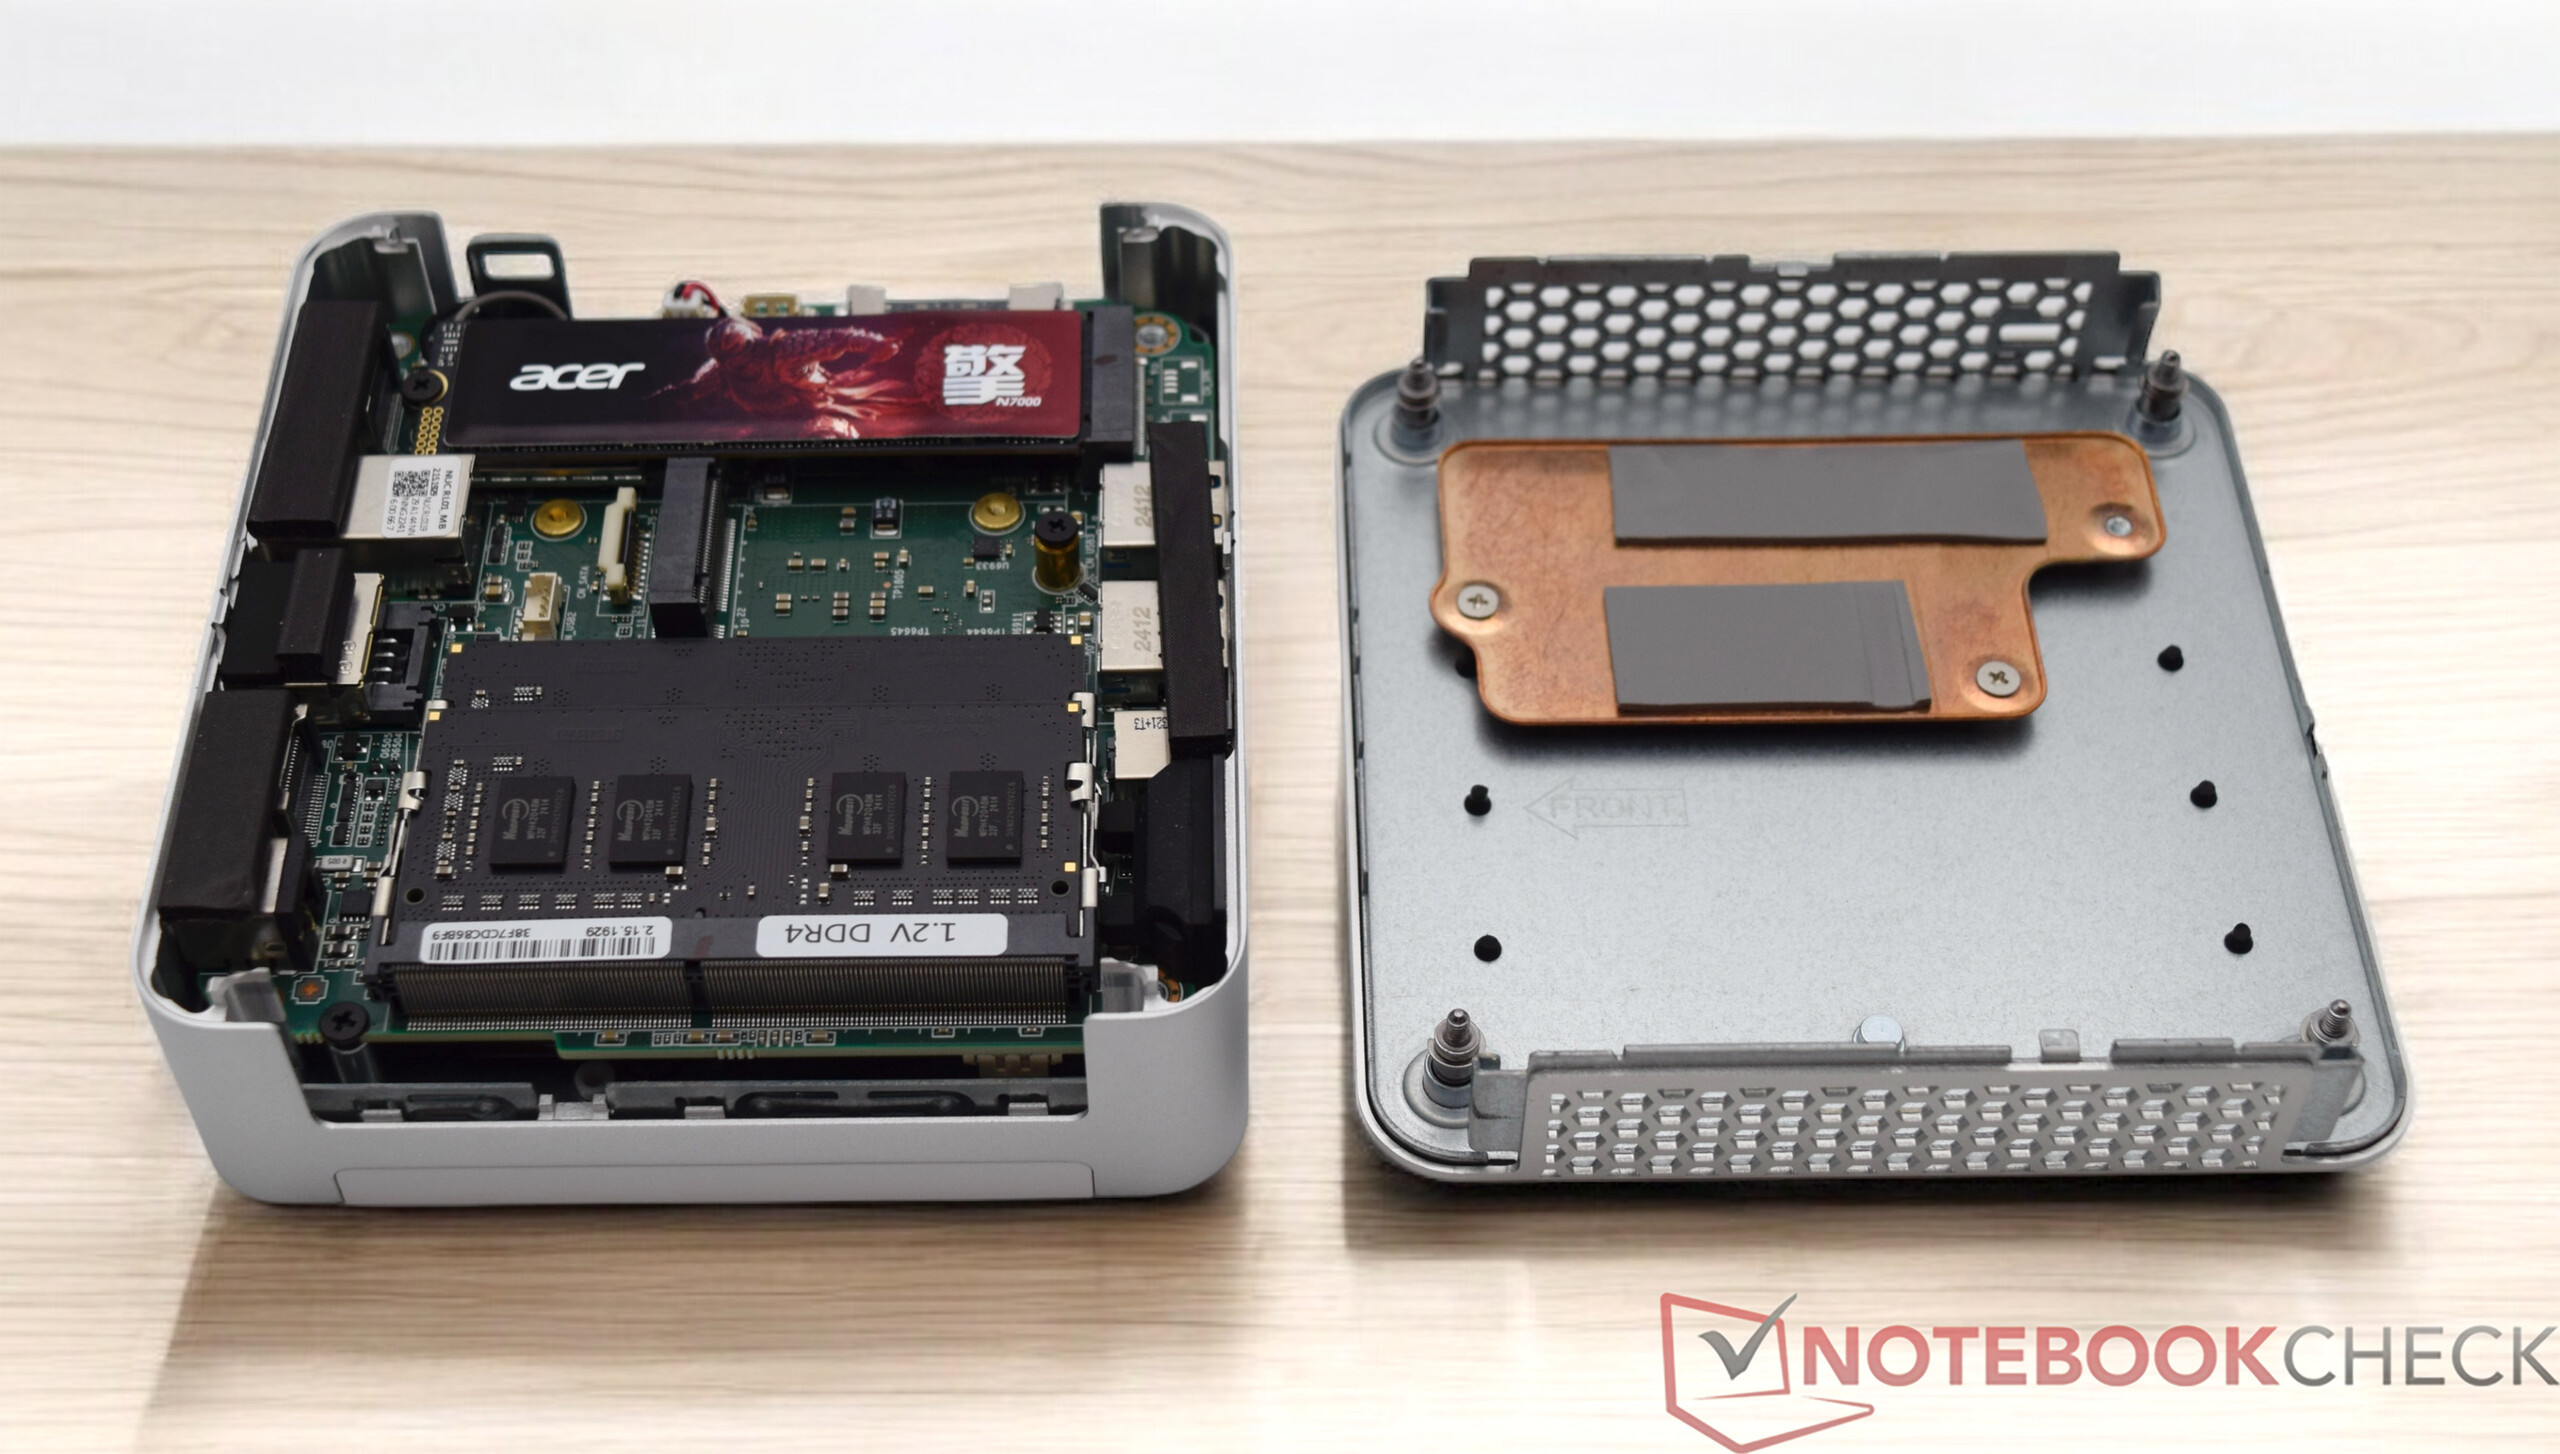
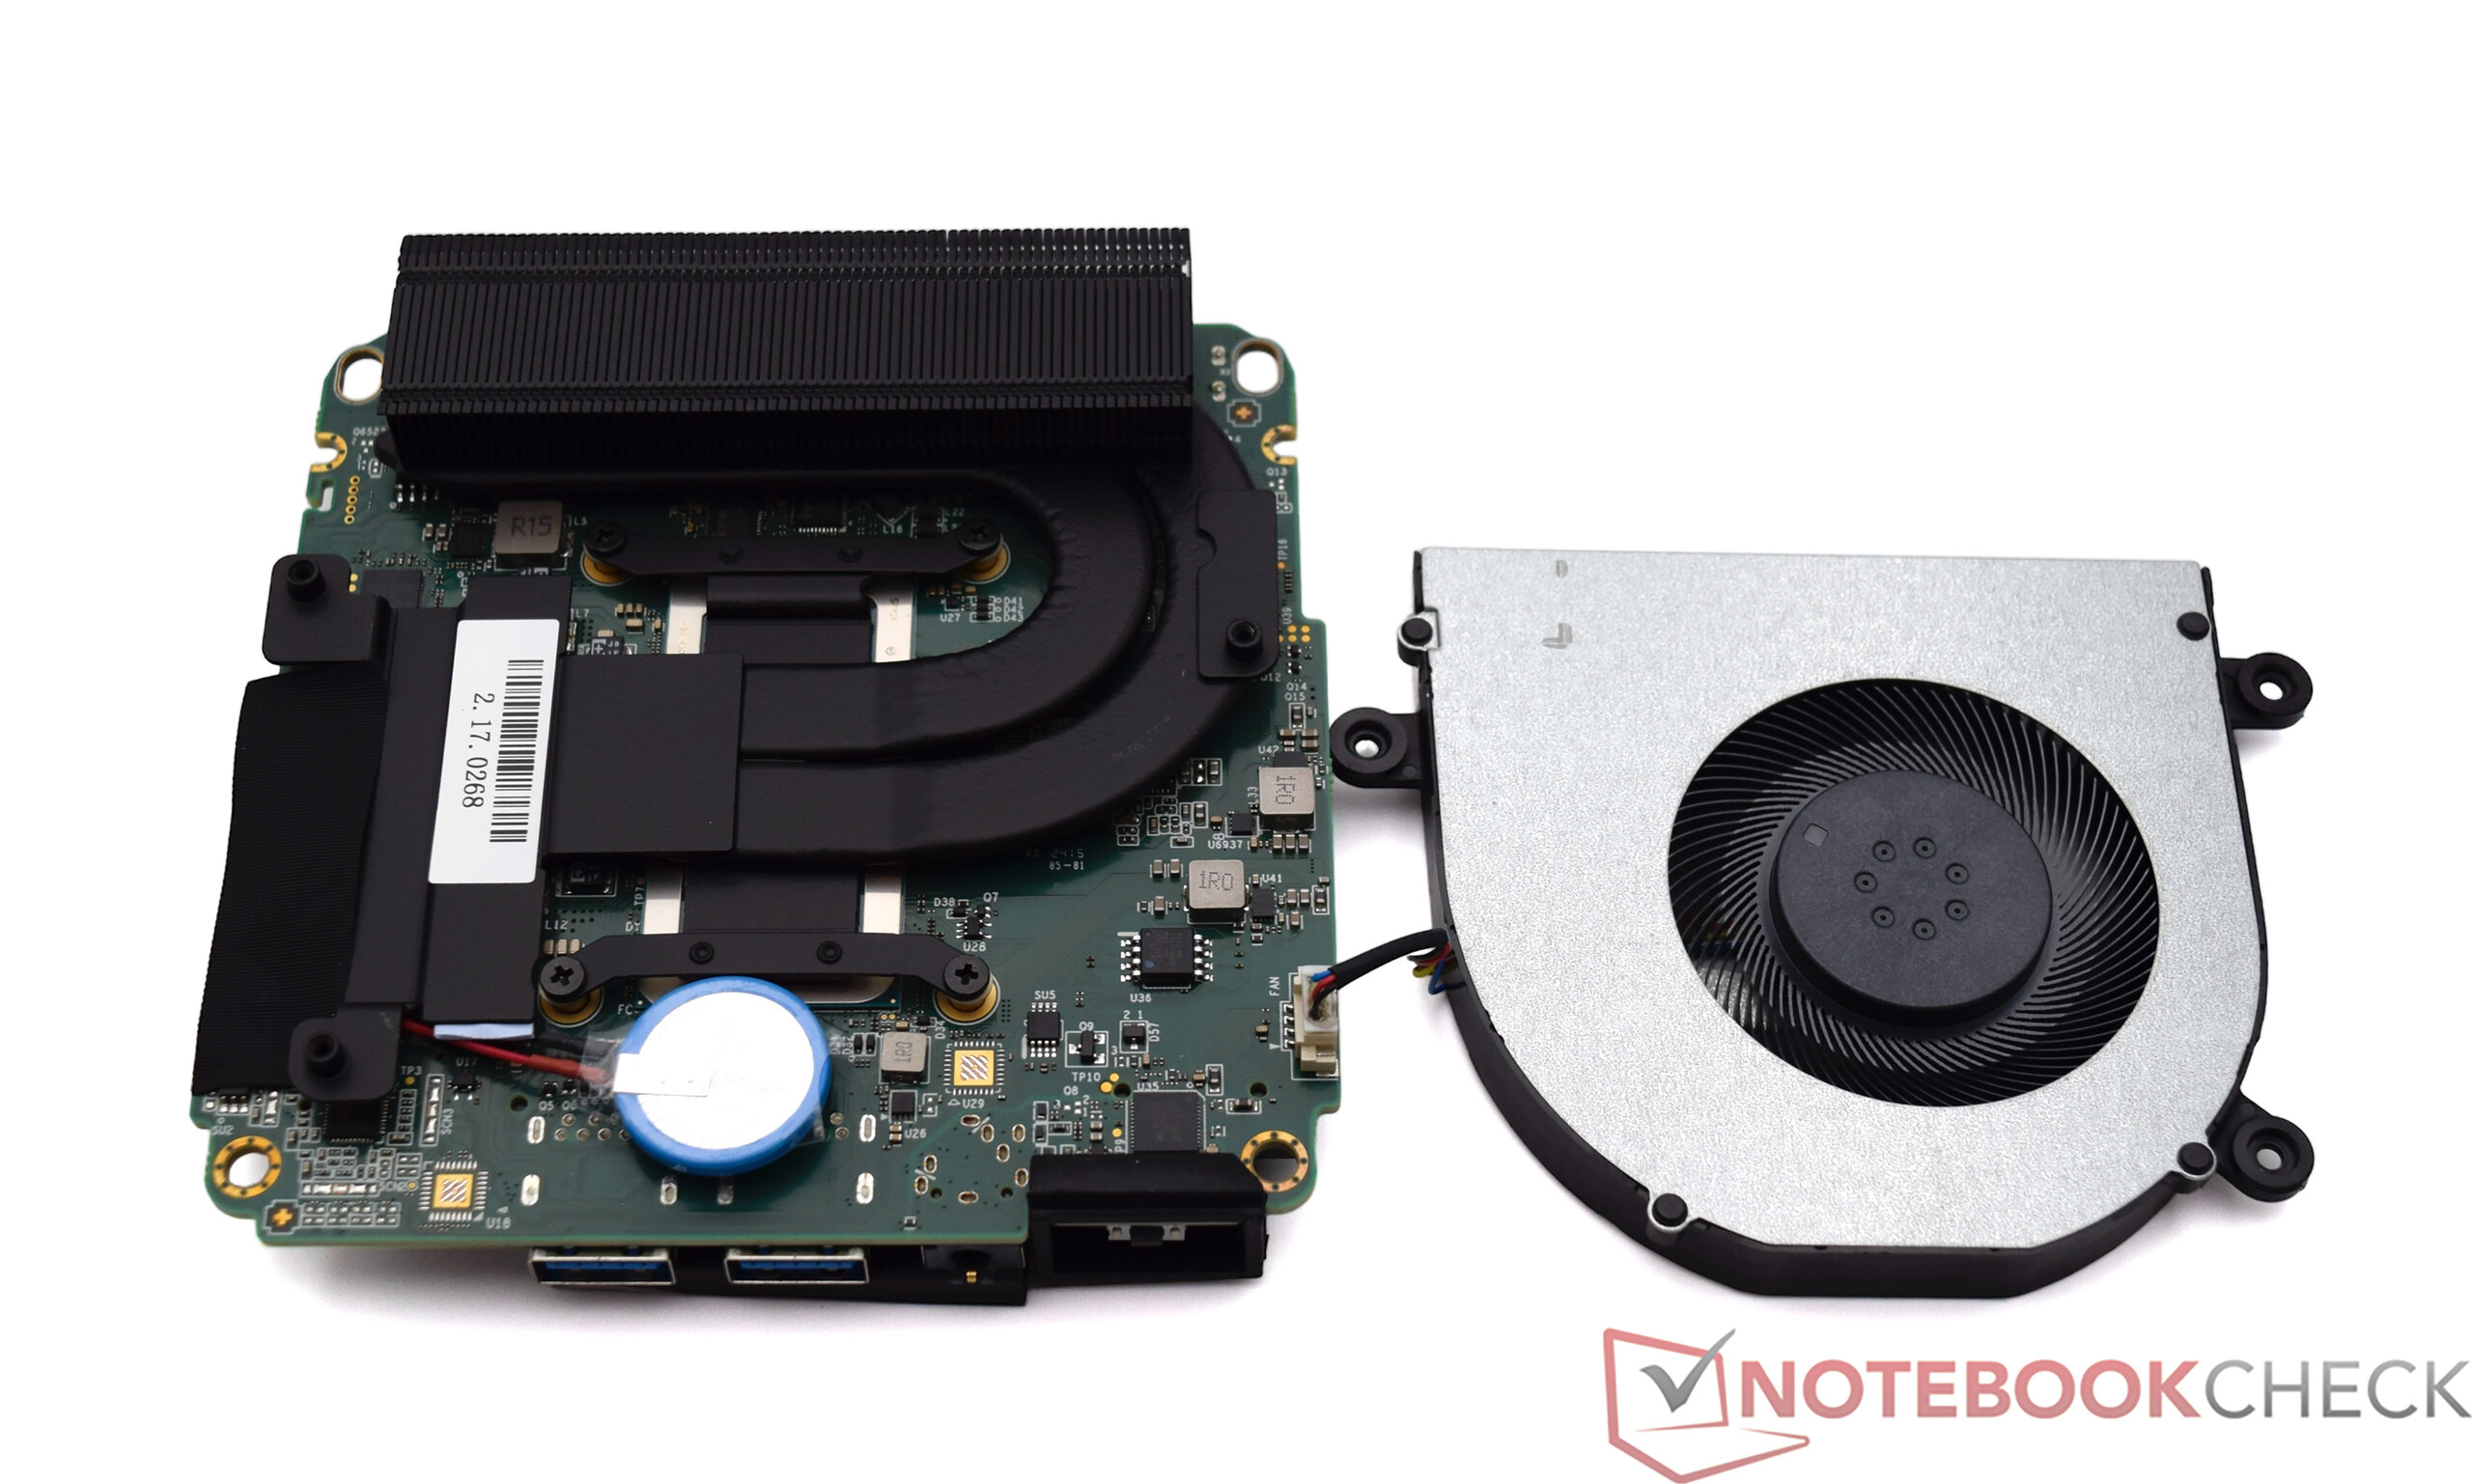
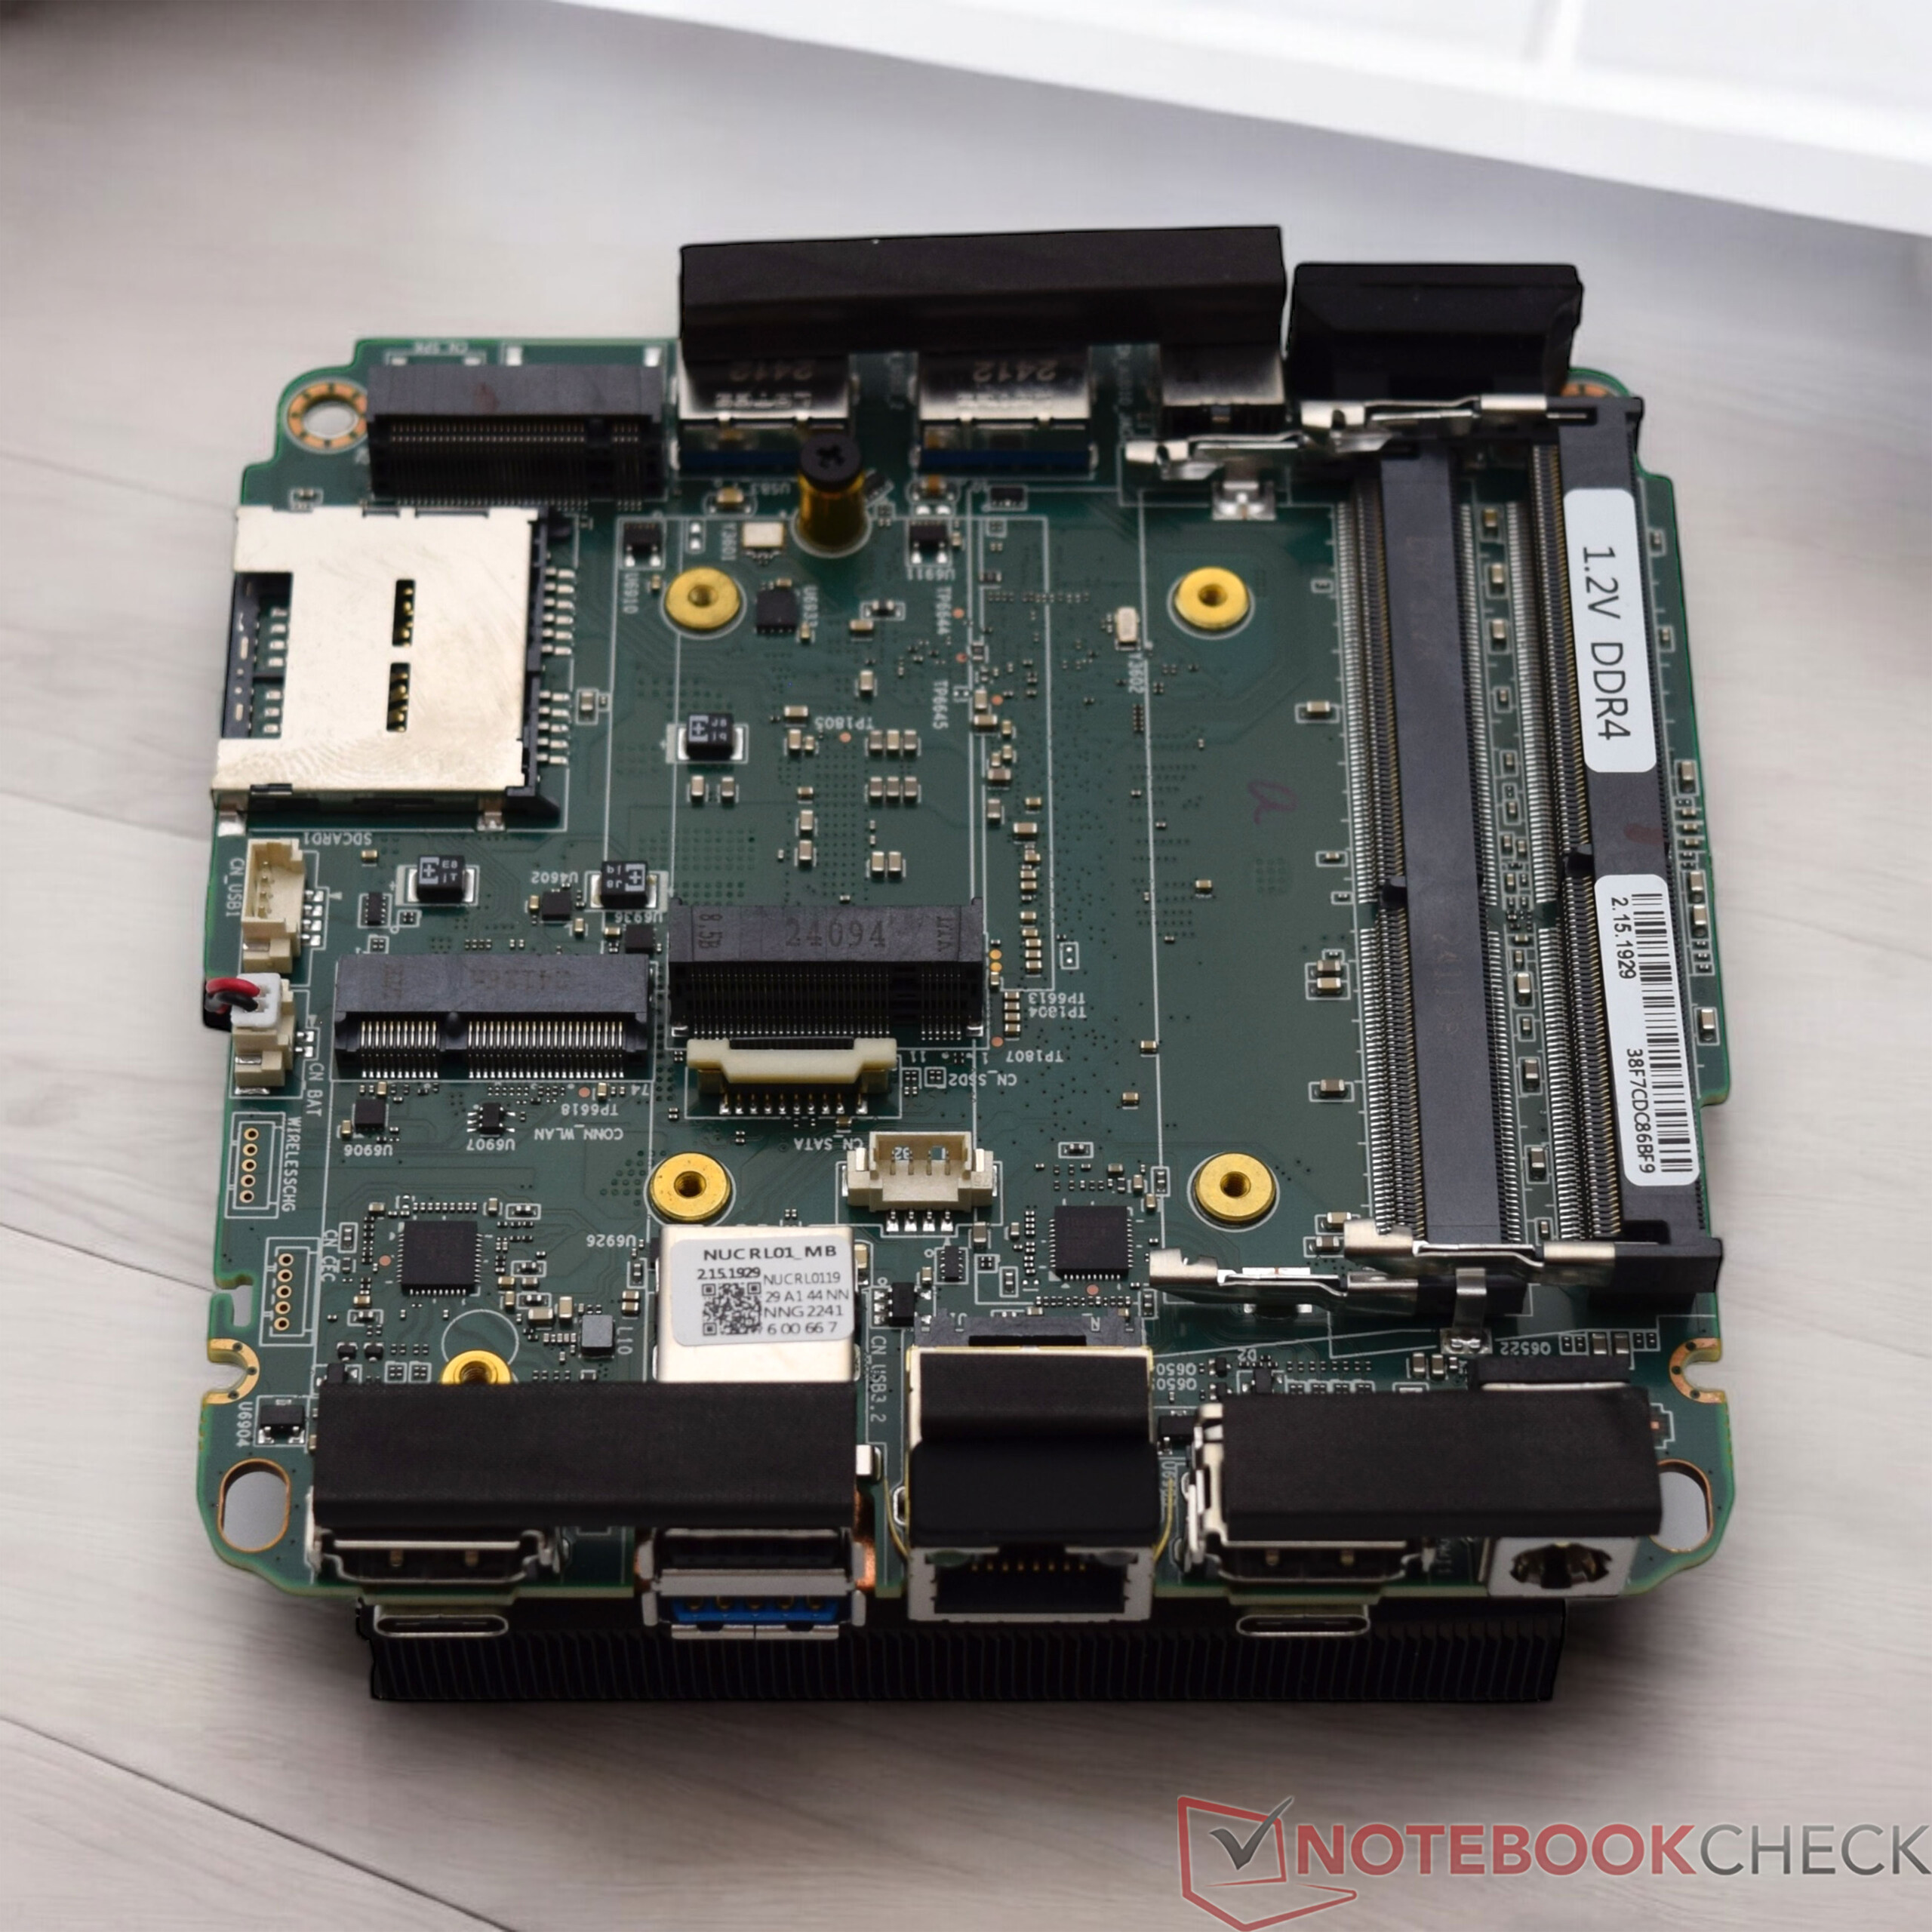
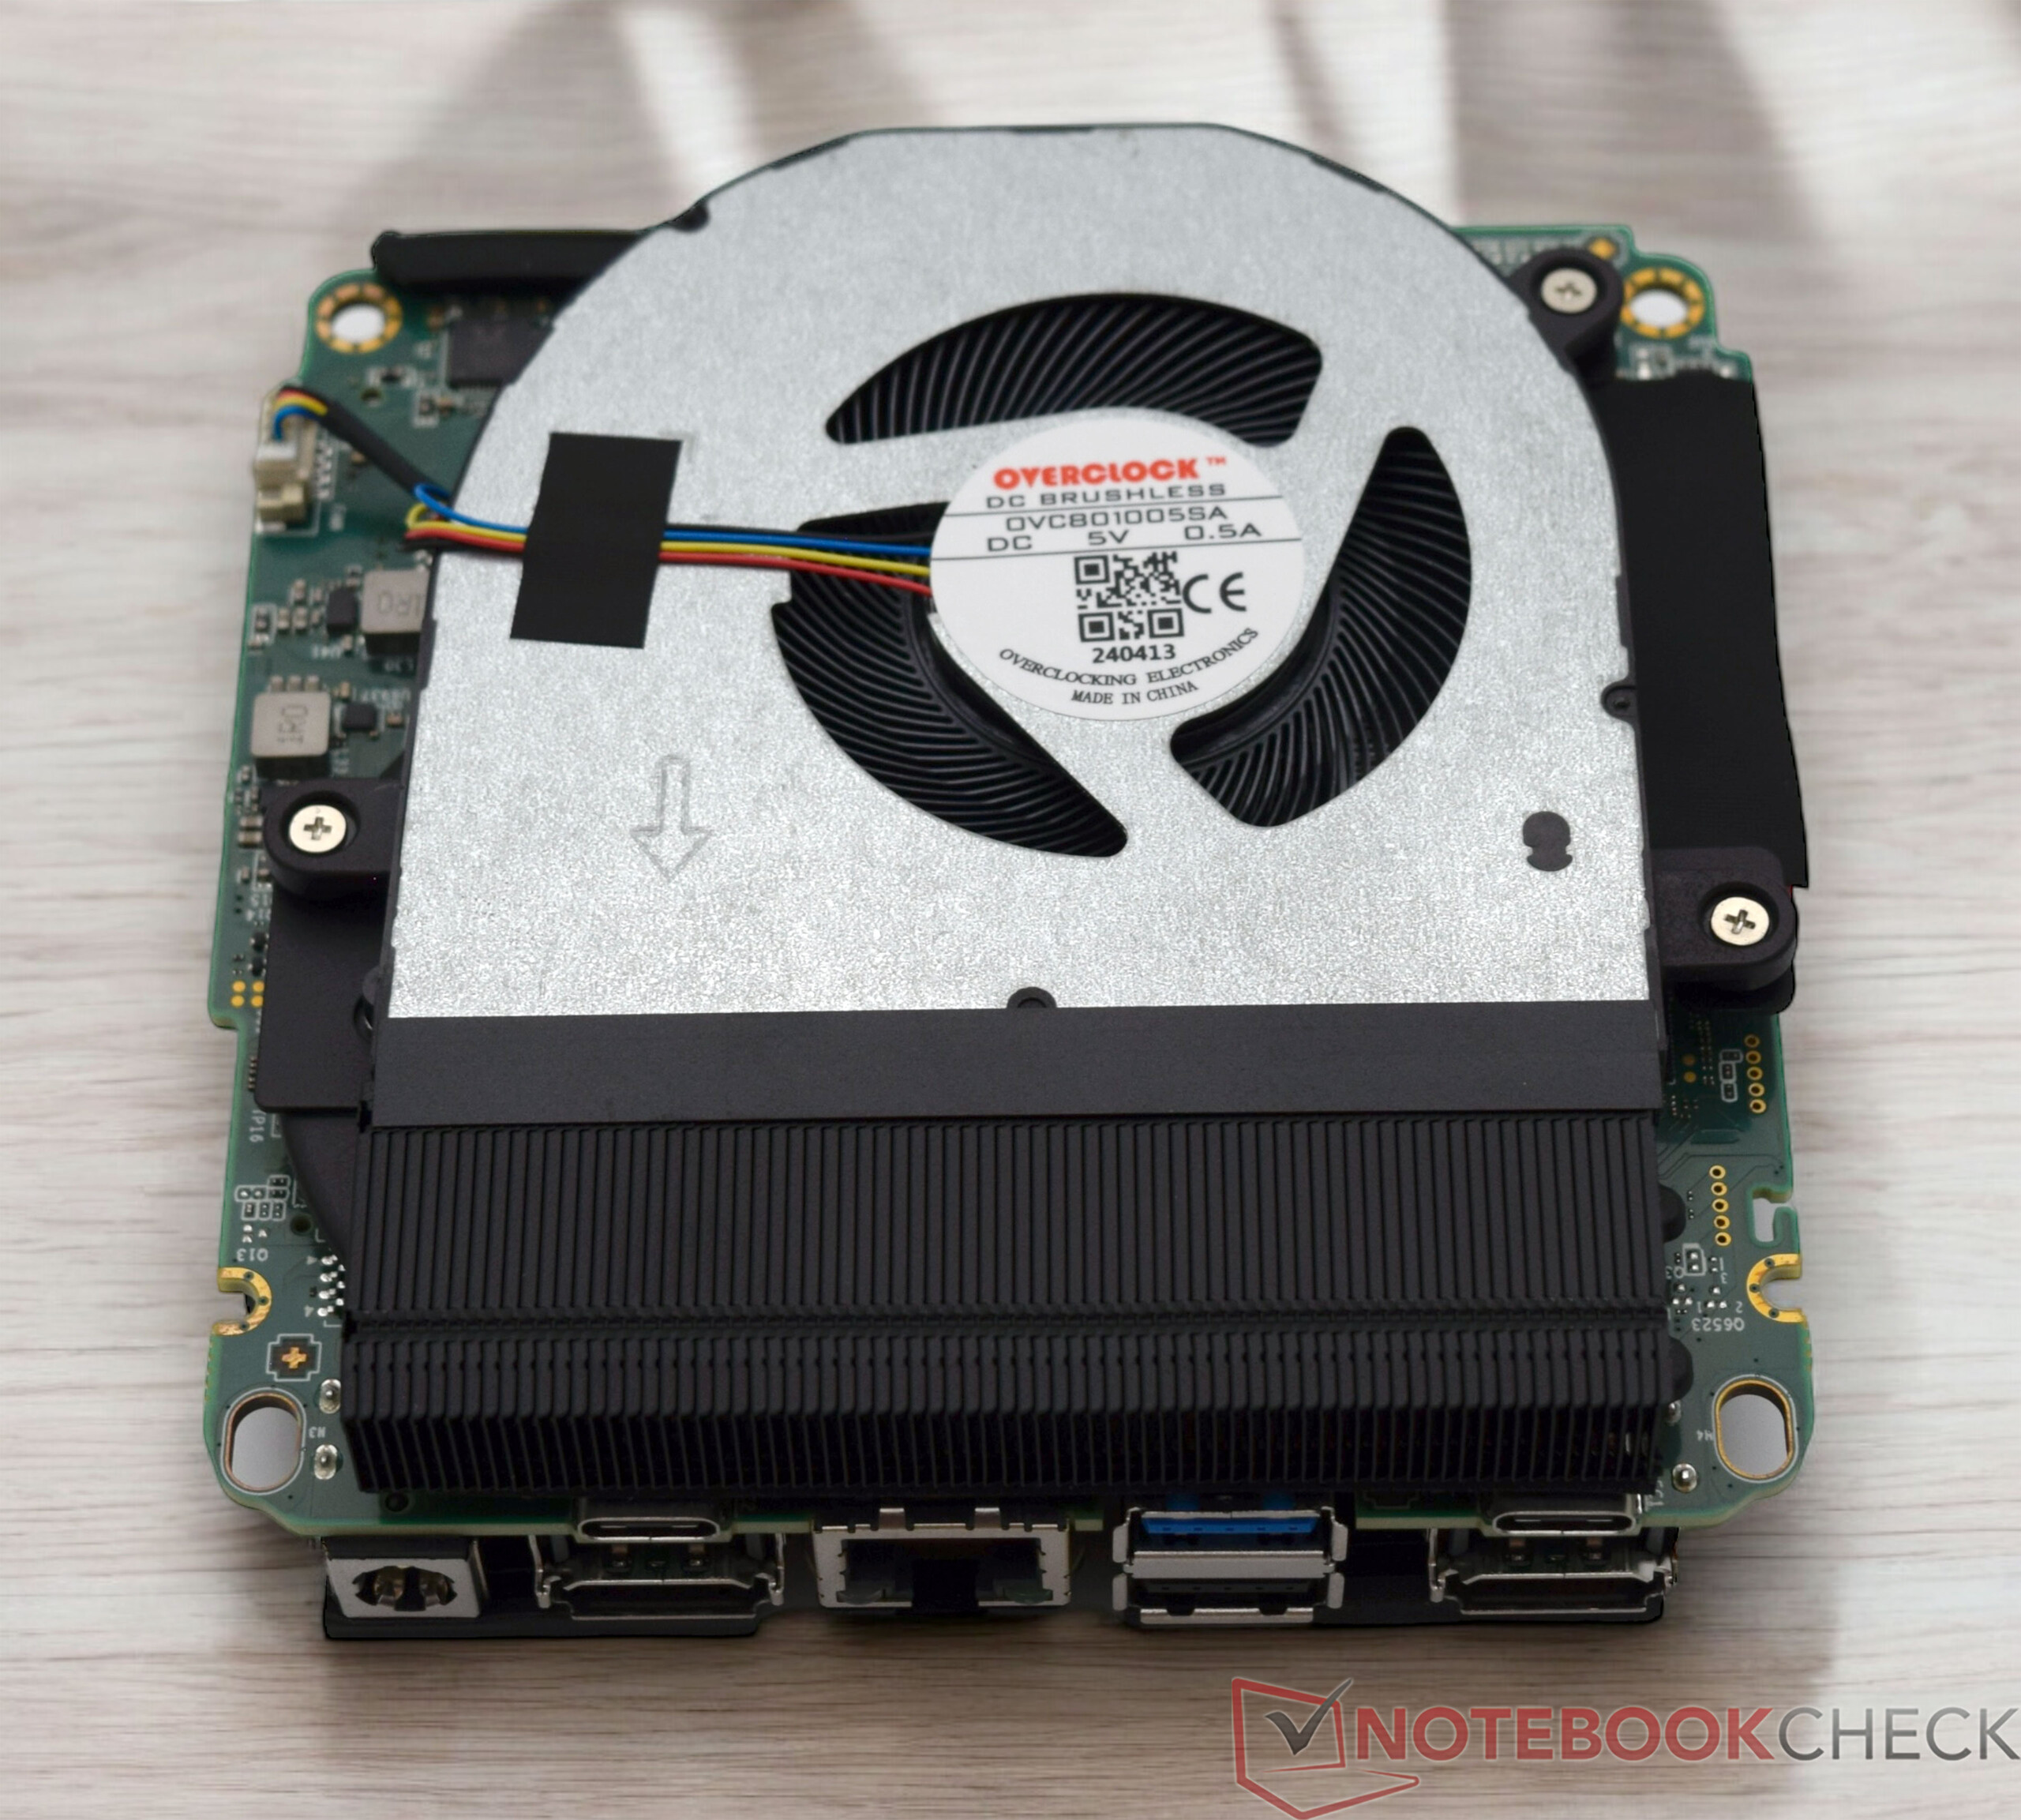
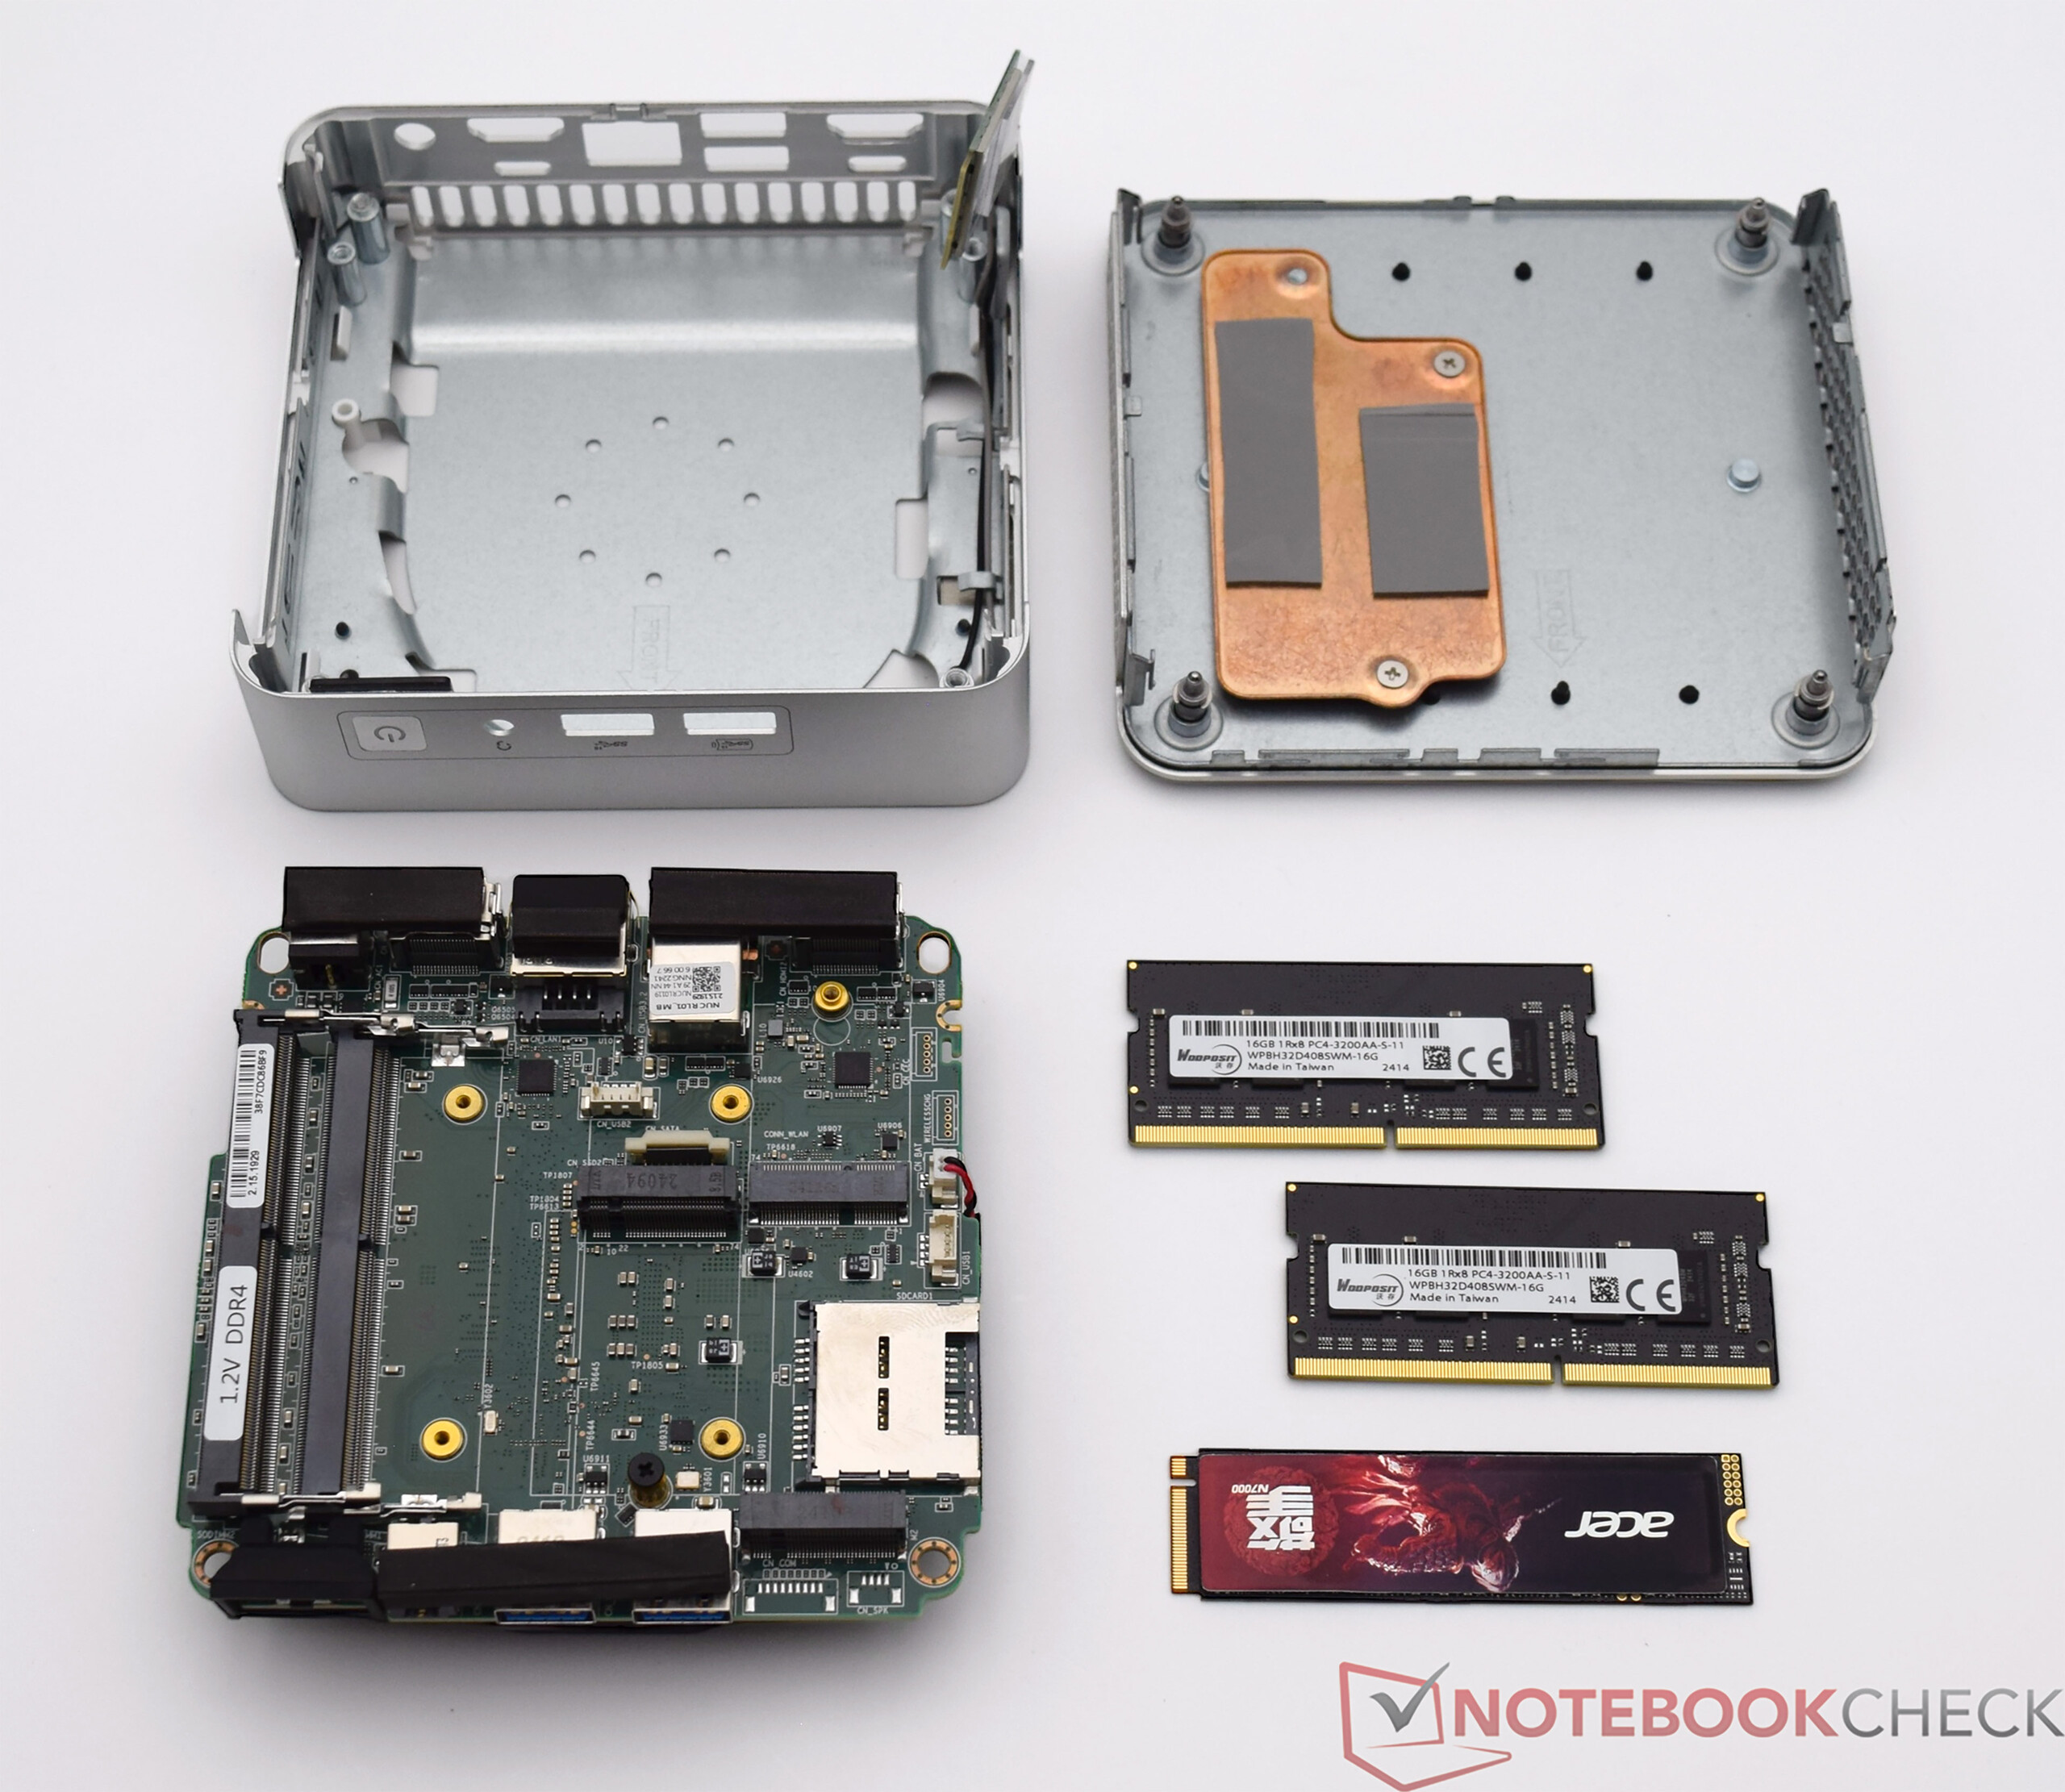
Wartung
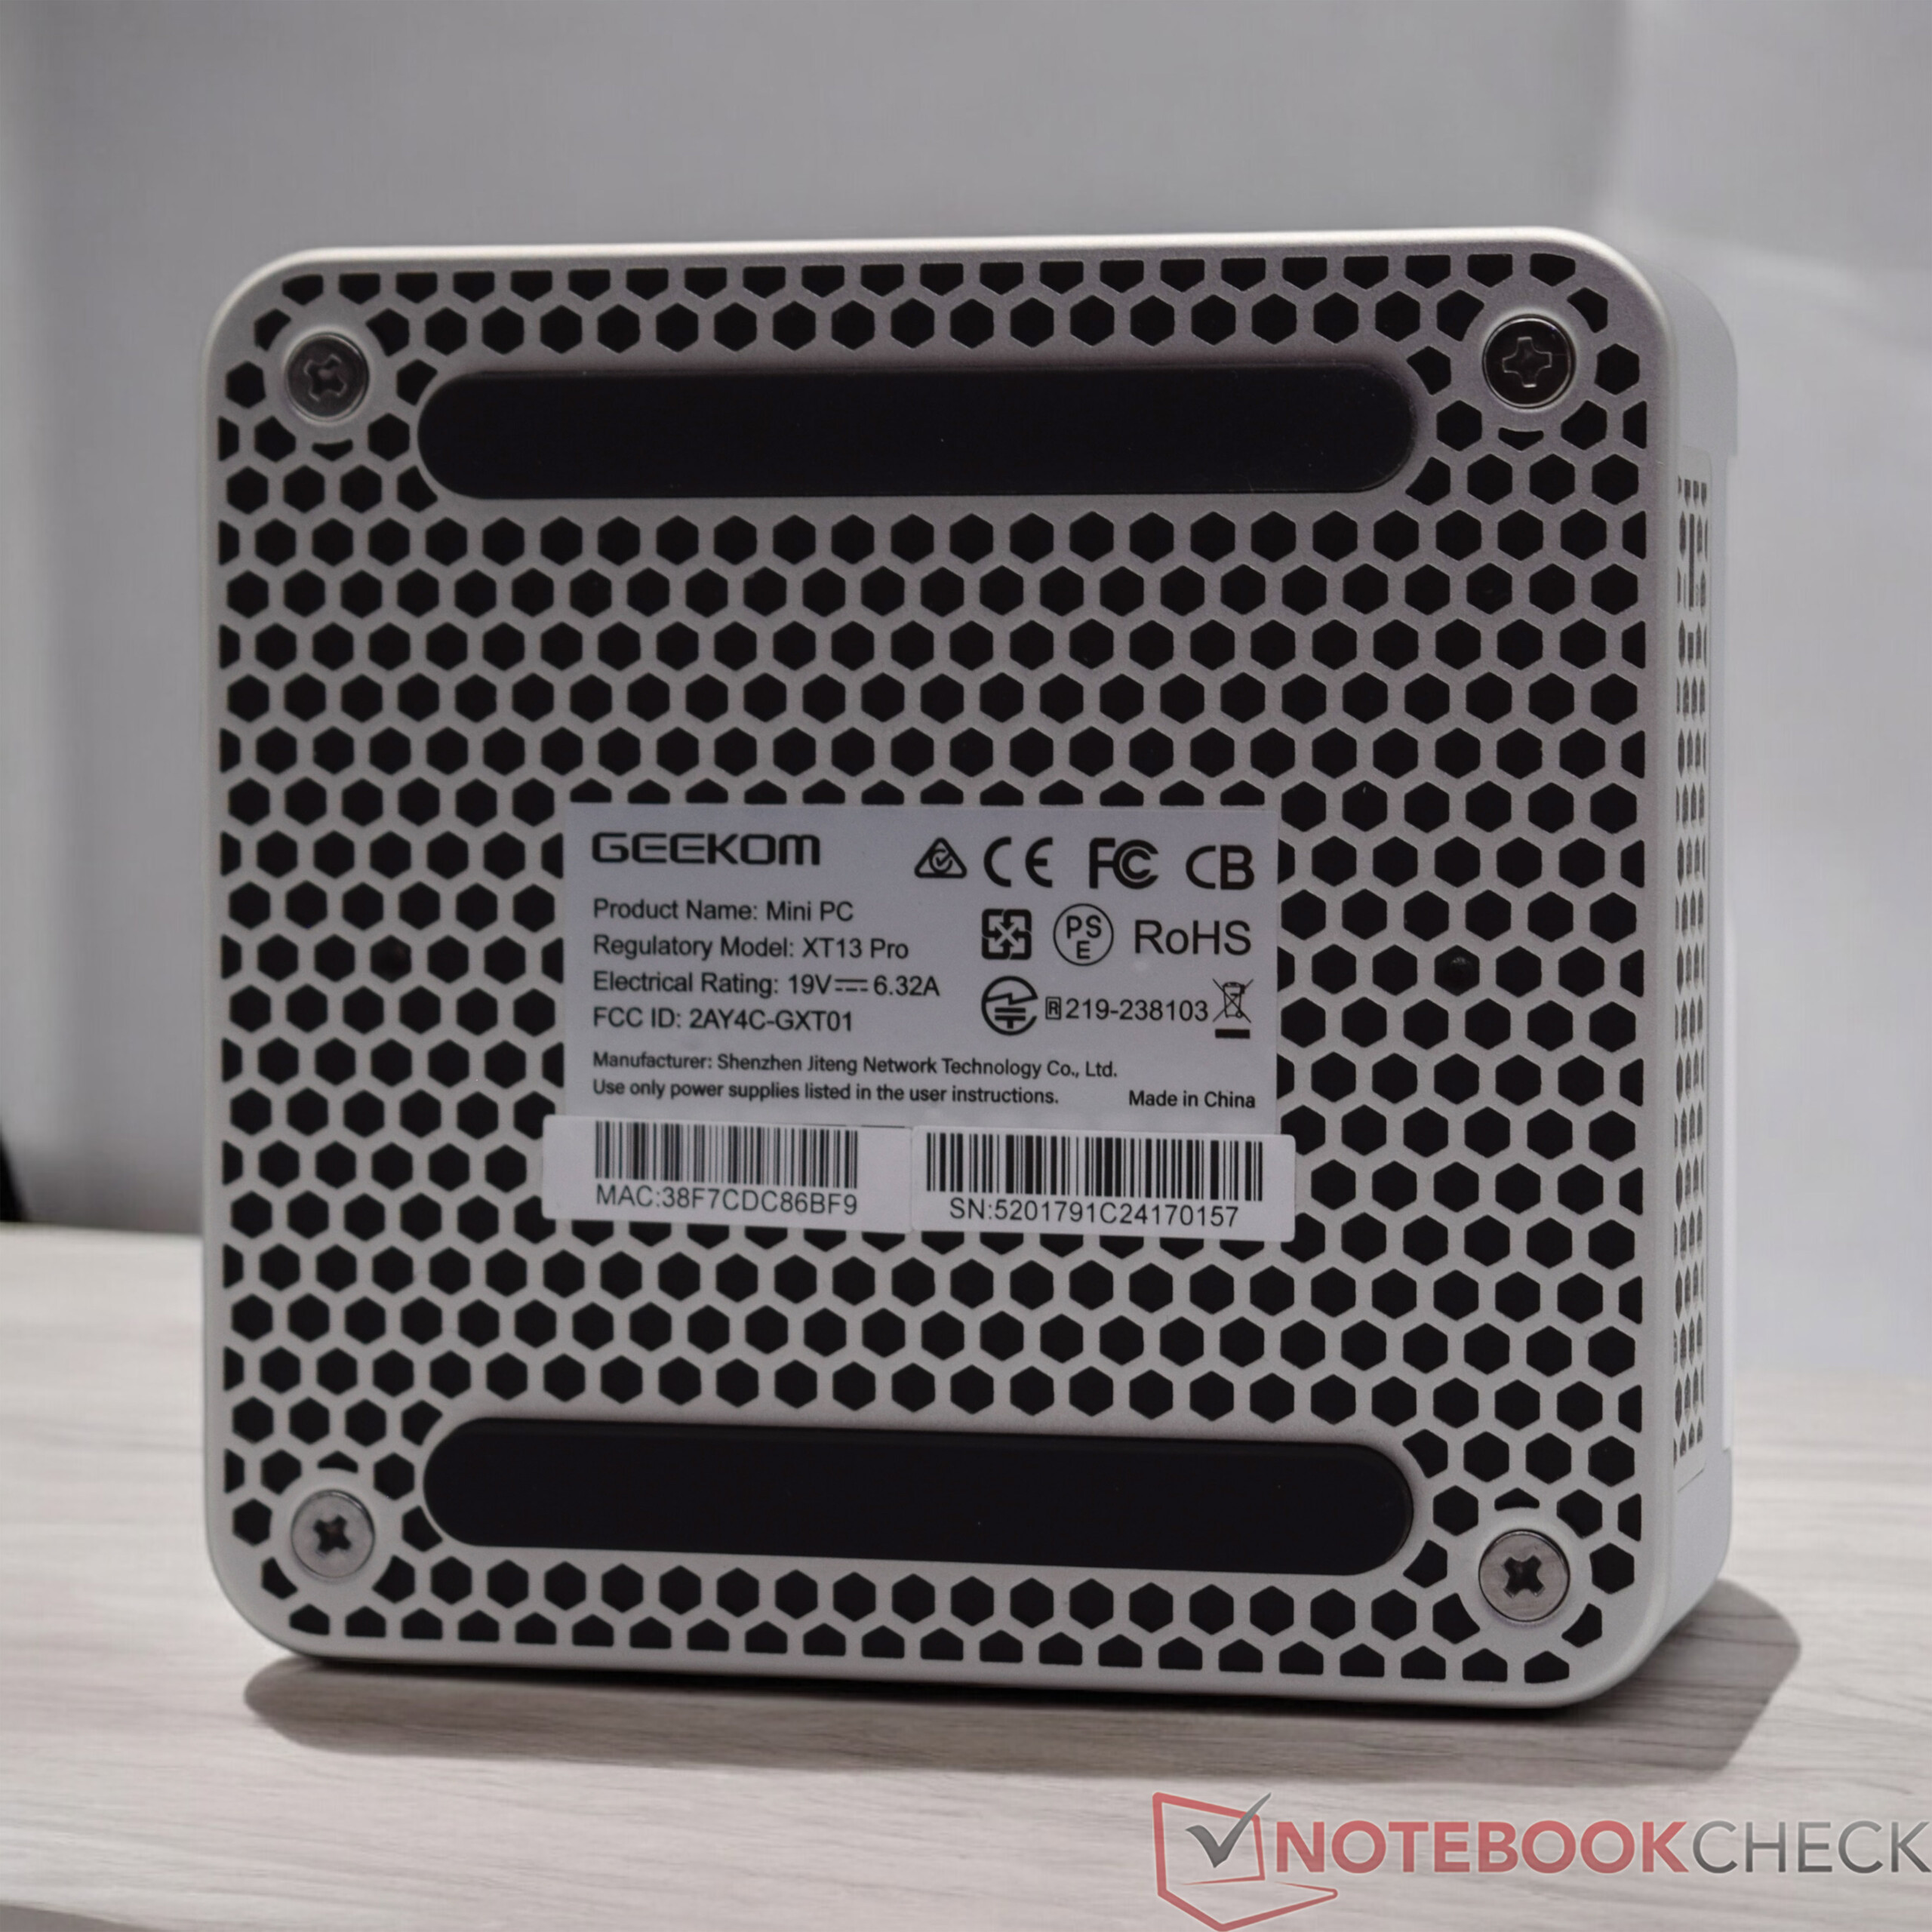
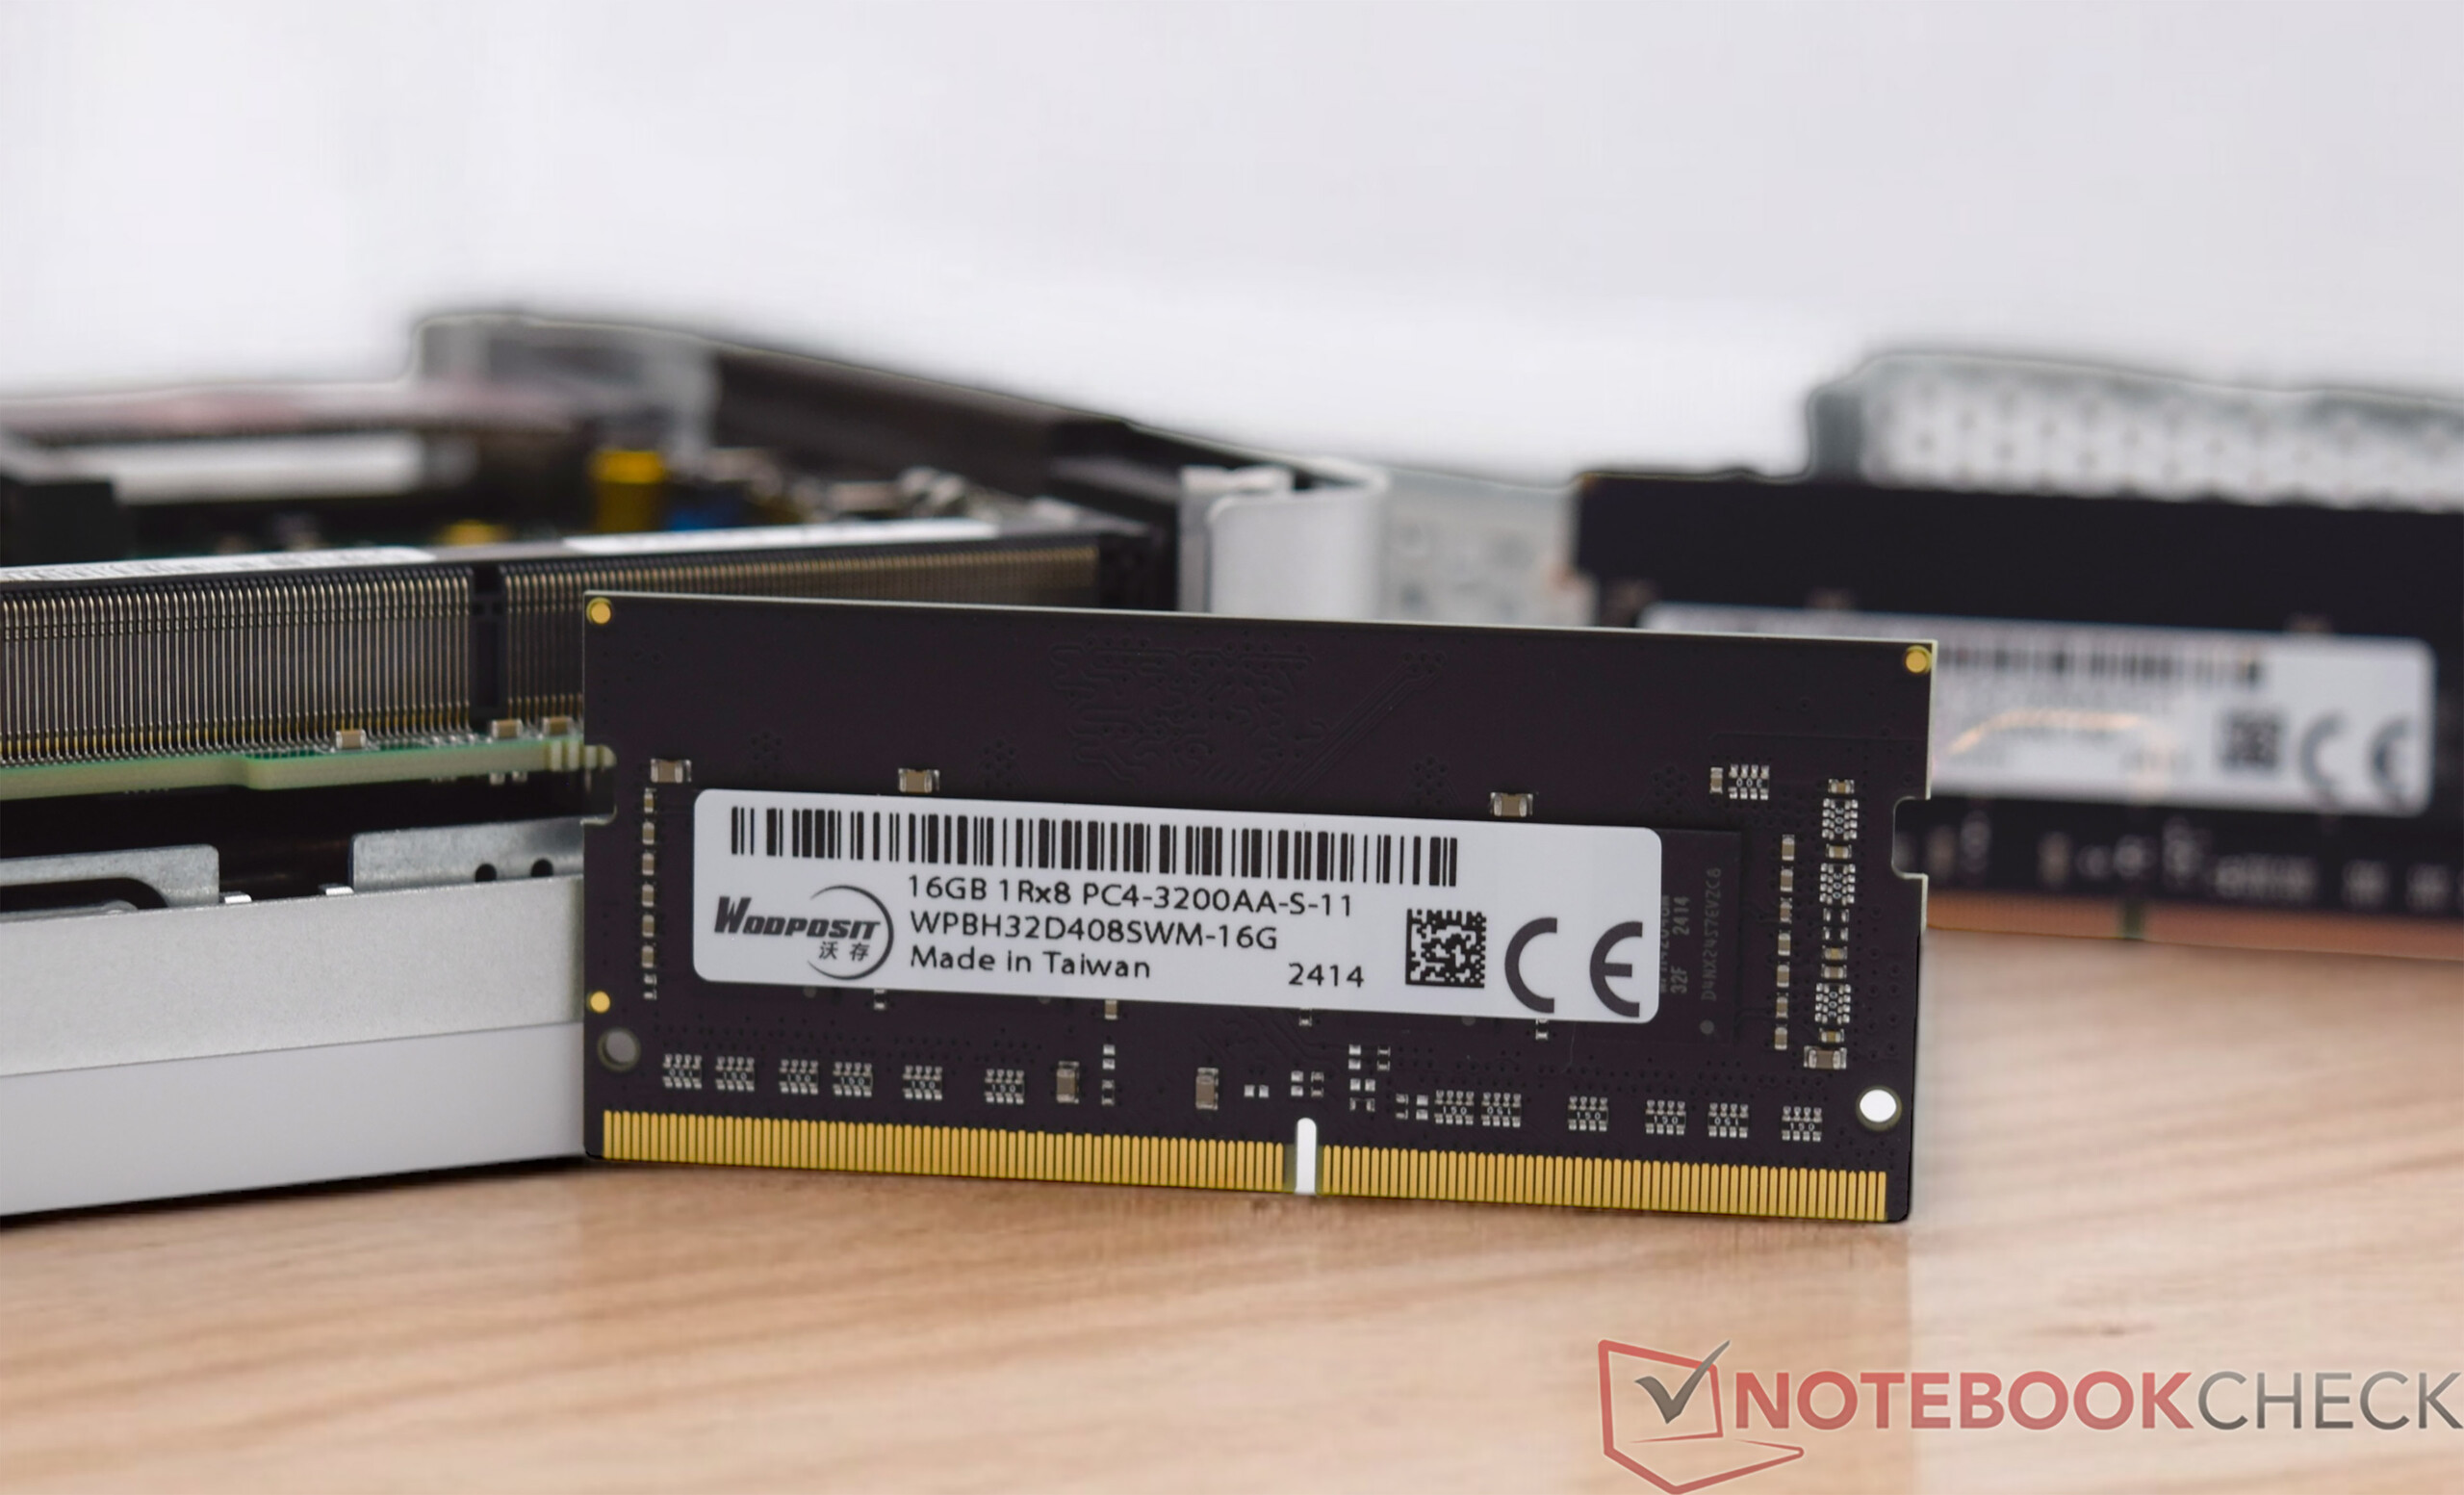
Der Geekom XT13 Pro lässt sich problemlos öffnen. Auf der Unterseite müssen nur vier kleine Schrauben gelöst werden, welche die Bodenplatte am restlichen Gehäuse fixieren. An der Bodenplatte selbst befindet sich ein SSD-Kühler, weshalb man an dieser Stelle etwas vorsichtiger sein sollte. Der Arbeits- und der Massenspeicher sind dann leicht zugänglich. In unserem Fall kann noch eine weitere SSD eingebaut werden. Allerdings muss hier auf den richtigen Standard geachtet werden, denn nur SATA-SSDs mit einer Länge von 42 Millimetern sind kompatibel.
Nachhaltigkeit
Der Geekom XT13 Pro wird in einem vergleichsweise großen Karton mit viel "Luft" geliefert. Das haben wir von Geekom schon anders gesehen. Des Weiteren ist das mitgelieferte Standard-Zubehör in separaten Plastiktüten verpackt, was hinsichtlich der Nachhaltigkeit verbesserungswürdig wäre. Das Gerät selbst ist überwiegend aus Metall und Kunststoff gefertigt. Ob hier jedoch speziell recycelte Materialien für die Herstellung verwendet worden sind, ist uns nicht weiter bekannt. Positiv zu erwähnen ist die 36-monatige Garantie, welche der Hersteller direkt mit anbietet.
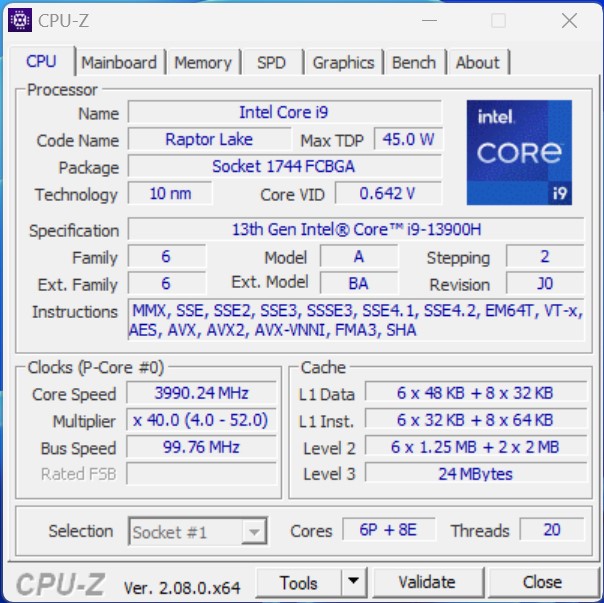
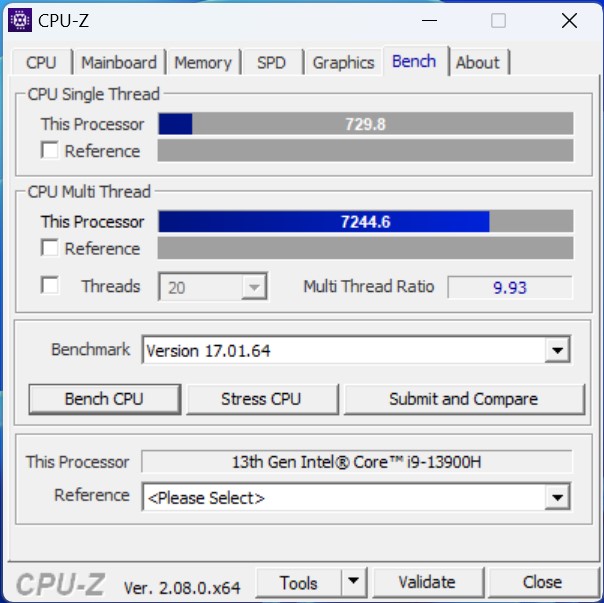
Leistung - Intel Core i9-13900H mit 14 Kernen und 20 Threads
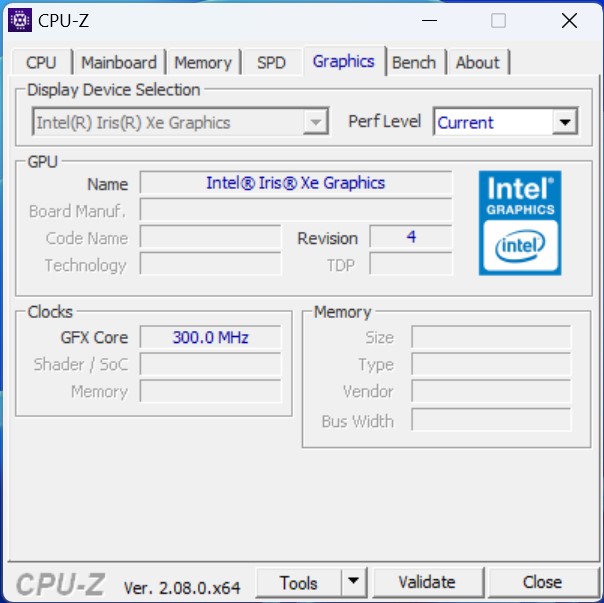
Der Geekom XT13 Pro wird in der Topausstattung mit dem Intel Core i9-13900H ausgeliefert. Alternativ kann man den NUC-PC auch mit einem etwas schwächeren Intel Core i7-13620H bekommen, welcher ebenfalls mit 6P-Kernen ausgestattet ist und in puncto Leistung dem Topmodell nur einen kleinen Nachteil haben sollte. 32 GB DDR4-RAM sind immer mit dabei, wenngleich mit der schnellen NVMe-SSD eine solide Grundausstattung vorhanden ist. Auch leistungshungrige Anwendungen stellen den Geekom XT13 Pro vor keine unüberwindbare Aufgabe. Gleichwohl ist die 3D-Leistung der iGPU die größte Schwachstelle, welche jedoch mit einer eGPU spürbar verbessert werden kann.
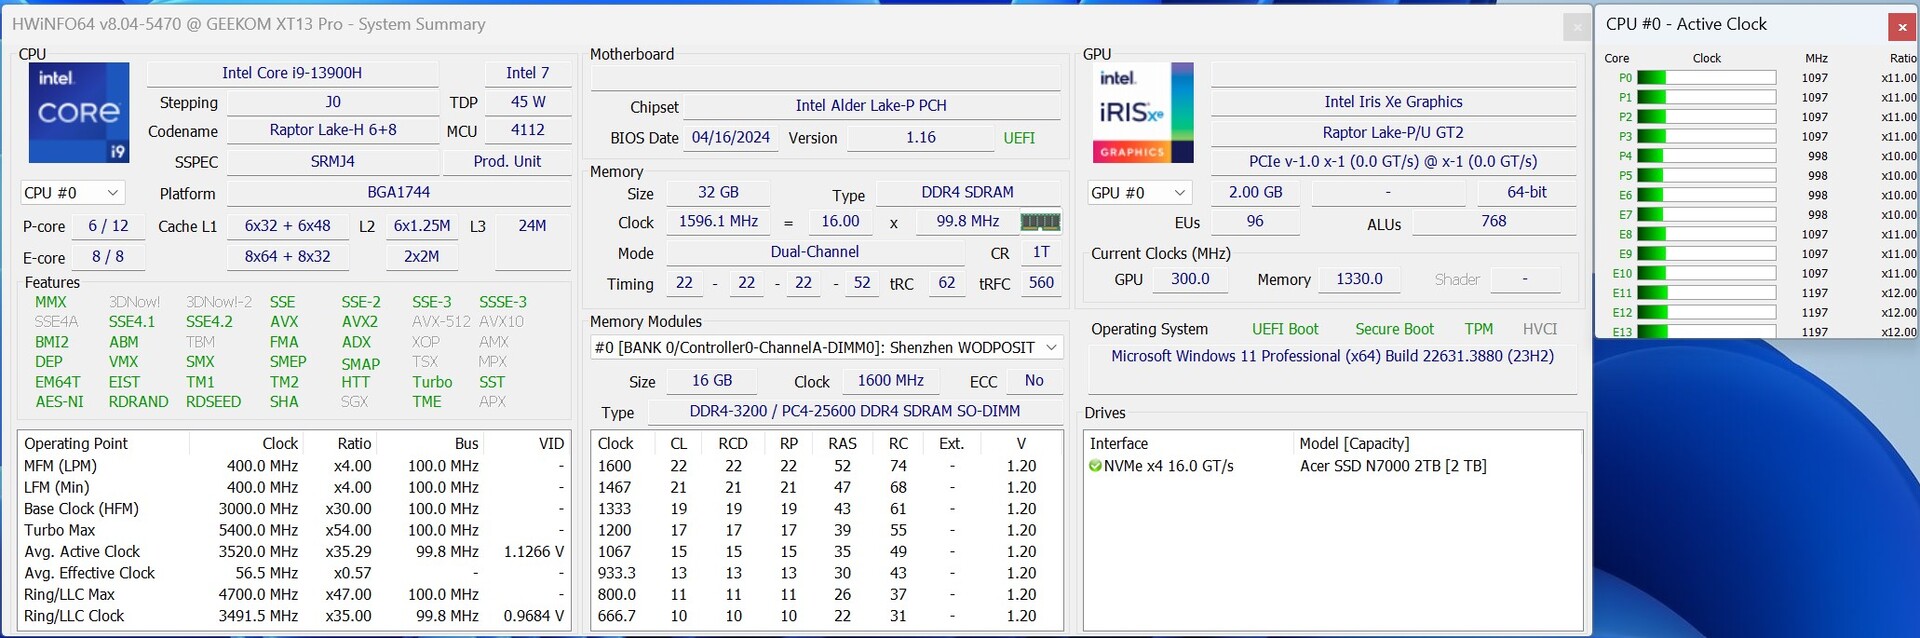
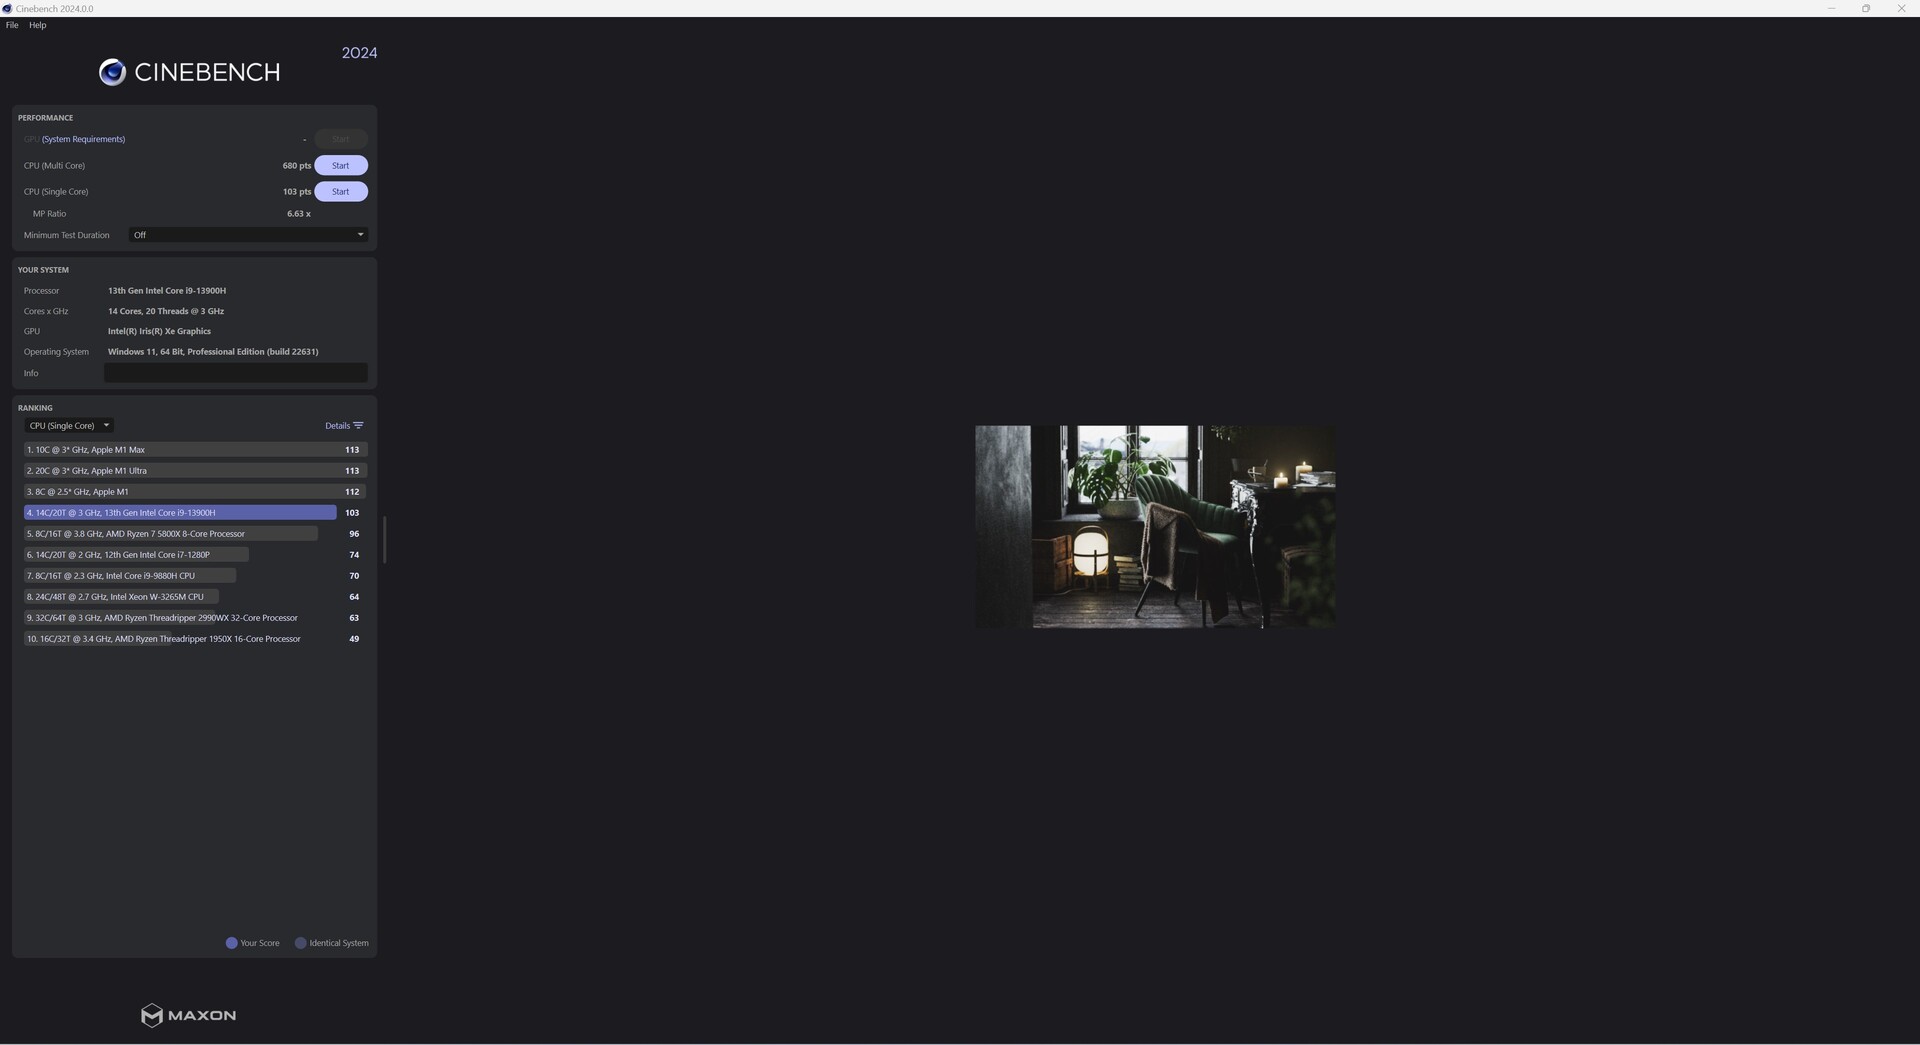
Testbedingungen
Für alle Leistungstests mit dem Geekom XT13 Pro nutzen wir das Energieprofil "Höchstleistung". Abweichungen hierzu gab es nur bei den Energie- und Lautstärkemessungen laut unserer Testkriterien. Gemäß den Herstellervorgaben lässt Geekom das SoC bei der geringsten Leistungsaufnahme arbeiten. In Zahlen bedeutet dies ein Leistungslimit von 35 Watt unter Dauerlast, wenngleich kurzfristig bis zu 64 Watt eingeräumt werden.
Prozessor

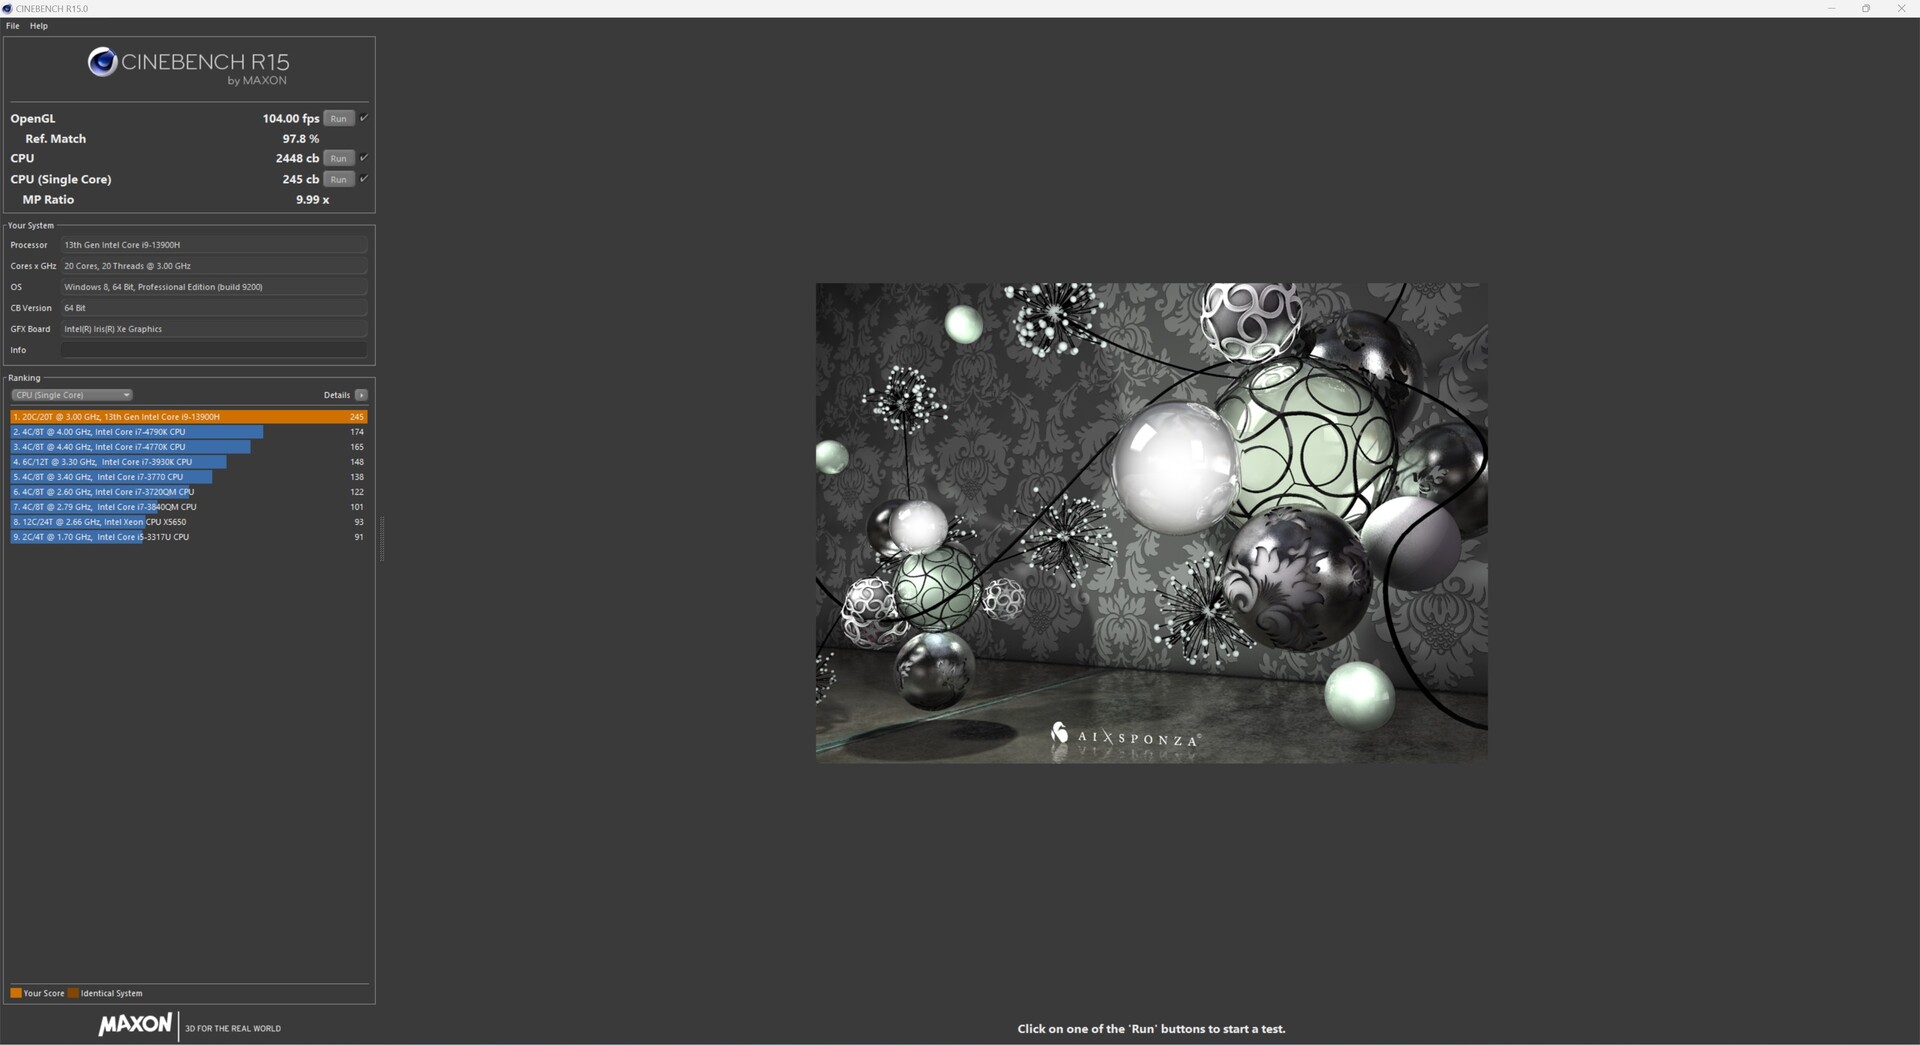
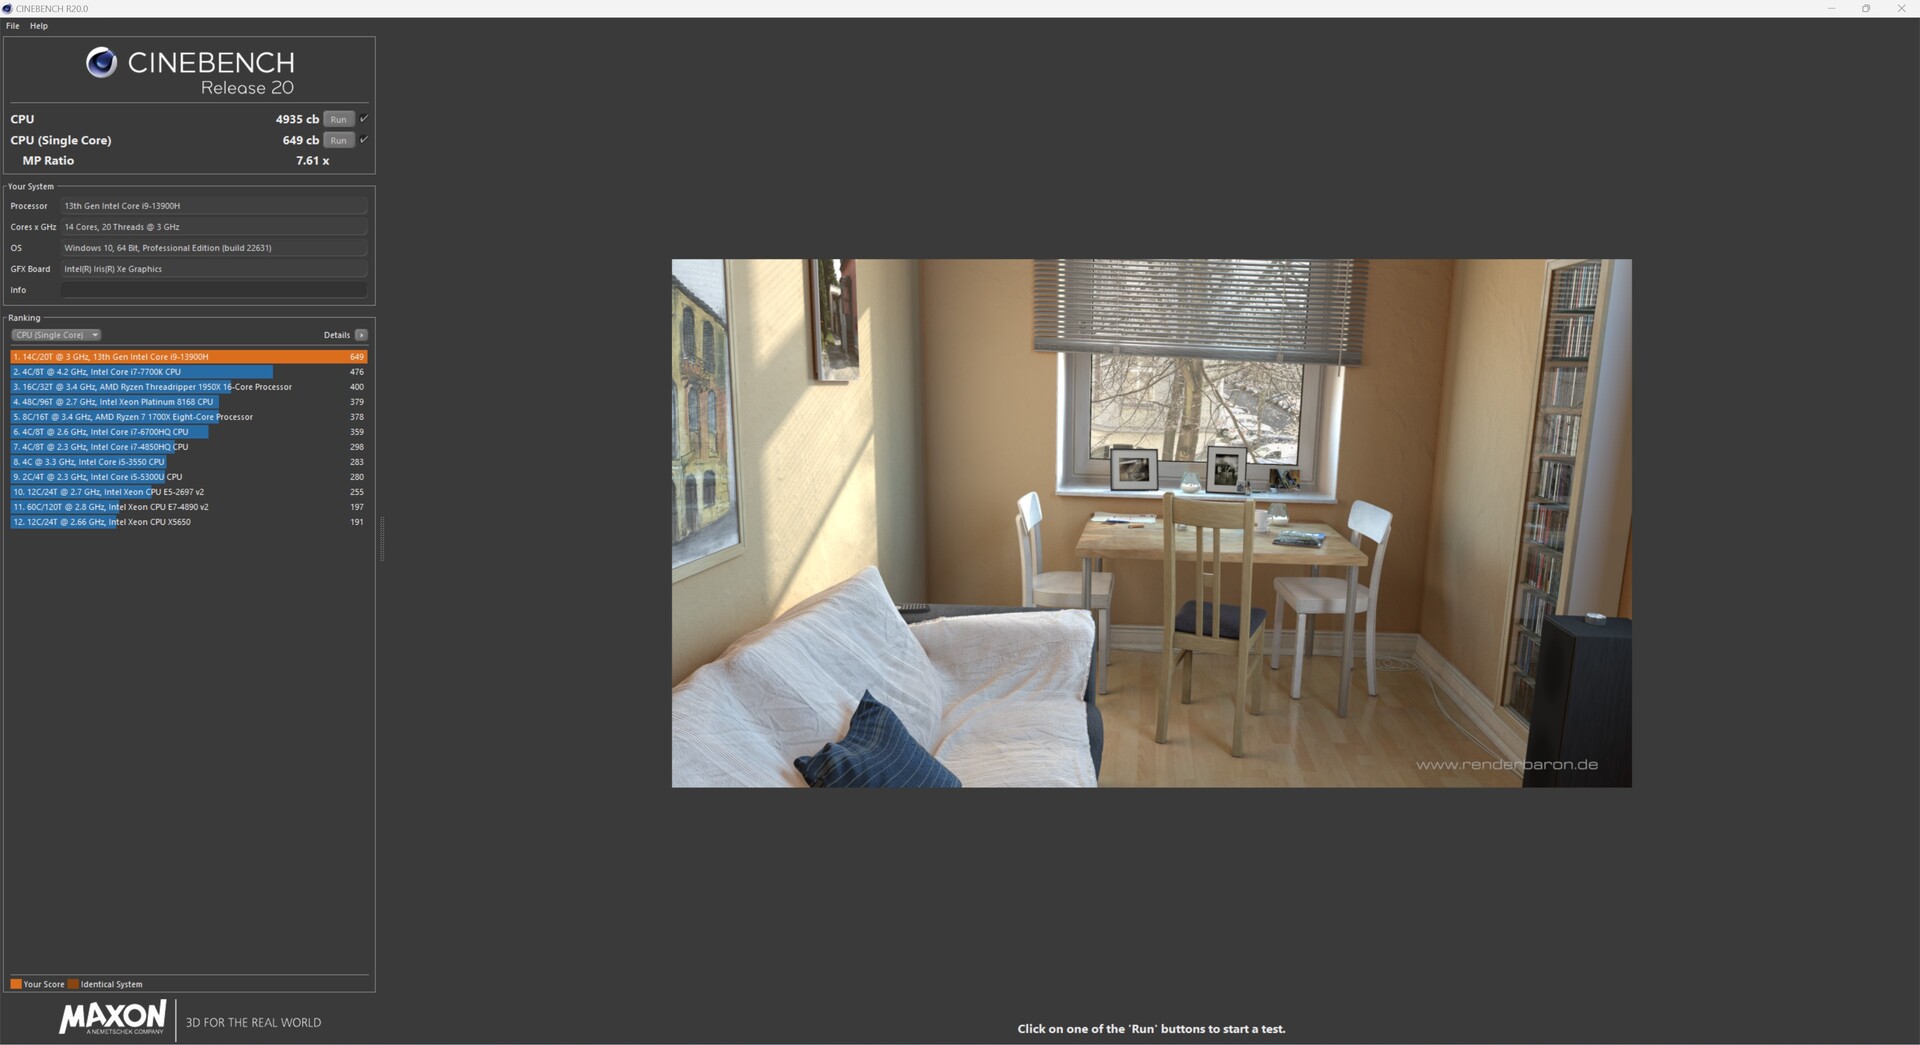
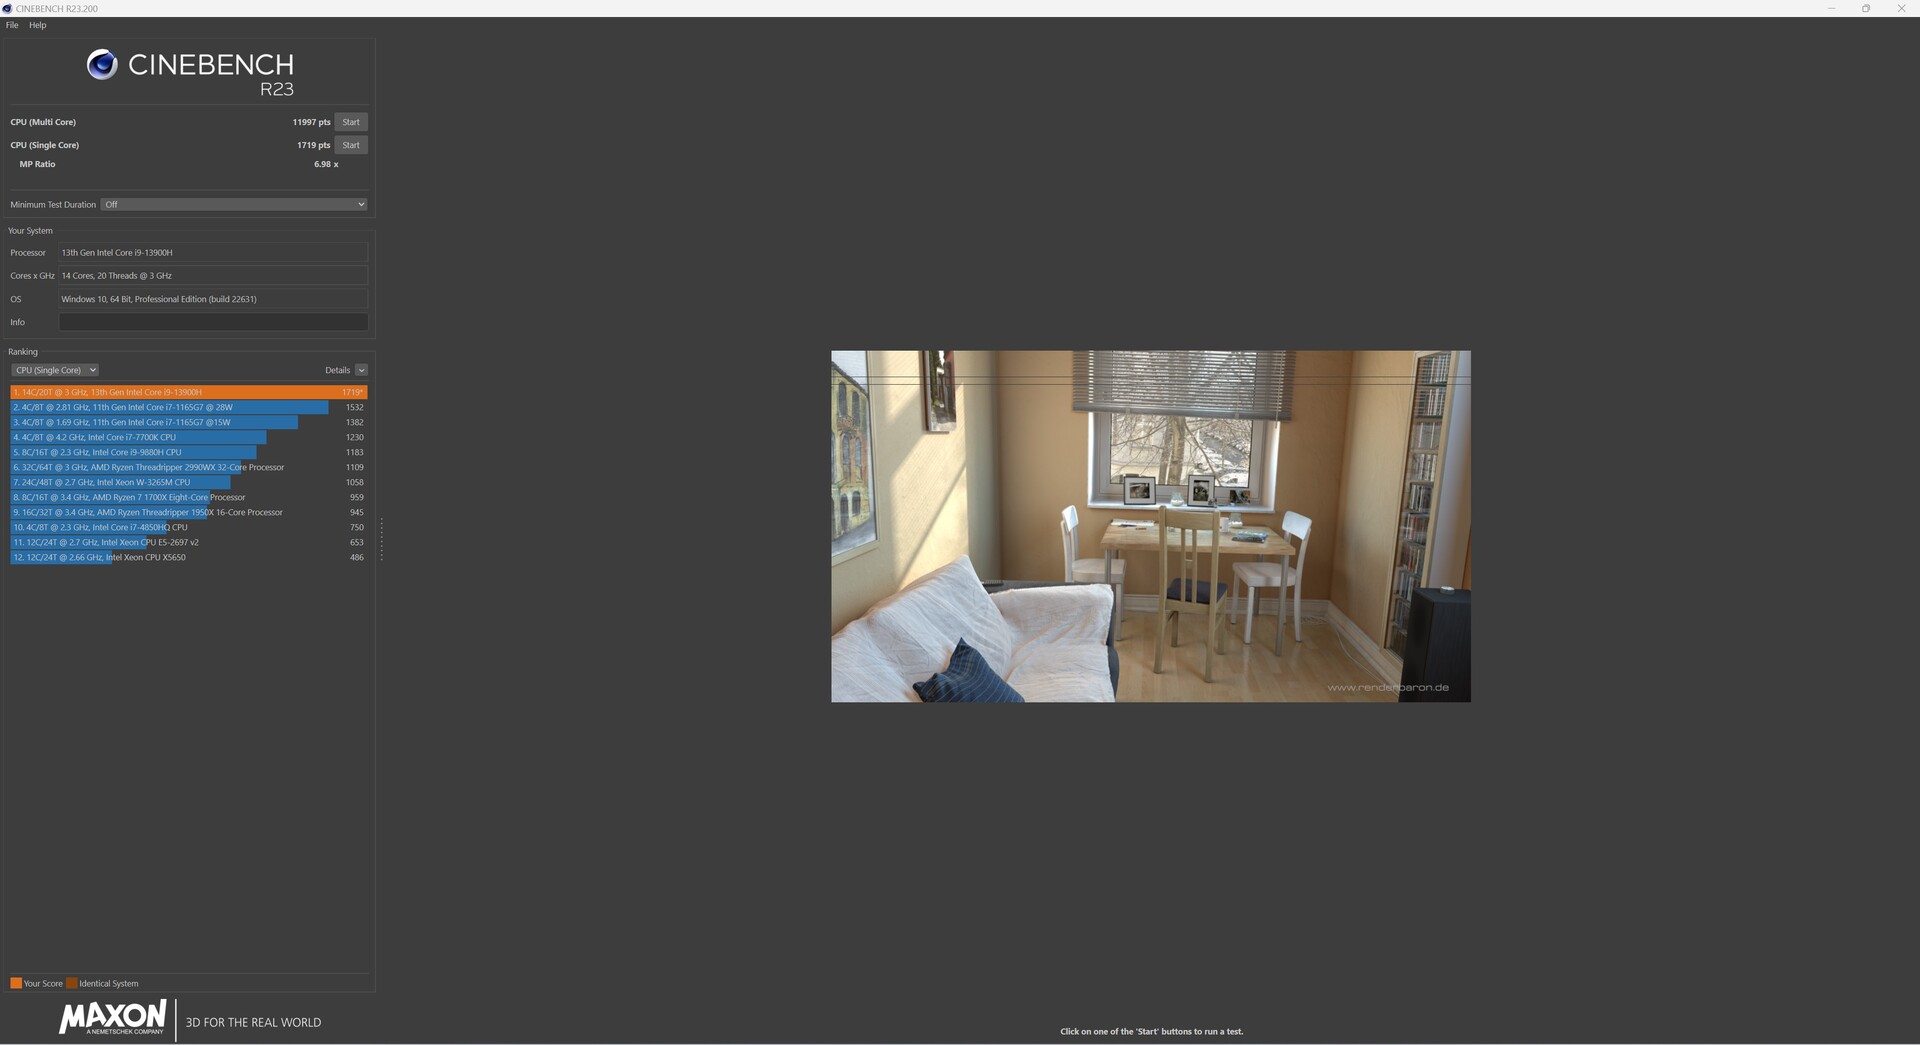
Der Intel Core i9-13900H basiert auf der Raptor-Lake-Architektur und vereint 6P- und 8E-Kerne miteinander. Technisch gibt es zum Intel Core i9-12900H keine signifikanten Unterschiede, was wir anhand unserer Benchmarkergebnisse beim Performance-Rating im Vergleich zum Geekom XT12 Pro sehen. Im Detail sehen wir dann allerdings doch einen kleinen Vorteil zugunsten des Intel Core i9-13900H, der mit einer etwas besseren Multi-Core-Leistung auf sich aufmerksam machen kann. Einen AMD Ryzen 9 7940HS oder Intels neuere Modelle der Meteor-Lake-Serie kann unser Testsample nicht in Bedrängnis bringen. Der Rückstand auf die etwas schnelleren Modelle der Kontrahenten ist jedoch nicht sehr groß. Von einem spürbaren Leistungsunterschied im Alltag kann aufgrund der geringen Unterschiede keine Rede sein.
Weitere Benchmarks zu den Prozessoren finden Sie hier.
| Performance Rating - Percent | |
| Geekom A7 | |
| Aoostar GEM12 | |
| Minisforum AtomMan X7 Ti | |
| Acemagic F2A | |
| Geekom XT13 Pro | |
| Geekom XT12 Pro | |
| Cinebench 2024 | |
| CPU Multi Core | |
| Minisforum AtomMan X7 Ti | |
| Acemagic F2A | |
| Aoostar GEM12 | |
| Geekom A7 | |
| Geekom XT13 Pro | |
| Geekom XT12 Pro | |
| CPU Single Core | |
| Minisforum AtomMan X7 Ti | |
| Geekom A7 | |
| Geekom XT12 Pro | |
| Aoostar GEM12 | |
| Acemagic F2A | |
| Geekom XT13 Pro | |
| Cinebench R15 | |
| CPU Single 64Bit | |
| Aoostar GEM12 | |
| Geekom A7 | |
| Minisforum AtomMan X7 Ti | |
| Acemagic F2A | |
| Geekom XT12 Pro | |
| Geekom XT13 Pro | |
| CPU Multi 64Bit | |
| Minisforum AtomMan X7 Ti | |
| Acemagic F2A | |
| Aoostar GEM12 | |
| Geekom A7 | |
| Geekom XT13 Pro | |
| Geekom XT12 Pro | |
| Cinebench R20 | |
| CPU (Single Core) | |
| Minisforum AtomMan X7 Ti | |
| Geekom XT12 Pro | |
| Geekom A7 | |
| Aoostar GEM12 | |
| Acemagic F2A | |
| Geekom XT13 Pro | |
| CPU (Multi Core) | |
| Minisforum AtomMan X7 Ti | |
| Acemagic F2A | |
| Aoostar GEM12 | |
| Geekom A7 | |
| Geekom XT13 Pro | |
| Geekom XT12 Pro | |
| Cinebench R11.5 | |
| CPU Single 64Bit | |
| Geekom A7 | |
| Aoostar GEM12 | |
| Minisforum AtomMan X7 Ti | |
| Acemagic F2A | |
| Geekom XT12 Pro | |
| Geekom XT13 Pro | |
| CPU Multi 64Bit | |
| Minisforum AtomMan X7 Ti | |
| Acemagic F2A | |
| Geekom A7 | |
| Aoostar GEM12 | |
| Geekom XT13 Pro | |
| Geekom XT12 Pro | |
| Cinebench R10 | |
| Rendering Single CPUs 64Bit | |
| Minisforum AtomMan X7 Ti | |
| Geekom A7 | |
| Aoostar GEM12 | |
| Acemagic F2A | |
| Geekom XT13 Pro | |
| Geekom XT12 Pro | |
| Rendering Multiple CPUs 64Bit | |
| Acemagic F2A | |
| Minisforum AtomMan X7 Ti | |
| Aoostar GEM12 | |
| Geekom A7 | |
| Geekom XT13 Pro | |
| Geekom XT12 Pro | |
| Blender - v2.79 BMW27 CPU | |
| Geekom XT12 Pro | |
| Geekom XT13 Pro | |
| Geekom A7 | |
| Aoostar GEM12 | |
| Acemagic F2A | |
| Minisforum AtomMan X7 Ti | |
| wPrime 2.10 | |
| 32m | |
| Geekom XT12 Pro | |
| Acemagic F2A | |
| Geekom XT13 Pro | |
| Minisforum AtomMan X7 Ti | |
| Aoostar GEM12 | |
| Geekom A7 | |
| 1024m | |
| Minisforum AtomMan X7 Ti | |
| Geekom XT13 Pro | |
| Geekom XT12 Pro | |
| Acemagic F2A | |
| Aoostar GEM12 | |
| Geekom A7 | |
| WinRAR - Result | |
| Geekom XT12 Pro | |
| Minisforum AtomMan X7 Ti | |
| Acemagic F2A | |
| Geekom A7 | |
| Aoostar GEM12 | |
| Geekom XT13 Pro | |
| Geekbench 5.0 | |
| 5.0 Multi-Core | |
| Minisforum AtomMan X7 Ti | |
| Acemagic F2A | |
| Geekom A7 | |
| Aoostar GEM12 | |
| Geekom XT13 Pro | |
| Geekom XT12 Pro | |
| 5.0 Single-Core | |
| Geekom A7 | |
| Aoostar GEM12 | |
| Minisforum AtomMan X7 Ti | |
| Geekom XT12 Pro | |
| Acemagic F2A | |
| Geekom XT13 Pro | |
| Geekbench 4.4 | |
| 64 Bit Single-Core Score | |
| Geekom A7 | |
| Aoostar GEM12 | |
| Geekom XT12 Pro | |
| Minisforum AtomMan X7 Ti | |
| Geekom XT13 Pro | |
| Acemagic F2A | |
| 64 Bit Multi-Core Score | |
| Geekom A7 | |
| Minisforum AtomMan X7 Ti | |
| Aoostar GEM12 | |
| Acemagic F2A | |
| Geekom XT13 Pro | |
| Geekom XT12 Pro | |
| 3DMark 11 - 1280x720 Performance Physics | |
| Geekom A7 | |
| Minisforum AtomMan X7 Ti | |
| Aoostar GEM12 | |
| Acemagic F2A | |
| Geekom XT13 Pro | |
| Geekom XT12 Pro | |
| HWBOT x265 Benchmark v2.2 - 4k Preset | |
| Minisforum AtomMan X7 Ti | |
| Geekom A7 | |
| Aoostar GEM12 | |
| Acemagic F2A | |
| Geekom XT13 Pro | |
| Geekom XT12 Pro | |
| R Benchmark 2.5 - Overall mean | |
| Geekom XT13 Pro | |
| Acemagic F2A | |
| Geekom XT12 Pro | |
| Minisforum AtomMan X7 Ti | |
| Aoostar GEM12 | |
| Geekom A7 | |
| LibreOffice - 20 Documents To PDF | |
| Geekom A7 | |
| Minisforum AtomMan X7 Ti | |
| Aoostar GEM12 | |
| Geekom XT13 Pro | |
| Acemagic F2A | |
| Geekom XT12 Pro | |
| WebXPRT 3 - Overall | |
| Geekom A7 | |
| Aoostar GEM12 | |
| Geekom XT12 Pro | |
| Acemagic F2A | |
| Geekom XT13 Pro | |
| Minisforum AtomMan X7 Ti | |
| Mozilla Kraken 1.1 - Total | |
| Geekom XT13 Pro | |
| Acemagic F2A | |
| Minisforum AtomMan X7 Ti | |
| Aoostar GEM12 | |
| Geekom XT12 Pro | |
| Geekom A7 | |
| 3DMark | |
| 1920x1080 Fire Strike Physics | |
| Aoostar GEM12 | |
| Minisforum AtomMan X7 Ti | |
| Geekom A7 | |
| Acemagic F2A | |
| Geekom XT13 Pro | |
| Geekom XT12 Pro | |
| 2560x1440 Time Spy CPU | |
| Minisforum AtomMan X7 Ti | |
| Aoostar GEM12 | |
| Geekom A7 | |
| Acemagic F2A | |
| Geekom XT13 Pro | |
| Geekom XT12 Pro | |
| Super Pi mod 1.5 XS 1M - 1M | |
| Geekom XT13 Pro | |
| Geekom XT12 Pro | |
| Geekom A7 | |
| Aoostar GEM12 | |
| Acemagic F2A | |
| Minisforum AtomMan X7 Ti | |
| Super Pi mod 1.5 XS 2M - 2M | |
| Geekom A7 | |
| Aoostar GEM12 | |
| Geekom XT13 Pro | |
| Geekom XT12 Pro | |
| Acemagic F2A | |
| Minisforum AtomMan X7 Ti | |
| Super Pi Mod 1.5 XS 32M - 32M | |
| Aoostar GEM12 | |
| Geekom A7 | |
| Geekom XT13 Pro | |
| Geekom XT12 Pro | |
| Acemagic F2A | |
| Minisforum AtomMan X7 Ti | |
* ... kleinere Werte sind besser
AIDA64: FP32 Ray-Trace | FPU Julia | CPU SHA3 | CPU Queen | FPU SinJulia | FPU Mandel | CPU AES | CPU ZLib | FP64 Ray-Trace | CPU PhotoWorxx
| Performance Rating | |
| Geekom A7 | |
| Aoostar GEM12 | |
| Minisforum AtomMan X7 Ti | |
| Acemagic F2A | |
| Durchschnitt der Klasse Mini PC | |
| Geekom XT13 Pro | |
| Geekom XT12 Pro | |
| AIDA64 / FP32 Ray-Trace | |
| Aoostar GEM12 | |
| Geekom A7 | |
| Durchschnitt der Klasse Mini PC (974 - 82725, n=103, der letzten 2 Jahre) | |
| Acemagic F2A | |
| Minisforum AtomMan X7 Ti | |
| Geekom XT13 Pro | |
| Geekom XT12 Pro | |
| AIDA64 / FPU Julia | |
| Aoostar GEM12 | |
| Geekom A7 | |
| Minisforum AtomMan X7 Ti | |
| Acemagic F2A | |
| Durchschnitt der Klasse Mini PC (6115 - 227429, n=103, der letzten 2 Jahre) | |
| Geekom XT13 Pro | |
| Geekom XT12 Pro | |
| AIDA64 / CPU SHA3 | |
| Geekom A7 | |
| Aoostar GEM12 | |
| Minisforum AtomMan X7 Ti | |
| Acemagic F2A | |
| Durchschnitt der Klasse Mini PC (385 - 9475, n=103, der letzten 2 Jahre) | |
| Geekom XT13 Pro | |
| Geekom XT12 Pro | |
| AIDA64 / CPU Queen | |
| Geekom A7 | |
| Aoostar GEM12 | |
| Geekom XT13 Pro | |
| Durchschnitt der Klasse Mini PC (19025 - 184747, n=103, der letzten 2 Jahre) | |
| Acemagic F2A | |
| Minisforum AtomMan X7 Ti | |
| Geekom XT12 Pro | |
| AIDA64 / FPU SinJulia | |
| Aoostar GEM12 | |
| Geekom A7 | |
| Durchschnitt der Klasse Mini PC (985 - 31931, n=103, der letzten 2 Jahre) | |
| Minisforum AtomMan X7 Ti | |
| Acemagic F2A | |
| Geekom XT13 Pro | |
| Geekom XT12 Pro | |
| AIDA64 / FPU Mandel | |
| Aoostar GEM12 | |
| Geekom A7 | |
| Durchschnitt der Klasse Mini PC (3322 - 121827, n=103, der letzten 2 Jahre) | |
| Acemagic F2A | |
| Minisforum AtomMan X7 Ti | |
| Geekom XT13 Pro | |
| Geekom XT12 Pro | |
| AIDA64 / CPU AES | |
| Geekom A7 | |
| Minisforum AtomMan X7 Ti | |
| Acemagic F2A | |
| Geekom XT13 Pro | |
| Geekom XT12 Pro | |
| Durchschnitt der Klasse Mini PC (8752 - 325960, n=102, der letzten 2 Jahre) | |
| Aoostar GEM12 | |
| AIDA64 / CPU ZLib | |
| Minisforum AtomMan X7 Ti | |
| Acemagic F2A | |
| Aoostar GEM12 | |
| Geekom A7 | |
| Durchschnitt der Klasse Mini PC (127.2 - 2431, n=103, der letzten 2 Jahre) | |
| Geekom XT13 Pro | |
| Geekom XT12 Pro | |
| AIDA64 / FP64 Ray-Trace | |
| Aoostar GEM12 | |
| Geekom A7 | |
| Durchschnitt der Klasse Mini PC (537 - 43587, n=103, der letzten 2 Jahre) | |
| Acemagic F2A | |
| Minisforum AtomMan X7 Ti | |
| Geekom XT13 Pro | |
| Geekom XT12 Pro | |
| AIDA64 / CPU PhotoWorxx | |
| Minisforum AtomMan X7 Ti | |
| Geekom A7 | |
| Aoostar GEM12 | |
| Durchschnitt der Klasse Mini PC (8069 - 94259, n=103, der letzten 2 Jahre) | |
| Acemagic F2A | |
| Geekom XT13 Pro | |
| Geekom XT12 Pro | |
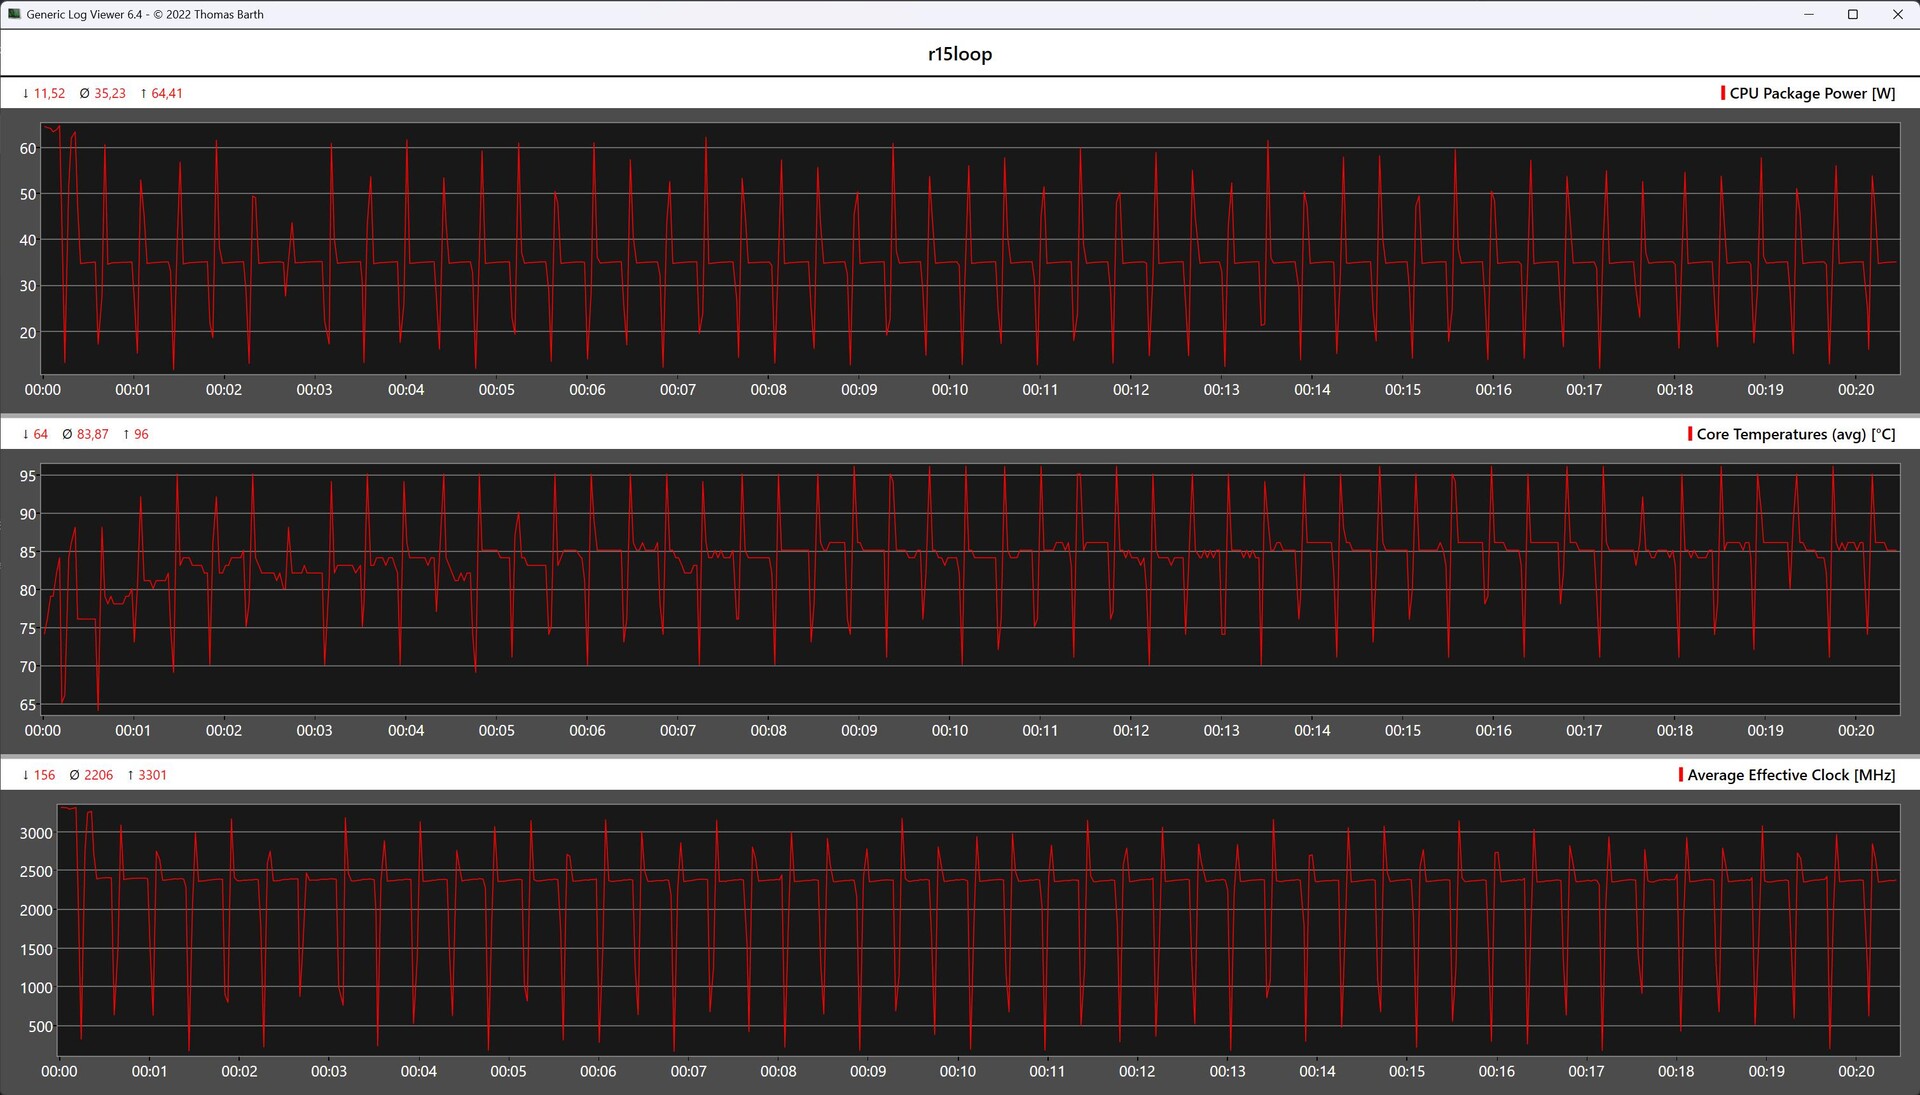
Cinebench R15 Multi Dauertest
Die Cinebench-R15-Dauerschleife unseres Testsamples verläuft fast parallel zu der des Geekom XT12 Pro. Schlussendlich kann sich das neuere XT13-Pro-Modell dann aber mit einem deutlichen Vorsprung absetzen. Zu erkennen ist auch, dass es die kleine Kühlung nicht schafft, den Turbo des SoC über einen längeren Zeitraum aufrechtzuerhalten. Das maximale Leistungslimit von 64 Watt wird nur kurzzeitig erreicht, weil infolge der hohen Temperaturen die Leistungsaufnahme gedrosselt werden muss.
System Performance
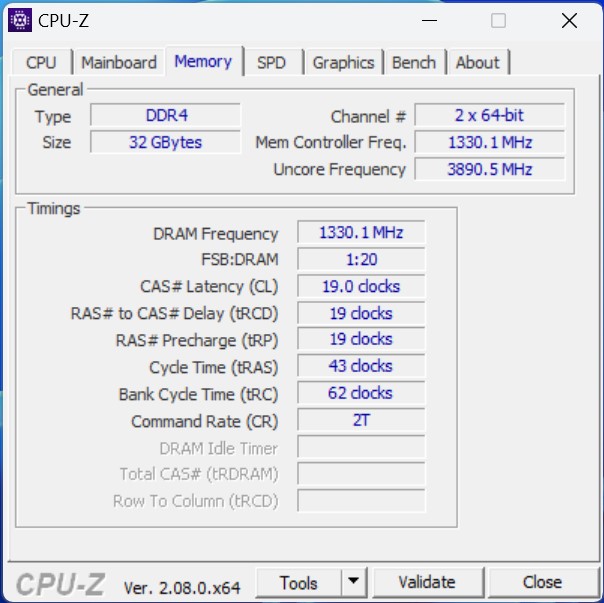
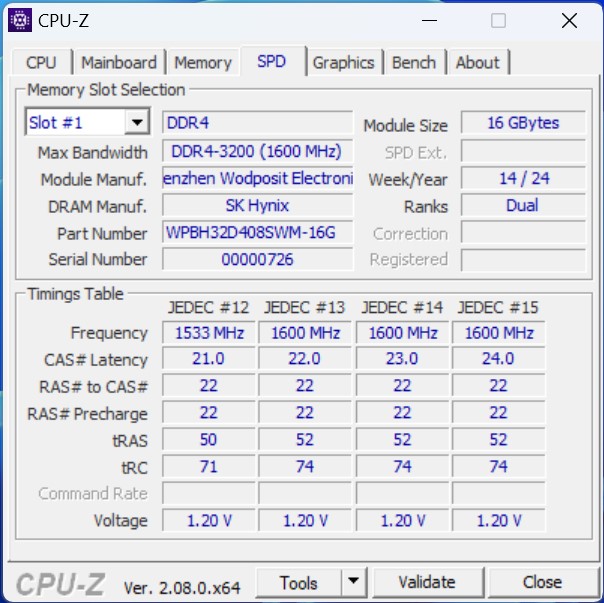
Bei den Tests hinsichtlich der Systemleistung reicht die dokumentierte Performance des Geekom XT13 Pro nur für eine Platzierung auf den hinteren Plätzen. Subjektiv können wir aber sagen, dass der Geekom XT13 Pro eine ordentliche Leistung bietet. Auffällige Latenzen haben wir während der Testphase beim Arbeiten mit dem Gerät nicht beobachten können. Bei der Wahl des Arbeitsspeichers rächt sich der Griff zum langsameren DDR4-Standard, wie man den AIDA64-Benchmarks entnehmen kann. Technisch könnte der Intel Core i9-13900H mit DDR5 (5.200 MT/s) kombiniert werden.
| AIDA64 / Memory Copy | |
| Minisforum AtomMan X7 Ti | |
| Aoostar GEM12 | |
| Geekom A7 | |
| Acemagic F2A | |
| Durchschnitt der Klasse Mini PC (15933 - 163031, n=103, der letzten 2 Jahre) | |
| Geekom XT13 Pro | |
| Geekom XT12 Pro | |
| AIDA64 / Memory Read | |
| Minisforum AtomMan X7 Ti | |
| Acemagic F2A | |
| Geekom A7 | |
| Aoostar GEM12 | |
| Durchschnitt der Klasse Mini PC (14143 - 123769, n=103, der letzten 2 Jahre) | |
| Geekom XT12 Pro | |
| Geekom XT13 Pro | |
| AIDA64 / Memory Write | |
| Geekom A7 | |
| Aoostar GEM12 | |
| Minisforum AtomMan X7 Ti | |
| Durchschnitt der Klasse Mini PC (10630 - 216693, n=103, der letzten 2 Jahre) | |
| Acemagic F2A | |
| Geekom XT13 Pro | |
| Geekom XT12 Pro | |
| AIDA64 / Memory Latency | |
| Acemagic F2A | |
| Minisforum AtomMan X7 Ti | |
| Durchschnitt der Klasse Mini PC (82.3 - 184.8, n=103, der letzten 2 Jahre) | |
| Geekom A7 | |
| Aoostar GEM12 | |
| Geekom XT13 Pro | |
| Geekom XT12 Pro | |
* ... kleinere Werte sind besser
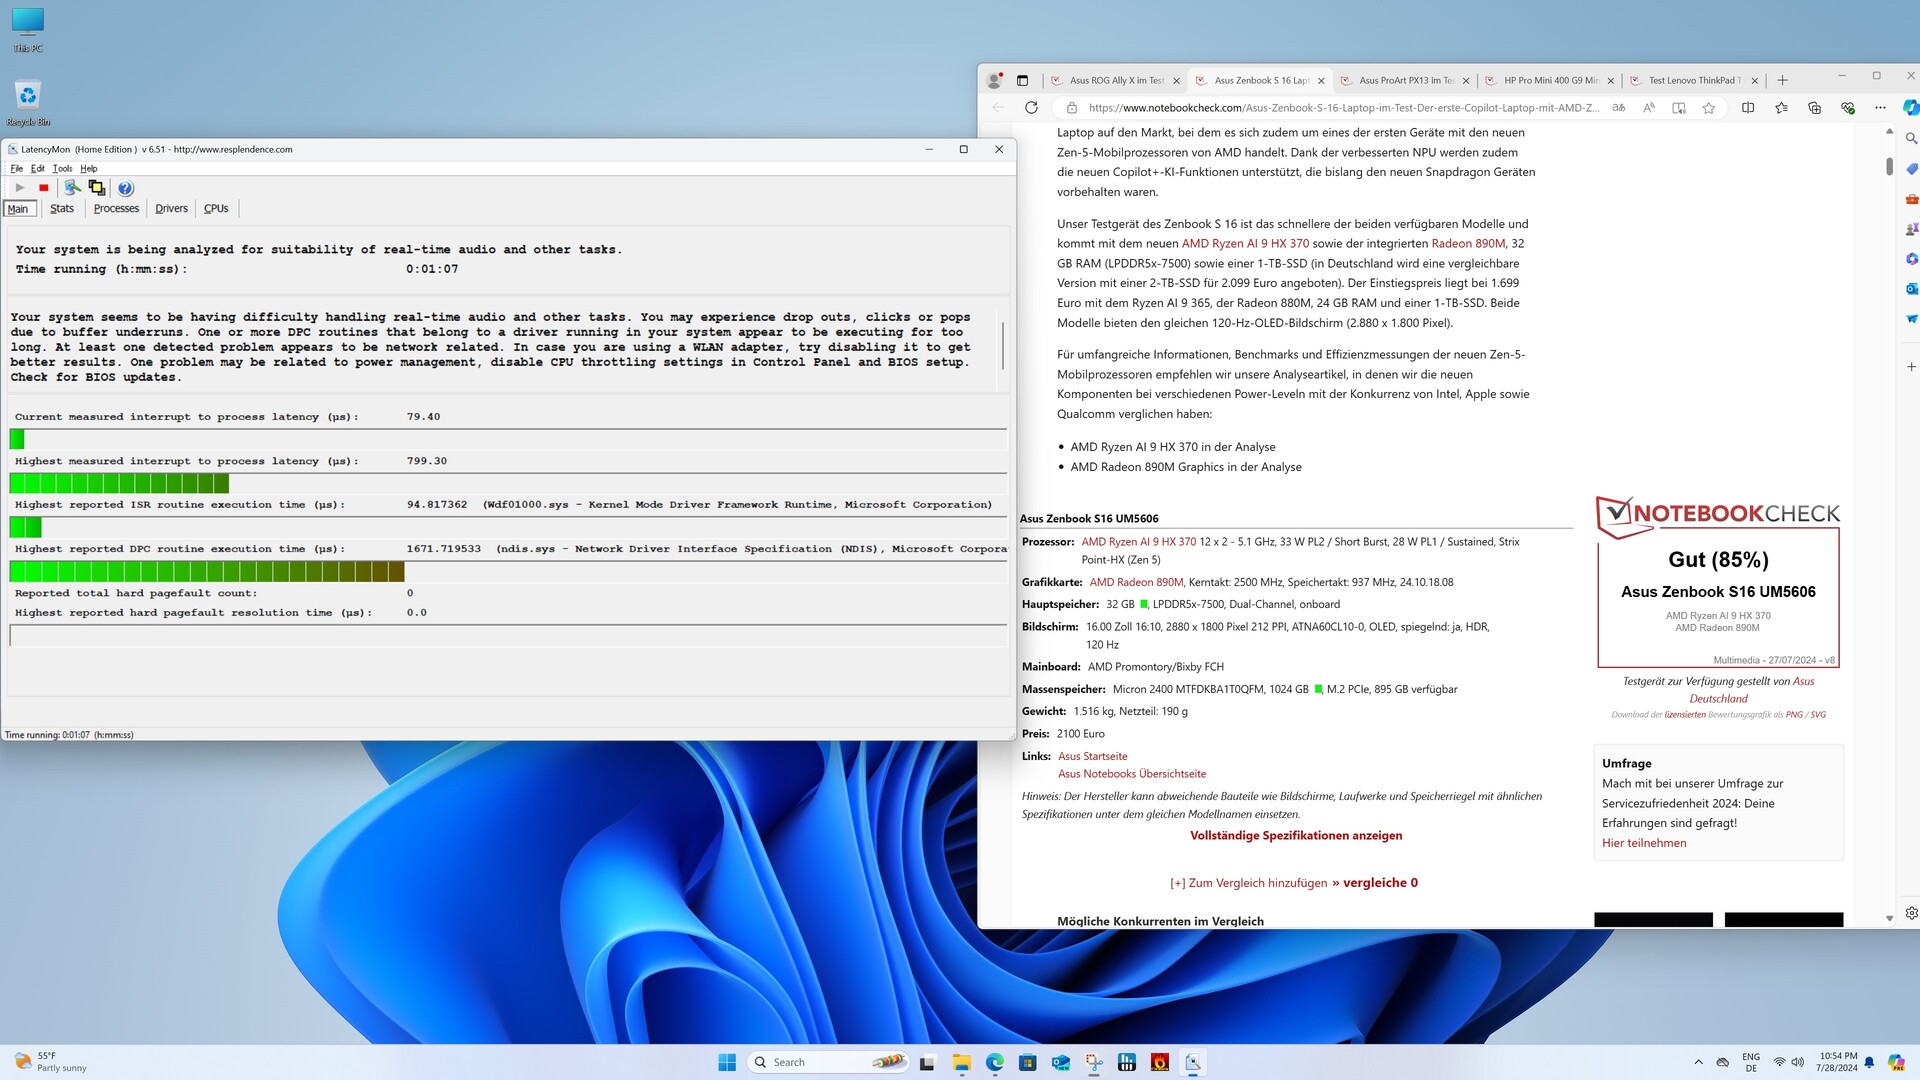
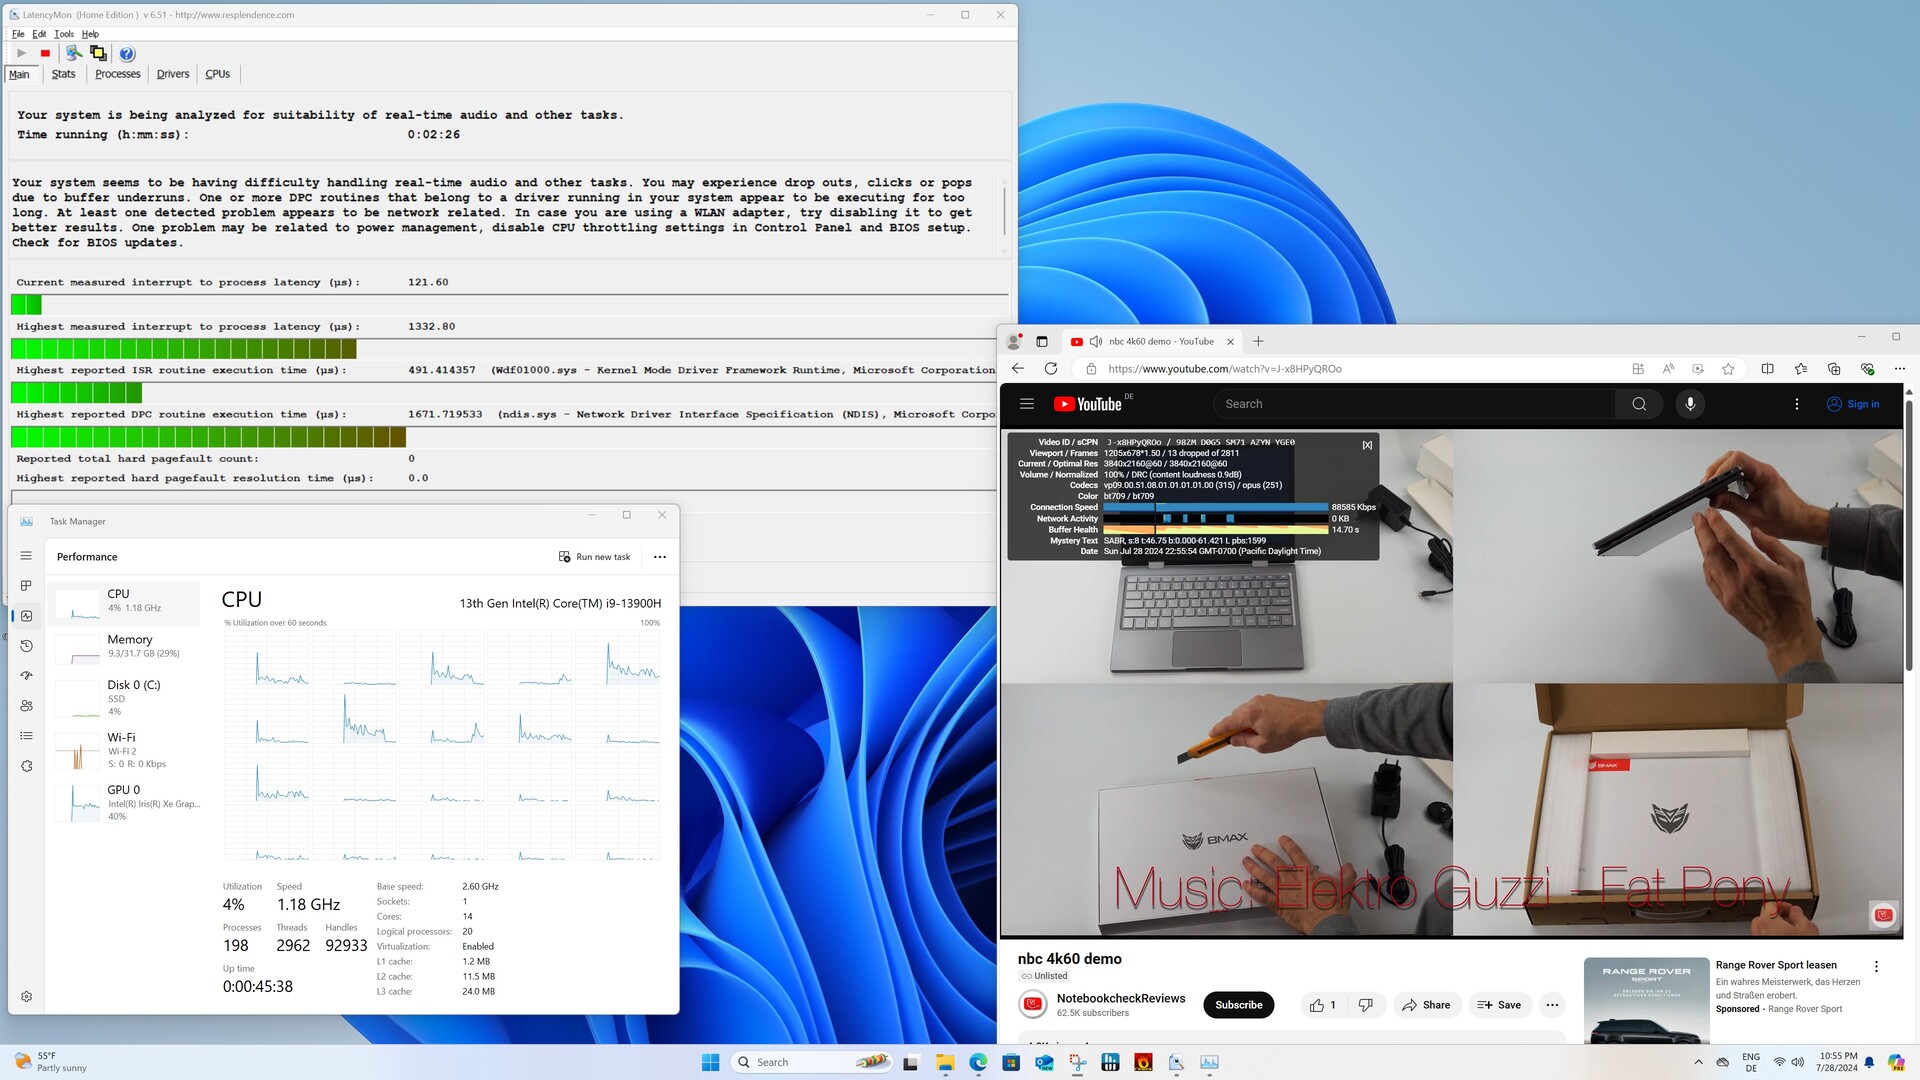
DPC-Latenzen
Extrem ausufernde DPC-Latenzen sehen wir beim Geekom XT13 Pro nicht. Das sah beim Geekom XT12 Pro noch deutlich anders aus. Von hervorragenden Ergebnissen ist unser Testsample dennoch weit entfernt. Den Maximalwert erreichen wir schon beim einfachen Surfen mit dem Edge-Browser.

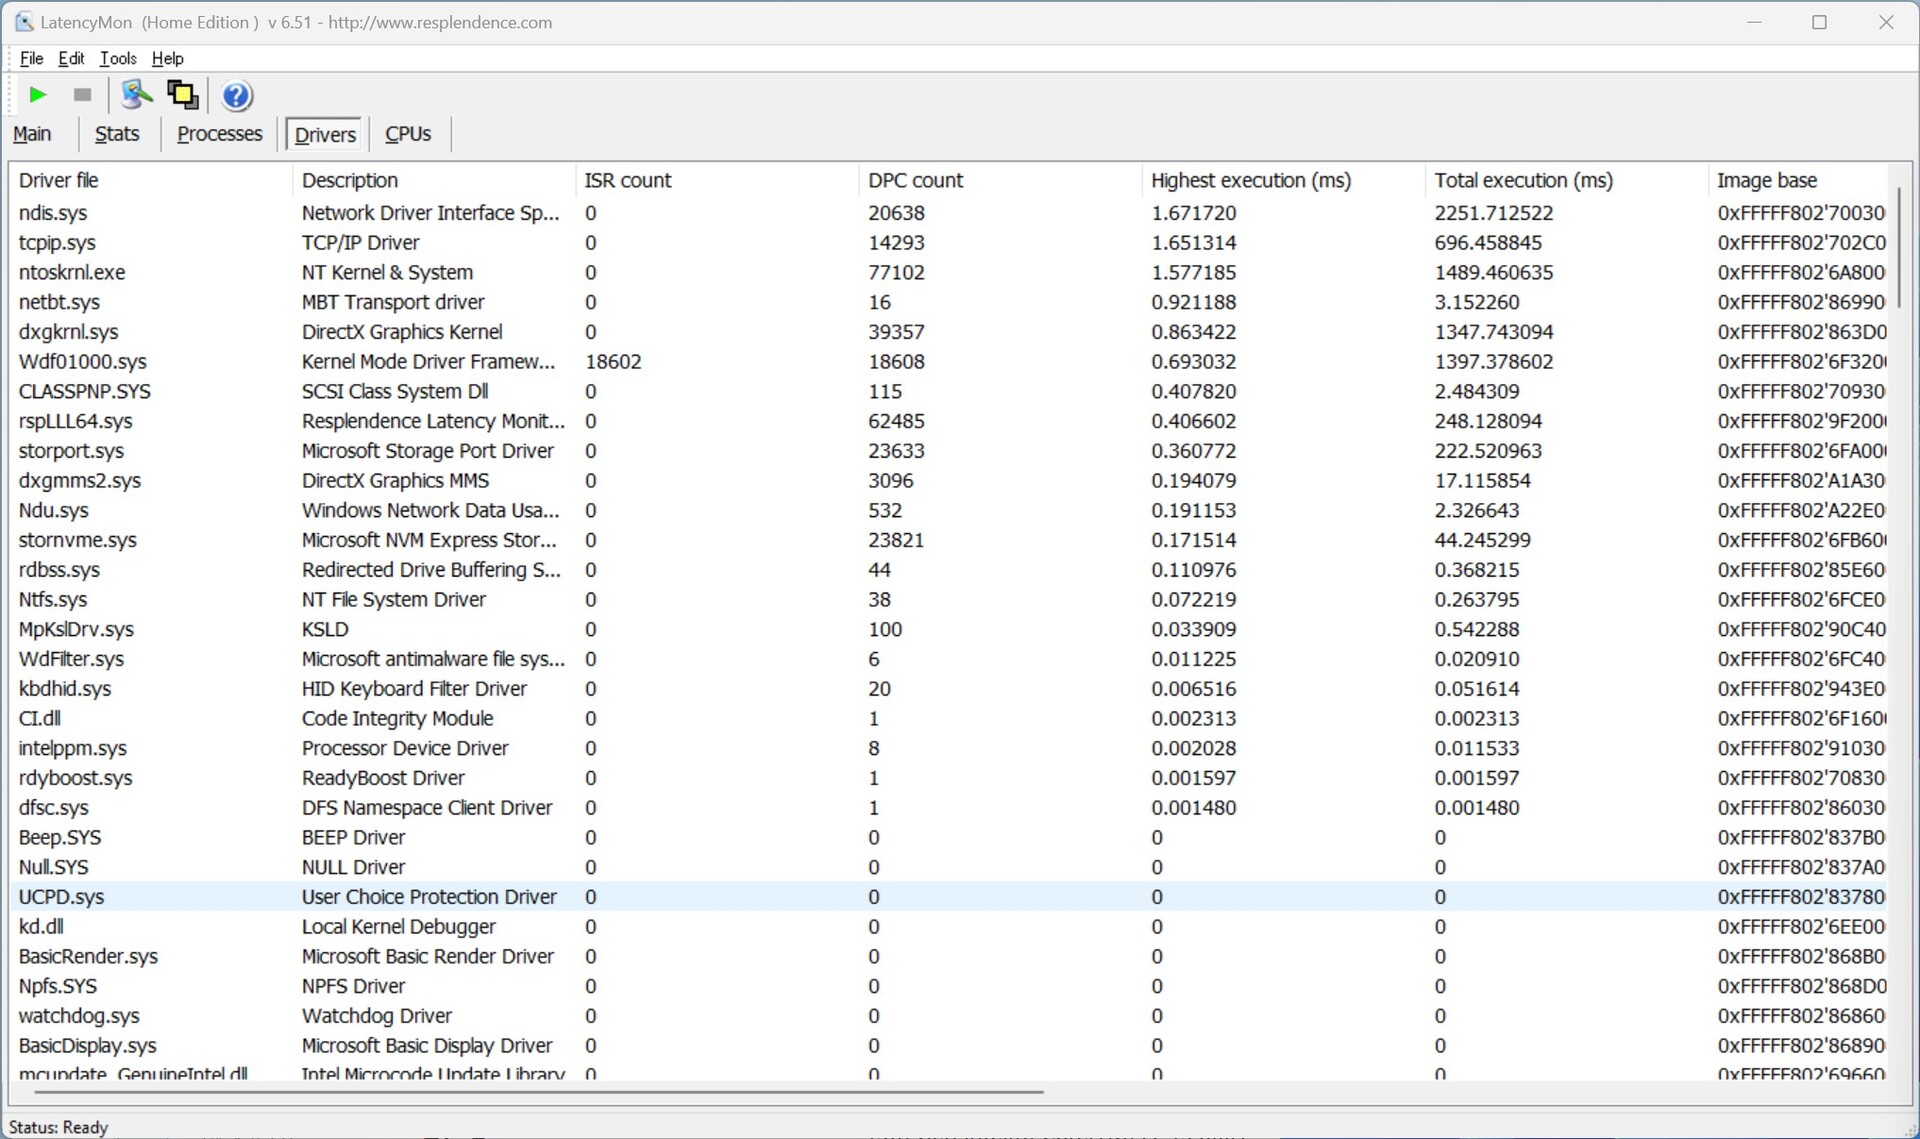
| DPC Latencies / LatencyMon - interrupt to process latency (max), Web, Youtube, Prime95 | |
| Acemagic F2A | |
| Geekom XT12 Pro | |
| Minisforum AtomMan X7 Ti | |
| Geekom XT13 Pro | |
| Geekom A7 | |
| Aoostar GEM12 | |
* ... kleinere Werte sind besser
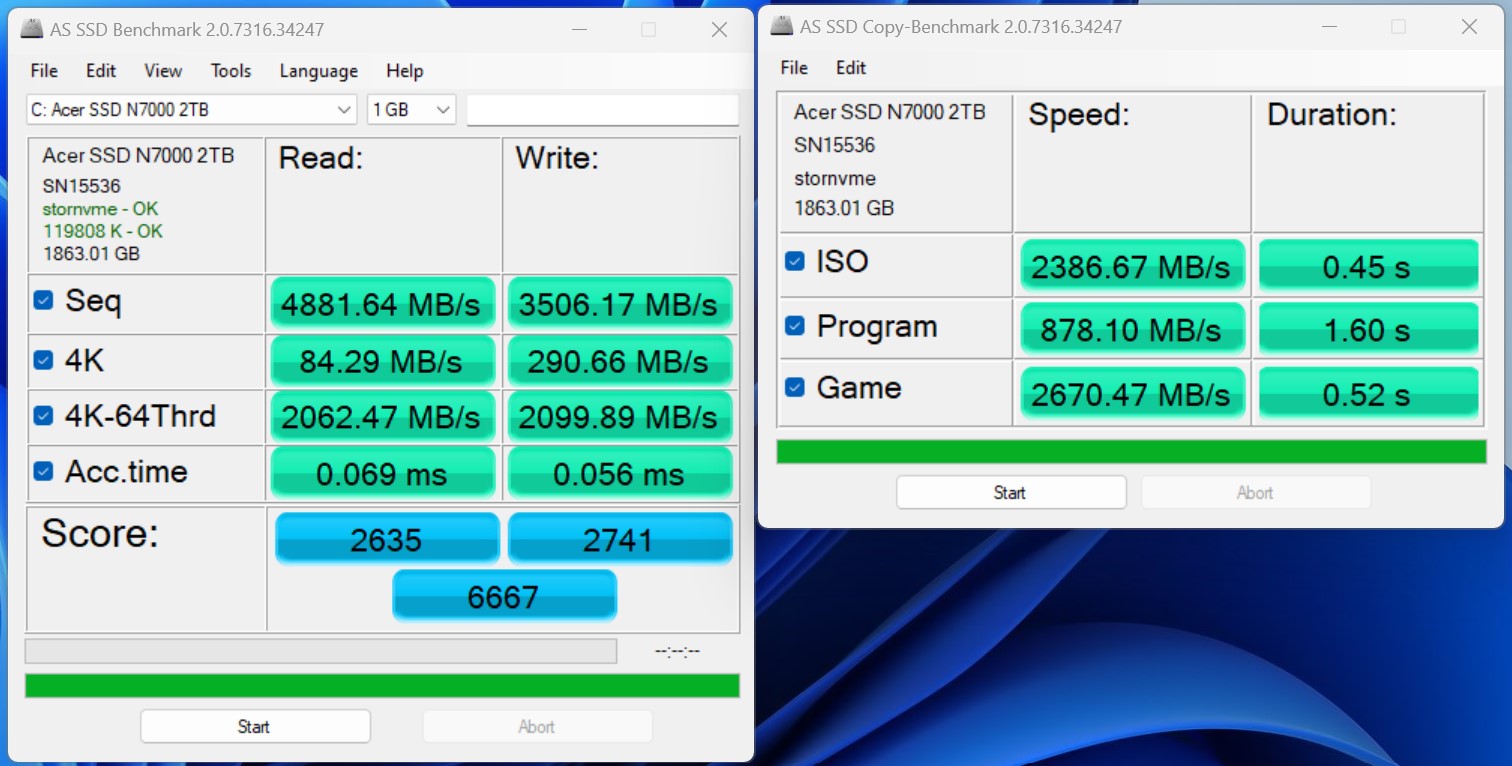
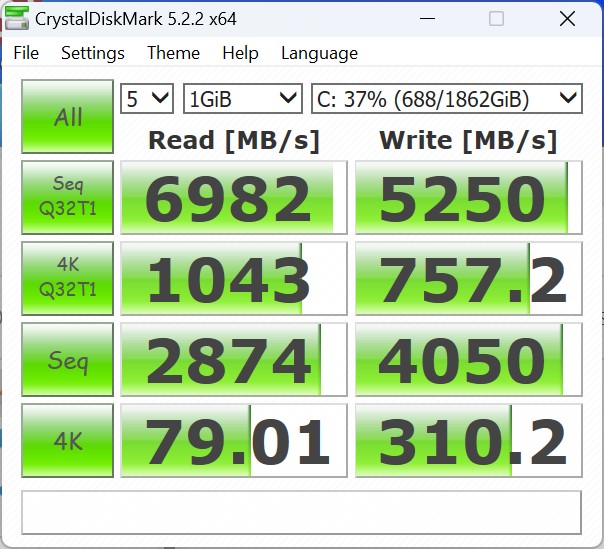
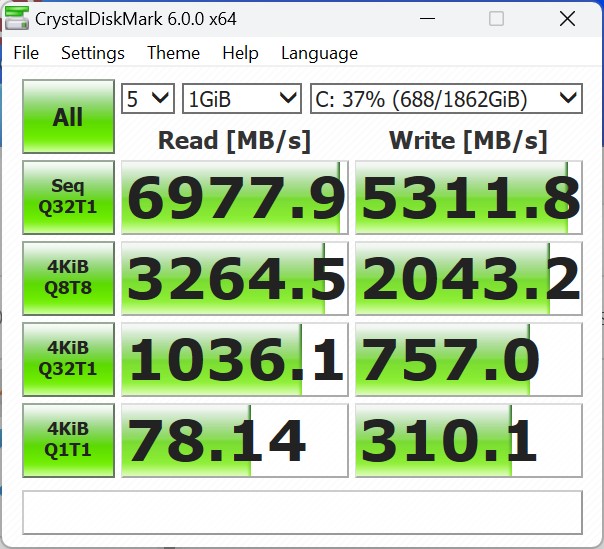
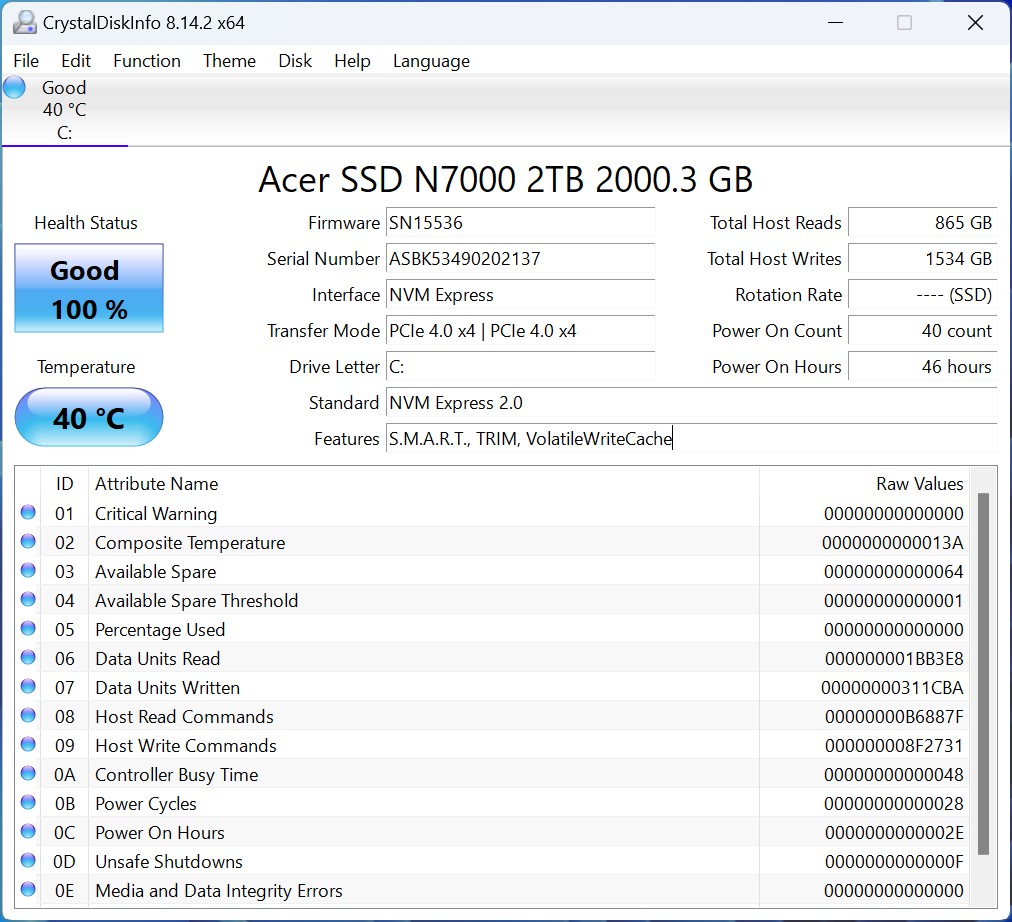
Massenspeicher
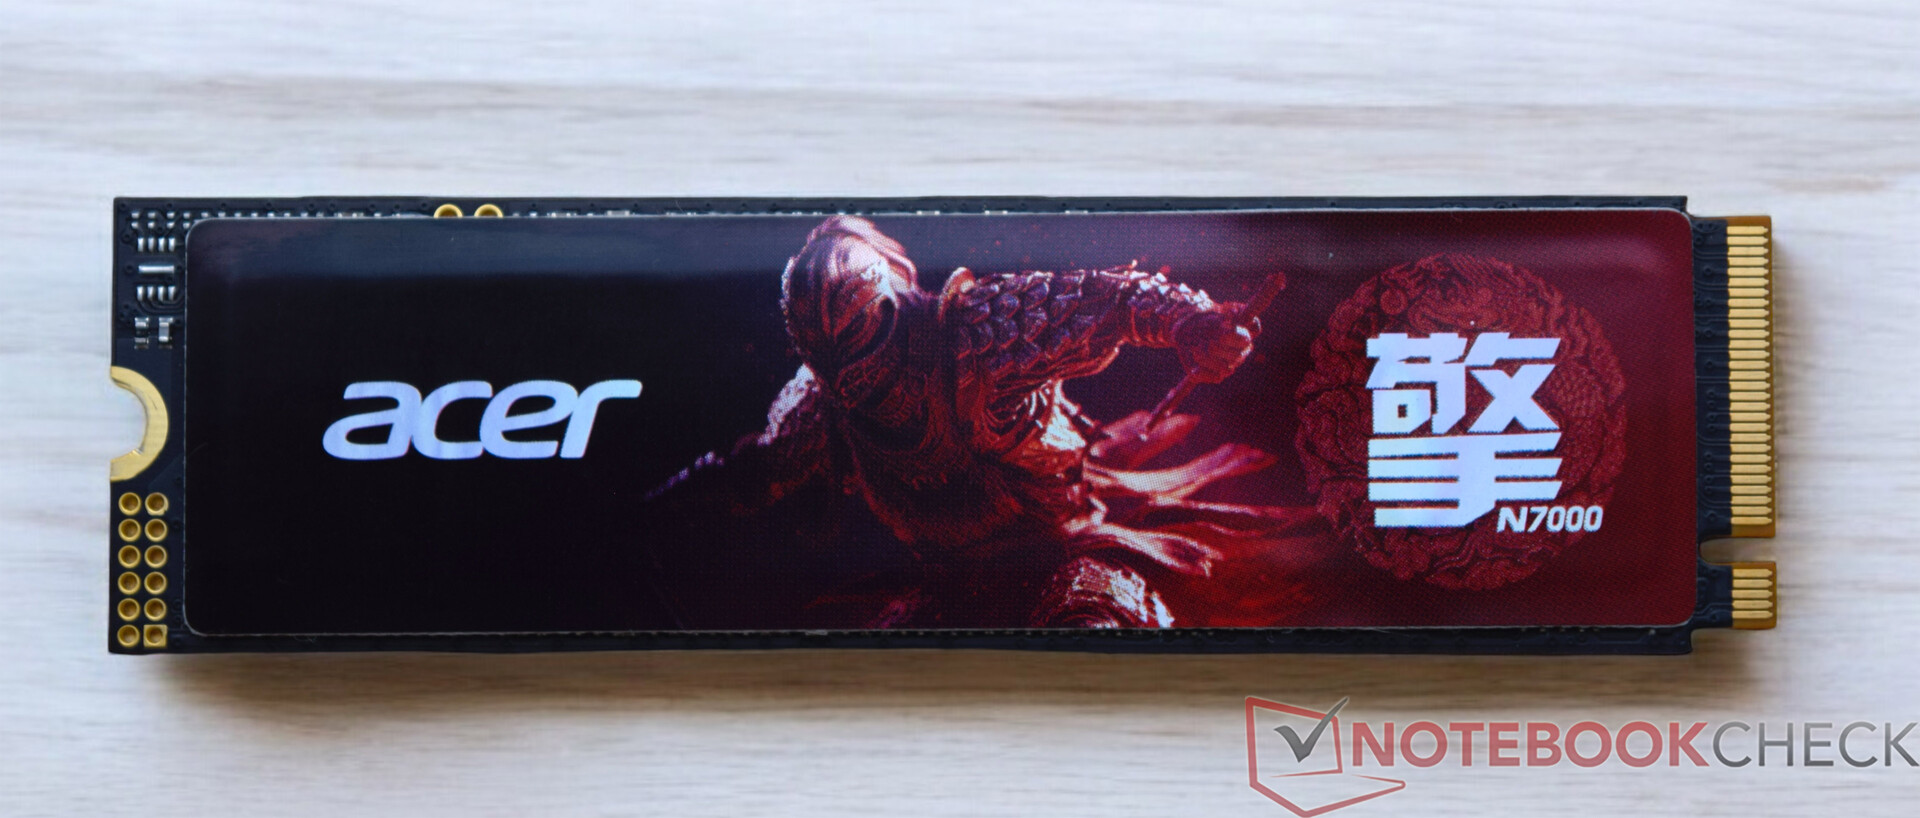
Im Geekom XT13 Pro wird eine SSD mit 2 TB Speicherplatz aus dem Hause Acer verbaut. Das gleiche Modell steckte bereits im Geekom GT13 und lieferte über alle Tests hinweg eine tolle Leistung. Die technische Anbindung ist optimal und die daraus resultierenden Transferraten fallen sehr hoch aus. Unter Dauerlast hat die Acer N7000 leichte Probleme, die Leseleistung stabil zu halten. Ein extremer Nachteil ergibt sich glücklicherweise nicht. Wie der Grafik zu entnehmen ist, kann die Acer N7000 auch mit reduzierter Leseleistung noch bedeutend besser abschneiden als beim Geekom XT12 Pro oder beim Acemagic F2A. Der Test des Geekom XT12 Pro offenbarte ein Problem mit der Position des Wärmeleitpads, dieses gibt es beim Geekom XT13 Pro nicht. Die Wärmeleitpads befinden sich an der richtigen Position. Wie wir schon beim Thema Wartung erwähnt haben, kann im Geekom XT13 Pro noch eine weitere SSD installiert werden. Allerdings unterstützt der zweite M.2-Slot nur SATA-SSDs mit einer Länge von 42 Millimetern (M.2-2242).
Für weitere Vergleiche und Benchmarks verweisen wir auf unsere Vergleichstabelle.

| Drive Performance Rating - Percent | |
| Aoostar GEM12 | |
| Geekom XT13 Pro | |
| Geekom XT12 Pro | |
| Minisforum AtomMan X7 Ti | |
| Geekom A7 | |
| Durchschnitt der Klasse Mini PC | |
| Acemagic F2A | |
* ... kleinere Werte sind besser
Dauerleistung Lesen: DiskSpd Read Loop, Queue Depth 8
Grafikkarte
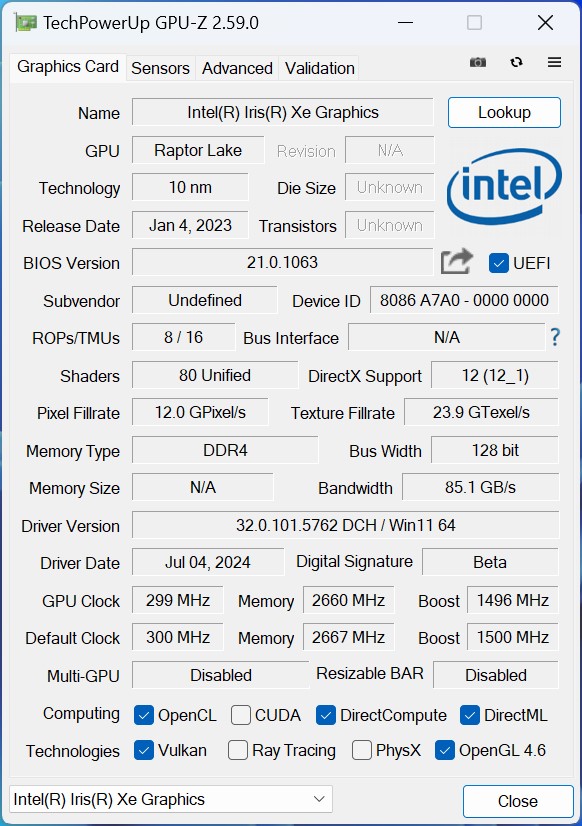
Die Intel Iris Xe Graphics G7 übernimmt die 3D-Berechnungen und ist für die Bildausgabe zuständig. Mit 96 EUs kommt im Intel Core i9-13900H das schnellste Modell der Serie zum Einsatz. Doch das inzwischen betagte Modell hat es schwer, sich gegen die modernen Vertreter durchzusetzen. Hätte Geekom bereits beim XT13 Pro den Schritt gewagt, ein Meteor-Lake-SoC zu verbauen, wäre ein deutlich spürbarer Leistungszuwachs bei der 3D-Performance zu erwarten gewesen. Was eine Intel Arc 8-Core iGPU leistet, kann man den Vergleichsdaten perfekt entnehmen. Noch etwas mehr 3D-Leistung bekommt man derweil, wenn eine AMD Radeon 780M im System verbaut ist. Geekom selbst bietet inzwischen einige Geräte mit dieser iGPU an, womit sich der Hersteller in dieser Disziplin das Leben selbst schwer macht. Als Beispiel dazu kann man sich den Geekom A7, den Geekom A8 oder auch den Geekom AE7 anschauen.
Weitere Vergleiche und Benchmarks entnehmen Sie bitte unserer GPU-Vergleichstabelle.
| 3DMark Performance Rating - Percent | |
| Geekom A7 | |
| Aoostar GEM12 | |
| Acemagic F2A | |
| Minisforum AtomMan X7 Ti | |
| Geekom XT13 Pro | |
| Geekom XT12 Pro | |
| 3DMark 11 - 1280x720 Performance GPU | |
| Geekom A7 | |
| Aoostar GEM12 | |
| Acemagic F2A | |
| Minisforum AtomMan X7 Ti | |
| Geekom XT13 Pro | |
| Geekom XT12 Pro | |
| 3DMark | |
| 2560x1440 Time Spy Graphics | |
| Acemagic F2A | |
| Minisforum AtomMan X7 Ti | |
| Geekom A7 | |
| Aoostar GEM12 | |
| Geekom XT13 Pro | |
| Geekom XT12 Pro | |
| 1920x1080 Fire Strike Graphics | |
| Geekom A7 | |
| Aoostar GEM12 | |
| Acemagic F2A | |
| Minisforum AtomMan X7 Ti | |
| Geekom XT13 Pro | |
| Geekom XT12 Pro | |
| Unigine Heaven 4.0 | |
| Extreme Preset OpenGL | |
| Aoostar GEM12 | |
| Acemagic F2A | |
| Minisforum AtomMan X7 Ti | |
| Geekom A7 | |
| Geekom XT13 Pro | |
| Geekom XT12 Pro | |
| Extreme Preset DX11 | |
| Aoostar GEM12 | |
| Minisforum AtomMan X7 Ti | |
| Acemagic F2A | |
| Geekom A7 | |
| Geekom XT13 Pro | |
| Geekom XT12 Pro | |
| Unigine Valley 1.0 | |
| 1920x1080 Extreme HD DirectX AA:x8 | |
| Aoostar GEM12 | |
| Minisforum AtomMan X7 Ti | |
| Geekom A7 | |
| Acemagic F2A | |
| Geekom XT13 Pro | |
| Geekom XT12 Pro | |
| 1920x1080 Extreme HD Preset OpenGL AA:x8 | |
| Minisforum AtomMan X7 Ti | |
| Aoostar GEM12 | |
| Acemagic F2A | |
| Geekom XT13 Pro | |
| Geekom XT12 Pro | |
| Geekom A7 | |
| Unigine Superposition | |
| 1280x720 720p Low | |
| Aoostar GEM12 | |
| Acemagic F2A | |
| Minisforum AtomMan X7 Ti | |
| Geekom A7 | |
| Geekom XT13 Pro | |
| Geekom XT12 Pro | |
| 1920x1080 1080p High | |
| Aoostar GEM12 | |
| Acemagic F2A | |
| Minisforum AtomMan X7 Ti | |
| Geekom A7 | |
| Geekom XT13 Pro | |
| Geekom XT12 Pro | |
| 1920x1080 1080p Extreme | |
| Acemagic F2A | |
| Minisforum AtomMan X7 Ti | |
| Aoostar GEM12 | |
| Geekom A7 | |
| Geekom XT13 Pro | |
| Geekom XT12 Pro | |
| ComputeMark v2.1 | |
| 1024x600 Normal, Score | |
| Geekom A7 | |
| Aoostar GEM12 | |
| Acemagic F2A | |
| Minisforum AtomMan X7 Ti | |
| Geekom XT13 Pro | |
| Geekom XT12 Pro | |
| 1024x600 Normal, Fluid 3DTex | |
| Aoostar GEM12 | |
| Geekom A7 | |
| Minisforum AtomMan X7 Ti | |
| Acemagic F2A | |
| Geekom XT13 Pro | |
| Geekom XT12 Pro | |
| 1024x600 Normal, Fluid 2DTexArr | |
| Geekom A7 | |
| Aoostar GEM12 | |
| Minisforum AtomMan X7 Ti | |
| Acemagic F2A | |
| Geekom XT13 Pro | |
| Geekom XT12 Pro | |
| 1024x600 Normal, Mandel Vector | |
| Geekom A7 | |
| Aoostar GEM12 | |
| Acemagic F2A | |
| Minisforum AtomMan X7 Ti | |
| Geekom XT12 Pro | |
| Geekom XT13 Pro | |
| 1024x600 Normal, Mandel Scalar | |
| Geekom A7 | |
| Aoostar GEM12 | |
| Acemagic F2A | |
| Minisforum AtomMan X7 Ti | |
| Geekom XT12 Pro | |
| Geekom XT13 Pro | |
| 1024x600 Normal, QJuliaRayTrace | |
| Geekom A7 | |
| Aoostar GEM12 | |
| Acemagic F2A | |
| Minisforum AtomMan X7 Ti | |
| Geekom XT13 Pro | |
| Geekom XT12 Pro | |
| LuxMark v2.0 64Bit | |
| Room GPUs-only | |
| Geekom A7 | |
| Aoostar GEM12 | |
| Minisforum AtomMan X7 Ti | |
| Geekom XT13 Pro | |
| Acemagic F2A | |
| Sala GPUs-only | |
| Minisforum AtomMan X7 Ti | |
| Acemagic F2A | |
| Geekom XT13 Pro | |
| Geekom A7 | |
| Aoostar GEM12 | |
| Affinity Photo 2 - Combined (Single / Multi GPU) | |
| Minisforum AtomMan X7 Ti | |
| Acemagic F2A | |
| Geekom XT13 Pro | |
| Geekom XT12 Pro | |
| Aoostar GEM12 | |
| Geekom A7 | |
| Geekom XT13 Pro, Intel Iris Xe Graphics G7 96EUs i9-13900H | Aoostar GEM12, AMD Radeon 780M R7 8845HS | Minisforum AtomMan X7 Ti, Intel Arc 8-Core iGPU Ultra 9 185H | Acemagic F2A, Intel Arc 8-Core iGPU Ultra 7 155H | Geekom XT12 Pro, Intel Iris Xe Graphics G7 96EUs i9-12900H | Geekom A7, AMD Radeon 780M R9 7940HS | Durchschnitt der Klasse Mini PC | |
|---|---|---|---|---|---|---|---|
| SPECviewperf 2020 | 309% | 36% | 25% | -4% | 278% | 432% | |
| 3840x2160 Medical (medical-03) (fps) | 3.63 | 11.2 209% | 4.23 17% | 5.05 39% | 3.49 -4% | 11.1 206% | 18.7 ? 415% |
| 3840x2160 Energy (energy-03) (fps) | 3.15 | 19.9 532% | 6.03 91% | 4.61 46% | 3.05 -3% | 14.1 348% | 28.9 ? 817% |
| 3840x2160 Creo (creo-03) (fps) | 16 | 33.4 109% | 18.5 16% | 17.9 12% | 14.8 -7% | 31.4 96% | 43.9 ? 174% |
| 3840x2160 CATIA (catia-06) (fps) | 7.9 | 23.2 194% | 11.1 41% | 10 27% | 7.78 -2% | 24.8 214% | 29.9 ? 278% |
| 3840x2160 3ds Max (3dsmax-07) (fps) | 10.3 | 20.4 98% | 14.9 45% | 12.9 25% | 9.69 -6% | 20.9 103% | 42.4 ? 312% |
| 3840x2160 Siemens NX (snx-04) (fps) | 6.13 | 64.1 946% | 6.24 2% | 5.7 -7% | 6.29 3% | 61.4 902% | 50.1 ? 717% |
| 3840x2160 Maya (maya-06) (fps) | 26.8 | 47.7 78% | 37.7 41% | 35.4 32% | 23.9 -11% | 47 75% | 110.4 ? 312% |
| 3DMark 05 Standard | 29045 Punkte | |
| 3DMark 06 Score 1366x768 | 30156 Punkte | |
| 3DMark Vantage P Result | 28599 Punkte | |
| 3DMark 11 Performance | 8024 Punkte | |
| 3DMark Ice Storm Standard Score | 155640 Punkte | |
| 3DMark Cloud Gate Standard Score | 28112 Punkte | |
| 3DMark Fire Strike Score | 5448 Punkte | |
| 3DMark Fire Strike Extreme Score | 2570 Punkte | |
| 3DMark Time Spy Score | 1920 Punkte | |
| 3DMark Steel Nomad Score | 183 Punkte | |
| 3DMark Steel Nomad Light Score | 1276 Punkte | |
Hilfe | ||
Gaming Performance
Mit den meisten Spielen ist die Intel Iris Xe iGPU überfordert. Adäquate Frameraten erzielt die betagte iGPU, wenn überhaupt, nur in geringen Auflösungen und einem niedrigen oder mittlerem Grafik-Preset. Wer den Geekom XT13 Pro trotzdem zum Spielen nutzen will, muss den Umweg über eine externe Grafikkarte gehen. Über USB4 lassen sich verschiedene Modelle mit dem Gerät verwenden.
| Dota 2 Reborn | |
| 1280x720 min (0/3) fastest | |
| Geekom A7 | |
| Aoostar GEM12 | |
| Geekom XT13 Pro | |
| Minisforum AtomMan X7 Ti | |
| Geekom XT12 Pro | |
| Acemagic F2A | |
| 1920x1080 high (2/3) | |
| Geekom A7 | |
| Aoostar GEM12 | |
| Minisforum AtomMan X7 Ti | |
| Acemagic F2A | |
| Geekom XT13 Pro | |
| Geekom XT12 Pro | |
| GTA V | |
| 1024x768 Lowest Settings possible | |
| Geekom A7 | |
| Aoostar GEM12 | |
| Minisforum AtomMan X7 Ti | |
| Acemagic F2A | |
| Geekom XT13 Pro | |
| 1920x1080 High/On (Advanced Graphics Off) AA:2xMSAA + FX AF:8x | |
| Geekom A7 | |
| Aoostar GEM12 | |
| Minisforum AtomMan X7 Ti | |
| Acemagic F2A | |
| Geekom XT13 Pro | |
| Cyberpunk 2077 | |
| 1920x1080 Low Preset (FSR off) | |
| Aoostar GEM12 | |
| Minisforum AtomMan X7 Ti | |
| Acemagic F2A | |
| Geekom XT13 Pro | |
| Geekom XT12 Pro | |
| 1920x1080 High Preset (FSR off) | |
| Aoostar GEM12 | |
| Minisforum AtomMan X7 Ti | |
| Acemagic F2A | |
| Geekom XT13 Pro | |
| Geekom XT12 Pro | |
| Baldur's Gate 3 | |
| 1280x720 Low Preset AA:SM | |
| Aoostar GEM12 | |
| Minisforum AtomMan X7 Ti | |
| Geekom XT13 Pro | |
| 1920x1080 High Preset AA:T | |
| Aoostar GEM12 | |
| Minisforum AtomMan X7 Ti | |
| Geekom XT13 Pro | |
| F1 24 | |
| 1920x1080 Low Preset AA:T AF:16x | |
| Minisforum AtomMan X7 Ti | |
| Acemagic F2A | |
| Geekom XT13 Pro | |
| 1920x1080 High Preset AA:T AF:16x | |
| Minisforum AtomMan X7 Ti | |
| Acemagic F2A | |
| Geekom XT13 Pro | |
FPS-Diagramm
| min. | mittel | hoch | max. | |
|---|---|---|---|---|
| GTA V (2015) | 123.5 | 105.9 | 22.1 | 9 |
| Dota 2 Reborn (2015) | 117.2 | 82.9 | 72.5 | 66.5 |
| Final Fantasy XV Benchmark (2018) | 46 | 25.7 | 18.2 | |
| Baldur's Gate 3 (2023) | 19.9 | 15.4 | 13.5 | 13 |
| Cyberpunk 2077 (2023) | 18.6 | 15 | 13 | 11.4 |
| F1 24 (2024) | 43.1 | 37.3 | 26.7 |
Geekom XT13 Pro im Leistungscheck mit einer Nvidia GeForce RTX 3060 Ti
Der Geekom XT13 Pro besitzt zwei USB4-Anschlüsse, welche den Einsatz von externen Grafikkarten unterstützen. Ohne Einflussnahme auf das Gesamtergebnis haben wir einige Tests mit dem Razer Core X und einer Nvidia GeForce RTX 3060 Ti durchgeführt. Gegenüber der betagten iGPU des Intel Core i9-13900H kann die 3D-Leistung massiv gesteigert werden. Der Vergleich mit den anderen Testgeräten zeigt bei den synthetischen Tests ein fast identisches Ergebnis. Die Spieletauglichkeit kann mit dieser Kombination ebenfalls signifikant gesteigert werden, wie man anhand der getesteten Spiele sehen kann. Mitunter lassen sich auch modernste Spiele in voller Detailpracht genießen.
| Performance Rating - Percent | |
| Geekom AE7 (Nvidia GeForce RTX 3060 Ti FE) | |
| Geekom A8 (Nvidia GeForce RTX 3060 Ti FE) | |
| Geekom GT13 Pro (Nvidia GeForce RTX 3060 Ti FE) | |
| Geekom XT13 Pro (Nvidia GeForce RTX 3060 Ti FE) | |
| Geekom XT12 Pro (Nvidia GeForce RTX 3060 Ti FE) | |
| Minisforum UH125 Pro (Nvidia GeForce RTX 3060 Ti FE) | |
| 3DMark 11 - 1280x720 Performance GPU | |
| Geekom A8 (Nvidia GeForce RTX 3060 Ti FE) | |
| Geekom AE7 (Nvidia GeForce RTX 3060 Ti FE) | |
| Geekom XT13 Pro (Nvidia GeForce RTX 3060 Ti FE) | |
| Geekom GT13 Pro (Nvidia GeForce RTX 3060 Ti FE) | |
| Geekom XT12 Pro (Nvidia GeForce RTX 3060 Ti FE) | |
| Minisforum UH125 Pro (Nvidia GeForce RTX 3060 Ti FE) | |
| 3DMark | |
| 2560x1440 Time Spy Graphics | |
| Geekom A8 (Nvidia GeForce RTX 3060 Ti FE) | |
| Geekom AE7 (Nvidia GeForce RTX 3060 Ti FE) | |
| Geekom XT13 Pro (Nvidia GeForce RTX 3060 Ti FE) | |
| Geekom GT13 Pro (Nvidia GeForce RTX 3060 Ti FE) | |
| Geekom XT12 Pro (Nvidia GeForce RTX 3060 Ti FE) | |
| Minisforum UH125 Pro (Nvidia GeForce RTX 3060 Ti FE) | |
| 1920x1080 Fire Strike Graphics | |
| Geekom AE7 (Nvidia GeForce RTX 3060 Ti FE) | |
| Geekom GT13 Pro (Nvidia GeForce RTX 3060 Ti FE) | |
| Geekom A8 (Nvidia GeForce RTX 3060 Ti FE) | |
| Geekom XT13 Pro (Nvidia GeForce RTX 3060 Ti FE) | |
| Minisforum UH125 Pro (Nvidia GeForce RTX 3060 Ti FE) | |
| Geekom XT12 Pro (Nvidia GeForce RTX 3060 Ti FE) | |
| 3840x2160 Fire Strike Ultra Graphics | |
| Geekom GT13 Pro (Nvidia GeForce RTX 3060 Ti FE) | |
| Geekom AE7 (Nvidia GeForce RTX 3060 Ti FE) | |
| Geekom XT12 Pro (Nvidia GeForce RTX 3060 Ti FE) | |
| Geekom XT13 Pro (Nvidia GeForce RTX 3060 Ti FE) | |
| Geekom A8 (Nvidia GeForce RTX 3060 Ti FE) | |
| Minisforum UH125 Pro (Nvidia GeForce RTX 3060 Ti FE) | |
| Unigine Superposition | |
| 1280x720 720p Low | |
| Geekom AE7 (Nvidia GeForce RTX 3060 Ti FE) | |
| Geekom GT13 Pro (Nvidia GeForce RTX 3060 Ti FE) | |
| Geekom A8 (Nvidia GeForce RTX 3060 Ti FE) | |
| Geekom XT13 Pro (Nvidia GeForce RTX 3060 Ti FE) | |
| Geekom XT12 Pro (Nvidia GeForce RTX 3060 Ti FE) | |
| Minisforum UH125 Pro (Nvidia GeForce RTX 3060 Ti FE) | |
| 1920x1080 1080p High | |
| Geekom GT13 Pro (Nvidia GeForce RTX 3060 Ti FE) | |
| Geekom A8 (Nvidia GeForce RTX 3060 Ti FE) | |
| Geekom AE7 (Nvidia GeForce RTX 3060 Ti FE) | |
| Geekom XT13 Pro (Nvidia GeForce RTX 3060 Ti FE) | |
| Minisforum UH125 Pro (Nvidia GeForce RTX 3060 Ti FE) | |
| Geekom XT12 Pro (Nvidia GeForce RTX 3060 Ti FE) | |
| 1920x1080 1080p Extreme | |
| Geekom GT13 Pro (Nvidia GeForce RTX 3060 Ti FE) | |
| Geekom XT13 Pro (Nvidia GeForce RTX 3060 Ti FE) | |
| Geekom XT12 Pro (Nvidia GeForce RTX 3060 Ti FE) | |
| Minisforum UH125 Pro (Nvidia GeForce RTX 3060 Ti FE) | |
| Geekom A8 (Nvidia GeForce RTX 3060 Ti FE) | |
| Geekom AE7 (Nvidia GeForce RTX 3060 Ti FE) | |
| 3840x2160 4k Optimized | |
| Geekom GT13 Pro (Nvidia GeForce RTX 3060 Ti FE) | |
| Geekom XT13 Pro (Nvidia GeForce RTX 3060 Ti FE) | |
| Geekom XT12 Pro (Nvidia GeForce RTX 3060 Ti FE) | |
| Geekom A8 (Nvidia GeForce RTX 3060 Ti FE) | |
| Minisforum UH125 Pro (Nvidia GeForce RTX 3060 Ti FE) | |
| Geekom AE7 (Nvidia GeForce RTX 3060 Ti FE) | |
| 7680x4320 8k Optimized | |
| Geekom GT13 Pro (Nvidia GeForce RTX 3060 Ti FE) | |
| Geekom XT13 Pro (Nvidia GeForce RTX 3060 Ti FE) | |
| Geekom XT12 Pro (Nvidia GeForce RTX 3060 Ti FE) | |
| Minisforum UH125 Pro (Nvidia GeForce RTX 3060 Ti FE) | |
| Geekom A8 (Nvidia GeForce RTX 3060 Ti FE) | |
| Geekom AE7 (Nvidia GeForce RTX 3060 Ti FE) | |
| Unigine Valley 1.0 | |
| 1920x1080 Extreme HD DirectX AA:x8 | |
| Geekom XT12 Pro (Nvidia GeForce RTX 3060 Ti FE) | |
| Geekom GT13 Pro (Nvidia GeForce RTX 3060 Ti FE) | |
| Geekom XT13 Pro (Nvidia GeForce RTX 3060 Ti FE) | |
| Geekom A8 (Nvidia GeForce RTX 3060 Ti FE) | |
| Geekom AE7 (Nvidia GeForce RTX 3060 Ti FE) | |
| Minisforum UH125 Pro (Nvidia GeForce RTX 3060 Ti FE) | |
| 1920x1080 Extreme HD Preset OpenGL AA:x8 | |
| Geekom GT13 Pro (Nvidia GeForce RTX 3060 Ti FE) | |
| Geekom XT12 Pro (Nvidia GeForce RTX 3060 Ti FE) | |
| Geekom XT13 Pro (Nvidia GeForce RTX 3060 Ti FE) | |
| Geekom A8 (Nvidia GeForce RTX 3060 Ti FE) | |
| Geekom AE7 (Nvidia GeForce RTX 3060 Ti FE) | |
| Minisforum UH125 Pro (Nvidia GeForce RTX 3060 Ti FE) | |
| Unigine Heaven 4.0 | |
| Extreme Preset OpenGL | |
| Geekom A8 (Nvidia GeForce RTX 3060 Ti FE) | |
| Geekom AE7 (Nvidia GeForce RTX 3060 Ti FE) | |
| Geekom GT13 Pro (Nvidia GeForce RTX 3060 Ti FE) | |
| Geekom XT13 Pro (Nvidia GeForce RTX 3060 Ti FE) | |
| Minisforum UH125 Pro (Nvidia GeForce RTX 3060 Ti FE) | |
| Geekom XT12 Pro (Nvidia GeForce RTX 3060 Ti FE) | |
| Extreme Preset DX11 | |
| Geekom XT13 Pro (Nvidia GeForce RTX 3060 Ti FE) | |
| Geekom GT13 Pro (Nvidia GeForce RTX 3060 Ti FE) | |
| Geekom A8 (Nvidia GeForce RTX 3060 Ti FE) | |
| Geekom XT12 Pro (Nvidia GeForce RTX 3060 Ti FE) | |
| Geekom AE7 (Nvidia GeForce RTX 3060 Ti FE) | |
| Minisforum UH125 Pro (Nvidia GeForce RTX 3060 Ti FE) | |
| ComputeMark v2.1 | |
| 1024x600 Normal, Score | |
| Geekom GT13 Pro (Nvidia GeForce RTX 3060 Ti FE) | |
| Geekom AE7 (Nvidia GeForce RTX 3060 Ti FE) | |
| Geekom A8 (Nvidia GeForce RTX 3060 Ti FE) | |
| Geekom XT13 Pro (Nvidia GeForce RTX 3060 Ti FE) | |
| Minisforum UH125 Pro (Nvidia GeForce RTX 3060 Ti FE) | |
| Geekom XT12 Pro (Nvidia GeForce RTX 3060 Ti FE) | |
| 1024x600 Normal, Fluid 3DTex | |
| Geekom GT13 Pro (Nvidia GeForce RTX 3060 Ti FE) | |
| Geekom AE7 (Nvidia GeForce RTX 3060 Ti FE) | |
| Minisforum UH125 Pro (Nvidia GeForce RTX 3060 Ti FE) | |
| Geekom A8 (Nvidia GeForce RTX 3060 Ti FE) | |
| Geekom XT13 Pro (Nvidia GeForce RTX 3060 Ti FE) | |
| Geekom XT12 Pro (Nvidia GeForce RTX 3060 Ti FE) | |
| 1024x600 Normal, Fluid 2DTexArr | |
| Geekom GT13 Pro (Nvidia GeForce RTX 3060 Ti FE) | |
| Geekom AE7 (Nvidia GeForce RTX 3060 Ti FE) | |
| Minisforum UH125 Pro (Nvidia GeForce RTX 3060 Ti FE) | |
| Geekom A8 (Nvidia GeForce RTX 3060 Ti FE) | |
| Geekom XT13 Pro (Nvidia GeForce RTX 3060 Ti FE) | |
| Geekom XT12 Pro (Nvidia GeForce RTX 3060 Ti FE) | |
| 1024x600 Normal, Mandel Vector | |
| Geekom GT13 Pro (Nvidia GeForce RTX 3060 Ti FE) | |
| Geekom AE7 (Nvidia GeForce RTX 3060 Ti FE) | |
| Geekom A8 (Nvidia GeForce RTX 3060 Ti FE) | |
| Geekom XT13 Pro (Nvidia GeForce RTX 3060 Ti FE) | |
| Minisforum UH125 Pro (Nvidia GeForce RTX 3060 Ti FE) | |
| Geekom XT12 Pro (Nvidia GeForce RTX 3060 Ti FE) | |
| 1024x600 Normal, Mandel Scalar | |
| Geekom GT13 Pro (Nvidia GeForce RTX 3060 Ti FE) | |
| Geekom AE7 (Nvidia GeForce RTX 3060 Ti FE) | |
| Geekom A8 (Nvidia GeForce RTX 3060 Ti FE) | |
| Geekom XT13 Pro (Nvidia GeForce RTX 3060 Ti FE) | |
| Minisforum UH125 Pro (Nvidia GeForce RTX 3060 Ti FE) | |
| Geekom XT12 Pro (Nvidia GeForce RTX 3060 Ti FE) | |
| 1024x600 Normal, QJuliaRayTrace | |
| Geekom GT13 Pro (Nvidia GeForce RTX 3060 Ti FE) | |
| Geekom AE7 (Nvidia GeForce RTX 3060 Ti FE) | |
| Geekom A8 (Nvidia GeForce RTX 3060 Ti FE) | |
| Geekom XT13 Pro (Nvidia GeForce RTX 3060 Ti FE) | |
| Minisforum UH125 Pro (Nvidia GeForce RTX 3060 Ti FE) | |
| Geekom XT12 Pro (Nvidia GeForce RTX 3060 Ti FE) | |
| Photoshop PugetBench - GPU Score | |
| Geekom A8 (Nvidia GeForce RTX 3060 Ti FE) | |
| Geekom AE7 (Nvidia GeForce RTX 3060 Ti FE) | |
| Geekom XT12 Pro (Nvidia GeForce RTX 3060 Ti FE) | |
| Geekom GT13 Pro (Nvidia GeForce RTX 3060 Ti FE) | |
| Minisforum UH125 Pro (Nvidia GeForce RTX 3060 Ti FE) | |
| Geekom XT13 Pro (Nvidia GeForce RTX 3060 Ti FE) | |
| Premiere Pro PugetBench - GPU 0.9 | |
| Geekom A8 (Nvidia GeForce RTX 3060 Ti FE) | |
| Geekom AE7 (Nvidia GeForce RTX 3060 Ti FE) | |
| Geekom GT13 Pro (Nvidia GeForce RTX 3060 Ti FE) | |
| Minisforum UH125 Pro (Nvidia GeForce RTX 3060 Ti FE) | |
| Geekom XT13 Pro (Nvidia GeForce RTX 3060 Ti FE) | |
| Geekom XT12 Pro (Nvidia GeForce RTX 3060 Ti FE) | |
| Cyberpunk 2077 | |
| 1280x720 Low Preset (FSR off) | |
| Geekom AE7 (Nvidia GeForce RTX 3060 Ti FE) | |
| Geekom A8 (Nvidia GeForce RTX 3060 Ti FE) | |
| Geekom XT13 Pro (Nvidia GeForce RTX 3060 Ti FE) | |
| Geekom GT13 Pro (Nvidia GeForce RTX 3060 Ti FE) | |
| Geekom XT12 Pro (Nvidia GeForce RTX 3060 Ti FE) | |
| Minisforum UH125 Pro (Nvidia GeForce RTX 3060 Ti FE) | |
| Geekom XT13 Pro | |
| 1920x1080 Medium Preset (FSR off) | |
| Geekom AE7 (Nvidia GeForce RTX 3060 Ti FE) | |
| Geekom XT13 Pro (Nvidia GeForce RTX 3060 Ti FE) | |
| Geekom A8 (Nvidia GeForce RTX 3060 Ti FE) | |
| Geekom GT13 Pro (Nvidia GeForce RTX 3060 Ti FE) | |
| Geekom XT12 Pro (Nvidia GeForce RTX 3060 Ti FE) | |
| Minisforum UH125 Pro (Nvidia GeForce RTX 3060 Ti FE) | |
| Geekom XT13 Pro | |
| 1920x1080 Ultra Preset (FSR off) | |
| Geekom AE7 (Nvidia GeForce RTX 3060 Ti FE) | |
| Geekom XT13 Pro (Nvidia GeForce RTX 3060 Ti FE) | |
| Geekom GT13 Pro (Nvidia GeForce RTX 3060 Ti FE) | |
| Geekom A8 (Nvidia GeForce RTX 3060 Ti FE) | |
| Geekom XT12 Pro (Nvidia GeForce RTX 3060 Ti FE) | |
| Minisforum UH125 Pro (Nvidia GeForce RTX 3060 Ti FE) | |
| Geekom XT13 Pro | |
| Baldur's Gate 3 | |
| 1920x1080 Low Preset AA:SM | |
| Geekom GT13 Pro (Nvidia GeForce RTX 3060 Ti FE) | |
| Geekom XT12 Pro (Nvidia GeForce RTX 3060 Ti FE) | |
| Geekom XT13 Pro (Nvidia GeForce RTX 3060 Ti FE) | |
| Geekom AE7 (Nvidia GeForce RTX 3060 Ti FE) | |
| Geekom A8 (Nvidia GeForce RTX 3060 Ti FE) | |
| Minisforum UH125 Pro (Nvidia GeForce RTX 3060 Ti FE) | |
| Geekom XT13 Pro | |
| 1920x1080 Medium Preset AA:T | |
| Geekom XT13 Pro (Nvidia GeForce RTX 3060 Ti FE) | |
| Geekom GT13 Pro (Nvidia GeForce RTX 3060 Ti FE) | |
| Geekom A8 (Nvidia GeForce RTX 3060 Ti FE) | |
| Geekom XT12 Pro (Nvidia GeForce RTX 3060 Ti FE) | |
| Geekom AE7 (Nvidia GeForce RTX 3060 Ti FE) | |
| Minisforum UH125 Pro (Nvidia GeForce RTX 3060 Ti FE) | |
| Geekom XT13 Pro | |
| 1920x1080 Ultra Preset AA:T | |
| Geekom GT13 Pro (Nvidia GeForce RTX 3060 Ti FE) | |
| Geekom XT13 Pro (Nvidia GeForce RTX 3060 Ti FE) | |
| Geekom A8 (Nvidia GeForce RTX 3060 Ti FE) | |
| Geekom XT12 Pro (Nvidia GeForce RTX 3060 Ti FE) | |
| Geekom AE7 (Nvidia GeForce RTX 3060 Ti FE) | |
| Minisforum UH125 Pro (Nvidia GeForce RTX 3060 Ti FE) | |
| Geekom XT13 Pro | |
| F1 24 | |
| 1920x1080 Low Preset AA:T AF:16x | |
| Geekom AE7 (Nvidia GeForce RTX 3060 Ti FE) | |
| Geekom A8 (Nvidia GeForce RTX 3060 Ti FE) | |
| Geekom GT13 Pro (Nvidia GeForce RTX 3060 Ti FE) | |
| Geekom XT13 Pro (Nvidia GeForce RTX 3060 Ti FE) | |
| Geekom XT12 Pro (Nvidia GeForce RTX 3060 Ti FE) | |
| Minisforum UH125 Pro (Nvidia GeForce RTX 3060 Ti FE) | |
| Geekom XT13 Pro | |
| 1920x1080 Medium Preset AA:T AF:16x | |
| Geekom A8 (Nvidia GeForce RTX 3060 Ti FE) | |
| Geekom AE7 (Nvidia GeForce RTX 3060 Ti FE) | |
| Geekom XT12 Pro (Nvidia GeForce RTX 3060 Ti FE) | |
| Geekom XT13 Pro (Nvidia GeForce RTX 3060 Ti FE) | |
| Geekom GT13 Pro (Nvidia GeForce RTX 3060 Ti FE) | |
| Minisforum UH125 Pro (Nvidia GeForce RTX 3060 Ti FE) | |
| Geekom XT13 Pro | |
| 1920x1080 Ultra High Preset AA:T AF:16x | |
| Geekom AE7 (Nvidia GeForce RTX 3060 Ti FE) | |
| Geekom A8 (Nvidia GeForce RTX 3060 Ti FE) | |
| Geekom XT13 Pro (Nvidia GeForce RTX 3060 Ti FE) | |
| Geekom GT13 Pro (Nvidia GeForce RTX 3060 Ti FE) | |
| Geekom XT12 Pro (Nvidia GeForce RTX 3060 Ti FE) | |
| Minisforum UH125 Pro (Nvidia GeForce RTX 3060 Ti FE) | |
| Geekom XT13 Pro, Intel Iris Xe Graphics G7 96EUs i9-13900H | Geekom XT13 Pro (Nvidia GeForce RTX 3060 Ti FE), i9-13900H | Geekom GT13 Pro (Nvidia GeForce RTX 3060 Ti FE), i9-13900H | Geekom XT12 Pro (Nvidia GeForce RTX 3060 Ti FE), i9-12900H | Minisforum UH125 Pro (Nvidia GeForce RTX 3060 Ti FE), Ultra 5 125H | Geekom AE7 (Nvidia GeForce RTX 3060 Ti FE), R9 7940HS | Geekom A8 (Nvidia GeForce RTX 3060 Ti FE), R9 8945HS | Durchschnitt der Klasse Mini PC | |
|---|---|---|---|---|---|---|---|---|
| SPECviewperf 2020 | 391% | 387% | 321% | 182% | 395% | 516% | 432% | |
| 3840x2160 Medical (medical-03) (fps) | 3.63 | 13 258% | 10.8 198% | 11.8 225% | 10.9 200% | 13 258% | 10.8 198% | 18.7 ? 415% |
| 3840x2160 Energy (energy-03) (fps) | 3.15 | 20.9 563% | 21 567% | 18.9 500% | 17.8 465% | 20.9 563% | 50.3 1497% | 28.9 ? 817% |
| 3840x2160 Creo (creo-03) (fps) | 16 | 74.2 364% | 76.4 378% | 62.7 292% | 26.6 66% | 76.8 380% | 76.6 379% | 43.9 ? 174% |
| 3840x2160 CATIA (catia-06) (fps) | 7.9 | 39.4 399% | 40.1 408% | 32.8 315% | 23.6 199% | 39.2 396% | 38.8 391% | 29.9 ? 278% |
| 3840x2160 3ds Max (3dsmax-07) (fps) | 10.3 | 47.2 358% | 47.3 359% | 40 288% | 28.7 179% | 46.5 351% | 45.9 346% | 42.4 ? 312% |
| 3840x2160 Siemens NX (snx-04) (fps) | 6.13 | 16.5 169% | 16.5 169% | 15.2 148% | 11.4 86% | 16.6 171% | 16.6 171% | 50.1 ? 717% |
| 3840x2160 Maya (maya-06) (fps) | 26.8 | 194 624% | 196 631% | 155 478% | 47.5 77% | 199 643% | 195 628% | 110.4 ? 312% |
| min. | mittel | hoch | max. | QHD | 4K | |
|---|---|---|---|---|---|---|
| GTA V (2015) | 182.2 | 178.4 | 170.3 | 104.2 | 92.7 | 103.4 |
| Dota 2 Reborn (2015) | 165.8 | 138.3 | 132 | 121.9 | 104.6 | |
| Final Fantasy XV Benchmark (2018) | 183.7 | 142.2 | 98.8 | 77.6 | 48.6 | |
| X-Plane 11.11 (2018) | 146.4 | 137.9 | 106.3 | 92.1 | ||
| Baldur's Gate 3 (2023) | 113 | 91.3 | 79 | 78.5 | 61.6 | 37.1 |
| Cyberpunk 2077 (2023) | 88.2 | 81.4 | 71.7 | 64.4 | 44.5 | 22.2 |
| F1 24 (2024) | 76.9 | 73.1 | 60.5 | 42.2 | 36.9 | 19.2 |
Emissionen - Schwache Kühlung und geringer Energiebedarf
Geräuschemissionen
Schon die baugleichen Geräte konnten bei den Geräuschemissionen nicht mit Topwerten überzeugen. Das gilt auch für den Geekom XT13 Pro, zumindest unter Belastung. Im Leerlauf arbeitet der Mini-PC sehr leise und ist kaum hörbar. Der Lüfter arbeitet aber immer, womit ein semi-passiver Betrieb nicht gegeben ist. Unter Last dreht der Lüfter dann zeitweise ordentlich auf, womit wir in der Spitze einen Schalldruckpegel von 49,5 dB(A) messen konnten. Die maximale Lautstärke ist jedoch nicht immer vorhanden. Während des Stresstests schwankt die Lüfterdrehzahl immer wieder, sodass der Geekom XT13 Pro unter Last zwischenzeitlich nur 38 dB(A) erreicht. Das gleiche Phänomen konnten wir bei durchschnittlicher Last beobachten. Hier schwankt die messbare Lautstärke zwischen 38 bis hin zu 42,2 dB(A).
Zu den leisesten Geräten zählt der Geekom XT12 Pro leider nicht. Nur im Leerlauf arbeitet das Gerät fast lautlos, nur ein leises Lüfterrauschen ist hörbar. Das ändert sich unter Last, denn mit bis zu 44,2 dB(A) ist der Mini-PC deutlich hörbar. Beim Spielen haben wir zwischenzeitlich sogar bis zu 47,2 dB(A) messen können. Einen dauerhaft hohen Schalldruckpegel konnten wir beim Spielen jedoch nicht feststellen. Hier schwankte das Ergebnis zwischen 39 und 47,2 dB(A).
Lautstärkediagramm
| Idle |
| 27.6 / 27.8 / 27.9 dB(A) |
| Last |
| 42.2 / 49.5 dB(A) |
 | ||
30 dB leise 40 dB(A) deutlich hörbar 50 dB(A) störend |
||
min: | ||
| Geekom XT13 Pro i9-13900H, Iris Xe G7 96EUs | Aoostar GEM12 R7 8845HS, Radeon 780M | Minisforum AtomMan X7 Ti Ultra 9 185H, Arc 8-Core | Acemagic F2A Ultra 7 155H, Arc 8-Core | Geekom XT12 Pro i9-12900H, Iris Xe G7 96EUs | Geekom A7 R9 7940HS, Radeon 780M | |
|---|---|---|---|---|---|---|
| Geräuschentwicklung | 10% | 1% | 2% | 2% | -9% | |
| aus / Umgebung * (dB) | 25 | 24.3 3% | 24.1 4% | 24.9 -0% | 25.4 -2% | 25.4 -2% |
| Idle min * (dB) | 27.6 | 27.5 -0% | 29.8 -8% | 25.4 8% | 28 -1% | 33.3 -21% |
| Idle avg * (dB) | 27.8 | 27.6 1% | 29.9 -8% | 25.7 8% | 28.1 -1% | 33.6 -21% |
| Idle max * (dB) | 27.9 | 27.6 1% | 30 -8% | 25.7 8% | 28.5 -2% | 33.7 -21% |
| Last avg * (dB) | 42.2 | 36 15% | 37.3 12% | 47.8 -13% | 39.6 6% | 43.3 -3% |
| Cyberpunk 2077 ultra * (dB) | 46.6 | 35.4 24% | ||||
| Last max * (dB) | 49.5 | 38.2 23% | 43.5 12% | 49 1% | 44.2 11% | 43.3 13% |
| Witcher 3 ultra * (dB) | 35.4 | 40.2 | 45.23 | 47.2 | 43.2 |
* ... kleinere Werte sind besser
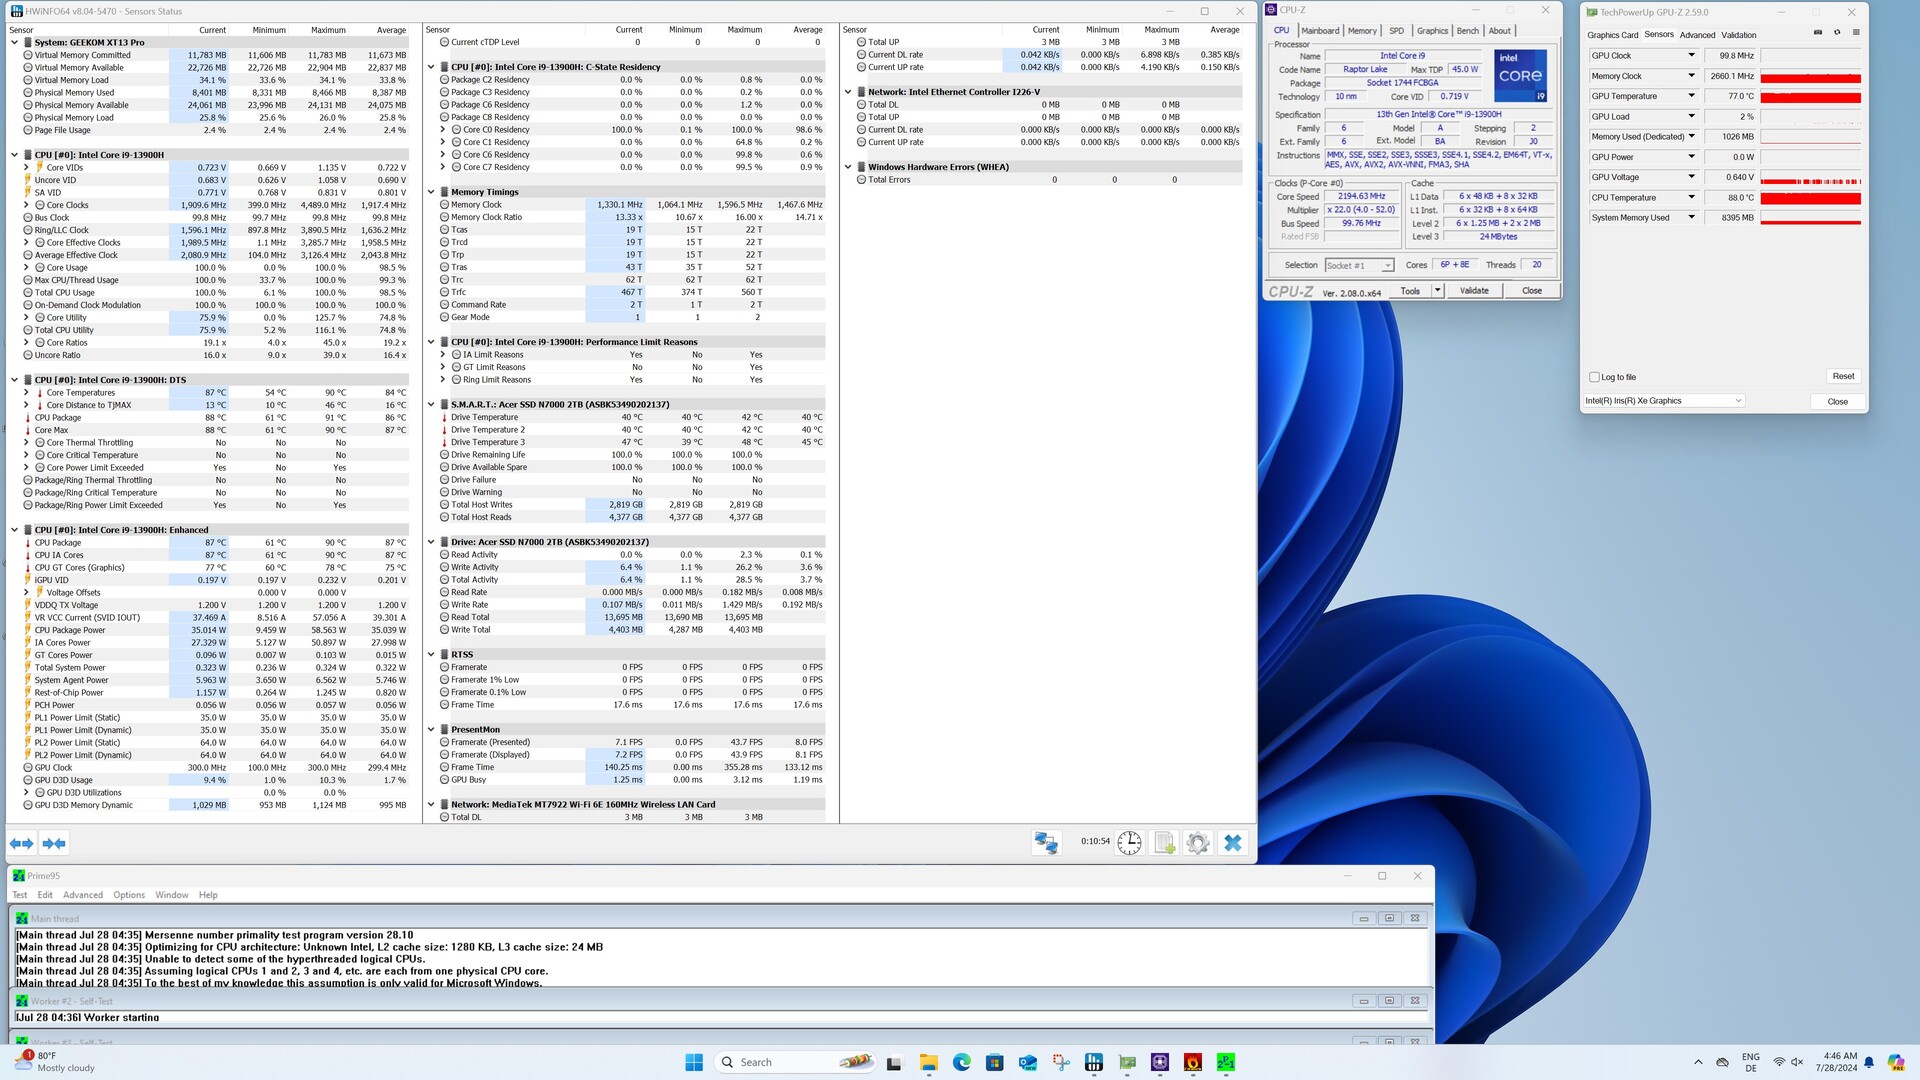
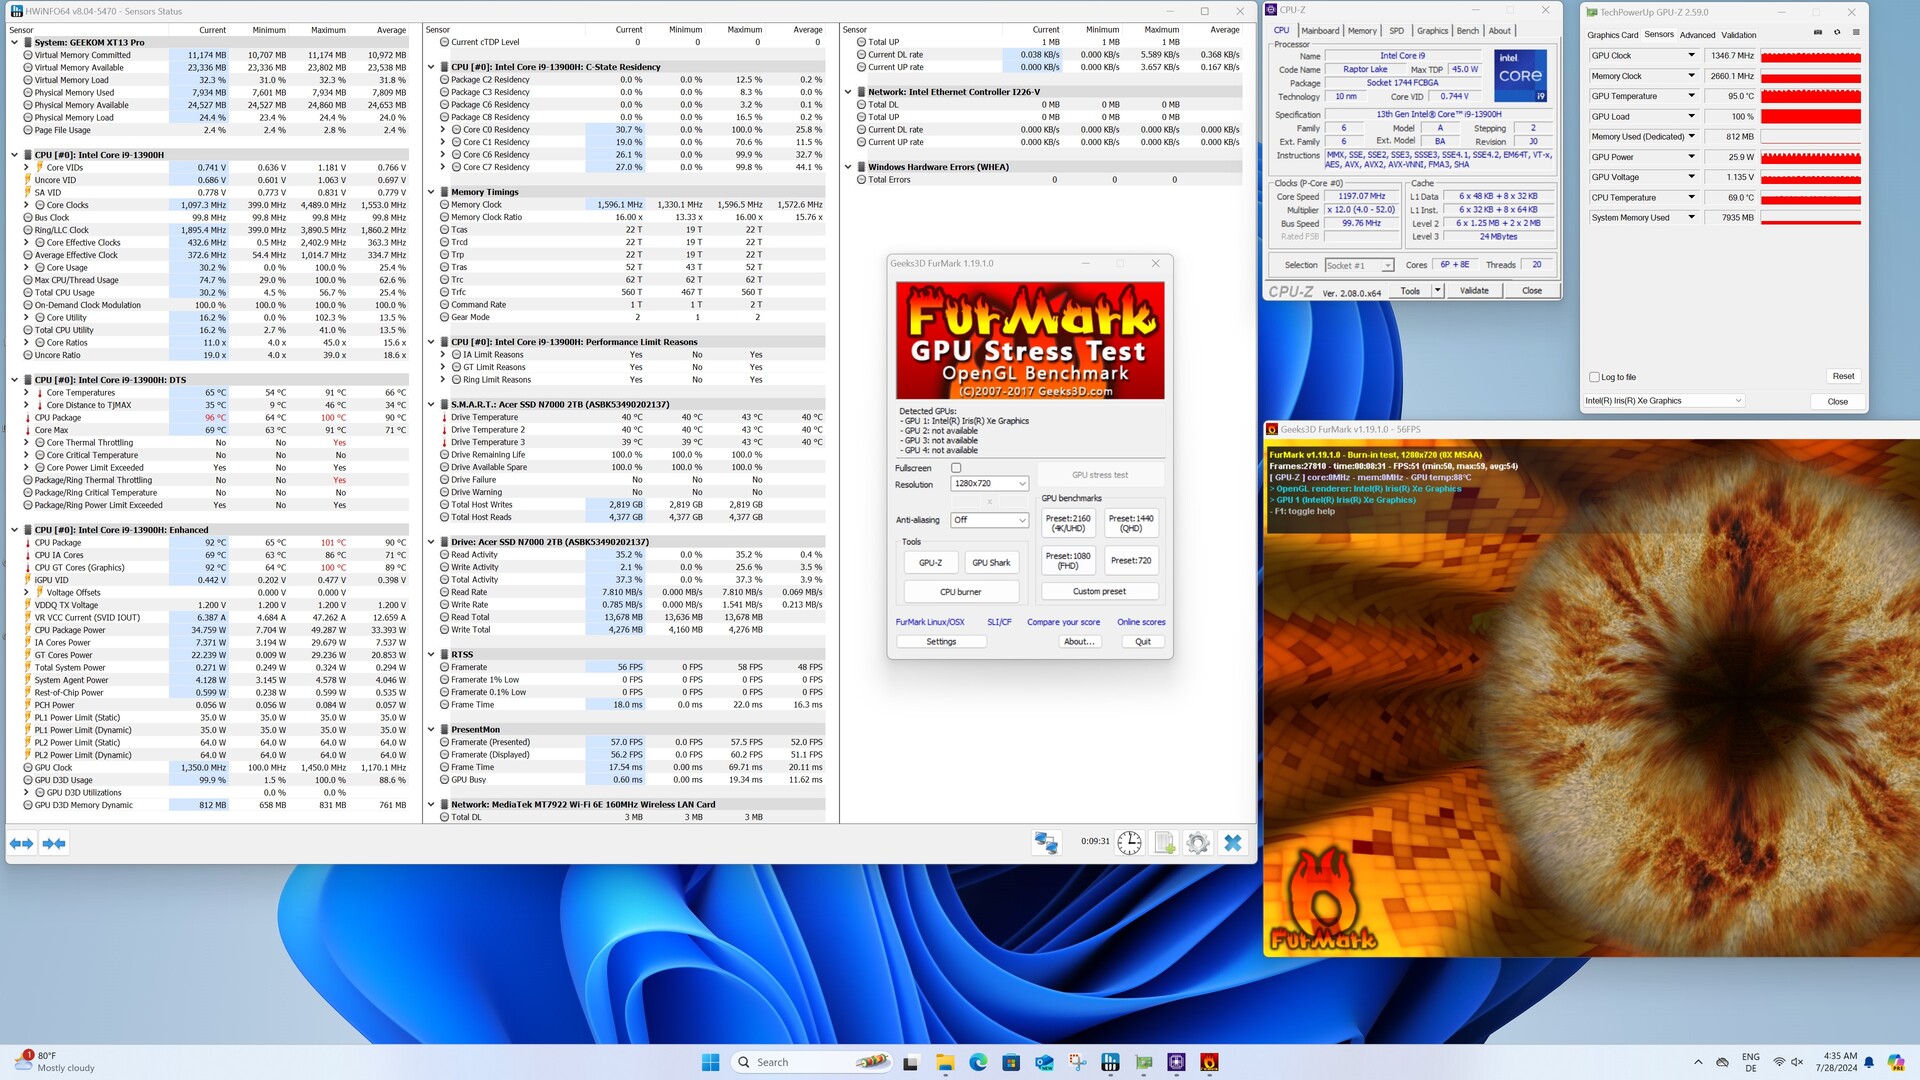
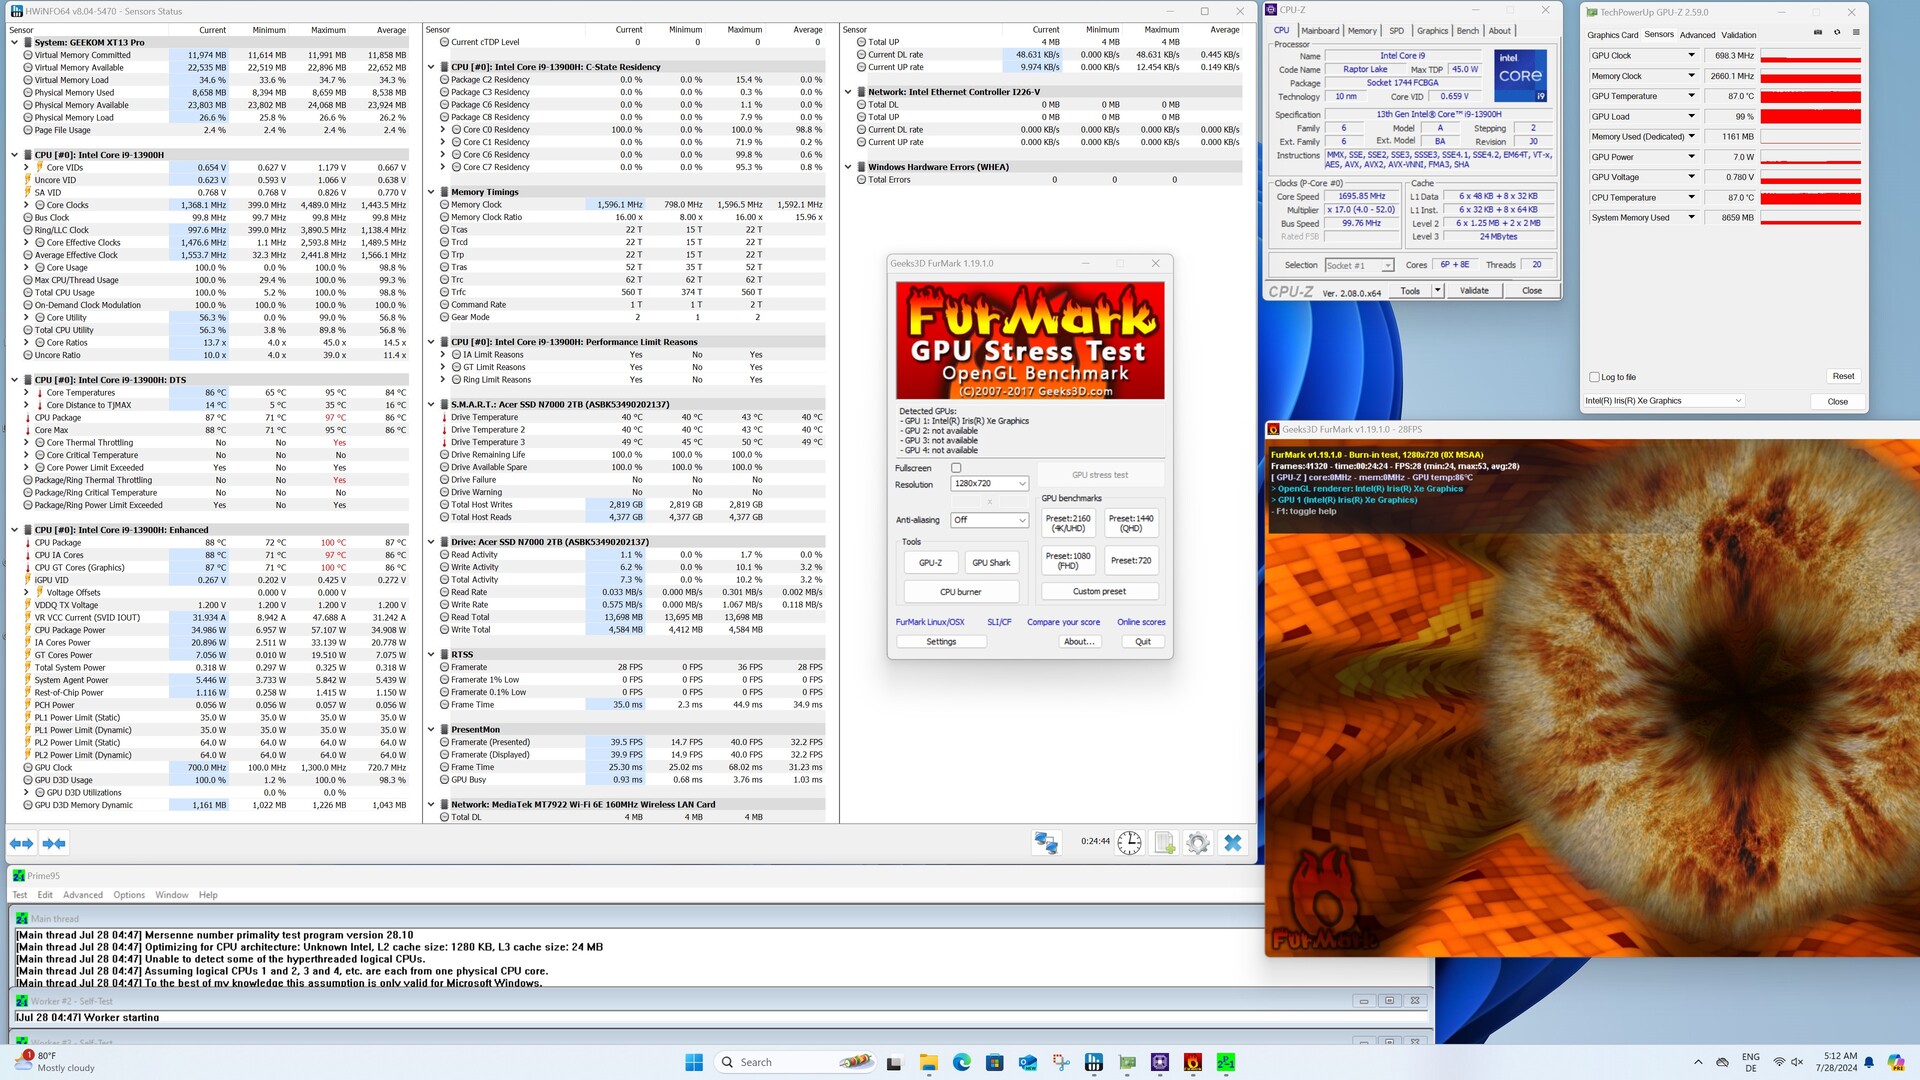
Temperatur
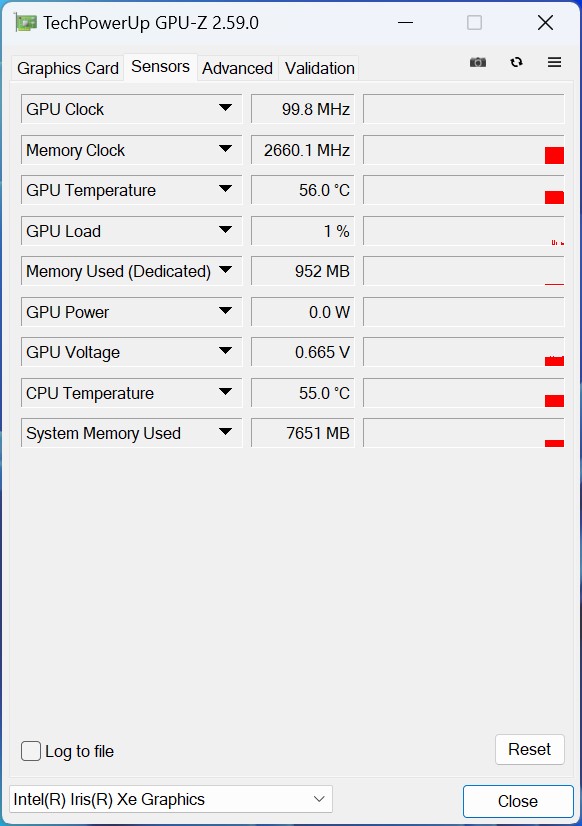
Das Gehäuse erwärmt sich unter Last spürbar. Kritische Werte können wir allerdings nicht ausfindig machen. Beim SoC sieht das schon etwas anders aus, denn Geekom beschränkt die maximale Temperatur nicht, womit unter Last die 100 °C schnell erreicht sind. Anders als bei der Cinebench-R15-Multi-Schleife überschreitet der Intel Core i9-13900H beim Stresstest die 64 Watt Grenze nicht. Zu schnell erhitzt sich das SoC und die Leistung muss reduziert werden. Über einen längeren Zeitraum pendelt sich die Temperatur dann bei etwa 90 °C ein, was für den Prozessor keine Probleme darstellt. Die extrem kompakte Bauweise macht es schlichtweg unmöglich, eine leistungsfähigere Kühlung zu verbauen.
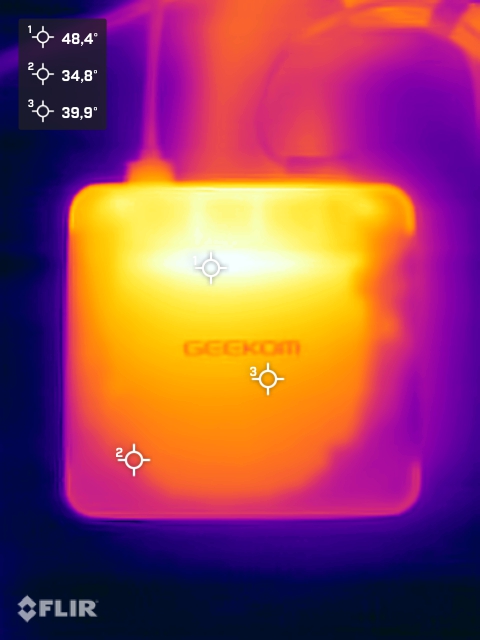
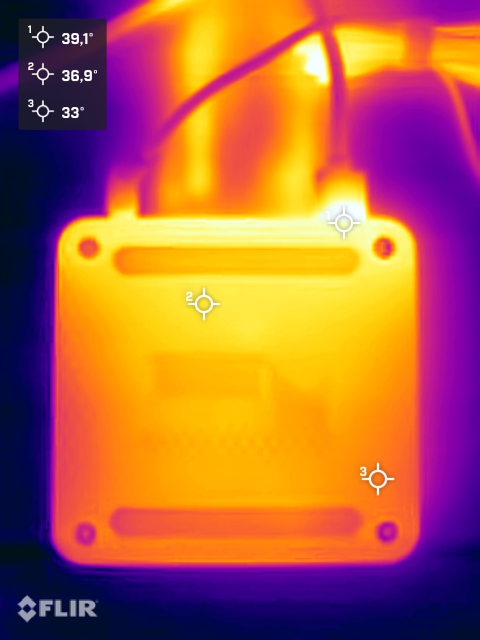
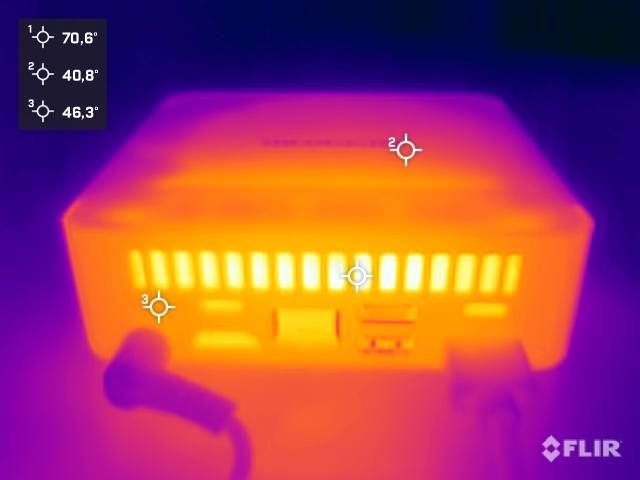
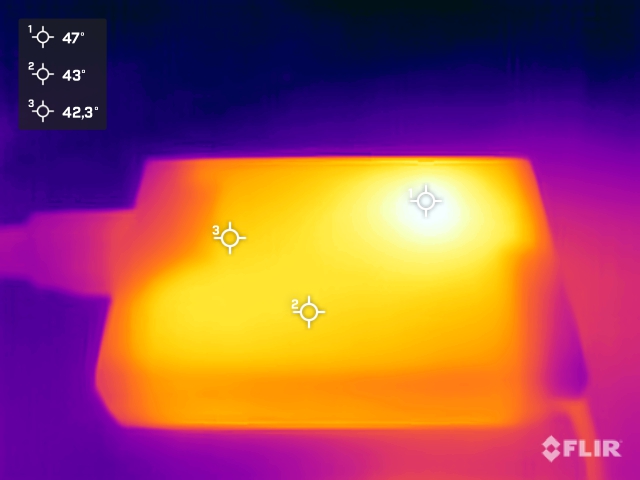
(-) Die maximale Temperatur auf der Oberseite ist 45.7 °C. Im Vergleich liegt der Klassendurchschnitt bei 36 °C (von 21.6 bis 69.5 °C für die Klasse Mini PC).
(±) Auf der Unterseite messen wir eine maximalen Wert von 40.3 °C (im Vergleich zum Durchschnitt von 36.4 °C).
(+) Ohne Last messen wir eine durchschnittliche Temperatur von 27.9 °C auf der Oberseite. Der Klassendurchschnitt erreicht 32.5 °C.
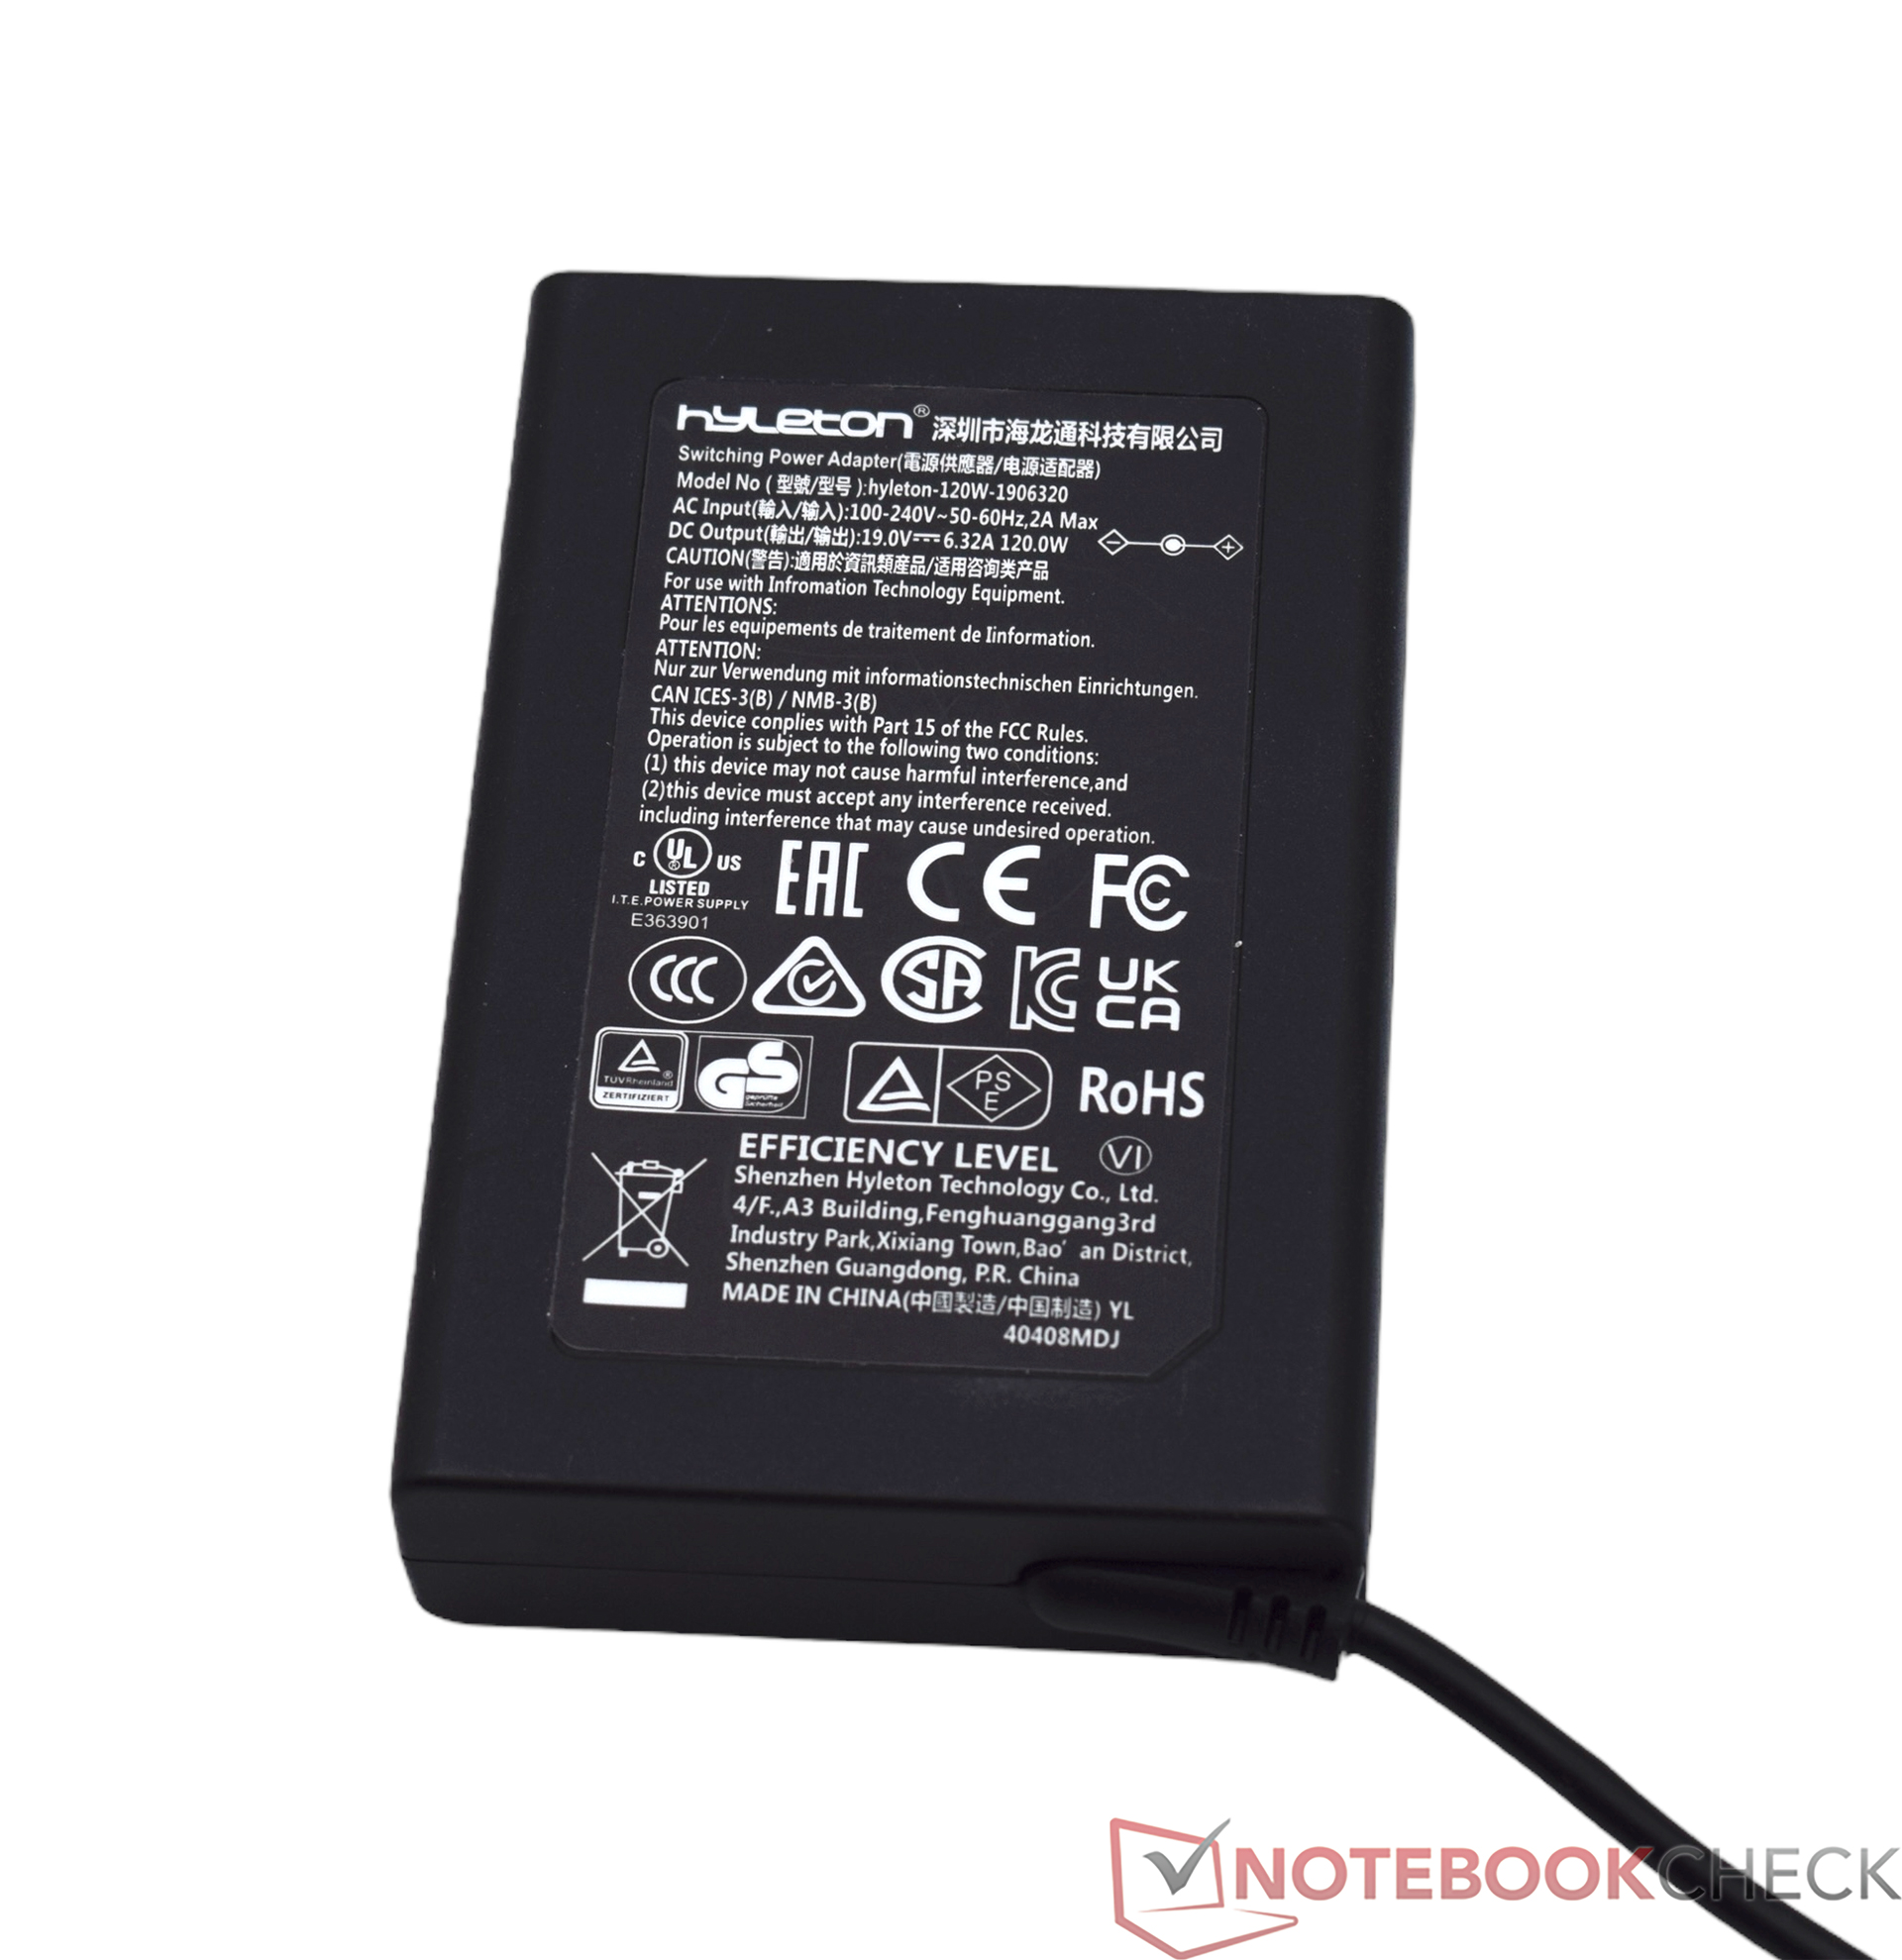
Energieverwaltung
Der Energiebedarf des Geekom XT13 Pro fällt im Vergleich zu den Kontrahenten sehr positiv aus. Schon im Leerlauf messen wir nur geringe Werte. Die geringen Power-Limits (PL1 und PL2) des Intel Core i9-13900H sorgen unter Last für einen verhältnismäßig geringen Energiebedarf. Bei durchschnittlicher Last kommt das System mit etwas weniger als 50 Watt aus. Unter Belastung sehen wir die 94,5 Watt nur kurzzeitig, wenn das System noch von dem Turbo Gebrauch machen kann. Ein etwas eigenartiges Verhalten haben wir dann doch beobachten können. Beim Cinebench-R23-Sigle-Test dokumentieren wir sehr viele Ausschläge, was bei anderen Testgeräten bislang nicht aufgetreten ist. Wir haben den Test mehrfach wiederholt - mit gleichem Ergebnis. Die Vermutung liegt nahe, dass das SoC in diesem Fall immer wieder an einer Temperaturgrenze arbeitet, welche es zulässt, kurzzeitig mehr Leistung aufnehmen zu können. Die Energieversorgung übernimmt ein kleines Netzteil mit 120 Watt. Das gleiche Netzteil liegt vielen Geräten aus dem Hause Geekom bei.
| Aus / Standby | |
| Idle | |
| Last |
|
Legende:
min: | |
| Geekom XT13 Pro i9-13900H, Iris Xe G7 96EUs | Aoostar GEM12 R7 8845HS, Radeon 780M | Minisforum AtomMan X7 Ti Ultra 9 185H, Arc 8-Core | Acemagic F2A Ultra 7 155H, Arc 8-Core | Geekom XT12 Pro i9-12900H, Iris Xe G7 96EUs | Geekom A7 R9 7940HS, Radeon 780M | Durchschnittliche Intel Iris Xe Graphics G7 96EUs | Durchschnitt der Klasse Mini PC | |
|---|---|---|---|---|---|---|---|---|
| Stromverbrauch | -38% | -34% | -35% | -21% | 11% | 1% | -41% | |
| Idle min * (Watt) | 6.3 | 8.2 -30% | 8.2 -30% | 9.1 -44% | 5.7 10% | 3.8 40% | 5.51 ? 13% | 8.98 ? -43% |
| Idle avg * (Watt) | 7.1 | 10 -41% | 12.1 -70% | 10.3 -45% | 9.5 -34% | 4.8 32% | 8.66 ? -22% | 11.1 ? -56% |
| Idle max * (Watt) | 9 | 14.6 -62% | 14 -56% | 14.4 -60% | 16.5 -83% | 6.5 28% | 10.9 ? -21% | 14.6 ? -62% |
| Last avg * (Watt) | 49.8 | 73.9 -48% | 53.1 -7% | 54.9 -10% | 53.3 -7% | 71.9 -44% | 45.6 ? 8% | 64.3 ? -29% |
| Cyberpunk 2077 ultra external monitor * (Watt) | 54 | 79.9 -48% | ||||||
| Last max * (Watt) | 94.5 | 95.3 -1% | 100.4 -6% | 110.4 -17% | 87.8 7% | 94.7 -0% | 67.8 ? 28% | 109.8 ? -16% |
* ... kleinere Werte sind besser
Effizienzübersicht
| Performance Rating - Percent | |
| Geekom A8, R9 8945HS | |
| Minisforum AtomMan X7 Ti | |
| Acemagic F2A | |
| Geekom XT13 Pro | |
| Geekom XT12 Pro | |
| Power Consumption | |
| Cinebench R23 Multi Power Efficiency - external Monitor | |
| Geekom A8, R9 8945HS | |
| Minisforum AtomMan X7 Ti | |
| Geekom XT13 Pro | |
| Acemagic F2A | |
| Geekom XT12 Pro | |
| Cinebench R23 Single Power Efficiency - external Monitor | |
| Geekom A8, R9 8945HS | |
| Minisforum AtomMan X7 Ti | |
| Acemagic F2A | |
| Geekom XT13 Pro | |
| Geekom XT12 Pro | |
| Cinebench R15 Multi Efficiency (external Monitor) | |
| Geekom A8, R9 8945HS | |
| Minisforum AtomMan X7 Ti | |
| Geekom XT13 Pro | |
| Acemagic F2A | |
| Geekom XT12 Pro | |
Energieaufnahme mit externem Monitor
Energieaufnahme mit externem Monitor
Pro
Contra
Fazit - Premiumpreis ohne Premiumleistung
Der Geekom XT13 Pro ist ein leistungsstarker Mini-PC. Das konnten wir dem Geekom XT12 Pro allerdings auch schon attestieren. Vergleichen wir nur diese beiden Modelle miteinander, so kann man sich ohne spürbare Leistungseinbußen für das ältere Gerät entscheiden. Der Intel Core i9-13900H des Geekom XT13 Pro kann nicht für einen spürbaren Leistungszuwachs sorgen. Zu gering sind die technischen Unterschiede im Vergleich zum Intel Core i9-12900H. Den mutigeren Schritt auf einen Mini-PC auf Basis der Meteor-Lake-Serie wagt Geekom nicht. Somit hat Geekom nur das Nachsehen, denn viele andere Hersteller haben ihre Modellreihe bereits mit den neuesten Prozessoren von Intel bestückt. Der größte Nachteil des Geekom XT13 Pro liegt bei der iGPU, die den modernen Vertretern in allen Tests unterlegen ist. Geekom unterliegt hier allerdings nicht nur den Kontrahenten, sondern auch sich selbst. Im eigenen Portfolio hat Geekom Mini-PCs mit aktuellsten AMD-SoCs, welche technisch nicht viel schlechter aufgestellt sind, aber ein rundum besseres Ergebnis abliefern. Dabei haben wir uns noch gar nicht dem Preis gewidmet. Hier fällt der Geekom XT13 Pro leider komplett aus dem Rahmen. 999 Euro stehen aktuell auf der Rechnung, wenn es das Topmodell sein soll. Andere Mini-PCs kosten etwas weniger, bieten aber mehr Leistung.
Der Geekom XT13 Pro liefert mit dem Intel Core i9-13900H eine adäquate Leistung und überzeugt mit seiner vielseitigen Ausstattung. Das Preis-Leistungs-Verhältnis des Geekom XT13 Pro passt jedoch ganz und gar nicht.
Positiv hervorzuheben ist die gute Anschlussausstattung, mit der Geekom auch in der Vergangenheit immer wieder punkten konnte. Unter den zahlreichen Anschlüssen verbergen sich auch zwei USB4-Ports, die hinsichtlich der Zukunftssicherheit die Kaufentscheidung beeinflussen können. Auch die dreijährige Herstellergarantie spricht für ein Gerät aus dem Hause Geekom. Diese gibt es freilich auch bei anderen Geräten des Herstellers. Die Effizienz konnte nur im Vergleich zum Geekom XT12 Pro etwas gesteigert werden. In dieser Disziplin ist der Intel Core i9-13900H den moderneren Meteor-Lake-Prozessoren deutlich unterlegen. Aus diesem Grund können wir dem Geekom XT13 Pro auch in Relation zu dem hohen Anschaffungspreis keine Kaufempfehlung geben. Wenn der Geekom XT13 Pro nicht zum Ladenhüter werden soll, muss Geekom seine aktuelle Preisgestaltung zwingend überarbeiten.
Hinweis: Wir haben unser Rating-System kürzlich aktualisiert und die Ergebnisse von Version 8 sind nicht mit den Ergebnissen von Version 7 vergleichbar. Weitere Informationen dazu sind hier verfügbar.
Preis und Verfügbarkeit
Geekom XT13 Pro
- 29.10.2025 v8
Sebastian Bade
 Total Sustainability Score:
 Transparenz
Die Auswahl der zu testenden Geräte erfolgt innerhalb der Redaktion. Das vorliegende Testmuster wurde dem Autor vom Hersteller unentgeltlich zu Testzwecken überlassen. Eine Einflussnahme auf den Testbericht gab es nicht, der Hersteller erhielt keine Version des Reviews vor der Veröffentlichung. Es bestand keine Verpflichtung zur Publikation. Als eigenständiges, unabhängiges Unternehmen unterliegt Notebookcheck keiner Diktion von Herstellern, Shops und Verlagen.
So testet Notebookcheck
Pro Jahr werden von Notebookcheck hunderte Laptops und Smartphones unabhängig in von uns standardisierten technischen Verfahren getestet, um eine Vergleichbarkeit aller Testergebnisse zu gewährleisten. Seit rund 20 Jahren entwickeln wir diese Testmethoden kontinuierlich weiter und setzen damit Branchenstandards. In unseren Testlaboren kommt ausschließlich hochwertiges Messequipment in die Hände erfahrener Techniker und Redakteure. Die Tests unterliegen einer mehrstufigen Kontrolle. Unsere komplexe Gesamtbewertung basiert auf hunderten fundierten Messergebnissen und Benchmarks, womit Ihnen Objektivität garantiert ist. Weitere Informationen zu unseren Testmethoden gibt es hier.
Preisvergleich
