Notebookcheck Logo

Beelink SER5 Pro 5600H Mini-PC Test: NUC-11-Geschwindigkeiten mit AMD Ryzen
Hervorragende CPU-Leistung für 650 Euro

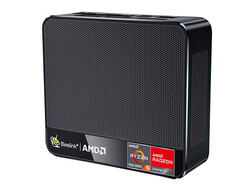
Der SER5 Pro setzt die Reihe der erschwinglichen HTPCs von Beelink fort, die allesamt als günstigere Alternativen zur Intel-NUC-Serie konzipiert wurden. Dieses neueste Modell fordert die High-End-Intel-NUCs mit Core-i7-CPUs der U-Serie heraus, indem es auf einem Ryzen-5-Zen-3-Prozessor der H-Serie läuft.
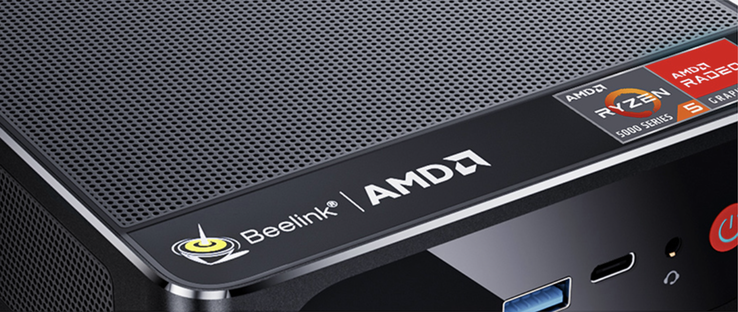
(Bildquelle: Beelink)

Ähnlich wie Zotac und seine bekannt große Auswahl an ZBox-Mini-PCs will auch Beelink alle paar Monate neue Modelle auf den Markt bringen, die mit immer schnelleren Prozessoren ausgestattet sind. Der Beelink SER4 wurde Anfang des Jahres mit dem Zen-2-Ryzen-7-4800U-Prozessor auf den Markt gebracht, aber jetzt ist der SER5 mit einem noch schnelleren Zen 3 Ryzen 5 5600H verfügbar, und das alles bei Preisen von deutlich unter 700 Euro.

Vergleichbare Konkurrenten in diesem Bereich sind z. B. Mini-PCs bzw. HTPCs ohne dedizierte Grafik wie der Ace Magician TK11, Geekom MiniAir 11, Zotac ZBox PI336 und die meisten Intel-NUC-Modelle.

Mehr Beelink Tests:

Beelink SER Pro Ryzen 5 5600H
Prozessor
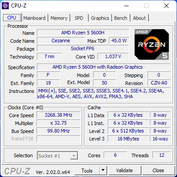
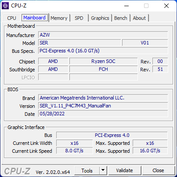
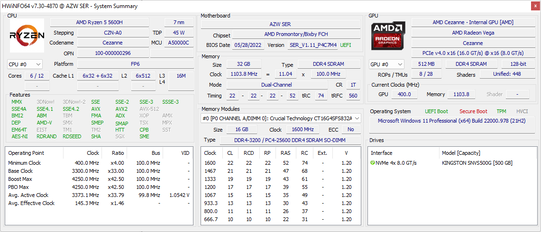
AMD Ryzen 5 5600H 6 x 3.3 - 4.2 GHz, 35 W PL2 / Short Burst, 35 W PL1 / Sustained, Cezanne-H (Zen 3)
Grafikkarte
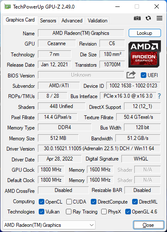
AMD Radeon RX Vega 7 - 512 MB VRAM, Speichertakt: 1600 MHz, DDR4, 30.0.15021.11005
RAM
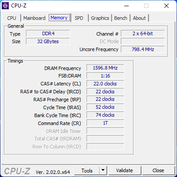
32 GB 
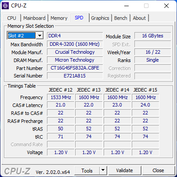
, Crucial DDR4-3200, 22-22-22-52, Dual-Channel
Mainboard
AMD Promontory/Bixby FCH
Massenspeicher
Kingston NV1 SNVS/500GCN, 500 GB 
Soundkarte
AMD Zen - Audio Processor - HD Audio Controller
Anschlüsse
4 USB 3.0 / 3.1 Gen1, USB-C Power Delivery (PD), 2 HDMI, 1 DisplayPort, Audio Anschlüsse: 3.5 mm combo
Netzwerk
Realtek RTL8168/8111 Gigabit-LAN (10/100/1000MBit/s), MediaTek RZ608 (a/b/g/n = Wi-Fi 4/ac = Wi-Fi 5/ax = Wi-Fi 6/ Wi-Fi 6E 6 GHz), Bluetooth 5.2
Abmessungen
Höhe x Breite x Tiefe (in mm): 42 x 126 x 113
Betriebssystem
Microsoft Windows 11 Pro
Sonstiges
12 Monate Garantie
Gewicht
498 g, Netzteil: 219 g
Preis
490 USD
Hinweis: Der Hersteller kann abweichende Bauteile wie Bildschirme, Laufwerke und Speicherriegel mit ähnlichen Spezifikationen unter dem gleichen Modellnamen einsetzen.


Potenzielle Wettbewerber im Vergleich

Bew.
Datum
Modell
Gewicht
Dicke
Größe
Auflösung
Preis ab

v (old)
10 / 2022
Beelink SER Pro Ryzen 5 5600H
R5 5600H, Vega 7
498 g42 mmx

v (old)
09 / 2022
Beelink SEi11 Pro
i5-11320H, Iris Xe G7 96EUs
440 g40 mmx

v (old)
02 / 2022
Beelink GTR5
R9 5900HX, Vega 8
686 g39 mmx

v (old)
04 / 2021
Intel NUC11TNKi5
i5-1135G7, Iris Xe G7 80EUs
504 g37 mmx

v (old)
02 / 2020
Intel NUC10i7FNH
i7-10710U, UHD Graphics 620
697 g51 mm0.00"0x0

v (old)
07 / 2022
Zotac ZBOX PI336 pico
Celeron N6211, UHD Graphics (Elkhart Lake 16 EU)
293 g20.7 mmx

Gehäuse

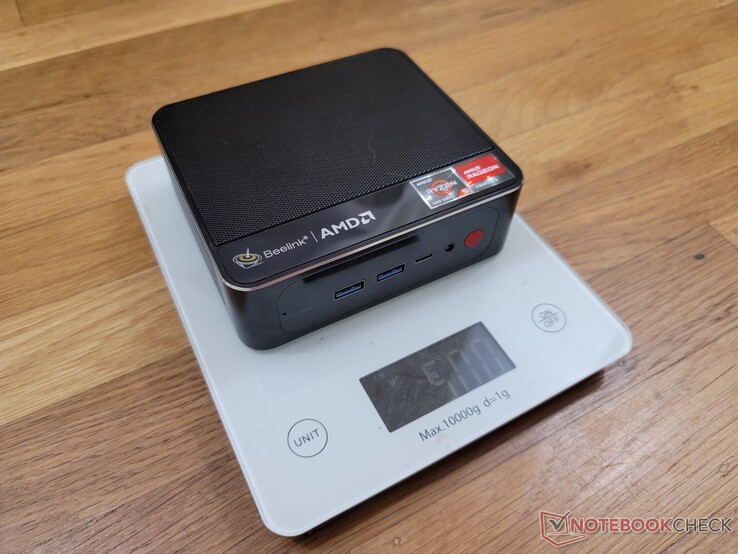
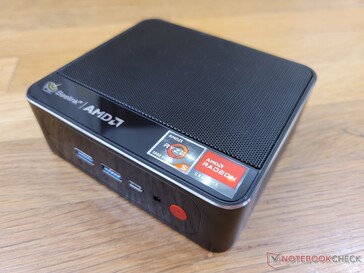
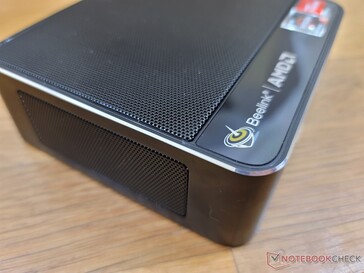
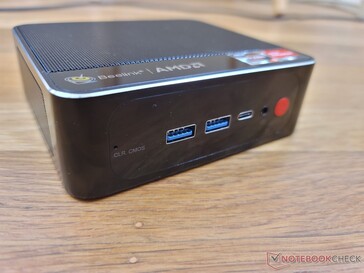
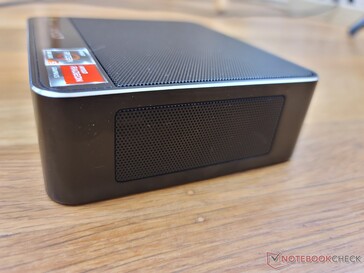
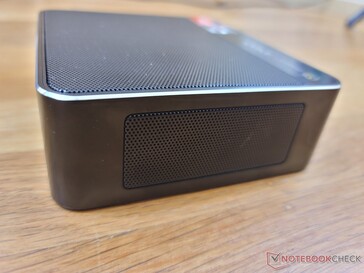
Sowohl der SER4 als auch der SER5 verwenden den gleichen Gehäusekörper, wenn auch mit leicht unterschiedlichen Oberflächenmarkierungen und Farben. Beim SER5 sind die Lüftungsgitter an der Seite schwarz statt rot. 

In Bezug auf die Größe ist der SER5 nur geringfügig dicker als der Intel NUC 11TNK. Mit etwa einem halben Kilogramm ist er aber genauso schwer.

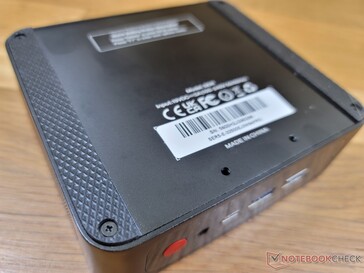
Vertrautes Gehäusedesign wie bei vielen anderen Beelink SER oder SEi Mini-PCs
zwei Bohrungen auf der Unterseite für die Befestigung der mitgelieferten VESA-Halterung
Verchromte Kanten und Ecken mit einem glänzenden Streifen auf der Vorderseite
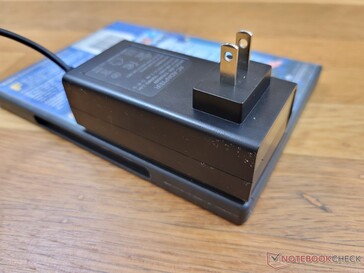
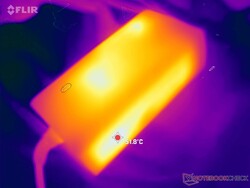
Steckernetzteil
Steckernetzteil

Größenvergleich

168 mm 120 mm 39 mm 686 g126 mm 113 mm 42 mm 498 g117 mm 112 mm 51 mm 697 g126 mm 113 mm 40 mm 440 g117 mm 112 mm 37 mm 504 g115 mm 76 mm 20.7 mm 293 g210 mm 148 mm 1 mm 2.9 g

Konnektivität

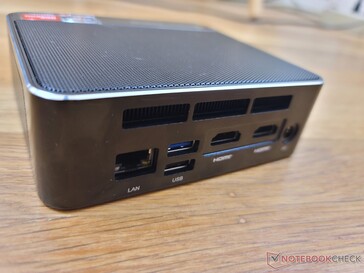
Die Anschlussoptionen sind die gleichen wie beim SER4. Es ist enttäuschend, dass Beelink immer noch nicht auf USB-C-Netzteile umgestiegen ist, da der SER5 stattdessen auf ein proprietäres Netzteil zurückgreift. Der einzelne USB-C-Anschluss an der Vorderseite unterstützt DisplayPort 1.4, aber nicht PD-in.

Vorderseite: 2x USB 3.0, USB-C, 3,5-mm-Kombo-Audio, Einschaltknopf
Rückseite: Gigabit RJ-45, 2x USB 3.0, 2x HDMI 2.0, Netzanschluss
Richtig: keine Anschlüsse
Links: keine Anschlüsse

Kommunikation

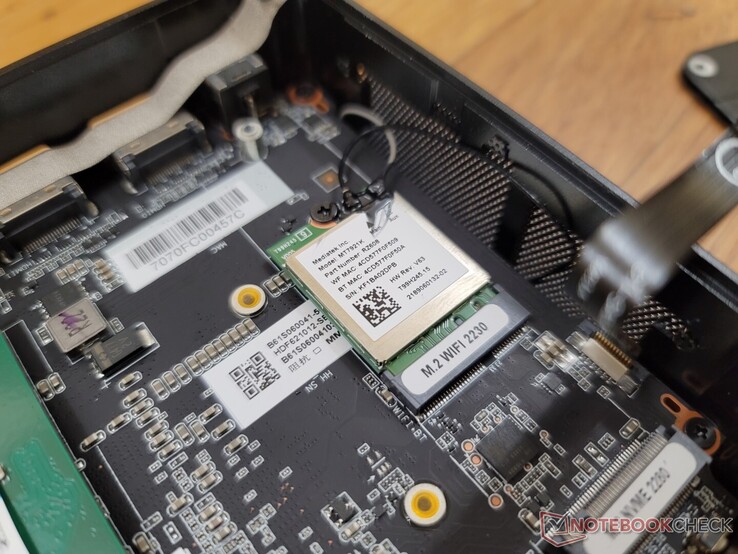
Ein MediaTek RZ608 wird standardmäßig für Wi-Fi-6E-Unterstützung eingesetzt, ähnlich wie beim Beelink SEi11 Pro. Allerdings ist die Leistung im Vergleich zu den gängigen Intel-AX200/210-Serien immer noch mangelhaft, wie die folgenden Diagramme zeigen.

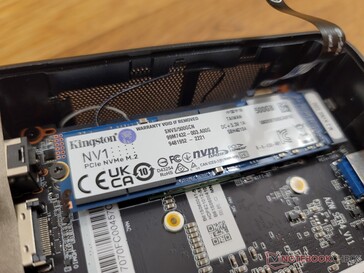
Das entfernbare M.2-WLAN-Modul befindet sich unter der M.2-SSD
Networking
iperf3 transmit AX12
Intel NUC11TNKi5
Intel Wi-Fi 6 AX201
1626 (1386min - 1677max) MBit/s
Beelink GTR5
MediaTek RZ608
657 (321min - 735max) MBit/s
iperf3 receive AX12
Intel NUC11TNKi5
Intel Wi-Fi 6 AX201
1524 (1442min - 1571max) MBit/s
Beelink GTR5
MediaTek RZ608
837 (806min - 876max) MBit/s
iperf3 receive AXE11000 6GHz
Zotac ZBOX PI336 pico
Intel Wi-Fi 6E AX210
1827 (1760min - 1865max) MBit/s +115%
Beelink SER Pro Ryzen 5 5600H
MediaTek RZ608
850 (802min - 876max) MBit/s
Beelink SEi11 Pro
MediaTek RZ608
743 (453min - 793max) MBit/s -13%
iperf3 transmit AXE11000 6GHz
Zotac ZBOX PI336 pico
Intel Wi-Fi 6E AX210
1385 (1351min - 1401max) MBit/s +85%
Beelink SER Pro Ryzen 5 5600H
MediaTek RZ608
750 (374min - 799max) MBit/s
Beelink SEi11 Pro
MediaTek RZ608
722 (447min - 789max) MBit/s -4%
050100150200250300350400450500550600650700750800850Tooltip
Beelink SER Pro Ryzen 5 5600H; iperf3 transmit AXE11000 6GHz; iperf 3.1.3: Ø738 (374-799)
Beelink SER Pro Ryzen 5 5600H; iperf3 receive AXE11000 6GHz; iperf 3.1.3: Ø850 (802-876)

Wartung

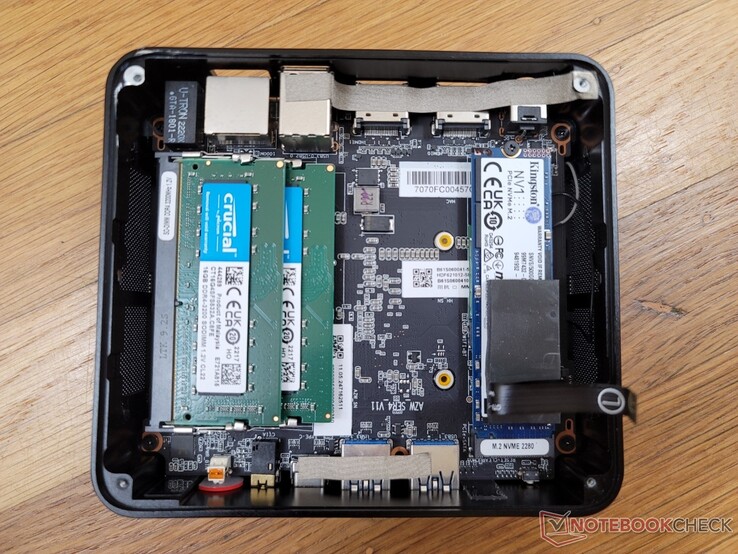
Die Bodenplatte ist mit vier Kreuzschlitzschrauben befestigt. Diese Schrauben sind viel kleiner als die Handschrauben an einem Intel NUC und erfordern einen Schraubenzieher, um sie zu entfernen. Man bedenke, dass auch diese Schrauben recht weich sind und bei Unachtsamkeit leicht abgerissen werden können.

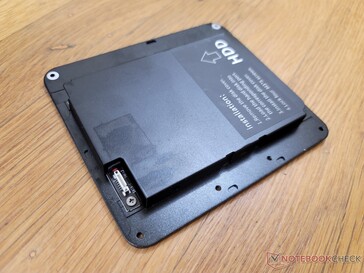
Nutzer haben Zugang zu zwei DDR4-SODIMM-Steckplätzen, zwei Speicherschächten (M.2 + 2,5-Zoll-SATA) und dem herausnehmbaren WLAN-Modul

Zubehör und Garantie

Im Lieferumfang enthalten sind eine abnehmbare VESA-Halterung, zusätzliche Schrauben, ein Benutzerhandbuch, zwei HDMI-Kabel und ein Netzgerät. 

Abgesehen von den EU bzw. länderspezifischen Vorschriften bietet der Hersteller eine Zubehörgarantie von einem Jahr an.

Leistung


Testbedingungen

Wir haben unser Gerät über Windows in den Leistungsmodus versetzt, bevor wir die folgenden Benchmarks durchgeführt haben.

Prozessor

Die Multi-Thread-Leistung ist etwa 15 % langsamer als der durchschnittliche PC in unserer Datenbank, der mit der gleichen Ryzen-5-5600H-CPU ausgestattet ist. Trotzdem ist die Gesamtleistung immer noch viel schneller als der übliche Core i7-1165G7, der in vielen Ultrabooks und Intel NUCs zu finden ist.

Cinebench R15 Multi Loop

01002003004005006007008009001000110012001300140015001600170018001900Tooltip
Beelink SER Pro Ryzen 5 5600H AMD Ryzen 5 5600H: Ø1310 (1286.46-1319.48)
Beelink SEi11 Pro Intel Core i5-11320H: Ø851 (845.25-856.84)
Beelink GTR5 AMD Ryzen 9 5900HX: Ø1938 (1889.11-1963.48)
Intel NUC11TNKi5 Intel Core i5-1135G7: Ø789 (772.57-794.38)
Intel NUC10i7FNH Intel Core i7-10710U: Ø946 (834.01-1067.02)
Cinebench R20: CPU (Multi Core) | CPU (Single Core)
Cinebench R23: Multi Core | Single Core
Cinebench R15: CPU Multi 64Bit | CPU Single 64Bit
Blender: v2.79 BMW27 CPU
7-Zip 18.03: 7z b 4 | 7z b 4 -mmt1
Geekbench 5.5: Multi-Core | Single-Core
HWBOT x265 Benchmark v2.2: 4k Preset
LibreOffice : 20 Documents To PDF
R Benchmark 2.5: Overall mean
Cinebench R20 / CPU (Multi Core)
HP Envy 16 h0112nr
Intel Core i7-12700H
5053 Points +64%
SCHENKER XMG Apex 15 NH57E PS
AMD Ryzen 7 5800H
4913 Points +60%
Honor MagicBook 14 2022
Intel Core i5-12500H
4723 Points +54%
Beelink GTR5
AMD Ryzen 9 5900HX
4596 Points +50%
Durchschnittliche AMD Ryzen 5 5600H
  (3074 - 4059, n=16)
3678 Points +20%
Beelink SER4
AMD Ryzen 7 4800U
3248 Points +6%
Beelink SER Pro Ryzen 5 5600H
AMD Ryzen 5 5600H
3074 Points
Intel NUC10i7FNH
Intel Core i7-10710U
2303 Points -25%
Beelink SEi11 Pro
Intel Core i5-11320H
2208 Points -28%
Framework Laptop 13.5
Intel Core i7-1165G7
2119 Points -31%
Intel NUC11TNKi5
Intel Core i5-1135G7
1974 Points -36%
Zotac ZBOX PI336 pico
Intel Celeron N6211
285 Points -91%
Cinebench R20 / CPU (Single Core)
HP Envy 16 h0112nr
Intel Core i7-12700H
683 Points +29%
Honor MagicBook 14 2022
Intel Core i5-12500H
652 Points +23%
Framework Laptop 13.5
Intel Core i7-1165G7
580 Points +9%
Beelink GTR5
AMD Ryzen 9 5900HX
579 Points +9%
Beelink SEi11 Pro
Intel Core i5-11320H
561 Points +6%
SCHENKER XMG Apex 15 NH57E PS
AMD Ryzen 7 5800H
558 Points +5%
Durchschnittliche AMD Ryzen 5 5600H
  (527 - 538, n=15)
533 Points 0%
Beelink SER Pro Ryzen 5 5600H
AMD Ryzen 5 5600H
531 Points
Intel NUC11TNKi5
Intel Core i5-1135G7
503 Points -5%
Beelink SER4
AMD Ryzen 7 4800U
488 Points -8%
Intel NUC10i7FNH
Intel Core i7-10710U
480 Points -10%
Zotac ZBOX PI336 pico
Intel Celeron N6211
174 Points -67%
Cinebench R23 / Multi Core
HP Envy 16 h0112nr
Intel Core i7-12700H
13094 (11750.2min - 13094.1max) Points +65%
SCHENKER XMG Apex 15 NH57E PS
AMD Ryzen 7 5800H
12663 Points +59%
Honor MagicBook 14 2022
Intel Core i5-12500H
12225 Points +54%
Beelink GTR5
AMD Ryzen 9 5900HX
11599 (11445.9min - 11598.6max) Points +46%
Durchschnittliche AMD Ryzen 5 5600H
  (7945 - 10416, n=13)
9466 Points +19%
Beelink SER4
AMD Ryzen 7 4800U
8376 (8310.1min - 8376.05max) Points +5%
Beelink SER Pro Ryzen 5 5600H
AMD Ryzen 5 5600H
7945 (7877.51min - 7944.53max) Points
Beelink SEi11 Pro
Intel Core i5-11320H
5720 (5681.08min - 5720.38max) Points -28%
Framework Laptop 13.5
Intel Core i7-1165G7
5477 (5385.09min - 5477.06max) Points -31%
Intel NUC11TNKi5
Intel Core i5-1135G7
5098 (4930.91min - 5098.17max) Points -36%
Zotac ZBOX PI336 pico
Intel Celeron N6211
735 Points -91%
Cinebench R23 / Single Core
HP Envy 16 h0112nr
Intel Core i7-12700H
1772 Points +30%
Honor MagicBook 14 2022
Intel Core i5-12500H
1697 Points +24%
Framework Laptop 13.5
Intel Core i7-1165G7
1507 Points +10%
Beelink GTR5
AMD Ryzen 9 5900HX
1497 Points +10%
Beelink SEi11 Pro
Intel Core i5-11320H
1467 Points +7%
SCHENKER XMG Apex 15 NH57E PS
AMD Ryzen 7 5800H
1427 Points +4%
Intel NUC11TNKi5
Intel Core i5-1135G7
1369 Points 0%
Beelink SER Pro Ryzen 5 5600H
AMD Ryzen 5 5600H
1367 Points
Durchschnittliche AMD Ryzen 5 5600H
  (1316 - 1381, n=13)
1363 Points 0%
Beelink SER4
AMD Ryzen 7 4800U
1240 Points -9%
Zotac ZBOX PI336 pico
Intel Celeron N6211
439 Points -68%
Cinebench R15 / CPU Multi 64Bit
HP Envy 16 h0112nr
Intel Core i7-12700H
2590 (2293.84min - 2590.34max) Points +96%
Honor MagicBook 14 2022
Intel Core i5-12500H
2094 (1576.35min - 2094.02max) Points +59%
Honor MagicBook 14 2022
Intel Core i5-12500H
2091 (1748.1min - 2091.07max) Points +59%
SCHENKER XMG Apex 15 NH57E PS
AMD Ryzen 7 5800H
2085 (2055.92min - 2084.96max) Points +58%
Beelink GTR5
AMD Ryzen 9 5900HX
1963 (1889.11min - 1963.48max) Points +49%
Durchschnittliche AMD Ryzen 5 5600H
  (1319 - 1723, n=16)
1562 Points +18%
Beelink SER4
AMD Ryzen 7 4800U
1411 (1390.29min - 1411.03max) Points +7%
Beelink SER Pro Ryzen 5 5600H
AMD Ryzen 5 5600H
1319 (1286.46min - 1319.48max) Points
Intel NUC10i7FNH
Intel Core i7-10710U
1067 Points -19%
Beelink SEi11 Pro
Intel Core i5-11320H
857 (845.25min - 856.84max) Points -35%
Framework Laptop 13.5
Intel Core i7-1165G7
850 (812.27min - 850.43max) Points -36%
Intel NUC11TNKi5
Intel Core i5-1135G7
794 (772.57min - 794.38max) Points -40%
Zotac ZBOX PI336 pico
Intel Celeron N6211
128 Points -90%
Cinebench R15 / CPU Single 64Bit
HP Envy 16 h0112nr
Intel Core i7-12700H
256 Points +16%
Beelink GTR5
AMD Ryzen 9 5900HX
240 Points +9%
Honor MagicBook 14 2022
Intel Core i5-12500H
240 Points +9%
SCHENKER XMG Apex 15 NH57E PS
AMD Ryzen 7 5800H
230 Points +4%
Framework Laptop 13.5
Intel Core i7-1165G7
224 Points +1%
Durchschnittliche AMD Ryzen 5 5600H
  (218 - 225, n=14)
222 Points 0%
Beelink SER Pro Ryzen 5 5600H
AMD Ryzen 5 5600H
221 Points
Beelink SEi11 Pro
Intel Core i5-11320H
214 Points -3%
Intel NUC11TNKi5
Intel Core i5-1135G7
201 Points -9%
Intel NUC10i7FNH
Intel Core i7-10710U
194 Points -12%
Beelink SER4
AMD Ryzen 7 4800U
187 Points -15%
Zotac ZBOX PI336 pico
Intel Celeron N6211
76 Points -66%
Blender / v2.79 BMW27 CPU
Zotac ZBOX PI336 pico
Intel Celeron N6211
3767 Seconds * -881%
Intel NUC11TNKi5
Intel Core i5-1135G7
600 Seconds * -56%
Framework Laptop 13.5
Intel Core i7-1165G7
551 Seconds * -43%
Beelink SEi11 Pro
Intel Core i5-11320H
541 Seconds * -41%
Intel NUC10i7FNH
Intel Core i7-10710U
468.3 Seconds * -22%
Beelink SER Pro Ryzen 5 5600H
AMD Ryzen 5 5600H
384 Seconds *
Beelink SER4
AMD Ryzen 7 4800U
340 Seconds * +11%
Durchschnittliche AMD Ryzen 5 5600H
  (300 - 384, n=14)
326 Seconds * +15%
Honor MagicBook 14 2022
Intel Core i5-12500H
264 Seconds * +31%
Beelink GTR5
AMD Ryzen 9 5900HX
262 Seconds * +32%
HP Envy 16 h0112nr
Intel Core i7-12700H
249 Seconds * +35%
SCHENKER XMG Apex 15 NH57E PS
AMD Ryzen 7 5800H
244 Seconds * +36%
7-Zip 18.03 / 7z b 4
SCHENKER XMG Apex 15 NH57E PS
AMD Ryzen 7 5800H
58467 MIPS +47%
Beelink GTR5
AMD Ryzen 9 5900HX
56761 MIPS +42%
HP Envy 16 h0112nr
Intel Core i7-12700H
54715 MIPS +37%
Honor MagicBook 14 2022
Intel Core i5-12500H
51818 MIPS +30%
Durchschnittliche AMD Ryzen 5 5600H
  (36315 - 46562, n=14)
43438 MIPS +9%
Beelink SER4
AMD Ryzen 7 4800U
40117 MIPS +1%
Beelink SER Pro Ryzen 5 5600H
AMD Ryzen 5 5600H
39897 MIPS
Intel NUC10i7FNH
Intel Core i7-10710U
29948 MIPS -25%
Beelink SEi11 Pro
Intel Core i5-11320H
24798 MIPS -38%
Framework Laptop 13.5
Intel Core i7-1165G7
24436 MIPS -39%
Intel NUC11TNKi5
Intel Core i5-1135G7
23280 MIPS -42%
Zotac ZBOX PI336 pico
Intel Celeron N6211
3974 MIPS -90%
7-Zip 18.03 / 7z b 4 -mmt1
Beelink GTR5
AMD Ryzen 9 5900HX
5791 MIPS +7%
HP Envy 16 h0112nr
Intel Core i7-12700H
5706 MIPS +6%
SCHENKER XMG Apex 15 NH57E PS
AMD Ryzen 7 5800H
5590 MIPS +4%
Framework Laptop 13.5
Intel Core i7-1165G7
5405 MIPS 0%
Beelink SER Pro Ryzen 5 5600H
AMD Ryzen 5 5600H
5400 MIPS
Durchschnittliche AMD Ryzen 5 5600H
  (5213 - 5446, n=14)
5350 MIPS -1%
Honor MagicBook 14 2022
Intel Core i5-12500H
5260 MIPS -3%
Beelink SEi11 Pro
Intel Core i5-11320H
5105 MIPS -5%
Intel NUC11TNKi5
Intel Core i5-1135G7
4738 MIPS -12%
Intel NUC10i7FNH
Intel Core i7-10710U
4727 MIPS -12%
Beelink SER4
AMD Ryzen 7 4800U
4603 MIPS -15%
Zotac ZBOX PI336 pico
Intel Celeron N6211
2593 MIPS -52%
Geekbench 5.5 / Multi-Core
HP Envy 16 h0112nr
Intel Core i7-12700H
12640 Points +107%
Honor MagicBook 14 2022
Intel Core i5-12500H
10828 Points +77%
SCHENKER XMG Apex 15 NH57E PS
AMD Ryzen 7 5800H
8389 Points +37%
Beelink GTR5
AMD Ryzen 9 5900HX
8147 Points +33%
Durchschnittliche AMD Ryzen 5 5600H
  (4990 - 7253, n=14)
6521 Points +7%
Beelink SER4
AMD Ryzen 7 4800U
6375 Points +4%
Beelink SER Pro Ryzen 5 5600H
AMD Ryzen 5 5600H
6103 Points
Intel NUC10i7FNH
Intel Core i7-10710U
5839 Points -4%
Beelink SEi11 Pro
Intel Core i5-11320H
4959 Points -19%
Intel NUC11TNKi5
Intel Core i5-1135G7
4593 Points -25%
Zotac ZBOX PI336 pico
Intel Celeron N6211
844 Points -86%
Geekbench 5.5 / Single-Core
HP Envy 16 h0112nr
Intel Core i7-12700H
1773 Points +23%
Honor MagicBook 14 2022
Intel Core i5-12500H
1685 Points +17%
Beelink GTR5
AMD Ryzen 9 5900HX
1560 Points +9%
Beelink SEi11 Pro
Intel Core i5-11320H
1518 Points +6%
SCHENKER XMG Apex 15 NH57E PS
AMD Ryzen 7 5800H
1501 Points +5%
Beelink SER Pro Ryzen 5 5600H
AMD Ryzen 5 5600H
1436 Points
Durchschnittliche AMD Ryzen 5 5600H
  (1365 - 1445, n=14)
1412 Points -2%
Intel NUC11TNKi5
Intel Core i5-1135G7
1396 Points -3%
Intel NUC10i7FNH
Intel Core i7-10710U
1229 Points -14%
Beelink SER4
AMD Ryzen 7 4800U
1192 Points -17%
Zotac ZBOX PI336 pico
Intel Celeron N6211
556 Points -61%
HWBOT x265 Benchmark v2.2 / 4k Preset
SCHENKER XMG Apex 15 NH57E PS
AMD Ryzen 7 5800H
15.6 fps +49%
HP Envy 16 h0112nr
Intel Core i7-12700H
14.9 fps +42%
Beelink GTR5
AMD Ryzen 9 5900HX
14.8 fps +41%
Honor MagicBook 14 2022
Intel Core i5-12500H
14.3 fps +36%
Durchschnittliche AMD Ryzen 5 5600H
  (9.92 - 13.3, n=14)
12 fps +14%
Beelink SER Pro Ryzen 5 5600H
AMD Ryzen 5 5600H
10.5 fps
Beelink SER4
AMD Ryzen 7 4800U
10.4 fps -1%
Intel NUC10i7FNH
Intel Core i7-10710U
7.95 fps -24%
Beelink SEi11 Pro
Intel Core i5-11320H
7.28 fps -31%
Framework Laptop 13.5
Intel Core i7-1165G7
7.05 fps -33%
Intel NUC11TNKi5
Intel Core i5-1135G7
6.63 fps -37%
Zotac ZBOX PI336 pico
Intel Celeron N6211
0.88 fps -92%
LibreOffice / 20 Documents To PDF
Zotac ZBOX PI336 pico
Intel Celeron N6211
144.7 s * -177%
Beelink SER4
AMD Ryzen 7 4800U
62.6 s * -20%
Durchschnittliche AMD Ryzen 5 5600H
  (52.2 - 81.5, n=14)
58.7 s * -12%
SCHENKER XMG Apex 15 NH57E PS
AMD Ryzen 7 5800H
53.5 s * -2%
Beelink SER Pro Ryzen 5 5600H
AMD Ryzen 5 5600H
52.2 s *
Intel NUC11TNKi5
Intel Core i5-1135G7
51.3 s * +2%
Beelink GTR5
AMD Ryzen 9 5900HX
49.7 s * +5%
Beelink SEi11 Pro
Intel Core i5-11320H
49.1 s * +6%
HP Envy 16 h0112nr
Intel Core i7-12700H
45.3 s * +13%
Framework Laptop 13.5
Intel Core i7-1165G7
45.1 s * +14%
Honor MagicBook 14 2022
Intel Core i5-12500H
41.6 s * +20%
R Benchmark 2.5 / Overall mean
Zotac ZBOX PI336 pico
Intel Celeron N6211
1.371 sec * -159%
Intel NUC10i7FNH
Intel Core i7-10710U
0.649 sec * -22%
Intel NUC11TNKi5
Intel Core i5-1135G7
0.622 sec * -17%
Beelink SEi11 Pro
Intel Core i5-11320H
0.581 sec * -10%
Beelink SER4
AMD Ryzen 7 4800U
0.576 sec * -9%
Framework Laptop 13.5
Intel Core i7-1165G7
0.566 sec * -7%
Durchschnittliche AMD Ryzen 5 5600H
  (0.526 - 0.596, n=14)
0.541 sec * -2%
Beelink SER Pro Ryzen 5 5600H
AMD Ryzen 5 5600H
0.53 sec *
SCHENKER XMG Apex 15 NH57E PS
AMD Ryzen 7 5800H
0.512 sec * +3%
Honor MagicBook 14 2022
Intel Core i5-12500H
0.4969 sec * +6%
Beelink GTR5
AMD Ryzen 9 5900HX
0.48 sec * +9%
HP Envy 16 h0112nr
Intel Core i7-12700H
0.4586 sec * +13%

* ... kleinere Werte sind besser

Cinebench R15 CPU Multi 64Bit
1319 Points
Cinebench R15 OpenGL 64Bit
89.3 fps
Cinebench R15 Ref. Match 64Bit
98 %
Cinebench R15 CPU Single 64Bit
221 Points
Cinebench R20 CPU (Multi Core)
3074 Points
Cinebench R20 CPU (Single Core)
531 Points
Cinebench R23 Single Core
1367 Points
Cinebench R23 Multi Core
7945 Points
Hilfe
Performance Rating
Beelink GTR5
AMD Ryzen 9 5900HX, Vega 8
97.8 pt
Beelink SER Pro Ryzen 5 5600H
AMD Ryzen 5 5600H, Vega 7
67.4 pt
Beelink SEi11 Pro
Intel Core i5-11320H, Iris Xe G7 96EUs
53.2 pt
Intel NUC11TNKi5
Intel Core i5-1135G7, Iris Xe G7 80EUs
47.7 pt
Zotac ZBOX PI336 pico
Intel Celeron N6211, UHD Graphics (Elkhart Lake 16 EU)
6.9 pt
AIDA64 / FP32 Ray-Trace
Beelink GTR5
AMD Ryzen 9 5900HX, Vega 8
13987 KRay/s +52%
Beelink SER Pro Ryzen 5 5600H
AMD Ryzen 5 5600H, Vega 7
9181 KRay/s
Beelink SEi11 Pro
Intel Core i5-11320H, Iris Xe G7 96EUs
7047 KRay/s -23%
Intel NUC11TNKi5
Intel Core i5-1135G7, Iris Xe G7 80EUs
6699 KRay/s -27%
Zotac ZBOX PI336 pico
Intel Celeron N6211, UHD Graphics (Elkhart Lake 16 EU)
490 KRay/s -95%
AIDA64 / FPU Julia
Beelink GTR5
AMD Ryzen 9 5900HX, Vega 8
88153 Points +52%
Beelink SER Pro Ryzen 5 5600H
AMD Ryzen 5 5600H, Vega 7
58039 Points
Beelink SEi11 Pro
Intel Core i5-11320H, Iris Xe G7 96EUs
29972 Points -48%
Intel NUC11TNKi5
Intel Core i5-1135G7, Iris Xe G7 80EUs
27861 Points -52%
Zotac ZBOX PI336 pico
Intel Celeron N6211, UHD Graphics (Elkhart Lake 16 EU)
2932 Points -95%
AIDA64 / CPU SHA3
Beelink GTR5
AMD Ryzen 9 5900HX, Vega 8
3026 MB/s +51%
Beelink SER Pro Ryzen 5 5600H
AMD Ryzen 5 5600H, Vega 7
2006 MB/s
Beelink SEi11 Pro
Intel Core i5-11320H, Iris Xe G7 96EUs
1992 MB/s -1%
Intel NUC11TNKi5
Intel Core i5-1135G7, Iris Xe G7 80EUs
1855 MB/s -8%
Zotac ZBOX PI336 pico
Intel Celeron N6211, UHD Graphics (Elkhart Lake 16 EU)
202 MB/s -90%
AIDA64 / CPU Queen
Beelink GTR5
AMD Ryzen 9 5900HX, Vega 8
97835 Points +47%
Beelink SER Pro Ryzen 5 5600H
AMD Ryzen 5 5600H, Vega 7
66699 Points
Beelink SEi11 Pro
Intel Core i5-11320H, Iris Xe G7 96EUs
48212 Points -28%
Intel NUC11TNKi5
Intel Core i5-1135G7, Iris Xe G7 80EUs
46536 Points -30%
Zotac ZBOX PI336 pico
Intel Celeron N6211, UHD Graphics (Elkhart Lake 16 EU)
8820 Points -87%
AIDA64 / FPU SinJulia
Beelink GTR5
AMD Ryzen 9 5900HX, Vega 8
12402 Points +49%
Beelink SER Pro Ryzen 5 5600H
AMD Ryzen 5 5600H, Vega 7
8340 Points
Beelink SEi11 Pro
Intel Core i5-11320H, Iris Xe G7 96EUs
4771 Points -43%
Intel NUC11TNKi5
Intel Core i5-1135G7, Iris Xe G7 80EUs
4444 Points -47%
Zotac ZBOX PI336 pico
Intel Celeron N6211, UHD Graphics (Elkhart Lake 16 EU)
396 Points -95%
AIDA64 / FPU Mandel
Beelink GTR5
AMD Ryzen 9 5900HX, Vega 8
48563 Points +52%
Beelink SER Pro Ryzen 5 5600H
AMD Ryzen 5 5600H, Vega 7
31962 Points
Beelink SEi11 Pro
Intel Core i5-11320H, Iris Xe G7 96EUs
17987 Points -44%
Intel NUC11TNKi5
Intel Core i5-1135G7, Iris Xe G7 80EUs
16937 Points -47%
Zotac ZBOX PI336 pico
Intel Celeron N6211, UHD Graphics (Elkhart Lake 16 EU)
1558 Points -95%
AIDA64 / CPU AES
Beelink GTR5
AMD Ryzen 9 5900HX, Vega 8
119784 MB/s +51%
Beelink SER Pro Ryzen 5 5600H
AMD Ryzen 5 5600H, Vega 7
79183 MB/s
Beelink SEi11 Pro
Intel Core i5-11320H, Iris Xe G7 96EUs
68683 MB/s -13%
Intel NUC11TNKi5
Intel Core i5-1135G7, Iris Xe G7 80EUs
66724 MB/s -16%
Zotac ZBOX PI336 pico
Intel Celeron N6211, UHD Graphics (Elkhart Lake 16 EU)
7653 MB/s -90%
AIDA64 / CPU ZLib
Beelink GTR5
AMD Ryzen 9 5900HX, Vega 8
769 MB/s +52%
Beelink SER Pro Ryzen 5 5600H
AMD Ryzen 5 5600H, Vega 7
507 MB/s
Intel NUC11TNKi5
Intel Core i5-1135G7, Iris Xe G7 80EUs
373 MB/s -26%
Beelink SEi11 Pro
Intel Core i5-11320H, Iris Xe G7 96EUs
368 MB/s -27%
Zotac ZBOX PI336 pico
Intel Celeron N6211, UHD Graphics (Elkhart Lake 16 EU)
75.2 MB/s -85%
AIDA64 / FP64 Ray-Trace
Beelink GTR5
AMD Ryzen 9 5900HX, Vega 8
7395 KRay/s +54%
Beelink SER Pro Ryzen 5 5600H
AMD Ryzen 5 5600H, Vega 7
4811 KRay/s
Beelink SEi11 Pro
Intel Core i5-11320H, Iris Xe G7 96EUs
3811 KRay/s -21%
Intel NUC11TNKi5
Intel Core i5-1135G7, Iris Xe G7 80EUs
3628 KRay/s -25%
Zotac ZBOX PI336 pico
Intel Celeron N6211, UHD Graphics (Elkhart Lake 16 EU)
273 KRay/s -94%
AIDA64 / CPU PhotoWorxx
Beelink SEi11 Pro
Intel Core i5-11320H, Iris Xe G7 96EUs
25964 MPixel/s +28%
Beelink GTR5
AMD Ryzen 9 5900HX, Vega 8
20277 MPixel/s 0%
Beelink SER Pro Ryzen 5 5600H
AMD Ryzen 5 5600H, Vega 7
20237 MPixel/s
Intel NUC11TNKi5
Intel Core i5-1135G7, Iris Xe G7 80EUs
16877 MPixel/s -17%
Zotac ZBOX PI336 pico
Intel Celeron N6211, UHD Graphics (Elkhart Lake 16 EU)
5125 MPixel/s -75%

Systemleistung

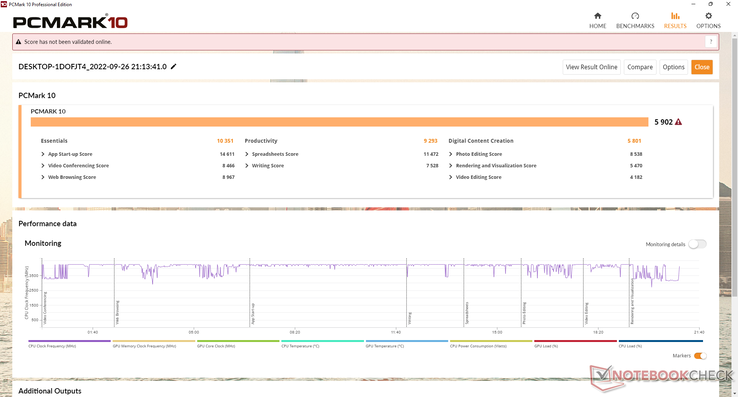
Die Ergebnisse des PCMark 10 sind dort, wo wir sie im Vergleich zu anderen Ryzen-5-5600H-Laptops oder Mini-PCs erwarten, außer im Subtest Digital Content Creation, wo die Grafikleistung am wichtigsten ist. Das liegt daran, dass viele Laptops mit dem gleichen Prozessor in der Regel mit einer schnelleren dedizierten Grafikkarte ausgestattet sind.

PCMark 10 / Score
Beelink GTR5
Vega 8, R9 5900HX, Kingston NV1 SNVS/500GCN
6504 Points +10%
Durchschnittliche AMD Ryzen 5 5600H
  (5309 - 7091, n=14)
6135 Points +4%
Beelink SER Pro Ryzen 5 5600H
Vega 7, R5 5600H, Kingston NV1 SNVS/500GCN
5902 Points
Beelink SEi11 Pro
Iris Xe G7 96EUs, i5-11320H, Kingston NV1 SNVS/500GCN
5095 Points -14%
Intel NUC11TNKi5
Iris Xe G7 80EUs, i5-1135G7, Transcend M.2 SSD 430S TS512GMTS430S
4512 Points -24%
Intel NUC10i7FNH
UHD Graphics 620, i7-10710U, Kingston RBUSNS8154P3256GJ1
4418 Points -25%
PCMark 10 / Essentials
Beelink GTR5
Vega 8, R9 5900HX, Kingston NV1 SNVS/500GCN
10772 Points +4%
Beelink SER Pro Ryzen 5 5600H
Vega 7, R5 5600H, Kingston NV1 SNVS/500GCN
10351 Points
Beelink SEi11 Pro
Iris Xe G7 96EUs, i5-11320H, Kingston NV1 SNVS/500GCN
10281 Points -1%
Durchschnittliche AMD Ryzen 5 5600H
  (9326 - 10506, n=14)
9950 Points -4%
Intel NUC10i7FNH
UHD Graphics 620, i7-10710U, Kingston RBUSNS8154P3256GJ1
9013 Points -13%
Intel NUC11TNKi5
Iris Xe G7 80EUs, i5-1135G7, Transcend M.2 SSD 430S TS512GMTS430S
9000 Points -13%
PCMark 10 / Productivity
Beelink GTR5
Vega 8, R9 5900HX, Kingston NV1 SNVS/500GCN
9875 Points +6%
Beelink SER Pro Ryzen 5 5600H
Vega 7, R5 5600H, Kingston NV1 SNVS/500GCN
9293 Points
Durchschnittliche AMD Ryzen 5 5600H
  (7975 - 9642, n=14)
8901 Points -4%
Beelink SEi11 Pro
Iris Xe G7 96EUs, i5-11320H, Kingston NV1 SNVS/500GCN
6915 Points -26%
Intel NUC10i7FNH
UHD Graphics 620, i7-10710U, Kingston RBUSNS8154P3256GJ1
6876 Points -26%
Intel NUC11TNKi5
Iris Xe G7 80EUs, i5-1135G7, Transcend M.2 SSD 430S TS512GMTS430S
6190 Points -33%
PCMark 10 / Digital Content Creation
Durchschnittliche AMD Ryzen 5 5600H
  (4921 - 9907, n=14)
7149 Points +23%
Beelink GTR5
Vega 8, R9 5900HX, Kingston NV1 SNVS/500GCN
7020 Points +21%
Beelink SER Pro Ryzen 5 5600H
Vega 7, R5 5600H, Kingston NV1 SNVS/500GCN
5801 Points
Beelink SEi11 Pro
Iris Xe G7 96EUs, i5-11320H, Kingston NV1 SNVS/500GCN
5048 Points -13%
Intel NUC11TNKi5
Iris Xe G7 80EUs, i5-1135G7, Transcend M.2 SSD 430S TS512GMTS430S
4474 Points -23%
Intel NUC10i7FNH
UHD Graphics 620, i7-10710U, Kingston RBUSNS8154P3256GJ1
3777 Points -35%
CrossMark / Overall
Beelink GTR5
Vega 8, R9 5900HX, Kingston NV1 SNVS/500GCN
1501 Points +14%
Beelink SEi11 Pro
Iris Xe G7 96EUs, i5-11320H, Kingston NV1 SNVS/500GCN
1335 Points +2%
Beelink SER Pro Ryzen 5 5600H
Vega 7, R5 5600H, Kingston NV1 SNVS/500GCN
1311 Points
Durchschnittliche AMD Ryzen 5 5600H
  (1157 - 1353, n=7)
1292 Points -1%
CrossMark / Productivity
Beelink GTR5
Vega 8, R9 5900HX, Kingston NV1 SNVS/500GCN
1495 Points +10%
Beelink SEi11 Pro
Iris Xe G7 96EUs, i5-11320H, Kingston NV1 SNVS/500GCN
1419 Points +5%
Beelink SER Pro Ryzen 5 5600H
Vega 7, R5 5600H, Kingston NV1 SNVS/500GCN
1355 Points
Durchschnittliche AMD Ryzen 5 5600H
  (1217 - 1384, n=7)
1332 Points -2%
CrossMark / Creativity
Beelink GTR5
Vega 8, R9 5900HX, Kingston NV1 SNVS/500GCN
1589 Points +21%
Durchschnittliche AMD Ryzen 5 5600H
  (1184 - 1377, n=7)
1316 Points 0%
Beelink SER Pro Ryzen 5 5600H
Vega 7, R5 5600H, Kingston NV1 SNVS/500GCN
1315 Points
Beelink SEi11 Pro
Iris Xe G7 96EUs, i5-11320H, Kingston NV1 SNVS/500GCN
1256 Points -4%
CrossMark / Responsiveness
Beelink SEi11 Pro
Iris Xe G7 96EUs, i5-11320H, Kingston NV1 SNVS/500GCN
1336 Points +14%
Beelink GTR5
Vega 8, R9 5900HX, Kingston NV1 SNVS/500GCN
1281 Points +9%
Beelink SER Pro Ryzen 5 5600H
Vega 7, R5 5600H, Kingston NV1 SNVS/500GCN
1177 Points
Durchschnittliche AMD Ryzen 5 5600H
  (926 - 1225, n=7)
1118 Points -5%
PCMark 10 Score
5902 Punkte
Hilfe
AIDA64 / Memory Copy
Beelink GTR5
AMD Ryzen 9 5900HX, Vega 8
42079 MB/s 0%
Beelink SER Pro Ryzen 5 5600H
AMD Ryzen 5 5600H, Vega 7
42001 MB/s
Beelink SEi11 Pro
Intel Core i5-11320H, Iris Xe G7 96EUs
41106 MB/s -2%
Durchschnittliche AMD Ryzen 5 5600H
  (20549 - 42141, n=14)
37145 MB/s -12%
Intel NUC11TNKi5
Intel Core i5-1135G7, Iris Xe G7 80EUs
22895 MB/s -45%
Zotac ZBOX PI336 pico
Intel Celeron N6211, UHD Graphics (Elkhart Lake 16 EU)
15737 MB/s -63%
AIDA64 / Memory Read
Beelink SER Pro Ryzen 5 5600H
AMD Ryzen 5 5600H, Vega 7
47363 MB/s
Beelink GTR5
AMD Ryzen 9 5900HX, Vega 8
47281 MB/s 0%
Beelink SEi11 Pro
Intel Core i5-11320H, Iris Xe G7 96EUs
46516 MB/s -2%
Durchschnittliche AMD Ryzen 5 5600H
  (22917 - 47595, n=14)
42445 MB/s -10%
Intel NUC11TNKi5
Intel Core i5-1135G7, Iris Xe G7 80EUs
24947 MB/s -47%
Zotac ZBOX PI336 pico
Intel Celeron N6211, UHD Graphics (Elkhart Lake 16 EU)
10311 MB/s -78%
AIDA64 / Memory Write
Beelink SEi11 Pro
Intel Core i5-11320H, Iris Xe G7 96EUs
46760 MB/s +10%
Beelink SER Pro Ryzen 5 5600H
AMD Ryzen 5 5600H, Vega 7
42347 MB/s
Beelink GTR5
AMD Ryzen 9 5900HX, Vega 8
42270 MB/s 0%
Durchschnittliche AMD Ryzen 5 5600H
  (20226 - 44872, n=14)
36396 MB/s -14%
Intel NUC11TNKi5
Intel Core i5-1135G7, Iris Xe G7 80EUs
23454 MB/s -45%
Zotac ZBOX PI336 pico
Intel Celeron N6211, UHD Graphics (Elkhart Lake 16 EU)
17031 MB/s -60%
AIDA64 / Memory Latency
Intel NUC11TNKi5
Intel Core i5-1135G7, Iris Xe G7 80EUs
87.1 ns * -8%
Beelink SEi11 Pro
Intel Core i5-11320H, Iris Xe G7 96EUs
81 ns * -1%
Beelink SER Pro Ryzen 5 5600H
AMD Ryzen 5 5600H, Vega 7
80.3 ns *
Beelink GTR5
AMD Ryzen 9 5900HX, Vega 8
80 ns * -0%
Durchschnittliche AMD Ryzen 5 5600H
  (75 - 89.1, n=14)
79 ns * +2%
Zotac ZBOX PI336 pico
Intel Celeron N6211, UHD Graphics (Elkhart Lake 16 EU)
76.3 ns * +5%

* ... kleinere Werte sind besser

DPC-Latenz

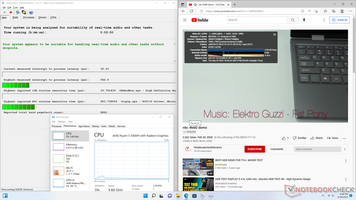
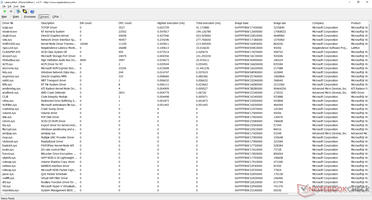
LatencyMon zeigt keine größeren DPC-Probleme beim Öffnen mehrerer Browser-Tabs auf unserer Homepage. Leider ist die 4K-Videowiedergabe bei 60 fps mangelhaft, da während unseres einminütigen Videos 21 Frames ausfallen.

DPC Latencies / LatencyMon - interrupt to process latency (max), Web, Youtube, Prime95
Zotac ZBOX PI336 pico
UHD Graphics (Elkhart Lake 16 EU), Celeron N6211, SanDisk DF4128
1476.3 μs * -163%
Beelink SER Pro Ryzen 5 5600H
Vega 7, R5 5600H, Kingston NV1 SNVS/500GCN
562 μs *
Intel NUC11TNKi5
Iris Xe G7 80EUs, i5-1135G7, Transcend M.2 SSD 430S TS512GMTS430S
525 μs * +7%
Beelink SEi11 Pro
Iris Xe G7 96EUs, i5-11320H, Kingston NV1 SNVS/500GCN
167.2 μs * +70%
Beelink GTR5
Vega 8, R9 5900HX, Kingston NV1 SNVS/500GCN
116 μs * +79%

* ... kleinere Werte sind besser

Massenspeicher

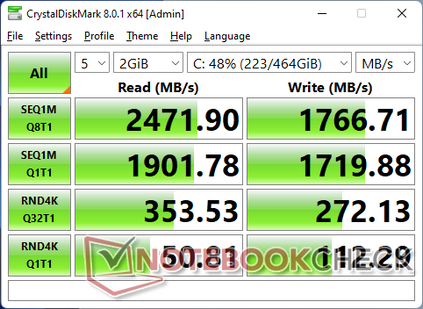
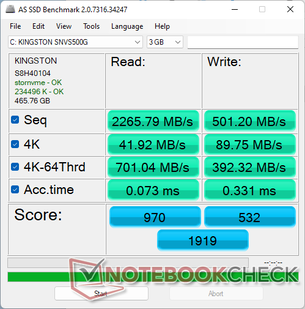
Die NVMe-Geschwindigkeiten sind auf PCIe3 x4 beschränkt, während die meisten neueren Intel-NUC-Modelle PCIe4 x4 vollständig unterstützen. PCIe3 ist jedoch für die meisten Nutzer mehr als ausreichend, sodass die Einschränkung hier nicht ins Gewicht fällt. Unsere Mittelklasse 500 GB Kingston NV1 SSD ist in der Lage, die maximalen Lesegeschwindigkeiten von ~2.500 MB/s ohne thermische Probleme zu erreichen. 

CDM 8
CDM 8
AS SSD
AS SSD
Primärer M.2-NVMe-Steckplatz
Sekundärer 2,5-Zoll-SATA-Schacht
Kingston NV1 SNVS/500GCN
CDM 5/6 Read Seq Q32T1: 2440 MB/s
CDM 5/6 Write Seq Q32T1: 1764 MB/s
CDM 5/6 Read 4K Q32T1: 353.6 MB/s
CDM 5/6 Write 4K Q32T1: 270.8 MB/s
CDM 5 Read Seq: 1898 MB/s
CDM 5 Write Seq: 1727 MB/s
CDM 5/6 Read 4K: 50.6 MB/s
CDM 5/6 Write 4K: 117.8 MB/s
Drive Performance Rating - Percent
Beelink SER Pro Ryzen 5 5600H -11!
Kingston NV1 SNVS/500GCN
94.2 pt
Beelink GTR5
Kingston NV1 SNVS/500GCN
93.2 pt
Beelink SEi11 Pro
Kingston NV1 SNVS/500GCN
92.9 pt
Intel NUC10i7FNH
Kingston RBUSNS8154P3256GJ1
53.8 pt
Intel NUC11TNKi5
Transcend M.2 SSD 430S TS512GMTS430S
34.1 pt
Zotac ZBOX PI336 pico
SanDisk DF4128
7.8 pt
DiskSpd
seq read
Beelink GTR5
Kingston NV1 SNVS/500GCN
1986 (1983.26min - 1986.21max) MB/s +1%
Beelink SER Pro Ryzen 5 5600H
Kingston NV1 SNVS/500GCN
1976 (1950.06min - 1975.69max) MB/s
Beelink SEi11 Pro
Kingston NV1 SNVS/500GCN
1638 (1628.34min - 1637.59max) MB/s -17%
Intel NUC10i7FNH
Kingston RBUSNS8154P3256GJ1
687 MB/s -65%
Intel NUC11TNKi5
Transcend M.2 SSD 430S TS512GMTS430S
509 (505.62min - 509.19max) MB/s -74%
Zotac ZBOX PI336 pico
SanDisk DF4128
250 (248.23min - 249.69max) MB/s -87%
seq write
Beelink GTR5
Kingston NV1 SNVS/500GCN
1766 (564min - 1766.22max) MB/s +1%
Beelink SER Pro Ryzen 5 5600H
Kingston NV1 SNVS/500GCN
1746 (580.39min - 1746.23max) MB/s
Beelink SEi11 Pro
Kingston NV1 SNVS/500GCN
1661 (336.85min - 1661.33max) MB/s -5%
Intel NUC10i7FNH
Kingston RBUSNS8154P3256GJ1
858 MB/s -51%
Intel NUC11TNKi5
Transcend M.2 SSD 430S TS512GMTS430S
467 (462min - 467.13max) MB/s -73%
Zotac ZBOX PI336 pico
SanDisk DF4128
105.7 (97.74min - 105.7max) MB/s -94%
seq q8 t1 read
Beelink GTR5
Kingston NV1 SNVS/500GCN
2511 (2320.5min - 2511.12max) MB/s +2%
Beelink SER Pro Ryzen 5 5600H
Kingston NV1 SNVS/500GCN
2456 (2261.06min - 2456.06max) MB/s
Beelink SEi11 Pro
Kingston NV1 SNVS/500GCN
2374 (2218.75min - 2374.19max) MB/s -3%
Intel NUC10i7FNH
Kingston RBUSNS8154P3256GJ1
1030 MB/s -58%
Intel NUC11TNKi5
Transcend M.2 SSD 430S TS512GMTS430S
561 (469.24min - 560.5max) MB/s -77%
Zotac ZBOX PI336 pico
SanDisk DF4128
254 (201.55min - 254.3max) MB/s -90%
seq q8 t1 write
Beelink GTR5
Kingston NV1 SNVS/500GCN
1797 (679.16min - 1796.66max) MB/s +2%
Beelink SER Pro Ryzen 5 5600H
Kingston NV1 SNVS/500GCN
1763 (714.42min - 1763.25max) MB/s
Beelink SEi11 Pro
Kingston NV1 SNVS/500GCN
1433 (67.32min - 1432.98max) MB/s -19%
Intel NUC10i7FNH
Kingston RBUSNS8154P3256GJ1
980 MB/s -44%
Intel NUC11TNKi5
Transcend M.2 SSD 430S TS512GMTS430S
504 (500.38min - 503.53max) MB/s -71%
Zotac ZBOX PI336 pico
SanDisk DF4128
100.9 (42.78min - 100.87max) MB/s -94%
4k q1 t1 read
Beelink GTR5
Kingston NV1 SNVS/500GCN
51.1 (45.32min - 51.14max) MB/s +15%
Beelink SEi11 Pro
Kingston NV1 SNVS/500GCN
50.5 (48.13min - 50.48max) MB/s +14%
Beelink SER Pro Ryzen 5 5600H
Kingston NV1 SNVS/500GCN
44.3 (43.84min - 44.26max) MB/s
Intel NUC10i7FNH
Kingston RBUSNS8154P3256GJ1
25.19 MB/s -43%
Intel NUC11TNKi5
Transcend M.2 SSD 430S TS512GMTS430S
21.6 (20.05min - 21.62max) MB/s -51%
Zotac ZBOX PI336 pico
SanDisk DF4128
13.7 (13.61min - 13.69max) MB/s -69%
4k q1 t1 write
Beelink GTR5
Kingston NV1 SNVS/500GCN
203 (155.48min - 203.38max) MB/s +37%
Beelink SEi11 Pro
Kingston NV1 SNVS/500GCN
173.6 (113.3min - 173.62max) MB/s +17%
Beelink SER Pro Ryzen 5 5600H
Kingston NV1 SNVS/500GCN
147.9 (117.82min - 147.87max) MB/s
Intel NUC10i7FNH
Kingston RBUSNS8154P3256GJ1
61.1 MB/s -59%
Intel NUC11TNKi5
Transcend M.2 SSD 430S TS512GMTS430S
46.4 (45.57min - 46.37max) MB/s -69%
Zotac ZBOX PI336 pico
SanDisk DF4128
13.8 (12.91min - 13.8max) MB/s -91%
4k q32 t16 read
Beelink GTR5
Kingston NV1 SNVS/500GCN
747 (741.87min - 747.14max) MB/s 0%
Beelink SER Pro Ryzen 5 5600H
Kingston NV1 SNVS/500GCN
747 (745.51min - 747.02max) MB/s
Beelink SEi11 Pro
Kingston NV1 SNVS/500GCN
745 (742.2min - 744.53max) MB/s 0%
Intel NUC11TNKi5
Transcend M.2 SSD 430S TS512GMTS430S
285 (283.99min - 284.61max) MB/s -62%
Intel NUC10i7FNH
Kingston RBUSNS8154P3256GJ1
251.1 MB/s -66%
Zotac ZBOX PI336 pico
SanDisk DF4128
26 (24.84min - 25.96max) MB/s -97%
4k q32 t16 write
Beelink SER Pro Ryzen 5 5600H
Kingston NV1 SNVS/500GCN
860 (472.56min - 860.33max) MB/s
Beelink GTR5
Kingston NV1 SNVS/500GCN
801 (384.08min - 801.12max) MB/s -7%
Beelink SEi11 Pro
Kingston NV1 SNVS/500GCN
733 (332min - 733.18max) MB/s -15%
Intel NUC11TNKi5
Transcend M.2 SSD 430S TS512GMTS430S
330 (329.53min - 329.95max) MB/s -62%
Intel NUC10i7FNH
Kingston RBUSNS8154P3256GJ1
257.7 MB/s -70%
Zotac ZBOX PI336 pico
SanDisk DF4128
13.1 (12.24min - 13.12max) MB/s -98%
AS SSD
Score Total
Beelink SEi11 Pro
Kingston NV1 SNVS/500GCN
2742 Points
Beelink GTR5
Kingston NV1 SNVS/500GCN
2544 Points
Intel NUC10i7FNH
Kingston RBUSNS8154P3256GJ1
1944 Points
Intel NUC11TNKi5
Transcend M.2 SSD 430S TS512GMTS430S
839 Points
Zotac ZBOX PI336 pico
SanDisk DF4128
136 Points
Score Read
Beelink SEi11 Pro
Kingston NV1 SNVS/500GCN
975 Points
Beelink GTR5
Kingston NV1 SNVS/500GCN
966 Points
Intel NUC10i7FNH
Kingston RBUSNS8154P3256GJ1
804 Points
Intel NUC11TNKi5
Transcend M.2 SSD 430S TS512GMTS430S
304 Points
Zotac ZBOX PI336 pico
SanDisk DF4128
65 Points
Score Write
Beelink SEi11 Pro
Kingston NV1 SNVS/500GCN
1282 Points
Beelink GTR5
Kingston NV1 SNVS/500GCN
1103 Points
Intel NUC10i7FNH
Kingston RBUSNS8154P3256GJ1
762 Points
Intel NUC11TNKi5
Transcend M.2 SSD 430S TS512GMTS430S
375 Points
Zotac ZBOX PI336 pico
SanDisk DF4128
39 Points
Seq Read
Beelink GTR5
Kingston NV1 SNVS/500GCN
2289 MB/s
Beelink SEi11 Pro
Kingston NV1 SNVS/500GCN
2246.84 MB/s
Intel NUC10i7FNH
Kingston RBUSNS8154P3256GJ1
1306 MB/s
Intel NUC11TNKi5
Transcend M.2 SSD 430S TS512GMTS430S
527 MB/s
Zotac ZBOX PI336 pico
SanDisk DF4128
264.86 MB/s
Seq Write
Beelink SEi11 Pro
Kingston NV1 SNVS/500GCN
1764.26 MB/s
Beelink GTR5
Kingston NV1 SNVS/500GCN
1703 MB/s
Intel NUC10i7FNH
Kingston RBUSNS8154P3256GJ1
611 MB/s
Intel NUC11TNKi5
Transcend M.2 SSD 430S TS512GMTS430S
469 MB/s
Zotac ZBOX PI336 pico
SanDisk DF4128
117 MB/s
4K Read
Beelink SEi11 Pro
Kingston NV1 SNVS/500GCN
44.12 MB/s
Beelink GTR5
Kingston NV1 SNVS/500GCN
43.84 MB/s
Intel NUC10i7FNH
Kingston RBUSNS8154P3256GJ1
21.53 MB/s
Intel NUC11TNKi5
Transcend M.2 SSD 430S TS512GMTS430S
20.41 MB/s
Zotac ZBOX PI336 pico
SanDisk DF4128
13.21 MB/s
4K Write
Beelink SEi11 Pro
Kingston NV1 SNVS/500GCN
192.62 MB/s
Beelink GTR5
Kingston NV1 SNVS/500GCN
137.3 MB/s
Intel NUC10i7FNH
Kingston RBUSNS8154P3256GJ1
53.5 MB/s
Intel NUC11TNKi5
Transcend M.2 SSD 430S TS512GMTS430S
42.52 MB/s
Zotac ZBOX PI336 pico
SanDisk DF4128
13.46 MB/s
4K-64 Read
Beelink SEi11 Pro
Kingston NV1 SNVS/500GCN
706.35 MB/s
Beelink GTR5
Kingston NV1 SNVS/500GCN
693 MB/s
Intel NUC10i7FNH
Kingston RBUSNS8154P3256GJ1
652 MB/s
Intel NUC11TNKi5
Transcend M.2 SSD 430S TS512GMTS430S
231.4 MB/s
Zotac ZBOX PI336 pico
SanDisk DF4128
25.74 MB/s
4K-64 Write
Beelink SEi11 Pro
Kingston NV1 SNVS/500GCN
912.72 MB/s
Beelink GTR5
Kingston NV1 SNVS/500GCN
795 MB/s
Intel NUC10i7FNH
Kingston RBUSNS8154P3256GJ1
648 MB/s
Intel NUC11TNKi5
Transcend M.2 SSD 430S TS512GMTS430S
285.3 MB/s
Zotac ZBOX PI336 pico
SanDisk DF4128
13.71 MB/s
Access Time Read
Zotac ZBOX PI336 pico
SanDisk DF4128
0.311 ms *
Intel NUC11TNKi5
Transcend M.2 SSD 430S TS512GMTS430S
0.124 ms *
Intel NUC10i7FNH
Kingston RBUSNS8154P3256GJ1
0.114 ms *
Beelink GTR5
Kingston NV1 SNVS/500GCN
0.054 ms *
Beelink SEi11 Pro
Kingston NV1 SNVS/500GCN
0.053 ms *
Access Time Write
Zotac ZBOX PI336 pico
SanDisk DF4128
0.942 ms *
Beelink SEi11 Pro
Kingston NV1 SNVS/500GCN
0.342 ms *
Beelink GTR5
Kingston NV1 SNVS/500GCN
0.332 ms *
Intel NUC11TNKi5
Transcend M.2 SSD 430S TS512GMTS430S
0.269 ms *
Intel NUC10i7FNH
Kingston RBUSNS8154P3256GJ1
0.07 ms *

* ... kleinere Werte sind besser

Disk Throttling: DiskSpd Read Loop, Queue Depth 8

0125250375500625750875100011251250137515001625175018752000212522502375Tooltip
Beelink SER Pro Ryzen 5 5600H: Ø2448 (2226.34-2468.25)

Grafikleistung

Die Grafikleistung ist viel schneller als bei den meisten anderen Laptops oder Mini-PCs mit der gleichen integrierten Radeon RX Vega 7 GPU um 30 bis 35 Prozent, da solche Produkte den Grafikprozessor in der Regel mit langsameren CPUs der Ryzen-U-Serie oder nur mit Single-Channel-Arbeitsspeicher kombinieren. Der Ryzen 5 5600H ist ein geringerer Engpass für die GPU, und die Frame-Raten profitieren davon. Es ist aber immer noch keine Gaming-Maschine.

Die Iris Xe 96 EUs, die in den meisten Intel-Core-i7-Laptops oder Mini-PCs der 11. Generation zu finden sind, arbeiten immer noch etwa zehn bis 15 Prozent schneller.

3DMark 11
3DMark 11
Cloud Gate
Cloud Gate
Time Spy
Time Spy
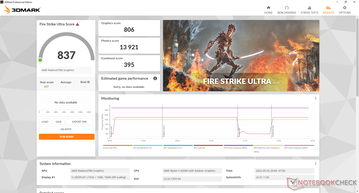
Fire Strike
Fire Strike
Fire Strike Ultra
Fire Strike Ultra
 
3DMark
1920x1080 Fire Strike Graphics
Intel NUC11PHKi7C
NVIDIA GeForce RTX 2060 Mobile, Intel Core i7-1165G7
17077 Points +323%
Honor MagicBook 14 2022
NVIDIA GeForce RTX 2050 Mobile, Intel Core i5-12500H
10621 Points +163%
Lenovo Yoga 7-14ARB G7
AMD Radeon 680M, AMD Ryzen 7 6800U
7279 Points +80%
Beelink SEi11 Pro
Intel Iris Xe Graphics G7 96EUs, Intel Core i5-11320H
4523 Points +12%
Beelink GTR5
AMD Radeon RX Vega 8 (Ryzen 4000/5000), AMD Ryzen 9 5900HX
4493 Points +11%
Beelink SER Pro Ryzen 5 5600H
AMD Radeon RX Vega 7, AMD Ryzen 5 5600H
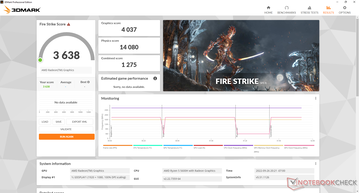
4037 Points
Beelink SER4
AMD Radeon RX Vega 8 (Ryzen 4000/5000), AMD Ryzen 7 4800U
3927 Points -3%
Durchschnittliche AMD Radeon RX Vega 7
  (1772 - 4037, n=62)
3189 Points -21%
Intel NUC11TNKi5
Intel Iris Xe Graphics G7 80EUs, Intel Core i5-1135G7
3152 Points -22%
Intel NUC10i7FNH
Intel UHD Graphics 620, Intel Core i7-10710U
1418 Points -65%
Zotac ZBOX PI336 pico
Intel UHD Graphics (Elkhart Lake 16 EU), Intel Celeron N6211
523 Points -87%
2560x1440 Time Spy Graphics
Intel NUC11PHKi7C
NVIDIA GeForce RTX 2060 Mobile, Intel Core i7-1165G7
6599 Points +429%
Honor MagicBook 14 2022
NVIDIA GeForce RTX 2050 Mobile, Intel Core i5-12500H
3938 Points +216%
Lenovo Yoga 7-14ARB G7
AMD Radeon 680M, AMD Ryzen 7 6800U
2449 Points +96%
Beelink SEi11 Pro
Intel Iris Xe Graphics G7 96EUs, Intel Core i5-11320H
1443 Points +16%
Beelink GTR5
AMD Radeon RX Vega 8 (Ryzen 4000/5000), AMD Ryzen 9 5900HX
1441 Points +16%
Beelink SER Pro Ryzen 5 5600H
AMD Radeon RX Vega 7, AMD Ryzen 5 5600H
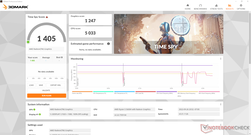
1247 Points
Beelink SER4
AMD Radeon RX Vega 8 (Ryzen 4000/5000), AMD Ryzen 7 4800U
1241 Points 0%
Intel NUC11TNKi5
Intel Iris Xe Graphics G7 80EUs, Intel Core i5-1135G7
1031 Points -17%
Durchschnittliche AMD Radeon RX Vega 7
  (496 - 1249, n=57)
991 Points -21%
Intel NUC10i7FNH
Intel UHD Graphics 620, Intel Core i7-10710U
443 Points -64%
2560x1440 Time Spy Score
Intel NUC11PHKi7C
NVIDIA GeForce RTX 2060 Mobile, Intel Core i7-1165G7
6380 Points +354%
Honor MagicBook 14 2022
NVIDIA GeForce RTX 2050 Mobile, Intel Core i5-12500H
4326 Points +208%
Lenovo Yoga 7-14ARB G7
AMD Radeon 680M, AMD Ryzen 7 6800U
2722 Points +94%
Beelink GTR5
AMD Radeon RX Vega 8 (Ryzen 4000/5000), AMD Ryzen 9 5900HX
1647 Points +17%
Beelink SEi11 Pro
Intel Iris Xe Graphics G7 96EUs, Intel Core i5-11320H
1612 Points +15%
Beelink SER4
AMD Radeon RX Vega 8 (Ryzen 4000/5000), AMD Ryzen 7 4800U
1412 Points 0%
Beelink SER Pro Ryzen 5 5600H
AMD Radeon RX Vega 7, AMD Ryzen 5 5600H
1405 Points
Intel NUC11TNKi5
Intel Iris Xe Graphics G7 80EUs, Intel Core i5-1135G7
1161 Points -17%
Durchschnittliche AMD Radeon RX Vega 7
  (570 - 1420, n=58)
1126 Points -20%
Intel NUC10i7FNH
Intel UHD Graphics 620, Intel Core i7-10710U
512 Points -64%
3DMark 11 - 1280x720 Performance GPU
Intel NUC11PHKi7C
NVIDIA GeForce RTX 2060 Mobile, Intel Core i7-1165G7
23992 Points +295%
Honor MagicBook 14 2022
NVIDIA GeForce RTX 2050 Mobile, Intel Core i5-12500H
15411 Points +154%
Lenovo Yoga 7-14ARB G7
AMD Radeon 680M, AMD Ryzen 7 6800U
9507 Points +56%
Beelink GTR5
AMD Radeon RX Vega 8 (Ryzen 4000/5000), AMD Ryzen 9 5900HX
7102 Points +17%
Beelink SEi11 Pro
Intel Iris Xe Graphics G7 96EUs, Intel Core i5-11320H
6571 Points +8%
Beelink SER Pro Ryzen 5 5600H
AMD Radeon RX Vega 7, AMD Ryzen 5 5600H
6079 Points
Beelink SER4
AMD Radeon RX Vega 8 (Ryzen 4000/5000), AMD Ryzen 7 4800U
6036 Points -1%
Intel NUC11TNKi5
Intel Iris Xe Graphics G7 80EUs, Intel Core i5-1135G7
5221 Points -14%
Durchschnittliche AMD Radeon RX Vega 7
  (3353 - 6249, n=58)
5054 Points -17%
Intel NUC10i7FNH
Intel UHD Graphics 620, Intel Core i7-10710U
1983 Points -67%
Zotac ZBOX PI336 pico
Intel UHD Graphics (Elkhart Lake 16 EU), Intel Celeron N6211
650 Points -89%
3DMark 11 Performance
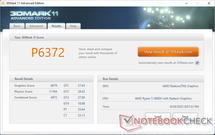
6372 Punkte
3DMark Cloud Gate Standard Score
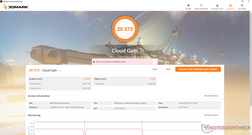
20373 Punkte
3DMark Fire Strike Score
3638 Punkte
3DMark Time Spy Score
1405 Punkte
Hilfe
Blender - v3.3 Classroom CPU
Durchschnitt der Klasse Mini PC
  (160 - 7856, n=117, der letzten 2 Jahre)
826 Seconds * -24%
Beelink SER Pro Ryzen 5 5600H
AMD Radeon RX Vega 7, AMD Ryzen 5 5600H
666 Seconds *

* ... kleinere Werte sind besser

GTA V
1024x768 Lowest Settings possible
Honor MagicBook 14 2022
Intel Core i5-12500H, NVIDIA GeForce RTX 2050 Mobile
183.2 (2.84min, 125P1) fps +38%
Intel NUC11PHKi7C
Intel Core i7-1165G7, NVIDIA GeForce RTX 2060 Mobile
168 (5.58min, 111P1) fps +26%
Beelink GTR5
AMD Ryzen 9 5900HX, AMD Radeon RX Vega 8 (Ryzen 4000/5000)
140 (14min, 90.9P1) fps +5%
Beelink SER Pro Ryzen 5 5600H
AMD Ryzen 5 5600H, AMD Radeon RX Vega 7
132.9 (18.4min, 90.9P1) fps
Lenovo Yoga 7-14ARB G7
AMD Ryzen 7 6800U, AMD Radeon 680M
131.1 (6.99min, 76.9P1) fps -1%
Beelink SER4
AMD Ryzen 7 4800U, AMD Radeon RX Vega 8 (Ryzen 4000/5000)
110 (19.4min, 71.4P1) fps -17%
Beelink SEi11 Pro
Intel Core i5-11320H, Intel Iris Xe Graphics G7 96EUs
94.2 (16.5min, 58.8P1) fps -29%
Durchschnittliche AMD Radeon RX Vega 7
  (43.1 - 140.7, n=35)
89.5 fps -33%
1920x1080 Lowest Settings possible
Intel NUC11PHKi7C
Intel Core i7-1165G7, NVIDIA GeForce RTX 2060 Mobile
156 (4.99min, 111P1) fps +93%
Beelink GTR5
AMD Ryzen 9 5900HX, AMD Radeon RX Vega 8 (Ryzen 4000/5000)
81.8 (10.6min, 58.8P1) fps +1%
Beelink SER Pro Ryzen 5 5600H
AMD Ryzen 5 5600H, AMD Radeon RX Vega 7
81 (12.3min, 58.8P1) fps
Beelink SER4
AMD Ryzen 7 4800U, AMD Radeon RX Vega 8 (Ryzen 4000/5000)
71.5 (8.83min, 52.6P1) fps -12%
Beelink SEi11 Pro
Intel Core i5-11320H, Intel Iris Xe Graphics G7 96EUs
65.9 (13.2min, 45.5P1) fps -19%
Durchschnittliche AMD Radeon RX Vega 7
  (25.1 - 81.3, n=27)
56.2 fps -31%
1366x768 Normal/Off AF:4x
Honor MagicBook 14 2022
Intel Core i5-12500H, NVIDIA GeForce RTX 2050 Mobile
175.8 (3.76min, 125P1) fps +49%
Intel NUC11PHKi7C
Intel Core i7-1165G7, NVIDIA GeForce RTX 2060 Mobile
158 (4.65min, 90.9P1) fps +34%
Beelink GTR5
AMD Ryzen 9 5900HX, AMD Radeon RX Vega 8 (Ryzen 4000/5000)
124 (14.4min, 83.3P1) fps +5%
Lenovo Yoga 7-14ARB G7
AMD Ryzen 7 6800U, AMD Radeon 680M
119.6 (26.1min, 76.9P1) fps +2%
Beelink SER Pro Ryzen 5 5600H
AMD Ryzen 5 5600H, AMD Radeon RX Vega 7
117.6 (20.9min, 71.4P1) fps
Beelink SER4
AMD Ryzen 7 4800U, AMD Radeon RX Vega 8 (Ryzen 4000/5000)
98.3 (13.8min, 62.5P1) fps -16%
Durchschnittliche AMD Radeon RX Vega 7
  (38 - 123, n=33)
78.7 fps -33%
Beelink SEi11 Pro
Intel Core i5-11320H, Intel Iris Xe Graphics G7 96EUs
77.6 (21.9min, 50P1) fps -34%
1920x1080 Normal/Off AF:4x
Intel NUC11PHKi7C
Intel Core i7-1165G7, NVIDIA GeForce RTX 2060 Mobile
147 (4.13min, 90.9P1) fps +80%
Beelink GTR5
AMD Ryzen 9 5900HX, AMD Radeon RX Vega 8 (Ryzen 4000/5000)
84.6 (9.51min, 58.8P1) fps +3%
Beelink SER Pro Ryzen 5 5600H
AMD Ryzen 5 5600H, AMD Radeon RX Vega 7
81.8 (14.1min, 55.6P1) fps
Beelink SER4
AMD Ryzen 7 4800U, AMD Radeon RX Vega 8 (Ryzen 4000/5000)
72.2 (6.79min, 50P1) fps -12%
Beelink SEi11 Pro
Intel Core i5-11320H, Intel Iris Xe Graphics G7 96EUs
57.3 (22.2min, 38.5P1) fps -30%
Durchschnittliche AMD Radeon RX Vega 7
  (26.3 - 82.7, n=28)
57.1 fps -30%
1920x1080 High/On (Advanced Graphics Off) AA:2xMSAA + FX AF:8x
Intel NUC11PHKi7C
Intel Core i7-1165G7, NVIDIA GeForce RTX 2060 Mobile
119 (39.3min, 76.9P1) fps +270%
Honor MagicBook 14 2022
Intel Core i5-12500H, NVIDIA GeForce RTX 2050 Mobile
111.5 (33.4min, 71.4P1) fps +246%
Lenovo Yoga 7-14ARB G7
AMD Ryzen 7 6800U, AMD Radeon 680M
49.5 (0.668min, 32.3P1) fps +54%
Beelink GTR5
AMD Ryzen 9 5900HX, AMD Radeon RX Vega 8 (Ryzen 4000/5000)
33.4 (6.39min, 24.4P1) fps +4%
Beelink SER Pro Ryzen 5 5600H
AMD Ryzen 5 5600H, AMD Radeon RX Vega 7
32.2 (8.1min, 23.3P1) fps
Beelink SER4
AMD Ryzen 7 4800U, AMD Radeon RX Vega 8 (Ryzen 4000/5000)
29.6 (5.48min, 21.7P1) fps -8%
Beelink SEi11 Pro
Intel Core i5-11320H, Intel Iris Xe Graphics G7 96EUs
23.2 (11.5min, 15.9P1) fps -28%
Durchschnittliche AMD Radeon RX Vega 7
  (11.3 - 32.2, n=36)
22.7 fps -30%
1920x1080 Highest Settings possible AA:4xMSAA + FX AF:16x
Intel NUC11PHKi7C
Intel Core i7-1165G7, NVIDIA GeForce RTX 2060 Mobile
69.6 (19.2min, 47.6P1) fps +380%
Honor MagicBook 14 2022
Intel Core i5-12500H, NVIDIA GeForce RTX 2050 Mobile
55.8 (15.1min, 37P1) fps +285%
Lenovo Yoga 7-14ARB G7
AMD Ryzen 7 6800U, AMD Radeon 680M
23.5 (1.5min, 16.4P1) fps +62%
Beelink GTR5
AMD Ryzen 9 5900HX, AMD Radeon RX Vega 8 (Ryzen 4000/5000)
15.1 (3.94min, 10.6P1) fps +4%
Beelink SER Pro Ryzen 5 5600H
AMD Ryzen 5 5600H, AMD Radeon RX Vega 7
14.5 (4.85min, 10.3P1) fps
Beelink SER4
AMD Ryzen 7 4800U, AMD Radeon RX Vega 8 (Ryzen 4000/5000)
13.4 (3.61min, 9.62P1) fps -8%
Durchschnittliche AMD Radeon RX Vega 7
  (5.09 - 15, n=34)
10 fps -31%
The Witcher 3
1024x768 Low Graphics & Postprocessing
Intel NUC11PHKi7C
Intel Core i7-1165G7, NVIDIA GeForce RTX 2060 Mobile
220.7 (196min) fps +179%
Honor MagicBook 14 2022
Intel Core i5-12500H, NVIDIA GeForce RTX 2050 Mobile
217 fps +174%
Lenovo Yoga 7-14ARB G7
AMD Ryzen 7 6800U, AMD Radeon 680M
126 fps +59%
Beelink SEi11 Pro
Intel Core i5-11320H, Intel Iris Xe Graphics G7 96EUs
89.7 (45min) fps +13%
Beelink GTR5
AMD Ryzen 9 5900HX, AMD Radeon RX Vega 8 (Ryzen 4000/5000)
86.9 (77min) fps +10%
Beelink SER Pro Ryzen 5 5600H
AMD Ryzen 5 5600H, AMD Radeon RX Vega 7
79.2 (75min) fps
Beelink SER4
AMD Ryzen 7 4800U, AMD Radeon RX Vega 8 (Ryzen 4000/5000)
64.2 (51min) fps -19%
Intel NUC11TNKi5
Intel Core i5-1135G7, Intel Iris Xe Graphics G7 80EUs
59.8 (53min) fps -24%
Durchschnittliche AMD Radeon RX Vega 7
  (25.5 - 105.8, n=50)
58.1 fps -27%
1366x768 Medium Graphics & Postprocessing
Intel NUC11PHKi7C
Intel Core i7-1165G7, NVIDIA GeForce RTX 2060 Mobile
152.2 (142min) fps +213%
Honor MagicBook 14 2022
Intel Core i5-12500H, NVIDIA GeForce RTX 2050 Mobile
141 fps +190%
Lenovo Yoga 7-14ARB G7
AMD Ryzen 7 6800U, AMD Radeon 680M
76 fps +56%
Beelink GTR5
AMD Ryzen 9 5900HX, AMD Radeon RX Vega 8 (Ryzen 4000/5000)
55.2 (52min) fps +13%
Beelink SEi11 Pro
Intel Core i5-11320H, Intel Iris Xe Graphics G7 96EUs
53.7 (44min) fps +10%
Beelink SER Pro Ryzen 5 5600H
AMD Ryzen 5 5600H, AMD Radeon RX Vega 7
48.7 (45min) fps
Beelink SER4
AMD Ryzen 7 4800U, AMD Radeon RX Vega 8 (Ryzen 4000/5000)
45.2 (41min) fps -7%
Durchschnittliche AMD Radeon RX Vega 7
  (9.74 - 81.3, n=37)
34.1 fps -30%
1920x1080 High Graphics & Postprocessing (Nvidia HairWorks Off)
Intel NUC11PHKi7C
Intel Core i7-1165G7, NVIDIA GeForce RTX 2060 Mobile
101.5 (96min) fps +304%
Honor MagicBook 14 2022
Intel Core i5-12500H, NVIDIA GeForce RTX 2050 Mobile
78 fps +211%
Lenovo Yoga 7-14ARB G7
AMD Ryzen 7 6800U, AMD Radeon 680M
43 fps +71%
Beelink SEi11 Pro
Intel Core i5-11320H, Intel Iris Xe Graphics G7 96EUs
27.8 (25min) fps +11%
Beelink GTR5
AMD Ryzen 9 5900HX, AMD Radeon RX Vega 8 (Ryzen 4000/5000)
26.8 (25min) fps +7%
Beelink SER Pro Ryzen 5 5600H
AMD Ryzen 5 5600H, AMD Radeon RX Vega 7
25.1 (22min) fps
Beelink SER4
AMD Ryzen 7 4800U, AMD Radeon RX Vega 8 (Ryzen 4000/5000)
22.6 (21min) fps -10%
Durchschnittliche AMD Radeon RX Vega 7
  (8.96 - 26.2, n=49)
18.1 fps -28%
1920x1080 Ultra Graphics & Postprocessing (HBAO+)
Intel NUC11PHKi7C
Intel Core i7-1165G7, NVIDIA GeForce RTX 2060 Mobile
61.4 (59min) fps +289%
Honor MagicBook 14 2022
Intel Core i5-12500H, NVIDIA GeForce RTX 2050 Mobile
39.6 (38min, 38P1) fps +151%
Lenovo Yoga 7-14ARB G7
AMD Ryzen 7 6800U, AMD Radeon 680M
25.4 (19min, 24P1) fps +61%
Beelink GTR5
AMD Ryzen 9 5900HX, AMD Radeon RX Vega 8 (Ryzen 4000/5000)
17.1 (15min) fps +8%
Beelink SER Pro Ryzen 5 5600H
AMD Ryzen 5 5600H, AMD Radeon RX Vega 7
15.8 (14min) fps
Beelink SER4
AMD Ryzen 7 4800U, AMD Radeon RX Vega 8 (Ryzen 4000/5000)
14.3 (13min) fps -9%
Beelink SEi11 Pro
Intel Core i5-11320H, Intel Iris Xe Graphics G7 96EUs
13.8 (12min) fps -13%
Durchschnittliche AMD Radeon RX Vega 7
  (6.5 - 15.8, n=42)
11.9 fps -25%
X-Plane 11.11
1280x720 low (fps_test=1)
Honor MagicBook 14 2022
Intel Core i5-12500H, NVIDIA GeForce RTX 2050 Mobile
117 fps +119%
Intel NUC11PHKi7C
Intel Core i7-1165G7, NVIDIA GeForce RTX 2060 Mobile
94.8 fps +78%
Beelink GTR5
AMD Ryzen 9 5900HX, AMD Radeon RX Vega 8 (Ryzen 4000/5000)
58.2 fps +9%
Beelink SEi11 Pro
Intel Core i5-11320H, Intel Iris Xe Graphics G7 96EUs
58.2 fps +9%
Lenovo Yoga 7-14ARB G7
AMD Ryzen 7 6800U, AMD Radeon 680M
54.6 fps +2%
Beelink SER Pro Ryzen 5 5600H
AMD Ryzen 5 5600H, AMD Radeon RX Vega 7
53.4 fps
Beelink SER4
AMD Ryzen 7 4800U, AMD Radeon RX Vega 8 (Ryzen 4000/5000)
41.1 fps -23%
Durchschnittliche AMD Radeon RX Vega 7
  (24.7 - 53.4, n=56)
39.3 fps -26%
Intel NUC11TNKi5
Intel Core i5-1135G7, Intel Iris Xe Graphics G7 80EUs
37.1 fps -31%
Intel NUC10i7FNH
Intel Core i7-10710U, Intel UHD Graphics 620
11.6 fps -78%
Zotac ZBOX PI336 pico
Intel Celeron N6211, Intel UHD Graphics (Elkhart Lake 16 EU)
7.76 fps -85%
1920x1080 med (fps_test=2)
Honor MagicBook 14 2022
Intel Core i5-12500H, NVIDIA GeForce RTX 2050 Mobile
93.6 fps +132%
Intel NUC11PHKi7C
Intel Core i7-1165G7, NVIDIA GeForce RTX 2060 Mobile
81.3 fps +102%
Beelink GTR5
AMD Ryzen 9 5900HX, AMD Radeon RX Vega 8 (Ryzen 4000/5000)
45.7 fps +13%
Lenovo Yoga 7-14ARB G7
AMD Ryzen 7 6800U, AMD Radeon 680M
41.9 fps +4%
Beelink SEi11 Pro
Intel Core i5-11320H, Intel Iris Xe Graphics G7 96EUs
41.2 fps +2%
Beelink SER Pro Ryzen 5 5600H
AMD Ryzen 5 5600H, AMD Radeon RX Vega 7
40.3 fps
Beelink SER4
AMD Ryzen 7 4800U, AMD Radeon RX Vega 8 (Ryzen 4000/5000)
33.2 fps -18%
Durchschnittliche AMD Radeon RX Vega 7
  (19.3 - 40.3, n=56)
30.5 fps -24%
Intel NUC11TNKi5
Intel Core i5-1135G7, Intel Iris Xe Graphics G7 80EUs
27.3 fps -32%
Intel NUC10i7FNH
Intel Core i7-10710U, Intel UHD Graphics 620
13.5 fps -67%
Zotac ZBOX PI336 pico
Intel Celeron N6211, Intel UHD Graphics (Elkhart Lake 16 EU)
4.97 fps -88%
1920x1080 high (fps_test=3)
Honor MagicBook 14 2022
Intel Core i5-12500H, NVIDIA GeForce RTX 2050 Mobile
82.3 fps +131%
Intel NUC11PHKi7C
Intel Core i7-1165G7, NVIDIA GeForce RTX 2060 Mobile
69.8 fps +96%
Beelink GTR5
AMD Ryzen 9 5900HX, AMD Radeon RX Vega 8 (Ryzen 4000/5000)
40.5 fps +13%
Beelink SEi11 Pro
Intel Core i5-11320H, Intel Iris Xe Graphics G7 96EUs
37.3 fps +4%
Lenovo Yoga 7-14ARB G7
AMD Ryzen 7 6800U, AMD Radeon 680M
36.2 fps +1%
Beelink SER Pro Ryzen 5 5600H
AMD Ryzen 5 5600H, AMD Radeon RX Vega 7
35.7 fps
Beelink SER4
AMD Ryzen 7 4800U, AMD Radeon RX Vega 8 (Ryzen 4000/5000)
29.5 fps -17%
Intel NUC11TNKi5
Intel Core i5-1135G7, Intel Iris Xe Graphics G7 80EUs
29.1 fps -18%
Durchschnittliche AMD Radeon RX Vega 7
  (17.4 - 35.7, n=56)
27.2 fps -24%
Intel NUC10i7FNH
Intel Core i7-10710U, Intel UHD Graphics 620
11 fps -69%
Zotac ZBOX PI336 pico
Intel Celeron N6211, Intel UHD Graphics (Elkhart Lake 16 EU)
4.64 fps -87%
Dota 2 Reborn
1280x720 min (0/3) fastest
Honor MagicBook 14 2022
Intel Core i5-12500H, NVIDIA GeForce RTX 2050 Mobile
159.3 (143.4min) fps +16%
Intel NUC11PHKi7C
Intel Core i7-1165G7, NVIDIA GeForce RTX 2060 Mobile
139 (124.5min) fps +1%
Beelink SER Pro Ryzen 5 5600H
AMD Ryzen 5 5600H, AMD Radeon RX Vega 7
137.5 (109.5min) fps
Beelink GTR5
AMD Ryzen 9 5900HX, AMD Radeon RX Vega 8 (Ryzen 4000/5000)
135 (115.7min) fps -2%
Beelink SEi11 Pro
Intel Core i5-11320H, Intel Iris Xe Graphics G7 96EUs
119.6 (108.4min) fps -13%
Lenovo Yoga 7-14ARB G7
AMD Ryzen 7 6800U, AMD Radeon 680M
114.6 (100.4min) fps -17%
Beelink SER4
AMD Ryzen 7 4800U, AMD Radeon RX Vega 8 (Ryzen 4000/5000)
103 (88.1min) fps -25%
Durchschnittliche AMD Radeon RX Vega 7
  (32.9 - 137.7, n=58)
99 fps -28%
Intel NUC10i7FNH
Intel Core i7-10710U, Intel UHD Graphics 620
81.3 (71.9min) fps -41%
Intel NUC11TNKi5
Intel Core i5-1135G7, Intel Iris Xe Graphics G7 80EUs
73.8 (47.9min) fps -46%
Zotac ZBOX PI336 pico
Intel Celeron N6211, Intel UHD Graphics (Elkhart Lake 16 EU)
24.3 (20.6min) fps -82%
1366x768 med (1/3)
Honor MagicBook 14 2022
Intel Core i5-12500H, NVIDIA GeForce RTX 2050 Mobile
143.6 (127min) fps +39%
Intel NUC11PHKi7C
Intel Core i7-1165G7, NVIDIA GeForce RTX 2060 Mobile
123 (107.7min) fps +19%
Beelink GTR5
AMD Ryzen 9 5900HX, AMD Radeon RX Vega 8 (Ryzen 4000/5000)
107 (88.2min) fps +4%
Beelink SER Pro Ryzen 5 5600H
AMD Ryzen 5 5600H, AMD Radeon RX Vega 7
103.1 (78.3min) fps
Lenovo Yoga 7-14ARB G7
AMD Ryzen 7 6800U, AMD Radeon 680M
97.6 (84.4min) fps -5%
Beelink SER4
AMD Ryzen 7 4800U, AMD Radeon RX Vega 8 (Ryzen 4000/5000)
83.3 (67.5min) fps -19%
Beelink SEi11 Pro
Intel Core i5-11320H, Intel Iris Xe Graphics G7 96EUs
78.6 (66.2min) fps -24%
Durchschnittliche AMD Radeon RX Vega 7
  (32.7 - 107.8, n=58)
76.7 fps -26%
Intel NUC11TNKi5
Intel Core i5-1135G7, Intel Iris Xe Graphics G7 80EUs
56 (40.8min) fps -46%
Intel NUC10i7FNH
Intel Core i7-10710U, Intel UHD Graphics 620
52.5 (48min) fps -49%
Zotac ZBOX PI336 pico
Intel Celeron N6211, Intel UHD Graphics (Elkhart Lake 16 EU)
10.9 (8.1min) fps -89%
1920x1080 high (2/3)
Honor MagicBook 14 2022
Intel Core i5-12500H, NVIDIA GeForce RTX 2050 Mobile
138.1 (121.4min) fps +133%
Intel NUC11PHKi7C
Intel Core i7-1165G7, NVIDIA GeForce RTX 2060 Mobile
116 (100.9min) fps +96%
Lenovo Yoga 7-14ARB G7
AMD Ryzen 7 6800U, AMD Radeon 680M
74 (65.1min) fps +25%
Beelink GTR5
AMD Ryzen 9 5900HX, AMD Radeon RX Vega 8 (Ryzen 4000/5000)
63.8 (56.8min) fps +8%
Beelink SER Pro Ryzen 5 5600H
AMD Ryzen 5 5600H, AMD Radeon RX Vega 7
59.3 (52.5min) fps
Beelink SER4
AMD Ryzen 7 4800U, AMD Radeon RX Vega 8 (Ryzen 4000/5000)
53.1 (44.7min) fps -10%
Beelink SEi11 Pro
Intel Core i5-11320H, Intel Iris Xe Graphics G7 96EUs
50.4 (41.9min) fps -15%
Durchschnittliche AMD Radeon RX Vega 7
  (25.1 - 62.1, n=58)
44.8 fps -24%
Intel NUC11TNKi5
Intel Core i5-1135G7, Intel Iris Xe Graphics G7 80EUs
34.2 (20min) fps -42%
Intel NUC10i7FNH
Intel Core i7-10710U, Intel UHD Graphics 620
22.4 (21min) fps -62%
Zotac ZBOX PI336 pico
Intel Celeron N6211, Intel UHD Graphics (Elkhart Lake 16 EU)
5.8 (2.3min) fps -90%
1920x1080 ultra (3/3) best looking
Honor MagicBook 14 2022
Intel Core i5-12500H, NVIDIA GeForce RTX 2050 Mobile
130.1 (114.7min) fps +131%
Intel NUC11PHKi7C
Intel Core i7-1165G7, NVIDIA GeForce RTX 2060 Mobile
112 (98.7min) fps +99%
Lenovo Yoga 7-14ARB G7
AMD Ryzen 7 6800U, AMD Radeon 680M
64.2 (56.1min) fps +14%
Beelink GTR5
AMD Ryzen 9 5900HX, AMD Radeon RX Vega 8 (Ryzen 4000/5000)
59.9 (53.3min) fps +6%
Beelink SER Pro Ryzen 5 5600H
AMD Ryzen 5 5600H, AMD Radeon RX Vega 7
56.3 (49.3min) fps
Beelink SER4
AMD Ryzen 7 4800U, AMD Radeon RX Vega 8 (Ryzen 4000/5000)
51.1 (44.6min) fps -9%
Beelink SEi11 Pro
Intel Core i5-11320H, Intel Iris Xe Graphics G7 96EUs
47.4 (40.8min) fps -16%
Durchschnittliche AMD Radeon RX Vega 7
  (23.3 - 58.2, n=58)
41.9 fps -26%
Intel NUC11TNKi5
Intel Core i5-1135G7, Intel Iris Xe Graphics G7 80EUs
31.4 (18.2min) fps -44%
Intel NUC10i7FNH
Intel Core i7-10710U, Intel UHD Graphics 620
19.9 (18.7min) fps -65%
Zotac ZBOX PI336 pico
Intel Celeron N6211, Intel UHD Graphics (Elkhart Lake 16 EU)
5.2 (2.4min) fps -91%
Cyberpunk 2077 1.6
1920x1080 Low Preset
Honor MagicBook 14 2022
Intel Core i5-12500H, NVIDIA GeForce RTX 2050 Mobile
49 fps +134%
Lenovo Yoga 7-14ARB G7
AMD Ryzen 7 6800U, AMD Radeon 680M
34 fps +63%
Beelink SER Pro Ryzen 5 5600H
AMD Ryzen 5 5600H, AMD Radeon RX Vega 7
20.9 (14min) fps
Beelink SEi11 Pro
Intel Core i5-11320H, Intel Iris Xe Graphics G7 96EUs
18.6 (8.1min) fps -11%
Durchschnittliche AMD Radeon RX Vega 7
  (10 - 20.9, n=4)
16.9 fps -19%
1920x1080 Medium Preset
Honor MagicBook 14 2022
Intel Core i5-12500H, NVIDIA GeForce RTX 2050 Mobile
42 fps +159%
Lenovo Yoga 7-14ARB G7
AMD Ryzen 7 6800U, AMD Radeon 680M
26 fps +60%
Beelink SER Pro Ryzen 5 5600H
AMD Ryzen 5 5600H, AMD Radeon RX Vega 7
16.2 (12min) fps
Beelink SEi11 Pro
Intel Core i5-11320H, Intel Iris Xe Graphics G7 96EUs
15.6 (7.8min) fps -4%
Durchschnittliche AMD Radeon RX Vega 7
  (11.6 - 16.2, n=4)
14 fps -14%
1920x1080 High Preset
Honor MagicBook 14 2022
Intel Core i5-12500H, NVIDIA GeForce RTX 2050 Mobile
30 fps +163%
Lenovo Yoga 7-14ARB G7
AMD Ryzen 7 6800U, AMD Radeon 680M
19 fps +67%
Beelink SEi11 Pro
Intel Core i5-11320H, Intel Iris Xe Graphics G7 96EUs
11.7 (6.1min) fps +3%
Beelink SER Pro Ryzen 5 5600H
AMD Ryzen 5 5600H, AMD Radeon RX Vega 7
11.4 (8.7min) fps
Durchschnittliche AMD Radeon RX Vega 7
  (8.5 - 11.4, n=4)
9.83 fps -14%
Final Fantasy XV Benchmark
1280x720 Lite Quality
Intel NUC11PHKi7C
Intel Core i7-1165G7, NVIDIA GeForce RTX 2060 Mobile
130 fps +216%
Honor MagicBook 14 2022
Intel Core i5-12500H, NVIDIA GeForce RTX 2050 Mobile
112.6 fps +174%
Lenovo Yoga 7-14ARB G7
AMD Ryzen 7 6800U, AMD Radeon 680M
68.5 fps +67%
Beelink GTR5
AMD Ryzen 9 5900HX, AMD Radeon RX Vega 8 (Ryzen 4000/5000)
44.8 fps +9%
Beelink SER Pro Ryzen 5 5600H
AMD Ryzen 5 5600H, AMD Radeon RX Vega 7
41.1 fps
Beelink SEi11 Pro
Intel Core i5-11320H, Intel Iris Xe Graphics G7 96EUs
38.6 fps -6%
Beelink SER4
AMD Ryzen 7 4800U, AMD Radeon RX Vega 8 (Ryzen 4000/5000)
37.3 fps -9%
Durchschnittliche AMD Radeon RX Vega 7
  (17.1 - 41.1, n=40)
30.4 fps -26%
Intel NUC11TNKi5
Intel Core i5-1135G7, Intel Iris Xe Graphics G7 80EUs
26.8 fps -35%
Zotac ZBOX PI336 pico
Intel Celeron N6211, Intel UHD Graphics (Elkhart Lake 16 EU)
3.45 fps -92%
1920x1080 Standard Quality
Intel NUC11PHKi7C
Intel Core i7-1165G7, NVIDIA GeForce RTX 2060 Mobile
89.2 fps +339%
Honor MagicBook 14 2022
Intel Core i5-12500H, NVIDIA GeForce RTX 2050 Mobile
60.8 fps +200%
Lenovo Yoga 7-14ARB G7
AMD Ryzen 7 6800U, AMD Radeon 680M
34 fps +67%
Beelink GTR5
AMD Ryzen 9 5900HX, AMD Radeon RX Vega 8 (Ryzen 4000/5000)
22.3 fps +10%
Beelink SEi11 Pro
Intel Core i5-11320H, Intel Iris Xe Graphics G7 96EUs
20.3 fps 0%
Beelink SER Pro Ryzen 5 5600H
AMD Ryzen 5 5600H, AMD Radeon RX Vega 7
20.3 fps
Beelink SER4
AMD Ryzen 7 4800U, AMD Radeon RX Vega 8 (Ryzen 4000/5000)
19.2 fps -5%
Durchschnittliche AMD Radeon RX Vega 7
  (8.9 - 20.3, n=40)
15.4 fps -24%
Intel NUC11TNKi5
Intel Core i5-1135G7, Intel Iris Xe Graphics G7 80EUs
13.7 fps -33%
Zotac ZBOX PI336 pico
Intel Celeron N6211, Intel UHD Graphics (Elkhart Lake 16 EU)
1.66 fps -92%
1920x1080 High Quality
Intel NUC11PHKi7C
Intel Core i7-1165G7, NVIDIA GeForce RTX 2060 Mobile
67.5 fps +372%
Honor MagicBook 14 2022
Intel Core i5-12500H, NVIDIA GeForce RTX 2050 Mobile
42.9 fps +200%
Lenovo Yoga 7-14ARB G7
AMD Ryzen 7 6800U, AMD Radeon 680M
24.2 fps +69%
Beelink GTR5
AMD Ryzen 9 5900HX, AMD Radeon RX Vega 8 (Ryzen 4000/5000)
15.7 fps +10%
Beelink SEi11 Pro
Intel Core i5-11320H, Intel Iris Xe Graphics G7 96EUs
14.9 fps +4%
Beelink SER Pro Ryzen 5 5600H
AMD Ryzen 5 5600H, AMD Radeon RX Vega 7
14.3 fps
Beelink SER4
AMD Ryzen 7 4800U, AMD Radeon RX Vega 8 (Ryzen 4000/5000)
13.8 fps -3%
Intel NUC11TNKi5
Intel Core i5-1135G7, Intel Iris Xe Graphics G7 80EUs
10.5 fps -27%
Durchschnittliche AMD Radeon RX Vega 7
  (5.85 - 14.3, n=37)
10.5 fps -27%
Strange Brigade
1280x720 lowest AF:1
Intel NUC11PHKi7C
Intel Core i7-1165G7, NVIDIA GeForce RTX 2060 Mobile
287 (77min, 220P1) fps +201%
Honor MagicBook 14 2022
Intel Core i5-12500H, NVIDIA GeForce RTX 2050 Mobile
198.7 (96.8min, 155P1) fps +108%
Lenovo Yoga 7-14ARB G7
AMD Ryzen 7 6800U, AMD Radeon 680M
140.5 (68.9min, 108.3P1) fps +47%
Beelink GTR5
AMD Ryzen 9 5900HX, AMD Radeon RX Vega 8 (Ryzen 4000/5000)
99.1 (72.8min, 85.4P1) fps +4%
Beelink SER Pro Ryzen 5 5600H
AMD Ryzen 5 5600H, AMD Radeon RX Vega 7
95.3 (72.8min, 84.4P1) fps
Beelink SER4
AMD Ryzen 7 4800U, AMD Radeon RX Vega 8 (Ryzen 4000/5000)
82.3 (43.8min, 72.3P1) fps -14%
Beelink SEi11 Pro
Intel Core i5-11320H, Intel Iris Xe Graphics G7 96EUs
79.3 (18.8min, 25.6P1) fps -17%
Durchschnittliche AMD Radeon RX Vega 7
  (34.8 - 95.3, n=41)
70.4 fps -26%
Zotac ZBOX PI336 pico
Intel Celeron N6211, Intel UHD Graphics (Elkhart Lake 16 EU)
9.2 (5min, 5P1) fps -90%
1920x1080 medium AA:medium AF:4
Intel NUC11PHKi7C
Intel Core i7-1165G7, NVIDIA GeForce RTX 2060 Mobile
148 (64.5min, 124P1) fps +311%
Honor MagicBook 14 2022
Intel Core i5-12500H, NVIDIA GeForce RTX 2050 Mobile
89.7 (71.8min, 77.7P1) fps +149%
Lenovo Yoga 7-14ARB G7
AMD Ryzen 7 6800U, AMD Radeon 680M
58.4 (43.4min, 50P1) fps +62%
Beelink GTR5
AMD Ryzen 9 5900HX, AMD Radeon RX Vega 8 (Ryzen 4000/5000)
37.8 (31.8min, 33.6P1) fps +5%
Beelink SER Pro Ryzen 5 5600H
AMD Ryzen 5 5600H, AMD Radeon RX Vega 7
36 (29.9min, 31P1) fps
Beelink SEi11 Pro
Intel Core i5-11320H, Intel Iris Xe Graphics G7 96EUs
33.9 (10.3min, 19.8P1) fps -6%
Beelink SER4
AMD Ryzen 7 4800U, AMD Radeon RX Vega 8 (Ryzen 4000/5000)
33.3 (24min, 29.6P1) fps -7%
Durchschnittliche AMD Radeon RX Vega 7
  (13.4 - 36.1, n=41)
27.1 fps -25%
1920x1080 high AA:high AF:8
Intel NUC11PHKi7C
Intel Core i7-1165G7, NVIDIA GeForce RTX 2060 Mobile
124 (75.3min, 98P1) fps +312%
Honor MagicBook 14 2022
Intel Core i5-12500H, NVIDIA GeForce RTX 2050 Mobile
74 (52.9min, 56.5P1) fps +146%
Lenovo Yoga 7-14ARB G7
AMD Ryzen 7 6800U, AMD Radeon 680M
48.1 (20.7min, 36.9P1) fps +60%
Beelink GTR5
AMD Ryzen 9 5900HX, AMD Radeon RX Vega 8 (Ryzen 4000/5000)
31.9 (23.5min, 25.5P1) fps +6%
Beelink SER Pro Ryzen 5 5600H
AMD Ryzen 5 5600H, AMD Radeon RX Vega 7
30.1 (23.7min, 24.1P1) fps
Beelink SER4
AMD Ryzen 7 4800U, AMD Radeon RX Vega 8 (Ryzen 4000/5000)
28.1 (20.4min, 22.5P1) fps -7%
Beelink SEi11 Pro
Intel Core i5-11320H, Intel Iris Xe Graphics G7 96EUs
27.7 (10min, 15.1P1) fps -8%
Durchschnittliche AMD Radeon RX Vega 7
  (11.5 - 30.1, n=41)
22.7 fps -25%
1920x1080 ultra AA:ultra AF:16
Intel NUC11PHKi7C
Intel Core i7-1165G7, NVIDIA GeForce RTX 2060 Mobile
109 (68.2min, 83.9P1) fps +327%
Honor MagicBook 14 2022
Intel Core i5-12500H, NVIDIA GeForce RTX 2050 Mobile
65.3 (38.1min, 50.7P1) fps +156%
Lenovo Yoga 7-14ARB G7
AMD Ryzen 7 6800U, AMD Radeon 680M
41.8 (21.9min, 23.8P1) fps +64%
Beelink GTR5
AMD Ryzen 9 5900HX, AMD Radeon RX Vega 8 (Ryzen 4000/5000)
27.5 (21.3min, 22.3P1) fps +8%
Beelink SER Pro Ryzen 5 5600H
AMD Ryzen 5 5600H, AMD Radeon RX Vega 7
25.5 (19.5min, 20.8P1) fps
Beelink SER4
AMD Ryzen 7 4800U, AMD Radeon RX Vega 8 (Ryzen 4000/5000)
24 (17.8min, 19.5P1) fps -6%
Beelink SEi11 Pro
Intel Core i5-11320H, Intel Iris Xe Graphics G7 96EUs
22.2 (5.6min, 7.76P1) fps -13%
Durchschnittliche AMD Radeon RX Vega 7
  (9.9 - 25.5, n=39)
19.4 fps -24%

Die Frame-Raten sind leider nicht so konstant, wie wir gehofft hatten. Im Leerlauf von Witcher 3 bei niedrigen 720p-Einstellungen fielen die Frame-Raten manchmal auf 60 fps oder sogar 19 fps ohne erkennbaren Grund, wie die Grafik unten zeigt. Die schlechte Handhabung von Hintergrundaktivitäten ist wahrscheinlich für die Unterbrechung der Frame-Raten verantwortlich.

Witcher 3 FPS Diagramm

051015202530354045505560657075Tooltip
min.mittelhochmax.
GTA V (2015) 132.9 117.6 32.2 14.5
The Witcher 3 (2015) 79.2 48.7 25.1 15.8
Dota 2 Reborn (2015) 137.5 103.1 59.3 56.3
Final Fantasy XV Benchmark (2018) 41.1 20.3 14.3
X-Plane 11.11 (2018) 53.4 40.3 35.7
Strange Brigade (2018) 95.3 36 30.1 25.5
Cyberpunk 2077 1.6 (2022) 20.9 16.2 11.4

Emissionen

Systemlautstärke

Unser Testgerät leidet unter elektronischem Rauschen oder Spulengeräuschen. So konnten wir ein Geräusch von 26,1 dB(A) gegen einen leisen Hintergrund von 22,8 dB(A) aufzeichnen, selbst im Leerlauf auf dem Desktop ohne laufende Anwendungen. Das Lüftergeräusch bewegt sich bei typischer Last wie Webbrowsing oder Videostreaming im Bereich von 28,7 dB(A) und ist damit leiser als das des NUC11TNK.

Das Lüftergeräusch liegt zwischen 32 und 37 dB(A) bei anspruchsvolleren Lasten wie Spielen, was wiederum leiser ist als beim NUC11TNK und dem schnelleren Beelink GTR5. Es ist ein leiser Mini-PC im Verhältnis zur Leistung, die man dafür erhält.

Lüftergeräuschprofil (Weiß: Hintergrund, Rot: System im Leerlauf, Blau: 3DMark 06, Orange: Witcher 3, Grün: Prime95, Stress)

Lautstärkediagramm

Idle
26.1 / 26.1 / 28.7 dB(A)
Last
32.3 / 36.4 dB(A)
  red to green bar
 
 
30 dB
leise
40 dB(A)
deutlich hörbar
50 dB(A)
störend
 
min: dark, med: mid, max: light   Earthworks M23R, Arta (aus 15 cm gemessen)   Umgebungsgeräusche: 22.8 dB(A)
dB(A) 0102030405060708090Deep BassMiddle BassHigh BassLower RangeMidsHigher MidsLower HighsMid HighsUpper HighsSuper Highs2036.534.334.63736.636.52526.926.726.829.528.126.93125.729.122.325.621.925.74022.322.125.721.92222.35017.920.221.32120.617.96318.217.818.617.922.118.28018.120.22119.919.418.110017.823.81820.920.217.812516.419.52020.618.116.416012.516.920.620.814.412.520011.62119.617.915.111.625011.11918.817.113.211.131513.621.119.819.116.213.640012.221.318.91813.512.250010.521.219.819.513.410.56301023.420.620.511.7108008.924.821.821.3128.910009.525.321.720.712.39.512509.525.221.620.611.39.516009.825.321.421.511.79.820009.926.822.822.211.99.9250010.525.523.321.71210.5315010.725.820.319.912.710.740001125.620.119.611.711500011.323.918.117.711.511.3630011.516.113.213.812.111.5800011.615.115.316.51511.61000011.519.719.719.519.211.51250011.523.123.123.723.811.51600010.514.314.915.613.410.5SPL22.836.432.832.326.122.8N0.42.31.71.60.70.4median 11.1median 23.1median 20median 19.9median 13.2median 11.1Delta13.21.61.82.11hearing rangehide median Fan NoiseBeelink SER Pro Ryzen 5 5600H
Beelink SER Pro Ryzen 5 5600H
Vega 7, R5 5600H, Kingston NV1 SNVS/500GCN
Beelink SEi11 Pro
Iris Xe G7 96EUs, i5-11320H, Kingston NV1 SNVS/500GCN
Beelink GTR5
Vega 8, R9 5900HX, Kingston NV1 SNVS/500GCN
Intel NUC11TNKi5
Iris Xe G7 80EUs, i5-1135G7, Transcend M.2 SSD 430S TS512GMTS430S
Beelink SEi8
Iris Plus Graphics 655, i3-8109U, Intel SSD 660p SSDPEKNW512G8
Beelink SER4
Vega 8, R7 4800U, Intel SSD 660p SSDPEKNW512G8
Geräuschentwicklung
1%
-24%
-23%
-7%
-18%
aus / Umgebung *
22.8
22.8
-0%
23.1
-1%
24.8
-9%
24.5
-7%
23.4
-3%
Idle min *
26.1
24.7
5%
34.2
-31%
35.6
-36%
26.5
-2%
33.2
-27%
Idle avg *
26.1
24.7
5%
34.2
-31%
35.6
-36%
26.5
-2%
33.2
-27%
Idle max *
28.7
25.3
12%
34.2
-19%
35.6
-24%
31.1
-8%
33.2
-16%
Last avg *
32.3
33.2
-3%
44.6
-38%
36.2
-12%
37.7
-17%
38.6
-20%
Witcher 3 ultra *
32.8
34.5
-5%
41.4
-26%
38
-16%
39.2
-20%
Last max *
36.4
37.8
-4%
45.1
-24%
47.6
-31%
37.5
-3%
40.8
-12%

* ... kleinere Werte sind besser

Temperaturen

Der Netzadapter kann unter Last eine Temperatur von 52 °C erreichen

Kühle Luft strömt von oben ein, und die Abwärme wird an der Rückseite abgeführt. Um eine optimale Kühlung zu gewährleisten, sollte man die Oberseite frei von Büchern, Papieren oder anderen Hindernissen halten.

System im Leerlauf (vorne)
System im Leerlauf (hinten)
Prime95+FurMark, Stress (vorne)
Prime95+FurMark, Stress (hinten)

Stresstest

Die CPU-Taktraten und die Leistungsaufnahme des Boards stabilisieren sich bei 3,0 GHz bzw. 35 W, wenn Prime95 gestartet wird. 35 W ist das untere Ende des Spektrums für den Ryzen 5 5600H, und daher ist es ein wenig enttäuschend, keine höheren TDP-Ziele für den SER5 zu sehen. Die Kerntemperatur ist mit 85 °C bereits recht hoch, was den niedrigen Wert von 35 W erklären könnte.

Die Ausführung von Witcher 3 führt zu einer Kerntemperatur von 75 °C im Vergleich zu 57 °C mit dem Intel NUC11PAQ. Das Beelink System läuft unter den meisten Bedingungen ein wenig wärmer als das Intel System.

System im Leerlauf
System im Leerlauf
Witcher 3, Stress
Witcher 3, Stress
Prime95, Stress
Prime95, Stress
Prime95+FurMark, Stress
CPU Clock (GHz) GPU Clock (MHz) durchschnitt. CPU-Temperatur (°C)
System Idle -- -- 39
Prime95, Stress 3,0 -- 85
Prime95 + FurMark, Stress 2,8 980 84
Witcher 3, Stress ~0,9 1.800 75

Energiemanagement

Leistungsaufnahme

Die Leistungsaufnahme ist in der Regel höher als bei Modellen, die mit CPUs der Ryzen-U-Serie oder Core-U-Serie laufen, da unsere CPU der Ryzen-H-Serie auf vergleichsweise höhere TDP-Werte abzielt. Der Intel NUC11 mit dem Core i5-1135G7 zum Beispiel benötigt beim Spielen zwischen 40 und 44 W, verglichen mit 46 bis 50 W bei unserem Beelink. Die Leistung pro Watt ist beim Ryzen 5 5600H immer noch besser, vor allem in Bezug auf die Multi-Thread-CPU-Leistung.

Wir konnten mit dem kleinen bis mittelgroßen (~10 x 4,9 x 3,3 cm) 57-Watt-Netzteil eine maximale Leistungsaufnahme von 50,2 W aufzeichnen, wenn die CPU zu 100 Prozent ausgelastet ist. Wir vermuten, dass dieser Wert noch höher ausfallen kann, wenn mehrere USB-Geräte oder externe USB-C-Monitore angeschlossen sind.

3DMark 06, Leistungsaufnahme
Witcher 3, 1.080p-Ultra-Stress
Das Auslösen von Prime95 lässt den Verbrauch in die Höhe schnellen und stabilisiert ihn bei 54 W ohne größere Einbrüche
Prime95+FurMark, Stress
Stromverbrauch
Aus / Standbydarklight 0.6 / 1 Watt
Idledarkmidlight 5.4 / 8.2 / 8.3 Watt
Last midlight 49.3 / 50.2 Watt
 color bar
Legende: min: dark, med: mid, max: light        Metrahit Energy
Beelink SER Pro Ryzen 5 5600H
R5 5600H, Vega 7, Kingston NV1 SNVS/500GCN, , x,
Beelink SEi11 Pro
i5-11320H, Iris Xe G7 96EUs, Kingston NV1 SNVS/500GCN, , x,
Beelink GTR5
R9 5900HX, Vega 8, Kingston NV1 SNVS/500GCN, , x,
Intel NUC11TNKi5
i5-1135G7, Iris Xe G7 80EUs, Transcend M.2 SSD 430S TS512GMTS430S, , x,
Beelink SEi8
i3-8109U, Iris Plus Graphics 655, Intel SSD 660p SSDPEKNW512G8, , x,
Beelink SER4
R7 4800U, Vega 8, Intel SSD 660p SSDPEKNW512G8, , x,
Stromverbrauch
-30%
-28%
-41%
-2%
32%
Idle min *
5.4
9.8
-81%
6.2
-15%
11.5
-113%
7.5
-39%
4.1
24%
Idle avg *
8.2
10.3
-26%
8.9
-9%
12.4
-51%
7.6
7%
4.1
50%
Idle max *
8.3
10.5
-27%
9
-8%
12.9
-55%
9.2
-11%
4.6
45%
Last avg *
49.3
54.2
-10%
66.8
-35%
40.7
17%
41.1
17%
35.6
28%
Witcher 3 ultra *
46.1
53.1
-15%
62.6
-36%
43.9
5%
35.6
23%
Last max *
50.2
59
-18%
81.6
-63%
73.5
-46%
41.4
18%
39.9
21%

* ... kleinere Werte sind besser

Leistungsaufnahme Witcher 3 / Stresstest

05101520253035404550Tooltip
Beelink SER Pro Ryzen 5 5600H; Witcher 3 ultra: Ø46.1 (45.2-47.8)
Beelink SER Pro Ryzen 5 5600H; 1280x720 Prime95 28.10 and Furmark 1.25: Ø54.3 (50.1-55)

Leistungsaufnahme externer Monitor

05101520253035404550Tooltip
Beelink SER Pro Ryzen 5 5600H; Prime95 V2810 Stress (external Monitor): Ø53.3 (52.3-54)
Beelink SER Pro Ryzen 5 5600H; Cinebench R15 Multi (external Monitor): Ø48.2 (47.8-48.5)
Beelink SER Pro Ryzen 5 5600H; 1280x720 FurMark 1.19 GPU Stress Test (external Monitor): Ø49.5 (48.2-50.5)
Beelink SER Pro Ryzen 5 5600H; 1920x1080 The Witcher 3 ultra (external Monitor): Ø46.1 (45.2-47.8)

Pro

+ zugängliche 2x SODIMM, 2x Speicherschächte
+ hervorragende CPU-Leistung für den Preis
+ Wi-Fi 6E-Standard
+ relativ leise
+ preiswert

Contra

- langsame Wireless-Leistung für Wi-Fi 6E-Standards
- kürzere Garantiezeit als Intel NUC
- keine Unterstützung für Thunderbolt oder PD-in
- kleine Schrauben lösen sich leicht
- Spulengeräusch

Fazit: Eine weitere hervorragende Alternative zum Intel NUC11

Im Test: Beelink SER5 Pro. Testgerät von Beelink zur Verfügung gestellt

Für rund 650 Euro ist der Beelink SER5 Pro mit 16 GB Arbeitsspeicher, 500 GB Speicherplatz und einer lizenzierten Kopie von Windows 11 Pro ausgestattet. Im Gegensatz dazu wird ein Intel NUC11PAHi7 mit der gleichen Speicher- und Arbeitsspeicherkapazität derzeit für fast 750 Euro angeboten. Der SER5 bietet sogar eine schnellere Prozessorleistung als der Intel und viele der gleichen aufrüstbaren Optionen, einschließlich SODIMM und Dual-Storage. Wenn man ca. 150 Euro sparen will, dann sollte der Beelink ganz oben auf der Wunschliste stehen.

Der Beelink SER5 Pro ist ca. 150 Euro günstiger als ein Intel NUC mit ähnlicher Leistung. Unternehmen werden vielleicht immer noch die Zuverlässigkeit des NUC bevorzugen, doch die meisten Privatanwender können den günstigeren Beelink in Betracht ziehen.

Es gibt eine Reihe von Abstrichen, die sich jedoch nicht auf das Benutzererlebnis auswirken. Im Vergleich zum Intel NUC fehlt es dem SER5 Pro an Thunderbolt, einer Diebstahlsicherung, PCIe4-SSD-Unterstützung, einer dreijährigen Herstellergarantie und einem stärkeren Gehäuse. Der NUC kann immer noch die bessere Investition sein, wenn diese Funktionen als wichtig erachtet werden, aber die Preisersparnis ist ansonsten relativ signifikant.


Preis und Verfügbarkeit

Der Beelink SER5 ist für ca. 650 Euro auf Amazon erhältlich.

Preisvergleich

static version load dynamic
Loading Comments
Diesen Artikel kommentieren / Antworten
Teilen Sie diesen Artikel, um uns zu unterstützen. Jeder Link hilft!
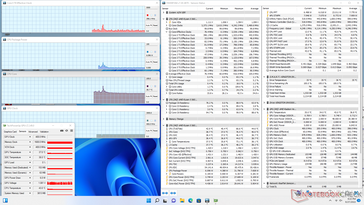
Mail Logo
> Notebook Test, Laptop Test und News > Tests > Notebook Testberichte > Beelink SER5 Pro 5600H Mini-PC Test: NUC-11-Geschwindigkeiten mit AMD Ryzen
Autor: Allen Ngo, 12.10.2022 (Update: 12.10.2022)