Beelink GTI12 Ultra EX Docking Station Mini-PC im Test: Erschwinglicher als erwartet

Ein häufig geäußerter Kritikpunkt an den Mini-PCs von Beelink war bisher, dass sie ausschließlich mit integrierter Grafik ausgestattet waren. Die neueste GTI Ultra-Serie bietet zwar keine diskrete Grafiklösung, markiert jedoch Beelinks ersten Vorstoß in die offizielle Unterstützung von eGPUs durch die EX-Dockingstation. Dies richtet sich besonders an Power-User und Gamer, die zusätzliche Leistung benötigen.
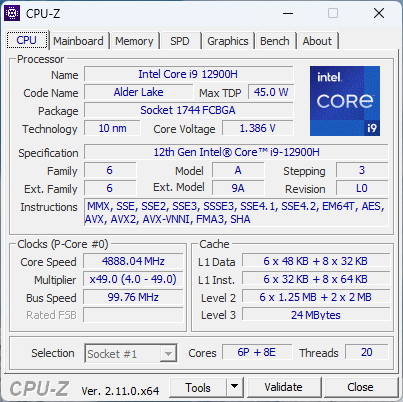
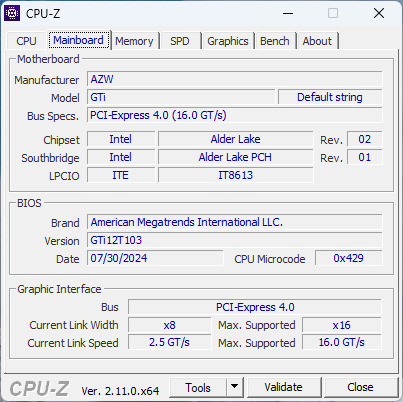
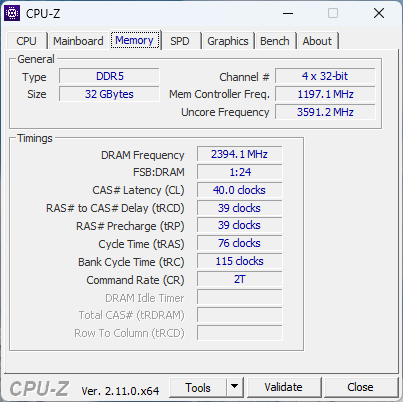
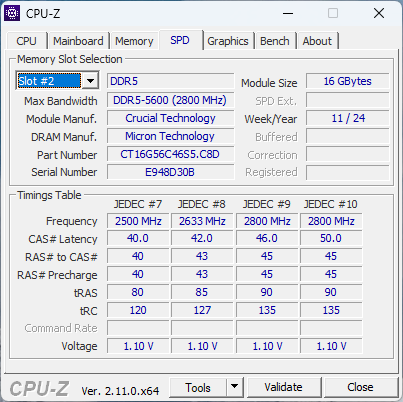
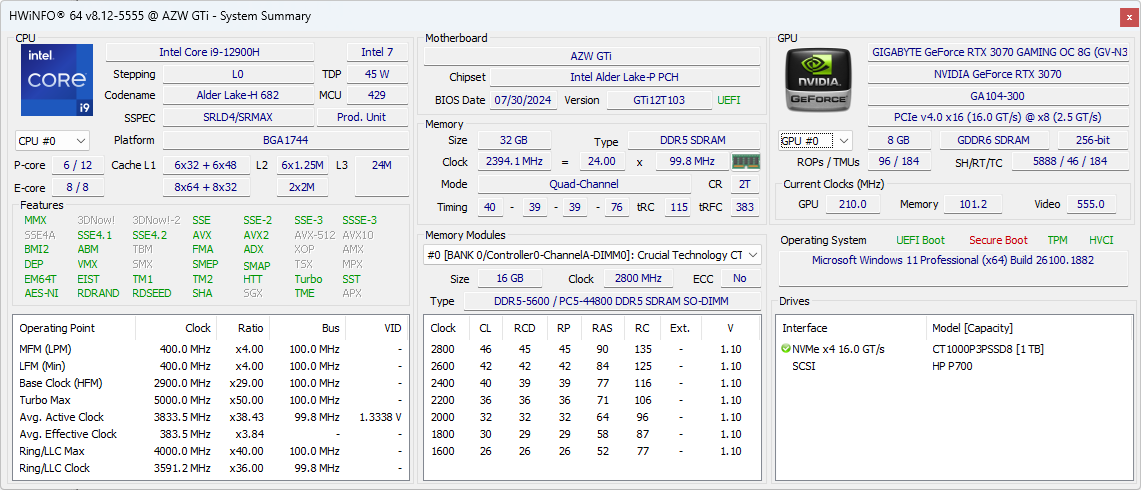
Unser Testgerät, das GTI12 Ultra, ist mit einem Core i9-12900H, einer 1-TB-SSD und 32 GB DDR5-5600-RAM ausgestattet. Zusammen mit der EX-Dockingstation liegt der Preis bei etwa 873 Euro. Neuere Meteor Lake-CPUs sind im Modell GTI14 Ultra erhältlich, das äußerlich dem GTI12 Ultra gleicht.
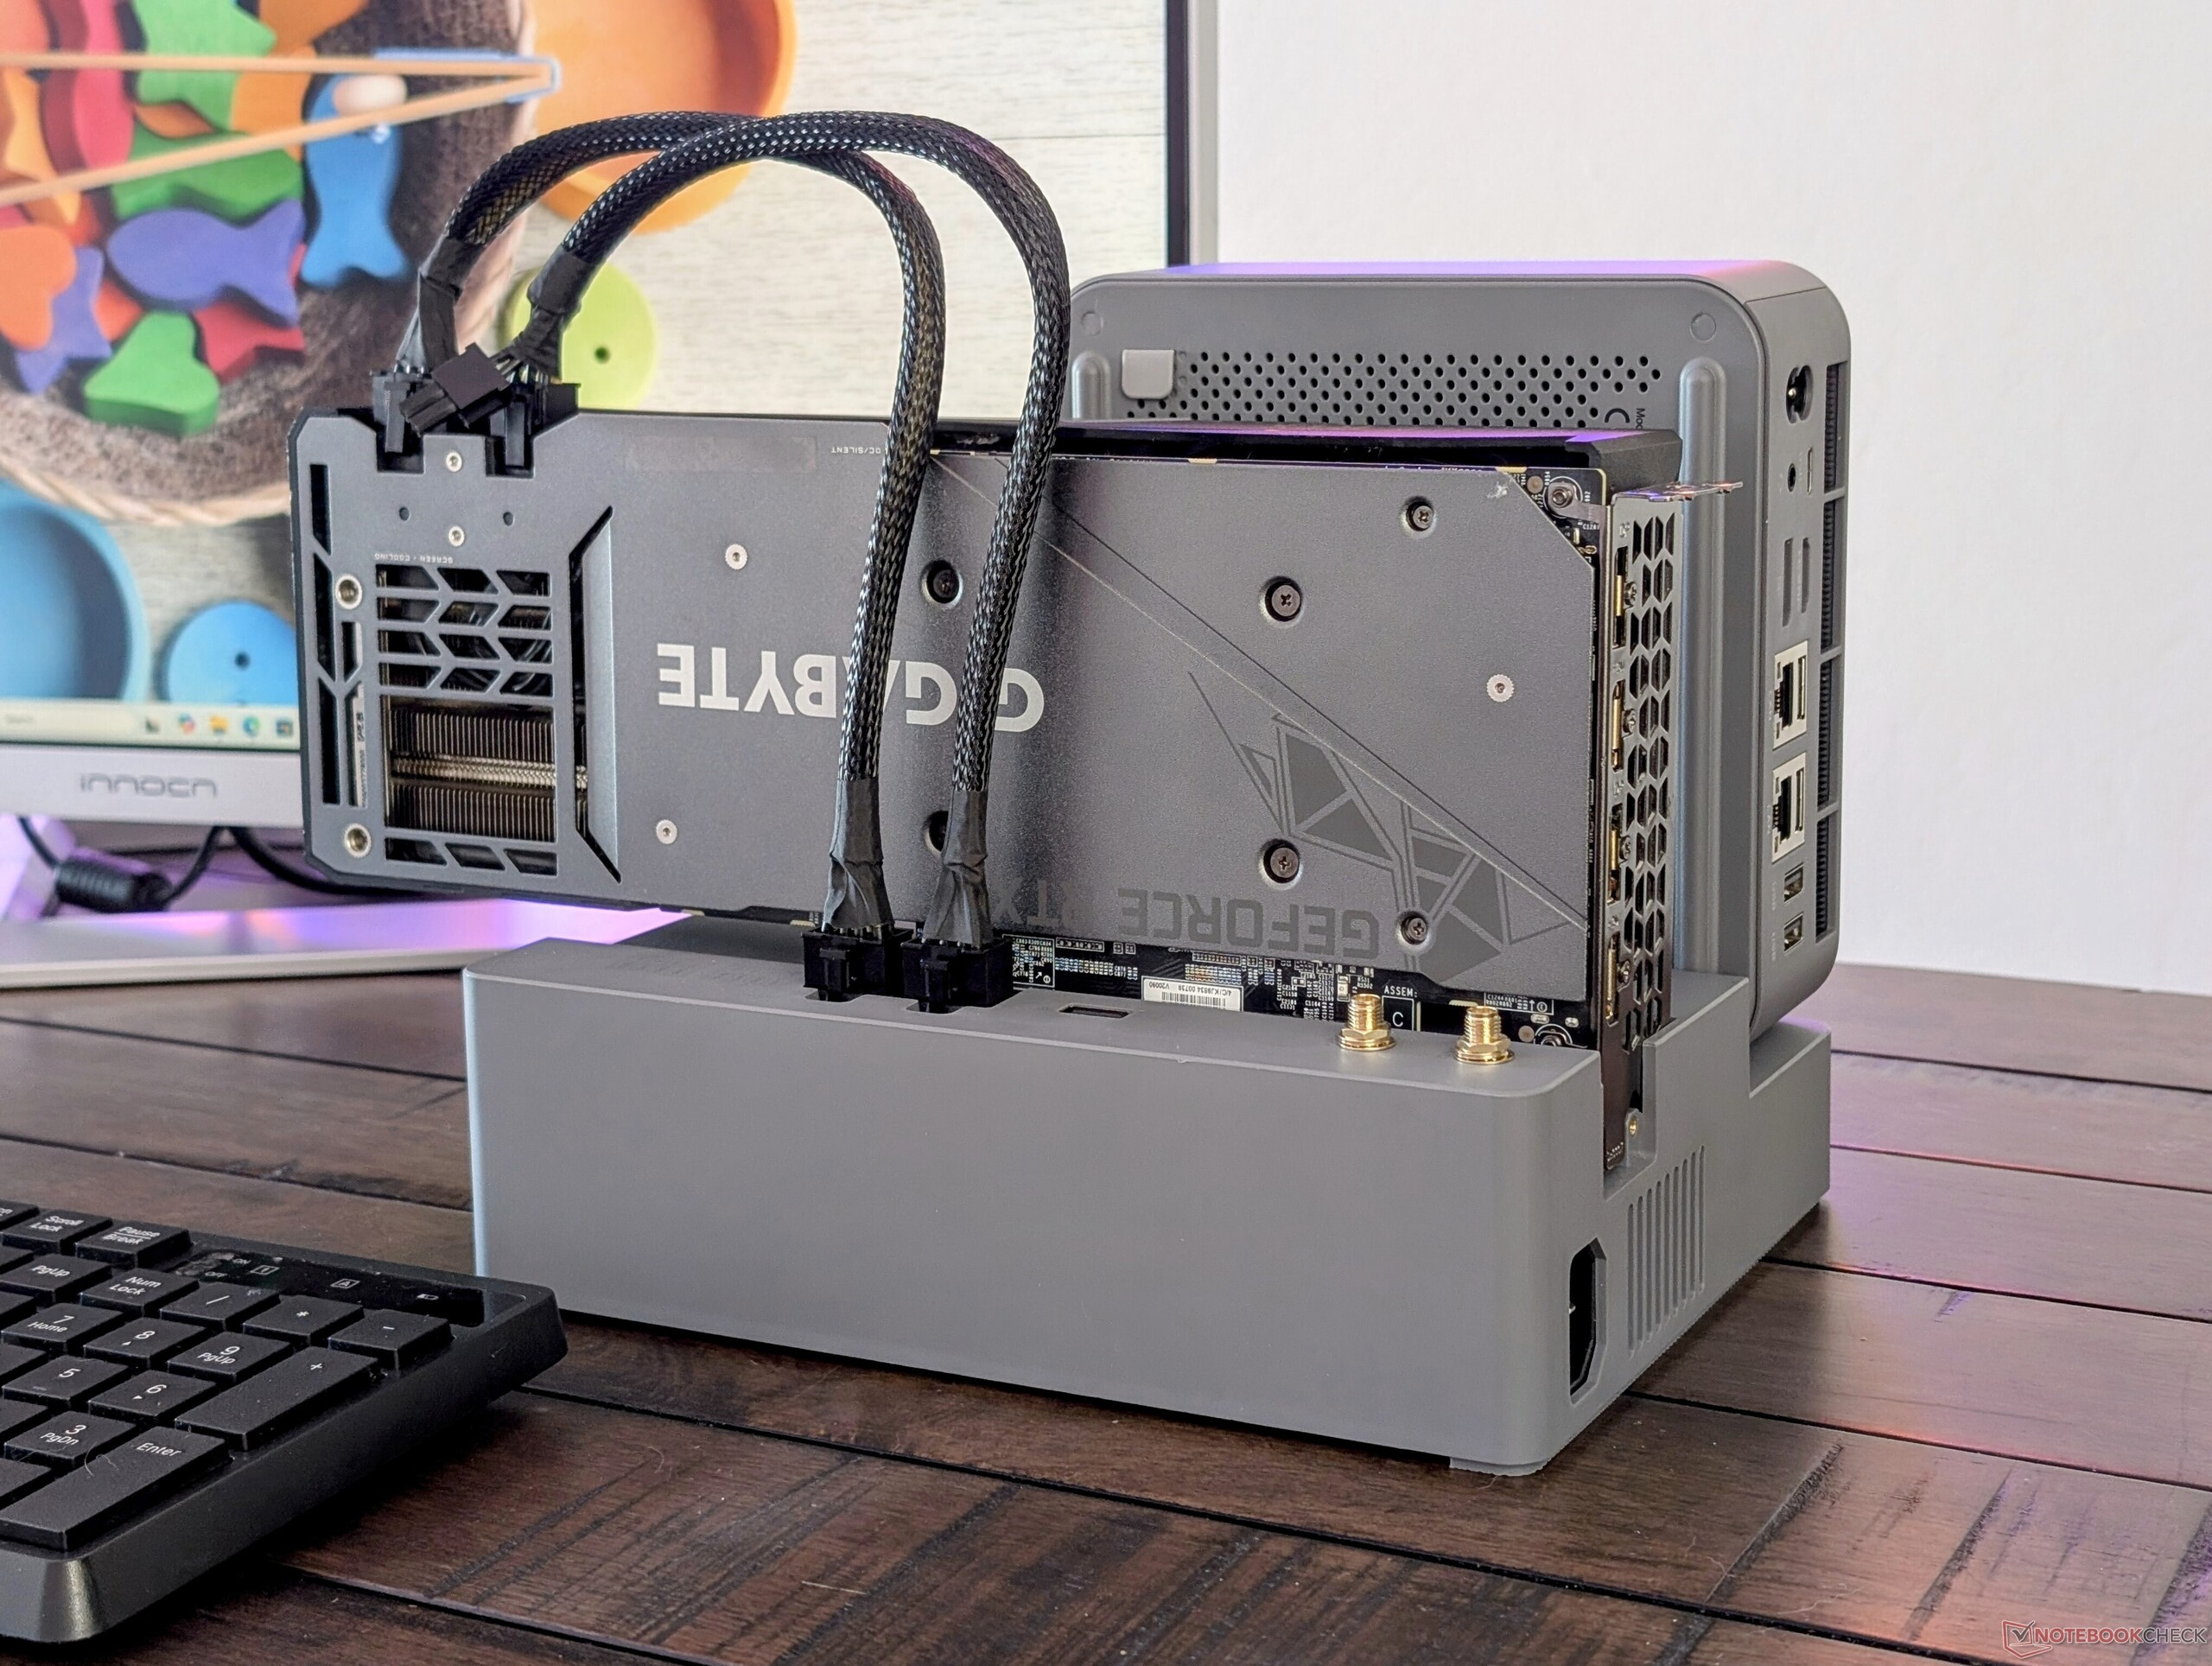
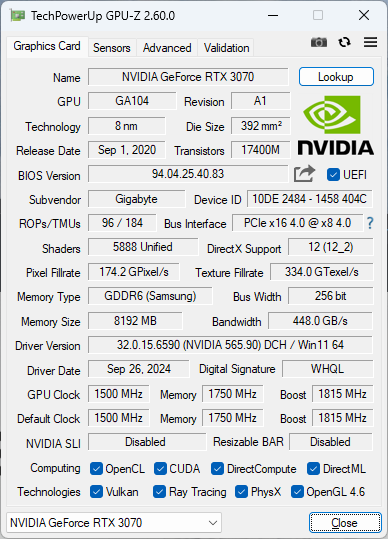
Für unseren Test der EX-Dockingstation haben wir eine Gigabyte GeForce RTX 3070 GPU verwendet. Die Dockingstation selbst unterstützt jedoch GPUs bis hin zur RTX 4090 bei einer maximalen Leistungsaufnahme von 600 W.
Weitere Beelink Bewertungen:
Mögliche Konkurrenten im Vergleich
Bew. | Version | Datum | Modell | Gewicht | Dicke | Größe | Auflösung | Preis ab |
|---|---|---|---|---|---|---|---|---|
| 76.5 % | v8 | 10 / 2024 | Beelink GTI12 Ultra EX Docking Station i9-12900H, GeForce RTX 3070 | 1.3 kg | 55.8 mm | x | ||
| 76.7 % | v8 | 10 / 2024 | Minisforum MS-A1 R7 8700G, Radeon 780M | 1.7 kg | 48 mm | x | ||
| 67.3 % | v8 | 09 / 2024 | GMK NucBox K9 Ultra 5 125H, Arc 7-Core | 528 g | 47 mm | x | ||
| 74.7 % | v8 | 08 / 2024 | Asus NUC 14 Pro Ultra 5 125H, Arc 7-Core | 525 g | 37 mm | x | ||
| 78.4 % | v8 | 08 / 2024 | Geekom AX8 Pro R9 8945HS, Radeon 780M | 548 g | 37 mm | x | ||
| 86 % | v8 | 08 / 2024 | Asus ROG NUC 14-90AS0051 Ultra 9 185H, GeForce RTX 4070 Laptop GPU | 2.6 kg | 50 mm | x |
Gehäuse
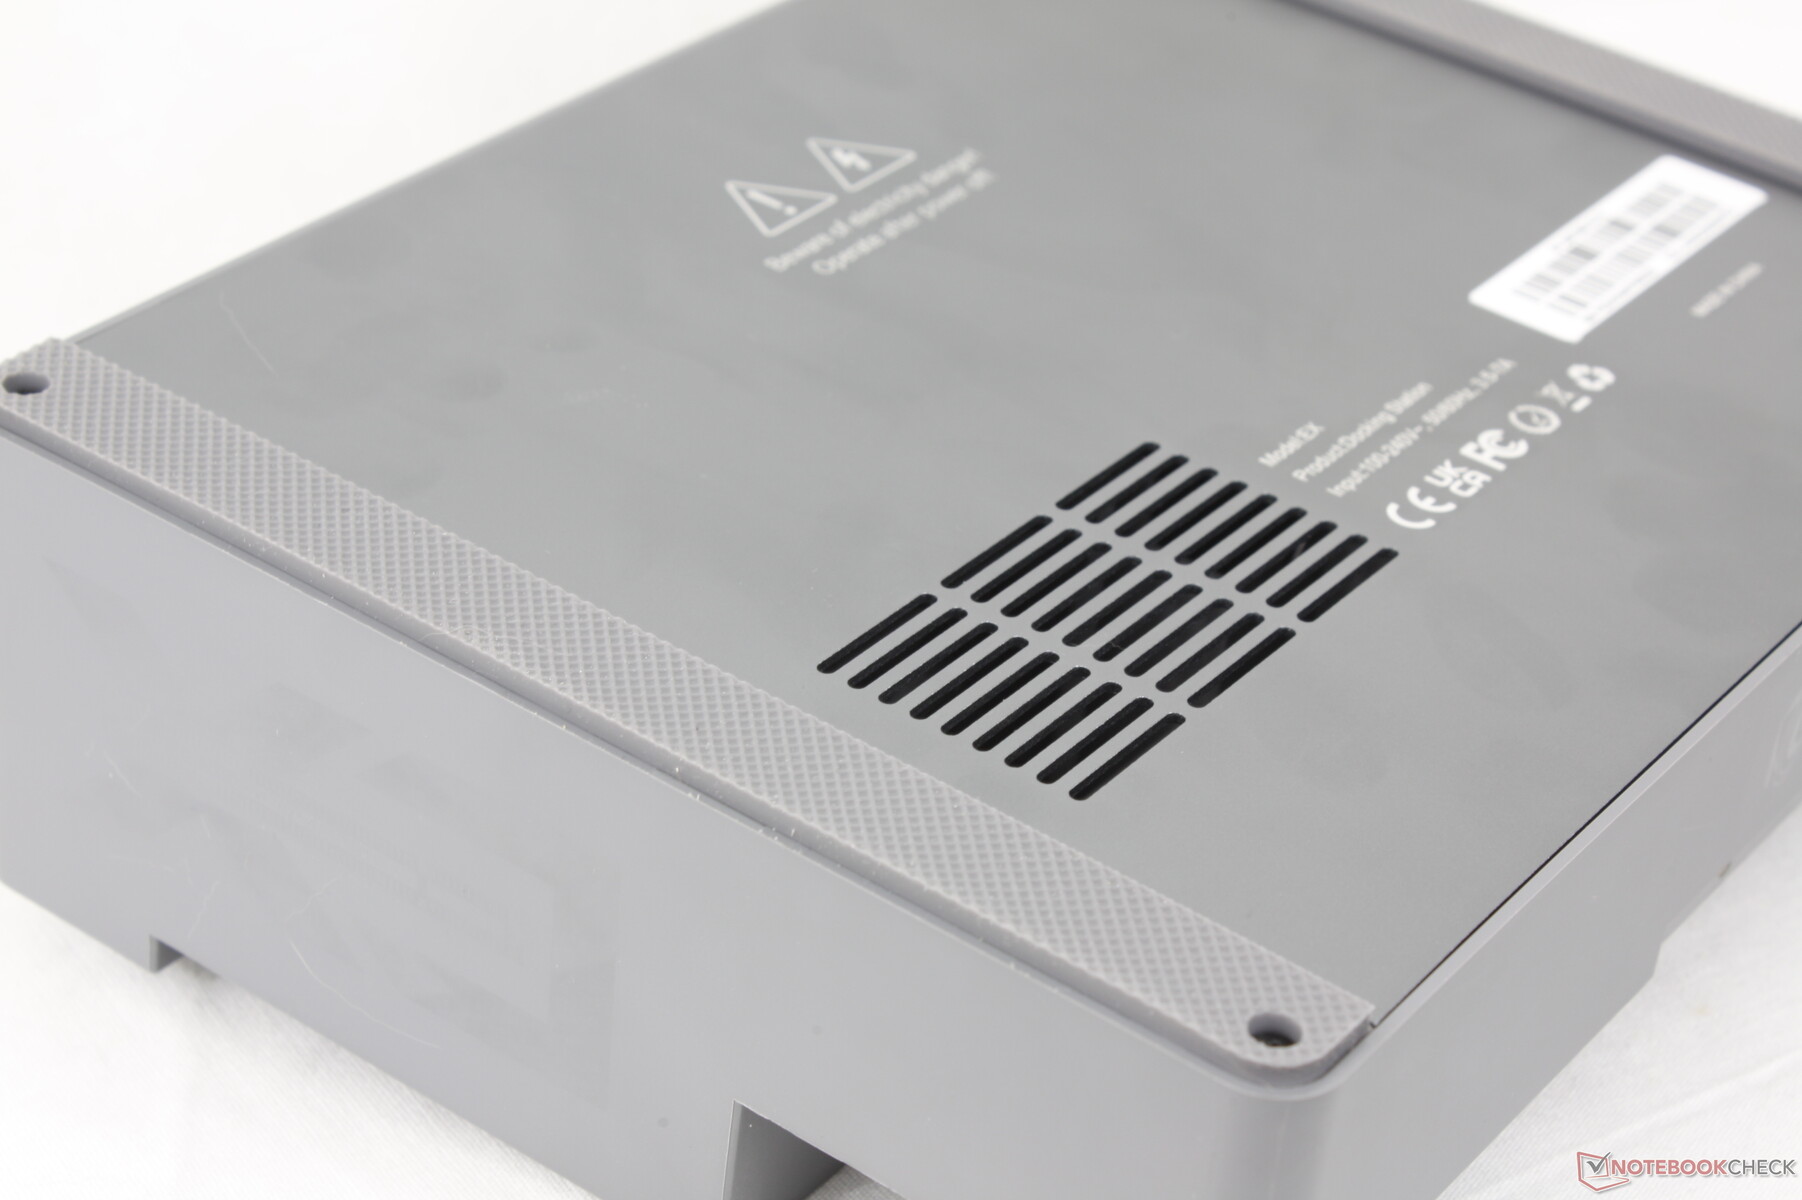
Das GTI12 Ultra ist im Wesentlichen eine vergrößerte Version des SER8, verwendet jedoch die gleichen hochwertigen Metallgehäusematerialien, einen Kunststoffboden und eine glatte, matte Oberfläche. Intern gibt es jedoch wesentliche Unterschiede zwischen den beiden Modellen. Das GTI12 Ultra verfügt über ein integriertes 145-Watt-Netzteil, im Gegensatz zu externen Netzteilen, auf die andere Mini-PCs angewiesen sind. Darüber hinaus ist es mit zwei Lautsprechern ausgestattet, was es zu einem der wenigen Mini-PCs macht, die sowohl ein integriertes Netzteil als auch Audio-Lautsprecher bieten.
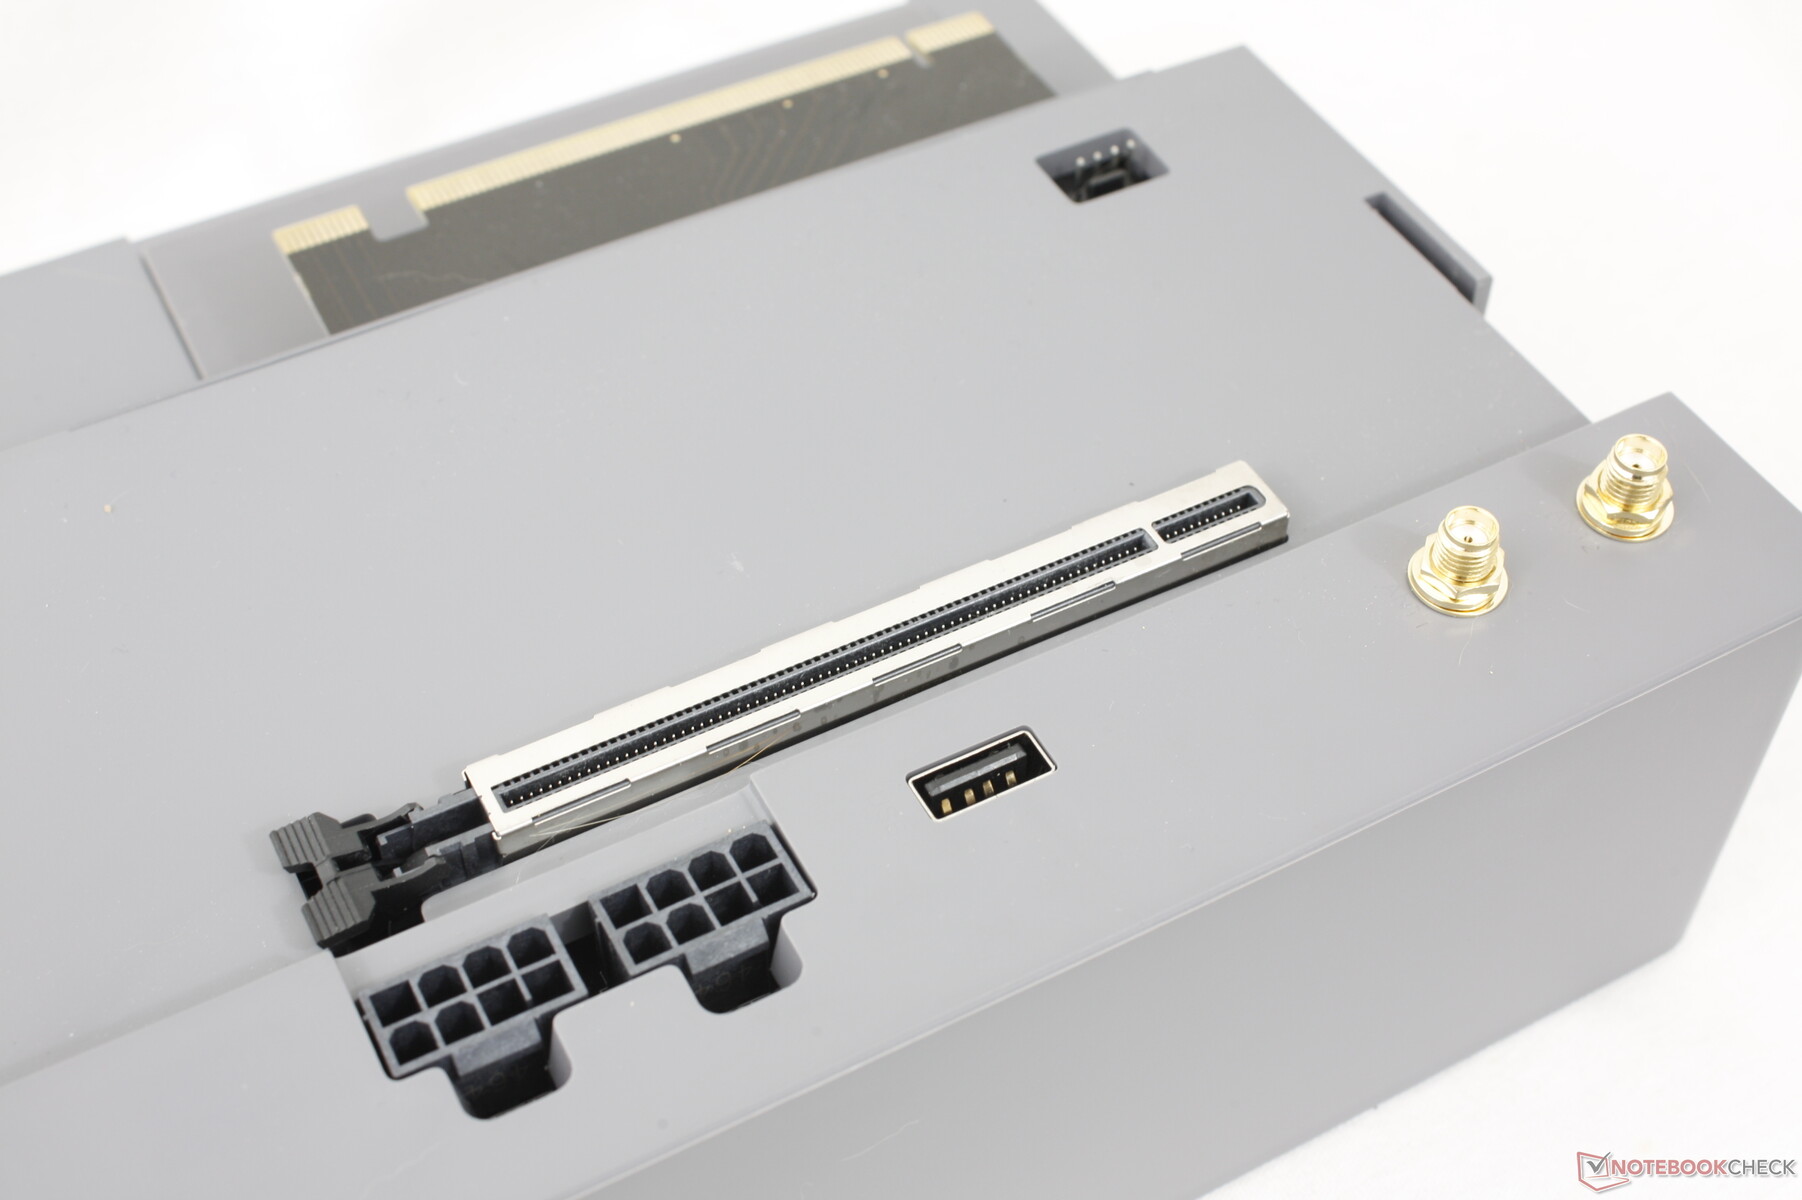
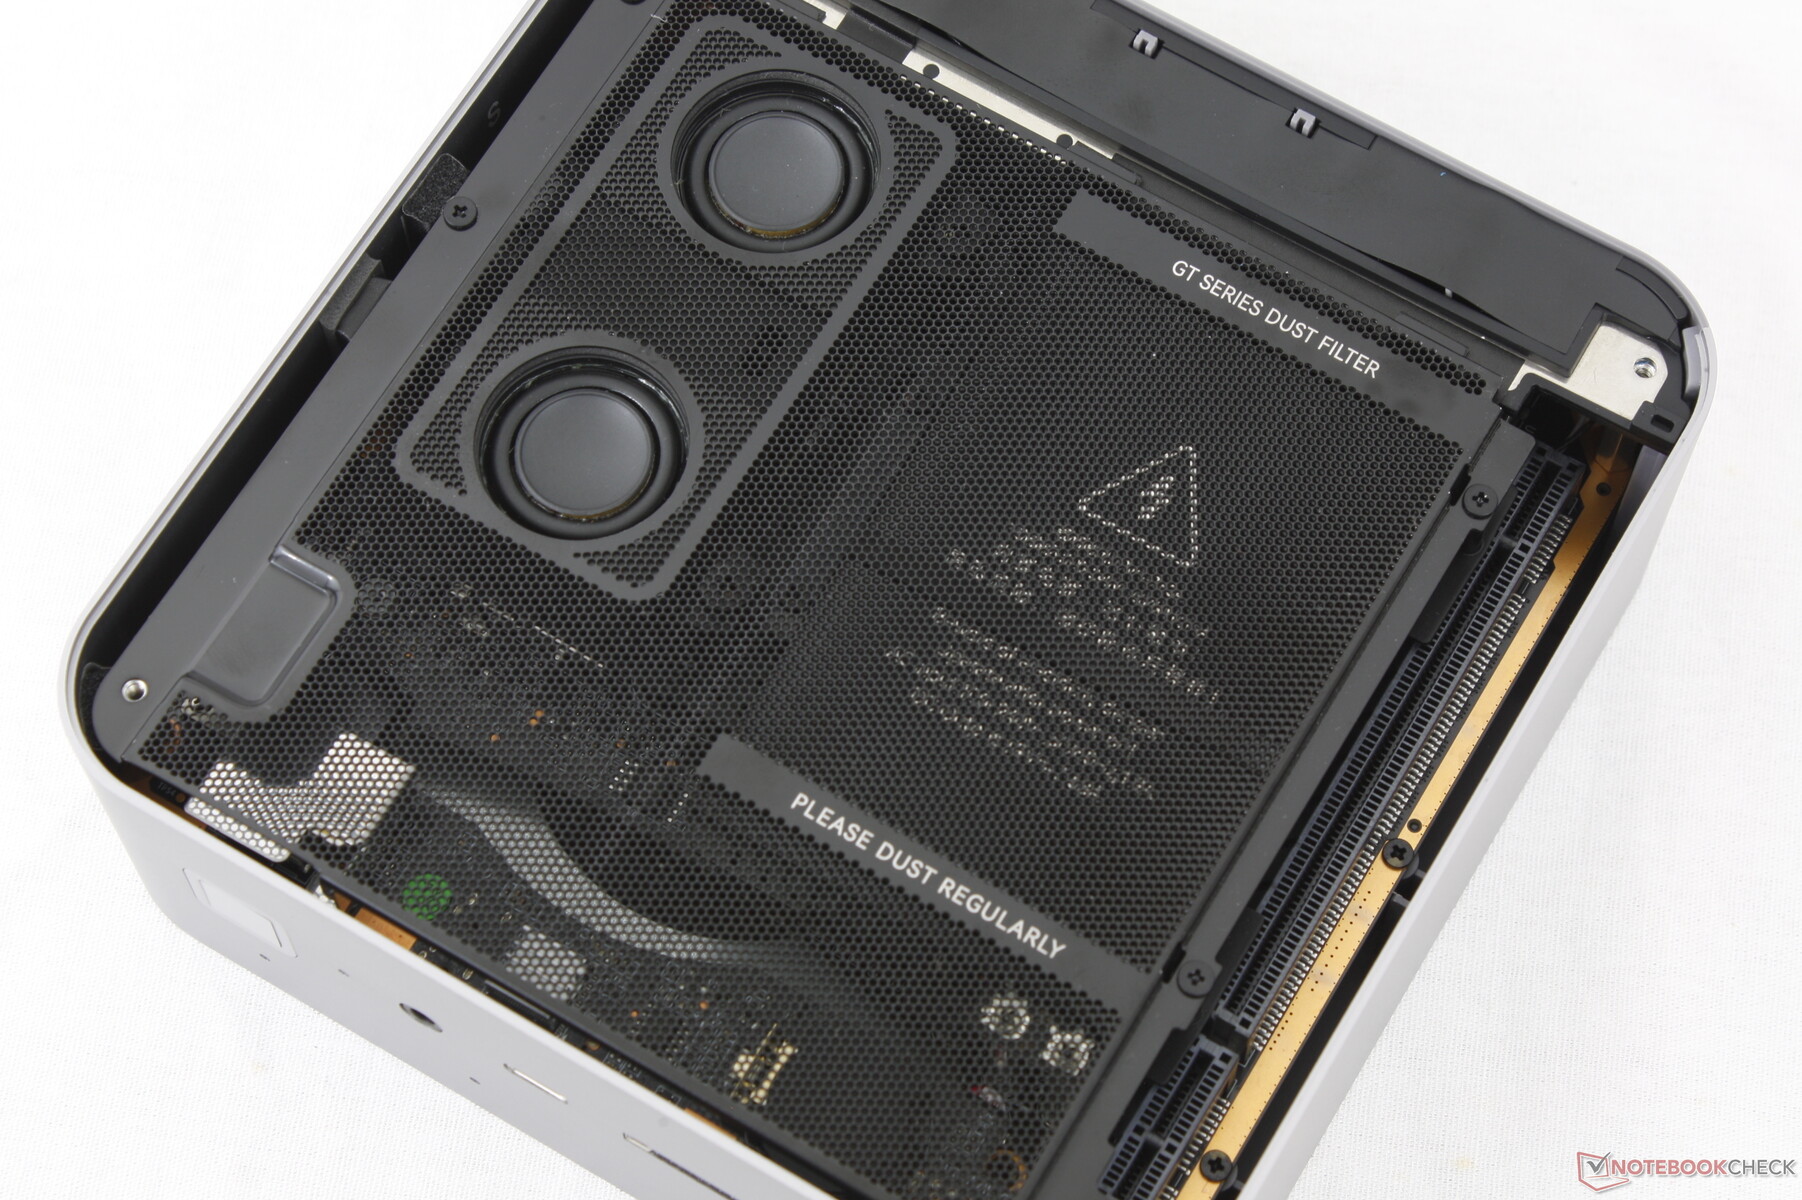
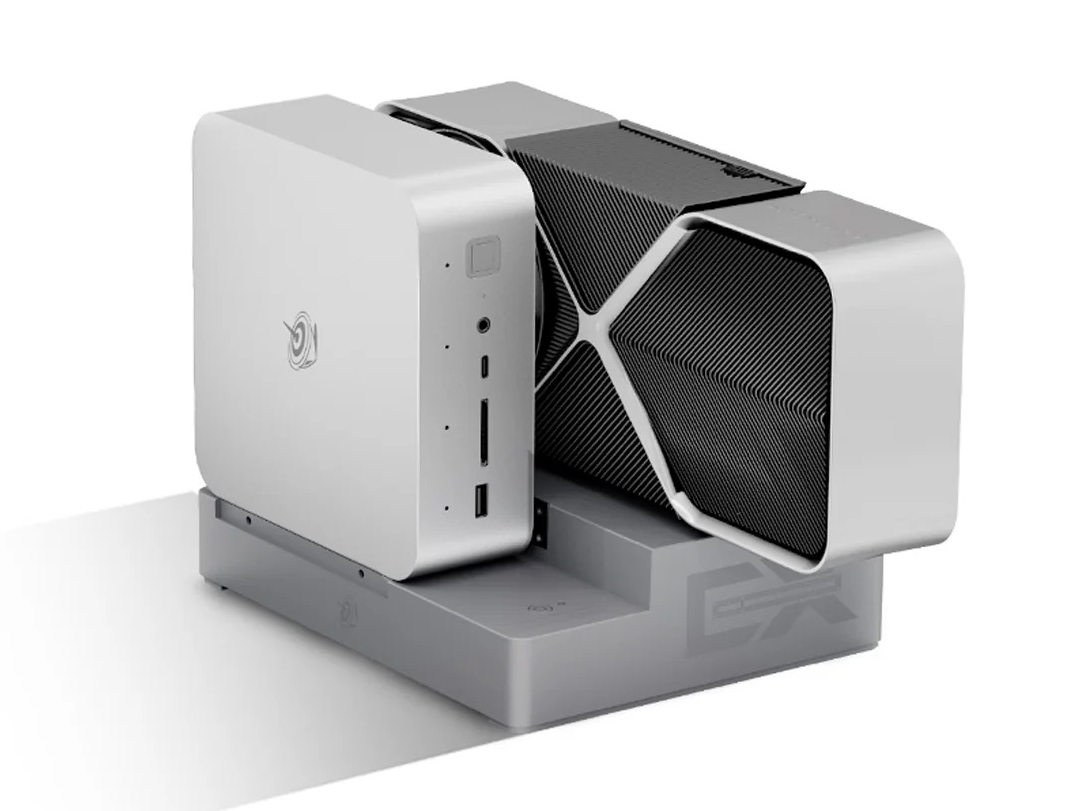
Ein weiteres herausragendes Merkmal ist der PCIe-x8-Steckplatz an der Unterseite des Geräts, der den Anschluss an die EX-Dockingstation ermöglicht, wie auf dem untenstehenden Bild zu sehen ist. Besonders schätzen wir, dass dieser Anschluss nicht proprietär ist, wie es beispielsweise beim Asus ROG XG Mobile der Fall ist.
Das Gerät ist aufgrund der oben genannten einzigartigen Eigenschaften deutlich größer und schwerer als die meisten anderen Mini-PCs mit integrierter Grafik.
| Mini PC | EX Docking Station | Mini PC + EX Docking Station |
| 1316 g | 1419 g | 2735 g |

Ausstattung
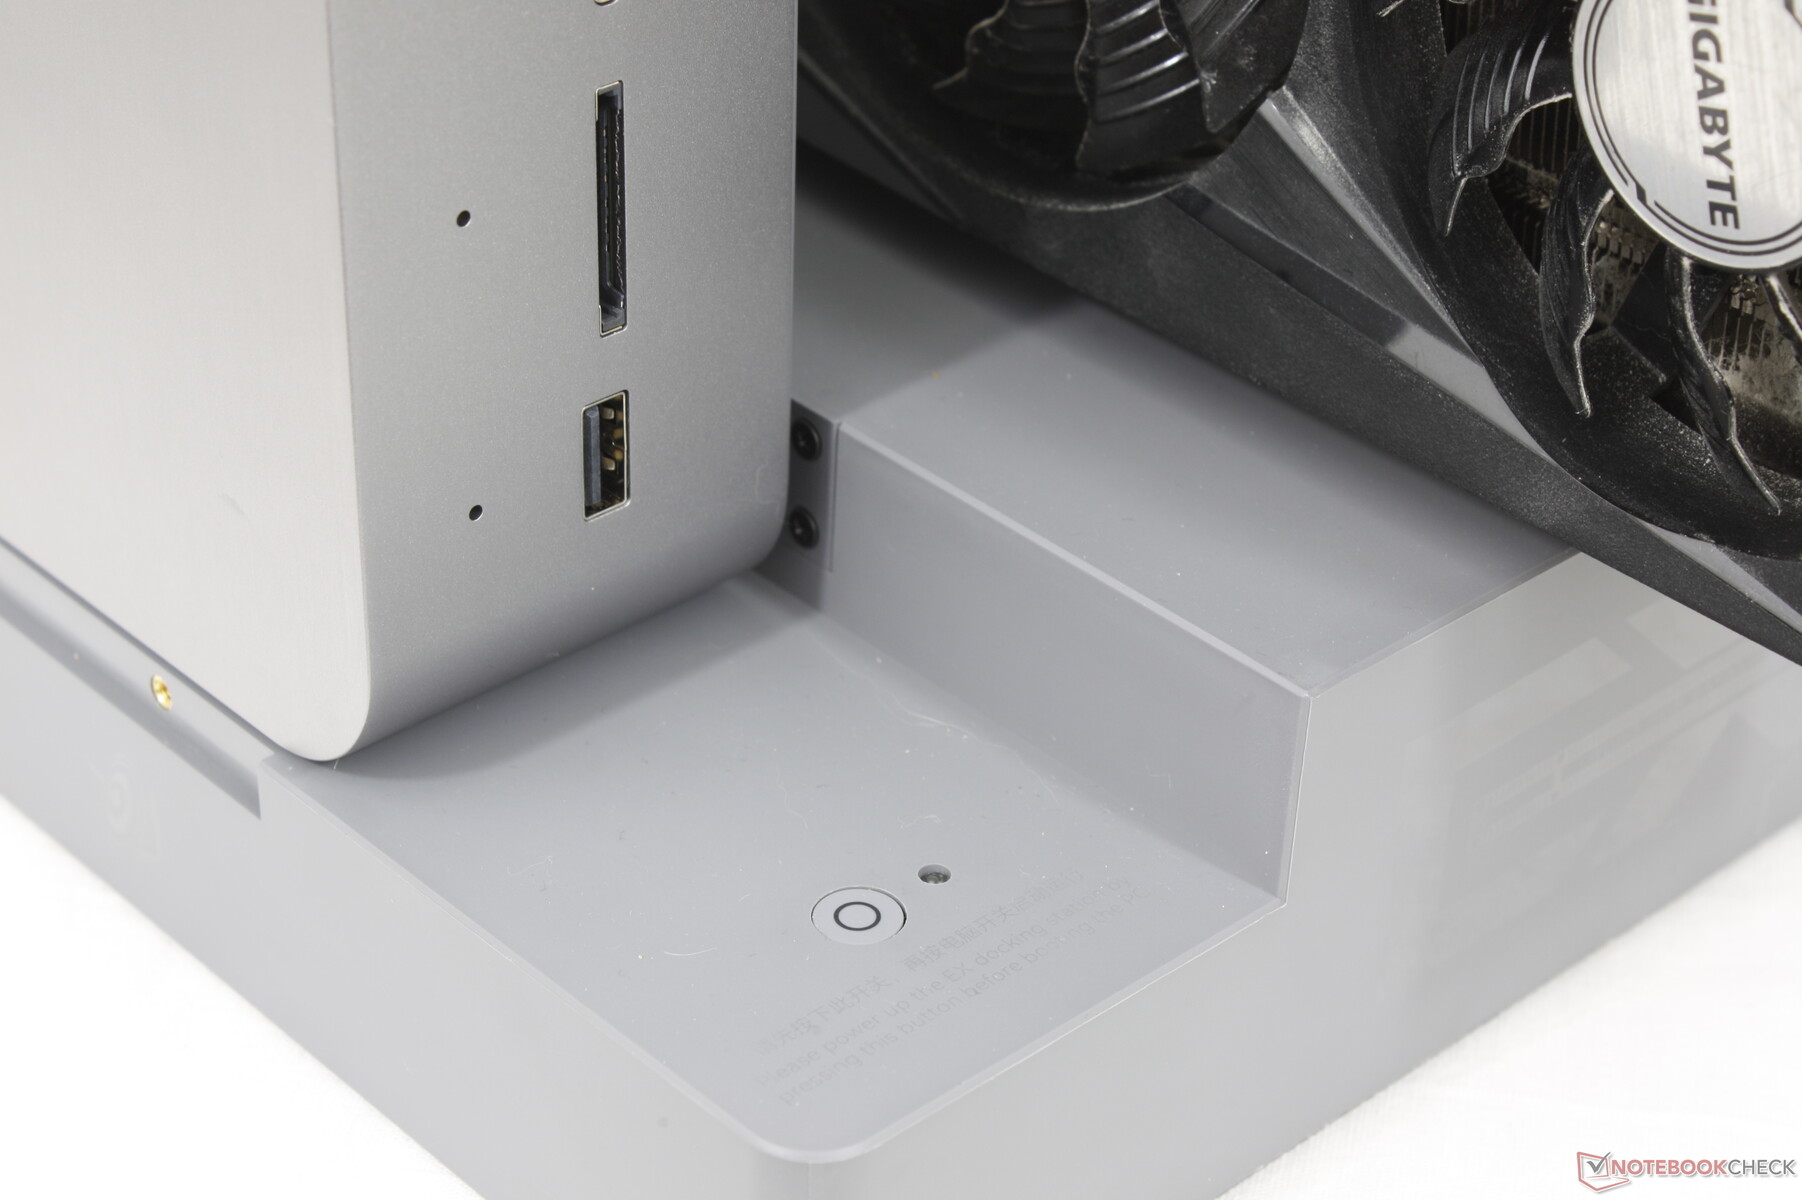
Die Anschlussmöglichkeiten sind größer als bei der SER8 und vielen anderen Mini-PCs in NUC-Größe, da der GTI12 Ultra entsprechend größer ist. Das Modell verfügt über einen SD-Kartenleser sowie zusätzliche USB-A- und RJ-45-Anschlüsse.
Ein Kensington-Schloss ist jedoch nicht vorhanden.

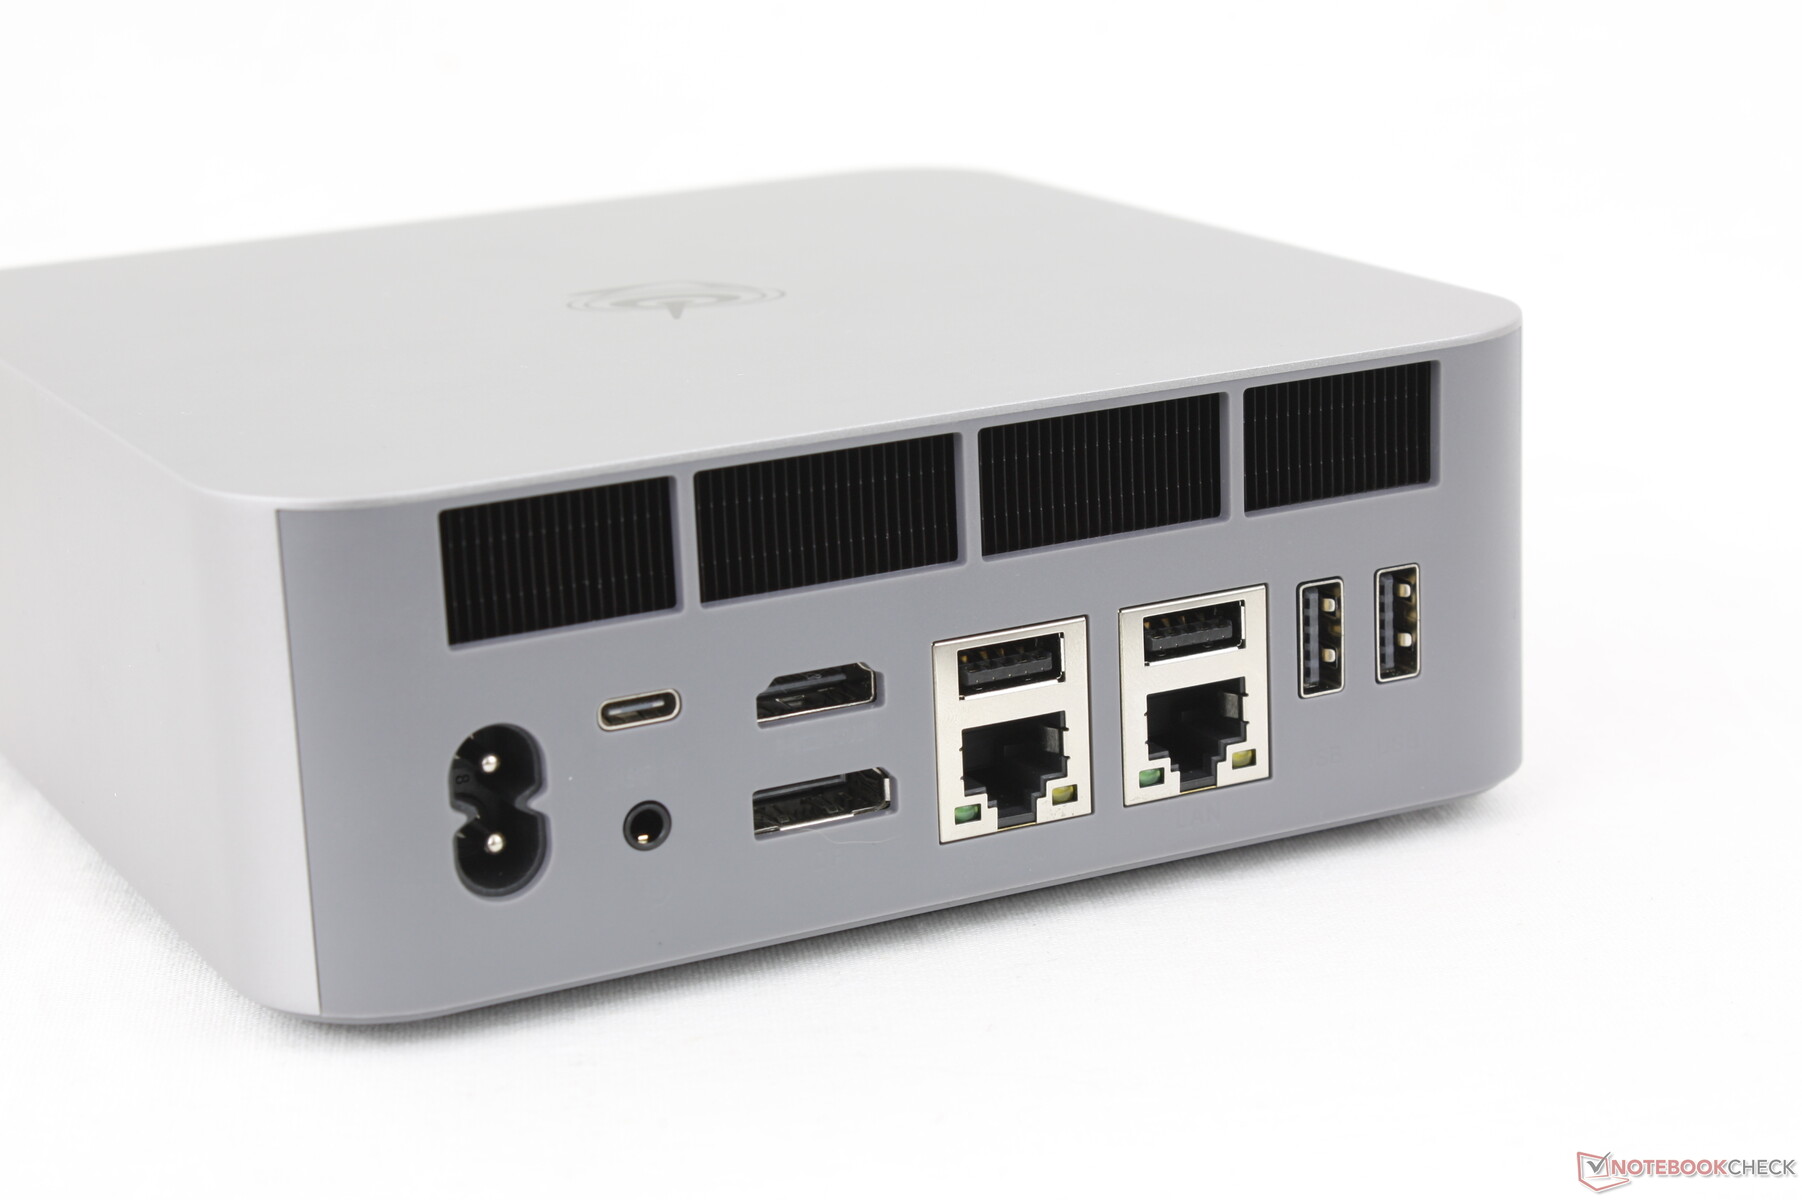
SD Card Reader
| SD Card Reader | |
| average JPG Copy Test (av. of 3 runs) | |
| Asus ROG NUC 14-90AS0051 (AV Pro SD microSD 128 GB V60) | |
| Beelink GTI12 Ultra EX Docking Station (Toshiba Exceria Pro SDXC 64 GB UHS-II) | |
| maximum AS SSD Seq Read Test (1GB) | |
| Asus ROG NUC 14-90AS0051 (AV Pro SD microSD 128 GB V60) | |
| Beelink GTI12 Ultra EX Docking Station (Toshiba Exceria Pro SDXC 64 GB UHS-II) | |
Kommunikation
Wi-Fi 6E und Wi-Fi 7 werden nicht unterstützt, wahrscheinlich um Kosten zu sparen.
| Networking | |
| iperf3 transmit AXE11000 | |
| Asus NUC 14 Pro | |
| Beelink GTI12 Ultra EX Docking Station | |
| Asus ROG NUC 14-90AS0051 | |
| Geekom AX8 Pro | |
| Minisforum MS-A1 | |
| GMK NucBox K9 | |
| iperf3 receive AXE11000 | |
| Asus NUC 14 Pro | |
| Beelink GTI12 Ultra EX Docking Station | |
| Geekom AX8 Pro | |
| Asus ROG NUC 14-90AS0051 | |
| Minisforum MS-A1 | |
| GMK NucBox K9 | |
| iperf3 transmit AXE11000 6GHz | |
| Geekom AX8 Pro | |
| Asus ROG NUC 14-90AS0051 | |
| Minisforum MS-A1 | |
| Asus NUC 14 Pro | |
| iperf3 receive AXE11000 6GHz | |
| Minisforum MS-A1 | |
| Asus ROG NUC 14-90AS0051 | |
| Asus NUC 14 Pro | |
| Geekom AX8 Pro | |
Wartung
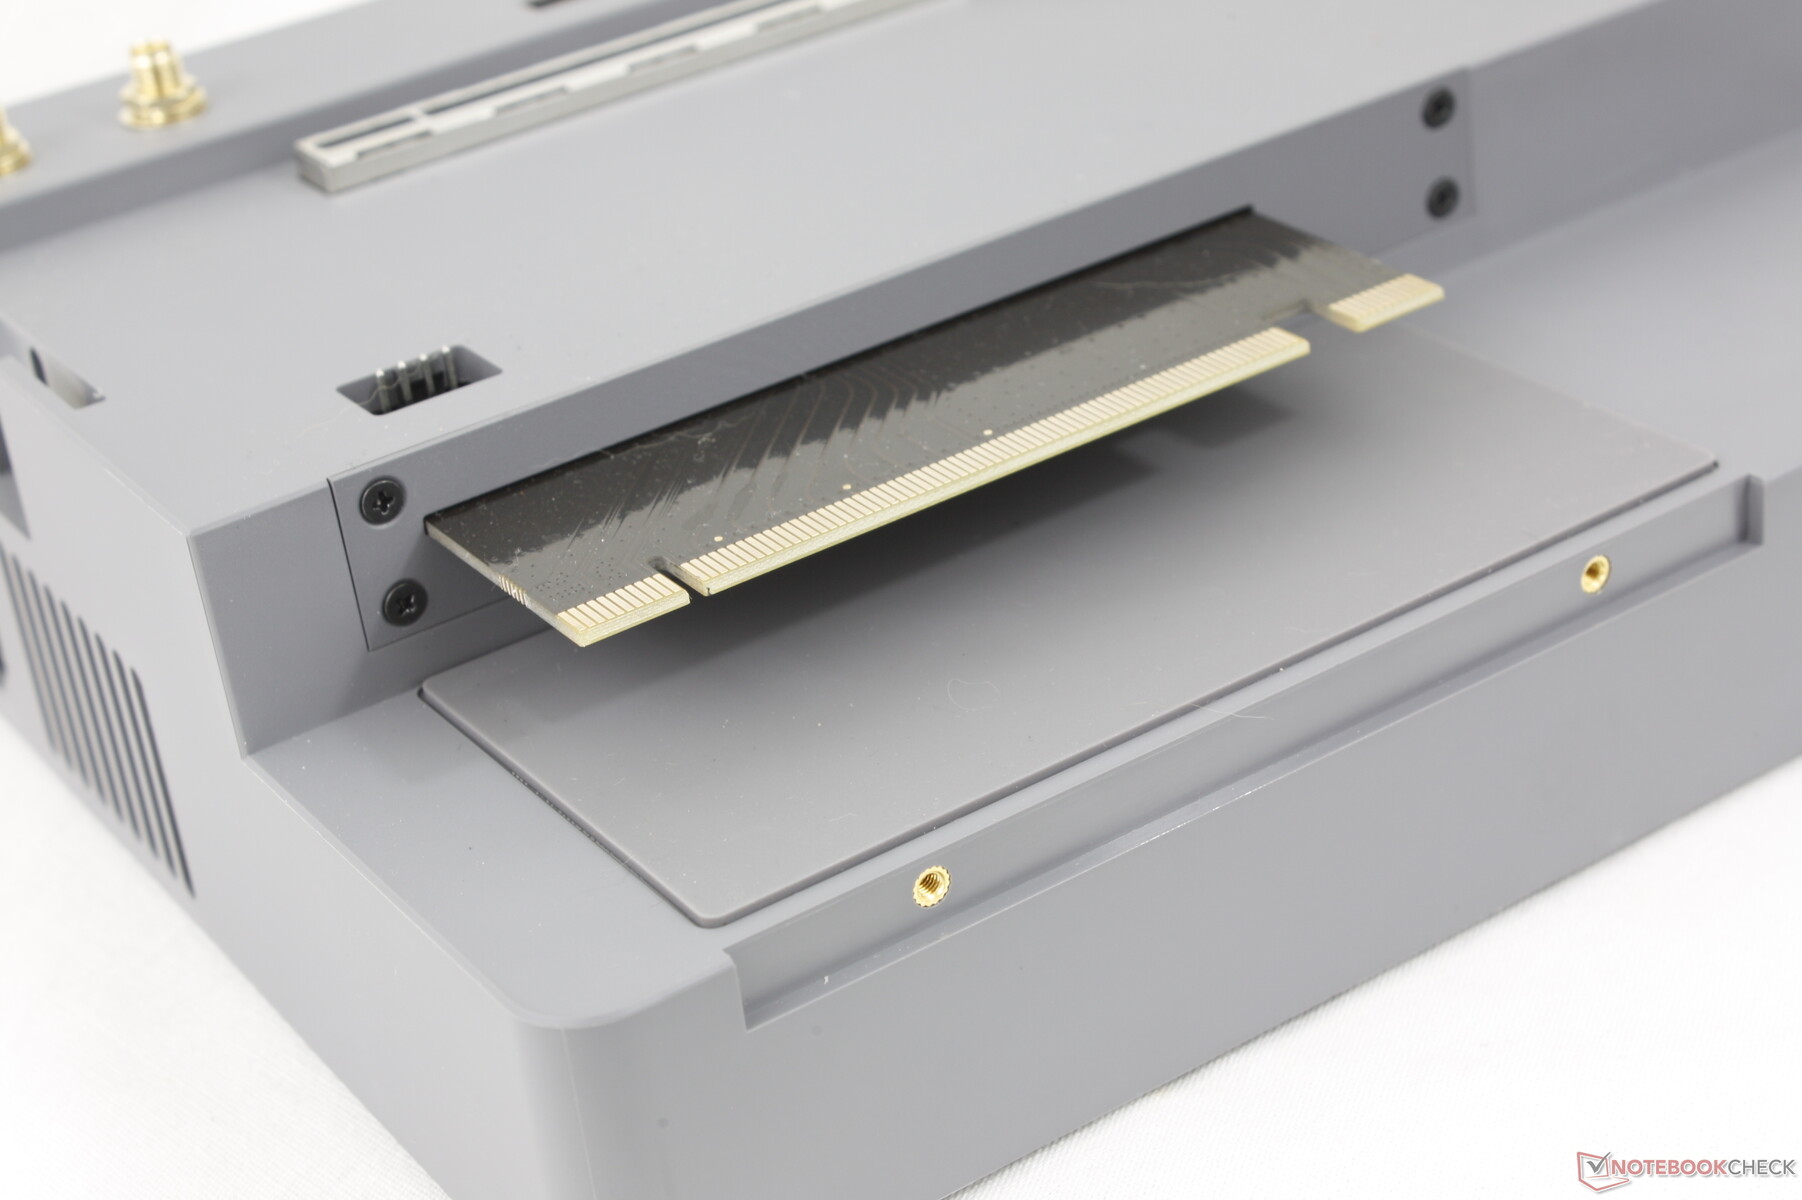
Das GTI12 Ultra ist im Vergleich zu seinen kleineren Geschwistern viel schwieriger zu warten, da es mehr integrierte Teile hat, die bei anderen Modellen nicht zu finden sind. Die Lautsprecher, der Staubfilter und das integrierte Netzteil befinden sich oben auf der Hauptplatine und haben jeweils unterschiedlich große Schrauben, was die Wartung zusätzlich erschwert.
Nachhaltigkeit
Beelink wirbt damit, dass bei der Herstellung des GTI12 nachhaltige Maßnahmen ergriffen wurden. Die Verpackung besteht größtenteils aus Papier, ergänzt durch etwas LDPE-Verpackung und Kunststoff.
Zubehör und Garantie
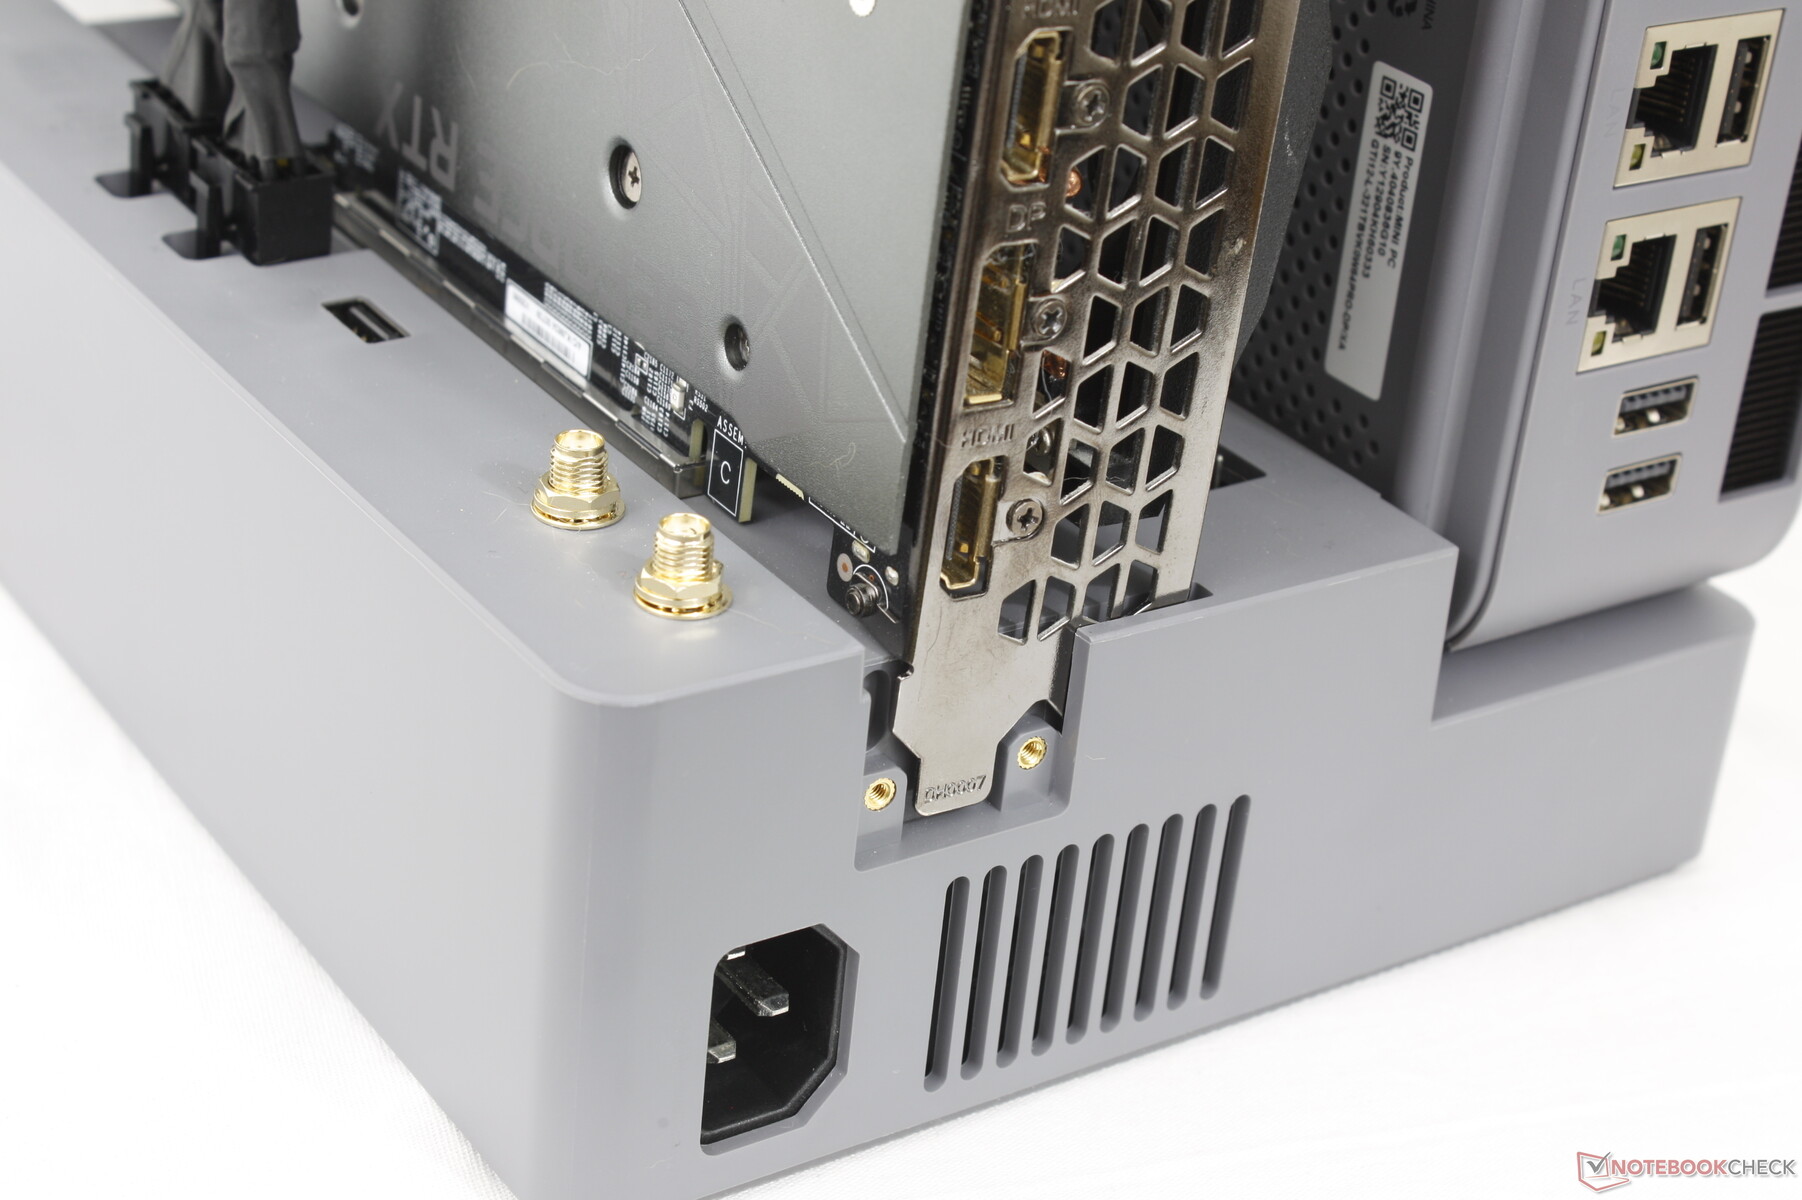
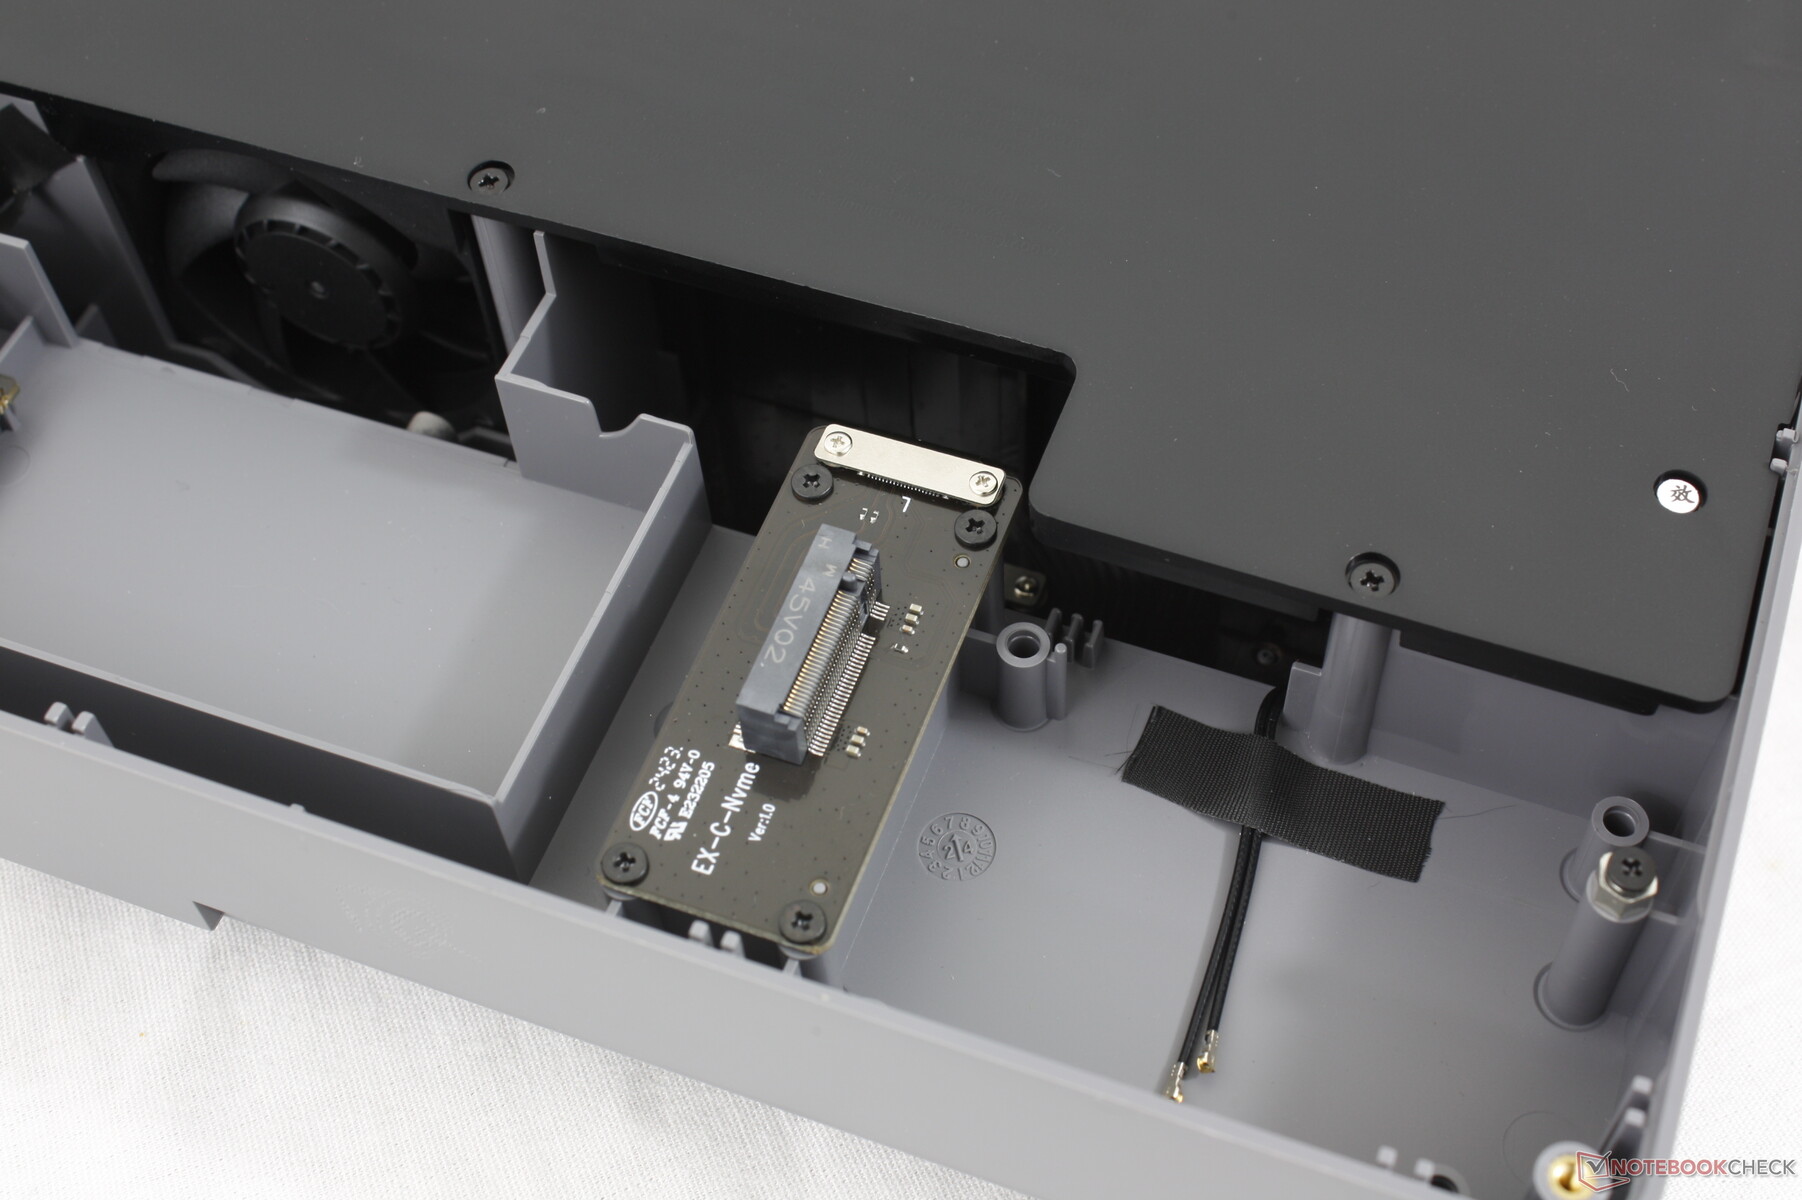
Die EX-Dockingstation enthält zwei 6+2-polige Stromkabel sowie zwei kleine Platten zur Befestigung der GPU und des Mini-PCs an der Dockingstation. Der M.2-Wi-Fi-Steckplatz und die Antenne sind optional für diejenigen, die ein WLAN-Modul auf der Dockingstation anstatt im Mini-PC installieren möchten. Praktisch alle Mini-PCs sind mit integriertem WLAN ausgestattet, sodass dieses spezielle Merkmal der Dockingstation von den meisten Benutzern ignoriert werden kann.

Performance
Testbedingungen
Wir haben Windows auf den Performance-Modus eingestellt, bevor wir die folgenden Benchmarks durchgeführt haben.
Prozessor
Der Core i9-12900H liegt zwei bis drei Generationen hinter der aktuellen Raptor Lake-R-Serie zurück, und die Benchmark-Ergebnisse spiegeln dies wider. Der neuere Core i9-14900HX bietet beispielsweise fast die doppelte Multi-Thread-Leistung im Vergleich zu unserem Beelink-Gerät. Selbst günstigere Mini-PCs wie der Beelink SER7 bieten eine nahezu identische Prozessorleistung.
Für das Modell GTI14 sind neuere Meteor Lake Core Ultra-Prozessoroptionen verfügbar.
Cinebench R15 Multi Dauertest
Cinebench R23: Multi Core | Single Core
Cinebench R20: CPU (Multi Core) | CPU (Single Core)
Cinebench R15: CPU Multi 64Bit | CPU Single 64Bit
Blender: v2.79 BMW27 CPU
7-Zip 18.03: 7z b 4 | 7z b 4 -mmt1
Geekbench 6.5: Multi-Core | Single-Core
Geekbench 5.5: Multi-Core | Single-Core
HWBOT x265 Benchmark v2.2: 4k Preset
LibreOffice : 20 Documents To PDF
R Benchmark 2.5: Overall mean
* ... kleinere Werte sind besser
AIDA64: FP32 Ray-Trace | FPU Julia | CPU SHA3 | CPU Queen | FPU SinJulia | FPU Mandel | CPU AES | CPU ZLib | FP64 Ray-Trace | CPU PhotoWorxx
| Performance Rating | |
| Minisforum MS-A1 | |
| Geekom AX8 Pro | |
| Asus ROG NUC 14-90AS0051 | |
| Beelink GTI12 Ultra EX Docking Station | |
| Asus NUC 14 Pro | |
| Durchschnittliche Intel Core i9-12900H | |
| GMK NucBox K9 | |
| AIDA64 / FP32 Ray-Trace | |
| Minisforum MS-A1 | |
| Geekom AX8 Pro | |
| Asus ROG NUC 14-90AS0051 | |
| Beelink GTI12 Ultra EX Docking Station | |
| Asus NUC 14 Pro | |
| Durchschnittliche Intel Core i9-12900H (4074 - 18289, n=28) | |
| GMK NucBox K9 | |
| AIDA64 / FPU Julia | |
| Minisforum MS-A1 | |
| Geekom AX8 Pro | |
| Asus ROG NUC 14-90AS0051 | |
| Beelink GTI12 Ultra EX Docking Station | |
| Asus NUC 14 Pro | |
| GMK NucBox K9 | |
| Durchschnittliche Intel Core i9-12900H (22307 - 93236, n=28) | |
| AIDA64 / CPU SHA3 | |
| Minisforum MS-A1 | |
| Geekom AX8 Pro | |
| Asus ROG NUC 14-90AS0051 | |
| Beelink GTI12 Ultra EX Docking Station | |
| Asus NUC 14 Pro | |
| Durchschnittliche Intel Core i9-12900H (1378 - 4215, n=28) | |
| GMK NucBox K9 | |
| AIDA64 / CPU Queen | |
| Minisforum MS-A1 | |
| Geekom AX8 Pro | |
| Durchschnittliche Intel Core i9-12900H (78172 - 111241, n=28) | |
| Beelink GTI12 Ultra EX Docking Station | |
| Asus ROG NUC 14-90AS0051 | |
| Asus NUC 14 Pro | |
| GMK NucBox K9 | |
| AIDA64 / FPU SinJulia | |
| Minisforum MS-A1 | |
| Geekom AX8 Pro | |
| Asus ROG NUC 14-90AS0051 | |
| Beelink GTI12 Ultra EX Docking Station | |
| Durchschnittliche Intel Core i9-12900H (5709 - 10410, n=28) | |
| Asus NUC 14 Pro | |
| GMK NucBox K9 | |
| AIDA64 / FPU Mandel | |
| Minisforum MS-A1 | |
| Geekom AX8 Pro | |
| Asus ROG NUC 14-90AS0051 | |
| Beelink GTI12 Ultra EX Docking Station | |
| Asus NUC 14 Pro | |
| Durchschnittliche Intel Core i9-12900H (11257 - 45581, n=28) | |
| GMK NucBox K9 | |
| AIDA64 / CPU AES | |
| Minisforum MS-A1 | |
| Geekom AX8 Pro | |
| GMK NucBox K9 | |
| Asus ROG NUC 14-90AS0051 | |
| Durchschnittliche Intel Core i9-12900H (31935 - 151546, n=28) | |
| Beelink GTI12 Ultra EX Docking Station | |
| Asus NUC 14 Pro | |
| AIDA64 / CPU ZLib | |
| Asus ROG NUC 14-90AS0051 | |
| Minisforum MS-A1 | |
| Beelink GTI12 Ultra EX Docking Station | |
| Geekom AX8 Pro | |
| Asus NUC 14 Pro | |
| Durchschnittliche Intel Core i9-12900H (449 - 1193, n=28) | |
| GMK NucBox K9 | |
| AIDA64 / FP64 Ray-Trace | |
| Minisforum MS-A1 | |
| Geekom AX8 Pro | |
| Asus ROG NUC 14-90AS0051 | |
| Beelink GTI12 Ultra EX Docking Station | |
| Asus NUC 14 Pro | |
| Durchschnittliche Intel Core i9-12900H (2235 - 10511, n=28) | |
| GMK NucBox K9 | |
| AIDA64 / CPU PhotoWorxx | |
| Asus NUC 14 Pro | |
| GMK NucBox K9 | |
| Asus ROG NUC 14-90AS0051 | |
| Beelink GTI12 Ultra EX Docking Station | |
| Minisforum MS-A1 | |
| Geekom AX8 Pro | |
| Durchschnittliche Intel Core i9-12900H (20960 - 48269, n=29) | |
System Performance
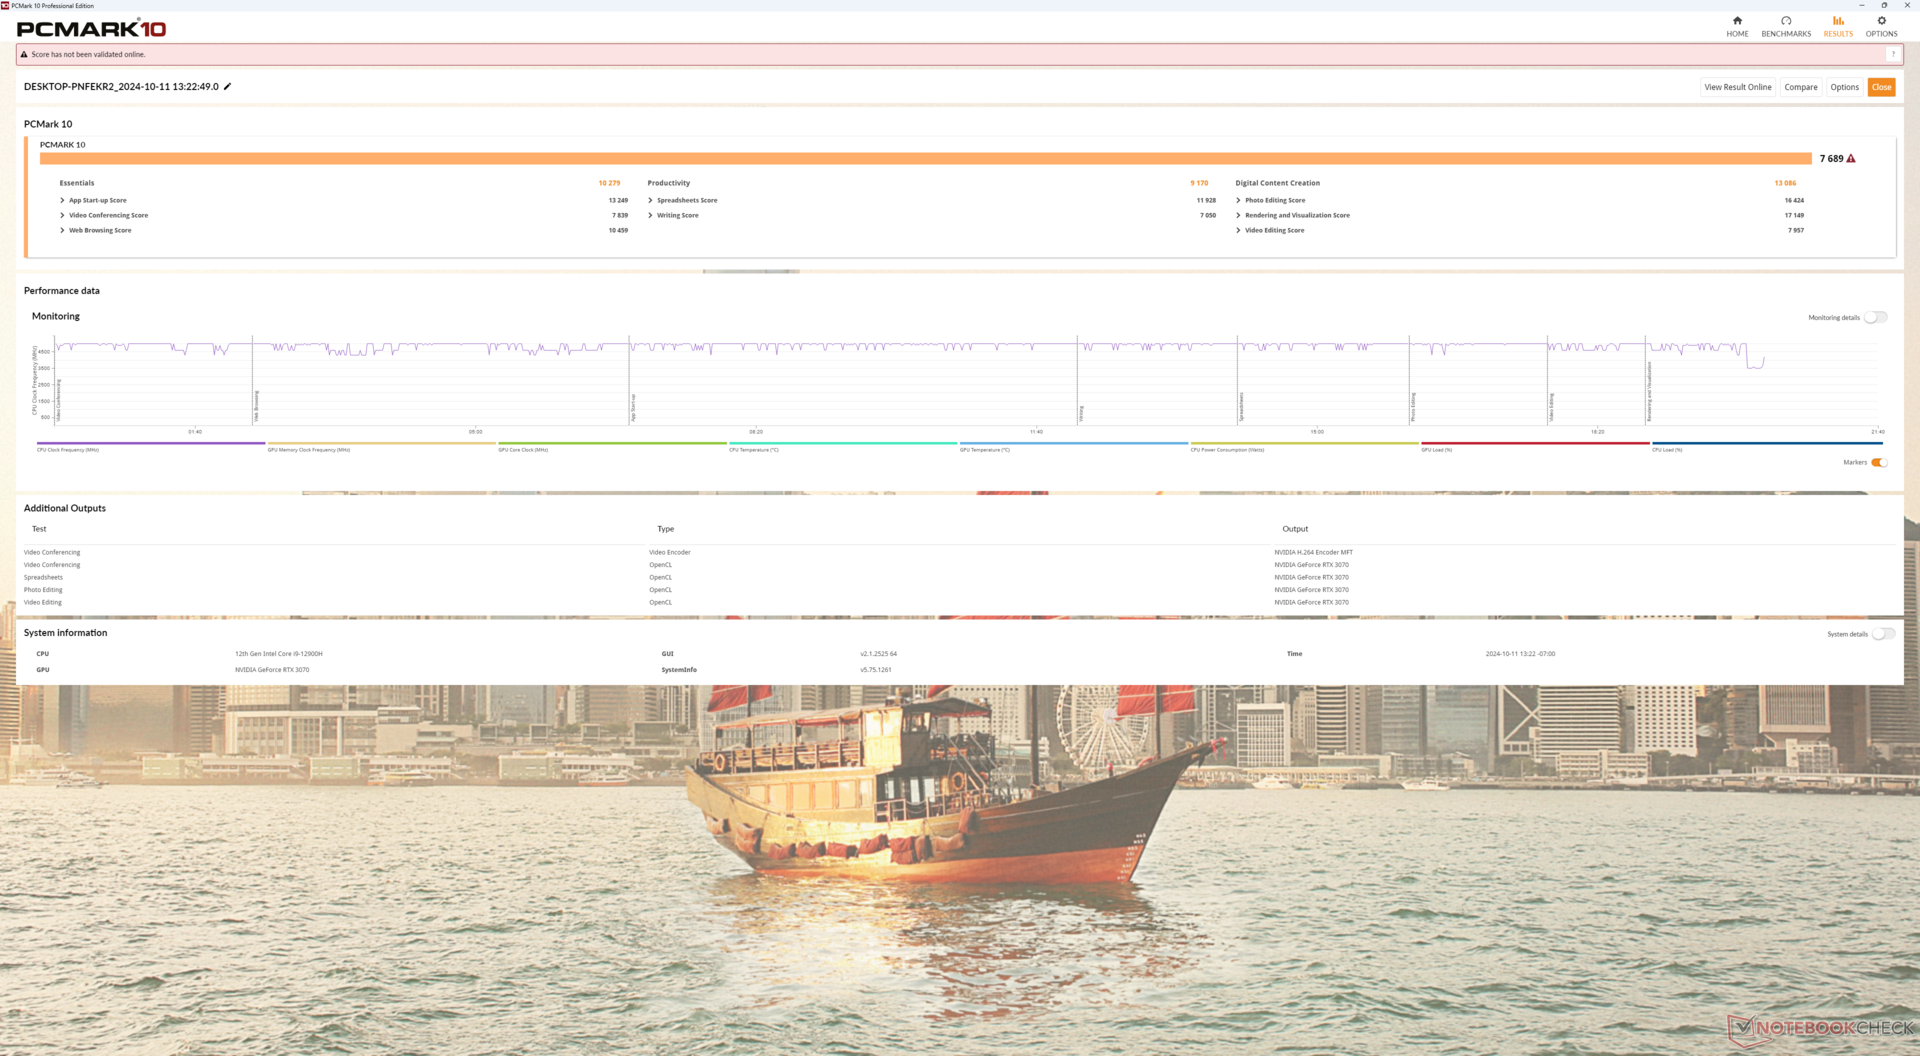
Die PCMark-Ergebnisse sind vergleichbar mit denen von Laptops und anderen Mini-PCs mit diskreter Grafik, einschließlich des Asus ROG NUC 14. Unser Produktivitätsergebnis ist jedoch relativ niedrig, was wahrscheinlich auf die ältere Intel-CPU der 12. Generation zurückzuführen ist.
CrossMark: Overall | Productivity | Creativity | Responsiveness
WebXPRT 3: Overall
WebXPRT 4: Overall
Mozilla Kraken 1.1: Total
* ... kleinere Werte sind besser
| PCMark 10 Score | 7689 Punkte | |
Hilfe | ||
| AIDA64 / Memory Copy | |
| Asus ROG NUC 14-90AS0051 | |
| Asus NUC 14 Pro | |
| Geekom AX8 Pro | |
| GMK NucBox K9 | |
| Minisforum MS-A1 | |
| Beelink GTI12 Ultra EX Docking Station | |
| Durchschnittliche Intel Core i9-12900H (34438 - 74264, n=28) | |
| AIDA64 / Memory Read | |
| Asus NUC 14 Pro | |
| Asus ROG NUC 14-90AS0051 | |
| GMK NucBox K9 | |
| Beelink GTI12 Ultra EX Docking Station | |
| Durchschnittliche Intel Core i9-12900H (36365 - 74642, n=28) | |
| Geekom AX8 Pro | |
| Minisforum MS-A1 | |
| AIDA64 / Memory Write | |
| Geekom AX8 Pro | |
| Minisforum MS-A1 | |
| Asus NUC 14 Pro | |
| GMK NucBox K9 | |
| Asus ROG NUC 14-90AS0051 | |
| Beelink GTI12 Ultra EX Docking Station | |
| Durchschnittliche Intel Core i9-12900H (32276 - 67858, n=28) | |
| AIDA64 / Memory Latency | |
| Asus ROG NUC 14-90AS0051 | |
| GMK NucBox K9 | |
| Asus NUC 14 Pro | |
| Geekom AX8 Pro | |
| Beelink GTI12 Ultra EX Docking Station | |
| Minisforum MS-A1 | |
| Durchschnittliche Intel Core i9-12900H (74.7 - 118.1, n=27) | |
* ... kleinere Werte sind besser
DPC-Latenzen
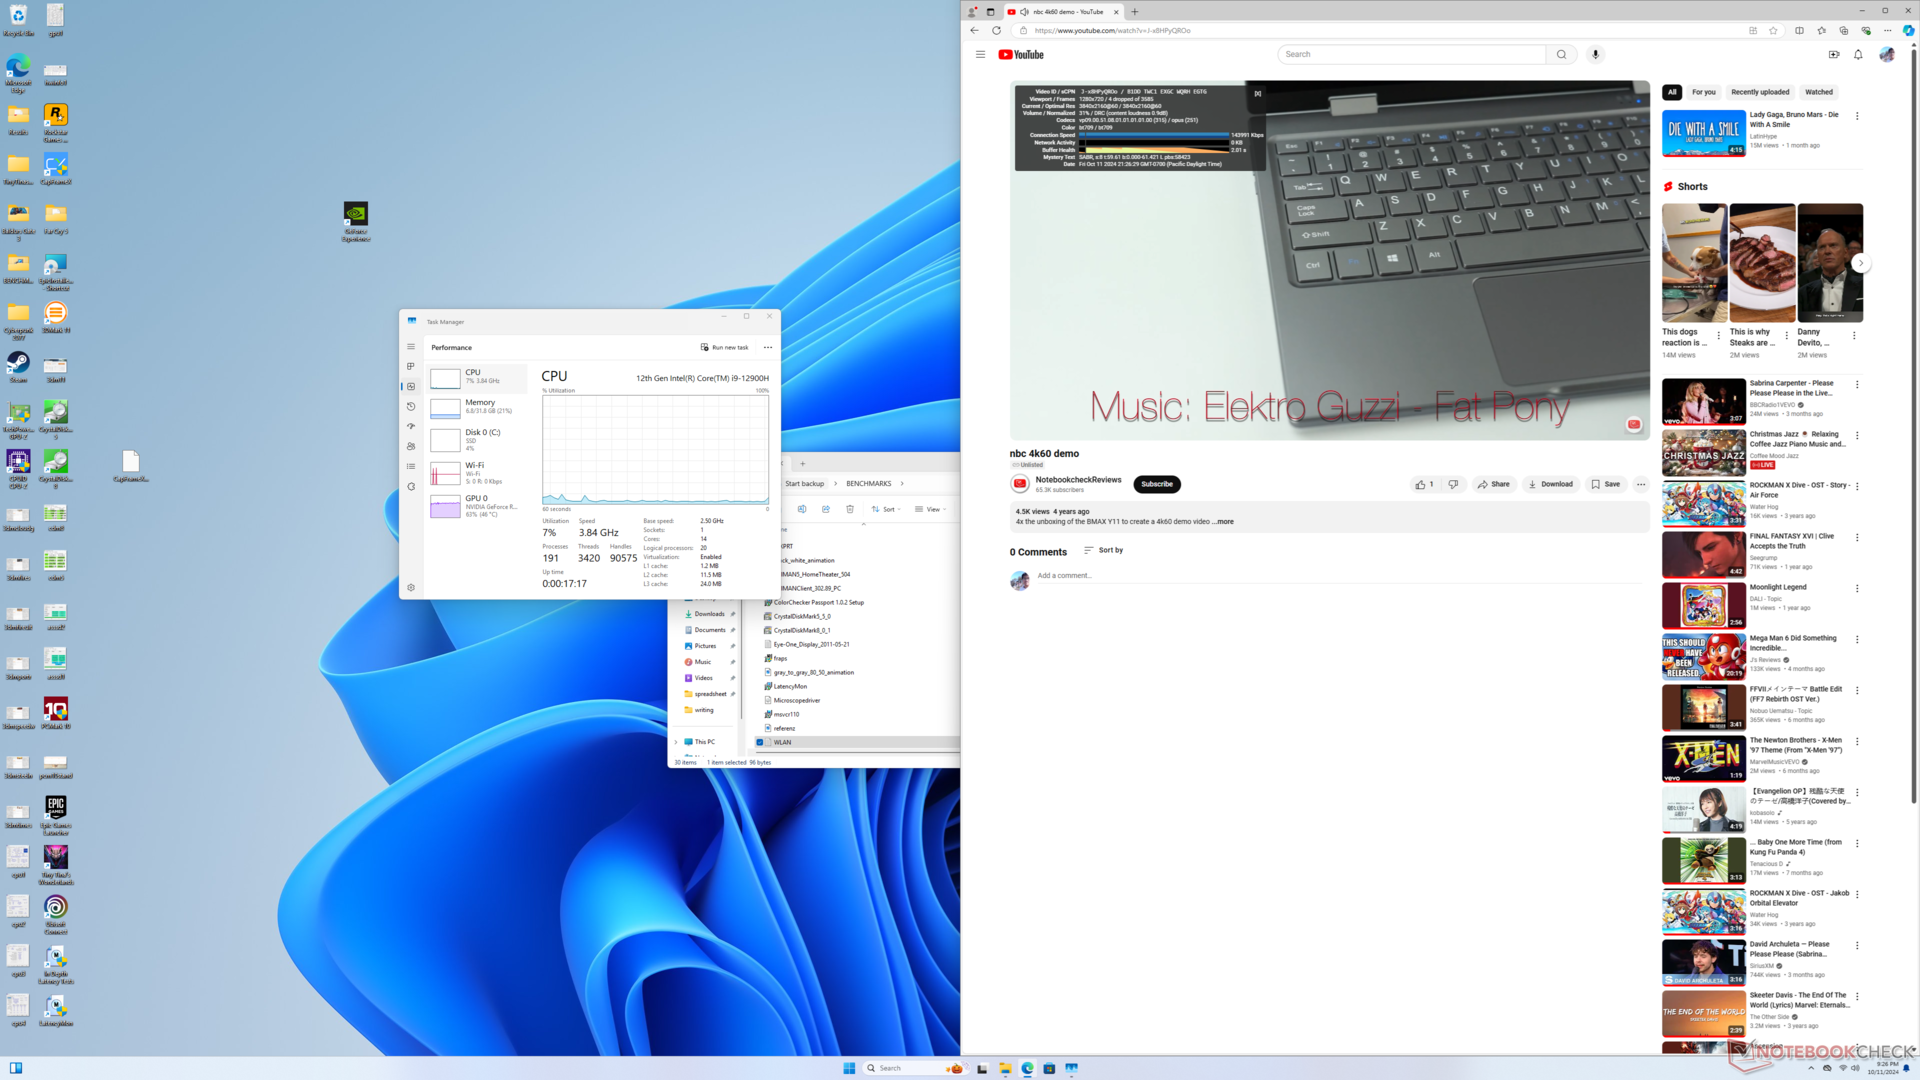
Die 4K-Videowiedergabe bei 60 FPS ist nahezu perfekt. Seltsamerweise gibt es immer ein paar Bildaussetzer direkt nach dem Drücken der Wiedergabetaste, was wir normalerweise auf anderen PCs nicht erleben. Abgesehen davon treten während des restlichen Testvideos keine übersprungenen Frames auf.
LatencyMon ist mit der aktuellen Version des Systems nicht kompatibel.
Massenspeicher
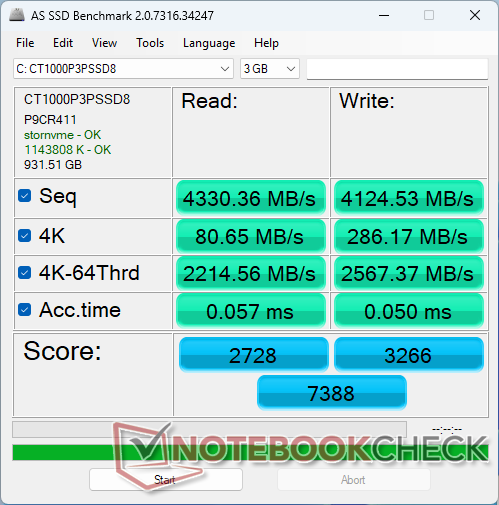
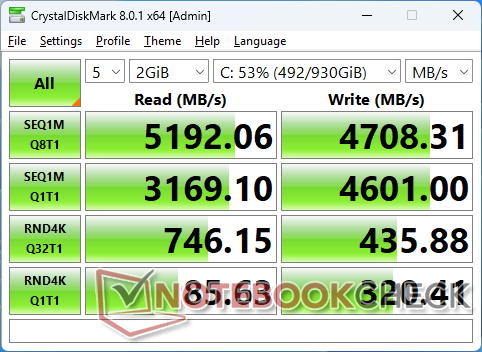
Unser Gerät ist mit einer 1 TB Crucial P3 Plus SSD ausgestattet. Die maximalen Übertragungsraten erreichen 5200 MB/s, fallen jedoch nach ein paar Minuten Belastung auf 4800 MB/s. Zum Vergleich kann die schnellere Samsung PM9A1 im Asus NUC 14 eine Geschwindigkeit von 6700 MB/s aufrechterhalten.

| Drive Performance Rating - Percent | |
| Beelink GTI12 Ultra EX Docking Station | |
| GMK NucBox K9 | |
| Minisforum MS-A1 | |
| Geekom AX8 Pro | |
| Asus ROG NUC 14-90AS0051 | |
| Asus NUC 14 Pro | |
* ... kleinere Werte sind besser
Dauerleistung Lesen: DiskSpd Read Loop, Queue Depth 8
GPU Performance
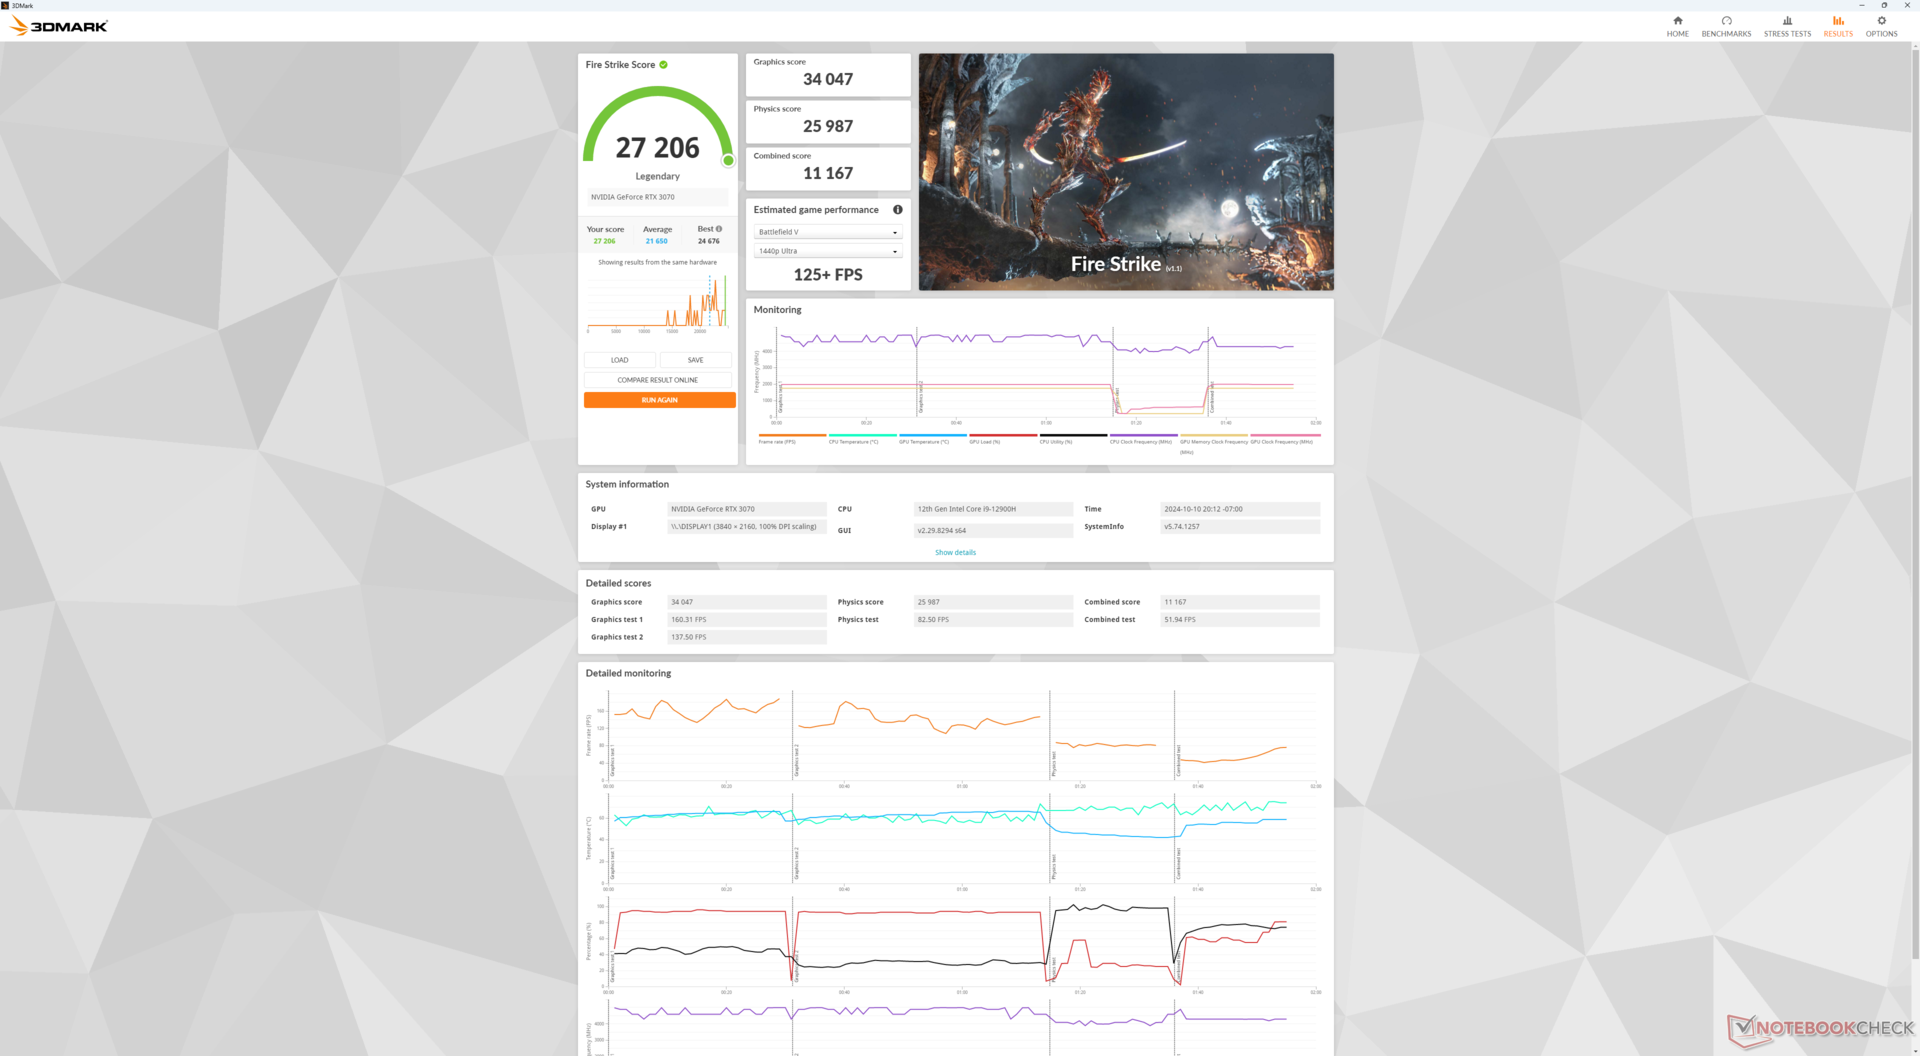
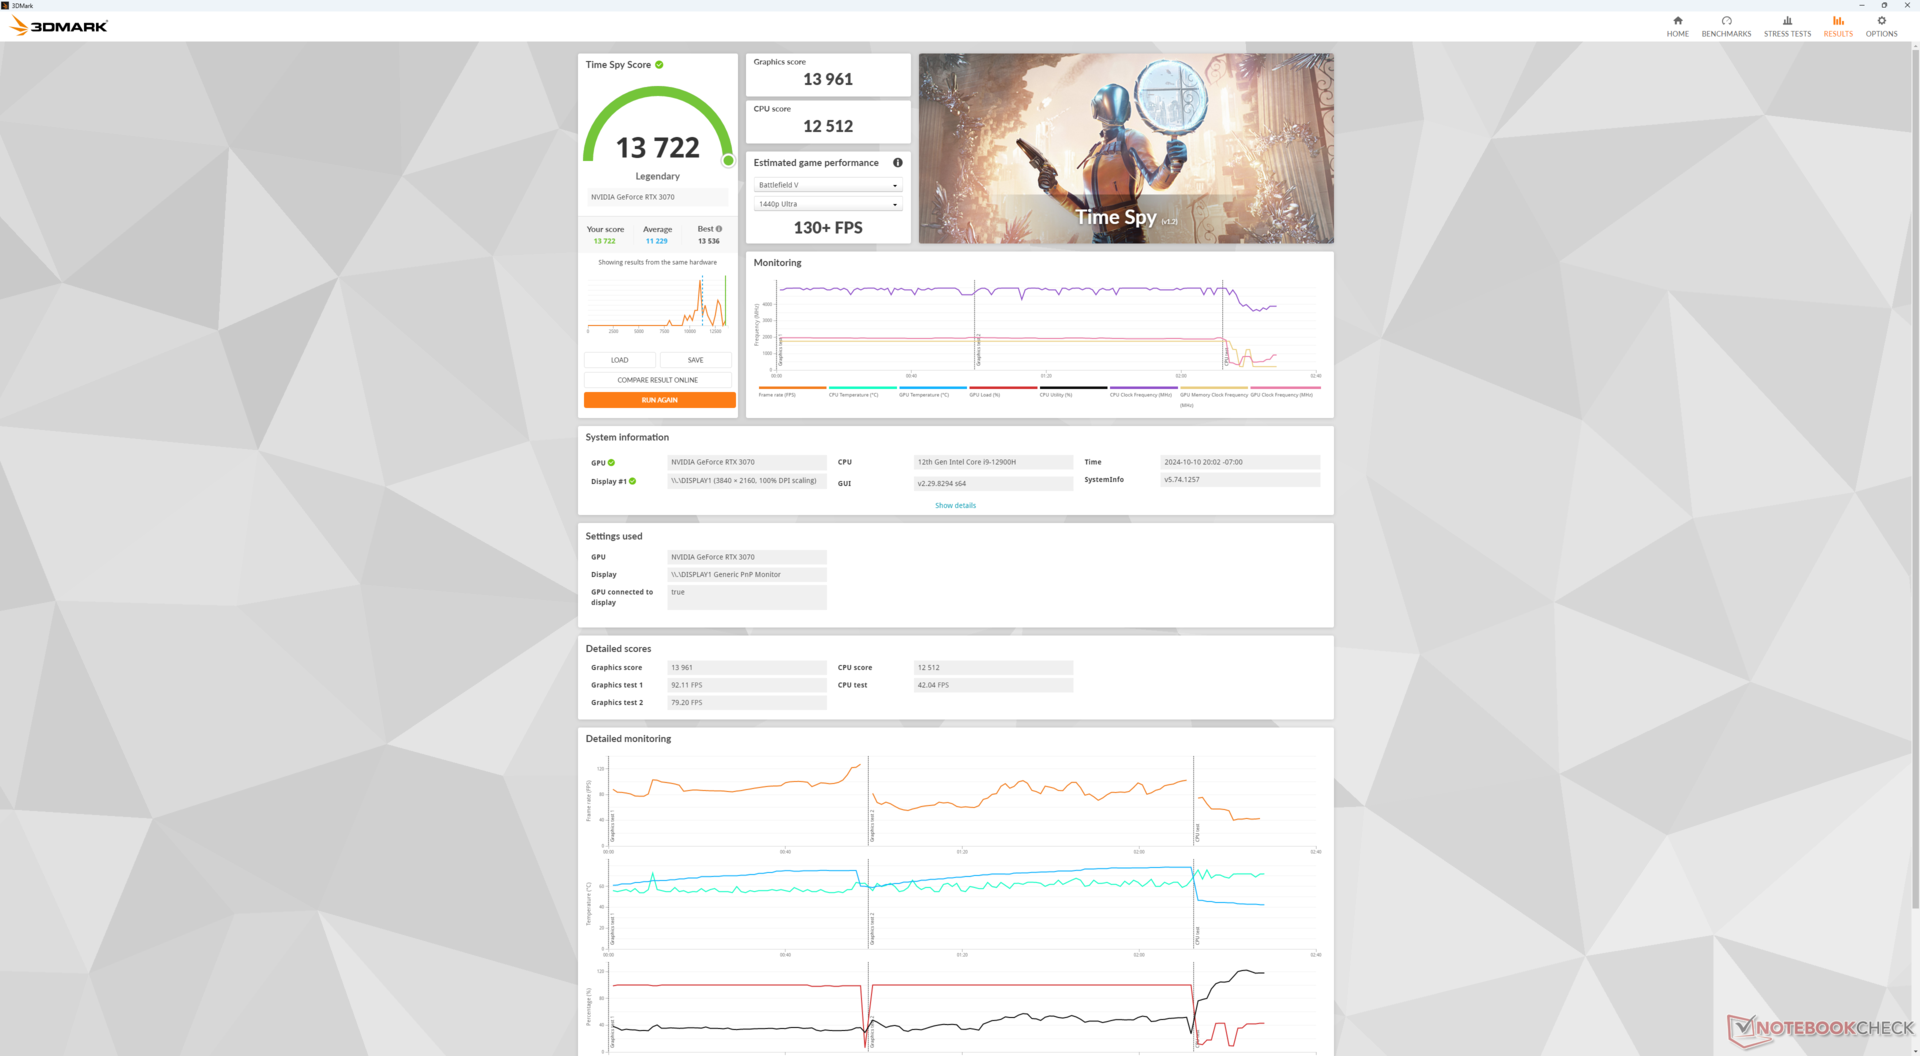
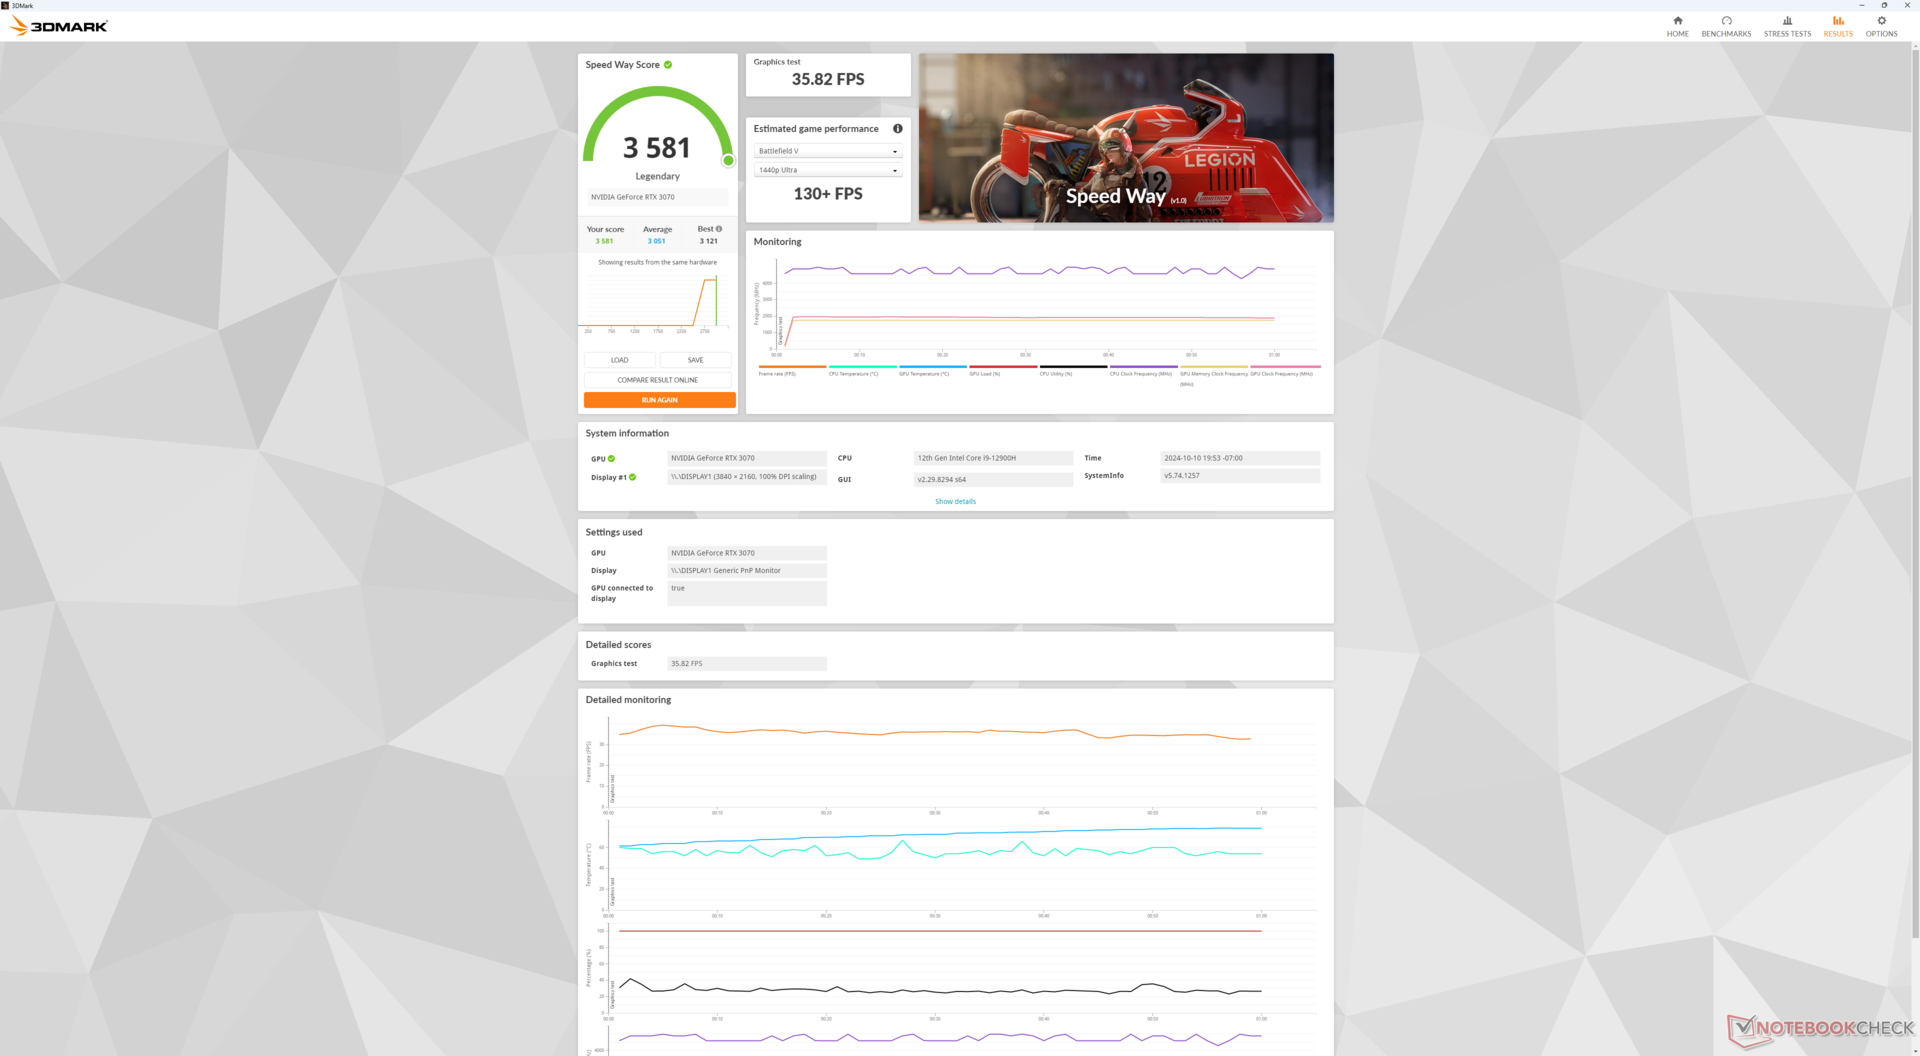
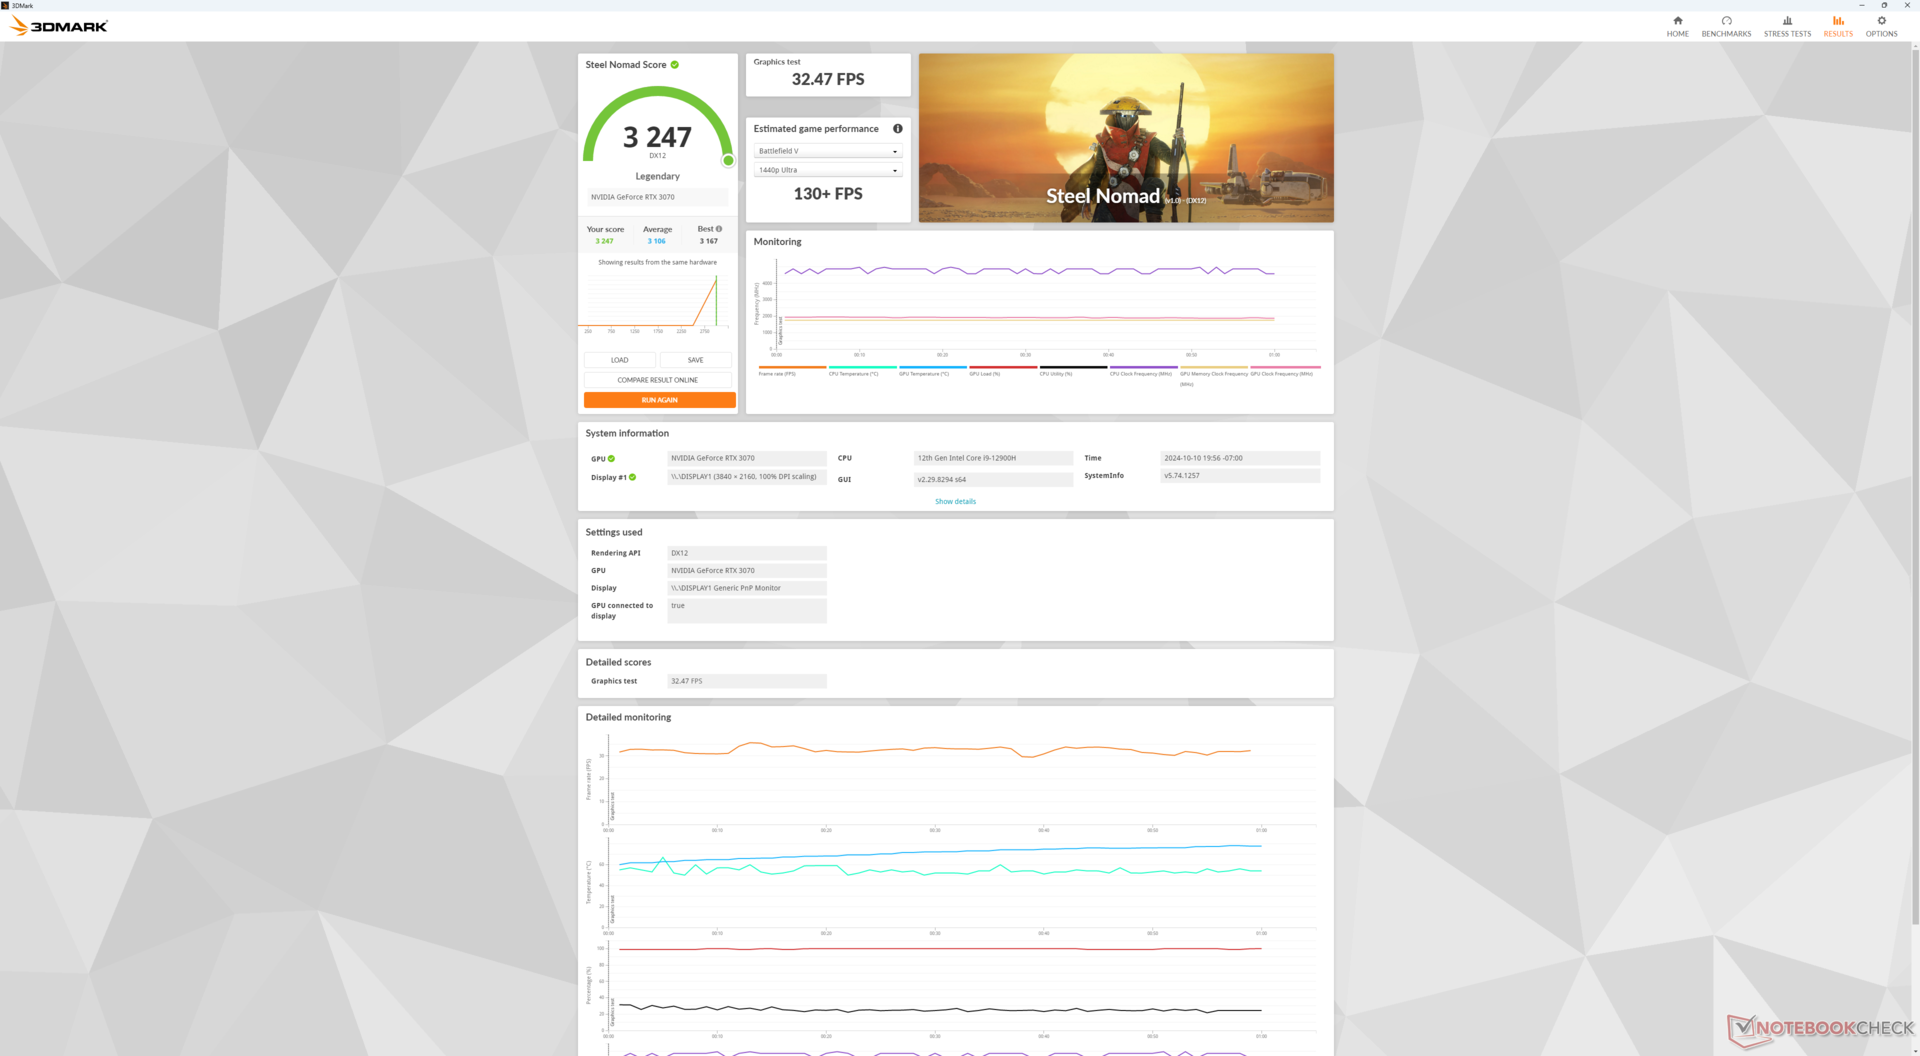
Die GeForce RTX 3070 wurde ausgiebig getestet, sodass ihre Leistung keine Überraschungen bietet. Unser Interesse gilt stattdessen möglichen Leistungsdefiziten, die unsere angedockte RTX 3070 im Vergleich zu einem „richtigen“ Desktop-PC mit derselben GPU aufweisen könnte. In diesem Fall liegt die Leistung im Wesentlichen auf dem Niveau unseres Referenz-Desktop-RTX-3070-PCs oder ist sogar ein paar Prozentpunkte schneller, sodass keine spürbaren Leistungseinbußen auftreten. Natürlich können die Ergebnisse variieren, wenn deutlich schnellere GPUs wie die RTX 4090 installiert werden, da die PCIe-x8-Schnittstelle dann zu einem begrenzenden Faktor werden kann.
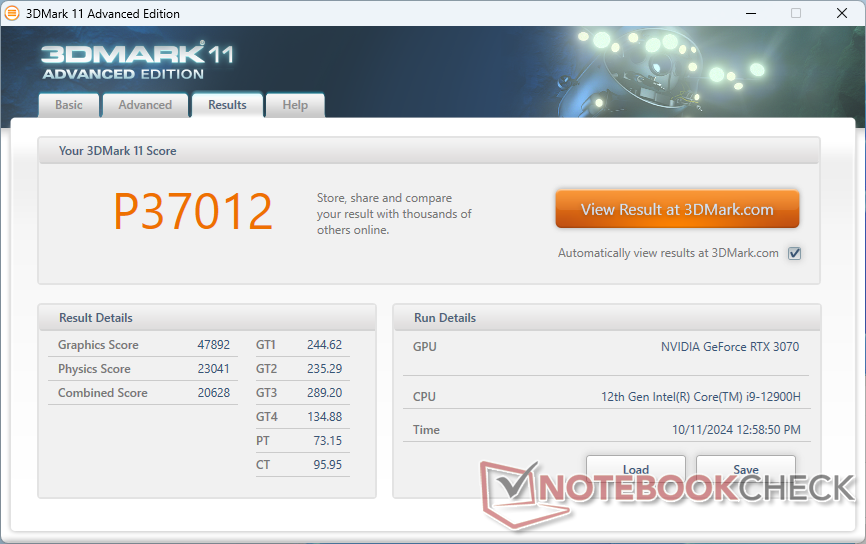
| 3DMark 11 Performance | 37012 Punkte | |
| 3DMark Cloud Gate Standard Score | 57634 Punkte | |
| 3DMark Fire Strike Score | 27206 Punkte | |
| 3DMark Time Spy Score | 13722 Punkte | |
| 3DMark Steel Nomad Score | 3247 Punkte | |
Hilfe | ||
* ... kleinere Werte sind besser
Gaming Performance
Trotz ihrer vier Jahre alten GPU ist die Desktop-Grafikkarte GeForce RTX 3070 immer noch leistungsstark, insbesondere im Vergleich zu Gaming-Laptops, bei denen der Leistungsumfang oft viel geringer ist. Unser GTI12 Ultra und die eGPU unserer Wahl können Laptops mit der GeForce RTX 4070, wie z. B. das Maingear ML-16 MK2, mühelos übertreffen und kommen in der Leistung sogar näher an die mobile RTX 4080 heran. Beachten Sie, dass dies vor der Berücksichtigung jeglicher DLSS-Upscaling-Methoden gilt, sodass die mobile RTX 40-Serie potenziell immer noch besser abschneiden kann, insbesondere wenn ein Titel DLSS 3 unterstützt.
| Baldur's Gate 3 - 1920x1080 Ultra Preset AA:T | |
| Beelink GTI12 Ultra EX Docking Station | |
| Asus ROG NUC 14-90AS0051 | |
| Minisforum G7 PT | |
| Acemagic M2A | |
| Asus TUF Gaming A14 FA401WV-WB94 | |
| Acemagic Tank03 | |
| Lenovo IdeaPad Pro 5 16IMH G9 RTX 4050 | |
Cyberpunk 2077 Ultra FPS-Diagramm
| min. | mittel | hoch | max. | QHD | 4K | |
|---|---|---|---|---|---|---|
| GTA V (2015) | 184.3 | 178.9 | 176.5 | 111.3 | 108.8 | 129 |
| Dota 2 Reborn (2015) | 175.9 | 162 | 158.5 | 149.3 | 144.3 | |
| Final Fantasy XV Benchmark (2018) | 209 | 184.8 | 138.7 | 104.9 | 61.5 | |
| X-Plane 11.11 (2018) | 118.2 | 106.1 | 89.5 | 79.4 | ||
| Far Cry 5 (2018) | 170 | 154 | 148 | 142 | 130 | 75 |
| Strange Brigade (2018) | 459 | 339 | 280 | 245 | 181.1 | 104.6 |
| Tiny Tina's Wonderlands (2022) | 268.9 | 216.7 | 154.9 | 122.6 | 87.1 | 48.9 |
| F1 22 (2022) | 282 | 277 | 264 | 91.8 | 58.8 | 28.8 |
| Baldur's Gate 3 (2023) | 174.5 | 152.6 | 137.1 | 132.9 | 93.5 | 49.7 |
| Cyberpunk 2077 (2023) | 148.5 | 133.9 | 115.3 | 102.2 | 65.7 | 29.9 |
Emissionen
Geräuschemissionen
Lüftergeräusche sind immer vorhanden, da der interne PSU-Lüfter im EX-Dock ständig aktiv ist, selbst wenn die Lüfter des Mini-PCs und der GPU inaktiv sind. Der Geräuschpegel ist im Allgemeinen lauter als bei den meisten anderen Mini-PCs, gemessen aus einem Abstand von 15 cm. Die Geräuschkurve ist jedoch breiter und nicht so scharf, wie wir es gewohnt sind. Die niedrigeren dB-Frequenzen sind weniger aufdringlich und erträglicher als die normalerweise schärferen und lauteren Lüfter von Gaming-Laptops.
Lautstärkediagramm
| Idle |
| 32.7 / 32.7 / 35.3 dB(A) |
| Last |
| 36.8 / 52.9 dB(A) |
 | ||
30 dB leise 40 dB(A) deutlich hörbar 50 dB(A) störend |
||
min: | ||
| Beelink GTI12 Ultra EX Docking Station GeForce RTX 3070, i9-12900H, Crucial P3 Plus CT1000P3PSSD8 | Minisforum MS-A1 Radeon 780M, R7 8700G, Kingston OM8PGP41024Q-A0 | GMK NucBox K9 Arc 7-Core, Ultra 5 125H, MasonSemi 1TB MC7000 | Asus NUC 14 Pro Arc 7-Core, Ultra 5 125H, Kingston KC3000 2048G SKC3000D2048G | Geekom AX8 Pro Radeon 780M, R9 8945HS, Acer N7000 2 TB | Asus ROG NUC 14-90AS0051 GeForce RTX 4070 Laptop GPU, Ultra 9 185H, Samsung PM9A1a MZVL21T0HDLU | |
|---|---|---|---|---|---|---|
| Geräuschentwicklung | 1% | 2% | 9% | 5% | 15% | |
| aus / Umgebung * (dB) | 22.8 | 24.8 -9% | 23 -1% | 24 -5% | 24.9 -9% | 24.9 -9% |
| Idle min * (dB) | 32.7 | 33.9 -4% | 29.8 9% | 26 20% | 24.9 24% | 24.9 24% |
| Idle avg * (dB) | 32.7 | 34 -4% | 35.7 -9% | 26.2 20% | 24.9 24% | 24.9 24% |
| Idle max * (dB) | 35.3 | 34 4% | 35.7 -1% | 26.2 26% | 24.9 29% | 24.9 29% |
| Last avg * (dB) | 36.8 | 41.1 -12% | 41.9 -14% | 42.4 -15% | 50.1 -36% | 37.9 -3% |
| Cyberpunk 2077 ultra * (dB) | 50.3 | 42.2 16% | 43.8 13% | 47.7 5% | 50 1% | 38.3 24% |
| Last max * (dB) | 52.9 | 46.2 13% | 44 17% | 47.8 10% | 50.2 5% | 44.2 16% |
* ... kleinere Werte sind besser
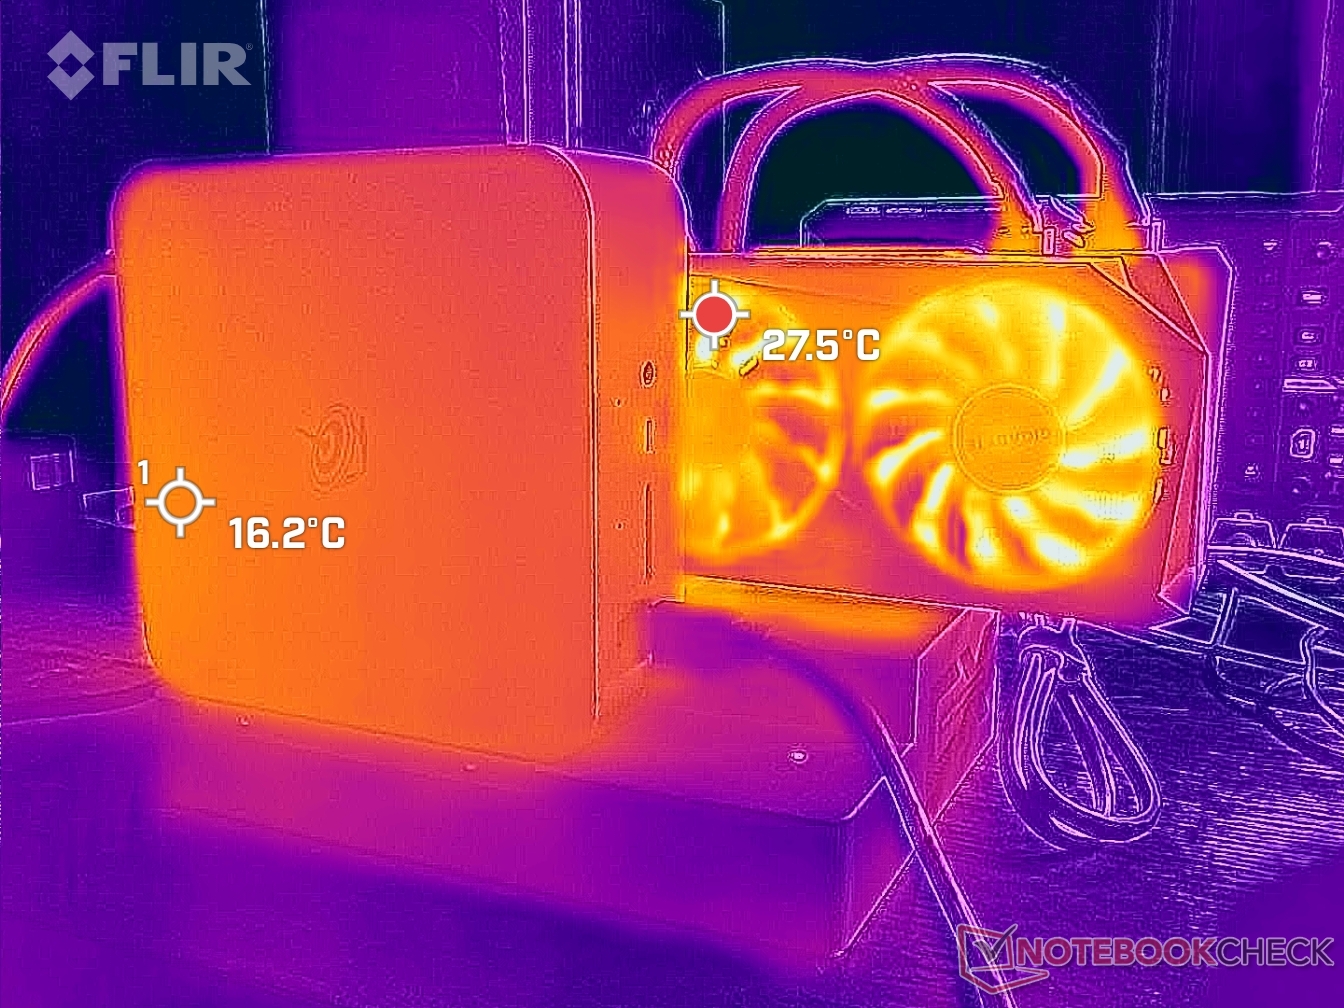
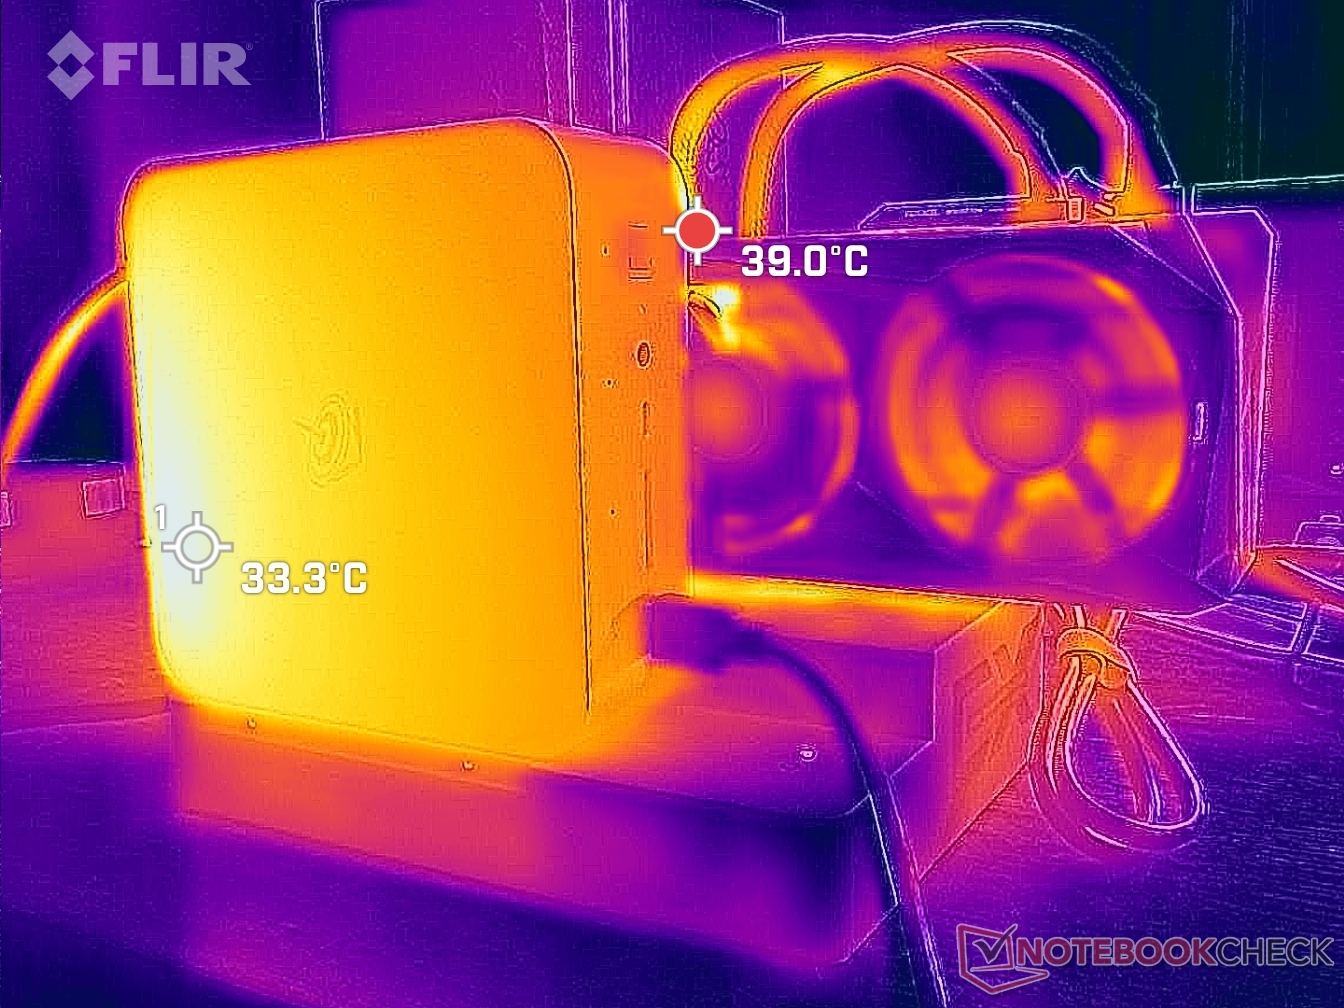
Temperatur
Die Oberseite des Mini-PCs kann beim Spielen etwa 34 °C erreichen und über 41 °C, wenn die CPU zu 100 Prozent ausgelastet ist. Damit ist sie wärmer als bei vielen anderen Mini-PCs. Dies liegt vor allem daran, dass das Gerät das gesamte Netzteil im Gehäuse integriert hat und keine Lüftungsgitter an den Seiten vorhanden sind.
Stresstest
Während des Prime95-Stresstests steigert die CPU ihre Frequenz auf 3,2 GHz und verbraucht dabei 69 W. Nach etwa ein bis zwei Minuten sinkt sie jedoch auf 2,9 GHz und 61 W, um eine angemessene Kerntemperatur von 78 °C aufrechtzuerhalten. Der maximale Turbo Boost ist trotz der großen Gehäusegröße leider nicht unbegrenzt, aber der Leistungsabfall bleibt zumindest relativ gering.
Beim Spielen stabilisiert sich die Kerntemperatur bei 83 °C, was für einen Mini-PC wärmer ist als erwartet.
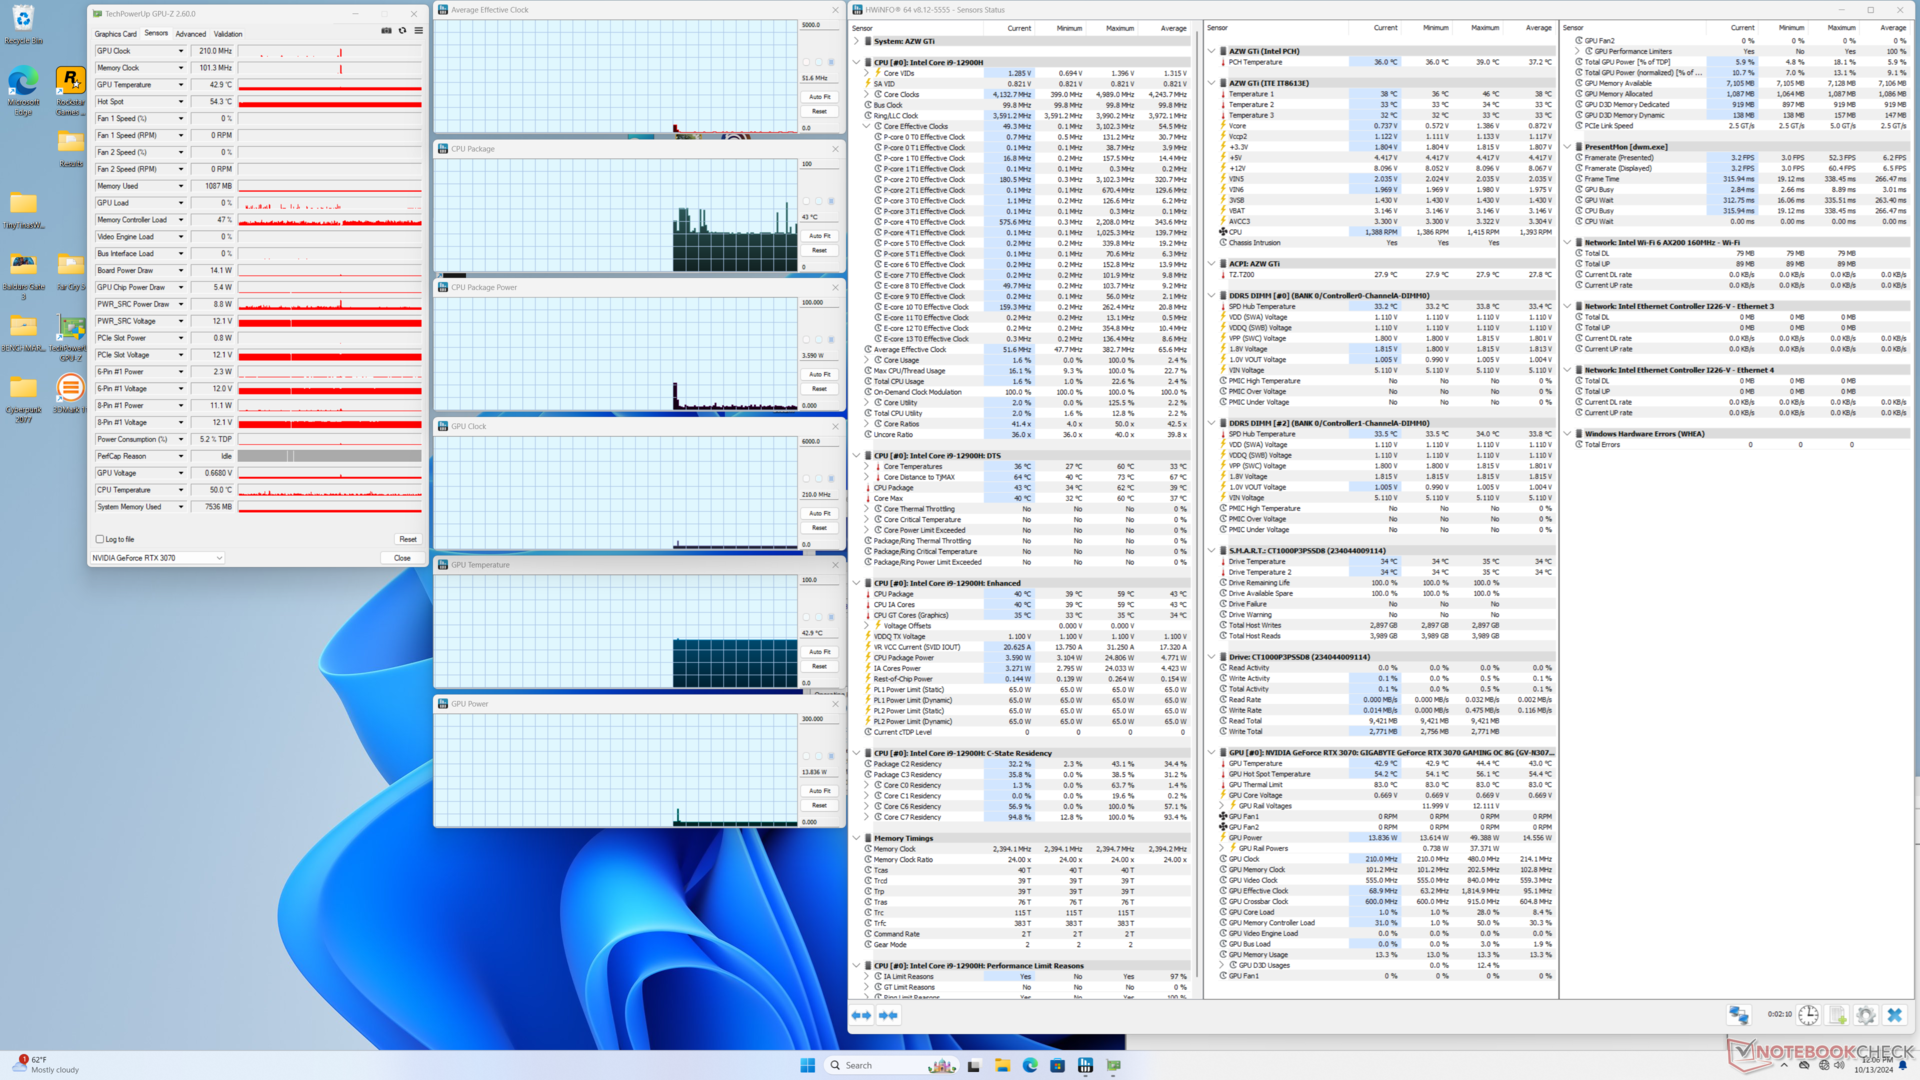
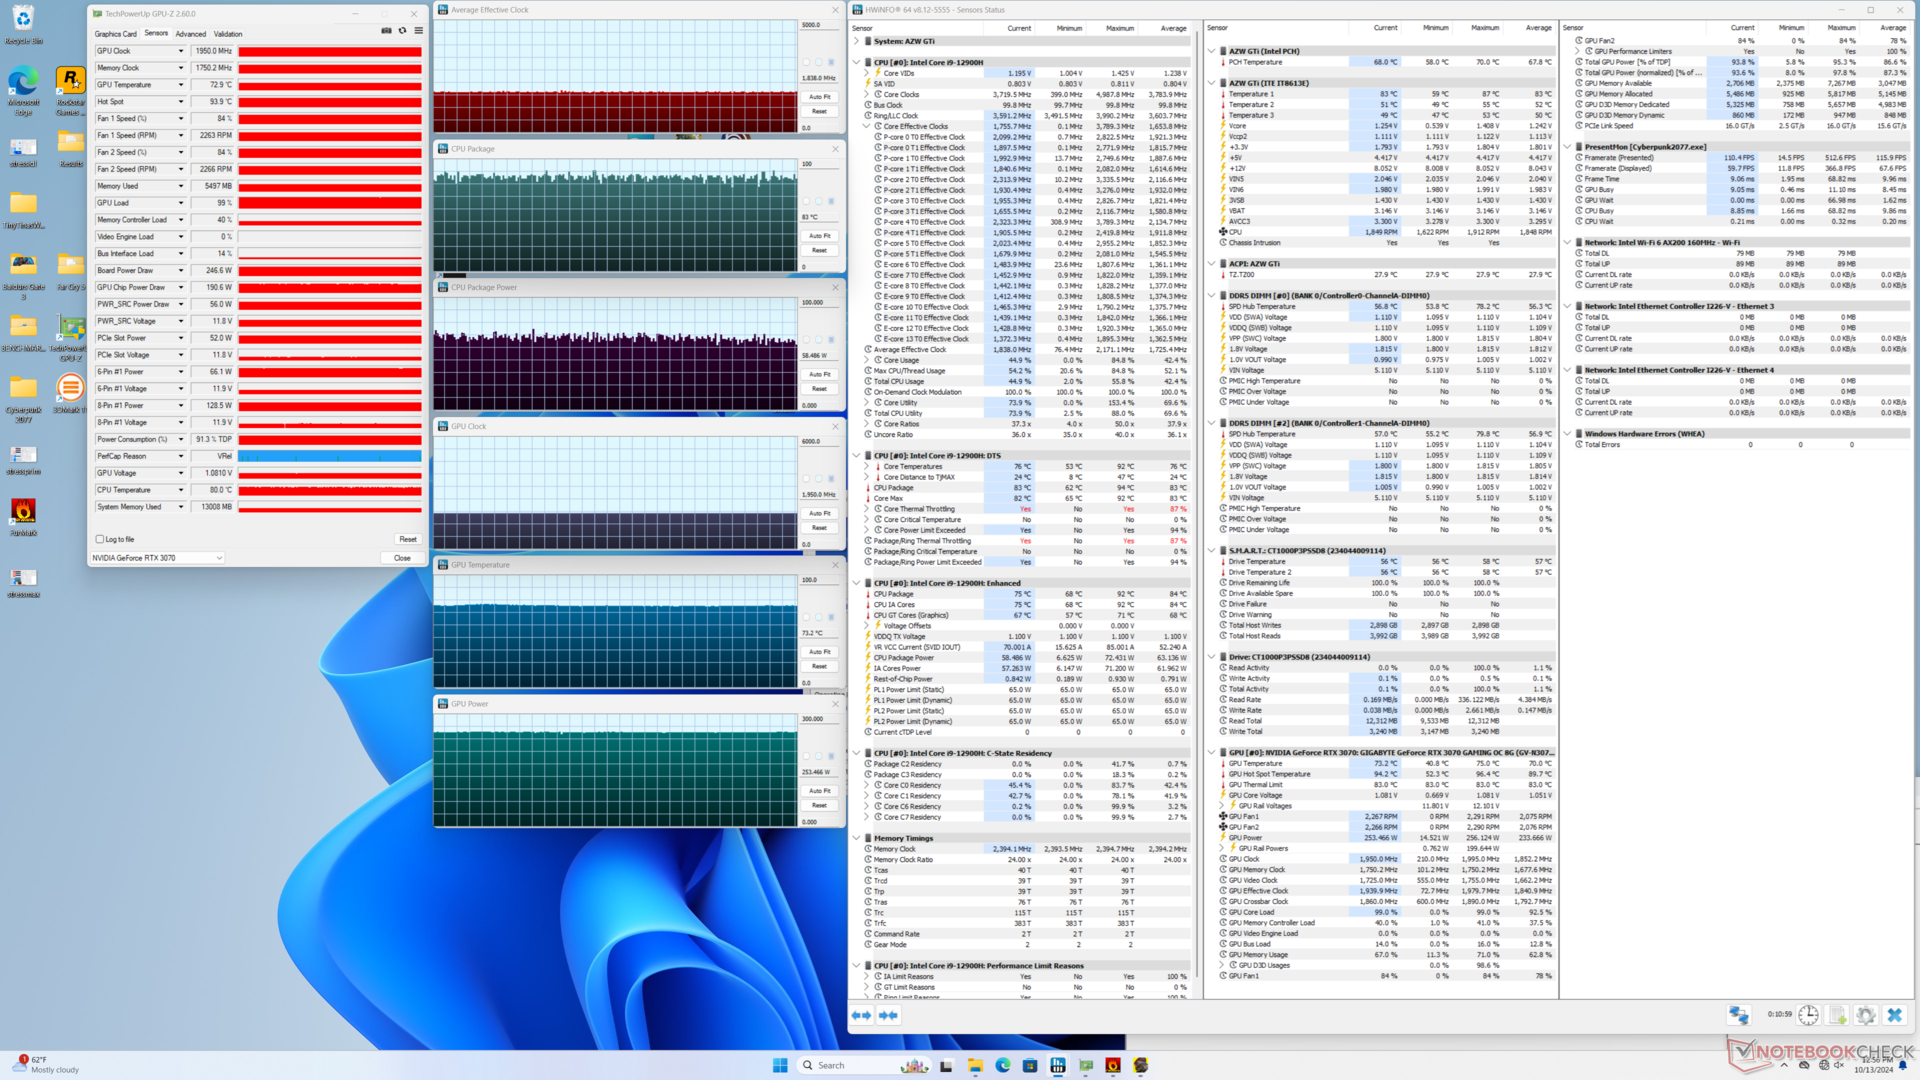
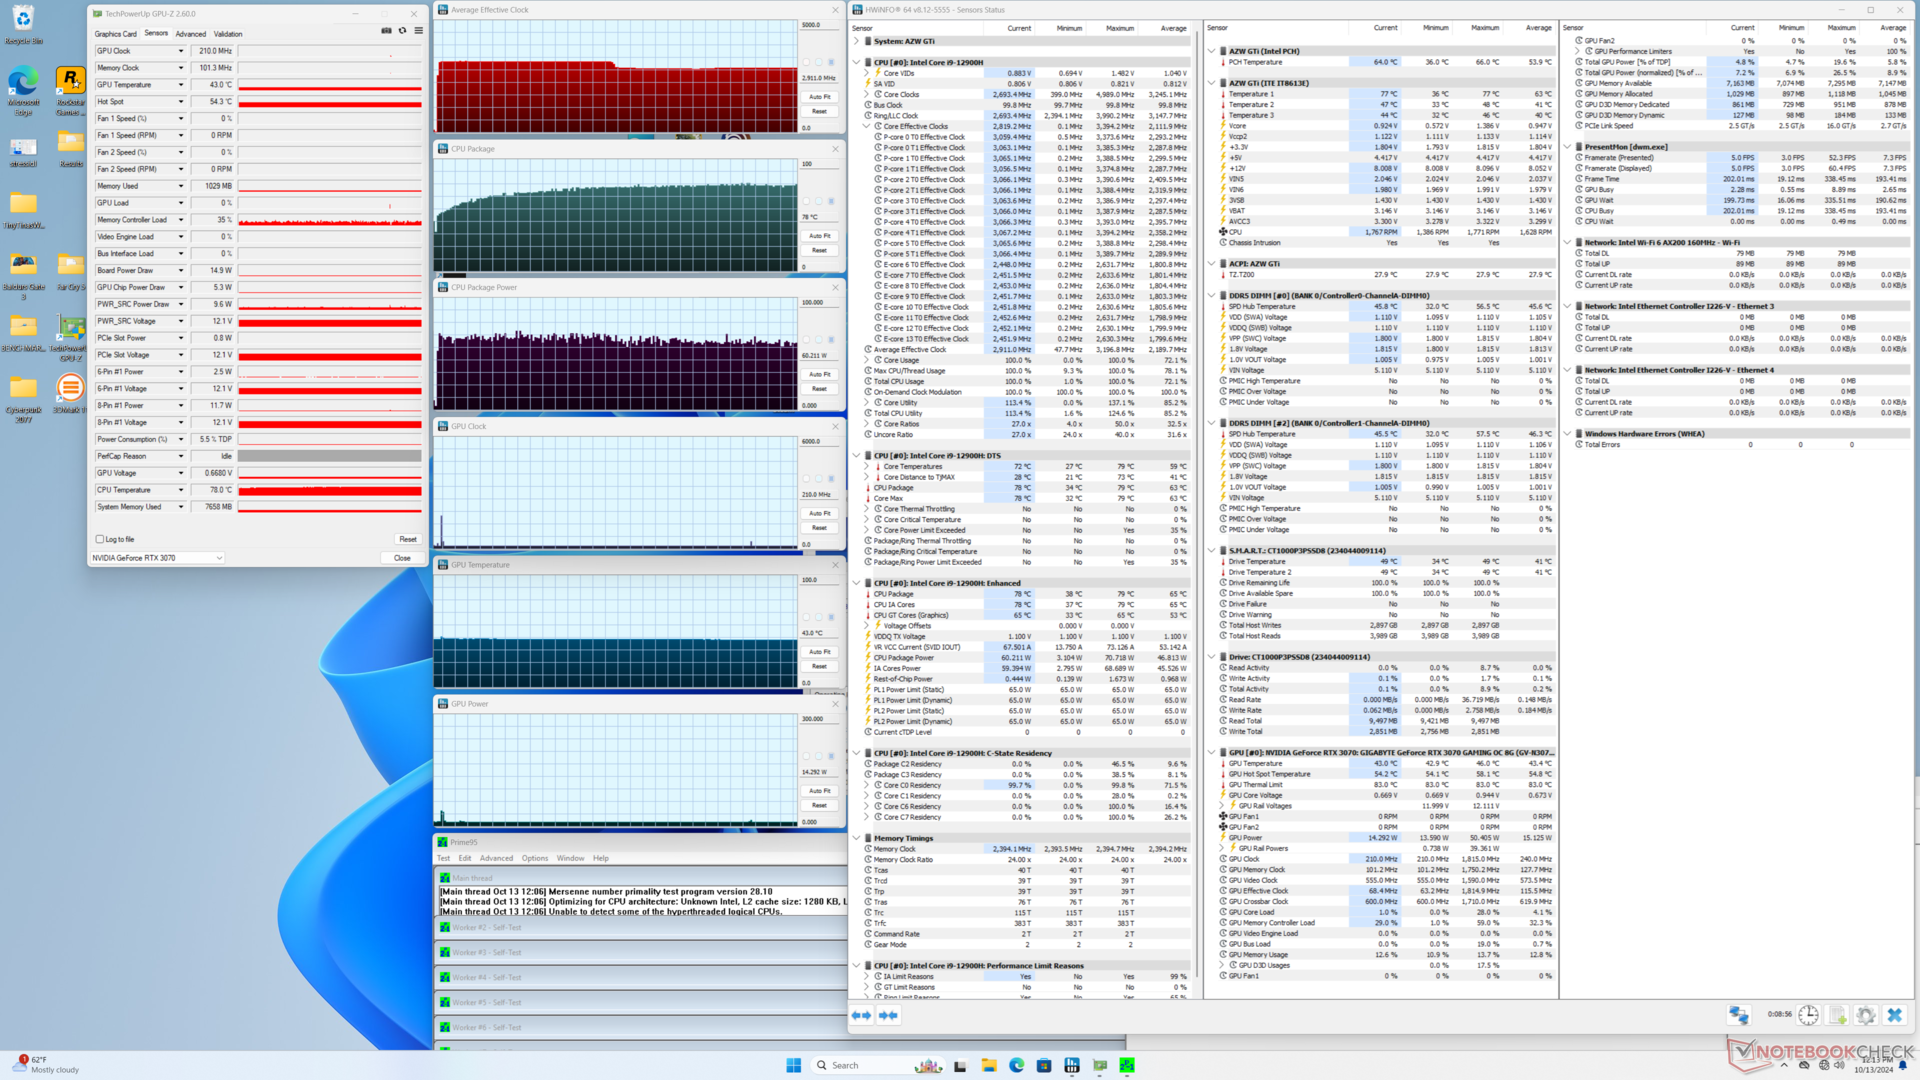
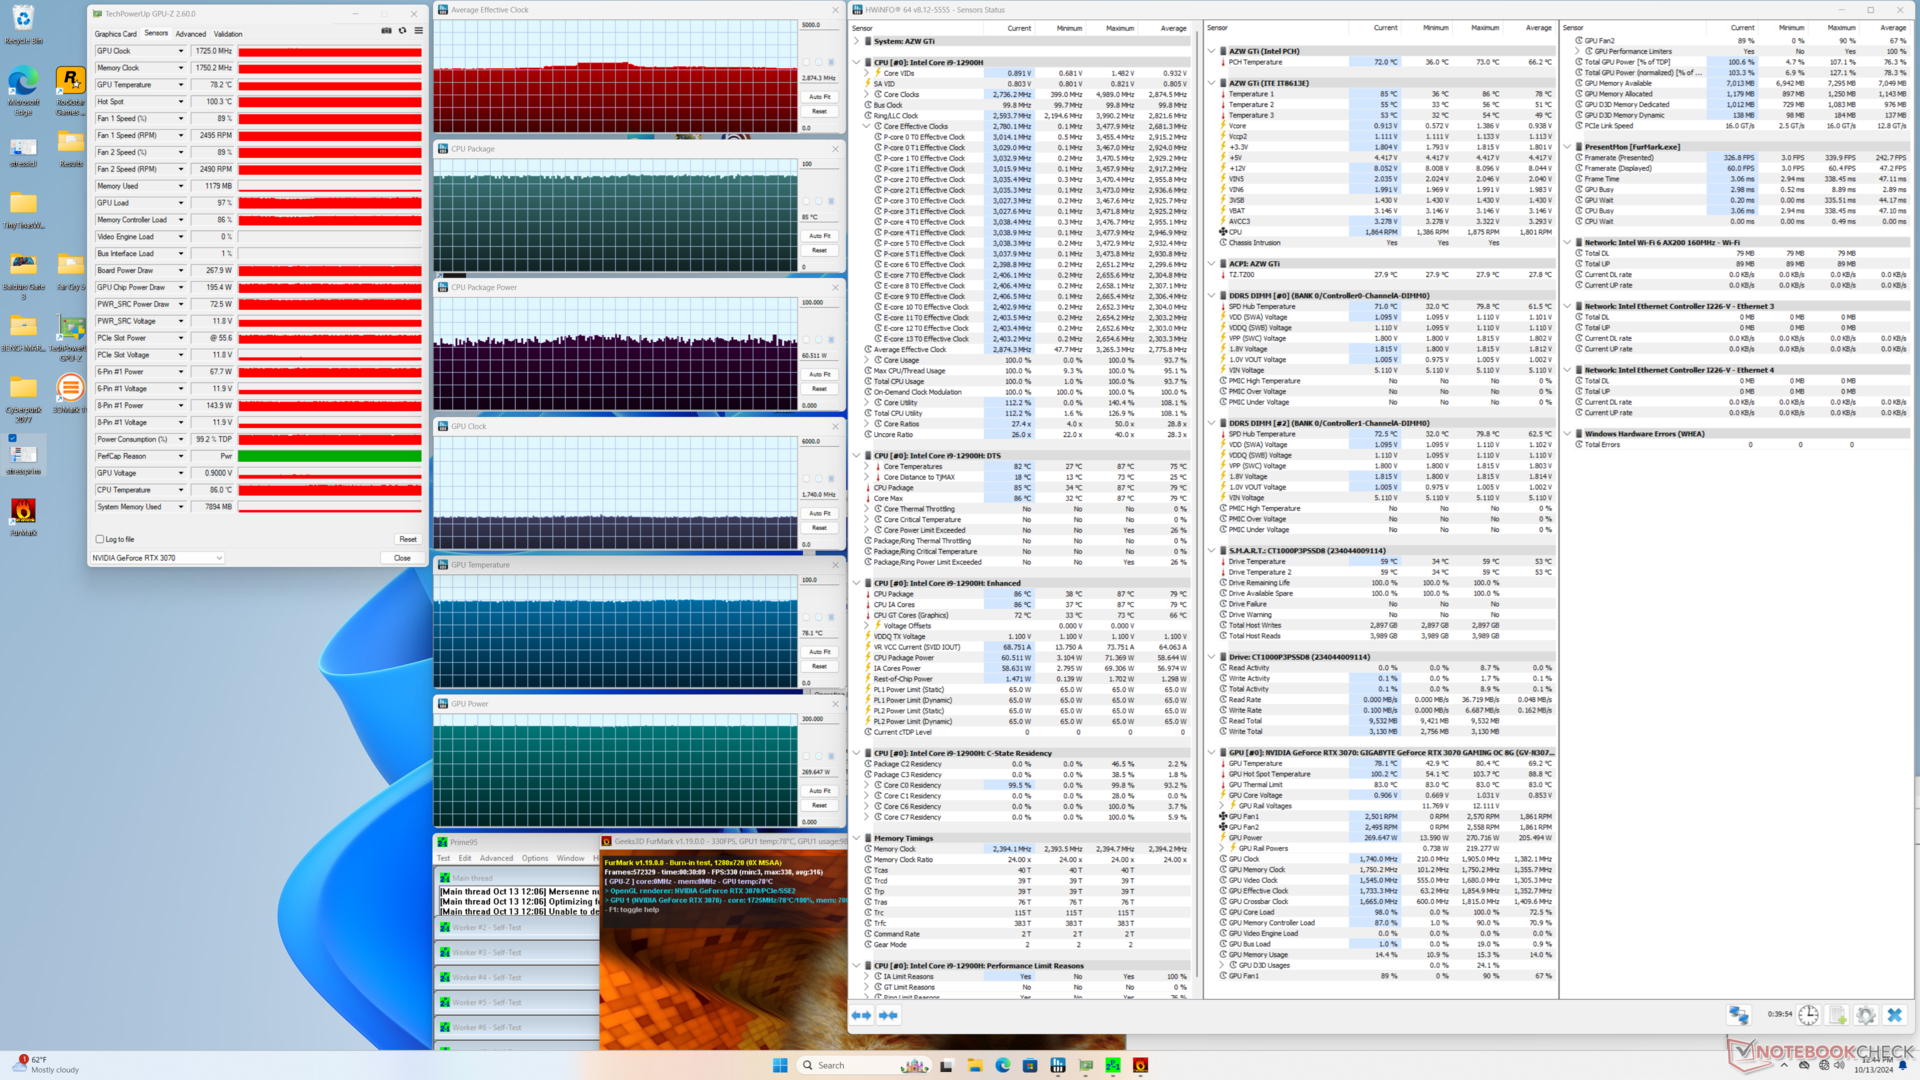
| Durchschnittlicher CPU-Takt (GHz) | GPU-Takt (MHz) | Durchschnittliche CPU-Temperatur (°C) | Durchschnittliche GPU Temperatur (°C) | |
| System im Leerlauf | -- | -- | 40 | 43 |
| Prime95 Stresstest | 2.9 | -- | 78 | 43 |
| Prime95 + FurMark Stresstest | 2.9 | 1725 | 85 | 78 |
| Cyberpunk 2077 Stresstest | 1.8 | 1950 | 83 | 73 |
Lautsprecher
Die internen Lautsprecher sind nicht besonders laut oder beeindruckend, wie wir es bei dem aktuellen Bosgame erlebt haben. Sie eignen sich eher für Zusatzfunktionen wie Konferenzen oder für kleine Räume, in denen die Audioqualität weniger wichtig ist. Für jede Art von Multimedia-Wiedergabe werden nach wie vor externe Lautsprecher empfohlen.
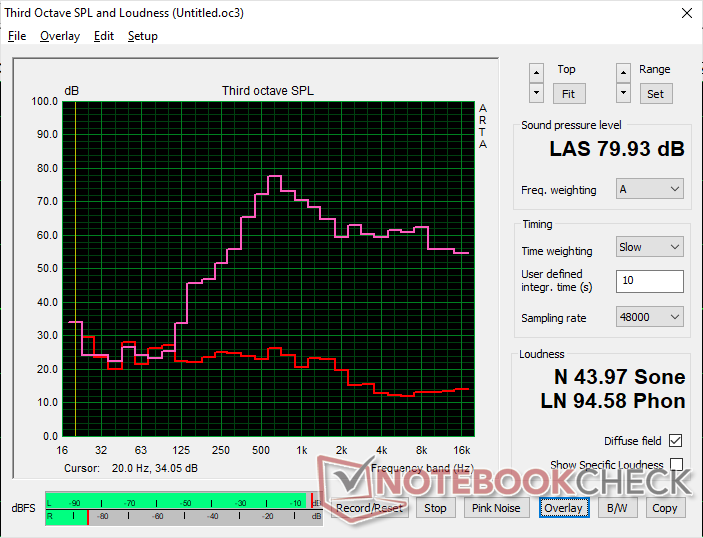
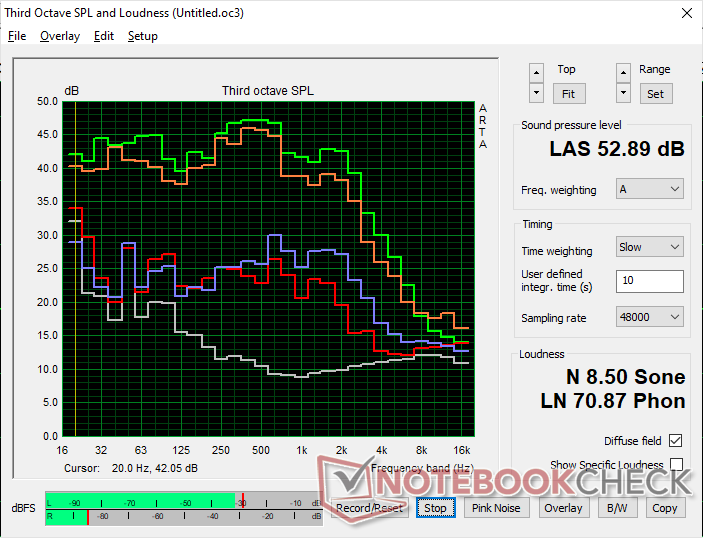
Beelink GTI12 Ultra EX Docking Station Audio Analyse
(±) | Mittelmäßig laut spielende Lautsprecher (79.9 dB)
Bass 100 - 315 Hz
(-) | kaum Bass - 17.1% niedriger als der Median
(±) | durchschnittlich lineare Bass-Wiedergabe (14.3% Delta zum Vorgänger)
Mitteltöne 400 - 2000 Hz
(±) | zu hohe Mitten, vom Median 8.9% abweichend
(±) | Linearität der Mitten ist durchschnittlich (13% Delta zum Vorgänger)
Hochtöne 2 - 16 kHz
(+) | ausgeglichene Hochtöne, vom Median nur 1.7% abweichend
(+) | sehr lineare Hochtöne (6.7% Delta zum Vorgänger)
Gesamt im hörbaren Bereich 100 - 16.000 Hz
(±) | hörbarer Bereich ist durchschnittlich linear (24.2% Abstand zum Median)
Im Vergleich zu allen Geräten derselben Klasse
» 60% aller getesteten Geräte dieser Klasse waren besser, 8% vergleichbar, 32% schlechter
» Das beste Gerät hat einen Delta-Wert von 13%, durchschnittlich ist 25%, das schlechteste Gerät hat 64%
Im Vergleich zu allen Geräten im Test
» 72% aller getesteten Geräte waren besser, 6% vergleichbar, 22% schlechter
» Das beste Gerät hat einen Delta-Wert von 4%, durchschnittlich ist 24%, das schlechteste Gerät hat 134%
Apple MacBook Pro 16 2021 M1 Pro Audio Analyse
(+) | Die Lautsprecher können relativ laut spielen (84.7 dB)
Bass 100 - 315 Hz
(+) | guter Bass - nur 3.8% Abweichung vom Median
(+) | lineare Bass-Wiedergabe (5.2% Delta zum Vorgänger)
Mitteltöne 400 - 2000 Hz
(+) | ausgeglichene Mitten, vom Median nur 1.3% abweichend
(+) | lineare Mitten (2.1% Delta zum Vorgänger)
Hochtöne 2 - 16 kHz
(+) | ausgeglichene Hochtöne, vom Median nur 1.9% abweichend
(+) | sehr lineare Hochtöne (2.7% Delta zum Vorgänger)
Gesamt im hörbaren Bereich 100 - 16.000 Hz
(+) | hörbarer Bereich ist sehr linear (4.6% Abstand zum Median
Im Vergleich zu allen Geräten derselben Klasse
» 0% aller getesteten Geräte dieser Klasse waren besser, 0% vergleichbar, 100% schlechter
» Das beste Gerät hat einen Delta-Wert von 5%, durchschnittlich ist 17%, das schlechteste Gerät hat 45%
Im Vergleich zu allen Geräten im Test
» 0% aller getesteten Geräte waren besser, 0% vergleichbar, 100% schlechter
» Das beste Gerät hat einen Delta-Wert von 4%, durchschnittlich ist 24%, das schlechteste Gerät hat 134%
Energieverwaltung
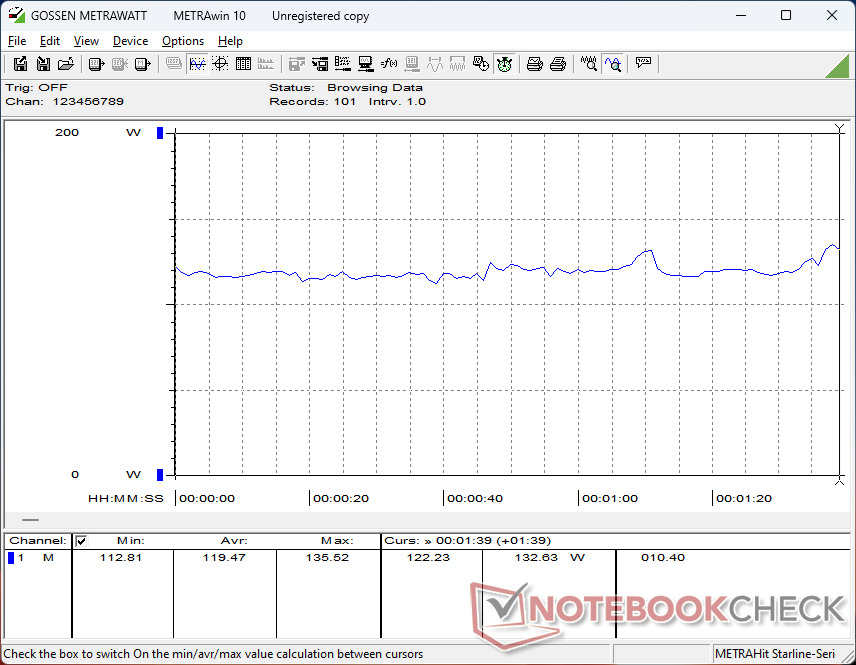
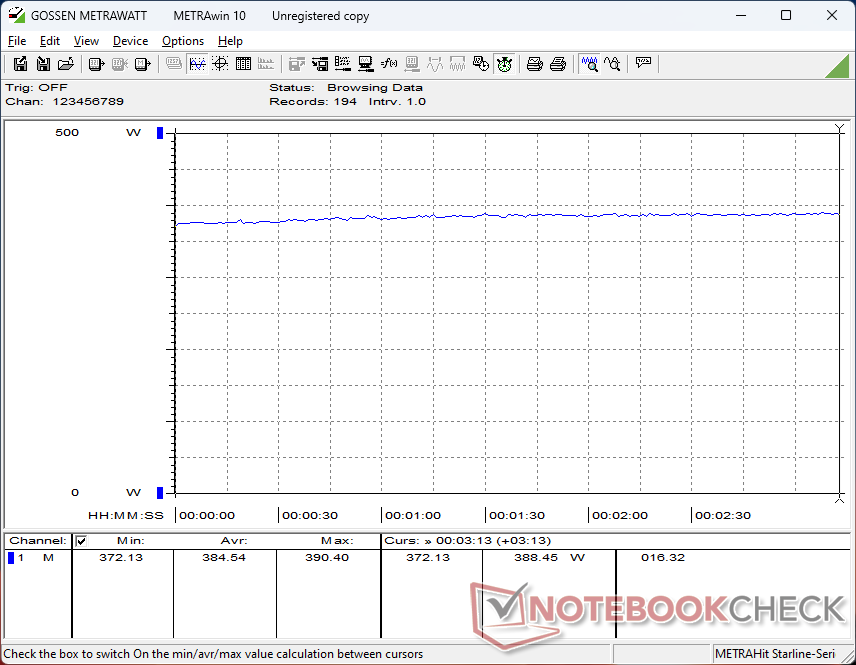
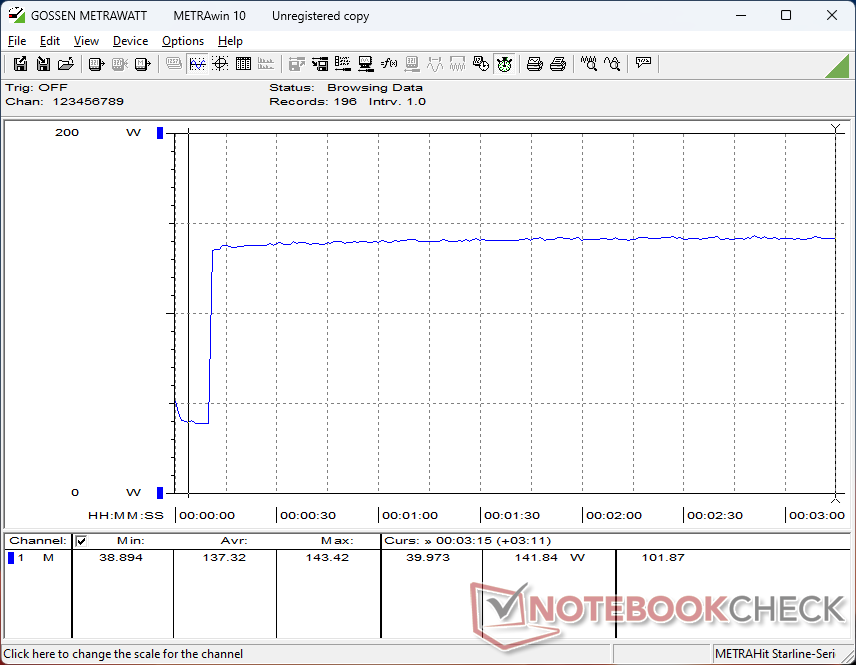
Energieaufnahme
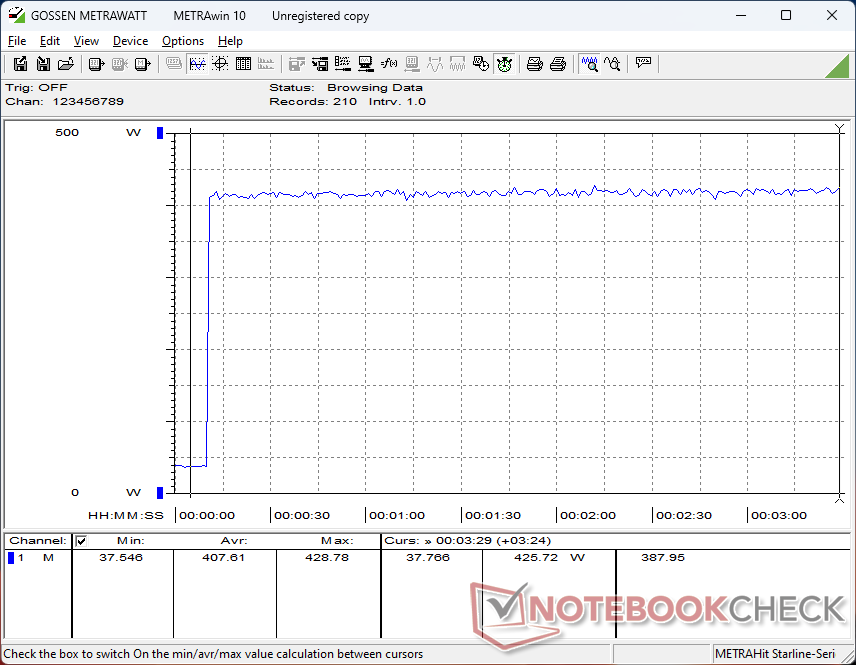
Das GTI12 Ultra und die EX-Dockingstation sind erwartungsgemäß deutlich anspruchsvoller als andere Mini-PCs, einschließlich des Asus ROG NUC 14 mit seiner eigenen RTX 4070-Dockinglösung. Der Stromverbrauch im Leerlauf auf dem Desktop beträgt bereits mehr als das Doppelte im Vergleich zu den meisten Laptops, während Spiele über 380 W benötigen – im Vergleich zu 336 W beim MSI Titan 18 HX, einem der schnellsten derzeit erhältlichen Gaming-Laptops.
Wie bereits erwähnt, verfügen sowohl das GTI12 Ultra als auch das EX-Dock im Gegensatz zu den meisten anderen Mini-PCs und Laptops über keinen externen Stromanschluss.
| Aus / Standby | |
| Idle | |
| Last |
|
Legende:
min: | |
| Beelink GTI12 Ultra EX Docking Station i9-12900H, GeForce RTX 3070, Crucial P3 Plus CT1000P3PSSD8, , x, | Minisforum MS-A1 R7 8700G, Radeon 780M, Kingston OM8PGP41024Q-A0, , x, | GMK NucBox K9 Ultra 5 125H, Arc 7-Core, MasonSemi 1TB MC7000, , x, | Asus NUC 14 Pro Ultra 5 125H, Arc 7-Core, Kingston KC3000 2048G SKC3000D2048G, , x, | Geekom AX8 Pro R9 8945HS, Radeon 780M, Acer N7000 2 TB, , x, | Asus ROG NUC 14-90AS0051 Ultra 9 185H, GeForce RTX 4070 Laptop GPU, Samsung PM9A1a MZVL21T0HDLU, , x, | |
|---|---|---|---|---|---|---|
| Stromverbrauch | 62% | 72% | 74% | 60% | 47% | |
| Idle min * (Watt) | 35.9 | 8.8 75% | 10.9 70% | 5.1 86% | 14 61% | 10.6 70% |
| Idle avg * (Watt) | 35.9 | 12.6 65% | 11 69% | 6.4 82% | 15.9 56% | 14.8 59% |
| Idle max * (Watt) | 36 | 14 61% | 11.4 68% | 14.7 59% | 19.5 46% | 27.5 24% |
| Last avg * (Watt) | 119.5 | 93.2 22% | 52.8 56% | 55.5 54% | 76.4 36% | 84.6 29% |
| Cyberpunk 2077 ultra external monitor * (Watt) | 384 | 102.1 73% | 57.1 85% | 59.1 85% | 54.3 86% | 171.4 55% |
| Last max * (Watt) | 422.9 | 105.4 75% | 72.2 83% | 103.3 76% | 99.1 77% | 244 42% |
* ... kleinere Werte sind besser
Energieaufnahme Cyberpunk / Stresstest
Energieaufnahme externer Monitor
Pro
Contra
Fazit — Ausgezeichnete Verarbeitungsqualität für den Preis
Das GTI12 Ultra macht seinem „Ultra“-Namen mit dem vergrößerten Gehäusedesign und zusätzlichen Funktionen gegenüber der regulären Beelink GTI- oder SER-Serie alle Ehre. Insbesondere das integrierte Netzteil ist ein Merkmal, das wir gerne zur Norm werden sehen würden, da einige Netzteile fast so groß wie die Mini-PCs selbst sein können. Das Gehäusedesign und die Verarbeitungsqualität sind ebenfalls erstklassig, ähnlich wie beim SER8.
Der größte Nachteil wird offensichtlich, wenn Sie das Gerät warten müssen. Die Lautsprecher und das Netzteil müssen zuerst entfernt werden, um an die M.2-SSD- und RAM-Steckplätze zu gelangen, wodurch der Vorgang umständlicher ist als bei den meisten anderen Mini-PCs. Außerdem wird das Gerät wärmer, als uns lieb ist, obwohl es deutlich größer und schwerer ist als andere Geräte in dieser Kategorie. Der sehr langsame integrierte SD-Leser ist ebenfalls ein Rückschlag für Content-Ersteller, zumal das Modell als höherwertiger Mini-PC vermarktet wird.
Was die EX-Dockingstation betrifft, so handelt es sich um ein robustes, wenn auch wenig elegantes Design mit freiliegenden Stromkabeln und Antennenanschlüssen, selbst wenn Sie sich entscheiden, keine der WLAN-Funktionen der Dockingstation zu nutzen. Das „Open-Air“-Design der EX wird im Vergleich zu einer verpackten eGPU-Lösung wie der Aorus Gaming Box, in der normalerweise Vorfilter eingebaut sind, mehr sichtbaren Staub und Haare anziehen. Außerdem eignet sich die EX nicht zur Präsentation der Grafikkarte, da die GPU in Richtung des Mini-PCs und nicht von ihm weg eingebaut werden muss.
In Anbetracht der Verarbeitungsqualität und der Konkurrenz sind das GTI12 Ultra und die EX-Dockingstation erstaunlich günstig.
Wenn man die selten genutzte Wi-Fi-Funktion des EX entfernt oder durch zusätzliche Anschlüsse ersetzt, könnte man die Größe und den Preis des Docks weiter reduzieren.
Preis und Verfügbarkeit
Beelink bietet derzeit das GTI12 Ultra mit einer 1 TB SSD, 32 GB RAM und der EX Docking Station im Bundle für nur 873 Euro an. Ab 200 Euro mehr sind aktuelle Meteor Lake-CPU-Optionen erhältlich.
Beelink GTI12 Ultra EX Docking Station
- 21.10.2024 v8
Allen Ngo
 Total Sustainability Score:
 Transparenz
Die Auswahl der zu testenden Geräte erfolgt innerhalb der Redaktion. Das vorliegende Testmuster wurde dem Autor vom Hersteller oder einem Shop zu Testzwecken leihweise zur Verfügung gestellt. Eine Einflussnahme des Leihstellers auf den Testbericht gab es nicht, der Hersteller erhielt keine Version des Reviews vor der Veröffentlichung. Es bestand keine Verpflichtung zur Publikation. Als eigenständiges, unabhängiges Unternehmen unterliegt Notebookcheck keiner Diktion von Herstellern, Shops und Verlagen.
So testet Notebookcheck
Pro Jahr werden von Notebookcheck hunderte Laptops und Smartphones unabhängig in von uns standardisierten technischen Verfahren getestet, um eine Vergleichbarkeit aller Testergebnisse zu gewährleisten. Seit rund 20 Jahren entwickeln wir diese Testmethoden kontinuierlich weiter und setzen damit Branchenstandards. In unseren Testlaboren kommt ausschließlich hochwertiges Messequipment in die Hände erfahrener Techniker und Redakteure. Die Tests unterliegen einer mehrstufigen Kontrolle. Unsere komplexe Gesamtbewertung basiert auf hunderten fundierten Messergebnissen und Benchmarks, womit Ihnen Objektivität garantiert ist. Weitere Informationen zu unseren Testmethoden gibt es hier.
Preisvergleich

