Notebookcheck Logo

Maingear ML-16 MK2 Laptop im Test: GeForce RTX 4070 Leistung zu einem attraktiven Preis
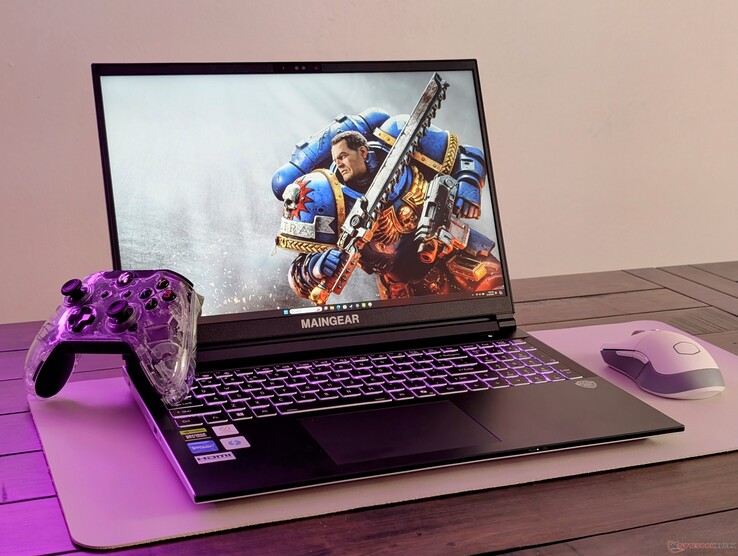
Wie Schenker, aber für Nordamerika.

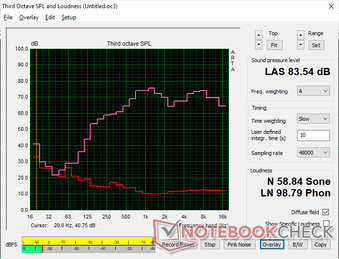
Das ML-16 MK2 legt den Fokus auf GPU-Leistung, Preis und geringes Gewicht, um eine attraktive Option für Gamer und Künstler zu bieten, die viel unterwegs sind. Die Nachteile sind jedoch buchstäblich schwer zu überhören, da die Lüfter ziemlich laut sein können.
Maingear ML-16 Mark II

Ähnlich wie Schenker und Eurocom ist Maingear ein Anbieter leistungsstarker White-Label-Notebooks, der sich an Gamer und Profis richtet. Dieser Ansatz unterscheidet sich von bekannteren PC-Herstellern wie Dell, Lenovo oder HP, die ihre Laptops selbst entwickeln. Das neueste Modell von Maingear ist das ML-16 MK2, ausgestattet mit der neuesten Intel Meteor Lake CPU und einer Nvidia GPU.

Unser Testgerät wurde mit einem Core Ultra 7 155H, einer 105 W GeForce RTX 4070 und einem 240 Hz 1600p IPS-Display für etwa 1860 Euro, konfiguriert. Kleinere Konfigurationen sind stattdessen mit der RTX 4060 ausgestattet, während die CPU und das Display gleich bleiben.

Zu den Konkurrenten des ML-16 MK2 gehören andere ultradünne 16-Zoll-Gaming-Laptops wie das Razer Blade 16, das Alienware x16 R2, das Asus ROG Zephyrus G16 und das Lenovo Legion Pro 7 16.

Weitere Maingear Bewertungen:

Maingear ML-16 MK2
Prozessor
Intel Core Ultra 7 155H 16 x 3.8 - 4.8 GHz, 85 W PL2 / Short Burst, 57 W PL1 / Sustained, Meteor Lake-H
Grafikkarte
NVIDIA GeForce RTX 4070 Laptop GPU - 8 GB VRAM, Kerntakt: 1980 MHz, Speichertakt: 2000 MHz, 105 W TDP, GDDR6, 560.81, MUX
RAM
32 GB 
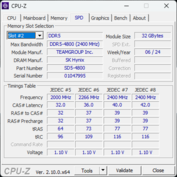
, Team Group, DDR5-4800, 40-39-39-77, Dual-Channel
Bildschirm
16.00 Zoll 16:10, 2560 x 1600 Pixel 189 PPI, TL160ADMP11-0, IPS, spiegelnd: nein, 240 Hz
Mainboard
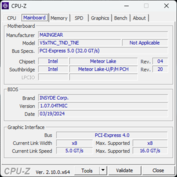
Intel Meteor Lake-U/P/H PCH
Soundkarte
Intel Meteor Lake-U/P/H PCH - cAVS (Audio, Voice, Speech)
Anschlüsse
1 USB 3.0 / 3.1 Gen1, 3 USB 3.1 Gen2, 1 Thunderbolt, USB-C Power Delivery (PD), 1 HDMI, 2 DisplayPort, Audio Anschlüsse: 3.5 mm combo, Card Reader: MicroSD
Netzwerk
Realtek RTL8168/8111 Gigabit-LAN (10/100/1000MBit/s), Intel Wi-Fi 6E AX211 (a/b/g/h/n = Wi-Fi 4/ac = Wi-Fi 5/ax = Wi-Fi 6/ Wi-Fi 6E 6 GHz), Bluetooth 5.3
Abmessungen
Höhe x Breite x Tiefe (in mm): 19.9 x 358 x 258.6
Akku
80 Wh Lithium-Polymer
Betriebssystem
Microsoft Windows 11 Pro
Kamera
Webcam: 1080p30
Primary Camera: 2.1 MPix
Sonstiges
Lautsprecher: Stereo, Tastatur: Chiclet, Tastatur-Beleuchtung: ja, Control Center, 12 Monate Garantie
Gewicht
2.109 kg, Netzteil: 629 g
Preis
2000 USD
Hinweis: Der Hersteller kann abweichende Bauteile wie Bildschirme, Laufwerke und Speicherriegel mit ähnlichen Spezifikationen unter dem gleichen Modellnamen einsetzen.


Mögliche Konkurrenten im Vergleich

Bew.
Version
Datum
Modell
Gewicht
Dicke
Größe
Auflösung
Preis ab
80.9 %v8
09 / 2024
Maingear ML-16 MK2
Ultra 7 155H, NVIDIA GeForce RTX 4070 Laptop GPU
2.1 kg19.9 mm16.00"2560x1600
85.9 %v8
08 / 2024
Asus ROG Zephyrus G16 GA605WV
Ryzen AI 9 HX 370, NVIDIA GeForce RTX 4060 Laptop GPU
1.8 kg17.2 mm16.00"2560x1600
84.3 %
v7 (old)
v7 (old)
05 / 2024
HP Victus 16 (2024)
i7-14700HX, NVIDIA GeForce RTX 4060 Laptop GPU
2.4 kg23.9 mm16.10"1920x1080
88.4 %
v7 (old)
v7 (old)
05 / 2024
Alienware x16 R2 P120F
Ultra 9 185H, NVIDIA GeForce RTX 4080 Laptop GPU
2.7 kg18.57 mm16.00"2560x1600
89.3 %
v7 (old)
v7 (old)
04 / 2024
Lenovo Legion Pro 5 16IRX9
i9-14900HX, NVIDIA GeForce RTX 4070 Laptop GPU
2.5 kg26.95 mm16.00"2560x1600
91.1 %
v7 (old)
v7 (old)
02 / 2024
Razer Blade 16 2024, RTX 4090
i9-14900HX, NVIDIA GeForce RTX 4090 Laptop GPU
2.5 kg22 mm16.00"2560x1600

Hinweis: Wir haben unser Bewertungssystem kürzlich aktualisiert, wodurch die Ergebnisse der Version 8 nicht mit denen der Version 7 vergleichbar sind. Weitere Informationen dazu finden Sie hier.

Gehäuse — Schlank und kantig

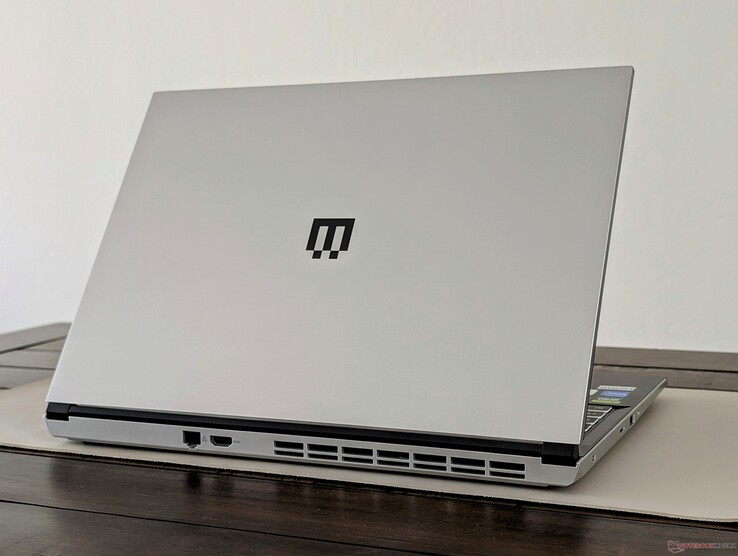
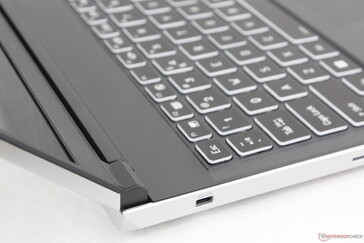
Das Gehäuse lässt sich auf den Ursprungshersteller Clevo (V560TNE-S) zurückführen. Es besteht größtenteils aus Aluminium für den äußeren Deckel und den Boden, während das schwarze Tastaturdeck aus Kunststoff gefertigt ist. Die beiden kontrastierenden Farben harmonieren gut und heben das Modell von den üblichen komplett schwarzen oder mattweißen Gaming-Notebooks ab.

Allerdings spiegelt die Qualität des Gehäuses nicht den hohen Preis wider. Die Oberflächen sind leichter verformbar und wirken nicht so stabil wie bei Konkurrenten wie dem Razer Blade 16 oder dem Alienware x16 R2. Wenn man beispielsweise mit dem Finger auf die Mitte der Tastatur oder den äußeren Deckel drückt, sind die Oberflächen spürbar nachgiebig. Auch beim Verstellen des Winkels wippt der Deckel leichter. Bei der Handhabung des ML-16 MK2 sollte man daher vorsichtiger sein, um Beschädigungen an den kleinen Scharnieren zu vermeiden.

Das Gewicht und die Dicke sind geringer als bei den großen Konkurrenten wie dem Blade 16 oder dem Lenovo Legion Pro 5 16IRX9. Das Asus ROG Zephyrus G16 ist sogar noch dünner und leichter als unser Maingear, kostet jedoch auch mehrere hundert Euro mehr.

Kein-Unibody-Design mit Aluminium- und Kunststoffteilen
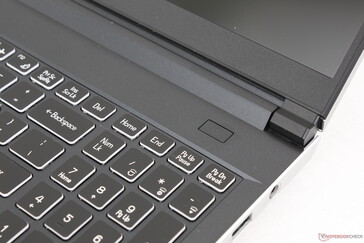
Keine Fingerabdruck-fähige Einschalttaste
Keine Belüftung oder Lüftungsgitter über der ersten Tastenreihe
Die scharfen, flachen Kanten und Ecken verleihen dem Gerät ein kastenförmigeres Aussehen im Vergleich zu den Wettbewerbern
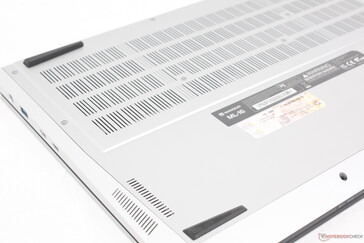
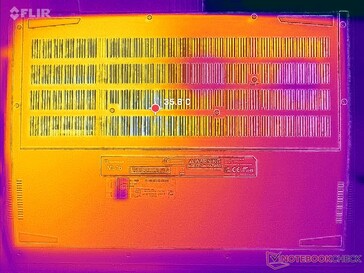
Die Hälfte der Bodenfläche ist für die Belüftung vorgesehen
Deckel in einem maximalen Winkel von ~140 Grad geöffnet

Größenvergleich

369 mm 259.4 mm 23.9 mm 2.4 kg363.4 mm 261.75 mm 26.95 mm 2.5 kg364.74 mm 289.81 mm 18.57 mm 2.7 kg358 mm 258.6 mm 19.9 mm 2.1 kg355 mm 244 mm 22 mm 2.5 kg354 mm 246 mm 17.2 mm 1.8 kg297 mm 210 mm 1 mm 5.7 g

Ausstattung

Die Anschlüsse sind reichlich vorhanden, auch wenn einige fehlen. Das Blade 16 bietet beispielsweise mehr USB-A-Anschlüsse, während das Alienware x16 R2 über einen Mini-DisplayPort verfügt. Die Positionierung der Anschlüsse ist gelungen und nicht zu überfüllt, im Gegensatz zu dem zuvor erwähnten Alienware-System.

Vorderseite: Keine Anschlüsse
Rechts: USB-C 3.2 Gen. 2 mit DisplayPort 1.4, USB-C mit Thunderbolt 4 + DisplayPort + Power Delivery, USB-A 3.2 Gen. 2, Netzteil
Rückseite: 1 Gbps RJ-45, HDMI 2.1
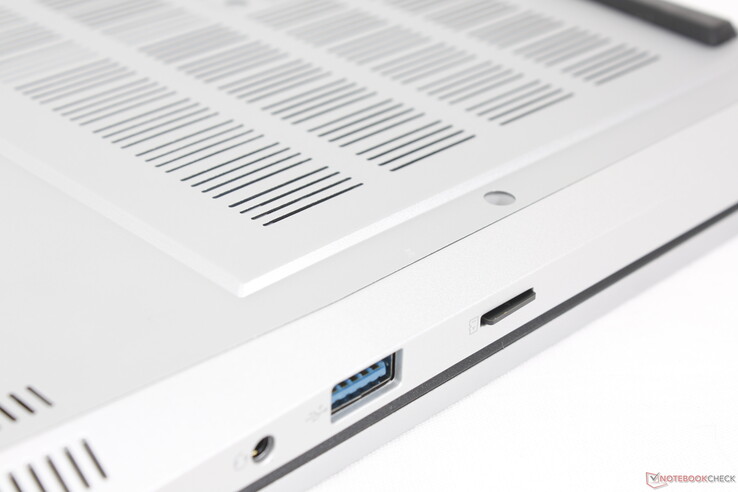
Links: Kensington-Schloss, MicroSD-Leser, USB-A 3.2 Gen. 1, 3,5-mm-Headset

SD Card Reader

Obwohl wir den kleinen MicroSD-Leser zu schätzen wissen, ist er im Vergleich zu einem SD-Leser langsam, besonders für einen 16-Zoll-Gaming-Laptop. Die Übertragung von 1 GB Bildern von unserer UHS-II-Testkarte dauert etwa 25 Sekunden, während es beim Blade 16 nur 6 Sekunden sind.

Die vollständig eingelegte MicroSD-Karte liegt für den sicheren Transport nahezu flach an der Kante an
SD Card Reader
average JPG Copy Test (av. of 3 runs)
Razer Blade 16 2024, RTX 4090
Intel Core i9-14900HX
171 (169.48min - 194.55max) MB/s +317%
Alienware x16 R2 P120F
Intel Core Ultra 9 185H (AV PRO microSD 128 GB V60)
168.9 MB/s +312%
Maingear ML-16 MK2
Intel Core Ultra 7 155H (AV PRO microSD 128 GB V60)
41 MB/s
maximum AS SSD Seq Read Test (1GB)
Alienware x16 R2 P120F
Intel Core Ultra 9 185H (AV PRO microSD 128 GB V60)
258 MB/s +229%
Razer Blade 16 2024, RTX 4090
Intel Core i9-14900HX
181.81 MB/s +132%
Maingear ML-16 MK2
Intel Core Ultra 7 155H (AV PRO microSD 128 GB V60)
78.4 MB/s

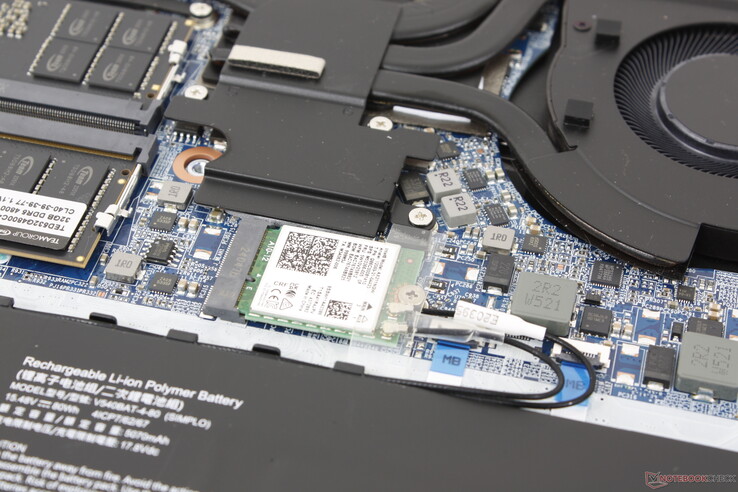
Kommunikation

Der Intel AX211 ist standardmäßig mit Wi-Fi 6E und Bluetooth 5.3 ausgestattet. Bei der Verbindung mit unserem AXE11000 Testrouter haben wir stabile Übertragungsraten und keine Probleme festgestellt.

Herausnehmbare WLAN-Modul
Networking
iperf3 transmit AXE11000
Asus ROG Zephyrus G16 GA605WV
Mediatek Wi-Fi 7 MT7925 Wireless LAN Card
1843 (1712min - 1964max) MBit/s +198%
Razer Blade 16 2024, RTX 4090
Intel Killer Wi-Fi 7 BE1750W 320 MHz (BE200NGW)
1577 (796min - 1617max) MBit/s +155%
Alienware x16 R2 P120F
Intel Killer Wi-Fi 7 BE1750x BE200NGW
1393 (771min - 1527max) MBit/s +125%
HP Victus 16 (2024)
Realtek RTL8852BE
776 (487min - 929max) MBit/s +25%
Lenovo Legion Pro 5 16IRX9
Intel Wi-Fi 6E AX211
636 (485min - 769max) MBit/s +3%
Maingear ML-16 MK2
Intel Wi-Fi 6E AX211
619 (429min - 751max) MBit/s
iperf3 receive AXE11000
Asus ROG Zephyrus G16 GA605WV
Mediatek Wi-Fi 7 MT7925 Wireless LAN Card
1712 (1678min - 1737max) MBit/s +152%
Razer Blade 16 2024, RTX 4090
Intel Killer Wi-Fi 7 BE1750W 320 MHz (BE200NGW)
1604 (1554min - 1623max) MBit/s +136%
Alienware x16 R2 P120F
Intel Killer Wi-Fi 7 BE1750x BE200NGW
1298 (794min - 1451max) MBit/s +91%
Lenovo Legion Pro 5 16IRX9
Intel Wi-Fi 6E AX211
1040 (739min - 1218max) MBit/s +53%
HP Victus 16 (2024)
Realtek RTL8852BE
978 (960min - 990max) MBit/s +44%
Maingear ML-16 MK2
Intel Wi-Fi 6E AX211
680 (541min - 731max) MBit/s
iperf3 transmit AXE11000 6GHz
Razer Blade 16 2024, RTX 4090
Intel Killer Wi-Fi 7 BE1750W 320 MHz (BE200NGW)
1538 (784min - 1597max) MBit/s +41%
Alienware x16 R2 P120F
Intel Killer Wi-Fi 7 BE1750x BE200NGW
1216 (706min - 1415max) MBit/s +11%
Maingear ML-16 MK2
Intel Wi-Fi 6E AX211
1092 (563min - 1183max) MBit/s
Lenovo Legion Pro 5 16IRX9
Intel Wi-Fi 6E AX211
820 (711min - 921max) MBit/s -25%
iperf3 receive AXE11000 6GHz
Razer Blade 16 2024, RTX 4090
Intel Killer Wi-Fi 7 BE1750W 320 MHz (BE200NGW)
1518 (762min - 1536max) MBit/s +54%
Alienware x16 R2 P120F
Intel Killer Wi-Fi 7 BE1750x BE200NGW
1281 (925min - 1431max) MBit/s +30%
Lenovo Legion Pro 5 16IRX9
Intel Wi-Fi 6E AX211
1205 (1100min - 1317max) MBit/s +22%
Maingear ML-16 MK2
Intel Wi-Fi 6E AX211
988 (495min - 1013max) MBit/s
0501001502002503003504004505005506006507007508008509009501000105011001150Tooltip
Maingear ML-16 MK2; iperf3 transmit AXE11000 6GHz; iperf 3.1.3: Ø1074 (563-1183)
Maingear ML-16 MK2; iperf3 receive AXE11000 6GHz; iperf 3.1.3: Ø971 (495-1013)

Webcam

Eine 2-MP-Webcam mit IR und elektronischem Verschluss gehört zur Standardausstattung, um mit den Konkurrenten Schritt zu halten.
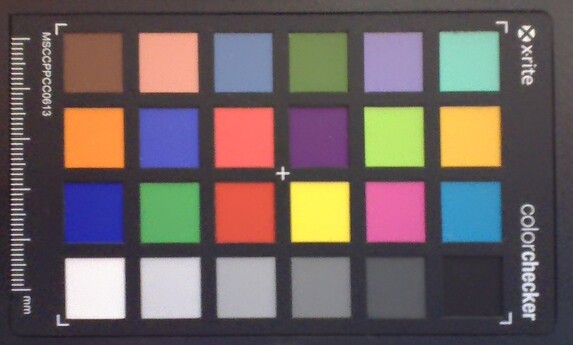
ColorChecker
6.3 ∆E
10.5 ∆E
8.1 ∆E
13.4 ∆E
8.7 ∆E
7.6 ∆E
9.3 ∆E
5.3 ∆E
14.8 ∆E
6.1 ∆E
10.8 ∆E
9.9 ∆E
5.3 ∆E
9.6 ∆E
17.1 ∆E
11.7 ∆E
10.9 ∆E
10.1 ∆E
2.8 ∆E
5.9 ∆E
6.7 ∆E
7.4 ∆E
4.6 ∆E
6.8 ∆E
ColorChecker Maingear ML-16 MK2: 8.74 ∆E min: 2.81 - max: 17.12 ∆E

Wartung

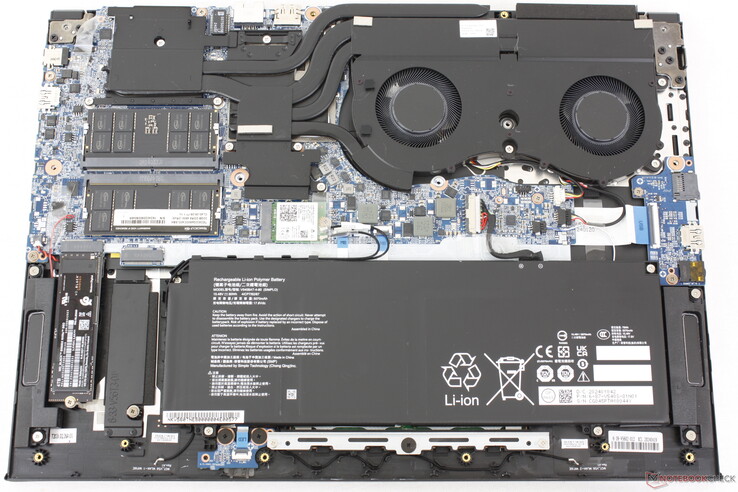
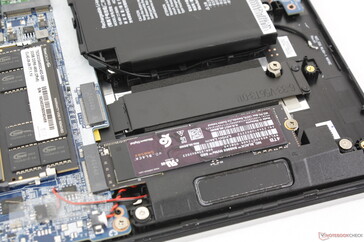
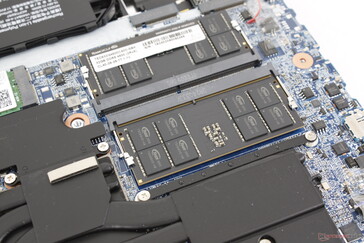
Die Bodenplatte erfordert etwas Geduld, da sie mit 13 Kreuzschlitzschrauben befestigt ist. Ansonsten lässt sie sich ohne großen Widerstand abnehmen und gewährt einfachen Zugang zu zwei M.2 PCIe 4 x4 2280-Schächten, zwei SODIMM-Slots, dem Akku und dem herausnehmbaren WLAN-Modul. Diese Optionen sind vergleichbar mit denen des Razer Blade 16 und besser als die des Alienware x16 R2, das keinen vom Benutzer aufrüstbaren RAM bietet.

Maingear ML-16 MK2
Maingear ML-16 MK2

Nachhaltigkeit

Maingear betont, dass bei der Herstellung des Notebooks keine recycelten Materialien verwendet wurden.

Die Verpackung besteht aus Karton, Plastikfolie und nicht wiederverwertbarem LDPE.

Zubehör und Garantie

In der verpackung befinden sich neben dem Netzgerät und den Unterlagen keine weiteren Extras. Beim Kauf gilt die übliche einjährige Herstellergarantie.

Eingabegeräten

Tastatur

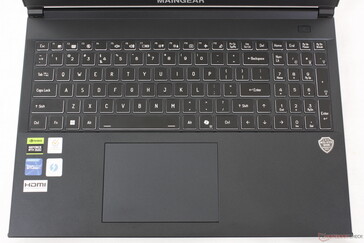
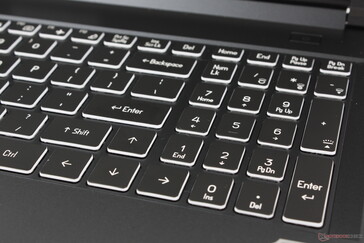
Das Tippen ist lauter als bei den meisten anderen Laptops, was auf das hohe Klappern der QWERTY-Haupttasten zurückzuführen ist. Lautes Klappern bedeutet normalerweise ein festeres und befriedigenderes Feedback, doch beim ML-16 MK2 ist das nicht der Fall, da der Hubweg flach bleibt und das sanfte Feedback nicht mit dem lauten Geräuschpegel mithalten kann. Im Vergleich dazu fühlen sich die Tastaturen der Legion Pro 5 16 oder des Victus 16 vertrauter an, und man kann sich leichter an sie gewöhnen.

Standardmäßig ist eine RGB-Hintergrundbeleuchtung mit einer einzigen Zone; RGB-Optionen pro Taste oder Vier-Zonen-Optionen fehlen.

Touchpad

Das Clickpad (12,2 x 8,3 cm) ist kleiner als das des Blade 16 (17 x 9,7 cm), aber größer als das des Legion Pro 5 16IRX9 (12 x 7,5 cm). Es bietet ausreichend Platz und ein festes, klickendes Feedback beim Drücken. Das Gleiten ist jedoch fast zu sanft, insbesondere bei niedrigen Geschwindigkeiten, was präzise Klicks oder Drag-and-Drop-Aktionen erschwert. Im Vergleich dazu haftet der Finger bei den meisten anderen Laptops eher bei langsameren Bewegungen, was die Präzision unterstützt.

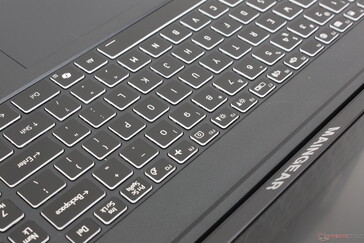
Tastaturlayout und Schriftart ähneln Modellen von Schenker oder Eurocom
Das Touchpad hat eine angemessene Größe und bietet ein gutes Druckfeedback, ist jedoch fast zu leichtgängig
Die Tasten sind laut und flach mit nur leichtem Feedback, was ein unbefriedigendes Gefühl hinterlässt
Pfeiltasten in voller Größe, während die Zifferntasten zu klein sind

Display — Gaming IPS

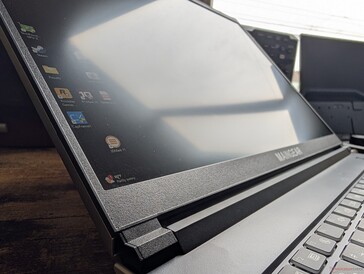
Das ML-16 MK2 ist das erste Modell in unserer Datenbank, das mit dem TL160ADMP11-0 240 Hz IPS-Panel ausgestattet ist. In Bezug auf Bildwiederholrate, Kontrastverhältnis und Auflösung ist es mit dem BOE B160QAN-Panel des Alienware x16 R2 vergleichbar. Allerdings kann es bei der Farbwiedergabe und den Reaktionszeiten nicht ganz mit dem Dell-Display mithalten. Daher lässt sich das Display des ML-16 MK2 als ein gutes Mittelklasse-Panel einstufen, das für Spiele und die meisten Amateur-Grafikbearbeitungen mehr als ausreichend ist.

Fortschrittlichere Funktionen wie G-Sync oder HDR werden allerdings nicht unterstützt.

Keine Edge-to-Edge-Glas- oder OLED-Optionen
Schmale Seitenränder
Das matte Panel ist schärfer als erwartet und zeigt aus der Nähe nur minimale Körnigkeit
Leichte ungleichmäßige Hintergrundbeleuchtung entlang der Kanten
474.5
cd/m²
467.5
cd/m²
480.6
cd/m²
494
cd/m²
518.2
cd/m²
498.3
cd/m²
467.6
cd/m²
504.1
cd/m²
475.1
cd/m²
Ausleuchtung des Bildschirms
TL160ADMP11-0 getestet mit X-Rite i1Pro 2
Maximal: 518.2 cd/m² (Nits) Durchschnitt: 486.7 cd/m² Minimum: 25.62 cd/m²
Ausleuchtung: 90 %
Helligkeit Akku: 518.2 cd/m²
Kontrast: 1296:1 (Schwarzwert: 0.4 cd/m²)
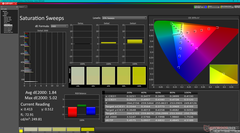
ΔE Color 1.88 | 0.5-29.43 Ø4.92, calibrated: 1.42
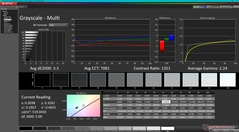
ΔE Greyscale 3.3 | 0.5-98 Ø5.2
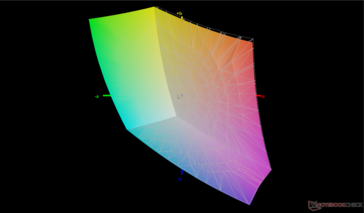
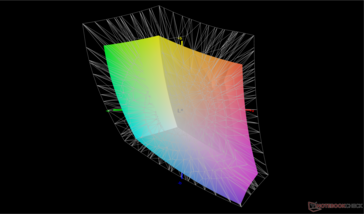
69.2% AdobeRGB 1998 (Argyll 2.2.0 3D)
98.2% sRGB (Argyll 2.2.0 3D)
67.3% Display P3 (Argyll 2.2.0 3D)
Gamma: 2.24
Maingear ML-16 MK2
TL160ADMP11-0, IPS, 2560x1600, 16", 240 Hz
Asus ROG Zephyrus G16 GA605WV
ATNA60DL04-0, OLED, 2560x1600, 16", 240 Hz
HP Victus 16 (2024)
Chi Mei CMN163E, IPS, 1920x1080, 16.1", 144 Hz
Alienware x16 R2 P120F
BOE B160QAN, IPS, 2560x1600, 16", 240 Hz
Lenovo Legion Pro 5 16IRX9
BOE NE160QDM-NYC, IPS, 2560x1600, 16", 165 Hz
Razer Blade 16 2024, RTX 4090
Samsung SDC41AB (ATNA60DL03-0), OLED, 2560x1600, 16", 240 Hz
Display
30%
-38%
25%
2%
29%
Display P3 Coverage
67.3
99.9
48%
41.3
-39%
98.3
46%
69.3
3%
99.1
47%
sRGB Coverage
98.2
100
2%
61.7
-37%
100
2%
99.4
1%
99.9
2%
AdobeRGB 1998 Coverage
69.2
96.9
40%
42.7
-38%
88.8
28%
70.1
1%
95.6
38%
Response Times
98%
-117%
42%
4%
97%
Response Time Grey 50% / Grey 80% *
12.5 ?(5.6, 6.9)
0.22 ?(0.11, 0.11)
98%
28.6 ?(13.3, 15.3)
-129%
3.9 ?(1.7, 2.2)
69%
11.9 ?(5.5, 6.4)
5%
0.24 ?(0.15, 0.09)
98%
Response Time Black / White *
9.1 ?(5, 4.1)
0.25 ?(0.13, 0.12)
97%
18.7 ?(9.6, 9.1)
-105%
7.8 ?(3.9, 3.7)
14%
8.9 ?(4.8, 4.1)
2%
0.4 ?(0.2, 0.2)
96%
PWM Frequency
960
960
Bildschirm
11%
-79%
-3%
14%
193%
Helligkeit Bildmitte
518.2
416
-20%
287
-45%
348.4
-33%
384
-26%
418
-19%
Brightness
487
418
-14%
288
-41%
340
-30%
366
-25%
420
-14%
Brightness Distribution
90
96
7%
86
-4%
90
0%
91
1%
98
9%
Schwarzwert *
0.4
0.19
52%
0.33
17%
0.35
12%
0.02
95%
Kontrast
1296
1511
17%
1056
-19%
1097
-15%
20900
1513%
Delta E Colorchecker *
1.88
1.6
15%
5.46
-190%
2.68
-43%
0.97
48%
1.07
43%
Colorchecker dE 2000 max. *
4.96
2.1
58%
20.36
-310%
4.14
17%
3.57
28%
4.04
19%
Colorchecker dE 2000 calibrated *
1.42
3.52
-148%
0.42
70%
0.77
46%
1.07
25%
Delta E Graustufen *
3.3
2.7
18%
4.8
-45%
3.4
-3%
1.5
55%
1.12
66%
Gamma
2.24 98%
2.16 102%
2.108 104%
2.41 91%
2.24 98%
2.29 96%
CCT
7081 92%
6331 103%
6442 101%
6083 107%
6709 97%
6417 101%
Durchschnitt gesamt (Programm / Settings)
46% / 32%
-78% / -76%
21% / 10%
7% / 10%
106% / 144%

* ... kleinere Werte sind besser

vs. sRGB
vs. sRGB
vs. P3
vs. P3

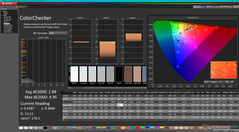
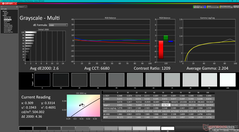
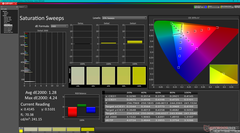
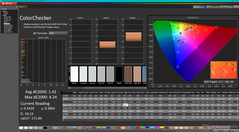
Obwohl das Display nicht werkseitig kalibriert ist, sind die durchschnittlichen Graustufen- und Farb-DeltaE-Werte mit 3,3 bzw. 1,8 recht gut. Die Farbtemperatur ist mit knapp 7100K etwas zu kühl, lässt sich jedoch durch eine Kalibrierung mit unserem X-Rite-Kolorimeter korrigieren, wodurch sich die durchschnittlichen DeltaE-Werte weiter verbessern. Nutzer können unser kalibriertes ICM-Profil kostenlos anwenden.

Graustufen vor der Kalibrierung
Sättigungsverläufe vor der Kalibrierung
ColorChecker vor der Kalibrierung
Graustufen nach der Kalibrierung
Sättigungsverläufe nach der Kalibrierung
ColorChecker nach der Kalibrierung

Reaktionszeiten (Response Times) des Displays

Die Reaktionszeiten (Response Times) beschreiben wie schnell zwischen zwei Farben eines Pixels umgeschaltet werden kann. Langsame Response Times können zu einer verschwommenen Darstellung, Schlieren und Geisterbilder führen. Besonders bei schnellen 3D-Spielen sind kurze Umschaltzeiten wichtig.
       Reaktionszeiten Schwarz zu Weiß
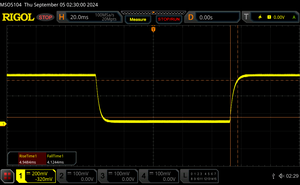
9.1 ms ... steigend ↗ und fallend ↘ kombiniert↗ 5 ms steigend
↘ 4.1 ms fallend
Die gemessenen Reaktionszeiten sind kurz wodurch sich der Bildschirm auch für Spiele gut eignen sollte.
Im Vergleich rangierten die bei uns getesteten Geräte von 0.1 (Minimum) zu 240 (Maximum) ms. » 22 % aller Screens waren schneller als der getestete.
Daher sind die gemessenen Reaktionszeiten besser als der Durchschnitt aller vermessenen Geräte (21 ms).
       Reaktionszeiten 50% Grau zu 80% Grau
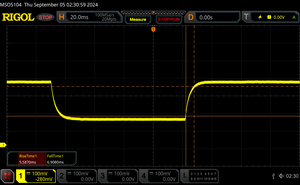
12.5 ms ... steigend ↗ und fallend ↘ kombiniert↗ 5.6 ms steigend
↘ 6.9 ms fallend
Die gemessenen Reaktionszeiten sind gut, für anspruchsvolle Spieler könnten der Bildschirm jedoch zu langsam sein.
Im Vergleich rangierten die bei uns getesteten Geräte von 0.165 (Minimum) zu 636 (Maximum) ms. » 22 % aller Screens waren schneller als der getestete.
Daher sind die gemessenen Reaktionszeiten besser als der Durchschnitt aller vermessenen Geräte (32.9 ms).

Bildschirm-Flackern / PWM (Pulse-Width Modulation)

Eine günstige Methode um die Helligkeit eines Bildschirms zu steuern, ist die Beleuchtung periodisch ein- und auszuschalten. Dies nennt sich PWM (Pulsweitenmodulation) Diese Umschaltung sollte mit einer hohen Frequenz stattfinden damit das menschliche Auge kein Flimmern wahrnimmt. Wenn die Frequenz zu niedrig ist, kann dies zu Ermüdungserscheinungen, Augenbrennen, Kopfweh und auch sichtbaren Flackern führen.
Flackern / PWM nicht festgestellt

Im Vergleich: 53 % aller getesteten Geräte nutzten kein PWM um die Helligkeit zu reduzieren. Wenn PWM eingesetzt wurde, dann bei einer Frequenz von durchschnittlich 8747 (Minimum 5, Maximum 343500) Hz.

Die Sichtbarkeit im Freien ist dank der relativ hellen 500-Nit-Hintergrundbeleuchtung besser als bei den meisten anderen 16-Zoll-Gaming-Laptops. Modelle wie das Victus 16, Alienware x16 R2 und Blade 16 erreichen beispielsweise nur 400 nits oder sogar nur 300 nits, was deutlich schwächer ist. Trotzdem sollte direktes Sonnenlicht vermieden werden, um eine optimale Farbwiedergabe zu gewährleisten.

Draußen bei Sonnenlicht
Draußen im Schatten
Draußen im Schatten
Draußen bei Sonnenlicht
Weiter IPS-Betrachtungswinkel. Farben und Kontrast verschlechtern sich bei extremen Winkeln

Performance — Meteor Lake statt Raptor Lake Refresh


Testbedingungen

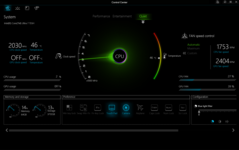
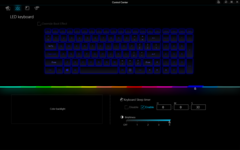
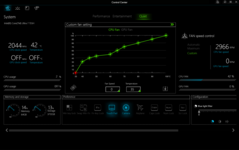
Wir haben Windows und das Control Center auf den Performance-Modus eingestellt, bevor wir die folgenden Benchmarks durchgeführt haben. Nutzer sollten sich mit der vorinstallierten Control-Center-Software vertraut machen, da sie zentral für die Anpassung wichtiger Funktionen ist, darunter das Lüfterverhalten, der elektronische Kameraverschluss, die RGB-Beleuchtung der Tasten und der manuelle GPU-MUX-Schalter. Ärgerlicherweise ist Letzterer in einem Untermenü versteckt, das zusätzliche Klicks erfordert, um darauf zuzugreifen.

Es werden nur Standard-Optimus und MUX unterstützt, jedoch kein Advanced Optimus. Daher ist ein Neustart erforderlich, wenn zwischen den Modi dGPU und MSHybrid gewechselt wird.

Startbildschirm des Control Centers
RGB-Tastatureinstellungen
Manuelle Lüfterkurveneinstellungen

Processor

Der Core Ultra 7 155H tritt die Nachfolge des Core i7-13700H an, jedoch fällt der Leistungszuwachs mit nur 5 bis 15 Prozent eher gering aus. Dies liegt vor allem daran, dass die neue Meteor Lake-Plattform einen Großteil der Chipfläche für die integrierte NPU reserviert hat, wodurch die Steigerung der reinen Rechenleistung in diesem Jahr weniger stark ins Gewicht fällt. Ein Core i7-14700HX hätte eine deutlich höhere Rohleistung erbracht, ist jedoch auch ein wesentlich energieintensiverer Prozessor.

Leider ist die integrierte NPU derzeit nur begrenzt nutzbar, da sie nicht mit Co-Pilot+ kompatibel ist. Der Microsoft-Dienst erfordert mindestens einen Lunar-Lake-Prozessor oder ein vergleichbares Modell von AMD oder Qualcomm. Auch in den meisten aktuellen Spielen bleibt die NPU bisher ungenutzt.

Cinebench R15 Multi Dauertest

0230460690920115013801610184020702300253027602990322034503680391041404370Tooltip
Maingear ML-16 MK2 Intel Core Ultra 7 155H: Ø2134 (1976.58-2705.26)
Asus ROG Zephyrus G16 GA605WV AMD Ryzen AI 9 HX 370: Ø3338 (3327.79-3370.98)
HP Victus 16 (2024) Intel Core i7-14700HX: Ø2658 (2509.88-3812.18)
Alienware x16 R2 P120F Intel Core Ultra 9 185H: Ø2753 (2708.56-2857.35)
Lenovo Legion Pro 5 16IRX9 Intel Core i9-14900HX: Ø4230 (4151.1-4590.84)
Razer Blade 16 2024, RTX 4090 Intel Core i9-14900HX: Ø4396 (4349.72-4455.83)
CPU Performance Rating: Percent
Cinebench R23: Multi Core | Single Core
Cinebench R20: CPU (Multi Core) | CPU (Single Core)
Cinebench R15: CPU Multi 64Bit | CPU Single 64Bit
Blender: v2.79 BMW27 CPU
7-Zip 18.03: 7z b 4 | 7z b 4 -mmt1
Geekbench 6.3: Multi-Core | Single-Core
Geekbench 5.5: Multi-Core | Single-Core
HWBOT x265 Benchmark v2.2: 4k Preset
LibreOffice : 20 Documents To PDF
R Benchmark 2.5: Overall mean
CPU Performance Rating
Razer Blade 16 2024, RTX 4090
Intel Core i9-14900HX
88.5 pt
Asus ROG Zephyrus G16 GA605WV
AMD Ryzen AI 9 HX 370
76 pt
HP Victus 16 (2024)
Intel Core i7-14700HX
69.3 pt
Asus TUF Gaming A16 FA617XS -2!
AMD Ryzen 9 7940HS
65.1 pt
MSI Stealth 16 Mercedes-AMG Motorsport A13VG
Intel Core i9-13900H
64.8 pt
Lenovo Legion Slim 7 16APH8
AMD Ryzen 7 7840HS
62.9 pt
Dell Inspiron 16 Plus 7630
Intel Core i7-13700H
62.9 pt
HP Victus 16-r0076TX -3!
Intel Core i5-13500HX
62.7 pt
Alienware x16 R2 P120F
Intel Core Ultra 9 185H
61.1 pt
Maingear ML-16 MK2
Intel Core Ultra 7 155H
59 pt
Durchschnittliche Intel Core Ultra 7 155H
 
58.1 pt
HP Victus 16-r0077ng
Intel Core i7-13700H
56.9 pt
CSL GameStar Notebook VenomGamer G16
AMD Ryzen 7 7735HS
53.9 pt
HP Omen 16-n0033dx -2!
AMD Ryzen 7 6800H
50.1 pt
Acer Nitro 16 AN16-41-R7YE
AMD Ryzen 5 7535HS
48.1 pt
Cinebench R23 / Multi Core
Razer Blade 16 2024, RTX 4090
Intel Core i9-14900HX
28867 Points +68%
HP Victus 16 (2024)
Intel Core i7-14700HX
23887 Points +39%
Asus ROG Zephyrus G16 GA605WV
AMD Ryzen AI 9 HX 370
22724 Points +32%
MSI Stealth 16 Mercedes-AMG Motorsport A13VG
Intel Core i9-13900H
19907 Points +16%
Alienware x16 R2 P120F
Intel Core Ultra 9 185H
18338 (17139.2min - 18337.8max) Points +6%
HP Victus 16-r0076TX
Intel Core i5-13500HX
18334 Points +6%
Maingear ML-16 MK2
Intel Core Ultra 7 155H
17231 (12872.9min - 17231.1max) Points
Asus TUF Gaming A16 FA617XS
AMD Ryzen 9 7940HS
16907 Points -2%
Lenovo Legion Slim 7 16APH8
AMD Ryzen 7 7840HS
16364 Points -5%
Dell Inspiron 16 Plus 7630
Intel Core i7-13700H
15922 (13533.8min - 15922.1max) Points -8%
HP Victus 16-r0077ng
Intel Core i7-13700H
15410 Points -11%
Durchschnittliche Intel Core Ultra 7 155H
  (9769 - 19007, n=47)
14916 Points -13%
CSL GameStar Notebook VenomGamer G16
AMD Ryzen 7 7735HS
13556 Points -21%
HP Omen 16-n0033dx
AMD Ryzen 7 6800H
13094 (12158.8min - 13093.9max) Points -24%
Acer Nitro 16 AN16-41-R7YE
AMD Ryzen 5 7535HS
10900 Points -37%
Cinebench R23 / Single Core
Razer Blade 16 2024, RTX 4090
Intel Core i9-14900HX
2117 Points +28%
MSI Stealth 16 Mercedes-AMG Motorsport A13VG
Intel Core i9-13900H
2023 Points +23%
Asus ROG Zephyrus G16 GA605WV
AMD Ryzen AI 9 HX 370
1973 Points +20%
Dell Inspiron 16 Plus 7630
Intel Core i7-13700H
1874 Points +14%
Asus TUF Gaming A16 FA617XS
AMD Ryzen 9 7940HS
1791 Points +9%
Lenovo Legion Slim 7 16APH8
AMD Ryzen 7 7840HS
1754 Points +6%
Durchschnittliche Intel Core Ultra 7 155H
  (1496 - 1815, n=47)
1726 Points +5%
HP Victus 16 (2024)
Intel Core i7-14700HX
1702 Points +3%
HP Victus 16-r0076TX
Intel Core i5-13500HX
1689 Points +2%
HP Victus 16-r0077ng
Intel Core i7-13700H
1687 Points +2%
Maingear ML-16 MK2
Intel Core Ultra 7 155H
1650 Points
Alienware x16 R2 P120F
Intel Core Ultra 9 185H
1620 Points -2%
CSL GameStar Notebook VenomGamer G16
AMD Ryzen 7 7735HS
1522 Points -8%
HP Omen 16-n0033dx
AMD Ryzen 7 6800H
1500 Points -9%
Acer Nitro 16 AN16-41-R7YE
AMD Ryzen 5 7535HS
1488 Points -10%
Cinebench R20 / CPU (Multi Core)
Razer Blade 16 2024, RTX 4090
Intel Core i9-14900HX
10968 Points +62%
HP Victus 16 (2024)
Intel Core i7-14700HX
9244 Points +36%
Asus ROG Zephyrus G16 GA605WV
AMD Ryzen AI 9 HX 370
8843 Points +30%
MSI Stealth 16 Mercedes-AMG Motorsport A13VG
Intel Core i9-13900H
7659 Points +13%
Alienware x16 R2 P120F
Intel Core Ultra 9 185H
7081 Points +4%
HP Victus 16-r0076TX
Intel Core i5-13500HX
7021 Points +3%
Maingear ML-16 MK2
Intel Core Ultra 7 155H
6789 Points
Asus TUF Gaming A16 FA617XS
AMD Ryzen 9 7940HS
6571 Points -3%
Lenovo Legion Slim 7 16APH8
AMD Ryzen 7 7840HS
6379 Points -6%
Dell Inspiron 16 Plus 7630
Intel Core i7-13700H
6162 Points -9%
HP Victus 16-r0077ng
Intel Core i7-13700H
5895 Points -13%
Durchschnittliche Intel Core Ultra 7 155H
  (3798 - 7409, n=45)
5791 Points -15%
CSL GameStar Notebook VenomGamer G16
AMD Ryzen 7 7735HS
5224 Points -23%
HP Omen 16-n0033dx
AMD Ryzen 7 6800H
5083 Points -25%
Acer Nitro 16 AN16-41-R7YE
AMD Ryzen 5 7535HS
4224 Points -38%
Cinebench R20 / CPU (Single Core)
Razer Blade 16 2024, RTX 4090
Intel Core i9-14900HX
810 Points +28%
Asus ROG Zephyrus G16 GA605WV
AMD Ryzen AI 9 HX 370
777 Points +23%
MSI Stealth 16 Mercedes-AMG Motorsport A13VG
Intel Core i9-13900H
776 Points +22%
Dell Inspiron 16 Plus 7630
Intel Core i7-13700H
725 Points +14%
Asus TUF Gaming A16 FA617XS
AMD Ryzen 9 7940HS
702 Points +11%
Lenovo Legion Slim 7 16APH8
AMD Ryzen 7 7840HS
672 Points +6%
Durchschnittliche Intel Core Ultra 7 155H
  (601 - 696, n=45)
665 Points +5%
HP Victus 16 (2024)
Intel Core i7-14700HX
651 Points +3%
HP Victus 16-r0077ng
Intel Core i7-13700H
649 Points +2%
HP Victus 16-r0076TX
Intel Core i5-13500HX
648 Points +2%
Maingear ML-16 MK2
Intel Core Ultra 7 155H
634 Points
Alienware x16 R2 P120F
Intel Core Ultra 9 185H
622 Points -2%
HP Omen 16-n0033dx
AMD Ryzen 7 6800H
598 Points -6%
CSL GameStar Notebook VenomGamer G16
AMD Ryzen 7 7735HS
595 Points -6%
Acer Nitro 16 AN16-41-R7YE
AMD Ryzen 5 7535HS
581 Points -8%
Cinebench R15 / CPU Multi 64Bit
Razer Blade 16 2024, RTX 4090
Intel Core i9-14900HX
4456 (4349.72min - 4455.83max) Points +65%
HP Victus 16 (2024)
Intel Core i7-14700HX
3812 Points +41%
Asus ROG Zephyrus G16 GA605WV
AMD Ryzen AI 9 HX 370
3371 (3327.79min - 3370.98max) Points +25%
MSI Stealth 16 Mercedes-AMG Motorsport A13VG
Intel Core i9-13900H
3026 (1537.87min - 3026.18max) Points +12%
HP Victus 16-r0076TX
Intel Core i5-13500HX
2863 (2303.88min - 2863.07max) Points +6%
Alienware x16 R2 P120F
Intel Core Ultra 9 185H
2857 (2708.56min - 2857.35max) Points +6%
Maingear ML-16 MK2
Intel Core Ultra 7 155H
2705 (1976.58min - 2705.26max) Points
Asus TUF Gaming A16 FA617XS
AMD Ryzen 9 7940HS
2666.7 Points -1%
Lenovo Legion Slim 7 16APH8
AMD Ryzen 7 7840HS
2564 (2422.77min - 2563.77max) Points -5%
Durchschnittliche Intel Core Ultra 7 155H
  (1932 - 2880, n=51)
2445 Points -10%
Dell Inspiron 16 Plus 7630
Intel Core i7-13700H
2421 (1806.77min - 2421.45max) Points -10%
HP Victus 16-r0077ng
Intel Core i7-13700H
2317 (2203.13min - 2316.56max) Points -14%
CSL GameStar Notebook VenomGamer G16
AMD Ryzen 7 7735HS
2195 (2121.57min - 2195.39max) Points -19%
HP Omen 16-n0033dx
AMD Ryzen 7 6800H
2151 (2104.6min - 2150.88max) Points -20%
Acer Nitro 16 AN16-41-R7YE
AMD Ryzen 5 7535HS
1757 Points -35%
Cinebench R15 / CPU Single 64Bit
Razer Blade 16 2024, RTX 4090
Intel Core i9-14900HX
311 Points +29%
Asus ROG Zephyrus G16 GA605WV
AMD Ryzen AI 9 HX 370
303 Points +25%
Asus TUF Gaming A16 FA617XS
AMD Ryzen 9 7940HS
283 Points +17%
MSI Stealth 16 Mercedes-AMG Motorsport A13VG
Intel Core i9-13900H
280 Points +16%
Lenovo Legion Slim 7 16APH8
AMD Ryzen 7 7840HS
273 Points +13%
Dell Inspiron 16 Plus 7630
Intel Core i7-13700H
265 Points +10%
CSL GameStar Notebook VenomGamer G16
AMD Ryzen 7 7735HS
251 Points +4%
Durchschnittliche Intel Core Ultra 7 155H
  (99.6 - 268, n=47)
249 Points +3%
HP Victus 16-r0077ng
Intel Core i7-13700H
245 Points +1%
HP Omen 16-n0033dx
AMD Ryzen 7 6800H
243 Points 0%
HP Victus 16-r0076TX
Intel Core i5-13500HX
242 Points 0%
Maingear ML-16 MK2
Intel Core Ultra 7 155H
242 Points
Acer Nitro 16 AN16-41-R7YE
AMD Ryzen 5 7535HS
241 Points 0%
HP Victus 16 (2024)
Intel Core i7-14700HX
238 Points -2%
Alienware x16 R2 P120F
Intel Core Ultra 9 185H
238 Points -2%
Blender / v2.79 BMW27 CPU
Acer Nitro 16 AN16-41-R7YE
AMD Ryzen 5 7535HS
286 Seconds * -27%
HP Omen 16-n0033dx
AMD Ryzen 7 6800H
236 Seconds * -4%
Durchschnittliche Intel Core Ultra 7 155H
  (175 - 381, n=43)
234 Seconds * -4%
MSI Stealth 16 Mercedes-AMG Motorsport A13VG
Intel Core i9-13900H
231 Seconds * -2%
Maingear ML-16 MK2
Intel Core Ultra 7 155H
226 Seconds *
Dell Inspiron 16 Plus 7630
Intel Core i7-13700H
221 Seconds * +2%
HP Victus 16-r0077ng
Intel Core i7-13700H
215 Seconds * +5%
CSL GameStar Notebook VenomGamer G16
AMD Ryzen 7 7735HS
214 Seconds * +5%
Lenovo Legion Slim 7 16APH8
AMD Ryzen 7 7840HS
195 Seconds * +14%
HP Victus 16-r0076TX
Intel Core i5-13500HX
193 Seconds * +15%
Asus TUF Gaming A16 FA617XS
AMD Ryzen 9 7940HS
189 Seconds * +16%
Alienware x16 R2 P120F
Intel Core Ultra 9 185H
178 Seconds * +21%
HP Victus 16 (2024)
Intel Core i7-14700HX
173 Seconds * +23%
Asus ROG Zephyrus G16 GA605WV
AMD Ryzen AI 9 HX 370
145 Seconds * +36%
Razer Blade 16 2024, RTX 4090
Intel Core i9-14900HX
113 Seconds * +50%
7-Zip 18.03 / 7z b 4
Razer Blade 16 2024, RTX 4090
Intel Core i9-14900HX
115695 MIPS +80%
HP Victus 16 (2024)
Intel Core i7-14700HX
84799 MIPS +32%
Asus ROG Zephyrus G16 GA605WV
AMD Ryzen AI 9 HX 370
82463 MIPS +28%
HP Victus 16-r0076TX
Intel Core i5-13500HX
71243 MIPS +11%
Lenovo Legion Slim 7 16APH8
AMD Ryzen 7 7840HS
70243 MIPS +9%
Asus TUF Gaming A16 FA617XS
AMD Ryzen 9 7940HS
70081 MIPS +9%
Alienware x16 R2 P120F
Intel Core Ultra 9 185H
67227 MIPS +5%
HP Victus 16-r0077ng
Intel Core i7-13700H
65405 MIPS +2%
Maingear ML-16 MK2
Intel Core Ultra 7 155H
64182 MIPS
CSL GameStar Notebook VenomGamer G16
AMD Ryzen 7 7735HS
63698 MIPS -1%
Dell Inspiron 16 Plus 7630
Intel Core i7-13700H
59433 MIPS -7%
Durchschnittliche Intel Core Ultra 7 155H
  (41739 - 70254, n=45)
58973 MIPS -8%
HP Omen 16-n0033dx
AMD Ryzen 7 6800H
58798 MIPS -8%
MSI Stealth 16 Mercedes-AMG Motorsport A13VG
Intel Core i9-13900H
57625 MIPS -10%
Acer Nitro 16 AN16-41-R7YE
AMD Ryzen 5 7535HS
48646 MIPS -24%
7-Zip 18.03 / 7z b 4 -mmt1
Razer Blade 16 2024, RTX 4090
Intel Core i9-14900HX
7018 MIPS +39%
Asus TUF Gaming A16 FA617XS
AMD Ryzen 9 7940HS
6621 MIPS +31%
Lenovo Legion Slim 7 16APH8
AMD Ryzen 7 7840HS
6604 MIPS +31%
MSI Stealth 16 Mercedes-AMG Motorsport A13VG
Intel Core i9-13900H
6305 MIPS +25%
Asus ROG Zephyrus G16 GA605WV
AMD Ryzen AI 9 HX 370
6127 MIPS +21%
CSL GameStar Notebook VenomGamer G16
AMD Ryzen 7 7735HS
5792 MIPS +15%
Dell Inspiron 16 Plus 7630
Intel Core i7-13700H
5703 MIPS +13%
Acer Nitro 16 AN16-41-R7YE
AMD Ryzen 5 7535HS
5670 MIPS +12%
HP Omen 16-n0033dx
AMD Ryzen 7 6800H
5669 MIPS +12%
HP Victus 16 (2024)
Intel Core i7-14700HX
5641 MIPS +12%
HP Victus 16-r0077ng
Intel Core i7-13700H
5559 MIPS +10%
HP Victus 16-r0076TX
Intel Core i5-13500HX
5377 MIPS +7%
Durchschnittliche Intel Core Ultra 7 155H
  (4795 - 5621, n=45)
5343 MIPS +6%
Maingear ML-16 MK2
Intel Core Ultra 7 155H
5047 MIPS
Alienware x16 R2 P120F
Intel Core Ultra 9 185H
4502 MIPS -11%
Geekbench 6.3 / Multi-Core
Razer Blade 16 2024, RTX 4090
Intel Core i9-14900HX
17559 Points +47%
Asus ROG Zephyrus G16 GA605WV
AMD Ryzen AI 9 HX 370
15230 Points +28%
HP Victus 16 (2024)
Intel Core i7-14700HX
14807 Points +24%
Dell Inspiron 16 Plus 7630
Intel Core i7-13700H
13406 Points +12%
Lenovo Legion Slim 7 16APH8
AMD Ryzen 7 7840HS
12919 Points +8%
Alienware x16 R2 P120F
Intel Core Ultra 9 185H
12825 Points +7%
Durchschnittliche Intel Core Ultra 7 155H
  (7732 - 13656, n=50)
12279 Points +3%
MSI Stealth 16 Mercedes-AMG Motorsport A13VG
Intel Core i9-13900H
12060 Points +1%
Maingear ML-16 MK2
Intel Core Ultra 7 155H
11941 Points
HP Victus 16-r0077ng
Intel Core i7-13700H
11741 Points -2%
CSL GameStar Notebook VenomGamer G16
AMD Ryzen 7 7735HS
10807 Points -9%
Acer Nitro 16 AN16-41-R7YE
AMD Ryzen 5 7535HS
8960 Points -25%
Geekbench 6.3 / Single-Core
Razer Blade 16 2024, RTX 4090
Intel Core i9-14900HX
2964 Points +32%
Asus ROG Zephyrus G16 GA605WV
AMD Ryzen AI 9 HX 370
2875 Points +28%
MSI Stealth 16 Mercedes-AMG Motorsport A13VG
Intel Core i9-13900H
2765 Points +24%
Dell Inspiron 16 Plus 7630
Intel Core i7-13700H
2638 Points +18%
Lenovo Legion Slim 7 16APH8
AMD Ryzen 7 7840HS
2625 Points +17%
HP Victus 16-r0077ng
Intel Core i7-13700H
2395 Points +7%
HP Victus 16 (2024)
Intel Core i7-14700HX
2378 Points +6%
Durchschnittliche Intel Core Ultra 7 155H
  (1901 - 2473, n=47)
2378 Points +6%
Maingear ML-16 MK2
Intel Core Ultra 7 155H
2238 Points
Alienware x16 R2 P120F
Intel Core Ultra 9 185H
2199 Points -2%
CSL GameStar Notebook VenomGamer G16
AMD Ryzen 7 7735HS
2121 Points -5%
Acer Nitro 16 AN16-41-R7YE
AMD Ryzen 5 7535HS
2056 Points -8%
Geekbench 5.5 / Multi-Core
Razer Blade 16 2024, RTX 4090
Intel Core i9-14900HX
19372 Points +58%
HP Victus 16 (2024)
Intel Core i7-14700HX
16732 Points +37%
Asus ROG Zephyrus G16 GA605WV
AMD Ryzen AI 9 HX 370
14774 Points +21%
Dell Inspiron 16 Plus 7630
Intel Core i7-13700H
12805 Points +5%
Alienware x16 R2 P120F
Intel Core Ultra 9 185H
12759 Points +4%
HP Victus 16-r0076TX
Intel Core i5-13500HX
12683 Points +4%
Maingear ML-16 MK2
Intel Core Ultra 7 155H
12228 Points
Asus TUF Gaming A16 FA617XS
AMD Ryzen 9 7940HS
12111 Points -1%
Durchschnittliche Intel Core Ultra 7 155H
  (10017 - 13556, n=47)
12016 Points -2%
Lenovo Legion Slim 7 16APH8
AMD Ryzen 7 7840HS
11872 Points -3%
HP Victus 16-r0077ng
Intel Core i7-13700H
11504 Points -6%
MSI Stealth 16 Mercedes-AMG Motorsport A13VG
Intel Core i9-13900H
10600 Points -13%
CSL GameStar Notebook VenomGamer G16
AMD Ryzen 7 7735HS
10258 Points -16%
HP Omen 16-n0033dx
AMD Ryzen 7 6800H
9385 Points -23%
Acer Nitro 16 AN16-41-R7YE
AMD Ryzen 5 7535HS
7852 Points -36%
Geekbench 5.5 / Single-Core
Razer Blade 16 2024, RTX 4090
Intel Core i9-14900HX
2131 Points +30%
Asus ROG Zephyrus G16 GA605WV
AMD Ryzen AI 9 HX 370
2104 Points +29%
Asus TUF Gaming A16 FA617XS
AMD Ryzen 9 7940HS
2032 Points +24%
MSI Stealth 16 Mercedes-AMG Motorsport A13VG
Intel Core i9-13900H
1986 Points +21%
Lenovo Legion Slim 7 16APH8
AMD Ryzen 7 7840HS
1943 Points +19%
Dell Inspiron 16 Plus 7630
Intel Core i7-13700H
1906 Points +16%
Durchschnittliche Intel Core Ultra 7 155H
  (1462 - 1824, n=47)
1753 Points +7%
HP Victus 16 (2024)
Intel Core i7-14700HX
1700 Points +4%
Alienware x16 R2 P120F
Intel Core Ultra 9 185H
1700 Points +4%
HP Victus 16-r0076TX
Intel Core i5-13500HX
1688 Points +3%
HP Victus 16-r0077ng
Intel Core i7-13700H
1685 Points +3%
Maingear ML-16 MK2
Intel Core Ultra 7 155H
1637 Points
CSL GameStar Notebook VenomGamer G16
AMD Ryzen 7 7735HS
1575 Points -4%
HP Omen 16-n0033dx
AMD Ryzen 7 6800H
1535 Points -6%
Acer Nitro 16 AN16-41-R7YE
AMD Ryzen 5 7535HS
1502 Points -8%
HWBOT x265 Benchmark v2.2 / 4k Preset
Razer Blade 16 2024, RTX 4090
Intel Core i9-14900HX
30.1 fps +68%
Asus ROG Zephyrus G16 GA605WV
AMD Ryzen AI 9 HX 370
26.5 fps +48%
HP Victus 16 (2024)
Intel Core i7-14700HX
22 fps +23%
Asus TUF Gaming A16 FA617XS
AMD Ryzen 9 7940HS
20.8 fps +16%
Alienware x16 R2 P120F
Intel Core Ultra 9 185H
20.7 fps +16%
HP Victus 16-r0076TX
Intel Core i5-13500HX
20.3 fps +13%
Lenovo Legion Slim 7 16APH8
AMD Ryzen 7 7840HS
20.1 fps +12%
CSL GameStar Notebook VenomGamer G16
AMD Ryzen 7 7735HS
17.9 fps 0%
Maingear ML-16 MK2
Intel Core Ultra 7 155H
17.9 fps
HP Victus 16-r0077ng
Intel Core i7-13700H
16.6 fps -7%
HP Omen 16-n0033dx
AMD Ryzen 7 6800H
16.4 fps -8%
Durchschnittliche Intel Core Ultra 7 155H
  (9.93 - 21.2, n=45)
16.4 fps -8%
Dell Inspiron 16 Plus 7630
Intel Core i7-13700H
15.9 fps -11%
MSI Stealth 16 Mercedes-AMG Motorsport A13VG
Intel Core i9-13900H
14.7 fps -18%
Acer Nitro 16 AN16-41-R7YE
AMD Ryzen 5 7535HS
14.2 fps -21%
LibreOffice / 20 Documents To PDF
Lenovo Legion Slim 7 16APH8
AMD Ryzen 7 7840HS
68.3 s * -58%
CSL GameStar Notebook VenomGamer G16
AMD Ryzen 7 7735HS
63.9 s * -48%
HP Victus 16-r0077ng
Intel Core i7-13700H
61.5 s * -43%
HP Omen 16-n0033dx
AMD Ryzen 7 6800H
59.3 s * -38%
MSI Stealth 16 Mercedes-AMG Motorsport A13VG
Intel Core i9-13900H
57.5 s * -33%
HP Victus 16 (2024)
Intel Core i7-14700HX
55.3 s * -28%
Asus ROG Zephyrus G16 GA605WV
AMD Ryzen AI 9 HX 370
53.8 s * -25%
Durchschnittliche Intel Core Ultra 7 155H
  (40.9 - 79.2, n=44)
49 s * -14%
Razer Blade 16 2024, RTX 4090
Intel Core i9-14900HX
47.5 s * -10%
Acer Nitro 16 AN16-41-R7YE
AMD Ryzen 5 7535HS
46.2 s * -7%
Alienware x16 R2 P120F
Intel Core Ultra 9 185H
45.9 s * -6%
Dell Inspiron 16 Plus 7630
Intel Core i7-13700H
45.1 s * -5%
Maingear ML-16 MK2
Intel Core Ultra 7 155H
43.1 s *
Asus TUF Gaming A16 FA617XS
AMD Ryzen 9 7940HS
41.7 s * +3%
R Benchmark 2.5 / Overall mean
Maingear ML-16 MK2
Intel Core Ultra 7 155H
0.505 sec *
HP Victus 16-r0077ng
Intel Core i7-13700H
0.504 sec * -0%
Acer Nitro 16 AN16-41-R7YE
AMD Ryzen 5 7535HS
0.503 sec * -0%
Alienware x16 R2 P120F
Intel Core Ultra 9 185H
0.503 sec * -0%
HP Omen 16-n0033dx
AMD Ryzen 7 6800H
0.501 sec * +1%
HP Victus 16 (2024)
Intel Core i7-14700HX
0.4896 sec * +3%
HP Victus 16-r0076TX
Intel Core i5-13500HX
0.4891 sec * +3%
CSL GameStar Notebook VenomGamer G16
AMD Ryzen 7 7735HS
0.4842 sec * +4%
Durchschnittliche Intel Core Ultra 7 155H
  (0.4457 - 0.53, n=44)
0.4819 sec * +5%
Lenovo Legion Slim 7 16APH8
AMD Ryzen 7 7840HS
0.4431 sec * +12%
Dell Inspiron 16 Plus 7630
Intel Core i7-13700H
0.4338 sec * +14%
MSI Stealth 16 Mercedes-AMG Motorsport A13VG
Intel Core i9-13900H
0.4303 sec * +15%
Asus TUF Gaming A16 FA617XS
AMD Ryzen 9 7940HS
0.4253 sec * +16%
Asus ROG Zephyrus G16 GA605WV
AMD Ryzen AI 9 HX 370
0.4111 sec * +19%
Razer Blade 16 2024, RTX 4090
Intel Core i9-14900HX
0.3789 sec * +25%
CPU Performance Rating: Percent
Cinebench R23: Multi Core | Single Core
Cinebench R20: CPU (Multi Core) | CPU (Single Core)
Cinebench R15: CPU Multi 64Bit | CPU Single 64Bit
Blender: v2.79 BMW27 CPU
7-Zip 18.03: 7z b 4 | 7z b 4 -mmt1
Geekbench 6.3: Multi-Core | Single-Core
Geekbench 5.5: Multi-Core | Single-Core
HWBOT x265 Benchmark v2.2: 4k Preset
LibreOffice : 20 Documents To PDF
R Benchmark 2.5: Overall mean

* ... kleinere Werte sind besser

Cinebench R15 CPU Multi 64Bit
2705 Points
Cinebench R15 OpenGL 64Bit
183.9 fps
Cinebench R15 Ref. Match 64Bit
99.6 %
Cinebench R15 CPU Single 64Bit
242 Points
Cinebench R20 CPU (Multi Core)
6789 Points
Cinebench R20 CPU (Single Core)
634 Points
Cinebench R23 Single Core
1650 Points
Cinebench R23 Multi Core
17231 Points
Cinebench 2024 CPU Single Core
98.4 Points
Cinebench 2024 CPU Multi Core
789 Points
Hilfe
Performance Rating
Asus ROG Zephyrus G16 GA605WV
AMD Ryzen AI 9 HX 370, NVIDIA GeForce RTX 4060 Laptop GPU
88.3 pt
Razer Blade 16 2024, RTX 4090
Intel Core i9-14900HX, NVIDIA GeForce RTX 4090 Laptop GPU
87.7 pt
Lenovo Legion Pro 5 16IRX9
Intel Core i9-14900HX, NVIDIA GeForce RTX 4070 Laptop GPU
87.3 pt
Alienware x16 R2 P120F
Intel Core Ultra 9 185H, NVIDIA GeForce RTX 4080 Laptop GPU
66.4 pt
HP Victus 16 (2024)
Intel Core i7-14700HX, NVIDIA GeForce RTX 4060 Laptop GPU
62.1 pt
Maingear ML-16 MK2
Intel Core Ultra 7 155H, NVIDIA GeForce RTX 4070 Laptop GPU
59.3 pt
Durchschnittliche Intel Core Ultra 7 155H
 
51.7 pt
AIDA64 / FP32 Ray-Trace
Asus ROG Zephyrus G16 GA605WV
AMD Ryzen AI 9 HX 370, NVIDIA GeForce RTX 4060 Laptop GPU
36304 KRay/s +147%
Razer Blade 16 2024, RTX 4090
Intel Core i9-14900HX, NVIDIA GeForce RTX 4090 Laptop GPU
25682 KRay/s +75%
Lenovo Legion Pro 5 16IRX9
Intel Core i9-14900HX, NVIDIA GeForce RTX 4070 Laptop GPU
25072 KRay/s +71%
Alienware x16 R2 P120F
Intel Core Ultra 9 185H, NVIDIA GeForce RTX 4080 Laptop GPU
18676 KRay/s +27%
HP Victus 16 (2024)
Intel Core i7-14700HX, NVIDIA GeForce RTX 4060 Laptop GPU
16932 KRay/s +15%
Maingear ML-16 MK2
Intel Core Ultra 7 155H, NVIDIA GeForce RTX 4070 Laptop GPU
14694 KRay/s
Durchschnittliche Intel Core Ultra 7 155H
  (6670 - 18470, n=45)
13101 KRay/s -11%
AIDA64 / FPU Julia
Asus ROG Zephyrus G16 GA605WV
AMD Ryzen AI 9 HX 370, NVIDIA GeForce RTX 4060 Laptop GPU
138436 Points +79%
Lenovo Legion Pro 5 16IRX9
Intel Core i9-14900HX, NVIDIA GeForce RTX 4070 Laptop GPU
129169 Points +67%
Razer Blade 16 2024, RTX 4090
Intel Core i9-14900HX, NVIDIA GeForce RTX 4090 Laptop GPU
127908 Points +65%
Alienware x16 R2 P120F
Intel Core Ultra 9 185H, NVIDIA GeForce RTX 4080 Laptop GPU
96463 Points +25%
HP Victus 16 (2024)
Intel Core i7-14700HX, NVIDIA GeForce RTX 4060 Laptop GPU
86338 Points +11%
Maingear ML-16 MK2
Intel Core Ultra 7 155H, NVIDIA GeForce RTX 4070 Laptop GPU
77477 Points
Durchschnittliche Intel Core Ultra 7 155H
  (40905 - 93181, n=45)
69488 Points -10%
AIDA64 / CPU SHA3
Lenovo Legion Pro 5 16IRX9
Intel Core i9-14900HX, NVIDIA GeForce RTX 4070 Laptop GPU
6285 MB/s +64%
Razer Blade 16 2024, RTX 4090
Intel Core i9-14900HX, NVIDIA GeForce RTX 4090 Laptop GPU
6188 MB/s +62%
Asus ROG Zephyrus G16 GA605WV
AMD Ryzen AI 9 HX 370, NVIDIA GeForce RTX 4060 Laptop GPU
5696 MB/s +49%
Alienware x16 R2 P120F
Intel Core Ultra 9 185H, NVIDIA GeForce RTX 4080 Laptop GPU
4534 MB/s +19%
HP Victus 16 (2024)
Intel Core i7-14700HX, NVIDIA GeForce RTX 4060 Laptop GPU
4008 MB/s +5%
Maingear ML-16 MK2
Intel Core Ultra 7 155H, NVIDIA GeForce RTX 4070 Laptop GPU
3822 MB/s
Durchschnittliche Intel Core Ultra 7 155H
  (1940 - 4436, n=45)
3244 MB/s -15%
AIDA64 / CPU Queen
Lenovo Legion Pro 5 16IRX9
Intel Core i9-14900HX, NVIDIA GeForce RTX 4070 Laptop GPU
142503 Points +51%
Razer Blade 16 2024, RTX 4090
Intel Core i9-14900HX, NVIDIA GeForce RTX 4090 Laptop GPU
138473 Points +47%
HP Victus 16 (2024)
Intel Core i7-14700HX, NVIDIA GeForce RTX 4060 Laptop GPU
129836 Points +38%
Alienware x16 R2 P120F
Intel Core Ultra 9 185H, NVIDIA GeForce RTX 4080 Laptop GPU
94794 Points +1%
Asus ROG Zephyrus G16 GA605WV
AMD Ryzen AI 9 HX 370, NVIDIA GeForce RTX 4060 Laptop GPU
94289 Points 0%
Maingear ML-16 MK2
Intel Core Ultra 7 155H, NVIDIA GeForce RTX 4070 Laptop GPU
94181 Points
Durchschnittliche Intel Core Ultra 7 155H
  (64698 - 94181, n=45)
83491 Points -11%
AIDA64 / FPU SinJulia
Asus ROG Zephyrus G16 GA605WV
AMD Ryzen AI 9 HX 370, NVIDIA GeForce RTX 4060 Laptop GPU
18867 Points +79%
Razer Blade 16 2024, RTX 4090
Intel Core i9-14900HX, NVIDIA GeForce RTX 4090 Laptop GPU
15857 Points +50%
Lenovo Legion Pro 5 16IRX9
Intel Core i9-14900HX, NVIDIA GeForce RTX 4070 Laptop GPU
15401 Points +46%
HP Victus 16 (2024)
Intel Core i7-14700HX, NVIDIA GeForce RTX 4060 Laptop GPU
11704 Points +11%
Alienware x16 R2 P120F
Intel Core Ultra 9 185H, NVIDIA GeForce RTX 4080 Laptop GPU
11095 Points +5%
Maingear ML-16 MK2
Intel Core Ultra 7 155H, NVIDIA GeForce RTX 4070 Laptop GPU
10560 Points
Durchschnittliche Intel Core Ultra 7 155H
  (5639 - 10647, n=45)
9119 Points -14%
AIDA64 / FPU Mandel
Asus ROG Zephyrus G16 GA605WV
AMD Ryzen AI 9 HX 370, NVIDIA GeForce RTX 4060 Laptop GPU
74066 Points +104%
Razer Blade 16 2024, RTX 4090
Intel Core i9-14900HX, NVIDIA GeForce RTX 4090 Laptop GPU
64134 Points +77%
Lenovo Legion Pro 5 16IRX9
Intel Core i9-14900HX, NVIDIA GeForce RTX 4070 Laptop GPU
62567 Points +72%
Alienware x16 R2 P120F
Intel Core Ultra 9 185H, NVIDIA GeForce RTX 4080 Laptop GPU
48020 Points +32%
HP Victus 16 (2024)
Intel Core i7-14700HX, NVIDIA GeForce RTX 4060 Laptop GPU
42125 Points +16%
Maingear ML-16 MK2
Intel Core Ultra 7 155H, NVIDIA GeForce RTX 4070 Laptop GPU
36322 Points
Durchschnittliche Intel Core Ultra 7 155H
  (18236 - 47685, n=45)
33738 Points -7%
AIDA64 / CPU AES
Maingear ML-16 MK2
Intel Core Ultra 7 155H, NVIDIA GeForce RTX 4070 Laptop GPU
148318 MB/s
Razer Blade 16 2024, RTX 4090
Intel Core i9-14900HX, NVIDIA GeForce RTX 4090 Laptop GPU
122937 MB/s -17%
Lenovo Legion Pro 5 16IRX9
Intel Core i9-14900HX, NVIDIA GeForce RTX 4070 Laptop GPU
120213 MB/s -19%
Alienware x16 R2 P120F
Intel Core Ultra 9 185H, NVIDIA GeForce RTX 4080 Laptop GPU
88763 MB/s -40%
HP Victus 16 (2024)
Intel Core i7-14700HX, NVIDIA GeForce RTX 4060 Laptop GPU
82161 MB/s -45%
Asus ROG Zephyrus G16 GA605WV
AMD Ryzen AI 9 HX 370, NVIDIA GeForce RTX 4060 Laptop GPU
80186 MB/s -46%
Durchschnittliche Intel Core Ultra 7 155H
  (45713 - 152179, n=45)
78240 MB/s -47%
AIDA64 / CPU ZLib
Lenovo Legion Pro 5 16IRX9
Intel Core i9-14900HX, NVIDIA GeForce RTX 4070 Laptop GPU
1866 MB/s +57%
Razer Blade 16 2024, RTX 4090
Intel Core i9-14900HX, NVIDIA GeForce RTX 4090 Laptop GPU
1863 MB/s +57%
Asus ROG Zephyrus G16 GA605WV
AMD Ryzen AI 9 HX 370, NVIDIA GeForce RTX 4060 Laptop GPU
1489 MB/s +26%
Alienware x16 R2 P120F
Intel Core Ultra 9 185H, NVIDIA GeForce RTX 4080 Laptop GPU
1298 MB/s +9%
Maingear ML-16 MK2
Intel Core Ultra 7 155H, NVIDIA GeForce RTX 4070 Laptop GPU
1186 MB/s
HP Victus 16 (2024)
Intel Core i7-14700HX, NVIDIA GeForce RTX 4060 Laptop GPU
1177 MB/s -1%
Durchschnittliche Intel Core Ultra 7 155H
  (557 - 1250, n=45)
960 MB/s -19%
AIDA64 / FP64 Ray-Trace
Asus ROG Zephyrus G16 GA605WV
AMD Ryzen AI 9 HX 370, NVIDIA GeForce RTX 4060 Laptop GPU
19629 KRay/s +169%
Razer Blade 16 2024, RTX 4090
Intel Core i9-14900HX, NVIDIA GeForce RTX 4090 Laptop GPU
13993 KRay/s +92%
Lenovo Legion Pro 5 16IRX9
Intel Core i9-14900HX, NVIDIA GeForce RTX 4070 Laptop GPU
13776 KRay/s +89%
Alienware x16 R2 P120F
Intel Core Ultra 9 185H, NVIDIA GeForce RTX 4080 Laptop GPU
10078 KRay/s +38%
HP Victus 16 (2024)
Intel Core i7-14700HX, NVIDIA GeForce RTX 4060 Laptop GPU
9029 KRay/s +24%
Maingear ML-16 MK2
Intel Core Ultra 7 155H, NVIDIA GeForce RTX 4070 Laptop GPU
7295 KRay/s
Durchschnittliche Intel Core Ultra 7 155H
  (3569 - 9802, n=45)
6848 KRay/s -6%
AIDA64 / CPU PhotoWorxx
Alienware x16 R2 P120F
Intel Core Ultra 9 185H, NVIDIA GeForce RTX 4080 Laptop GPU
53242 MPixel/s +57%
Lenovo Legion Pro 5 16IRX9
Intel Core i9-14900HX, NVIDIA GeForce RTX 4070 Laptop GPU
49676 MPixel/s +46%
Razer Blade 16 2024, RTX 4090
Intel Core i9-14900HX, NVIDIA GeForce RTX 4090 Laptop GPU
49616 MPixel/s +46%
Asus ROG Zephyrus G16 GA605WV
AMD Ryzen AI 9 HX 370, NVIDIA GeForce RTX 4060 Laptop GPU
49354 MPixel/s +45%
Durchschnittliche Intel Core Ultra 7 155H
  (32719 - 54223, n=45)
46541 MPixel/s +37%
HP Victus 16 (2024)
Intel Core i7-14700HX, NVIDIA GeForce RTX 4060 Laptop GPU
39448 MPixel/s +16%
Maingear ML-16 MK2
Intel Core Ultra 7 155H, NVIDIA GeForce RTX 4070 Laptop GPU
33939 MPixel/s

Stresstest

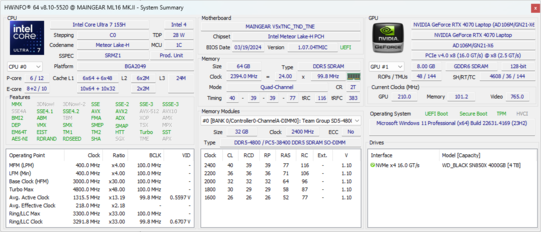
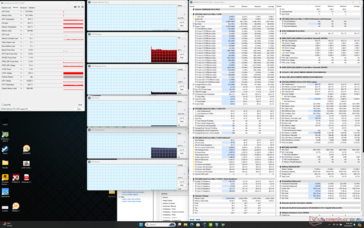
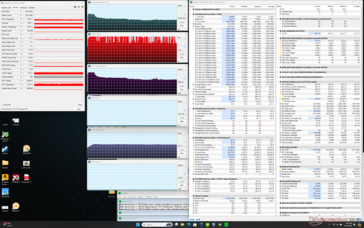
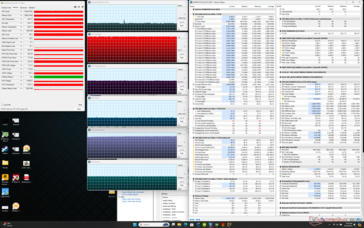
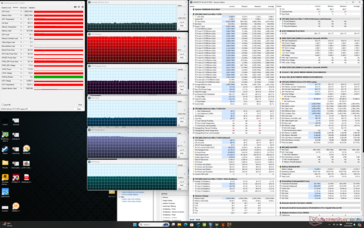
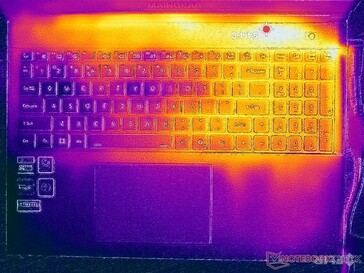
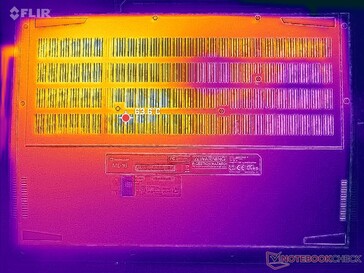
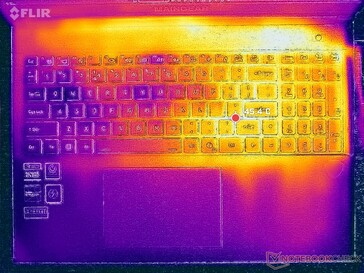
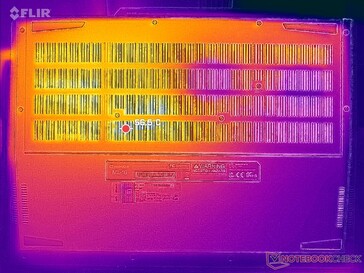
Als wir den Prime95-Stresstest starteten, stieg die CPU auf 3,2 GHz, 100 °C und 85 W an. Nach einigen Sekunden reduzierte sich die Taktfrequenz jedoch auf 2,6 GHz und 69 W und stabilisierte sich schließlich bei 2,1 GHz und 57 W. Die Kerntemperaturen schwankten laut HWiNFO zwischen 73 °C und 100 °C, wobei thermisches Throttling auftrat. Diese hohen Temperaturen sind deutlich höher als beim Razer Blade 16 unter ähnlichen Bedingungen und führen auch zu den spürbar warmen Oberflächentemperaturen.

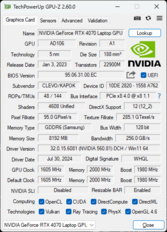
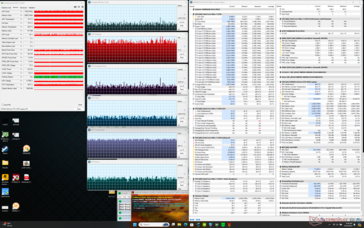
Beim Spielen von Cyberpunk 2077 im Performance-Modus stabilisierte sich die GPU bei 2160 MHz, 85 °C und 80 W, während sie im ruhigeren Balanced-Modus bei 2010 MHz, 80 °C und 74 W lag. Wenn das Spiel nicht besonders CPU-lastig ist, könnte der Balanced-Modus vorzuziehen sein, da die GPU nicht so stark beansprucht wird. Interessanterweise zeigt das Nvidia Control Panel eine TGP von 105 W an, aber GPU-Z verzeichnete beim Spielen ein Maximum von nur 80 W.

Insgesamt sind die Kerntemperaturen beim Spielen deutlich höher als bei Konkurrenzmodellen wie dem Blade 16. Unsere CPU und GPU stabilisierten sich bei 101 °C bzw. 85 °C, verglichen mit 78 °C und 75 °C beim Razer. Selbst im maximalen Lüftermodus konnten die Kerntemperaturen nur geringfügig gesenkt werden, ohne die Leistung zu verbessern.

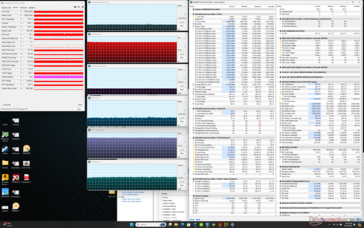
System im Leerlauf
System im Leerlauf
Cyberpunk 2077 (Balanced/Entertainment-Modus)
Prime95 Stresstest
Prime95 Stresstest
Cyberpunk 2077 (Performance-Modus mit ausgeschaltetem Max-Lüfter)
Prime95+FurMark Stresstest
Cyberpunk 2077 (Performance-Modus mit eingeschaltetem Max-Lüfter)
Durchschnittlicher CPU-Takt (GHz) GPU-Takt (MHz) Durchschnittliche CPU-Temperatur (°C) Durchschnittliche GPU-Temperatur (°C)
System Idle -- -- 48 40
Prime95 Stress 2.1 -- 73 - 101 53
Prime95 + FurMark Stresstest 1.1 - 1.4 ~1785 75 - 95 ~70
Cyberpunk 2077 Stresstest (Balanced-Modus) 1.2 2010 79 80
Cyberpunk 2077 Stresstest (Performance-Modus mit ausgeschaltetem Max-Lüfter) 1.4 2160 101 85
Cyberpunk 2077 Stresstest (Performance-Modus mit eingeschaltetem Max-Lüfter) 1.5 2055 98 82

System Performance

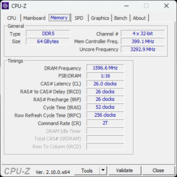
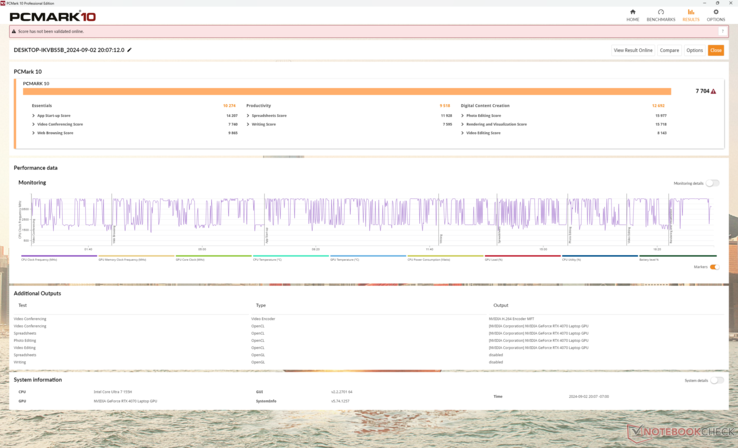
Die PCMark-Ergebnisse des Maingear ML-16 MK2 liegen auf einem vergleichbaren Niveau mit Konkurrenten wie dem HP Victus 16 oder dem Asus ROG Zephyrus G16. Das zeigt, dass alltägliche Aufgaben auf dem Maingear trotz unterschiedlicher Spezifikationen nicht wesentlich schneller oder langsamer erledigt werden. Allerdings sind die CrossMark- und AIDA64-Speichertests niedriger als erwartet. Dies könnte auf die geringere Rohleistung der CPU und den langsameren DDR5-4800-RAM zurückzuführen sein. Andere Modelle wie das Blade 16 oder Alienware m16 R2 sind mit schnellerem DDR5-5600 bzw. LPDDR5-7467 ausgestattet, was zu einer besseren Speicherleistung führt.

PCMark 10 Standard
PCMark 10 Standard
PCMark 10 / Score
Lenovo Legion Pro 5 16IRX9
NVIDIA GeForce RTX 4070 Laptop GPU, i9-14900HX, Samsung PM9A1 MZVL21T0HCLR
8550 Points +11%
Razer Blade 16 2024, RTX 4090
NVIDIA GeForce RTX 4090 Laptop GPU, i9-14900HX, Samsung PM9A1 MZVL22T0HBLB
8401 Points +9%
Asus ROG Zephyrus G16 GA605WV
NVIDIA GeForce RTX 4060 Laptop GPU, Ryzen AI 9 HX 370, Micron 2400 MTFDKBA1T0QFM
7915 Points +3%
Maingear ML-16 MK2
NVIDIA GeForce RTX 4070 Laptop GPU, Ultra 7 155H
7704 Points
HP Victus 16 (2024)
NVIDIA GeForce RTX 4060 Laptop GPU, i7-14700HX, Kioxia XG8 KXG80ZNV512G
7528 Points -2%
Durchschnittliche Intel Core Ultra 7 155H, NVIDIA GeForce RTX 4070 Laptop GPU
  (7084 - 7761, n=4)
7418 Points -4%
Alienware x16 R2 P120F
NVIDIA GeForce RTX 4080 Laptop GPU, Ultra 9 185H, WDC PC SN810 1TB
7251 Points -6%
PCMark 10 / Essentials
Lenovo Legion Pro 5 16IRX9
NVIDIA GeForce RTX 4070 Laptop GPU, i9-14900HX, Samsung PM9A1 MZVL21T0HCLR
11286 Points +10%
Razer Blade 16 2024, RTX 4090
NVIDIA GeForce RTX 4090 Laptop GPU, i9-14900HX, Samsung PM9A1 MZVL22T0HBLB
10915 Points +6%
HP Victus 16 (2024)
NVIDIA GeForce RTX 4060 Laptop GPU, i7-14700HX, Kioxia XG8 KXG80ZNV512G
10778 Points +5%
Maingear ML-16 MK2
NVIDIA GeForce RTX 4070 Laptop GPU, Ultra 7 155H
10274 Points
Durchschnittliche Intel Core Ultra 7 155H, NVIDIA GeForce RTX 4070 Laptop GPU
  (10038 - 10393, n=4)
10259 Points 0%
Asus ROG Zephyrus G16 GA605WV
NVIDIA GeForce RTX 4060 Laptop GPU, Ryzen AI 9 HX 370, Micron 2400 MTFDKBA1T0QFM
10140 Points -1%
Alienware x16 R2 P120F
NVIDIA GeForce RTX 4080 Laptop GPU, Ultra 9 185H, WDC PC SN810 1TB
10036 Points -2%
PCMark 10 / Productivity
Razer Blade 16 2024, RTX 4090
NVIDIA GeForce RTX 4090 Laptop GPU, i9-14900HX, Samsung PM9A1 MZVL22T0HBLB
11150 Points +17%
Lenovo Legion Pro 5 16IRX9
NVIDIA GeForce RTX 4070 Laptop GPU, i9-14900HX, Samsung PM9A1 MZVL21T0HCLR
10139 Points +7%
Asus ROG Zephyrus G16 GA605WV
NVIDIA GeForce RTX 4060 Laptop GPU, Ryzen AI 9 HX 370, Micron 2400 MTFDKBA1T0QFM
9971 Points +5%
HP Victus 16 (2024)
NVIDIA GeForce RTX 4060 Laptop GPU, i7-14700HX, Kioxia XG8 KXG80ZNV512G
9910 Points +4%
Maingear ML-16 MK2
NVIDIA GeForce RTX 4070 Laptop GPU, Ultra 7 155H
9518 Points
Durchschnittliche Intel Core Ultra 7 155H, NVIDIA GeForce RTX 4070 Laptop GPU
  (9192 - 9518, n=4)
9335 Points -2%
Alienware x16 R2 P120F
NVIDIA GeForce RTX 4080 Laptop GPU, Ultra 9 185H, WDC PC SN810 1TB
7934 Points -17%
PCMark 10 / Digital Content Creation
Lenovo Legion Pro 5 16IRX9
NVIDIA GeForce RTX 4070 Laptop GPU, i9-14900HX, Samsung PM9A1 MZVL21T0HCLR
14827 Points +17%
Asus ROG Zephyrus G16 GA605WV
NVIDIA GeForce RTX 4060 Laptop GPU, Ryzen AI 9 HX 370, Micron 2400 MTFDKBA1T0QFM
13309 Points +5%
Razer Blade 16 2024, RTX 4090
NVIDIA GeForce RTX 4090 Laptop GPU, i9-14900HX, Samsung PM9A1 MZVL22T0HBLB
13219 Points +4%
Alienware x16 R2 P120F
NVIDIA GeForce RTX 4080 Laptop GPU, Ultra 9 185H, WDC PC SN810 1TB
12994 Points +2%
Maingear ML-16 MK2
NVIDIA GeForce RTX 4070 Laptop GPU, Ultra 7 155H
12692 Points
Durchschnittliche Intel Core Ultra 7 155H, NVIDIA GeForce RTX 4070 Laptop GPU
  (10100 - 13035, n=4)
11610 Points -9%
HP Victus 16 (2024)
NVIDIA GeForce RTX 4060 Laptop GPU, i7-14700HX, Kioxia XG8 KXG80ZNV512G
10841 Points -15%
CrossMark / Overall
Razer Blade 16 2024, RTX 4090
NVIDIA GeForce RTX 4090 Laptop GPU, i9-14900HX, Samsung PM9A1 MZVL22T0HBLB
2149 Points +27%
Lenovo Legion Pro 5 16IRX9
NVIDIA GeForce RTX 4070 Laptop GPU, i9-14900HX, Samsung PM9A1 MZVL21T0HCLR
2002 Points +19%
HP Victus 16 (2024)
NVIDIA GeForce RTX 4060 Laptop GPU, i7-14700HX, Kioxia XG8 KXG80ZNV512G
1923 Points +14%
Asus ROG Zephyrus G16 GA605WV
NVIDIA GeForce RTX 4060 Laptop GPU, Ryzen AI 9 HX 370, Micron 2400 MTFDKBA1T0QFM
1819 Points +8%
Durchschnittliche Intel Core Ultra 7 155H, NVIDIA GeForce RTX 4070 Laptop GPU
  (1687 - 1848, n=4)
1755 Points +4%
Maingear ML-16 MK2
NVIDIA GeForce RTX 4070 Laptop GPU, Ultra 7 155H
1687 Points
Alienware x16 R2 P120F
NVIDIA GeForce RTX 4080 Laptop GPU, Ultra 9 185H, WDC PC SN810 1TB
1589 Points -6%
CrossMark / Productivity
Razer Blade 16 2024, RTX 4090
NVIDIA GeForce RTX 4090 Laptop GPU, i9-14900HX, Samsung PM9A1 MZVL22T0HBLB
2007 Points +26%
Lenovo Legion Pro 5 16IRX9
NVIDIA GeForce RTX 4070 Laptop GPU, i9-14900HX, Samsung PM9A1 MZVL21T0HCLR
1827 Points +15%
HP Victus 16 (2024)
NVIDIA GeForce RTX 4060 Laptop GPU, i7-14700HX, Kioxia XG8 KXG80ZNV512G
1782 Points +12%
Durchschnittliche Intel Core Ultra 7 155H, NVIDIA GeForce RTX 4070 Laptop GPU
  (1589 - 1750, n=4)
1662 Points +5%
Asus ROG Zephyrus G16 GA605WV
NVIDIA GeForce RTX 4060 Laptop GPU, Ryzen AI 9 HX 370, Micron 2400 MTFDKBA1T0QFM
1637 Points +3%
Maingear ML-16 MK2
NVIDIA GeForce RTX 4070 Laptop GPU, Ultra 7 155H
1589 Points
Alienware x16 R2 P120F
NVIDIA GeForce RTX 4080 Laptop GPU, Ultra 9 185H, WDC PC SN810 1TB
1584 Points 0%
CrossMark / Creativity
Razer Blade 16 2024, RTX 4090
NVIDIA GeForce RTX 4090 Laptop GPU, i9-14900HX, Samsung PM9A1 MZVL22T0HBLB
2418 Points +30%
Lenovo Legion Pro 5 16IRX9
NVIDIA GeForce RTX 4070 Laptop GPU, i9-14900HX, Samsung PM9A1 MZVL21T0HCLR
2287 Points +23%
Asus ROG Zephyrus G16 GA605WV
NVIDIA GeForce RTX 4060 Laptop GPU, Ryzen AI 9 HX 370, Micron 2400 MTFDKBA1T0QFM
2264 Points +22%
HP Victus 16 (2024)
NVIDIA GeForce RTX 4060 Laptop GPU, i7-14700HX, Kioxia XG8 KXG80ZNV512G
2107 Points +13%
Durchschnittliche Intel Core Ultra 7 155H, NVIDIA GeForce RTX 4070 Laptop GPU
  (1860 - 2014, n=4)
1932 Points +4%
Maingear ML-16 MK2
NVIDIA GeForce RTX 4070 Laptop GPU, Ultra 7 155H
1860 Points
Alienware x16 R2 P120F
NVIDIA GeForce RTX 4080 Laptop GPU, Ultra 9 185H, WDC PC SN810 1TB
1583 Points -15%
CrossMark / Responsiveness
Razer Blade 16 2024, RTX 4090
NVIDIA GeForce RTX 4090 Laptop GPU, i9-14900HX, Samsung PM9A1 MZVL22T0HBLB
1851 Points +23%
HP Victus 16 (2024)
NVIDIA GeForce RTX 4060 Laptop GPU, i7-14700HX, Kioxia XG8 KXG80ZNV512G
1835 Points +22%
Lenovo Legion Pro 5 16IRX9
NVIDIA GeForce RTX 4070 Laptop GPU, i9-14900HX, Samsung PM9A1 MZVL21T0HCLR
1769 Points +17%
Alienware x16 R2 P120F
NVIDIA GeForce RTX 4080 Laptop GPU, Ultra 9 185H, WDC PC SN810 1TB
1621 Points +8%
Durchschnittliche Intel Core Ultra 7 155H, NVIDIA GeForce RTX 4070 Laptop GPU
  (1424 - 1683, n=4)
1548 Points +3%
Maingear ML-16 MK2
NVIDIA GeForce RTX 4070 Laptop GPU, Ultra 7 155H
1507 Points
Asus ROG Zephyrus G16 GA605WV
NVIDIA GeForce RTX 4060 Laptop GPU, Ryzen AI 9 HX 370, Micron 2400 MTFDKBA1T0QFM
1293 Points -14%
WebXPRT 3 / Overall
Razer Blade 16 2024, RTX 4090
NVIDIA GeForce RTX 4090 Laptop GPU, i9-14900HX, Samsung PM9A1 MZVL22T0HBLB
330 Points +25%
Lenovo Legion Pro 5 16IRX9
NVIDIA GeForce RTX 4070 Laptop GPU, i9-14900HX, Samsung PM9A1 MZVL21T0HCLR
322 Points +22%
Durchschnittliche Intel Core Ultra 7 155H, NVIDIA GeForce RTX 4070 Laptop GPU
  (264 - 294, n=4)
281 Points +6%
HP Victus 16 (2024)
NVIDIA GeForce RTX 4060 Laptop GPU, i7-14700HX, Kioxia XG8 KXG80ZNV512G
276 Points +5%
Maingear ML-16 MK2
NVIDIA GeForce RTX 4070 Laptop GPU, Ultra 7 155H
264 Points
Alienware x16 R2 P120F
NVIDIA GeForce RTX 4080 Laptop GPU, Ultra 9 185H, WDC PC SN810 1TB
237 Points -10%
WebXPRT 4 / Overall
Lenovo Legion Pro 5 16IRX9
NVIDIA GeForce RTX 4070 Laptop GPU, i9-14900HX, Samsung PM9A1 MZVL21T0HCLR
291 Points +18%
Asus ROG Zephyrus G16 GA605WV
NVIDIA GeForce RTX 4060 Laptop GPU, Ryzen AI 9 HX 370, Micron 2400 MTFDKBA1T0QFM
259 Points +5%
Durchschnittliche Intel Core Ultra 7 155H, NVIDIA GeForce RTX 4070 Laptop GPU
  (247 - 257, n=4)
254 Points +3%
HP Victus 16 (2024)
NVIDIA GeForce RTX 4060 Laptop GPU, i7-14700HX, Kioxia XG8 KXG80ZNV512G
251 Points +2%
Maingear ML-16 MK2
NVIDIA GeForce RTX 4070 Laptop GPU, Ultra 7 155H
247 Points
Alienware x16 R2 P120F
NVIDIA GeForce RTX 4080 Laptop GPU, Ultra 9 185H, WDC PC SN810 1TB
237 Points -4%
Mozilla Kraken 1.1 / Total
Alienware x16 R2 P120F
NVIDIA GeForce RTX 4080 Laptop GPU, Ultra 9 185H, WDC PC SN810 1TB
594 ms * -5%
Maingear ML-16 MK2
NVIDIA GeForce RTX 4070 Laptop GPU, Ultra 7 155H
568 ms *
Durchschnittliche Intel Core Ultra 7 155H, NVIDIA GeForce RTX 4070 Laptop GPU
  (546 - 568, n=3)
554 ms * +2%
HP Victus 16 (2024)
NVIDIA GeForce RTX 4060 Laptop GPU, i7-14700HX, Kioxia XG8 KXG80ZNV512G
542 ms * +5%
Razer Blade 16 2024, RTX 4090
NVIDIA GeForce RTX 4090 Laptop GPU, i9-14900HX, Samsung PM9A1 MZVL22T0HBLB
450 ms * +21%
Lenovo Legion Pro 5 16IRX9
NVIDIA GeForce RTX 4070 Laptop GPU, i9-14900HX, Samsung PM9A1 MZVL21T0HCLR
449 ms * +21%
Asus ROG Zephyrus G16 GA605WV
NVIDIA GeForce RTX 4060 Laptop GPU, Ryzen AI 9 HX 370, Micron 2400 MTFDKBA1T0QFM
434 ms * +24%

* ... kleinere Werte sind besser

PCMark 10 Score
7704 Punkte
Hilfe
AIDA64 / Memory Copy
Alienware x16 R2 P120F
Intel Core Ultra 9 185H, NVIDIA GeForce RTX 4080 Laptop GPU
89701 MB/s +35%
Asus ROG Zephyrus G16 GA605WV
AMD Ryzen AI 9 HX 370, NVIDIA GeForce RTX 4060 Laptop GPU
89564 MB/s +35%
Durchschnittliche Intel Core Ultra 7 155H
  (62397 - 96791, n=45)
83293 MB/s +25%
Lenovo Legion Pro 5 16IRX9
Intel Core i9-14900HX, NVIDIA GeForce RTX 4070 Laptop GPU
78979 MB/s +19%
Razer Blade 16 2024, RTX 4090
Intel Core i9-14900HX, NVIDIA GeForce RTX 4090 Laptop GPU
78799 MB/s +18%
HP Victus 16 (2024)
Intel Core i7-14700HX, NVIDIA GeForce RTX 4060 Laptop GPU
66599 MB/s 0%
Maingear ML-16 MK2
Intel Core Ultra 7 155H, NVIDIA GeForce RTX 4070 Laptop GPU
66526 MB/s
AIDA64 / Memory Read
Asus ROG Zephyrus G16 GA605WV
AMD Ryzen AI 9 HX 370, NVIDIA GeForce RTX 4060 Laptop GPU
99713 MB/s +59%
Razer Blade 16 2024, RTX 4090
Intel Core i9-14900HX, NVIDIA GeForce RTX 4090 Laptop GPU
86387 MB/s +38%
Lenovo Legion Pro 5 16IRX9
Intel Core i9-14900HX, NVIDIA GeForce RTX 4070 Laptop GPU
86376 MB/s +38%
Alienware x16 R2 P120F
Intel Core Ultra 9 185H, NVIDIA GeForce RTX 4080 Laptop GPU
85092 MB/s +36%
HP Victus 16 (2024)
Intel Core i7-14700HX, NVIDIA GeForce RTX 4060 Laptop GPU
81049 MB/s +29%
Durchschnittliche Intel Core Ultra 7 155H
  (60544 - 90647, n=45)
79984 MB/s +28%
Maingear ML-16 MK2
Intel Core Ultra 7 155H, NVIDIA GeForce RTX 4070 Laptop GPU
62637 MB/s
AIDA64 / Memory Write
Asus ROG Zephyrus G16 GA605WV
AMD Ryzen AI 9 HX 370, NVIDIA GeForce RTX 4060 Laptop GPU
98802 MB/s +53%
Lenovo Legion Pro 5 16IRX9
Intel Core i9-14900HX, NVIDIA GeForce RTX 4070 Laptop GPU
77346 MB/s +20%
Razer Blade 16 2024, RTX 4090
Intel Core i9-14900HX, NVIDIA GeForce RTX 4090 Laptop GPU
75421 MB/s +17%
Alienware x16 R2 P120F
Intel Core Ultra 9 185H, NVIDIA GeForce RTX 4080 Laptop GPU
73199 MB/s +14%
Durchschnittliche Intel Core Ultra 7 155H
  (58692 - 93451, n=45)
72558 MB/s +13%
HP Victus 16 (2024)
Intel Core i7-14700HX, NVIDIA GeForce RTX 4060 Laptop GPU
65204 MB/s +1%
Maingear ML-16 MK2
Intel Core Ultra 7 155H, NVIDIA GeForce RTX 4070 Laptop GPU
64451 MB/s
AIDA64 / Memory Latency
Maingear ML-16 MK2
Intel Core Ultra 7 155H, NVIDIA GeForce RTX 4070 Laptop GPU
165.4 ns *
Durchschnittliche Intel Core Ultra 7 155H
  (120.2 - 233, n=45)
144.2 ns * +13%
Alienware x16 R2 P120F
Intel Core Ultra 9 185H, NVIDIA GeForce RTX 4080 Laptop GPU
142.3 ns * +14%
Asus ROG Zephyrus G16 GA605WV
AMD Ryzen AI 9 HX 370, NVIDIA GeForce RTX 4060 Laptop GPU
114.2 ns * +31%
HP Victus 16 (2024)
Intel Core i7-14700HX, NVIDIA GeForce RTX 4060 Laptop GPU
96.4 ns * +42%
Razer Blade 16 2024, RTX 4090
Intel Core i9-14900HX, NVIDIA GeForce RTX 4090 Laptop GPU
83.4 ns * +50%
Lenovo Legion Pro 5 16IRX9
Intel Core i9-14900HX, NVIDIA GeForce RTX 4070 Laptop GPU
83.4 ns * +50%

* ... kleinere Werte sind besser

DPC-Latenzen

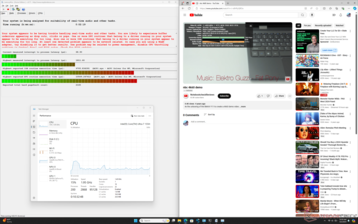
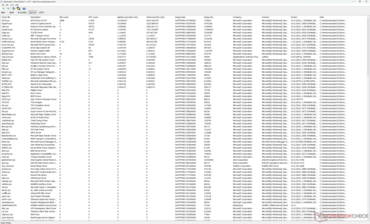
LatencyMon zeigt mehr als die erwarteten DPC-Probleme im Zusammenhang mit den ACPI-Treibern, selbst im MSHybrid-Modus. Zusätzlich traten während eines 60-sekündigen 4K60-Testvideos 33 Bildaussetzer auf, obwohl keine erwartet wurden, insbesondere bei einer Meteor Lake-H-CPU. Diese Bildaussetzer äußern sich beim Streaming von 4K-Videos als Stottern und könnten auf ein zugrunde liegendes Treiberproblem oder eine unzureichende Hintergrundaktivitätsverwaltung hinweisen, die das Hauptscreen beeinträchtigen.

LatencyMon
LatencyMon
Treiberliste
Treiberliste
DPC Latencies / LatencyMon - interrupt to process latency (max), Web, Youtube, Prime95
Alienware x16 R2 P120F
NVIDIA GeForce RTX 4080 Laptop GPU, Ultra 9 185H, WDC PC SN810 1TB
16146 μs * -791%
Maingear ML-16 MK2
NVIDIA GeForce RTX 4070 Laptop GPU, Ultra 7 155H
1811.6 μs *
Razer Blade 16 2024, RTX 4090
NVIDIA GeForce RTX 4090 Laptop GPU, i9-14900HX, Samsung PM9A1 MZVL22T0HBLB
1389.7 μs * +23%
Lenovo Legion Pro 5 16IRX9
NVIDIA GeForce RTX 4070 Laptop GPU, i9-14900HX, Samsung PM9A1 MZVL21T0HCLR
989.1 μs * +45%
HP Victus 16 (2024)
NVIDIA GeForce RTX 4060 Laptop GPU, i7-14700HX, Kioxia XG8 KXG80ZNV512G
853.9 μs * +53%
Asus ROG Zephyrus G16 GA605WV
NVIDIA GeForce RTX 4060 Laptop GPU, Ryzen AI 9 HX 370, Micron 2400 MTFDKBA1T0QFM
566.1 μs * +69%

* ... kleinere Werte sind besser

Massenspeicher

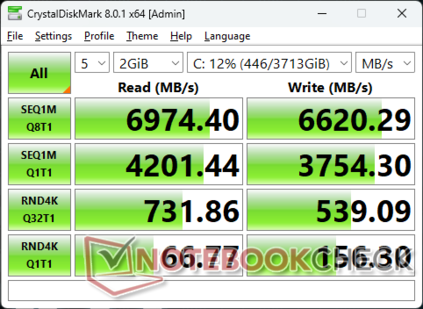
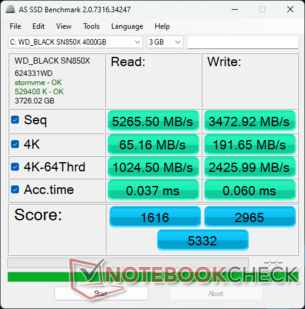
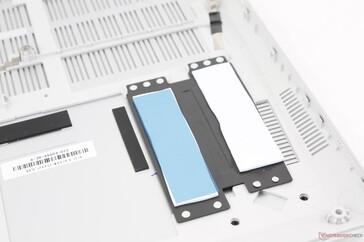
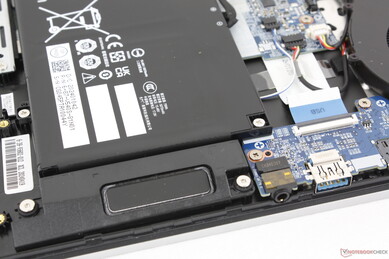
Das Maingear ML-16 MK2 ist eines der wenigen Systeme, die mit 4 TB WD Black SN850X x4 NVMe-Optionen ausgestattet sind. Die Übertragungsraten sind mit fast 7000 MB/s hervorragend, und es wurde keine Drosselung bei Belastung festgestellt. Wir gehen davon aus, dass der Kühlkörper und die Wärmeleitpads standardmäßig mitgeliefert werden, um die Wärmeableitung zu unterstützen.

CDM 8
CDM 8
AS SSD
AS SSD
Wärmeleitpads und Kühlkörper für die beiden SSD- Slots
Benutzer können bis zu zwei M.2 2280 SSDs installieren
CDM 5/6 Read Seq Q32T1: 6971 MB/s
CDM 5/6 Write Seq Q32T1: 6353 MB/s
CDM 5/6 Read 4K Q32T1: 728.3 MB/s
CDM 5/6 Write 4K Q32T1: 550.3 MB/s
CDM 5 Read Seq: 4232 MB/s
CDM 5 Write Seq: 3877 MB/s
CDM 5/6 Read 4K: 67.61 MB/s
CDM 5/6 Write 4K: 156.6 MB/s
Drive Performance Rating - Percent
Lenovo Legion Pro 5 16IRX9
Samsung PM9A1 MZVL21T0HCLR
92 pt
Alienware x16 R2 P120F
WDC PC SN810 1TB
89.4 pt
Razer Blade 16 2024, RTX 4090
Samsung PM9A1 MZVL22T0HBLB
82.3 pt
HP Victus 16 (2024)
Kioxia XG8 KXG80ZNV512G
78.7 pt
Maingear ML-16 MK2
 
70.2 pt
Asus ROG Zephyrus G16 GA605WV
Micron 2400 MTFDKBA1T0QFM
45.5 pt
DiskSpd
seq read
Alienware x16 R2 P120F
WDC PC SN810 1TB
4224 (3741.6min - 4224.02max) MB/s +4%
Maingear ML-16 MK2
 
4072 (3998.88min - 4072.22max) MB/s
Lenovo Legion Pro 5 16IRX9
Samsung PM9A1 MZVL21T0HCLR
4037 (3964.04min - 4036.7max) MB/s -1%
Razer Blade 16 2024, RTX 4090
Samsung PM9A1 MZVL22T0HBLB
3795 (3693.04min - 3794.8max) MB/s -7%
HP Victus 16 (2024)
Kioxia XG8 KXG80ZNV512G
3469 (3344.35min - 3469.11max) MB/s -15%
Asus ROG Zephyrus G16 GA605WV
Micron 2400 MTFDKBA1T0QFM
2267 (2202.85min - 2267.15max) MB/s -44%
seq write
Alienware x16 R2 P120F
WDC PC SN810 1TB
4899 (4625.25min - 4898.53max) MB/s +29%
Lenovo Legion Pro 5 16IRX9
Samsung PM9A1 MZVL21T0HCLR
4093 (4016.82min - 4092.8max) MB/s +8%
HP Victus 16 (2024)
Kioxia XG8 KXG80ZNV512G
3895 (3747.67min - 3894.8max) MB/s +3%
Maingear ML-16 MK2
 
3800 (3465.53min - 3800.25max) MB/s
Razer Blade 16 2024, RTX 4090
Samsung PM9A1 MZVL22T0HBLB
3794 (3745.51min - 3793.5max) MB/s 0%
Asus ROG Zephyrus G16 GA605WV
Micron 2400 MTFDKBA1T0QFM
2542 (2385.77min - 2541.75max) MB/s -33%
seq q8 t1 read
Maingear ML-16 MK2
 
6972 (6330.54min - 6971.87max) MB/s
HP Victus 16 (2024)
Kioxia XG8 KXG80ZNV512G
6933 (6552.34min - 6933.16max) MB/s -1%
Alienware x16 R2 P120F
WDC PC SN810 1TB
6823 (5715.47min - 6822.87max) MB/s -2%
Razer Blade 16 2024, RTX 4090
Samsung PM9A1 MZVL22T0HBLB
6673 (5801.28min - 6672.72max) MB/s -4%
Lenovo Legion Pro 5 16IRX9
Samsung PM9A1 MZVL21T0HCLR
6636 (6205.02min - 6635.75max) MB/s -5%
Asus ROG Zephyrus G16 GA605WV
Micron 2400 MTFDKBA1T0QFM
4946 (3626.31min - 4945.75max) MB/s -29%
seq q8 t1 write
Maingear ML-16 MK2
 
6566 (6531.01min - 6566.18max) MB/s
Alienware x16 R2 P120F
WDC PC SN810 1TB
5208 (5161.3min - 5208.07max) MB/s -21%
Lenovo Legion Pro 5 16IRX9
Samsung PM9A1 MZVL21T0HCLR
4949 (4932.28min - 4948.61max) MB/s -25%
Razer Blade 16 2024, RTX 4090
Samsung PM9A1 MZVL22T0HBLB
4936 (4909.47min - 4936.28max) MB/s -25%
HP Victus 16 (2024)
Kioxia XG8 KXG80ZNV512G
4392 (3922.93min - 4391.65max) MB/s -33%
Asus ROG Zephyrus G16 GA605WV
Micron 2400 MTFDKBA1T0QFM
3387 (3154.75min - 3386.9max) MB/s -48%
4k q1 t1 read
Lenovo Legion Pro 5 16IRX9
Samsung PM9A1 MZVL21T0HCLR
92.7 (91.49min - 92.68max) MB/s +40%
Alienware x16 R2 P120F
WDC PC SN810 1TB
79.3 (64.25min - 79.25max) MB/s +20%
Razer Blade 16 2024, RTX 4090
Samsung PM9A1 MZVL22T0HBLB
71.4 (66.19min - 71.35max) MB/s +8%
Maingear ML-16 MK2
 
66 (65.15min - 66.01max) MB/s
HP Victus 16 (2024)
Kioxia XG8 KXG80ZNV512G
46.2 (45.32min - 46.24max) MB/s -30%
Asus ROG Zephyrus G16 GA605WV
Micron 2400 MTFDKBA1T0QFM
40.3 (40.03min - 40.33max) MB/s -39%
4k q1 t1 write
Lenovo Legion Pro 5 16IRX9
Samsung PM9A1 MZVL21T0HCLR
251 (249.74min - 251.16max) MB/s +57%
HP Victus 16 (2024)
Kioxia XG8 KXG80ZNV512G
251 (249.24min - 250.87max) MB/s +57%
Alienware x16 R2 P120F
WDC PC SN810 1TB
244 (238.59min - 244.13max) MB/s +52%
Razer Blade 16 2024, RTX 4090
Samsung PM9A1 MZVL22T0HBLB
205 (202.97min - 204.75max) MB/s +28%
Maingear ML-16 MK2
 
160.3 (156.3min - 160.29max) MB/s
Asus ROG Zephyrus G16 GA605WV
Micron 2400 MTFDKBA1T0QFM
93.9 (77.46min - 93.94max) MB/s -41%
4k q32 t16 read
Alienware x16 R2 P120F
WDC PC SN810 1TB
4245 (4210.56min - 4245.12max) MB/s +259%
Lenovo Legion Pro 5 16IRX9
Samsung PM9A1 MZVL21T0HCLR
4055 (4044.11min - 4055.48max) MB/s +243%
Razer Blade 16 2024, RTX 4090
Samsung PM9A1 MZVL22T0HBLB
3726 (3704.12min - 3725.6max) MB/s +215%
HP Victus 16 (2024)
Kioxia XG8 KXG80ZNV512G
3330 (3310.23min - 3329.64max) MB/s +182%
Maingear ML-16 MK2
 
1182 (1152.17min - 1182.3max) MB/s
Asus ROG Zephyrus G16 GA605WV
Micron 2400 MTFDKBA1T0QFM
550 (536.5min - 549.61max) MB/s -53%
4k q32 t16 write
Razer Blade 16 2024, RTX 4090
Samsung PM9A1 MZVL22T0HBLB
3548 (3533.85min - 3548.33max) MB/s +549%
Lenovo Legion Pro 5 16IRX9
Samsung PM9A1 MZVL21T0HCLR
3542 (3491.17min - 3541.69max) MB/s +548%
Alienware x16 R2 P120F
WDC PC SN810 1TB
2907 (2737.8min - 2907.05max) MB/s +431%
HP Victus 16 (2024)
Kioxia XG8 KXG80ZNV512G
2405 (937.07min - 2405.2max) MB/s +340%
Maingear ML-16 MK2
 
547 (529.87min - 547.07max) MB/s
Asus ROG Zephyrus G16 GA605WV
Micron 2400 MTFDKBA1T0QFM
313 (297.37min - 312.94max) MB/s -43%
AS SSD
Score Total
Lenovo Legion Pro 5 16IRX9
Samsung PM9A1 MZVL21T0HCLR
8364 Points +57%
Alienware x16 R2 P120F
WDC PC SN810 1TB
8139 Points +53%
HP Victus 16 (2024)
Kioxia XG8 KXG80ZNV512G
7423 Points +39%
Razer Blade 16 2024, RTX 4090
Samsung PM9A1 MZVL22T0HBLB
7040 Points +32%
Maingear ML-16 MK2
 
5332 Points
Asus ROG Zephyrus G16 GA605WV
Micron 2400 MTFDKBA1T0QFM
3564 Points -33%
Score Read
Lenovo Legion Pro 5 16IRX9
Samsung PM9A1 MZVL21T0HCLR
3233 Points +100%
Alienware x16 R2 P120F
WDC PC SN810 1TB
3204 Points +98%
HP Victus 16 (2024)
Kioxia XG8 KXG80ZNV512G
3007 Points +86%
Razer Blade 16 2024, RTX 4090
Samsung PM9A1 MZVL22T0HBLB
2848 Points +76%
Maingear ML-16 MK2
 
1616 Points
Asus ROG Zephyrus G16 GA605WV
Micron 2400 MTFDKBA1T0QFM
954 Points -41%
Score Write
Lenovo Legion Pro 5 16IRX9
Samsung PM9A1 MZVL21T0HCLR
3543 Points +19%
Alienware x16 R2 P120F
WDC PC SN810 1TB
3341 Points +13%
Maingear ML-16 MK2
 
2965 Points
HP Victus 16 (2024)
Kioxia XG8 KXG80ZNV512G
2919 Points -2%
Razer Blade 16 2024, RTX 4090
Samsung PM9A1 MZVL22T0HBLB
2766 Points -7%
Asus ROG Zephyrus G16 GA605WV
Micron 2400 MTFDKBA1T0QFM
2185 Points -26%
Seq Read
Alienware x16 R2 P120F
WDC PC SN810 1TB
5642.41 MB/s +7%
Lenovo Legion Pro 5 16IRX9
Samsung PM9A1 MZVL21T0HCLR
5355.36 MB/s +2%
Maingear ML-16 MK2
 
5265.5 MB/s
HP Victus 16 (2024)
Kioxia XG8 KXG80ZNV512G
5247.63 MB/s 0%
Razer Blade 16 2024, RTX 4090
Samsung PM9A1 MZVL22T0HBLB
4371 MB/s -17%
Asus ROG Zephyrus G16 GA605WV
Micron 2400 MTFDKBA1T0QFM
3863 MB/s -27%
Seq Write
Alienware x16 R2 P120F
WDC PC SN810 1TB
4787.7 MB/s +38%
HP Victus 16 (2024)
Kioxia XG8 KXG80ZNV512G
4617.83 MB/s +33%
Lenovo Legion Pro 5 16IRX9
Samsung PM9A1 MZVL21T0HCLR
3950.35 MB/s +14%
Razer Blade 16 2024, RTX 4090
Samsung PM9A1 MZVL22T0HBLB
3791 MB/s +9%
Maingear ML-16 MK2
 
3472.92 MB/s
Asus ROG Zephyrus G16 GA605WV
Micron 2400 MTFDKBA1T0QFM
2555 MB/s -26%
4K Read
Lenovo Legion Pro 5 16IRX9
Samsung PM9A1 MZVL21T0HCLR
82.62 MB/s +27%
Alienware x16 R2 P120F
WDC PC SN810 1TB
70.48 MB/s +8%
Maingear ML-16 MK2
 
65.16 MB/s
Razer Blade 16 2024, RTX 4090
Samsung PM9A1 MZVL22T0HBLB
61.1 MB/s -6%
HP Victus 16 (2024)
Kioxia XG8 KXG80ZNV512G
51.41 MB/s -21%
Asus ROG Zephyrus G16 GA605WV
Micron 2400 MTFDKBA1T0QFM
27.8 MB/s -57%
4K Write
HP Victus 16 (2024)
Kioxia XG8 KXG80ZNV512G
218.1 MB/s +14%
Lenovo Legion Pro 5 16IRX9
Samsung PM9A1 MZVL21T0HCLR
213.76 MB/s +12%
Alienware x16 R2 P120F
WDC PC SN810 1TB
213.62 MB/s +11%
Maingear ML-16 MK2
 
191.65 MB/s
Asus ROG Zephyrus G16 GA605WV
Micron 2400 MTFDKBA1T0QFM
185.4 MB/s -3%
Razer Blade 16 2024, RTX 4090
Samsung PM9A1 MZVL22T0HBLB
160.6 MB/s -16%
4K-64 Read
Lenovo Legion Pro 5 16IRX9
Samsung PM9A1 MZVL21T0HCLR
2615.17 MB/s +155%
Alienware x16 R2 P120F
WDC PC SN810 1TB
2569.34 MB/s +151%
HP Victus 16 (2024)
Kioxia XG8 KXG80ZNV512G
2430.71 MB/s +137%
Razer Blade 16 2024, RTX 4090
Samsung PM9A1 MZVL22T0HBLB
2350 MB/s +129%
Maingear ML-16 MK2
 
1024.5 MB/s
Asus ROG Zephyrus G16 GA605WV
Micron 2400 MTFDKBA1T0QFM
539 MB/s -47%
4K-64 Write
Lenovo Legion Pro 5 16IRX9
Samsung PM9A1 MZVL21T0HCLR
2933.74 MB/s +21%
Alienware x16 R2 P120F
WDC PC SN810 1TB
2648.4 MB/s +9%
Maingear ML-16 MK2
 
2425.99 MB/s
HP Victus 16 (2024)
Kioxia XG8 KXG80ZNV512G
2238.92 MB/s -8%
Razer Blade 16 2024, RTX 4090
Samsung PM9A1 MZVL22T0HBLB
2226 MB/s -8%
Asus ROG Zephyrus G16 GA605WV
Micron 2400 MTFDKBA1T0QFM
1744 MB/s -28%
Access Time Read
HP Victus 16 (2024)
Kioxia XG8 KXG80ZNV512G
0.137 ms * -270%
Alienware x16 R2 P120F
WDC PC SN810 1TB
0.09 ms * -143%
Lenovo Legion Pro 5 16IRX9
Samsung PM9A1 MZVL21T0HCLR
0.042 ms * -14%
Maingear ML-16 MK2
 
0.037 ms *
Razer Blade 16 2024, RTX 4090
Samsung PM9A1 MZVL22T0HBLB
0.033 ms * +11%
Asus ROG Zephyrus G16 GA605WV
Micron 2400 MTFDKBA1T0QFM
0.027 ms * +27%
Access Time Write
Asus ROG Zephyrus G16 GA605WV
Micron 2400 MTFDKBA1T0QFM
0.139 ms * -132%
Maingear ML-16 MK2
 
0.06 ms *
Lenovo Legion Pro 5 16IRX9
Samsung PM9A1 MZVL21T0HCLR
0.059 ms * +2%
Alienware x16 R2 P120F
WDC PC SN810 1TB
0.055 ms * +8%
Razer Blade 16 2024, RTX 4090
Samsung PM9A1 MZVL22T0HBLB
0.025 ms * +58%
HP Victus 16 (2024)
Kioxia XG8 KXG80ZNV512G
0.019 ms * +68%

* ... kleinere Werte sind besser

Dauerleistung Lesen: DiskSpd Read Loop, Queue Depth 8

035070010501400175021002450280031503500385042004550490052505600595063006650Tooltip
Maingear ML-16 MK2; diskspd 2.0.17 f: Ø6943 (5802.4-6977.43)

GPU Performance

Die mobile GeForce RTX 4070 ist einige Prozentpunkte langsamer als der Durchschnitt der Laptops in unserer Datenbank mit der gleichen GPU-Option. Ihre Gesamtleistung liegt nur 5 bis 15 Prozent über der Basisoption RTX 4060 und etwa 15 Prozent über der älteren RTX 3070 Ti. Die Leistungsdifferenz wird noch größer, wenn man die mobile RTX 4070 mit der mobilen RTX 4080 vergleicht, wobei letztere bei diesem Modell nicht konfiguriert werden kann.

Es ist wichtig zu beachten, dass die mobile RTX 4070 etwa 35 bis 40 Prozent langsamer ist als ihr Desktop-Pendant.

EnergieprofileGrafikleistungPhysics ScoreCPU-Leistung
Performance-Modus28464268979495
Balanced-Modus28238 (-0%)16060 (-40%)8049 (-15%)
Battery Power5539 (-81%)12186 (-55%)1715 (-82%)

Die Verwendung des Balanced-Modus anstelle des Performance-Modus hat erhebliche Auswirkungen auf die CPU-Leistung, während die Grafikleistung laut den oben genannten Fire-Strike-Ergebnissen unverändert bleibt. Diese Beobachtungen stimmen mit unseren Feststellungen im Abschnitt „Stresstest“ überein. Auch der Battery Power-Betrieb beeinflusst die Gesamtleistung, selbst wenn der Performance-Modus aktiviert ist.

3DMark 11
3DMark 11
Fire Strike
Fire Strike
Time Spy
Time Spy
Speed Way
Speed Way
Steel Nomad
Steel Nomad
 
3DMark Performance Rating - Percent
Razer Blade 16 2024, RTX 4090 -1!
NVIDIA GeForce RTX 4090 Laptop GPU, Intel Core i9-14900HX
100 pt
KFA2 GeForce RTX 4070 EX Gamer
NVIDIA GeForce RTX 4070, AMD Ryzen 9 7950X
93.1 pt
Alienware x16 R2 P120F
NVIDIA GeForce RTX 4080 Laptop GPU, Intel Core Ultra 9 185H
92.6 pt
Lenovo Yoga Pro 9 16IMH9 -1!
NVIDIA GeForce RTX 4070 Laptop GPU, Intel Core Ultra 9 185H
63.5 pt
Durchschnittliche NVIDIA GeForce RTX 4070 Laptop GPU
 
61 pt
Maingear ML-16 MK2
NVIDIA GeForce RTX 4070 Laptop GPU, Intel Core Ultra 7 155H
57 pt
HP Victus 16 (2024) -1!
NVIDIA GeForce RTX 4060 Laptop GPU, Intel Core i7-14700HX
54.3 pt
HP Omen 16-b0085ng -1!
NVIDIA GeForce RTX 3070 Laptop GPU, Intel Core i7-11800H
52.3 pt
CSL GameStar Notebook VenomGamer G16 -1!
AMD Radeon RX 7600M, AMD Ryzen 7 7735HS
50.8 pt
Asus ROG Zephyrus M16 GU603Z -1!
NVIDIA GeForce RTX 3070 Ti Laptop GPU, Intel Core i9-12900H
50.4 pt
Asus TUF Gaming A16 FA617XS
AMD Radeon RX 7600S, AMD Ryzen 9 7940HS
48 pt
HP Victus 16-r0076TX
NVIDIA GeForce RTX 4050 Laptop GPU, Intel Core i5-13500HX
46.5 pt
HP Omen 16-n0033dx
AMD Radeon RX 6650M, AMD Ryzen 7 6800H
45.3 pt
Acer Nitro 16 AN16-41-R7YE
NVIDIA GeForce RTX 4050 Laptop GPU, AMD Ryzen 5 7535HS
44.7 pt
Lenovo Legion C7 15IMH05 82EH0030GE -1!
NVIDIA GeForce RTX 2070 Max-Q, Intel Core i7-10875H
38 pt
3DMark 11 - 1280x720 Performance GPU
Razer Blade 16 2024, RTX 4090
NVIDIA GeForce RTX 4090 Laptop GPU, Intel Core i9-14900HX
65956 Points +77%
KFA2 GeForce RTX 4070 EX Gamer
NVIDIA GeForce RTX 4070, AMD Ryzen 9 7950X
60428 Points +62%
Alienware x16 R2 P120F
NVIDIA GeForce RTX 4080 Laptop GPU, Intel Core Ultra 9 185H
56772 Points +52%
Lenovo Yoga Pro 9 16IMH9
NVIDIA GeForce RTX 4070 Laptop GPU, Intel Core Ultra 9 185H
40646 Points +9%
Durchschnittliche NVIDIA GeForce RTX 4070 Laptop GPU
  (24229 - 46434, n=59)
40410 Points +8%
Maingear ML-16 MK2
NVIDIA GeForce RTX 4070 Laptop GPU, Intel Core Ultra 7 155H
37263 Points
CSL GameStar Notebook VenomGamer G16
AMD Radeon RX 7600M, AMD Ryzen 7 7735HS
35101 Points -6%
HP Victus 16 (2024)
NVIDIA GeForce RTX 4060 Laptop GPU, Intel Core i7-14700HX
35045 Points -6%
HP Omen 16-b0085ng
NVIDIA GeForce RTX 3070 Laptop GPU, Intel Core i7-11800H
34644 Points -7%
Asus TUF Gaming A16 FA617XS
AMD Radeon RX 7600S, AMD Ryzen 9 7940HS
33037 Points -11%
HP Omen 16-n0033dx
AMD Radeon RX 6650M, AMD Ryzen 7 6800H
32846 Points -12%
Asus ROG Zephyrus M16 GU603Z
NVIDIA GeForce RTX 3070 Ti Laptop GPU, Intel Core i9-12900H
32236 Points -13%
HP Victus 16-r0076TX
NVIDIA GeForce RTX 4050 Laptop GPU, Intel Core i5-13500HX
31571 Points -15%
Acer Nitro 16 AN16-41-R7YE
NVIDIA GeForce RTX 4050 Laptop GPU, AMD Ryzen 5 7535HS
30717 Points -18%
Lenovo Legion C7 15IMH05 82EH0030GE
NVIDIA GeForce RTX 2070 Max-Q, Intel Core i7-10875H
24040 Points -35%
3DMark
1920x1080 Fire Strike Graphics
Razer Blade 16 2024, RTX 4090
NVIDIA GeForce RTX 4090 Laptop GPU, Intel Core i9-14900HX
46527 Points +63%
KFA2 GeForce RTX 4070 EX Gamer
NVIDIA GeForce RTX 4070, AMD Ryzen 9 7950X
44065 Points +55%
Alienware x16 R2 P120F
NVIDIA GeForce RTX 4080 Laptop GPU, Intel Core Ultra 9 185H
42558 Points +50%
Lenovo Yoga Pro 9 16IMH9
NVIDIA GeForce RTX 4070 Laptop GPU, Intel Core Ultra 9 185H
30874 Points +8%
Durchschnittliche NVIDIA GeForce RTX 4070 Laptop GPU
  (12242 - 33451, n=62)
29041 Points +2%
Maingear ML-16 MK2
NVIDIA GeForce RTX 4070 Laptop GPU, Intel Core Ultra 7 155H
28464 Points
HP Victus 16 (2024)
NVIDIA GeForce RTX 4060 Laptop GPU, Intel Core i7-14700HX
26844 Points -6%
Asus TUF Gaming A16 FA617XS
AMD Radeon RX 7600S, AMD Ryzen 9 7940HS
26154 Points -8%
HP Omen 16-n0033dx
AMD Radeon RX 6650M, AMD Ryzen 7 6800H
25739 Points -10%
CSL GameStar Notebook VenomGamer G16
AMD Radeon RX 7600M, AMD Ryzen 7 7735HS
25679 Points -10%
Asus ROG Zephyrus M16 GU603Z
NVIDIA GeForce RTX 3070 Ti Laptop GPU, Intel Core i9-12900H
24618 Points -14%
HP Omen 16-b0085ng
NVIDIA GeForce RTX 3070 Laptop GPU, Intel Core i7-11800H
24384 Points -14%
HP Victus 16-r0076TX
NVIDIA GeForce RTX 4050 Laptop GPU, Intel Core i5-13500HX
23524 Points -17%
Acer Nitro 16 AN16-41-R7YE
NVIDIA GeForce RTX 4050 Laptop GPU, AMD Ryzen 5 7535HS
23204 Points -18%
Lenovo Legion C7 15IMH05 82EH0030GE
NVIDIA GeForce RTX 2070 Max-Q, Intel Core i7-10875H
18684 Points -34%
2560x1440 Time Spy Graphics
Razer Blade 16 2024, RTX 4090
NVIDIA GeForce RTX 4090 Laptop GPU, Intel Core i9-14900HX
19878 Points +86%
Alienware x16 R2 P120F
NVIDIA GeForce RTX 4080 Laptop GPU, Intel Core Ultra 9 185H
18627 Points +74%
KFA2 GeForce RTX 4070 EX Gamer
NVIDIA GeForce RTX 4070, AMD Ryzen 9 7950X
17827 Points +67%
Lenovo Yoga Pro 9 16IMH9
NVIDIA GeForce RTX 4070 Laptop GPU, Intel Core Ultra 9 185H
12181 Points +14%
Durchschnittliche NVIDIA GeForce RTX 4070 Laptop GPU
  (5012 - 13391, n=60)
11603 Points +9%
Maingear ML-16 MK2
NVIDIA GeForce RTX 4070 Laptop GPU, Intel Core Ultra 7 155H
10691 Points
HP Omen 16-b0085ng
NVIDIA GeForce RTX 3070 Laptop GPU, Intel Core i7-11800H
10019 Points -6%
HP Victus 16 (2024)
NVIDIA GeForce RTX 4060 Laptop GPU, Intel Core i7-14700HX
9937 Points -7%
Asus ROG Zephyrus M16 GU603Z
NVIDIA GeForce RTX 3070 Ti Laptop GPU, Intel Core i9-12900H
9421 Points -12%
Asus TUF Gaming A16 FA617XS
AMD Radeon RX 7600S, AMD Ryzen 9 7940HS
9203 Points -14%
CSL GameStar Notebook VenomGamer G16
AMD Radeon RX 7600M, AMD Ryzen 7 7735HS
9097 Points -15%
HP Omen 16-n0033dx
AMD Radeon RX 6650M, AMD Ryzen 7 6800H
8700 Points -19%
HP Victus 16-r0076TX
NVIDIA GeForce RTX 4050 Laptop GPU, Intel Core i5-13500HX
8621 Points -19%
Acer Nitro 16 AN16-41-R7YE
NVIDIA GeForce RTX 4050 Laptop GPU, AMD Ryzen 5 7535HS
8363 Points -22%
Lenovo Legion C7 15IMH05 82EH0030GE
NVIDIA GeForce RTX 2070 Max-Q, Intel Core i7-10875H
7093 Points -34%
2560x1440 Time Spy Score
Razer Blade 16 2024, RTX 4090
NVIDIA GeForce RTX 4090 Laptop GPU, Intel Core i9-14900HX
18732 Points +74%
KFA2 GeForce RTX 4070 EX Gamer
NVIDIA GeForce RTX 4070, AMD Ryzen 9 7950X
17690 Points +64%
Alienware x16 R2 P120F
NVIDIA GeForce RTX 4080 Laptop GPU, Intel Core Ultra 9 185H
17164 Points +60%
Lenovo Yoga Pro 9 16IMH9
NVIDIA GeForce RTX 4070 Laptop GPU, Intel Core Ultra 9 185H
12105 Points +13%
Durchschnittliche NVIDIA GeForce RTX 4070 Laptop GPU
  (5339 - 13871, n=60)
11749 Points +9%
Maingear ML-16 MK2
NVIDIA GeForce RTX 4070 Laptop GPU, Intel Core Ultra 7 155H
10759 Points
HP Victus 16 (2024)
NVIDIA GeForce RTX 4060 Laptop GPU, Intel Core i7-14700HX
10542 Points -2%
HP Omen 16-b0085ng
NVIDIA GeForce RTX 3070 Laptop GPU, Intel Core i7-11800H
10126 Points -6%
Asus ROG Zephyrus M16 GU603Z
NVIDIA GeForce RTX 3070 Ti Laptop GPU, Intel Core i9-12900H
9841 Points -9%
Asus TUF Gaming A16 FA617XS
AMD Radeon RX 7600S, AMD Ryzen 9 7940HS
9530 Points -11%
CSL GameStar Notebook VenomGamer G16
AMD Radeon RX 7600M, AMD Ryzen 7 7735HS
9172 Points -15%
HP Victus 16-r0076TX
NVIDIA GeForce RTX 4050 Laptop GPU, Intel Core i5-13500HX
9069 Points -16%
HP Omen 16-n0033dx
AMD Radeon RX 6650M, AMD Ryzen 7 6800H
8869 Points -18%
Acer Nitro 16 AN16-41-R7YE
NVIDIA GeForce RTX 4050 Laptop GPU, AMD Ryzen 5 7535HS
8227 Points -24%
Lenovo Legion C7 15IMH05 82EH0030GE
NVIDIA GeForce RTX 2070 Max-Q, Intel Core i7-10875H
7411 Points -31%
2560x1440 Speed Way Score
Alienware x16 R2 P120F
NVIDIA GeForce RTX 4080 Laptop GPU, Intel Core Ultra 9 185H
4688 Points +79%
KFA2 GeForce RTX 4070 EX Gamer
NVIDIA GeForce RTX 4070, AMD Ryzen 9 7950X
4445 Points +70%
Durchschnittliche NVIDIA GeForce RTX 4070 Laptop GPU
  (1333 - 3166, n=30)
2813 Points +7%
Maingear ML-16 MK2
NVIDIA GeForce RTX 4070 Laptop GPU, Intel Core Ultra 7 155H
2620 Points
HP Victus 16-r0076TX
NVIDIA GeForce RTX 4050 Laptop GPU, Intel Core i5-13500HX
1987 Points -24%
Acer Nitro 16 AN16-41-R7YE
NVIDIA GeForce RTX 4050 Laptop GPU, AMD Ryzen 5 7535HS
1928 Points -26%
Asus TUF Gaming A16 FA617XS
AMD Radeon RX 7600S, AMD Ryzen 9 7940HS
1705 Points -35%
HP Omen 16-n0033dx
AMD Radeon RX 6650M, AMD Ryzen 7 6800H
1418 Points -46%
3DMark 11 Performance
31266 Punkte
3DMark Cloud Gate Standard Score
57717 Punkte
3DMark Fire Strike Score
23552 Punkte
3DMark Time Spy Score
10759 Punkte
3DMark Steel Nomad Score
2329 Punkte
Hilfe
Blender
v3.3 Classroom HIP/AMD
Durchschnittliche NVIDIA GeForce RTX 4070 Laptop GPU
  ()
330 Seconds *
CSL GameStar Notebook VenomGamer G16
AMD Radeon RX 7600M, AMD Ryzen 7 7735HS
63 Seconds *
v3.3 Classroom OPTIX/RTX
Asus ROG Zephyrus M16 GU603Z
NVIDIA GeForce RTX 3070 Ti Laptop GPU, Intel Core i9-12900H
28 Seconds * -33%
HP Victus 16-r0076TX
NVIDIA GeForce RTX 4050 Laptop GPU, Intel Core i5-13500HX
28 Seconds * -33%
Acer Nitro 16 AN16-41-R7YE
NVIDIA GeForce RTX 4050 Laptop GPU, AMD Ryzen 5 7535HS
26 Seconds * -24%
MSI Stealth 16 Mercedes-AMG Motorsport A13VG
NVIDIA GeForce RTX 4070 Laptop GPU, Intel Core i9-13900H
23 Seconds * -10%
HP Victus 16 (2024)
NVIDIA GeForce RTX 4060 Laptop GPU, Intel Core i7-14700HX
22 Seconds * -5%
Durchschnittliche NVIDIA GeForce RTX 4070 Laptop GPU
  (18 - 30, n=60)
21.5 Seconds * -2%
Maingear ML-16 MK2
NVIDIA GeForce RTX 4070 Laptop GPU, Intel Core Ultra 7 155H
21 Seconds *
Alienware x16 R2 P120F
NVIDIA GeForce RTX 4080 Laptop GPU, Intel Core Ultra 9 185H
15 Seconds * +29%
KFA2 GeForce RTX 4070 EX Gamer
NVIDIA GeForce RTX 4070, AMD Ryzen 9 7950X
14 Seconds * +33%
Razer Blade 16 2024, RTX 4090
NVIDIA GeForce RTX 4090 Laptop GPU, Intel Core i9-14900HX
12 Seconds * +43%
v3.3 Classroom CUDA
Acer Nitro 16 AN16-41-R7YE
NVIDIA GeForce RTX 4050 Laptop GPU, AMD Ryzen 5 7535HS
50 Seconds * -47%
HP Victus 16-r0076TX
NVIDIA GeForce RTX 4050 Laptop GPU, Intel Core i5-13500HX
50 Seconds * -47%
Asus ROG Zephyrus M16 GU603Z
NVIDIA GeForce RTX 3070 Ti Laptop GPU, Intel Core i9-12900H
45 Seconds * -32%
HP Victus 16 (2024)
NVIDIA GeForce RTX 4060 Laptop GPU, Intel Core i7-14700HX
41 Seconds * -21%
Durchschnittliche NVIDIA GeForce RTX 4070 Laptop GPU
  (32 - 181, n=63)
40.6 Seconds * -19%
MSI Stealth 16 Mercedes-AMG Motorsport A13VG
NVIDIA GeForce RTX 4070 Laptop GPU, Intel Core i9-13900H
36 Seconds * -6%
Maingear ML-16 MK2
NVIDIA GeForce RTX 4070 Laptop GPU, Intel Core Ultra 7 155H
34 Seconds *
Alienware x16 R2 P120F
NVIDIA GeForce RTX 4080 Laptop GPU, Intel Core Ultra 9 185H
22 Seconds * +35%
Razer Blade 16 2024, RTX 4090
NVIDIA GeForce RTX 4090 Laptop GPU, Intel Core i9-14900HX
18 Seconds * +47%
v3.3 Classroom CPU
Acer Nitro 16 AN16-41-R7YE
NVIDIA GeForce RTX 4050 Laptop GPU, AMD Ryzen 5 7535HS
481 Seconds * -18%
Maingear ML-16 MK2
NVIDIA GeForce RTX 4070 Laptop GPU, Intel Core Ultra 7 155H
408 Seconds *
MSI Stealth 16 Mercedes-AMG Motorsport A13VG
NVIDIA GeForce RTX 4070 Laptop GPU, Intel Core i9-13900H
399 Seconds * +2%
HP Omen 16-n0033dx
AMD Radeon RX 6650M, AMD Ryzen 7 6800H
394 Seconds * +3%
CSL GameStar Notebook VenomGamer G16
AMD Radeon RX 7600M, AMD Ryzen 7 7735HS
355 Seconds * +13%
HP Victus 16-r0076TX
NVIDIA GeForce RTX 4050 Laptop GPU, Intel Core i5-13500HX
339 Seconds * +17%
Asus ROG Zephyrus M16 GU603Z
NVIDIA GeForce RTX 3070 Ti Laptop GPU, Intel Core i9-12900H
329 Seconds * +19%
HP Victus 16 (2024)
NVIDIA GeForce RTX 4060 Laptop GPU, Intel Core i7-14700HX
312 Seconds * +24%
Alienware x16 R2 P120F
NVIDIA GeForce RTX 4080 Laptop GPU, Intel Core Ultra 9 185H
305 Seconds * +25%
Asus TUF Gaming A16 FA617XS
AMD Radeon RX 7600S, AMD Ryzen 9 7940HS
301 Seconds * +26%
Durchschnittliche NVIDIA GeForce RTX 4070 Laptop GPU
  (158 - 440, n=59)
290 Seconds * +29%
Razer Blade 16 2024, RTX 4090
NVIDIA GeForce RTX 4090 Laptop GPU, Intel Core i9-14900HX
202 Seconds * +50%

* ... kleinere Werte sind besser

Gaming Performance

Die mobile RTX 4070 ist leistungsfähig genug, um moderne Titel auf maximalen Einstellungen in nativer QHD+-Auflösung zu spielen. Anspruchsvollere Spiele wie Cyberpunk 2077 sind ebenfalls möglich, benötigen jedoch DLSS, um 60 FPS oder mehr zu erreichen. Im In-Game-Benchmark mit Ultra-RT-Einstellungen und nativer 1600p-Auflösung erzielte das Spiel beispielsweise eine durchschnittliche Bildrate von nur 20,2 FPS im Vergleich zu 63,1 FPS mit aktiviertem DLSS 3 im Balanced-Modus.

Performance Rating - Percent
Razer Blade 16 2024, RTX 4090
Intel Core i9-14900HX, NVIDIA GeForce RTX 4090 Laptop GPU
96.5 pt
Lenovo Legion Pro 5 16IRX9
Intel Core i9-14900HX, NVIDIA GeForce RTX 4070 Laptop GPU
90.6 pt
Alienware x16 R2 P120F -1!
Intel Core Ultra 9 185H, NVIDIA GeForce RTX 4080 Laptop GPU
77.1 pt
Maingear ML-16 MK2
Intel Core Ultra 7 155H, NVIDIA GeForce RTX 4070 Laptop GPU
70.6 pt
HP Victus 16 (2024) -1!
Intel Core i7-14700HX, NVIDIA GeForce RTX 4060 Laptop GPU
69.6 pt
Asus ROG Zephyrus G16 GA605WV
AMD Ryzen AI 9 HX 370, NVIDIA GeForce RTX 4060 Laptop GPU
62.7 pt
GTA V - 1920x1080 Highest Settings possible AA:4xMSAA + FX AF:16x
Razer Blade 16 2024, RTX 4090
Intel Core i9-14900HX, NVIDIA GeForce RTX 4090 Laptop GPU
138.1 (4.19min, 83.3P1) fps +20%
Lenovo Legion Pro 5 16IRX9
Intel Core i9-14900HX, NVIDIA GeForce RTX 4070 Laptop GPU
127.2 (5.17min, 83.3P1) fps +11%
Maingear ML-16 MK2
Intel Core Ultra 7 155H, NVIDIA GeForce RTX 4070 Laptop GPU
115.1 (3.8min, 71.4P1) fps
HP Victus 16 (2024)
Intel Core i7-14700HX, NVIDIA GeForce RTX 4060 Laptop GPU
110.2 (8.03min, 76.9P1) fps -4%
Asus ROG Zephyrus G16 GA605WV
AMD Ryzen AI 9 HX 370, NVIDIA GeForce RTX 4060 Laptop GPU
100.1 (4.02min, 66.7P1) fps -13%
Final Fantasy XV Benchmark - 1920x1080 High Quality
Alienware x16 R2 P120F
Intel Core Ultra 9 185H, NVIDIA GeForce RTX 4080 Laptop GPU
139.8 fps +26%
Razer Blade 16 2024, RTX 4090
Intel Core i9-14900HX, NVIDIA GeForce RTX 4090 Laptop GPU
137.5 fps +24%
Lenovo Legion Pro 5 16IRX9
Intel Core i9-14900HX, NVIDIA GeForce RTX 4070 Laptop GPU
131 fps +18%
Maingear ML-16 MK2
Intel Core Ultra 7 155H, NVIDIA GeForce RTX 4070 Laptop GPU
110.6 fps
HP Victus 16 (2024)
Intel Core i7-14700HX, NVIDIA GeForce RTX 4060 Laptop GPU
98.1 fps -11%
Asus ROG Zephyrus G16 GA605WV
AMD Ryzen AI 9 HX 370, NVIDIA GeForce RTX 4060 Laptop GPU
90.7 fps -18%
Strange Brigade - 1920x1080 ultra AA:ultra AF:16
Razer Blade 16 2024, RTX 4090
Intel Core i9-14900HX, NVIDIA GeForce RTX 4090 Laptop GPU
359.8 (30.2min, 253P1) fps +87%
Alienware x16 R2 P120F
Intel Core Ultra 9 185H, NVIDIA GeForce RTX 4080 Laptop GPU
293 (38.3min, 184.1P1) fps +52%
Lenovo Legion Pro 5 16IRX9
Intel Core i9-14900HX, NVIDIA GeForce RTX 4070 Laptop GPU
234 (27.8min, 175.8P1) fps +21%
Maingear ML-16 MK2
Intel Core Ultra 7 155H, NVIDIA GeForce RTX 4070 Laptop GPU
192.8 (84.3min, 146.7P1) fps
HP Victus 16 (2024)
Intel Core i7-14700HX, NVIDIA GeForce RTX 4060 Laptop GPU
179 (76.4min, 130.3P1) fps -7%
Asus ROG Zephyrus G16 GA605WV
AMD Ryzen AI 9 HX 370, NVIDIA GeForce RTX 4060 Laptop GPU
174.9 (77.7min, 128P1) fps -9%
Dota 2 Reborn - 1920x1080 ultra (3/3) best looking
Razer Blade 16 2024, RTX 4090
Intel Core i9-14900HX, NVIDIA GeForce RTX 4090 Laptop GPU
188.1 (155.2min) fps +35%
Lenovo Legion Pro 5 16IRX9
Intel Core i9-14900HX, NVIDIA GeForce RTX 4070 Laptop GPU
185.3 (161min) fps +33%
HP Victus 16 (2024)
Intel Core i7-14700HX, NVIDIA GeForce RTX 4060 Laptop GPU
149.7 (130.4min) fps +8%
Asus ROG Zephyrus G16 GA605WV
AMD Ryzen AI 9 HX 370, NVIDIA GeForce RTX 4060 Laptop GPU
139.2 (118.4min) fps 0%
Maingear ML-16 MK2
Intel Core Ultra 7 155H, NVIDIA GeForce RTX 4070 Laptop GPU
139.2 (117.8min) fps
Alienware x16 R2 P120F
Intel Core Ultra 9 185H, NVIDIA GeForce RTX 4080 Laptop GPU
133 (114.6min) fps -4%
X-Plane 11.11 - 1920x1080 high (fps_test=3)
Razer Blade 16 2024, RTX 4090
Intel Core i9-14900HX, NVIDIA GeForce RTX 4090 Laptop GPU
146.2 fps +63%
Lenovo Legion Pro 5 16IRX9
Intel Core i9-14900HX, NVIDIA GeForce RTX 4070 Laptop GPU
137.6 fps +53%
HP Victus 16 (2024)
Intel Core i7-14700HX, NVIDIA GeForce RTX 4060 Laptop GPU
100.3 fps +12%
Maingear ML-16 MK2
Intel Core Ultra 7 155H, NVIDIA GeForce RTX 4070 Laptop GPU
89.8 fps
Alienware x16 R2 P120F
Intel Core Ultra 9 185H, NVIDIA GeForce RTX 4080 Laptop GPU
89.3 fps -1%
Asus ROG Zephyrus G16 GA605WV
AMD Ryzen AI 9 HX 370, NVIDIA GeForce RTX 4060 Laptop GPU
66.5 fps -26%
Far Cry 5 - 1920x1080 Ultra Preset AA:T
Lenovo Legion Pro 5 16IRX9
Intel Core i9-14900HX, NVIDIA GeForce RTX 4070 Laptop GPU
158 (121min) fps +39%
Razer Blade 16 2024, RTX 4090
Intel Core i9-14900HX, NVIDIA GeForce RTX 4090 Laptop GPU
127 fps +11%
Alienware x16 R2 P120F
Intel Core Ultra 9 185H, NVIDIA GeForce RTX 4080 Laptop GPU
114 (89min) fps 0%
Maingear ML-16 MK2
Intel Core Ultra 7 155H, NVIDIA GeForce RTX 4070 Laptop GPU
114 (87min) fps
Asus ROG Zephyrus G16 GA605WV
AMD Ryzen AI 9 HX 370, NVIDIA GeForce RTX 4060 Laptop GPU
112 fps -2%
Baldur's Gate 3
1920x1080 High Preset
Alienware x16 R2 P120F
Intel Core Ultra 9 185H, NVIDIA GeForce RTX 4080 Laptop GPU
161.2 fps +49%
Lenovo Yoga Pro 9 16IMH9
Intel Core Ultra 9 185H, NVIDIA GeForce RTX 4070 Laptop GPU
119.9 fps +11%
Maingear ML-16 MK2
Intel Core Ultra 7 155H, NVIDIA GeForce RTX 4070 Laptop GPU
108.2 fps
Durchschnittliche NVIDIA GeForce RTX 4070 Laptop GPU
  (72.7 - 129.3, n=19)
105.4 fps -3%
CSL GameStar Notebook VenomGamer G16
AMD Ryzen 7 7735HS, AMD Radeon RX 7600M
71 (48.1min, 59P0.1, 63.1P1) fps -34%
1920x1080 Ultra Preset
Alienware x16 R2 P120F
Intel Core Ultra 9 185H, NVIDIA GeForce RTX 4080 Laptop GPU
159.4 fps +49%
Lenovo Yoga Pro 9 16IMH9
Intel Core Ultra 9 185H, NVIDIA GeForce RTX 4070 Laptop GPU
117.7 fps +10%
Maingear ML-16 MK2
Intel Core Ultra 7 155H, NVIDIA GeForce RTX 4070 Laptop GPU
106.8 fps
Durchschnittliche NVIDIA GeForce RTX 4070 Laptop GPU
  (66.7 - 128.5, n=20)
103 fps -4%
CSL GameStar Notebook VenomGamer G16
AMD Ryzen 7 7735HS, AMD Radeon RX 7600M
68.9 (56.8min, 58.8P0.1, 62P1) fps -35%
2560x1440 Ultra Preset
Alienware x16 R2 P120F
Intel Core Ultra 9 185H, NVIDIA GeForce RTX 4080 Laptop GPU
124.3 fps +76%
Lenovo Yoga Pro 9 16IMH9
Intel Core Ultra 9 185H, NVIDIA GeForce RTX 4070 Laptop GPU
79.8 fps +13%
Durchschnittliche NVIDIA GeForce RTX 4070 Laptop GPU
  (54.4 - 89.6, n=18)
73.9 fps +5%
Maingear ML-16 MK2
Intel Core Ultra 7 155H, NVIDIA GeForce RTX 4070 Laptop GPU
70.6 fps
CSL GameStar Notebook VenomGamer G16
AMD Ryzen 7 7735HS, AMD Radeon RX 7600M
47.2 (41.5min, 42.1P0.1, 42.9P1) fps -33%
GTA V
1920x1080 Normal/Off AF:4x
KFA2 GeForce RTX 4070 EX Gamer
AMD Ryzen 9 7950X, NVIDIA GeForce RTX 4070
187.8 (2.92min, 200P1) fps +4%
Asus ROG Zephyrus M16 GU603Z
Intel Core i9-12900H, NVIDIA GeForce RTX 3070 Ti Laptop GPU
183.9 (3.13min, 142.9P1) fps +1%
Razer Blade 16 2024, RTX 4090
Intel Core i9-14900HX, NVIDIA GeForce RTX 4090 Laptop GPU
183.7 (1.84min, 76.9P1) fps +1%
Maingear ML-16 MK2
Intel Core Ultra 7 155H, NVIDIA GeForce RTX 4070 Laptop GPU
181.3 (2.62min, 111.1P1) fps
Asus TUF Gaming A16 FA617XS
AMD Ryzen 9 7940HS, AMD Radeon RX 7600S
180.8 (2.93min, 142.9P1) fps 0%
HP Victus 16 (2024)
Intel Core i7-14700HX, NVIDIA GeForce RTX 4060 Laptop GPU
180.8 (2.03min, 125P1) fps 0%
Durchschnittliche NVIDIA GeForce RTX 4070 Laptop GPU
  (159.9 - 187.5, n=35)
179.5 fps -1%
HP Omen 16-b0085ng
Intel Core i7-11800H, NVIDIA GeForce RTX 3070 Laptop GPU
178 (3.02min, 143P1) fps -2%
CSL GameStar Notebook VenomGamer G16
AMD Ryzen 7 7735HS, AMD Radeon RX 7600M
168.4 (5.18min, 125P1) fps -7%
1920x1080 High/On (Advanced Graphics Off) AA:2xMSAA + FX AF:8x
KFA2 GeForce RTX 4070 EX Gamer
AMD Ryzen 9 7950X, NVIDIA GeForce RTX 4070
187.4 (2.62min, 166.7P1) fps +7%
Razer Blade 16 2024, RTX 4090
Intel Core i9-14900HX, NVIDIA GeForce RTX 4090 Laptop GPU
181.6 (2.3min, 90.9P1) fps +4%
HP Victus 16 (2024)
Intel Core i7-14700HX, NVIDIA GeForce RTX 4060 Laptop GPU
176.1 (3.36min, 125P1) fps +1%
Maingear ML-16 MK2
Intel Core Ultra 7 155H, NVIDIA GeForce RTX 4070 Laptop GPU
175 (2.95min, 111.1P1) fps
HP Omen 16-b0085ng
Intel Core i7-11800H, NVIDIA GeForce RTX 3070 Laptop GPU
172 (3.01min, 111P1) fps -2%
Durchschnittliche NVIDIA GeForce RTX 4070 Laptop GPU
  (134.3 - 186.4, n=49)
171.9 fps -2%
Asus TUF Gaming A16 FA617XS
AMD Ryzen 9 7940HS, AMD Radeon RX 7600S
171.7 (5.08min, 125P1) fps -2%
Asus ROG Zephyrus M16 GU603Z
Intel Core i9-12900H, NVIDIA GeForce RTX 3070 Ti Laptop GPU
171.4 (3.71min, 111.1P1) fps -2%
Lenovo Yoga Pro 9 16IMH9
Intel Core Ultra 9 185H, NVIDIA GeForce RTX 4070 Laptop GPU
171.4 (3.71min, 111.1P1) fps -2%
CSL GameStar Notebook VenomGamer G16
AMD Ryzen 7 7735HS, AMD Radeon RX 7600M
145.2 (7min, 83.3P1) fps -17%
1920x1080 Highest Settings possible AA:4xMSAA + FX AF:16x
KFA2 GeForce RTX 4070 EX Gamer
AMD Ryzen 9 7950X, NVIDIA GeForce RTX 4070
160.9 (3.73min, 111.1P1) fps +40%
Razer Blade 16 2024, RTX 4090
Intel Core i9-14900HX, NVIDIA GeForce RTX 4090 Laptop GPU
138.1 (4.19min, 83.3P1) fps +20%
Maingear ML-16 MK2
Intel Core Ultra 7 155H, NVIDIA GeForce RTX 4070 Laptop GPU
115.1 (3.8min, 71.4P1) fps
Lenovo Yoga Pro 9 16IMH9
Intel Core Ultra 9 185H, NVIDIA GeForce RTX 4070 Laptop GPU
110.9 (3.51min, 71.4P1) fps -4%
Durchschnittliche NVIDIA GeForce RTX 4070 Laptop GPU
  (48.3 - 140.5, n=55)
110.9 fps -4%
HP Victus 16 (2024)
Intel Core i7-14700HX, NVIDIA GeForce RTX 4060 Laptop GPU
110.2 (8.03min, 76.9P1) fps -4%
Asus ROG Zephyrus M16 GU603Z
Intel Core i9-12900H, NVIDIA GeForce RTX 3070 Ti Laptop GPU
108.1 (4.18min, 76.9P1) fps -6%
HP Omen 16-b0085ng
Intel Core i7-11800H, NVIDIA GeForce RTX 3070 Laptop GPU
103 (6.42min, 71.4P1) fps -11%
Asus TUF Gaming A16 FA617XS
AMD Ryzen 9 7940HS, AMD Radeon RX 7600S
92.9 (26.7min, 62.5P1) fps -19%
CSL GameStar Notebook VenomGamer G16
AMD Ryzen 7 7735HS, AMD Radeon RX 7600M
77.7 (7.64min, 50P1) fps -32%
2560x1440 Highest Settings possible AA:4xMSAA + FX AF:16x
KFA2 GeForce RTX 4070 EX Gamer
AMD Ryzen 9 7950X, NVIDIA GeForce RTX 4070
136.2 (8.88min, 90.9P1) fps +50%
Razer Blade 16 2024, RTX 4090
Intel Core i9-14900HX, NVIDIA GeForce RTX 4090 Laptop GPU
126.9 (3.16min, 83.3P1) fps +40%
Maingear ML-16 MK2
Intel Core Ultra 7 155H, NVIDIA GeForce RTX 4070 Laptop GPU
90.6 (4.99min, 55.6P1) fps
Lenovo Yoga Pro 9 16IMH9
Intel Core Ultra 9 185H, NVIDIA GeForce RTX 4070 Laptop GPU
90.4 (4.07min, 58.8P1) fps 0%
Durchschnittliche NVIDIA GeForce RTX 4070 Laptop GPU
  (36.9 - 102.2, n=46)
86.5 fps -5%
Dota 2 Reborn
1920x1080 high (2/3)
KFA2 GeForce RTX 4070 EX Gamer
AMD Ryzen 9 7950X, NVIDIA GeForce RTX 4070
253.4 (213.5min) fps +74%
Razer Blade 16 2024, RTX 4090
Intel Core i9-14900HX, NVIDIA GeForce RTX 4090 Laptop GPU
201 (172.2min) fps +38%
Asus ROG Zephyrus M16 GU603Z
Intel Core i9-12900H, NVIDIA GeForce RTX 3070 Ti Laptop GPU
170.2 (149.7min) fps +17%
HP Victus 16 (2024)
Intel Core i7-14700HX, NVIDIA GeForce RTX 4060 Laptop GPU
168.4 (142.9min) fps +16%
HP Victus 16-r0076TX
Intel Core i5-13500HX, NVIDIA GeForce RTX 4050 Laptop GPU
159 (132.4min) fps +9%
Durchschnittliche NVIDIA GeForce RTX 4070 Laptop GPU
  (88.2 - 203, n=59)
157.4 fps +8%
Lenovo Yoga Pro 9 16IMH9
Intel Core Ultra 9 185H, NVIDIA GeForce RTX 4070 Laptop GPU
148.1 (129min) fps +2%
Maingear ML-16 MK2
Intel Core Ultra 7 155H, NVIDIA GeForce RTX 4070 Laptop GPU
145.3 (120.9min) fps
HP Omen 16-b0085ng
Intel Core i7-11800H, NVIDIA GeForce RTX 3070 Laptop GPU
145 (127.4min) fps 0%
Alienware x16 R2 P120F
Intel Core Ultra 9 185H, NVIDIA GeForce RTX 4080 Laptop GPU
139.2 (114.4min) fps -4%
Asus TUF Gaming A16 FA617XS
AMD Ryzen 9 7940HS, AMD Radeon RX 7600S
132.2 (114.1min) fps -9%
Acer Nitro 16 AN16-41-R7YE
AMD Ryzen 5 7535HS, NVIDIA GeForce RTX 4050 Laptop GPU
132.1 (115.6min) fps -9%
Lenovo Legion C7 15IMH05 82EH0030GE
Intel Core i7-10875H, NVIDIA GeForce RTX 2070 Max-Q
131 (114.9min) fps -10%
CSL GameStar Notebook VenomGamer G16
AMD Ryzen 7 7735HS, AMD Radeon RX 7600M
125.7 (108.9min) fps -13%
HP Omen 16-n0033dx
AMD Ryzen 7 6800H, AMD Radeon RX 6650M
118 (102.7min) fps -19%
1920x1080 ultra (3/3) best looking
KFA2 GeForce RTX 4070 EX Gamer
AMD Ryzen 9 7950X, NVIDIA GeForce RTX 4070
238.05 (199.8min) fps +71%
Razer Blade 16 2024, RTX 4090
Intel Core i9-14900HX, NVIDIA GeForce RTX 4090 Laptop GPU
188.1 (155.2min) fps +35%
Asus ROG Zephyrus M16 GU603Z
Intel Core i9-12900H, NVIDIA GeForce RTX 3070 Ti Laptop GPU
160.5 (140.4min) fps +15%
HP Victus 16 (2024)
Intel Core i7-14700HX, NVIDIA GeForce RTX 4060 Laptop GPU
149.7 (130.4min) fps +8%
Durchschnittliche NVIDIA GeForce RTX 4070 Laptop GPU
  (89.7 - 187.5, n=59)
147.6 fps +6%
HP Victus 16-r0076TX
Intel Core i5-13500HX, NVIDIA GeForce RTX 4050 Laptop GPU
145 (125.6min) fps +4%
Maingear ML-16 MK2
Intel Core Ultra 7 155H, NVIDIA GeForce RTX 4070 Laptop GPU
139.2 (117.8min) fps
Lenovo Yoga Pro 9 16IMH9
Intel Core Ultra 9 185H, NVIDIA GeForce RTX 4070 Laptop GPU
139 (119.7min) fps 0%
HP Omen 16-b0085ng
Intel Core i7-11800H, NVIDIA GeForce RTX 3070 Laptop GPU
137 (118.7min) fps -2%
Alienware x16 R2 P120F
Intel Core Ultra 9 185H, NVIDIA GeForce RTX 4080 Laptop GPU
133 (114.6min) fps -4%
Acer Nitro 16 AN16-41-R7YE
AMD Ryzen 5 7535HS, NVIDIA GeForce RTX 4050 Laptop GPU
125.2 (109.9min) fps -10%
Lenovo Legion C7 15IMH05 82EH0030GE
Intel Core i7-10875H, NVIDIA GeForce RTX 2070 Max-Q
125 (108.6min) fps -10%
Asus TUF Gaming A16 FA617XS
AMD Ryzen 9 7940HS, AMD Radeon RX 7600S
121.6 (100.8min) fps -13%
CSL GameStar Notebook VenomGamer G16
AMD Ryzen 7 7735HS, AMD Radeon RX 7600M
113 (96.3min) fps -19%
HP Omen 16-n0033dx
AMD Ryzen 7 6800H, AMD Radeon RX 6650M
100 (82.7min) fps -28%
Final Fantasy XV Benchmark
1920x1080 Standard Quality
KFA2 GeForce RTX 4070 EX Gamer
AMD Ryzen 9 7950X, NVIDIA GeForce RTX 4070
236 fps +61%
Alienware x16 R2 P120F
Intel Core Ultra 9 185H, NVIDIA GeForce RTX 4080 Laptop GPU
169.3 fps +16%
Lenovo Yoga Pro 9 16IMH9
Intel Core Ultra 9 185H, NVIDIA GeForce RTX 4070 Laptop GPU
156.2 fps +7%
Razer Blade 16 2024, RTX 4090
Intel Core i9-14900HX, NVIDIA GeForce RTX 4090 Laptop GPU
155.7 fps +6%
Durchschnittliche NVIDIA GeForce RTX 4070 Laptop GPU
  (84 - 185.9, n=49)
152.6 fps +4%
Maingear ML-16 MK2
Intel Core Ultra 7 155H, NVIDIA GeForce RTX 4070 Laptop GPU
146.3 fps
HP Victus 16 (2024)
Intel Core i7-14700HX, NVIDIA GeForce RTX 4060 Laptop GPU
135.3 fps -8%
Asus ROG Zephyrus M16 GU603Z
Intel Core i9-12900H, NVIDIA GeForce RTX 3070 Ti Laptop GPU
123.8 fps -15%
HP Victus 16-r0076TX
Intel Core i5-13500HX, NVIDIA GeForce RTX 4050 Laptop GPU
120.3 fps -18%
Asus TUF Gaming A16 FA617XS
AMD Ryzen 9 7940HS, AMD Radeon RX 7600S
117.2 fps -20%
Acer Nitro 16 AN16-41-R7YE
AMD Ryzen 5 7535HS, NVIDIA GeForce RTX 4050 Laptop GPU
116.2 fps -21%
HP Omen 16-n0033dx
AMD Ryzen 7 6800H, AMD Radeon RX 6650M
113.3 fps -23%
CSL GameStar Notebook VenomGamer G16
AMD Ryzen 7 7735HS, AMD Radeon RX 7600M
102.3 fps -30%
1920x1080 High Quality
KFA2 GeForce RTX 4070 EX Gamer
AMD Ryzen 9 7950X, NVIDIA GeForce RTX 4070
182.6 fps +65%
Alienware x16 R2 P120F
Intel Core Ultra 9 185H, NVIDIA GeForce RTX 4080 Laptop GPU
139.8 fps +26%
Razer Blade 16 2024, RTX 4090
Intel Core i9-14900HX, NVIDIA GeForce RTX 4090 Laptop GPU
137.5 fps +24%
Lenovo Yoga Pro 9 16IMH9
Intel Core Ultra 9 185H, NVIDIA GeForce RTX 4070 Laptop GPU
115.7 fps +5%
Durchschnittliche NVIDIA GeForce RTX 4070 Laptop GPU
  (41 - 131.9, n=57)
111 fps 0%
Maingear ML-16 MK2
Intel Core Ultra 7 155H, NVIDIA GeForce RTX 4070 Laptop GPU
110.6 fps
HP Victus 16 (2024)
Intel Core i7-14700HX, NVIDIA GeForce RTX 4060 Laptop GPU
98.1 fps -11%
Asus ROG Zephyrus M16 GU603Z
Intel Core i9-12900H, NVIDIA GeForce RTX 3070 Ti Laptop GPU
94.8 fps -14%
Asus TUF Gaming A16 FA617XS
AMD Ryzen 9 7940HS, AMD Radeon RX 7600S
85.2 fps -23%
HP Victus 16-r0076TX
Intel Core i5-13500HX, NVIDIA GeForce RTX 4050 Laptop GPU
84.8 fps -23%
Acer Nitro 16 AN16-41-R7YE
AMD Ryzen 5 7535HS, NVIDIA GeForce RTX 4050 Laptop GPU
83.5 fps -25%
HP Omen 16-n0033dx
AMD Ryzen 7 6800H, AMD Radeon RX 6650M
83.2 fps -25%
CSL GameStar Notebook VenomGamer G16
AMD Ryzen 7 7735HS, AMD Radeon RX 7600M
70.3 fps -36%
2560x1440 High Quality
KFA2 GeForce RTX 4070 EX Gamer
AMD Ryzen 9 7950X, NVIDIA GeForce RTX 4070
135.2 fps +69%
Razer Blade 16 2024, RTX 4090
Intel Core i9-14900HX, NVIDIA GeForce RTX 4090 Laptop GPU
126.8 fps +59%
Alienware x16 R2 P120F
Intel Core Ultra 9 185H, NVIDIA GeForce RTX 4080 Laptop GPU
120.8 fps +51%
Lenovo Yoga Pro 9 16IMH9
Intel Core Ultra 9 185H, NVIDIA GeForce RTX 4070 Laptop GPU
85.6 fps +7%
Durchschnittliche NVIDIA GeForce RTX 4070 Laptop GPU
  (32.5 - 119.9, n=52)
82.2 fps +3%
Maingear ML-16 MK2
Intel Core Ultra 7 155H, NVIDIA GeForce RTX 4070 Laptop GPU
80 fps
Asus ROG Zephyrus M16 GU603Z
Intel Core i9-12900H, NVIDIA GeForce RTX 3070 Ti Laptop GPU
72.1 fps -10%
X-Plane 11.11
1920x1080 med (fps_test=2)
KFA2 GeForce RTX 4070 EX Gamer
AMD Ryzen 9 7950X, NVIDIA GeForce RTX 4070
189.1 fps +52%
Razer Blade 16 2024, RTX 4090
Intel Core i9-14900HX, NVIDIA GeForce RTX 4090 Laptop GPU
182.3 fps +47%
Asus ROG Zephyrus M16 GU603Z
Intel Core i9-12900H, NVIDIA GeForce RTX 3070 Ti Laptop GPU
145.7 fps +17%
HP Victus 16-r0076TX
Intel Core i5-13500HX, NVIDIA GeForce RTX 4050 Laptop GPU
138.8 fps +12%
Durchschnittliche NVIDIA GeForce RTX 4070 Laptop GPU
  (80.4 - 187.1, n=59)
132.6 fps +7%
HP Victus 16 (2024)
Intel Core i7-14700HX, NVIDIA GeForce RTX 4060 Laptop GPU
129.2 fps +4%
Maingear ML-16 MK2
Intel Core Ultra 7 155H, NVIDIA GeForce RTX 4070 Laptop GPU
124.4 fps
HP Omen 16-b0085ng
Intel Core i7-11800H, NVIDIA GeForce RTX 3070 Laptop GPU
121 fps -3%
Lenovo Yoga Pro 9 16IMH9
Intel Core Ultra 9 185H, NVIDIA GeForce RTX 4070 Laptop GPU
118.7 fps -5%
Alienware x16 R2 P120F
Intel Core Ultra 9 185H, NVIDIA GeForce RTX 4080 Laptop GPU
117.4 fps -6%
Acer Nitro 16 AN16-41-R7YE
AMD Ryzen 5 7535HS, NVIDIA GeForce RTX 4050 Laptop GPU
101.6 fps -18%
Lenovo Legion C7 15IMH05 82EH0030GE
Intel Core i7-10875H, NVIDIA GeForce RTX 2070 Max-Q
101 fps -19%
CSL GameStar Notebook VenomGamer G16
AMD Ryzen 7 7735HS, AMD Radeon RX 7600M
76 fps -39%
Asus TUF Gaming A16 FA617XS
AMD Ryzen 9 7940HS, AMD Radeon RX 7600S
72 fps -42%
HP Omen 16-n0033dx
AMD Ryzen 7 6800H, AMD Radeon RX 6650M
52.7 fps -58%
1920x1080 high (fps_test=3)
KFA2 GeForce RTX 4070 EX Gamer
AMD Ryzen 9 7950X, NVIDIA GeForce RTX 4070
150 fps +67%
Razer Blade 16 2024, RTX 4090
Intel Core i9-14900HX, NVIDIA GeForce RTX 4090 Laptop GPU
146.2 fps +63%
Asus ROG Zephyrus M16 GU603Z
Intel Core i9-12900H, NVIDIA GeForce RTX 3070 Ti Laptop GPU
115 fps +28%
HP Victus 16-r0076TX
Intel Core i5-13500HX, NVIDIA GeForce RTX 4050 Laptop GPU
106.5 fps +19%
Durchschnittliche NVIDIA GeForce RTX 4070 Laptop GPU
  (58.9 - 144.4, n=61)
104.6 fps +16%
HP Victus 16 (2024)
Intel Core i7-14700HX, NVIDIA GeForce RTX 4060 Laptop GPU
100.3 fps +12%
HP Omen 16-b0085ng
Intel Core i7-11800H, NVIDIA GeForce RTX 3070 Laptop GPU
96.7 fps +8%
Lenovo Yoga Pro 9 16IMH9
Intel Core Ultra 9 185H, NVIDIA GeForce RTX 4070 Laptop GPU
90.5 fps +1%
Maingear ML-16 MK2
Intel Core Ultra 7 155H, NVIDIA GeForce RTX 4070 Laptop GPU
89.8 fps
Alienware x16 R2 P120F
Intel Core Ultra 9 185H, NVIDIA GeForce RTX 4080 Laptop GPU
89.3 fps -1%
Lenovo Legion C7 15IMH05 82EH0030GE
Intel Core i7-10875H, NVIDIA GeForce RTX 2070 Max-Q
84.4 fps -6%
Acer Nitro 16 AN16-41-R7YE
AMD Ryzen 5 7535HS, NVIDIA GeForce RTX 4050 Laptop GPU
81.4 fps -9%
CSL GameStar Notebook VenomGamer G16
AMD Ryzen 7 7735HS, AMD Radeon RX 7600M
62.1 fps -31%
Asus TUF Gaming A16 FA617XS
AMD Ryzen 9 7940HS, AMD Radeon RX 7600S
57.3 fps -36%
HP Omen 16-n0033dx
AMD Ryzen 7 6800H, AMD Radeon RX 6650M
46.4 fps -48%
Far Cry 5
1920x1080 High Preset AA:T
KFA2 GeForce RTX 4070 EX Gamer
AMD Ryzen 9 7950X, NVIDIA GeForce RTX 4070
204 (158min) fps +63%
Durchschnittliche NVIDIA GeForce RTX 4070 Laptop GPU
  (98 - 170, n=33)
135.9 fps +9%
Razer Blade 16 2024, RTX 4090
Intel Core i9-14900HX, NVIDIA GeForce RTX 4090 Laptop GPU
134 fps +7%
Lenovo Yoga Pro 9 16IMH9
Intel Core Ultra 9 185H, NVIDIA GeForce RTX 4070 Laptop GPU
130 fps +4%
Asus ROG Zephyrus M16 GU603Z
Intel Core i9-12900H, NVIDIA GeForce RTX 3070 Ti Laptop GPU
128 fps +2%
Maingear ML-16 MK2
Intel Core Ultra 7 155H, NVIDIA GeForce RTX 4070 Laptop GPU
125 (95min) fps
HP Omen 16-b0085ng
Intel Core i7-11800H, NVIDIA GeForce RTX 3070 Laptop GPU
123 fps -2%
Alienware x16 R2 P120F
Intel Core Ultra 9 185H, NVIDIA GeForce RTX 4080 Laptop GPU
122 (97min) fps -2%
Asus TUF Gaming A16 FA617XS
AMD Ryzen 9 7940HS, AMD Radeon RX 7600S
115 (88min) fps -8%
HP Victus 16-r0076TX
Intel Core i5-13500HX, NVIDIA GeForce RTX 4050 Laptop GPU
110 (88min) fps -12%
CSL GameStar Notebook VenomGamer G16
AMD Ryzen 7 7735HS, AMD Radeon RX 7600M
110 (89min) fps -12%
Acer Nitro 16 AN16-41-R7YE
AMD Ryzen 5 7535HS, NVIDIA GeForce RTX 4050 Laptop GPU
108 (82min) fps -14%
Lenovo Legion C7 15IMH05 82EH0030GE
Intel Core i7-10875H, NVIDIA GeForce RTX 2070 Max-Q
105 (87min) fps -16%
1920x1080 Ultra Preset AA:T
KFA2 GeForce RTX 4070 EX Gamer
AMD Ryzen 9 7950X, NVIDIA GeForce RTX 4070
189 (137min) fps +66%
Durchschnittliche NVIDIA GeForce RTX 4070 Laptop GPU
  (92 - 158, n=34)
127.2 fps +12%
Razer Blade 16 2024, RTX 4090
Intel Core i9-14900HX, NVIDIA GeForce RTX 4090 Laptop GPU
127 fps +11%
Asus ROG Zephyrus M16 GU603Z
Intel Core i9-12900H, NVIDIA GeForce RTX 3070 Ti Laptop GPU
124 fps +9%
Lenovo Yoga Pro 9 16IMH9
Intel Core Ultra 9 185H, NVIDIA GeForce RTX 4070 Laptop GPU
116 fps +2%
HP Omen 16-b0085ng
Intel Core i7-11800H, NVIDIA GeForce RTX 3070 Laptop GPU
115 fps +1%
Alienware x16 R2 P120F
Intel Core Ultra 9 185H, NVIDIA GeForce RTX 4080 Laptop GPU
114 (89min) fps 0%
Maingear ML-16 MK2
Intel Core Ultra 7 155H, NVIDIA GeForce RTX 4070 Laptop GPU
114 (87min) fps
HP Victus 16-r0076TX
Intel Core i5-13500HX, NVIDIA GeForce RTX 4050 Laptop GPU
109 (84min) fps -4%
Asus TUF Gaming A16 FA617XS
AMD Ryzen 9 7940HS, AMD Radeon RX 7600S
108 (77min) fps -5%
CSL GameStar Notebook VenomGamer G16
AMD Ryzen 7 7735HS, AMD Radeon RX 7600M
103 (82min) fps -10%
Acer Nitro 16 AN16-41-R7YE
AMD Ryzen 5 7535HS, NVIDIA GeForce RTX 4050 Laptop GPU
102 (70min) fps -11%
Lenovo Legion C7 15IMH05 82EH0030GE
Intel Core i7-10875H, NVIDIA GeForce RTX 2070 Max-Q
99 (89min) fps -13%
2560x1440 Ultra Preset AA:T
KFA2 GeForce RTX 4070 EX Gamer
AMD Ryzen 9 7950X, NVIDIA GeForce RTX 4070
171 (138min) fps +69%
Razer Blade 16 2024, RTX 4090
Intel Core i9-14900HX, NVIDIA GeForce RTX 4090 Laptop GPU
125 fps +24%
Alienware x16 R2 P120F
Intel Core Ultra 9 185H, NVIDIA GeForce RTX 4080 Laptop GPU
114 (84min) fps +13%
Lenovo Yoga Pro 9 16IMH9
Intel Core Ultra 9 185H, NVIDIA GeForce RTX 4070 Laptop GPU
109 fps +8%
Durchschnittliche NVIDIA GeForce RTX 4070 Laptop GPU
  (79 - 128, n=31)
108.8 fps +8%
Maingear ML-16 MK2
Intel Core Ultra 7 155H, NVIDIA GeForce RTX 4070 Laptop GPU
101 (82min) fps
Asus ROG Zephyrus M16 GU603Z
Intel Core i9-12900H, NVIDIA GeForce RTX 3070 Ti Laptop GPU
90 fps -11%
Strange Brigade
1920x1080 high AA:high AF:8
KFA2 GeForce RTX 4070 EX Gamer
AMD Ryzen 9 7950X, NVIDIA GeForce RTX 4070
376 (50.3min, 269P1) fps +68%
Razer Blade 16 2024, RTX 4090
Intel Core i9-14900HX, NVIDIA GeForce RTX 4090 Laptop GPU
368 (5min, 238P1) fps +64%
Alienware x16 R2 P120F
Intel Core Ultra 9 185H, NVIDIA GeForce RTX 4080 Laptop GPU
317 (105.9min, 203P1) fps +42%
Lenovo Yoga Pro 9 16IMH9
Intel Core Ultra 9 185H, NVIDIA GeForce RTX 4070 Laptop GPU
244 fps +9%
Durchschnittliche NVIDIA GeForce RTX 4070 Laptop GPU
  (136.6 - 268, n=51)
226 fps +1%
Maingear ML-16 MK2
Intel Core Ultra 7 155H, NVIDIA GeForce RTX 4070 Laptop GPU
224 (160.9min, 169.3P1) fps
HP Omen 16-b0085ng
Intel Core i7-11800H, NVIDIA GeForce RTX 3070 Laptop GPU
205 (42.7min, 153P1) fps -8%
HP Victus 16 (2024)
Intel Core i7-14700HX, NVIDIA GeForce RTX 4060 Laptop GPU
205 (68.3min, 145.6P1) fps -8%
Asus TUF Gaming A16 FA617XS
AMD Ryzen 9 7940HS, AMD Radeon RX 7600S
190.8 (17.3min, 137P1) fps -15%
HP Omen 16-n0033dx
AMD Ryzen 7 6800H, AMD Radeon RX 6650M
190 (123.2min, 140.4P1) fps -15%
Asus ROG Zephyrus M16 GU603Z
Intel Core i9-12900H, NVIDIA GeForce RTX 3070 Ti Laptop GPU
187.9 (72.5min, 138.2P1) fps -16%
CSL GameStar Notebook VenomGamer G16
AMD Ryzen 7 7735HS, AMD Radeon RX 7600M
185 (122.6min, 138.3P1) fps -17%
HP Victus 16-r0076TX
Intel Core i5-13500HX, NVIDIA GeForce RTX 4050 Laptop GPU
171.8 (75.5min, 130.9P1) fps -23%
Acer Nitro 16 AN16-41-R7YE
AMD Ryzen 5 7535HS, NVIDIA GeForce RTX 4050 Laptop GPU
169.3 (91.4min, 130.3P1) fps -24%
1920x1080 ultra AA:ultra AF:16
Razer Blade 16 2024, RTX 4090
Intel Core i9-14900HX, NVIDIA GeForce RTX 4090 Laptop GPU
359.8 (30.2min, 253P1) fps +87%
KFA2 GeForce RTX 4070 EX Gamer
AMD Ryzen 9 7950X, NVIDIA GeForce RTX 4070
322 (130.7min, 237P1) fps +67%
Alienware x16 R2 P120F
Intel Core Ultra 9 185H, NVIDIA GeForce RTX 4080 Laptop GPU
293 (38.3min, 184.1P1) fps +52%
Lenovo Yoga Pro 9 16IMH9
Intel Core Ultra 9 185H, NVIDIA GeForce RTX 4070 Laptop GPU
213 fps +10%
Durchschnittliche NVIDIA GeForce RTX 4070 Laptop GPU
  (76.3 - 234, n=58)
196.1 fps +2%
Maingear ML-16 MK2
Intel Core Ultra 7 155H, NVIDIA GeForce RTX 4070 Laptop GPU
192.8 (84.3min, 146.7P1) fps
HP Victus 16 (2024)
Intel Core i7-14700HX, NVIDIA GeForce RTX 4060 Laptop GPU
179 (76.4min, 130.3P1) fps -7%
HP Omen 16-b0085ng
Intel Core i7-11800H, NVIDIA GeForce RTX 3070 Laptop GPU
178 (45.3min, 135P1) fps -8%
HP Omen 16-n0033dx
AMD Ryzen 7 6800H, AMD Radeon RX 6650M
167.2 (61.1min, 120.8P1) fps -13%
Asus ROG Zephyrus M16 GU603Z
Intel Core i9-12900H, NVIDIA GeForce RTX 3070 Ti Laptop GPU
163.8 (35.9min, 125.2P1) fps -15%
Asus TUF Gaming A16 FA617XS
AMD Ryzen 9 7940HS, AMD Radeon RX 7600S
163.3 (16.3min, 119.3P1) fps -15%
CSL GameStar Notebook VenomGamer G16
AMD Ryzen 7 7735HS, AMD Radeon RX 7600M
157.2 (109min, 117.9P1) fps -18%
HP Victus 16-r0076TX
Intel Core i5-13500HX, NVIDIA GeForce RTX 4050 Laptop GPU
149.3 (13.3min, 115.1P1) fps -23%
Acer Nitro 16 AN16-41-R7YE
AMD Ryzen 5 7535HS, NVIDIA GeForce RTX 4050 Laptop GPU
146.8 (93.6min, 114.3P1) fps -24%
2560x1440 ultra AA:ultra AF:16
Razer Blade 16 2024, RTX 4090
Intel Core i9-14900HX, NVIDIA GeForce RTX 4090 Laptop GPU
279 (62.1min, 203P1) fps +118%
Alienware x16 R2 P120F
Intel Core Ultra 9 185H, NVIDIA GeForce RTX 4080 Laptop GPU
226 (45.4min, 170.9P1) fps +77%
KFA2 GeForce RTX 4070 EX Gamer
AMD Ryzen 9 7950X, NVIDIA GeForce RTX 4070
222 (48.6min, 176.9P1) fps +74%
Lenovo Yoga Pro 9 16IMH9
Intel Core Ultra 9 185H, NVIDIA GeForce RTX 4070 Laptop GPU
139 fps +9%
Durchschnittliche NVIDIA GeForce RTX 4070 Laptop GPU
  (52.8 - 150.9, n=50)
130.1 fps +2%
Maingear ML-16 MK2
Intel Core Ultra 7 155H, NVIDIA GeForce RTX 4070 Laptop GPU
127.9 (103.7min, 105.8P1) fps
Tiny Tina's Wonderlands
1920x1080 High Preset (DX12)
KFA2 GeForce RTX 4070 EX Gamer
AMD Ryzen 9 7950X, NVIDIA GeForce RTX 4070
196 fps +64%
Alienware x16 R2 P120F
Intel Core Ultra 9 185H, NVIDIA GeForce RTX 4080 Laptop GPU
166.7 fps +40%
Durchschnittliche NVIDIA GeForce RTX 4070 Laptop GPU
  (74.3 - 151.4, n=12)
128.5 fps +8%
Maingear ML-16 MK2
Intel Core Ultra 7 155H, NVIDIA GeForce RTX 4070 Laptop GPU
119.4 fps
Asus TUF Gaming A16 FA617XS
AMD Ryzen 9 7940HS, AMD Radeon RX 7600S
105.7 fps -11%
1920x1080 Badass Preset (DX12)
KFA2 GeForce RTX 4070 EX Gamer
AMD Ryzen 9 7950X, NVIDIA GeForce RTX 4070
153.9 fps +66%
Alienware x16 R2 P120F
Intel Core Ultra 9 185H, NVIDIA GeForce RTX 4080 Laptop GPU
144.5 fps +56%
Durchschnittliche NVIDIA GeForce RTX 4070 Laptop GPU
  (58.6 - 115.9, n=15)
99.2 fps +7%
Maingear ML-16 MK2
Intel Core Ultra 7 155H, NVIDIA GeForce RTX 4070 Laptop GPU
92.9 fps
Asus TUF Gaming A16 FA617XS
AMD Ryzen 9 7940HS, AMD Radeon RX 7600S
82.2 fps -12%
2560x1440 Badass Preset (DX12)
KFA2 GeForce RTX 4070 EX Gamer
AMD Ryzen 9 7950X, NVIDIA GeForce RTX 4070
106.9 fps +70%
Alienware x16 R2 P120F
Intel Core Ultra 9 185H, NVIDIA GeForce RTX 4080 Laptop GPU
99 fps +58%
Durchschnittliche NVIDIA GeForce RTX 4070 Laptop GPU
  (49.8 - 79.5, n=15)
69.1 fps +10%
Maingear ML-16 MK2
Intel Core Ultra 7 155H, NVIDIA GeForce RTX 4070 Laptop GPU
62.7 fps
F1 22
1920x1080 High Preset AA:T AF:16x
KFA2 GeForce RTX 4070 EX Gamer
AMD Ryzen 9 7950X, NVIDIA GeForce RTX 4070
309 (262min, 183P1) fps +50%
Maingear ML-16 MK2
Intel Core Ultra 7 155H, NVIDIA GeForce RTX 4070 Laptop GPU
206 (165min, 130P1) fps
Durchschnittliche NVIDIA GeForce RTX 4070 Laptop GPU
  (109 - 245, n=31)
190.1 fps -8%
Asus TUF Gaming A16 FA617XS
AMD Ryzen 9 7940HS, AMD Radeon RX 7600S
190 (164min, 130P1) fps -8%
Alienware x16 R2 P120F
Intel Core Ultra 9 185H, NVIDIA GeForce RTX 4080 Laptop GPU
185.7 (5min, 132P1) fps -10%
HP Omen 16-n0033dx
AMD Ryzen 7 6800H, AMD Radeon RX 6650M
178.2 (151min, 121P1) fps -13%
Acer Nitro 16 AN16-41-R7YE
AMD Ryzen 5 7535HS, NVIDIA GeForce RTX 4050 Laptop GPU
166.8 (144min, 110P1) fps -19%
HP Victus 16-r0076TX
Intel Core i5-13500HX, NVIDIA GeForce RTX 4050 Laptop GPU
154.4 (135min, 87P1) fps -25%
1920x1080 Ultra High Preset AA:T AF:16x
KFA2 GeForce RTX 4070 EX Gamer
AMD Ryzen 9 7950X, NVIDIA GeForce RTX 4070
113.3 (99min, 92P1) fps +64%
Alienware x16 R2 P120F
Intel Core Ultra 9 185H, NVIDIA GeForce RTX 4080 Laptop GPU
108.5 (86min, 76P1) fps +57%
Durchschnittliche NVIDIA GeForce RTX 4070 Laptop GPU
  (39.2 - 88.7, n=31)
73.8 fps +7%
Maingear ML-16 MK2
Intel Core Ultra 7 155H, NVIDIA GeForce RTX 4070 Laptop GPU
69.2 (59min, 58P1) fps
HP Victus 16-r0076TX
Intel Core i5-13500HX, NVIDIA GeForce RTX 4050 Laptop GPU
54.1 (45min, 37P1) fps -22%
Acer Nitro 16 AN16-41-R7YE
AMD Ryzen 5 7535HS, NVIDIA GeForce RTX 4050 Laptop GPU
52.9 (43min, 44P1) fps -24%
Asus TUF Gaming A16 FA617XS
AMD Ryzen 9 7940HS, AMD Radeon RX 7600S
50.5 (36min, 36P1) fps -27%
HP Omen 16-n0033dx
AMD Ryzen 7 6800H, AMD Radeon RX 6650M
40.6 (31min, 31P1) fps -41%
2560x1440 Ultra High Preset AA:T AF:16x
KFA2 GeForce RTX 4070 EX Gamer
AMD Ryzen 9 7950X, NVIDIA GeForce RTX 4070
73.7 (63min, 62P1) fps +72%
Alienware x16 R2 P120F
Intel Core Ultra 9 185H, NVIDIA GeForce RTX 4080 Laptop GPU
65.6 (56P1) fps +53%
Durchschnittliche NVIDIA GeForce RTX 4070 Laptop GPU
  (10.6 - 58.8, n=30)
47.4 fps +10%
Maingear ML-16 MK2
Intel Core Ultra 7 155H, NVIDIA GeForce RTX 4070 Laptop GPU
42.9 (36min, 35P1) fps
Cyberpunk 2077 2.1 Phantom Liberty
1920x1080 Medium Preset (FSR off)
Alienware x16 R2 P120F
Intel Core Ultra 9 185H, NVIDIA GeForce RTX 4080 Laptop GPU
118.7 (9.5min) fps +12%
Durchschnittliche NVIDIA GeForce RTX 4070 Laptop GPU
  (81.6 - 124.5, n=22)
109 fps +3%
Lenovo Yoga Pro 9 16IMH9
Intel Core Ultra 9 185H, NVIDIA GeForce RTX 4070 Laptop GPU
106.8 (53.2min) fps +1%
Maingear ML-16 MK2
Intel Core Ultra 7 155H, NVIDIA GeForce RTX 4070 Laptop GPU
106.1 (91.6min) fps
HP Victus 16 (2024)
Intel Core i7-14700HX, NVIDIA GeForce RTX 4060 Laptop GPU
90 (47.2min) fps -15%
CSL GameStar Notebook VenomGamer G16
AMD Ryzen 7 7735HS, AMD Radeon RX 7600M
73.8 (50min) fps -30%
1920x1080 High Preset (FSR off)
Alienware x16 R2 P120F
Intel Core Ultra 9 185H, NVIDIA GeForce RTX 4080 Laptop GPU
109 (41min) fps +24%
Durchschnittliche NVIDIA GeForce RTX 4070 Laptop GPU
  (74.7 - 103.6, n=23)
92.6 fps +5%
Lenovo Yoga Pro 9 16IMH9
Intel Core Ultra 9 185H, NVIDIA GeForce RTX 4070 Laptop GPU
90.5 (40.2min) fps +3%
Maingear ML-16 MK2
Intel Core Ultra 7 155H, NVIDIA GeForce RTX 4070 Laptop GPU
88.1 (75min) fps
HP Victus 16 (2024)
Intel Core i7-14700HX, NVIDIA GeForce RTX 4060 Laptop GPU
76.9 (24min) fps -13%
CSL GameStar Notebook VenomGamer G16
AMD Ryzen 7 7735HS, AMD Radeon RX 7600M
62.3 (40min) fps -29%
1920x1080 Ultra Preset (FSR off)
Alienware x16 R2 P120F
Intel Core Ultra 9 185H, NVIDIA GeForce RTX 4080 Laptop GPU
99.7 (13.5min) fps +30%
Razer Blade 16 2024, RTX 4090
Intel Core i9-14900HX, NVIDIA GeForce RTX 4090 Laptop GPU
95.35 (70.51min) fps +25%
Durchschnittliche NVIDIA GeForce RTX 4070 Laptop GPU
  (30.7 - 90.7, n=29)
79.6 fps +4%
Lenovo Yoga Pro 9 16IMH9
Intel Core Ultra 9 185H, NVIDIA GeForce RTX 4070 Laptop GPU
76.9 (18min) fps +1%
Maingear ML-16 MK2
Intel Core Ultra 7 155H, NVIDIA GeForce RTX 4070 Laptop GPU
76.4 (63.2min) fps
HP Victus 16 (2024)
Intel Core i7-14700HX, NVIDIA GeForce RTX 4060 Laptop GPU
67.1 (20.8min) fps -12%
CSL GameStar Notebook VenomGamer G16
AMD Ryzen 7 7735HS, AMD Radeon RX 7600M
57.1 (39min) fps -25%
2560x1440 Ultra Preset (FSR off)
Razer Blade 16 2024, RTX 4090
Intel Core i9-14900HX, NVIDIA GeForce RTX 4090 Laptop GPU
83.39 (67.14min) fps +88%
Alienware x16 R2 P120F
Intel Core Ultra 9 185H, NVIDIA GeForce RTX 4080 Laptop GPU
75.4 (25.4min) fps +70%
Durchschnittliche NVIDIA GeForce RTX 4070 Laptop GPU
  (24.8 - 57.1, n=28)
49.1 fps +11%
Lenovo Yoga Pro 9 16IMH9
Intel Core Ultra 9 185H, NVIDIA GeForce RTX 4070 Laptop GPU
47.8 (31.2min) fps +8%
Maingear ML-16 MK2
Intel Core Ultra 7 155H, NVIDIA GeForce RTX 4070 Laptop GPU
44.3 (37.2min) fps
CSL GameStar Notebook VenomGamer G16
AMD Ryzen 7 7735HS, AMD Radeon RX 7600M
36.6 (28min) fps -17%

Cyberpunk 2077 ultra FPS-Diagramm

0510152025303540455055606570Tooltip
Maingear ML-16 MK2 Ultra 7 155H, NVIDIA GeForce RTX 4070 Laptop GPU: Ø69.5 (62.8-72.4)
min.mittelhochmax.QHD
GTA V (2015) 183.3 180.4 175 115.1 90.6
Dota 2 Reborn (2015) 173.4 152.8 145.3 139.2
Final Fantasy XV Benchmark (2018) 187.6 146.3 110.6 80
X-Plane 11.11 (2018) 139.9 124.4 89.8
Far Cry 5 (2018) 125 125 114 101
Strange Brigade (2018) 477 284 224 192.8 127.9
Tiny Tina's Wonderlands (2022) 218.7 180.9 119.4 92.9 62.7
F1 22 (2022) 252 250 206 69.2 42.9
Baldur's Gate 3 (2023) 152 125.9 108.2 106.8 70.6
Cyberpunk 2077 2.1 Phantom Liberty (2023) 130 106.1 88.1 76.4 44.3

Emissionen — Heiß und laut

Geräuschemissionen

Das Lüftergeräusch beim Surfen oder Videostreaming erreicht einen Spitzenwert von 27 dB(A) über einem leisen Hintergrund von 23 dB(A). Damit ist es wahrnehmbar, aber erträglich, besonders im Quiet-Modus. Beim Spielen im Performance-Modus wird das Lüftergeräusch jedoch mit über 55 dB(A) sehr laut und übertrifft damit die Lautstärke von Konkurrenten wie dem Victus 16, Alienware x16 R2 oder Legion Pro 5 16. Wenn der Maximum Fan Noise aktiviert wird, steigt das Lüftergeräusch sogar auf fast 58 dB(A).

Die Kühllösung besteht aus zwei ~50-mm-Lüftern und 4 Kupfer-Heatpipes
Bei unserem Testgerät können wir ein sehr geringes elektronisches Rauschen oder Spulenwimmern feststellen
Asymmetrische Kühllösung, anders als bei den meisten anderen Gaming-Notebooks
Zugänglicher 2x DDR5 SODIMM- Slots
Lüftergeräuschprofil (Weiß: Hintergrund, Rot: System im Leerlauf, Blau: 3DMark 06, Orange: Cyberpunk 2077 Stresstest, Grün: Prime95+FurMark Stresstest Maximaler Lüftermodus)

Lautstärkediagramm

Idle
24.1 / 24.1 / 25.6 dB(A)
Last
44.3 / 57.8 dB(A)
  red to green bar
 
 
30 dB
leise
40 dB(A)
deutlich hörbar
50 dB(A)
störend
 
min: dark, med: mid, max: light   Earthworks M23R, Arta (aus 15 cm gemessen)   Umgebungsgeräusche: 23 dB(A)
dB(A) 0102030405060708090Deep BassMiddle BassHigh BassLower RangeMidsHigher MidsLower HighsMid HighsUpper HighsSuper Highs2038.435.332.831.640.42528.73226.12232.13127.525.325.820.127.44026.421.521.618.125.45026.125.220.719.223.96328.528.526.41727.88027.824.220.918.226.410030.221.618.515.827.812527.12319.119.629.716029.324.114.813.530.220031.724.414.713.331.225034.327.214.413.335.331535.228.81713.936.840038.329.815.511.94050039.432.113.711.241.763038.13013.69.639.580039.631.511.29.441.1100041.632.3109.343.412504332.59.89.245.1160043.932.9109.445.9200044.834.210.39.947.3250047.635.311.310.449.9315046.635.811.810.649.2400043.731.411.711.346.2500041.228.112.112.143.9630039.62712.311.842.8800041.127.712.411.844.11000040.325.912.21243.51250037.621.112.312.441.41600032.61812.112.136.9SPL55.444.324.12357.8N104.60.50.411.7median 39.6median 28.8median 12.3median 11.8median 41.7Delta54.11.71.54.7hearing rangehide median Fan NoiseMaingear ML-16 MK2
Maingear ML-16 MK2
NVIDIA GeForce RTX 4070 Laptop GPU, Ultra 7 155H
Asus ROG Zephyrus G16 GA605WV
NVIDIA GeForce RTX 4060 Laptop GPU, Ryzen AI 9 HX 370, Micron 2400 MTFDKBA1T0QFM
HP Victus 16 (2024)
NVIDIA GeForce RTX 4060 Laptop GPU, i7-14700HX, Kioxia XG8 KXG80ZNV512G
Alienware x16 R2 P120F
NVIDIA GeForce RTX 4080 Laptop GPU, Ultra 9 185H, WDC PC SN810 1TB
Lenovo Legion Pro 5 16IRX9
NVIDIA GeForce RTX 4070 Laptop GPU, i9-14900HX, Samsung PM9A1 MZVL21T0HCLR
Razer Blade 16 2024, RTX 4090
NVIDIA GeForce RTX 4090 Laptop GPU, i9-14900HX, Samsung PM9A1 MZVL22T0HBLB
Geräuschentwicklung
-4%
-10%
2%
-3%
3%
aus / Umgebung *
23
24.6
-7%
25
-9%
23.4
-2%
23.9
-4%
23
-0%
Idle min *
24.1
28.6
-19%
28
-16%
23.8
1%
24.3
-1%
23
5%
Idle avg *
24.1
28.6
-19%
29
-20%
28.5
-18%
24.3
-1%
23
5%
Idle max *
25.6
28.6
-12%
33
-29%
28.5
-11%
28.9
-13%
27.66
-8%
Last avg *
44.3
42.8
3%
45
-2%
28.8
35%
45.8
-3%
43.76
1%
Cyberpunk 2077 ultra *
55.4
48.3
13%
Last max *
57.8
48.3
16%
48
17%
54.2
6%
56.6
2%
50.37
13%
Witcher 3 ultra *
43
49.5
51
46.81

* ... kleinere Werte sind besser

Temperatur

Die oben erwähnten sehr warmen Betriebstemperaturen führen zu überdurchschnittlich warmen Oberflächentemperaturen. Hotspots beim Spielen können auf der Ober- und Unterseite über 54 °C bzw. 56 °C erreichen, während das Blade 16 nur 40 °C und das Legion Pro 5 16IRX9 47 °C verzeichnen.

Zudem führt die asymmetrische Kühllösung dazu, dass die rechte Hälfte des Gehäuses und der Tastatur deutlich wärmer ist als die linke. Dies steht im Gegensatz zu den meisten anderen Gaming-Laptops, bei denen symmetrische Kühllösungen üblich sind. Dies ist zwar kein großes Problem, da die meisten Spiele hauptsächlich die WASD-Tasten auf der linken Seite verwenden, doch Sie sollten mit einer verschwitzten Handfläche rechnen, wenn das Spiel Eingaben über den Ziffernblock erfordert.

Hintere Abluft
Hintere Abluft
Das Netzteil erreicht bei anspruchsvollen Lasten über 55 °C
Max. Last
 35.2 °C40.6 °C45.2 °C 
 31.8 °C44.4 °C44.4 °C 
 26.8 °C28.2 °C33.2 °C 
Maximal: 45.2 °C
Durchschnitt: 36.6 °C
48.6 °C41 °C34.8 °C
48.8 °C46 °C31.8 °C
33.4 °C33.8 °C28.6 °C
Maximal: 48.8 °C
Durchschnitt: 38.5 °C
Netzteil (max.)  45 °C | Raumtemperatur 20 °C | Fluke 62 Mini IR Thermometer
(±) Die Durchschnittstemperatur auf der Oberseite unter extremer Last ist 36.6 °C. Im Vergleich erhitzte sich der Durchschnitt der Geräteklasse Gaming auf 33.9 °C.
(-) Die maximale Temperatur auf der Oberseite ist 45.2 °C. Im Vergleich liegt der Klassendurchschnitt bei 40.5 °C (von 21.2 bis 68.8 °C für die Klasse Gaming).
(-) Auf der Unterseite messen wir eine maximalen Wert von 48.8 °C (im Vergleich zum Durchschnitt von 43.2 °C).
(+) Ohne Last messen wir eine durchschnittliche Temperatur von 31.9 °C auf der Oberseite. Der Klassendurchschnitt erreicht 33.9 °C.
(-) 3: The average temperature for the upper side is 40 °C / 104 F, compared to the average of 33.9 °C / 93 F for the class Gaming.
(+) Die Handballen und der Touchpad-Bereich erreichen maximal 34.6 °C und damit die typische Hauttemperatur und fühlen sich daher nicht heiß an.
(-) Die durchschnittliche Handballen-Temperatur anderer getesteter Geräte war 28.9 °C (-5.7 °C).
System im Leerlauf (Abdeckung-C)
System im Leerlauf (Abdeckung-D)
Cyberpunk 2077 stress (Abdeckung-C)
Cyberpunk 2077 stress (Abdeckung-D)
Prime95+FurMark stress (Abdeckung-C)
Prime95+FurMark stress (Abdeckung-D)
Maingear ML-16 MK2
Intel Core Ultra 7 155H, NVIDIA GeForce RTX 4070 Laptop GPU
Asus ROG Zephyrus G16 GA605WV
AMD Ryzen AI 9 HX 370, NVIDIA GeForce RTX 4060 Laptop GPU
HP Victus 16 (2024)
Intel Core i7-14700HX, NVIDIA GeForce RTX 4060 Laptop GPU
Alienware x16 R2 P120F
Intel Core Ultra 9 185H, NVIDIA GeForce RTX 4080 Laptop GPU
Lenovo Legion Pro 5 16IRX9
Intel Core i9-14900HX, NVIDIA GeForce RTX 4070 Laptop GPU
Razer Blade 16 2024, RTX 4090
Intel Core i9-14900HX, NVIDIA GeForce RTX 4090 Laptop GPU
Hitze
8%
12%
-4%
0%
12%
Last oben max *
45.2
48.2
-7%
50
-11%
51
-13%
43.8
3%
45
-0%
Last unten max *
48.8
51.3
-5%
50
-2%
50.8
-4%
55.4
-14%
45
8%
Idle oben max *
34.8
28
20%
25
28%
36.6
-5%
32.8
6%
29
17%
Idle unten max *
38.2
28.8
25%
26
32%
35.2
8%
36
6%
30
21%

* ... kleinere Werte sind besser

Lautsprecher

Nach unten gerichtete Stereolautsprecher in den vorderen Ecken
Pink noise bietet eine ordentliche maximale Lautstärke, hat jedoch eine schwache Basswiedergabe
dB(A) 0102030405060708090Deep BassMiddle BassHigh BassLower RangeMidsHigher MidsLower HighsMid HighsUpper HighsSuper Highs2040.832.840.8253026.1303126.825.826.84021.921.621.95024.920.724.9632926.4298028.920.928.910036.318.536.312543.919.143.916053.614.853.620056.314.756.325058.814.458.831559.41759.440060.815.560.850064.413.764.463069.113.669.180073.911.273.91000741074125075.59.875.5160072.11072.1200069.810.369.8250064.311.364.3315067.411.867.4400067.411.767.4500072.412.172.4630073.512.373.580007412.4741000069.512.269.51250069.612.369.61600064.512.164.5SPL83.524.183.5N58.80.558.8median 67.4median 12.3median 67.4Delta6.21.76.226.325.821.422.12624.925.127.622.532.523.448.72655.818.860.922.167.2267019.372.317.674.217.774.319.575.31571.711.871.311.27410.574.21072.710.17210.67210.97511.374.811.671.71269.71269.612.371.112.669.61270.111.269.824.784.70.666.6median 12median 71.73.42.2hearing rangehide median Pink NoiseMaingear ML-16 MK2Apple MacBook Pro 16 2021 M1 Pro
Frequenzdiagramm (für Vergleiche die Checkboxen oben an-/abwählen)
Maingear ML-16 MK2 Audio Analyse

(+) | Die Lautsprecher können relativ laut spielen (83.5 dB)
Bass 100 - 315 Hz
(-) | kaum Bass - 16.1% niedriger als der Median
(±) | durchschnittlich lineare Bass-Wiedergabe (9.2% Delta zum Vorgänger)
Mitteltöne 400 - 2000 Hz
(+) | ausgeglichene Mitten, vom Median nur 4.9% abweichend
(+) | lineare Mitten (4.9% Delta zum Vorgänger)
Hochtöne 2 - 16 kHz
(+) | ausgeglichene Hochtöne, vom Median nur 3.3% abweichend
(+) | sehr lineare Hochtöne (5.1% Delta zum Vorgänger)
Gesamt im hörbaren Bereich 100 - 16.000 Hz
(+) | hörbarer Bereich ist sehr linear (13.7% Abstand zum Median
Im Vergleich zu allen Geräten derselben Klasse
» 25% aller getesteten Geräte dieser Klasse waren besser, 6% vergleichbar, 69% schlechter
» Das beste Gerät hat einen Delta-Wert von 6%, durchschnittlich ist 17%, das schlechteste Gerät hat 108%
Im Vergleich zu allen Geräten im Test
» 15% aller getesteten Geräte waren besser, 4% vergleichbar, 81% schlechter
» Das beste Gerät hat einen Delta-Wert von 3%, durchschnittlich ist 20%, das schlechteste Gerät hat 130%

Apple MacBook Pro 16 2021 M1 Pro Audio Analyse

(+) | Die Lautsprecher können relativ laut spielen (84.7 dB)
Bass 100 - 315 Hz
(+) | guter Bass - nur 3.8% Abweichung vom Median
(+) | lineare Bass-Wiedergabe (5.2% Delta zum Vorgänger)
Mitteltöne 400 - 2000 Hz
(+) | ausgeglichene Mitten, vom Median nur 1.3% abweichend
(+) | lineare Mitten (2.1% Delta zum Vorgänger)
Hochtöne 2 - 16 kHz
(+) | ausgeglichene Hochtöne, vom Median nur 1.9% abweichend
(+) | sehr lineare Hochtöne (2.7% Delta zum Vorgänger)
Gesamt im hörbaren Bereich 100 - 16.000 Hz
(+) | hörbarer Bereich ist sehr linear (4.6% Abstand zum Median
Im Vergleich zu allen Geräten derselben Klasse
» 1% aller getesteten Geräte dieser Klasse waren besser, 0% vergleichbar, 99% schlechter
» Das beste Gerät hat einen Delta-Wert von 3%, durchschnittlich ist 17%, das schlechteste Gerät hat 41%
Im Vergleich zu allen Geräten im Test
» 0% aller getesteten Geräte waren besser, 0% vergleichbar, 100% schlechter
» Das beste Gerät hat einen Delta-Wert von 3%, durchschnittlich ist 20%, das schlechteste Gerät hat 130%

Energieverwaltung

Energieaufnahme

Die Leistungsaufnahme im Leerlauf variiert je nach GPU-Einstellung und Helligkeitsstufe zwischen 7 W und 27 W, was im Vergleich zu den Konkurrenten einen größeren Bereich darstellt. Dies könnte auch die relativ kurze Akkulaufzeit im folgenden Abschnitt erklären. Allein das Aktivieren des dGPU-Modus und der maximalen Display-Helligkeit lässt den Verbrauch von 7 W auf 23 W ansteigen, weshalb wir den MSHybrid-Modus empfehlen, wenn die Akkulaufzeit wichtig ist.

Beim Spielen benötigt das mittelgroße (~14,4 x 7,5 x 2,3 cm) 180-W-Netzteil durchschnittlich 179 W. Das bedeutet, dass die Ladegeschwindigkeit während des Spielens sehr langsam ist, und es deutet darauf hin, dass die Leistung besser hätte sein können, wenn das Modell mit einem größeren 230-W-Netzteil ausgestattet wäre. Tatsächlich konnten wir eine maximale Leistungsaufnahme von 203 W messen, wenn CPU und GPU voll ausgelastet sind, was zeigt, dass das System mehr Leistung verlangt, als das Netzteil sicher bereitstellen kann. Dies ähnelt dem Lenovo Yoga Pro 9i 16 G9, dessen 170-W-Netzteil wir als zu klein für die Core Ultra H CPU und die RTX 4070 GPU empfanden.

3DMark 06, Verbrauch
Cyberpunk 2077 1080p Ultra, Verbrauch
Während des Prime95-Stresstests stieg der Verbrauch auf 154 W, sank jedoch 20 Sekunden später aufgrund thermischer Beschränkungen auf 113 W
Prime95+FurMark Stresstest wird bei 10 Sekunden gestartet
Stromverbrauch
Aus / Standbydarklight 0.28 / 1.2 Watt
Idledarkmidlight 7.7 / 22.9 / 26.7 Watt
Last midlight 77.5 / 202.6 Watt
 color bar
Legende: min: dark, med: mid, max: light        Metrahit Energy
Maingear ML-16 MK2
Ultra 7 155H, NVIDIA GeForce RTX 4070 Laptop GPU, , IPS, 2560x1600, 16"
Asus ROG Zephyrus G16 GA605WV
Ryzen AI 9 HX 370, NVIDIA GeForce RTX 4060 Laptop GPU, Micron 2400 MTFDKBA1T0QFM, OLED, 2560x1600, 16"
HP Victus 16 (2024)
i7-14700HX, NVIDIA GeForce RTX 4060 Laptop GPU, Kioxia XG8 KXG80ZNV512G, IPS, 1920x1080, 16.1"
Alienware x16 R2 P120F
Ultra 9 185H, NVIDIA GeForce RTX 4080 Laptop GPU, WDC PC SN810 1TB, IPS, 2560x1600, 16"
Lenovo Legion Pro 5 16IRX9
i9-14900HX, NVIDIA GeForce RTX 4070 Laptop GPU, Samsung PM9A1 MZVL21T0HCLR, IPS, 2560x1600, 16"
Razer Blade 16 2024, RTX 4090
i9-14900HX, NVIDIA GeForce RTX 4090 Laptop GPU, Samsung PM9A1 MZVL22T0HBLB, OLED, 2560x1600, 16"
Stromverbrauch
24%
-9%
-20%
-29%
-39%
Idle min *
7.7
6.9
10%
9
-17%
9.9
-29%
12.5
-62%
16.9
-119%
Idle avg *
22.9
12.6
45%
15
34%
14.5
37%
24.6
-7%
17.8
22%
Idle max *
26.7
13
51%
23
14%
33.5
-25%
24.8
7%
19.6
27%
Last avg *
77.5
84.1
-9%
123
-59%
97.5
-26%
109.6
-41%
128
-65%
Cyberpunk 2077 ultra external monitor *
178.9
124.5
30%
Cyberpunk 2077 ultra *
178.6
127.2
29%
Last max *
202.6
177.6
12%
241
-19%
315.2
-56%
284.9
-41%
328
-62%
Witcher 3 ultra *
143.7
230
218
243

* ... kleinere Werte sind besser

Energieaufnahme Cyberpunk / Stresstest

0153045607590105120135150165180195210225Tooltip
Maingear ML-16 MK2 Ultra 7 155H, NVIDIA GeForce RTX 4070 Laptop GPU; 1280x720 Prime95 28.10 and Furmark 1.25: Ø171.6 (131.1-203)
Lenovo Legion 7 16 IRX G9 i9-14900HX, NVIDIA GeForce RTX 4070 Laptop GPU; 1280x720 Prime95 28.10 and Furmark 1.25: Ø213 (182.5-239)
Maingear ML-16 MK2 Ultra 7 155H, NVIDIA GeForce RTX 4070 Laptop GPU; Idle 150cd/m2: Ø8.5 (6.76-11.5)
Lenovo Legion 7 16 IRX G9 i9-14900HX, NVIDIA GeForce RTX 4070 Laptop GPU; Idle 150cd/m2: Ø18.7 (18.2-20.7)
Maingear ML-16 MK2 Ultra 7 155H, NVIDIA GeForce RTX 4070 Laptop GPU; Cyberpunk 2077 FHD ultra no FSR 150cd: Ø178.6 (168.6-185.6)

Energieaufnahme externer Monitor

0153045607590105120135150165180195210225Tooltip
Maingear ML-16 MK2 Ultra 7 155H, NVIDIA GeForce RTX 4070 Laptop GPU; Prime95 V2810 Stress (external Monitor): Ø122.6 (106.9-154.1)
Lenovo Legion 7 16 IRX G9 i9-14900HX, NVIDIA GeForce RTX 4070 Laptop GPU; Prime95 V2810 Stress (external Monitor): Ø146.4 (130-234)
Maingear ML-16 MK2 Ultra 7 155H, NVIDIA GeForce RTX 4070 Laptop GPU; Cinebench R15 Multi (external Monitor): Ø130.4 (74-136.1)
Lenovo Legion 7 16 IRX G9 i9-14900HX, NVIDIA GeForce RTX 4070 Laptop GPU; Cinebench R15 Multi (external Monitor): Ø219 (193.6-231)
Maingear ML-16 MK2 Ultra 7 155H, NVIDIA GeForce RTX 4070 Laptop GPU; 1280x720 FurMark 1.19 GPU Stress Test (external Monitor): Ø133.3 (126.7-136.7)
Lenovo Legion 7 16 IRX G9 i9-14900HX, NVIDIA GeForce RTX 4070 Laptop GPU; 1280x720 FurMark 1.19 GPU Stress Test (external Monitor): Ø162.8 (154.1-200)
Maingear ML-16 MK2 Ultra 7 155H, NVIDIA GeForce RTX 4070 Laptop GPU; Idle 1min (external Monitor): Ø7.65 (5.35-12)
Lenovo Legion 7 16 IRX G9 i9-14900HX, NVIDIA GeForce RTX 4070 Laptop GPU; Idle 1min (external Monitor): Ø15.5 (15.1-16.4)
Maingear ML-16 MK2 Ultra 7 155H, NVIDIA GeForce RTX 4070 Laptop GPU; Cyberpunk 2077 FHD ultra no FSR - external Monitor: Ø178.9 (169.7-186)

Akkulaufzeit

180 W Netzteil
180 W Netzteil

Die Akkukapazität von 80 Wh ist für die Größe des 16-Zoll-Bildschirms durchschnittlich, doch die Laufzeiten sind unterdurchschnittlich für ein Gaming-Notebook. Selbst im Balanced-Modus mit aktivem MSHybrid können wir unter realen Bedingungen nur etwas mehr als 3,5 Stunden WLAN-Surfen verzeichnen, während Konkurrenten wie das Asus ROG Zephyrus G16 oder HP Victus 16 mehr als das Doppelte schaffen.

Der Ladevorgang vom leeren zum vollen Akku erfolgt relativ schnell und dauert 1 bis 1,5 Stunden. Das System kann auch über USB-C-Netzteile von Drittanbietern aufgeladen werden, allerdings mit einer langsameren Rate. Beachten Sie, dass nur einer der beiden USB-C-Anschlüsse das Aufladen unterstützt.

Akkulaufzeit
Idle (ohne WLAN, min Helligkeit)
10h 51min
WiFi Websurfing
3h 38min
Last (volle Helligkeit)
1h 38min
Maingear ML-16 MK2
Ultra 7 155H, NVIDIA GeForce RTX 4070 Laptop GPU, 80 Wh
Asus ROG Zephyrus G16 GA605WV
Ryzen AI 9 HX 370, NVIDIA GeForce RTX 4060 Laptop GPU, 90 Wh
HP Victus 16 (2024)
i7-14700HX, NVIDIA GeForce RTX 4060 Laptop GPU, 83 Wh
Alienware x16 R2 P120F
Ultra 9 185H, NVIDIA GeForce RTX 4080 Laptop GPU, 90 Wh
Lenovo Legion Pro 5 16IRX9
i9-14900HX, NVIDIA GeForce RTX 4070 Laptop GPU, 80 Wh
Razer Blade 16 2024, RTX 4090
i9-14900HX, NVIDIA GeForce RTX 4090 Laptop GPU, 95.2 Wh
Akkulaufzeit
62%
134%
-11%
-13%
16%
Idle
651
403
-38%
WLAN
218
478
119%
511
134%
193
-11%
290
33%
329
51%
Last
98
103
5%
65
-34%
79
-19%
H.264
824
456

Pro

+ helles 500-Nit-IPS-Display mit vollen sRGB-Farben
+ relativ leicht für die Größe
+ zugängliches Gehäuse
+ integrierter Ziffernblock
+ keine SSD-Drosselung

Contra

- sehr warme Kerntemperaturen beim Spielen
- kein Advanced Optimus oder G-Sync
- Gehäusesteifigkeit könnte besser sein
- keine P3-, OLED- oder HDR-Optionen
- lautes Lüftergeräusch beim Spielen

Fazit — Überraschend leicht, aber etwas zu heiß

Im Test: Maingear ML-16 MK2

Der Maingear ML-16 MK2 bietet im Vergleich zu seinen namhaften Konkurrenten einige Vorteile. Besonders hervorzuheben sind das geringe Gewicht und das relativ helle Display, was vor allem Nutzern zugutekommt, die häufig unterwegs sind. Der integrierte Ziffernblock kann in bestimmten Spielen und bei Tabellenkalkulationen nützlich sein, und auch die einfache Wartung wird von Enthusiasten geschätzt.

Leider hat das Modell auch eine längere Liste von Nachteilen. Zum einen ist die Kühllösung relativ klein und nicht so leistungsfähig wie bei anderen 16-Zoll-Gaming-Notebooks. Dadurch fallen die Kerntemperaturen und Oberflächentemperaturen höher aus, und die Lüftergeräusche sind lauter als bei Konkurrenten wie dem schwereren Razer Blade 16 oder dem Lenovo Legion Pro. Auch die Gehäusesteifigkeit ist schwächer, was einen weniger hochwertigen ersten Eindruck hinterlässt. Diese Schwächen lassen sich teilweise auf das geringe Gewicht zurückführen, da sowohl beim Gehäuse als auch bei der Kühllösung Kompromisse gemacht wurden. Mit anderen Worten: Wer das leichtere Gewicht und die bessere Tragbarkeit möchte, muss einige wichtige Abstriche hinnehmen.

Der Maingear ML-16 MK2 ist leichter und heller als erwartet, jedoch fehlen ihm einige fortschrittliche Funktionen, und sowohl die Temperaturen als auch die Lüfterlautstärke hätten besser ausfallen können.

Fortschrittliche Funktionen wie Optimus 2.0, HDR, OLED, RGB-Beleuchtung pro Taste, Dampfkammerkühlung und Flüssigmetall-Wärmeleitpaste sind beim ML-16 MK2 nicht vorhanden. Solche Auslassungen mögen im 1400 Euro,-Preissegment akzeptabel sein, aber bei einem Preis von etwa 1860 Euro für unsere RTX 4070-Konfiguration hätten wir etwas mehr erwartet.

Preis und Verfügbarkeit

Maingear bietet den ML-16 MK2 jetzt für etwa 1680 Euro mit der GeForce RTX 4060 oder für 1860 Euro mit der RTX 4070 an.

Hinweis: Wir haben unser Bewertungssystem kürzlich aktualisiert. Daher sind die Ergebnisse der Version 8 nicht mit denen der Version 7 vergleichbar. Für weitere Informationen klicken Sie bitte hier.

Maingear ML-16 MK2 - 17.09.2024 v8
Allen Ngo

Gehäuse
79 / 98 → 80%
Tastatur
82%
Pointing Device
78%
Konnektivität
67 / 80 → 84%
Gewicht
62 / 10-68 → 90%
Akkulaufzeit
56 / 95 → 59%
Display
84%
Leistung Spiele
83%
Leistung Anwendungen
80%
Temperatur
82 / 95 → 86%
Lautstärke
67 / 90 → 74%
Audio
79%
Kamera
36 / 75 → 48%
Durchschnitt
57%
81%
Gaming - gewichteter Durchschnitt
Weitere Informationen über unsere Bewertung finden Sie hier.
CO2 Emissions
No Data
Materials
0%
Packaging
25%
Power Use
78.7%
Repairability
50%
Software Updates
22.3%
Recycle Logo Total Sustainability Score: 29.3%

Transparenz

Die Auswahl der zu testenden Geräte erfolgt innerhalb der Redaktion. Das vorliegende Testmuster wurde dem Autor vom Hersteller oder einem Shop zu Testzwecken leihweise zur Verfügung gestellt. Eine Einflussnahme des Leihstellers auf den Testbericht gab es nicht, der Hersteller erhielt keine Version des Reviews vor der Veröffentlichung. Es bestand keine Verpflichtung zur Publikation. Unsere Reviews erfolgen stets ohne Gegenleistung oder Kompensationen. Als eigenständiges, unabhängiges Unternehmen unterliegt Notebookcheck keiner Diktion von Herstellern, Shops und Verlagen.

So testet Notebookcheck

Pro Jahr werden von Notebookcheck hunderte Laptops und Smartphones unabhängig in von uns standardisierten technischen Verfahren getestet, um eine Vergleichbarkeit aller Testergebnisse zu gewährleisten. Seit rund 20 Jahren entwickeln wir diese Testmethoden kontinuierlich weiter und setzen damit Branchenstandards. In unseren Testlaboren kommt ausschließlich hochwertiges Messequipment in die Hände erfahrener Techniker und Redakteure. Die Tests unterliegen einer mehrstufigen Kontrolle. Unsere komplexe Gesamtbewertung basiert auf hunderten fundierten Messergebnissen und Benchmarks, womit Ihnen Objektivität garantiert ist. Weitere Informationen zu unseren Testmethoden gibt es hier.

Preisvergleich

Alle 1 Beträge lesen / Antworten
static version load dynamic
Loading Comments
Diesen Artikel kommentieren / Antworten
Teilen Sie diesen Artikel, um uns zu unterstützen. Jeder Link hilft!
> Notebook Test, Laptop Test und News > Tests > Notebook Testberichte > Maingear ML-16 MK2 Laptop im Test: GeForce RTX 4070 Leistung zu einem attraktiven Preis
Autor: Allen Ngo, 20.09.2024 (Update: 21.09.2024)