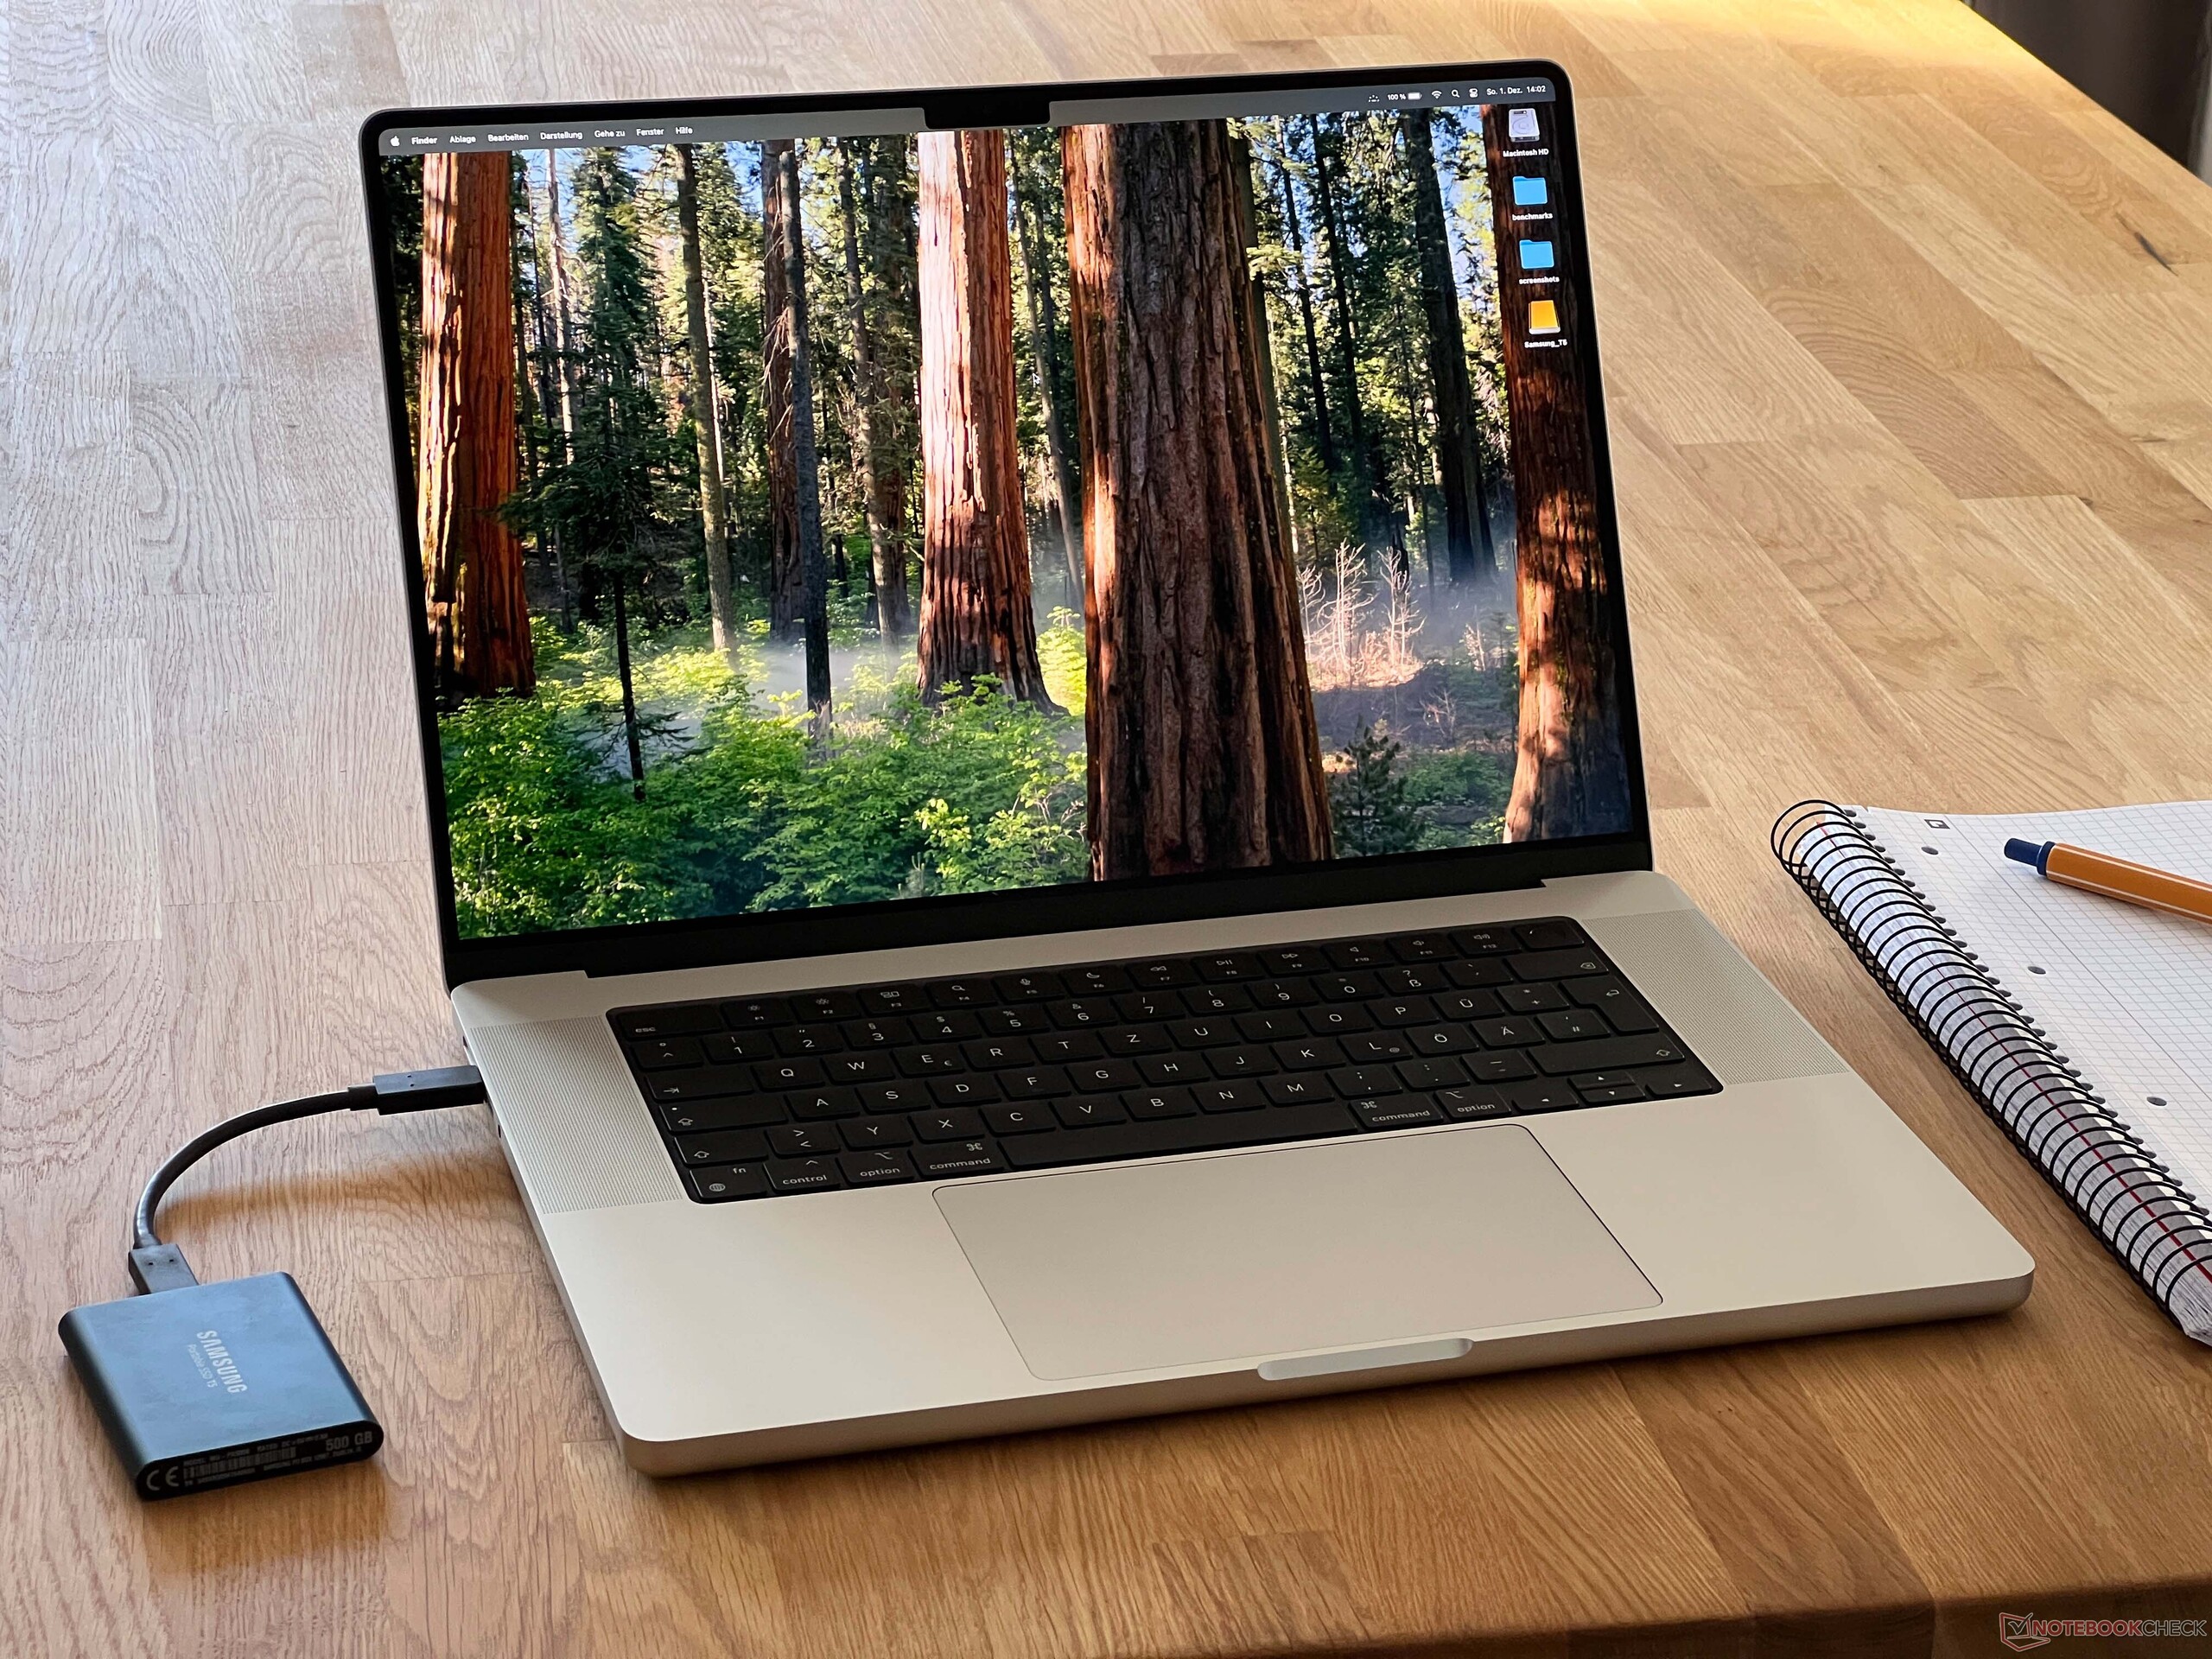
Apple MacBook Pro 16 M4 Max im Test - Der M4 Max ist einer der schnellsten Mobilprozessoren
Kühlung am Limit.
Apples neuer M4 Max bekommt in der Top-Konfiguration zwei zusätzliche Performance-Kerne und eine sehr schnelle Grafikkarte. Allerdings wird der M4 Max von der Kühlung des MacBook Pro 16 eingebremst und kann sein volles Potenzial nicht ausnutzen. Wird es langsam Zeit für ein neues Gehäusedesign? Update: M4 Max schlägt die RTX 4090 Laptop bei der VideobearbeitungAndreas Osthoff 👁 Veröffentlicht am 🇺🇸 🇫🇷 ...
Fazit - Apple baut den Leistungsvorsprung mit dem M4 Max weiter aus
Mit der neuen M4-Generation baut Apple den Leistungsvorsprung gegenüber der Konkurrenz weiter aus. Die Single-Core-Leistung ist konkurrenzlos gut und die High-End-Variante des M4 Max gehört auch zu den schnellsten Mobilprozessoren bei Multi-Core-Belastung, die zudem sehr stabil bleibt (auch im Akkubetrieb). Die Grafikleistung hingegen konnte ebenfalls gesteigert werden und liegt in den meisten Fällen auf dem Niveau der Konkurrenz mit dedizierten GeForce-RTX-4070-Laptop-GPUs und teilweise werden langsame Varianten der 4080 Laptop geschlagen.
Bei gleichzeitiger CPU/GPU-Last limitiert die Kühlung des MacBook Pro 16 die Leistung des M4 Max aber deutlich und tatsächlich ist die Energieaufnahme des Chips sogar etwas geringer als beim M4 Pro. Auch das Netzteil ist hier ein limitierender Faktor und gerade die schnellen Max-Konfiguration würden von einer stärkeren Kühlung profitieren. Das 14-Zoll-Modell dürfte hier noch einmal schwächer abschneiden, wenn man das 14-Zoll-Modell mit dem M4 Pro als Referenz nimmt.
Ansonsten gelten auch hier die gleichen Vor- und Nachteile wie beim M4-Pro-Modell. Dazu gehören das hochwertige Gehäuse, die umfangreiche Ausstattung, das tolle Mini-LED-Panel mit einer erhöhten Helligkeit und optionaler matter Oberfläche, das exzellente Soundsystem sowie lange Akkulaufzeiten. Nachteile sind die fehlenden Upgrade-/Wartungsmöglichkeiten in Verbindung mit den massiven Aufpreisen für mehr RAM/SSD-Kapazität.
Pro
Contra
Preis und Verfügbarkeit
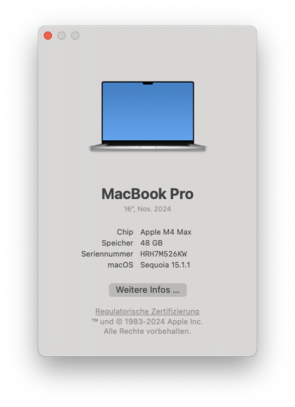
Unsere Testkonfiguration des MacBook Pro 16 M4 Max mit dem High-End M4 Max, 48 GB RAM und einer 1-TB-SSD wird für die UVP von 4.699 Euro angeboten, beispielsweise bei Notebooksbilliger.
Mögliche Alternativen im Vergleich
Bild | Modell / Test | Preis ab | Gewicht | Dicke | Display |
|---|---|---|---|---|---|
| Apple MacBook Pro 16 M4 Max Apple M4 Max (16 cores) ⎘ Apple M4 Max 40-Core GPU ⎘ 48 GB RAM, 1024 GB SSD | Amazon: 4.299,99 € Bestpreis 3999€ nullprozentshop.de 2. 3999€ Coolblue 3. 3999€ galaxus | 2.1 kg | 16.8 mm | 16.20" 3456x2234 254 PPI Mini-LED | |
| Apple MacBook Pro 16 2023 M3 Max Apple M3 Max 16-Core ⎘ Apple M3 Max 40-Core GPU ⎘ 128 GB RAM, 8192 GB SSD | Amazon: Bestpreis 3427.79282213€ AppliancesDirect 2. 3427.79282213€ LaptopsDirect | 2.1 kg | 16.9 mm | 16.00" 3456x2234 257 PPI Mini-LED | |
| HP ZBook Studio 16 G11 Intel Core Ultra 9 185H ⎘ NVIDIA RTX 3000 Ada Generation Laptop ⎘ 64 GB RAM, 1024 GB SSD | Amazon: 3.118,00 € Geizhals Suche | 1.8 kg | 19 mm | 16.00" 3840x2400 283 PPI IPS | |
| Lenovo ThinkPad P1 Gen 7 21KV001SGE Intel Core Ultra 7 155H ⎘ NVIDIA GeForce RTX 4060 Laptop GPU ⎘ 32 GB RAM, 1024 GB SSD | Amazon: 3.080,00 € Bestpreis 2966.74€ Easynotebooks.de 2. 2966.75€ Notebook.de 3. 2966.75€ TechnikDeals24 | 2 kg | 20.5 mm | 16.00" 2560x1600 189 PPI IPS LED | |
| Asus ProArt P16 H7606WI AMD Ryzen AI 9 HX 370 ⎘ NVIDIA GeForce RTX 4070 Laptop GPU ⎘ 64 GB RAM, 1024 GB SSD | Amazon: Geizhals Suche | 1.8 kg | 17.3 mm | 16.00" 3840x2400 283 PPI OLED | |
| Schenker XMG Pro 16 Studio (Mid 24) Intel Core i9-14900HX ⎘ NVIDIA GeForce RTX 4070 Laptop GPU ⎘ 32 GB RAM, 1024 GB SSD | Amazon: 1. 129,90 € Laptiptop 16,0" LED Display ... Geizhals Suche | 2.3 kg | 19.9 mm | 16.00" 2560x1600 189 PPI IPS | |
| Lenovo Yoga Pro 9 16IMH9 Intel Core Ultra 9 185H ⎘ NVIDIA GeForce RTX 4070 Laptop GPU ⎘ 32 GB RAM, 1024 GB SSD | Amazon: Geizhals Suche | 2.1 kg | 18.3 mm | 16.00" 3200x2000 236 PPI Mini-LED | |
| Dell XPS 16 9640 Intel Core Ultra 7 155H ⎘ NVIDIA GeForce RTX 4070 Laptop GPU ⎘ 32 GB RAM, 1024 GB SSD | Amazon: 1. 24,99 € mCover Nur kompatibel mit De... 2. 24,99 € mCover Nur kompatibel mit De... 3. 38,49 € Smatree Hard Eva Schutzhüll... Geizhals Suche | 2.3 kg | 18.7 mm | 16.30" 3840x2400 139 PPI OLED |
Das MacBook Pro 16 2024 wird entweder mit dem Vollausbau des neuen M4-Pro-SoC (hier im ausführlichen Test) oder aber zwei Varianten des stärkeren M4-Max-SoCs angeboten. Der "kleine" M4 Max bietet mit 14 CPU-Kernen dabei die gleiche CPU-Leistung wie der M4 Pro, dafür aber die stärkere GPU mit 32 Kernen für Preise ab 3.359 Euro. Der Vollausbau des M4 Max mit 16 CPU-Kernen und 40 GPU-Kernen startet ab 4.699 Euro und genau diese Variante mit 48 GB RAM sowie einer 1-TB-SSD haben wir heute auch im Test. Bei der Wahl von 128 GB RAM (+1.150 Euro), einer 8-TB-SSD (+2.350 Euro) sowie dem matten Panel (+170 Euro) kann man den Preis auf bis zu 8.549 Euro erhöhen.
Da es weder beim Gehäuse, den Anschlüssen, den Eingabegeräten, dem Display noch den Lautsprechern Unterschiede zum bereits getesteten M4-Pro-Modell gibt, werden wir diese Sektionen hier nicht noch einmal behandeln und fokussieren uns stattdessen auf die Leistung des neuen M4-Max-Prozessors.
Update 12. Dezember: PugetBench-Tests für Adobe Photoshop, Premiere Pro & DaVinci Resolve in der Sektion GPU-Leistung hinzugefügt
Spezifikationen
Preisvergleich
Unterschiede zum MacBook Pro 16 M4 Pro
Die 16-Zoll-Variante des 2024er MacBook Pro wird entweder mit dem M4-Pro-SoC oder dem M4-Max-SoC angeboten und sowohl beim Gehäuse als auch der Ausstattung sind sich alle Versionen sehr ähnlich. Dazu zählt die Unterstützung für Thunderbolt 5 (bis zu 120 GBit/s) bei allen USB-C-Anschlüssen oder auch die Kühlung mit zwei Lüftern, lediglich die Kühlkörper selbst weichen leicht ab. Der M4 Max kann allerdings zwei zusätzliche externe Displays ansteuern, neben dem internen Bildschirm also maximal vier externe Displays gleichzeitig.
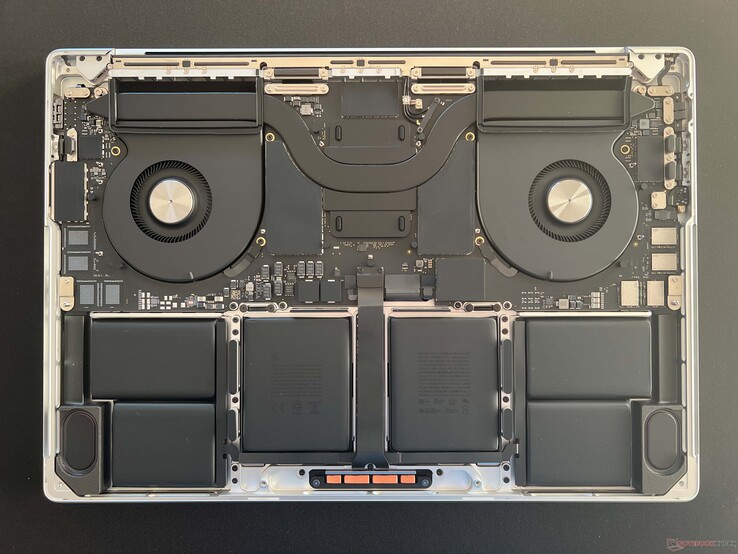
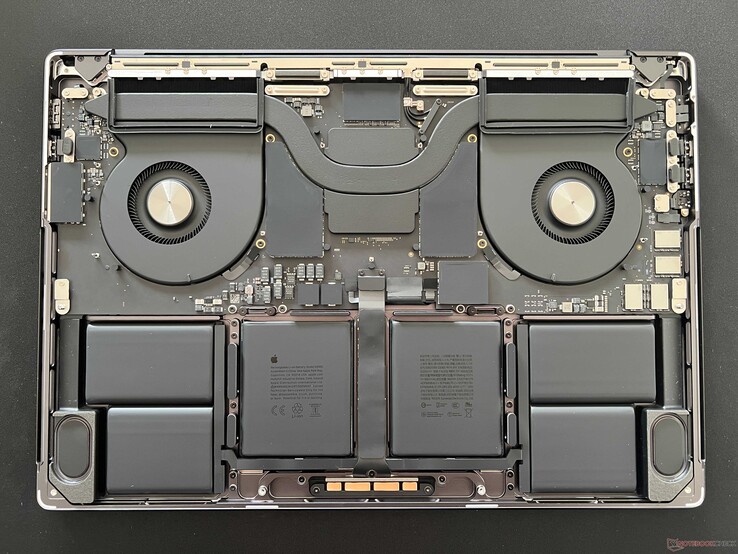
Nachhaltigkeit
Apple stellt einen Umwelt-Bericht für das MacBook Pro 16 auf der entsprechenden Produktseite zur Verfügung. Sowohl für das Gerät selbst als auch die Verpackung werden viele recycelte Materialien verwendet. Für die Testkonfiguration wird ein CO2-Fußabdruck von 303 kg angegeben.
Leistung - M4 Max mit bis zu 128 GB RAM
Der Vollausbau des neuen M4 Max kann im MacBook Pro 16 mit maximal 128 GB RAM konfiguriert werden, was ein großer Vorteil gegenüber nahezu allen Vergleichsgeräten darstellt. Da es sich zudem um einen gemeinsamen Arbeitsspeicher handelt, kann auch die GPU voll davon profitieren. Schon bald wird es hier mit den neuen Strix-Halo-APUs von AMD jedoch einen direkten Konkurrenten geben, der den Gerüchten zufolge mit bis zu 96 GB verfügbar sein wird.
Testbedingungen
Das MacBook Pro 16 bietet drei Energiemodi: Geringe Ladung, Automatisch, Hohe Leistung. Standardmäßig arbeitet das MacBook im Modus Automatisch, den wir auch für die nachfolgenden Benchmarks und Messungen verwendet haben. Der Modus Hohe Leistung hat in unseren Tests nicht immer einen Vorteil gebracht, das werden wir uns in den einzelnen Sektionen aber genauer ansehen.
Prozessor - M4 Max mit 16 Kernen
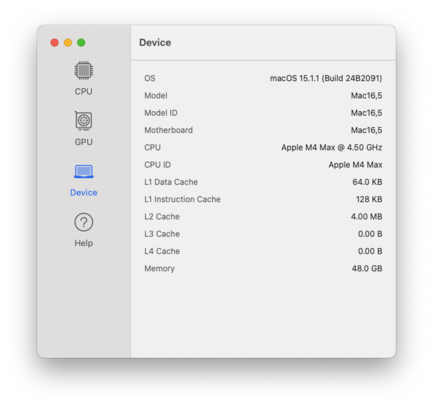
Apple hat seine CPU-Strategie mit den neuen M4-Chips im Vergleich zur alten M3-Generation erneut verändert. Denn während beide M3-Max-CPUs deutlich schneller waren als der M3 Pro, herrscht beim Vollausbau des M4 Pro sowie dem kleinen M4 Max nun Gleichstand, denn beiden bieten 14 CPU-Kerne (10x Performance, 4x Efficiency) mit identischen Taktraten. Lediglich das Top-Modell des M4 Max bekommt zwei zusätzliche Performance-Kerne spendiert, was sich aber natürlich auch beim Stromverbrauch widerspiegelt. Während der M4 Pro maximal 46 Watt bei voller Multi-Core-Belastung verbrauchte, sind es beim M4 Max nun bis zu 57 Watt, wobei dieser Wert nur sehr kurz erreicht wird und sich dann bei ~50 Watt einpendelt. Im Modus Hohe Leistung sind es 57-59 Watt und dieser Wert wird auch gehalten, weshalb die Multi-Core-Leistung in CB 2024 beispielsweise etwas besser ausfällt.
Die Multi-Core-Leistung ist beeindruckend. In den nativen Tests Cinebench 2024 sowie Geekbench liegt der Vorteil gegenüber dem alten M3 Max bei 17-21 % und auch der Vollausbau des M4 Pro wird hier um 14-17 % überboten. Im Cinebench-2024-Test handelt es sich sogar um einen der schnellsten Mobilprozessoren überhaupt, lediglich der übertaktete Core i9-14900HX im XMG Neo 16 mit angeschlossener Wasserkühlung ist noch einmal minimal schneller. Auch im Blender-CPU-Test muss sich der neue M4 Max lediglich dem Core i9-14900HX sowie dem AMD Ryzen 9 7945HX3D geschlagen geben.
Geekbench 6.5: Multi-Core | Single-Core
Blender: v3.3 Classroom CPU
| Cinebench 2024 / CPU Multi Core | |
| Schenker XMG Neo 16 (Early 24) (v6.92.6600, Overboost, Oasis) | |
| Apple MacBook Pro 16 M4 Max (High Performance) | |
| Apple MacBook Pro 16 M4 Max | |
| Asus ROG Strix Scar 17 G733PYV-LL053X | |
| Apple MacBook Pro 16 2024 M4 Pro | |
| Apple MacBook Pro 16 2023 M3 Max | |
| Schenker XMG Pro 16 Studio (Mid 24) | |
| Asus ProArt P16 H7606WI | |
| Dell XPS 16 9640 | |
| Lenovo ThinkPad P1 Gen 7 21KV001SGE | |
| HP ZBook Studio 16 G11 | |
| Cinebench 2024 / CPU Single Core | |
| Apple MacBook Pro 16 2024 M4 Pro | |
| Apple MacBook Pro 16 M4 Max | |
| Apple MacBook Pro 16 2023 M3 Max | |
| Schenker XMG Neo 16 (Early 24) (v6.92.6600, Overboost, Oasis) | |
| Schenker XMG Pro 16 Studio (Mid 24) | |
| Asus ProArt P16 H7606WI | |
| Asus ROG Strix Scar 17 G733PYV-LL053X | |
| HP ZBook Studio 16 G11 | |
| Dell XPS 16 9640 | |
| Lenovo ThinkPad P1 Gen 7 21KV001SGE | |
| Geekbench 6.5 / Multi-Core | |
| Apple MacBook Pro 16 M4 Max | |
| Apple MacBook Pro 16 2024 M4 Pro | |
| Apple MacBook Pro 16 2023 M3 Max | |
| Schenker XMG Neo 16 (Early 24) (6.2.1, Overboost, Oasis) | |
| Schenker XMG Pro 16 Studio (Mid 24) (6.2.1) | |
| Asus ROG Strix Scar 17 G733PYV-LL053X | |
| Asus ProArt P16 H7606WI (6.2.1) | |
| Lenovo Yoga Pro 9 16IMH9 (6.2.1) | |
| HP ZBook Studio 16 G11 (6.2.1) | |
| Dell XPS 16 9640 (6.2.1) | |
| Lenovo ThinkPad P1 Gen 7 21KV001SGE (6.2.1) | |
| Geekbench 6.5 / Single-Core | |
| Apple MacBook Pro 16 M4 Max | |
| Apple MacBook Pro 16 2024 M4 Pro | |
| Schenker XMG Neo 16 (Early 24) (6.2.1, Overboost, Oasis) | |
| Apple MacBook Pro 16 2023 M3 Max | |
| Asus ROG Strix Scar 17 G733PYV-LL053X | |
| Asus ProArt P16 H7606WI (6.2.1) | |
| Schenker XMG Pro 16 Studio (Mid 24) (6.2.1) | |
| Lenovo Yoga Pro 9 16IMH9 (6.2.1) | |
| HP ZBook Studio 16 G11 (6.2.1) | |
| Dell XPS 16 9640 (6.2.1) | |
| Lenovo ThinkPad P1 Gen 7 21KV001SGE (6.2.1) | |
| Blender / v3.3 Classroom CPU | |
| HP ZBook Studio 16 G11 (3.3.3) | |
| Dell XPS 16 9640 (3.3.3) | |
| Lenovo ThinkPad P1 Gen 7 21KV001SGE (3.3.3) | |
| Lenovo Yoga Pro 9 16IMH9 (3.3.3) | |
| Schenker XMG Pro 16 Studio (Mid 24) (3.3.3) | |
| Asus ProArt P16 H7606WI (3.3.3) | |
| Apple MacBook Pro 16 2023 M3 Max | |
| Apple MacBook Pro 16 M4 Max | |
| Schenker XMG Neo 16 (Early 24) (3.3.3, Overboost, Oasis) | |
| Asus ROG Strix Scar 17 G733PYV-LL053X (3.3.3) | |
* ... kleinere Werte sind besser
Die Single-Core-Performance der neuen M4-SoCs ist sowieso über jeden Zweifel erhaben und Apple konnte den Vorsprung gegenüber der Konkurrenz weiter ausbauen. Der alte M3 Max wird um satte 25-28 % überboten und die restlichen Konkurrenten haben hier einfach keine Chance. Der Stromverbrauch in Single-Core-Tests ist mit 6,2-6,5 Watt allerdings etwas höher als beim M4 Pro.
Den Stresstest von Cinebench 2024 Multi (30 Minuten) besteht der M4 Max in beiden Energieprofilen problemlos und die Leistung bleibt vollkommen konstant. In der alten Cinebench-R15-Multi-Schleife schwankt die Leistung im Modus Automatisch minimal, was aber einfach an der sehr kurzen Testdauer liegt (wenige Sekunden). Hier wirkt sich das kurzzeitige höhere Limit von 57 Watt bzw. der Abfall auf 50 Watt also aus. Wir reden hier aber trotzdem nur von einer Reduktion von ~3-4 %.
Im Akkubetrieb bleibt die Leistung stabil, bis der Akkustand 4 % erreicht. Erst ab diesem Punkt gibt es eine deutliche Leistungsreduzierung. Weitere CPU-Benchmarks stehen hier zur Verfügung.
Cinebench R15 Multi Dauertest
System Performance
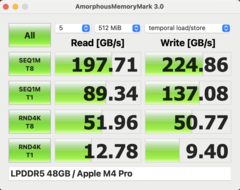
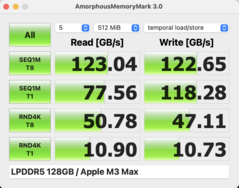
Im systemübergreifenden CrossMark-Benchmark kann sich das MacBook Pro 16 M4 Max deutlich vor den direkten Konkurrenten platzieren und auch in den Browser-Tests ist der Vorsprung deutlich. Die subjektive Leistungsfähigkeit ist ebenfalls sehr hoch, wobei das aber auch für die Konkurrenz gilt. Wir hatten während des Tests auch keinerlei Probleme mit der Stabilität. Die Geschwindigkeit des RAMs konnte im Vergleich zum M3 Max deutlich verbessert werden, im Vergleich zum M4 Pro sind die Unterschiede aber nur gering.
WebXPRT 3: Overall
WebXPRT 4: Overall
Mozilla Kraken 1.1: Total
| CrossMark / Overall | |
| Apple MacBook Pro 16 M4 Max | |
| Durchschnittliche Apple M4 Max (16 cores), Apple M4 Max 40-Core GPU (n=1) | |
| Schenker XMG Pro 16 Studio (Mid 24) | |
| Apple MacBook Pro 16 2023 M3 Max | |
| Dell XPS 16 9640 | |
| Asus ProArt P16 H7606WI | |
| HP ZBook Studio 16 G11 | |
| Durchschnitt der Klasse Multimedia (866 - 2426, n=63, der letzten 2 Jahre) | |
| Lenovo Yoga Pro 9 16IMH9 | |
| Lenovo ThinkPad P1 Gen 7 21KV001SGE | |
| CrossMark / Productivity | |
| Apple MacBook Pro 16 M4 Max | |
| Durchschnittliche Apple M4 Max (16 cores), Apple M4 Max 40-Core GPU (n=1) | |
| Schenker XMG Pro 16 Studio (Mid 24) | |
| Apple MacBook Pro 16 2023 M3 Max | |
| Dell XPS 16 9640 | |
| HP ZBook Studio 16 G11 | |
| Durchschnitt der Klasse Multimedia (913 - 2344, n=63, der letzten 2 Jahre) | |
| Lenovo ThinkPad P1 Gen 7 21KV001SGE | |
| Lenovo Yoga Pro 9 16IMH9 | |
| Asus ProArt P16 H7606WI | |
| CrossMark / Creativity | |
| Apple MacBook Pro 16 M4 Max | |
| Durchschnittliche Apple M4 Max (16 cores), Apple M4 Max 40-Core GPU (n=1) | |
| Apple MacBook Pro 16 2023 M3 Max | |
| Schenker XMG Pro 16 Studio (Mid 24) | |
| Asus ProArt P16 H7606WI | |
| Dell XPS 16 9640 | |
| Lenovo Yoga Pro 9 16IMH9 | |
| Durchschnitt der Klasse Multimedia (907 - 2820, n=63, der letzten 2 Jahre) | |
| HP ZBook Studio 16 G11 | |
| Lenovo ThinkPad P1 Gen 7 21KV001SGE | |
| CrossMark / Responsiveness | |
| Schenker XMG Pro 16 Studio (Mid 24) | |
| Dell XPS 16 9640 | |
| Apple MacBook Pro 16 M4 Max | |
| Durchschnittliche Apple M4 Max (16 cores), Apple M4 Max 40-Core GPU (n=1) | |
| Apple MacBook Pro 16 2023 M3 Max | |
| HP ZBook Studio 16 G11 | |
| Durchschnitt der Klasse Multimedia (605 - 2094, n=63, der letzten 2 Jahre) | |
| Lenovo ThinkPad P1 Gen 7 21KV001SGE | |
| Lenovo Yoga Pro 9 16IMH9 | |
| Asus ProArt P16 H7606WI | |
| WebXPRT 3 / Overall | |
| Apple MacBook Pro 16 M4 Max | |
| Durchschnittliche Apple M4 Max (16 cores), Apple M4 Max 40-Core GPU (n=1) | |
| Apple MacBook Pro 16 2023 M3 Max | |
| Durchschnitt der Klasse Multimedia (136.4 - 545, n=66, der letzten 2 Jahre) | |
| Schenker XMG Pro 16 Studio (Mid 24) | |
| Asus ProArt P16 H7606WI | |
| Lenovo Yoga Pro 9 16IMH9 | |
| HP ZBook Studio 16 G11 | |
| Lenovo ThinkPad P1 Gen 7 21KV001SGE | |
| Dell XPS 16 9640 | |
| WebXPRT 4 / Overall | |
| Apple MacBook Pro 16 M4 Max | |
| Durchschnittliche Apple M4 Max (16 cores), Apple M4 Max 40-Core GPU (n=1) | |
| Schenker XMG Pro 16 Studio (Mid 24) | |
| Durchschnitt der Klasse Multimedia (167.3 - 384, n=65, der letzten 2 Jahre) | |
| Lenovo Yoga Pro 9 16IMH9 | |
| HP ZBook Studio 16 G11 | |
| Lenovo ThinkPad P1 Gen 7 21KV001SGE | |
| Dell XPS 16 9640 | |
| Asus ProArt P16 H7606WI | |
| Mozilla Kraken 1.1 / Total | |
| Lenovo ThinkPad P1 Gen 7 21KV001SGE | |
| HP ZBook Studio 16 G11 | |
| Lenovo Yoga Pro 9 16IMH9 | |
| Durchschnitt der Klasse Multimedia (228 - 835, n=69, der letzten 2 Jahre) | |
| Schenker XMG Pro 16 Studio (Mid 24) | |
| Asus ProArt P16 H7606WI | |
| Apple MacBook Pro 16 2023 M3 Max | |
| Apple MacBook Pro 16 M4 Max | |
| Durchschnittliche Apple M4 Max (16 cores), Apple M4 Max 40-Core GPU (n=1) | |
* ... kleinere Werte sind besser
Massenspeicher
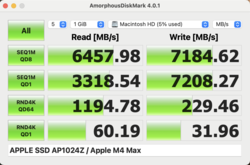
Trotz des sehr hohen Preises unserer Testkonfiguration ist nur eine 1-TB-SSD verbaut, die nicht getauscht bzw. aufgerüstet werden kann. Im Auslieferungszustand stehen 962 GB zur freien Verfügung und die Transferraten der PCIe-4.0-SSD sind sehr gut. Maximal kann das MBP 16 mit einer 8-TB-SSD ausgestattet werden, was sich Apple mit 2.530 Euro aber auch teuer bezahlen lässt. Weitere SSD-Benchmarks sind hier gelistet.
| Blackmagic Disk Speed Test / 5GB Read | |
| Apple MacBook Pro 16 2024 M4 Pro | |
| Apple MacBook Pro 14 2023 M3 Max | |
| Apple MacBook Pro 14 2024 M4 Pro Entry | |
| Durchschnitt der Klasse Multimedia (3028 - 6752, n=6, der letzten 2 Jahre) | |
| Apple MacBook Pro 16 M4 Max | |
| Durchschnittliche Apple SSD AP1024Z (2797 - 6752, n=9) | |
| Blackmagic Disk Speed Test / 5GB Write | |
| Apple MacBook Pro 16 2024 M4 Pro | |
| Apple MacBook Pro 14 2023 M3 Max | |
| Apple MacBook Pro 14 2024 M4 Pro Entry | |
| Apple MacBook Pro 16 M4 Max | |
| Durchschnitt der Klasse Multimedia (3426 - 6713, n=6, der letzten 2 Jahre) | |
| Durchschnittliche Apple SSD AP1024Z (2873 - 6431, n=9) | |
Grafikkarte - M4 Max mit 40 GPU-Kernen
Der schnelle M4-Max-SoC ist mit einer 40-Kern-GPU ausgestattet und ist damit das aktuelle Top-Modell von Apple. Maximal konnten wir der GPU 75 Watt entlocken, in vielen Tests sind es aber maximal 60 Watt. Der Turbo-Modus hatte hier keinen direkten Einfluss auf die Energieaufnahme, im Cinebench-2024-GPU-Test konnten wir aber dennoch ein besseres Ergebnis erzielen (+4,7 %). Die GPU kann auf den gesamten Arbeitsspeicher zugreifen.
Je nach Benchmark liegt der Vorteil gegenüber der alten M3-Max-GPU bei 14-27 % und in systemübergreifenden Tests sind die Ergebnisse in der Regel etwas besser als bei der GeForce RTX 4070 Laptop der direkten Konkurrenten wie beispielsweise dem Asus ProArt P16. In den GFX-Bench-Tests sowie dem CB-2024-GPU-Test können sogar langsame Varianten der RTX 4080 Laptop geschlagen werden. Im Blender-Test mit Metal benötigt der M4-Max-SoC rund 18 Sekunden und liegt damit auf dem Niveau der dedizierten Nvidia-GPUs (OPTIX oder CUDA). Sowohl im Akkubetrieb als auch bei dauerhafter Belastung bleibt die GPU-Leistung stabil.
Geekbench 6.5: GPU Metal | GPU OpenCL
GFXBench: 3840x2160 4K Aztec Ruins High Tier Offscreen | 2560x1440 Aztec Ruins High Tier Offscreen | 1920x1080 Car Chase Offscreen
Cinebench 2024: GPU
Blender: v3.3 Classroom METAL | v3.3 Classroom OPTIX/RTX | v3.3 Classroom CUDA
| 3DMark / Steel Nomad Light Score | |
| Razer Blade 16 Early 2023 (DX12) | |
| Razer Blade 16 Early 2023 (Vulkan) | |
| Durchschnittliche Apple M4 Max 40-Core GPU (13989 - 14432, n=2) | |
| Apple MacBook Pro 16 M4 Max | |
| Asus ProArt P16 H7606WI | |
| Apple MacBook Pro 16 2024 M4 Pro | |
| Apple MacBook Pro 14 2024 M4 Pro Entry | |
| Durchschnitt der Klasse Multimedia (1147 - 21012, n=39, der letzten 2 Jahre) | |
| 3DMark / Wild Life Extreme Unlimited | |
| Apple MacBook Pro 16 M4 Max | |
| Durchschnittliche Apple M4 Max 40-Core GPU (n=1) | |
| Apple MacBook Pro 16 2023 M3 Max | |
| Asus ProArt P16 H7606WI | |
| Lenovo Yoga Pro 9 16IMH9 | |
| Apple MacBook Pro 16 2024 M4 Pro | |
| Dell XPS 16 9640 | |
| Durchschnitt der Klasse Multimedia (3164 - 37434, n=24, der letzten 2 Jahre) | |
| Geekbench 6.5 / GPU Metal | |
| Apple MacBook Pro 16 M4 Max | |
| Durchschnittliche Apple M4 Max 40-Core GPU (n=1) | |
| Apple MacBook Pro 16 2023 M3 Max | |
| Apple MacBook Pro 16 2024 M4 Pro | |
| Durchschnitt der Klasse Multimedia (57998 - 179746, n=6, der letzten 2 Jahre) | |
| Apple MacBook Pro 14 2024 M4 Pro Entry | |
| Geekbench 6.5 / GPU OpenCL | |
| Razer Blade 16 Early 2023 (6.4.0 Pro) | |
| Razer Blade 16 Early 2023 (6.3) | |
| Asus Zenbook Pro 16X UX7602BZ-MY005W | |
| Lenovo ThinkPad P1 G6 21FV001KUS (6.2.1) | |
| Schenker XMG Pro 16 Studio (Mid 24) (6.2.1) | |
| Apple MacBook Pro 16 M4 Max | |
| Durchschnittliche Apple M4 Max 40-Core GPU (n=1) | |
| Lenovo Yoga Pro 9 16IMH9 (6.2.1) | |
| Asus ProArt P16 H7606WI (6.2.1) | |
| Dell XPS 16 9640 (6.2.1) | |
| HP ZBook Studio 16 G11 (6.2.1) | |
| Lenovo ThinkPad P1 Gen 7 21KV001SGE (6.2.1) | |
| Apple MacBook Pro 16 2023 M3 Max | |
| Apple MacBook Pro 16 2024 M4 Pro | |
| Apple MacBook Pro 14 2024 M4 Pro Entry | |
| Durchschnitt der Klasse Multimedia (9994 - 187922, n=69, der letzten 2 Jahre) | |
| GFXBench / 4K Aztec Ruins High Tier Offscreen | |
| Durchschnittliche Apple M4 Max 40-Core GPU (n=1) | |
| Apple MacBook Pro 16 M4 Max | |
| Razer Blade 16 Early 2023 | |
| Apple MacBook Pro 16 2023 M3 Max | |
| Lenovo Legion Pro 7 16IRX8H | |
| Apple MacBook Pro 16 2024 M4 Pro | |
| Asus ProArt P16 H7606WI | |
| Apple MacBook Pro 14 2024 M4 Pro Entry | |
| Lenovo ThinkPad P1 Gen 7 21KV001SGE | |
| Durchschnitt der Klasse Multimedia (36.4 - 232, n=13, der letzten 2 Jahre) | |
| GFXBench / Aztec Ruins High Tier Offscreen | |
| Durchschnittliche Apple M4 Max 40-Core GPU (n=1) | |
| Apple MacBook Pro 16 M4 Max | |
| Razer Blade 16 Early 2023 | |
| Lenovo Legion Pro 7 16IRX8H | |
| Apple MacBook Pro 16 2023 M3 Max | |
| Apple MacBook Pro 16 2024 M4 Pro | |
| Asus ProArt P16 H7606WI | |
| Apple MacBook Pro 14 2024 M4 Pro Entry | |
| Lenovo ThinkPad P1 Gen 7 21KV001SGE | |
| Durchschnitt der Klasse Multimedia (73.3 - 516, n=13, der letzten 2 Jahre) | |
| GFXBench / Car Chase Offscreen | |
| Durchschnittliche Apple M4 Max 40-Core GPU (n=1) | |
| Apple MacBook Pro 16 M4 Max | |
| Apple MacBook Pro 16 2024 M4 Pro | |
| Apple MacBook Pro 16 2023 M3 Max | |
| Lenovo ThinkPad P1 Gen 7 21KV001SGE | |
| Apple MacBook Pro 14 2024 M4 Pro Entry | |
| Durchschnitt der Klasse Multimedia (174.6 - 941, n=10, der letzten 2 Jahre) | |
| Cinebench 2024 / GPU | |
| Razer Blade 16 Early 2023 | |
| Apple MacBook Pro 16 M4 Max (High Performance) | |
| Apple MacBook Pro 16 M4 Max | |
| Durchschnittliche Apple M4 Max 40-Core GPU (15804 - 16546, n=2) | |
| Lenovo ThinkPad P1 G6 21FV001KUS | |
| Apple MacBook Pro 16 2023 M3 Max | |
| Schenker XMG Pro 16 Studio (Mid 24) | |
| Dell XPS 16 9640 | |
| Lenovo ThinkPad P1 Gen 7 21KV001SGE | |
| Asus ProArt P16 H7606WI | |
| Durchschnitt der Klasse Multimedia (4201 - 16546, n=14, der letzten 2 Jahre) | |
| Apple MacBook Pro 16 2024 M4 Pro | |
| Apple MacBook Pro 14 2024 M4 Pro Entry | |
| Blender / v3.3 Classroom METAL | |
| Apple MacBook Pro 14 2024 M4 Pro Entry (3.3.21) | |
| Durchschnitt der Klasse Multimedia (17.8 - 68, n=3, der letzten 2 Jahre) | |
| Apple MacBook Pro 16 2023 M3 Max | |
| Apple MacBook Pro 16 M4 Max | |
| Durchschnittliche Apple M4 Max 40-Core GPU (n=1) | |
| Blender / v3.3 Classroom OPTIX/RTX | |
| Durchschnitt der Klasse Multimedia (12 - 105, n=28, der letzten 2 Jahre) | |
| Lenovo ThinkPad P1 Gen 7 21KV001SGE (3.3.3) | |
| Schenker XMG Pro 16 Studio (Mid 24) (3.3.3) | |
| HP ZBook Studio 16 G11 (3.3.3) | |
| Asus ProArt P16 H7606WI (3.3.3) | |
| Dell XPS 16 9640 (3.3.3) | |
| Lenovo Yoga Pro 9 16IMH9 (3.3.3) | |
| Asus Zenbook Pro 16X UX7602BZ-MY005W (3.3.3) | |
| Lenovo ThinkPad P1 G6 21FV001KUS (3.3.3) | |
| Razer Blade 16 Early 2023 (3.3.3) | |
| Lenovo Legion Pro 7 16IRX8H (3.3.3) | |
| Blender / v3.3 Classroom CUDA | |
| Durchschnitt der Klasse Multimedia (20 - 186, n=28, der letzten 2 Jahre) | |
| Lenovo ThinkPad P1 Gen 7 21KV001SGE (3.3.3) | |
| HP ZBook Studio 16 G11 (3.3.3) | |
| Dell XPS 16 9640 (3.3.3) | |
| Schenker XMG Pro 16 Studio (Mid 24) (3.3.3) | |
| Asus ProArt P16 H7606WI (3.3.3) | |
| Lenovo Yoga Pro 9 16IMH9 (3.3.3) | |
| Lenovo ThinkPad P1 G6 21FV001KUS (3.3.3) | |
| Asus Zenbook Pro 16X UX7602BZ-MY005W (3.3.3) | |
| Lenovo Legion Pro 7 16IRX8H (3.3.3) | |
| Razer Blade 16 Early 2023 (3.3.3) | |
Geekbench 6.5: GPU Metal | GPU OpenCL
GFXBench: 3840x2160 4K Aztec Ruins High Tier Offscreen | 2560x1440 Aztec Ruins High Tier Offscreen | 1920x1080 Car Chase Offscreen
Cinebench 2024: GPU
Blender: v3.3 Classroom METAL | v3.3 Classroom OPTIX/RTX | v3.3 Classroom CUDA
* ... kleinere Werte sind besser
| 3DMark Steel Nomad Light Score | 13989 Punkte | |
| 3DMark Steel Nomad Light Unlimited Score | 14212 Punkte | |
Hilfe | ||
Update 12. Dezember: Wir haben zusätzlich noch die PugetBench-Tests für Adobe Photoshop, Premiere Pro sowie DaVinci Resolve durchgeführt. Die Ergebnisse sind sehr gut für den M4 Max, denn hier können auch schnelle Konkurrenten mit der GeForce RTX 4090 Laptop geschlagen werden. Vor allem in DaVinci Resolve, das auch wir für den Videoschnitt verwenden und bei dem es vornehmlich auf die GPU-Leistung ankommt, kann sich der M4 Max 12 % vor der GeForce RTX 4090 Laptop im Razer Blade 16 (175W TGP) platzieren. Es handelt sich damit aktuell um den besten Laptop für die Videobearbeitung
| DaVinci Resolve PugetBench - Extended Score 1.1 | |
| Apple MacBook Pro 16 M4 Max | |
| Razer Blade 16 2024, RTX 4090 | |
| Asus ROG Zephyrus G16 GA605WI | |
| Lenovo Yoga Pro 9 16IMH9 | |
Die Bewertung der Gaming-Performance gestaltet sich nach wie vor schwierig, da die Anzahl an nativen Titeln für macOS begrenzt ist. Aktuell können wir nur auf Baldur's Gate 3 zurückgreifen, um die Leistung mit Windows-Laptops zu vergleichen. In 1080p und mit maximalen Details liegt die M4-Max-GPU zwischen den Konkurrenten mit der GeForce RTX 4070 Laptop. Die anderen getesteten Titel müssen aber emuliert werden und hier erkennt man ganz deutlich Leistungseinschränkungen. Spannend wird im nächsten Jahr der Titel Cyberpunk 2077, der dann auch nativ für macOS erscheinen wird.
| Total War Pharaoh - 1920x1080 Ultra Preset | |
| Apple MacBook Pro 16 2023 M3 Max | |
| Apple MacBook Pro 16 M4 Max | |
| Apple MacBook Pro 16 2024 M4 Pro | |
| Durchschnitt der Klasse Multimedia (23.4 - 56, n=12, der letzten 2 Jahre) | |
| The Witcher 3 - 1920x1080 Ultra Graphics & Postprocessing (HBAO+) | |
| Asus ProArt P16 H7606WI | |
| Lenovo Yoga Pro 9 16IMH9 | |
| Apple MacBook Pro 16 M4 Max | |
| Dell XPS 16 9640 | |
| Apple MacBook Pro 16 2023 M3 Max | |
| Durchschnitt der Klasse Multimedia (11 - 121, n=29, der letzten 2 Jahre) | |
| Shadow of the Tomb Raider - 1920x1080 Highest Preset AA:T | |
| Apple MacBook Pro 16 M4 Max | |
| Apple MacBook Pro 16 2023 M3 Max | |
| Apple MacBook Pro 16 2024 M4 Pro | |
| Durchschnitt der Klasse Multimedia (23 - 129, n=7, der letzten 2 Jahre) | |
| min. | mittel | hoch | max. | QHD | 4K | |
|---|---|---|---|---|---|---|
| The Witcher 3 (2015) | 157 | 107 | 78 | 61 | ||
| Shadow of the Tomb Raider (2018) | 167 | 143 | 129 | 94 | 51 | |
| Baldur's Gate 3 (2023) | 164 | 131 | 101 | 99 | 69 | 35 |
| Cyberpunk 2077 (2023) | 49.1 | 48.7 | 48.5 | 47.4 | 43 | 21.3 |
| Total War Pharaoh (2023) | 74.1 | 61.8 | 56.1 | 56 | 56 | 50 |
Emissionen & Energie
Geräuschemissionen
Die Kühlung unterscheidet sich grundsätzlich nicht vom bereits getesteten Modell mit dem M4 Pro. Im Leerlauf und bei einfachen Aufgaben bleibt das MacBook in der Regel komplett leise bzw. man hört nur ein ganz leises Rauschen. Sobald man das Gerät etwas mehr belastet wird beim M4 Max allerdings deutlich schneller die maximale Lautstärke von ~42,2 dB(A) im Modus Automatisch erreicht. Im Modus Hohe Leistung schwankt die Lüfterdrehzahl deutlich stärker, als es noch beim M4-Pro-Modell der Fall war. Im Stresstest messen wir hier maximal 54,7 dB(A) bzw. 50,2 dB(A) bei Baldur's Gate 3. Bei einigen GPU-Benchmarks konnten wir ein leichtes Spulenfiepen hören.
Lautstärkediagramm
| Idle |
| 24.1 / 24.1 / 24.1 dB(A) |
| Last |
| 42.2 / 42.2 dB(A) |
 | ||
30 dB leise 40 dB(A) deutlich hörbar 50 dB(A) störend |
||
min: | ||
| Apple MacBook Pro 16 M4 Max M4 Max 40-Core GPU, M4 Max (16 cores), Apple SSD AP1024Z | Apple MacBook Pro 16 2023 M3 Max M3 Max 40-Core GPU, Apple M3 Max 16-Core, Apple SSD AP8192Z | HP ZBook Studio 16 G11 RTX 3000 Ada Generation Laptop, Ultra 9 185H, Kioxia XG8 KXG80ZNV1T02 | Lenovo ThinkPad P1 Gen 7 21KV001SGE GeForce RTX 4060 Laptop GPU, Ultra 7 155H, Kioxia XG8 KXG8AZNV1T02 | Asus ProArt P16 H7606WI GeForce RTX 4070 Laptop GPU, Ryzen AI 9 HX 370, Micron 2400 MTFDKBA1T0QFM | Schenker XMG Pro 16 Studio (Mid 24) GeForce RTX 4070 Laptop GPU, i9-14900HX, Samsung 990 Pro 1 TB | Lenovo Yoga Pro 9 16IMH9 GeForce RTX 4070 Laptop GPU, Ultra 9 185H, SK Hynix HFS001TEJ9X115N | Dell XPS 16 9640 GeForce RTX 4070 Laptop GPU, Ultra 7 155H, Kioxia XG8 KXG80ZNV1T02 | |
|---|---|---|---|---|---|---|---|---|
| Geräuschentwicklung | 2% | -5% | -9% | -15% | -24% | -9% | -5% | |
| aus / Umgebung * (dB) | 24.1 | 23.7 2% | 23.8 1% | 24.7 -2% | 24.4 -1% | 25 -4% | 24.3 -1% | 24.5 -2% |
| Idle min * (dB) | 24.1 | 23.7 2% | 23.8 1% | 24.7 -2% | 24.4 -1% | 28 -16% | 24.3 -1% | 24.5 -2% |
| Idle avg * (dB) | 24.1 | 23.7 2% | 26.4 -10% | 24.7 -2% | 27.7 -15% | 31 -29% | 24.3 -1% | 24.5 -2% |
| Idle max * (dB) | 24.1 | 23.7 2% | 26.4 -10% | 24.7 -2% | 32.3 -34% | 35 -45% | 25.8 -7% | 27.5 -14% |
| Last avg * (dB) | 42.2 | 40.8 3% | 33.7 20% | 43.7 -4% | 42.2 -0% | 52 -23% | 48.1 -14% | 39.6 6% |
| Cyberpunk 2077 ultra * (dB) | 42.2 | 46.1 -9% | 53.2 -26% | 53.2 -26% | 53 -26% | |||
| Last max * (dB) | 42.2 | 42.8 -1% | 53.2 -26% | 53.3 -26% | 53.2 -26% | 52 -23% | 53.9 -28% | 49.7 -18% |
| Witcher 3 ultra * (dB) | 42.8 | 49.7 | 49.7 |
* ... kleinere Werte sind besser
Temperatur
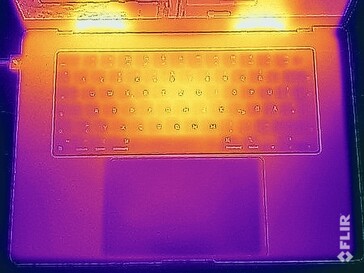
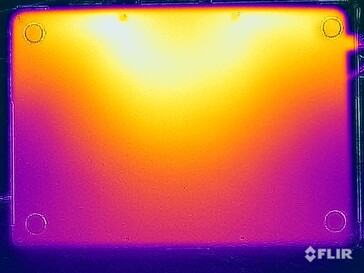
Die Oberflächentemperaturen des MacBook Pro 16 hat Apple sehr gut im Griff. Bei wenig Last wärmt sich das Gehäuse praktisch überhaupt nicht auf und auch beim Spielen oder im Stresstest messen wir maximal knapp 43 °C. Damit kann man das Gerät auch noch problemlos auf den Oberschenkeln abstellen. Der Tastaturbereich erwärmt sich ebenfalls spürbar und es kann warme Finger geben, zu Einschränkungen kommt es hier aber nicht.
(±) Die maximale Temperatur auf der Oberseite ist 42.8 °C. Im Vergleich liegt der Klassendurchschnitt bei 36.9 °C (von 21.1 bis 71 °C für die Klasse Multimedia).
(±) Auf der Unterseite messen wir eine maximalen Wert von 42.3 °C (im Vergleich zum Durchschnitt von 39.2 °C).
(+) Ohne Last messen wir eine durchschnittliche Temperatur von 23.2 °C auf der Oberseite. Der Klassendurchschnitt erreicht 31.3 °C.
(±) 3: The average temperature for the upper side is 37.2 °C / 99 F, compared to the average of 31.3 °C / 88 F for the class Multimedia.
(+) Die Handballen und der Touchpad-Bereich sind mit gemessenen 30.8 °C kühler als die typische Hauttemperatur und fühlen sich dadurch kühl an.
(-) Die durchschnittliche Handballen-Temperatur anderer getesteter Geräte war 28.7 °C (-2.1 °C).
| Apple MacBook Pro 16 M4 Max Apple M4 Max (16 cores), Apple M4 Max 40-Core GPU | Apple MacBook Pro 16 2023 M3 Max Apple M3 Max 16-Core, Apple M3 Max 40-Core GPU | HP ZBook Studio 16 G11 Intel Core Ultra 9 185H, NVIDIA RTX 3000 Ada Generation Laptop | Lenovo ThinkPad P1 Gen 7 21KV001SGE Intel Core Ultra 7 155H, NVIDIA GeForce RTX 4060 Laptop GPU | Asus ProArt P16 H7606WI AMD Ryzen AI 9 HX 370, NVIDIA GeForce RTX 4070 Laptop GPU | Schenker XMG Pro 16 Studio (Mid 24) Intel Core i9-14900HX, NVIDIA GeForce RTX 4070 Laptop GPU | Lenovo Yoga Pro 9 16IMH9 Intel Core Ultra 9 185H, NVIDIA GeForce RTX 4070 Laptop GPU | Dell XPS 16 9640 Intel Core Ultra 7 155H, NVIDIA GeForce RTX 4070 Laptop GPU | |
|---|---|---|---|---|---|---|---|---|
| Hitze | 3% | -21% | -11% | -20% | -47% | -8% | -4% | |
| Last oben max * (°C) | 42.8 | 42.3 1% | 36.6 14% | 50.3 -18% | 46.9 -10% | 51 -19% | 41.7 3% | 39.4 8% |
| Last unten max * (°C) | 42.3 | 42 1% | 47.8 -13% | 38 10% | 50.9 -20% | 66 -56% | 46.3 -9% | 36.9 13% |
| Idle oben max * (°C) | 23.6 | 22.5 5% | 31.4 -33% | 28.3 -20% | 28.9 -22% | 35 -48% | 26.2 -11% | 28.2 -19% |
| Idle unten max * (°C) | 23.5 | 22.9 3% | 35.6 -51% | 27.3 -16% | 30 -28% | 39 -66% | 27.2 -16% | 27.4 -17% |
* ... kleinere Werte sind besser
Stresstest
Im Stresstest zeigt sich ein etwas anderes Verhalten des M4-Max-Testgerätes im Vergleich zur M4-Pro-Variante, was uns etwas überrascht hat. Zudem hat der Modus Hohe Leistung hier auch keinen spürbaren Einfluss. Im Verlauf pendelt sich der CPU/GPU-Verbrauch jeweils bei rund 28 Watt ein, also insgesamt nur etwa 56 Watt. Die M4-Pro-Variante lag im Modus Automatisch bei rund 60 Watt und sogar 66 Watt im Modus Hohe Leistung. Bei kombinierter Last kann die Kühlung des MacBook Pro 16 das Leistungspotenzial des neuen M4 Max also überhaupt nicht ausnutzen.
Energieaufnahme
Die Energieaufnahme des MacBook Pro 16 mit dem M4 Max wird bei sehr hoher Belastung durch das 140-Watt-Netzteil begrenzt, allerdings nur für eine sehr kurze Zeit und der Akku wird auch nicht angezapft. Maximal ermitteln wir rund 144 Watt, danach fällt der Verbrauch aber schnell ab und liegt nur noch bei rund 120 Watt. Beim Spielen sind es rund 116 Watt und damit rund 30 Watt mehr als bei der M4-Pro-Konfiguration.
| Aus / Standby | |
| Idle | |
| Last |
|
Legende:
min: | |
| Apple MacBook Pro 16 M4 Max M4 Max 40-Core GPU, M4 Max (16 cores), Apple SSD AP1024Z | Apple MacBook Pro 16 2023 M3 Max M3 Max 40-Core GPU, Apple M3 Max 16-Core, Apple SSD AP8192Z | Apple MacBook Pro 16 2024 M4 Pro M4 Pro 20-Core GPU, M4 Pro (14 cores), Apple SSD AP2048Z | HP ZBook Studio 16 G11 RTX 3000 Ada Generation Laptop, Ultra 9 185H, Kioxia XG8 KXG80ZNV1T02 | Lenovo ThinkPad P1 Gen 7 21KV001SGE GeForce RTX 4060 Laptop GPU, Ultra 7 155H, Kioxia XG8 KXG8AZNV1T02 | Asus ProArt P16 H7606WI GeForce RTX 4070 Laptop GPU, Ryzen AI 9 HX 370, Micron 2400 MTFDKBA1T0QFM | Schenker XMG Pro 16 Studio (Mid 24) GeForce RTX 4070 Laptop GPU, i9-14900HX, Samsung 990 Pro 1 TB | Lenovo Yoga Pro 9 16IMH9 GeForce RTX 4070 Laptop GPU, Ultra 9 185H, SK Hynix HFS001TEJ9X115N | Dell XPS 16 9640 GeForce RTX 4070 Laptop GPU, Ultra 7 155H, Kioxia XG8 KXG80ZNV1T02 | |
|---|---|---|---|---|---|---|---|---|---|
| Stromverbrauch | -1% | 12% | -43% | -6% | -14% | -153% | -41% | 9% | |
| Idle min * (Watt) | 4.7 | 5.2 -11% | 4.6 2% | 14 -198% | 7.3 -55% | 8 -70% | 31 -560% | 10.3 -119% | 7.7 -64% |
| Idle avg * (Watt) | 15.5 | 16.9 -9% | 16.8 -8% | 22.4 -45% | 12.3 21% | 9.9 36% | 33 -113% | 21.9 -41% | 10.3 34% |
| Idle max * (Watt) | 15.6 | 17.2 -10% | 17.1 -10% | 25.7 -65% | 17.9 -15% | 11.6 26% | 41 -163% | 22.4 -44% | 10.6 32% |
| Last avg * (Watt) | 125 | 90.5 28% | 76.4 39% | 90.2 28% | 78.2 37% | 76.9 38% | 114 9% | 96.9 22% | 76.5 39% |
| Cyberpunk 2077 ultra * (Watt) | 116.2 | 83.4 28% | 125.4 -8% | 123.5 -6% | 157.7 -36% | 218 -88% | |||
| Cyberpunk 2077 ultra external monitor * (Watt) | 107.2 | 79.3 26% | 120.3 -12% | 117.7 -10% | 156.6 -46% | 196.8 -84% | |||
| Last max * (Watt) | 143.7 | 145.2 -1% | 138.1 4% | 142 1% | 167.5 -17% | 212.6 -48% | 250 -74% | 173.8 -21% | 138.5 4% |
| Witcher 3 ultra * (Watt) | 109 | 159.6 | 126.4 |
* ... kleinere Werte sind besser
Energieaufnahme Cyberpunk / Stresstest
Energieaufnahme mit externem Monitor
Akkulaufzeit
Die Akkulaufzeit wurde im Vergleich zum M3-Max-Vorgänger verbessert, die M4-Pro-Variante erreicht aber noch bessere Laufzeiten. Die direkte Windows-Konkurrenz hat gegen Laufzeiten von 18 Stunden in WLAN-Test sowie knapp 22 Stunden im Videotest (jeweils bei 150 cd/m²) keine Chance, lediglich das Dell XPS 16 9640 sowie das Asus ProArt P16 können im Videotest gut mithalten.
Im WLAN-Test bei voller SDR-Helligkeit liegt die Laufzeit noch bei 6:45 Stunden, was angesichts des hellen Panels eine ordentliche Leistung ist. Unter voller Last hingegen zahlt man den Preis, dass die Leistung nicht gedrosselt wird. Im schlimmsten Fall ist nach 65 Minuten Schluss, wobei der Energiesparmodus nach 56 Minuten erreicht wird.
| Apple MacBook Pro 16 M4 Max M4 Max (16 cores), M4 Max 40-Core GPU, 99.6 Wh | Apple MacBook Pro 16 2023 M3 Max Apple M3 Max 16-Core, M3 Max 40-Core GPU, 99.6 Wh | Apple MacBook Pro 16 2024 M4 Pro M4 Pro (14 cores), M4 Pro 20-Core GPU, 99.6 Wh | HP ZBook Studio 16 G11 Ultra 9 185H, RTX 3000 Ada Generation Laptop, 86 Wh | Lenovo ThinkPad P1 Gen 7 21KV001SGE Ultra 7 155H, GeForce RTX 4060 Laptop GPU, 90 Wh | Asus ProArt P16 H7606WI Ryzen AI 9 HX 370, GeForce RTX 4070 Laptop GPU, 90 Wh | Schenker XMG Pro 16 Studio (Mid 24) i9-14900HX, GeForce RTX 4070 Laptop GPU, 73 Wh | Lenovo Yoga Pro 9 16IMH9 Ultra 9 185H, GeForce RTX 4070 Laptop GPU, 84 Wh | Dell XPS 16 9640 Ultra 7 155H, GeForce RTX 4070 Laptop GPU, 99.5 Wh | Durchschnitt der Klasse Multimedia | |
|---|---|---|---|---|---|---|---|---|---|---|
| Akkulaufzeit | -1% | 11% | -73% | 14% | 5% | -69% | -30% | -10% | -4% | |
| H.264 (h) | 21.8 | 20.4 -6% | 24.6 13% | 21 -4% | 11.5 -47% | 16.5 -24% | 15.8 ? -28% | |||
| WLAN (h) | 18 | 16.7 -7% | 19.6 9% | 4.8 -73% | 9.9 -45% | 8.3 -54% | 5.6 -69% | 8.8 -51% | 10.5 -42% | 11.4 ? -37% |
| Last (h) | 1.1 | 1.2 9% | 1.9 73% | 1.9 73% | 1.2 9% | 1.5 36% | 1.688 ? 53% |
Notebookcheck Gesamtbewertung
Der neue Apple M4 Max überzeugt mit deutlich mehr Leistung und vor allem der Prozessor gehört in vielen Bereichen zu den schnellsten Modellen auf dem Markt. Im Single-Core-Bereich gibt es aktuell keine schnelleren CPUs, doch auch im Multi-Core-Bereich muss man schon den Core i9-14900HX oder aber Desktop-CPUs nehmen, um mehr Leistung zu bekommen. Allerdings steigt mit der Leistung auch die Leistungsaufnahme, und vor allem bei kombinierter Belastung kann die Kühlung des MacBook Pro 16 das Potenzial des neuen M4 Max nicht ausnutzen. Dennoch ist das MacBook Pro 16 auch mit dem M4 Max eines der besten Multimedia-Notebooks auf dem Markt.
Apple MacBook Pro 16 M4 Max
- 08.12.2024 v8
Andreas Osthoff
Transparenz
Die Auswahl der zu testenden Geräte erfolgt innerhalb der Redaktion. Das vorliegende Testmuster wurde dem Autor vom Hersteller oder einem Shop zu Testzwecken leihweise zur Verfügung gestellt. Eine Einflussnahme des Leihstellers auf den Testbericht gab es nicht, der Hersteller erhielt keine Version des Reviews vor der Veröffentlichung. Es bestand keine Verpflichtung zur Publikation. Als eigenständiges, unabhängiges Unternehmen unterliegt Notebookcheck keiner Diktion von Herstellern, Shops und Verlagen.
So testet Notebookcheck
Pro Jahr werden von Notebookcheck hunderte Laptops und Smartphones unabhängig in von uns standardisierten technischen Verfahren getestet, um eine Vergleichbarkeit aller Testergebnisse zu gewährleisten. Seit rund 20 Jahren entwickeln wir diese Testmethoden kontinuierlich weiter und setzen damit Branchenstandards. In unseren Testlaboren kommt ausschließlich hochwertiges Messequipment in die Hände erfahrener Techniker und Redakteure. Die Tests unterliegen einer mehrstufigen Kontrolle. Unsere komplexe Gesamtbewertung basiert auf hunderten fundierten Messergebnissen und Benchmarks, womit Ihnen Objektivität garantiert ist. Weitere Informationen zu unseren Testmethoden gibt es hier.





 Total Sustainability Score:

