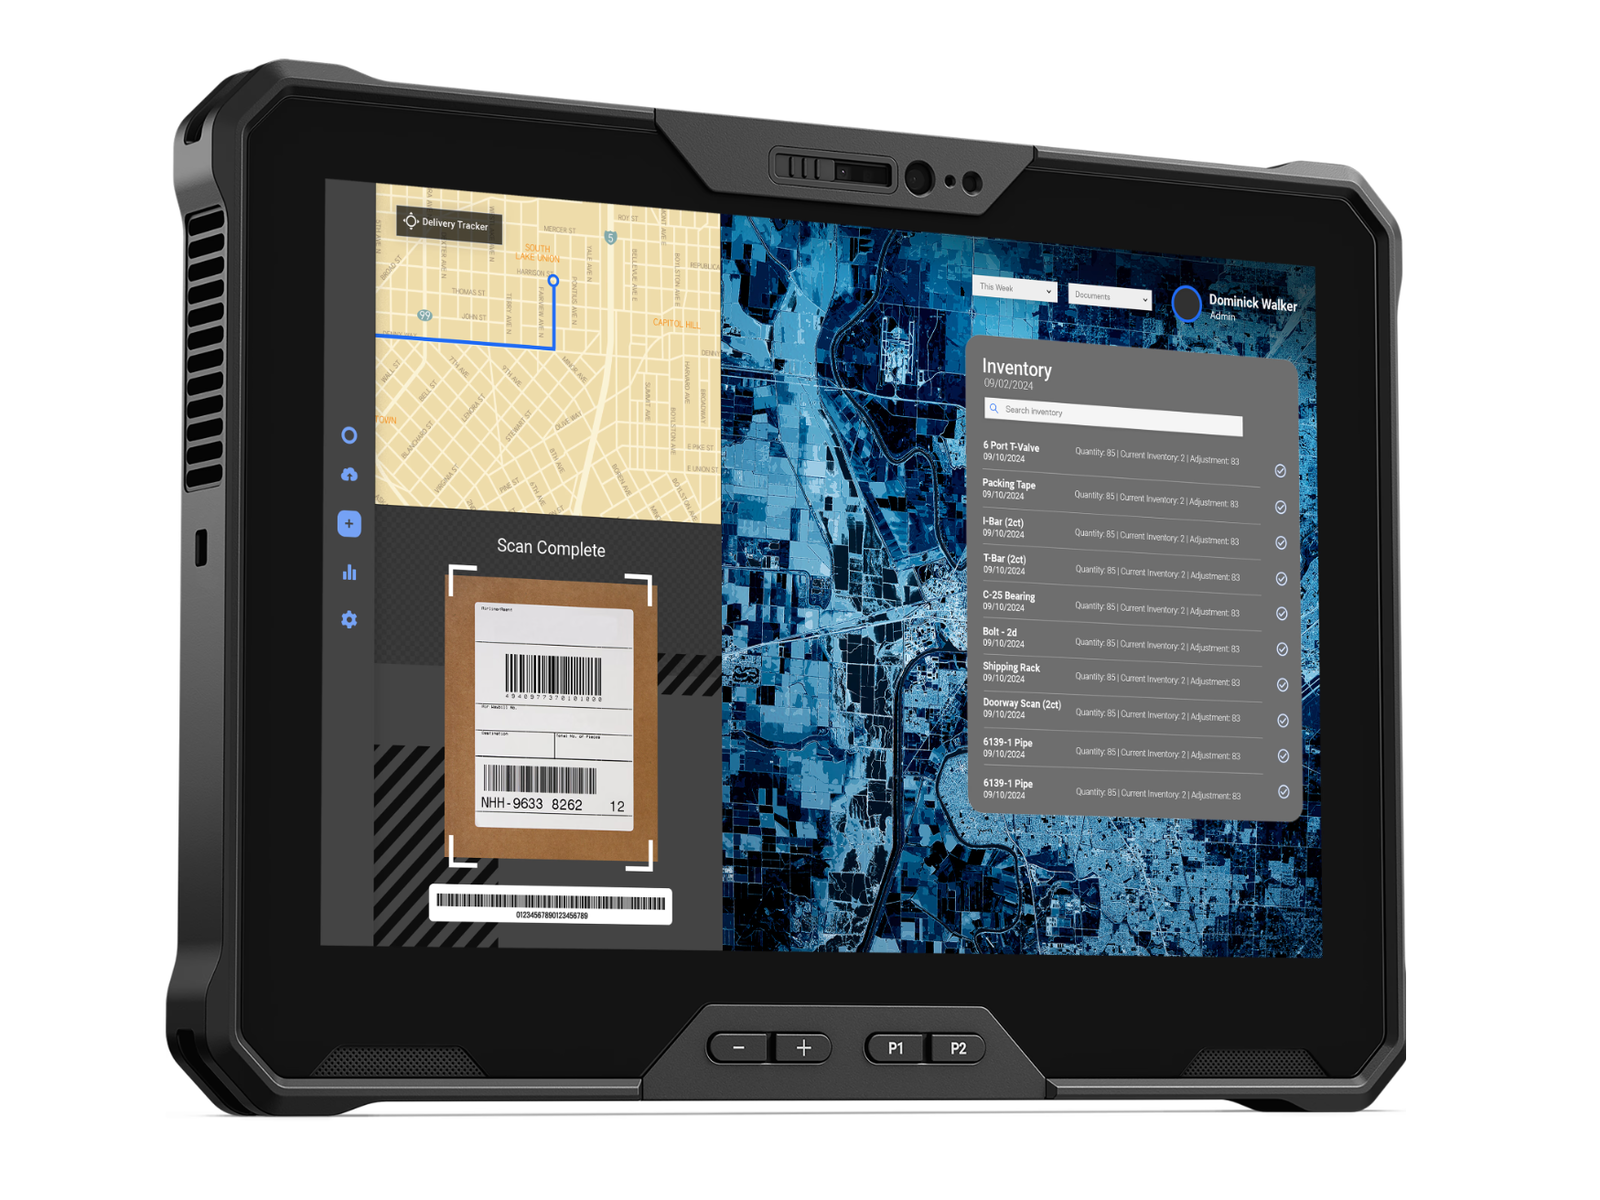
Dell Latitude 7030 Rugged Extreme im Test: Robustes Tablet mit vollen sRGB-Farben

Das Latitude 7030 Rugged Extreme ist das erste 10-Zoll-Tablet in Dells Rugged-Extreme-Serie und erweitert das bestehende Portfolio, das bereits die 12-Zoll Latitude 72xx und die 13-Zoll Latitude 73xx Rugged Extreme Modelle umfasst. Mit seiner kompakteren Größe ist es ideal für Nutzer, die auf noch mehr Mobilität angewiesen sind.
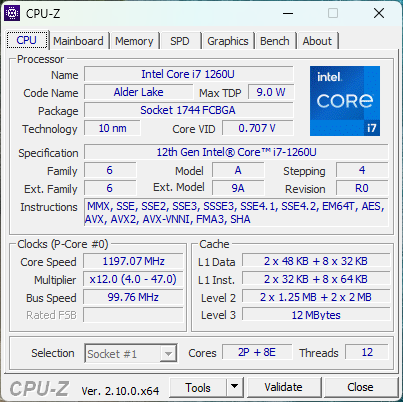
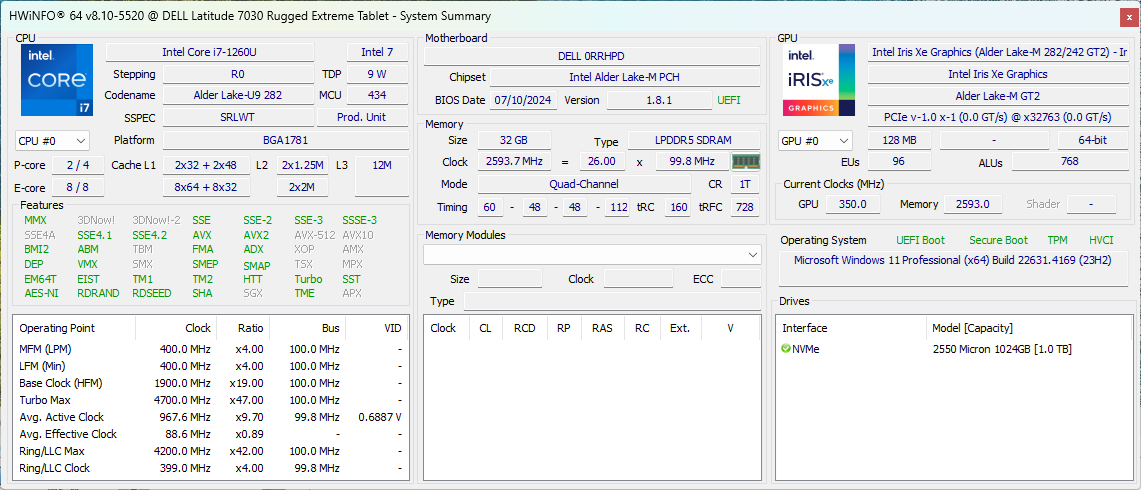
Unser Testgerät gehört zur High-End-Kategorie und verfügt über eine vPro Core i7-1260U-CPU sowie 32 GB LPDDR5-RAM, was es für etwas mehr als 2.800 Euro zu einer leistungsstarken Option macht. Günstigere Varianten beginnen mit einem Core i3-1210U und weniger Speicher und RAM, jedoch teilen alle Konfigurationen denselben 1200p IPS-Touchscreen.
Vergleichbare robuste Alternativen sind Modelle wie das Durabook R8 oder das Acer Enduro Urban, die sich ebenfalls in anspruchsvollen Umgebungen bewährt haben.
Weitere Dell Bewertungen:
Mögliche Konkurrenten im Vergleich
Bew. | Version | Datum | Modell | Gewicht | Dicke | Größe | Auflösung | Preis ab |
|---|---|---|---|---|---|---|---|---|
| 82.3 % | v8 | 09 / 2024 | Dell Latitude 7030 Rugged Extreme i7-1260U, Iris Xe G7 96EUs | 1.1 kg | 25.4 mm | 10.00" | 1920x1200 | |
| 83.3 % | v8 | 09 / 2024 | Dell Latitude 7350 Detachable Ultra 7 164U, Graphics 4-Core iGPU (Arrow Lake) | 865 g | 8.9 mm | 13.00" | 2880x1920 | |
| 83.9 % v7 (old) | v7 (old) | 04 / 2023 | Dell Latitude 7230 Rugged Extreme i5-1240U, Iris Xe G7 80EUs | 1.6 kg | 23.9 mm | 12.00" | 1920x1200 | |
| 79.6 % v7 (old) | v7 (old) | Durabook R8 Tablet i5-1230U, Iris Xe G7 80EUs | 856 g | 20.6 mm | 8.00" | 1280x800 | ||
| 82.4 % v7 (old) | v7 (old) | 12 / 2021 | Acer Enduro Urban N3 EUN314 i7-1165G7, Iris Xe G7 96EUs | 1.8 kg | 21.95 mm | 14.00" | 1920x1080 | |
v (old) | 05 / 2022 | Dell Latitude 7330 Rugged Extreme i7-1185G7, Iris Xe G7 96EUs | 2.7 kg | 36.5 mm | 13.30" | 1920x1080 |
Hinweis: Wir haben unser Bewertungssystem kürzlich aktualisiert, wodurch die Ergebnisse der Version 8 nicht mit denen der Version 7 vergleichbar sind. Weitere Informationen dazu finden Sie hier.
Gehäuse — MIL-STD-810H zertifiziert
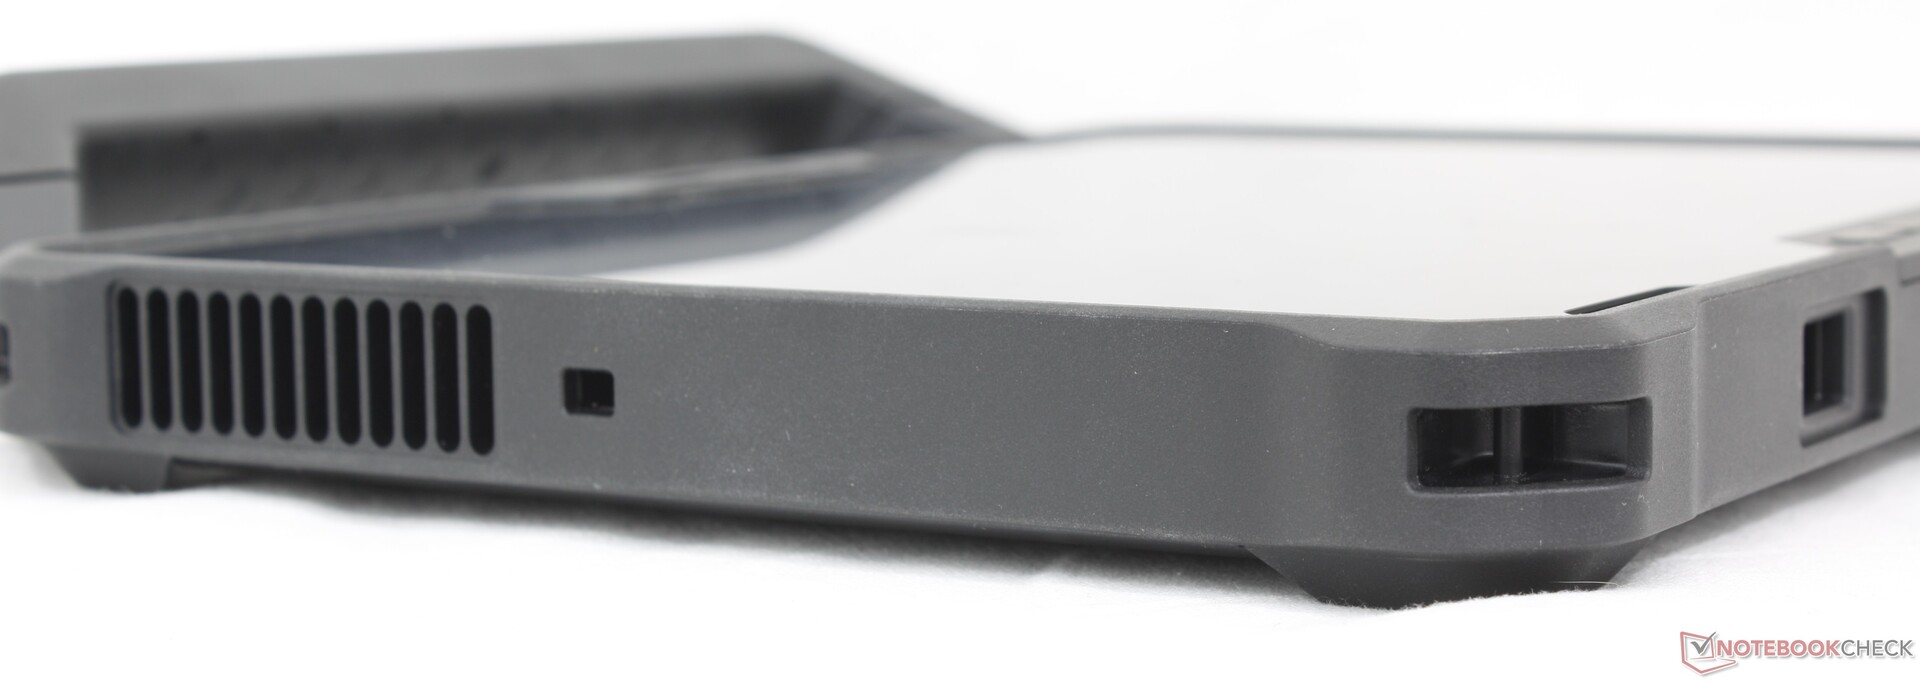
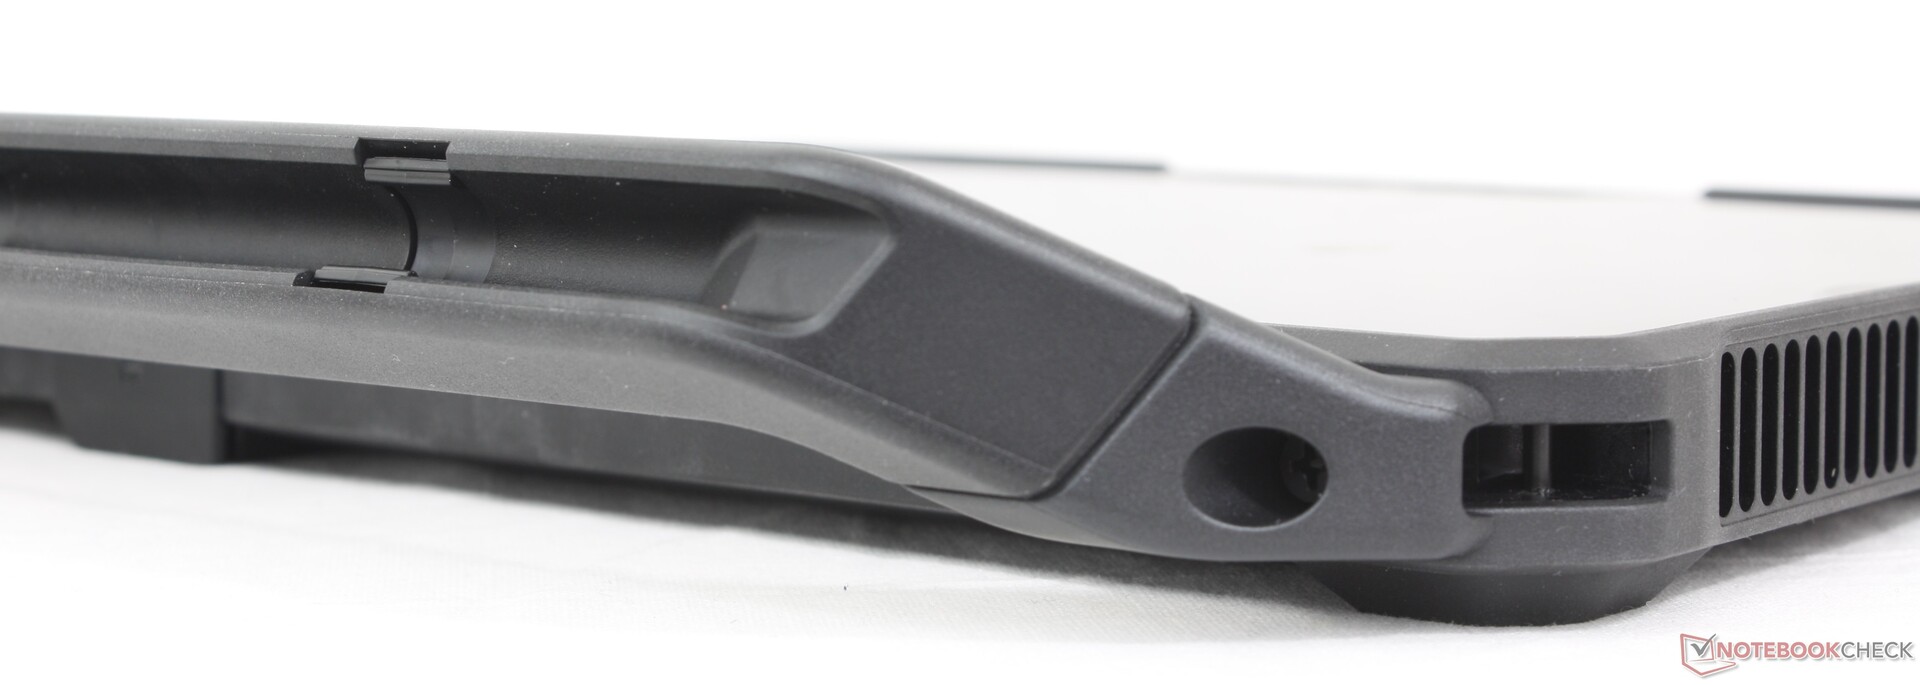
Das Gehäuse besteht aus Kunstharz und thermoplastischem Elastomer (TPE). Die Gehäusesteifigkeit ist ausgezeichnet, da es weder zu Verformungen noch zu Knarren kommt, wenn man versucht, die Oberflächen zu biegen oder Druck auszuüben. Allerdings ist das Gerät spürbar kopflastig, sobald die abnehmbare Tastatur angebracht wird. Im Laptop-Modus neigt das Gerät dazu, umzukippen, wenn die Scharniere auf 130 Grad oder mehr geöffnet werden.
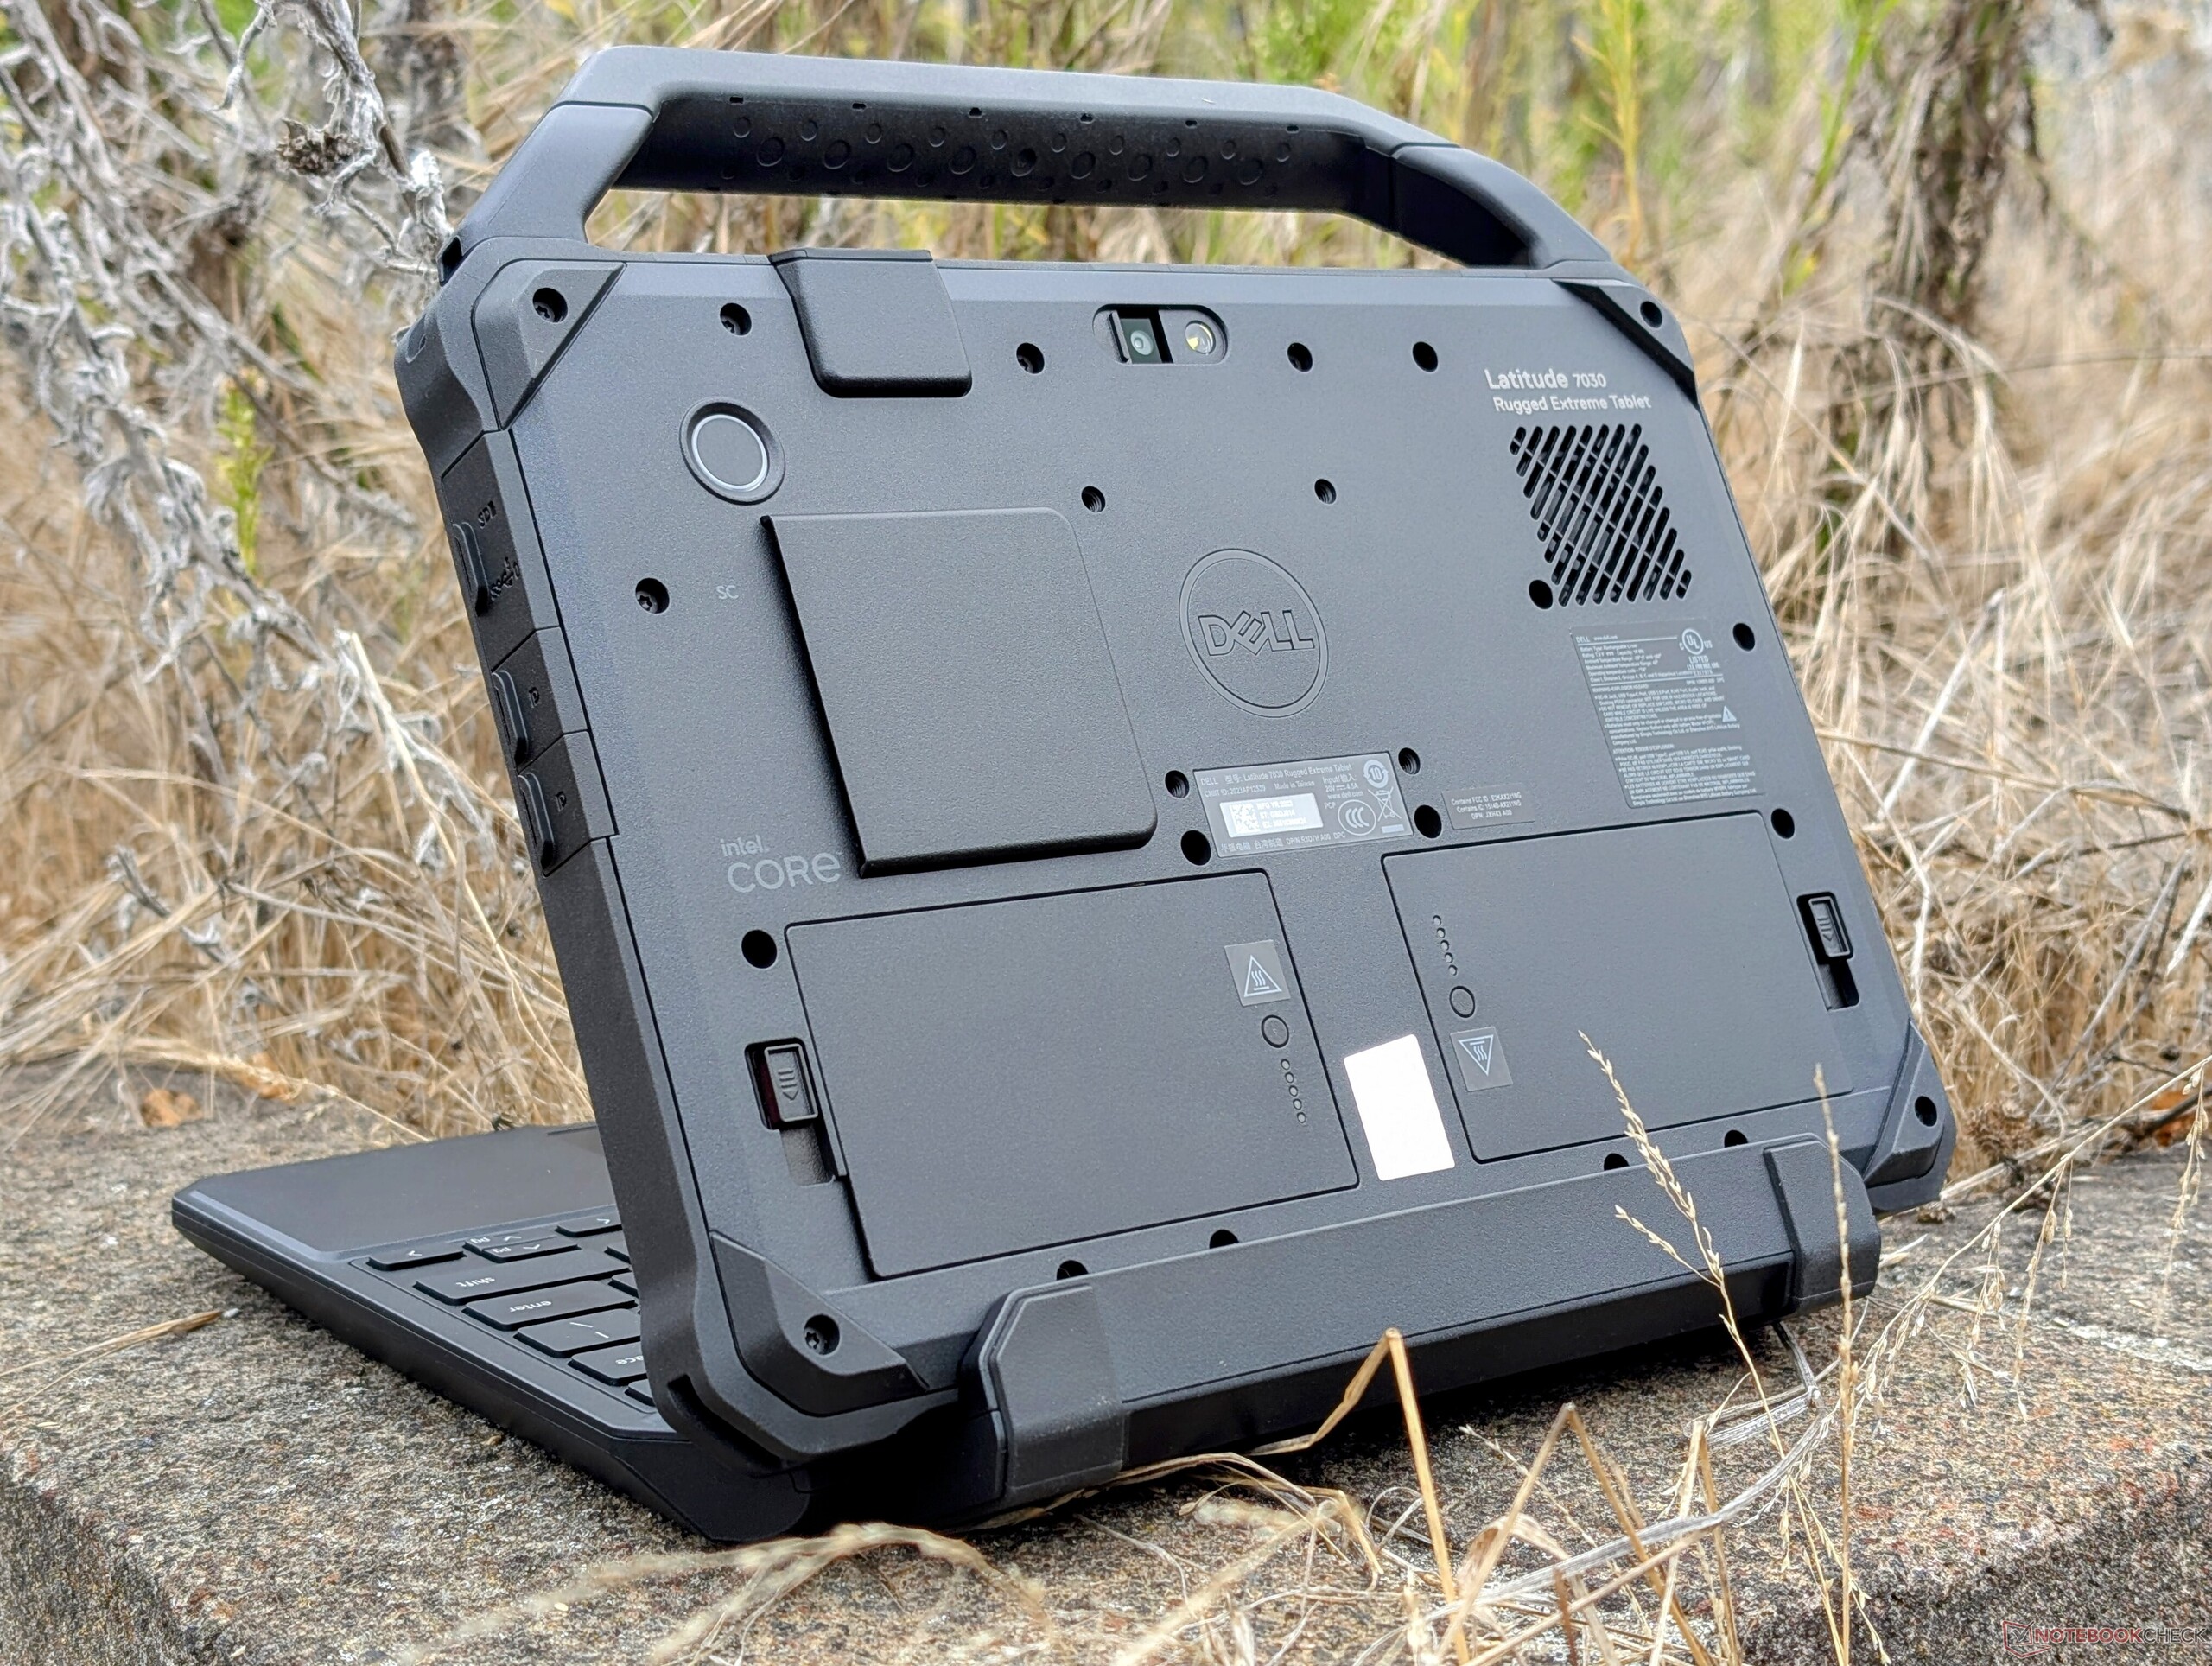
Dieses Modell ist mit einer Dicke von knapp über 25 mm relativ voluminös, sogar dicker als das größere 12-Zoll Latitude 7230 Rugged Extreme. Glücklicherweise bleibt das Gewicht mit 1,1 kg überschaubar, was das Gerät leichter als das beliebte XPS 13 macht.
Sobald jedoch die Tastatur angebracht ist, nehmen sowohl Dicke als auch Gewicht erheblich zu, wie die untenstehende Tabelle zeigt. Mit fast 2 kg Gesamtgewicht kommt das Tablet an das Gewicht einiger 16-Zoll-Gaming-Notebooks heran. Die Tastatur selbst ist durch ihre steifen Scharniere und die angewinkelte Basis zur Verbesserung der Ergonomie recht sperrig. Bedauerlich ist, dass sie keine zusätzlichen Funktionen wie weitere Anschlüsse oder Sondertasten bietet.
| Latitude 7030 Rugged Extreme | Tablet | Abnehmbare Tastatur | Tablet + abnehmbare Tastatur |
| Dicke (mm) | 25.4 | 47 (closed) | 47 (closed) |
| Gewicht (g) | 1148 | 802 | 1950 |


Ausstattung
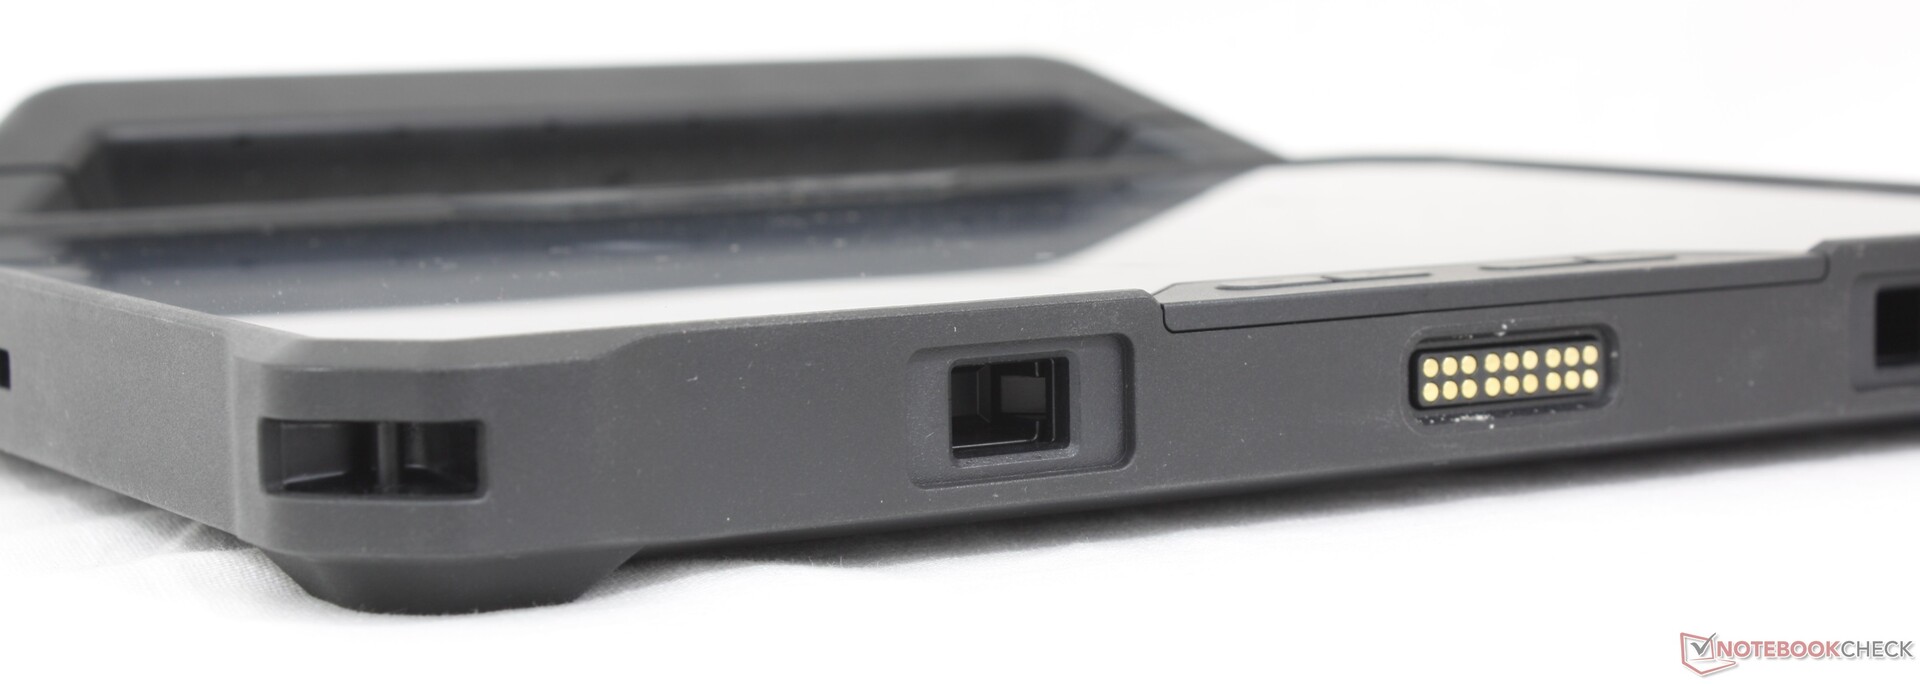
Das Aufladen des Latitude 7030 Rugged Extreme erfolgt nun über den universellen USB-C-Anschluss, anstatt über proprietäre Netzteile, wie sie bei älteren Rugged-Modellen noch verwendet wurden. Ein Beispiel hierfür ist das Durabook R8, das nach wie vor mit einem veralteten Netzladegerät ausgeliefert wird. Das Latitude-Tablet bietet zudem zwei Thunderbolt-4-Anschlüsse, die mit verschiedenem Zubehör und Docking-Stationen kompatibel sind, was die Flexibilität und Konnektivität des Geräts erheblich verbessert.
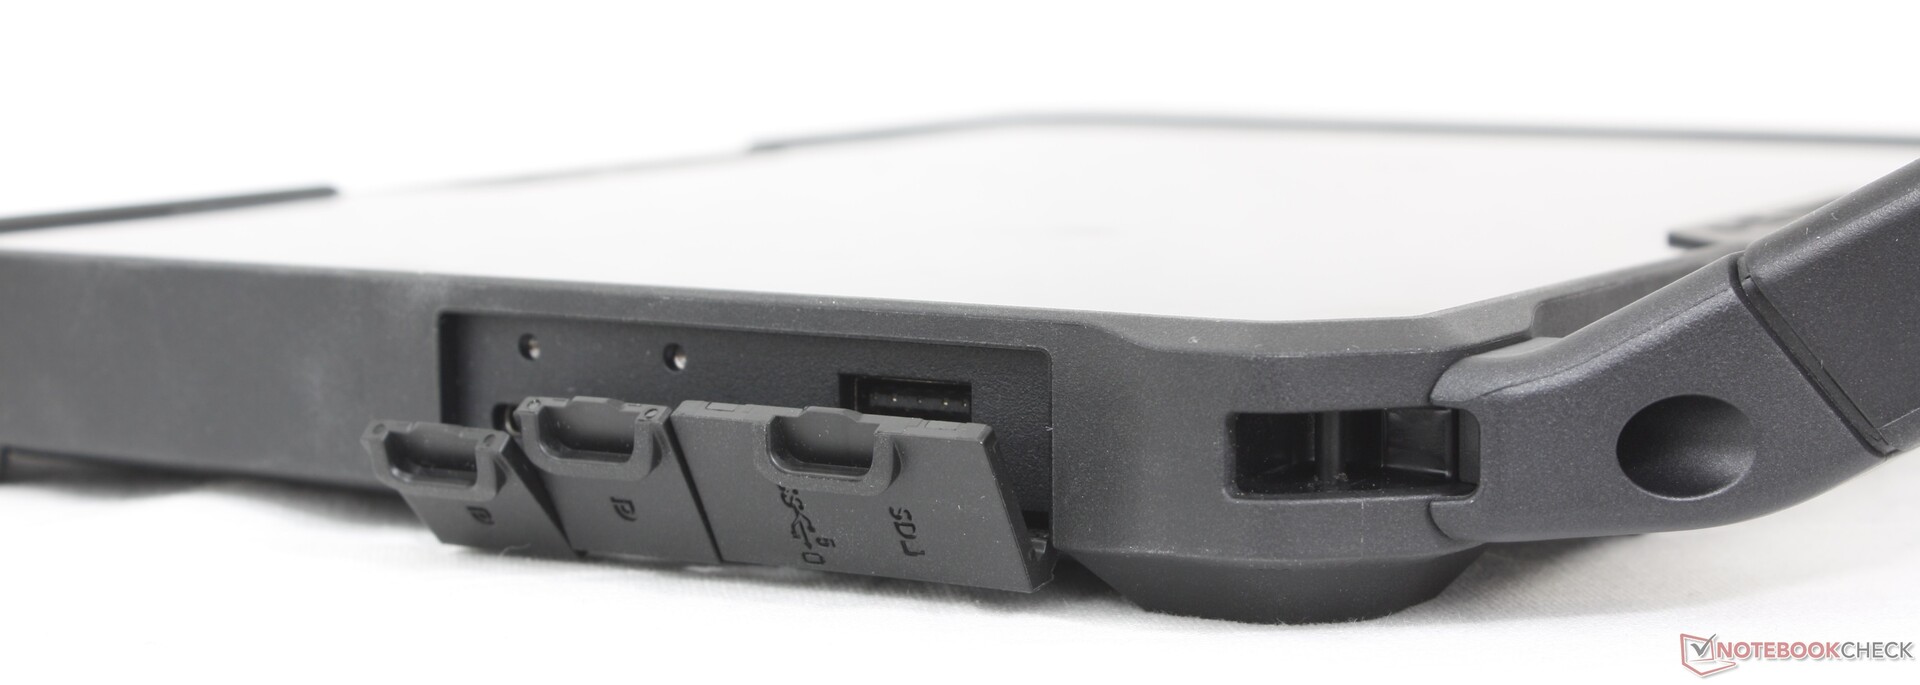
SD Card Reader
Der integrierte MicroSD-Leser des Latitude 7030 Rugged Extreme erreicht mit knapp 200 MB/s beeindruckende Geschwindigkeiten, ähnlich wie bei den Modellen Latitude 5420 Rugged oder Latitude 7424 Rugged. Allerdings fiel die Übertragung von 1 GB Bildern von unserer UHS-II-Testkarte auf den Desktop mit nur etwa 50 MB/s deutlich langsamer aus, sodass die Übertragung größerer Dateien immer noch etwas Zeit in Anspruch nehmen kann.
| SD Card Reader | |
| average JPG Copy Test (av. of 3 runs) | |
| Dell Latitude 5420 Rugged-P85G (Toshiba Exceria Pro SDXC 64 GB UHS-II) | |
| Dell Latitude 7424 Rugged Extreme (Toshiba Exceria Pro SDXC 64 GB UHS-II) | |
| Dell Latitude 7330 Rugged Extreme (AV Pro V60) | |
| Dell Latitude 7230 Rugged Extreme (AV Pro V60) | |
| Dell Latitude 7030 Rugged Extreme (AV Pro V60) | |
| Durabook R8 Tablet (AV Pro V60) | |
| Acer Enduro Urban N3 EUN314 (AV Pro V60) | |
| maximum AS SSD Seq Read Test (1GB) | |
| Dell Latitude 5420 Rugged-P85G (Toshiba Exceria Pro SDXC 64 GB UHS-II) | |
| Dell Latitude 7424 Rugged Extreme (Toshiba Exceria Pro SDXC 64 GB UHS-II) | |
| Dell Latitude 7030 Rugged Extreme (AV Pro V60) | |
| Dell Latitude 7330 Rugged Extreme (AV Pro V60) | |
| Dell Latitude 7230 Rugged Extreme (AV Pro V60) | |
| Durabook R8 Tablet (AV Pro V60) | |
| Acer Enduro Urban N3 EUN314 (AV Pro V60) | |
Kommunikation
Ein Intel AX211 sorgt standardmäßig für Bluetooth 5.2 und Wi-Fi 6E-Konnektivität. Optional ist ein Qualcomm-Modul für 4G/5G und GPS-Unterstützung verfügbar.
| Networking | |
| iperf3 transmit AX12 | |
| Acer Enduro Urban N3 EUN314 | |
| Dell Latitude 7330 Rugged Extreme | |
| iperf3 receive AX12 | |
| Acer Enduro Urban N3 EUN314 | |
| Dell Latitude 7330 Rugged Extreme | |
| iperf3 transmit AXE11000 | |
| Durabook R8 Tablet | |
| Dell Latitude 7230 Rugged Extreme | |
| Dell Latitude 7030 Rugged Extreme | |
| Dell Latitude 7350 Detachable | |
| iperf3 receive AXE11000 | |
| Durabook R8 Tablet | |
| Dell Latitude 7230 Rugged Extreme | |
| Dell Latitude 7030 Rugged Extreme | |
| Dell Latitude 7350 Detachable | |
| iperf3 transmit AXE11000 6GHz | |
| Dell Latitude 7030 Rugged Extreme | |
| Dell Latitude 7350 Detachable | |
| Dell Latitude 7230 Rugged Extreme | |
| Durabook R8 Tablet | |
| iperf3 receive AXE11000 6GHz | |
| Dell Latitude 7030 Rugged Extreme | |
| Dell Latitude 7350 Detachable | |
| Durabook R8 Tablet | |
| Dell Latitude 7230 Rugged Extreme | |
Webcam
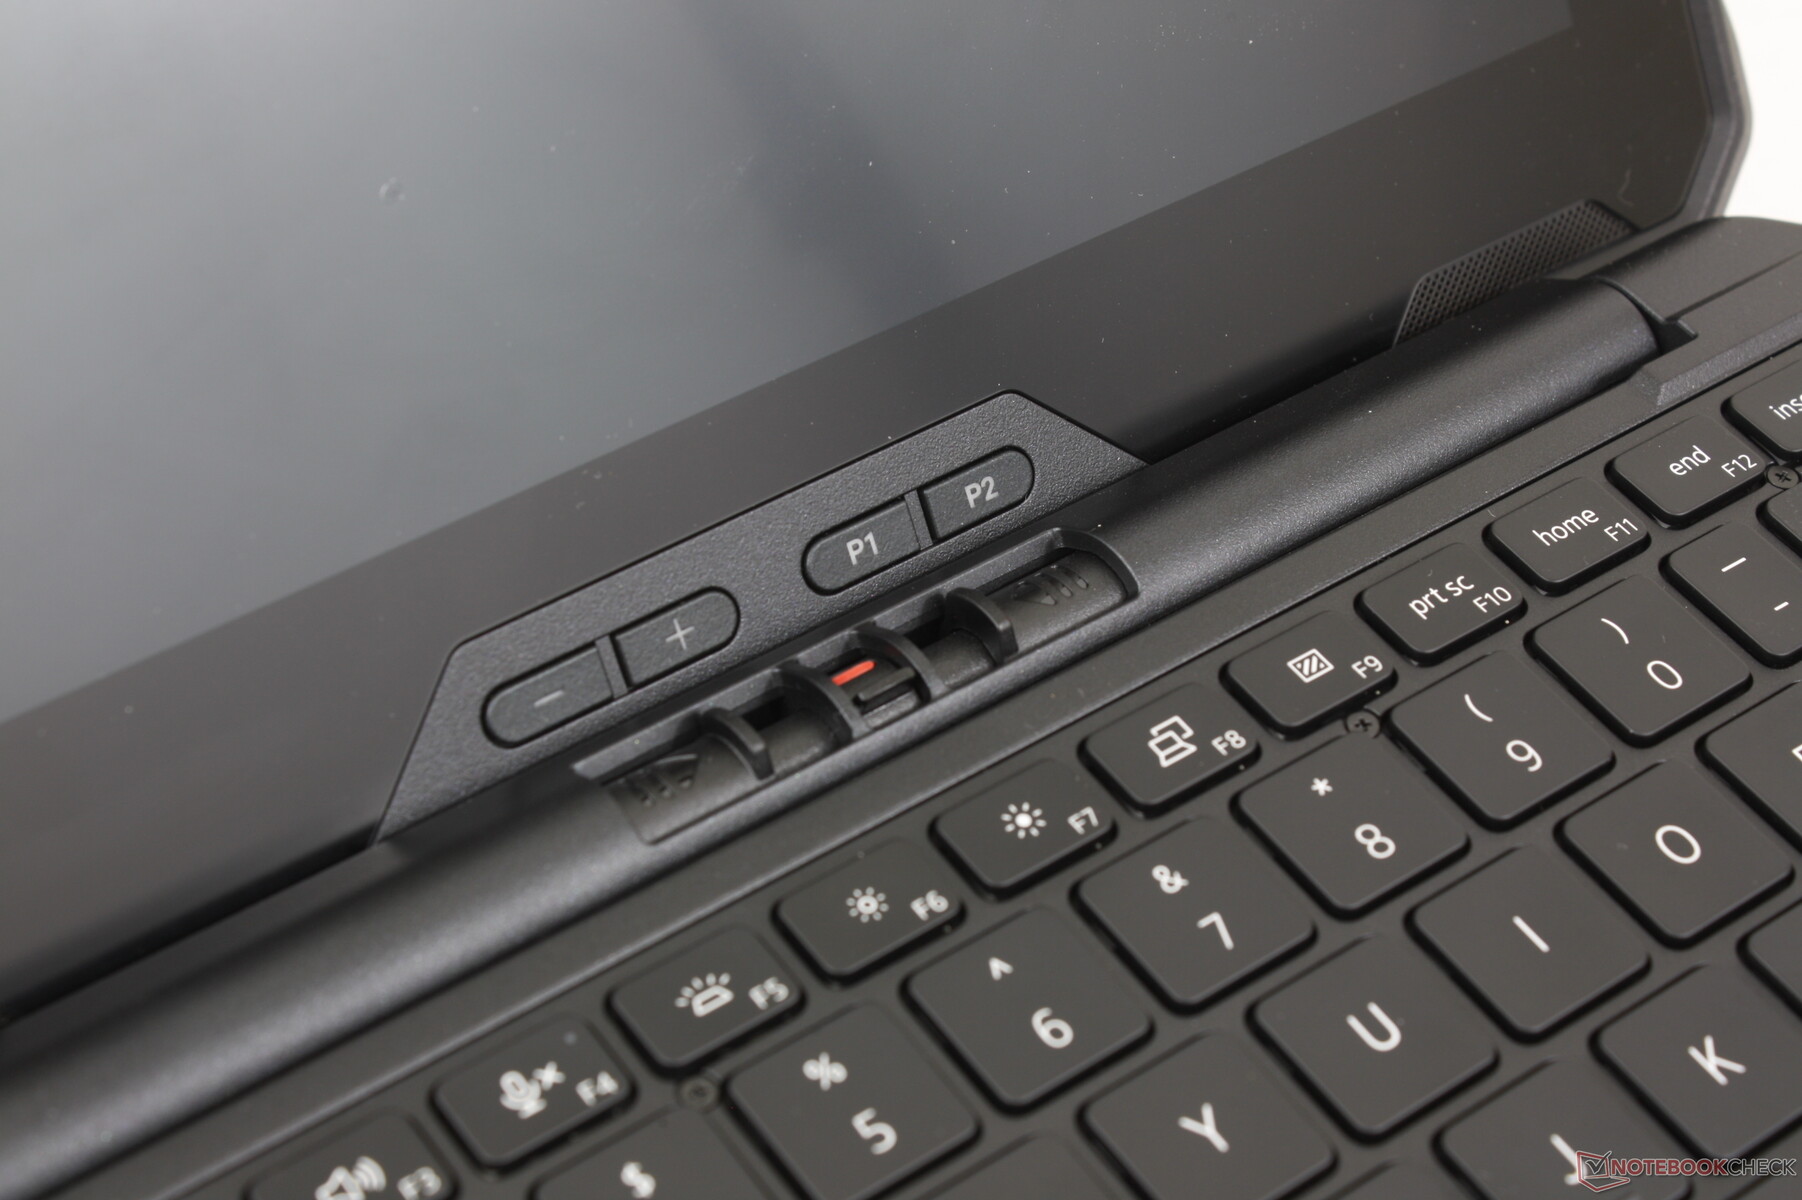
Die Nutzer können das Gerät entweder ohne Kameras oder mit zwei Kameras (5 MP auf der Vorderseite und 11 MP auf der Rückseite) konfigurieren. Bei der Version mit Kameras verfügen beide über physische Schieberegler zum Schutz der Privatsphäre, während die Vorderseite einen IR-Sensor für die Windows Hello-Unterstützung enthält. Interessanterweise können Nutzer über die Windows-Kamera-App nur bis zu 10 MP auswählen, anstatt die vollen 11 MP nutzen zu können. Im Vergleich dazu sind die Kameras des Durabook R8 unschärfer.
Die Bildqualität ist für ein Windows-Gerät scharf, jedoch hätten die Farben und die Helligkeit etwas lebendiger sein können.


Wartung
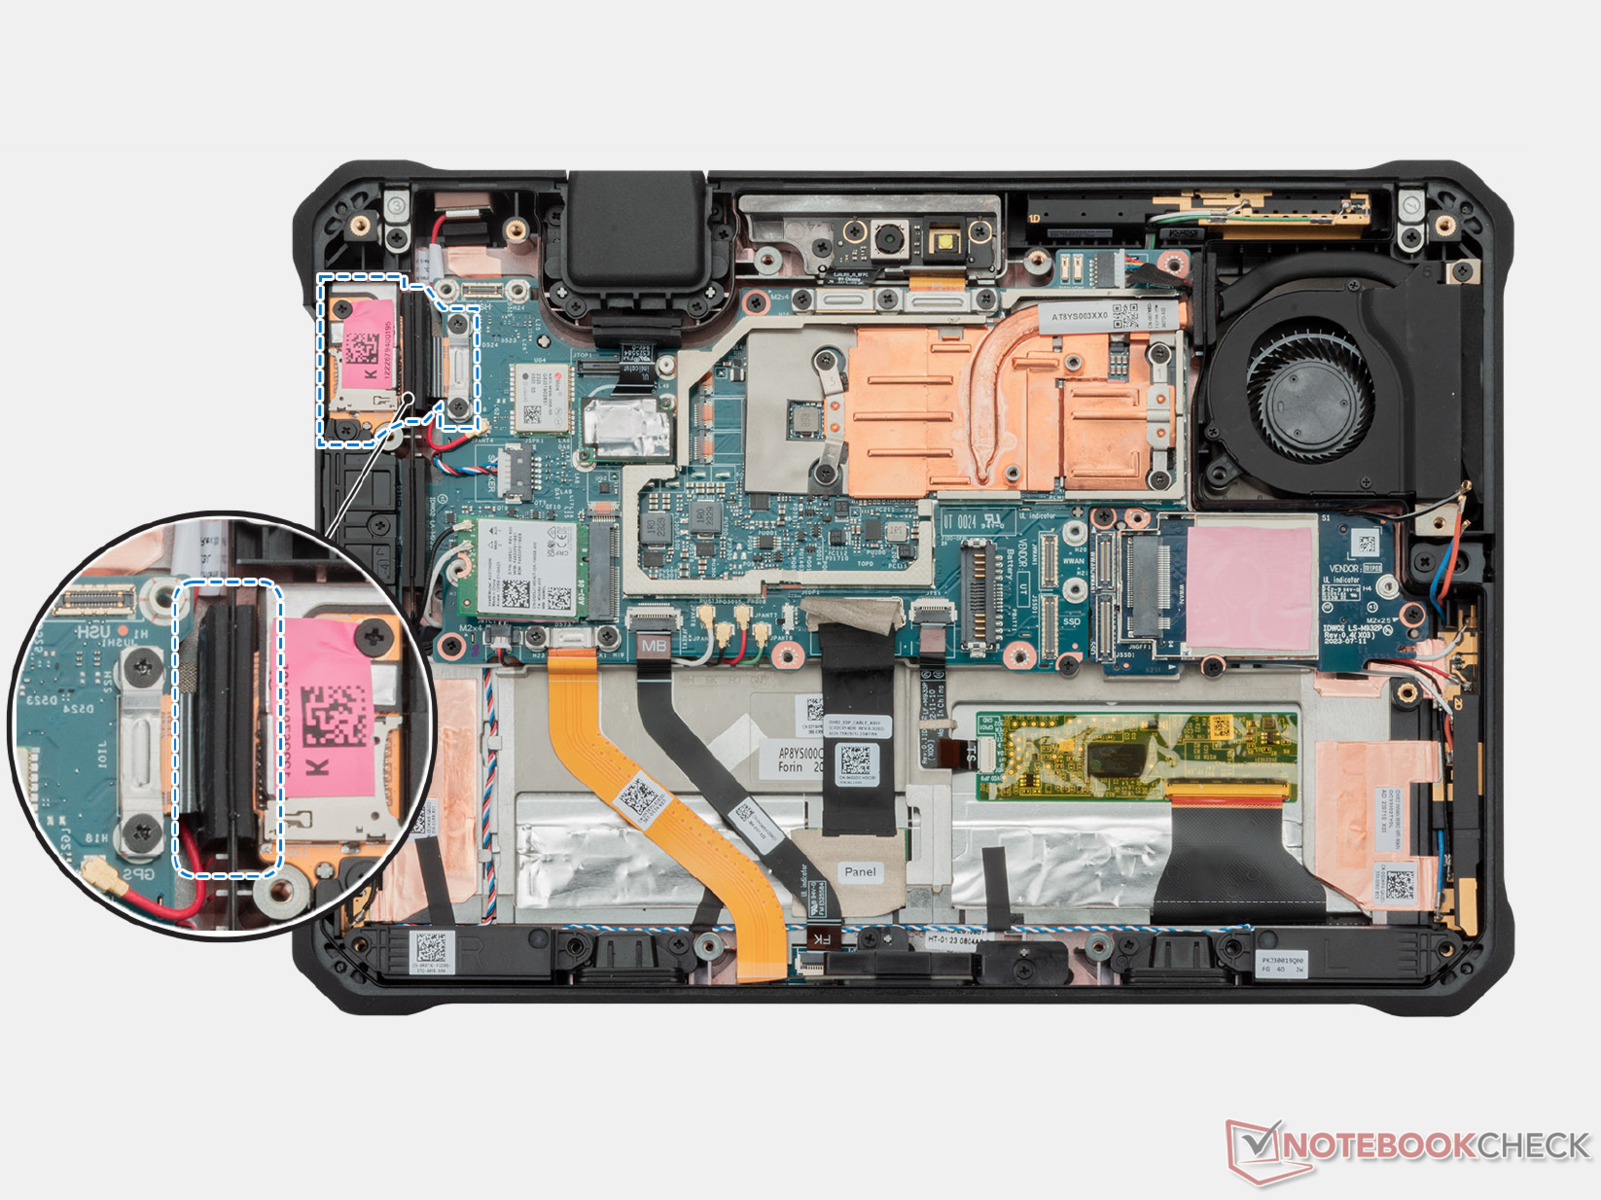
Die Rückseite ist mit 19 Torx-Schrauben befestigt. Beim Entfernen sollte darauf geachtet werden, dass das Flachbandkabel, das die abnehmbare Platte mit der Hauptplatine verbindet, nicht herausgerissen wird.
Im Innenbereich hat der Benutzer Zugriff auf das herausnehmbare M.2-WLAN-Modul, den M.2-WAN-Slot und den M.2-2230-SSD-Slot. Der interne Akku ist ebenfalls vorhanden, sofern das Gerät mit einem solchen konfiguriert ist.
Nachhaltigkeit
Das USB-C-Netzteil besteht zu 50 Prozent aus recyceltem Kunststoff, während die Verpackung aus Pappe, Plastikfolie und LDPE gefertigt ist. Das Tablet selbst ist EPEAT-Gold-zertifiziert, aber Dell betont, dass bei der Herstellung keine recycelten Materialien verwendet wurden.
Ersatzteile sind direkt bei Dell erhältlich, ebenso wie das offizielle Service-Handbuch.
Zubehör und Garantie
Dell bietet eine breite Palette an optionalem Zubehör an, darunter eine abnehmbare Tastatur, eine Handschlaufe, sowohl einen aktiven als auch einen passiven Stift, ein mobiles Ladegerät, einen mobilen Ständer und vieles mehr.
Die Garantie erstreckt sich in Deutschland über 36 Monate.
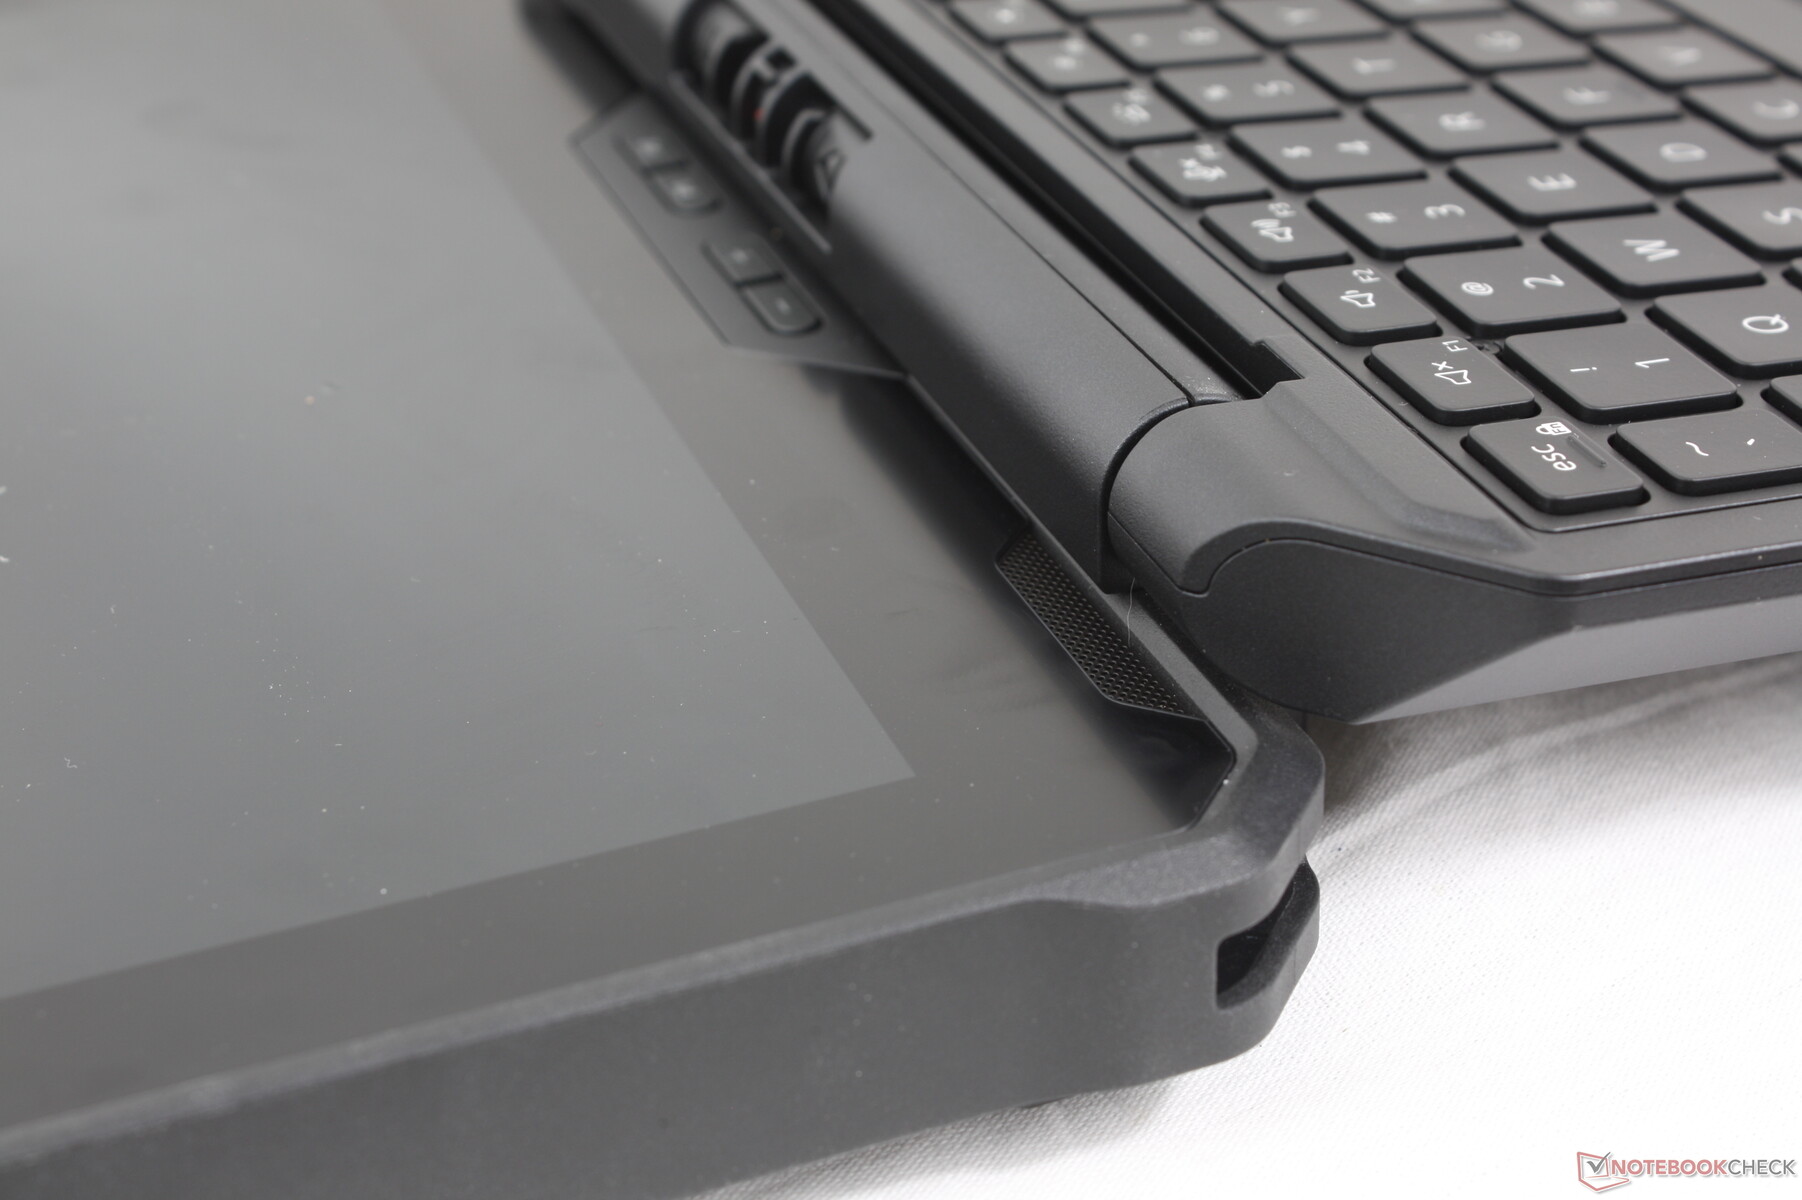
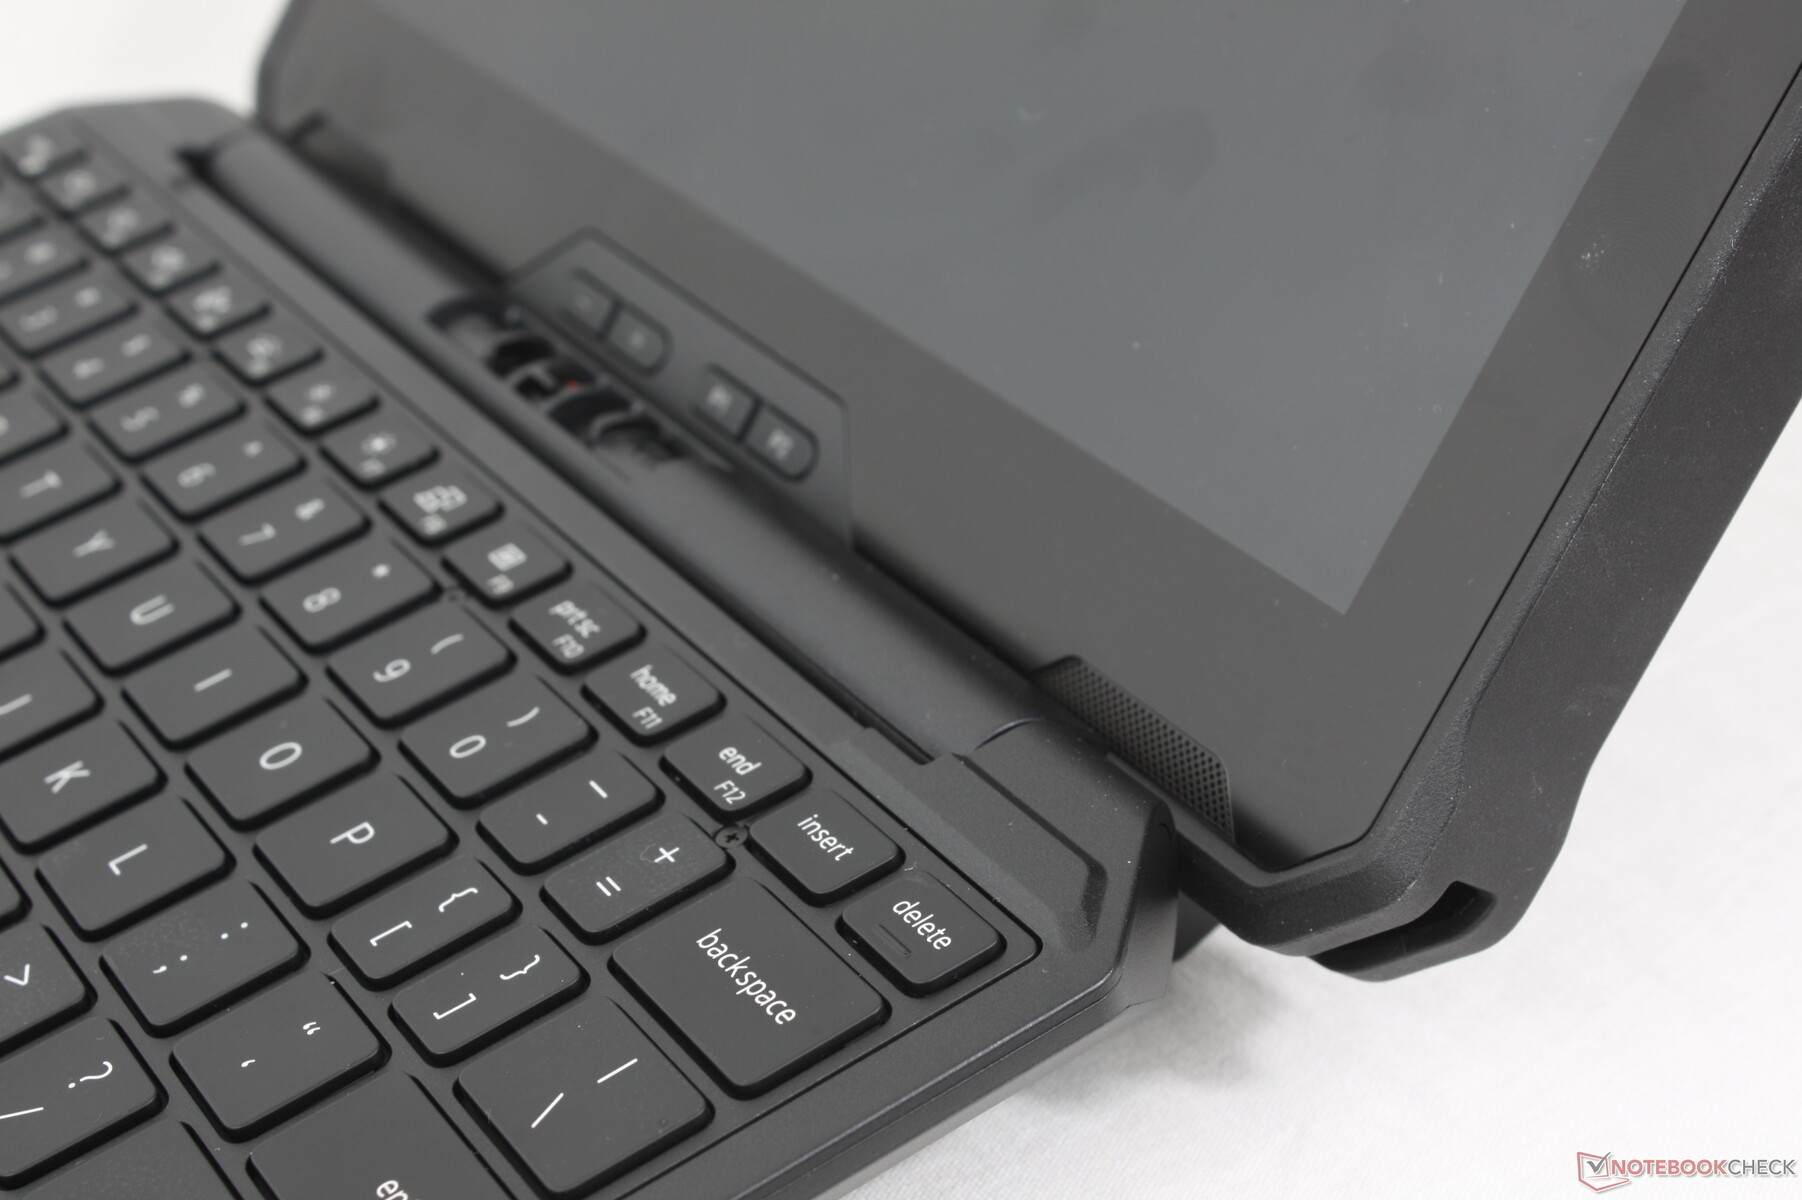
Eingabegeräten
Tastatur
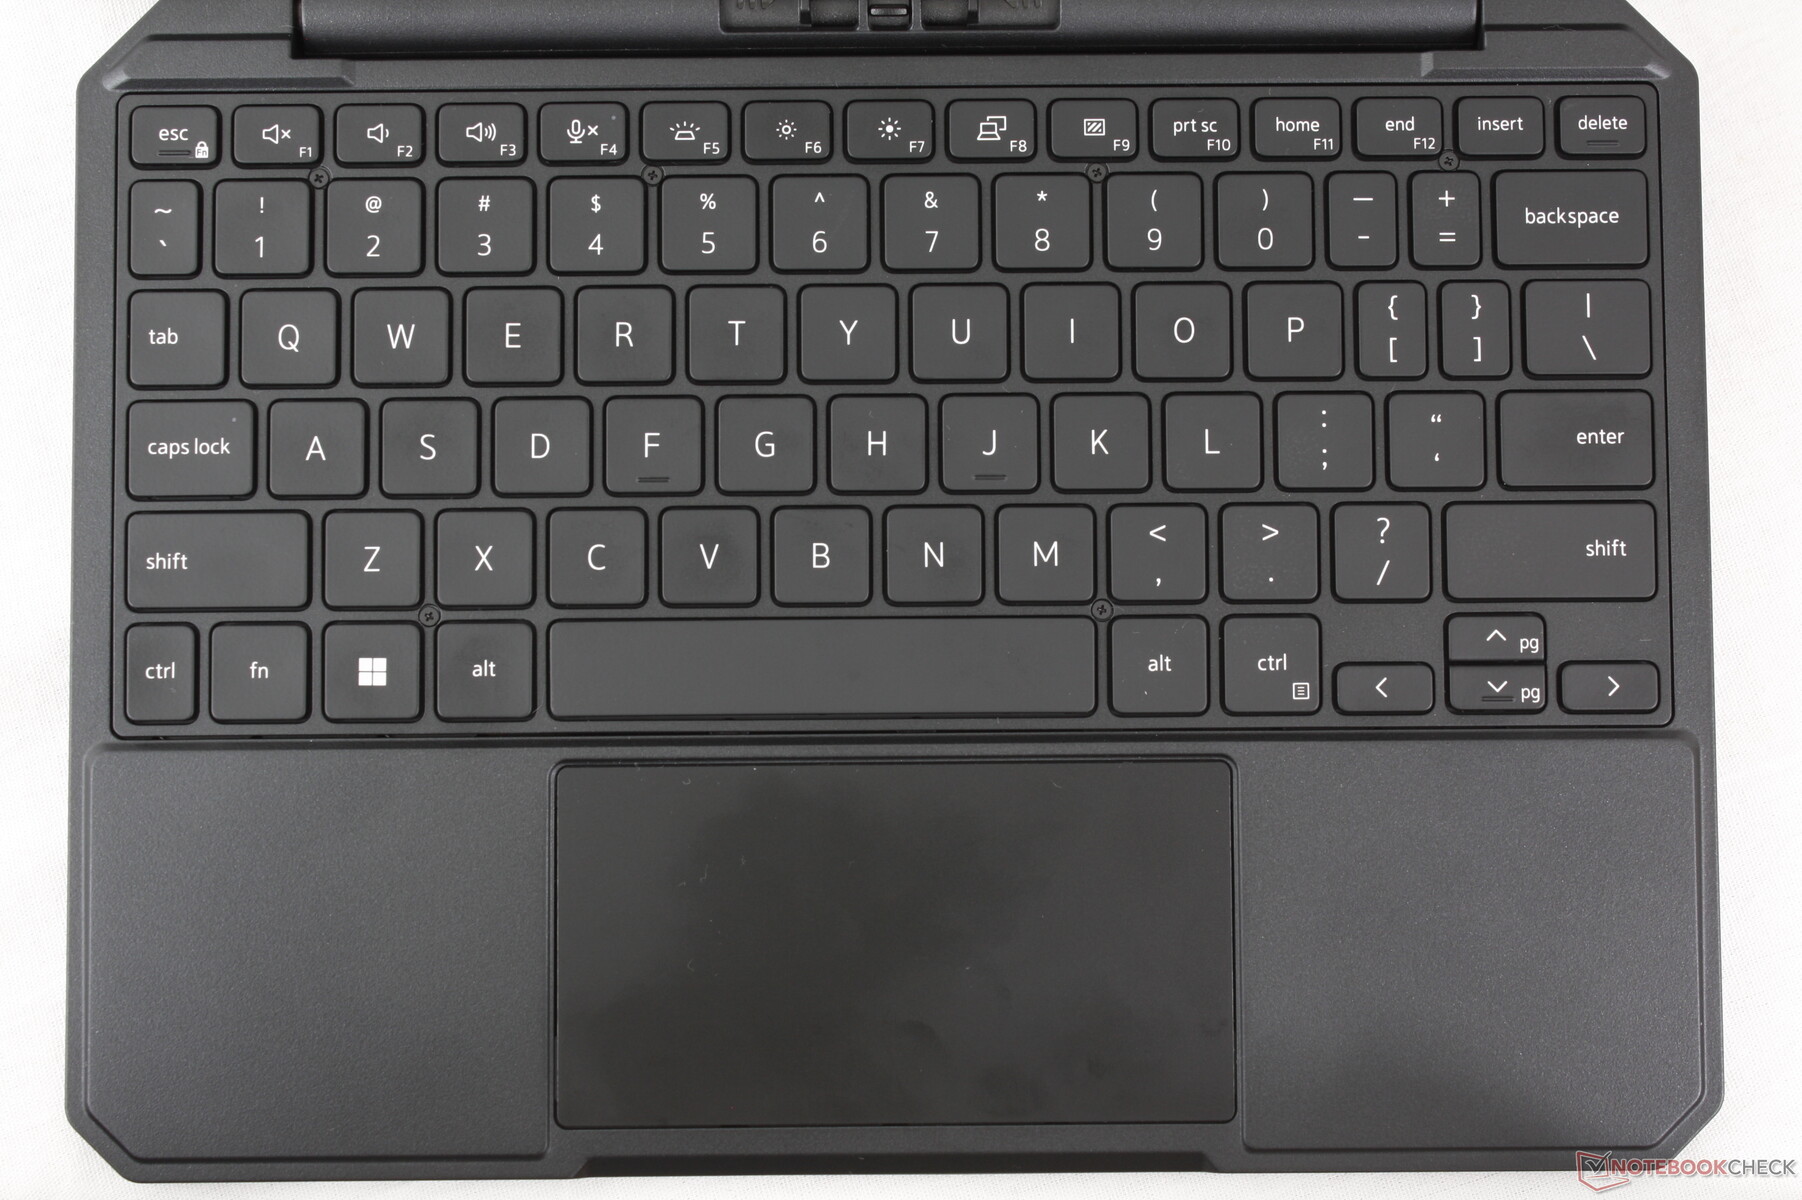
Das Tastenfeedback ist überraschend fest und gleichmäßig, während die meisten anderen abnehmbaren Tastaturen eher schwammig und leicht wirken. Dies dürfte auf die dicke Basis unserer abnehmbaren Dell-Tastatur zurückzuführen sein, während Alternativen wie das Surface Pro im Vergleich deutlich dünner sind. Das Tippen auf dem Dell fühlt sich daher mehr wie das Tippen auf einem herkömmlichen Clamshell-Laptop an, auch wenn es aufgrund des kleineren Formfaktors etwas beengter ist.
Das Klappern ist aufgrund des festeren Feedbacks relativ deutlich und laut.
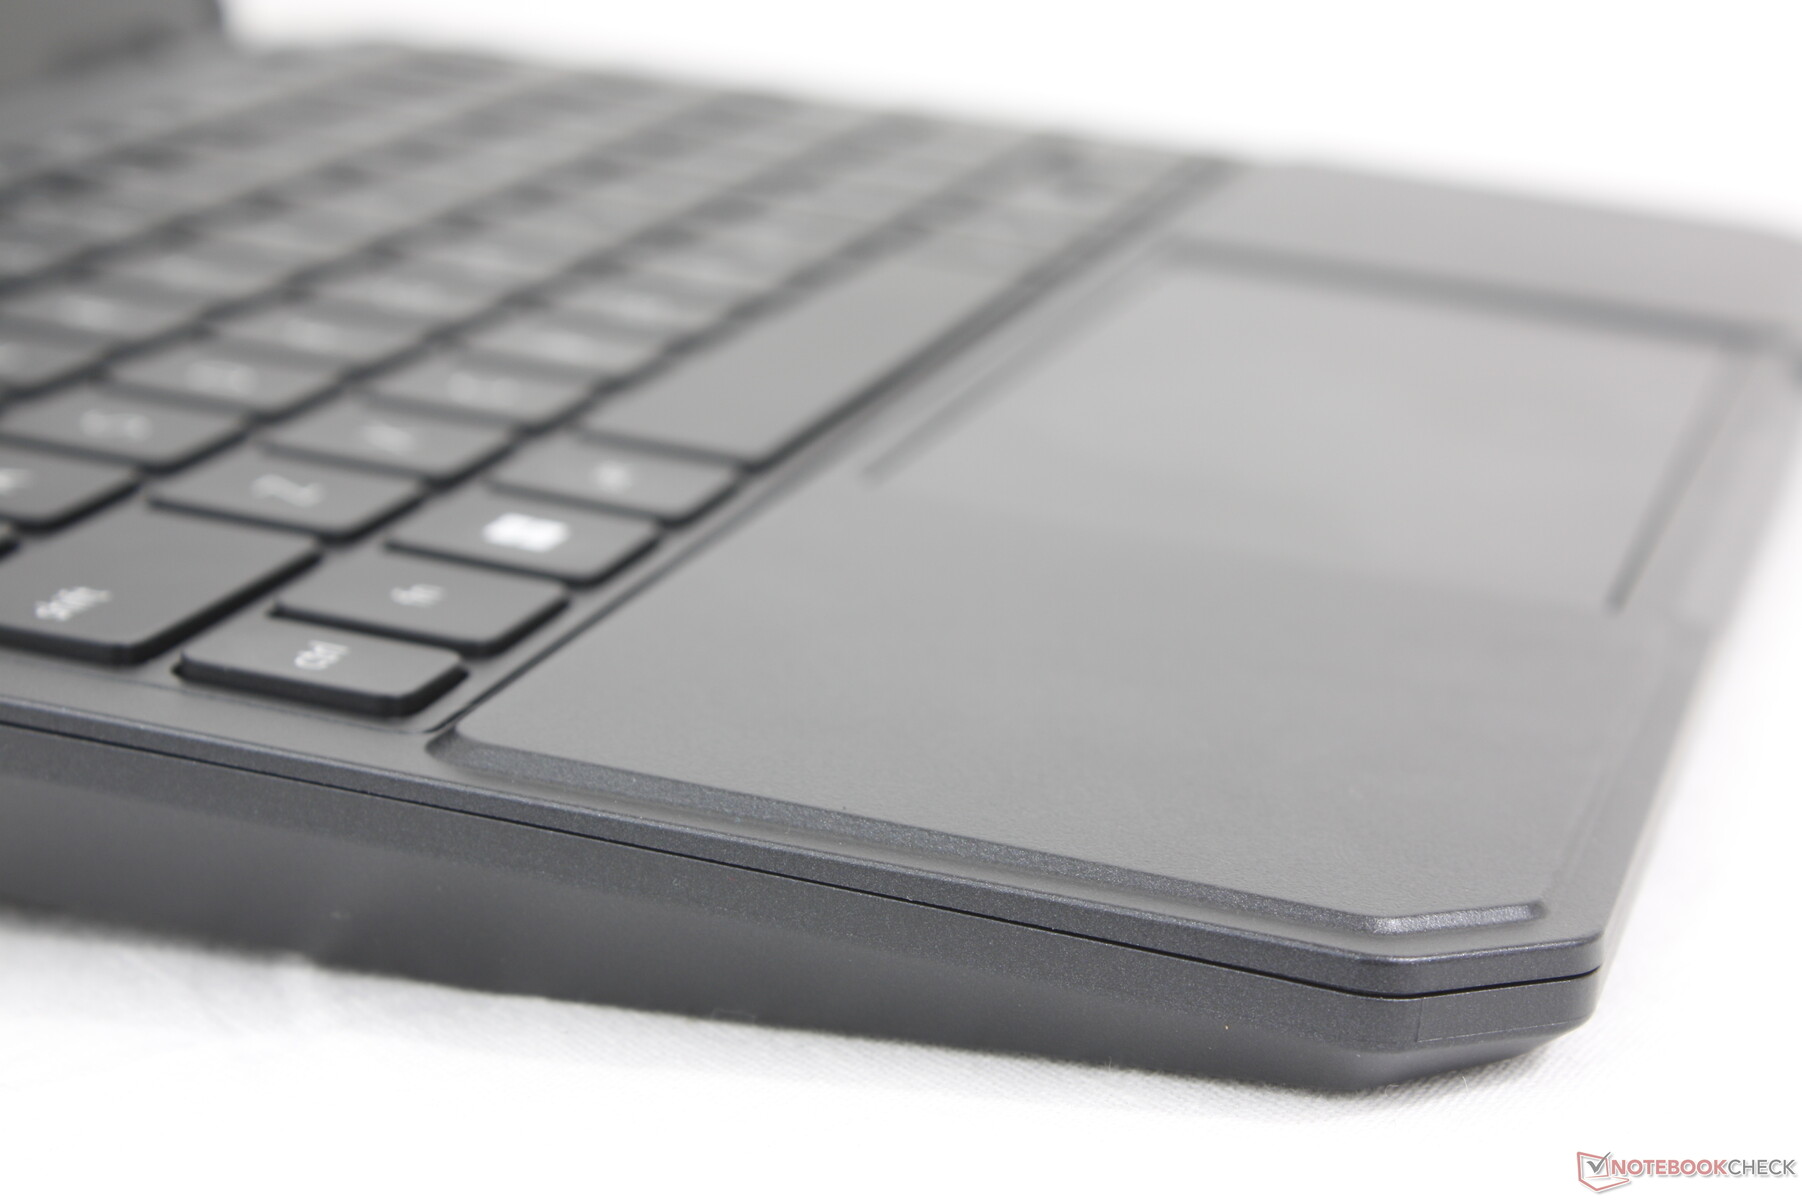
Touchpad
Das Clickpad ist mit 10,2 x 5,5 cm erwartungsgemäß klein. Das Gleiten verläuft zwar flüssig, jedoch sind Multitouch-Gesten wie Ziehen und Ablegen aufgrund der geringen Größe des Clickpads schwierig auszuführen. Zudem springt der Cursor unerwartet häufig.


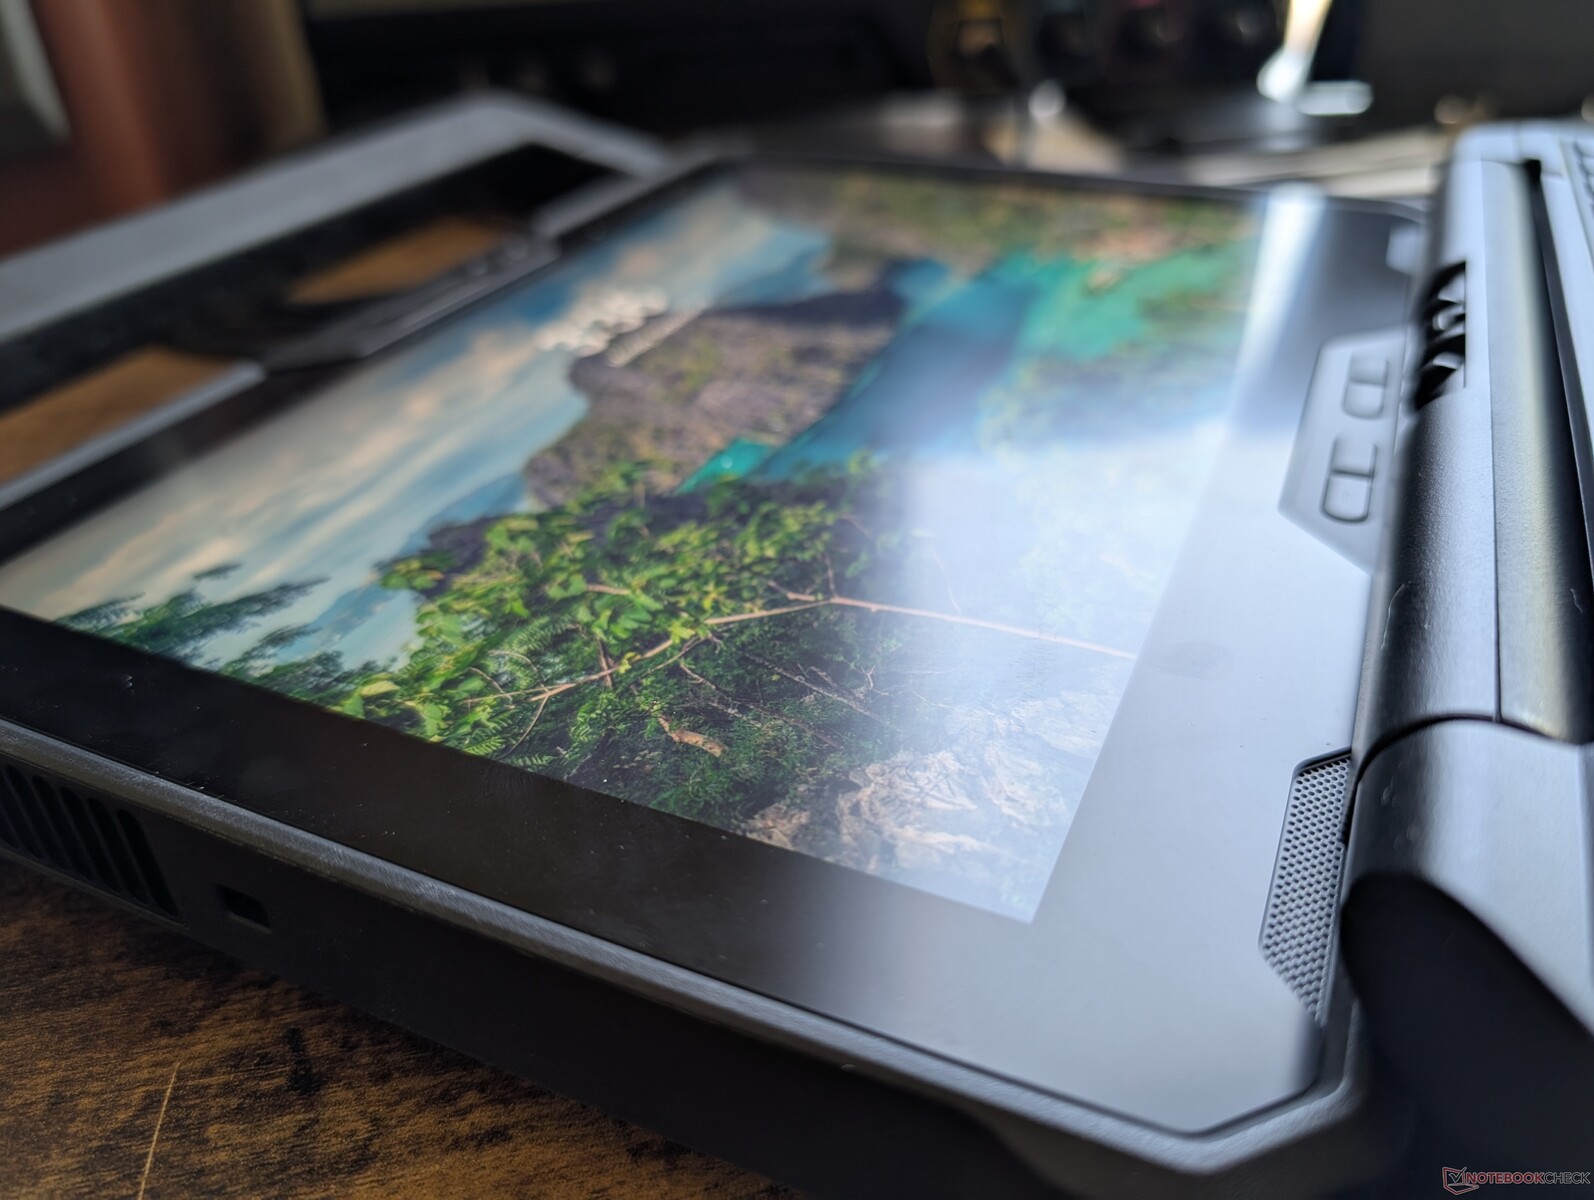
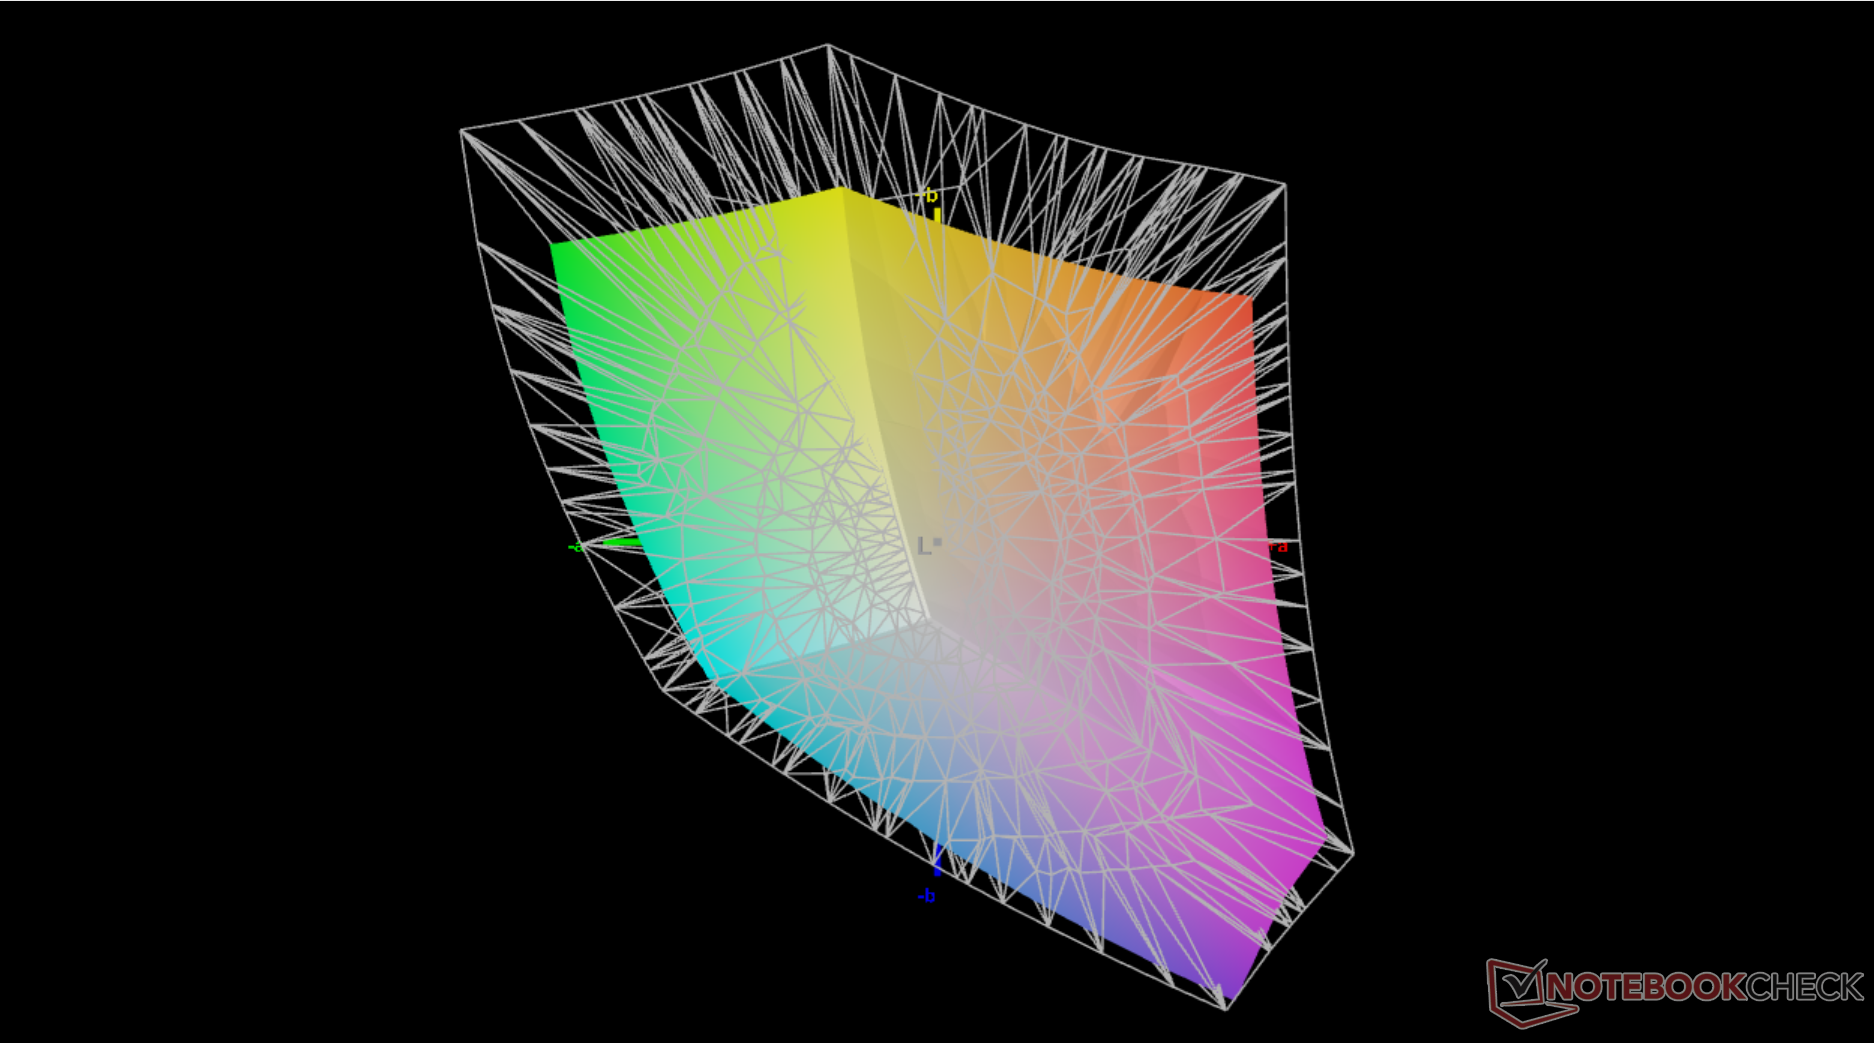
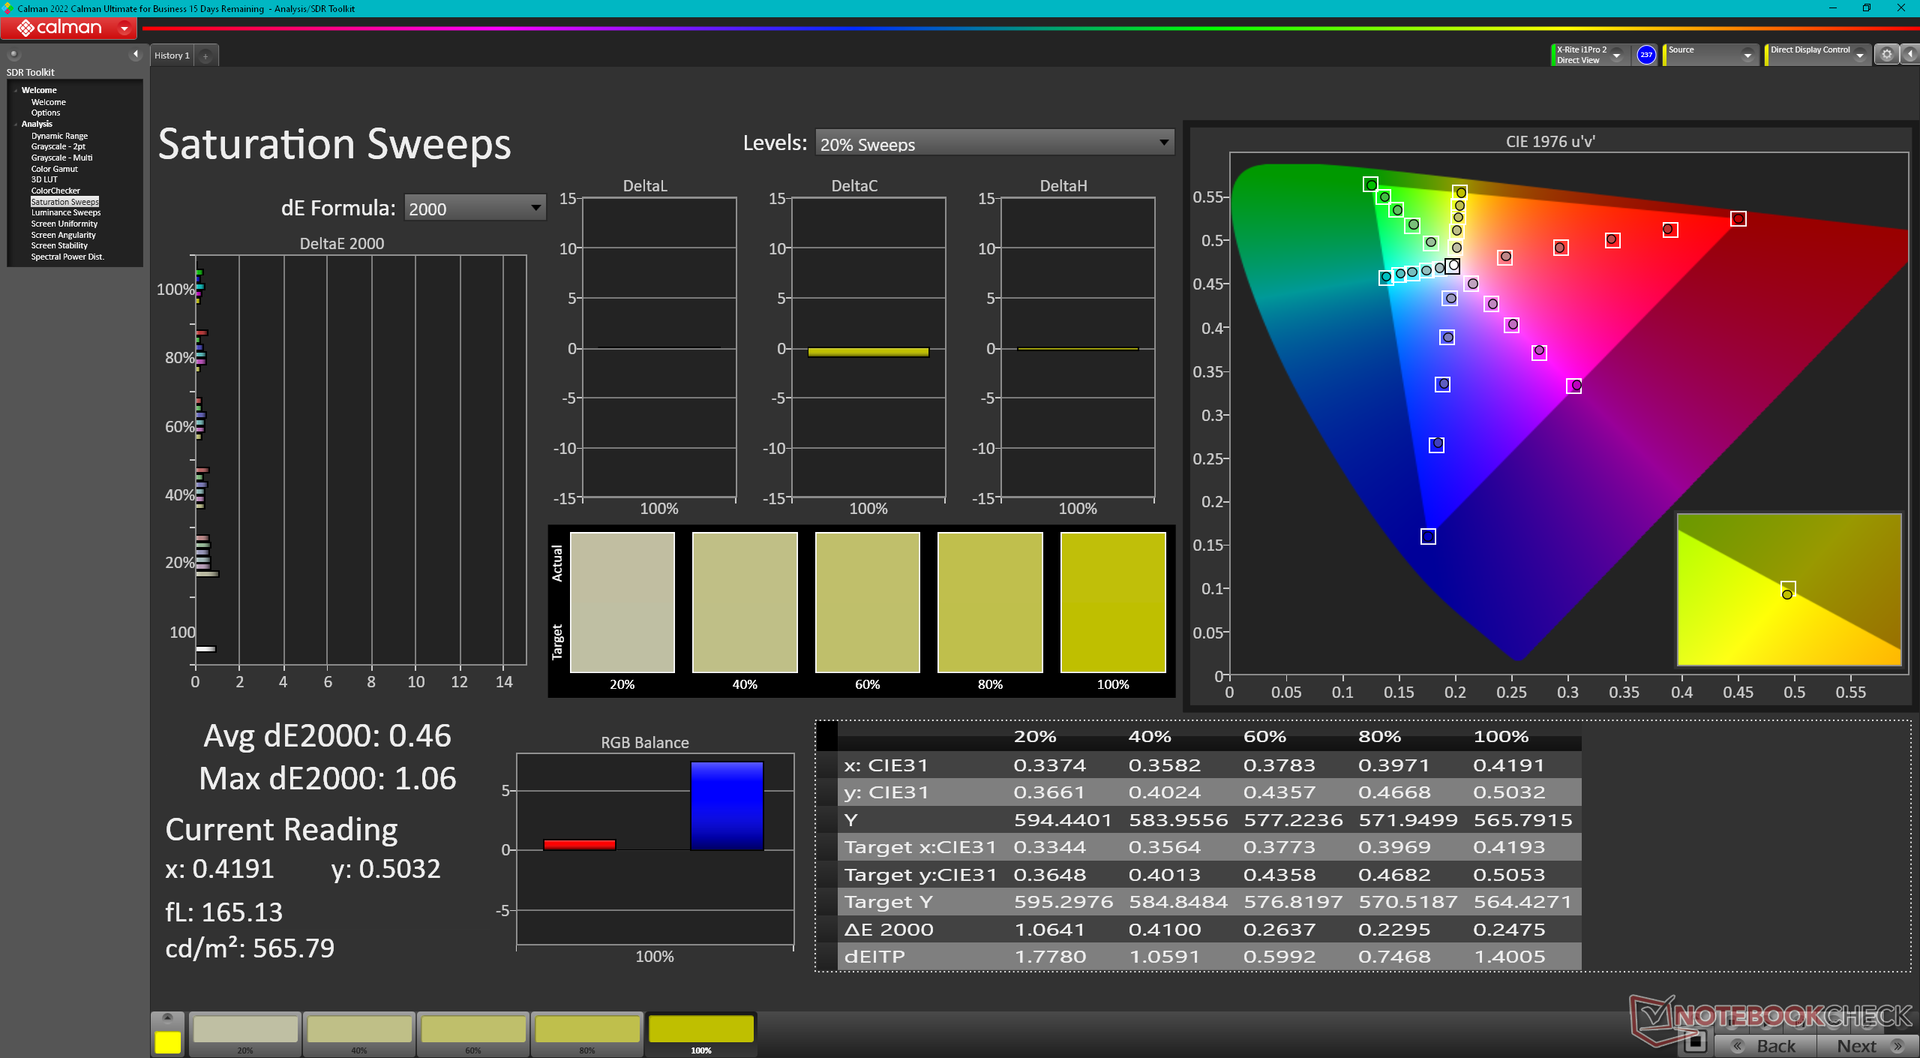
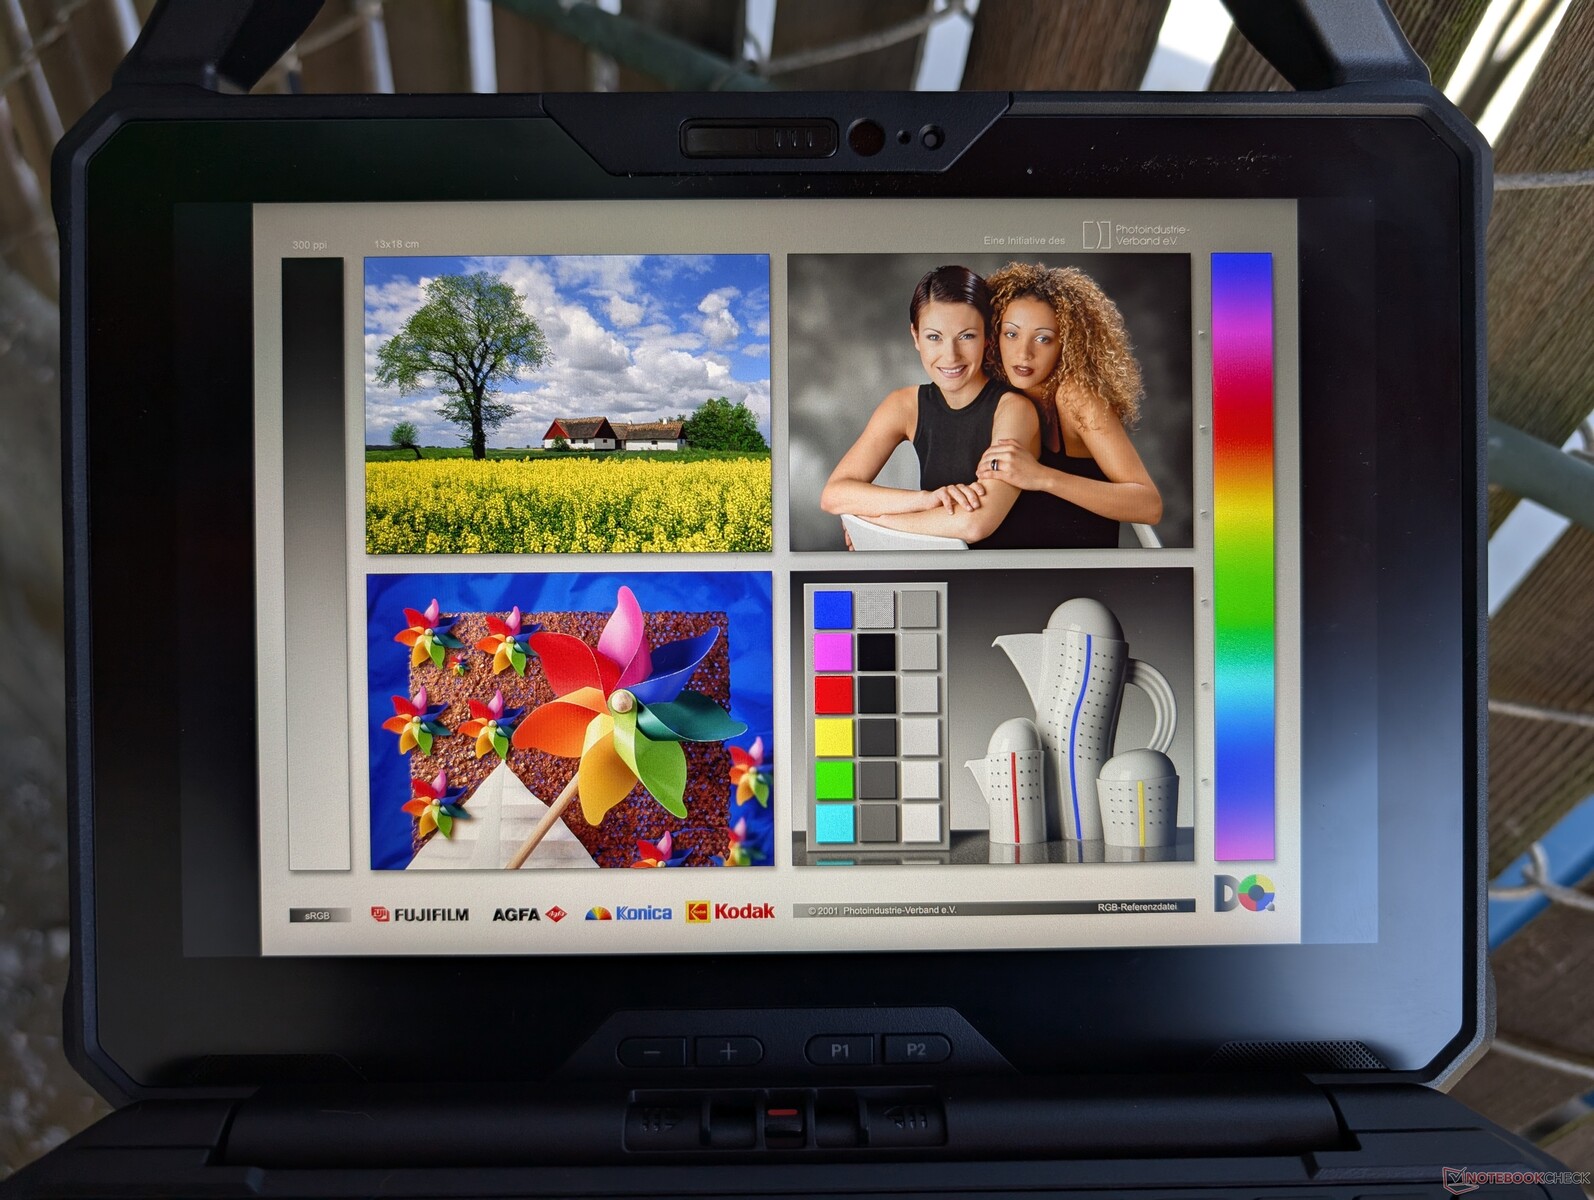
Display — Tolle Farben für ein robustes Tablet
Das Modell bietet eines der besten Displays, die wir bei einem robusten Tablet gesehen haben. Es unterstützt volles sRGB, was lebendigere Farben sofort erkennbar macht. Die helle Hintergrundbeleuchtung mit 1000 Nits und das beeindruckende Kontrastverhältnis von etwa 1500:1 intensivieren das visuelle Erlebnis zusätzlich.
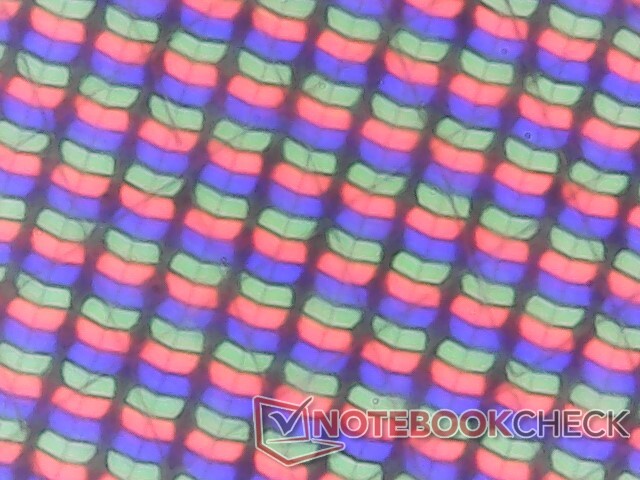
Zu den Nachteilen gehören die langsamen Schwarz-Weiß-Reaktionszeiten, die Bildwiederholrate von 60 Hz und das körnige Overlay. Während Ghosting kein Problem darstellen, sorgt die Körnigkeit leider dafür, dass Texte und Bilder auf dem ansonsten hochauflösenden Bildschirm unscharf erscheinen. Dies ist bei den meisten robusten Tablets üblich, da ihre Touchscreens durch dickere Schutzschichten besser geschützt sind als bei herkömmlichen Endgeräten.

| |||||||||||||||||||||||||
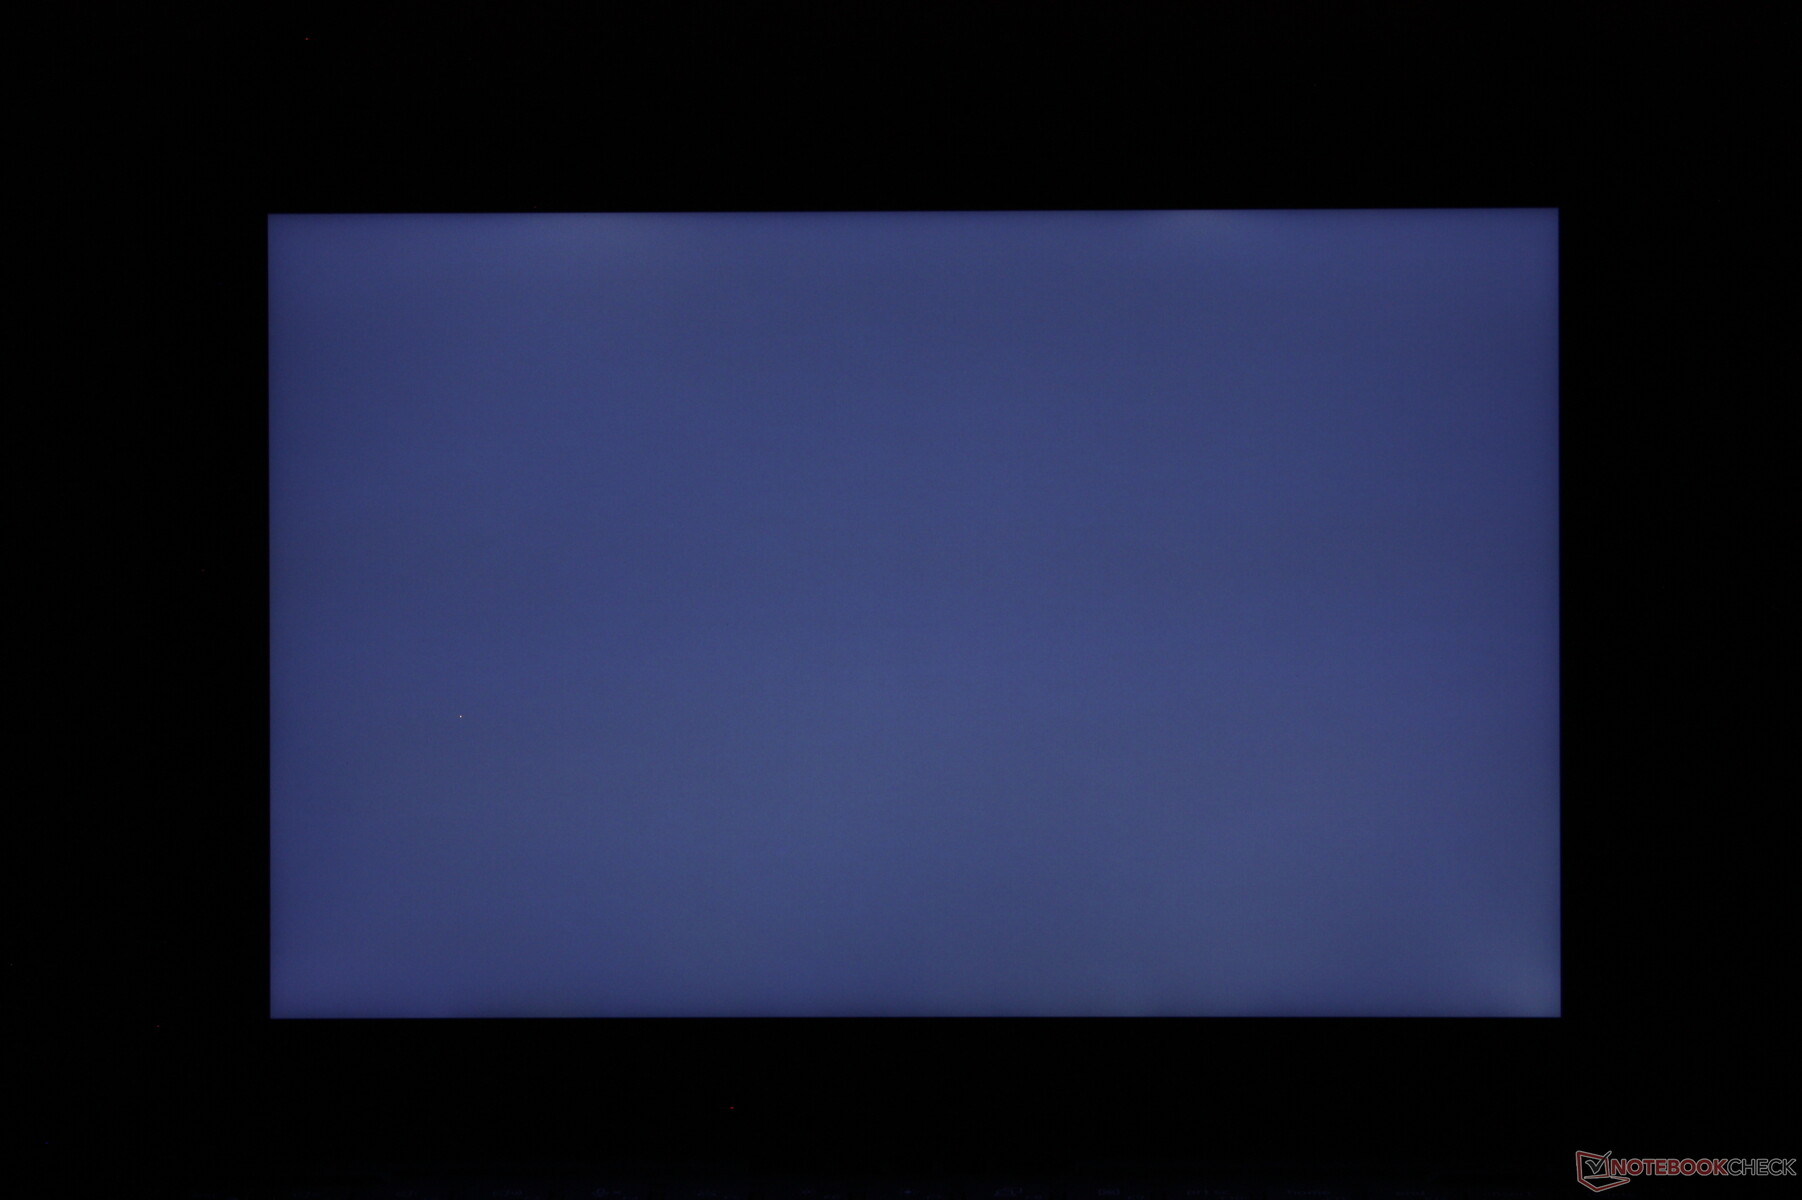
Ausleuchtung: 88 %
Helligkeit Akku: 1183.9 cd/m²
Kontrast: 1600:1 (Schwarzwert: 0.74 cd/m²)
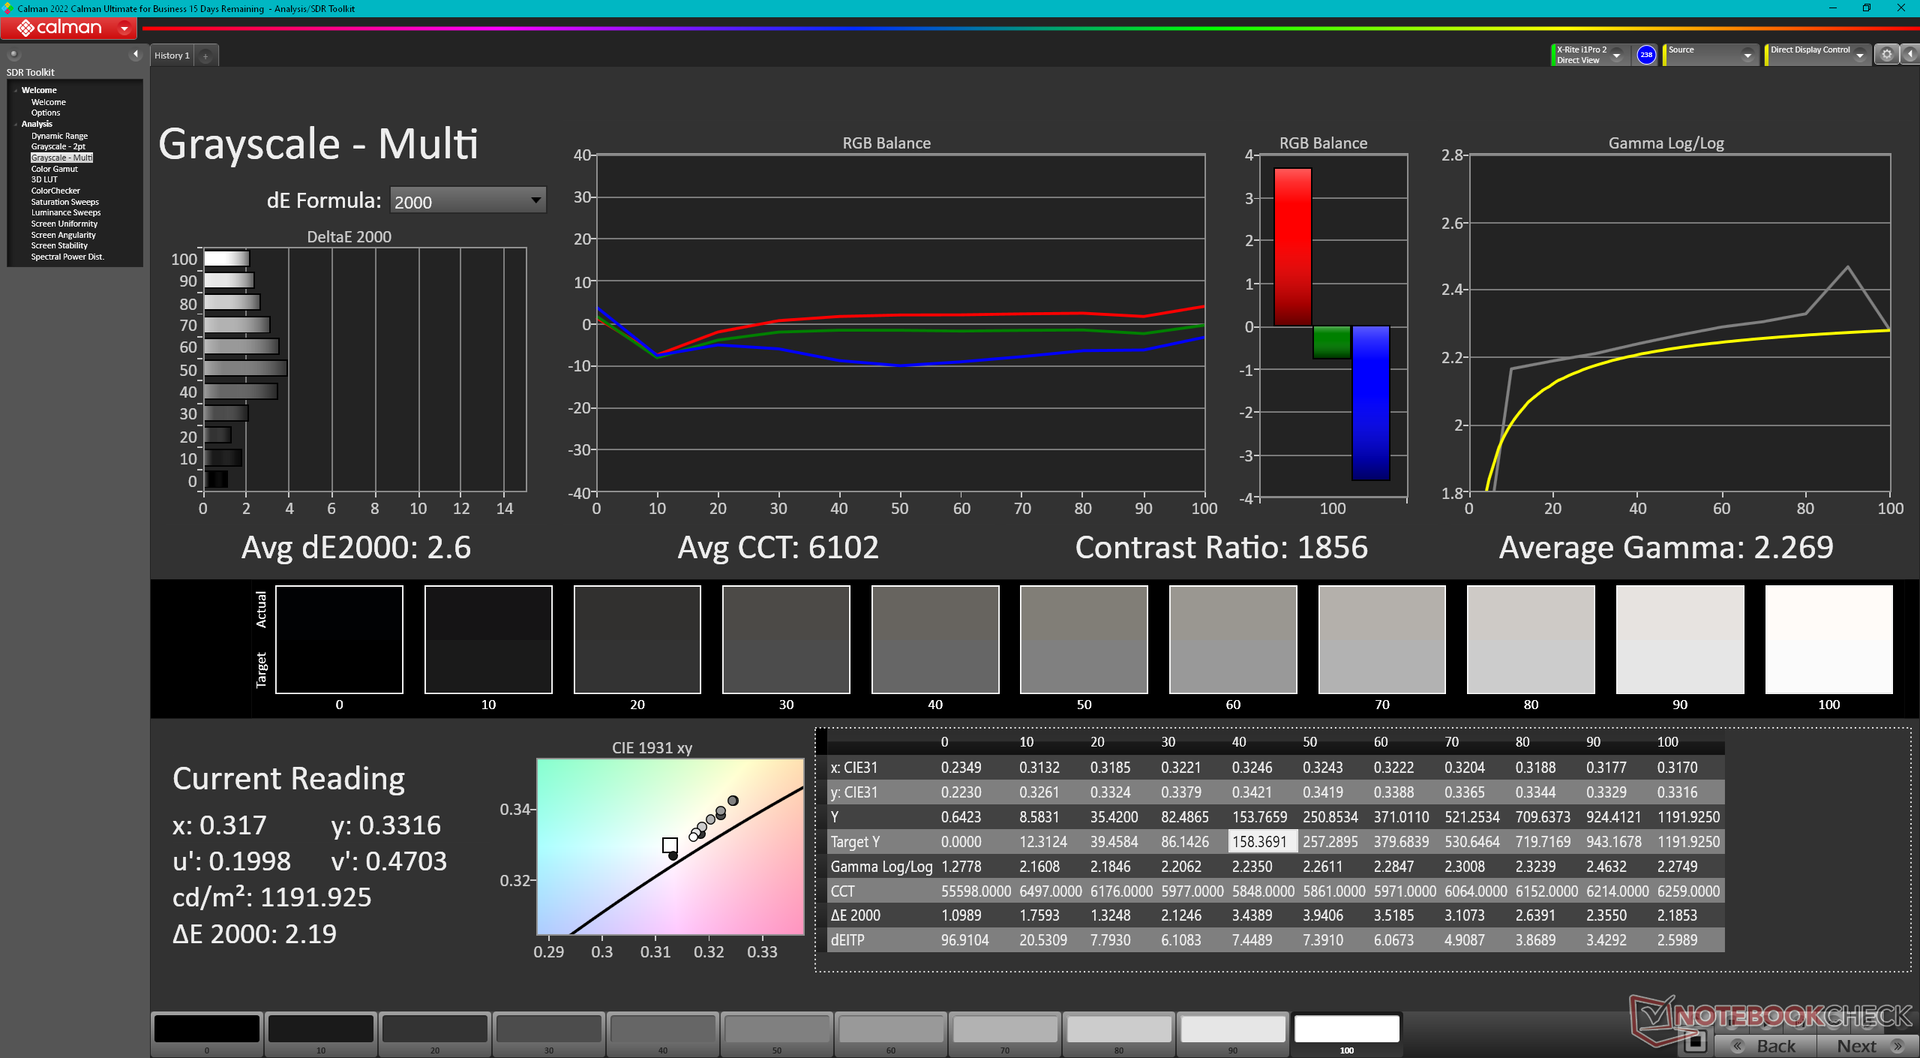
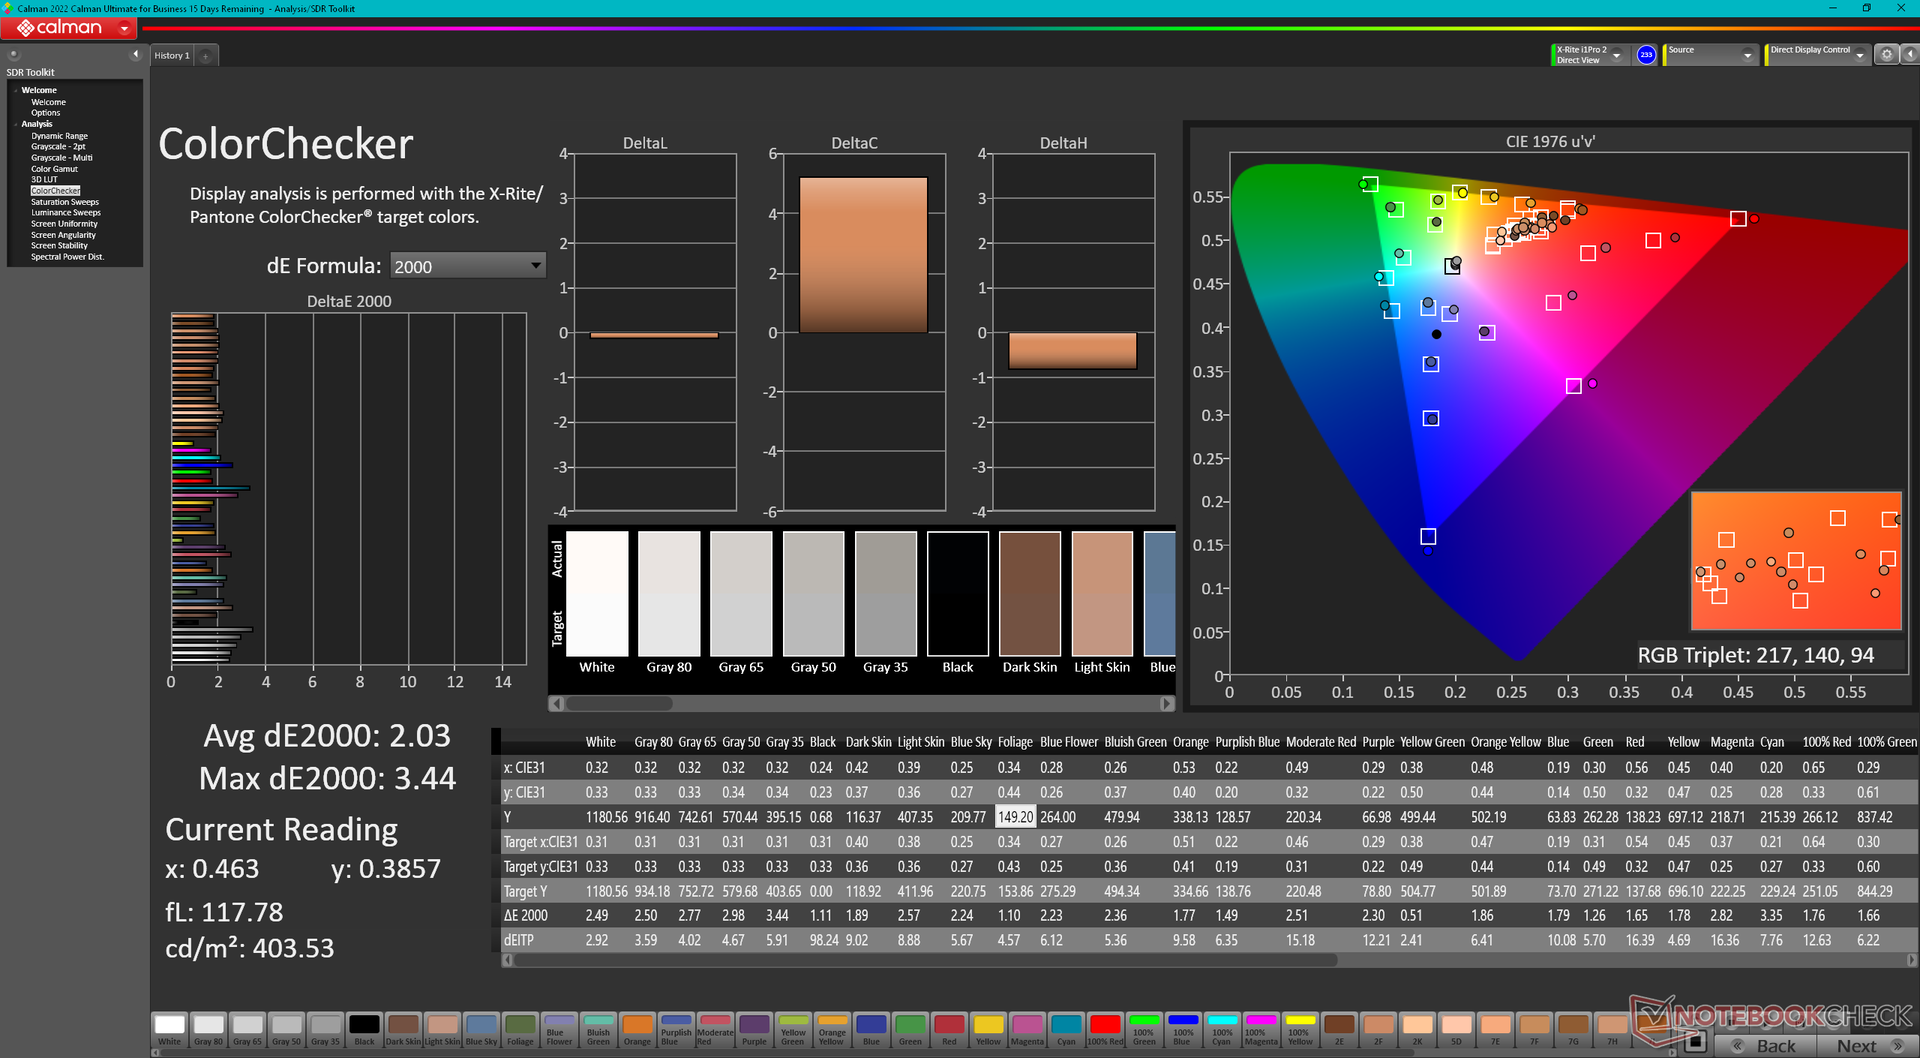
ΔE ColorChecker Calman: 2.03 | ∀{0.5-29.43 Ø4.78}
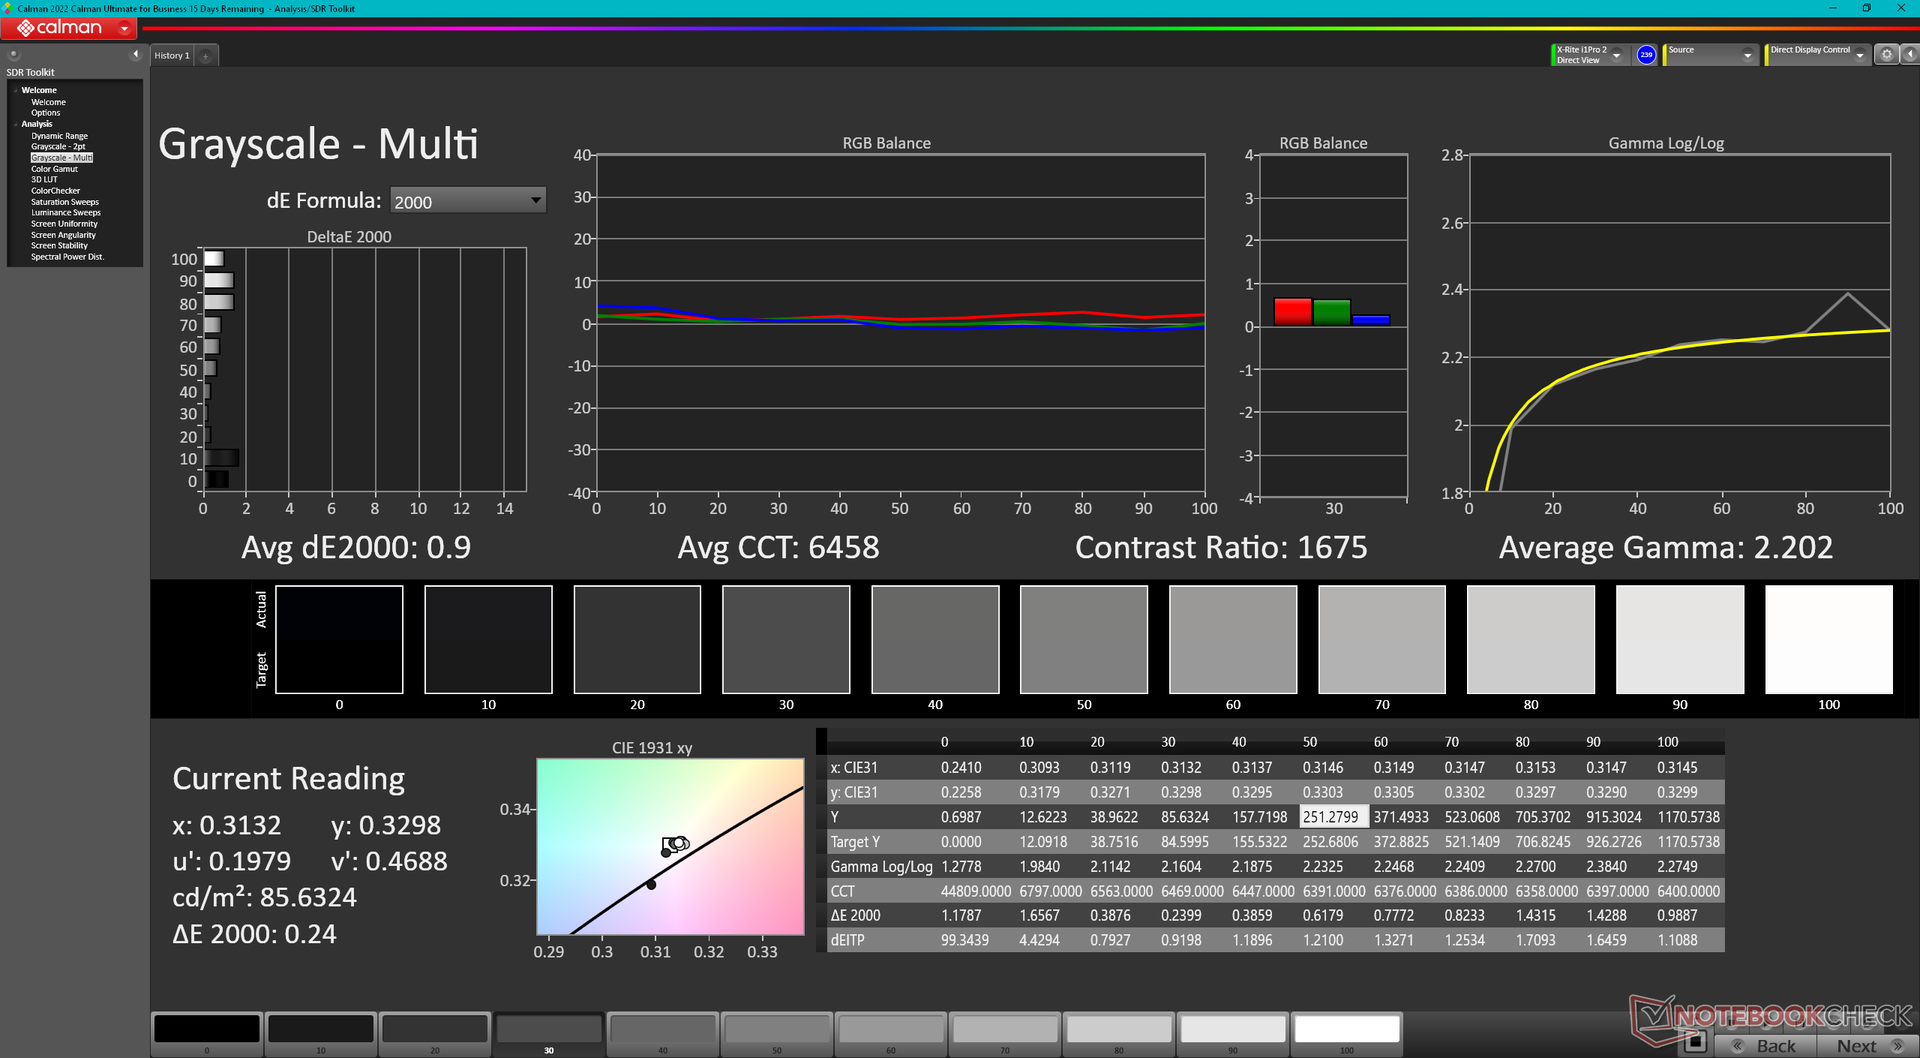
calibrated: 0.53
ΔE Greyscale Calman: 2.6 | ∀{0.09-98 Ø5}
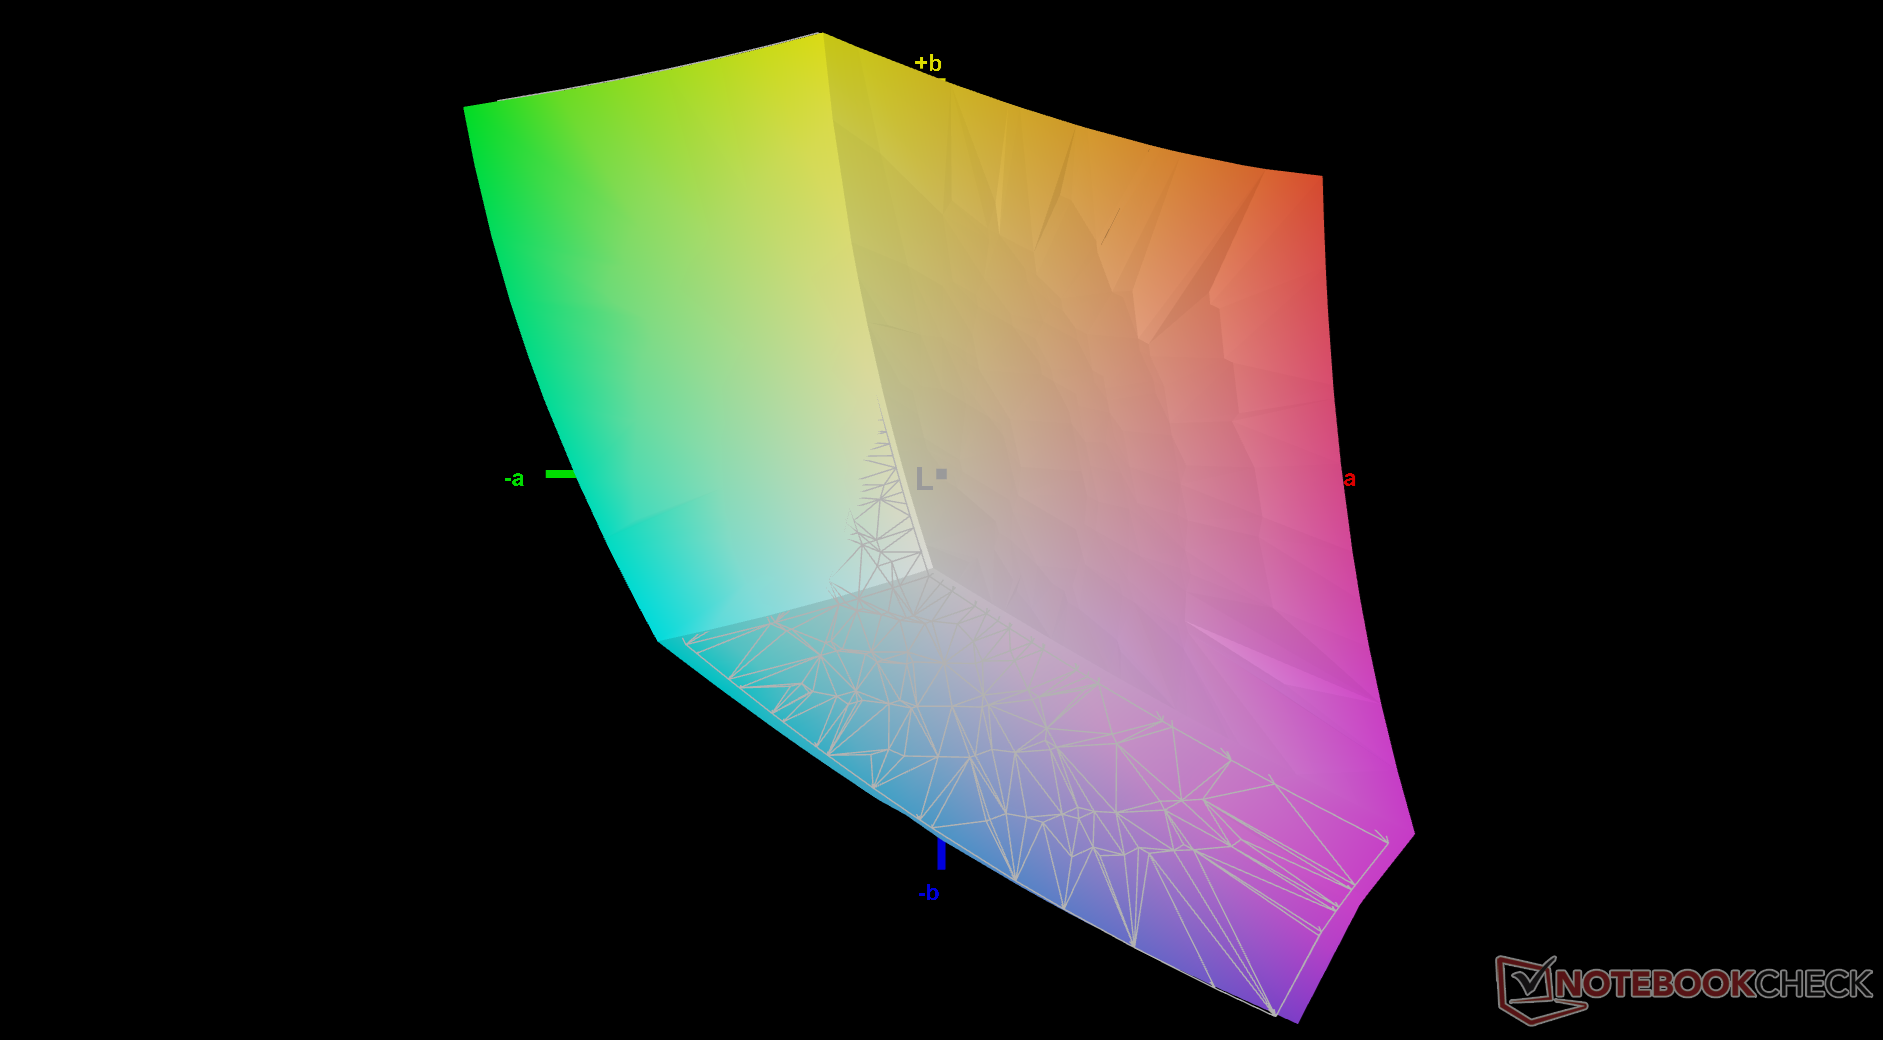
72.7% AdobeRGB 1998 (Argyll 3D)
99% sRGB (Argyll 3D)
72.2% Display P3 (Argyll 3D)
Gamma: 2.27
CCT: 6102 K
| Dell Latitude 7030 Rugged Extreme Sharp LQ101N1, IPS, 1920x1200, 10", 60 Hz | Dell Latitude 7350 Detachable BOE NE13A1M, IPS, 2880x1920, 13", 60 Hz | Dell Latitude 7230 Rugged Extreme Sharp LQ120N1, IPS, 1920x1200, 12", 60 Hz | Durabook R8 Tablet Digital Flat Panel, IPS, 1280x800, 8", 60 Hz | Acer Enduro Urban N3 EUN314 XR140EA6T, IPS, 1920x1080, 14", 60 Hz | Dell Latitude 7330 Rugged Extreme Sharp LQ133M1, IPS, 1920x1080, 13.3", 60 Hz | |
|---|---|---|---|---|---|---|
| Display | -1% | -6% | -26% | -10% | -4% | |
| Display P3 Coverage (%) | 72.2 | 70.2 -3% | 66.2 -8% | 51.5 -29% | 63.5 -12% | 67.1 -7% |
| sRGB Coverage (%) | 99 | 98.9 0% | 96.1 -3% | 77.4 -22% | 91.9 -7% | 98.2 -1% |
| AdobeRGB 1998 Coverage (%) | 72.7 | 72.1 -1% | 68.4 -6% | 53.1 -27% | 65.5 -10% | 69 -5% |
| Response Times | -15% | 17% | 6% | -57% | -98% | |
| Response Time Grey 50% / Grey 80% * (ms) | 35.9 ? | 43.8 ? -22% | 28.4 ? 21% | 32.4 ? 10% | 56 ? -56% | 74.4 ? -107% |
| Response Time Black / White * (ms) | 22.4 ? | 24.1 ? -8% | 19.4 ? 13% | 21.9 ? 2% | 35.2 ? -57% | 42.4 ? -89% |
| PWM Frequency (Hz) | 300 ? | 1000 ? | ||||
| Bildschirm | -43% | 4% | -166% | -111% | -3% | |
| Helligkeit Bildmitte (cd/m²) | 1183.9 | 508.5 -57% | 1326.7 12% | 943.7 -20% | 487.8 -59% | 1414.1 19% |
| Brightness (cd/m²) | 1140 | 507 -56% | 1193 5% | 870 -24% | 464 -59% | 1282 12% |
| Brightness Distribution (%) | 88 | 87 -1% | 82 -7% | 85 -3% | 89 1% | 84 -5% |
| Schwarzwert * (cd/m²) | 0.74 | 0.24 68% | 0.85 -15% | 0.85 -15% | 0.48 35% | 0.83 -12% |
| Kontrast (:1) | 1600 | 2119 32% | 1561 -2% | 1110 -31% | 1016 -36% | 1704 7% |
| Delta E Colorchecker * | 2.03 | 3 -48% | 1.06 48% | 6.35 -213% | 6.51 -221% | 1.99 2% |
| Colorchecker dE 2000 max. * | 3.44 | 7.03 -104% | 3.78 -10% | 8.86 -158% | 11.36 -230% | 3.75 -9% |
| Colorchecker dE 2000 calibrated * | 0.53 | 1.28 -142% | 0.71 -34% | 5.1 -862% | 1.77 -234% | 0.72 -36% |
| Delta E Graustufen * | 2.6 | 4.6 -77% | 1.5 42% | 6.9 -165% | 7.8 -200% | 2.8 -8% |
| Gamma | 2.27 97% | 2.17 101% | 2.19 100% | 2.65 83% | 2.28 96% | 2.06 107% |
| CCT | 6102 107% | 6929 94% | 6804 96% | 6956 93% | 8102 80% | 6775 96% |
| Durchschnitt gesamt (Programm / Settings) | -20% /
-30% | 5% /
4% | -62% /
-111% | -59% /
-82% | -35% /
-17% |
* ... kleinere Werte sind besser
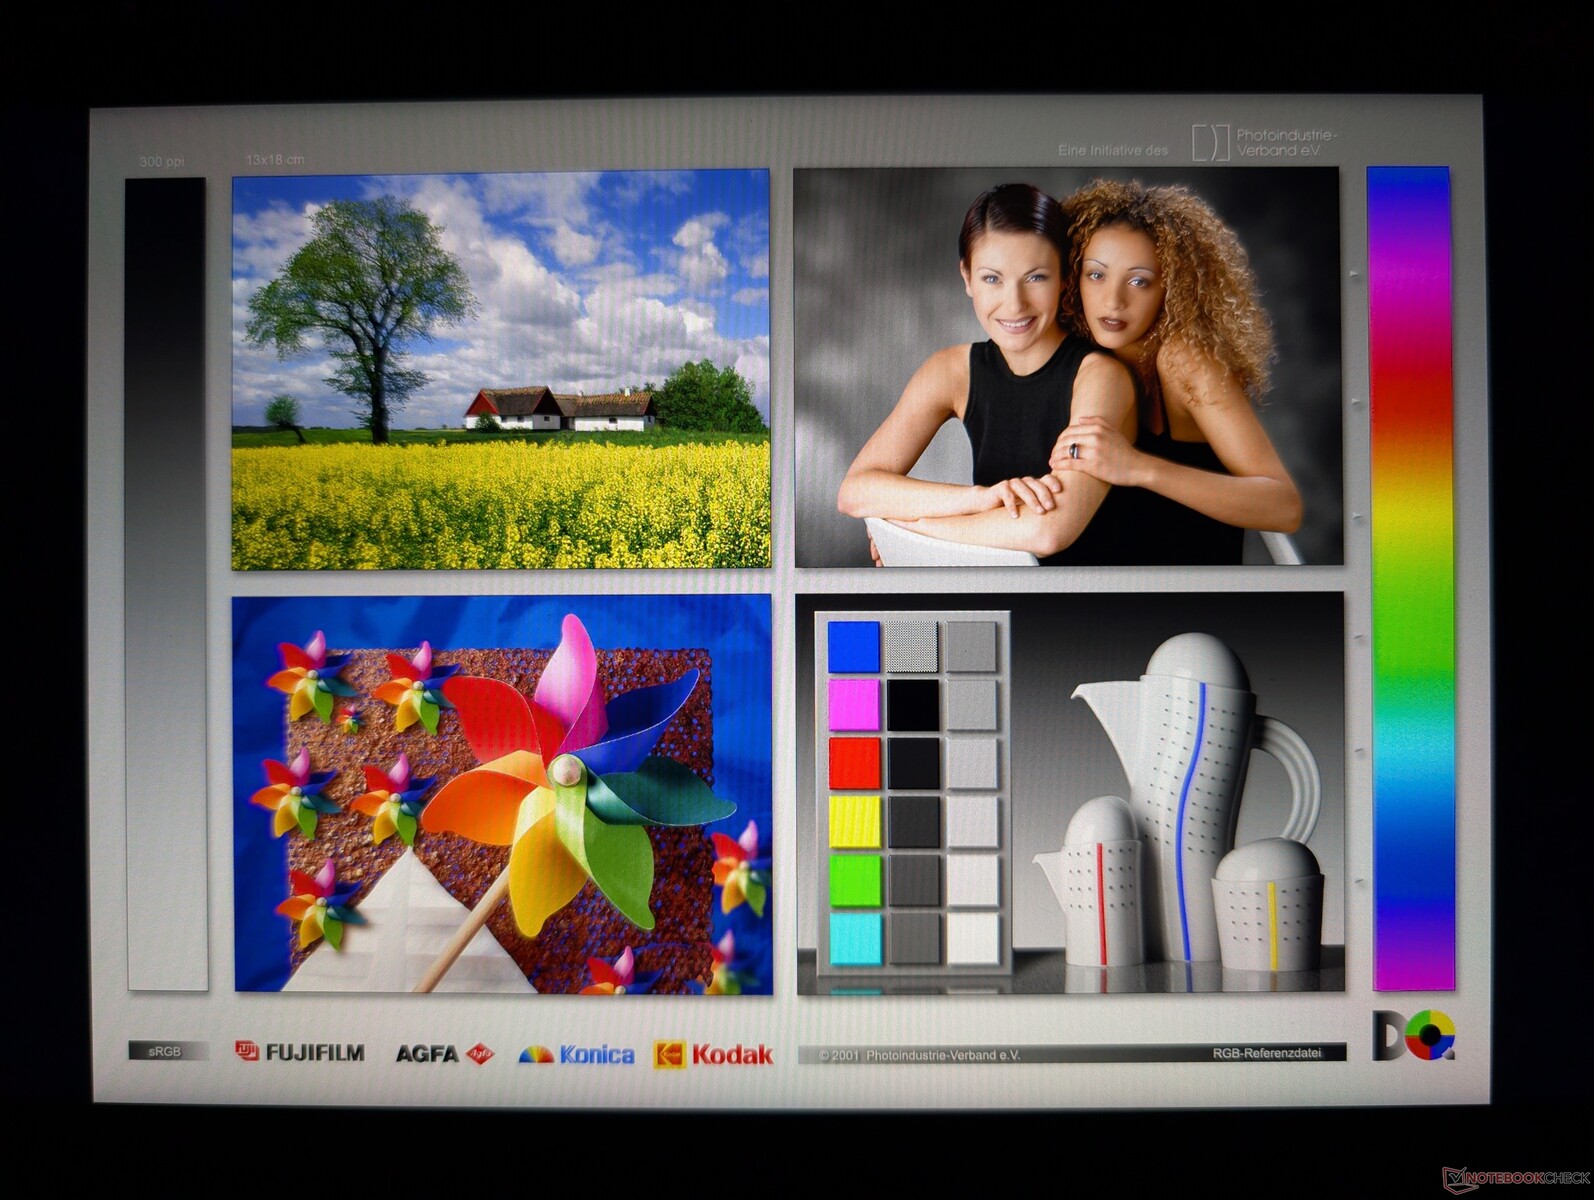
Das Display ist werksseitig gut kalibriert und weist relativ niedrige durchschnittliche DeltaE-Werte auf. Die Farbtemperatur ist etwas zu warm, doch eine Kalibrierung des Bildschirms mit einem X-Rite-Kolorimeter behebt diesen Fehler und sorgt für eine noch genauere Farbdarstellung. Unser kalibriertes ICM-Profil kann oben kostenlos heruntergeladen werden.


Reaktionszeiten (Response Times) des Displays
| ↔ Reaktionszeiten Schwarz zu Weiß | ||
|---|---|---|
| 22.4 ms ... steigend ↗ und fallend ↘ kombiniert | ↗ 11.7 ms steigend | 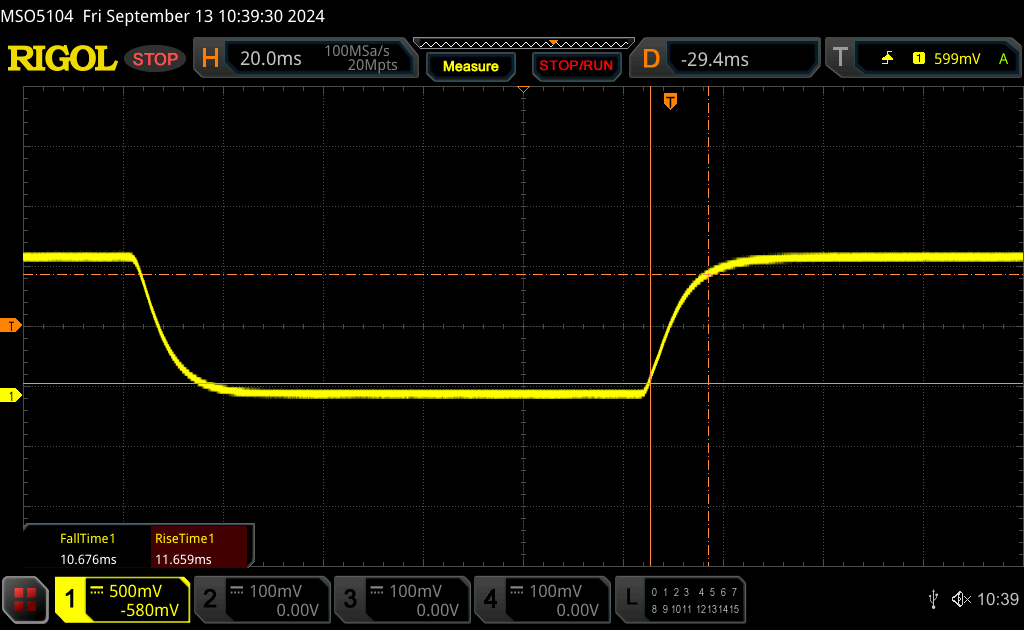 |
| ↘ 10.7 ms fallend | ||
| Die gemessenen Reaktionszeiten sind gut, für anspruchsvolle Spieler könnten der Bildschirm jedoch zu langsam sein. Im Vergleich rangierten die bei uns getesteten Geräte von 0.1 (Minimum) zu 240 (Maximum) ms. » 49 % aller Screens waren schneller als der getestete. Daher sind die gemessenen Reaktionszeiten schlechter als der Durchschnitt aller vermessenen Geräte (20.2 ms). | ||
| ↔ Reaktionszeiten 50% Grau zu 80% Grau | ||
| 35.9 ms ... steigend ↗ und fallend ↘ kombiniert | ↗ 17.1 ms steigend | 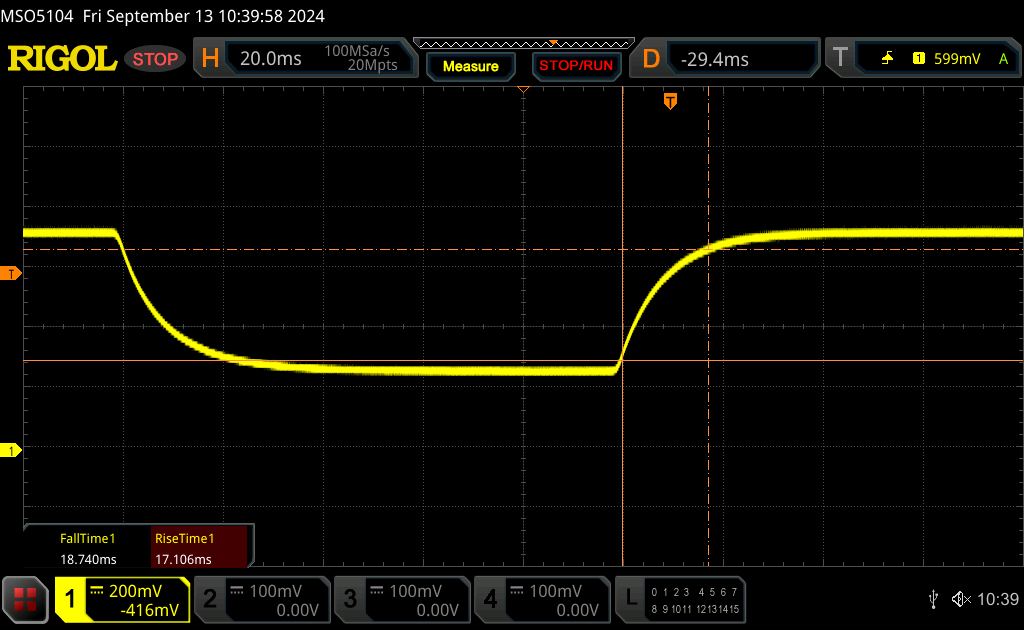 |
| ↘ 18.8 ms fallend | ||
| Die gemessenen Reaktionszeiten sind langsam und dadurch für viele Spieler wahrscheinlich zu langsam. Im Vergleich rangierten die bei uns getesteten Geräte von 0.165 (Minimum) zu 636 (Maximum) ms. » 49 % aller Screens waren schneller als der getestete. Daher sind die gemessenen Reaktionszeiten schlechter als der Durchschnitt aller vermessenen Geräte (31.6 ms). | ||
Bildschirm-Flackern / PWM (Pulse-Width Modulation)
| Flackern / PWM nicht festgestellt | 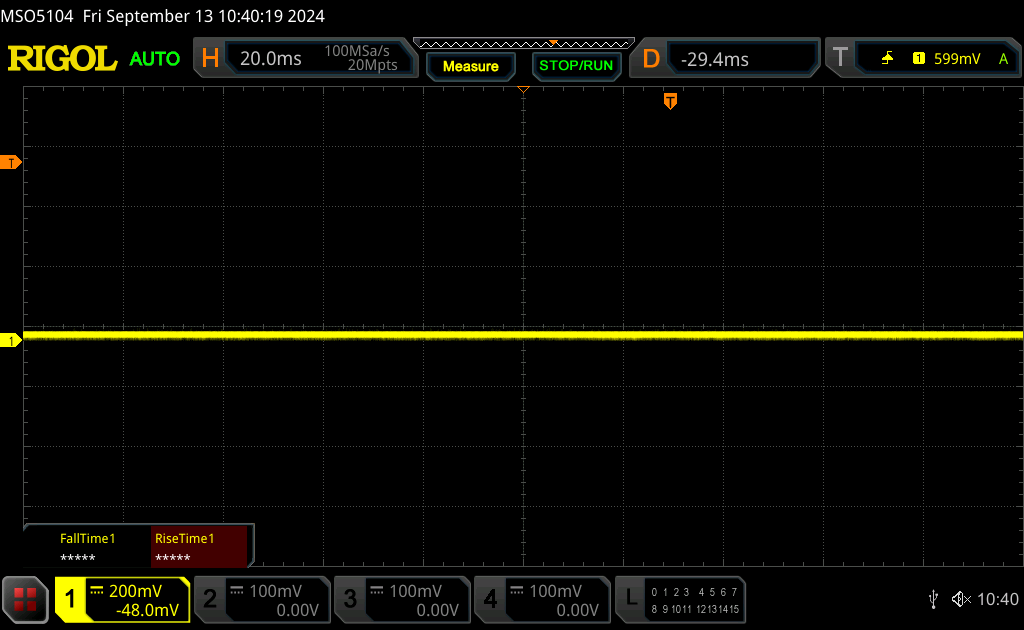 | ||
Im Vergleich: 53 % aller getesteten Geräte nutzten kein PWM um die Helligkeit zu reduzieren. Wenn PWM eingesetzt wurde, dann bei einer Frequenz von durchschnittlich 8111 (Minimum 5, Maximum 343500) Hz. | |||
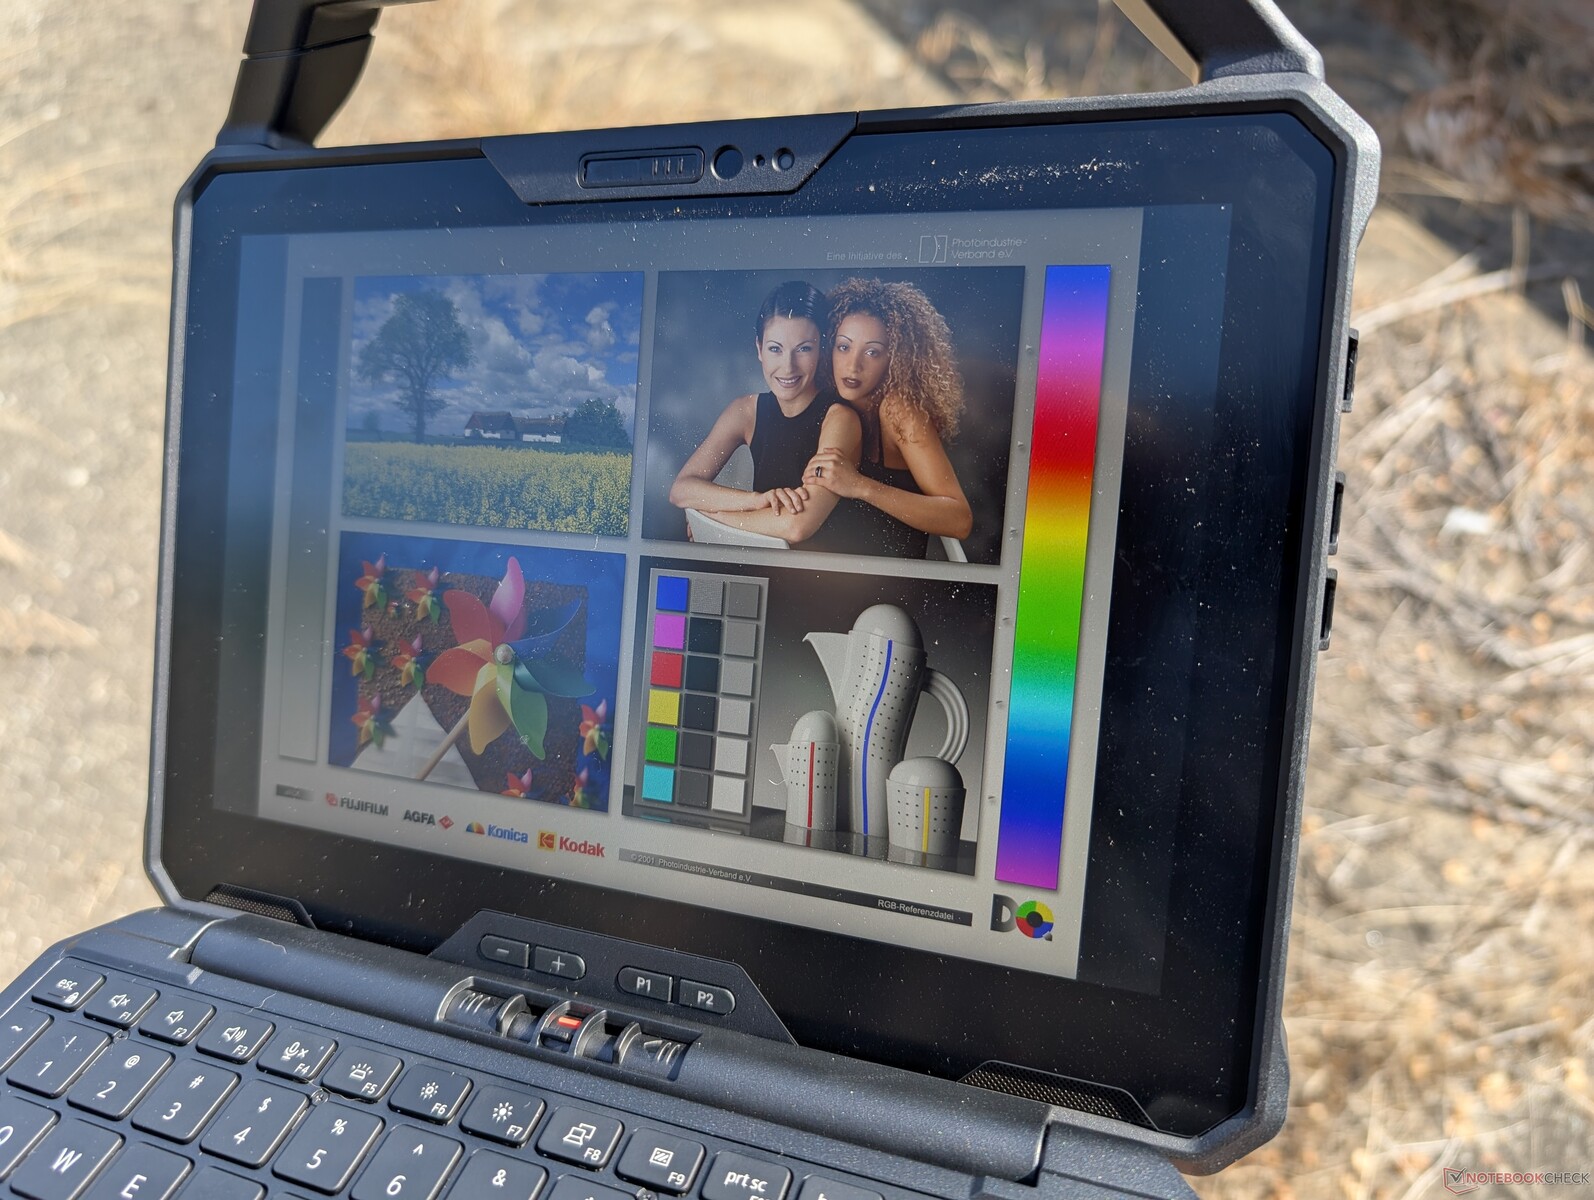
Der besonders helle 1000-Nit-Bildschirm sorgt für eine gute Sichtbarkeit im Freien, selbst bei direkter Sonneneinstrahlung. Zwar gibt es auf dem matten Bildschirm weiterhin Blendeffekte und die Farben sind nicht so lebendig, jedoch bleibt der Text gut sichtbar und lesbar.


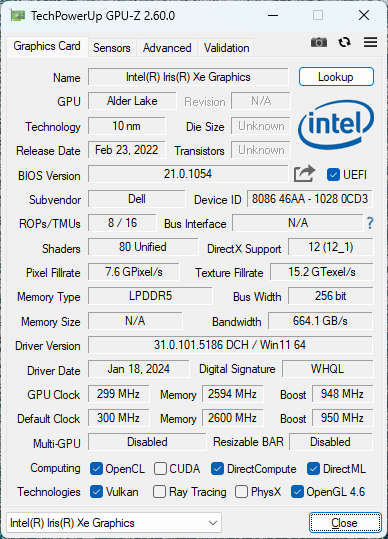
Performance — Alder Lake vPro
Testbedingungen
Wir haben Windows und Dell Optimizer auf den Performance-Modus eingestellt, bevor wir die folgenden Benchmarks durchgeführt haben.
Prozessor
Die rohe Prozessorleistung ist in der robusten Kategorie beeindruckend hoch. Der Core i7-1260U konkurriert mit dem Core Ultra 7 164U im aktuellen Latitude 7350 Detachable und übertrifft den Core i7-1185G7 im älteren Latitude 7330 Rugged Extreme um mehr als 50 %. Die Nachhaltigkeit der Leistung ist für ein Tablet ebenfalls respektabel, mit einem Leistungsabfall von nur 9 bis 10 Prozent nach 5 oder 6 Durchläufen in unserem CineBench R15 xT Stresstest.
Ein Wechsel zur Core i5-1240U-Konfiguration dürfte die Leistung nur um 5 bis 10 Prozent beeinträchtigen, basierend auf unseren Erfahrungen mit dem Latitude 7230 Rugged Extreme. Daher könnte die Core i5-Option sinnvoller sein als unser Core i7, da der Leistungsunterschied kaum spürbar wäre.
Es gibt jedoch keine integrierte NPU für lokale KI-Beschleunigung.
Cinebench R15 Multi Dauertest
Cinebench R23: Multi Core | Single Core
Cinebench R20: CPU (Multi Core) | CPU (Single Core)
Cinebench R15: CPU Multi 64Bit | CPU Single 64Bit
Blender: v2.79 BMW27 CPU
7-Zip 18.03: 7z b 4 | 7z b 4 -mmt1
Geekbench 6.5: Multi-Core | Single-Core
Geekbench 5.5: Multi-Core | Single-Core
HWBOT x265 Benchmark v2.2: 4k Preset
LibreOffice : 20 Documents To PDF
R Benchmark 2.5: Overall mean
| CPU Performance Rating | |
| Dell Latitude 7030 Rugged Extreme | |
| Dell Latitude 7350 Detachable | |
| Durchschnittliche Intel Core i7-1260U | |
| Dell Latitude 7230 Rugged Extreme -2! | |
| Dell Latitude 7330 Rugged Extreme -2! | |
| Acer Enduro Urban N3 EUN314 -2! | |
| Dell Latitude 5420 Rugged-P85G -14! | |
| Dell Latitude 7424 Rugged Extreme -14! | |
| Durabook R8 Tablet -2! | |
| Cinebench R23 / Multi Core | |
| Dell Latitude 7350 Detachable | |
| Dell Latitude 7030 Rugged Extreme | |
| Durchschnittliche Intel Core i7-1260U (7444 - 8381, n=2) | |
| Dell Latitude 7230 Rugged Extreme | |
| Dell Latitude 7330 Rugged Extreme | |
| Acer Enduro Urban N3 EUN314 | |
| Durabook R8 Tablet | |
| Cinebench R23 / Single Core | |
| Dell Latitude 7030 Rugged Extreme | |
| Durchschnittliche Intel Core i7-1260U (1538 - 1664, n=2) | |
| Dell Latitude 7350 Detachable | |
| Dell Latitude 7230 Rugged Extreme | |
| Dell Latitude 7330 Rugged Extreme | |
| Acer Enduro Urban N3 EUN314 | |
| Durabook R8 Tablet | |
| Cinebench R20 / CPU (Multi Core) | |
| Dell Latitude 7350 Detachable | |
| Dell Latitude 7030 Rugged Extreme | |
| Durchschnittliche Intel Core i7-1260U (2838 - 3165, n=2) | |
| Dell Latitude 7230 Rugged Extreme | |
| Dell Latitude 7330 Rugged Extreme | |
| Acer Enduro Urban N3 EUN314 | |
| Durabook R8 Tablet | |
| Cinebench R20 / CPU (Single Core) | |
| Dell Latitude 7350 Detachable | |
| Dell Latitude 7230 Rugged Extreme | |
| Dell Latitude 7330 Rugged Extreme | |
| Durchschnittliche Intel Core i7-1260U (566 - 588, n=2) | |
| Dell Latitude 7030 Rugged Extreme | |
| Acer Enduro Urban N3 EUN314 | |
| Durabook R8 Tablet | |
| Cinebench R15 / CPU Multi 64Bit | |
| Dell Latitude 7350 Detachable | |
| Dell Latitude 7030 Rugged Extreme | |
| Dell Latitude 7230 Rugged Extreme | |
| Durchschnittliche Intel Core i7-1260U (1117 - 1289, n=2) | |
| Acer Enduro Urban N3 EUN314 | |
| Dell Latitude 7330 Rugged Extreme | |
| Dell Latitude 7424 Rugged Extreme | |
| Dell Latitude 5420 Rugged-P85G | |
| Durabook R8 Tablet | |
| Cinebench R15 / CPU Single 64Bit | |
| Dell Latitude 7330 Rugged Extreme | |
| Dell Latitude 7230 Rugged Extreme | |
| Dell Latitude 7350 Detachable | |
| Durchschnittliche Intel Core i7-1260U (217 - 222, n=2) | |
| Dell Latitude 7030 Rugged Extreme | |
| Acer Enduro Urban N3 EUN314 | |
| Dell Latitude 5420 Rugged-P85G | |
| Dell Latitude 7424 Rugged Extreme | |
| Durabook R8 Tablet | |
| Blender / v2.79 BMW27 CPU | |
| Durabook R8 Tablet | |
| Acer Enduro Urban N3 EUN314 | |
| Dell Latitude 7330 Rugged Extreme | |
| Durchschnittliche Intel Core i7-1260U (393 - 431, n=2) | |
| Dell Latitude 7230 Rugged Extreme | |
| Dell Latitude 7350 Detachable | |
| Dell Latitude 7030 Rugged Extreme | |
| 7-Zip 18.03 / 7z b 4 | |
| Dell Latitude 7030 Rugged Extreme | |
| Durchschnittliche Intel Core i7-1260U (32008 - 36480, n=2) | |
| Dell Latitude 7230 Rugged Extreme | |
| Dell Latitude 7350 Detachable | |
| Acer Enduro Urban N3 EUN314 | |
| Dell Latitude 7330 Rugged Extreme | |
| Durabook R8 Tablet | |
| 7-Zip 18.03 / 7z b 4 -mmt1 | |
| Dell Latitude 7330 Rugged Extreme | |
| Acer Enduro Urban N3 EUN314 | |
| Dell Latitude 7030 Rugged Extreme | |
| Durchschnittliche Intel Core i7-1260U (4746 - 5047, n=2) | |
| Dell Latitude 7350 Detachable | |
| Dell Latitude 7230 Rugged Extreme | |
| Durabook R8 Tablet | |
| Geekbench 6.5 / Multi-Core | |
| Dell Latitude 7350 Detachable | |
| Dell Latitude 7030 Rugged Extreme | |
| Durchschnittliche Intel Core i7-1260U (n=1) | |
| Geekbench 6.5 / Single-Core | |
| Dell Latitude 7030 Rugged Extreme | |
| Durchschnittliche Intel Core i7-1260U (n=1) | |
| Dell Latitude 7350 Detachable | |
| Geekbench 5.5 / Multi-Core | |
| Dell Latitude 7350 Detachable | |
| Dell Latitude 7030 Rugged Extreme | |
| Durchschnittliche Intel Core i7-1260U (7072 - 7444, n=2) | |
| Dell Latitude 7230 Rugged Extreme | |
| Dell Latitude 7330 Rugged Extreme | |
| Acer Enduro Urban N3 EUN314 | |
| Durabook R8 Tablet | |
| Geekbench 5.5 / Single-Core | |
| Dell Latitude 7030 Rugged Extreme | |
| Durchschnittliche Intel Core i7-1260U (1560 - 1662, n=2) | |
| Dell Latitude 7230 Rugged Extreme | |
| Dell Latitude 7330 Rugged Extreme | |
| Acer Enduro Urban N3 EUN314 | |
| Dell Latitude 7350 Detachable | |
| Durabook R8 Tablet | |
| HWBOT x265 Benchmark v2.2 / 4k Preset | |
| Dell Latitude 7030 Rugged Extreme | |
| Dell Latitude 7230 Rugged Extreme | |
| Durchschnittliche Intel Core i7-1260U (8.54 - 9.58, n=2) | |
| Dell Latitude 7350 Detachable | |
| Dell Latitude 7330 Rugged Extreme | |
| Acer Enduro Urban N3 EUN314 | |
| Durabook R8 Tablet | |
| LibreOffice / 20 Documents To PDF | |
| Acer Enduro Urban N3 EUN314 | |
| Durabook R8 Tablet | |
| Dell Latitude 7230 Rugged Extreme | |
| Dell Latitude 7330 Rugged Extreme | |
| Durchschnittliche Intel Core i7-1260U (45.9 - 51.4, n=2) | |
| Dell Latitude 7350 Detachable | |
| Dell Latitude 7030 Rugged Extreme | |
| R Benchmark 2.5 / Overall mean | |
| Durabook R8 Tablet | |
| Acer Enduro Urban N3 EUN314 | |
| Dell Latitude 7330 Rugged Extreme | |
| Dell Latitude 7230 Rugged Extreme | |
| Dell Latitude 7350 Detachable | |
| Durchschnittliche Intel Core i7-1260U (0.494 - 0.53, n=2) | |
| Dell Latitude 7030 Rugged Extreme | |
* ... kleinere Werte sind besser
AIDA64: FP32 Ray-Trace | FPU Julia | CPU SHA3 | CPU Queen | FPU SinJulia | FPU Mandel | CPU AES | CPU ZLib | FP64 Ray-Trace | CPU PhotoWorxx
| Performance Rating | |
| Dell Latitude 7330 Rugged Extreme | |
| Dell Latitude 7030 Rugged Extreme | |
| Durchschnittliche Intel Core i7-1260U | |
| Acer Enduro Urban N3 EUN314 | |
| Dell Latitude 7230 Rugged Extreme | |
| Dell Latitude 7350 Detachable | |
| Durabook R8 Tablet | |
| AIDA64 / FP32 Ray-Trace | |
| Dell Latitude 7330 Rugged Extreme | |
| Dell Latitude 7030 Rugged Extreme | |
| Durchschnittliche Intel Core i7-1260U (6694 - 7261, n=2) | |
| Acer Enduro Urban N3 EUN314 | |
| Dell Latitude 7230 Rugged Extreme | |
| Dell Latitude 7350 Detachable | |
| Durabook R8 Tablet | |
| AIDA64 / FPU Julia | |
| Dell Latitude 7030 Rugged Extreme | |
| Durchschnittliche Intel Core i7-1260U (33823 - 37371, n=2) | |
| Dell Latitude 7230 Rugged Extreme | |
| Dell Latitude 7330 Rugged Extreme | |
| Dell Latitude 7350 Detachable | |
| Acer Enduro Urban N3 EUN314 | |
| Durabook R8 Tablet | |
| AIDA64 / CPU SHA3 | |
| Dell Latitude 7330 Rugged Extreme | |
| Acer Enduro Urban N3 EUN314 | |
| Dell Latitude 7030 Rugged Extreme | |
| Durchschnittliche Intel Core i7-1260U (1816 - 1949, n=2) | |
| Dell Latitude 7230 Rugged Extreme | |
| Dell Latitude 7350 Detachable | |
| Durabook R8 Tablet | |
| AIDA64 / CPU Queen | |
| Dell Latitude 7030 Rugged Extreme | |
| Dell Latitude 7330 Rugged Extreme | |
| Durchschnittliche Intel Core i7-1260U (50854 - 53090, n=2) | |
| Acer Enduro Urban N3 EUN314 | |
| Dell Latitude 7230 Rugged Extreme | |
| Dell Latitude 7350 Detachable | |
| Durabook R8 Tablet | |
| AIDA64 / FPU SinJulia | |
| Dell Latitude 7330 Rugged Extreme | |
| Acer Enduro Urban N3 EUN314 | |
| Dell Latitude 7350 Detachable | |
| Dell Latitude 7030 Rugged Extreme | |
| Durchschnittliche Intel Core i7-1260U (4067 - 4155, n=2) | |
| Dell Latitude 7230 Rugged Extreme | |
| Durabook R8 Tablet | |
| AIDA64 / FPU Mandel | |
| Dell Latitude 7330 Rugged Extreme | |
| Dell Latitude 7030 Rugged Extreme | |
| Acer Enduro Urban N3 EUN314 | |
| Durchschnittliche Intel Core i7-1260U (16988 - 17918, n=2) | |
| Dell Latitude 7230 Rugged Extreme | |
| Dell Latitude 7350 Detachable | |
| Durabook R8 Tablet | |
| AIDA64 / CPU AES | |
| Dell Latitude 7330 Rugged Extreme | |
| Acer Enduro Urban N3 EUN314 | |
| Dell Latitude 7030 Rugged Extreme | |
| Dell Latitude 7230 Rugged Extreme | |
| Dell Latitude 7350 Detachable | |
| Durchschnittliche Intel Core i7-1260U (33289 - 35061, n=2) | |
| Durabook R8 Tablet | |
| AIDA64 / CPU ZLib | |
| Dell Latitude 7030 Rugged Extreme | |
| Durchschnittliche Intel Core i7-1260U (506 - 586, n=2) | |
| Dell Latitude 7230 Rugged Extreme | |
| Dell Latitude 7350 Detachable | |
| Dell Latitude 7330 Rugged Extreme | |
| Acer Enduro Urban N3 EUN314 | |
| Durabook R8 Tablet | |
| AIDA64 / FP64 Ray-Trace | |
| Dell Latitude 7330 Rugged Extreme | |
| Dell Latitude 7030 Rugged Extreme | |
| Durchschnittliche Intel Core i7-1260U (3666 - 3854, n=2) | |
| Acer Enduro Urban N3 EUN314 | |
| Dell Latitude 7230 Rugged Extreme | |
| Dell Latitude 7350 Detachable | |
| Durabook R8 Tablet | |
| AIDA64 / CPU PhotoWorxx | |
| Dell Latitude 7350 Detachable | |
| Dell Latitude 7330 Rugged Extreme | |
| Dell Latitude 7030 Rugged Extreme | |
| Durchschnittliche Intel Core i7-1260U (37448 - 37790, n=2) | |
| Dell Latitude 7230 Rugged Extreme | |
| Acer Enduro Urban N3 EUN314 | |
| Durabook R8 Tablet | |
Stresstest
Die CPU wurde auf 2,4 GHz und 30 W hochgefahren, als der Prime95-Stresstest gestartet wurde. Nach etwa einer Minute, als die Kerntemperatur 100 °C erreichte, reduzierte die CPU jedoch ihre Frequenz auf 2,2 GHz und die Leistung auf 22 W, um eine handlichere Kerntemperatur von 92 °C aufrechtzuerhalten. So oder so läuft die CPU sehr warm, was zu den hohen Oberflächentemperaturen beiträgt.
Bei einem Test mit Cyberpunk 2077 stabilisierte sich die CPU bei 79 °C und war damit sogar wärmer als beim Latitude 7350 Detachable.
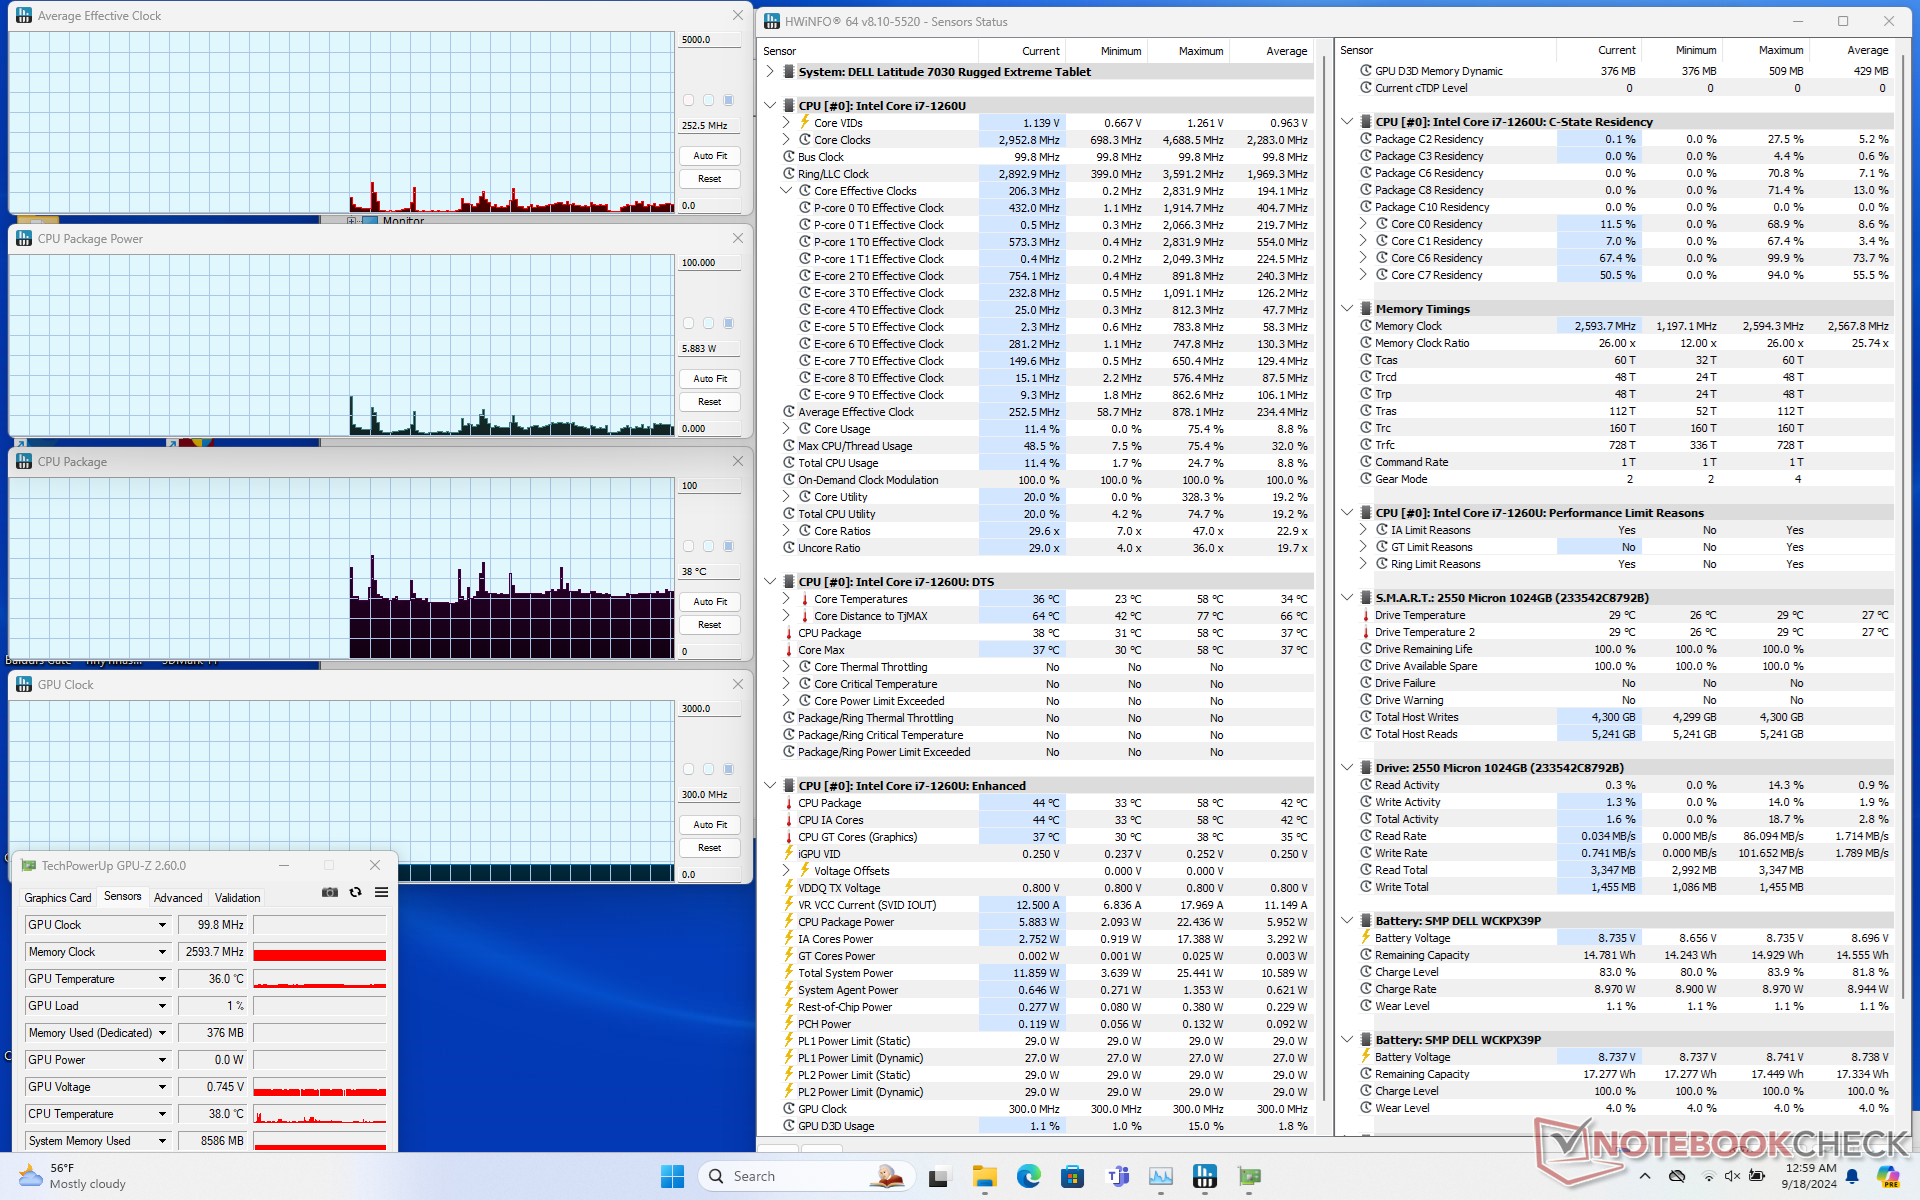
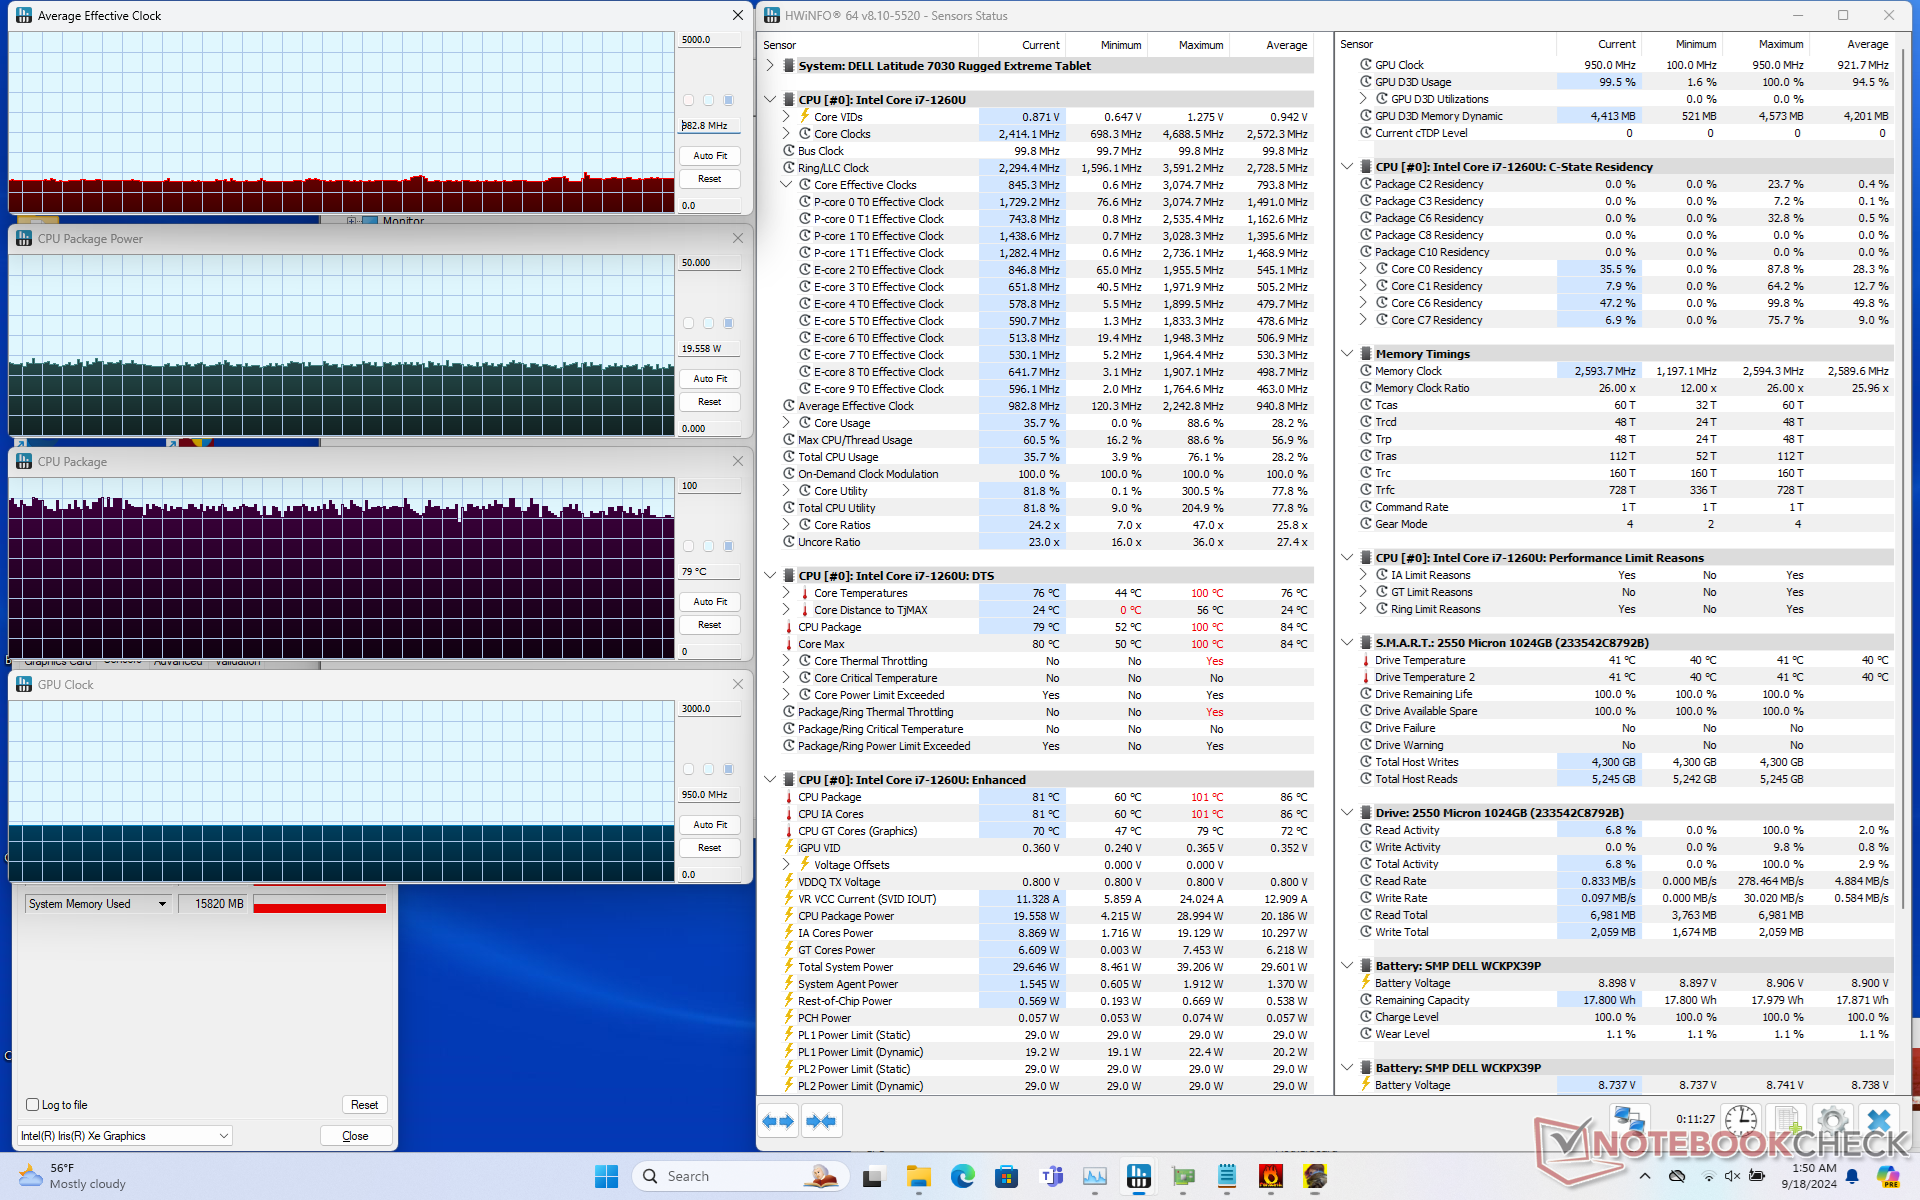
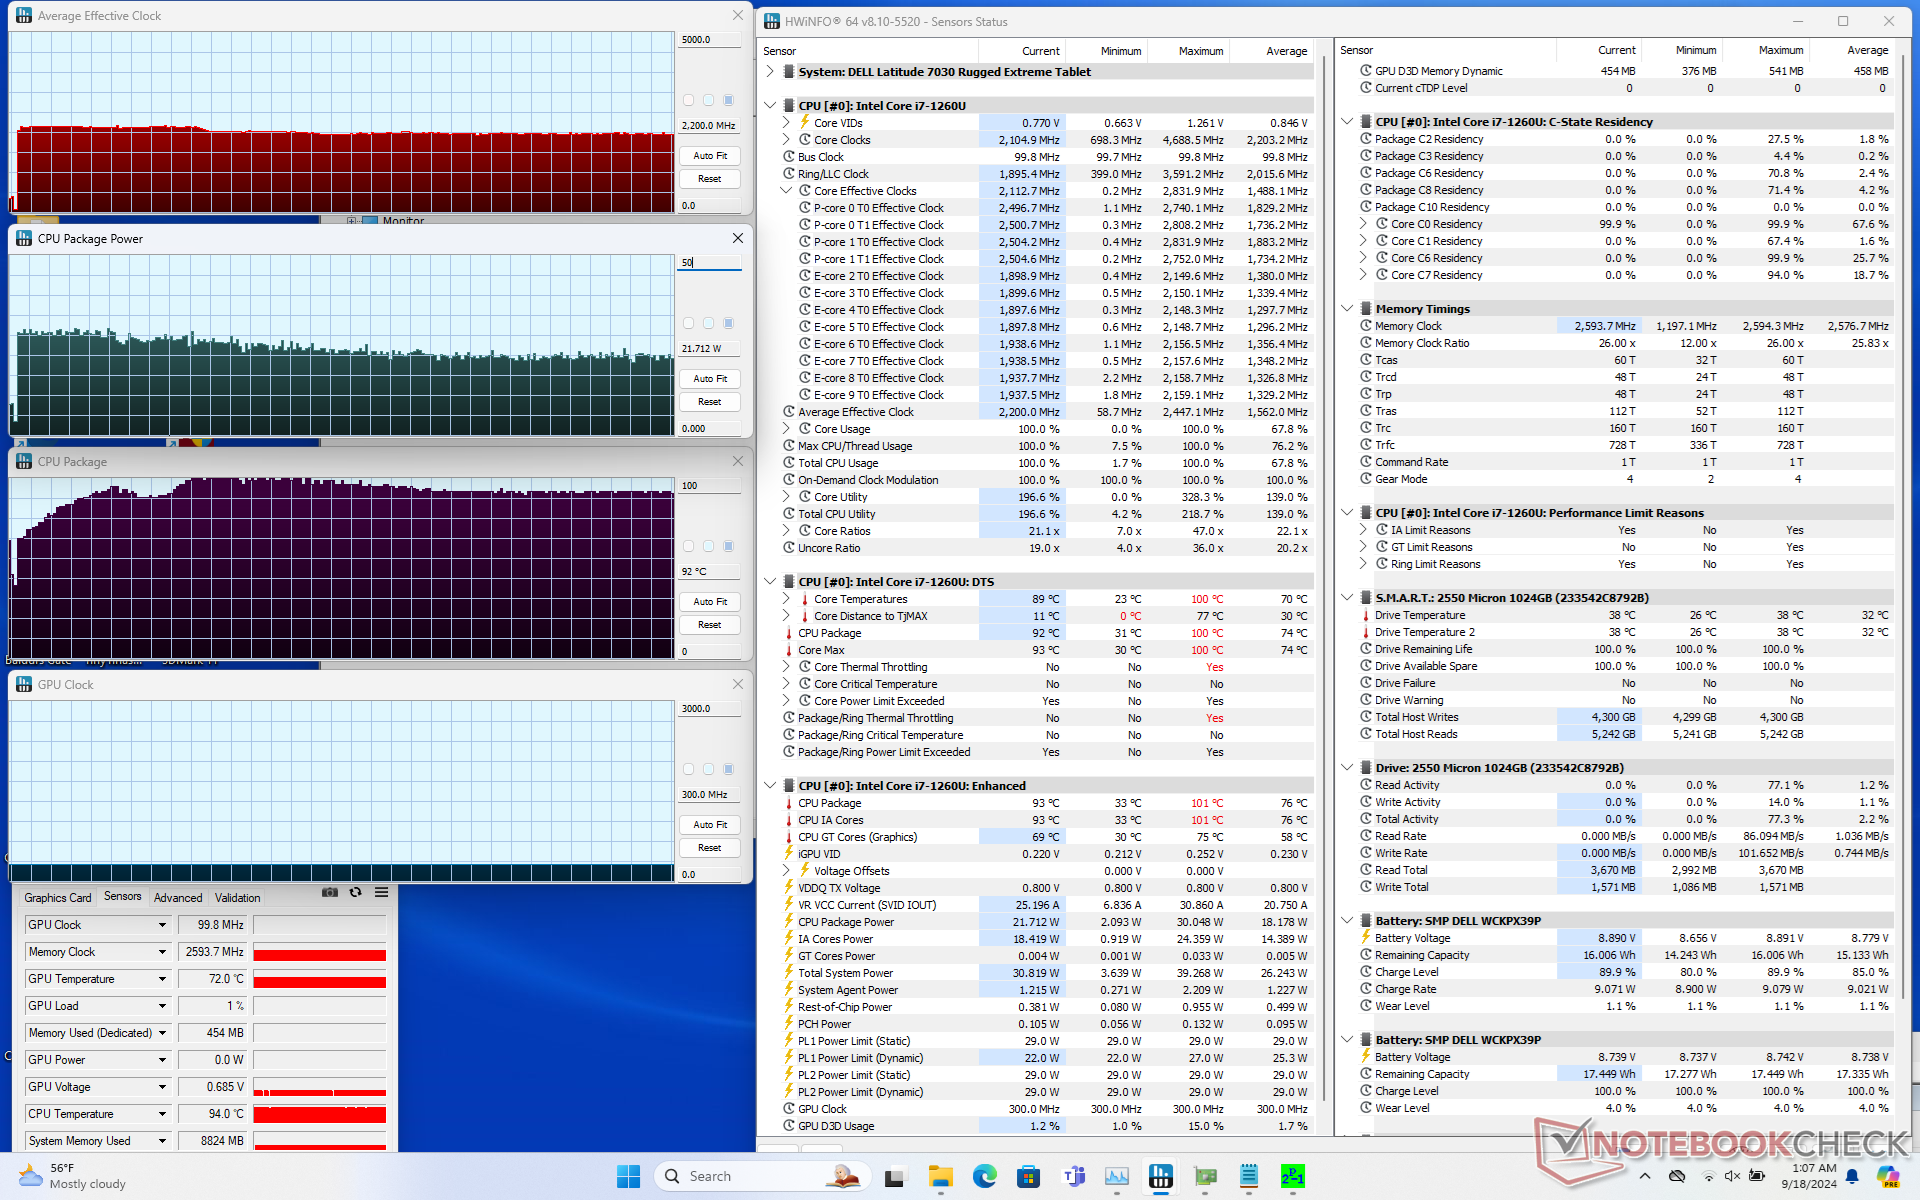
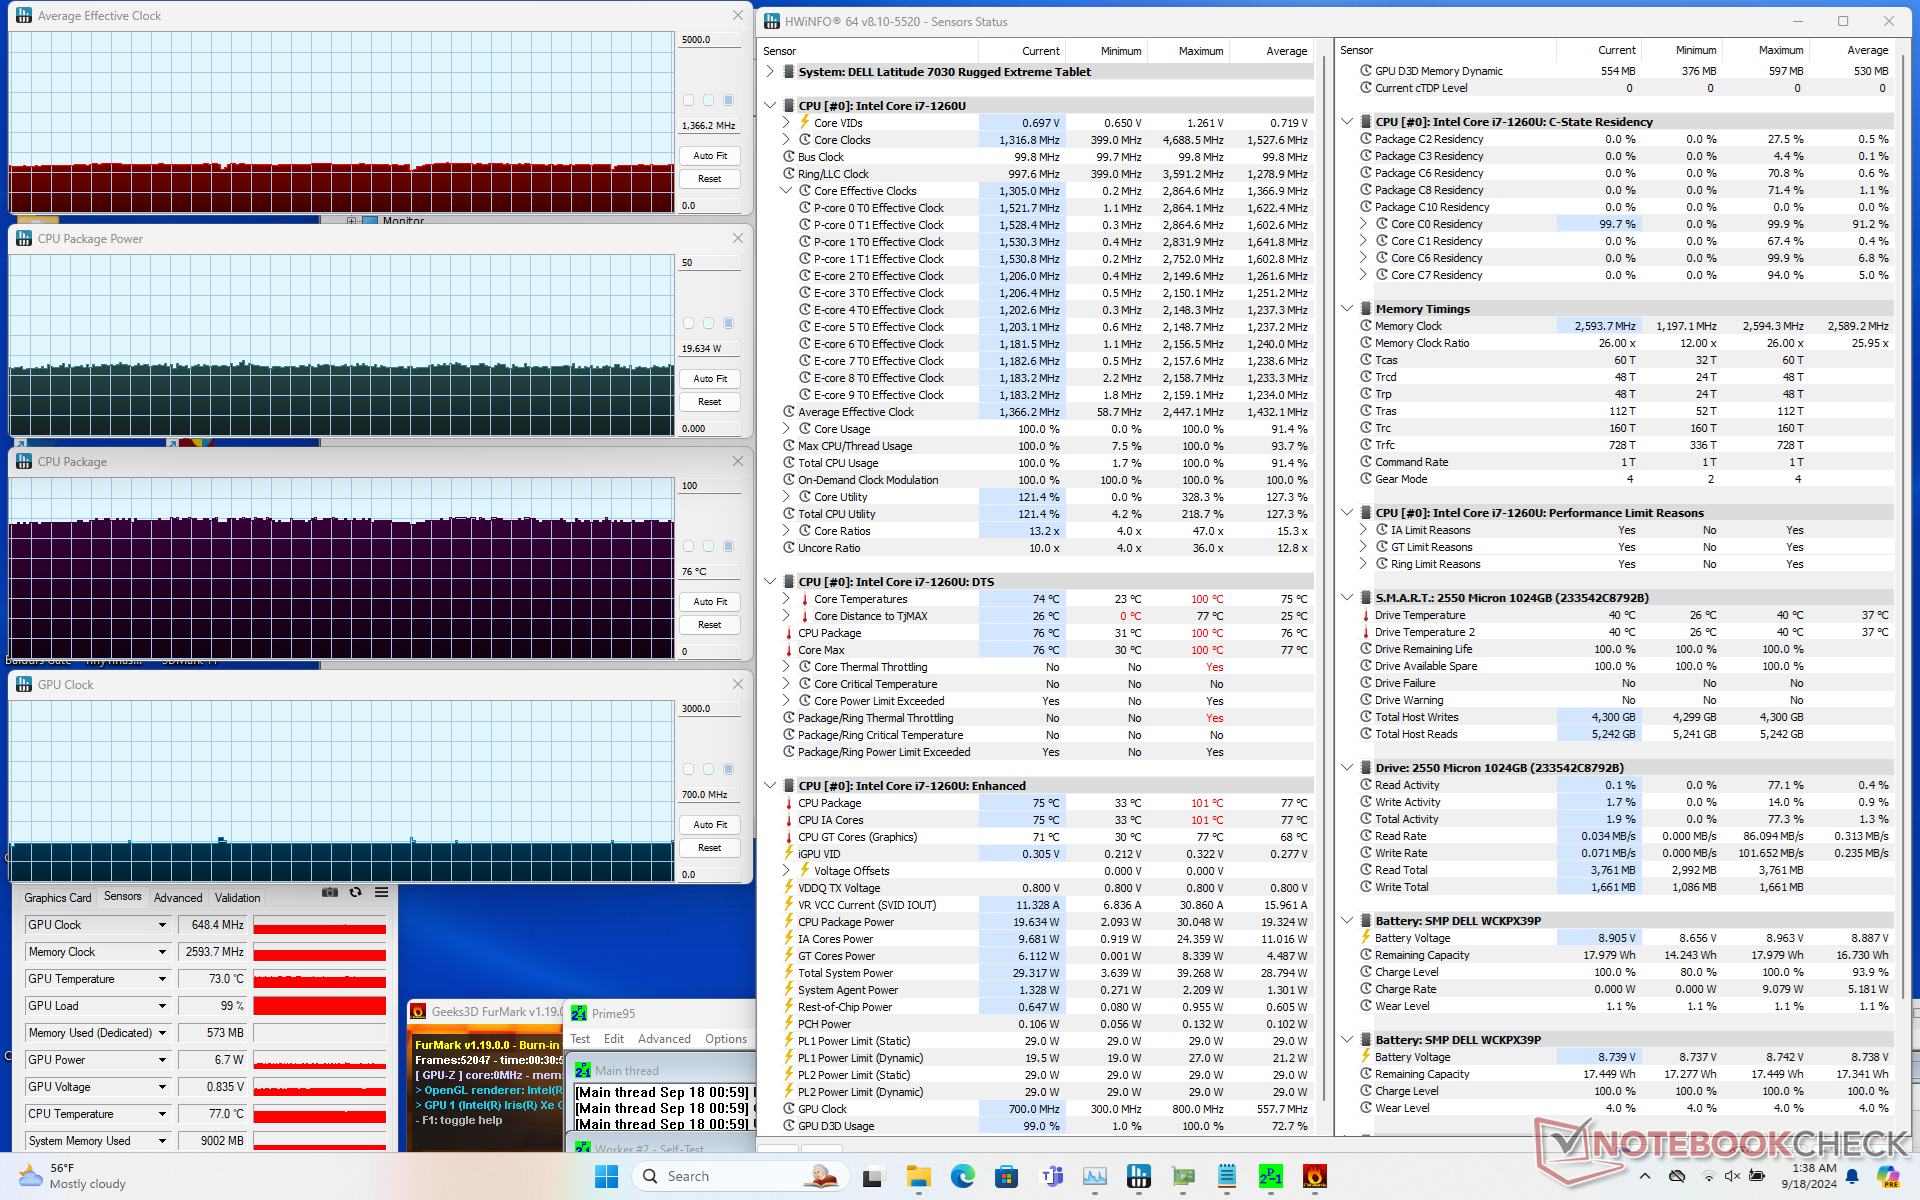
| Durchschnittlicher CPU-Takt (GHz) | GPU-Takt (MHz) | Durchschnittliche CPU-Temperatur (°C) | |
| System im Leerlauf | -- | -- | 38 |
| Prime95 Stresstest | 2.2 | -- | 92 |
| Prime95 + FurMark Stresstest | 1.4 | 700 | 76 |
| Cyberpunk 2077 Stresstest | 1.0 | 950 | 79 |
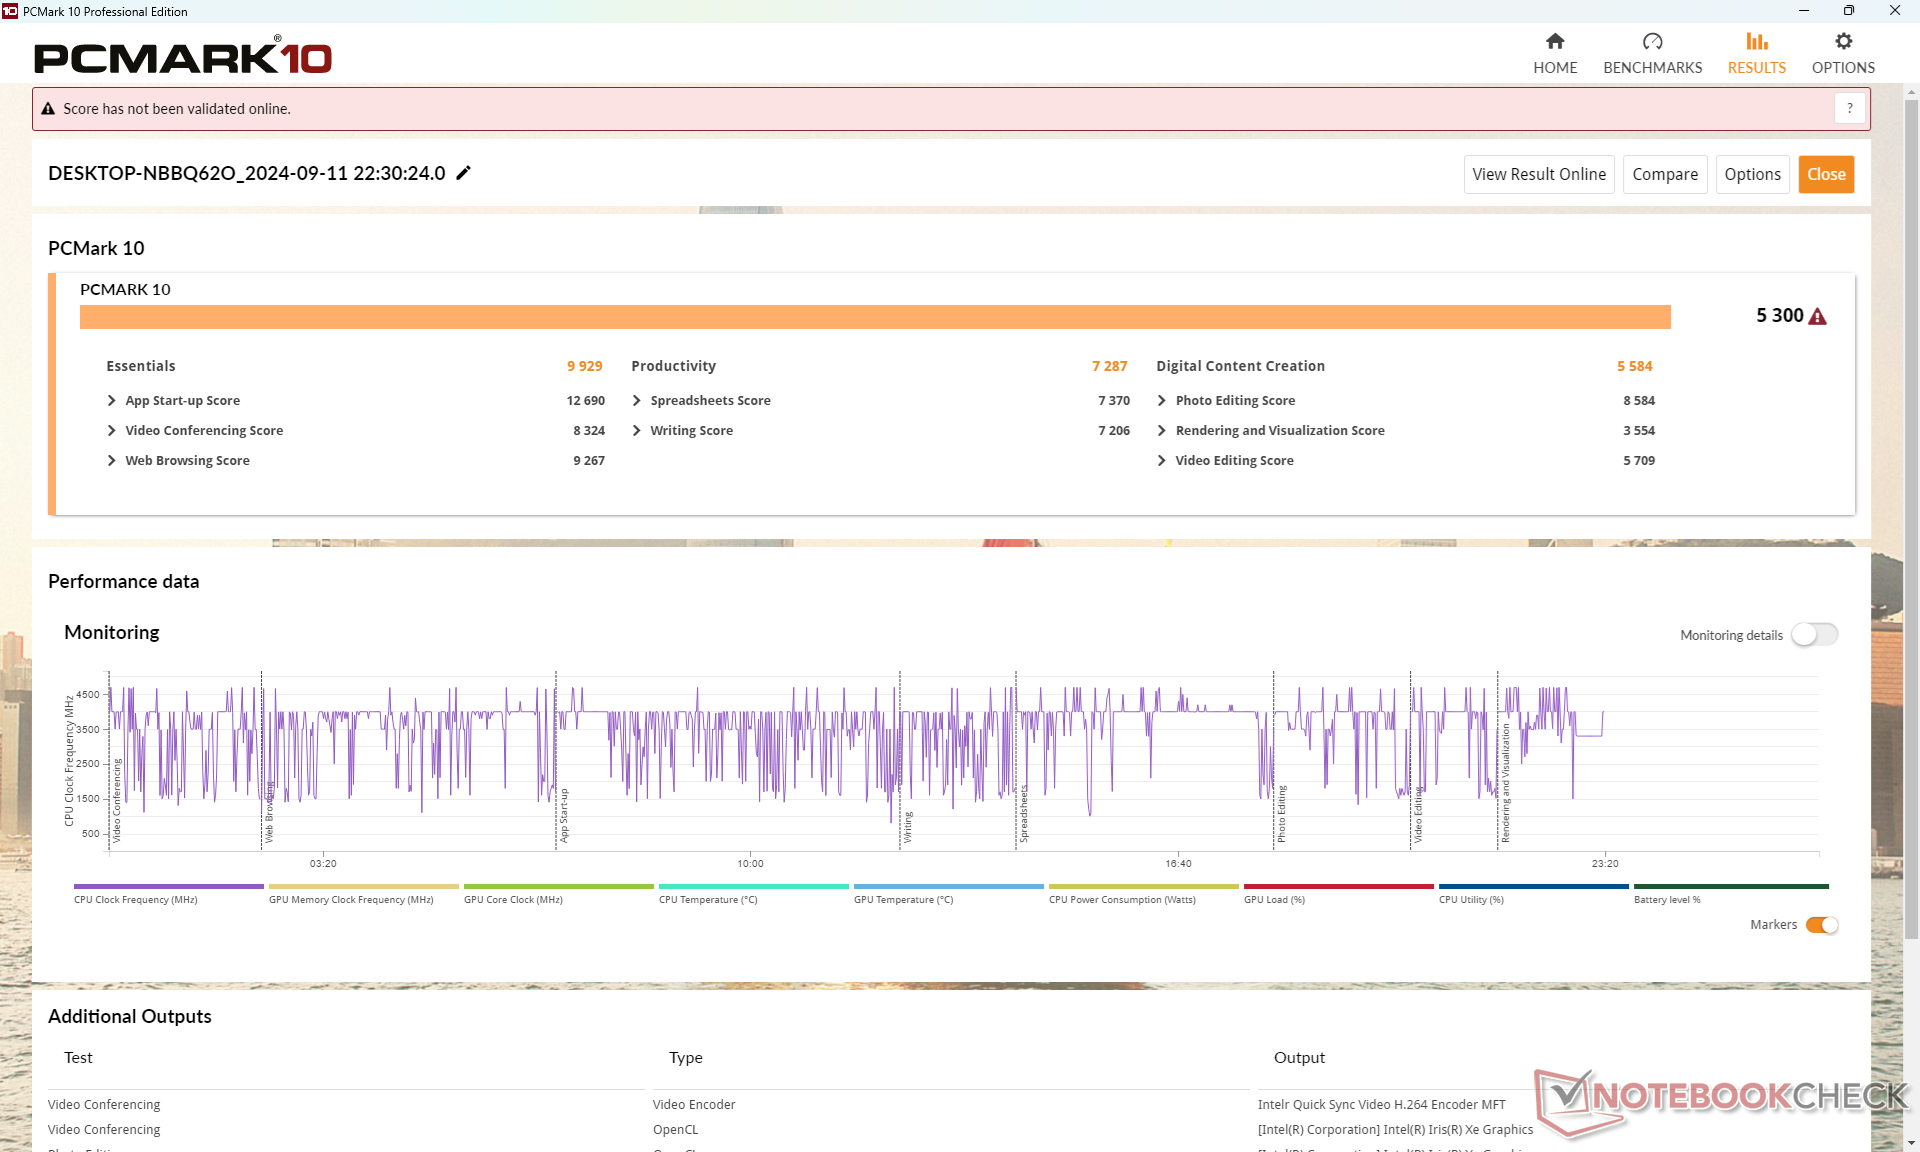
System Performance
CrossMark: Overall | Productivity | Creativity | Responsiveness
WebXPRT 3: Overall
WebXPRT 4: Overall
Mozilla Kraken 1.1: Total
| PCMark 10 / Score | |
| Dell Latitude 7350 Detachable | |
| Dell Latitude 7030 Rugged Extreme | |
| Dell Latitude 7330 Rugged Extreme | |
| Durchschnittliche Intel Core i7-1260U, Intel Iris Xe Graphics G7 96EUs (5182 - 5300, n=2) | |
| Dell Latitude 7230 Rugged Extreme | |
| Acer Enduro Urban N3 EUN314 | |
| Durabook R8 Tablet | |
| PCMark 10 / Essentials | |
| Dell Latitude 7350 Detachable | |
| Dell Latitude 7330 Rugged Extreme | |
| Durchschnittliche Intel Core i7-1260U, Intel Iris Xe Graphics G7 96EUs (9929 - 10179, n=2) | |
| Dell Latitude 7030 Rugged Extreme | |
| Dell Latitude 7230 Rugged Extreme | |
| Acer Enduro Urban N3 EUN314 | |
| Durabook R8 Tablet | |
| PCMark 10 / Productivity | |
| Dell Latitude 7350 Detachable | |
| Dell Latitude 7030 Rugged Extreme | |
| Durchschnittliche Intel Core i7-1260U, Intel Iris Xe Graphics G7 96EUs (7056 - 7287, n=2) | |
| Dell Latitude 7330 Rugged Extreme | |
| Dell Latitude 7230 Rugged Extreme | |
| Acer Enduro Urban N3 EUN314 | |
| Durabook R8 Tablet | |
| PCMark 10 / Digital Content Creation | |
| Dell Latitude 7350 Detachable | |
| Dell Latitude 7330 Rugged Extreme | |
| Dell Latitude 7030 Rugged Extreme | |
| Durchschnittliche Intel Core i7-1260U, Intel Iris Xe Graphics G7 96EUs (5258 - 5584, n=2) | |
| Acer Enduro Urban N3 EUN314 | |
| Dell Latitude 7230 Rugged Extreme | |
| Durabook R8 Tablet | |
| CrossMark / Overall | |
| Dell Latitude 7030 Rugged Extreme | |
| Durchschnittliche Intel Core i7-1260U, Intel Iris Xe Graphics G7 96EUs (n=1) | |
| Dell Latitude 7230 Rugged Extreme | |
| Dell Latitude 7350 Detachable | |
| Durabook R8 Tablet | |
| CrossMark / Productivity | |
| Dell Latitude 7030 Rugged Extreme | |
| Durchschnittliche Intel Core i7-1260U, Intel Iris Xe Graphics G7 96EUs (n=1) | |
| Dell Latitude 7350 Detachable | |
| Dell Latitude 7230 Rugged Extreme | |
| Durabook R8 Tablet | |
| CrossMark / Creativity | |
| Dell Latitude 7030 Rugged Extreme | |
| Durchschnittliche Intel Core i7-1260U, Intel Iris Xe Graphics G7 96EUs (n=1) | |
| Dell Latitude 7230 Rugged Extreme | |
| Dell Latitude 7350 Detachable | |
| Durabook R8 Tablet | |
| CrossMark / Responsiveness | |
| Dell Latitude 7350 Detachable | |
| Dell Latitude 7030 Rugged Extreme | |
| Durchschnittliche Intel Core i7-1260U, Intel Iris Xe Graphics G7 96EUs (n=1) | |
| Dell Latitude 7230 Rugged Extreme | |
| Durabook R8 Tablet | |
| WebXPRT 3 / Overall | |
| Dell Latitude 7230 Rugged Extreme | |
| Dell Latitude 7030 Rugged Extreme | |
| Dell Latitude 7330 Rugged Extreme | |
| Durchschnittliche Intel Core i7-1260U, Intel Iris Xe Graphics G7 96EUs (236 - 256, n=2) | |
| Dell Latitude 7350 Detachable | |
| Durabook R8 Tablet | |
| Acer Enduro Urban N3 EUN314 | |
| WebXPRT 4 / Overall | |
| Dell Latitude 7350 Detachable | |
| Dell Latitude 7030 Rugged Extreme | |
| Dell Latitude 7230 Rugged Extreme | |
| Durchschnittliche Intel Core i7-1260U, Intel Iris Xe Graphics G7 96EUs (213 - 222, n=2) | |
| Durabook R8 Tablet | |
| Mozilla Kraken 1.1 / Total | |
| Acer Enduro Urban N3 EUN314 | |
| Dell Latitude 7330 Rugged Extreme | |
| Durabook R8 Tablet | |
| Dell Latitude 7230 Rugged Extreme | |
| Dell Latitude 7350 Detachable | |
| Dell Latitude 7030 Rugged Extreme | |
| Durchschnittliche Intel Core i7-1260U, Intel Iris Xe Graphics G7 96EUs (572 - 583, n=2) | |
* ... kleinere Werte sind besser
| PCMark 10 Score | 5300 Punkte | |
Hilfe | ||
| AIDA64 / Memory Copy | |
| Dell Latitude 7350 Detachable | |
| Durchschnittliche Intel Core i7-1260U (68849 - 69994, n=2) | |
| Dell Latitude 7030 Rugged Extreme | |
| Dell Latitude 7230 Rugged Extreme | |
| Dell Latitude 7330 Rugged Extreme | |
| Acer Enduro Urban N3 EUN314 | |
| Durabook R8 Tablet | |
| AIDA64 / Memory Read | |
| Dell Latitude 7330 Rugged Extreme | |
| Durchschnittliche Intel Core i7-1260U (59219 - 60804, n=2) | |
| Dell Latitude 7030 Rugged Extreme | |
| Dell Latitude 7230 Rugged Extreme | |
| Dell Latitude 7350 Detachable | |
| Acer Enduro Urban N3 EUN314 | |
| Durabook R8 Tablet | |
| AIDA64 / Memory Write | |
| Dell Latitude 7330 Rugged Extreme | |
| Durchschnittliche Intel Core i7-1260U (62367 - 63786, n=2) | |
| Dell Latitude 7230 Rugged Extreme | |
| Dell Latitude 7030 Rugged Extreme | |
| Dell Latitude 7350 Detachable | |
| Acer Enduro Urban N3 EUN314 | |
| Durabook R8 Tablet | |
| AIDA64 / Memory Latency | |
| Dell Latitude 7350 Detachable | |
| Dell Latitude 7230 Rugged Extreme | |
| Durchschnittliche Intel Core i7-1260U (107.2 - 107.7, n=2) | |
| Dell Latitude 7030 Rugged Extreme | |
| Durabook R8 Tablet | |
| Dell Latitude 7330 Rugged Extreme | |
| Acer Enduro Urban N3 EUN314 | |
* ... kleinere Werte sind besser
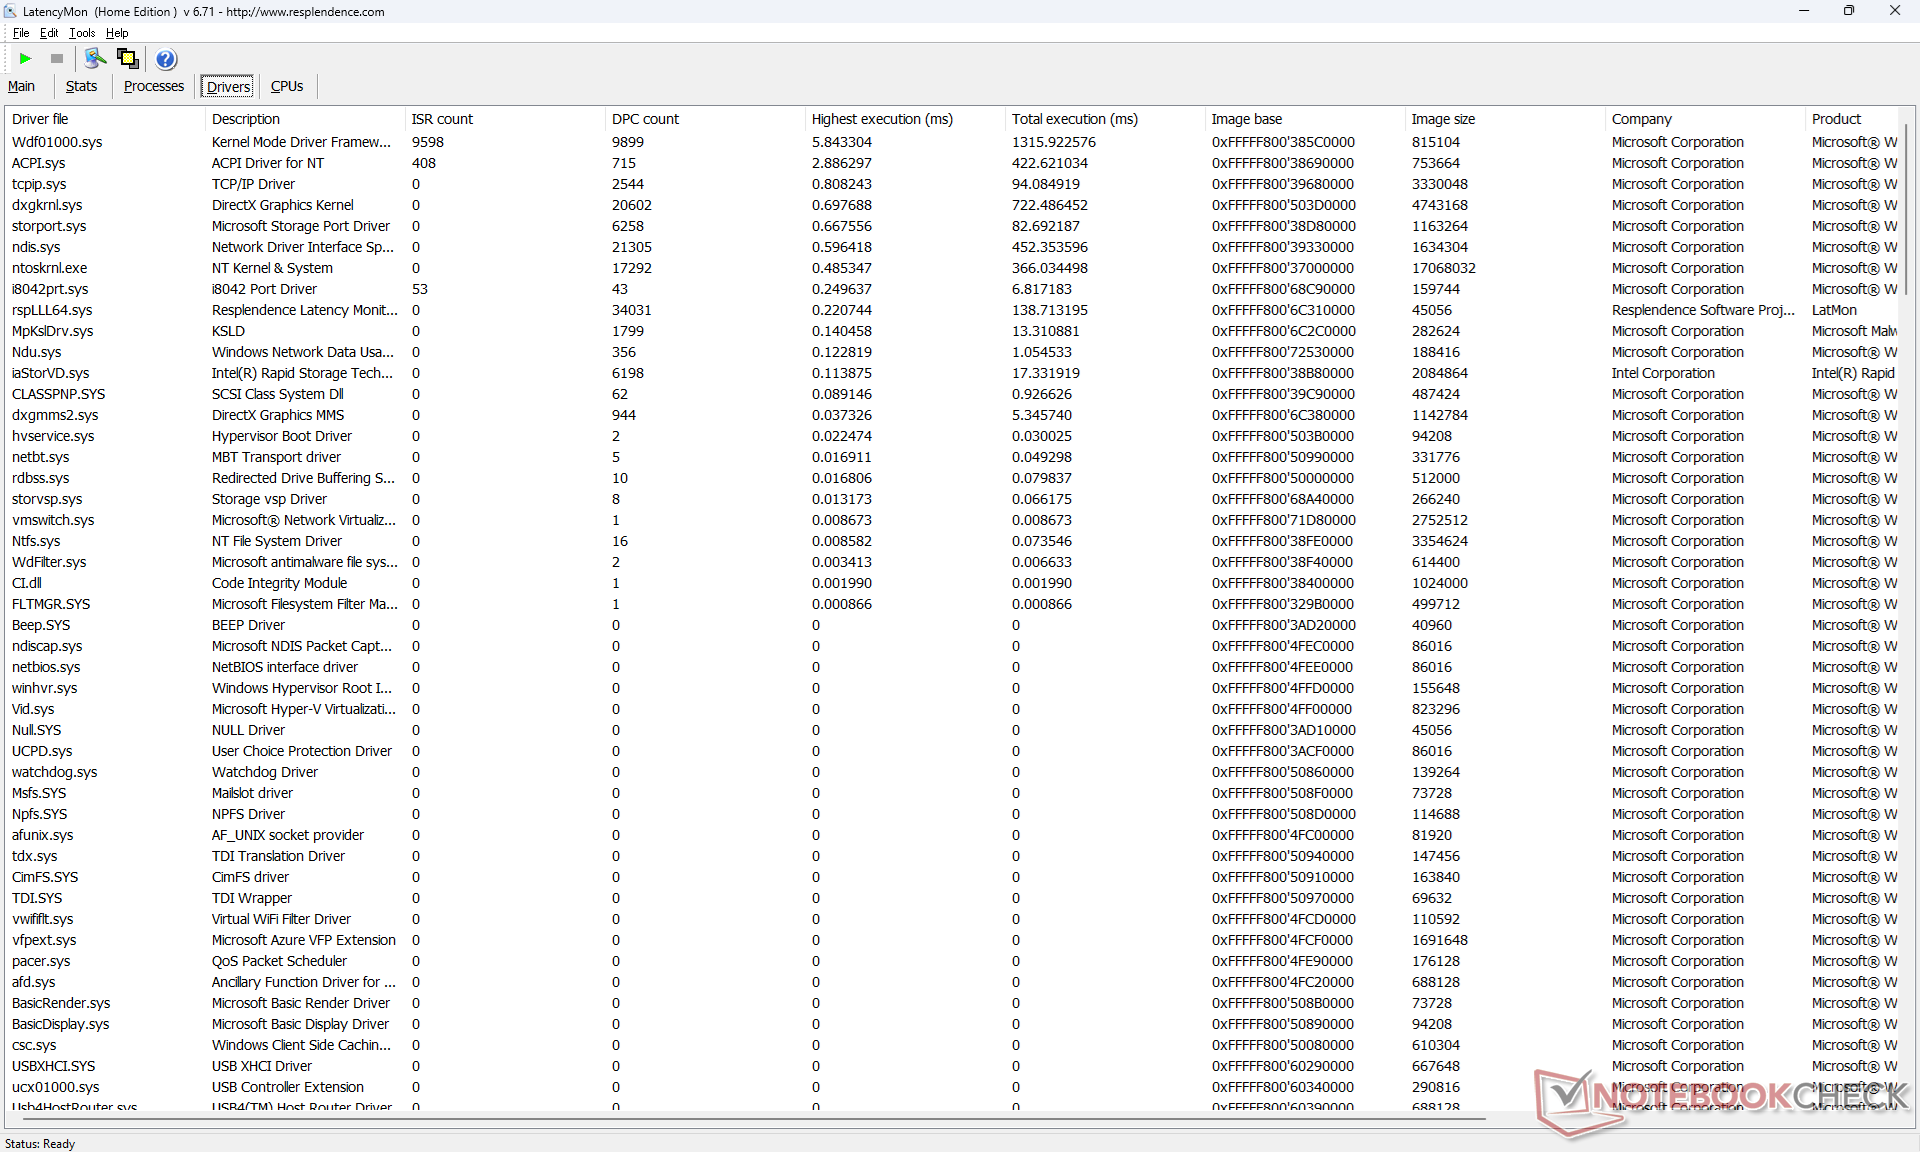
DPC-Latenzen
LatencyMon zeigt DPC-Probleme und verzeichnete während unseres 60 Sekunden langen 4K60-Videowiedergabetests sieben verlorene Frames.
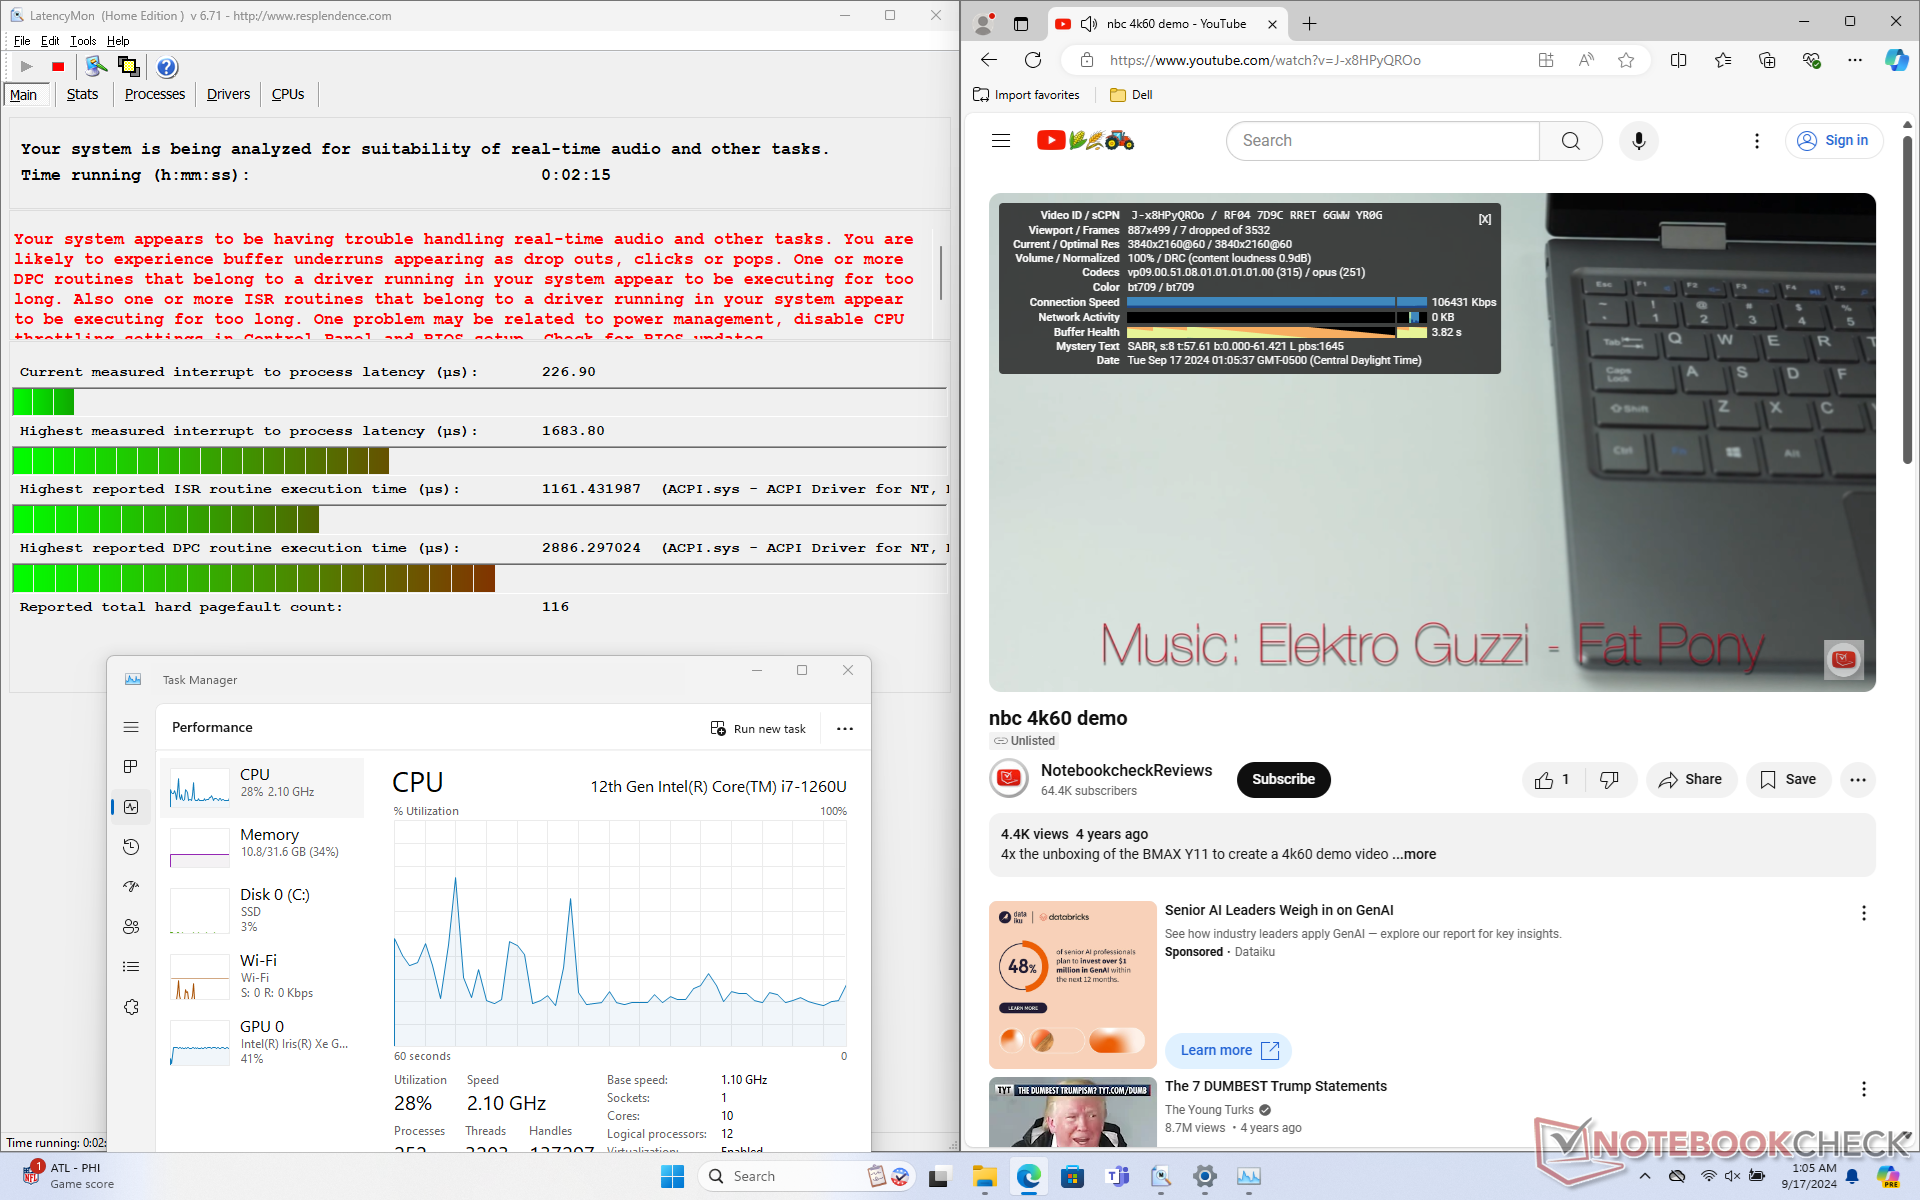
| DPC Latencies / LatencyMon - interrupt to process latency (max), Web, Youtube, Prime95 | |
| Acer Enduro Urban N3 EUN314 | |
| Dell Latitude 7230 Rugged Extreme | |
| Dell Latitude 7030 Rugged Extreme | |
| Dell Latitude 7350 Detachable | |
| Durabook R8 Tablet | |
| Dell Latitude 7330 Rugged Extreme | |
* ... kleinere Werte sind besser
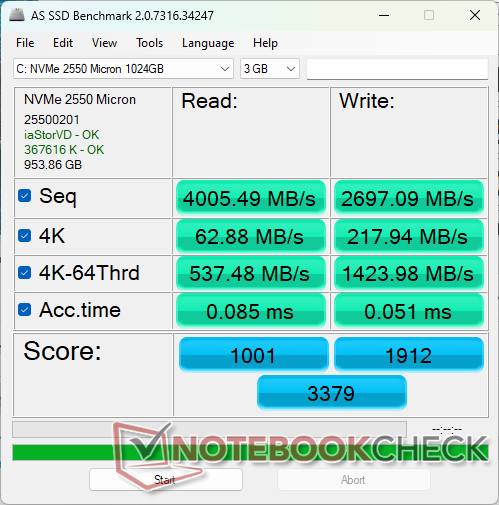
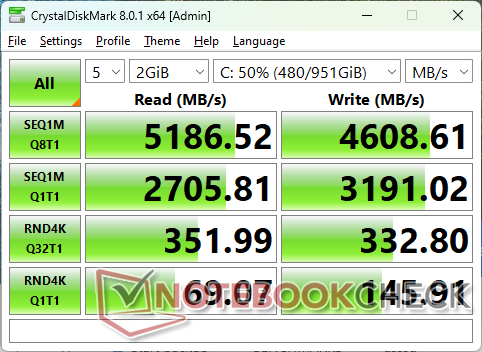
Massenspeicher
Unser Gerät ist mit der gleichen Micron 2550 PCIe4 x4 NVMe SSD ausgestattet, die auch im aktuellen Latitude 7350 Detachable zu finden ist. Die Leistung übertrifft die der WD PC SN740 im Latitude 7230 Rugged Extreme und bleibt über die Zeit hinweg konstant, ohne Drosselung.
Es werden ausschließlich kleine M.2 2230 SSDs mit optionalen SED-Konfigurationen unterstützt.

| Drive Performance Rating - Percent | |
| Dell Latitude 7330 Rugged Extreme | |
| Dell Latitude 7030 Rugged Extreme | |
| Dell Latitude 7350 Detachable | |
| Dell Latitude 7230 Rugged Extreme | |
| Acer Enduro Urban N3 EUN314 | |
| Durabook R8 Tablet | |
* ... kleinere Werte sind besser
Dauerleistung Lesen: DiskSpd Read Loop, Queue Depth 8
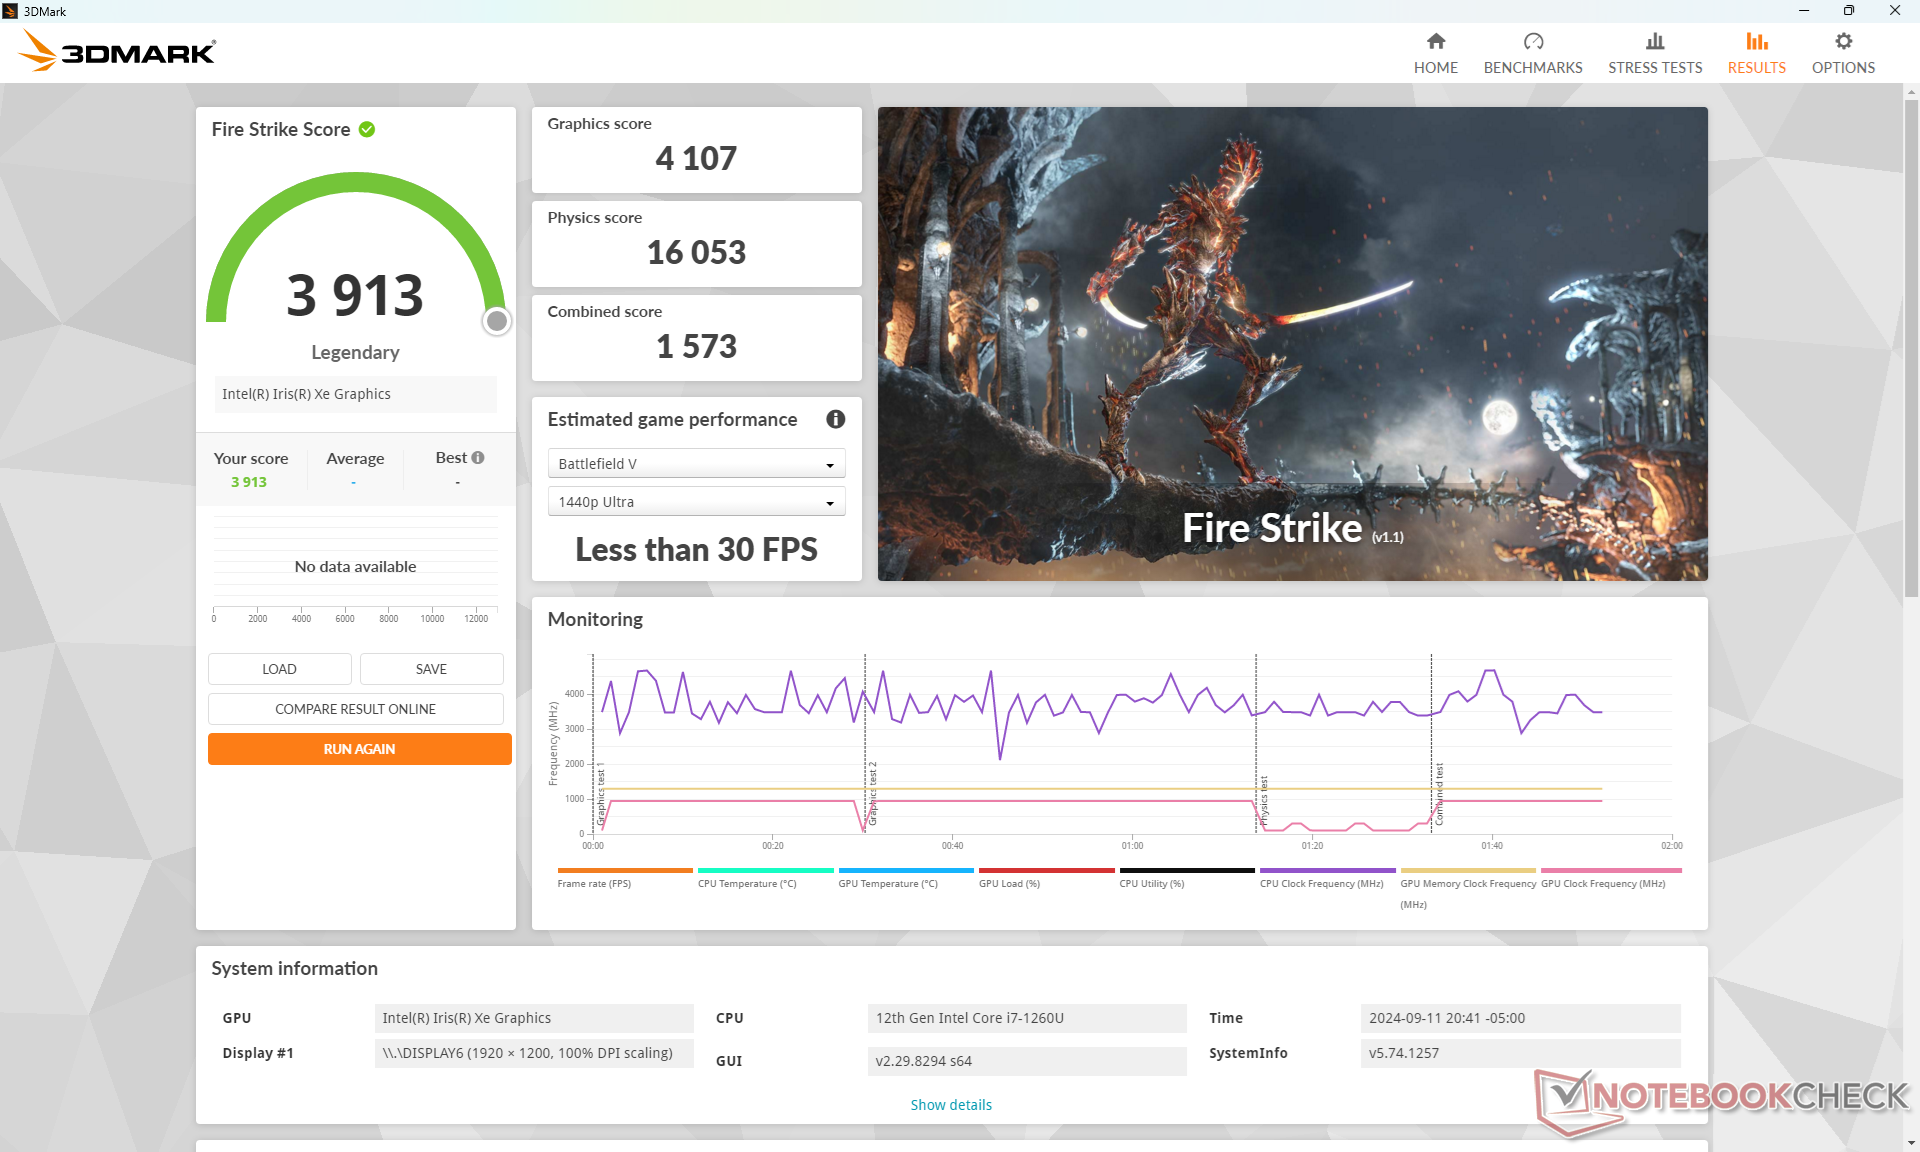
GPU Performance
Die integrierte Iris Xe 96 EUs überrascht nicht, da es sich um eine ältere GPU handelt, die in vielen anderen PCs mit CPUs der Core-U-Serie zu finden ist. Im Latitude 7030 Rugged Extreme läuft sie jedoch etwa 20 Prozent langsamer als der durchschnittliche Laptop in unserer Datenbank, der mit derselben GPU ausgestattet ist.
| Energieprofile | Grafikleistung | CPU-Leistung | Gesamtwert |
| Performance-Modus | 4107 | 16053 | 1573 |
| Balanced-Modus | 4090 (-0%) | 16077 (-0%) | 1581 (-0%) |
| Battery Power | 3973 (-3%) | 10424 (-35%) | 1263 (-20%) |
Der Betrieb im Balanced-Modus anstelle des Performance-Modus hat laut unserer obigen Fire-Strike-Ergebnistabelle keine Auswirkungen auf die Leistung. Allerdings wird die Prozessorleistung im Battery Power-Betrieb deutlich reduziert.
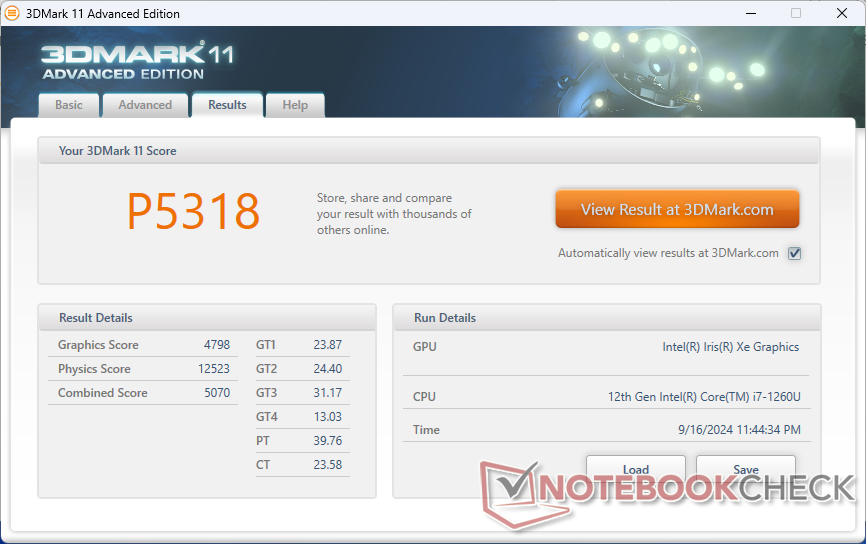
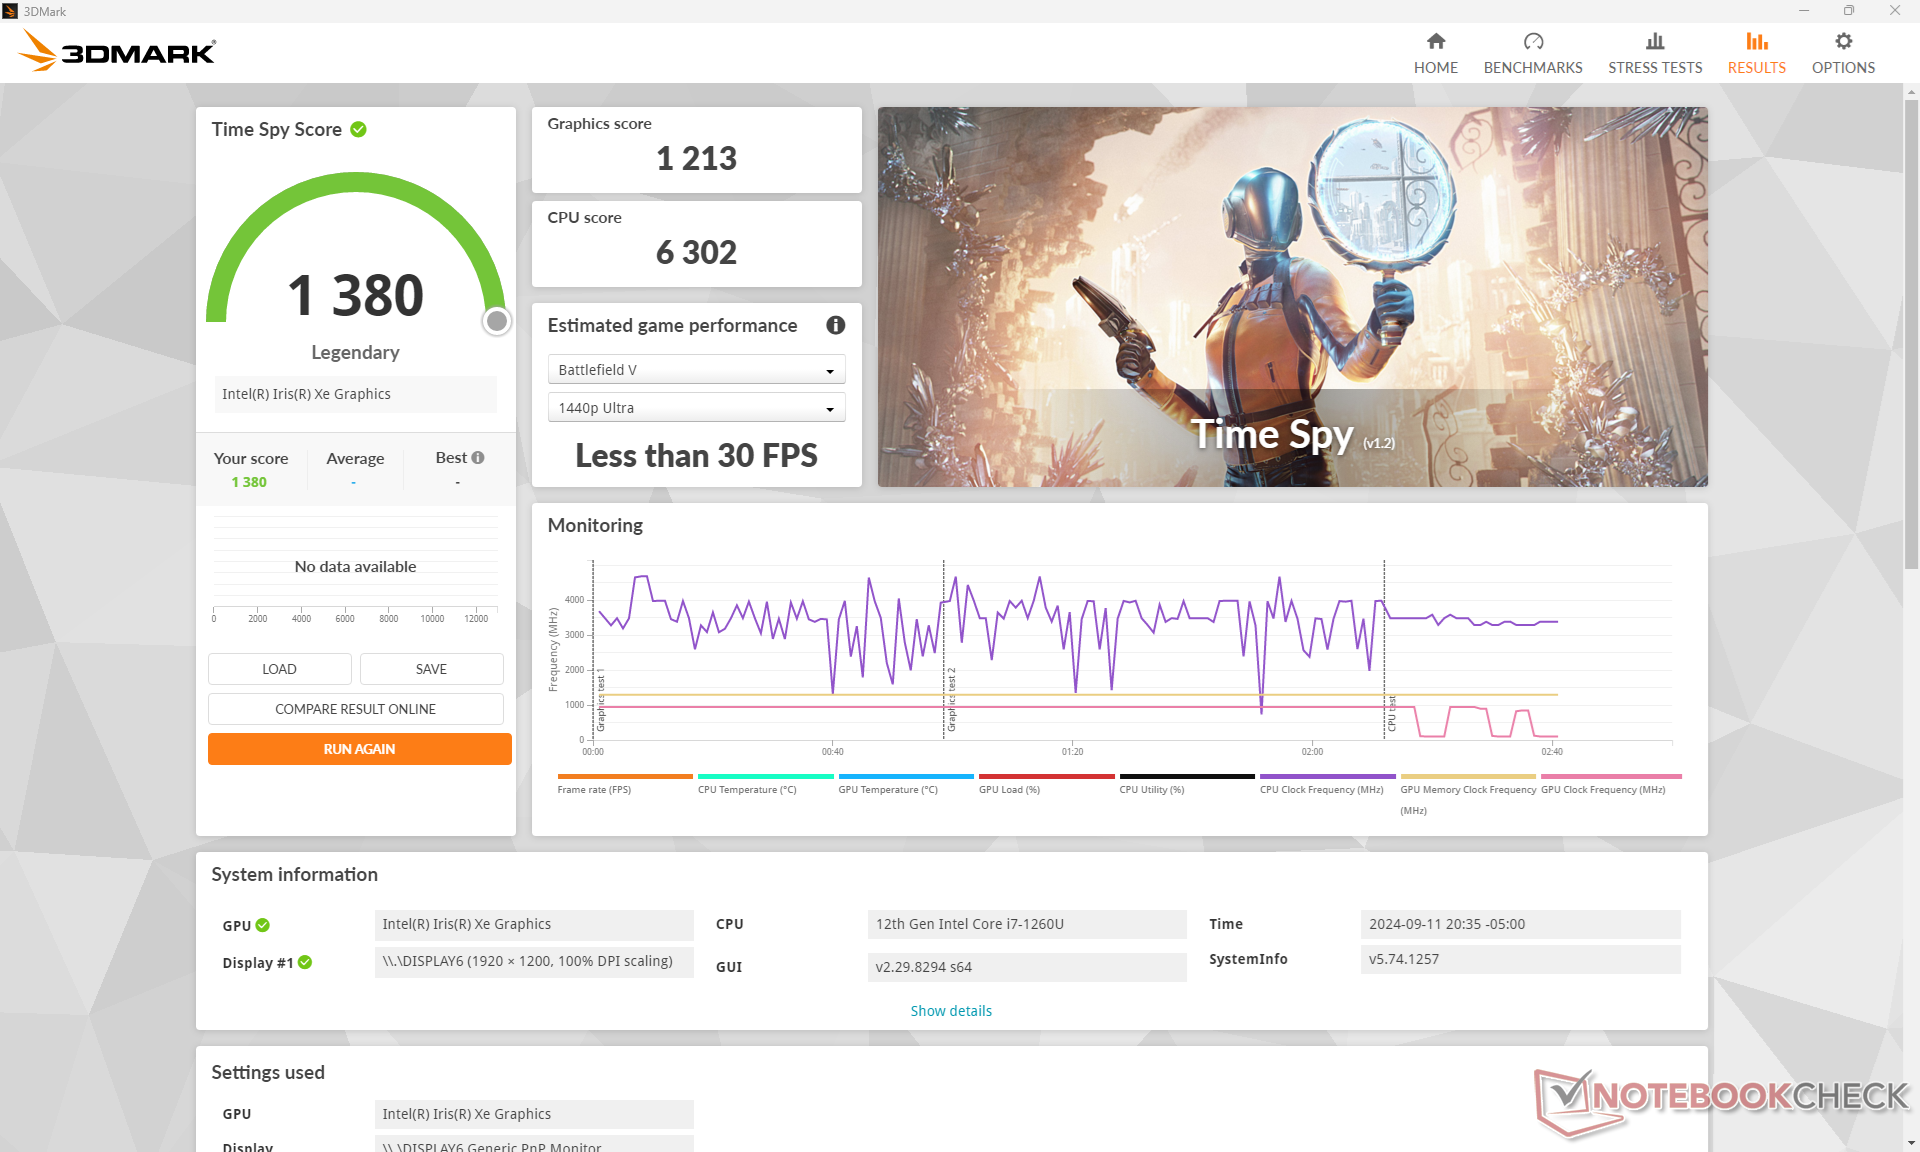
| 3DMark 11 Performance | 5318 Punkte | |
| 3DMark Cloud Gate Standard Score | 14930 Punkte | |
| 3DMark Fire Strike Score | 3913 Punkte | |
| 3DMark Time Spy Score | 1380 Punkte | |
Hilfe | ||
| Blender | |
| v3.3 Classroom CPU | |
| Durabook R8 Tablet | |
| Dell Latitude 7350 Detachable | |
| Dell Latitude 7230 Rugged Extreme | |
| Dell Latitude 7030 Rugged Extreme | |
| Durchschnittliche Intel Iris Xe Graphics G7 96EUs (336 - 1259, n=109) | |
| v3.3 Classroom oneAPI/Intel | |
| Dell Latitude 7350 Detachable | |
* ... kleinere Werte sind besser
| Performance Rating - Percent | |
| Dell Latitude 7330 Rugged Extreme -3! | |
| Acer Enduro Urban N3 EUN314 | |
| Dell Latitude 7350 Detachable | |
| Dell Latitude 7030 Rugged Extreme | |
| Dell Latitude 7230 Rugged Extreme -1! | |
| Durabook R8 Tablet -4! | |
| GTA V - 1920x1080 Highest AA:4xMSAA + FX AF:16x | |
| Dell Latitude 7030 Rugged Extreme | |
| Acer Enduro Urban N3 EUN314 | |
| Dell Latitude 7230 Rugged Extreme | |
| Dell Latitude 7350 Detachable | |
| Final Fantasy XV Benchmark - 1920x1080 High Quality | |
| Dell Latitude 7330 Rugged Extreme | |
| Acer Enduro Urban N3 EUN314 | |
| Dell Latitude 7350 Detachable | |
| Dell Latitude 7030 Rugged Extreme | |
| Dell Latitude 7230 Rugged Extreme | |
| Strange Brigade - 1920x1080 ultra AA:ultra AF:16 | |
| Dell Latitude 7350 Detachable | |
| Acer Enduro Urban N3 EUN314 | |
| Dell Latitude 7030 Rugged Extreme | |
| Dell Latitude 7230 Rugged Extreme | |
| Dota 2 Reborn - 1920x1080 ultra (3/3) best looking | |
| Dell Latitude 7330 Rugged Extreme | |
| Dell Latitude 7030 Rugged Extreme | |
| Dell Latitude 7350 Detachable | |
| Dell Latitude 7230 Rugged Extreme | |
| Acer Enduro Urban N3 EUN314 | |
| Durabook R8 Tablet | |
| X-Plane 11.11 - 1920x1080 high (fps_test=3) | |
| Acer Enduro Urban N3 EUN314 | |
| Dell Latitude 7350 Detachable | |
| Dell Latitude 7030 Rugged Extreme | |
| Dell Latitude 7330 Rugged Extreme | |
| Dell Latitude 7230 Rugged Extreme | |
| Durabook R8 Tablet | |
| Far Cry 5 - 1920x1080 Ultra Preset AA:T | |
| Dell Latitude 7350 Detachable | |
| Dell Latitude 7030 Rugged Extreme | |
| Acer Enduro Urban N3 EUN314 | |
| Baldur's Gate 3 | |
| 1280x720 Low Preset AA:SM | |
| Durchschnittliche Intel Iris Xe Graphics G7 96EUs (14.5 - 66.1, n=13) | |
| Dell Latitude 7350 Detachable | |
| Dell Latitude 7030 Rugged Extreme | |
| 1920x1080 Low Preset AA:SM | |
| Durchschnittliche Intel Iris Xe Graphics G7 96EUs (9.4 - 29.3, n=13) | |
| Dell Latitude 7350 Detachable | |
| Dell Latitude 7030 Rugged Extreme | |
| Tiny Tina's Wonderlands | |
| 1280x720 Lowest Preset (DX12) | |
| Dell Latitude 7350 Detachable | |
| Durchschnittliche Intel Iris Xe Graphics G7 96EUs (25.9 - 67.3, n=32) | |
| Dell Latitude 7030 Rugged Extreme | |
| 1920x1080 Low Preset (DX12) | |
| Durchschnittliche Intel Iris Xe Graphics G7 96EUs (22.3 - 53, n=32) | |
| Dell Latitude 7350 Detachable | |
| Dell Latitude 7030 Rugged Extreme | |
| 1920x1080 Medium Preset (DX12) | |
| Durchschnittliche Intel Iris Xe Graphics G7 96EUs (17 - 40.1, n=30) | |
| Dell Latitude 7030 Rugged Extreme | |
| 1920x1080 High Preset (DX12) | |
| Durchschnittliche Intel Iris Xe Graphics G7 96EUs (10.6 - 24.1, n=29) | |
| Dell Latitude 7030 Rugged Extreme | |
| 1920x1080 Badass Preset (DX12) | |
| Durchschnittliche Intel Iris Xe Graphics G7 96EUs (8.4 - 18.4, n=26) | |
| Dell Latitude 7030 Rugged Extreme | |
| F1 22 | |
| 1280x720 Ultra Low Preset AA:T AF:16x | |
| Durchschnittliche Intel Iris Xe Graphics G7 96EUs (57.4 - 94.9, n=53) | |
| Dell Latitude 7350 Detachable | |
| Dell Latitude 7030 Rugged Extreme | |
| 1920x1080 Low Preset AA:T AF:16x | |
| Durchschnittliche Intel Iris Xe Graphics G7 96EUs (33.3 - 57.2, n=58) | |
| Dell Latitude 7350 Detachable | |
| Dell Latitude 7030 Rugged Extreme | |
| 1920x1080 Medium Preset AA:T AF:16x | |
| Durchschnittliche Intel Iris Xe Graphics G7 96EUs (28 - 52.3, n=58) | |
| Dell Latitude 7350 Detachable | |
| Dell Latitude 7030 Rugged Extreme | |
| 1920x1080 High Preset AA:T AF:16x | |
| Durchschnittliche Intel Iris Xe Graphics G7 96EUs (21.7 - 37.1, n=58) | |
| Dell Latitude 7350 Detachable | |
| Dell Latitude 7030 Rugged Extreme | |
| Cyberpunk 2077 | |
| 1280x720 Low Preset (FSR off) | |
| Durchschnittliche Intel Iris Xe Graphics G7 96EUs (21.4 - 37.3, n=17) | |
| Dell Latitude 7350 Detachable | |
| Dell Latitude 7030 Rugged Extreme | |
| 1920x1080 Low Preset (FSR off) | |
| Dell Latitude 7350 Detachable | |
| Durchschnittliche Intel Iris Xe Graphics G7 96EUs (13.1 - 22.5, n=17) | |
| Dell Latitude 7030 Rugged Extreme | |
| 1920x1080 Medium Preset (FSR off) | |
| Dell Latitude 7350 Detachable | |
| Durchschnittliche Intel Iris Xe Graphics G7 96EUs (11.4 - 17.7, n=14) | |
| Dell Latitude 7030 Rugged Extreme | |
| 1920x1080 High Preset (FSR off) | |
| Dell Latitude 7350 Detachable | |
| Durchschnittliche Intel Iris Xe Graphics G7 96EUs (9.8 - 15, n=14) | |
| Dell Latitude 7030 Rugged Extreme | |
Cyberpunk 2077 ultra FPS-Diagramm
| min. | mittel | hoch | max. | |
|---|---|---|---|---|
| GTA V (2015) | 104.9 | 92.1 | 21.8 | 8.86 |
| Dota 2 Reborn (2015) | 98.8 | 78 | 58.6 | 52.7 |
| Final Fantasy XV Benchmark (2018) | 36.3 | 20.8 | 14.3 | |
| X-Plane 11.11 (2018) | 31.6 | 25.6 | 23.5 | |
| Far Cry 5 (2018) | 47 | 25 | 23 | 22 |
| Strange Brigade (2018) | 68.8 | 31.2 | 24.9 | 19.8 |
| Tiny Tina's Wonderlands (2022) | 23.4 | 18.2 | 11.4 | 8.8 |
| F1 22 (2022) | 37.2 | 33.1 | 23.6 | 17.7 |
| Baldur's Gate 3 (2023) | 12.3 | |||
| Cyberpunk 2077 (2023) | 14.4 | 11.4 | 9.8 | 8.56 |
Emissionen
Geräuschemissionen
Das Lüftergeräusch ist eine gemischte Angelegenheit. Einerseits ist es bei geringer bis mittlerer Last, wie beim Surfen, Videostreaming oder sogar bei der ersten Benchmark-Szene von 3DMark 06, kaum hörbar. Andererseits wird das Latitude 7030 Rugged Extreme mit über 50 dB(A) zu einem der lautesten Windows-Tablets, die wir jemals getestet haben, wenn es stark belastet wird, etwa beim Spielen. Die gute Nachricht ist, dass das Pulsieren minimal ist, sodass der Lüfter bei den meisten alltäglichen Aufgaben nicht auffällt.
Lautstärkediagramm
| Idle |
| 23.5 / 23.5 / 23.5 dB(A) |
| Last |
| 24.1 / 50.6 dB(A) |
 | ||
30 dB leise 40 dB(A) deutlich hörbar 50 dB(A) störend |
||
min: | ||
| Dell Latitude 7030 Rugged Extreme Iris Xe G7 96EUs, i7-1260U, Micron 2550 1TB | Dell Latitude 7350 Detachable Graphics 4-Core iGPU (Arrow Lake), Ultra 7 164U, Micron 2550 1TB | Dell Latitude 7230 Rugged Extreme Iris Xe G7 80EUs, i5-1240U, WD PC SN740 512GB SDDPMQD-512G-1101 | Acer Enduro Urban N3 EUN314 Iris Xe G7 96EUs, i7-1165G7, Samsung PM991 MZVLQ1T0HALB | Dell Latitude 7330 Rugged Extreme Iris Xe G7 96EUs, i7-1185G7 | |
|---|---|---|---|---|---|
| Geräuschentwicklung | -1% | 4% | -1% | 3% | |
| aus / Umgebung * (dB) | 23 | 22.9 -0% | 22.8 1% | 23.8 -3% | 22.9 -0% |
| Idle min * (dB) | 23.5 | 22.9 3% | 22.9 3% | 24.1 -3% | 23.1 2% |
| Idle avg * (dB) | 23.5 | 22.9 3% | 22.9 3% | 24.1 -3% | 23.1 2% |
| Idle max * (dB) | 23.5 | 24.4 -4% | 22.9 3% | 24.1 -3% | 23.1 2% |
| Last avg * (dB) | 24.1 | 29.7 -23% | 24.5 -2% | 27.9 -16% | 28 -16% |
| Cyberpunk 2077 ultra * (dB) | 50.5 | 47.2 7% | |||
| Last max * (dB) | 50.6 | 47.2 7% | 43.2 15% | 38.6 24% | 36.2 28% |
| Witcher 3 ultra * (dB) | 36 | 35.7 | 31.2 |
* ... kleinere Werte sind besser
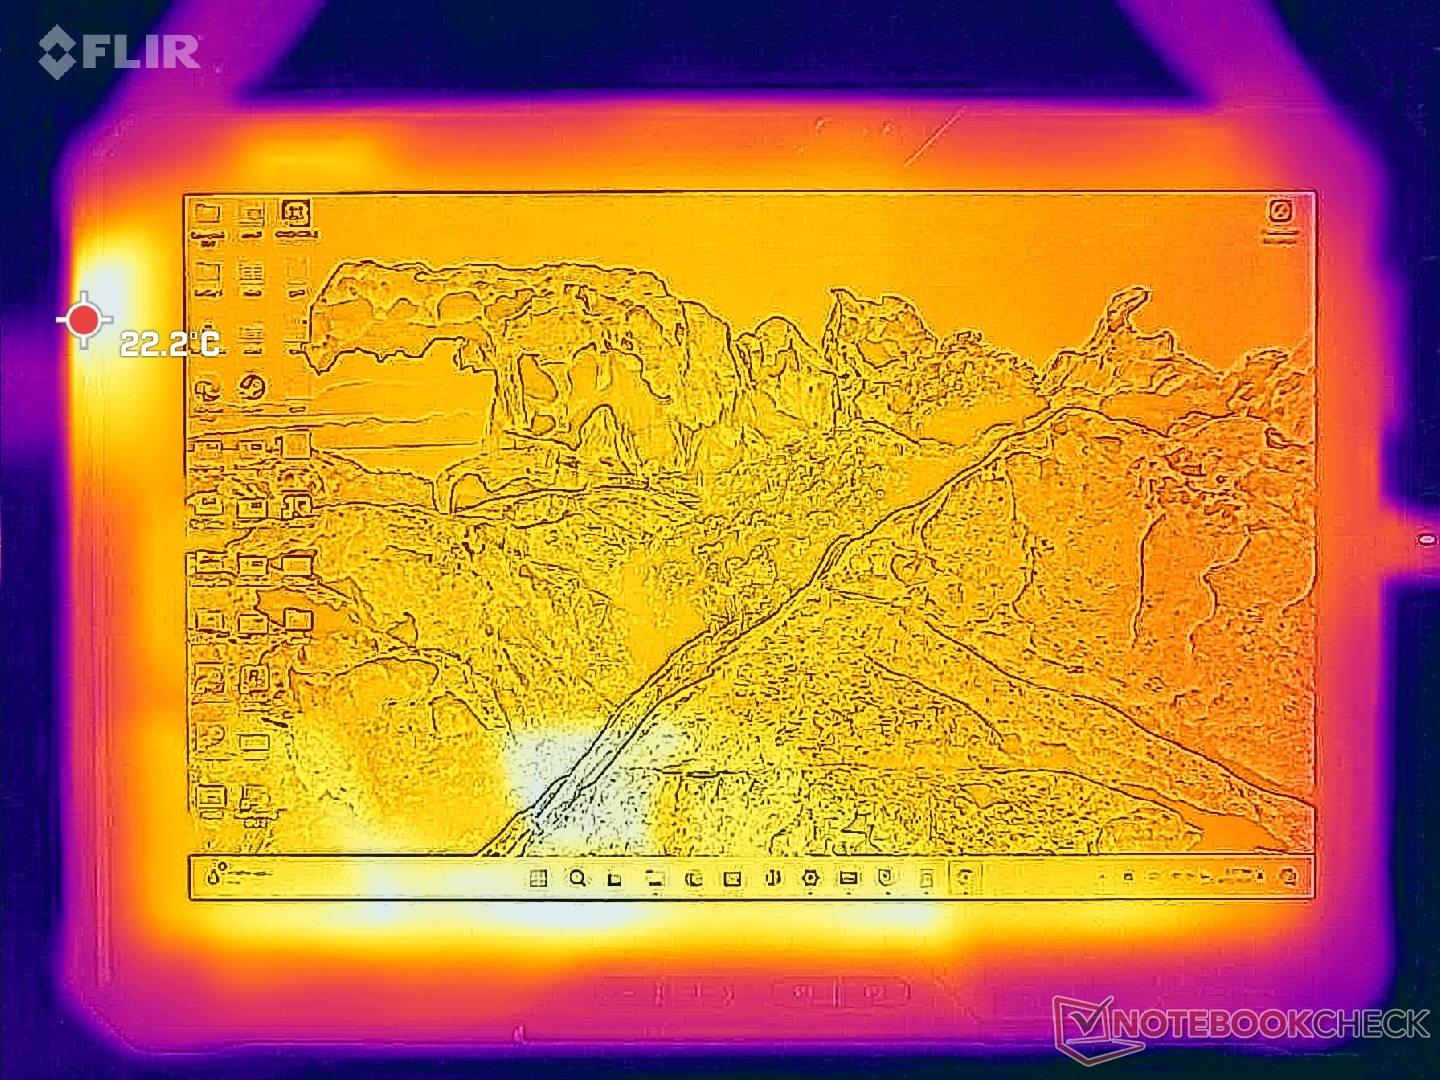
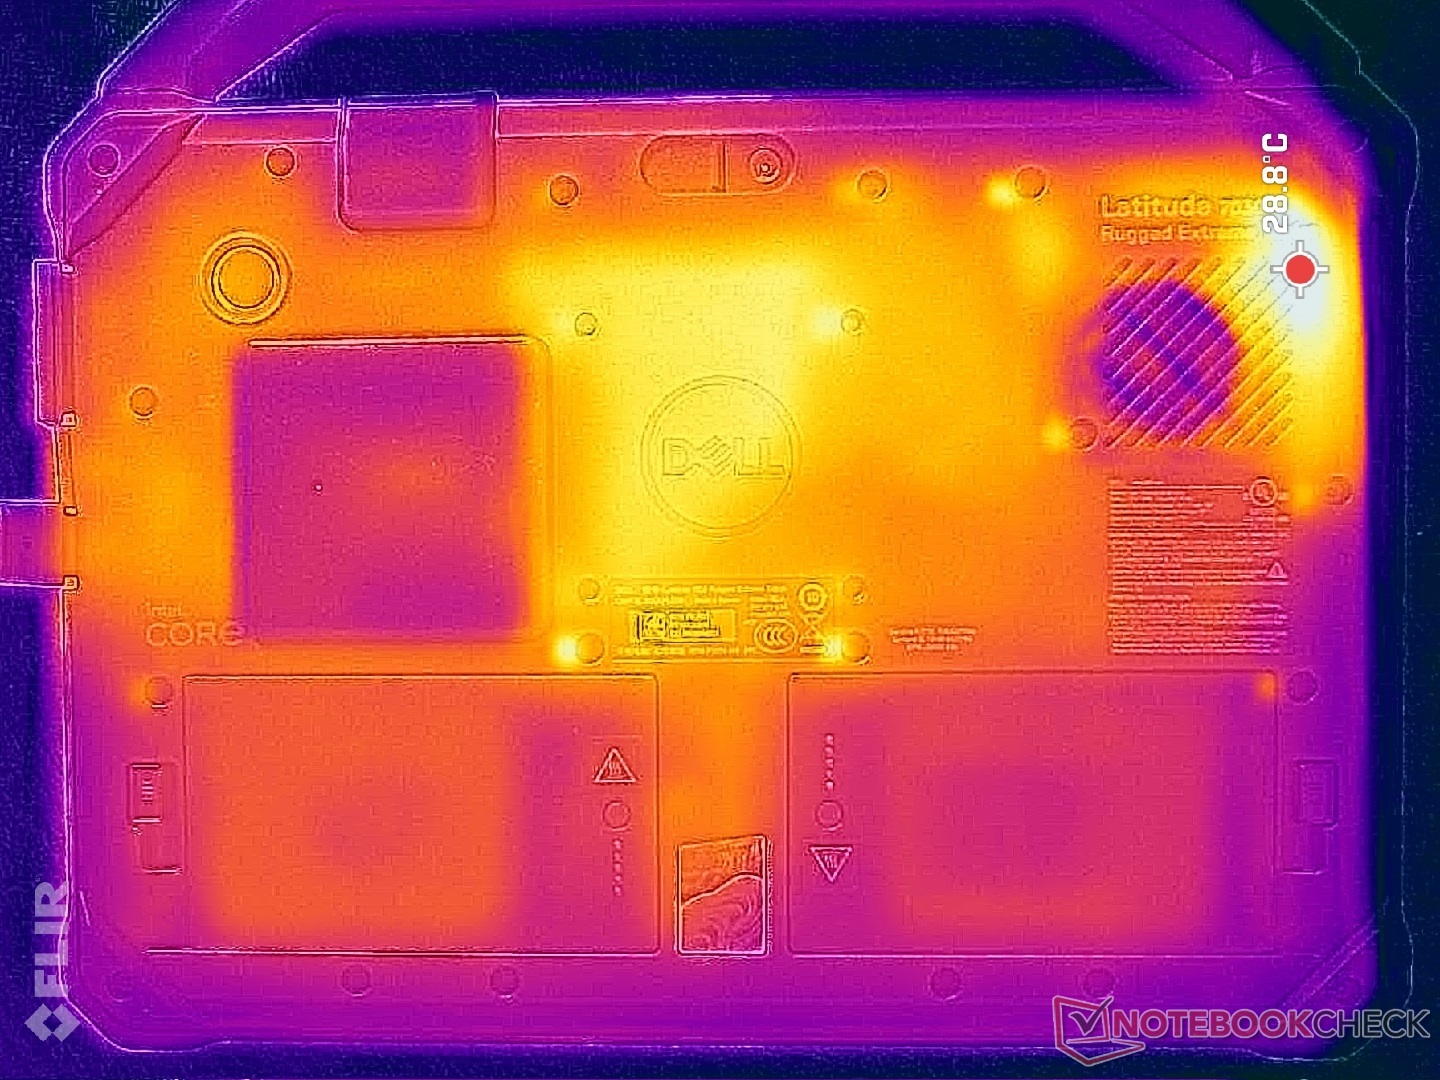
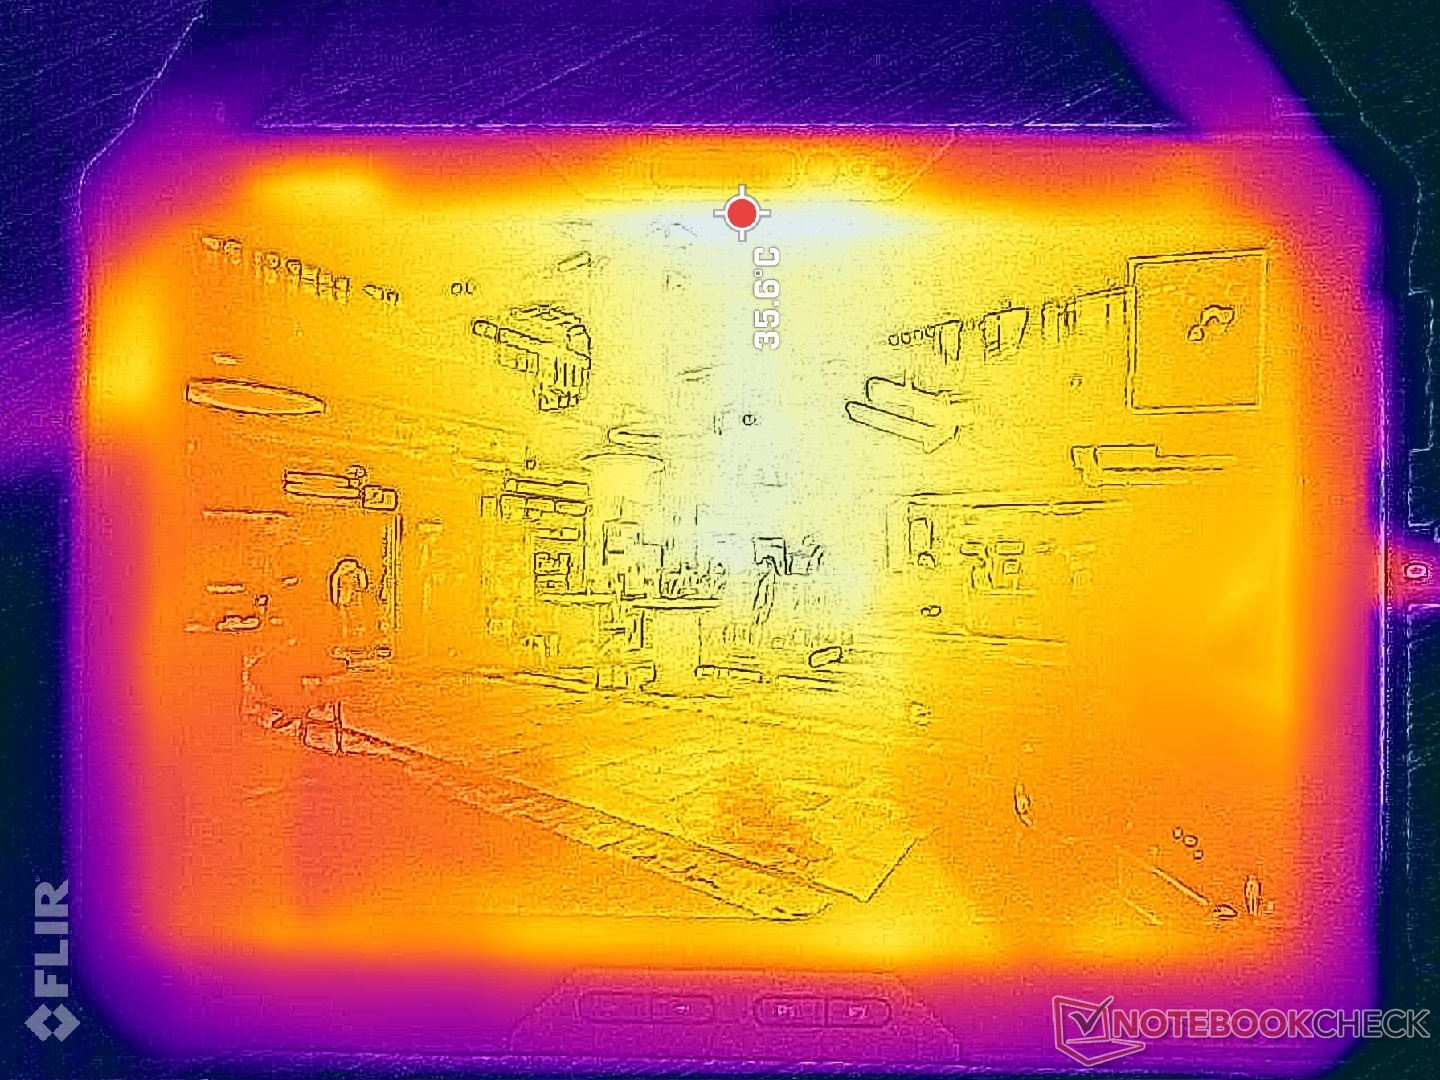
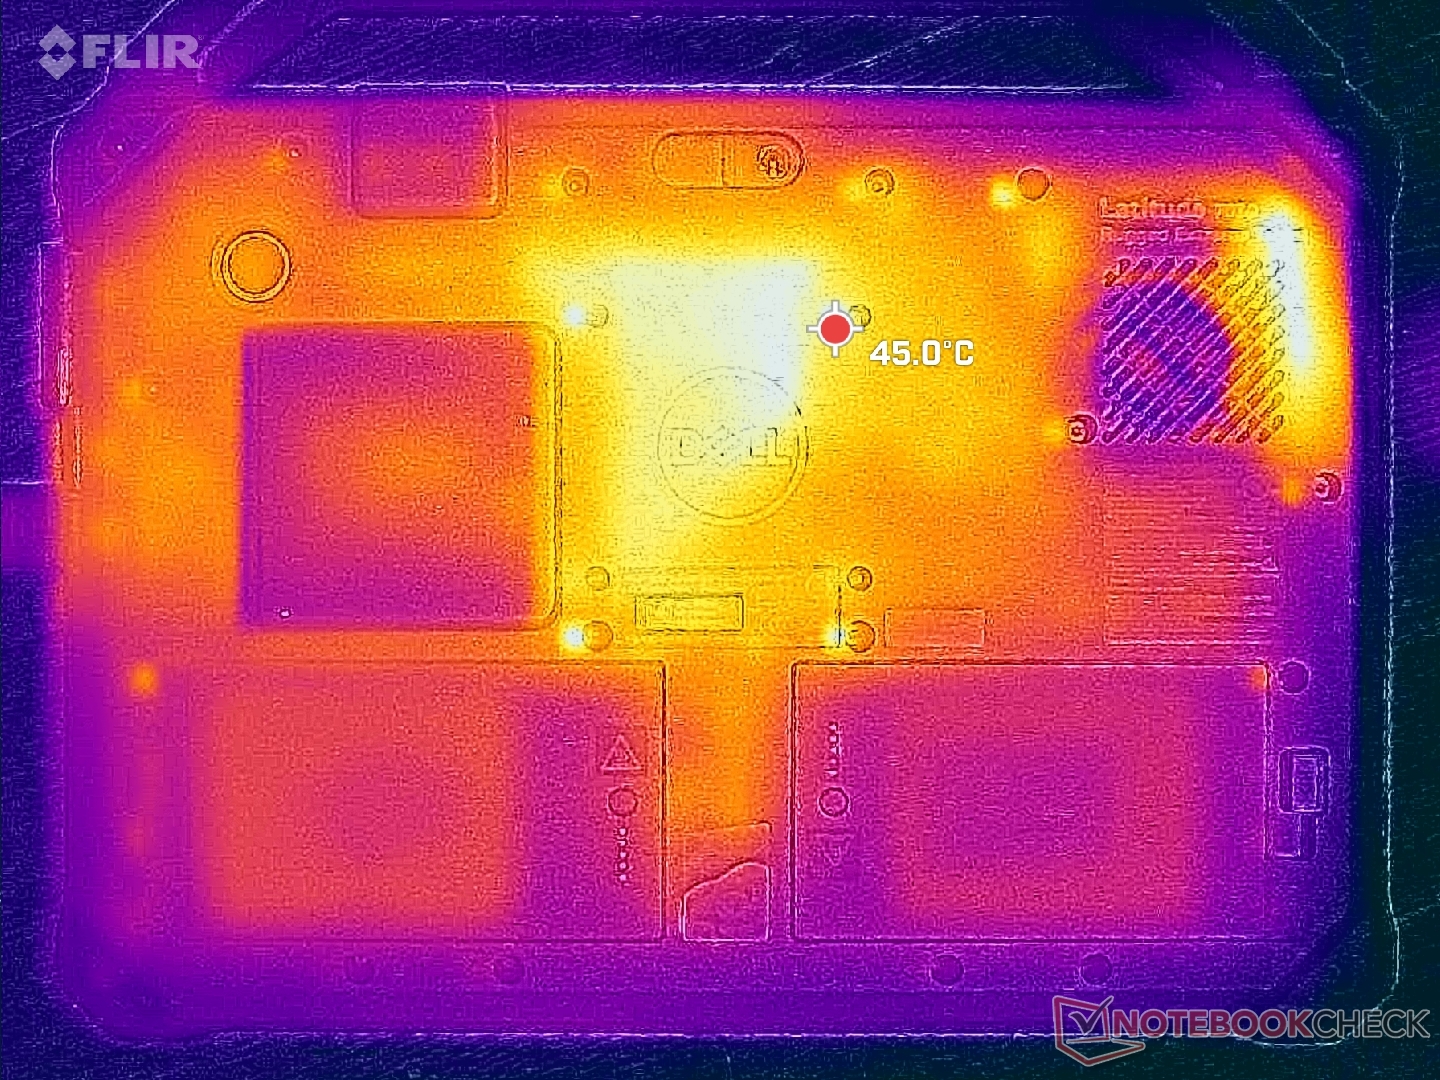
Temperatur
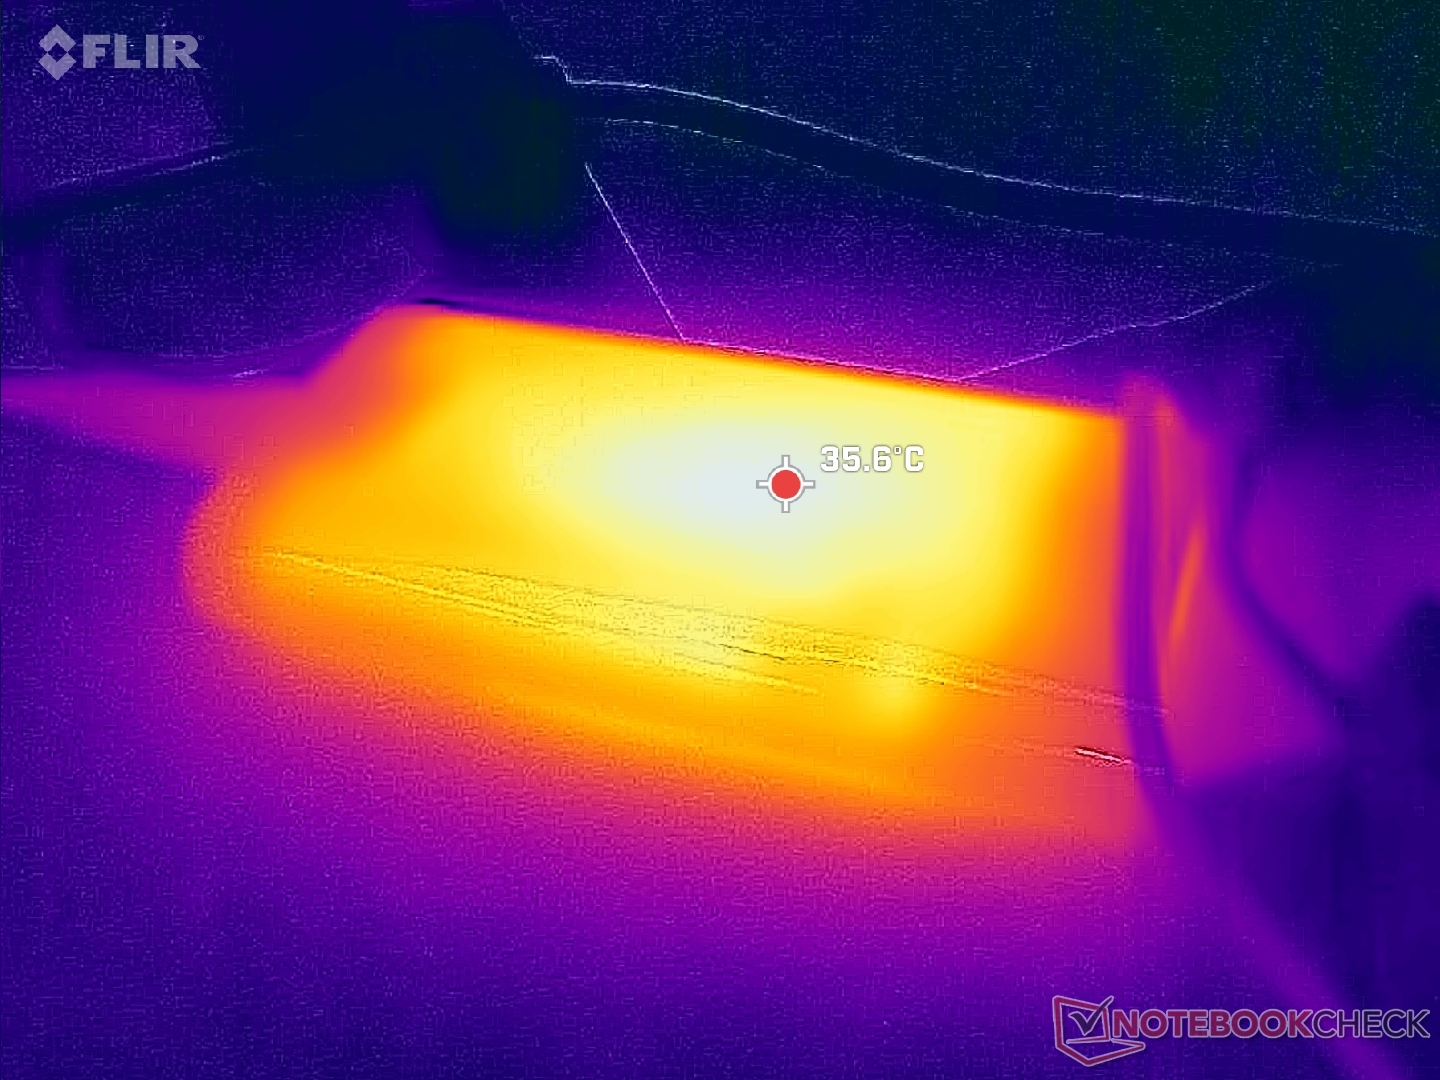
Die Oberflächentemperaturen können unter Belastung mit bis zu 38 °C auf der Vorderseite und 45 °C auf der Rückseite recht hoch werden. Das ist deutlich wärmer als die Werte, die wir beim Latitude 7230 Rugged Extreme gemessen haben, und diese Ergebnisse stimmen mit den zuvor erwähnten, sehr warmen Kerntemperaturen überein.
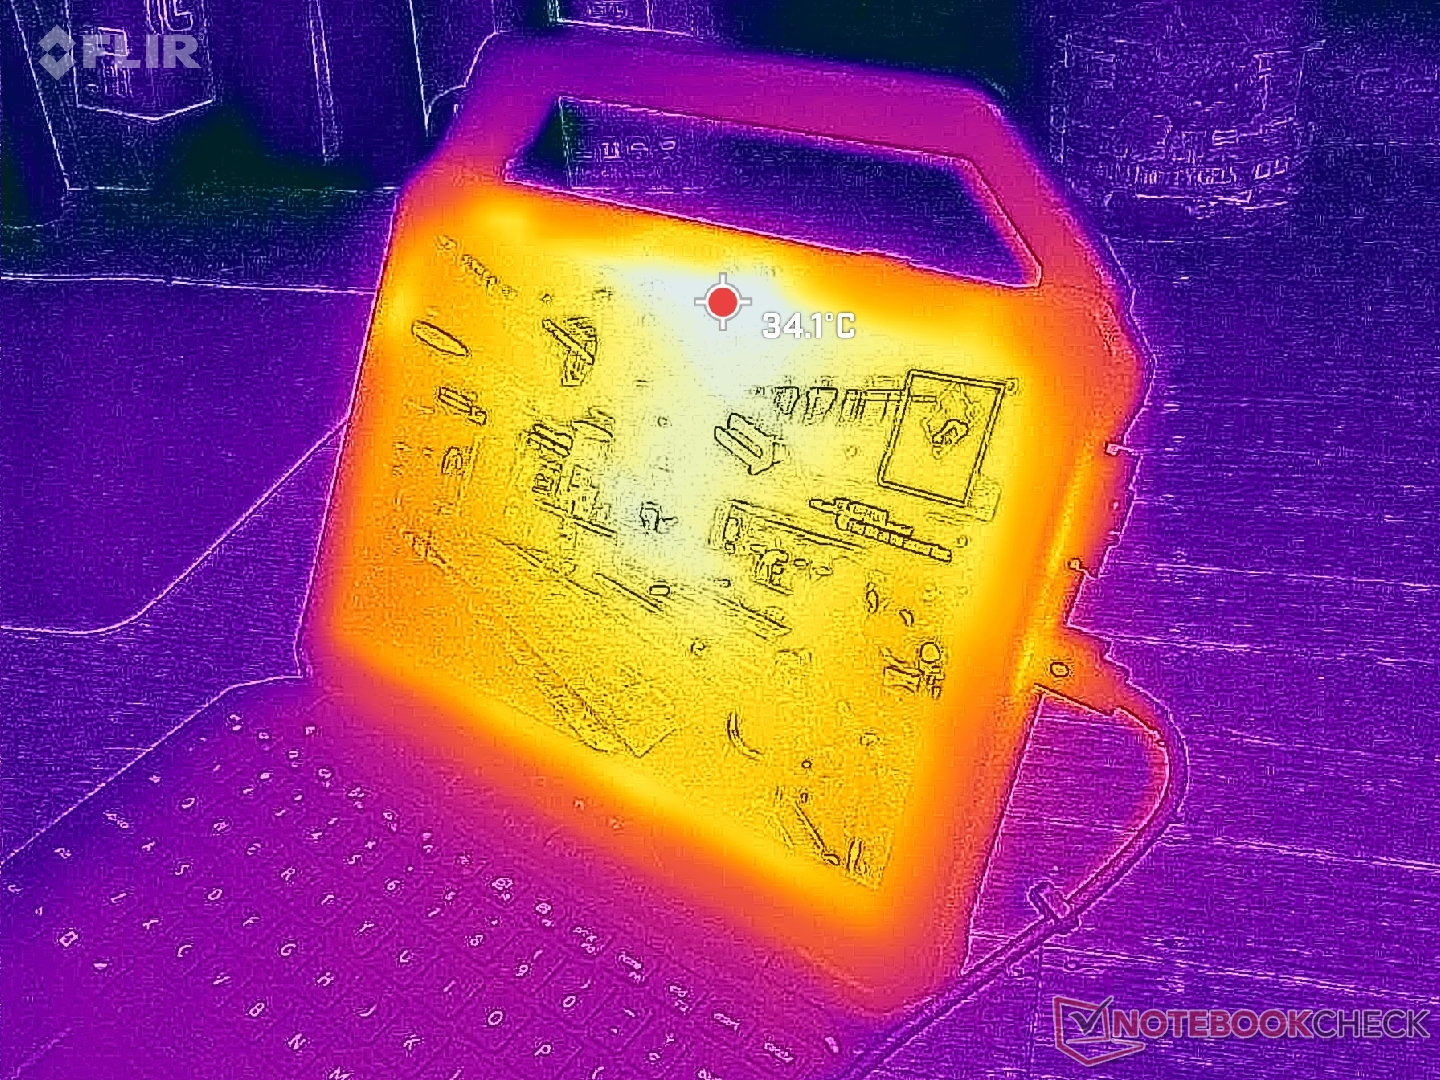
(+) Die maximale Temperatur auf der Oberseite ist 37.2 °C. Im Vergleich liegt der Klassendurchschnitt bei 35.4 °C (von 19.6 bis 60 °C für die Klasse Convertible).
(±) Auf der Unterseite messen wir eine maximalen Wert von 43.4 °C (im Vergleich zum Durchschnitt von 36.8 °C).
(+) Ohne Last messen wir eine durchschnittliche Temperatur von 25.7 °C auf der Oberseite. Der Klassendurchschnitt erreicht 30.3 °C.
(+) Die Handballen und der Touchpad-Bereich erreichen maximal 35.8 °C und damit die typische Hauttemperatur und fühlen sich daher nicht heiß an.
(-) Die durchschnittliche Handballen-Temperatur anderer getesteter Geräte war 27.9 °C (-7.9 °C).
| Dell Latitude 7030 Rugged Extreme Intel Core i7-1260U, Intel Iris Xe Graphics G7 96EUs | Dell Latitude 7350 Detachable Intel Core Ultra 7 164U, Intel Graphics 4-Core iGPU (Arrow Lake) | Dell Latitude 7230 Rugged Extreme Intel Core i5-1240U, Intel Iris Xe Graphics G7 80EUs | Durabook R8 Tablet Intel Core i5-1230U, Intel Iris Xe Graphics G7 80EUs | Acer Enduro Urban N3 EUN314 Intel Core i7-1165G7, Intel Iris Xe Graphics G7 96EUs | Dell Latitude 7330 Rugged Extreme Intel Core i7-1185G7, Intel Iris Xe Graphics G7 96EUs | |
|---|---|---|---|---|---|---|
| Hitze | -0% | -4% | -13% | -3% | 11% | |
| Last oben max * (°C) | 37.2 | 38.4 -3% | 32.6 12% | 38.2 -3% | 37.8 -2% | 34.6 7% |
| Last unten max * (°C) | 43.4 | 40.6 6% | 40.2 7% | 49.6 -14% | 45.8 -6% | 36.6 16% |
| Idle oben max * (°C) | 26.4 | 28.2 -7% | 30.6 -16% | 32.2 -22% | 26.4 -0% | 24.8 6% |
| Idle unten max * (°C) | 29.6 | 28.6 3% | 35 -18% | 33.4 -13% | 30.2 -2% | 25.2 15% |
* ... kleinere Werte sind besser
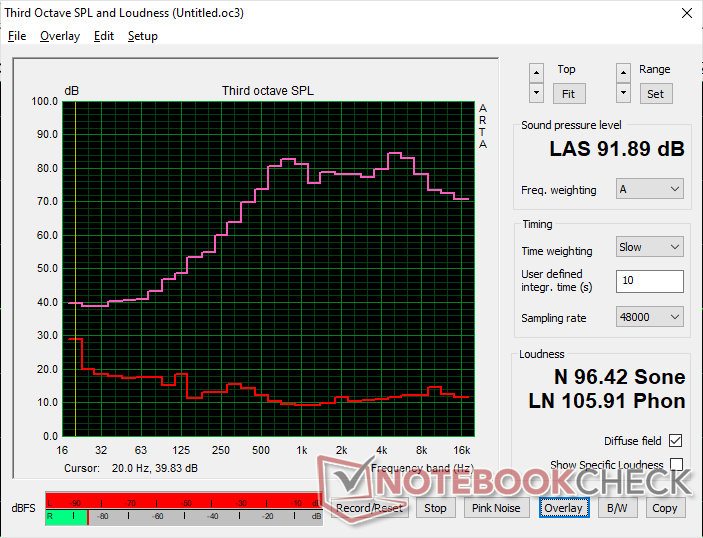
Lautsprecher
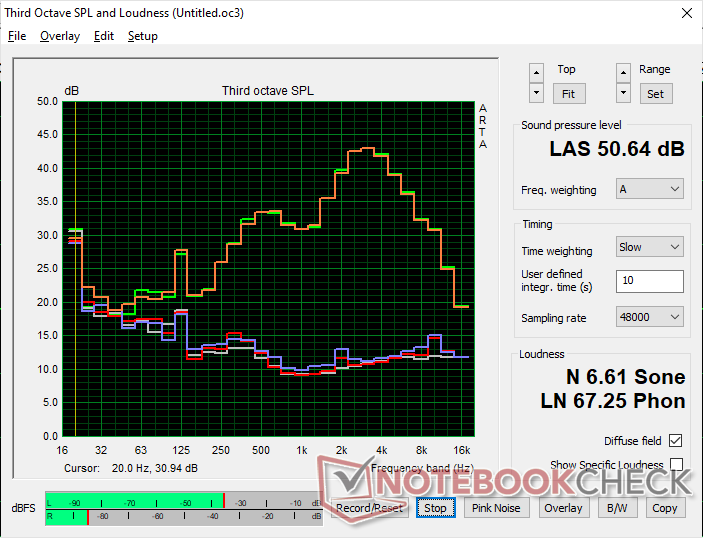
Die internen Lautsprecher sind mit fast 92 dB(A) für den kompakten Formfaktor überraschend laut und eignen sich gut für laute Außenbedingungen. Im Vergleich erreichen die meisten Endkunden-Laptops maximal 80 bis 85 dB(A).
Dell Latitude 7030 Rugged Extreme Audio Analyse
(+) | Die Lautsprecher können relativ laut spielen (91.9 dB)
Bass 100 - 315 Hz
(-) | kaum Bass - 22.6% niedriger als der Median
(+) | lineare Bass-Wiedergabe (5.2% Delta zum Vorgänger)
Mitteltöne 400 - 2000 Hz
(+) | ausgeglichene Mitten, vom Median nur 3.5% abweichend
(+) | lineare Mitten (5.7% Delta zum Vorgänger)
Hochtöne 2 - 16 kHz
(+) | ausgeglichene Hochtöne, vom Median nur 3% abweichend
(+) | sehr lineare Hochtöne (4.2% Delta zum Vorgänger)
Gesamt im hörbaren Bereich 100 - 16.000 Hz
(+) | hörbarer Bereich ist sehr linear (14% Abstand zum Median
Im Vergleich zu allen Geräten derselben Klasse
» 20% aller getesteten Geräte dieser Klasse waren besser, 4% vergleichbar, 77% schlechter
» Das beste Gerät hat einen Delta-Wert von 6%, durchschnittlich ist 20%, das schlechteste Gerät hat 57%
Im Vergleich zu allen Geräten im Test
» 16% aller getesteten Geräte waren besser, 4% vergleichbar, 81% schlechter
» Das beste Gerät hat einen Delta-Wert von 4%, durchschnittlich ist 24%, das schlechteste Gerät hat 134%
Apple MacBook Pro 16 2021 M1 Pro Audio Analyse
(+) | Die Lautsprecher können relativ laut spielen (84.7 dB)
Bass 100 - 315 Hz
(+) | guter Bass - nur 3.8% Abweichung vom Median
(+) | lineare Bass-Wiedergabe (5.2% Delta zum Vorgänger)
Mitteltöne 400 - 2000 Hz
(+) | ausgeglichene Mitten, vom Median nur 1.3% abweichend
(+) | lineare Mitten (2.1% Delta zum Vorgänger)
Hochtöne 2 - 16 kHz
(+) | ausgeglichene Hochtöne, vom Median nur 1.9% abweichend
(+) | sehr lineare Hochtöne (2.7% Delta zum Vorgänger)
Gesamt im hörbaren Bereich 100 - 16.000 Hz
(+) | hörbarer Bereich ist sehr linear (4.6% Abstand zum Median
Im Vergleich zu allen Geräten derselben Klasse
» 0% aller getesteten Geräte dieser Klasse waren besser, 0% vergleichbar, 100% schlechter
» Das beste Gerät hat einen Delta-Wert von 5%, durchschnittlich ist 17%, das schlechteste Gerät hat 45%
Im Vergleich zu allen Geräten im Test
» 0% aller getesteten Geräte waren besser, 0% vergleichbar, 100% schlechter
» Das beste Gerät hat einen Delta-Wert von 4%, durchschnittlich ist 24%, das schlechteste Gerät hat 134%
Energieverwaltung — Effizienter Stromverbrauch mit kompaktem Akku
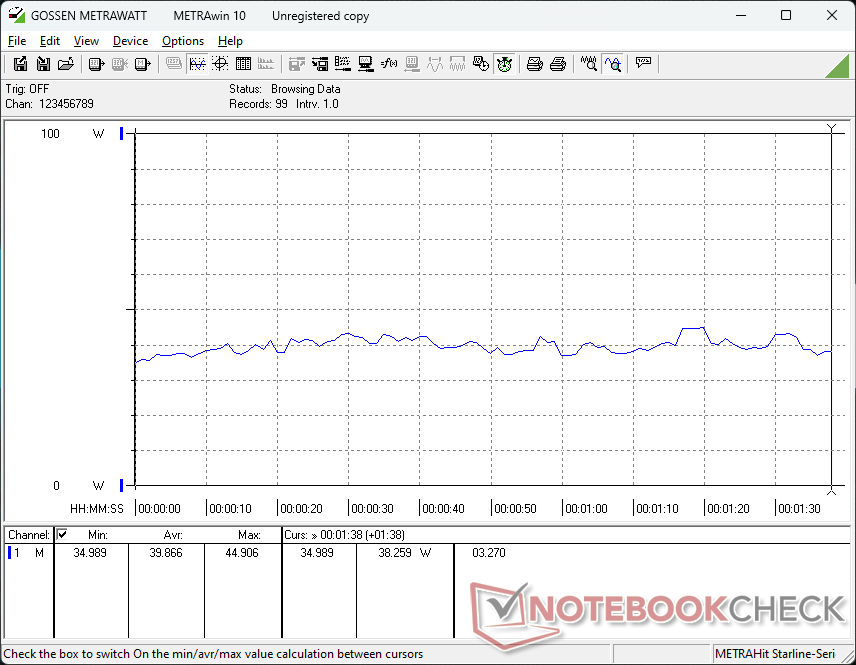
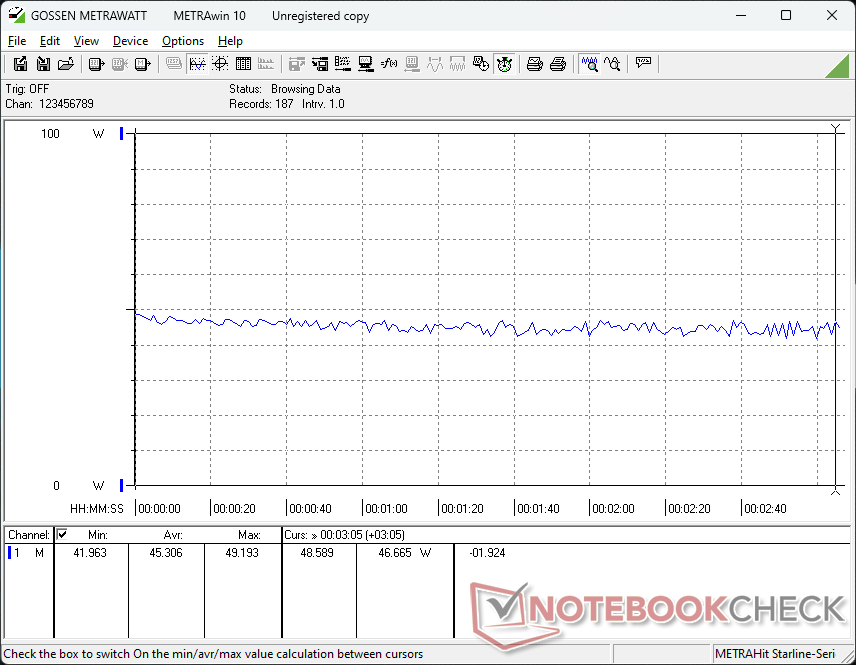
Energieaufnahme
Der Verbrauch liegt im Leerlauf auf dem Desktop zwischen 2 W und 9 W, abhängig von der Helligkeitsstufe. Der Unterschied zwischen minimaler und maximaler Helligkeit beträgt etwa 6 W. Anspruchsvollere Anwendungen wie Spiele benötigen über 40 W, um mit dem Latitude 7230 Rugged vergleichbar zu sein.
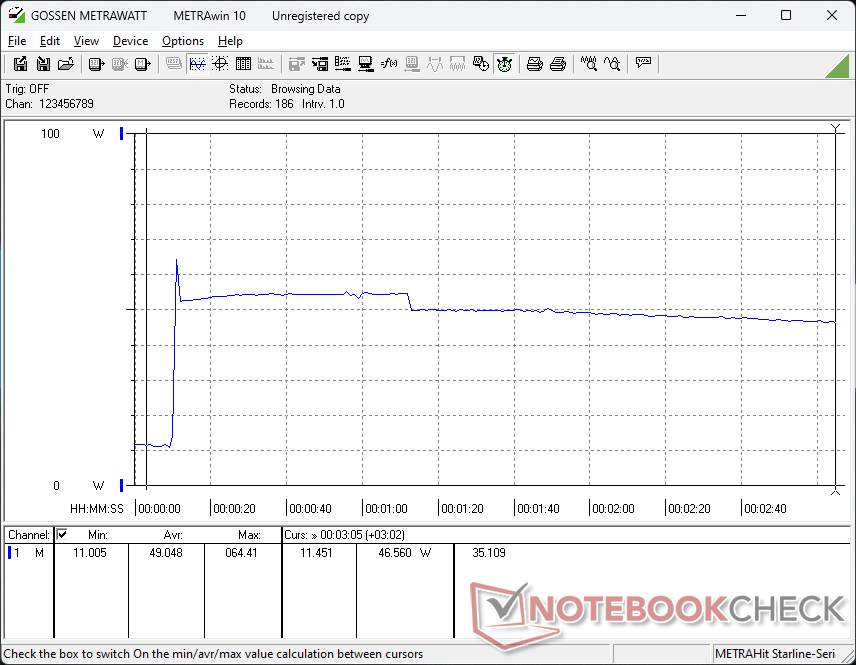
Mit dem kompakten (~13 x 6,6 x 2,2 cm) USB-C-Netzteil konnten wir bei 100 Prozent CPU-Auslastung eine temporäre maximale Leistungsaufnahme von 65 W messen.

| Aus / Standby | |
| Idle | |
| Last |
|
Legende:
min: | |
| Dell Latitude 7030 Rugged Extreme i7-1260U, Iris Xe G7 96EUs, Micron 2550 1TB, IPS, 1920x1200, 10" | Dell Latitude 7350 Detachable Ultra 7 164U, Graphics 4-Core iGPU (Arrow Lake), Micron 2550 1TB, IPS, 2880x1920, 13" | Dell Latitude 7230 Rugged Extreme i5-1240U, Iris Xe G7 80EUs, WD PC SN740 512GB SDDPMQD-512G-1101, IPS, 1920x1200, 12" | Durabook R8 Tablet i5-1230U, Iris Xe G7 80EUs, Silicon Power SP128GIMEA3K5EV0, IPS, 1280x800, 8" | Acer Enduro Urban N3 EUN314 i7-1165G7, Iris Xe G7 96EUs, Samsung PM991 MZVLQ1T0HALB, IPS, 1920x1080, 14" | Dell Latitude 7330 Rugged Extreme i7-1185G7, Iris Xe G7 96EUs, , IPS, 1920x1080, 13.3" | |
|---|---|---|---|---|---|---|
| Stromverbrauch | 9% | -49% | 17% | -4% | -45% | |
| Idle min * (Watt) | 2.5 | 3.6 -44% | 6.5 -160% | 2.8 -12% | 3.8 -52% | 4.1 -64% |
| Idle avg * (Watt) | 7.3 | 6.1 16% | 8.9 -22% | 6.3 14% | 8 -10% | 11.7 -60% |
| Idle max * (Watt) | 8.6 | 6.7 22% | 14.3 -66% | 10.3 -20% | 8.7 -1% | 11.8 -37% |
| Last avg * (Watt) | 39.9 | 33.7 16% | 44.9 -13% | 19 52% | 34.6 13% | 48.5 -22% |
| Cyberpunk 2077 ultra external monitor * (Watt) | 38.8 | 31.8 18% | ||||
| Cyberpunk 2077 ultra * (Watt) | 45.3 | 37 18% | ||||
| Last max * (Watt) | 64.4 | 55.1 14% | 54.8 15% | 30.1 53% | 45.4 30% | 91 -41% |
| Witcher 3 ultra * (Watt) | 43.2 | 15.5 | 35.4 | 44.3 |
* ... kleinere Werte sind besser
Energieaufnahme Cyberpunk / Stresstest
Energieaufnahme externer Monitor
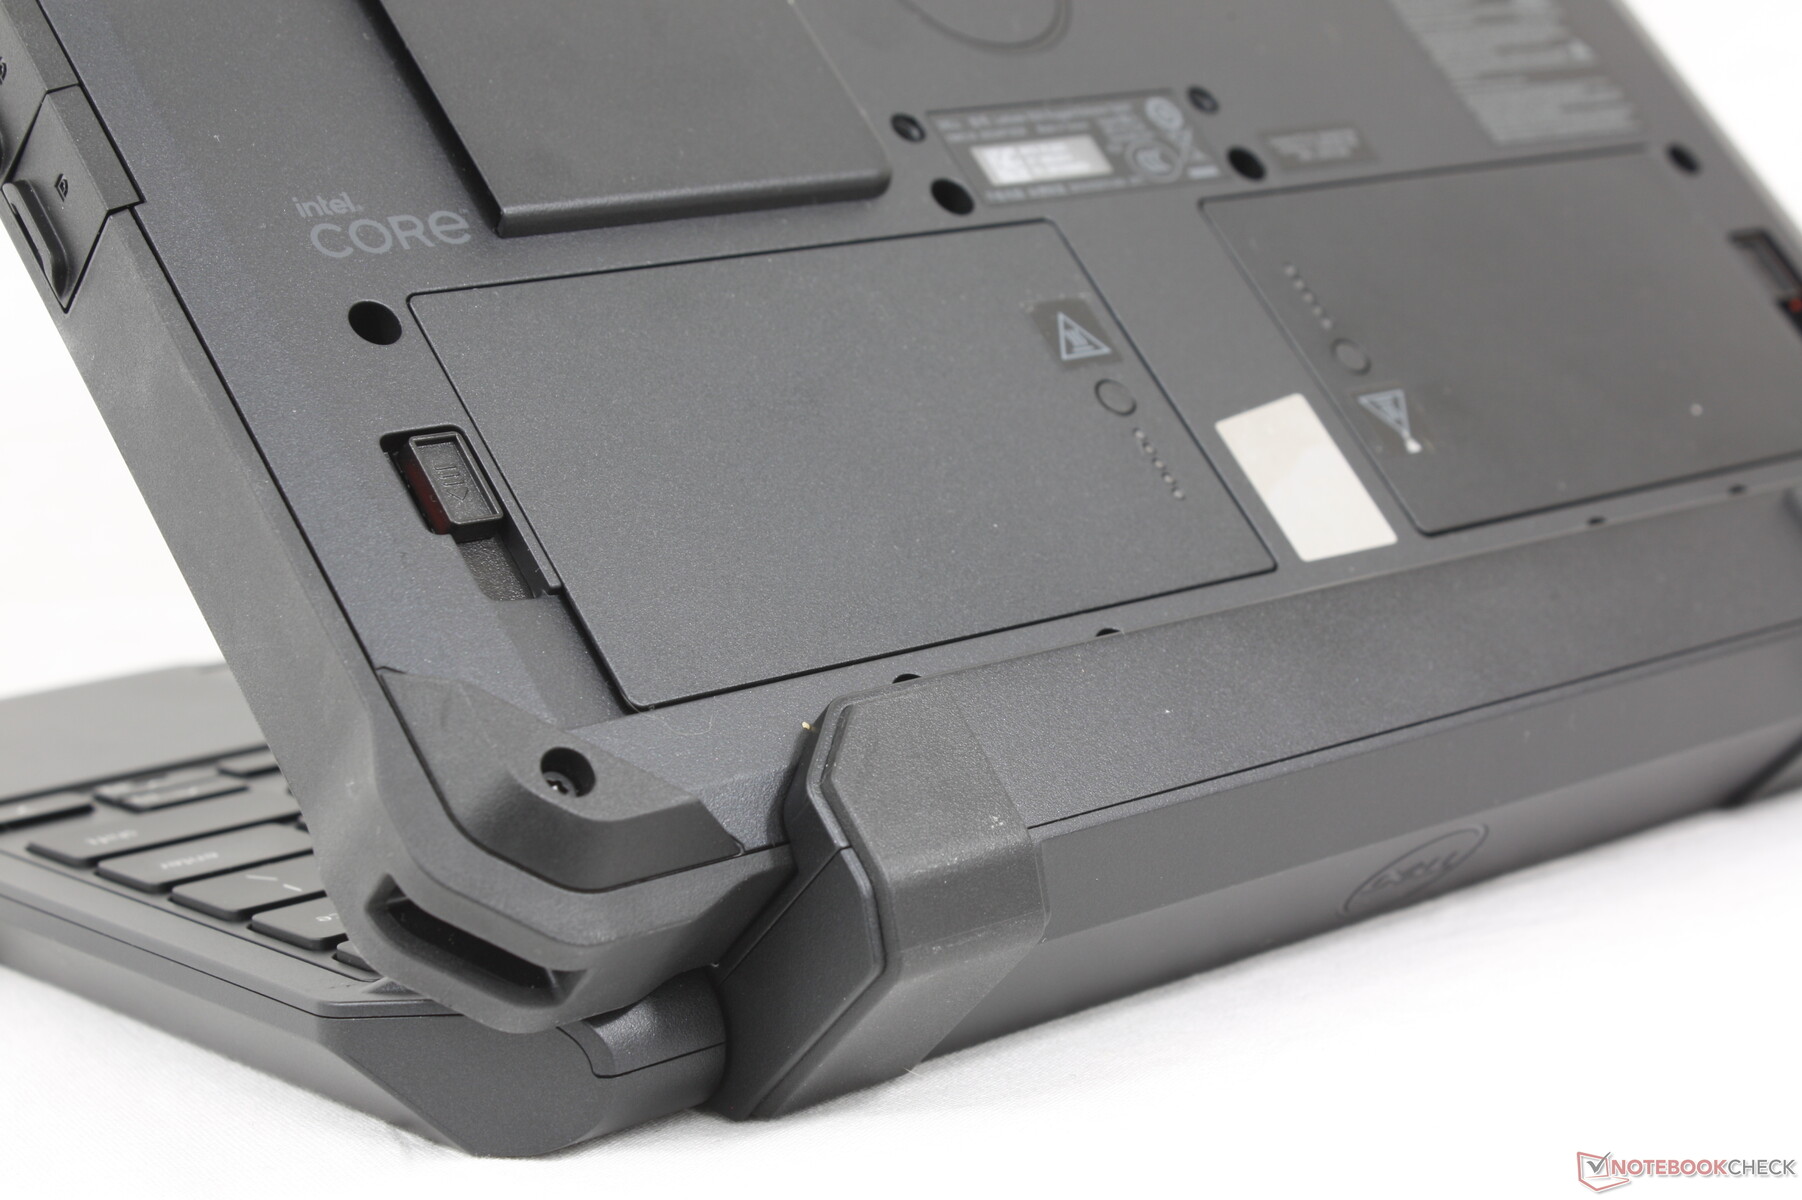
Akkulaufzeit
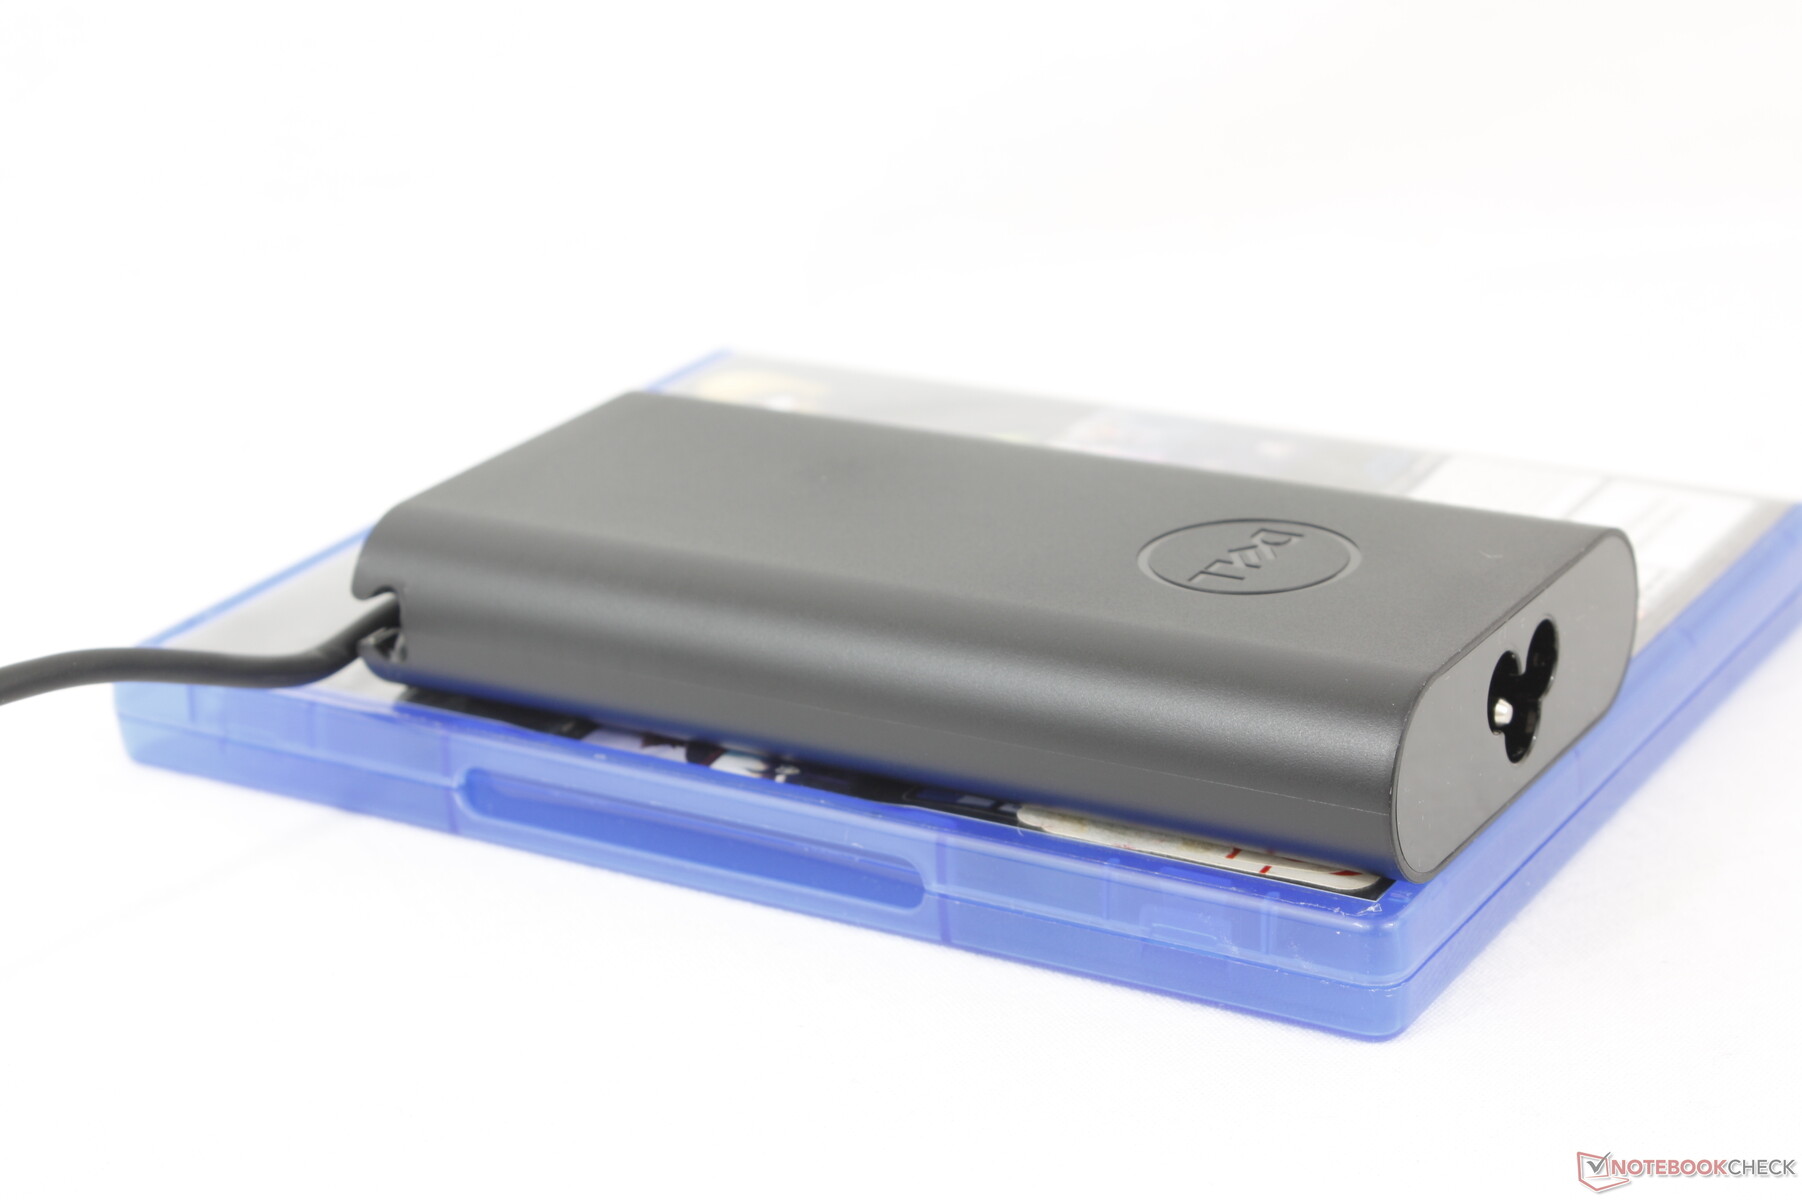
Der Benutzer kann entweder einen internen 36-Wh-Akku oder zwei herausnehmbare 18-Wh-Akkus konfigurieren – jedoch nicht beide gleichzeitig. Die WLAN-Laufzeit im Balanced-Modus bei einer Helligkeit von 150 cd/m² beträgt mit etwas mehr als 6 Stunden weniger als erwartet; mit einem einzelnen 18-Wh-Akku sind es lediglich 3 Stunden, um Gewicht zu sparen. Natürlich haben Nutzer die Möglichkeit, mehrere 18-Wh-Akkus erwerben, um die Laufzeit zu verlängern, doch das Mitführen mehrerer Akkus ist nicht gerade ideal.
Das Aufladen von null auf volle Kapazität ist enttäuschend langsam und dauert etwa 4 Stunden, wenn beide 18-Wh-Akkus installiert sind.
| Dell Latitude 7030 Rugged Extreme i7-1260U, Iris Xe G7 96EUs, 36 Wh | Dell Latitude 7350 Detachable Ultra 7 164U, Graphics 4-Core iGPU (Arrow Lake), 46.5 Wh | Dell Latitude 7230 Rugged Extreme i5-1240U, Iris Xe G7 80EUs, 72 Wh | Durabook R8 Tablet i5-1230U, Iris Xe G7 80EUs, 27.4 Wh | Acer Enduro Urban N3 EUN314 i7-1165G7, Iris Xe G7 96EUs, 50.3 Wh | Dell Latitude 7330 Rugged Extreme i7-1185G7, Iris Xe G7 96EUs, 107 Wh | |
|---|---|---|---|---|---|---|
| Akkulaufzeit | 69% | 113% | -13% | 5% | 195% | |
| WLAN (h) | 6.1 | 10.3 69% | 13 113% | 5.3 -13% | 6.4 5% | 18 195% |
| Idle (h) | 24.9 | |||||
| Last (h) | 1.6 | 3.6 |
Pro
Contra
Fazit — Stark, wo es zählt
Als industrietaugliches PC-Tablet glänzt das Latitude 7030 Rugged Extreme dort, wo es für die Zielgruppe am wichtigsten ist. Aspekte wie die solide Prozessorleistung, die lauten internen Lautsprecher, das superhelle Display und die vielfältigen Anschlussmöglichkeiten sind sehr erfreulich und übertreffen angesichts des kleinen Formfaktors die Erwartungen. Die volle sRGB-Abdeckung und das gute Feedback der Tastatur sind ebenfalls überraschend, da die meisten Geräte in der robusten Kategorie oft auf präzise Farben oder komfortable Tasten verzichten.
Das 10-Zoll Latitude 7030 Rugged Extreme übertrifft viele größere Konkurrenten und bietet eine ähnliche Reihe von Zusatzfunktionen. Allerdings sind der kleine Akku und die kurzen Laufzeiten ein kleiner Wermutstropfen.
Zu den Nachteilen gehören die hohen Kerntemperaturen, die erhöhten Oberflächentemperaturen, das laute Lüftergeräusch unter Last, die kurze Akkulaufzeit und die verringerte CPU-Leistung im Akkubetrieb. Einige dieser Punkte fallen in einer Außenumgebung nicht auf, aber die relativ kurze Laufzeit könnte problematisch sein, zumal die Ladegeschwindigkeit recht langsam ist.
Preis und Verfügbarkeit
Dell bietet das Latitude 7030 Rugged Extreme jetzt zu einem Einstiegspreis von 2.898,74 Euro mit dem Basis-Core i5-1240U an.
Note: We have recently updated our rating system and the results of version 8 are not comparable with the results of version 7. More information is available here .
Dell Latitude 7030 Rugged Extreme
- 20.09.2024 v8
Allen Ngo
 Total Sustainability Score:
 Transparenz
Die Auswahl der zu testenden Geräte erfolgt innerhalb der Redaktion. Das vorliegende Testmuster wurde dem Autor vom Hersteller oder einem Shop zu Testzwecken leihweise zur Verfügung gestellt. Eine Einflussnahme des Leihstellers auf den Testbericht gab es nicht, der Hersteller erhielt keine Version des Reviews vor der Veröffentlichung. Es bestand keine Verpflichtung zur Publikation. Als eigenständiges, unabhängiges Unternehmen unterliegt Notebookcheck keiner Diktion von Herstellern, Shops und Verlagen.
So testet Notebookcheck
Pro Jahr werden von Notebookcheck hunderte Laptops und Smartphones unabhängig in von uns standardisierten technischen Verfahren getestet, um eine Vergleichbarkeit aller Testergebnisse zu gewährleisten. Seit rund 20 Jahren entwickeln wir diese Testmethoden kontinuierlich weiter und setzen damit Branchenstandards. In unseren Testlaboren kommt ausschließlich hochwertiges Messequipment in die Hände erfahrener Techniker und Redakteure. Die Tests unterliegen einer mehrstufigen Kontrolle. Unsere komplexe Gesamtbewertung basiert auf hunderten fundierten Messergebnissen und Benchmarks, womit Ihnen Objektivität garantiert ist. Weitere Informationen zu unseren Testmethoden gibt es hier.
Preisvergleich

