Notebookcheck Logo
Dell Latitude 7450 2-in-1 im Test

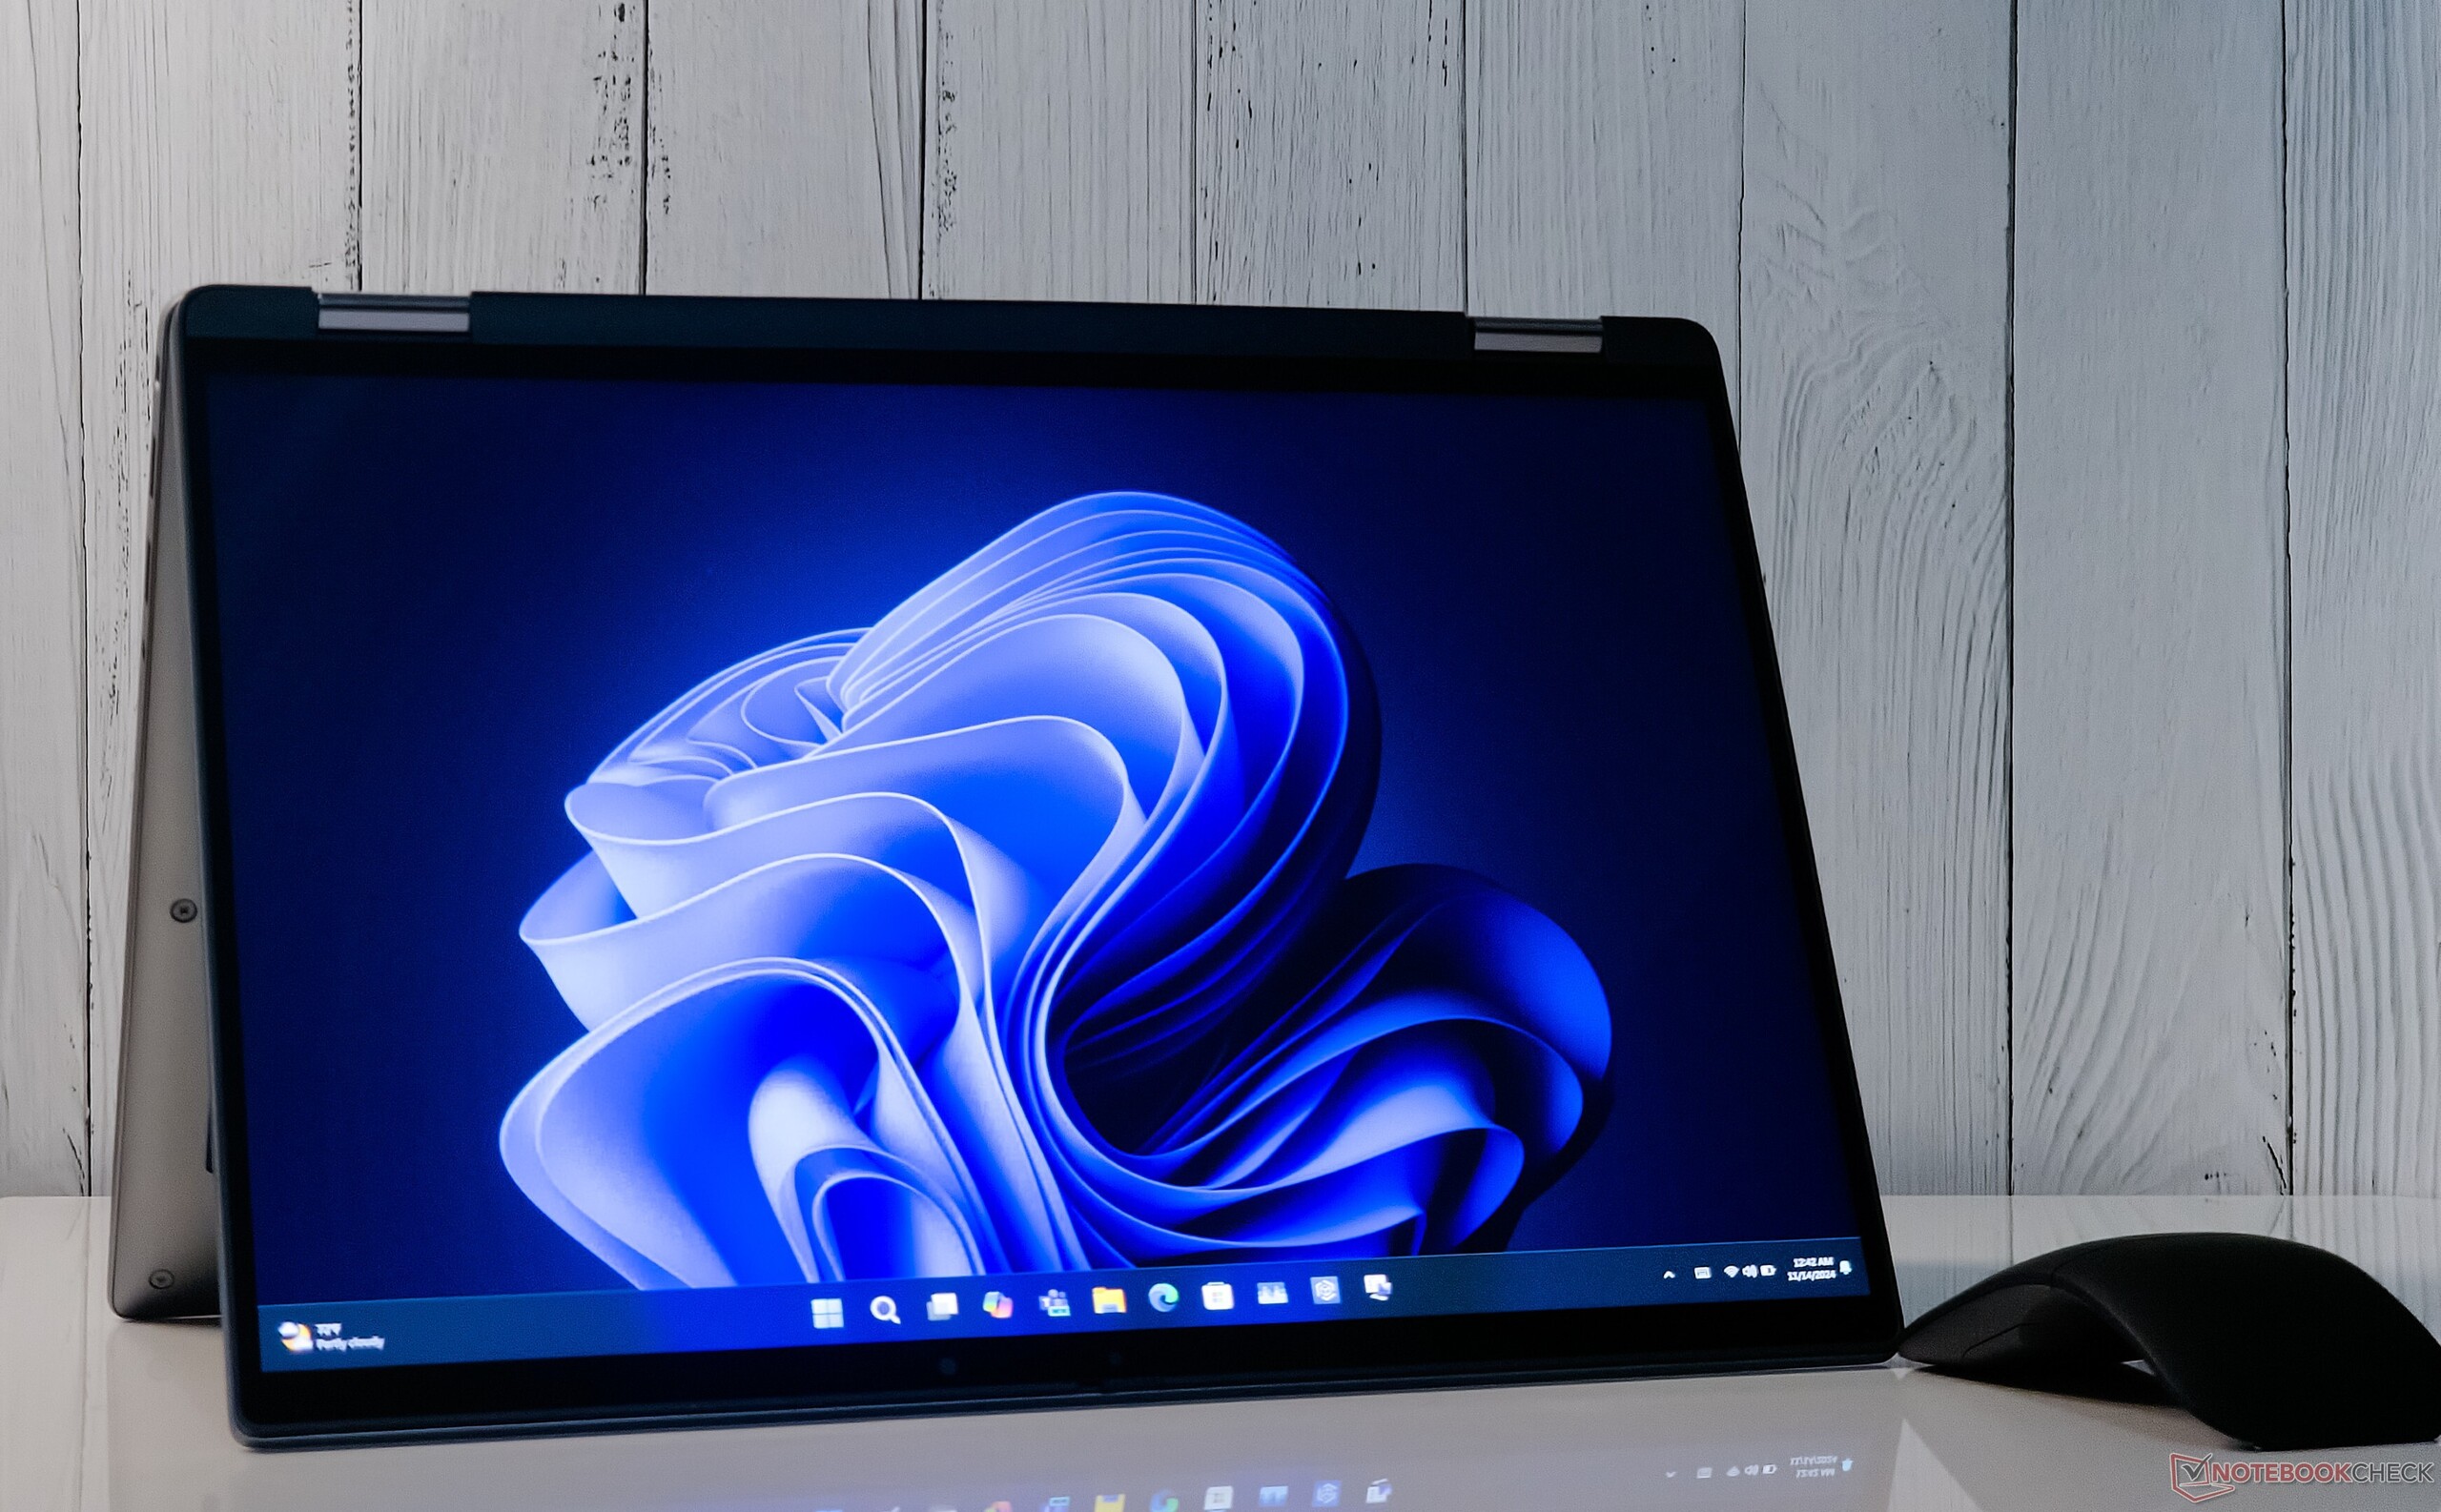
Dell Latitude 7450 2-in-1 Laptop: Vielseitiges Business-Convertible überzeugt im Test

Gut kalkuliert.

Das Dell Latitude 7450 2-in-1 mit dem Intel Core Ultra 7 165U vPro liefert eine solide Reihe an Funktionen fürs Business unterwegs, die sogar manch IT-Administrator zufriedenstellen könnte. Aber hat sich gegenüber dem Vorgänger genug getan, um mit den neuen Lenovo-ThinkPads mitzuhalten?
Vaidyanathan Subramaniam, 👁 Vaidyanathan Subramaniam, Andrea Grüblinger (übersetzt von DeepL / Ninh Duy) Veröffentlicht am 🇺🇸 🇹🇷 ...
Laptop / Notebook Convertible / 2-in-1 Meteor Lake Touchscreen Wi-Fi 7

Fazit: Schrittweiser Generationswechsel

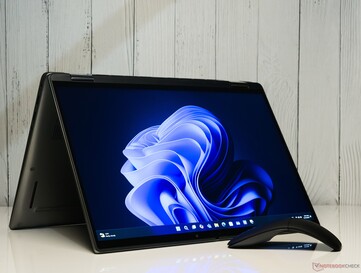
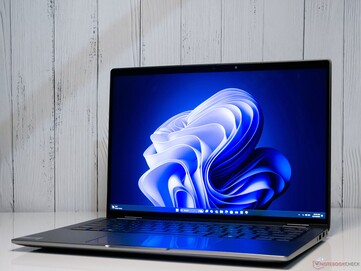
Das Dell Latitude 7450 2-in-1 ist ein vielseitiges und effizientes Convertible für Businesskunden, die viel unterwegs sind. Die Aluminiumkonstruktion ist robust und nicht zu schwer.

Trotz seines schlanken Designs bietet das Latitude 7450 2-in-1 eine solide Auswahl an Anschlussoptionen, Wi-Fi 7 liefert einen beeindruckenden Datendurchsatz. Die Tastatur und das Touchpad sorgen für zufriedenstellende Eingaben.

Der 60 Hz FHD+ IPS-Touchscreen ist mit seiner ordentlichen Helligkeit, der vollen sRGB-Farbabdeckung und dem Verzicht auf PWM für typische Businessaufgaben bestens geeignet. Die Gesamtleistung des Latitude 7450 2-in-1 entspricht den Erwartungen an ein Intel Core Ultra 7 165U-Notebook, niedrige Emissionen und sparsamer Stromverbrauch inklusive.

Download der lizensierten Bewertungsgrafik als SVG / PNG

Allerdings gibt es auch einige Sorgenkinder. Die Qualität der Webcam ist passabel, könnte aber durchaus besser sein, wenn man bedenkt, dass die Konkurrenz bereits auf 5 MP oder höher umgestiegen ist.

Die anfängliche Leistung des Geräts war recht dürftig, insbesondere bei den Single-Core-Tests, sodass ein anschließendes BIOS-Update erforderlich war. Dennoch kämpfte die CPU damit, ihre 44 W PL2 bei Multi-Core-Lasten aufrechtzuerhalten. Das sollten Sie im Hinterkopf behalten, wenn Sie vorhaben, viele Multi-Thread-Anwendungen auszuführen.

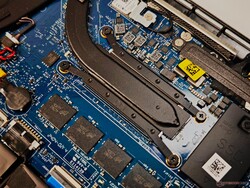
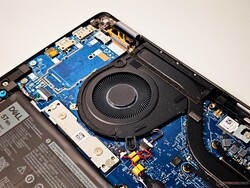
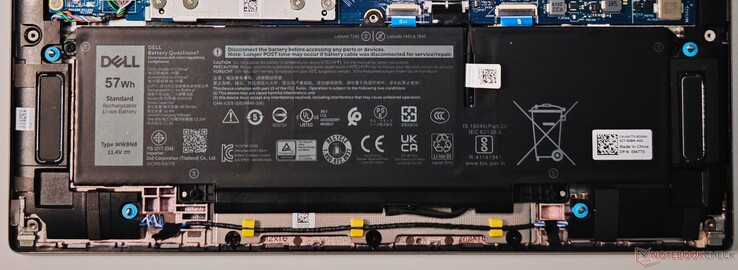
Außerdem sollten Sie Ihr Gerät vor dem Kauf entsprechend konfigurieren, da es fast keinen Spielraum für interne Änderungen gibt, außer dem Austausch der einzigen SSD.

Obwohl das Latitude 7450 2-in-1 viele positive Eigenschaften aufweist, gibt es nicht allzu viele zwingende Gründe, die ein sofortiges Upgrade vom Latitude 7440 rechtfertigen.

Pro

+ Robuste Gehäusekonstruktion
+ Schnelles WLAN-Netzwerk und gute Anschlussauswahl
+ Lebendiges IPS-Panel mit voller sRGB-Abdeckung und ohne PWM
+ Geringe Oberflächenwärme und Lüftergeräusche
+ Geringe Leistungsaufnahme im Leerlauf

Contra

- Langsame Responsezeiten
- Core Ultra 7 165U kann 44 W PL2 nicht lange halten
- Nahezu keine Komponenten-Upgrademöglichkeiten
- FHD-Webcam nur passabel
- Kein überzeugendes Upgrade gegenüber dem Vorgängermodell

Preis und Verfügbarkeit

Das Dell Latitude 7450 kann aktuell ab rund 1.500 Euro bei Dell.de konfiguriert werden.

Amazon Logo
Amazon
Latitude 7450 ULTRA5-135U 16GB

Mögliche Konkurrenten im Vergleich

Bild
Modell / Test
Geizhals
Gewicht
Dicke
Display
1.
87.7%
Dell Latitude 7450 2-in-1
Intel Core Ultra 7 165U ⎘
Intel Graphics 4-Cores iGPU (Arc) ⎘
32 GB RAM, 512 GB SSD
Bestpreis 1801.91€ Mediarado
2. 1808€ CNW IT-Systeme
3. 1823.52€ MetaComp
1.5 kg17.1 mm14.00"
1920x1200
162 PPI
IPS
2.
88.4% v7 (old)
Lenovo ThinkPad X1 2in1 G9 21KE004AGE
Intel Core Ultra 7 165U ⎘
Intel Graphics 4-Cores iGPU (Arc) ⎘
32 GB RAM, 1024 GB SSD
Bestpreis 2268€ notebookstore
2. 2269€ MetaComp
3. 2299€ lapstars
1.3 kg15.5 mm14.00"
2880x1800
243 PPI
OLED
3.
88.3% v7 (old)
Dell Latitude 9450 2-in-1
Intel Core Ultra 7 165U ⎘
Intel Graphics 4-Cores iGPU (Arc) ⎘
32 GB RAM
Bestpreis 2375.58€ Mediarado
2. 2385€ CNW IT-Systeme
3. 2401.68€ MetaComp
1.6 kg16.28 mm14.00"
2560x1600
216 PPI
IPS
4.
83.3%
Dell Latitude 7350 Detachable
Intel Core Ultra 7 164U ⎘
Intel Graphics 4-Cores iGPU (Arc) ⎘
32 GB RAM, 1024 GB SSD
Listenpreis 2390 USD
Geizhals Suche
865 g8.9 mm13.00"
2880x1920
266 PPI
IPS
5.
90.4% v7 (old)
Lenovo ThinkPad T14 G4 21K4S02000
AMD Ryzen 7 PRO 7840U ⎘
AMD Radeon 780M ⎘
32 GB RAM, 1024 GB SSD
Bestpreis 1710€ computeruniverse.net
2. 1710€ Cyberport.de
3. 1724.37€ computeruniverse.at
1.5 kg17.9 mm14.00"
1920x1200
162 PPI
IPS LED
6.
87.2%
HP EliteBook x360 1040 G11
Intel Core Ultra 7 165H ⎘
Intel Arc 8-Core iGPU ⎘
16 GB RAM, 512 GB SSD
Bestpreis 2312€ CNW IT-Systeme
2. 2331€ HEINZSOFT
3. 2338€ Easynotebooks.de
1.5 kg14.7 mm14.00"
1920x1200
162 PPI
IPS

Dell hat dieses Jahr mehrere aktualisierte Latitude-Modelle mit Intel Meteor Lake Prozessoren vorgestellt. Wir haben bereits das Latitude 9450 2-in-1Latitude 7350 Detachable und das Latitude 7350 getestet, so werfen wir nun einen Blick auf das Latitude 7450 2-in-1 Convertible, das auch in einem herkömmlichen Laptop-Formfaktor erhältlich ist. 

Das 2024 Latitude 7450 ist Dells Angebot für die gehobene Mittelklasse und tritt die Nachfolge des Latitude 7440 vom letzten Jahr an. Unser Testsample wird angetrieben vom Intel Core Ultra 7 165U vPro Prozessor, gepaart mit 32 GB LPDDR5x-6400 RAM, einem 14-Zoll FHD+ 60 Hz Touch-Display, Wi-Fi 7 und einem 57 Wh Akku.

Spezifikationen

Dell Latitude 7450 2-in-1 (Latitude 7400 Serie)
Prozessor
Intel Core Ultra 7 165U 12 x 3.8 - 4.9 GHz, 44 W PL2 / Short Burst, 38 W PL1 / Sustained, Meteor Lake-P
Grafikkarte
RAM
32 GB 
, LPDDR5x-6400 Quad-Channel, Timings: 64-52-52-120
Bildschirm
14.00 Zoll 16:10, 1920 x 1200 Pixel 162 PPI, Yes, Native Unterstützung für die Stifteingabe, BOE NV140WU, IPS, Anti-glare, spiegelnd: nein, 60 Hz
Mainboard
Intel Meteor Lake-U/P/H PCH
Massenspeicher
Micron 2550 512GB, 512 GB 
, 416 GB verfügbar
Soundkarte
Intel Meteor Lake-U/P/H PCH - cAVS (Audio, Voice, Speech)
Anschlüsse
2 USB 3.0 / 3.1 Gen1, 2 Thunderbolt, USB-C Power Delivery (PD), 1 HDMI, 2 DisplayPort, 1 Kensington Lock, Audio Anschlüsse: 3.5 mm combo audio jack, 1 Fingerprint Reader, Helligkeitssensor
Netzwerk
Intel Wi-Fi 7 BE200 320MHz (a/b/g/n = Wi-Fi 4/ac = Wi-Fi 5/ax = Wi-Fi 6/ Wi-Fi 6E 6 GHz be = Wi-Fi 7), Bluetooth 5.4
Abmessungen
Höhe x Breite x Tiefe (in mm): 17.1 x 313 x 222.8
Akku
57 Wh Lithium-Polymer, 3-cell, ExpressCharge 1.0
Laden
Schnellladen / Quick Charge
Betriebssystem
Microsoft Windows 11 Pro
Kamera
Webcam: FHD IR
Primary Camera: 2.1 MPix
Sonstiges
Lautsprecher: Quad-speakers with Waves MaxxAudio Pro, Tastatur: Chiclet, Tastatur-Beleuchtung: ja, Dell Optimizer, Dell Pair, Dell Peripheral Manager, Dell Update, Dell Display Manager, 36 Monate Garantie
Gewicht
1.5 kg
Preis
2279 USD
Geizhals
Preisvergleich
Geizhals Bestpreis 1801.91€ (Historischer Bestpreis: 1575.43€)
Dell Latitude 7450, Core Ultra 7 165U, 16GB RAM, 512GB SSD, 5G, DE (GV98K / S010L745014DEAT_VP)
Hinweis: Der Hersteller kann abweichende Bauteile wie Bildschirme, Laufwerke und Speicherriegel mit ähnlichen Spezifikationen unter dem gleichen Modellnamen einsetzen.


Gehäuse und Anschlüsse: Erstklassige Vollaluminiumkonstruktion mit anständigem I/O

Das Latitude 7450 2-in-1 verfügt über ein schlankes Vollaluminiumgehäuse in der Farbe Titan Gray. Darüber hinaus gibt es die traditionelle Laptop-Variante auch in einer Magnesium-Konstruktion mit einem River Blue-Finish.

Die Aluminiumkonstruktion fühlt sich robust und hochwertig an, ohne Knarren oder Verwindungen, und das Gehäuse ist weitgehend resistent gegen Fingerabdrücke. Das Display und die Tastatur sind kaum biegsam. Auch die Scharniere sind stabil.

Während das Aluminiumgehäuse 1,5 kg wiegt, sind die SKUs aus Magnesium mit 1,3 kg deutlich leichter.

Die Anschlussauswahl des Latitude 7450 2-in-1 ist ähnlich wie im letzten Jahr. Dell verzichtet wieder einmal auf einen dedizierten Ethernet-Anschluss, aber der HDMI-Anschluss erhält ein Upgrade auf Version 2.1.

Unser Testgerät hat keinen Micro-SIM-Kartensteckplatz.

Dell Latitude 7450 2-in-1
Dell Latitude 7450 2-in-1: Interna

Größenvergleich

317.7 mm 226.9 mm 17.9 mm 1.5 kg313 mm 222.8 mm 17.1 mm 1.5 kg313.9 mm 219.9 mm 14.7 mm 1.5 kg312.8 mm 217.7 mm 15.5 mm 1.3 kg310.5 mm 215 mm 16.28 mm 1.6 kg292.94 mm 208 mm 8.9 mm 865 g297 mm 210 mm 1 mm 5.7 g
Links: HDMI 2.1-Ausgang, 2x Thunderbolt 4 mit Power Delivery und DisplayPort 2.1-Ausgang
Rechts: 3,5-mm-Kombi-Audiobuchse, 2x USB 3.2 Gen1 Typ-A (eine mit Power Share), keilförmiger Slot
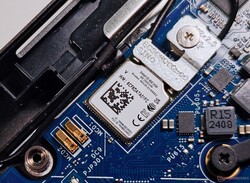
Gelötete Intel Wi-Fi 7 BE200 WLAN-Karte

Die Intel BE200 Wi-Fi 7 WLAN-Karte des Latitude 7450 liefert sowohl auf dem 5 GHz- als auch auf dem 6 GHz-Band eine starke Leistung ohne Übertragungsdrosselungen.

Der Durchsatz in diesen beiden Bändern ist nahezu identisch, wobei das 6-GHz-Band im Vergleich zum entsprechenden 5-GHz-Test 3,6 % höhere Empfangsgeschwindigkeiten aufweist.

Dell Optimizer ermöglicht die gleichzeitige Nutzung von zwei Verbindungen (kabelgebunden und drahtlos) für schnellere Downloads.

Leider ist die WLAN-Karte fest verlötet und kann nicht ausgetauscht werden.

Networking / iperf3 transmit AXE11000
Lenovo ThinkPad X1 2in1 G9 21KE004AGE
Intel Wi-Fi 6E AX211
1720 (1645min, 1656.89P1 - 1788max) MBit/s +5%
Dell Latitude 7450 2-in-1
Intel Wi-Fi 7 BE200 320MHz
1634 (1559min - 1703max) MBit/s
Dell Latitude 9450 2-in-1
Intel Wi-Fi 7 BE200 320MHz
1253 (724min - 1614max) MBit/s -23%
Durchschnittliche Intel Wi-Fi 7 BE200 320MHz
  (469 - 1642, n=20)
1192 MBit/s -27%
Durchschnitt der Klasse Convertible
  (426 - 1720, n=58, der letzten 2 Jahre)
1091 MBit/s -33%
Lenovo ThinkPad T14 G4 21K4S02000
Qualcomm WCN685x
1088 (710min - 1401max) MBit/s -33%
HP EliteBook x360 1040 G11
Intel Wi-Fi 6E AX211
908 (834min - 982max) MBit/s -44%
Dell Latitude 7350 Detachable
 
703 (616min - 919max) MBit/s -57%
Networking / iperf3 receive AXE11000
Dell Latitude 7450 2-in-1
Intel Wi-Fi 7 BE200 320MHz
1683 (1648min - 1718max) MBit/s
Lenovo ThinkPad X1 2in1 G9 21KE004AGE
Intel Wi-Fi 6E AX211
1663 (1611min, 1617.09P1 - 1699max) MBit/s -1%
Lenovo ThinkPad T14 G4 21K4S02000
Qualcomm WCN685x
1512 (1401min - 1621max) MBit/s -10%
Dell Latitude 9450 2-in-1
Intel Wi-Fi 7 BE200 320MHz
1427 (1249min - 1561max) MBit/s -15%
Durchschnittliche Intel Wi-Fi 7 BE200 320MHz
  (838 - 1701, n=20)
1358 MBit/s -19%
Durchschnitt der Klasse Convertible
  (492 - 1753, n=58, der letzten 2 Jahre)
1227 MBit/s -27%
HP EliteBook x360 1040 G11
Intel Wi-Fi 6E AX211
847 (792min - 868max) MBit/s -50%
Dell Latitude 7350 Detachable
 
773 (705min - 836max) MBit/s -54%
Networking / iperf3 transmit AXE11000 6GHz
Lenovo ThinkPad T14 G4 21K4S02000
Qualcomm WCN685x
1729 (1534min - 1921max) MBit/s +5%
Dell Latitude 7450 2-in-1
Intel Wi-Fi 7 BE200 320MHz
1644 (1463min - 1690max) MBit/s
HP EliteBook x360 1040 G11
Intel Wi-Fi 6E AX211
1408 (1281min - 1531max) MBit/s -14%
Durchschnittliche Intel Wi-Fi 7 BE200 320MHz
  (943 - 1653, n=15)
1390 MBit/s -15%
Dell Latitude 7350 Detachable
 
1382 (1298min - 1477max) MBit/s -16%
Durchschnitt der Klasse Convertible
  (685 - 1775, n=45, der letzten 2 Jahre)
1295 MBit/s -21%
Dell Latitude 9450 2-in-1
Intel Wi-Fi 7 BE200 320MHz
1049 (742min - 1160max) MBit/s -36%
Networking / iperf3 receive AXE11000 6GHz
Lenovo ThinkPad T14 G4 21K4S02000
Qualcomm WCN685x
1771 (1740min - 1791max) MBit/s +2%
Dell Latitude 7450 2-in-1
Intel Wi-Fi 7 BE200 320MHz
1743 (1699min - 1768max) MBit/s
Dell Latitude 7350 Detachable
 
1576 (1256min - 1616max) MBit/s -10%
Durchschnittliche Intel Wi-Fi 7 BE200 320MHz
  (1149 - 1770, n=15)
1537 MBit/s -12%
HP EliteBook x360 1040 G11
Intel Wi-Fi 6E AX211
1486 (1312min - 1573max) MBit/s -15%
Durchschnitt der Klasse Convertible
  (824 - 1771, n=45, der letzten 2 Jahre)
1427 MBit/s -18%
Dell Latitude 9450 2-in-1
Intel Wi-Fi 7 BE200 320MHz
1387 (1264min - 1447max) MBit/s -20%
0501001502002503003504004505005506006507007508008509009501000105011001150120012501300135014001450150015501600165017001750Tooltip
Dell Latitude 7450 2-in-1 Intel Wi-Fi 7 BE200 320MHz; iperf3 transmit AXE11000 6GHz; iperf 3.1.3: Ø1644 (1463-1690)
HP EliteBook x360 1040 G11 Intel Wi-Fi 6E AX211; iperf3 transmit AXE11000 6GHz; iperf 3.1.3: Ø1408 (1281-1531)
Dell Latitude 7450 2-in-1 Intel Wi-Fi 7 BE200 320MHz; iperf3 receive AXE11000 6GHz; iperf 3.1.3: Ø1742 (1699-1768)
HP EliteBook x360 1040 G11 Intel Wi-Fi 6E AX211; iperf3 receive AXE11000 6GHz; iperf 3.1.3: Ø1486 (1312-1573)
Dell Latitude 7450 2-in-1 Intel Wi-Fi 7 BE200 320MHz; iperf3 transmit AXE11000; iperf 3.1.3: Ø1634 (1559-1703)
HP EliteBook x360 1040 G11 Intel Wi-Fi 6E AX211; iperf3 transmit AXE11000; iperf 3.1.3: Ø908 (834-982)
Dell Latitude 7450 2-in-1 Intel Wi-Fi 7 BE200 320MHz; iperf3 receive AXE11000; iperf 3.1.3: Ø1682 (1648-1718)
HP EliteBook x360 1040 G11 Intel Wi-Fi 6E AX211; iperf3 receive AXE11000; iperf 3.1.3: Ø847 (792-868)

Dell bietet im Latitude 7450 2-in-1 nur eine 1080p-Webcam, während die Laptop-Variante mit einer 5 MP-Kamera konfiguriert werden kann. Die Bildqualität ist für Videotelefonate brauchbar, sofern das Umgebungslicht gut ist.

Ein IR-Sensor ist zusätzlich zu einem Fingerabdruckleser an der Einschalttaste für Windows Hello-basierte Anmeldungen an Bord. Eine physische Webcam-Sichtschutzblende ist ebenfalls vorhanden.

Außerdem können Sie mit der Dell Optimizer App verschiedene Funktionen für die Anwesenheitserkennung konfigurieren, um die Privatsphäre zu verbessern.
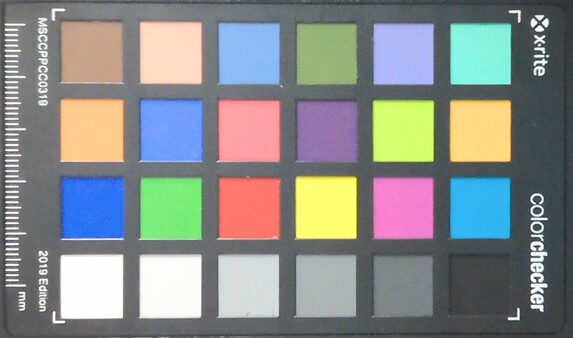
ColorChecker
30.2 ∆E
17.8 ∆E
21.1 ∆E
25.3 ∆E
17.4 ∆E
12.8 ∆E
20.5 ∆E
25.6 ∆E
21.2 ∆E
21 ∆E
15.6 ∆E
13.9 ∆E
22.1 ∆E
23.8 ∆E
24.4 ∆E
14.1 ∆E
16 ∆E
18.4 ∆E
2.3 ∆E
11.8 ∆E
15.4 ∆E
19.3 ∆E
18.5 ∆E
5.7 ∆E
ColorChecker Dell Latitude 7450 2-in-1: 18.09 ∆E min: 2.33 - max: 30.21 ∆E

Nachhaltigkeit

Dell betont in den Marketingmaterialien für die Latitude-Serie deren Nachhaltigkeit. Nach Angaben des Unternehmens bestehen die Aluminiumgehäuse zu 50% aus recyceltem und zu 50% aus emissionsarmem Aluminium, während die Magnesiumoptionen zu 90% aus recyceltem Magnesium bestehen.

Das Gehäuse des Netzteils besteht zu 95% aus recyceltem Kunststoff und der interne Hitzeschild zu 98% aus recyceltem Aluminium.

Darüber hinaus versichert Dell, dass die Verpackung der Latitude-Serie vollständig aus recycelten oder erneuerbaren Materialien besteht, die alle zu 100% recycelbar sind.

Eingabegeräte: Touchscreen mit Stiftunterstützung

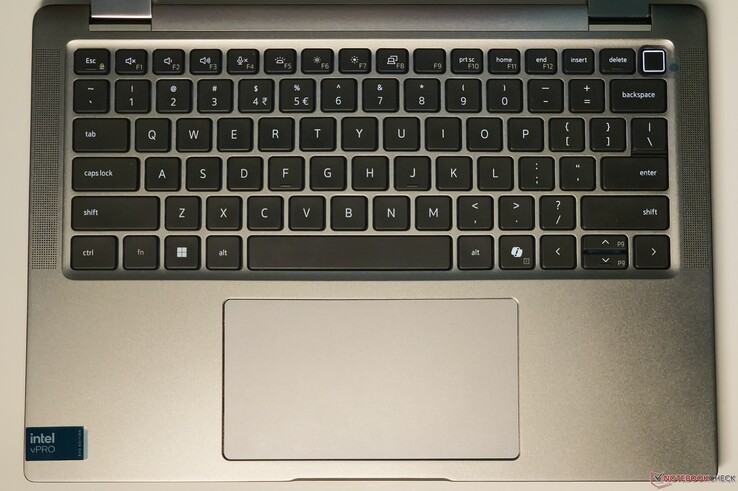
Das Latitude 7450 2-in-1 verfügt über eine spritzwassergeschützte Chiclet-Tastatur mit einer speziellen Co-Pilot-Taste. Die Tasten bieten einen ordentlichen Hub und einen guten Anschlag. Eine 2-stufige weiße Hintergrundbeleuchtung erleichtert die Lesbarkeit bei Dunkelheit.

Das 13,3 cm x 7 cm große Touchpad ist gegenüber dem letztjährigen Modell weitgehend unverändert. Die Klicks sind fest und haben einen großen Hubweg, obwohl sie etwas lauter sind als gewünscht. Die Oberfläche bietet volle Unterstützung für Windows Precision Gesten. Die oberen Ecken lassen sich nur schwer anklicken, aber die untere Hälfte des Touchpads ist sehr reaktionsschnell.

Als Convertible verfügt das Latitude 7450 2-in-1 über einen Touchscreen, der 10-Finger-Multitouch und Stifteingabe erkennt. Dell bietet keinen Eingabestift im Lieferumfang an, aber Sie können optional den Dell Active Pen PN5122W mit 4.096 Druckstufen erwerben.

Die Chiclet-Tastatur bietet ein gutes Tipperlebnis

Display: 60 Hz FHD+ IPS-Panel ohne PWM

Dell bietet ein 14-Zoll 16:10 FHD+ 60 Hz Touch IPS-Display für das Latitude 7450 2-in-1 an. Die reguläre Laptop-Variante kann optional mit einem QHD+ Touch-IPS-Panel konfiguriert werden. Wie bei den meisten Business-Laptops bleiben höhere Bildwiederholraten leider auch bei der Latitude-Produktreihe schwer zu erreichen.

Wir beobachten eine gute 85%ige Gleichmäßigkeit bei der Helligkeitsverteilung mit minimalem Backlight Bleeding. Die glänzende Oberfläche kann jedoch bei direktem Lichteinfall störend wirken.

Subpixelmatrix
Subpixelmatrix
Minimales Backlight Bleeding an den Rändern
331
cd/m²
335
cd/m²
358
cd/m²
312
cd/m²
333
cd/m²
327
cd/m²
312
cd/m²
319
cd/m²
304
cd/m²
Ausleuchtung des Bildschirms
BOE NV140WU getestet mit X-Rite i1Basic Pro 3
Maximal: 358 cd/m² (Nits) Durchschnitt: 325.7 cd/m² Minimum: 17 cd/m²
Ausleuchtung: 85 %
Helligkeit Akku: 332 cd/m²
Kontrast: 1233:1 (Schwarzwert: 0.27 cd/m²)
ΔE Color 2.46 | 0.5-29.43 Ø4.91, calibrated: 1.31
ΔE Greyscale 2.1 | 0.5-98 Ø5.2
76% AdobeRGB 1998 (Argyll 2.2.0 3D)
100% sRGB (Argyll 2.2.0 3D)
76.5% Display P3 (Argyll 2.2.0 3D)
Gamma: 2.2
Dell Latitude 7450 2-in-1
BOE NV140WU, IPS, 1920x1200, 14", 60 Hz
Lenovo ThinkPad X1 2in1 G9 21KE004AGE
ATNA4ßYK20-0, OLED, 2880x1800, 14", 120 Hz
Dell Latitude 9450 2-in-1
AU Optronics B140QAN, IPS, 2560x1600, 14", 60 Hz
Dell Latitude 7350 Detachable
BOE NE13A1M, IPS, 2880x1920, 13", 60 Hz
Lenovo ThinkPad T14 G4 21K4S02000
MNE007JA1-1, IPS LED, 1920x1200, 14",  Hz
HP EliteBook x360 1040 G11
CMN1474, IPS, 1920x1200, 14", 60 Hz
Display
20%
3%
-5%
-8%
-6%
Display P3 Coverage
76.5
99.9
31%
80.6
5%
70.2
-8%
67.1
-12%
69
-10%
sRGB Coverage
100
100
0%
100
0%
98.9
-1%
97.8
-2%
99.2
-1%
AdobeRGB 1998 Coverage
76
97.6
28%
80.1
5%
72.1
-5%
69.4
-9%
71.1
-6%
Response Times
98%
-60%
-13%
-8%
-47%
Response Time Grey 50% / Grey 80% *
35.65 ?(16.01, 19.64)
0.61 ?(0.31, 0.3)
98%
59.6 ?(27.8, 31.8)
-67%
43.8 ?(20.5, 23.3)
-23%
38.4 ?(18, 20.4)
-8%
54.5 ?(24.4, 30.1)
-53%
Response Time Black / White *
23.35 ?(11.77, 11.58)
0.69 ?(0.35, 0.34)
97%
35.6 ?(17, 18.6)
-52%
24.1 ?(10.3, 13.8)
-3%
25.1 ?(11.5, 13.6)
-7%
32.7 ?(16.1, 16.6)
-40%
PWM Frequency
240 ?(99)
Bildschirm
16%
15%
0%
24%
11%
Helligkeit Bildmitte
333
412
24%
501.4
51%
508.5
53%
398
20%
351.3
5%
Brightness
326
411
26%
491
51%
507
56%
379
16%
328
1%
Brightness Distribution
85
98
15%
88
4%
87
2%
90
6%
86
1%
Schwarzwert *
0.27
0.32
-19%
0.24
11%
0.23
15%
0.24
11%
Kontrast
1233
1567
27%
2119
72%
1730
40%
1464
19%
Delta E Colorchecker *
2.46
1.9
23%
2.52
-2%
3
-22%
1.3
47%
2.29
7%
Colorchecker dE 2000 max. *
4.58
3.9
15%
4.87
-6%
7.03
-53%
3.1
32%
4.55
1%
Colorchecker dE 2000 calibrated *
1.31
1.9
-45%
0.45
66%
1.28
2%
1.2
8%
0.49
63%
Delta E Graustufen *
2.1
1
52%
2.8
-33%
4.6
-119%
1.4
33%
2.2
-5%
Gamma
2.2 100%
2.21 100%
2.17 101%
2.17 101%
2.26 97%
2.13 103%
CCT
6578 99%
6361 102%
6270 104%
6929 94%
6448 101%
6321 103%
Durchschnitt gesamt (Programm / Settings)
45% / 30%
-14% / 2%
-6% / -3%
3% / 13%
-14% / -1%

* ... kleinere Werte sind besser

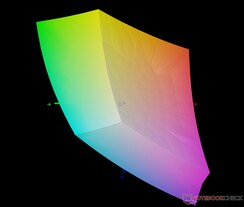
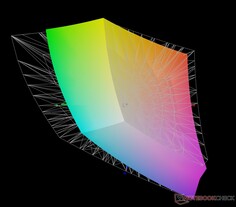
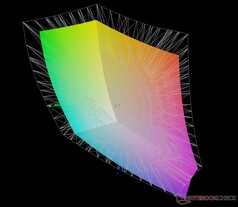
Das Display bietet eine vollständige Abdeckung des sRGB-Spektrums und eine anständige Adobe RGB- und Display P3-Abdeckung.

vs. sRGB: 100% Abdeckung
vs. Adobe RGB: 76,5% Abdeckung
vs. Display P3: 76% Abdeckung

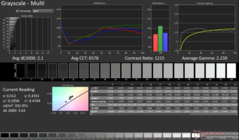
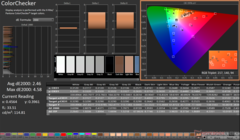
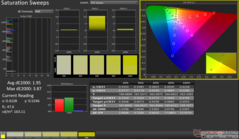
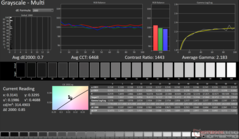
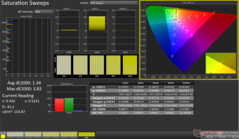
Das BOE-Panel in unserem Gerät bietet akzeptable DeltaE 2000-Werte. Unsere Kalibrierung mit dem X-Rite i1Basic Pro 3 Spektralphotometer und der Calman Ultimate Software von Portrait Displays trägt dazu bei, die DeltaE 2000-Werte für Graustufen und ColorChecker weiter zu verbessern.

Allerdings leidet das Panel immer noch unter großen Abweichungen im 100% blauen Teil des Spektrums.

Graustufen vor der Kalibrierung
ColorChecker vor der Kalibrierung
Sättigungs-Sweeps vor der Kalibrierung
Graustufen nach der Kalibrierung
ColorChecker nach der Kalibrierung
Sättigungs-Sweeps nach der Kalibrierung

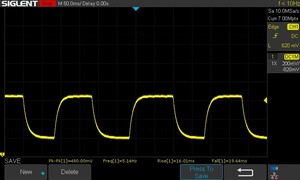
Reaktionszeiten (Response Times) des Displays

Die Reaktionszeiten (Response Times) beschreiben wie schnell zwischen zwei Farben eines Pixels umgeschaltet werden kann. Langsame Response Times können zu einer verschwommenen Darstellung, Schlieren und Geisterbilder führen. Besonders bei schnellen 3D-Spielen sind kurze Umschaltzeiten wichtig.
       Reaktionszeiten Schwarz zu Weiß
23.35 ms ... steigend ↗ und fallend ↘ kombiniert↗ 11.77 ms steigend
↘ 11.58 ms fallend
Die gemessenen Reaktionszeiten sind gut, für anspruchsvolle Spieler könnten der Bildschirm jedoch zu langsam sein.
Im Vergleich rangierten die bei uns getesteten Geräte von 0.1 (Minimum) zu 240 (Maximum) ms. » 50 % aller Screens waren schneller als der getestete.
Daher sind die gemessenen Reaktionszeiten schlechter als der Durchschnitt aller vermessenen Geräte (20.9 ms).
       Reaktionszeiten 50% Grau zu 80% Grau
35.65 ms ... steigend ↗ und fallend ↘ kombiniert↗ 16.01 ms steigend
↘ 19.64 ms fallend
Die gemessenen Reaktionszeiten sind langsam und dadurch für viele Spieler wahrscheinlich zu langsam.
Im Vergleich rangierten die bei uns getesteten Geräte von 0.165 (Minimum) zu 636 (Maximum) ms. » 46 % aller Screens waren schneller als der getestete.
Daher sind die gemessenen Reaktionszeiten durchschnittlich (32.8 ms).

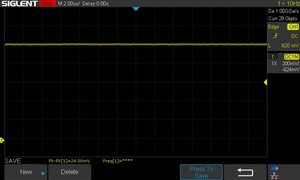
Bildschirm-Flackern / PWM (Pulse-Width Modulation)

Eine günstige Methode um die Helligkeit eines Bildschirms zu steuern, ist die Beleuchtung periodisch ein- und auszuschalten. Dies nennt sich PWM (Pulsweitenmodulation) Diese Umschaltung sollte mit einer hohen Frequenz stattfinden damit das menschliche Auge kein Flimmern wahrnimmt. Wenn die Frequenz zu niedrig ist, kann dies zu Ermüdungserscheinungen, Augenbrennen, Kopfweh und auch sichtbaren Flackern führen.
Flackern / PWM nicht festgestellt ≤ 100 % Helligkeit

Im Vergleich: 53 % aller getesteten Geräte nutzten kein PWM um die Helligkeit zu reduzieren. Wenn PWM eingesetzt wurde, dann bei einer Frequenz von durchschnittlich 8705 (Minimum 5, Maximum 343500) Hz.

0% Helligkeit: Keine PWM
10% Helligkeit: Keine PWM
25% Helligkeit: Keine PWM
50% Helligkeit: Keine PWM
75% Helligkeit: Keine PWM
100% Helligkeit: Keine PWM

Weitere Informationen finden Sie in unserem Artikel "Warum PWM so viel Kopfzerbrechen macht" und unserer PWM-Rangliste.

Das glänzende Display kann das Betrachten unter direktem Sonnenlicht etwas unangenehm machen. Die Betrachtungswinkel sind relativ stabil, ohne dass die Helligkeit oder die Farbinformationen in den extremen Bereichen beeinträchtigt werden.

Draußen bei bedecktem Himmel
Draußen im Schatten
Draußen im Schatten
Relativ stabile Blickwinkel

Performance: Core Ultra 7 165U vPro kämpft mit 44 W PL2 für lange Zeit

Das Latitude 7450 2-in-1 kommt entweder mit dem Intel Core Ultra 5 135U vPro oder dem Core Ultra 7 165U vPro.

Zusätzliche CPU-Optionen wie der Core Ultra 5 125U, der Core Ultra 7 155U und der 28 W Core Ultra 7 165H vPro sind für den Laptop-Formfaktor erhältlich.


Testbedingungen

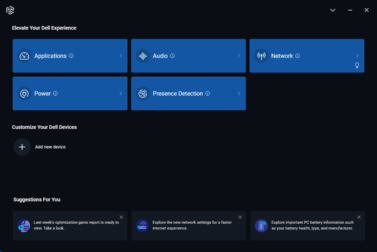
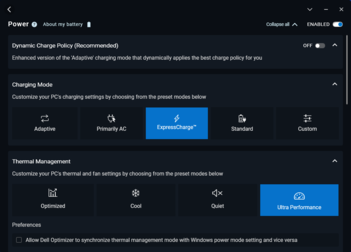
Dell bietet vier Leistungsmodi zur Auswahl über die Dell Optimizer App, die separat heruntergeladen werden kann.

Wir haben den Modus Ultra Performance für alle Benchmarks und den Modus Leise für die Akkutests verwendet. Es ist auch möglich, die Leistungsprofile des Dell Optimizer mit den Windows-Energiemodi zu synchronisieren.

Dell Optimizer App
Dell Optimizer App
Einstellungen für das Wärmemanagement
Performance modus PL1 (PBP) / Tau PL2 (MTP) / Tau Cinebench R15 Multi score Cinebench R15 Multi score (30 Schleifen)
Leise 11 W / 28 s 44 W / 2.44 ms 1680 (+2.5%) 889 (-26%)
Kühl 30 W / 28 s 44 W / 2,44 ms 1345 (-17,8%) 1026 (-15%)
Optimiert 35 W / 28 s 44 W / 2,44 ms - -
Ultra Performance 38 W / 28 s 44 W / 2,44 ms 1638 (100%) 1209 (100%)

Prozessor

Der Intel Core Ultra 7 165U bietet eine gute Leistung, obwohl er Multi-Core nicht sehr gut verträgt

Die Leistung des Latitude 7450 2-in-1 Core Ultra 7 165U liegt im Bereich der durchschnittlichen Ergebnisse für diesen Prozessor.

Bemerkenswert ist, dass das Gerät in Single-Core-Benchmarks mit der ausgelieferten BIOS-Version eher schlecht abschneidet. Wir empfehlen Nutzern, auf die neueste Version 1.60 oder höher zu aktualisieren, die dieses Problem behebt.

Das Lenovo ThinkPad X1 2-in-1 G9 mit der gleichen CPU ist in der Lage, die kumulative Leistung des Latitude zu erreichen, obwohl es mit einem niedrigeren 40 W PL2 betrieben wird.

Nichtsdestotrotz schneidet das Latitude 7450 2-in-1 in den Geekbench 6.3 Single-Core- und kumulativen AIDA64-Tests geringfügig besser ab als das ThinkPad X1 2-in-1.

Wir beobachten CPU-Throttling in der Cinebench R15 Multi-Core-Schleife, ähnlich wie zuvor bei dem Latitude 7440 mit einem Core i5-1345U.

Cinebench R15 Multi Loop

0125250375500625750875100011251250137515001625175018752000212522502375Tooltip
Dell Latitude 7450 2-in-1 Intel Core Ultra 7 165U: Ø1385 (1049.21-1643.86)
Lenovo ThinkPad X1 2in1 G9 21KE004AGE Intel Core Ultra 7 165U: Ø1392 (1321.79-1604.56)
Dell Latitude 9450 2-in-1 Intel Core Ultra 7 165U: Ø1494 (1433.95-1667.01)
Dell Latitude 7350 Detachable Intel Core Ultra 7 164U: Ø1105 (1025.54-1304.29)
Lenovo ThinkPad T14 G4 21K4S02000 AMD Ryzen 7 PRO 7840U: Ø1965 (1946.38-2013.69)
HP EliteBook x360 1040 G11 Intel Core Ultra 7 165H: Ø1922 (1713.06-2466.7)
Dell Latitude 7440 Intel Core i5-1345U: Ø1310 (929.37-1541.9)
CPU Performance Rating: Percent
Cinebench R23: Multi Core | Single Core
Cinebench R20: CPU (Multi Core) | CPU (Single Core)
Cinebench R15: CPU Multi 64Bit | CPU Single 64Bit
Blender: v2.79 BMW27 CPU
7-Zip 18.03: 7z b 4 | 7z b 4 -mmt1
Geekbench 6.3: Multi-Core | Single-Core
Geekbench 5.5: Multi-Core | Single-Core
HWBOT x265 Benchmark v2.2: 4k Preset
LibreOffice : 20 Documents To PDF
R Benchmark 2.5: Overall mean
CPU Performance Rating
HP EliteBook x360 1040 G11
Intel Core Ultra 7 165H
83.2 pt
Lenovo ThinkPad T14 G4 21K4S02000
AMD Ryzen 7 PRO 7840U
77.6 pt
Dell Latitude 9450 2-in-1
Intel Core Ultra 7 165U
70.6 pt
Dell Latitude 7450 2-in-1
Intel Core Ultra 7 165U
67.8 pt
Durchschnitt der Klasse Convertible
 
66.9 pt
Lenovo ThinkPad X1 2in1 G9 21KE004AGE
Intel Core Ultra 7 165U
66.8 pt
Durchschnittliche Intel Core Ultra 7 165U
 
65.9 pt
Dell Latitude 7440 -2!
Intel Core i5-1345U
64.7 pt
Dell Latitude 7350 Detachable
Intel Core Ultra 7 164U
58 pt
Cinebench R23 / Multi Core
HP EliteBook x360 1040 G11
Intel Core Ultra 7 165H
14551 (13047.9min - 14551max) Points +37%
Lenovo ThinkPad T14 G4 21K4S02000
AMD Ryzen 7 PRO 7840U
12929 Points +22%
Dell Latitude 9450 2-in-1
Intel Core Ultra 7 165U
10797 (9637.37min - 10796.8max) Points +2%
Dell Latitude 7450 2-in-1
Intel Core Ultra 7 165U
10632 Points
Durchschnitt der Klasse Convertible
  (616 - 18698, n=64, der letzten 2 Jahre)
10358 Points -3%
Lenovo ThinkPad X1 2in1 G9 21KE004AGE
Intel Core Ultra 7 165U
10226 Points -4%
Durchschnittliche Intel Core Ultra 7 165U
  (8498 - 10797, n=4)
10038 Points -6%
Dell Latitude 7440
Intel Core i5-1345U
9795 (7630.48min - 9794.71max) Points -8%
Dell Latitude 7350 Detachable
Intel Core Ultra 7 164U
8766 (7212.24min - 8765.97max) Points -18%
Cinebench R23 / Single Core
HP EliteBook x360 1040 G11
Intel Core Ultra 7 165H
1759 Points +5%
Dell Latitude 7440
Intel Core i5-1345U
1757 Points +5%
Lenovo ThinkPad T14 G4 21K4S02000
AMD Ryzen 7 PRO 7840U
1747 Points +4%
Dell Latitude 9450 2-in-1
Intel Core Ultra 7 165U
1709 Points +2%
Dell Latitude 7450 2-in-1
Intel Core Ultra 7 165U
1679 Points
Lenovo ThinkPad X1 2in1 G9 21KE004AGE
Intel Core Ultra 7 165U
1662 Points -1%
Durchschnittliche Intel Core Ultra 7 165U
  (1507 - 1709, n=4)
1639 Points -2%
Durchschnitt der Klasse Convertible
  (308 - 1980, n=64, der letzten 2 Jahre)
1614 Points -4%
Dell Latitude 7350 Detachable
Intel Core Ultra 7 164U
1590 Points -5%
Cinebench R20 / CPU (Multi Core)
HP EliteBook x360 1040 G11
Intel Core Ultra 7 165H
5545 Points +34%
Lenovo ThinkPad T14 G4 21K4S02000
AMD Ryzen 7 PRO 7840U
4970 Points +20%
Dell Latitude 9450 2-in-1
Intel Core Ultra 7 165U
4176 Points +1%
Dell Latitude 7450 2-in-1
Intel Core Ultra 7 165U
4145 Points
Lenovo ThinkPad X1 2in1 G9 21KE004AGE
Intel Core Ultra 7 165U
3934 Points -5%
Durchschnitt der Klasse Convertible
  (242 - 7303, n=64, der letzten 2 Jahre)
3928 Points -5%
Durchschnittliche Intel Core Ultra 7 165U
  (3254 - 4176, n=4)
3877 Points -6%
Dell Latitude 7440
Intel Core i5-1345U
3610 Points -13%
Dell Latitude 7350 Detachable
Intel Core Ultra 7 164U
3212 Points -23%
Cinebench R20 / CPU (Single Core)
Lenovo ThinkPad T14 G4 21K4S02000
AMD Ryzen 7 PRO 7840U
684 Points +7%
HP EliteBook x360 1040 G11
Intel Core Ultra 7 165H
683 Points +6%
Dell Latitude 9450 2-in-1
Intel Core Ultra 7 165U
661 Points +3%
Dell Latitude 7440
Intel Core i5-1345U
656 Points +2%
Dell Latitude 7450 2-in-1
Intel Core Ultra 7 165U
642 Points
Durchschnittliche Intel Core Ultra 7 165U
  (604 - 661, n=4)
633 Points -1%
Lenovo ThinkPad X1 2in1 G9 21KE004AGE
Intel Core Ultra 7 165U
624 Points -3%
Durchschnitt der Klasse Convertible
  (149.8 - 781, n=63, der letzten 2 Jahre)
619 Points -4%
Dell Latitude 7350 Detachable
Intel Core Ultra 7 164U
602 Points -6%
Cinebench R15 / CPU Multi 64Bit
HP EliteBook x360 1040 G11
Intel Core Ultra 7 165H
2467 (1713.06min - 2466.7max) Points +49%
Lenovo ThinkPad T14 G4 21K4S02000
AMD Ryzen 7 PRO 7840U
2014 (1946.38min - 2013.69max) Points +21%
Durchschnitt der Klasse Convertible
  (110.1 - 2889, n=66, der letzten 2 Jahre)
1728 Points +4%
Dell Latitude 9450 2-in-1
Intel Core Ultra 7 165U
1667 (1433.95min - 1667.01max) Points +1%
Dell Latitude 7450 2-in-1
Intel Core Ultra 7 165U
1658 (1049.21min - 1643.86max) Points
Lenovo ThinkPad X1 2in1 G9 21KE004AGE
Intel Core Ultra 7 165U
1605 (1321.79min - 1604.56max) Points -3%
Durchschnittliche Intel Core Ultra 7 165U
  (1428 - 1667, n=4)
1590 Points -4%
Dell Latitude 7440
Intel Core i5-1345U
1542 (929.37min - 1541.9max) Points -7%
Dell Latitude 7350 Detachable
Intel Core Ultra 7 164U
1304 (1025.54min - 1304.29max) Points -21%
Cinebench R15 / CPU Single 64Bit
Lenovo ThinkPad T14 G4 21K4S02000
AMD Ryzen 7 PRO 7840U
273 Points +14%
HP EliteBook x360 1040 G11
Intel Core Ultra 7 165H
257 Points +8%
Dell Latitude 9450 2-in-1
Intel Core Ultra 7 165U
252 Points +5%
Dell Latitude 7440
Intel Core i5-1345U
244 Points +2%
Dell Latitude 7450 2-in-1
Intel Core Ultra 7 165U
239 Points
Durchschnitt der Klasse Convertible
  (68.6 - 302, n=63, der letzten 2 Jahre)
236 Points -1%
Durchschnittliche Intel Core Ultra 7 165U
  (220 - 252, n=4)
235 Points -2%
Lenovo ThinkPad X1 2in1 G9 21KE004AGE
Intel Core Ultra 7 165U
228 Points -5%
Dell Latitude 7350 Detachable
Intel Core Ultra 7 164U
225 Points -6%
Blender / v2.79 BMW27 CPU
Dell Latitude 7350 Detachable
Intel Core Ultra 7 164U
395 Seconds * -17%
Durchschnitt der Klasse Convertible
  (175 - 1059, n=60, der letzten 2 Jahre)
367 Seconds * -8%
Durchschnittliche Intel Core Ultra 7 165U
  (310 - 380, n=4)
341 Seconds * -1%
Dell Latitude 7450 2-in-1
Intel Core Ultra 7 165U
339 Seconds *
Lenovo ThinkPad X1 2in1 G9 21KE004AGE
Intel Core Ultra 7 165U
335 Seconds * +1%
Dell Latitude 7440
Intel Core i5-1345U
332 Seconds * +2%
Dell Latitude 9450 2-in-1
Intel Core Ultra 7 165U
310 Seconds * +9%
Lenovo ThinkPad T14 G4 21K4S02000
AMD Ryzen 7 PRO 7840U
248 Seconds * +27%
HP EliteBook x360 1040 G11
Intel Core Ultra 7 165H
231 Seconds * +32%
7-Zip 18.03 / 7z b 4
Lenovo ThinkPad T14 G4 21K4S02000
AMD Ryzen 7 PRO 7840U
57056 MIPS +45%
HP EliteBook x360 1040 G11
Intel Core Ultra 7 165H
56997 MIPS +44%
Dell Latitude 9450 2-in-1
Intel Core Ultra 7 165U
43441 MIPS +10%
Durchschnitt der Klasse Convertible
  (12977 - 72400, n=61, der letzten 2 Jahre)
42944 MIPS +9%
Lenovo ThinkPad X1 2in1 G9 21KE004AGE
Intel Core Ultra 7 165U
41133 MIPS +4%
Dell Latitude 7440
Intel Core i5-1345U
40563 MIPS +3%
Dell Latitude 7450 2-in-1
Intel Core Ultra 7 165U
39479 MIPS
Durchschnittliche Intel Core Ultra 7 165U
  (30898 - 43441, n=4)
38738 MIPS -2%
Dell Latitude 7350 Detachable
Intel Core Ultra 7 164U
29361 MIPS -26%
7-Zip 18.03 / 7z b 4 -mmt1
Lenovo ThinkPad T14 G4 21K4S02000
AMD Ryzen 7 PRO 7840U
5988 MIPS +23%
Dell Latitude 7440
Intel Core i5-1345U
5296 MIPS +9%
HP EliteBook x360 1040 G11
Intel Core Ultra 7 165H
5273 MIPS +9%
Durchschnitt der Klasse Convertible
  (3672 - 6493, n=61, der letzten 2 Jahre)
5221 MIPS +8%
Lenovo ThinkPad X1 2in1 G9 21KE004AGE
Intel Core Ultra 7 165U
4960 MIPS +2%
Dell Latitude 9450 2-in-1
Intel Core Ultra 7 165U
4938 MIPS +2%
Dell Latitude 7450 2-in-1
Intel Core Ultra 7 165U
4852 MIPS
Durchschnittliche Intel Core Ultra 7 165U
  (4644 - 4960, n=4)
4849 MIPS 0%
Dell Latitude 7350 Detachable
Intel Core Ultra 7 164U
4619 MIPS -5%
Geekbench 6.3 / Multi-Core
HP EliteBook x360 1040 G11
Intel Core Ultra 7 165H
12265 Points +28%
Durchschnitt der Klasse Convertible
  (3257 - 14513, n=41, der letzten 2 Jahre)
10411 Points +8%
Dell Latitude 9450 2-in-1
Intel Core Ultra 7 165U
9944 Points +3%
Dell Latitude 7450 2-in-1
Intel Core Ultra 7 165U
9618 Points
Durchschnittliche Intel Core Ultra 7 165U
  (9308 - 9944, n=4)
9578 Points 0%
Lenovo ThinkPad X1 2in1 G9 21KE004AGE
Intel Core Ultra 7 165U
9441 Points -2%
Dell Latitude 7350 Detachable
Intel Core Ultra 7 164U
8411 Points -13%
Lenovo ThinkPad T14 G4 21K4S02000
AMD Ryzen 7 PRO 7840U
7596 Points -21%
Geekbench 6.3 / Single-Core
HP EliteBook x360 1040 G11
Intel Core Ultra 7 165H
2437 Points +3%
Dell Latitude 7450 2-in-1
Intel Core Ultra 7 165U
2359 Points
Dell Latitude 9450 2-in-1
Intel Core Ultra 7 165U
2356 Points 0%
Durchschnitt der Klasse Convertible
  (1216 - 2814, n=42, der letzten 2 Jahre)
2325 Points -1%
Lenovo ThinkPad X1 2in1 G9 21KE004AGE
Intel Core Ultra 7 165U
2290 Points -3%
Durchschnittliche Intel Core Ultra 7 165U
  (2092 - 2359, n=5)
2274 Points -4%
Dell Latitude 7350 Detachable
Intel Core Ultra 7 164U
2136 Points -9%
Lenovo ThinkPad T14 G4 21K4S02000
AMD Ryzen 7 PRO 7840U
1896 Points -20%
Geekbench 5.5 / Multi-Core
HP EliteBook x360 1040 G11
Intel Core Ultra 7 165H
12204 Points +42%
Lenovo ThinkPad T14 G4 21K4S02000
AMD Ryzen 7 PRO 7840U
9663 Points +12%
Dell Latitude 9450 2-in-1
Intel Core Ultra 7 165U
8719 Points +2%
Durchschnitt der Klasse Convertible
  (663 - 14016, n=64, der letzten 2 Jahre)
8710 Points +1%
Dell Latitude 7450 2-in-1
Intel Core Ultra 7 165U
8590 Points
Lenovo ThinkPad X1 2in1 G9 21KE004AGE
Intel Core Ultra 7 165U
8564 Points 0%
Durchschnittliche Intel Core Ultra 7 165U
  (8028 - 8719, n=4)
8475 Points -1%
Dell Latitude 7440
Intel Core i5-1345U
8263 Points -4%
Dell Latitude 7350 Detachable
Intel Core Ultra 7 164U
7503 Points -13%
Geekbench 5.5 / Single-Core
Lenovo ThinkPad T14 G4 21K4S02000
AMD Ryzen 7 PRO 7840U
1881 Points +8%
HP EliteBook x360 1040 G11
Intel Core Ultra 7 165H
1806 Points +4%
Dell Latitude 7450 2-in-1
Intel Core Ultra 7 165U
1740 Points
Dell Latitude 9450 2-in-1
Intel Core Ultra 7 165U
1735 Points 0%
Lenovo ThinkPad X1 2in1 G9 21KE004AGE
Intel Core Ultra 7 165U
1732 Points 0%
Durchschnittliche Intel Core Ultra 7 165U
  (1714 - 1740, n=4)
1730 Points -1%
Dell Latitude 7440
Intel Core i5-1345U
1710 Points -2%
Durchschnitt der Klasse Convertible
  (319 - 2062, n=64, der letzten 2 Jahre)
1647 Points -5%
Dell Latitude 7350 Detachable
Intel Core Ultra 7 164U
1522 Points -13%
HWBOT x265 Benchmark v2.2 / 4k Preset
HP EliteBook x360 1040 G11
Intel Core Ultra 7 165H
16 fps +32%
Lenovo ThinkPad T14 G4 21K4S02000
AMD Ryzen 7 PRO 7840U
15.9 fps +31%
Dell Latitude 9450 2-in-1
Intel Core Ultra 7 165U
12.3 fps +2%
Dell Latitude 7450 2-in-1
Intel Core Ultra 7 165U
12.1 fps
Lenovo ThinkPad X1 2in1 G9 21KE004AGE
Intel Core Ultra 7 165U
11.6 fps -4%
Durchschnitt der Klasse Convertible
  (0.73 - 22.4, n=63, der letzten 2 Jahre)
11.5 fps -5%
Durchschnittliche Intel Core Ultra 7 165U
  (9.06 - 12.3, n=4)
11.3 fps -7%
Dell Latitude 7440
Intel Core i5-1345U
10.8 fps -11%
Dell Latitude 7350 Detachable
Intel Core Ultra 7 164U
9.01 fps -26%
LibreOffice / 20 Documents To PDF
HP EliteBook x360 1040 G11
Intel Core Ultra 7 165H
54.8 s * -10%
Durchschnitt der Klasse Convertible
  (42 - 121.5, n=60, der letzten 2 Jahre)
51.7 s * -4%
Dell Latitude 7450 2-in-1
Intel Core Ultra 7 165U
49.9 s *
Durchschnittliche Intel Core Ultra 7 165U
  (43.5 - 56.4, n=4)
49.5 s * +1%
Lenovo ThinkPad X1 2in1 G9 21KE004AGE
Intel Core Ultra 7 165U
48.1 s * +4%
Dell Latitude 7350 Detachable
Intel Core Ultra 7 164U
48 s * +4%
Lenovo ThinkPad T14 G4 21K4S02000
AMD Ryzen 7 PRO 7840U
46.9 s * +6%
Dell Latitude 7440
Intel Core i5-1345U
45.5 s * +9%
Dell Latitude 9450 2-in-1
Intel Core Ultra 7 165U
43.5 s * +13%
R Benchmark 2.5 / Overall mean
Dell Latitude 7350 Detachable
Intel Core Ultra 7 164U
0.531 sec * -6%
Durchschnitt der Klasse Convertible
  (0.4102 - 1.013, n=60, der letzten 2 Jahre)
0.517 sec * -3%
Durchschnittliche Intel Core Ultra 7 165U
  (0.4881 - 0.555, n=4)
0.512 sec * -2%
Lenovo ThinkPad X1 2in1 G9 21KE004AGE
Intel Core Ultra 7 165U
0.504 sec * -0%
Dell Latitude 7450 2-in-1
Intel Core Ultra 7 165U
0.502 sec *
Dell Latitude 7440
Intel Core i5-1345U
0.4948 sec * +1%
Dell Latitude 9450 2-in-1
Intel Core Ultra 7 165U
0.4881 sec * +3%
HP EliteBook x360 1040 G11
Intel Core Ultra 7 165H
0.4686 sec * +7%
Lenovo ThinkPad T14 G4 21K4S02000
AMD Ryzen 7 PRO 7840U
0.4676 sec * +7%

* ... kleinere Werte sind besser

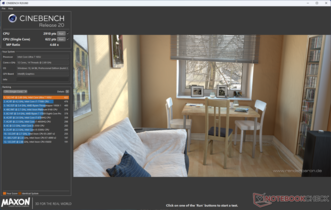
Cinebench R15 OpenGL 64Bit
108.39 fps
Cinebench R15 CPU Single 64Bit
239 Points
Cinebench R15 CPU Multi 64Bit
1658 Points
Cinebench R15 Ref. Match 64Bit
97.8 %
Cinebench R20 CPU (Multi Core)
4145 Points
Cinebench R20 CPU (Single Core)
642 Points
Cinebench R23 Single Core
1679 Points
Cinebench R23 Multi Core
10632 Points
Cinebench 2024 CPU Single Core
100 Points
Cinebench 2024 CPU Multi Core
492 Points
Hilfe

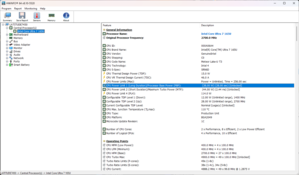
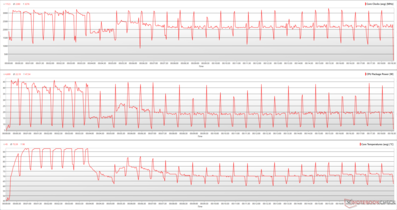
Die Analyse der CPU-Metriken während der Cinebench R15 Multi-Core-Schleife zeigt, dass der Core Ultra 7 165U des Latitude 7450 2-in-1 kurzzeitig 47,5 W verbraucht, während er zu Beginn des Laufs einen Spitzentakt von 3,27 GHz erreicht.

Obwohl die CPU zu Beginn der meisten Schleifen des Tests versucht, den Stromverbrauch zwischen 40 W und 45 W zu halten, fällt es ihr schwer, diesen Wert aufrechtzuerhalten, und sie sinkt schließlich auf einen Durchschnitt von 22 W, was zu einer durchschnittlichen Taktfrequenz von 2,28 GHz führt. Dieses Muster spiegelt sich auch in unseren Multi-Core-Stromverbrauchstests wider, zu denen wir gleich noch kommen werden.

In der 9. Schleife kommt es zu einem deutlichen Abfall der Leistungsaufnahme und der Taktraten, bevor sie sich wieder erholen, was mit dem Einbruch der Ergebnisse in der Schleifengrafik oben übereinstimmt.

Der Cinebench R20 Multi-Core-Score sinkt im Akkubetrieb um 29,8 %, während die Single-Core-Leistung mehr oder weniger gleich bleibt.

CPU-Takte, Gehäuseleistung und Kerntemperatur während einer Cinebench R15-Schleife
Cinebench R20-Scores wirken sich massiv auf die Akkuleistung aus
Performance Rating
Lenovo ThinkPad T14 G4 21K4S02000
AMD Ryzen 7 PRO 7840U, Radeon 780M
97.2 pt
HP EliteBook x360 1040 G11
Intel Core Ultra 7 165H, Arc 8-Core
76.3 pt
Durchschnitt der Klasse Convertible
 
59.6 pt
Dell Latitude 7450 2-in-1
Intel Core Ultra 7 165U, Graphics 4-Core
57.5 pt
Dell Latitude 9450 2-in-1
Intel Core Ultra 7 165U, Graphics 4-Core
57.3 pt
Lenovo ThinkPad X1 2in1 G9 21KE004AGE
Intel Core Ultra 7 165U, Graphics 4-Core
55.5 pt
Durchschnittliche Intel Core Ultra 7 165U
 
53.3 pt
Dell Latitude 7440
Intel Core i5-1345U, Iris Xe G7 80EUs
53 pt
Dell Latitude 7350 Detachable
Intel Core Ultra 7 164U, Graphics 4-Core
40.3 pt
AIDA64 / FP32 Ray-Trace
Lenovo ThinkPad T14 G4 21K4S02000
AMD Ryzen 7 PRO 7840U, Radeon 780M
20130 KRay/s +114%
HP EliteBook x360 1040 G11
Intel Core Ultra 7 165H, Arc 8-Core
12864 KRay/s +37%
Durchschnitt der Klasse Convertible
  (468 - 29594, n=64, der letzten 2 Jahre)
10295 KRay/s +9%
Dell Latitude 9450 2-in-1
Intel Core Ultra 7 165U, Graphics 4-Core
9685 KRay/s +3%
Dell Latitude 7450 2-in-1
Intel Core Ultra 7 165U, Graphics 4-Core
9421 KRay/s
Dell Latitude 7440
Intel Core i5-1345U, Iris Xe G7 80EUs
8830 KRay/s -6%
Lenovo ThinkPad X1 2in1 G9 21KE004AGE
Intel Core Ultra 7 165U, Graphics 4-Core
8822 KRay/s -6%
Durchschnittliche Intel Core Ultra 7 165U
  (6218 - 9685, n=4)
8537 KRay/s -9%
Dell Latitude 7350 Detachable
Intel Core Ultra 7 164U, Graphics 4-Core
5976 KRay/s -37%
AIDA64 / FPU Julia
Lenovo ThinkPad T14 G4 21K4S02000
AMD Ryzen 7 PRO 7840U, Radeon 780M
84324 Points +77%
HP EliteBook x360 1040 G11
Intel Core Ultra 7 165H, Arc 8-Core
67576 Points +42%
Durchschnitt der Klasse Convertible
  (2644 - 114033, n=63, der letzten 2 Jahre)
51457 Points +8%
Dell Latitude 7450 2-in-1
Intel Core Ultra 7 165U, Graphics 4-Core
47555 Points
Dell Latitude 9450 2-in-1
Intel Core Ultra 7 165U, Graphics 4-Core
46507 Points -2%
Lenovo ThinkPad X1 2in1 G9 21KE004AGE
Intel Core Ultra 7 165U, Graphics 4-Core
45125 Points -5%
Dell Latitude 7440
Intel Core i5-1345U, Iris Xe G7 80EUs
43149 Points -9%
Durchschnittliche Intel Core Ultra 7 165U
  (32054 - 47555, n=4)
42810 Points -10%
Dell Latitude 7350 Detachable
Intel Core Ultra 7 164U, Graphics 4-Core
29883 Points -37%
AIDA64 / CPU SHA3
Lenovo ThinkPad T14 G4 21K4S02000
AMD Ryzen 7 PRO 7840U, Radeon 780M
3970 MB/s +47%
HP EliteBook x360 1040 G11
Intel Core Ultra 7 165H, Arc 8-Core
3130 MB/s +16%
Dell Latitude 7450 2-in-1
Intel Core Ultra 7 165U, Graphics 4-Core
2694 MB/s
Lenovo ThinkPad X1 2in1 G9 21KE004AGE
Intel Core Ultra 7 165U, Graphics 4-Core
2609 MB/s -3%
Dell Latitude 9450 2-in-1
Intel Core Ultra 7 165U, Graphics 4-Core
2507 MB/s -7%
Durchschnitt der Klasse Convertible
  (182 - 4841, n=63, der letzten 2 Jahre)
2418 MB/s -10%
Durchschnittliche Intel Core Ultra 7 165U
  (1739 - 2694, n=4)
2387 MB/s -11%
Dell Latitude 7440
Intel Core i5-1345U, Iris Xe G7 80EUs
2265 MB/s -16%
Dell Latitude 7350 Detachable
Intel Core Ultra 7 164U, Graphics 4-Core
1638 MB/s -39%
AIDA64 / CPU Queen
Lenovo ThinkPad T14 G4 21K4S02000
AMD Ryzen 7 PRO 7840U, Radeon 780M
95384 Points +101%
HP EliteBook x360 1040 G11
Intel Core Ultra 7 165H, Arc 8-Core
82058 Points +73%
Durchschnitt der Klasse Convertible
  (10502 - 120368, n=63, der letzten 2 Jahre)
69685 Points +47%
Dell Latitude 7440
Intel Core i5-1345U, Iris Xe G7 80EUs
62953 Points +33%
Dell Latitude 7450 2-in-1
Intel Core Ultra 7 165U, Graphics 4-Core
47345 Points
Lenovo ThinkPad X1 2in1 G9 21KE004AGE
Intel Core Ultra 7 165U, Graphics 4-Core
46512 Points -2%
Durchschnittliche Intel Core Ultra 7 165U
  (45867 - 47345, n=4)
46445 Points -2%
Dell Latitude 9450 2-in-1
Intel Core Ultra 7 165U, Graphics 4-Core
45867 Points -3%
Dell Latitude 7350 Detachable
Intel Core Ultra 7 164U, Graphics 4-Core
40342 Points -15%
AIDA64 / FPU SinJulia
Lenovo ThinkPad T14 G4 21K4S02000
AMD Ryzen 7 PRO 7840U, Radeon 780M
12858 Points +125%
HP EliteBook x360 1040 G11
Intel Core Ultra 7 165H, Arc 8-Core
9024 Points +58%
Durchschnitt der Klasse Convertible
  (659 - 16315, n=63, der letzten 2 Jahre)
7064 Points +24%
Dell Latitude 9450 2-in-1
Intel Core Ultra 7 165U, Graphics 4-Core
5776 Points +1%
Dell Latitude 7450 2-in-1
Intel Core Ultra 7 165U, Graphics 4-Core
5704 Points
Lenovo ThinkPad X1 2in1 G9 21KE004AGE
Intel Core Ultra 7 165U, Graphics 4-Core
5411 Points -5%
Durchschnittliche Intel Core Ultra 7 165U
  (4547 - 5776, n=4)
5360 Points -6%
Dell Latitude 7440
Intel Core i5-1345U, Iris Xe G7 80EUs
5206 Points -9%
Dell Latitude 7350 Detachable
Intel Core Ultra 7 164U, Graphics 4-Core
4343 Points -24%
AIDA64 / FPU Mandel
Lenovo ThinkPad T14 G4 21K4S02000
AMD Ryzen 7 PRO 7840U, Radeon 780M
44731 Points +92%
HP EliteBook x360 1040 G11
Intel Core Ultra 7 165H, Arc 8-Core
33246 Points +42%
Durchschnitt der Klasse Convertible
  (1420 - 61249, n=63, der letzten 2 Jahre)
26214 Points +12%
Dell Latitude 7450 2-in-1
Intel Core Ultra 7 165U, Graphics 4-Core
23352 Points
Dell Latitude 9450 2-in-1
Intel Core Ultra 7 165U, Graphics 4-Core
23161 Points -1%
Lenovo ThinkPad X1 2in1 G9 21KE004AGE
Intel Core Ultra 7 165U, Graphics 4-Core
22066 Points -6%
Dell Latitude 7440
Intel Core i5-1345U, Iris Xe G7 80EUs
21556 Points -8%
Durchschnittliche Intel Core Ultra 7 165U
  (15677 - 23352, n=4)
21064 Points -10%
Dell Latitude 7350 Detachable
Intel Core Ultra 7 164U, Graphics 4-Core
15324 Points -34%
AIDA64 / CPU AES
Lenovo ThinkPad T14 G4 21K4S02000
AMD Ryzen 7 PRO 7840U, Radeon 780M
142329 MB/s +184%
HP EliteBook x360 1040 G11
Intel Core Ultra 7 165H, Arc 8-Core
66655 MB/s +33%
Dell Latitude 7450 2-in-1
Intel Core Ultra 7 165U, Graphics 4-Core
50177 MB/s
Durchschnitt der Klasse Convertible
  (1279 - 169089, n=63, der letzten 2 Jahre)
50162 MB/s 0%
Dell Latitude 9450 2-in-1
Intel Core Ultra 7 165U, Graphics 4-Core
48837 MB/s -3%
Lenovo ThinkPad X1 2in1 G9 21KE004AGE
Intel Core Ultra 7 165U, Graphics 4-Core
47090 MB/s -6%
Durchschnittliche Intel Core Ultra 7 165U
  (36912 - 50177, n=4)
45754 MB/s -9%
Dell Latitude 7440
Intel Core i5-1345U, Iris Xe G7 80EUs
41994 MB/s -16%
Dell Latitude 7350 Detachable
Intel Core Ultra 7 164U, Graphics 4-Core
34421 MB/s -31%
AIDA64 / CPU ZLib
HP EliteBook x360 1040 G11
Intel Core Ultra 7 165H, Arc 8-Core
912 MB/s +15%
Lenovo ThinkPad T14 G4 21K4S02000
AMD Ryzen 7 PRO 7840U, Radeon 780M
858 MB/s +8%
Dell Latitude 7450 2-in-1
Intel Core Ultra 7 165U, Graphics 4-Core
794 MB/s
Lenovo ThinkPad X1 2in1 G9 21KE004AGE
Intel Core Ultra 7 165U, Graphics 4-Core
752 MB/s -5%
Dell Latitude 9450 2-in-1
Intel Core Ultra 7 165U, Graphics 4-Core
732 MB/s -8%
Durchschnittliche Intel Core Ultra 7 165U
  (518 - 794, n=4)
699 MB/s -12%
Durchschnitt der Klasse Convertible
  (61.4 - 1243, n=63, der letzten 2 Jahre)
677 MB/s -15%
Dell Latitude 7440
Intel Core i5-1345U, Iris Xe G7 80EUs
640 MB/s -19%
Dell Latitude 7350 Detachable
Intel Core Ultra 7 164U, Graphics 4-Core
477 MB/s -40%
AIDA64 / FP64 Ray-Trace
Lenovo ThinkPad T14 G4 21K4S02000
AMD Ryzen 7 PRO 7840U, Radeon 780M
10555 KRay/s +116%
HP EliteBook x360 1040 G11
Intel Core Ultra 7 165H, Arc 8-Core
6708 KRay/s +37%
Durchschnitt der Klasse Convertible
  (254 - 16065, n=63, der letzten 2 Jahre)
5422 KRay/s +11%
Dell Latitude 9450 2-in-1
Intel Core Ultra 7 165U, Graphics 4-Core
4965 KRay/s +2%
Dell Latitude 7450 2-in-1
Intel Core Ultra 7 165U, Graphics 4-Core
4887 KRay/s
Dell Latitude 7440
Intel Core i5-1345U, Iris Xe G7 80EUs
4640 KRay/s -5%
Lenovo ThinkPad X1 2in1 G9 21KE004AGE
Intel Core Ultra 7 165U, Graphics 4-Core
4537 KRay/s -7%
Durchschnittliche Intel Core Ultra 7 165U
  (3182 - 4965, n=4)
4393 KRay/s -10%
Dell Latitude 7350 Detachable
Intel Core Ultra 7 164U, Graphics 4-Core
3062 KRay/s -37%
AIDA64 / CPU PhotoWorxx
Dell Latitude 9450 2-in-1
Intel Core Ultra 7 165U, Graphics 4-Core
49113 MPixel/s +12%
HP EliteBook x360 1040 G11
Intel Core Ultra 7 165H, Arc 8-Core
48762 MPixel/s +11%
Lenovo ThinkPad X1 2in1 G9 21KE004AGE
Intel Core Ultra 7 165U, Graphics 4-Core
45781 MPixel/s +4%
Durchschnittliche Intel Core Ultra 7 165U
  (41747 - 49113, n=4)
45143 MPixel/s +3%
Dell Latitude 7450 2-in-1
Intel Core Ultra 7 165U, Graphics 4-Core
43930 MPixel/s
Dell Latitude 7350 Detachable
Intel Core Ultra 7 164U, Graphics 4-Core
39546 MPixel/s -10%
Dell Latitude 7440
Intel Core i5-1345U, Iris Xe G7 80EUs
39231 MPixel/s -11%
Lenovo ThinkPad T14 G4 21K4S02000
AMD Ryzen 7 PRO 7840U, Radeon 780M
38442 MPixel/s -12%
Durchschnitt der Klasse Convertible
  (5136 - 53406, n=63, der letzten 2 Jahre)
36922 MPixel/s -16%

Sehen Sie sich dazu unsere spezielle Intel Core Ultra 7 165U Seite für weitere Informationen und Leistungsvergleiche an.

Leistung des Systems

Das Latitude 7450 2-in-1 bietet eine angemessene Leistung in den Systembenchmarks. Es fühlt sich bei täglichen Aufgaben nicht träge an und ist in der Lage, die meisten Anwendungen problemlos zu bewältigen.

PCMark 10 / Score
HP EliteBook x360 1040 G11
Arc 8-Core, Ultra 7 165H, Kioxia XG8 KXG80ZNV512G
6983 Points +9%
Lenovo ThinkPad T14 G4 21K4S02000
Radeon 780M, R7 PRO 7840U, Samsung PM9A1a MZVL21T0HDLU
6973 Points +9%
Dell Latitude 7450 2-in-1
Graphics 4-Core, Ultra 7 165U, Micron 2550 512GB
6421 Points
Dell Latitude 9450 2-in-1
Graphics 4-Core, Ultra 7 165U
6156 Points -4%
Durchschnittliche Intel Core Ultra 7 165U, Intel Graphics 4-Cores iGPU (Arc)
  (5893 - 6421, n=4)
6100 Points -5%
Durchschnitt der Klasse Convertible
  (1486 - 7963, n=60, der letzten 2 Jahre)
6006 Points -6%
Dell Latitude 7350 Detachable
Graphics 4-Core, Ultra 7 164U, Micron 2550 1TB
5933 Points -8%
Lenovo ThinkPad X1 2in1 G9 21KE004AGE
Graphics 4-Core, Ultra 7 165U, Kioxia XG8 KXG8AZNV1T02
5893 Points -8%
Dell Latitude 7440
Iris Xe G7 80EUs, i5-1345U, Samsung MZ9L4512HBLU-00BMV
5554 Points -14%
PCMark 10 / Essentials
Dell Latitude 9450 2-in-1
Graphics 4-Core, Ultra 7 165U
11238 Points 0%
Dell Latitude 7450 2-in-1
Graphics 4-Core, Ultra 7 165U, Micron 2550 512GB
11209 Points
Durchschnittliche Intel Core Ultra 7 165U, Intel Graphics 4-Cores iGPU (Arc)
  (10937 - 11238, n=4)
11152 Points -1%
HP EliteBook x360 1040 G11
Arc 8-Core, Ultra 7 165H, Kioxia XG8 KXG80ZNV512G
11052 Points -1%
Lenovo ThinkPad X1 2in1 G9 21KE004AGE
Graphics 4-Core, Ultra 7 165U, Kioxia XG8 KXG8AZNV1T02
10937 Points -2%
Lenovo ThinkPad T14 G4 21K4S02000
Radeon 780M, R7 PRO 7840U, Samsung PM9A1a MZVL21T0HDLU
10803 Points -4%
Dell Latitude 7440
Iris Xe G7 80EUs, i5-1345U, Samsung MZ9L4512HBLU-00BMV
10758 Points -4%
Durchschnitt der Klasse Convertible
  (3975 - 12059, n=60, der letzten 2 Jahre)
10580 Points -6%
Dell Latitude 7350 Detachable
Graphics 4-Core, Ultra 7 164U, Micron 2550 1TB
10497 Points -6%
PCMark 10 / Productivity
Lenovo ThinkPad T14 G4 21K4S02000
Radeon 780M, R7 PRO 7840U, Samsung PM9A1a MZVL21T0HDLU
9933 Points +14%
Dell Latitude 7350 Detachable
Graphics 4-Core, Ultra 7 164U, Micron 2550 1TB
8866 Points +1%
Dell Latitude 7450 2-in-1
Graphics 4-Core, Ultra 7 165U, Micron 2550 512GB
8751 Points
HP EliteBook x360 1040 G11
Arc 8-Core, Ultra 7 165H, Kioxia XG8 KXG80ZNV512G
8722 Points 0%
Durchschnittliche Intel Core Ultra 7 165U, Intel Graphics 4-Cores iGPU (Arc)
  (7722 - 8751, n=4)
8175 Points -7%
Dell Latitude 9450 2-in-1
Graphics 4-Core, Ultra 7 165U
8138 Points -7%
Durchschnitt der Klasse Convertible
  (2764 - 10800, n=60, der letzten 2 Jahre)
8011 Points -8%
Lenovo ThinkPad X1 2in1 G9 21KE004AGE
Graphics 4-Core, Ultra 7 165U, Kioxia XG8 KXG8AZNV1T02
7722 Points -12%
Dell Latitude 7440
Iris Xe G7 80EUs, i5-1345U, Samsung MZ9L4512HBLU-00BMV
7189 Points -18%
PCMark 10 / Digital Content Creation
HP EliteBook x360 1040 G11
Arc 8-Core, Ultra 7 165H, Kioxia XG8 KXG80ZNV512G
9587 Points +31%
Lenovo ThinkPad T14 G4 21K4S02000
Radeon 780M, R7 PRO 7840U, Samsung PM9A1a MZVL21T0HDLU
8575 Points +17%
Dell Latitude 7450 2-in-1
Graphics 4-Core, Ultra 7 165U, Micron 2550 512GB
7325 Points
Durchschnitt der Klasse Convertible
  (811 - 12360, n=60, der letzten 2 Jahre)
7096 Points -3%
Dell Latitude 9450 2-in-1
Graphics 4-Core, Ultra 7 165U
6925 Points -5%
Durchschnittliche Intel Core Ultra 7 165U, Intel Graphics 4-Cores iGPU (Arc)
  (6229 - 7325, n=4)
6763 Points -8%
Lenovo ThinkPad X1 2in1 G9 21KE004AGE
Graphics 4-Core, Ultra 7 165U, Kioxia XG8 KXG8AZNV1T02
6574 Points -10%
Dell Latitude 7350 Detachable
Graphics 4-Core, Ultra 7 164U, Micron 2550 1TB
6089 Points -17%
Dell Latitude 7440
Iris Xe G7 80EUs, i5-1345U, Samsung MZ9L4512HBLU-00BMV
6012 Points -18%
CrossMark / Overall
HP EliteBook x360 1040 G11
Arc 8-Core, Ultra 7 165H, Kioxia XG8 KXG80ZNV512G
1690 Points +10%
Lenovo ThinkPad T14 G4 21K4S02000
Radeon 780M, R7 PRO 7840U, Samsung PM9A1a MZVL21T0HDLU
1669 Points +8%
Dell Latitude 7450 2-in-1
Graphics 4-Core, Ultra 7 165U, Micron 2550 512GB
1539 Points
Durchschnittliche Intel Core Ultra 7 165U, Intel Graphics 4-Cores iGPU (Arc)
  (1471 - 1570, n=4)
1524 Points -1%
Dell Latitude 9450 2-in-1
Graphics 4-Core, Ultra 7 165U
1516 Points -1%
Durchschnitt der Klasse Convertible
  (310 - 1912, n=61, der letzten 2 Jahre)
1489 Points -3%
Lenovo ThinkPad X1 2in1 G9 21KE004AGE
Graphics 4-Core, Ultra 7 165U, Kioxia XG8 KXG8AZNV1T02
1471 Points -4%
Dell Latitude 7350 Detachable
Graphics 4-Core, Ultra 7 164U, Micron 2550 1TB
1338 Points -13%
CrossMark / Productivity
Lenovo ThinkPad T14 G4 21K4S02000
Radeon 780M, R7 PRO 7840U, Samsung PM9A1a MZVL21T0HDLU
1624 Points +10%
HP EliteBook x360 1040 G11
Arc 8-Core, Ultra 7 165H, Kioxia XG8 KXG80ZNV512G
1615 Points +9%
Durchschnittliche Intel Core Ultra 7 165U, Intel Graphics 4-Cores iGPU (Arc)
  (1448 - 1571, n=4)
1494 Points +1%
Dell Latitude 9450 2-in-1
Graphics 4-Core, Ultra 7 165U
1479 Points 0%
Dell Latitude 7450 2-in-1
Graphics 4-Core, Ultra 7 165U, Micron 2550 512GB
1479 Points
Durchschnitt der Klasse Convertible
  (389 - 1790, n=61, der letzten 2 Jahre)
1453 Points -2%
Lenovo ThinkPad X1 2in1 G9 21KE004AGE
Graphics 4-Core, Ultra 7 165U, Kioxia XG8 KXG8AZNV1T02
1448 Points -2%
Dell Latitude 7350 Detachable
Graphics 4-Core, Ultra 7 164U, Micron 2550 1TB
1359 Points -8%
CrossMark / Creativity
HP EliteBook x360 1040 G11
Arc 8-Core, Ultra 7 165H, Kioxia XG8 KXG80ZNV512G
1909 Points +13%
Lenovo ThinkPad T14 G4 21K4S02000
Radeon 780M, R7 PRO 7840U, Samsung PM9A1a MZVL21T0HDLU
1824 Points +8%
Dell Latitude 7450 2-in-1
Graphics 4-Core, Ultra 7 165U, Micron 2550 512GB
1685 Points
Dell Latitude 9450 2-in-1
Graphics 4-Core, Ultra 7 165U
1620 Points -4%
Durchschnittliche Intel Core Ultra 7 165U, Intel Graphics 4-Cores iGPU (Arc)
  (1555 - 1685, n=4)
1610 Points -4%
Durchschnitt der Klasse Convertible
  (252 - 2183, n=61, der letzten 2 Jahre)
1600 Points -5%
Lenovo ThinkPad X1 2in1 G9 21KE004AGE
Graphics 4-Core, Ultra 7 165U, Kioxia XG8 KXG8AZNV1T02
1555 Points -8%
Dell Latitude 7350 Detachable
Graphics 4-Core, Ultra 7 164U, Micron 2550 1TB
1351 Points -20%
CrossMark / Responsiveness
Lenovo ThinkPad T14 G4 21K4S02000
Radeon 780M, R7 PRO 7840U, Samsung PM9A1a MZVL21T0HDLU
1389 Points +5%
Durchschnittliche Intel Core Ultra 7 165U, Intel Graphics 4-Cores iGPU (Arc)
  (1305 - 1538, n=4)
1375 Points +4%
HP EliteBook x360 1040 G11
Arc 8-Core, Ultra 7 165H, Kioxia XG8 KXG80ZNV512G
1347 Points +2%
Dell Latitude 9450 2-in-1
Graphics 4-Core, Ultra 7 165U
1337 Points +1%
Dell Latitude 7450 2-in-1
Graphics 4-Core, Ultra 7 165U, Micron 2550 512GB
1319 Points
Lenovo ThinkPad X1 2in1 G9 21KE004AGE
Graphics 4-Core, Ultra 7 165U, Kioxia XG8 KXG8AZNV1T02
1305 Points -1%
Durchschnitt der Klasse Convertible
  (295 - 1868, n=61, der letzten 2 Jahre)
1270 Points -4%
Dell Latitude 7350 Detachable
Graphics 4-Core, Ultra 7 164U, Micron 2550 1TB
1240 Points -6%
AIDA64 / Memory Copy
HP EliteBook x360 1040 G11
Arc 8-Core, Ultra 7 165H, Kioxia XG8 KXG80ZNV512G
88831 MB/s +21%
Dell Latitude 9450 2-in-1
Graphics 4-Core, Ultra 7 165U
84739 MB/s +15%
Durchschnittliche Intel Core Ultra 7 165U, Intel Graphics 4-Cores iGPU (Arc)
  (69844 - 84739, n=4)
75319 MB/s +2%
Dell Latitude 7450 2-in-1
Graphics 4-Core, Ultra 7 165U, Micron 2550 512GB
73507 MB/s
Dell Latitude 7350 Detachable
Graphics 4-Core, Ultra 7 164U, Micron 2550 1TB
70163 MB/s -5%
Lenovo ThinkPad X1 2in1 G9 21KE004AGE
Graphics 4-Core, Ultra 7 165U, Kioxia XG8 KXG8AZNV1T02
69844 MB/s -5%
Lenovo ThinkPad T14 G4 21K4S02000
Radeon 780M, R7 PRO 7840U, Samsung PM9A1a MZVL21T0HDLU
67856 MB/s -8%
Durchschnitt der Klasse Convertible
  (16353 - 108544, n=63, der letzten 2 Jahre)
65139 MB/s -11%
Dell Latitude 7440
Iris Xe G7 80EUs, i5-1345U, Samsung MZ9L4512HBLU-00BMV
57716 MB/s -21%
AIDA64 / Memory Read
HP EliteBook x360 1040 G11
Arc 8-Core, Ultra 7 165H, Kioxia XG8 KXG80ZNV512G
87187 MB/s +57%
Lenovo ThinkPad X1 2in1 G9 21KE004AGE
Graphics 4-Core, Ultra 7 165U, Kioxia XG8 KXG8AZNV1T02
59571 MB/s +7%
Durchschnitt der Klasse Convertible
  (12706 - 125359, n=63, der letzten 2 Jahre)
58633 MB/s +5%
Dell Latitude 9450 2-in-1
Graphics 4-Core, Ultra 7 165U
57847 MB/s +4%
Durchschnittliche Intel Core Ultra 7 165U, Intel Graphics 4-Cores iGPU (Arc)
  (52264 - 59571, n=4)
56340 MB/s +1%
Dell Latitude 7450 2-in-1
Graphics 4-Core, Ultra 7 165U, Micron 2550 512GB
55676 MB/s
Dell Latitude 7350 Detachable
Graphics 4-Core, Ultra 7 164U, Micron 2550 1TB
53381 MB/s -4%
Lenovo ThinkPad T14 G4 21K4S02000
Radeon 780M, R7 PRO 7840U, Samsung PM9A1a MZVL21T0HDLU
50543 MB/s -9%
Dell Latitude 7440
Iris Xe G7 80EUs, i5-1345U, Samsung MZ9L4512HBLU-00BMV
50185 MB/s -10%
AIDA64 / Memory Write
Lenovo ThinkPad T14 G4 21K4S02000
Radeon 780M, R7 PRO 7840U, Samsung PM9A1a MZVL21T0HDLU
94965 MB/s +69%
HP EliteBook x360 1040 G11
Arc 8-Core, Ultra 7 165H, Kioxia XG8 KXG80ZNV512G
75839 MB/s +35%
Dell Latitude 7440
Iris Xe G7 80EUs, i5-1345U, Samsung MZ9L4512HBLU-00BMV
72373 MB/s +29%
Durchschnitt der Klasse Convertible
  (10177 - 117920, n=63, der letzten 2 Jahre)
65638 MB/s +17%
Lenovo ThinkPad X1 2in1 G9 21KE004AGE
Graphics 4-Core, Ultra 7 165U, Kioxia XG8 KXG8AZNV1T02
64848 MB/s +16%
Dell Latitude 9450 2-in-1
Graphics 4-Core, Ultra 7 165U
63397 MB/s +13%
Durchschnittliche Intel Core Ultra 7 165U, Intel Graphics 4-Cores iGPU (Arc)
  (56033 - 64848, n=4)
61722 MB/s +10%
Dell Latitude 7450 2-in-1
Graphics 4-Core, Ultra 7 165U, Micron 2550 512GB
56033 MB/s
Dell Latitude 7350 Detachable
Graphics 4-Core, Ultra 7 164U, Micron 2550 1TB
52714 MB/s -6%
AIDA64 / Memory Latency
Dell Latitude 7350 Detachable
Graphics 4-Core, Ultra 7 164U, Micron 2550 1TB
164.1 ns * -12%
Dell Latitude 7450 2-in-1
Graphics 4-Core, Ultra 7 165U, Micron 2550 512GB
146.4 ns *
Dell Latitude 9450 2-in-1
Graphics 4-Core, Ultra 7 165U
142.6 ns * +3%
Durchschnittliche Intel Core Ultra 7 165U, Intel Graphics 4-Cores iGPU (Arc)
  (137.8 - 146.4, n=4)
142.6 ns * +3%
HP EliteBook x360 1040 G11
Arc 8-Core, Ultra 7 165H, Kioxia XG8 KXG80ZNV512G
139.2 ns * +5%
Lenovo ThinkPad X1 2in1 G9 21KE004AGE
Graphics 4-Core, Ultra 7 165U, Kioxia XG8 KXG8AZNV1T02
137.8 ns * +6%
Lenovo ThinkPad T14 G4 21K4S02000
Radeon 780M, R7 PRO 7840U, Samsung PM9A1a MZVL21T0HDLU
131 ns * +11%
Durchschnitt der Klasse Convertible
  (7.4 - 173, n=63, der letzten 2 Jahre)
114.2 ns * +22%
Dell Latitude 7440
Iris Xe G7 80EUs, i5-1345U, Samsung MZ9L4512HBLU-00BMV
102.1 ns * +30%
WebXPRT 3 / Overall
Dell Latitude 7450 2-in-1
Graphics 4-Core, Ultra 7 165U, Micron 2550 512GB
399 Points
Lenovo ThinkPad T14 G4 21K4S02000
Radeon 780M, R7 PRO 7840U, Samsung PM9A1a MZVL21T0HDLU
317 Points -21%
Durchschnittliche Intel Core Ultra 7 165U, Intel Graphics 4-Cores iGPU (Arc)
  (261 - 399, n=4)
301 Points -25%
HP EliteBook x360 1040 G11
Arc 8-Core, Ultra 7 165H, Kioxia XG8 KXG80ZNV512G
295 Points -26%
Dell Latitude 9450 2-in-1
Graphics 4-Core, Ultra 7 165U
279 Points -30%
Dell Latitude 7440
Iris Xe G7 80EUs, i5-1345U, Samsung MZ9L4512HBLU-00BMV
274 Points -31%
Durchschnitt der Klasse Convertible
  (84.2 - 407, n=63, der letzten 2 Jahre)
271 Points -32%
Lenovo ThinkPad X1 2in1 G9 21KE004AGE
Graphics 4-Core, Ultra 7 165U, Kioxia XG8 KXG8AZNV1T02
265 Points -34%
Dell Latitude 7350 Detachable
Graphics 4-Core, Ultra 7 164U, Micron 2550 1TB
236 Points -41%
WebXPRT 4 / Overall
Dell Latitude 7450 2-in-1
Graphics 4-Core, Ultra 7 165U, Micron 2550 512GB
314 Points
HP EliteBook x360 1040 G11
Arc 8-Core, Ultra 7 165H, Kioxia XG8 KXG80ZNV512G
267 Points -15%
Durchschnittliche Intel Core Ultra 7 165U, Intel Graphics 4-Cores iGPU (Arc)
  (242 - 314, n=4)
264 Points -16%
Dell Latitude 9450 2-in-1
Graphics 4-Core, Ultra 7 165U
254 Points -19%
Dell Latitude 7440
Iris Xe G7 80EUs, i5-1345U, Samsung MZ9L4512HBLU-00BMV
242 Points -23%
Lenovo ThinkPad X1 2in1 G9 21KE004AGE
Graphics 4-Core, Ultra 7 165U, Kioxia XG8 KXG8AZNV1T02
242 Points -23%
Durchschnitt der Klasse Convertible
  (49.4 - 314, n=61, der letzten 2 Jahre)
227 Points -28%
Dell Latitude 7350 Detachable
Graphics 4-Core, Ultra 7 164U, Micron 2550 1TB
223 Points -29%
Mozilla Kraken 1.1 / Total
Durchschnitt der Klasse Convertible
  (407 - 2676, n=64, der letzten 2 Jahre)
641 ms * -58%
Dell Latitude 7350 Detachable
Graphics 4-Core, Ultra 7 164U, Micron 2550 1TB
611 ms * -50%
Lenovo ThinkPad X1 2in1 G9 21KE004AGE
Graphics 4-Core, Ultra 7 165U, Kioxia XG8 KXG8AZNV1T02
562 ms * -38%
Dell Latitude 7440
Iris Xe G7 80EUs, i5-1345U, Samsung MZ9L4512HBLU-00BMV
538 ms * -32%
Lenovo ThinkPad T14 G4 21K4S02000
Radeon 780M, R7 PRO 7840U, Samsung PM9A1a MZVL21T0HDLU
526 ms * -29%
Dell Latitude 9450 2-in-1
Graphics 4-Core, Ultra 7 165U
521 ms * -28%
HP EliteBook x360 1040 G11
Arc 8-Core, Ultra 7 165H, Kioxia XG8 KXG80ZNV512G
514 ms * -26%
Durchschnittliche Intel Core Ultra 7 165U, Intel Graphics 4-Cores iGPU (Arc)
  (407 - 562, n=4)
508 ms * -25%
Dell Latitude 7450 2-in-1
Graphics 4-Core, Ultra 7 165U, Micron 2550 512GB
406.8 ms *

* ... kleinere Werte sind besser

PCMark 8 Home Score Accelerated v2
4775 Punkte
PCMark 8 Work Score Accelerated v2
5305 Punkte
PCMark 10 Score
6421 Punkte
Hilfe

DPC-Latenzzeit

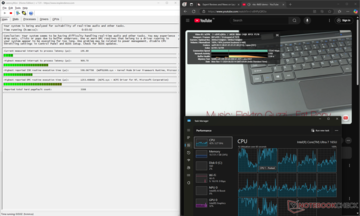
Das Latitude 7450 2-in-1 zeigt in unserer standardisierten Testroutine eine vernünftige Interrupt-to-Process-Latenz, was es für Echtzeit-Audio- und Video-Workflows geeignet machen sollte.

DPC-Latenzzeit
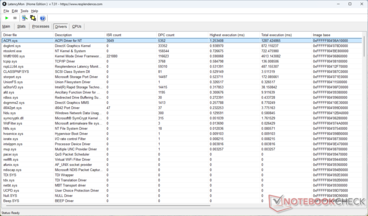
DPC-Latenzzeit
Der Treiber ACPI.sys hat die höchste Ausführungszeit.
DPC Latencies / LatencyMon - interrupt to process latency (max), Web, Youtube, Prime95
HP EliteBook x360 1040 G11
Arc 8-Core, Ultra 7 165H, Kioxia XG8 KXG80ZNV512G
3053.1 μs * -236%
Dell Latitude 9450 2-in-1
Graphics 4-Core, Ultra 7 165U
1836.7 μs * -102%
Dell Latitude 7350 Detachable
Graphics 4-Core, Ultra 7 164U, Micron 2550 1TB
1662.6 μs * -83%
Dell Latitude 7440
Iris Xe G7 80EUs, i5-1345U, Samsung MZ9L4512HBLU-00BMV
1203.08 μs * -32%
Dell Latitude 7450 2-in-1
Graphics 4-Core, Ultra 7 165U, Micron 2550 512GB
909.7 μs *
Lenovo ThinkPad X1 2in1 G9 21KE004AGE
Graphics 4-Core, Ultra 7 165U, Kioxia XG8 KXG8AZNV1T02
874.9 μs * +4%
Lenovo ThinkPad T14 G4 21K4S02000
Radeon 780M, R7 PRO 7840U, Samsung PM9A1a MZVL21T0HDLU
636.9 μs * +30%

* ... kleinere Werte sind besser

Unsere DPC Latenz-Rangliste bietet einen Überblick über die gemessenen Latenzzeiten der getesteten Laptops.

Speichergeräte

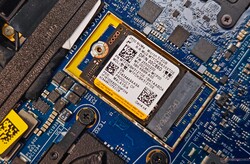
Es kann nur ein einziges M.2 2230-Laufwerk installiert werden.

Dell verwendet im Latitude 7450 2-in-1 eine M.2 2230 NVMe SSD anstelle der herkömmlichen M.2 2280.

Unser Gerät ist mit einem 512 GB Micron 2550-Laufwerk ausgestattet, das in den Speicherbenchmarks um 6 % hinter der 1-TB-Variante zurückbleibt, die im Latitude 7350 Detachable verwendet wird.

Die SSD zeigt in unserem DiskSpd-Leseschleifentest eine recht konstante Leistung mit minimalen Drosselungsproblemen. Es gibt keinen Spielraum für den Einbau einer weiteren M.2- oder SATA-SSD.

Micron 2550 512GB
CDM 5/6 Read Seq Q32T1: 4991.1 MB/s
CDM 5/6 Write Seq Q32T1: 3858.7 MB/s
CDM 5/6 Read 4K Q32T1: 412.3 MB/s
CDM 5/6 Write 4K Q32T1: 370.7 MB/s
CDM 5 Read Seq: 2420 MB/s
CDM 5 Write Seq: 3134 MB/s
CDM 5/6 Read 4K: 63.49 MB/s
CDM 5/6 Write 4K: 141.3 MB/s
CDM 6 Write 4K Q8T8: 373.6 MB/s
CDM 6 Read 4K Q8T8: 644 MB/s
Drive Performance Rating - Percent
Lenovo ThinkPad X1 2in1 G9 21KE004AGE
Kioxia XG8 KXG8AZNV1T02
92.6 pt
Lenovo ThinkPad T14 G4 21K4S02000
Samsung PM9A1a MZVL21T0HDLU
71.6 pt
HP EliteBook x360 1040 G11
Kioxia XG8 KXG80ZNV512G
61.7 pt
Dell Latitude 7350 Detachable
Micron 2550 1TB
55.7 pt
Durchschnittliche Micron 2550 512GB
 
54.9 pt
Dell Latitude 7450 2-in-1
Micron 2550 512GB
52.5 pt
Dell Latitude 9450 2-in-1
 
52.2 pt
Durchschnitt der Klasse Convertible
 
50 pt
Dell Latitude 7440
Samsung MZ9L4512HBLU-00BMV
47.1 pt
DiskSpd
seq read
Lenovo ThinkPad X1 2in1 G9 21KE004AGE
Kioxia XG8 KXG8AZNV1T02
3781 (3758.55min - 3780.54max) MB/s +74%
Lenovo ThinkPad T14 G4 21K4S02000
Samsung PM9A1a MZVL21T0HDLU
3417 (3399.9min - 3416.77max) MB/s +58%
HP EliteBook x360 1040 G11
Kioxia XG8 KXG80ZNV512G
3371 (3337.83min - 3370.54max) MB/s +55%
Dell Latitude 7350 Detachable
Micron 2550 1TB
2799 (2770.13min - 2798.92max) MB/s +29%
Durchschnitt der Klasse Convertible
  (321 - 4714, n=62, der letzten 2 Jahre)
2660 MB/s +23%
Dell Latitude 9450 2-in-1
 
2455 (2420.93min - 2454.72max) MB/s +13%
Dell Latitude 7440
Samsung MZ9L4512HBLU-00BMV
2443 (2427.84min - 2443.39max) MB/s +13%
Durchschnittliche Micron 2550 512GB
  (2168 - 2673, n=4)
2441 MB/s +13%
Dell Latitude 7450 2-in-1
Micron 2550 512GB
2168 (1667.86min - 2168.25max) MB/s
seq write
Lenovo ThinkPad X1 2in1 G9 21KE004AGE
Kioxia XG8 KXG8AZNV1T02
4824 (4693.38min - 4824.08max) MB/s +58%
Dell Latitude 7350 Detachable
Micron 2550 1TB
3367 (3050.92min - 3366.95max) MB/s +10%
Lenovo ThinkPad T14 G4 21K4S02000
Samsung PM9A1a MZVL21T0HDLU
3233 (3089.31min - 3233.18max) MB/s +6%
HP EliteBook x360 1040 G11
Kioxia XG8 KXG80ZNV512G
3104 (2871.13min - 3103.87max) MB/s +2%
Durchschnittliche Micron 2550 512GB
  (2477 - 3619, n=4)
3101 MB/s +1%
Dell Latitude 9450 2-in-1
 
3091 (808.18min - 3091.2max) MB/s +1%
Dell Latitude 7450 2-in-1
Micron 2550 512GB
3058 (102.34min - 3058.45max) MB/s
Durchschnitt der Klasse Convertible
  (195.5 - 5301, n=62, der letzten 2 Jahre)
2496 MB/s -18%
Dell Latitude 7440
Samsung MZ9L4512HBLU-00BMV
1776 (1737.28min - 1776.3max) MB/s -42%
seq q8 t1 read
Lenovo ThinkPad T14 G4 21K4S02000
Samsung PM9A1a MZVL21T0HDLU
7027 (5699.29min - 7026.72max) MB/s +42%
HP EliteBook x360 1040 G11
Kioxia XG8 KXG80ZNV512G
6768 (5543.64min - 6768.44max) MB/s +37%
Lenovo ThinkPad X1 2in1 G9 21KE004AGE
Kioxia XG8 KXG8AZNV1T02
6465 (5680.98min - 6465.1max) MB/s +31%
Dell Latitude 7350 Detachable
Micron 2550 1TB
5177 (3749.5min - 5176.53max) MB/s +5%
Dell Latitude 9450 2-in-1
 
5033 (4388.11min - 5032.75max) MB/s +2%
Durchschnittliche Micron 2550 512GB
  (4922 - 5057, n=4)
4976 MB/s +1%
Dell Latitude 7450 2-in-1
Micron 2550 512GB
4932 (4372min - 4931.87max) MB/s
Durchschnitt der Klasse Convertible
  (399 - 7152, n=62, der letzten 2 Jahre)
4622 MB/s -6%
Dell Latitude 7440
Samsung MZ9L4512HBLU-00BMV
3519 (2577.61min - 3518.81max) MB/s -29%
seq q8 t1 write
Lenovo ThinkPad X1 2in1 G9 21KE004AGE
Kioxia XG8 KXG8AZNV1T02
5472 (5258.79min - 5472.31max) MB/s +114%
HP EliteBook x360 1040 G11
Kioxia XG8 KXG80ZNV512G
4986 (4788.08min - 4985.98max) MB/s +95%
Lenovo ThinkPad T14 G4 21K4S02000
Samsung PM9A1a MZVL21T0HDLU
4924 (4892.94min - 4924.33max) MB/s +92%
Dell Latitude 7350 Detachable
Micron 2550 1TB
4559 (4534.62min - 4558.69max) MB/s +78%
Dell Latitude 9450 2-in-1
 
3981 (3754.15min - 3980.6max) MB/s +56%
Durchschnittliche Micron 2550 512GB
  (2560 - 4062, n=4)
3617 MB/s +41%
Durchschnitt der Klasse Convertible
  (215 - 5667, n=62, der letzten 2 Jahre)
3364 MB/s +31%
Dell Latitude 7450 2-in-1
Micron 2550 512GB
2560 (208.46min - 2559.99max) MB/s
Dell Latitude 7440
Samsung MZ9L4512HBLU-00BMV
2210 (2175.38min - 2210.17max) MB/s -14%
4k q1 t1 read
Dell Latitude 7440
Samsung MZ9L4512HBLU-00BMV
78.8 (76.59min - 78.83max) MB/s +96%
Lenovo ThinkPad T14 G4 21K4S02000
Samsung PM9A1a MZVL21T0HDLU
70 (69.61min - 70max) MB/s +74%
Lenovo ThinkPad X1 2in1 G9 21KE004AGE
Kioxia XG8 KXG8AZNV1T02
67.2 (66.31min - 67.21max) MB/s +67%
Dell Latitude 7350 Detachable
Micron 2550 1TB
64.8 (63.12min - 64.8max) MB/s +61%
Durchschnitt der Klasse Convertible
  (11.3 - 81.6, n=62, der letzten 2 Jahre)
57.5 MB/s +43%
Durchschnittliche Micron 2550 512GB
  (40.2 - 69.7, n=4)
56.7 MB/s +41%
HP EliteBook x360 1040 G11
Kioxia XG8 KXG80ZNV512G
54.3 (53.37min - 54.27max) MB/s +35%
Dell Latitude 9450 2-in-1
 
44.9 (44.41min - 44.94max) MB/s +12%
Dell Latitude 7450 2-in-1
Micron 2550 512GB
40.2 (38.87min - 40.15max) MB/s
4k q1 t1 write
Lenovo ThinkPad X1 2in1 G9 21KE004AGE
Kioxia XG8 KXG8AZNV1T02
189.9 (179.25min - 189.94max) MB/s +41%
Durchschnittliche Micron 2550 512GB
  (134.3 - 202, n=4)
154.8 MB/s +15%
Dell Latitude 7350 Detachable
Micron 2550 1TB
151.7 (149.7min - 151.65max) MB/s +13%
Lenovo ThinkPad T14 G4 21K4S02000
Samsung PM9A1a MZVL21T0HDLU
151 (149.72min - 151.04max) MB/s +12%
Durchschnitt der Klasse Convertible
  (48.4 - 398, n=62, der letzten 2 Jahre)
141.6 MB/s +5%
Dell Latitude 9450 2-in-1
 
137.1 (133.04min - 137.08max) MB/s +2%
Dell Latitude 7450 2-in-1
Micron 2550 512GB
134.3 (132.98min - 134.33max) MB/s
Dell Latitude 7440
Samsung MZ9L4512HBLU-00BMV
131.4 (129.27min - 131.42max) MB/s -2%
HP EliteBook x360 1040 G11
Kioxia XG8 KXG80ZNV512G
125.2 (121.28min - 125.17max) MB/s -7%
4k q32 t16 read
Lenovo ThinkPad X1 2in1 G9 21KE004AGE
Kioxia XG8 KXG8AZNV1T02
3522 (3437.73min - 3521.51max) MB/s +550%
Lenovo ThinkPad T14 G4 21K4S02000
Samsung PM9A1a MZVL21T0HDLU
1347 (1309.66min - 1347.08max) MB/s +149%
Durchschnittliche Micron 2550 512GB
  (542 - 2583, n=4)
1079 MB/s +99%
Durchschnitt der Klasse Convertible
  (156.4 - 3881, n=62, der letzten 2 Jahre)
958 MB/s +77%
HP EliteBook x360 1040 G11
Kioxia XG8 KXG80ZNV512G
810 (739.95min - 809.67max) MB/s +49%
Dell Latitude 7450 2-in-1
Micron 2550 512GB
542 (518.33min - 542.45max) MB/s
Dell Latitude 7440
Samsung MZ9L4512HBLU-00BMV
476 (466.05min - 475.52max) MB/s -12%
Dell Latitude 7350 Detachable
Micron 2550 1TB
434 (405.24min - 434.49max) MB/s -20%
Dell Latitude 9450 2-in-1
 
358 (353.65min - 357.92max) MB/s -34%
4k q32 t16 write
Lenovo ThinkPad X1 2in1 G9 21KE004AGE
Kioxia XG8 KXG8AZNV1T02
2413 (2320.95min - 2413.12max) MB/s +578%
Durchschnitt der Klasse Convertible
  (99.8 - 3537, n=62, der letzten 2 Jahre)
673 MB/s +89%
Durchschnittliche Micron 2550 512GB
  (356 - 1320, n=4)
608 MB/s +71%
Lenovo ThinkPad T14 G4 21K4S02000
Samsung PM9A1a MZVL21T0HDLU
502 (495.8min - 501.89max) MB/s +41%
HP EliteBook x360 1040 G11
Kioxia XG8 KXG80ZNV512G
401 (395.14min - 400.8max) MB/s +13%
Dell Latitude 9450 2-in-1
 
378 (301.45min - 377.68max) MB/s +6%
Dell Latitude 7440
Samsung MZ9L4512HBLU-00BMV
360 (355.44min - 360.36max) MB/s +1%
Dell Latitude 7450 2-in-1
Micron 2550 512GB
356 (353.94min - 356.37max) MB/s
Dell Latitude 7350 Detachable
Micron 2550 1TB
350 (335.93min - 350.1max) MB/s -2%
AS SSD
Score Total
Lenovo ThinkPad X1 2in1 G9 21KE004AGE
Kioxia XG8 KXG8AZNV1T02
8028 Points +105%
Lenovo ThinkPad T14 G4 21K4S02000
Samsung PM9A1a MZVL21T0HDLU
5803 Points +48%
HP EliteBook x360 1040 G11
Kioxia XG8 KXG80ZNV512G
4654 Points +19%
Dell Latitude 7450 2-in-1
Micron 2550 512GB
3917 Points
Dell Latitude 9450 2-in-1
 
3843 Points -2%
Durchschnitt der Klasse Convertible
  (394 - 8028, n=60, der letzten 2 Jahre)
3743 Points -4%
Dell Latitude 7440
Samsung MZ9L4512HBLU-00BMV
3533 Points -10%
Dell Latitude 7350 Detachable
Micron 2550 1TB
3472 Points -11%
Durchschnittliche Micron 2550 512GB
  (2375 - 4347, n=4)
3454 Points -12%
Score Read
Lenovo ThinkPad X1 2in1 G9 21KE004AGE
Kioxia XG8 KXG8AZNV1T02
3137 Points +198%
Lenovo ThinkPad T14 G4 21K4S02000
Samsung PM9A1a MZVL21T0HDLU
1712 Points +63%
HP EliteBook x360 1040 G11
Kioxia XG8 KXG80ZNV512G
1329 Points +26%
Durchschnitt der Klasse Convertible
  (186 - 3137, n=60, der letzten 2 Jahre)
1247 Points +19%
Dell Latitude 9450 2-in-1
 
1111 Points +6%
Dell Latitude 7350 Detachable
Micron 2550 1TB
1070 Points +2%
Durchschnittliche Micron 2550 512GB
  (950 - 1149, n=4)
1062 Points +1%
Dell Latitude 7450 2-in-1
Micron 2550 512GB
1052 Points
Dell Latitude 7440
Samsung MZ9L4512HBLU-00BMV
1028 Points -2%
Score Write
Lenovo ThinkPad X1 2in1 G9 21KE004AGE
Kioxia XG8 KXG8AZNV1T02
3315 Points +40%
Lenovo ThinkPad T14 G4 21K4S02000
Samsung PM9A1a MZVL21T0HDLU
3300 Points +39%
HP EliteBook x360 1040 G11
Kioxia XG8 KXG80ZNV512G
2750 Points +16%
Dell Latitude 7450 2-in-1
Micron 2550 512GB
2371 Points
Dell Latitude 9450 2-in-1
 
2221 Points -6%
Dell Latitude 7440
Samsung MZ9L4512HBLU-00BMV
2029 Points -14%
Dell Latitude 7350 Detachable
Micron 2550 1TB
1929 Points -19%
Durchschnittliche Micron 2550 512GB
  (1056 - 2661, n=4)
1915 Points -19%
Durchschnitt der Klasse Convertible
  (116 - 3348, n=60, der letzten 2 Jahre)
1912 Points -19%
Seq Read
Lenovo ThinkPad X1 2in1 G9 21KE004AGE
Kioxia XG8 KXG8AZNV1T02
5684 MB/s +51%
HP EliteBook x360 1040 G11
Kioxia XG8 KXG80ZNV512G
5151.21 MB/s +37%
Lenovo ThinkPad T14 G4 21K4S02000
Samsung PM9A1a MZVL21T0HDLU
4589.8 MB/s +22%
Dell Latitude 7350 Detachable
Micron 2550 1TB
4008.33 MB/s +6%
Durchschnittliche Micron 2550 512GB
  (3595 - 3952, n=4)
3812 MB/s +1%
Dell Latitude 9450 2-in-1
 
3809.37 MB/s +1%
Dell Latitude 7450 2-in-1
Micron 2550 512GB
3767.08 MB/s
Durchschnitt der Klasse Convertible
  (473 - 5684, n=60, der letzten 2 Jahre)
3519 MB/s -7%
Dell Latitude 7440
Samsung MZ9L4512HBLU-00BMV
3017.95 MB/s -20%
Seq Write
Lenovo ThinkPad X1 2in1 G9 21KE004AGE
Kioxia XG8 KXG8AZNV1T02
5229 MB/s +105%
HP EliteBook x360 1040 G11
Kioxia XG8 KXG80ZNV512G
2836.48 MB/s +11%
Lenovo ThinkPad T14 G4 21K4S02000
Samsung PM9A1a MZVL21T0HDLU
2622.82 MB/s +3%
Dell Latitude 7450 2-in-1
Micron 2550 512GB
2544.73 MB/s
Dell Latitude 9450 2-in-1
 
2302.92 MB/s -10%
Durchschnitt der Klasse Convertible
  (180 - 5229, n=60, der letzten 2 Jahre)
2192 MB/s -14%
Durchschnittliche Micron 2550 512GB
  (817 - 2609, n=4)
2135 MB/s -16%
Dell Latitude 7350 Detachable
Micron 2550 1TB
2090.41 MB/s -18%
Dell Latitude 7440
Samsung MZ9L4512HBLU-00BMV
1520.78 MB/s -40%
4K Read
Dell Latitude 7440
Samsung MZ9L4512HBLU-00BMV
72.35 MB/s +24%
Dell Latitude 7350 Detachable
Micron 2550 1TB
65.64 MB/s +12%
Lenovo ThinkPad T14 G4 21K4S02000
Samsung PM9A1a MZVL21T0HDLU
64.68 MB/s +11%
Dell Latitude 9450 2-in-1
 
61.05 MB/s +5%
Lenovo ThinkPad X1 2in1 G9 21KE004AGE
Kioxia XG8 KXG8AZNV1T02
61 MB/s +4%
Durchschnittliche Micron 2550 512GB
  (51.9 - 63.6, n=4)
59.4 MB/s +2%
Dell Latitude 7450 2-in-1
Micron 2550 512GB
58.4 MB/s
Durchschnitt der Klasse Convertible
  (11.4 - 82.4, n=60, der letzten 2 Jahre)
53.8 MB/s -8%
HP EliteBook x360 1040 G11
Kioxia XG8 KXG80ZNV512G
51.91 MB/s -11%
4K Write
Dell Latitude 7350 Detachable
Micron 2550 1TB
214.53 MB/s +22%
Dell Latitude 7440
Samsung MZ9L4512HBLU-00BMV
197.6 MB/s +12%
Dell Latitude 9450 2-in-1
 
183.52 MB/s +4%
Dell Latitude 7450 2-in-1
Micron 2550 512GB
176.13 MB/s
Durchschnittliche Micron 2550 512GB
  (138.4 - 201, n=4)
173.4 MB/s -2%
Lenovo ThinkPad X1 2in1 G9 21KE004AGE
Kioxia XG8 KXG8AZNV1T02
167.6 MB/s -5%
Durchschnitt der Klasse Convertible
  (41.5 - 347, n=60, der letzten 2 Jahre)
160.8 MB/s -9%
Lenovo ThinkPad T14 G4 21K4S02000
Samsung PM9A1a MZVL21T0HDLU
159.91 MB/s -9%
HP EliteBook x360 1040 G11
Kioxia XG8 KXG80ZNV512G
159.58 MB/s -9%
4K-64 Read
Lenovo ThinkPad X1 2in1 G9 21KE004AGE
Kioxia XG8 KXG8AZNV1T02
2508 MB/s +306%
Lenovo ThinkPad T14 G4 21K4S02000
Samsung PM9A1a MZVL21T0HDLU
1188.59 MB/s +93%
Durchschnitt der Klasse Convertible
  (126.9 - 2508, n=60, der letzten 2 Jahre)
843 MB/s +37%
HP EliteBook x360 1040 G11
Kioxia XG8 KXG80ZNV512G
761.59 MB/s +23%
Dell Latitude 9450 2-in-1
 
668.73 MB/s +8%
Dell Latitude 7440
Samsung MZ9L4512HBLU-00BMV
654.24 MB/s +6%
Durchschnittliche Micron 2550 512GB
  (527 - 690, n=4)
621 MB/s +1%
Dell Latitude 7450 2-in-1
Micron 2550 512GB
616.99 MB/s
Dell Latitude 7350 Detachable
Micron 2550 1TB
603.83 MB/s -2%
4K-64 Write
Lenovo ThinkPad T14 G4 21K4S02000
Samsung PM9A1a MZVL21T0HDLU
2878.08 MB/s +48%
Lenovo ThinkPad X1 2in1 G9 21KE004AGE
Kioxia XG8 KXG8AZNV1T02
2624 MB/s +35%
HP EliteBook x360 1040 G11
Kioxia XG8 KXG80ZNV512G
2307.16 MB/s +19%
Dell Latitude 7450 2-in-1
Micron 2550 512GB
1940.18 MB/s
Dell Latitude 9450 2-in-1
 
1807.57 MB/s -7%
Dell Latitude 7440
Samsung MZ9L4512HBLU-00BMV
1678.93 MB/s -13%
Durchschnitt der Klasse Convertible
  (38.4 - 2855, n=60, der letzten 2 Jahre)
1532 MB/s -21%
Durchschnittliche Micron 2550 512GB
  (796 - 2203, n=4)
1528 MB/s -21%
Dell Latitude 7350 Detachable
Micron 2550 1TB
1505.59 MB/s -22%
Access Time Read
Dell Latitude 9450 2-in-1
 
0.102 ms * -6%
Dell Latitude 7440
Samsung MZ9L4512HBLU-00BMV
0.098 ms * -2%
Dell Latitude 7450 2-in-1
Micron 2550 512GB
0.096 ms *
Dell Latitude 7350 Detachable
Micron 2550 1TB
0.091 ms * +5%
Durchschnitt der Klasse Convertible
  (0.021 - 0.244, n=60, der letzten 2 Jahre)
0.08697 ms * +9%
Durchschnittliche Micron 2550 512GB
  (0.032 - 0.097, n=4)
0.079 ms * +18%
Lenovo ThinkPad T14 G4 21K4S02000
Samsung PM9A1a MZVL21T0HDLU
0.058 ms * +40%
HP EliteBook x360 1040 G11
Kioxia XG8 KXG80ZNV512G
0.05 ms * +48%
Lenovo ThinkPad X1 2in1 G9 21KE004AGE
Kioxia XG8 KXG8AZNV1T02
0.048 ms * +50%
Access Time Write
Durchschnitt der Klasse Convertible
  (0.017 - 0.445, n=60, der letzten 2 Jahre)
0.09617 ms * -358%
Dell Latitude 7440
Samsung MZ9L4512HBLU-00BMV
0.091 ms * -333%
HP EliteBook x360 1040 G11
Kioxia XG8 KXG80ZNV512G
0.075 ms * -257%
Dell Latitude 9450 2-in-1
 
0.055 ms * -162%
Dell Latitude 7350 Detachable
Micron 2550 1TB
0.053 ms * -152%
Durchschnittliche Micron 2550 512GB
  (0.02 - 0.076, n=4)
0.03725 ms * -77%
Lenovo ThinkPad T14 G4 21K4S02000
Samsung PM9A1a MZVL21T0HDLU
0.026 ms * -24%
Lenovo ThinkPad X1 2in1 G9 21KE004AGE
Kioxia XG8 KXG8AZNV1T02
0.024 ms * -14%
Dell Latitude 7450 2-in-1
Micron 2550 512GB
0.021 ms *

* ... kleinere Werte sind besser

Disk throttling: DiskSpd Read Loop, Queue Depth 8

02505007501000125015001750200022502500275030003250350037504000425045004750Tooltip
Dell Latitude 7450 2-in-1; diskspd 2.0.17 f: Ø4813 (3955.71-4938.16)

Weitere Leistungsvergleiche finden Sie auf unserer speziellen SSD-Benchmarks-Seite.

GPU-Leistung

Die integrierte Arc 4-Kern iGPU schneidet in den Tests von 3DMark und Blender OneAPI wie erwartet ab. Die 3DMark Gesamtleistung ist 9% besser als die durchschnittlichen Ergebnisse für diese iGPU und 40% höher als die der Iris Xe Graphics G7 mit 80 EUs im Latitude 7440.

3DMark Performance Rating - Percent
HP EliteBook x360 1040 G11
Intel Arc 8-Core iGPU, Intel Core Ultra 7 165H
100 pt
Lenovo ThinkPad T14 G4 21K4S02000
AMD Radeon 780M, AMD Ryzen 7 PRO 7840U
84.8 pt
Durchschnitt der Klasse Convertible
 
71.6 pt
Dell Latitude 7450 2-in-1
Intel Graphics 4-Cores iGPU (Arc), Intel Core Ultra 7 165U
61.4 pt
Dell Latitude 9450 2-in-1
Intel Graphics 4-Cores iGPU (Arc), Intel Core Ultra 7 165U
60.1 pt
Lenovo ThinkPad X1 2in1 G9 21KE004AGE -1!
Intel Graphics 4-Cores iGPU (Arc), Intel Core Ultra 7 165U
59.2 pt
Durchschnittliche Intel Graphics 4-Cores iGPU (Arc)
 
56.3 pt
Dell Latitude 7350 Detachable
Intel Graphics 4-Cores iGPU (Arc), Intel Core Ultra 7 164U
51.6 pt
Dell Latitude 7440 -1!
Intel Iris Xe Graphics G7 80EUs, Intel Core i5-1345U
43.9 pt
3DMark 11 - 1280x720 Performance GPU
HP EliteBook x360 1040 G11
Intel Arc 8-Core iGPU, Intel Core Ultra 7 165H
12457 Points +75%
Lenovo ThinkPad T14 G4 21K4S02000
AMD Radeon 780M, AMD Ryzen 7 PRO 7840U
10862 Points +53%
Durchschnitt der Klasse Convertible
  (471 - 40768, n=62, der letzten 2 Jahre)
8774 Points +23%
Dell Latitude 7450 2-in-1
Intel Graphics 4-Cores iGPU (Arc), Intel Core Ultra 7 165U
7109 Points
Lenovo ThinkPad X1 2in1 G9 21KE004AGE
Intel Graphics 4-Cores iGPU (Arc), Intel Core Ultra 7 165U
7107 Points 0%
Dell Latitude 9450 2-in-1
Intel Graphics 4-Cores iGPU (Arc), Intel Core Ultra 7 165U
7055 Points -1%
Durchschnittliche Intel Graphics 4-Cores iGPU (Arc)
  (5764 - 7109, n=15)
6650 Points -6%
Dell Latitude 7350 Detachable
Intel Graphics 4-Cores iGPU (Arc), Intel Core Ultra 7 164U
6177 Points -13%
Dell Latitude 7440
Intel Iris Xe Graphics G7 80EUs, Intel Core i5-1345U
5485 Points -23%
3DMark
1280x720 Cloud Gate Standard Graphics
HP EliteBook x360 1040 G11
Intel Arc 8-Core iGPU, Intel Core Ultra 7 165H
46871 Points +50%
Lenovo ThinkPad T14 G4 21K4S02000
AMD Radeon 780M, AMD Ryzen 7 PRO 7840U
45874 Points +47%
Durchschnitt der Klasse Convertible
  (2965 - 154219, n=45, der letzten 2 Jahre)
36770 Points +18%
Dell Latitude 7450 2-in-1
Intel Graphics 4-Cores iGPU (Arc), Intel Core Ultra 7 165U
31234 Points
Dell Latitude 9450 2-in-1
Intel Graphics 4-Cores iGPU (Arc), Intel Core Ultra 7 165U
29517 Points -5%
Durchschnittliche Intel Graphics 4-Cores iGPU (Arc)
  (23935 - 31234, n=12)
28298 Points -9%
Dell Latitude 7350 Detachable
Intel Graphics 4-Cores iGPU (Arc), Intel Core Ultra 7 164U
23935 Points -23%
1920x1080 Fire Strike Graphics
HP EliteBook x360 1040 G11
Intel Arc 8-Core iGPU, Intel Core Ultra 7 165H
8961 Points +61%
Lenovo ThinkPad T14 G4 21K4S02000
AMD Radeon 780M, AMD Ryzen 7 PRO 7840U
7197 Points +30%
Durchschnitt der Klasse Convertible
  (365 - 29684, n=63, der letzten 2 Jahre)
6428 Points +16%
Dell Latitude 7450 2-in-1
Intel Graphics 4-Cores iGPU (Arc), Intel Core Ultra 7 165U
5554 Points
Lenovo ThinkPad X1 2in1 G9 21KE004AGE
Intel Graphics 4-Cores iGPU (Arc), Intel Core Ultra 7 165U
5498 Points -1%
Dell Latitude 9450 2-in-1
Intel Graphics 4-Cores iGPU (Arc), Intel Core Ultra 7 165U
5468 Points -2%
Durchschnittliche Intel Graphics 4-Cores iGPU (Arc)
  (4284 - 5554, n=16)
5119 Points -8%
Dell Latitude 7350 Detachable
Intel Graphics 4-Cores iGPU (Arc), Intel Core Ultra 7 164U
4785 Points -14%
Dell Latitude 7440
Intel Iris Xe Graphics G7 80EUs, Intel Core i5-1345U
4442 Points -20%
2560x1440 Time Spy Graphics
HP EliteBook x360 1040 G11
Intel Arc 8-Core iGPU, Intel Core Ultra 7 165H
3458 Points +67%
Lenovo ThinkPad T14 G4 21K4S02000
AMD Radeon 780M, AMD Ryzen 7 PRO 7840U
2551 Points +23%
Durchschnitt der Klasse Convertible
  (94 - 11749, n=62, der letzten 2 Jahre)
2272 Points +9%
Dell Latitude 7450 2-in-1
Intel Graphics 4-Cores iGPU (Arc), Intel Core Ultra 7 165U
2075 Points
Dell Latitude 9450 2-in-1
Intel Graphics 4-Cores iGPU (Arc), Intel Core Ultra 7 165U
2067 Points 0%
Lenovo ThinkPad X1 2in1 G9 21KE004AGE
Intel Graphics 4-Cores iGPU (Arc), Intel Core Ultra 7 165U
2049 Points -1%
Durchschnittliche Intel Graphics 4-Cores iGPU (Arc)
  (1622 - 2075, n=16)
1878 Points -9%
Dell Latitude 7350 Detachable
Intel Graphics 4-Cores iGPU (Arc), Intel Core Ultra 7 164U
1808 Points -13%
Dell Latitude 7440
Intel Iris Xe Graphics G7 80EUs, Intel Core i5-1345U
1318 Points -36%
3DMark 11 Performance
7632 Punkte
3DMark Ice Storm Standard Score
125758 Punkte
3DMark Cloud Gate Standard Score
24122 Punkte
3DMark Fire Strike Score
5295 Punkte
3DMark Fire Strike Extreme Score
2624 Punkte
3DMark Time Spy Score
2318 Punkte
3DMark Steel Nomad Score
427 Punkte
3DMark Steel Nomad Light Score
1749 Punkte
3DMark Steel Nomad Light Unlimited Score
1753 Punkte
Hilfe
Blender
v3.3 Classroom CPU
Dell Latitude 7350 Detachable
Intel Graphics 4-Cores iGPU (Arc), Intel Core Ultra 7 164U
770 Seconds * -17%
Durchschnittliche Intel Graphics 4-Cores iGPU (Arc)
  (548 - 1156, n=16)
709 Seconds * -8%
Dell Latitude 7450 2-in-1
Intel Graphics 4-Cores iGPU (Arc), Intel Core Ultra 7 165U
657 Seconds *
Durchschnitt der Klasse Convertible
  (269 - 2067, n=61, der letzten 2 Jahre)
656 Seconds * -0%
Dell Latitude 7440
Intel Iris Xe Graphics G7 80EUs, Intel Core i5-1345U
632 Seconds * +4%
Lenovo ThinkPad X1 2in1 G9 21KE004AGE
Intel Graphics 4-Cores iGPU (Arc), Intel Core Ultra 7 165U
628 Seconds * +4%
Dell Latitude 9450 2-in-1
Intel Graphics 4-Cores iGPU (Arc), Intel Core Ultra 7 165U
592 Seconds * +10%
Lenovo ThinkPad T14 G4 21K4S02000
AMD Radeon 780M, AMD Ryzen 7 PRO 7840U
410 Seconds * +38%
HP EliteBook x360 1040 G11
Intel Arc 8-Core iGPU, Intel Core Ultra 7 165H
406 Seconds * +38%
v3.3 Classroom oneAPI/Intel
Dell Latitude 7350 Detachable
Intel Graphics 4-Cores iGPU (Arc), Intel Core Ultra 7 164U
423 Seconds * -11%
Dell Latitude 7450 2-in-1
Intel Graphics 4-Cores iGPU (Arc), Intel Core Ultra 7 165U
382 Seconds *
Durchschnittliche Intel Graphics 4-Cores iGPU (Arc)
  (338 - 423, n=6)
370 Seconds * +3%
Durchschnitt der Klasse Convertible
  (208 - 423, n=9, der letzten 2 Jahre)
292 Seconds * +24%
HP EliteBook x360 1040 G11
Intel Arc 8-Core iGPU, Intel Core Ultra 7 165H
213 Seconds * +44%

* ... kleinere Werte sind besser

Das Latitude 7450 2-in-1 ist bei weitem kein Gaming-Laptop, aber die Arc iGPU schneidet in 1080p-Gaming-Tests besser ab als die Konkurrenz.

Performance Rating - Percent
HP EliteBook x360 1040 G11
Intel Core Ultra 7 165H, Intel Arc 8-Core iGPU
93.3 pt
Lenovo ThinkPad T14 G4 21K4S02000 -1!
AMD Ryzen 7 PRO 7840U, AMD Radeon 780M
89.9 pt
Durchschnitt der Klasse Convertible
 
81.7 pt
Dell Latitude 9450 2-in-1 -1!
Intel Core Ultra 7 165U, Intel Graphics 4-Cores iGPU (Arc)
64.7 pt
Dell Latitude 7450 2-in-1
Intel Core Ultra 7 165U, Intel Graphics 4-Cores iGPU (Arc)
63.2 pt
Lenovo ThinkPad X1 2in1 G9 21KE004AGE -1!
Intel Core Ultra 7 165U, Intel Graphics 4-Cores iGPU (Arc)
61.5 pt
Dell Latitude 7440 -1!
Intel Core i5-1345U, Intel Iris Xe Graphics G7 80EUs
54.2 pt
Dell Latitude 7350 Detachable
Intel Core Ultra 7 164U, Intel Graphics 4-Cores iGPU (Arc)
52.1 pt
Baldur's Gate 3 - 1920x1080 Ultra Preset
Durchschnitt der Klasse Convertible
  (10.5 - 63.1, n=15, der letzten 2 Jahre)
22.3 fps +60%
HP EliteBook x360 1040 G11
Intel Core Ultra 7 165H, Intel Arc 8-Core iGPU
20.4 fps +47%
Dell Latitude 7450 2-in-1
Intel Core Ultra 7 165U, Intel Graphics 4-Cores iGPU (Arc)
13.9 (11.2min, 11.4P0.1, 12P1) fps
Dell Latitude 7350 Detachable
Intel Core Ultra 7 164U, Intel Graphics 4-Cores iGPU (Arc)
11.5 fps -17%
Dell Latitude 9450 2-in-1
Intel Core Ultra 7 165U, Intel Graphics 4-Cores iGPU (Arc)
10.6 fps -24%
GTA V - 1920x1080 Highest Settings possible AA:4xMSAA + FX AF:16x
Lenovo ThinkPad T14 G4 21K4S02000
AMD Ryzen 7 PRO 7840U, AMD Radeon 780M
25.1 (2.96min, 17.2P1) fps +182%
Durchschnitt der Klasse Convertible
  (7.07 - 114.3, n=49, der letzten 2 Jahre)
17.6 fps +98%
HP EliteBook x360 1040 G11
Intel Core Ultra 7 165H, Intel Arc 8-Core iGPU
17.1 (1.72min, 12.3P1) fps +92%
Lenovo ThinkPad X1 2in1 G9 21KE004AGE
Intel Core Ultra 7 165U, Intel Graphics 4-Cores iGPU (Arc)
9 (1.588min, 6.54P1) fps +1%
Dell Latitude 7450 2-in-1
Intel Core Ultra 7 165U, Intel Graphics 4-Cores iGPU (Arc)
8.91 (1.463min, 6.33P1) fps
Dell Latitude 7440
Intel Core i5-1345U, Intel Iris Xe Graphics G7 80EUs
8.81 (4.42min, 5.46P1) fps -1%
Dell Latitude 7350 Detachable
Intel Core Ultra 7 164U, Intel Graphics 4-Cores iGPU (Arc)
7.55 (1.677min, 4.78P1) fps -15%
Final Fantasy XV Benchmark - 1920x1080 High Quality
HP EliteBook x360 1040 G11
Intel Core Ultra 7 165H, Intel Arc 8-Core iGPU
27.5 fps +49%
Lenovo ThinkPad T14 G4 21K4S02000
AMD Ryzen 7 PRO 7840U, AMD Radeon 780M
26.5 fps +43%
Durchschnitt der Klasse Convertible
  (4.48 - 107.1, n=60, der letzten 2 Jahre)
22 fps +19%
Dell Latitude 7450 2-in-1
Intel Core Ultra 7 165U, Intel Graphics 4-Cores iGPU (Arc)
18.5 fps
Dell Latitude 9450 2-in-1
Intel Core Ultra 7 165U, Intel Graphics 4-Cores iGPU (Arc)
18.2 fps -2%
Lenovo ThinkPad X1 2in1 G9 21KE004AGE
Intel Core Ultra 7 165U, Intel Graphics 4-Cores iGPU (Arc)
18.2 fps -2%
Dell Latitude 7440
Intel Core i5-1345U, Intel Iris Xe Graphics G7 80EUs
16.8 fps -9%
Dell Latitude 7350 Detachable
Intel Core Ultra 7 164U, Intel Graphics 4-Cores iGPU (Arc)
14.7 fps -21%
Strange Brigade - 1920x1080 ultra AA:ultra AF:16
HP EliteBook x360 1040 G11
Intel Core Ultra 7 165H, Intel Arc 8-Core iGPU
47.3 (5.3min, 10.1P1) fps +52%
Lenovo ThinkPad T14 G4 21K4S02000
AMD Ryzen 7 PRO 7840U, AMD Radeon 780M
44.6 (14.6min, 22.9P1) fps +43%
Durchschnitt der Klasse Convertible
  (10.8 - 196.9, n=56, der letzten 2 Jahre)
38.3 fps +23%
Dell Latitude 9450 2-in-1
Intel Core Ultra 7 165U, Intel Graphics 4-Cores iGPU (Arc)
33.3 (21.1min, 24.8P1) fps +7%
Lenovo ThinkPad X1 2in1 G9 21KE004AGE
Intel Core Ultra 7 165U, Intel Graphics 4-Cores iGPU (Arc)
32 fps +3%
Dell Latitude 7450 2-in-1
Intel Core Ultra 7 165U, Intel Graphics 4-Cores iGPU (Arc)
31.2 (7.8min, 12.8P1) fps
Dell Latitude 7350 Detachable
Intel Core Ultra 7 164U, Intel Graphics 4-Cores iGPU (Arc)
25.9 (13.7min, 15P1) fps -17%
Dell Latitude 7440
Intel Core i5-1345U, Intel Iris Xe Graphics G7 80EUs
21.9 (5min, 6.24P1) fps -30%
Dota 2 Reborn - 1920x1080 ultra (3/3) best looking
HP EliteBook x360 1040 G11
Intel Core Ultra 7 165H, Intel Arc 8-Core iGPU
74.4 (47.1min) fps +23%
Lenovo ThinkPad T14 G4 21K4S02000
AMD Ryzen 7 PRO 7840U, AMD Radeon 780M
67 (58.8min) fps +11%
Dell Latitude 7450 2-in-1
Intel Core Ultra 7 165U, Intel Graphics 4-Cores iGPU (Arc)
60.4 (38.8min) fps
Durchschnitt der Klasse Convertible
  (5.4 - 158.3, n=64, der letzten 2 Jahre)
58.6 fps -3%
Dell Latitude 9450 2-in-1
Intel Core Ultra 7 165U, Intel Graphics 4-Cores iGPU (Arc)
57.3 (44min) fps -5%
Lenovo ThinkPad X1 2in1 G9 21KE004AGE
Intel Core Ultra 7 165U, Intel Graphics 4-Cores iGPU (Arc)
56.9 (42.7min) fps -6%
Dell Latitude 7440
Intel Core i5-1345U, Intel Iris Xe Graphics G7 80EUs
56.3 (41.5min) fps -7%
Dell Latitude 7350 Detachable
Intel Core Ultra 7 164U, Intel Graphics 4-Cores iGPU (Arc)
48 (38.5min) fps -21%
X-Plane 11.11 - 1920x1080 high (fps_test=3)
HP EliteBook x360 1040 G11
Intel Core Ultra 7 165H, Intel Arc 8-Core iGPU
40.5 fps +49%
Durchschnitt der Klasse Convertible
  (3.91 - 101.4, n=64, der letzten 2 Jahre)
32.6 fps +20%
Lenovo ThinkPad T14 G4 21K4S02000
AMD Ryzen 7 PRO 7840U, AMD Radeon 780M
27.9 fps +3%
Dell Latitude 7450 2-in-1
Intel Core Ultra 7 165U, Intel Graphics 4-Cores iGPU (Arc)
27.1 fps
Dell Latitude 9450 2-in-1
Intel Core Ultra 7 165U, Intel Graphics 4-Cores iGPU (Arc)
25.3 fps -7%
Lenovo ThinkPad X1 2in1 G9 21KE004AGE
Intel Core Ultra 7 165U, Intel Graphics 4-Cores iGPU (Arc)
24.8 fps -8%
Dell Latitude 7350 Detachable
Intel Core Ultra 7 164U, Intel Graphics 4-Cores iGPU (Arc)
23.6 fps -13%
Dell Latitude 7440
Intel Core i5-1345U, Intel Iris Xe Graphics G7 80EUs
21.3 fps -21%

Cyberpunk 2077 1080p Ultra FPS Chart

01234567891011Tooltip
Dell Latitude 7450 2-in-1 Ultra 7 165U, Graphics 4-Core: Ø11.2 (9.83-11.9)
min.mittelhochmax.
GTA V (2015) 102.8 91.7 22.2 8.91
Dota 2 Reborn (2015) 96.2 67.3 52.9 60.4
Final Fantasy XV Benchmark (2018) 46.6 25.2 18.5
X-Plane 11.11 (2018) 41.2 31.9 27.1
Far Cry 5 (2018) 50 25 23 21
Strange Brigade (2018) 117.1 51.4 40.7 31.2
Baldur's Gate 3 (2023) 21.5 16.1 14.6 13.9
Cyberpunk 2077 2.1 Phantom Liberty (2023) 19.4 15.8 12.7 10.8

Unsere spezielle Seite zur Intel Arc 4-Kerne iGPU bietet weitere Informationen und Leistungsvergleiche.

Emissionen und Stromverbrauch: Niedrige Oberflächentemperaturen und sparsamer Stromverbrauch

Systemrauschen

Der Latitude 7450 2-in-1 verwendet eine Kombination aus einem Lüfter und einer Heatpipe.

Das Latitude 7450 2-in-1 arbeitet in allen Leistungsmodi geräuschlos, die Lüfter schalten sich nur bei spürbarer Belastung ein.

Der Geräuschpegel der Lüfter wird im Profil Ultra Performance unter 40 dB(A) gehalten.

Wir beobachteten nur etwas höhere Geräuschpegel während einer mäßigen Grafikauslastung im Vergleich zu einer kombinierten Volllast (Prime95 in-place large FFTs und FurMark 1.280 x 720 ohne AA) oder beim Spielen.

Lautstärkediagramm

Idle
23.53 / 23.53 / 23.53 dB(A)
Last
38.54 / 38.21 dB(A)
  red to green bar
 
 
30 dB
leise
40 dB(A)
deutlich hörbar
50 dB(A)
störend
 
min: dark, med: mid, max: light   Earthworks M23R, Arta (aus 15 cm gemessen)   Umgebungsgeräusche: 23.03 dB(A)
dB(A) 0102030405060708090Deep BassMiddle BassHigh BassLower RangeMidsHigher MidsLower HighsMid HighsUpper HighsSuper Highs2020.229.92518.521.73125.126.1401818.55020.522.36325.727.480252510023.221.712525.526.816019.921.920023.522.42501920.131518.22240018.219.85001620.263012.422.18009.523.810009.625.212508.925.616008.526.520009.427.72500827.931507.730.340007.127.350006.726.863006.624.680006.818.2100006.515.2125006.612.4160006.48.3SPL2338.2N0.52.7median 9.4median 22.4Delta5.43.8hearing rangehide median Fan NoiseDell Latitude 7450 2-in-1
Dell Latitude 7450 2-in-1
Intel Core Ultra 7 165U, Intel Graphics 4-Cores iGPU (Arc)
Lenovo ThinkPad X1 2in1 G9 21KE004AGE
Intel Core Ultra 7 165U, Intel Graphics 4-Cores iGPU (Arc)
Dell Latitude 9450 2-in-1
Intel Core Ultra 7 165U, Intel Graphics 4-Cores iGPU (Arc)
Dell Latitude 7350 Detachable
Intel Core Ultra 7 164U, Intel Graphics 4-Cores iGPU (Arc)
Lenovo ThinkPad T14 G4 21K4S02000
AMD Ryzen 7 PRO 7840U, AMD Radeon 780M
HP EliteBook x360 1040 G11
Intel Core Ultra 7 165H, Intel Arc 8-Core iGPU
Geräuschentwicklung
-12%
-4%
-3%
7%
-3%
aus / Umgebung *
23.03
24.5
-6%
23.9
-4%
22.9
1%
23.1
-0%
23
-0%
Idle min *
23.53
24.5
-4%
23.9
-2%
22.9
3%
23.1
2%
23
2%
Idle avg *
23.53
28
-19%
23.9
-2%
22.9
3%
23.1
2%
23
2%
Idle max *
23.53
29.8
-27%
23.9
-2%
24.4
-4%
23.1
2%
23
2%
Last avg *
38.54
41.7
-8%
36.4
6%
29.7
23%
26.5
31%
31
20%
Cyberpunk 2077 ultra *
38.2
47.2
-24%
45.7
-20%
Last max *
38.21
41.7
-9%
44.7
-17%
47.2
-24%
35.78
6%
47.7
-25%
Witcher 3 ultra *
41.7
44.7
35.7

* ... kleinere Werte sind besser

Oberflächentemperaturen

Die Oberflächentemperaturen sind im Großen und Ganzen gut erträglich. Bei extremer Belastung kann sich die Unterseite auf bis zu 45 °C erwärmen, aber bei normalem Gebrauch ist dies unwahrscheinlich.

Max. Last
 38.6 °C41.2 °C36 °C 
 36.6 °C36.2 °C31.8 °C 
 31.2 °C29.4 °C28.2 °C 
Maximal: 41.2 °C
Durchschnitt: 34.4 °C
35 °C41.2 °C45 °C
30.2 °C35.4 °C36 °C
29.2 °C32.2 °C32.6 °C
Maximal: 45 °C
Durchschnitt: 35.2 °C
Netzteil (max.)  35.8 °C | Raumtemperatur 22 °C | Amprobe TMD-50 // Fluke 62 Mini IR Thermometer
(±) Die Durchschnittstemperatur auf der Oberseite unter extremer Last ist 34.4 °C. Im Vergleich erhitzte sich der Durchschnitt der Geräteklasse Convertible auf 30.3 °C.
(±) Die maximale Temperatur auf der Oberseite ist 41.2 °C. Im Vergleich liegt der Klassendurchschnitt bei 35.4 °C (von 19.6 bis 60 °C für die Klasse Convertible).
(±) Auf der Unterseite messen wir eine maximalen Wert von 45 °C (im Vergleich zum Durchschnitt von 36.8 °C).
(+) Ohne Last messen wir eine durchschnittliche Temperatur von 25.7 °C auf der Oberseite. Der Klassendurchschnitt erreicht 30.3 °C.
(±) 3: The average temperature for the upper side is 34.4 °C / 94 F, compared to the average of 30.3 °C / 87 F for the class Convertible.
(+) Die Handballen und der Touchpad-Bereich sind mit gemessenen 31.6 °C kühler als die typische Hauttemperatur und fühlen sich dadurch kühl an.
(-) Die durchschnittliche Handballen-Temperatur anderer getesteter Geräte war 28 °C (-3.6 °C).
System im Leerlauf: Oberseite
System im Leerlauf: Unterseite
Prime95 + FurMark Stress: Oberseite
Prime95 + FurMark Stress: Unterseite
Cyberpunk 2077 2.1 1080p Ultra Stress: Oberseite
Cyberpunk 2077 2.1 Ultra Stress: Unterseite
Dell Latitude 7450 2-in-1
Intel Core Ultra 7 165U, Intel Graphics 4-Cores iGPU (Arc)
Lenovo ThinkPad X1 2in1 G9 21KE004AGE
Intel Core Ultra 7 165U, Intel Graphics 4-Cores iGPU (Arc)
Dell Latitude 9450 2-in-1
Intel Core Ultra 7 165U, Intel Graphics 4-Cores iGPU (Arc)
Dell Latitude 7350 Detachable
Intel Core Ultra 7 164U, Intel Graphics 4-Cores iGPU (Arc)
Lenovo ThinkPad T14 G4 21K4S02000
AMD Ryzen 7 PRO 7840U, AMD Radeon 780M
HP EliteBook x360 1040 G11
Intel Core Ultra 7 165H, Intel Arc 8-Core iGPU
Hitze
4%
6%
1%
-1%
3%
Last oben max *
41.2
42.9
-4%
35.4
14%
38.4
7%
43.5
-6%
39
5%
Last unten max *
45
43.6
3%
37.8
16%
40.6
10%
47.4
-5%
43.6
3%
Idle oben max *
27.2
24.4
10%
27.2
-0%
28.2
-4%
24.9
8%
24.4
10%
Idle unten max *
26.2
24.9
5%
28.2
-8%
28.6
-9%
26
1%
27.4
-5%

* ... kleinere Werte sind besser

Lautsprecher

Das Latitude 7450 2-in-1 erzeugt mit seinen vier Lautsprechern einen anständigen Klang mit ausreichender Lautstärke und ausgewogenen Mitten und Höhen. Wer eine bessere Qualität wünscht, kann externe Audioverbindungen über die 3,5-mm-Kombo-Audiobuchse oder Bluetooth 5.4 nutzen.

dB(A) 0102030405060708090Deep BassMiddle BassHigh BassLower RangeMidsHigher MidsLower HighsMid HighsUpper HighsSuper Highs2020.222.92518.520.23125.127.7401819.45020.522.96325.731802529.810023.240.112525.548.616019.955.220023.558.5250196131518.265.340018.263.25001667.463012.471.18009.568.910009.665.912508.971.816008.569.120009.468.72500868.531507.772.240007.170.750006.767.563006.664.480006.865.6100006.560.4125006.659.4160006.461.3SPL2381N0.551.7median 9.4median 65.6Delta5.44.726.325.821.422.12624.925.127.622.532.523.448.72655.818.860.922.167.2267019.372.317.674.217.774.319.575.31571.711.871.311.27410.574.21072.710.17210.67210.97511.374.811.671.71269.71269.612.371.112.669.61270.111.269.824.784.70.666.6median 12median 71.73.42.2hearing rangehide median Pink NoiseDell Latitude 7450 2-in-1Apple MacBook Pro 16 2021 M1 Pro
Frequenzdiagramm (für Vergleiche die Checkboxen oben an-/abwählen)
Dell Latitude 7450 2-in-1 Audio Analyse

(±) | Mittelmäßig laut spielende Lautsprecher (81 dB)
Bass 100 - 315 Hz
(±) | abgesenkter Bass - 10.9% geringer als der Median
(±) | durchschnittlich lineare Bass-Wiedergabe (10.5% Delta zum Vorgänger)
Mitteltöne 400 - 2000 Hz
(+) | ausgeglichene Mitten, vom Median nur 3.2% abweichend
(+) | lineare Mitten (5.4% Delta zum Vorgänger)
Hochtöne 2 - 16 kHz
(+) | ausgeglichene Hochtöne, vom Median nur 3.3% abweichend
(+) | sehr lineare Hochtöne (4.6% Delta zum Vorgänger)
Gesamt im hörbaren Bereich 100 - 16.000 Hz
(+) | hörbarer Bereich ist sehr linear (10.9% Abstand zum Median
Im Vergleich zu allen Geräten derselben Klasse
» 7% aller getesteten Geräte dieser Klasse waren besser, 2% vergleichbar, 92% schlechter
» Das beste Gerät hat einen Delta-Wert von 6%, durchschnittlich ist 21%, das schlechteste Gerät hat 57%
Im Vergleich zu allen Geräten im Test
» 5% aller getesteten Geräte waren besser, 1% vergleichbar, 94% schlechter
» Das beste Gerät hat einen Delta-Wert von 4%, durchschnittlich ist 25%, das schlechteste Gerät hat 134%

Apple MacBook Pro 16 2021 M1 Pro Audio Analyse

(+) | Die Lautsprecher können relativ laut spielen (84.7 dB)
Bass 100 - 315 Hz
(+) | guter Bass - nur 3.8% Abweichung vom Median
(+) | lineare Bass-Wiedergabe (5.2% Delta zum Vorgänger)
Mitteltöne 400 - 2000 Hz
(+) | ausgeglichene Mitten, vom Median nur 1.3% abweichend
(+) | lineare Mitten (2.1% Delta zum Vorgänger)
Hochtöne 2 - 16 kHz
(+) | ausgeglichene Hochtöne, vom Median nur 1.9% abweichend
(+) | sehr lineare Hochtöne (2.7% Delta zum Vorgänger)
Gesamt im hörbaren Bereich 100 - 16.000 Hz
(+) | hörbarer Bereich ist sehr linear (4.6% Abstand zum Median
Im Vergleich zu allen Geräten derselben Klasse
» 0% aller getesteten Geräte dieser Klasse waren besser, 0% vergleichbar, 100% schlechter
» Das beste Gerät hat einen Delta-Wert von 5%, durchschnittlich ist 18%, das schlechteste Gerät hat 45%
Im Vergleich zu allen Geräten im Test
» 0% aller getesteten Geräte waren besser, 0% vergleichbar, 100% schlechter
» Das beste Gerät hat einen Delta-Wert von 4%, durchschnittlich ist 25%, das schlechteste Gerät hat 134%

Stromverbrauch

Der Core Ultra 7 165U im Latitude 7450 2-in-1 erweist sich als Energiesparer. Sein Stromverbrauch im Leerlauf ist vergleichbar mit dem des AMD Ryzen 7 PRO 7840U im Lenovo ThinkPad T14 G4.

Das Latitude 9450 2-in-1 und das ThinkPad X1 2-in-1, die beide von einem Core Ultra 7 165U angetrieben werden, weisen insgesamt einen deutlich höheren Verbrauch auf, was hauptsächlich auf eine höhere Leistungsaufnahme im Leerlauf zurückzuführen ist.

Stromverbrauch
Aus / Standbydarklight 0.43 / 0.72 Watt
Idledarkmidlight 2.23 / 5.36 / 6.8 Watt
Last midlight 51.2 / 69.9 Watt
 color bar
Legende: min: dark, med: mid, max: light        Metrahit Energy
Dell Latitude 7450 2-in-1
Ultra 7 165U, Graphics 4-Core, IPS, 1920x1200, 14"
Lenovo ThinkPad X1 2in1 G9 21KE004AGE
Ultra 7 165U, Graphics 4-Core, OLED, 2880x1800, 14"
Dell Latitude 9450 2-in-1
Ultra 7 165U, Graphics 4-Core, IPS, 2560x1600, 14"
Dell Latitude 7350 Detachable
Ultra 7 164U, Graphics 4-Core, IPS, 2880x1920, 13"
Lenovo ThinkPad T14 G4 21K4S02000
R7 PRO 7840U, Radeon 780M, IPS LED, 1920x1200, 14"
HP EliteBook x360 1040 G11
Ultra 7 165H, Arc 8-Core, IPS, 1920x1200, 14"
Durchschnittliche Intel Graphics 4-Cores iGPU (Arc)
 
Durchschnitt der Klasse Convertible
 
Stromverbrauch
-70%
-26%
-5%
1%
-7%
-17%
-48%
Idle min *
2.23
7.3
-227%
3.2
-43%
3.6
-61%
3.3
-48%
1.8
19%
3.67 ?(2 - 7.3, n=15)
-65%
Idle avg *
5.36
10.1
-88%
6.4
-19%
6.1
-14%
5.6
-4%
4.4
18%
6.63 ?(4.4 - 10.1, n=15)
-24%
Idle max *
6.8
10.4
-53%
10.8
-59%
6.7
1%
6.1
10%
4.5
34%
8.26 ?(4.6 - 18.4, n=15)
-21%
Last avg *
51.2
45.7
11%
54.6
-7%
33.7
34%
40.1
22%
40.7
21%
Cyberpunk 2077 ultra *
29.5
37
-25%
56.5
-92%
Cyberpunk 2077 ultra external monitor *
34.6
31.8
8%
54.6
-58%
Last max *
69.9
64.1
8%
70.2
-0%
55.1
21%
51.8
26%
66
6%
Witcher 3 ultra *
35.2
35.5
41.4

* ... kleinere Werte sind besser

Die nachstehenden Cinebench-Diagramme zum Multicore-Stromverbrauch spiegeln unsere früheren Beobachtungen in Bezug auf die Paketleistung wider.

Das Kühlsystem des Latitude 7450 2-in-1 hat offensichtlich Schwierigkeiten, die 48 W PL2-Grenze lange aufrechtzuerhalten, insbesondere bei Multi-Core-Last. Es ist möglich, dass Dell einige aggressive thermische Drosselungsmaßnahmen einsetzt, sobald die Kerntemperaturen die 100 °C-Marke erreichen.

Power consumption: Cyberpunk 2077 / Stress test

05101520253035404550556065Tooltip
Dell Latitude 7450 2-in-1; 3DMark06 Return To Proxycon: Ø51.2 (45-55.7)
Dell Latitude 7450 2-in-1; 1280x720 Prime95 28.10 and Furmark 1.25: Ø40.2 (31.2-69.9)
Dell Latitude 7450 2-in-1; Cyberpunk 2077 FHD ultra no FSR 150cd: Ø29.5 (27.2-32.7)

Power consumption: External monitor

05101520253035404550556065Tooltip
Dell Latitude 7450 2-in-1; Prime95 V2810 Stress (external Monitor): Ø46.3 (26.1-68)
Dell Latitude 7450 2-in-1; Cinebench R15 Multi (external Monitor): Ø30.9 (23.6-64.5)
Dell Latitude 7450 2-in-1; Cinebench R23 Single (external Monitor): Ø26.1 (20.3-61.5)
Dell Latitude 7450 2-in-1; Cinebench R23 Multi (external Monitor): Ø28.4 (24.5-64.3)
Dell Latitude 7450 2-in-1; Cinebench 2024 Single Power (external Monitor): Ø31.8 (6.43-41.2)
Dell Latitude 7450 2-in-1; Cinebench 2024 Multi Power (external Monitor): Ø31.8 (24.4-66.6)
Dell Latitude 7450 2-in-1; Idle 1min (external Monitor): Ø4.87 (4.02-5.82)
Dell Latitude 7450 2-in-1; 1280x720 FurMark 1.19 GPU Stress Test (external Monitor): Ø28.7 (27-38.8)
Dell Latitude 7450 2-in-1; Cyberpunk 2077 FHD ultra no FSR (external Monitor): Ø34.6 (26.8-53)

Lebensdauer der Batterie

Der 57-Wh-Akku des Latitude 7450 2-in-1 bietet gute Laufzeiten in unseren Tests zum WLAN-Websurfen und zur 1080p H.264-Videowiedergabe bei 150 nits.

Das Convertible sollte problemlos einen typischen Arbeitstag durchhalten, insbesondere bei geringerer Bildschirmhelligkeit und aktivierter dynamischer Bildwiederholrate.

Das mitgelieferte 65-Watt-Netzteil unterstützt ExpressCharge-Schnellladung und benötigt etwas mehr als eine Stunde für eine vollständige Aufladung von 0 auf 100 Prozent.

Darüber hinaus bietet Dell Optimizer eine fein abgestufte Ladesteuerung mit Optionen für eine dynamische Ladepolitik und eine tageweise Ladeplanung.

Der 57-Wh-Akku bietet genug Reserven für einen durchschnittlichen Arbeitstag.
Akkulaufzeit
WiFi Websurfing
11h 00min
WiFi Websurfing max. Brightness
9h 17min
Big Buck Bunny H.264 1080p
12h 21min
Dell Latitude 7450 2-in-1
Ultra 7 165U, Graphics 4-Core, 57 Wh
Lenovo ThinkPad X1 2in1 G9 21KE004AGE
Ultra 7 165U, Graphics 4-Core, 57 Wh
Dell Latitude 9450 2-in-1
Ultra 7 165U, Graphics 4-Core, 60 Wh
Dell Latitude 7350 Detachable
Ultra 7 164U, Graphics 4-Core, 46.5 Wh
Lenovo ThinkPad T14 G4 21K4S02000
R7 PRO 7840U, Radeon 780M, 52.5 Wh
HP EliteBook x360 1040 G11
Ultra 7 165H, Arc 8-Core, 68 Wh
Durchschnitt der Klasse Convertible
 
Akkulaufzeit
-25%
23%
-6%
10%
47%
-3%
H.264
741
540
-27%
WLAN
660
509
-23%
815
23%
619
-6%
729
10%
969
47%
Last
89
143
98
100
99
Idle
1300
1493
3353

Notebookcheck Rating

Dell Latitude 7450 2-in-1 - 13.11.2024 v8
Vaidyanathan Subramaniam

Gehäuse
91 / 98 → 93%
Tastatur
92%
Pointing Device
96%
Konnektivität
73 / 74 → 98%
Gewicht
69 / 20-75 → 89%
Akkulaufzeit
88%
Display
79%
Leistung Spiele
31 / 65 → 48%
Leistung Anwendungen
78 / 92 → 85%
AI Performance
71%
Temperatur
90%
Lautstärke
90%
Audio
86 / 91 → 95%
Kamera
27 / 75 → 36%
Durchschnitt
74%
88%
Convertible - gewichteter Durchschnitt
Weitere Informationen über unsere Bewertung finden Sie hier.
CO2 Emissions
84.3%
Materials
75%
Packaging
100%
Power Use
82%
Repairability
60%
Software Updates
22.3%
Recycle Logo Total Sustainability Score: 70.6%

Transparenz

Die Auswahl der zu testenden Geräte erfolgt innerhalb der Redaktion. Das vorliegende Testmuster wurde dem Autor vom Hersteller oder einem Shop zu Testzwecken leihweise zur Verfügung gestellt. Eine Einflussnahme des Leihstellers auf den Testbericht gab es nicht, der Hersteller erhielt keine Version des Reviews vor der Veröffentlichung. Es bestand keine Verpflichtung zur Publikation. Unsere Reviews erfolgen stets ohne Gegenleistung oder Kompensationen. Als eigenständiges, unabhängiges Unternehmen unterliegt Notebookcheck keiner Diktion von Herstellern, Shops und Verlagen.

So testet Notebookcheck

Pro Jahr werden von Notebookcheck hunderte Laptops und Smartphones unabhängig in von uns standardisierten technischen Verfahren getestet, um eine Vergleichbarkeit aller Testergebnisse zu gewährleisten. Seit rund 20 Jahren entwickeln wir diese Testmethoden kontinuierlich weiter und setzen damit Branchenstandards. In unseren Testlaboren kommt ausschließlich hochwertiges Messequipment in die Hände erfahrener Techniker und Redakteure. Die Tests unterliegen einer mehrstufigen Kontrolle. Unsere komplexe Gesamtbewertung basiert auf hunderten fundierten Messergebnissen und Benchmarks, womit Ihnen Objektivität garantiert ist. Weitere Informationen zu unseren Testmethoden gibt es hier.

Alle 2 Beträge lesen / Antworten
static version load dynamic
Loading Comments
Diesen Artikel kommentieren / Antworten
Teilen Sie diesen Artikel, um uns zu unterstützen. Jeder Link hilft!
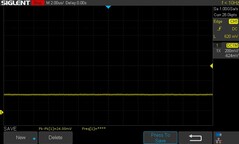
Mail Logo
> Notebook Test, Laptop Test und News > Tests > Notebook Testberichte > Dell Latitude 7450 2-in-1 Laptop: Vielseitiges Business-Convertible überzeugt im Test
Autor: Vaidyanathan Subramaniam, 15.11.2024 (Update: 23.11.2024)