|
Intel Core i9-14900K
Palit GeForce RTX 4090 GameRock OC, i9-14900K, 3200 MHz | |
Intel Core i9-13900K
Intel Core i9-13900K, i9-13900K, 3000 MHz | |
AMD Ryzen 9 7950X
NVIDIA GeForce RTX 3090 Founders Edition, R9 7950X, 4500 MHz | |
AMD Ryzen 9 7950X3D
AMD Ryzen 9 7950X3D, R9 7950X3D, 4200 MHz | |
AMD Ryzen 9 7900X
AMD Ryzen 9 7900X, R9 7900X, 4700 MHz | |
Intel Core i5-14600K
Intel Core i5-14600K, i5-14600K, 3500 MHz | |
Intel Core i9-12900K
Intel Core i9-12900K, i9-12900K, 3200 MHz | |
AMD Ryzen 9 5950X
AMD Ryzen 9 5950X, R9 5950X, 3400 MHz | |
Intel Core i5-13600K
Intel Core i5-13600K, i5-13600K, 3500 MHz | |
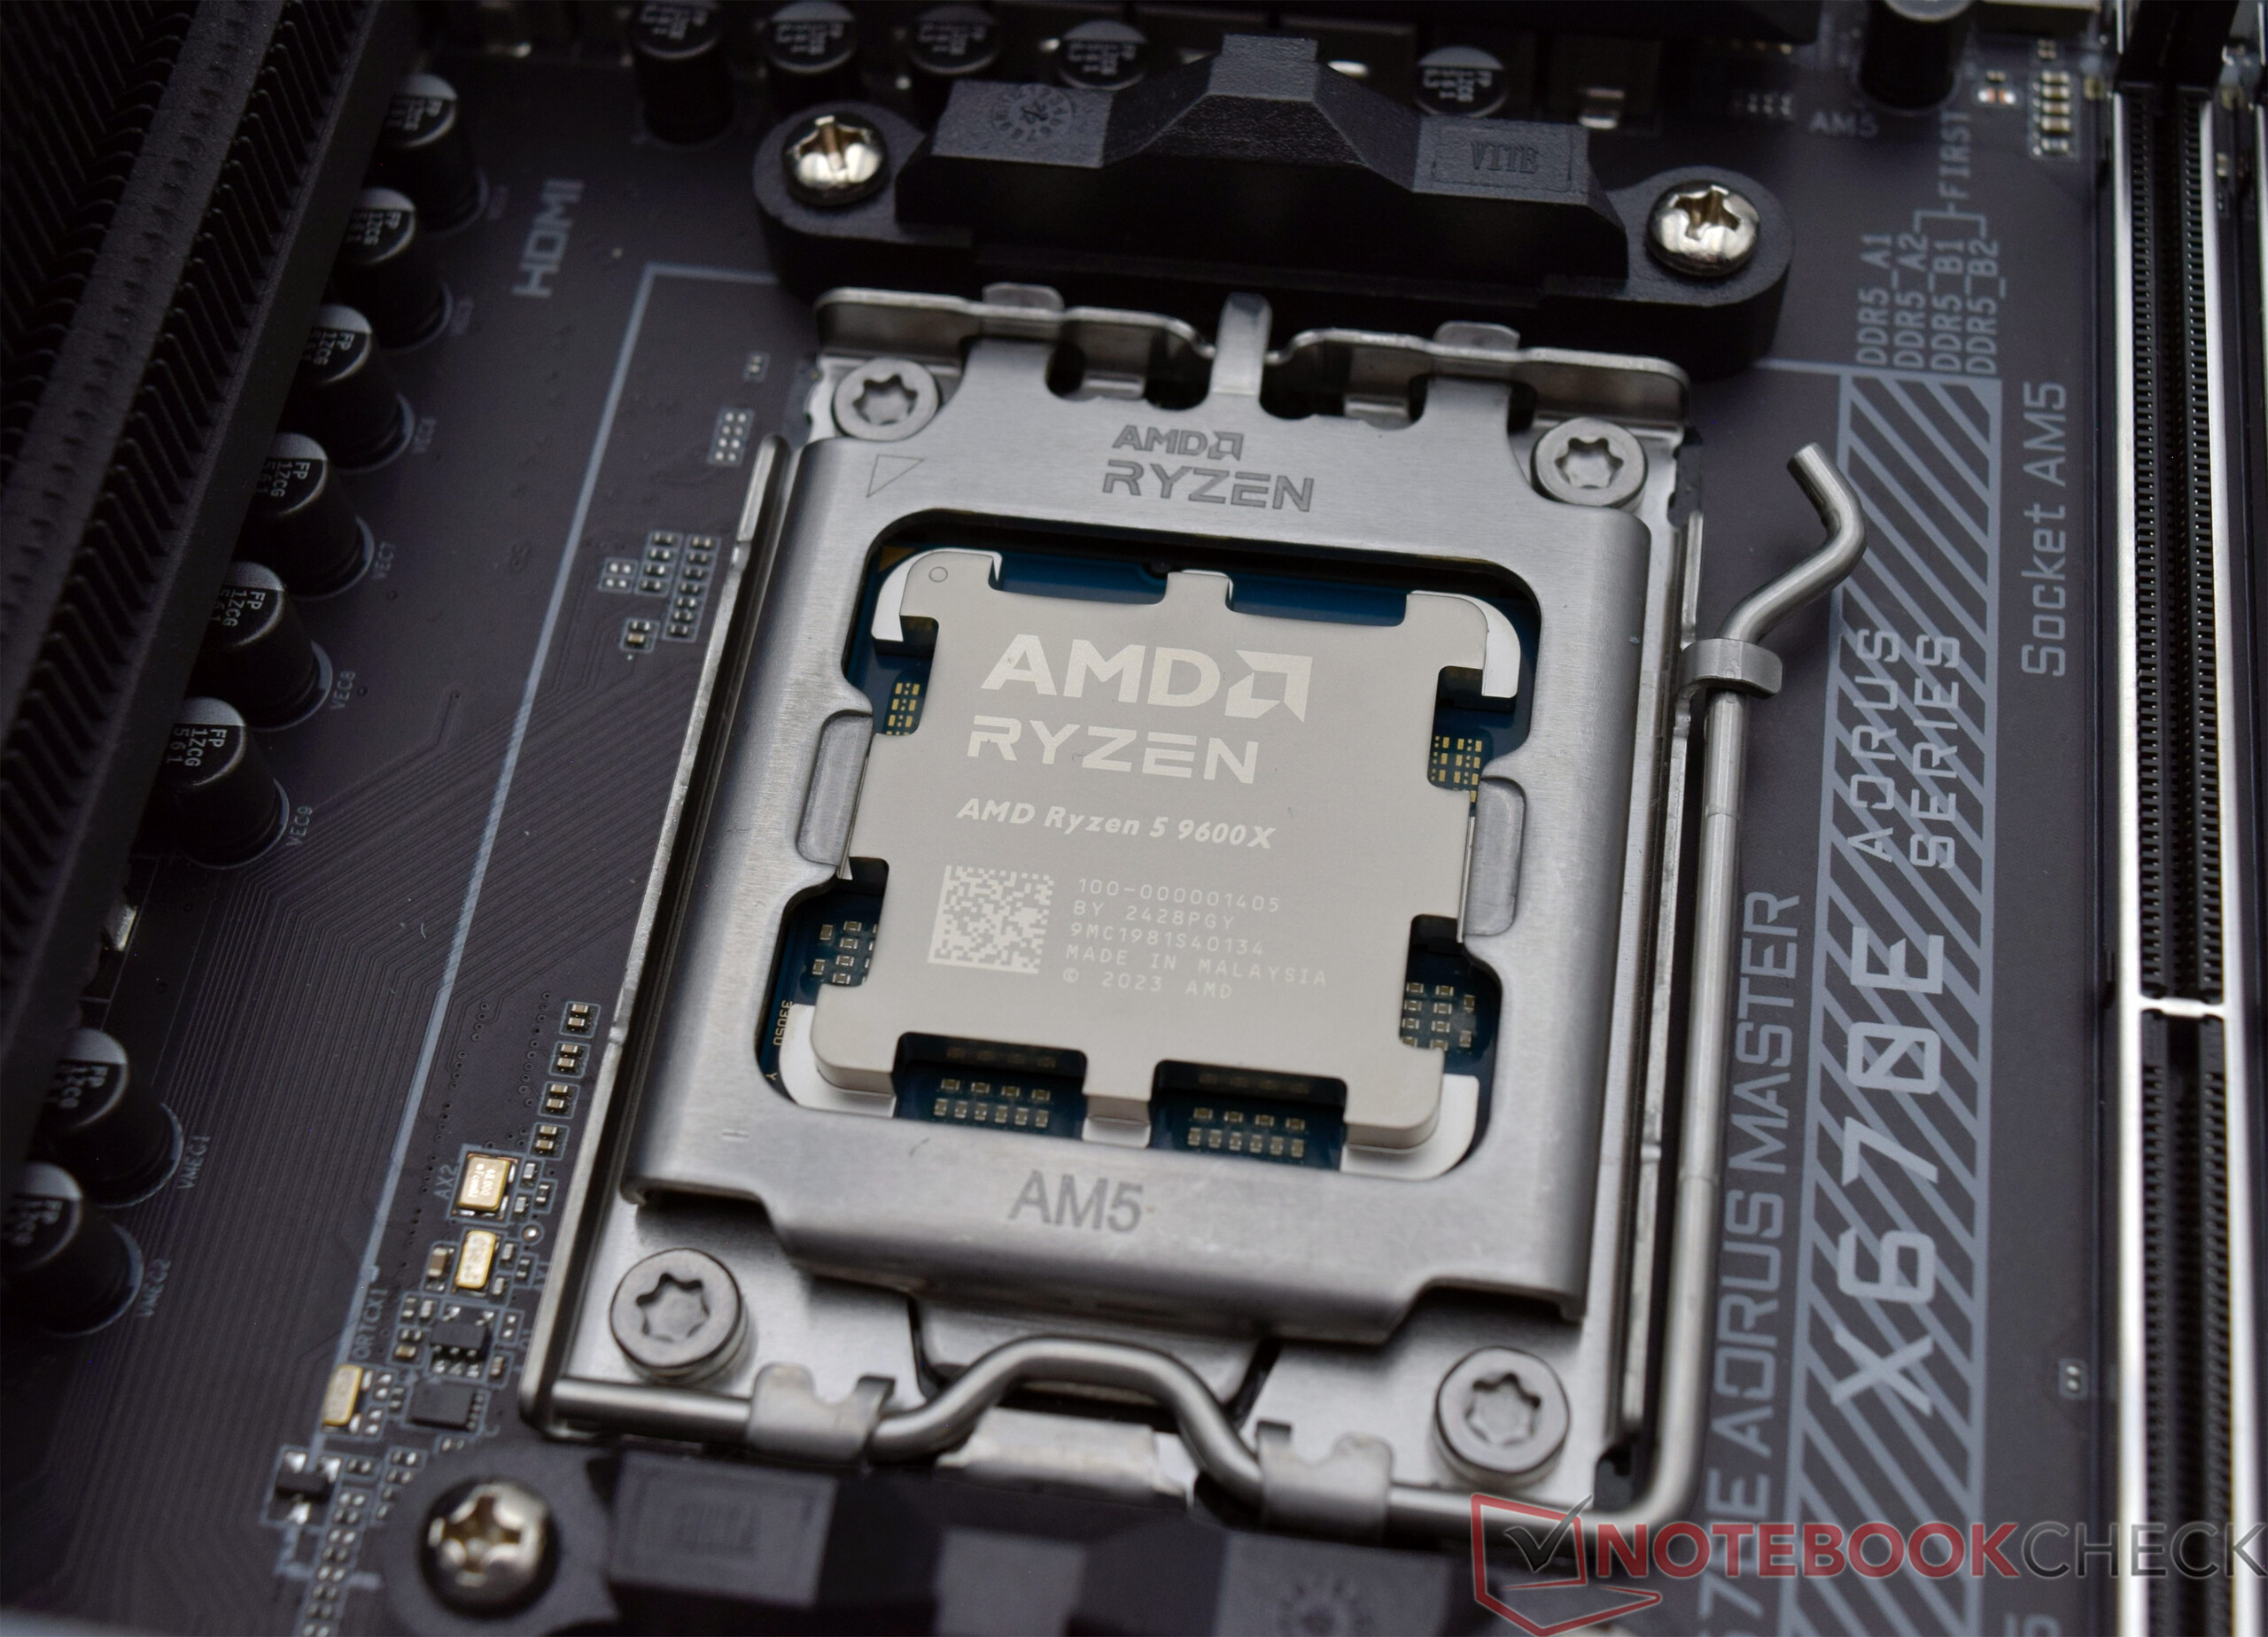
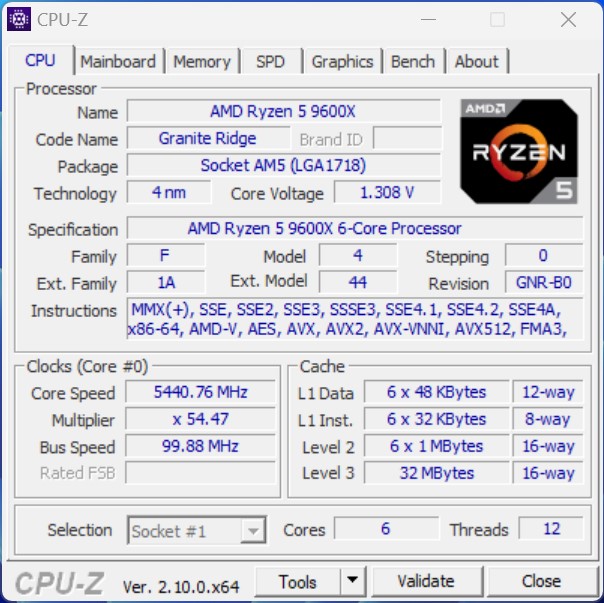
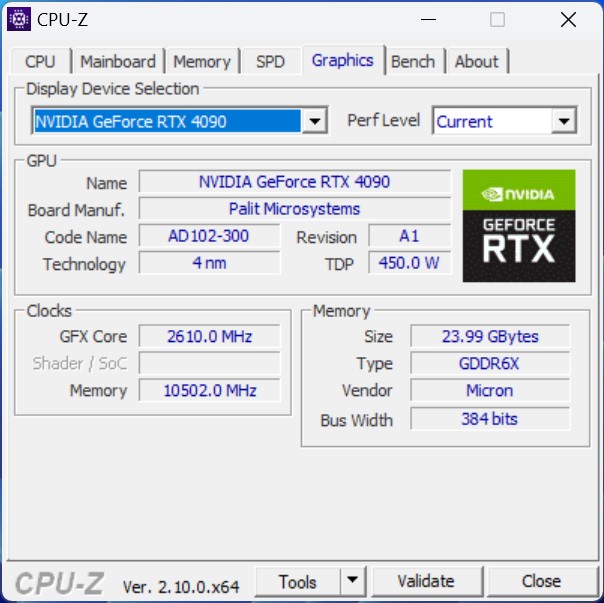
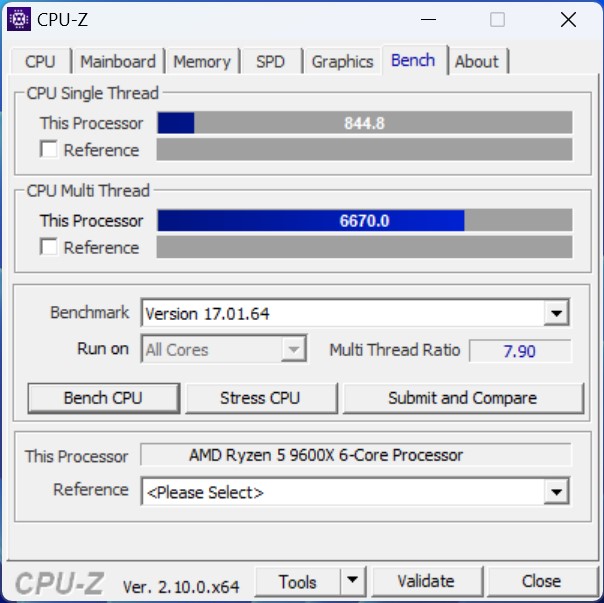
AMD Ryzen 5 9600X
AMD Ryzen 5 9600X (@105W), Ryzen 5 9600X, 3900 MHz | |
AMD Ryzen 5 9600X
AMD Ryzen 5 9600X, Ryzen 5 9600X, 3900 MHz | |
AMD Ryzen 7 7800X3D
AMD Ryzen 7 7800X3D, R7 7800X3D, 4200 MHz | |
AMD Ryzen 5 7600X
AMD Ryzen 5 7600X, R5 7600X, 4700 MHz | |
Intel Core i5-12600K
Intel Core i5-12600K, i5-12600K, 2800 MHz | |
Intel Core i5-13400
Intel Core i5-13400, i5-13400, 2500 MHz | |
Intel Core i5-12400F
Intel Core i5-12400F, i5-12400F, 2500 MHz | |
|
|
Intel Core i9-14900K
Palit GeForce RTX 4090 GameRock OC, i9-14900K, 3200 MHz | |
Intel Core i9-13900K
Intel Core i9-13900K, i9-13900K, 3000 MHz | |
AMD Ryzen 5 9600X
AMD Ryzen 5 9600X (@105W), Ryzen 5 9600X, 3900 MHz | |
AMD Ryzen 5 9600X
AMD Ryzen 5 9600X, Ryzen 5 9600X, 3900 MHz | |
Intel Core i5-14600K
Intel Core i5-14600K, i5-14600K, 3500 MHz | |
AMD Ryzen 9 7950X3D
AMD Ryzen 9 7950X3D, R9 7950X3D, 4200 MHz | |
AMD Ryzen 9 7950X
NVIDIA GeForce RTX 3090 Founders Edition, R9 7950X, 4500 MHz | |
AMD Ryzen 9 7900X
AMD Ryzen 9 7900X, R9 7900X, 4700 MHz | |
Intel Core i5-13600K
Intel Core i5-13600K, i5-13600K, 3500 MHz | |
Intel Core i9-12900K
Intel Core i9-12900K, i9-12900K, 3200 MHz | |
AMD Ryzen 5 7600X
AMD Ryzen 5 7600X, R5 7600X, 4700 MHz | |
Intel Core i5-12600K
Intel Core i5-12600K, i5-12600K, 2800 MHz | |
AMD Ryzen 7 7800X3D
AMD Ryzen 7 7800X3D, R7 7800X3D, 4200 MHz | |
Intel Core i5-13400
Intel Core i5-13400, i5-13400, 2500 MHz | |
Intel Core i5-12400F
Intel Core i5-12400F, i5-12400F, 2500 MHz | |
AMD Ryzen 9 5950X
AMD Ryzen 9 5950X, R9 5950X, 3400 MHz | |
|
Intel Core i9-14900K
Palit GeForce RTX 4090 GameRock OC, i9-14900K, 3200 MHz | |
Intel Core i9-13900K
Intel Core i9-13900K, i9-13900K, 3000 MHz | |
AMD Ryzen 9 7950X
NVIDIA GeForce RTX 3090 Founders Edition, R9 7950X, 4500 MHz | |
AMD Ryzen 9 7950X3D
AMD Ryzen 9 7950X3D, R9 7950X3D, 4200 MHz | |
AMD Ryzen 9 7900X
AMD Ryzen 9 7900X, R9 7900X, 4700 MHz | |
AMD Ryzen 9 5950X
AMD Ryzen 9 5950X, R9 5950X, 3400 MHz | |
Intel Core i9-12900K
Intel Core i9-12900K, i9-12900K, 3200 MHz | |
Intel Core i5-14600K
Intel Core i5-14600K, i5-14600K, 3500 MHz | |
Intel Core i5-13600K
Intel Core i5-13600K, i5-13600K, 3500 MHz | |
AMD Ryzen 7 7800X3D
AMD Ryzen 7 7800X3D, R7 7800X3D, 4200 MHz | |
AMD Ryzen 5 9600X
AMD Ryzen 5 9600X (@105W), Ryzen 5 9600X, 3900 MHz | |
Intel Core i5-12600K
Intel Core i5-12600K, i5-12600K, 2800 MHz | |
AMD Ryzen 5 9600X
AMD Ryzen 5 9600X, Ryzen 5 9600X, 3900 MHz | |
Intel Core i5-13400
Intel Core i5-13400, i5-13400, 2500 MHz | |
AMD Ryzen 5 7600X
AMD Ryzen 5 7600X, R5 7600X, 4700 MHz | |
Intel Core i5-12400F
Intel Core i5-12400F, i5-12400F, 2500 MHz | |
|
|
Intel Core i9-14900K
Palit GeForce RTX 4090 GameRock OC, i9-14900K, 3200 MHz | |
AMD Ryzen 5 9600X
AMD Ryzen 5 9600X, Ryzen 5 9600X, 3900 MHz | |
AMD Ryzen 5 9600X
AMD Ryzen 5 9600X (@105W), Ryzen 5 9600X, 3900 MHz | |
Intel Core i9-13900K
Intel Core i9-13900K, i9-13900K, 3000 MHz | |
AMD Ryzen 9 7950X
NVIDIA GeForce RTX 3090 Founders Edition, R9 7950X, 4500 MHz | |
AMD Ryzen 9 7950X3D
AMD Ryzen 9 7950X3D, R9 7950X3D, 4200 MHz | |
Intel Core i5-14600K
Intel Core i5-14600K, i5-14600K, 3500 MHz | |
AMD Ryzen 9 7900X
AMD Ryzen 9 7900X, R9 7900X, 4700 MHz | |
Intel Core i5-13600K
Intel Core i5-13600K, i5-13600K, 3500 MHz | |
Intel Core i9-12900K
Intel Core i9-12900K, i9-12900K, 3200 MHz | |
AMD Ryzen 5 7600X
AMD Ryzen 5 7600X, R5 7600X, 4700 MHz | |
Intel Core i5-12600K
Intel Core i5-12600K, i5-12600K, 2800 MHz | |
AMD Ryzen 7 7800X3D
AMD Ryzen 7 7800X3D, R7 7800X3D, 4200 MHz | |
Intel Core i5-13400
Intel Core i5-13400, i5-13400, 2500 MHz | |
Intel Core i5-12400F
Intel Core i5-12400F, i5-12400F, 2500 MHz | |
AMD Ryzen 9 5950X
AMD Ryzen 9 5950X, R9 5950X, 3400 MHz | |
|
Intel Core i9-14900K
Palit GeForce RTX 4090 GameRock OC, i9-14900K, 3200 MHz | |
Intel Core i9-13900K
Intel Core i9-13900K, i9-13900K, 3000 MHz | |
AMD Ryzen 9 7950X
NVIDIA GeForce RTX 3090 Founders Edition, R9 7950X, 4500 MHz | |
AMD Ryzen 9 7950X3D
AMD Ryzen 9 7950X3D, R9 7950X3D, 4200 MHz | |
AMD Ryzen 9 7900X
AMD Ryzen 9 7900X, R9 7900X, 4700 MHz | |
AMD Ryzen 9 5950X
AMD Ryzen 9 5950X, R9 5950X, 3400 MHz | |
Intel Core i9-12900K
Intel Core i9-12900K, i9-12900K, 3200 MHz | |
Intel Core i5-14600K
Intel Core i5-14600K, i5-14600K, 3500 MHz | |
Intel Core i5-13600K
Intel Core i5-13600K, i5-13600K, 3500 MHz | |
AMD Ryzen 7 7800X3D
AMD Ryzen 7 7800X3D, R7 7800X3D, 4200 MHz | |
AMD Ryzen 5 9600X
AMD Ryzen 5 9600X (@105W), Ryzen 5 9600X, 3900 MHz | |
AMD Ryzen 5 9600X
AMD Ryzen 5 9600X, Ryzen 5 9600X, 3900 MHz | |
Intel Core i5-12600K
Intel Core i5-12600K, i5-12600K, 2800 MHz | |
Intel Core i5-13400
Intel Core i5-13400, i5-13400, 2500 MHz | |
AMD Ryzen 5 7600X
AMD Ryzen 5 7600X, R5 7600X, 4700 MHz | |
Intel Core i5-12400F
Intel Core i5-12400F, i5-12400F, 2500 MHz | |
|
|
AMD Ryzen 5 9600X
AMD Ryzen 5 9600X (@105W), Ryzen 5 9600X, 3900 MHz | |
AMD Ryzen 5 9600X
AMD Ryzen 5 9600X, Ryzen 5 9600X, 3900 MHz | |
Intel Core i9-14900K
Palit GeForce RTX 4090 GameRock OC, i9-14900K, 3200 MHz | |
AMD Ryzen 9 7950X
NVIDIA GeForce RTX 3090 Founders Edition, R9 7950X, 4500 MHz | |
Intel Core i9-13900K
Intel Core i9-13900K, i9-13900K, 3000 MHz | |
AMD Ryzen 9 7950X3D
AMD Ryzen 9 7950X3D, R9 7950X3D, 4200 MHz | |
AMD Ryzen 9 7900X
AMD Ryzen 9 7900X, R9 7900X, 4700 MHz | |
AMD Ryzen 5 7600X
AMD Ryzen 5 7600X, R5 7600X, 4700 MHz | |
Intel Core i5-14600K
Intel Core i5-14600K, i5-14600K, 3500 MHz | |
AMD Ryzen 7 7800X3D
AMD Ryzen 7 7800X3D, R7 7800X3D, 4200 MHz | |
Intel Core i5-13600K
Intel Core i5-13600K, i5-13600K, 3500 MHz | |
Intel Core i9-12900K
Intel Core i9-12900K, i9-12900K, 3200 MHz | |
Intel Core i5-12600K
Intel Core i5-12600K, i5-12600K, 2800 MHz | |
AMD Ryzen 9 5950X
AMD Ryzen 9 5950X, R9 5950X, 3400 MHz | |
Intel Core i5-13400
Intel Core i5-13400, i5-13400, 2500 MHz | |
Intel Core i5-12400F
Intel Core i5-12400F, i5-12400F, 2500 MHz | |
|
Intel Core i9-14900K
Palit GeForce RTX 4090 GameRock OC, i9-14900K, 3200 MHz | |
AMD Ryzen 9 7950X
NVIDIA GeForce RTX 3090 Founders Edition, R9 7950X, 4500 MHz | |
Intel Core i9-13900K
Intel Core i9-13900K, i9-13900K, 3000 MHz | |
AMD Ryzen 9 7950X3D
AMD Ryzen 9 7950X3D, R9 7950X3D, 4200 MHz | |
AMD Ryzen 9 7900X
AMD Ryzen 9 7900X, R9 7900X, 4700 MHz | |
AMD Ryzen 9 5950X
AMD Ryzen 9 5950X, R9 5950X, 3400 MHz | |
Intel Core i9-12900K
Intel Core i9-12900K, i9-12900K, 3200 MHz | |
Intel Core i5-13600K
Intel Core i5-13600K, i5-13600K, 3500 MHz | |
Intel Core i5-14600K
Intel Core i5-14600K, i5-14600K, 3500 MHz | |
AMD Ryzen 7 7800X3D
AMD Ryzen 7 7800X3D, R7 7800X3D, 4200 MHz | |
AMD Ryzen 5 9600X
AMD Ryzen 5 9600X (@105W), Ryzen 5 9600X, 3900 MHz | |
AMD Ryzen 5 9600X
AMD Ryzen 5 9600X, Ryzen 5 9600X, 3900 MHz | |
Intel Core i5-12600K
Intel Core i5-12600K, i5-12600K, 2800 MHz | |
AMD Ryzen 5 7600X
AMD Ryzen 5 7600X, R5 7600X, 4700 MHz | |
Intel Core i5-13400
Intel Core i5-13400, i5-13400, 2500 MHz | |
Intel Core i5-12400F
Intel Core i5-12400F, i5-12400F, 2500 MHz | |
|
|
Intel Core i9-14900K
Palit GeForce RTX 4090 GameRock OC, i9-14900K, 3200 MHz | |
AMD Ryzen 5 9600X
AMD Ryzen 5 9600X (@105W), Ryzen 5 9600X, 3900 MHz | |
AMD Ryzen 5 9600X
AMD Ryzen 5 9600X, Ryzen 5 9600X, 3900 MHz | |
Intel Core i9-13900K
Intel Core i9-13900K, i9-13900K, 3000 MHz | |
AMD Ryzen 9 7950X
NVIDIA GeForce RTX 3090 Founders Edition, R9 7950X, 4500 MHz | |
AMD Ryzen 9 7950X3D
AMD Ryzen 9 7950X3D, R9 7950X3D, 4200 MHz | |
AMD Ryzen 9 7900X
AMD Ryzen 9 7900X, R9 7900X, 4700 MHz | |
AMD Ryzen 5 7600X
AMD Ryzen 5 7600X, R5 7600X, 4700 MHz | |
Intel Core i5-14600K
Intel Core i5-14600K, i5-14600K, 3500 MHz | |
Intel Core i9-12900K
Intel Core i9-12900K, i9-12900K, 3200 MHz | |
Intel Core i5-13600K
Intel Core i5-13600K, i5-13600K, 3500 MHz | |
AMD Ryzen 7 7800X3D
AMD Ryzen 7 7800X3D, R7 7800X3D, 4200 MHz | |
Intel Core i5-12600K
Intel Core i5-12600K, i5-12600K, 2800 MHz | |
AMD Ryzen 9 5950X
AMD Ryzen 9 5950X, R9 5950X, 3400 MHz | |
Intel Core i5-13400
Intel Core i5-13400, i5-13400, 2500 MHz | |
Intel Core i5-12400F
Intel Core i5-12400F, i5-12400F, 2500 MHz | |
|
Intel Core i9-14900K
Palit GeForce RTX 4090 GameRock OC, i9-14900K, 3200 MHz | |
Intel Core i9-13900K
Intel Core i9-13900K, i9-13900K, 3000 MHz | |
AMD Ryzen 9 7950X
NVIDIA GeForce RTX 3090 Founders Edition, R9 7950X, 4500 MHz | |
AMD Ryzen 9 7950X3D
AMD Ryzen 9 7950X3D, R9 7950X3D, 4200 MHz | |
AMD Ryzen 9 7900X
AMD Ryzen 9 7900X, R9 7900X, 4700 MHz | |
AMD Ryzen 9 5950X
AMD Ryzen 9 5950X, R9 5950X, 3400 MHz | |
Intel Core i9-12900K
Intel Core i9-12900K, i9-12900K, 3200 MHz | |
Intel Core i5-13600K
Intel Core i5-13600K, i5-13600K, 3500 MHz | |
Intel Core i5-14600K
Intel Core i5-14600K, i5-14600K, 3500 MHz | |
AMD Ryzen 7 7800X3D
AMD Ryzen 7 7800X3D, R7 7800X3D, 4200 MHz | |
AMD Ryzen 5 9600X
AMD Ryzen 5 9600X (@105W), Ryzen 5 9600X, 3900 MHz | |
AMD Ryzen 5 9600X
AMD Ryzen 5 9600X, Ryzen 5 9600X, 3900 MHz | |
Intel Core i5-12600K
Intel Core i5-12600K, i5-12600K, 2800 MHz | |
AMD Ryzen 5 7600X
AMD Ryzen 5 7600X, R5 7600X, 4700 MHz | |
Intel Core i5-13400
Intel Core i5-13400, i5-13400, 2500 MHz | |
Intel Core i5-12400F
Intel Core i5-12400F, i5-12400F, 2500 MHz | |
|
|
Intel Core i9-14900K
Palit GeForce RTX 4090 GameRock OC, i9-14900K, 3200 MHz | |
Intel Core i9-13900K
Intel Core i9-13900K, i9-13900K, 3000 MHz | |
AMD Ryzen 5 9600X
AMD Ryzen 5 9600X, Ryzen 5 9600X, 3900 MHz | |
AMD Ryzen 5 9600X
AMD Ryzen 5 9600X (@105W), Ryzen 5 9600X, 3900 MHz | |
Intel Core i5-14600K
Intel Core i5-14600K, i5-14600K, 3500 MHz | |
AMD Ryzen 9 7900X
AMD Ryzen 9 7900X, R9 7900X, 4700 MHz | |
AMD Ryzen 9 7950X
NVIDIA GeForce RTX 3090 Founders Edition, R9 7950X, 4500 MHz | |
Intel Core i5-13600K
Intel Core i5-13600K, i5-13600K, 3500 MHz | |
Intel Core i9-12900K
Intel Core i9-12900K, i9-12900K, 3200 MHz | |
AMD Ryzen 5 7600X
AMD Ryzen 5 7600X, R5 7600X, 4700 MHz | |
Intel Core i5-12600K
Intel Core i5-12600K, i5-12600K, 2800 MHz | |
AMD Ryzen 7 7800X3D
AMD Ryzen 7 7800X3D, R7 7800X3D, 4200 MHz | |
Intel Core i5-13400
Intel Core i5-13400, i5-13400, 2500 MHz | |
Intel Core i5-12400F
Intel Core i5-12400F, i5-12400F, 2500 MHz | |
AMD Ryzen 9 5950X
AMD Ryzen 9 5950X, R9 5950X, 3400 MHz | |
AMD Ryzen 9 7950X3D
AMD Ryzen 9 7950X3D, R9 7950X3D, 4200 MHz | |
|
Intel Core i9-14900K
Palit GeForce RTX 4090 GameRock OC, i9-14900K, 3200 MHz | |
Intel Core i9-13900K
Intel Core i9-13900K, i9-13900K, 3000 MHz | |
AMD Ryzen 9 7950X
NVIDIA GeForce RTX 3090 Founders Edition, R9 7950X, 4500 MHz | |
AMD Ryzen 9 7900X
AMD Ryzen 9 7900X, R9 7900X, 4700 MHz | |
Intel Core i5-14600K
Intel Core i5-14600K, i5-14600K, 3500 MHz | |
Intel Core i9-12900K
Intel Core i9-12900K, i9-12900K, 3200 MHz | |
Intel Core i5-13600K
Intel Core i5-13600K, i5-13600K, 3500 MHz | |
AMD Ryzen 9 5950X
AMD Ryzen 9 5950X, R9 5950X, 3400 MHz | |
AMD Ryzen 5 9600X
AMD Ryzen 5 9600X (@105W), Ryzen 5 9600X, 3900 MHz | |
AMD Ryzen 5 9600X
AMD Ryzen 5 9600X, Ryzen 5 9600X, 3900 MHz | |
AMD Ryzen 7 7800X3D
AMD Ryzen 7 7800X3D, R7 7800X3D, 4200 MHz | |
AMD Ryzen 5 7600X
AMD Ryzen 5 7600X, R5 7600X, 4700 MHz | |
Intel Core i5-12600K
Intel Core i5-12600K, i5-12600K, 2800 MHz | |
Intel Core i5-13400
Intel Core i5-13400, i5-13400, 2500 MHz | |
AMD Ryzen 9 7950X3D
AMD Ryzen 9 7950X3D, R9 7950X3D, 4200 MHz | |
Intel Core i5-12400F
Intel Core i5-12400F, i5-12400F, 2500 MHz | |
|
Intel Core i5-12400F
Intel Core i5-12400F, i5-12400F, 2500 MHz | |
Intel Core i5-13400
Intel Core i5-13400, i5-13400, 2500 MHz | |
AMD Ryzen 5 7600X
AMD Ryzen 5 7600X, R5 7600X, 4700 MHz | |
Intel Core i5-12600K
Intel Core i5-12600K, i5-12600K, 2800 MHz | |
AMD Ryzen 5 9600X
AMD Ryzen 5 9600X (@105W), Ryzen 5 9600X, 3900 MHz | |
AMD Ryzen 5 9600X
AMD Ryzen 5 9600X, Ryzen 5 9600X, 3900 MHz | |
AMD Ryzen 7 7800X3D
AMD Ryzen 7 7800X3D, R7 7800X3D, 4200 MHz | |
Intel Core i5-13600K
Intel Core i5-13600K, i5-13600K, 3500 MHz | |
Intel Core i5-14600K
Intel Core i5-14600K, i5-14600K, 3500 MHz | |
Intel Core i9-12900K
Intel Core i9-12900K, i9-12900K, 3200 MHz | |
AMD Ryzen 9 5950X
AMD Ryzen 9 5950X, R9 5950X, 3400 MHz | |
AMD Ryzen 9 7900X
AMD Ryzen 9 7900X, R9 7900X, 4700 MHz | |
AMD Ryzen 9 7950X3D
AMD Ryzen 9 7950X3D, R9 7950X3D, 4200 MHz | |
AMD Ryzen 9 7950X
NVIDIA GeForce RTX 3090 Founders Edition, R9 7950X, 4500 MHz | |
Intel Core i9-13900K
Intel Core i9-13900K, i9-13900K, 3000 MHz | |
Intel Core i9-14900K
Palit GeForce RTX 4090 GameRock OC, i9-14900K, 3200 MHz | |
|
|
Intel Core i9-12900K
Intel Core i9-12900K, i9-12900K, 3200 MHz | |
Intel Core i5-12600K
Intel Core i5-12600K, i5-12600K, 2800 MHz | |
Intel Core i5-12400F
Intel Core i5-12400F, i5-12400F, 2500 MHz | |
Intel Core i5-13400
Intel Core i5-13400, i5-13400, 2500 MHz | |
AMD Ryzen 5 7600X
AMD Ryzen 5 7600X, R5 7600X, 4700 MHz | |
AMD Ryzen 5 9600X
AMD Ryzen 5 9600X, Ryzen 5 9600X, 3900 MHz | |
AMD Ryzen 5 9600X
AMD Ryzen 5 9600X (@105W), Ryzen 5 9600X, 3900 MHz | |
AMD Ryzen 9 5950X
AMD Ryzen 9 5950X, R9 5950X, 3400 MHz | |
Intel Core i5-13600K
Intel Core i5-13600K, i5-13600K, 3500 MHz | |
AMD Ryzen 7 7800X3D
AMD Ryzen 7 7800X3D, R7 7800X3D, 4200 MHz | |
Intel Core i5-14600K
Intel Core i5-14600K, i5-14600K, 3500 MHz | |
Intel Core i9-14900K
Palit GeForce RTX 4090 GameRock OC, i9-14900K, 3200 MHz | |
AMD Ryzen 9 7950X3D
AMD Ryzen 9 7950X3D, R9 7950X3D, 4200 MHz | |
Intel Core i9-13900K
Intel Core i9-13900K, i9-13900K, 3000 MHz | |
AMD Ryzen 9 7900X
AMD Ryzen 9 7900X, R9 7900X, 4700 MHz | |
AMD Ryzen 9 7950X
NVIDIA GeForce RTX 3090 Founders Edition, R9 7950X, 4500 MHz | |
|
Intel Core i5-13400
Intel Core i5-13400, i5-13400, 2500 MHz | |
Intel Core i5-12600K
Intel Core i5-12600K, i5-12600K, 2800 MHz | |
Intel Core i9-12900K
Intel Core i9-12900K, i9-12900K, 3200 MHz | |
Intel Core i5-13600K
Intel Core i5-13600K, i5-13600K, 3500 MHz | |
Intel Core i5-14600K
Intel Core i5-14600K, i5-14600K, 3500 MHz | |
Intel Core i5-12400F
Intel Core i5-12400F, i5-12400F, 2500 MHz | |
Intel Core i9-13900K
Intel Core i9-13900K, i9-13900K, 3000 MHz | |
AMD Ryzen 5 7600X
AMD Ryzen 5 7600X, R5 7600X, 4700 MHz | |
Intel Core i9-14900K
Palit GeForce RTX 4090 GameRock OC, i9-14900K, 3200 MHz | |
AMD Ryzen 5 9600X
AMD Ryzen 5 9600X, Ryzen 5 9600X, 3900 MHz | |
AMD Ryzen 5 9600X
AMD Ryzen 5 9600X (@105W), Ryzen 5 9600X, 3900 MHz | |
AMD Ryzen 9 5950X
AMD Ryzen 9 5950X, R9 5950X, 3400 MHz | |
AMD Ryzen 7 7800X3D
AMD Ryzen 7 7800X3D, R7 7800X3D, 4200 MHz | |
AMD Ryzen 9 7900X
AMD Ryzen 9 7900X, R9 7900X, 4700 MHz | |
AMD Ryzen 9 7950X3D
AMD Ryzen 9 7950X3D, R9 7950X3D, 4200 MHz | |
AMD Ryzen 9 7950X
NVIDIA GeForce RTX 3090 Founders Edition, R9 7950X, 4500 MHz | |
|
|
Intel Core i9-14900K
Palit GeForce RTX 4090 GameRock OC, i9-14900K, 3200 MHz |
433.5 (424min - 434max) fps +19% |
Intel Core i9-13900K
Intel Core i9-13900K, i9-13900K, 3000 MHz |
412 (410min - 417max) fps +13% |
Intel Core i5-14600K
Intel Core i5-14600K, i5-14600K, 3500 MHz |
411 (410min - 412max) fps +13% |
AMD Ryzen 9 7950X3D
AMD Ryzen 9 7950X3D, R9 7950X3D, 4200 MHz |
392.5 (391min - 397max) fps +8% |
Intel Core i5-13600K
Intel Core i5-13600K, i5-13600K, 3500 MHz |
388 (386min - 388max) fps +7% |
AMD Ryzen 9 7950X
NVIDIA GeForce RTX 3090 Founders Edition, R9 7950X, 4500 MHz |
379.5 (378min - 385max) fps +4% |
AMD Ryzen 9 7900X
AMD Ryzen 9 7900X, R9 7900X, 4700 MHz |
376 (369min - 378max) fps +3% |
AMD Ryzen 5 9600X
AMD Ryzen 5 9600X (@105W), Ryzen 5 9600X, 3900 MHz |
373.5 (371min - 376max) fps +3% |
Intel Core i9-12900K
Intel Core i9-12900K, i9-12900K, 3200 MHz |
368.5 (366min - 369max) fps +1% |
AMD Ryzen 5 7600X
AMD Ryzen 5 7600X, R5 7600X, 4700 MHz |
367 (363min - 371max) fps +1% |
AMD Ryzen 5 9600X
AMD Ryzen 5 9600X, Ryzen 5 9600X, 3900 MHz |
364 (361min - 367max) fps |
AMD Ryzen 7 7800X3D
AMD Ryzen 7 7800X3D, R7 7800X3D, 4200 MHz |
344 (339min - 346max) fps -5% |
AMD Ryzen 9 5950X
AMD Ryzen 9 5950X, R9 5950X, 3400 MHz |
338.5 (337min - 340max) fps -7% |
Intel Core i5-12600K
Intel Core i5-12600K, i5-12600K, 2800 MHz |
333.5 (332min - 336max) fps -8% |
Intel Core i5-13400
Intel Core i5-13400, i5-13400, 2500 MHz |
311 (310min - 312max) fps -15% |
Intel Core i5-12400F
Intel Core i5-12400F, i5-12400F, 2500 MHz |
252.5 (249min - 256max) fps -31% |
|
Intel Core i9-14900K
Palit GeForce RTX 4090 GameRock OC, i9-14900K, 3200 MHz |
286.5 (285min - 287max) fps +86% |
Intel Core i9-13900K
Intel Core i9-13900K, i9-13900K, 3000 MHz |
267 (266min - 271max) fps +73% |
AMD Ryzen 9 7950X
NVIDIA GeForce RTX 3090 Founders Edition, R9 7950X, 4500 MHz |
266.5 (263min - 267max) fps +73% |
AMD Ryzen 9 7950X3D
AMD Ryzen 9 7950X3D, R9 7950X3D, 4200 MHz |
265.5 (263min - 266max) fps +72% |
AMD Ryzen 9 7900X
AMD Ryzen 9 7900X, R9 7900X, 4700 MHz |
241 (240min - 242max) fps +56% |
AMD Ryzen 9 5950X
AMD Ryzen 9 5950X, R9 5950X, 3400 MHz |
221 (220min - 221max) fps +44% |
Intel Core i5-14600K
Intel Core i5-14600K, i5-14600K, 3500 MHz |
209 (208min - 209max) fps +36% |
Intel Core i9-12900K
Intel Core i9-12900K, i9-12900K, 3200 MHz |
206 (206min - 206max) fps +34% |
Intel Core i5-13600K
Intel Core i5-13600K, i5-13600K, 3500 MHz |
199 (198.5min - 199.4max) fps +29% |
AMD Ryzen 7 7800X3D
AMD Ryzen 7 7800X3D, R7 7800X3D, 4200 MHz |
169.25 (169.1min - 170max) fps +10% |
AMD Ryzen 5 9600X
AMD Ryzen 5 9600X (@105W), Ryzen 5 9600X, 3900 MHz |
160.05 (159.6min - 160.3max) fps +4% |
AMD Ryzen 5 9600X
AMD Ryzen 5 9600X, Ryzen 5 9600X, 3900 MHz |
154 (153.4min - 154.3max) fps |
Intel Core i5-12600K
Intel Core i5-12600K, i5-12600K, 2800 MHz |
148 (147min - 148max) fps -4% |
AMD Ryzen 5 7600X
AMD Ryzen 5 7600X, R5 7600X, 4700 MHz |
147.8 (147.7min - 147.9max) fps -4% |
Intel Core i5-13400
Intel Core i5-13400, i5-13400, 2500 MHz |
135.8 (135.7min - 135.9max) fps -12% |
Intel Core i5-12400F
Intel Core i5-12400F, i5-12400F, 2500 MHz |
101.35 (101.1min - 101.5max) fps -34% |
|
AMD Ryzen 9 7900X
AMD Ryzen 9 7900X, R9 7900X, 4700 MHz | |
AMD Ryzen 7 7800X3D
AMD Ryzen 7 7800X3D, R7 7800X3D, 4200 MHz | |
AMD Ryzen 9 7950X
NVIDIA GeForce RTX 3090 Founders Edition, R9 7950X, 4500 MHz | |
AMD Ryzen 5 7600X
AMD Ryzen 5 7600X, R5 7600X, 4700 MHz | |
Intel Core i9-14900K
Palit GeForce RTX 4090 GameRock OC, i9-14900K, 3200 MHz | |
AMD Ryzen 9 7950X3D
AMD Ryzen 9 7950X3D, R9 7950X3D, 4200 MHz | |
Intel Core i9-13900K
Intel Core i9-13900K, i9-13900K, 3000 MHz | |
AMD Ryzen 5 9600X
AMD Ryzen 5 9600X, Ryzen 5 9600X, 3900 MHz | |
AMD Ryzen 5 9600X
AMD Ryzen 5 9600X (@105W), Ryzen 5 9600X, 3900 MHz | |
AMD Ryzen 9 5950X
AMD Ryzen 9 5950X, R9 5950X, 3400 MHz | |
Intel Core i5-14600K
Intel Core i5-14600K, i5-14600K, 3500 MHz | |
Intel Core i5-13600K
Intel Core i5-13600K, i5-13600K, 3500 MHz | |
Intel Core i9-12900K
Intel Core i9-12900K, i9-12900K, 3200 MHz | |
Intel Core i5-13400
Intel Core i5-13400, i5-13400, 2500 MHz | |
Intel Core i5-12400F
Intel Core i5-12400F, i5-12400F, 2500 MHz | |
Intel Core i5-12600K
Intel Core i5-12600K, i5-12600K, 2800 MHz | |
|
|
AMD Ryzen 9 7950X
NVIDIA GeForce RTX 3090 Founders Edition, R9 7950X, 4500 MHz | |
Intel Core i9-13900K
Intel Core i9-13900K, i9-13900K, 3000 MHz | |
AMD Ryzen 9 5950X
AMD Ryzen 9 5950X, R9 5950X, 3400 MHz | |
AMD Ryzen 9 7950X3D
AMD Ryzen 9 7950X3D, R9 7950X3D, 4200 MHz | |
Intel Core i9-14900K
Palit GeForce RTX 4090 GameRock OC, i9-14900K, 3200 MHz | |
Intel Core i5-14600K
Intel Core i5-14600K, i5-14600K, 3500 MHz | |
Intel Core i5-13600K
Intel Core i5-13600K, i5-13600K, 3500 MHz | |
Intel Core i9-12900K
Intel Core i9-12900K, i9-12900K, 3200 MHz | |
AMD Ryzen 7 7800X3D
AMD Ryzen 7 7800X3D, R7 7800X3D, 4200 MHz | |
AMD Ryzen 9 7900X
AMD Ryzen 9 7900X, R9 7900X, 4700 MHz | |
AMD Ryzen 5 9600X
AMD Ryzen 5 9600X (@105W), Ryzen 5 9600X, 3900 MHz | |
AMD Ryzen 5 9600X
AMD Ryzen 5 9600X, Ryzen 5 9600X, 3900 MHz | |
AMD Ryzen 5 7600X
AMD Ryzen 5 7600X, R5 7600X, 4700 MHz | |
Intel Core i5-12600K
Intel Core i5-12600K, i5-12600K, 2800 MHz | |
Intel Core i5-13400
Intel Core i5-13400, i5-13400, 2500 MHz | |
Intel Core i5-12400F
Intel Core i5-12400F, i5-12400F, 2500 MHz | |
|
Intel Core i9-14900K
Palit GeForce RTX 4090 GameRock OC, i9-14900K, 3200 MHz | |
Intel Core i9-13900K
Intel Core i9-13900K, i9-13900K, 3000 MHz | |
AMD Ryzen 9 7950X
NVIDIA GeForce RTX 3090 Founders Edition, R9 7950X, 4500 MHz | |
AMD Ryzen 9 7950X3D
AMD Ryzen 9 7950X3D, R9 7950X3D, 4200 MHz | |
AMD Ryzen 9 5950X
AMD Ryzen 9 5950X, R9 5950X, 3400 MHz | |
Intel Core i9-12900K
Intel Core i9-12900K, i9-12900K, 3200 MHz | |
Intel Core i5-14600K
Intel Core i5-14600K, i5-14600K, 3500 MHz | |
Intel Core i5-13600K
Intel Core i5-13600K, i5-13600K, 3500 MHz | |
AMD Ryzen 9 7900X
AMD Ryzen 9 7900X, R9 7900X, 4700 MHz | |
AMD Ryzen 5 9600X
AMD Ryzen 5 9600X (@105W), Ryzen 5 9600X, 3900 MHz | |
Intel Core i5-12600K
Intel Core i5-12600K, i5-12600K, 2800 MHz | |
AMD Ryzen 5 9600X
AMD Ryzen 5 9600X, Ryzen 5 9600X, 3900 MHz | |
AMD Ryzen 7 7800X3D
AMD Ryzen 7 7800X3D, R7 7800X3D, 4200 MHz | |
Intel Core i5-13400
Intel Core i5-13400, i5-13400, 2500 MHz | |
AMD Ryzen 5 7600X
AMD Ryzen 5 7600X, R5 7600X, 4700 MHz | |
Intel Core i5-12400F
Intel Core i5-12400F, i5-12400F, 2500 MHz | |
|
Intel Core i9-13900K
Intel Core i9-13900K, i9-13900K, 3000 MHz | |
AMD Ryzen 9 7950X
NVIDIA GeForce RTX 3090 Founders Edition, R9 7950X, 4500 MHz | |
AMD Ryzen 9 7950X3D
AMD Ryzen 9 7950X3D, R9 7950X3D, 4200 MHz | |
Intel Core i9-14900K
Palit GeForce RTX 4090 GameRock OC, i9-14900K, 3200 MHz | |
AMD Ryzen 9 5950X
AMD Ryzen 9 5950X, R9 5950X, 3400 MHz | |
Intel Core i9-12900K
Intel Core i9-12900K, i9-12900K, 3200 MHz | |
Intel Core i5-14600K
Intel Core i5-14600K, i5-14600K, 3500 MHz | |
Intel Core i5-13600K
Intel Core i5-13600K, i5-13600K, 3500 MHz | |
AMD Ryzen 9 7900X
AMD Ryzen 9 7900X, R9 7900X, 4700 MHz | |
AMD Ryzen 5 9600X
AMD Ryzen 5 9600X, Ryzen 5 9600X, 3900 MHz | |
Intel Core i5-12600K
Intel Core i5-12600K, i5-12600K, 2800 MHz | |
AMD Ryzen 7 7800X3D
AMD Ryzen 7 7800X3D, R7 7800X3D, 4200 MHz | |
AMD Ryzen 5 9600X
AMD Ryzen 5 9600X (@105W), Ryzen 5 9600X, 3900 MHz | |
Intel Core i5-13400
Intel Core i5-13400, i5-13400, 2500 MHz | |
AMD Ryzen 5 7600X
AMD Ryzen 5 7600X, R5 7600X, 4700 MHz | |
Intel Core i5-12400F
Intel Core i5-12400F, i5-12400F, 2500 MHz | |
|
|
Intel Core i9-14900K
Palit GeForce RTX 4090 GameRock OC, i9-14900K, 3200 MHz | |
AMD Ryzen 9 7950X
NVIDIA GeForce RTX 3090 Founders Edition, R9 7950X, 4500 MHz | |
AMD Ryzen 9 7950X3D
AMD Ryzen 9 7950X3D, R9 7950X3D, 4200 MHz | |
Intel Core i9-13900K
Intel Core i9-13900K, i9-13900K, 3000 MHz | |
AMD Ryzen 9 7900X
AMD Ryzen 9 7900X, R9 7900X, 4700 MHz | |
Intel Core i9-12900K
Intel Core i9-12900K, i9-12900K, 3200 MHz | |
Intel Core i5-14600K
Intel Core i5-14600K, i5-14600K, 3500 MHz | |
AMD Ryzen 9 5950X
AMD Ryzen 9 5950X, R9 5950X, 3400 MHz | |
Intel Core i5-13600K
Intel Core i5-13600K, i5-13600K, 3500 MHz | |
AMD Ryzen 7 7800X3D
AMD Ryzen 7 7800X3D, R7 7800X3D, 4200 MHz | |
AMD Ryzen 5 9600X
AMD Ryzen 5 9600X (@105W), Ryzen 5 9600X, 3900 MHz | |
Intel Core i5-12600K
Intel Core i5-12600K, i5-12600K, 2800 MHz | |
AMD Ryzen 5 9600X
AMD Ryzen 5 9600X, Ryzen 5 9600X, 3900 MHz | |
Intel Core i5-13400
Intel Core i5-13400, i5-13400, 2500 MHz | |
AMD Ryzen 5 7600X
AMD Ryzen 5 7600X, R5 7600X, 4700 MHz | |
Intel Core i5-12400F
Intel Core i5-12400F, i5-12400F, 2500 MHz | |
|
AMD Ryzen 5 9600X
AMD Ryzen 5 9600X, Ryzen 5 9600X, 3900 MHz | |
AMD Ryzen 5 9600X
AMD Ryzen 5 9600X (@105W), Ryzen 5 9600X, 3900 MHz | |
AMD Ryzen 9 7950X
NVIDIA GeForce RTX 3090 Founders Edition, R9 7950X, 4500 MHz | |
AMD Ryzen 9 7950X3D
AMD Ryzen 9 7950X3D, R9 7950X3D, 4200 MHz | |
Intel Core i9-13900K
Intel Core i9-13900K, i9-13900K, 3000 MHz | |
AMD Ryzen 9 7900X
AMD Ryzen 9 7900X, R9 7900X, 4700 MHz | |
Intel Core i9-14900K
Palit GeForce RTX 4090 GameRock OC, i9-14900K, 3200 MHz | |
AMD Ryzen 5 7600X
AMD Ryzen 5 7600X, R5 7600X, 4700 MHz | |
Intel Core i9-12900K
Intel Core i9-12900K, i9-12900K, 3200 MHz | |
AMD Ryzen 7 7800X3D
AMD Ryzen 7 7800X3D, R7 7800X3D, 4200 MHz | |
Intel Core i5-14600K
Intel Core i5-14600K, i5-14600K, 3500 MHz | |
Intel Core i5-13600K
Intel Core i5-13600K, i5-13600K, 3500 MHz | |
Intel Core i5-12600K
Intel Core i5-12600K, i5-12600K, 2800 MHz | |
Intel Core i5-13400
Intel Core i5-13400, i5-13400, 2500 MHz | |
Intel Core i5-12400F
Intel Core i5-12400F, i5-12400F, 2500 MHz | |
AMD Ryzen 9 5950X
AMD Ryzen 9 5950X, R9 5950X, 3400 MHz | |
|
|
Intel Core i9-14900K
Palit GeForce RTX 4090 GameRock OC, i9-14900K, 3200 MHz | |
AMD Ryzen 9 7950X
NVIDIA GeForce RTX 3090 Founders Edition, R9 7950X, 4500 MHz | |
Intel Core i9-13900K
Intel Core i9-13900K, i9-13900K, 3000 MHz | |
AMD Ryzen 9 7950X3D
AMD Ryzen 9 7950X3D, R9 7950X3D, 4200 MHz | |
AMD Ryzen 9 7900X
AMD Ryzen 9 7900X, R9 7900X, 4700 MHz | |
Intel Core i9-12900K
Intel Core i9-12900K, i9-12900K, 3200 MHz | |
Intel Core i5-14600K
Intel Core i5-14600K, i5-14600K, 3500 MHz | |
Intel Core i5-13600K
Intel Core i5-13600K, i5-13600K, 3500 MHz | |
AMD Ryzen 9 5950X
AMD Ryzen 9 5950X, R9 5950X, 3400 MHz | |
AMD Ryzen 7 7800X3D
AMD Ryzen 7 7800X3D, R7 7800X3D, 4200 MHz | |
AMD Ryzen 5 9600X
AMD Ryzen 5 9600X (@105W), Ryzen 5 9600X, 3900 MHz | |
Intel Core i5-12600K
Intel Core i5-12600K, i5-12600K, 2800 MHz | |
AMD Ryzen 5 9600X
AMD Ryzen 5 9600X, Ryzen 5 9600X, 3900 MHz | |
AMD Ryzen 5 7600X
AMD Ryzen 5 7600X, R5 7600X, 4700 MHz | |
Intel Core i5-13400
Intel Core i5-13400, i5-13400, 2500 MHz | |
Intel Core i5-12400F
Intel Core i5-12400F, i5-12400F, 2500 MHz | |
|
AMD Ryzen 5 9600X
AMD Ryzen 5 9600X, Ryzen 5 9600X, 3900 MHz | |
AMD Ryzen 5 9600X
AMD Ryzen 5 9600X (@105W), Ryzen 5 9600X, 3900 MHz | |
Intel Core i9-14900K
Palit GeForce RTX 4090 GameRock OC, i9-14900K, 3200 MHz | |
AMD Ryzen 9 7950X
NVIDIA GeForce RTX 3090 Founders Edition, R9 7950X, 4500 MHz | |
Intel Core i9-13900K
Intel Core i9-13900K, i9-13900K, 3000 MHz | |
AMD Ryzen 9 7900X
AMD Ryzen 9 7900X, R9 7900X, 4700 MHz | |
AMD Ryzen 9 7950X3D
AMD Ryzen 9 7950X3D, R9 7950X3D, 4200 MHz | |
AMD Ryzen 5 7600X
AMD Ryzen 5 7600X, R5 7600X, 4700 MHz | |
Intel Core i5-14600K
Intel Core i5-14600K, i5-14600K, 3500 MHz | |
Intel Core i9-12900K
Intel Core i9-12900K, i9-12900K, 3200 MHz | |
AMD Ryzen 7 7800X3D
AMD Ryzen 7 7800X3D, R7 7800X3D, 4200 MHz | |
Intel Core i5-13600K
Intel Core i5-13600K, i5-13600K, 3500 MHz | |
Intel Core i5-12600K
Intel Core i5-12600K, i5-12600K, 2800 MHz | |
Intel Core i5-13400
Intel Core i5-13400, i5-13400, 2500 MHz | |
AMD Ryzen 9 5950X
AMD Ryzen 9 5950X, R9 5950X, 3400 MHz | |
Intel Core i5-12400F
Intel Core i5-12400F, i5-12400F, 2500 MHz | |
|
|
Intel Core i9-14900K
Palit GeForce RTX 4090 GameRock OC, i9-14900K, 3200 MHz | |
AMD Ryzen 5 9600X
AMD Ryzen 5 9600X, Ryzen 5 9600X, 3900 MHz | |
AMD Ryzen 5 9600X
AMD Ryzen 5 9600X (@105W), Ryzen 5 9600X, 3900 MHz | |
Intel Core i9-13900K
Intel Core i9-13900K, i9-13900K, 3000 MHz | |
AMD Ryzen 9 7950X
NVIDIA GeForce RTX 3090 Founders Edition, R9 7950X, 4500 MHz | |
AMD Ryzen 9 7950X3D
AMD Ryzen 9 7950X3D, R9 7950X3D, 4200 MHz | |
AMD Ryzen 9 7900X
AMD Ryzen 9 7900X, R9 7900X, 4700 MHz | |
AMD Ryzen 7 7800X3D
AMD Ryzen 7 7800X3D, R7 7800X3D, 4200 MHz | |
AMD Ryzen 5 7600X
AMD Ryzen 5 7600X, R5 7600X, 4700 MHz | |
Intel Core i5-14600K
Intel Core i5-14600K, i5-14600K, 3500 MHz | |
Intel Core i9-12900K
Intel Core i9-12900K, i9-12900K, 3200 MHz | |
Intel Core i5-13600K
Intel Core i5-13600K, i5-13600K, 3500 MHz | |
Intel Core i5-12600K
Intel Core i5-12600K, i5-12600K, 2800 MHz | |
Intel Core i5-13400
Intel Core i5-13400, i5-13400, 2500 MHz | |
Intel Core i5-12400F
Intel Core i5-12400F, i5-12400F, 2500 MHz | |
AMD Ryzen 9 5950X
AMD Ryzen 9 5950X, R9 5950X, 3400 MHz | |
|
AMD Ryzen 9 7950X
NVIDIA GeForce RTX 3090 Founders Edition, R9 7950X, 4500 MHz | |
Intel Core i9-14900K
Palit GeForce RTX 4090 GameRock OC, i9-14900K, 3200 MHz | |
AMD Ryzen 9 7950X3D
AMD Ryzen 9 7950X3D, R9 7950X3D, 4200 MHz | |
Intel Core i9-13900K
Intel Core i9-13900K, i9-13900K, 3000 MHz | |
AMD Ryzen 9 7900X
AMD Ryzen 9 7900X, R9 7900X, 4700 MHz | |
Intel Core i5-14600K
Intel Core i5-14600K, i5-14600K, 3500 MHz | |
Intel Core i9-12900K
Intel Core i9-12900K, i9-12900K, 3200 MHz | |
AMD Ryzen 9 5950X
AMD Ryzen 9 5950X, R9 5950X, 3400 MHz | |
Intel Core i5-13600K
Intel Core i5-13600K, i5-13600K, 3500 MHz | |
AMD Ryzen 7 7800X3D
AMD Ryzen 7 7800X3D, R7 7800X3D, 4200 MHz | |
AMD Ryzen 5 9600X
AMD Ryzen 5 9600X (@105W), Ryzen 5 9600X, 3900 MHz | |
AMD Ryzen 5 9600X
AMD Ryzen 5 9600X, Ryzen 5 9600X, 3900 MHz | |
AMD Ryzen 5 7600X
AMD Ryzen 5 7600X, R5 7600X, 4700 MHz | |
Intel Core i5-12600K
Intel Core i5-12600K, i5-12600K, 2800 MHz | |
Intel Core i5-13400
Intel Core i5-13400, i5-13400, 2500 MHz | |
Intel Core i5-12400F
Intel Core i5-12400F, i5-12400F, 2500 MHz | |
|
AMD Ryzen 9 7950X3D
AMD Ryzen 9 7950X3D, R9 7950X3D, 4200 MHz | |
AMD Ryzen 7 7800X3D
AMD Ryzen 7 7800X3D, R7 7800X3D, 4200 MHz | |
Intel Core i9-13900K
Intel Core i9-13900K, i9-13900K, 3000 MHz | |
Intel Core i9-14900K
Palit GeForce RTX 4090 GameRock OC, i9-14900K, 3200 MHz | |
Intel Core i5-14600K
Intel Core i5-14600K, i5-14600K, 3500 MHz | |
Intel Core i5-13600K
Intel Core i5-13600K, i5-13600K, 3500 MHz | |
AMD Ryzen 9 7900X
AMD Ryzen 9 7900X, R9 7900X, 4700 MHz | |
AMD Ryzen 9 7950X
NVIDIA GeForce RTX 3090 Founders Edition, R9 7950X, 4500 MHz | |
Intel Core i9-12900K
Intel Core i9-12900K, i9-12900K, 3200 MHz | |
AMD Ryzen 5 9600X
AMD Ryzen 5 9600X (@105W), Ryzen 5 9600X, 3900 MHz | |
AMD Ryzen 5 9600X
AMD Ryzen 5 9600X, Ryzen 5 9600X, 3900 MHz | |
AMD Ryzen 5 7600X
AMD Ryzen 5 7600X, R5 7600X, 4700 MHz | |
AMD Ryzen 9 5950X
AMD Ryzen 9 5950X, R9 5950X, 3400 MHz | |
Intel Core i5-12600K
Intel Core i5-12600K, i5-12600K, 2800 MHz | |
Intel Core i5-13400
Intel Core i5-13400, i5-13400, 2500 MHz | |
Intel Core i5-12400F
Intel Core i5-12400F, i5-12400F, 2500 MHz | |
|
|
AMD Ryzen 9 7950X
NVIDIA GeForce RTX 3090 Founders Edition, R9 7950X, 4500 MHz | |
AMD Ryzen 9 7950X3D
AMD Ryzen 9 7950X3D, R9 7950X3D, 4200 MHz | |
Intel Core i9-14900K
Palit GeForce RTX 4090 GameRock OC, i9-14900K, 3200 MHz | |
Intel Core i9-13900K
Intel Core i9-13900K, i9-13900K, 3000 MHz | |
AMD Ryzen 9 5950X
AMD Ryzen 9 5950X, R9 5950X, 3400 MHz | |
AMD Ryzen 9 7900X
AMD Ryzen 9 7900X, R9 7900X, 4700 MHz | |
Intel Core i9-12900K
Intel Core i9-12900K, i9-12900K, 3200 MHz | |
Intel Core i5-14600K
Intel Core i5-14600K, i5-14600K, 3500 MHz | |
Intel Core i5-13600K
Intel Core i5-13600K, i5-13600K, 3500 MHz | |
AMD Ryzen 7 7800X3D
AMD Ryzen 7 7800X3D, R7 7800X3D, 4200 MHz | |
AMD Ryzen 5 7600X
AMD Ryzen 5 7600X, R5 7600X, 4700 MHz | |
AMD Ryzen 5 9600X
AMD Ryzen 5 9600X (@105W), Ryzen 5 9600X, 3900 MHz | |
AMD Ryzen 5 9600X
AMD Ryzen 5 9600X, Ryzen 5 9600X, 3900 MHz | |
Intel Core i5-12600K
Intel Core i5-12600K, i5-12600K, 2800 MHz | |
Intel Core i5-13400
Intel Core i5-13400, i5-13400, 2500 MHz | |
Intel Core i5-12400F
Intel Core i5-12400F, i5-12400F, 2500 MHz | |
|
AMD Ryzen 9 7950X
NVIDIA GeForce RTX 3090 Founders Edition, R9 7950X, 4500 MHz | |
AMD Ryzen 9 7950X3D
AMD Ryzen 9 7950X3D, R9 7950X3D, 4200 MHz | |
AMD Ryzen 9 7900X
AMD Ryzen 9 7900X, R9 7900X, 4700 MHz | |
AMD Ryzen 7 7800X3D
AMD Ryzen 7 7800X3D, R7 7800X3D, 4200 MHz | |
AMD Ryzen 5 7600X
AMD Ryzen 5 7600X, R5 7600X, 4700 MHz | |
AMD Ryzen 5 9600X
AMD Ryzen 5 9600X, Ryzen 5 9600X, 3900 MHz | |
Intel Core i9-14900K
Palit GeForce RTX 4090 GameRock OC, i9-14900K, 3200 MHz | |
AMD Ryzen 5 9600X
AMD Ryzen 5 9600X (@105W), Ryzen 5 9600X, 3900 MHz | |
Intel Core i9-13900K
Intel Core i9-13900K, i9-13900K, 3000 MHz | |
AMD Ryzen 9 5950X
AMD Ryzen 9 5950X, R9 5950X, 3400 MHz | |
Intel Core i5-14600K
Intel Core i5-14600K, i5-14600K, 3500 MHz | |
Intel Core i9-12900K
Intel Core i9-12900K, i9-12900K, 3200 MHz | |
Intel Core i5-13600K
Intel Core i5-13600K, i5-13600K, 3500 MHz | |
Intel Core i5-12600K
Intel Core i5-12600K, i5-12600K, 2800 MHz | |
Intel Core i5-13400
Intel Core i5-13400, i5-13400, 2500 MHz | |
Intel Core i5-12400F
Intel Core i5-12400F, i5-12400F, 2500 MHz | |
|
AMD Ryzen 9 7950X
NVIDIA GeForce RTX 3090 Founders Edition, R9 7950X, 4500 MHz | |
Intel Core i9-14900K
Palit GeForce RTX 4090 GameRock OC, i9-14900K, 3200 MHz | |
Intel Core i9-13900K
Intel Core i9-13900K, i9-13900K, 3000 MHz | |
AMD Ryzen 9 7950X3D
AMD Ryzen 9 7950X3D, R9 7950X3D, 4200 MHz | |
AMD Ryzen 9 7900X
AMD Ryzen 9 7900X, R9 7900X, 4700 MHz | |
AMD Ryzen 9 5950X
AMD Ryzen 9 5950X, R9 5950X, 3400 MHz | |
Intel Core i5-12600K
Intel Core i5-12600K, i5-12600K, 2800 MHz | |
Intel Core i9-12900K
Intel Core i9-12900K, i9-12900K, 3200 MHz | |
Intel Core i5-14600K
Intel Core i5-14600K, i5-14600K, 3500 MHz | |
Intel Core i5-13600K
Intel Core i5-13600K, i5-13600K, 3500 MHz | |
AMD Ryzen 7 7800X3D
AMD Ryzen 7 7800X3D, R7 7800X3D, 4200 MHz | |
AMD Ryzen 5 9600X
AMD Ryzen 5 9600X (@105W), Ryzen 5 9600X, 3900 MHz | |
AMD Ryzen 5 9600X
AMD Ryzen 5 9600X, Ryzen 5 9600X, 3900 MHz | |
AMD Ryzen 5 7600X
AMD Ryzen 5 7600X, R5 7600X, 4700 MHz | |
Intel Core i5-13400
Intel Core i5-13400, i5-13400, 2500 MHz | |
Intel Core i5-12400F
Intel Core i5-12400F, i5-12400F, 2500 MHz | |
|
Intel Core i5-12400F
Intel Core i5-12400F, i5-12400F, 2500 MHz | |
Intel Core i5-13400
Intel Core i5-13400, i5-13400, 2500 MHz | |
AMD Ryzen 9 5950X
AMD Ryzen 9 5950X, R9 5950X, 3400 MHz | |
Intel Core i5-12600K
Intel Core i5-12600K, i5-12600K, 2800 MHz | |
Intel Core i9-12900K
Intel Core i9-12900K, i9-12900K, 3200 MHz | |
AMD Ryzen 7 7800X3D
AMD Ryzen 7 7800X3D, R7 7800X3D, 4200 MHz | |
Intel Core i5-13600K
Intel Core i5-13600K, i5-13600K, 3500 MHz | |
Intel Core i5-14600K
Intel Core i5-14600K, i5-14600K, 3500 MHz | |
AMD Ryzen 5 7600X
AMD Ryzen 5 7600X, R5 7600X, 4700 MHz | |
AMD Ryzen 9 7900X
AMD Ryzen 9 7900X, R9 7900X, 4700 MHz | |
AMD Ryzen 9 7950X3D
AMD Ryzen 9 7950X3D, R9 7950X3D, 4200 MHz | |
AMD Ryzen 9 7950X
NVIDIA GeForce RTX 3090 Founders Edition, R9 7950X, 4500 MHz | |
Intel Core i9-13900K
Intel Core i9-13900K, i9-13900K, 3000 MHz | |
Intel Core i9-14900K
Palit GeForce RTX 4090 GameRock OC, i9-14900K, 3200 MHz | |
AMD Ryzen 5 9600X
AMD Ryzen 5 9600X (@105W), Ryzen 5 9600X, 3900 MHz | |
AMD Ryzen 5 9600X
AMD Ryzen 5 9600X, Ryzen 5 9600X, 3900 MHz | |
|
Intel Core i5-12600K
Intel Core i5-12600K, i5-12600K, 2800 MHz | |
Intel Core i5-12400F
Intel Core i5-12400F, i5-12400F, 2500 MHz | |
AMD Ryzen 5 9600X
AMD Ryzen 5 9600X, Ryzen 5 9600X, 3900 MHz | |
AMD Ryzen 9 5950X
AMD Ryzen 9 5950X, R9 5950X, 3400 MHz | |
AMD Ryzen 5 9600X
AMD Ryzen 5 9600X (@105W), Ryzen 5 9600X, 3900 MHz | |
AMD Ryzen 7 7800X3D
AMD Ryzen 7 7800X3D, R7 7800X3D, 4200 MHz | |
Intel Core i9-12900K
Intel Core i9-12900K, i9-12900K, 3200 MHz | |
Intel Core i5-13400
Intel Core i5-13400, i5-13400, 2500 MHz | |
AMD Ryzen 9 7950X3D
AMD Ryzen 9 7950X3D, R9 7950X3D, 4200 MHz | |
AMD Ryzen 5 7600X
AMD Ryzen 5 7600X, R5 7600X, 4700 MHz | |
Intel Core i9-13900K
Intel Core i9-13900K, i9-13900K, 3000 MHz | |
AMD Ryzen 9 7950X
NVIDIA GeForce RTX 3090 Founders Edition, R9 7950X, 4500 MHz | |
Intel Core i5-13600K
Intel Core i5-13600K, i5-13600K, 3500 MHz | |
AMD Ryzen 9 7900X
AMD Ryzen 9 7900X, R9 7900X, 4700 MHz | |
Intel Core i9-14900K
Palit GeForce RTX 4090 GameRock OC, i9-14900K, 3200 MHz | |
Intel Core i5-14600K
Intel Core i5-14600K, i5-14600K, 3500 MHz | |
|
AMD Ryzen 5 9600X
AMD Ryzen 5 9600X (@105W), Ryzen 5 9600X, 3900 MHz | |
AMD Ryzen 9 7950X3D
AMD Ryzen 9 7950X3D, R9 7950X3D, 4200 MHz | |
Intel Core i9-14900K
Palit GeForce RTX 4090 GameRock OC, i9-14900K, 3200 MHz | |
AMD Ryzen 9 7900X
AMD Ryzen 9 7900X, R9 7900X, 4700 MHz | |
AMD Ryzen 9 7950X
NVIDIA GeForce RTX 3090 Founders Edition, R9 7950X, 4500 MHz | |
AMD Ryzen 5 9600X
AMD Ryzen 5 9600X, Ryzen 5 9600X, 3900 MHz | |
AMD Ryzen 5 7600X
AMD Ryzen 5 7600X, R5 7600X, 4700 MHz | |
Intel Core i9-13900K
Intel Core i9-13900K, i9-13900K, 3000 MHz | |
Intel Core i5-14600K
Intel Core i5-14600K, i5-14600K, 3500 MHz | |
AMD Ryzen 7 7800X3D
AMD Ryzen 7 7800X3D, R7 7800X3D, 4200 MHz | |
Intel Core i5-13600K
Intel Core i5-13600K, i5-13600K, 3500 MHz | |
Intel Core i9-12900K
Intel Core i9-12900K, i9-12900K, 3200 MHz | |
Intel Core i5-13400
Intel Core i5-13400, i5-13400, 2500 MHz | |
Intel Core i5-12600K
Intel Core i5-12600K, i5-12600K, 2800 MHz | |
AMD Ryzen 9 5950X
AMD Ryzen 9 5950X, R9 5950X, 3400 MHz | |
Intel Core i5-12400F
Intel Core i5-12400F, i5-12400F, 2500 MHz | |
|
Intel Core i5-12400F
Intel Core i5-12400F, i5-12400F, 2500 MHz | |
AMD Ryzen 9 5950X
AMD Ryzen 9 5950X, R9 5950X, 3400 MHz | |
Intel Core i5-13400
Intel Core i5-13400, i5-13400, 2500 MHz | |
Intel Core i5-12600K
Intel Core i5-12600K, i5-12600K, 2800 MHz | |
AMD Ryzen 7 7800X3D
AMD Ryzen 7 7800X3D, R7 7800X3D, 4200 MHz | |
Intel Core i9-12900K
Intel Core i9-12900K, i9-12900K, 3200 MHz | |
Intel Core i5-13600K
Intel Core i5-13600K, i5-13600K, 3500 MHz | |
Intel Core i5-14600K
Intel Core i5-14600K, i5-14600K, 3500 MHz | |
AMD Ryzen 5 7600X
AMD Ryzen 5 7600X, R5 7600X, 4700 MHz | |
AMD Ryzen 9 7950X3D
AMD Ryzen 9 7950X3D, R9 7950X3D, 4200 MHz | |
AMD Ryzen 9 7950X
NVIDIA GeForce RTX 3090 Founders Edition, R9 7950X, 4500 MHz | |
Intel Core i9-13900K
Intel Core i9-13900K, i9-13900K, 3000 MHz | |
AMD Ryzen 9 7900X
AMD Ryzen 9 7900X, R9 7900X, 4700 MHz | |
Intel Core i9-14900K
Palit GeForce RTX 4090 GameRock OC, i9-14900K, 3200 MHz | |
AMD Ryzen 5 9600X
AMD Ryzen 5 9600X (@105W), Ryzen 5 9600X, 3900 MHz | |
AMD Ryzen 5 9600X
AMD Ryzen 5 9600X, Ryzen 5 9600X, 3900 MHz | |
|
|
Intel Core i9-14900K
Palit GeForce RTX 4090 GameRock OC, i9-14900K, 3200 MHz | |
Intel Core i9-13900K
Intel Core i9-13900K, i9-13900K, 3000 MHz | |
AMD Ryzen 9 7950X3D
AMD Ryzen 9 7950X3D, R9 7950X3D, 4200 MHz | |
AMD Ryzen 9 7900X
AMD Ryzen 9 7900X, R9 7900X, 4700 MHz | |
AMD Ryzen 9 7950X
NVIDIA GeForce RTX 3090 Founders Edition, R9 7950X, 4500 MHz | |
Intel Core i5-14600K
Intel Core i5-14600K, i5-14600K, 3500 MHz | |
Intel Core i9-12900K
Intel Core i9-12900K, i9-12900K, 3200 MHz | |
AMD Ryzen 9 5950X
AMD Ryzen 9 5950X, R9 5950X, 3400 MHz | |
Intel Core i5-13600K
Intel Core i5-13600K, i5-13600K, 3500 MHz | |
AMD Ryzen 5 9600X
AMD Ryzen 5 9600X, Ryzen 5 9600X, 3900 MHz | |
AMD Ryzen 7 7800X3D
AMD Ryzen 7 7800X3D, R7 7800X3D, 4200 MHz | |
AMD Ryzen 5 9600X
AMD Ryzen 5 9600X (@105W), Ryzen 5 9600X, 3900 MHz | |
AMD Ryzen 5 7600X
AMD Ryzen 5 7600X, R5 7600X, 4700 MHz | |
Intel Core i5-12600K
Intel Core i5-12600K, i5-12600K, 2800 MHz | |
Intel Core i5-13400
Intel Core i5-13400, i5-13400, 2500 MHz | |
Intel Core i5-12400F
Intel Core i5-12400F, i5-12400F, 2500 MHz | |
|
Intel Core i9-14900K
Palit GeForce RTX 4090 GameRock OC, i9-14900K, 3200 MHz | |
Intel Core i9-13900K
Intel Core i9-13900K, i9-13900K, 3000 MHz | |
AMD Ryzen 9 7950X3D
AMD Ryzen 9 7950X3D, R9 7950X3D, 4200 MHz | |
AMD Ryzen 9 7900X
AMD Ryzen 9 7900X, R9 7900X, 4700 MHz | |
AMD Ryzen 9 7950X
NVIDIA GeForce RTX 3090 Founders Edition, R9 7950X, 4500 MHz | |
Intel Core i5-14600K
Intel Core i5-14600K, i5-14600K, 3500 MHz | |
AMD Ryzen 9 5950X
AMD Ryzen 9 5950X, R9 5950X, 3400 MHz | |
Intel Core i9-12900K
Intel Core i9-12900K, i9-12900K, 3200 MHz | |
Intel Core i5-13600K
Intel Core i5-13600K, i5-13600K, 3500 MHz | |
AMD Ryzen 5 9600X
AMD Ryzen 5 9600X, Ryzen 5 9600X, 3900 MHz | |
AMD Ryzen 5 9600X
AMD Ryzen 5 9600X (@105W), Ryzen 5 9600X, 3900 MHz | |
AMD Ryzen 7 7800X3D
AMD Ryzen 7 7800X3D, R7 7800X3D, 4200 MHz | |
AMD Ryzen 5 7600X
AMD Ryzen 5 7600X, R5 7600X, 4700 MHz | |
Intel Core i5-12600K
Intel Core i5-12600K, i5-12600K, 2800 MHz | |
Intel Core i5-13400
Intel Core i5-13400, i5-13400, 2500 MHz | |
Intel Core i5-12400F
Intel Core i5-12400F, i5-12400F, 2500 MHz | |
|
Intel Core i9-14900K
Palit GeForce RTX 4090 GameRock OC, i9-14900K, 3200 MHz | |
Intel Core i9-13900K
Intel Core i9-13900K, i9-13900K, 3000 MHz | |
Intel Core i5-14600K
Intel Core i5-14600K, i5-14600K, 3500 MHz | |
Intel Core i9-12900K
Intel Core i9-12900K, i9-12900K, 3200 MHz | |
AMD Ryzen 9 7950X3D
AMD Ryzen 9 7950X3D, R9 7950X3D, 4200 MHz | |
Intel Core i5-13600K
Intel Core i5-13600K, i5-13600K, 3500 MHz | |
AMD Ryzen 9 7900X
AMD Ryzen 9 7900X, R9 7900X, 4700 MHz | |
AMD Ryzen 9 7950X
NVIDIA GeForce RTX 3090 Founders Edition, R9 7950X, 4500 MHz | |
AMD Ryzen 7 7800X3D
AMD Ryzen 7 7800X3D, R7 7800X3D, 4200 MHz | |
Intel Core i5-12600K
Intel Core i5-12600K, i5-12600K, 2800 MHz | |
AMD Ryzen 9 5950X
AMD Ryzen 9 5950X, R9 5950X, 3400 MHz | |
Intel Core i5-13400
Intel Core i5-13400, i5-13400, 2500 MHz | |
AMD Ryzen 5 9600X
AMD Ryzen 5 9600X (@105W), Ryzen 5 9600X, 3900 MHz | |
AMD Ryzen 5 9600X
AMD Ryzen 5 9600X, Ryzen 5 9600X, 3900 MHz | |
AMD Ryzen 5 7600X
AMD Ryzen 5 7600X, R5 7600X, 4700 MHz | |
Intel Core i5-12400F
Intel Core i5-12400F, i5-12400F, 2500 MHz | |
|
Intel Core i5-12400F
Intel Core i5-12400F, i5-12400F, 2500 MHz | |
Intel Core i5-13400
Intel Core i5-13400, i5-13400, 2500 MHz | |
AMD Ryzen 5 9600X
AMD Ryzen 5 9600X (@105W), Ryzen 5 9600X, 3900 MHz | |
AMD Ryzen 5 9600X
AMD Ryzen 5 9600X, Ryzen 5 9600X, 3900 MHz | |
AMD Ryzen 5 7600X
AMD Ryzen 5 7600X, R5 7600X, 4700 MHz | |
Intel Core i5-12600K
Intel Core i5-12600K, i5-12600K, 2800 MHz | |
AMD Ryzen 7 7800X3D
AMD Ryzen 7 7800X3D, R7 7800X3D, 4200 MHz | |
AMD Ryzen 9 5950X
AMD Ryzen 9 5950X, R9 5950X, 3400 MHz | |
Intel Core i9-12900K
Intel Core i9-12900K, i9-12900K, 3200 MHz | |
Intel Core i5-13600K
Intel Core i5-13600K, i5-13600K, 3500 MHz | |
Intel Core i5-14600K
Intel Core i5-14600K, i5-14600K, 3500 MHz | |
AMD Ryzen 9 7900X
AMD Ryzen 9 7900X, R9 7900X, 4700 MHz | |
AMD Ryzen 9 7950X3D
AMD Ryzen 9 7950X3D, R9 7950X3D, 4200 MHz | |
AMD Ryzen 9 7950X
NVIDIA GeForce RTX 3090 Founders Edition, R9 7950X, 4500 MHz | |
Intel Core i9-13900K
Intel Core i9-13900K, i9-13900K, 3000 MHz | |
Intel Core i9-14900K
Palit GeForce RTX 4090 GameRock OC, i9-14900K, 3200 MHz | |
|
Intel Core i5-12400F
Intel Core i5-12400F, i5-12400F, 2500 MHz | |
Intel Core i5-13400
Intel Core i5-13400, i5-13400, 2500 MHz | |
Intel Core i5-12600K
Intel Core i5-12600K, i5-12600K, 2800 MHz | |
AMD Ryzen 5 9600X
AMD Ryzen 5 9600X, Ryzen 5 9600X, 3900 MHz | |
AMD Ryzen 5 9600X
AMD Ryzen 5 9600X (@105W), Ryzen 5 9600X, 3900 MHz | |
AMD Ryzen 5 7600X
AMD Ryzen 5 7600X, R5 7600X, 4700 MHz | |
Intel Core i9-12900K
Intel Core i9-12900K, i9-12900K, 3200 MHz | |
AMD Ryzen 7 7800X3D
AMD Ryzen 7 7800X3D, R7 7800X3D, 4200 MHz | |
AMD Ryzen 9 5950X
AMD Ryzen 9 5950X, R9 5950X, 3400 MHz | |
Intel Core i5-13600K
Intel Core i5-13600K, i5-13600K, 3500 MHz | |
Intel Core i5-14600K
Intel Core i5-14600K, i5-14600K, 3500 MHz | |
AMD Ryzen 9 7950X
NVIDIA GeForce RTX 3090 Founders Edition, R9 7950X, 4500 MHz | |
AMD Ryzen 9 7900X
AMD Ryzen 9 7900X, R9 7900X, 4700 MHz | |
Intel Core i9-13900K
Intel Core i9-13900K, i9-13900K, 3000 MHz | |
AMD Ryzen 9 7950X3D
AMD Ryzen 9 7950X3D, R9 7950X3D, 4200 MHz | |
Intel Core i9-14900K
Palit GeForce RTX 4090 GameRock OC, i9-14900K, 3200 MHz | |
|
Intel Core i5-12400F
Intel Core i5-12400F, i5-12400F, 2500 MHz | |
Intel Core i5-13400
Intel Core i5-13400, i5-13400, 2500 MHz | |
AMD Ryzen 5 7600X
AMD Ryzen 5 7600X, R5 7600X, 4700 MHz | |
Intel Core i5-12600K
Intel Core i5-12600K, i5-12600K, 2800 MHz | |
AMD Ryzen 5 9600X
AMD Ryzen 5 9600X, Ryzen 5 9600X, 3900 MHz | |
AMD Ryzen 5 9600X
AMD Ryzen 5 9600X (@105W), Ryzen 5 9600X, 3900 MHz | |
AMD Ryzen 9 5950X
AMD Ryzen 9 5950X, R9 5950X, 3400 MHz | |
Intel Core i9-12900K
Intel Core i9-12900K, i9-12900K, 3200 MHz | |
AMD Ryzen 7 7800X3D
AMD Ryzen 7 7800X3D, R7 7800X3D, 4200 MHz | |
Intel Core i5-13600K
Intel Core i5-13600K, i5-13600K, 3500 MHz | |
Intel Core i5-14600K
Intel Core i5-14600K, i5-14600K, 3500 MHz | |
AMD Ryzen 9 7900X
AMD Ryzen 9 7900X, R9 7900X, 4700 MHz | |
AMD Ryzen 9 7950X
NVIDIA GeForce RTX 3090 Founders Edition, R9 7950X, 4500 MHz | |
AMD Ryzen 9 7950X3D
AMD Ryzen 9 7950X3D, R9 7950X3D, 4200 MHz | |
Intel Core i9-13900K
Intel Core i9-13900K, i9-13900K, 3000 MHz | |
Intel Core i9-14900K
Palit GeForce RTX 4090 GameRock OC, i9-14900K, 3200 MHz | |
* ... kleinere Werte sind besser