Notebookcheck Logo
Teaser

Intel Core Ultra 5 245K im Test: Die perfekte Balance zwischen Power und Effizienz?

Fluch und Segen zugleich! Intel läutet mit den Arrow-Lake-Prozessoren für den Desktop-Bereich eine frische Ära ein. Ein neues Namensschema sowie ein neuer Unterbau und eine geringere Leistungsaufnahme stehen als große Änderungen im Raum. Welche Änderungen es im Detail noch gibt und wie gut sich der Intel Core Ultra 5 245K im Alltag und in Spielen schlägt, erfahren Sie in diesem Review.
Sebastian Bade, Stefanie Voigt Veröffentlicht am 🇺🇸 🇫🇷 ...
CPU Intel Desktop Gaming

Fazit - Effiziente CPU zum Arbeiten

Der Intel Core Ultra 5 245K präsentiert sich in unserem Test als vielseitiger und leistungsstarker Prozessor, der sowohl für Gaming als auch für kreative Anwendungen eine starke Leistung bietet. Mit der hybriden Architektur, bestehend aus leistungsstarken Performance-Kernen (P-Kernen) und effizienten Effizienz-Kernen (E-Kernen), bietet der Chip eine ausgezeichnete Balance zwischen Rechenleistung und Energieeffizienz. Letzteres konnte im Vergleich zum Vorgängermodell deutlich verbessert werden, was ein richtiger und wichtiger Schritt ist, um den Anschluss an AMD nicht komplett zu verlieren.

In puncto Leistung kann der Core Ultra 5 245K vor allem bei den reinen CPU-Leistungstests überzeugen. Allerdings zeigt sich in Gaming-Szenarien eine etwas schlechtere Performance gegenüber dem älteren Intel Core i5-14600K. Die gebotene Leistung reicht jedoch immer aus, um alle gängigen Spiele flüssig auf den Bildschirm zu bringen. In Bezug auf Konnektivität unterstützt der Core Ultra 5 245K aktuelle Standards wie PCIe 5.0 und DDR5-RAM, was für schnelle Datenübertragung und Zukunftssicherheit sorgt. Dies ermöglicht es, das System mit den neuesten SSDs und Grafikkarten auszurüsten, was insbesondere für Gamer und Kreative von großem Vorteil ist. Als Neuerung dazu führt Intel auf Basis des Sockel 1851 einen neuen Unterbau ein. Ein einfaches CPU-Upgrade ist somit leider nicht möglich.

Der Intel Core Ultra 5 245K erweist sich als ein sparsamer Alleskönner im mittleren Leistungssegment. Mit seiner soliden Gaming-Performance, seinen guten Multitasking-Fähigkeiten und der Unterstützung moderner Technologien wie einer NPU ist er eine ausgezeichnete Wahl für Nutzer, die ein ausgewogenes Verhältnis zwischen Preis und Leistung suchen. Besonders hervorzuheben ist die Energieeffizienz des Prozessors.

Pro

+ tolle Anwendungsleistung
+ hervorragende Single- und Multi-Core-Leistung
+ PCI-Express-5.0
+ deutlich effizienter als vorherige Generationen
+ integrierte NPU
+ leicht zu kühlen
+ modularer Aufbau - Chiplet-Design

Contra

- neues Mainboard erforderlich
- Gaming-Leistung schlechter als beim Vorgänger

Preis und Verfügbarkeit

Ab sofort kann der Intel Core Ultra 5 245K beispielsweise bei Galaxus für 359 Euro bestellt werden. Den direkten Vorgänger, den Intel Core i5-14600K, gibt es derweil bei Amazon bereits für 295 Euro.

293,00 €
Intel® Core™ i5-14600K Gaming-Desktop-Prozessor, 14 Kerne (6 P-Kerne + 8 E-Kerne) mit integrierter Grafik - Freigeschaltet
Bestpreis 334.9€ Proshop.at
Intel Core Ultra 5 245K, 6C+8c/14T, 4.20-5.20GHz, boxed ohne Kühler (BXC80768245K)
2. 334.9 € Proshop.de
3. 352 € Alternate
4. 353 € computeruniverse.net
Intel-Arrow-Lake-S-Prozessoren (Quelle: Intel)

Die Arrow-Lake-S-Prozessoren stellen die nächste Generation der Intel Desktop-Prozessoren dar und basieren auf dem neuen LGA-1851-Sockel. Damit werden nicht nur die Raptor-Lake-Modelle, sondern auch der bereits vor drei Jahren vorgestellte LGA-1700-Sockel in Rente geschickt.

Die Arrow-Lake-S-Prozessoren basieren auf einer hybriden Architektur mit einer Kombination aus leistungsstarken Performance-Kernen (P-Kerne) und etwas schwächeren Effizienz-Kernen (E-Kerne). Diese Hybridarchitektur, die erstmals bei Alder Lake eingeführt wurde, wurde bei Arrow Lake weiter optimiert, um schlussendlich eine bessere Energieeffizienz zu ermöglichen. Bei den Arrow-Lake-Prozessoren setzt Intel auf eine deutliche Leistungssteigerung sowohl im Single- als auch im Multi-Core-Bereich. Was das genau bedeutet, schauen wir uns in diesem Review schrittweise im Detail an, denn nicht alle Anwendungen profitieren von der neuen Arrow-Lake-Architektur. Die Unterstützung von DDR4-RAM fällt nunmehr komplett weg, was bedeutet, dass alle LGA-1851-Mainboards mit DDR5-RAM umgehen.

Zusätzlich wird die integrierte Grafikeinheit verbessert, welche nun auf der Intel-Xe-Architektur basiert. Dies könnte vor allem in kleinen Systemen, welche keinen Platz für eine dedizierte Grafikkarte bieten, einen spürbaren Leistungsschub bieten.

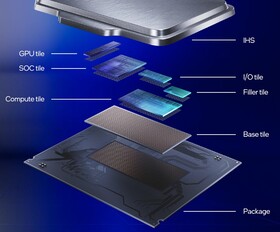
Intel Arrow-Lake-S, Aufbau (Quelle: Intel)
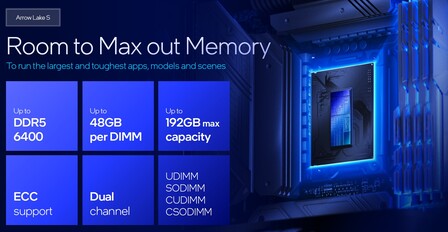
Unterstützung für DDR5-RAM (Quelle: Intel)
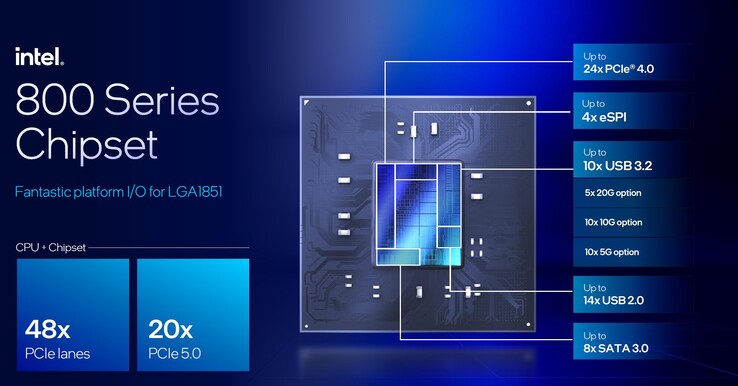
Intel 800 Series, Chipsatz (Quelle: Intel)
Intel Core Ultra 5 245K
Prozessor
Intel Core Ultra 5 245K 14 x 3.6 - 5.2 GHz, 159 W PL2 / Short Burst, 159 W PL1 / Sustained, Arrow Lake-S
Grafikkarte
NVIDIA GeForce RTX 4090 - 24 GB VRAM, Kerntakt: 2610 MHz, Speichertakt: 1313 MHz, 450 W TDP, 565.9
RAM
32 GB 
, DDR5-6000 MT/s
Mainboard
Intel Z890 (Arrow Lake-S PCH)
Massenspeicher
Kingston KC3000 2048G SKC3000D2048G, 2048 GB 
Betriebssystem
Microsoft Windows 11 Pro
Preis
309 USD
Amazon
Geizhals
Preisvergleich
Geizhals Bestpreis 334.9€
Intel Core Ultra 5 245K, 6C+8c/14T, 4.20-5.20GHz, boxed ohne Kühler (BXC80768245K)
  • Proshop.at (at): 334.9 EUR
  • Proshop.de (de): 334.9 EUR
  • Alternate (de): 352 EUR
  • computeruniverse.net (de): 353 EUR
  • Cyberport.de (de): 353 EUR
  • Hinweis: Der Hersteller kann abweichende Bauteile wie Bildschirme, Laufwerke und Speicherriegel mit ähnlichen Spezifikationen unter dem gleichen Modellnamen einsetzen.


    Für die durchgeführten Benchmarks und Tests nutzen wir folgendes System:

    • Streacom BC1 V2 Open Benchtable
    • Intel Core Ultra 5 245K
    • Asus TUF Gaming Z890-PLUS Wi-Fi, BIOS: 0407
    • Custom-Loop-Wasserkühlung (Pumpe: Watercool WCP D5, Radiator: EK MO-RA3 420 Pro)
    • Palit GeForce RTX 4090 GameRock OC
    • EVGA SuperNOVA P+ 1600W
    • G.Skill Trident Z5 Neo DDR5-6000 2x 16 GB, EXPO (DDR5-6000 CL30-38-38-96)
    • Kingston KC3000 2 TB, M.2 2280 (OS + synthetische Benchmarks)
    • Intel SSD DC P4618 - 6.4 TB (Games)
    • Microsoft Windows 11 Professional 64-Bit (Version 24H2)

    Intel Arrow-Lake-S-Prozessoren im Vergleich

    Modell Kerne /
    Threads
    Takt P-Core / Turbo Takt E-Core / Turbo TBMT 3.0 Cache L2 Intel Smart Cache iGPU (4 Xe Cores) NPU PBP MTP Preis (UVP)
    Intel Core Ultra 9 285K 24 (8P + 16E) /24 3,7 GHz / 5,5 GHz 3,2 GHz / 4,6 GHz 5,6 GHz 40 MB 36 MB 2,0 GHz 13 TOPS 125 Watt 250 Watt 589 US-Dollar
    Intel Core Ultra 7 265K 20 (8P + 12E) /20 3,9 GHz / 5,4 GHz 3,3 GHz / 4,6 GHz 5,6 GHz 36 MB 30 MB ,.0 GHz 13 TOPS 125 Watt 250 Watt 394 US-Dollar
    Intel Core Ultra 7 265KF 20 (8P + 12E) /20 3,9 GHz / 5,4 GHz 3,3 GHz / 4,6 GHz 5,6 GHz 36 MB 30 MB - 13 TOPS 125 Watt 250 Watt 379 US-Dollar
    Intel Core Ultra 5 245K 14 (6P + 8E) /14 3,9 GHz / 5,4 GHz 4,2 GHz / 5,2 GHz 5,2 GHz 26 MB 24 MB 1,9 GHz 13 TOPS 125 Watt 159 Watt 309 US-Dollar
    Intel Core Ultra 5 245KF 14 (6P + 8E) /14 3,9 GHz / 5,4 GHz 4,2 GHz / 5,2 GHz 5,2 GHz 26 MB 24 MB - 13 TOPS 125 Watt 159 Watt 294 US-Dollar
    Intel Core Ultra 5 245K
    Intel Arrow-Lake-S-Kit
    Intel Arrow-Lake-S-Kit
    Intel Arrow-Lake-S-Kit
    Intel Arrow-Lake-S-Kit
    Intel Arrow-Lake-S-Kit
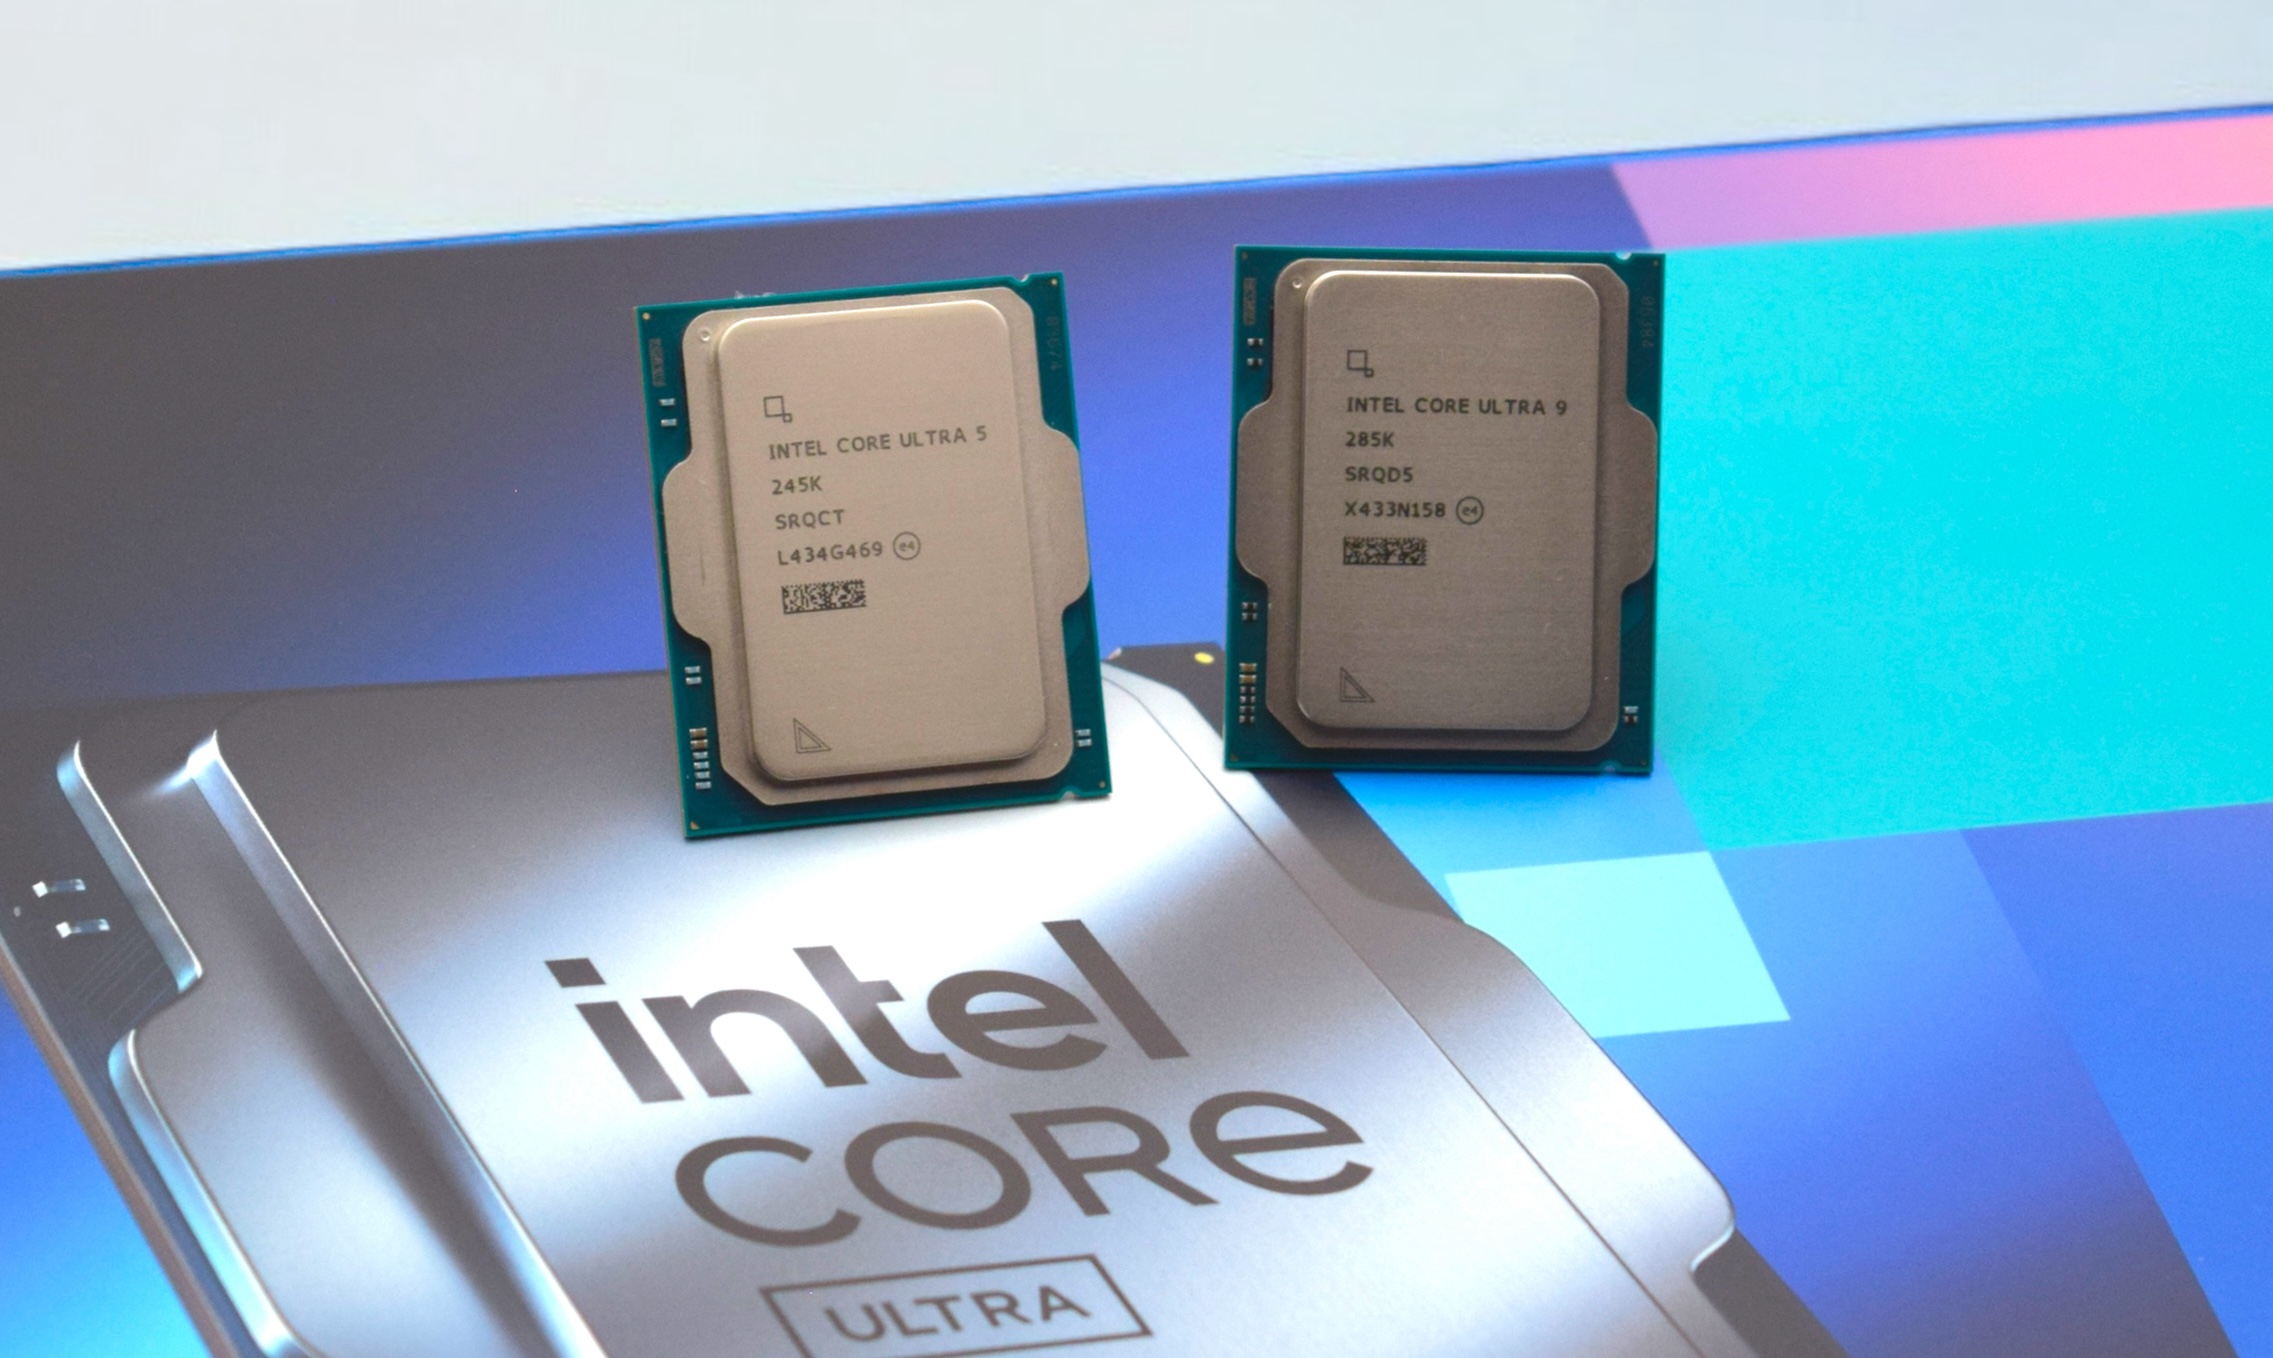
    Intel Core Ultra 9 285K und Intel Core Ultra 5 245K
    Intel Core Ultra 5 245K
    Intel Core Ultra 5 245K
    MO-RA3 420 Pro Radiator mit Watercool-WCP-D5-Pumpe
    Kingston KC3000 2 TB
    Intel SSD DC P4618 - 6,4 TB
    Intel SSD DC P4618 - 6,4 TB

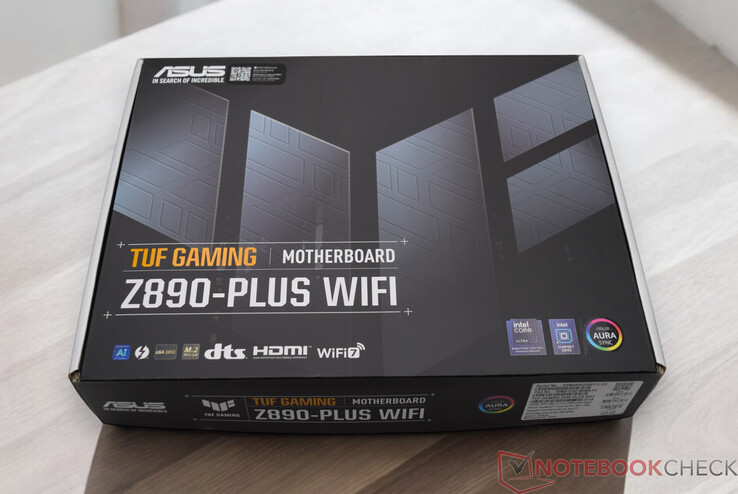
    Das Asus TUF Gaming Z890-PLUS Wi-Fi

    Anshlüsse beim Asus TUF Gaming Z890-PLUS Wi-Fi (Quelle: Asus)
    Anshlüsse beim Asus TUF Gaming Z890-PLUS Wi-Fi (Quelle: Asus)

    Wie eingangs schon erwähnt, nutzen alle Arrow-Lake-S-Prozessoren einen neuen Sockel, womit auch ein neuer Chipsatz vorgestellt wurde. Für diesen Test hat uns Asus das TUF Gaming Z890-PLUS Wi-Fi Mainboard zur Verfügung gestellt. Auf dem Mainboard ist der Z890-Chipsatz verlötet, womit in Summe mit dem Prozessor über 48 PCIe-Lanes zur Verfügung stehen. 

    Das Asus TUF Gaming Z890-PLUS Wi-Fi reiht sich optisch in die TUF-Serie von Asus ein. Das überwiegend schwarz gestaltete Mainboard wird mit einigen silbernen Akzenten aufgewertet, wenngleich auf beleuchtete Elemente auf der Vorderseite verzichtet wird. Ganz ohne RGB-Beleuchtung geht es dann doch nicht, denn auf der Rückseite befinden sich ein paar LEDs, die zudem auch leuchten, wenn das System nicht eingeschaltet ist. Dies lässt sich allerdings im BIOS auch abschalten. Das Asus TUF Gaming Z890-PLUS Wi-Fi unterstützt DDR5-RAM mit hohen Taktraten von bis zu 8.600 MT/s und darüber hinaus. Bis zu 192 GB sind bei voller Bestückung aller vier RAM-Slots möglich. Allerdings muss hierbei auf die Kompatibilität geachtet werden, womit sich ein Blick in die sogenannte QVL-Liste (Qualified Vendor List) des jeweiligen Mainboards vorab lohnt.

    Das Mainboard bietet eine breite Palette an Anschlüssen, darunter mehrere USB-3 Ports und einen USB-4.0-Anschluss. Überdies gibt es einmal 2.5G-LAN für die kabelgebundene Netzwerkanbindung, wenngleich beim Funknetz der neueste Wi-Fi-7-Standard geboten wird. Über das gesamte Mainboard hinweg sind diverse Kühler vorhanden, welche einerseits die Optik prägen, aber primär die Wärme abführen sollen. Als Besonderheit gibt es zu erwähnen, dass zumindest der SSD-Kühler oberhalb des Grafikkarten-Slots schnell und werkzeuglos abgenommen werden kann. Auch die Grafikkarte lässt sich ohne Probleme mithilfe des Q-Releases entriegeln und aus dem Slot nehmen. Leider zieht sich diese werkzeuglose Demontage nicht komplett durch, denn der Kühler im unteren Bereich ist verschraubt.

    Preislich ist das Asus TUF Gaming Z890-PLUS Wi-Fi für 378 Euro bei Amazon gelistet. Damit verlangt der Hersteller aktuell knapp 140 Euro mehr, als man derzeit für das Asus TUF Gaming Z790-Plus Wi-Fi auf den Tisch legen müsste. 

    Bestpreis 375€ Cyberport.de
    ASUS TUF Gaming Z890-Plus WIFI (90MB1IQ0-M0EAY0)
    2. 375.9 € ASUS
    3. 375.9 € galaxus
    4. 380.6 € nullprozentshop.de
    Asus TUF Gaming Z890-PLUS Wi-Fi
    Asus TUF Gaming Z890-PLUS Wi-Fi
    Asus TUF Gaming Z890-PLUS Wi-Fi
    Asus TUF Gaming Z890-PLUS Wi-Fi
    Asus TUF Gaming Z890-PLUS Wi-Fi
    Asus TUF Gaming Z890-PLUS Wi-Fi
    Asus TUF Gaming Z890-PLUS Wi-Fi
    Asus TUF Gaming Z890-PLUS Wi-Fi
    WLAN-Antenne des Asus TUF Gaming Z890-PLUS Wi-Fi

    Testbedingungen

    Alle Leistungstests haben wir mit dem Energieprofil Höchstleistung durchgeführt. Zudem haben wir im BIOS die Einstellungen Intel Default Settings gewählt. Damit arbeitet der Intel Core Ultra 5 245K innerhalb der Spezifikationen, die der Hersteller vorgesehen hat. Als Kühleinheit nutzen wir eine Custom-Loop-Wasserkühlung, welche bereits in gleicher Form für vorherige CPU-Leistungstests verwendet wurde.

    Prozessor-Benchmarks

    Werfen wir nun einmal einen Blick auf die Leistung des Intel Core Ultra 5 245K bei den reinen CPU-Benchmarks. Zu erkennen ist gleich, dass sich die neue Arrow-Lake-CPU nicht von seinem Vorgänger absetzen kann. Im Leistungsvergleich rangiert der Intel Core Ultra 5 245K auf Augenhöhe mit dem Intel Core i5-14600K. Beide Prozessoren besitzen 14 physische Recheneinheiten, welche sich in 6 P- und 8 E-Kerne aufteilen. Auf Hyperthreading verzichtet Intel bei seinen neuesten Prozessoren allerdings gänzlich. Dennoch schafft es Intel, eine identische Leistung im gemittelten CPU-Leistungsvergleich im Vergleich zum Intel Core i5-14600K zu erreichen. Gehen wir auf der Zeitachse noch weiter zurück, so kann es der Intel Core Ultra 5 245K sogar mit dem ehemaligen Flaggschiff aus dem Jahre 2021, dem Intel Core i9-12900K, aufnehmen. Im Duell mit AMD erreicht der Intel Core Ultra 5 245K die Leistung eines AMD Ryzen 7 9700X, welcher als reiner 8-Kerner daherkommt.

    Grundsätzlich liefert der Intel Core Ultra 5 245K eine beeindruckende Leistung, welche mit einer Leistungsaufnahme von 159 Watt geringer ausfällt als bei den Core-i5-Modellen der vorherigen Generationen. Damit arbeitet der Prozessor nicht nur deutlich effektiver, sondern lässt sich auch leichter kühlen.

    Weitere Benchmarks zu den Prozessoren finden Sie hier.

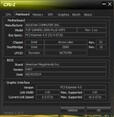
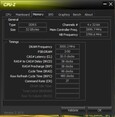
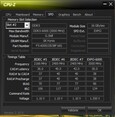
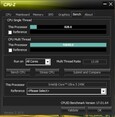
    CPU-Z
    CPU-Z
    CPU-Z
    CPU-Z
    CPU-Z
    CPU-Z
    Performance Rating - Percent
    AMD Ryzen 9 9950X
    Ryzen 9 9950X, 4300 MHz
    82.5 pt
    Intel Core i9-14900K
    i9-14900K, 3200 MHz
    82.3 pt
    Intel Core i9-13900K
    i9-13900K, 3000 MHz
    80 pt
    Intel Core Ultra 9 285K
    Core Ultra 9 285K, 3200 MHz
    79.7 pt
    AMD Ryzen 9 7950X
    R9 7950X, 4500 MHz
    78.6 pt
    AMD Ryzen 9 7950X3D
    R9 7950X3D, 4200 MHz
    78.5 pt
    AMD Ryzen 9 7900X
    R9 7900X, 4700 MHz
    71.8 pt
    Intel Core i5-14600K
    i5-14600K, 3500 MHz
    68.8 pt
    AMD Ryzen 7 9700X
    Ryzen 7 9700X, 3800 MHz
    68.3 pt
    Intel Core i9-12900K
    i9-12900K, 3200 MHz
    68.1 pt
    Intel Core Ultra 5 245K
    Core Ultra 5 245K, 3600 MHz
    68 pt
    AMD Ryzen 9 5950X
    R9 5950X, 3400 MHz
    67 pt
    Intel Core i5-13600K
    i5-13600K, 3500 MHz
    66.7 pt
    AMD Ryzen 5 9600X
    Ryzen 5 9600X, 3900 MHz
    64.5 pt
    AMD Ryzen 7 7800X3D
    R7 7800X3D, 4200 MHz
    64.1 pt
    AMD Ryzen 5 7600X
    R5 7600X, 4700 MHz
    61.9 pt
    Intel Core i5-12600K
    i5-12600K, 2800 MHz
    59.7 pt
    Intel Core i5-13400
    i5-13400, 2500 MHz
    57.1 pt
    Intel Core i5-12400F
    i5-12400F, 2500 MHz
    52.4 pt
    Cinebench R23
    Single Core
    Intel Core i9-14900K
    i9-14900K, 3200 MHz
    2351 Points +10%
    Intel Core Ultra 9 285K
    Core Ultra 9 285K, 3200 MHz
    2342 Points +10%
    Intel Core i9-13900K
    i9-13900K, 3000 MHz
    2267 Points +6%
    AMD Ryzen 7 9700X
    Ryzen 7 9700X, 3800 MHz
    2211 Points +4%
    AMD Ryzen 9 9950X
    Ryzen 9 9950X, 4300 MHz
    2202 Points +3%
    AMD Ryzen 5 9600X
    Ryzen 5 9600X, 3900 MHz
    2180 Points +2%
    Intel Core Ultra 5 245K
    Core Ultra 5 245K, 3600 MHz
    2132 Points
    Intel Core i5-14600K
    i5-14600K, 3500 MHz
    2064 Points -3%
    AMD Ryzen 9 7950X3D
    R9 7950X3D, 4200 MHz
    2053 Points -4%
    AMD Ryzen 9 7950X
    R9 7950X, 4500 MHz
    2045 Points -4%
    AMD Ryzen 9 7900X
    R9 7900X, 4700 MHz
    2039 Points -4%
    Intel Core i5-13600K
    i5-13600K, 3500 MHz
    2010 Points -6%
    Intel Core i9-12900K
    i9-12900K, 3200 MHz
    1998 Points -6%
    AMD Ryzen 5 7600X
    R5 7600X, 4700 MHz
    1967 Points -8%
    Intel Core i5-12600K
    i5-12600K, 2800 MHz
    1907 Points -11%
    AMD Ryzen 7 7800X3D
    R7 7800X3D, 4200 MHz
    1820 Points -15%
    Intel Core i5-13400
    i5-13400, 2500 MHz
    1786 Points -16%
    Intel Core i5-12400F
    i5-12400F, 2500 MHz
    1680 Points -21%
    AMD Ryzen 9 5950X
    R9 5950X, 3400 MHz
    1649 Points -23%
    Multi Core
    Intel Core Ultra 9 285K
    Core Ultra 9 285K, 3200 MHz
    42522 Points +70%
    Intel Core i9-14900K
    i9-14900K, 3200 MHz
    41193 Points +64%
    AMD Ryzen 9 9950X
    Ryzen 9 9950X, 4300 MHz
    40924 Points +63%
    Intel Core i9-13900K
    i9-13900K, 3000 MHz
    40103 Points +60%
    AMD Ryzen 9 7950X
    R9 7950X, 4500 MHz
    37792 Points +51%
    AMD Ryzen 9 7950X3D
    R9 7950X3D, 4200 MHz
    36291 Points +45%
    AMD Ryzen 9 7900X
    R9 7900X, 4700 MHz
    29480 Points +18%
    AMD Ryzen 9 5950X
    R9 5950X, 3400 MHz
    27062 Points +8%
    Intel Core i9-12900K
    i9-12900K, 3200 MHz
    27005 Points +8%
    Intel Core Ultra 5 245K
    Core Ultra 5 245K, 3600 MHz
    25066 Points
    Intel Core i5-14600K
    i5-14600K, 3500 MHz
    24491 Points -2%
    Intel Core i5-13600K
    i5-13600K, 3500 MHz
    24268 Points -3%
    AMD Ryzen 7 9700X
    Ryzen 7 9700X, 3800 MHz
    20485 Points -18%
    AMD Ryzen 7 7800X3D
    R7 7800X3D, 4200 MHz
    18086 Points -28%
    Intel Core i5-12600K
    i5-12600K, 2800 MHz
    17491 Points -30%
    AMD Ryzen 5 9600X
    Ryzen 5 9600X, 3900 MHz
    17176 Points -31%
    Intel Core i5-13400
    i5-13400, 2500 MHz
    15953 Points -36%
    AMD Ryzen 5 7600X
    R5 7600X, 4700 MHz
    15322 Points -39%
    Intel Core i5-12400F
    i5-12400F, 2500 MHz
    12380 Points -51%
    Cinebench R20
    CPU (Single Core)
    Intel Core i9-14900K
    i9-14900K, 3200 MHz
    900 Points +10%
    Intel Core Ultra 9 285K
    Core Ultra 9 285K, 3200 MHz
    899 Points +10%
    AMD Ryzen 9 9950X
    Ryzen 9 9950X, 4300 MHz
    871 Points +6%
    AMD Ryzen 7 9700X
    Ryzen 7 9700X, 3800 MHz
    870 Points +6%
    AMD Ryzen 5 9600X
    Ryzen 5 9600X, 3900 MHz
    858 Points +5%
    Intel Core i9-13900K
    i9-13900K, 3000 MHz
    828 Points +1%
    Intel Core Ultra 5 245K
    Core Ultra 5 245K, 3600 MHz
    820 Points
    AMD Ryzen 9 7950X
    R9 7950X, 4500 MHz
    795 Points -3%
    AMD Ryzen 9 7950X3D
    R9 7950X3D, 4200 MHz
    795 Points -3%
    Intel Core i5-14600K
    i5-14600K, 3500 MHz
    790 Points -4%
    AMD Ryzen 9 7900X
    R9 7900X, 4700 MHz
    786 Points -4%
    Intel Core i5-13600K
    i5-13600K, 3500 MHz
    775 Points -5%
    Intel Core i9-12900K
    i9-12900K, 3200 MHz
    766 Points -7%
    AMD Ryzen 5 7600X
    R5 7600X, 4700 MHz
    761 Points -7%
    Intel Core i5-12600K
    i5-12600K, 2800 MHz
    734 Points -10%
    AMD Ryzen 7 7800X3D
    R7 7800X3D, 4200 MHz
    709 Points -14%
    Intel Core i5-13400
    i5-13400, 2500 MHz
    688 Points -16%
    Intel Core i5-12400F
    i5-12400F, 2500 MHz
    653 Points -20%
    AMD Ryzen 9 5950X
    R9 5950X, 3400 MHz
    641 Points -22%
    CPU (Multi Core)
    Intel Core Ultra 9 285K
    Core Ultra 9 285K, 3200 MHz
    16623 Points +70%
    AMD Ryzen 9 9950X
    Ryzen 9 9950X, 4300 MHz
    15788 Points +62%
    Intel Core i9-14900K
    i9-14900K, 3200 MHz
    15466 Points +59%
    Intel Core i9-13900K
    i9-13900K, 3000 MHz
    15181 Points +56%
    AMD Ryzen 9 7950X
    R9 7950X, 4500 MHz
    14786 Points +52%
    AMD Ryzen 9 7950X3D
    R9 7950X3D, 4200 MHz
    14188 Points +45%
    AMD Ryzen 9 7900X
    R9 7900X, 4700 MHz
    11563 Points +19%
    AMD Ryzen 9 5950X
    R9 5950X, 3400 MHz
    10482 Points +7%
    Intel Core i9-12900K
    i9-12900K, 3200 MHz
    10240 Points +5%
    Intel Core Ultra 5 245K
    Core Ultra 5 245K, 3600 MHz
    9752 Points
    Intel Core i5-14600K
    i5-14600K, 3500 MHz
    9371 Points -4%
    Intel Core i5-13600K
    i5-13600K, 3500 MHz
    9265 Points -5%
    AMD Ryzen 7 9700X
    Ryzen 7 9700X, 3800 MHz
    7956 Points -18%
    AMD Ryzen 7 7800X3D
    R7 7800X3D, 4200 MHz
    7121 Points -27%
    AMD Ryzen 5 9600X
    Ryzen 5 9600X, 3900 MHz
    6719 Points -31%
    Intel Core i5-12600K
    i5-12600K, 2800 MHz
    6692 Points -31%
    Intel Core i5-13400
    i5-13400, 2500 MHz
    6135 Points -37%
    AMD Ryzen 5 7600X
    R5 7600X, 4700 MHz
    5985 Points -39%
    Intel Core i5-12400F
    i5-12400F, 2500 MHz
    4740 Points -51%
    Cinebench R15
    CPU Single 64Bit
    Intel Core Ultra 9 285K
    Core Ultra 9 285K, 3200 MHz
    355 Points +10%
    AMD Ryzen 7 9700X
    Ryzen 7 9700X, 3800 MHz
    346 Points +7%
    AMD Ryzen 9 9950X
    Ryzen 9 9950X, 4300 MHz
    344 Points +7%
    AMD Ryzen 5 9600X
    Ryzen 5 9600X, 3900 MHz
    341 Points +6%
    Intel Core i9-14900K
    i9-14900K, 3200 MHz
    332 Points +3%
    AMD Ryzen 9 7950X
    R9 7950X, 4500 MHz
    328 Points +2%
    Intel Core i9-13900K
    i9-13900K, 3000 MHz
    327 Points +2%
    AMD Ryzen 9 7950X3D
    R9 7950X3D, 4200 MHz
    326 Points +1%
    AMD Ryzen 9 7900X
    R9 7900X, 4700 MHz
    324 Points +1%
    Intel Core Ultra 5 245K
    Core Ultra 5 245K, 3600 MHz
    322 Points
    AMD Ryzen 5 7600X
    R5 7600X, 4700 MHz
    315 Points -2%
    Intel Core i5-14600K
    i5-14600K, 3500 MHz
    297 Points -8%
    AMD Ryzen 7 7800X3D
    R7 7800X3D, 4200 MHz
    291 Points -10%
    Intel Core i5-13600K
    i5-13600K, 3500 MHz
    289 Points -10%
    Intel Core i9-12900K
    i9-12900K, 3200 MHz
    286 Points -11%
    Intel Core i5-12600K
    i5-12600K, 2800 MHz
    275 Points -15%
    AMD Ryzen 9 5950X
    R9 5950X, 3400 MHz
    272 Points -16%
    Intel Core i5-13400
    i5-13400, 2500 MHz
    257 Points -20%
    Intel Core i5-12400F
    i5-12400F, 2500 MHz
    244 Points -24%
    CPU Multi 64Bit
    Intel Core Ultra 9 285K
    Core Ultra 9 285K, 3200 MHz
    6396 Points +66%
    AMD Ryzen 9 9950X
    Ryzen 9 9950X, 4300 MHz
    6335 (6262.72min - 6335.13max) Points +65%
    Intel Core i9-14900K
    i9-14900K, 3200 MHz
    6282 Points +63%
    AMD Ryzen 9 7950X
    R9 7950X, 4500 MHz
    6209 Points +61%
    Intel Core i9-13900K
    i9-13900K, 3000 MHz
    6191 Points +61%
    AMD Ryzen 9 7950X3D
    R9 7950X3D, 4200 MHz
    5974 Points +55%
    AMD Ryzen 9 7900X
    R9 7900X, 4700 MHz
    4856 Points +26%
    AMD Ryzen 9 5950X
    R9 5950X, 3400 MHz
    4492 Points +17%
    Intel Core i9-12900K
    i9-12900K, 3200 MHz
    4057 Points +5%
    Intel Core Ultra 5 245K
    Core Ultra 5 245K, 3600 MHz
    3850 Points
    Intel Core i5-13600K
    i5-13600K, 3500 MHz
    3643 Points -5%
    Intel Core i5-14600K
    i5-14600K, 3500 MHz
    3640 Points -5%
    AMD Ryzen 7 9700X
    Ryzen 7 9700X, 3800 MHz
    3178 (3067.25min - 3120.37max) Points -17%
    AMD Ryzen 7 7800X3D
    R7 7800X3D, 4200 MHz
    2974 Points -23%
    AMD Ryzen 5 9600X
    Ryzen 5 9600X, 3900 MHz
    2630 Points -32%
    Intel Core i5-12600K
    i5-12600K, 2800 MHz
    2555 Points -34%
    AMD Ryzen 5 7600X
    R5 7600X, 4700 MHz
    2507 Points -35%
    Intel Core i5-13400
    i5-13400, 2500 MHz
    2358 Points -39%
    Intel Core i5-12400F
    i5-12400F, 2500 MHz
    1759 Points -54%
    Cinebench R11.5
    CPU Single 64Bit
    Intel Core Ultra 9 285K
    Core Ultra 9 285K, 3200 MHz
    4.17 Points +8%
    AMD Ryzen 7 9700X
    Ryzen 7 9700X, 3800 MHz
    4.06 Points +5%
    AMD Ryzen 9 9950X
    Ryzen 9 9950X, 4300 MHz
    4.03 Points +5%
    Intel Core i9-14900K
    i9-14900K, 3200 MHz
    4.02 Points +4%
    AMD Ryzen 5 9600X
    Ryzen 5 9600X, 3900 MHz
    4 Points +4%
    Intel Core i9-13900K
    i9-13900K, 3000 MHz
    3.92 Points +2%
    AMD Ryzen 9 7950X
    R9 7950X, 4500 MHz
    3.86 Points 0%
    AMD Ryzen 9 7950X3D
    R9 7950X3D, 4200 MHz
    3.86 Points 0%
    Intel Core Ultra 5 245K
    Core Ultra 5 245K, 3600 MHz
    3.85 Points
    AMD Ryzen 9 7900X
    R9 7900X, 4700 MHz
    3.83 Points -1%
    AMD Ryzen 5 7600X
    R5 7600X, 4700 MHz
    3.72 Points -3%
    Intel Core i5-14600K
    i5-14600K, 3500 MHz
    3.58 Points -7%
    Intel Core i9-12900K
    i9-12900K, 3200 MHz
    3.49 Points -9%
    Intel Core i5-13600K
    i5-13600K, 3500 MHz
    3.48 Points -10%
    AMD Ryzen 7 7800X3D
    R7 7800X3D, 4200 MHz
    3.43 Points -11%
    Intel Core i5-12600K
    i5-12600K, 2800 MHz
    3.31 Points -14%
    AMD Ryzen 9 5950X
    R9 5950X, 3400 MHz
    3.14 Points -18%
    Intel Core i5-13400
    i5-13400, 2500 MHz
    3.1 Points -19%
    Intel Core i5-12400F
    i5-12400F, 2500 MHz
    2.95 Points -23%
    CPU Multi 64Bit
    Intel Core Ultra 9 285K
    Core Ultra 9 285K, 3200 MHz
    77.29 Points +63%
    AMD Ryzen 9 9950X
    Ryzen 9 9950X, 4300 MHz
    72.28 Points +52%
    Intel Core i9-14900K
    i9-14900K, 3200 MHz
    72.24 Points +52%
    Intel Core i9-13900K
    i9-13900K, 3000 MHz
    70.78 Points +49%
    AMD Ryzen 9 7950X
    R9 7950X, 4500 MHz
    68.61 Points +44%
    AMD Ryzen 9 7950X3D
    R9 7950X3D, 4200 MHz
    64.59 Points +36%
    AMD Ryzen 9 7900X
    R9 7900X, 4700 MHz
    54.51 Points +15%
    AMD Ryzen 9 5950X
    R9 5950X, 3400 MHz
    49.6 Points +4%
    Intel Core Ultra 5 245K
    Core Ultra 5 245K, 3600 MHz
    47.55 Points
    Intel Core i9-12900K
    i9-12900K, 3200 MHz
    47.06 Points -1%
    Intel Core i5-13600K
    i5-13600K, 3500 MHz
    42.38 Points -11%
    Intel Core i5-14600K
    i5-14600K, 3500 MHz
    40.96 Points -14%
    AMD Ryzen 7 9700X
    Ryzen 7 9700X, 3800 MHz
    36.24 Points -24%
    AMD Ryzen 7 7800X3D
    R7 7800X3D, 4200 MHz
    33.48 Points -30%
    AMD Ryzen 5 9600X
    Ryzen 5 9600X, 3900 MHz
    30.86 Points -35%
    Intel Core i5-12600K
    i5-12600K, 2800 MHz
    30.01 Points -37%
    AMD Ryzen 5 7600X
    R5 7600X, 4700 MHz
    28.41 Points -40%
    Intel Core i5-13400
    i5-13400, 2500 MHz
    27.36 Points -42%
    Intel Core i5-12400F
    i5-12400F, 2500 MHz
    20.39 Points -57%
    Blender - v2.79 BMW27 CPU
    Intel Core i5-12400F
    i5-12400F, 2500 MHz
    269 Seconds * -98%
    Intel Core i5-13400
    i5-13400, 2500 MHz
    206 Seconds * -51%
    AMD Ryzen 5 7600X
    R5 7600X, 4700 MHz
    203 Seconds * -49%
    Intel Core i5-12600K
    i5-12600K, 2800 MHz
    189.5 Seconds * -39%
    AMD Ryzen 5 9600X
    Ryzen 5 9600X, 3900 MHz
    184 Seconds * -35%
    AMD Ryzen 7 7800X3D
    R7 7800X3D, 4200 MHz
    169 Seconds * -24%
    AMD Ryzen 7 9700X
    Ryzen 7 9700X, 3800 MHz
    154 Seconds * -13%
    Intel Core Ultra 5 245K
    Core Ultra 5 245K, 3600 MHz
    136 Seconds *
    Intel Core i5-13600K
    i5-13600K, 3500 MHz
    135 Seconds * +1%
    Intel Core i5-14600K
    i5-14600K, 3500 MHz
    134 Seconds * +1%
    Intel Core i9-12900K
    i9-12900K, 3200 MHz
    121.1 Seconds * +11%
    AMD Ryzen 9 5950X
    R9 5950X, 3400 MHz
    112.8 Seconds * +17%
    AMD Ryzen 9 7900X
    R9 7900X, 4700 MHz
    106 Seconds * +22%
    AMD Ryzen 9 7950X3D
    R9 7950X3D, 4200 MHz
    86 Seconds * +37%
    AMD Ryzen 9 7950X
    R9 7950X, 4500 MHz
    85 Seconds * +37%
    Intel Core i9-13900K
    i9-13900K, 3000 MHz
    80 Seconds * +41%
    Intel Core i9-14900K
    i9-14900K, 3200 MHz
    80 Seconds * +41%
    Intel Core Ultra 9 285K
    Core Ultra 9 285K, 3200 MHz
    79 Seconds * +42%
    AMD Ryzen 9 9950X
    Ryzen 9 9950X, 4300 MHz
    77 Seconds * +43%
    wPrime 2.10
    32m
    Intel Core i9-12900K
    i9-12900K, 3200 MHz
    4.924 s * -65%
    Intel Core i5-12600K
    i5-12600K, 2800 MHz
    4.725 s * -59%
    Intel Core i5-12400F
    i5-12400F, 2500 MHz
    4.078 s * -37%
    Intel Core i5-13400
    i5-13400, 2500 MHz
    3.474 s * -17%
    Intel Core Ultra 5 245K
    Core Ultra 5 245K, 3600 MHz
    2.976 s *
    AMD Ryzen 5 7600X
    R5 7600X, 4700 MHz
    2.78 s * +7%
    AMD Ryzen 5 9600X
    Ryzen 5 9600X, 3900 MHz
    2.617 s * +12%
    AMD Ryzen 9 5950X
    R9 5950X, 3400 MHz
    2.538 s * +15%
    Intel Core i5-13600K
    i5-13600K, 3500 MHz
    2.527 s * +15%
    AMD Ryzen 7 7800X3D
    R7 7800X3D, 4200 MHz
    2.435 s * +18%
    Intel Core i5-14600K
    i5-14600K, 3500 MHz
    2.39 s * +20%
    AMD Ryzen 7 9700X
    Ryzen 7 9700X, 3800 MHz
    2.36 s * +21%
    Intel Core Ultra 9 285K
    Core Ultra 9 285K, 3200 MHz
    2.197 s * +26%
    AMD Ryzen 9 9950X
    Ryzen 9 9950X, 4300 MHz
    2.077 s * +30%
    Intel Core i9-14900K
    i9-14900K, 3200 MHz
    2.07 s * +30%
    AMD Ryzen 9 7950X3D
    R9 7950X3D, 4200 MHz
    2.007 s * +33%
    Intel Core i9-13900K
    i9-13900K, 3000 MHz
    1.818 s * +39%
    AMD Ryzen 9 7900X
    R9 7900X, 4700 MHz
    1.781 s * +40%
    AMD Ryzen 9 7950X
    R9 7950X, 4500 MHz
    1.669 s * +44%
    1024m
    Intel Core i5-13400
    i5-13400, 2500 MHz
    452.309 s * -482%
    Intel Core i5-12600K
    i5-12600K, 2800 MHz
    202.7 s * -161%
    Intel Core i9-12900K
    i9-12900K, 3200 MHz
    190.6 s * -145%
    Intel Core i5-13600K
    i5-13600K, 3500 MHz
    177.592 s * -128%
    Intel Core i5-14600K
    i5-14600K, 3500 MHz
    158.77 s * -104%
    Intel Core i5-12400F
    i5-12400F, 2500 MHz
    112.849 s * -45%
    Intel Core i9-13900K
    i9-13900K, 3000 MHz
    79.738 s * -3%
    Intel Core Ultra 5 245K
    Core Ultra 5 245K, 3600 MHz
    77.721 s *
    AMD Ryzen 5 7600X
    R5 7600X, 4700 MHz
    74.491 s * +4%
    Intel Core i9-14900K
    i9-14900K, 3200 MHz
    74.47 s * +4%
    AMD Ryzen 5 9600X
    Ryzen 5 9600X, 3900 MHz
    72.546 s * +7%
    AMD Ryzen 9 5950X
    R9 5950X, 3400 MHz
    64.9 s * +16%
    AMD Ryzen 7 7800X3D
    R7 7800X3D, 4200 MHz
    62.733 s * +19%
    AMD Ryzen 7 9700X
    Ryzen 7 9700X, 3800 MHz
    59.56 s * +23%
    Intel Core Ultra 9 285K
    Core Ultra 9 285K, 3200 MHz
    48.806 s * +37%
    AMD Ryzen 9 7900X
    R9 7900X, 4700 MHz
    39.954 s * +49%
    AMD Ryzen 9 7950X3D
    R9 7950X3D, 4200 MHz
    33.879 s * +56%
    AMD Ryzen 9 7950X
    R9 7950X, 4500 MHz
    30.811 s * +60%
    AMD Ryzen 9 9950X
    Ryzen 9 9950X, 4300 MHz
    29.318 s * +62%
    X264 HD Benchmark 4.0
    Pass 1
    Intel Core i9-14900K
    i9-14900K, 3200 MHz
    433.5 (424min - 434max) fps +12%
    Intel Core Ultra 9 285K
    Core Ultra 9 285K, 3200 MHz
    422 (421min - 423max) fps +9%
    Intel Core i9-13900K
    i9-13900K, 3000 MHz
    412 (410min - 417max) fps +6%
    Intel Core i5-14600K
    i5-14600K, 3500 MHz
    411 (410min - 412max) fps +6%
    AMD Ryzen 9 7950X3D
    R9 7950X3D, 4200 MHz
    392.5 (391min - 397max) fps +1%
    AMD Ryzen 9 9950X
    Ryzen 9 9950X, 4300 MHz
    392 (392min - 393max) fps +1%
    Intel Core Ultra 5 245K
    Core Ultra 5 245K, 3600 MHz
    388.5 (387min - 390max) fps
    Intel Core i5-13600K
    i5-13600K, 3500 MHz
    388 (386min - 388max) fps 0%
    AMD Ryzen 9 7950X
    R9 7950X, 4500 MHz
    379.5 (378min - 385max) fps -2%
    AMD Ryzen 9 7900X
    R9 7900X, 4700 MHz
    376 (369min - 378max) fps -3%
    AMD Ryzen 7 9700X
    Ryzen 7 9700X, 3800 MHz
    376 (374min - 376max) fps -3%
    Intel Core i9-12900K
    i9-12900K, 3200 MHz
    368.5 (366min - 369max) fps -5%
    AMD Ryzen 5 7600X
    R5 7600X, 4700 MHz
    367 (363min - 371max) fps -6%
    AMD Ryzen 5 9600X
    Ryzen 5 9600X, 3900 MHz
    364 (361min - 367max) fps -6%
    AMD Ryzen 7 7800X3D
    R7 7800X3D, 4200 MHz
    344 (339min - 346max) fps -11%
    AMD Ryzen 9 5950X
    R9 5950X, 3400 MHz
    338.5 (337min - 340max) fps -13%
    Intel Core i5-12600K
    i5-12600K, 2800 MHz
    333.5 (332min - 336max) fps -14%
    Intel Core i5-13400
    i5-13400, 2500 MHz
    311 (310min - 312max) fps -20%
    Intel Core i5-12400F
    i5-12400F, 2500 MHz
    252.5 (249min - 256max) fps -35%
    Pass 2
    Intel Core Ultra 9 285K
    Core Ultra 9 285K, 3200 MHz
    296.5 (296min - 298max) fps +37%
    Intel Core i9-14900K
    i9-14900K, 3200 MHz
    286.5 (285min - 287max) fps +32%
    AMD Ryzen 9 9950X
    Ryzen 9 9950X, 4300 MHz
    271 (271min - 272max) fps +25%
    Intel Core i9-13900K
    i9-13900K, 3000 MHz
    267 (266min - 271max) fps +23%
    AMD Ryzen 9 7950X
    R9 7950X, 4500 MHz
    266.5 (263min - 267max) fps +23%
    AMD Ryzen 9 7950X3D
    R9 7950X3D, 4200 MHz
    265.5 (263min - 266max) fps +23%
    AMD Ryzen 9 7900X
    R9 7900X, 4700 MHz
    241 (240min - 242max) fps +11%
    AMD Ryzen 9 5950X
    R9 5950X, 3400 MHz
    221 (220min - 221max) fps +2%
    Intel Core Ultra 5 245K
    Core Ultra 5 245K, 3600 MHz
    216.5 (215min - 217max) fps
    Intel Core i5-14600K
    i5-14600K, 3500 MHz
    209 (208min - 209max) fps -3%
    Intel Core i9-12900K
    i9-12900K, 3200 MHz
    206 (206min - 206max) fps -5%
    Intel Core i5-13600K
    i5-13600K, 3500 MHz
    199 (198.5min - 199.4max) fps -8%
    AMD Ryzen 7 9700X
    Ryzen 7 9700X, 3800 MHz
    176.05 (175.9min - 176.1max) fps -19%
    AMD Ryzen 7 7800X3D
    R7 7800X3D, 4200 MHz
    169.25 (169.1min - 170max) fps -22%
    AMD Ryzen 5 9600X
    Ryzen 5 9600X, 3900 MHz
    154 (153.4min - 154.3max) fps -29%
    Intel Core i5-12600K
    i5-12600K, 2800 MHz
    148 (147min - 148max) fps -32%
    AMD Ryzen 5 7600X
    R5 7600X, 4700 MHz
    147.8 (147.7min - 147.9max) fps -32%
    Intel Core i5-13400
    i5-13400, 2500 MHz
    135.8 (135.7min - 135.9max) fps -37%
    Intel Core i5-12400F
    i5-12400F, 2500 MHz
    101.35 (101.1min - 101.5max) fps -53%
    WinRAR - Result
    AMD Ryzen 9 7900X
    R9 7900X, 4700 MHz
    17225 KB/s +64%
    AMD Ryzen 7 7800X3D
    R7 7800X3D, 4200 MHz
    16585 KB/s +58%
    AMD Ryzen 9 7950X
    R9 7950X, 4500 MHz
    16351 KB/s +55%
    AMD Ryzen 5 7600X
    R5 7600X, 4700 MHz
    16178 KB/s +54%
    Intel Core i9-14900K
    i9-14900K, 3200 MHz
    16108 KB/s +53%
    AMD Ryzen 9 7950X3D
    R9 7950X3D, 4200 MHz
    15779 KB/s +50%
    Intel Core i9-13900K
    i9-13900K, 3000 MHz
    14836 KB/s +41%
    AMD Ryzen 5 9600X
    Ryzen 5 9600X, 3900 MHz
    14819 KB/s +41%
    AMD Ryzen 9 9950X
    Ryzen 9 9950X, 4300 MHz
    13778 KB/s +31%
    AMD Ryzen 7 9700X
    Ryzen 7 9700X, 3800 MHz
    13549 KB/s +29%
    Intel Core Ultra 9 285K
    Core Ultra 9 285K, 3200 MHz
    12599 KB/s +20%
    AMD Ryzen 9 5950X
    R9 5950X, 3400 MHz
    12503 KB/s +19%
    Intel Core i5-14600K
    i5-14600K, 3500 MHz
    11491 KB/s +9%
    Intel Core i5-13600K
    i5-13600K, 3500 MHz
    10937 KB/s +4%
    Intel Core i9-12900K
    i9-12900K, 3200 MHz
    10792 KB/s +3%
    Intel Core Ultra 5 245K
    Core Ultra 5 245K, 3600 MHz
    10521 KB/s
    Intel Core i5-13400
    i5-13400, 2500 MHz
    7979 KB/s -24%
    Intel Core i5-12400F
    i5-12400F, 2500 MHz
    7816 KB/s -26%
    Intel Core i5-12600K
    i5-12600K, 2800 MHz
    6239 KB/s -41%
    TrueCrypt
    AES Mean 100MB
    AMD Ryzen 9 9950X
    Ryzen 9 9950X, 4300 MHz
    32.4 GB/s +98%
    AMD Ryzen 9 7950X
    R9 7950X, 4500 MHz
    30.7 GB/s +87%
    Intel Core i9-13900K
    i9-13900K, 3000 MHz
    27 GB/s +65%
    AMD Ryzen 9 5950X
    R9 5950X, 3400 MHz
    26.9 GB/s +64%
    AMD Ryzen 9 7950X3D
    R9 7950X3D, 4200 MHz
    26.9 GB/s +64%
    Intel Core i9-14900K
    i9-14900K, 3200 MHz
    26.7 GB/s +63%
    Intel Core i5-14600K
    i5-14600K, 3500 MHz
    19.5 GB/s +19%
    Intel Core i5-13600K
    i5-13600K, 3500 MHz
    18.8 GB/s +15%
    Intel Core i9-12900K
    i9-12900K, 3200 MHz
    18.5 GB/s +13%
    Intel Core Ultra 5 245K
    Core Ultra 5 245K, 3600 MHz
    16.4 GB/s
    AMD Ryzen 7 9700X
    Ryzen 7 9700X, 3800 MHz
    16.1 GB/s -2%
    Intel Core Ultra 9 285K
    Core Ultra 9 285K, 3200 MHz
    16 GB/s -2%
    AMD Ryzen 7 7800X3D
    R7 7800X3D, 4200 MHz
    15.3 GB/s -7%
    AMD Ryzen 9 7900X
    R9 7900X, 4700 MHz
    14.8 GB/s -10%
    AMD Ryzen 5 9600X
    Ryzen 5 9600X, 3900 MHz
    13.4 GB/s -18%
    AMD Ryzen 5 7600X
    R5 7600X, 4700 MHz
    13.2 GB/s -20%
    Intel Core i5-12600K
    i5-12600K, 2800 MHz
    12.8 GB/s -22%
    Intel Core i5-13400
    i5-13400, 2500 MHz
    11.8 GB/s -28%
    Intel Core i5-12400F
    i5-12400F, 2500 MHz
    9.3 GB/s -43%
    Twofish Mean 100MB
    Intel Core i9-14900K
    i9-14900K, 3200 MHz
    5.8 GB/s +93%
    AMD Ryzen 9 9950X
    Ryzen 9 9950X, 4300 MHz
    5.6 GB/s +87%
    Intel Core i9-13900K
    i9-13900K, 3000 MHz
    5.4 GB/s +80%
    Intel Core Ultra 9 285K
    Core Ultra 9 285K, 3200 MHz
    4.9 GB/s +63%
    AMD Ryzen 9 7950X
    R9 7950X, 4500 MHz
    4.5 GB/s +50%
    AMD Ryzen 9 7950X3D
    R9 7950X3D, 4200 MHz
    4.2 GB/s +40%
    AMD Ryzen 9 5950X
    R9 5950X, 3400 MHz
    3.7 GB/s +23%
    Intel Core i9-12900K
    i9-12900K, 3200 MHz
    3.7 GB/s +23%
    Intel Core i5-14600K
    i5-14600K, 3500 MHz
    3.4 GB/s +13%
    Intel Core i5-13600K
    i5-13600K, 3500 MHz
    3.1 GB/s +3%
    Intel Core Ultra 5 245K
    Core Ultra 5 245K, 3600 MHz
    3 GB/s
    AMD Ryzen 9 7900X
    R9 7900X, 4700 MHz
    2.8 GB/s -7%
    AMD Ryzen 7 9700X
    Ryzen 7 9700X, 3800 MHz
    2.8 GB/s -7%
    Intel Core i5-12600K
    i5-12600K, 2800 MHz
    2.2 GB/s -27%
    AMD Ryzen 5 9600X
    Ryzen 5 9600X, 3900 MHz
    2.2 GB/s -27%
    AMD Ryzen 7 7800X3D
    R7 7800X3D, 4200 MHz
    2.1 GB/s -30%
    Intel Core i5-13400
    i5-13400, 2500 MHz
    2 GB/s -33%
    AMD Ryzen 5 7600X
    R5 7600X, 4700 MHz
    1.8 GB/s -40%
    Intel Core i5-12400F
    i5-12400F, 2500 MHz
    1.4 GB/s -53%
    Serpent Mean 100MB
    AMD Ryzen 9 9950X
    Ryzen 9 9950X, 4300 MHz
    3.4 GB/s +127%
    Intel Core i9-13900K
    i9-13900K, 3000 MHz
    3 GB/s +100%
    AMD Ryzen 9 7950X
    R9 7950X, 4500 MHz
    2.8 GB/s +87%
    AMD Ryzen 9 7950X3D
    R9 7950X3D, 4200 MHz
    2.8 GB/s +87%
    Intel Core i9-14900K
    i9-14900K, 3200 MHz
    2.8 GB/s +87%
    AMD Ryzen 9 5950X
    R9 5950X, 3400 MHz
    2.4 GB/s +60%
    Intel Core Ultra 9 285K
    Core Ultra 9 285K, 3200 MHz
    2.3 GB/s +53%
    Intel Core i9-12900K
    i9-12900K, 3200 MHz
    1.9 GB/s +27%
    Intel Core i5-14600K
    i5-14600K, 3500 MHz
    1.8 GB/s +20%
    Intel Core i5-13600K
    i5-13600K, 3500 MHz
    1.7 GB/s +13%
    AMD Ryzen 7 9700X
    Ryzen 7 9700X, 3800 MHz
    1.7 GB/s +13%
    AMD Ryzen 9 7900X
    R9 7900X, 4700 MHz
    1.5 GB/s 0%
    Intel Core Ultra 5 245K
    Core Ultra 5 245K, 3600 MHz
    1.5 GB/s
    AMD Ryzen 5 9600X
    Ryzen 5 9600X, 3900 MHz
    1.4 GB/s -7%
    Intel Core i5-12600K
    i5-12600K, 2800 MHz
    1.3 GB/s -13%
    AMD Ryzen 7 7800X3D
    R7 7800X3D, 4200 MHz
    1.3 GB/s -13%
    Intel Core i5-13400
    i5-13400, 2500 MHz
    1.2 GB/s -20%
    AMD Ryzen 5 7600X
    R5 7600X, 4700 MHz
    1.1 GB/s -27%
    Intel Core i5-12400F
    i5-12400F, 2500 MHz
    0.884 GB/s -41%
    Geekbench 5.5
    Multi-Core
    Intel Core i9-14900K
    i9-14900K, 3200 MHz
    25867 Points +46%
    Intel Core Ultra 9 285K
    Core Ultra 9 285K, 3200 MHz
    25740 Points +45%
    AMD Ryzen 9 7950X
    R9 7950X, 4500 MHz
    24625 Points +39%
    AMD Ryzen 9 7950X3D
    R9 7950X3D, 4200 MHz
    24343 Points +37%
    Intel Core i9-13900K
    i9-13900K, 3000 MHz
    24157 Points +36%
    AMD Ryzen 9 9950X
    Ryzen 9 9950X, 4300 MHz
    23982 Points +35%
    AMD Ryzen 9 9950X
    Ryzen 9 9950X, 4300 MHz
    23154 Points +30%
    AMD Ryzen 9 7900X
    R9 7900X, 4700 MHz
    19987 Points +13%
    Intel Core i9-12900K
    i9-12900K, 3200 MHz
    17854 Points +1%
    Intel Core Ultra 5 245K
    Core Ultra 5 245K, 3600 MHz
    17760 Points
    Intel Core i5-14600K
    i5-14600K, 3500 MHz
    17516 Points -1%
    AMD Ryzen 9 5950X
    R9 5950X, 3400 MHz
    16891 Points -5%
    Intel Core i5-13600K
    i5-13600K, 3500 MHz
    16651 Points -6%
    AMD Ryzen 7 9700X
    Ryzen 7 9700X, 3800 MHz
    14613 Points -18%
    AMD Ryzen 7 7800X3D
    R7 7800X3D, 4200 MHz
    14252 Points -20%
    Intel Core i5-12600K
    i5-12600K, 2800 MHz
    12797 Points -28%
    AMD Ryzen 5 9600X
    Ryzen 5 9600X, 3900 MHz
    12751 Points -28%
    Intel Core i5-13400
    i5-13400, 2500 MHz
    12107 Points -32%
    AMD Ryzen 5 7600X
    R5 7600X, 4700 MHz
    11917 Points -33%
    Intel Core i5-12400F
    i5-12400F, 2500 MHz
    9517 Points -46%
    Single-Core
    AMD Ryzen 9 9950X
    Ryzen 9 9950X, 4300 MHz
    2559 Points +15%
    AMD Ryzen 9 9950X
    Ryzen 9 9950X, 4300 MHz
    2536 Points +14%
    AMD Ryzen 5 9600X
    Ryzen 5 9600X, 3900 MHz
    2523 Points +13%
    AMD Ryzen 7 9700X
    Ryzen 7 9700X, 3800 MHz
    2507 Points +13%
    Intel Core Ultra 9 285K
    Core Ultra 9 285K, 3200 MHz
    2366 Points +6%
    AMD Ryzen 9 7950X
    R9 7950X, 4500 MHz
    2311 Points +4%
    AMD Ryzen 9 7950X3D
    R9 7950X3D, 4200 MHz
    2311 Points +4%
    Intel Core i9-13900K
    i9-13900K, 3000 MHz
    2290 Points +3%
    AMD Ryzen 9 7900X
    R9 7900X, 4700 MHz
    2274 Points +2%
    Intel Core i9-14900K
    i9-14900K, 3200 MHz
    2243 Points +1%
    Intel Core Ultra 5 245K
    Core Ultra 5 245K, 3600 MHz
    2224 Points
    AMD Ryzen 5 7600X
    R5 7600X, 4700 MHz
    2205 Points -1%
    Intel Core i9-12900K
    i9-12900K, 3200 MHz
    2042 Points -8%
    AMD Ryzen 7 7800X3D
    R7 7800X3D, 4200 MHz
    2027 Points -9%
    Intel Core i5-14600K
    i5-14600K, 3500 MHz
    2017 Points -9%
    Intel Core i5-13600K
    i5-13600K, 3500 MHz
    1967 Points -12%
    Intel Core i5-12600K
    i5-12600K, 2800 MHz
    1904 Points -14%
    Intel Core i5-13400
    i5-13400, 2500 MHz
    1795 Points -19%
    Intel Core i5-12400F
    i5-12400F, 2500 MHz
    1742 Points -22%
    AMD Ryzen 9 5950X
    R9 5950X, 3400 MHz
    1682 Points -24%
    Geekbench 5.0
    5.0 Multi-Core
    Intel Core Ultra 9 285K
    Core Ultra 9 285K, 3200 MHz
    25793 Points +44%
    Intel Core i9-14900K
    i9-14900K, 3200 MHz
    25459 Points +42%
    AMD Ryzen 9 7950X
    R9 7950X, 4500 MHz
    24479 Points +36%
    Intel Core i9-13900K
    i9-13900K, 3000 MHz
    24021 Points +34%
    AMD Ryzen 9 7950X3D
    R9 7950X3D, 4200 MHz
    23720 Points +32%
    AMD Ryzen 9 9950X
    Ryzen 9 9950X, 4300 MHz
    23387 Points +30%
    AMD Ryzen 9 7900X
    R9 7900X, 4700 MHz
    19975 Points +11%
    Intel Core i9-12900K
    i9-12900K, 3200 MHz
    17959 Points 0%
    Intel Core Ultra 5 245K
    Core Ultra 5 245K, 3600 MHz
    17938 Points
    Intel Core i5-14600K
    i5-14600K, 3500 MHz
    17374 Points -3%
    Intel Core i5-13600K
    i5-13600K, 3500 MHz
    16635 Points -7%
    AMD Ryzen 9 5950X
    R9 5950X, 3400 MHz
    16570 Points -8%
    AMD Ryzen 7 9700X
    Ryzen 7 9700X, 3800 MHz
    14698 Points -18%
    AMD Ryzen 7 7800X3D
    R7 7800X3D, 4200 MHz
    13888 Points -23%
    Intel Core i5-12600K
    i5-12600K, 2800 MHz
    12746 Points -29%
    AMD Ryzen 5 9600X
    Ryzen 5 9600X, 3900 MHz
    12556 Points -30%
    AMD Ryzen 5 7600X
    R5 7600X, 4700 MHz
    11880 Points -34%
    Intel Core i5-13400
    i5-13400, 2500 MHz
    11801 Points -34%
    Intel Core i5-12400F
    i5-12400F, 2500 MHz
    9368 Points -48%
    5.0 Single-Core
    AMD Ryzen 9 9950X
    Ryzen 9 9950X, 4300 MHz
    2445 Points +12%
    AMD Ryzen 7 9700X
    Ryzen 7 9700X, 3800 MHz
    2402 Points +10%
    AMD Ryzen 5 9600X
    Ryzen 5 9600X, 3900 MHz
    2397 Points +10%
    Intel Core Ultra 9 285K
    Core Ultra 9 285K, 3200 MHz
    2332 Points +7%
    Intel Core i9-14900K
    i9-14900K, 3200 MHz
    2272 Points +4%
    AMD Ryzen 9 7950X
    R9 7950X, 4500 MHz
    2222 Points +2%
    Intel Core i9-13900K
    i9-13900K, 3000 MHz
    2214 Points +2%
    AMD Ryzen 9 7900X
    R9 7900X, 4700 MHz
    2194 Points +1%
    AMD Ryzen 9 7950X3D
    R9 7950X3D, 4200 MHz
    2183 Points 0%
    Intel Core Ultra 5 245K
    Core Ultra 5 245K, 3600 MHz
    2180 Points
    AMD Ryzen 5 7600X
    R5 7600X, 4700 MHz
    2126 Points -2%
    Intel Core i5-14600K
    i5-14600K, 3500 MHz
    2004 Points -8%
    Intel Core i9-12900K
    i9-12900K, 3200 MHz
    1968 Points -10%
    AMD Ryzen 7 7800X3D
    R7 7800X3D, 4200 MHz
    1938 Points -11%
    Intel Core i5-13600K
    i5-13600K, 3500 MHz
    1931 Points -11%
    Intel Core i5-12600K
    i5-12600K, 2800 MHz
    1821 Points -16%
    Intel Core i5-13400
    i5-13400, 2500 MHz
    1706 Points -22%
    AMD Ryzen 9 5950X
    R9 5950X, 3400 MHz
    1683 Points -23%
    Intel Core i5-12400F
    i5-12400F, 2500 MHz
    1673 Points -23%
    Geekbench 4.4
    64 Bit Single-Core Score
    AMD Ryzen 9 9950X
    Ryzen 9 9950X, 4300 MHz
    10016 Points +9%
    Intel Core i9-14900K
    i9-14900K, 3200 MHz
    9890 Points +8%
    AMD Ryzen 7 9700X
    Ryzen 7 9700X, 3800 MHz
    9801 Points +7%
    Intel Core Ultra 9 285K
    Core Ultra 9 285K, 3200 MHz
    9791 Points +7%
    AMD Ryzen 5 9600X
    Ryzen 5 9600X, 3900 MHz
    9757 Points +6%
    Intel Core i9-13900K
    i9-13900K, 3000 MHz
    9598 Points +5%
    AMD Ryzen 9 7950X
    R9 7950X, 4500 MHz
    9322 Points +2%
    AMD Ryzen 9 7950X3D
    R9 7950X3D, 4200 MHz
    9240 Points +1%
    AMD Ryzen 9 7900X
    R9 7900X, 4700 MHz
    9193 Points 0%
    Intel Core Ultra 5 245K
    Core Ultra 5 245K, 3600 MHz
    9171 Points
    AMD Ryzen 7 7800X3D
    R7 7800X3D, 4200 MHz
    9097 Points -1%
    AMD Ryzen 5 7600X
    R5 7600X, 4700 MHz
    8926 Points -3%
    Intel Core i5-14600K
    i5-14600K, 3500 MHz
    8904 Points -3%
    Intel Core i9-12900K
    i9-12900K, 3200 MHz
    8665 Points -6%
    Intel Core i5-13600K
    i5-13600K, 3500 MHz
    8618 Points -6%
    Intel Core i5-12600K
    i5-12600K, 2800 MHz
    8223 Points -10%
    Intel Core i5-13400
    i5-13400, 2500 MHz
    7683 Points -16%
    Intel Core i5-12400F
    i5-12400F, 2500 MHz
    7548 Points -18%
    AMD Ryzen 9 5950X
    R9 5950X, 3400 MHz
    7216 Points -21%
    64 Bit Multi-Core Score
    AMD Ryzen 9 9950X
    Ryzen 9 9950X, 4300 MHz
    100326 Points +52%
    Intel Core Ultra 9 285K
    Core Ultra 9 285K, 3200 MHz
    92188 Points +40%
    AMD Ryzen 9 7950X
    R9 7950X, 4500 MHz
    89678 Points +36%
    Intel Core i9-14900K
    i9-14900K, 3200 MHz
    89177 Points +35%
    AMD Ryzen 9 7950X3D
    R9 7950X3D, 4200 MHz
    87922 Points +33%
    Intel Core i9-13900K
    i9-13900K, 3000 MHz
    86695 Points +31%
    AMD Ryzen 9 7900X
    R9 7900X, 4700 MHz
    74731 Points +13%
    Intel Core Ultra 5 245K
    Core Ultra 5 245K, 3600 MHz
    65981 Points
    Intel Core i5-14600K
    i5-14600K, 3500 MHz
    64035 Points -3%
    Intel Core i9-12900K
    i9-12900K, 3200 MHz
    63583 Points -4%
    AMD Ryzen 9 5950X
    R9 5950X, 3400 MHz
    63233 Points -4%
    Intel Core i5-13600K
    i5-13600K, 3500 MHz
    60407 Points -8%
    AMD Ryzen 7 9700X
    Ryzen 7 9700X, 3800 MHz
    59594 Points -10%
    AMD Ryzen 7 7800X3D
    R7 7800X3D, 4200 MHz
    54840 Points -17%
    AMD Ryzen 5 9600X
    Ryzen 5 9600X, 3900 MHz
    51644 Points -22%
    AMD Ryzen 5 7600X
    R5 7600X, 4700 MHz
    47407 Points -28%
    Intel Core i5-12600K
    i5-12600K, 2800 MHz
    46557 Points -29%
    Intel Core i5-13400
    i5-13400, 2500 MHz
    42509 Points -36%
    Intel Core i5-12400F
    i5-12400F, 2500 MHz
    35098 Points -47%
    3DMark 11 - 1280x720 Performance Physics
    AMD Ryzen 9 9950X
    Ryzen 9 9950X, 4300 MHz
    38269 Points +42%
    AMD Ryzen 9 7950X3D
    R9 7950X3D, 4200 MHz
    36991 Points +37%
    AMD Ryzen 7 7800X3D
    R7 7800X3D, 4200 MHz
    35127 Points +30%
    Intel Core i9-13900K
    i9-13900K, 3000 MHz
    32273 Points +19%
    Intel Core i9-14900K
    i9-14900K, 3200 MHz
    32188 Points +19%
    Intel Core i5-14600K
    i5-14600K, 3500 MHz
    31641 Points +17%
    AMD Ryzen 7 9700X
    Ryzen 7 9700X, 3800 MHz
    30757 Points +14%
    Intel Core i5-13600K
    i5-13600K, 3500 MHz
    30480 Points +13%
    Intel Core Ultra 9 285K
    Core Ultra 9 285K, 3200 MHz
    28636 Points +6%
    AMD Ryzen 9 7900X
    R9 7900X, 4700 MHz
    28618 Points +6%
    AMD Ryzen 9 7950X
    R9 7950X, 4500 MHz
    28618 Points +6%
    Intel Core i9-12900K
    i9-12900K, 3200 MHz
    28211 Points +4%
    Intel Core Ultra 5 245K
    Core Ultra 5 245K, 3600 MHz
    27022 Points
    AMD Ryzen 5 9600X
    Ryzen 5 9600X, 3900 MHz
    25717 Points -5%
    AMD Ryzen 5 7600X
    R5 7600X, 4700 MHz
    25396 Points -6%
    AMD Ryzen 9 5950X
    R9 5950X, 3400 MHz
    25367 Points -6%
    Intel Core i5-12600K
    i5-12600K, 2800 MHz
    25017 Points -7%
    Intel Core i5-13400
    i5-13400, 2500 MHz
    23120 Points -14%
    Intel Core i5-12400F
    i5-12400F, 2500 MHz
    19436 Points -28%
    7-Zip 18.03
    7z b 4
    AMD Ryzen 9 7950X
    R9 7950X, 4500 MHz
    161724 MIPS +108%
    AMD Ryzen 9 9950X
    Ryzen 9 9950X, 4300 MHz
    160423 MIPS +106%
    AMD Ryzen 9 7950X3D
    R9 7950X3D, 4200 MHz
    159341 MIPS +104%
    Intel Core i9-14900K
    i9-14900K, 3200 MHz
    149570 MIPS +92%
    Intel Core i9-13900K
    i9-13900K, 3000 MHz
    147068 MIPS +89%
    Intel Core Ultra 9 285K
    Core Ultra 9 285K, 3200 MHz
    129542 MIPS +66%
    AMD Ryzen 9 5950X
    R9 5950X, 3400 MHz
    127792 MIPS +64%
    AMD Ryzen 9 7900X
    R9 7900X, 4700 MHz
    124975 MIPS +60%
    Intel Core i9-12900K
    i9-12900K, 3200 MHz
    97671 MIPS +25%
    Intel Core i5-14600K
    i5-14600K, 3500 MHz
    93235 MIPS +20%
    Intel Core i5-13600K
    i5-13600K, 3500 MHz
    89647 MIPS +15%
    AMD Ryzen 7 7800X3D
    R7 7800X3D, 4200 MHz
    85067 MIPS +9%
    AMD Ryzen 7 9700X
    Ryzen 7 9700X, 3800 MHz
    82553 MIPS +6%
    Intel Core Ultra 5 245K
    Core Ultra 5 245K, 3600 MHz
    77921 MIPS
    AMD Ryzen 5 7600X
    R5 7600X, 4700 MHz
    69291 MIPS -11%
    AMD Ryzen 5 9600X
    Ryzen 5 9600X, 3900 MHz
    68220 MIPS -12%
    Intel Core i5-12600K
    i5-12600K, 2800 MHz
    64260 MIPS -18%
    Intel Core i5-13400
    i5-13400, 2500 MHz
    59510 MIPS -24%
    Intel Core i5-12400F
    i5-12400F, 2500 MHz
    45043 MIPS -42%
    7z b 4 -mmt1
    AMD Ryzen 9 7950X
    R9 7950X, 4500 MHz
    8365 MIPS +29%
    AMD Ryzen 9 7950X3D
    R9 7950X3D, 4200 MHz
    8321 MIPS +28%
    AMD Ryzen 9 7900X
    R9 7900X, 4700 MHz
    8282 MIPS +28%
    AMD Ryzen 7 7800X3D
    R7 7800X3D, 4200 MHz
    8235 MIPS +27%
    AMD Ryzen 5 7600X
    R5 7600X, 4700 MHz
    8063 MIPS +24%
    AMD Ryzen 7 9700X
    Ryzen 7 9700X, 3800 MHz
    7894 MIPS +22%
    AMD Ryzen 9 9950X
    Ryzen 9 9950X, 4300 MHz
    7852 MIPS +21%
    AMD Ryzen 5 9600X
    Ryzen 5 9600X, 3900 MHz
    7796 MIPS +20%
    Intel Core i9-14900K
    i9-14900K, 3200 MHz
    7772 MIPS +20%
    Intel Core Ultra 9 285K
    Core Ultra 9 285K, 3200 MHz
    7288 MIPS +13%
    Intel Core i9-13900K
    i9-13900K, 3000 MHz
    7272 MIPS +12%
    AMD Ryzen 9 5950X
    R9 5950X, 3400 MHz
    6974 MIPS +8%
    Intel Core i5-14600K
    i5-14600K, 3500 MHz
    6910 MIPS +7%
    Intel Core i9-12900K
    i9-12900K, 3200 MHz
    6571 MIPS +1%
    Intel Core i5-13600K
    i5-13600K, 3500 MHz
    6502 MIPS 0%
    Intel Core Ultra 5 245K
    Core Ultra 5 245K, 3600 MHz
    6477 MIPS
    Intel Core i5-12600K
    i5-12600K, 2800 MHz
    5944 MIPS -8%
    Intel Core i5-13400
    i5-13400, 2500 MHz
    5829 MIPS -10%
    Intel Core i5-12400F
    i5-12400F, 2500 MHz
    5476 MIPS -15%
    HWBOT x265 Benchmark v2.2 - 4k Preset
    AMD Ryzen 9 9950X
    Ryzen 9 9950X, 4300 MHz
    45.1 fps +52%
    Intel Core Ultra 9 285K
    Core Ultra 9 285K, 3200 MHz
    45 fps +52%
    AMD Ryzen 9 7950X
    R9 7950X, 4500 MHz
    44.4 fps +50%
    Intel Core i9-14900K
    i9-14900K, 3200 MHz
    42.8 fps +45%
    Intel Core i9-13900K
    i9-13900K, 3000 MHz
    42.6 fps +44%
    AMD Ryzen 9 7950X3D
    R9 7950X3D, 4200 MHz
    42.4 fps +43%
    AMD Ryzen 9 7900X
    R9 7900X, 4700 MHz
    36.2 fps +22%
    AMD Ryzen 9 5950X
    R9 5950X, 3400 MHz
    31.8 fps +7%
    Intel Core i5-12600K
    i5-12600K, 2800 MHz
    30.1 fps +2%
    Intel Core i9-12900K
    i9-12900K, 3200 MHz
    30 fps +1%
    Intel Core Ultra 5 245K
    Core Ultra 5 245K, 3600 MHz
    29.6 fps
    Intel Core i5-14600K
    i5-14600K, 3500 MHz
    28.6 fps -3%
    Intel Core i5-13600K
    i5-13600K, 3500 MHz
    27.6 fps -7%
    AMD Ryzen 7 9700X
    Ryzen 7 9700X, 3800 MHz
    26.4 fps -11%
    AMD Ryzen 7 7800X3D
    R7 7800X3D, 4200 MHz
    24.4 fps -18%
    AMD Ryzen 5 9600X
    Ryzen 5 9600X, 3900 MHz
    23.2 fps -22%
    AMD Ryzen 5 7600X
    R5 7600X, 4700 MHz
    21.1 fps -29%
    Intel Core i5-13400
    i5-13400, 2500 MHz
    19.1 fps -35%
    Intel Core i5-12400F
    i5-12400F, 2500 MHz
    15.2 fps -49%
    R Benchmark 2.5 - Overall mean
    Intel Core i5-12400F
    i5-12400F, 2500 MHz
    0.4837 sec * -18%
    Intel Core i5-13400
    i5-13400, 2500 MHz
    0.4654 sec * -14%
    AMD Ryzen 9 5950X
    R9 5950X, 3400 MHz
    0.4556 sec * -12%
    Intel Core i5-12600K
    i5-12600K, 2800 MHz
    0.4456 sec * -9%
    Intel Core i9-12900K
    i9-12900K, 3200 MHz
    0.4216 sec * -3%
    AMD Ryzen 7 7800X3D
    R7 7800X3D, 4200 MHz
    0.4152 sec * -2%
    Intel Core Ultra 5 245K
    Core Ultra 5 245K, 3600 MHz
    0.4086 sec *
    Intel Core Ultra 5 245K
    Core Ultra 5 245K, 3600 MHz
    0.4058 sec * +1%
    Intel Core i5-13600K
    i5-13600K, 3500 MHz
    0.405 sec * +1%
    Intel Core i5-14600K
    i5-14600K, 3500 MHz
    0.3937 sec * +4%
    Intel Core Ultra 9 285K
    Core Ultra 9 285K, 3200 MHz
    0.3833 sec * +6%
    AMD Ryzen 5 7600X
    R5 7600X, 4700 MHz
    0.3749 sec * +8%
    AMD Ryzen 9 7900X
    R9 7900X, 4700 MHz
    0.3736 sec * +9%
    AMD Ryzen 9 7950X3D
    R9 7950X3D, 4200 MHz
    0.372 sec * +9%
    AMD Ryzen 9 7950X
    R9 7950X, 4500 MHz
    0.3682 sec * +10%
    Intel Core i9-13900K
    i9-13900K, 3000 MHz
    0.3539 sec * +13%
    Intel Core i9-14900K
    i9-14900K, 3200 MHz
    0.345 sec * +16%
    AMD Ryzen 7 9700X
    Ryzen 7 9700X, 3800 MHz
    0.3414 sec * +16%
    AMD Ryzen 5 9600X
    Ryzen 5 9600X, 3900 MHz
    0.3389 sec * +17%
    AMD Ryzen 9 9950X
    Ryzen 9 9950X, 4300 MHz
    0.3307 sec * +19%
    LibreOffice - 20 Documents To PDF
    Intel Core i5-12600K
    i5-12600K, 2800 MHz
    71.8 s * -67%
    Intel Core i5-12400F
    i5-12400F, 2500 MHz
    46.5 s * -8%
    AMD Ryzen 5 9600X
    Ryzen 5 9600X, 3900 MHz
    46.4 s * -8%
    AMD Ryzen 9 5950X
    R9 5950X, 3400 MHz
    45.97 s * -7%
    AMD Ryzen 9 9950X
    Ryzen 9 9950X, 4300 MHz
    45.1 s * -5%
    AMD Ryzen 7 9700X
    Ryzen 7 9700X, 3800 MHz
    43.8 s * -2%
    Intel Core Ultra 5 245K
    Core Ultra 5 245K, 3600 MHz
    43.1 s *
    Intel Core Ultra 5 245K
    Core Ultra 5 245K, 3600 MHz
    39.3 s * +9%
    AMD Ryzen 7 7800X3D
    R7 7800X3D, 4200 MHz
    40.7 s * +6%
    Intel Core i9-12900K
    i9-12900K, 3200 MHz
    40.6 s * +6%
    Intel Core i5-13400
    i5-13400, 2500 MHz
    38.7 s * +10%
    AMD Ryzen 9 7950X3D
    R9 7950X3D, 4200 MHz
    38.6 s * +10%
    AMD Ryzen 5 7600X
    R5 7600X, 4700 MHz
    36.8 s * +15%
    Intel Core i9-13900K
    i9-13900K, 3000 MHz
    36.6 s * +15%
    Intel Core Ultra 9 285K
    Core Ultra 9 285K, 3200 MHz
    36.2 s * +16%
    AMD Ryzen 9 7950X
    R9 7950X, 4500 MHz
    35.5 s * +18%
    Intel Core i5-13600K
    i5-13600K, 3500 MHz
    35 s * +19%
    AMD Ryzen 9 7900X
    R9 7900X, 4700 MHz
    34.9 s * +19%
    Intel Core i9-14900K
    i9-14900K, 3200 MHz
    32.5 s * +25%
    Intel Core i5-14600K
    i5-14600K, 3500 MHz
    31.9 s * +26%
    WebXPRT 3 - Overall
    AMD Ryzen 9 9950X
    Ryzen 9 9950X, 4300 MHz
    409 Points +18%
    AMD Ryzen 7 9700X
    Ryzen 7 9700X, 3800 MHz
    398 Points +15%
    AMD Ryzen 9 7950X3D
    R9 7950X3D, 4200 MHz
    383 Points +11%
    Intel Core i9-14900K
    i9-14900K, 3200 MHz
    382 Points +10%
    Intel Core Ultra 9 285K
    Core Ultra 9 285K, 3200 MHz
    377 Points +9%
    AMD Ryzen 9 7900X
    R9 7900X, 4700 MHz
    371 Points +7%
    AMD Ryzen 9 7950X
    R9 7950X, 4500 MHz
    366 Points +6%
    AMD Ryzen 5 9600X
    Ryzen 5 9600X, 3900 MHz
    364 Points +5%
    AMD Ryzen 5 7600X
    R5 7600X, 4700 MHz
    362 Points +5%
    Intel Core i9-13900K
    i9-13900K, 3000 MHz
    361 Points +4%
    Intel Core i5-14600K
    i5-14600K, 3500 MHz
    354 Points +2%
    AMD Ryzen 7 7800X3D
    R7 7800X3D, 4200 MHz
    353 Points +2%
    Intel Core Ultra 5 245K
    Core Ultra 5 245K, 3600 MHz
    346 Points
    Intel Core i5-13600K
    i5-13600K, 3500 MHz
    333 Points -4%
    Intel Core i9-12900K
    i9-12900K, 3200 MHz
    320 Points -8%
    Intel Core i5-13400
    i5-13400, 2500 MHz
    306 Points -12%
    Intel Core i5-12600K
    i5-12600K, 2800 MHz
    293 Points -15%
    AMD Ryzen 9 5950X
    R9 5950X, 3400 MHz
    291 Points -16%
    Intel Core i5-12400F
    i5-12400F, 2500 MHz
    272 Points -21%
    Mozilla Kraken 1.1 - Total
    Intel Core i5-12400F
    i5-12400F, 2500 MHz
    573 ms * -35%
    AMD Ryzen 9 5950X
    R9 5950X, 3400 MHz
    558 ms * -31%
    Intel Core i5-13400
    i5-13400, 2500 MHz
    535 ms * -26%
    Intel Core i5-12600K
    i5-12600K, 2800 MHz
    511 ms * -20%
    AMD Ryzen 7 7800X3D
    R7 7800X3D, 4200 MHz
    487 ms * -15%
    Intel Core i9-12900K
    i9-12900K, 3200 MHz
    481 ms * -13%
    Intel Core i5-13600K
    i5-13600K, 3500 MHz
    469 ms * -10%
    Intel Core i5-14600K
    i5-14600K, 3500 MHz
    450 ms * -6%
    AMD Ryzen 5 7600X
    R5 7600X, 4700 MHz
    441 ms * -4%
    AMD Ryzen 9 7950X3D
    R9 7950X3D, 4200 MHz
    437 ms * -3%
    AMD Ryzen 9 7950X
    R9 7950X, 4500 MHz
    433 ms * -2%
    Intel Core i9-13900K
    i9-13900K, 3000 MHz
    432 ms * -2%
    AMD Ryzen 9 7900X
    R9 7900X, 4700 MHz
    431 ms * -1%
    Intel Core Ultra 5 245K
    Core Ultra 5 245K, 3600 MHz
    425 ms *
    Intel Core i9-14900K
    i9-14900K, 3200 MHz
    418 ms * +2%
    Intel Core Ultra 9 285K
    Core Ultra 9 285K, 3200 MHz
    396 ms * +7%
    AMD Ryzen 5 9600X
    Ryzen 5 9600X, 3900 MHz
    389 ms * +8%
    AMD Ryzen 7 9700X
    Ryzen 7 9700X, 3800 MHz
    383 ms * +10%
    AMD Ryzen 9 9950X
    Ryzen 9 9950X, 4300 MHz
    377 ms * +11%
    3DMark
    1920x1080 Fire Strike Physics
    Intel Core i9-14900K
    i9-14900K, 3200 MHz
    56087 Points +47%
    Intel Core i9-13900K
    i9-13900K, 3000 MHz
    53853 Points +41%
    Intel Core Ultra 9 285K
    Core Ultra 9 285K, 3200 MHz
    53194 Points +39%
    AMD Ryzen 9 9950X
    Ryzen 9 9950X, 4300 MHz
    49522 Points +30%
    AMD Ryzen 9 7950X3D
    R9 7950X3D, 4200 MHz
    44787 Points +17%
    AMD Ryzen 9 7900X
    R9 7900X, 4700 MHz
    42682 Points +12%
    AMD Ryzen 9 7950X
    R9 7950X, 4500 MHz
    42682 Points +12%
    Intel Core i5-14600K
    i5-14600K, 3500 MHz
    40164 Points +5%
    AMD Ryzen 9 5950X
    R9 5950X, 3400 MHz
    39600 Points +4%
    Intel Core i9-12900K
    i9-12900K, 3200 MHz
    39112 Points +2%
    Intel Core Ultra 5 245K
    Core Ultra 5 245K, 3600 MHz
    38202 Points
    AMD Ryzen 7 9700X
    Ryzen 7 9700X, 3800 MHz
    38088 Points 0%
    Intel Core i5-13600K
    i5-13600K, 3500 MHz
    35386 Points -7%
    AMD Ryzen 5 9600X
    Ryzen 5 9600X, 3900 MHz
    33462 Points -12%
    AMD Ryzen 7 7800X3D
    R7 7800X3D, 4200 MHz
    33345 Points -13%
    AMD Ryzen 5 7600X
    R5 7600X, 4700 MHz
    30691 Points -20%
    Intel Core i5-12600K
    i5-12600K, 2800 MHz
    29671 Points -22%
    Intel Core i5-13400
    i5-13400, 2500 MHz
    27135 Points -29%
    Intel Core i5-12400F
    i5-12400F, 2500 MHz
    24023 Points -37%
    2560x1440 Time Spy CPU
    Intel Core i9-14900K
    i9-14900K, 3200 MHz
    23721 Points +58%
    Intel Core i9-13900K
    i9-13900K, 3000 MHz
    19392 Points +29%
    Intel Core i5-14600K
    i5-14600K, 3500 MHz
    18768 Points +25%
    Intel Core i9-12900K
    i9-12900K, 3200 MHz
    18431 Points +23%
    Intel Core Ultra 9 285K
    Core Ultra 9 285K, 3200 MHz
    17911 Points +19%
    AMD Ryzen 9 7950X3D
    R9 7950X3D, 4200 MHz
    17206 Points +15%
    Intel Core i5-13600K
    i5-13600K, 3500 MHz
    17124 Points +14%
    AMD Ryzen 9 7900X
    R9 7900X, 4700 MHz
    16616 Points +11%
    AMD Ryzen 9 7950X
    R9 7950X, 4500 MHz
    16616 Points +11%
    AMD Ryzen 9 9950X
    Ryzen 9 9950X, 4300 MHz
    16112 Points +7%
    Intel Core Ultra 5 245K
    Core Ultra 5 245K, 3600 MHz
    15010 Points
    AMD Ryzen 7 9700X
    Ryzen 7 9700X, 3800 MHz
    14306 Points -5%
    AMD Ryzen 7 7800X3D
    R7 7800X3D, 4200 MHz
    14098 Points -6%
    Intel Core i5-12600K
    i5-12600K, 2800 MHz
    13869 Points -8%
    AMD Ryzen 9 5950X
    R9 5950X, 3400 MHz
    13650 Points -9%
    Intel Core i5-13400
    i5-13400, 2500 MHz
    12948 Points -14%
    AMD Ryzen 5 9600X
    Ryzen 5 9600X, 3900 MHz
    10821 Points -28%
    AMD Ryzen 5 7600X
    R5 7600X, 4700 MHz
    10458 Points -30%
    Intel Core i5-12400F
    i5-12400F, 2500 MHz
    9745 Points -35%
    Super Pi mod 1.5 XS 1M - 1M
    Intel Core i5-12400F
    i5-12400F, 2500 MHz
    8.298 s * -14%
    Intel Core i5-13400
    i5-13400, 2500 MHz
    8.033 s * -10%
    AMD Ryzen 5 9600X
    Ryzen 5 9600X, 3900 MHz
    7.614 s * -4%
    AMD Ryzen 7 9700X
    Ryzen 7 9700X, 3800 MHz
    7.54 s * -3%
    AMD Ryzen 5 7600X
    R5 7600X, 4700 MHz
    7.423 s * -2%
    Intel Core i5-12600K
    i5-12600K, 2800 MHz
    7.406 s * -1%
    AMD Ryzen 9 9950X
    Ryzen 9 9950X, 4300 MHz
    7.31 s * -0%
    Intel Core Ultra 5 245K
    Core Ultra 5 245K, 3600 MHz
    7.303 s *
    AMD Ryzen 7 7800X3D
    R7 7800X3D, 4200 MHz
    7.089 s * +3%
    AMD Ryzen 9 5950X
    R9 5950X, 3400 MHz
    7.065 s * +3%
    Intel Core i9-12900K
    i9-12900K, 3200 MHz
    7.063 s * +3%
    Intel Core Ultra 9 285K
    Core Ultra 9 285K, 3200 MHz
    6.713 s * +8%
    Intel Core i5-13600K
    i5-13600K, 3500 MHz
    6.58 s * +10%
    Intel Core i5-14600K
    i5-14600K, 3500 MHz
    6.234 s * +15%
    AMD Ryzen 9 7900X
    R9 7900X, 4700 MHz
    6.141 s * +16%
    AMD Ryzen 9 7950X3D
    R9 7950X3D, 4200 MHz
    6.109 s * +16%
    AMD Ryzen 9 7950X
    R9 7950X, 4500 MHz
    6.088 s * +17%
    Intel Core i9-13900K
    i9-13900K, 3000 MHz
    5.655 s * +23%
    Intel Core i9-14900K
    i9-14900K, 3200 MHz
    5.476 s * +25%
    Super Pi mod 1.5 XS 2M - 2M
    Intel Core i5-12400F
    i5-12400F, 2500 MHz
    18.473 s * -15%
    Intel Core i5-13400
    i5-13400, 2500 MHz
    17.963 s * -12%
    Intel Core i5-12600K
    i5-12600K, 2800 MHz
    16.42 s * -2%
    AMD Ryzen 5 9600X
    Ryzen 5 9600X, 3900 MHz
    16.363 s * -2%
    AMD Ryzen 7 9700X
    Ryzen 7 9700X, 3800 MHz
    16.1 s * -0%
    Intel Core Ultra 5 245K
    Core Ultra 5 245K, 3600 MHz
    16.026 s *
    AMD Ryzen 5 7600X
    R5 7600X, 4700 MHz
    15.954 s * -0%
    AMD Ryzen 9 9950X
    Ryzen 9 9950X, 4300 MHz
    15.61 s * +3%
    Intel Core i9-12900K
    i9-12900K, 3200 MHz
    15.59 s * +3%
    AMD Ryzen 7 7800X3D
    R7 7800X3D, 4200 MHz
    15.335 s * +4%
    AMD Ryzen 9 5950X
    R9 5950X, 3400 MHz
    15.28 s * +5%
    Intel Core i5-13600K
    i5-13600K, 3500 MHz
    14.876 s * +7%
    Intel Core Ultra 9 285K
    Core Ultra 9 285K, 3200 MHz
    14.64 s * +9%
    Intel Core i5-14600K
    i5-14600K, 3500 MHz
    13.657 s * +15%
    AMD Ryzen 9 7950X
    R9 7950X, 4500 MHz
    13.291 s * +17%
    AMD Ryzen 9 7900X
    R9 7900X, 4700 MHz
    13.251 s * +17%
    Intel Core i9-13900K
    i9-13900K, 3000 MHz
    13.193 s * +18%
    AMD Ryzen 9 7950X3D
    R9 7950X3D, 4200 MHz
    13.189 s * +18%
    Intel Core i9-14900K
    i9-14900K, 3200 MHz
    11.996 s * +25%

    * ... kleinere Werte sind besser
    Cinebench R15
    Cinebench R15
    Cinebench R20
    Cinebench R20
    Cinebench R23
    Cinebench R23
    Cinebench 2024
    Cinebench 2024
    Cinebench R10 Rendering Single 32Bit
    11681
    Cinebench R10 Shading 64Bit
    6829 Points
    Cinebench R10 Rendering Multiple CPUs 64Bit
    144770 Points
    Cinebench R10 Rendering Single CPUs 64Bit
    18079 Points
    Cinebench R10 Shading 32Bit
    6833
    Cinebench R10 Rendering Multiple CPUs 32Bit
    91572
    Cinebench R11.5 CPU Multi 32Bit
    41.7 Points
    Cinebench R11.5 OpenGL 32Bit
    187.41 fps
    Cinebench R11.5 CPU Single 64Bit
    3.85 Points
    Cinebench R11.5 CPU Multi 64Bit
    47.55 Points
    Cinebench R11.5 OpenGL 64Bit
    205.52 fps
    Cinebench R11.5 CPU Single 32Bit
    3.37 Points
    Cinebench R15 CPU Single 64Bit
    322 Points
    Cinebench R15 Ref. Match 64Bit
    99.6 %
    Cinebench R15 OpenGL 64Bit
    297.24 fps
    Cinebench R15 CPU Multi 64Bit
    3850 Points
    Hilfe

    Intel Core Ultra 5 245K bei der Cinebench-R15-Multi-Schleife

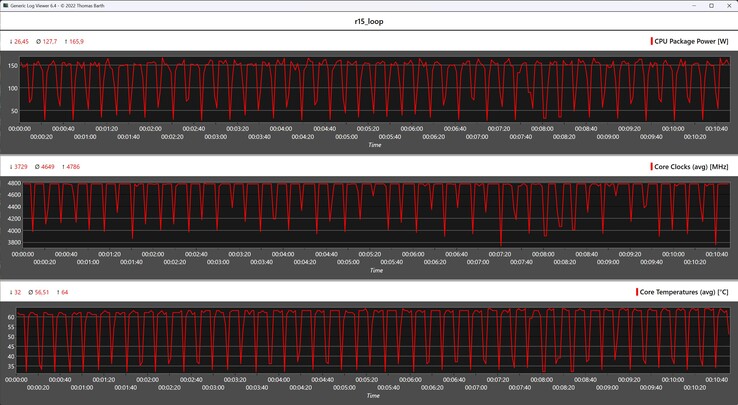
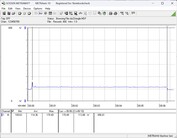
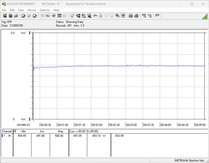
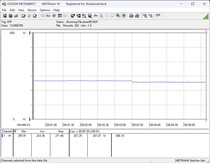
    Die Cinebench-R15-Dauerschleife meistert der Intel Core Ultra 5 245K ohne Einschränkungen. Lastspitzen von knapp 166 Watt sind nur kurzzeitig vorhanden, wenngleich die durchschnittliche Leistungsaufnahme des Prozessors sich über 50 Durchläufe hinweg bei 128 Watt einpendelt. Aufgrund der leistungsstarken Kühleinheit wurde der Intel Core Ultra 5 245K nicht wärmer als 64 °C.

    CPU-Metrik während der Cinebench-R15-Schleife
    CPU-Metrik während der Cinebench-R15-Schleife
    1723.61923.62123.62323.62523.62723.62923.63123.63323.63523.63723.63923.64123.64323.64523.64723.64923.65123.65323.65523.65723.65923.66123.66323.6Tooltip
    Intel Core Ultra 5 245K Core Ultra 5 245K: Ø3788 (3746.72-3821.53)
    Intel Core i9-13900K i9-13900K: Ø6182 (6045.95-6213.11)
    NVIDIA GeForce RTX 3090 Founders Edition R9 7950X: Ø6154 (6136.85-6189.08)
    Intel Core i5-13600K i5-13600K: Ø3620 (3607.83-3632.07)
    AMD Ryzen 5 7600X R5 7600X: Ø2468 (2440.21-2487.56)
    Intel Core i9-12900K i9-12900K: Ø3987 (3920.42-4037.55)
    Intel Core i5-12600K i5-12600K: Ø2545 (2497.35-2570.36)
    AMD Ryzen 7 7800X3D R7 7800X3D: Ø2967 (2917.15-3006.39)
    AMD Ryzen 9 7900X R9 7900X: Ø4785 (4739.9-4829.17)
    Intel Core i5-13400 i5-13400: Ø2328 (2286.5-2356.27)
    Intel Core i5-12400F i5-12400F: Ø1754 (1723.62-1775.1)
    AMD Ryzen 9 5950X R9 5950X: Ø4467 (4442.47-4510.09)
    AMD Ryzen 9 7950X3D R9 7950X3D: Ø5942 (5923.29-5966.59)
    Palit GeForce RTX 4090 GameRock OC i9-14900K: Ø6068 (5924.17-6110.6)
    Intel Core i5-14600K i5-14600K: Ø3640 (3622.86-3654.64)
    AMD Ryzen 5 9600X Ryzen 5 9600X: Ø2623 (2586.99-2654.28)
    AMD Ryzen 9 9950X Ryzen 9 9950X: Ø6291 (6262.72-6335.13)

    Synthetische Benchmarks und Anwendungsleistung

    Im Alltag performt der Intel Core Ultra 5 245K genauso gut wie alle anderen Prozessoren, die sich in der Vergleichsübersicht befinden. Spürbare Unterschiede sind nicht ausfindig zu machen, wenngleich die Ergebnisse des Intel Core Ultra 5 245K nur einen Platz im Mittelfeld offenbaren. Die Leistung des Intel Core i5-14600K kann nicht erreicht werden, was unter dem Stich etwas enttäuscht.

    PCMark 10 - Score
    AMD Ryzen 9 9950X
    10699 Points +14%
    Intel Core Ultra 9 285K
    10443 Points +11%
    Intel Core i9-14900K
    10101 Points +7%
    AMD Ryzen 5 9600X
    10060 Points +7%
    AMD Ryzen 9 7900X
    9911 Points +5%
    AMD Ryzen 9 7950X
    9911 Points +5%
    Intel Core i9-13900K
    9788 Points +4%
    Intel Core i5-14600K
    9587 Points +2%
    AMD Ryzen 7 7800X3D
    9500 Points +1%
    AMD Ryzen 5 7600X
    9470 Points +1%
    Intel Core Ultra 5 245K
    9409 Points
    Intel Core i5-13600K
    9362 Points 0%
    AMD Ryzen 9 5950X
    8778 Points -7%
    Intel Core i5-13400
    8614 Points -8%
    Intel Core i9-12900K
    8604 Points -9%
    Intel Core i5-12600K
    8259 Points -12%
    Intel Core i5-12400F
    7756 Points -18%
    CrossMark - Overall
    Intel Core i9-14900K
    2611 Points +16%
    Intel Core i9-13900K
    2589 Points +15%
    Intel Core Ultra 9 285K
    2533 Points +13%
    AMD Ryzen 9 7950X
    2512 Points +12%
    AMD Ryzen 9 9950X
    2451 Points +9%
    AMD Ryzen 9 7900X
    2405 Points +7%
    Intel Core i5-14600K
    2310 Points +3%
    Intel Core i5-13600K
    2271 Points +1%
    Intel Core Ultra 5 245K
    2245 Points
    AMD Ryzen 5 7600X
    2236 Points 0%
    AMD Ryzen 7 7800X3D
    2216 Points -1%
    AMD Ryzen 9 7950X3D
    2193 Points -2%
    AMD Ryzen 5 9600X
    2103 Points -6%
    Intel Core i5-13400
    1877 Points -16%
    Intel Core i5-12400F
    1762 Points -22%
    AMD Ryzen 9 5950X
    1495 Points -33%
    Blender
    v2.79 BMW27 CPU
    Intel Core i5-12400F
    269 Seconds * -98%
    Intel Core i5-13400
    206 Seconds * -51%
    AMD Ryzen 5 7600X
    203 Seconds * -49%
    Intel Core i5-12600K
    189.5 Seconds * -39%
    AMD Ryzen 5 9600X
    184 Seconds * -35%
    AMD Ryzen 7 7800X3D
    169 Seconds * -24%
    Intel Core Ultra 5 245K
    136 Seconds *
    Intel Core i5-13600K
    135 Seconds * +1%
    Intel Core i5-14600K
    134 Seconds * +1%
    Intel Core i9-12900K
    121.1 Seconds * +11%
    AMD Ryzen 9 5950X
    112.8 Seconds * +17%
    AMD Ryzen 9 7900X
    106 Seconds * +22%
    AMD Ryzen 9 7950X3D
    86 Seconds * +37%
    AMD Ryzen 9 7950X
    85 Seconds * +37%
    Intel Core i9-13900K
    80 Seconds * +41%
    Intel Core i9-14900K
    80 Seconds * +41%
    Intel Core Ultra 9 285K
    79 Seconds * +42%
    AMD Ryzen 9 9950X
    77 Seconds * +43%
    v3.3 Classroom CPU
    Intel Core i5-12400F
    430 Seconds * -99%
    Intel Core i5-13400
    336 Seconds * -56%
    AMD Ryzen 5 9600X
    289 Seconds * -34%
    AMD Ryzen 7 7800X3D
    266 Seconds * -23%
    Intel Core i5-13600K
    224 Seconds * -4%
    Intel Core i5-14600K
    223 Seconds * -3%
    Intel Core Ultra 5 245K
    216 Seconds *
    Intel Core i9-13900K
    138 Seconds * +36%
    Intel Core i9-14900K
    135 Seconds * +37%
    AMD Ryzen 9 7950X3D
    133 Seconds * +38%
    Intel Core Ultra 9 285K
    124 Seconds * +43%
    AMD Ryzen 9 9950X
    118 Seconds * +45%

    * ... kleinere Werte sind besser
    Performance Rating - Percent
    AMD Ryzen 5 9600X
    NVIDIA GeForce RTX 4090
    97.9 pt
    Intel Core i9-14900K
    NVIDIA GeForce RTX 4090
    97 pt
    Intel Core i5-14600K
    NVIDIA GeForce RTX 4090
    96.2 pt
    Intel Core i7-13700K
    NVIDIA GeForce RTX 4090
    95.6 pt
    AMD Ryzen 7 7800X3D
    NVIDIA GeForce RTX 4090
    95.1 pt
    AMD Ryzen 9 7950X3D
    NVIDIA GeForce RTX 4090
    95.1 pt
    AMD Ryzen 9 7950X
    NVIDIA GeForce RTX 4090
    95.1 pt
    Intel Core i7-13700
    NVIDIA GeForce RTX 4090
    94.7 pt
    Intel Core Ultra 9 285K
    NVIDIA GeForce RTX 4090
    91.1 pt
    Intel Core i7-12700
    NVIDIA GeForce RTX 4090
    91 pt
    Intel Core Ultra 5 245K
    NVIDIA GeForce RTX 4090
    90.8 pt
    Intel Core i5-13400
    NVIDIA GeForce RTX 4090
    88.7 pt
    3DMark 11 - 1280x720 Performance GPU
    AMD Ryzen 7 7800X3D
    NVIDIA GeForce RTX 4090
    114641 Points +9%
    Intel Core i5-14600K
    NVIDIA GeForce RTX 4090
    110994 Points +6%
    AMD Ryzen 9 7950X
    NVIDIA GeForce RTX 4090
    107723 Points +3%
    Intel Core i7-13700K
    NVIDIA GeForce RTX 4090
    107060 Points +2%
    AMD Ryzen 9 7950X3D
    NVIDIA GeForce RTX 4090
    105886 Points +1%
    Intel Core i7-13700
    NVIDIA GeForce RTX 4090
    105473 Points +1%
    Intel Core i9-14900K
    NVIDIA GeForce RTX 4090
    104998 Points 0%
    Intel Core i7-12700
    NVIDIA GeForce RTX 4090
    104876 Points 0%
    Intel Core Ultra 5 245K
    NVIDIA GeForce RTX 4090
    104781 Points
    Intel Core i5-13400
    NVIDIA GeForce RTX 4090
    104598 Points 0%
    AMD Ryzen 5 9600X
    NVIDIA GeForce RTX 4090
    104516 Points 0%
    Intel Core Ultra 9 285K
    NVIDIA GeForce RTX 4090
    97005 Points -7%
    3DMark
    2560x1440 Time Spy Graphics
    Intel Core i5-14600K
    NVIDIA GeForce RTX 4090
    37769 Points +3%
    Intel Core i9-14900K
    NVIDIA GeForce RTX 4090
    37762 Points +3%
    AMD Ryzen 7 7800X3D
    NVIDIA GeForce RTX 4090
    37664 Points +2%
    AMD Ryzen 5 9600X
    NVIDIA GeForce RTX 4090
    37161 Points +1%
    Intel Core i7-13700K
    NVIDIA GeForce RTX 4090
    37109 Points +1%
    Intel Core i7-13700
    NVIDIA GeForce RTX 4090
    37106 Points +1%
    AMD Ryzen 9 7950X
    NVIDIA GeForce RTX 4090
    36836 Points 0%
    Intel Core Ultra 5 245K
    NVIDIA GeForce RTX 4090
    36813 Points
    AMD Ryzen 9 7950X3D
    NVIDIA GeForce RTX 4090
    36665 Points 0%
    Intel Core Ultra 9 285K
    NVIDIA GeForce RTX 4090
    36172 Points -2%
    Intel Core i7-12700
    NVIDIA GeForce RTX 4090
    34580 Points -6%
    Intel Core i5-13400
    NVIDIA GeForce RTX 4090
    33624 Points -9%
    1920x1080 Fire Strike Graphics
    Intel Core i5-14600K
    NVIDIA GeForce RTX 4090
    86031 Points +10%
    Intel Core i7-12700
    NVIDIA GeForce RTX 4090
    79398 Points +2%
    Intel Core i7-13700K
    NVIDIA GeForce RTX 4090
    79091 Points +1%
    Intel Core i7-13700
    NVIDIA GeForce RTX 4090
    78878 Points +1%
    AMD Ryzen 5 9600X
    NVIDIA GeForce RTX 4090
    78579 Points +1%
    Intel Core Ultra 5 245K
    NVIDIA GeForce RTX 4090
    78079 Points
    Intel Core i5-13400
    NVIDIA GeForce RTX 4090
    77224 Points -1%
    AMD Ryzen 7 7800X3D
    NVIDIA GeForce RTX 4090
    73447 Points -6%
    AMD Ryzen 9 7950X3D
    NVIDIA GeForce RTX 4090
    72901 Points -7%
    AMD Ryzen 9 7950X
    NVIDIA GeForce RTX 4090
    72678 Points -7%
    Intel Core i9-14900K
    NVIDIA GeForce RTX 4090
    70971 Points -9%
    Intel Core Ultra 9 285K
    NVIDIA GeForce RTX 4090
    55924 Points -28%
    3840x2160 Fire Strike Ultra Graphics
    AMD Ryzen 7 7800X3D
    NVIDIA GeForce RTX 4090
    25571 Points +2%
    Intel Core i5-14600K
    NVIDIA GeForce RTX 4090
    25342 Points +1%
    Intel Core i7-13700
    NVIDIA GeForce RTX 4090
    25254 Points +1%
    Intel Core i9-14900K
    NVIDIA GeForce RTX 4090
    25209 Points 0%
    Intel Core i7-13700K
    NVIDIA GeForce RTX 4090
    25187 Points 0%
    Intel Core Ultra 5 245K
    NVIDIA GeForce RTX 4090
    25088 Points
    Intel Core i5-13400
    NVIDIA GeForce RTX 4090
    25052 Points 0%
    AMD Ryzen 9 7950X
    NVIDIA GeForce RTX 4090
    25018 Points 0%
    AMD Ryzen 9 7950X3D
    NVIDIA GeForce RTX 4090
    24969 Points 0%
    AMD Ryzen 5 9600X
    NVIDIA GeForce RTX 4090
    24915 Points -1%
    Intel Core i7-12700
    NVIDIA GeForce RTX 4090
    24669 Points -2%
    Intel Core Ultra 9 285K
    NVIDIA GeForce RTX 4090
    24376 Points -3%
    Unigine Superposition
    1280x720 720p Low
    AMD Ryzen 5 9600X
    NVIDIA GeForce RTX 4090
    63603 Points +59%
    Intel Core i9-14900K
    NVIDIA GeForce RTX 4090
    57174 Points +43%
    AMD Ryzen 7 7800X3D
    NVIDIA GeForce RTX 4090
    56805 Points +42%
    AMD Ryzen 9 7950X
    NVIDIA GeForce RTX 4090
    51741 Points +29%
    Intel Core i7-13700K
    NVIDIA GeForce RTX 4090
    51443 Points +28%
    AMD Ryzen 9 7950X3D
    NVIDIA GeForce RTX 4090
    50990 Points +27%
    Intel Core i7-13700
    NVIDIA GeForce RTX 4090
    50107 Points +25%
    Intel Core i5-14600K
    NVIDIA GeForce RTX 4090
    49203 Points +23%
    Intel Core Ultra 9 285K
    NVIDIA GeForce RTX 4090
    44723 Points +11%
    Intel Core i7-12700
    NVIDIA GeForce RTX 4090
    40758 Points +2%
    Intel Core Ultra 5 245K
    NVIDIA GeForce RTX 4090
    40122 Points
    Intel Core i5-13400
    NVIDIA GeForce RTX 4090
    35207 Points -12%
    1920x1080 1080p High
    Intel Core i9-14900K
    NVIDIA GeForce RTX 4090
    50399 Points +37%
    AMD Ryzen 5 9600X
    NVIDIA GeForce RTX 4090
    50230 Points +37%
    AMD Ryzen 7 7800X3D
    NVIDIA GeForce RTX 4090
    49328 Points +34%
    AMD Ryzen 9 7950X
    NVIDIA GeForce RTX 4090
    46814 Points +27%
    Intel Core i7-13700K
    NVIDIA GeForce RTX 4090
    46385 Points +26%
    AMD Ryzen 9 7950X3D
    NVIDIA GeForce RTX 4090
    46052 Points +25%
    Intel Core i7-13700
    NVIDIA GeForce RTX 4090
    45368 Points +23%
    Intel Core i5-14600K
    NVIDIA GeForce RTX 4090
    45162 Points +23%
    Intel Core Ultra 9 285K
    NVIDIA GeForce RTX 4090
    41496 Points +13%
    Intel Core i7-12700
    NVIDIA GeForce RTX 4090
    37819 Points +3%
    Intel Core Ultra 5 245K
    NVIDIA GeForce RTX 4090
    36786 Points
    Intel Core i5-13400
    NVIDIA GeForce RTX 4090
    32711 Points -11%
    1920x1080 1080p Extreme
    AMD Ryzen 7 7800X3D
    NVIDIA GeForce RTX 4090
    22618 Points +4%
    Intel Core Ultra 9 285K
    NVIDIA GeForce RTX 4090
    22319 Points +3%
    Intel Core i5-14600K
    NVIDIA GeForce RTX 4090
    21954 Points +1%
    Intel Core i9-14900K
    NVIDIA GeForce RTX 4090
    21920 Points +1%
    AMD Ryzen 9 7950X3D
    NVIDIA GeForce RTX 4090
    21913 Points +1%
    AMD Ryzen 9 7950X
    NVIDIA GeForce RTX 4090
    21824 Points +1%
    Intel Core i7-13700
    NVIDIA GeForce RTX 4090
    21808 Points 0%
    Intel Core i7-13700K
    NVIDIA GeForce RTX 4090
    21744 Points 0%
    Intel Core Ultra 5 245K
    NVIDIA GeForce RTX 4090
    21706 Points
    Intel Core i5-13400
    NVIDIA GeForce RTX 4090
    21646 Points 0%
    Intel Core i7-12700
    NVIDIA GeForce RTX 4090
    21615 Points 0%
    AMD Ryzen 5 9600X
    NVIDIA GeForce RTX 4090
    21586 Points -1%
    3840x2160 4k Optimized
    AMD Ryzen 9 7950X
    NVIDIA GeForce RTX 4090
    33943 Points +6%
    Intel Core i9-14900K
    NVIDIA GeForce RTX 4090
    33885 Points +5%
    AMD Ryzen 9 7950X3D
    NVIDIA GeForce RTX 4090
    33883 Points +5%
    Intel Core i7-13700
    NVIDIA GeForce RTX 4090
    33765 Points +5%
    Intel Core i7-13700K
    NVIDIA GeForce RTX 4090
    33719 Points +5%
    Intel Core i5-14600K
    NVIDIA GeForce RTX 4090
    33700 Points +5%
    AMD Ryzen 7 7800X3D
    NVIDIA GeForce RTX 4090
    33601 Points +4%
    AMD Ryzen 5 9600X
    NVIDIA GeForce RTX 4090
    33095 Points +3%
    Intel Core Ultra 9 285K
    NVIDIA GeForce RTX 4090
    33051 Points +3%
    Intel Core i7-12700
    NVIDIA GeForce RTX 4090
    32608 Points +1%
    Intel Core Ultra 5 245K
    NVIDIA GeForce RTX 4090
    32169 Points
    Intel Core i5-13400
    NVIDIA GeForce RTX 4090
    30877 Points -4%
    7680x4320 8k Optimized
    AMD Ryzen 9 7950X3D
    NVIDIA GeForce RTX 4090
    13105 Points +3%
    AMD Ryzen 9 7950X
    NVIDIA GeForce RTX 4090
    13082 Points +3%
    Intel Core i7-13700
    NVIDIA GeForce RTX 4090
    13081 Points +3%
    Intel Core i7-13700K
    NVIDIA GeForce RTX 4090
    13078 Points +3%
    Intel Core i7-12700
    NVIDIA GeForce RTX 4090
    13070 Points +3%
    Intel Core i5-13400
    NVIDIA GeForce RTX 4090
    13011 Points +2%
    Intel Core i9-14900K
    NVIDIA GeForce RTX 4090
    12845 Points +1%
    Intel Core i5-14600K
    NVIDIA GeForce RTX 4090
    12791 Points +1%
    AMD Ryzen 7 7800X3D
    NVIDIA GeForce RTX 4090
    12770 Points 0%
    Intel Core Ultra 5 245K
    NVIDIA GeForce RTX 4090
    12714 Points
    Intel Core Ultra 9 285K
    NVIDIA GeForce RTX 4090
    12705 Points 0%
    AMD Ryzen 5 9600X
    NVIDIA GeForce RTX 4090
    12498 Points -2%
    Unigine Valley 1.0
    1920x1080 Extreme HD DirectX AA:x8
    AMD Ryzen 5 9600X
    NVIDIA GeForce RTX 4090
    324 fps +31%
    Intel Core i9-14900K
    NVIDIA GeForce RTX 4090
    305.2 fps +24%
    Intel Core i5-14600K
    NVIDIA GeForce RTX 4090
    283.4 fps +15%
    AMD Ryzen 9 7950X3D
    NVIDIA GeForce RTX 4090
    277.2 fps +12%
    Intel Core i7-13700K
    NVIDIA GeForce RTX 4090
    273.9 fps +11%
    AMD Ryzen 9 7950X
    NVIDIA GeForce RTX 4090
    270.7 fps +10%
    Intel Core i7-13700
    NVIDIA GeForce RTX 4090
    266.6 fps +8%
    Intel Core Ultra 9 285K
    NVIDIA GeForce RTX 4090
    264 fps +7%
    AMD Ryzen 7 7800X3D
    NVIDIA GeForce RTX 4090
    246.7 fps 0%
    Intel Core Ultra 5 245K
    NVIDIA GeForce RTX 4090
    246.6 fps
    Intel Core i7-12700
    NVIDIA GeForce RTX 4090
    238.4 fps -3%
    Intel Core i5-13400
    NVIDIA GeForce RTX 4090
    226.2 fps -8%
    1920x1080 Extreme HD Preset OpenGL AA:x8
    AMD Ryzen 5 9600X
    NVIDIA GeForce RTX 4090
    331.8 fps +28%
    Intel Core i9-14900K
    NVIDIA GeForce RTX 4090
    322.2 fps +24%
    Intel Core i7-13700K
    NVIDIA GeForce RTX 4090
    305.7 fps +18%
    Intel Core i5-14600K
    NVIDIA GeForce RTX 4090
    303.2 fps +17%
    AMD Ryzen 9 7950X3D
    NVIDIA GeForce RTX 4090
    295.4 fps +14%
    Intel Core i7-13700
    NVIDIA GeForce RTX 4090
    293.1 fps +13%
    AMD Ryzen 9 7950X
    NVIDIA GeForce RTX 4090
    288 fps +11%
    Intel Core Ultra 9 285K
    NVIDIA GeForce RTX 4090
    278.9 fps +7%
    AMD Ryzen 7 7800X3D
    NVIDIA GeForce RTX 4090
    260.9 fps 0%
    Intel Core Ultra 5 245K
    NVIDIA GeForce RTX 4090
    259.8 fps
    Intel Core i7-12700
    NVIDIA GeForce RTX 4090
    258.5 fps -1%
    Intel Core i5-13400
    NVIDIA GeForce RTX 4090
    242.8 fps -7%
    Unigine Heaven 4.0
    Extreme Preset OpenGL
    AMD Ryzen 5 9600X
    NVIDIA GeForce RTX 4090
    472.4 fps +9%
    Intel Core i9-14900K
    NVIDIA GeForce RTX 4090
    465.1 fps +7%
    AMD Ryzen 9 7950X3D
    NVIDIA GeForce RTX 4090
    458.2 fps +6%
    Intel Core i7-13700K
    NVIDIA GeForce RTX 4090
    456.9 fps +5%
    Intel Core i5-14600K
    NVIDIA GeForce RTX 4090
    456.3 fps +5%
    AMD Ryzen 9 7950X
    NVIDIA GeForce RTX 4090
    450.4 fps +4%
    Intel Core i7-13700
    NVIDIA GeForce RTX 4090
    450.4 fps +4%
    Intel Core Ultra 9 285K
    NVIDIA GeForce RTX 4090
    447.7 fps +3%
    AMD Ryzen 7 7800X3D
    NVIDIA GeForce RTX 4090
    442.4 fps +2%
    Intel Core i7-12700
    NVIDIA GeForce RTX 4090
    433.8 fps 0%
    Intel Core Ultra 5 245K
    NVIDIA GeForce RTX 4090
    433.8 fps
    Intel Core i5-13400
    NVIDIA GeForce RTX 4090
    420 fps -3%
    Extreme Preset DX11
    AMD Ryzen 9 7950X3D
    NVIDIA GeForce RTX 4090
    492.5 fps +12%
    AMD Ryzen 9 7950X
    NVIDIA GeForce RTX 4090
    491.5 fps +12%
    Intel Core i9-14900K
    NVIDIA GeForce RTX 4090
    483.7 fps +10%
    AMD Ryzen 5 9600X
    NVIDIA GeForce RTX 4090
    473.9 fps +8%
    Intel Core i7-13700K
    NVIDIA GeForce RTX 4090
    473.8 fps +8%
    Intel Core i5-14600K
    NVIDIA GeForce RTX 4090
    473 fps +7%
    AMD Ryzen 7 7800X3D
    NVIDIA GeForce RTX 4090
    463.8 fps +5%
    Intel Core i7-13700
    NVIDIA GeForce RTX 4090
    462.5 fps +5%
    Intel Core Ultra 9 285K
    NVIDIA GeForce RTX 4090
    462.4 fps +5%
    Intel Core Ultra 5 245K
    NVIDIA GeForce RTX 4090
    440.5 fps
    Intel Core i7-12700
    NVIDIA GeForce RTX 4090
    435.2 fps -1%
    Intel Core i5-13400
    NVIDIA GeForce RTX 4090
    416.6 fps -5%
    ComputeMark v2.1
    1024x600 Normal, Score
    Intel Core i5-14600K
    NVIDIA GeForce RTX 4090
    92397 Points +2%
    AMD Ryzen 5 9600X
    NVIDIA GeForce RTX 4090
    92222 Points +2%
    AMD Ryzen 9 7950X
    NVIDIA GeForce RTX 4090
    92171 Points +2%
    Intel Core i9-14900K
    NVIDIA GeForce RTX 4090
    92026 Points +2%
    Intel Core i7-13700K
    NVIDIA GeForce RTX 4090
    92009 Points +2%
    AMD Ryzen 9 7950X3D
    NVIDIA GeForce RTX 4090
    91838 Points +1%
    Intel Core i7-12700
    NVIDIA GeForce RTX 4090
    91703 Points +1%
    AMD Ryzen 7 7800X3D
    NVIDIA GeForce RTX 4090
    91665 Points +1%
    Intel Core i5-13400
    NVIDIA GeForce RTX 4090
    91659 Points +1%
    Intel Core i7-13700
    NVIDIA GeForce RTX 4090
    91616 Points +1%
    Intel Core Ultra 9 285K
    NVIDIA GeForce RTX 4090
    90932 Points 0%
    Intel Core Ultra 5 245K
    NVIDIA GeForce RTX 4090
    90595 Points
    1024x600 Normal, Fluid 3DTex
    AMD Ryzen 7 7800X3D
    NVIDIA GeForce RTX 4090
    10875 Points +5%
    Intel Core i7-13700K
    NVIDIA GeForce RTX 4090
    10805 Points +4%
    Intel Core i5-14600K
    NVIDIA GeForce RTX 4090
    10797 Points +4%
    AMD Ryzen 9 7950X3D
    NVIDIA GeForce RTX 4090
    10778 Points +4%
    Intel Core i7-13700
    NVIDIA GeForce RTX 4090
    10759 Points +3%
    Intel Core i5-13400
    NVIDIA GeForce RTX 4090
    10756 Points +3%
    AMD Ryzen 5 9600X
    NVIDIA GeForce RTX 4090
    10756 Points +3%
    Intel Core i7-12700
    NVIDIA GeForce RTX 4090
    10749 Points +3%
    AMD Ryzen 9 7950X
    NVIDIA GeForce RTX 4090
    10724 Points +3%
    Intel Core i9-14900K
    NVIDIA GeForce RTX 4090
    10715 Points +3%
    Intel Core Ultra 9 285K
    NVIDIA GeForce RTX 4090
    10584 Points +2%
    Intel Core Ultra 5 245K
    NVIDIA GeForce RTX 4090
    10396 Points
    1024x600 Normal, Fluid 2DTexArr
    AMD Ryzen 5 9600X
    NVIDIA GeForce RTX 4090
    6948 Points +1%
    Intel Core i9-14900K
    NVIDIA GeForce RTX 4090
    6940 Points +1%
    Intel Core i5-14600K
    NVIDIA GeForce RTX 4090
    6920 Points 0%
    Intel Core i7-13700K
    NVIDIA GeForce RTX 4090
    6914 Points 0%
    Intel Core Ultra 9 285K
    NVIDIA GeForce RTX 4090
    6895 Points 0%
    Intel Core Ultra 5 245K
    NVIDIA GeForce RTX 4090
    6892 Points
    AMD Ryzen 9 7950X
    NVIDIA GeForce RTX 4090
    6891 Points 0%
    Intel Core i7-12700
    NVIDIA GeForce RTX 4090
    6891 Points 0%
    Intel Core i7-13700
    NVIDIA GeForce RTX 4090
    6891 Points 0%
    AMD Ryzen 9 7950X3D
    NVIDIA GeForce RTX 4090
    6887 Points 0%
    AMD Ryzen 7 7800X3D
    NVIDIA GeForce RTX 4090
    6887 Points 0%
    Intel Core i5-13400
    NVIDIA GeForce RTX 4090
    6879 Points 0%
    1024x600 Normal, Mandel Vector
    Intel Core i5-14600K
    NVIDIA GeForce RTX 4090
    17355 Points +2%
    AMD Ryzen 9 7950X
    NVIDIA GeForce RTX 4090
    17336 Points +2%
    AMD Ryzen 5 9600X
    NVIDIA GeForce RTX 4090
    17307 Points +1%
    Intel Core i9-14900K
    NVIDIA GeForce RTX 4090
    17302 Points +1%
    AMD Ryzen 9 7950X3D
    NVIDIA GeForce RTX 4090
    17301 Points +1%
    Intel Core i7-13700K
    NVIDIA GeForce RTX 4090
    17250 Points +1%
    Intel Core Ultra 9 285K
    NVIDIA GeForce RTX 4090
    17212 Points +1%
    Intel Core i7-13700
    NVIDIA GeForce RTX 4090
    17207 Points +1%
    Intel Core i7-12700
    NVIDIA GeForce RTX 4090
    17196 Points +1%
    AMD Ryzen 7 7800X3D
    NVIDIA GeForce RTX 4090
    17156 Points 0%
    Intel Core i5-13400
    NVIDIA GeForce RTX 4090
    17154 Points 0%
    Intel Core Ultra 5 245K
    NVIDIA GeForce RTX 4090
    17075 Points
    1024x600 Normal, Mandel Scalar
    Intel Core i5-14600K
    NVIDIA GeForce RTX 4090
    22992 Points +2%
    Intel Core i9-14900K
    NVIDIA GeForce RTX 4090
    22976 Points +2%
    AMD Ryzen 7 7800X3D
    NVIDIA GeForce RTX 4090
    22926 Points +2%
    AMD Ryzen 9 7950X
    NVIDIA GeForce RTX 4090
    22889 Points +2%
    Intel Core i7-13700K
    NVIDIA GeForce RTX 4090
    22862 Points +1%
    AMD Ryzen 5 9600X
    NVIDIA GeForce RTX 4090
    22843 Points +1%
    Intel Core i7-12700
    NVIDIA GeForce RTX 4090
    22834 Points +1%
    AMD Ryzen 9 7950X3D
    NVIDIA GeForce RTX 4090
    22834 Points +1%
    Intel Core i7-13700
    NVIDIA GeForce RTX 4090
    22825 Points +1%
    Intel Core i5-13400
    NVIDIA GeForce RTX 4090
    22813 Points +1%
    Intel Core Ultra 5 245K
    NVIDIA GeForce RTX 4090
    22542 Points
    Intel Core Ultra 9 285K
    NVIDIA GeForce RTX 4090
    22528 Points 0%
    1024x600 Normal, QJuliaRayTrace
    AMD Ryzen 5 9600X
    NVIDIA GeForce RTX 4090
    34367 Points +2%
    Intel Core i5-14600K
    NVIDIA GeForce RTX 4090
    34333 Points +2%
    AMD Ryzen 9 7950X
    NVIDIA GeForce RTX 4090
    34332 Points +2%
    Intel Core i7-13700K
    NVIDIA GeForce RTX 4090
    34178 Points +1%
    Intel Core i9-14900K
    NVIDIA GeForce RTX 4090
    34092 Points +1%
    Intel Core i5-13400
    NVIDIA GeForce RTX 4090
    34057 Points +1%
    AMD Ryzen 9 7950X3D
    NVIDIA GeForce RTX 4090
    34038 Points +1%
    Intel Core i7-12700
    NVIDIA GeForce RTX 4090
    34033 Points +1%
    Intel Core i7-13700
    NVIDIA GeForce RTX 4090
    33935 Points +1%
    AMD Ryzen 7 7800X3D
    NVIDIA GeForce RTX 4090
    33822 Points 0%
    Intel Core Ultra 5 245K
    NVIDIA GeForce RTX 4090
    33724 Points
    Intel Core Ultra 9 285K
    NVIDIA GeForce RTX 4090
    33713 Points 0%

    NPU-Leistung

    Der Intel Core Ultra 5 245K ist mit einer Neural Processing Unit (NPU) ausgestattet, welche als separater Teil des Prozessors KI-Anwendungen besonders effizient berechnen kann. Im Kern handelt es sich um die gleiche NPU, welcher bereits bei den Meteor-Lake-Prozessoren von Laptops und Mini-PCs zum Einsatz kommt. Die Rechenleistung ist mit 13 TOPS angegeben. Dennoch kann der Intel Core Ultra 5 245K mehr Leistung erbringen als die mobilen Ableger aus demselben Haus. Inwiefern die Integration von NPUs in der Zukunft an Gewicht hat, bleibt abzuwarten. Im Leistungsvergleich mit modernen Grafikkarten sind die NPUs der Prozessoren jedoch chancenlos.

    UL Procyon AI Inference for Windows / Overall Score Integer NPU
    Intel Core Ultra 5 245K
    Intel Core Ultra 5 245K, NVIDIA GeForce RTX 4090
    672 Points
    Intel Core Ultra 9 285K
    Intel Core Ultra 9 285K, NVIDIA GeForce RTX 4090
    672 Points 0%
    Intel Core Ultra 5 125H
    Intel Core Ultra 5 125H, Arc 7-Core
    508 Points -24%
    Intel Core Ultra 7 155H
    Intel Core Ultra 7 155H, Arc 8-Core
    504 Points -25%
    Intel Core Ultra 5 125H
    Intel Core Ultra 5 125H, Arc 7-Core
    501 Points -25%
    Intel Core Ultra 7 155H
    Intel Core Ultra 7 155H, Arc 8-Core
    499 Points -26%

    Spiele-Benchmarks

    Die bessere Leistung, welche wir bei den CPU-Benchmarks gesehen haben, kann leider nicht in eine bessere Gaming-Leistung umgemünzt werden. Kurzum: Der Intel Core Ultra 5 245K ist deutlich langsamer als ein Intel Core i5-14600K. Aber der Reihe nach: Die Gaming-Benchmarks haben wir einmal in zwei Bereiche geteilt. Als Grafikkarte wurde immer die Palit GeForce RTX 4090 GameRock OC verwendet.

    Im ersten Vergleich schauen wir uns die Leistung im CPU-Limit an. Hier rangiert unser Testsample nur im hinteren Drittel und duelliert sich mit einem Intel Core i7-12700. Genau 20 Prozent fehlen dem Intel Core Ultra 5 245K im Vergleich zum Intel Core i5-14600K. Das ist ein ernüchterndes Ergebnis, welches wir nicht erwartet hatten. AMDs aktuelles Topmodell im Gaming-Bereich liefert fast 50 Prozent mehr Leistung. Diese Einstellungen sind allerdings nicht repräsentativ und spiegeln nicht den Anwendungsfall im Alltag wider.

    Als Zweites lassen wir alle Prozessoren in 2.160p mit maximalen Details antreten. Alle Vertreter rutschen dichter zusammen, was zu erwarten war, denn nunmehr kommt es auf die Grafikkarte an, womit wir uns dann Richtung GPU-Limit bewegen. Trotzdem schafft es der Intel Core Ultra 5 245K, sich vor dem hausinternen Gegner, dem Intel Core i5-14600K, zu platzieren. Ein Leistungsdefizit von durchschnittlich sieben Prozent bleibt bestehen.

    Leistungsvergleich im CPU-Limit

    Performance Rating - Percent
    AMD Ryzen 7 7800X3D
    99 pt
    AMD Ryzen 9 7950X3D
    91.5 pt
    Intel Core i9-14900K
    90.7 pt
    AMD Ryzen 5 9600X
    87.2 pt
    AMD Ryzen 9 7950X
    85.4 pt
    AMD Ryzen 5 7600X
    83.9 pt
    Intel Core i9-13900K
    83.7 pt
    Intel Core i5-14600K
    79.6 pt
    Intel Core i7-13700K
    77.5 pt
    Intel Core i7-13700
    76.8 pt
    Intel Core Ultra 9 285K
    73.5 pt
    Intel Core Ultra 5 245K
    66.5 pt
    Intel Core i7-12700
    65.9 pt
    Intel Core i5-13400
    57.7 pt
    Intel Core i5-12400F
    56.5 pt
    F1 22 - 1920x1080 Low Preset AA:T AF:16x
    AMD Ryzen 7 7800X3D
    533 (380min, 288P1 - 637max) fps +71%
    AMD Ryzen 9 7950X3D
    475 (338min, 264P1 - 542max) fps +53%
    Intel Core i9-14900K
    462 (309min, 256P1 - 558max) fps +49%
    AMD Ryzen 9 7950X
    443 (278min, 245P1 - 521max) fps +42%
    AMD Ryzen 5 9600X
    439 (256min, 238P1 - 510max) fps +41%
    AMD Ryzen 5 7600X
    417 (281min, 236P1 - 488max) fps +34%
    Intel Core i9-13900K
    401 (265min, 222P1 - 463max) fps +29%
    Intel Core i7-13700K
    380 (280min, 217P1 - 437max) fps +22%
    Intel Core i5-14600K
    379 (280min, 225P1 - 455max) fps +22%
    Intel Core i7-13700
    378 (244min, 212P1 - 430max) fps +22%
    Intel Core Ultra 9 285K
    354 (237min, 199P1 - 414max) fps +14%
    Intel Core i7-12700
    313 (235min, 185P1 - 364max) fps +1%
    Intel Core Ultra 5 245K
    311 (242min, 180P1 - 346max) fps
    Intel Core i5-12400F
    271 (200min, 165P1 - 305max) fps -13%
    Intel Core i5-13400
    249 (197min, 152P1 - 284max) fps -20%
    Far Cry 5 - 1280x720 Low Preset AA:T
    AMD Ryzen 7 7800X3D
    344 (220min - 464max) fps +69%
    AMD Ryzen 9 7950X3D
    299 (201min - 390max) fps +47%
    Intel Core i9-14900K
    280 (214min - 355max) fps +37%
    Intel Core i9-13900K
    270 (203min - 349max) fps +32%
    AMD Ryzen 5 9600X
    263 (201min - 342max) fps +29%
    Intel Core i5-14600K
    255 (199min - 343max) fps +25%
    Intel Core i7-13700K
    242 (183min - 317max) fps +19%
    AMD Ryzen 5 7600X
    241 (180min - 334max) fps +18%
    AMD Ryzen 9 7950X
    238 (182min - 313max) fps +17%
    Intel Core i7-13700
    232 (161min - 306max) fps +14%
    Intel Core Ultra 9 285K
    213 (169min - 274max) fps +4%
    Intel Core i7-12700
    204 (156min - 270max) fps 0%
    Intel Core Ultra 5 245K
    204 (149min - 271max) fps
    Intel Core i5-13400
    185 (144min - 241max) fps -9%
    Intel Core i5-12400F
    173 (124min - 232max) fps -15%
    X-Plane 11.11 - 1280x720 low (fps_test=1)
    Intel Core i9-13900K
    245 fps +90%
    AMD Ryzen 5 9600X
    245 fps +90%
    Intel Core i9-14900K
    244 fps +89%
    Intel Core i5-14600K
    228 fps +77%
    AMD Ryzen 9 7950X3D
    225 fps +74%
    Intel Core i7-13700K
    224 fps +74%
    AMD Ryzen 9 7950X
    223 fps +73%
    AMD Ryzen 7 7800X3D
    219 fps +70%
    Intel Core i7-13700
    218 fps +69%
    AMD Ryzen 5 7600X
    217 fps +68%
    Intel Core i7-12700
    181.4 fps +41%
    Intel Core i5-13400
    155.7 fps +21%
    Intel Core Ultra 9 285K
    143.4 fps +11%
    Intel Core Ultra 5 245K
    129.1 fps
    Intel Core i5-12400F
    113 fps -12%
    Final Fantasy XV Benchmark - 1280x720 Lite Quality
    AMD Ryzen 5 9600X
    237 fps +1%
    Intel Core i9-13900K
    236 fps 0%
    AMD Ryzen 9 7950X
    236 fps 0%
    AMD Ryzen 5 7600X
    236 fps 0%
    Intel Core i7-13700
    236 fps 0%
    Intel Core i7-13700K
    236 fps 0%
    AMD Ryzen 7 7800X3D
    236 fps 0%
    Intel Core i5-14600K
    236 fps 0%
    Intel Core Ultra 9 285K
    236 fps 0%
    Intel Core i9-14900K
    235 fps 0%
    Intel Core Ultra 5 245K
    235 fps
    AMD Ryzen 9 7950X3D
    234 fps 0%
    Intel Core i7-12700
    232 fps -1%
    Intel Core i5-12400F
    217 fps -8%
    Intel Core i5-13400
    217 fps -8%
    Dota 2 Reborn - 1280x720 min (0/3) fastest
    AMD Ryzen 7 7800X3D
    322.9 (268min) fps +51%
    AMD Ryzen 9 7950X3D
    314.1 (261.7min) fps +47%
    AMD Ryzen 9 7950X
    310.6 (261.3min) fps +45%
    Intel Core i9-14900K
    299.9 (248.4min) fps +40%
    Intel Core i9-13900K
    294 (254.9min) fps +38%
    AMD Ryzen 5 9600X
    291 (244.2min) fps +36%
    AMD Ryzen 5 7600X
    278.1 (211.4min) fps +30%
    Intel Core i5-14600K
    261.5 (226.3min) fps +22%
    Intel Core Ultra 9 285K
    252.4 (219.5min) fps +18%
    Intel Core i7-13700K
    251.2 (215.9min) fps +18%
    Intel Core i7-13700
    245 (213.8min) fps +15%
    Intel Core Ultra 5 245K
    213.7 (189.8min) fps
    Intel Core i7-12700
    202.4 (178min) fps -5%
    Intel Core i5-12400F
    182.1 (159.5min) fps -15%
    Intel Core i5-13400
    182.1 (160.5min) fps -15%
    The Witcher 3 - 1024x768 Low Graphics & Postprocessing
    AMD Ryzen 9 7950X3D
    864.7 fps +61%
    AMD Ryzen 7 7800X3D
    858.4 fps +60%
    Intel Core i9-14900K
    829 (31.9min, 380P0.1, 595P1 - 1296max) fps +55%
    AMD Ryzen 9 7950X
    826 (23.6min, 360P0.1, 574P1 - 1357max) fps +54%
    Intel Core i9-13900K
    794 (25.1min, 361P0.1, 581P1 - 1267max) fps +48%
    AMD Ryzen 5 9600X
    762 (66min, 266P0.1, 520P1 - 1355max) fps +42%
    AMD Ryzen 5 7600X
    738 fps +38%
    Intel Core i7-13700K
    687.5 fps +28%
    Intel Core i7-13700
    670.4 fps +25%
    Intel Core Ultra 9 285K
    663 (87.9min, 319P0.1, 454P1 - 1115max) fps +24%
    Intel Core i5-14600K
    632 (29.4min, 209P0.1, 471P1 - 1028max) fps +18%
    Intel Core Ultra 5 245K
    536 (23.7min, 212P0.1, 371P1 - 944max) fps
    Intel Core i7-12700
    522 fps -3%
    Intel Core i5-13400
    451.7 fps -16%
    Intel Core i5-12400F
    414 fps -23%
    GTA V - 1024x768 Lowest Settings possible
    AMD Ryzen 7 7800X3D
    188.5 fps 0%
    AMD Ryzen 9 7950X
    188.2 (5.44min, 200P1 - 724max) fps 0%
    AMD Ryzen 5 9600X
    188.1 (3min, 200P1 - 713max) fps 0%
    AMD Ryzen 9 7950X3D
    188 (3.25min, 200P1 - 705max) fps 0%
    AMD Ryzen 5 7600X
    187.9 (7.22min, 200P1 - 815max) fps 0%
    Intel Core i9-14900K
    187.9 (3.8min, 200P1 - 705max) fps 0%
    Intel Core i9-13900K
    187.8 (2.26min, 200P1 - 688max) fps 0%
    Intel Core i7-13700
    187.7 (5.01min, 200P1 - 613max) fps 0%
    Intel Core i5-14600K
    187.7 (4.67min, 200P1 - 640max) fps 0%
    Intel Core Ultra 5 245K
    187.7 (4.11min, 200P1 - 547max) fps
    Intel Core Ultra 9 285K
    187.7 (4.29min, 200P1 - 567max) fps 0%
    Intel Core i7-13700K
    187.6 (3.74min, 200P1 - 607max) fps 0%
    Intel Core i7-12700
    187.1 (2.4min, 200P1 - 499max) fps 0%
    Intel Core i5-13400
    186.8 (1.87min, 166.7P1 - 445max) fps 0%
    Intel Core i5-12400F
    186.4 (2.09min, 166.7P1 - 413max) fps -1%
    Borderlands 3 - 1280x720 Very Low Overall Quality (DX11)
    AMD Ryzen 7 7800X3D
    310 fps +80%
    AMD Ryzen 9 7950X3D
    308 fps +79%
    Intel Core i9-14900K
    263 fps +53%
    Intel Core i9-13900K
    243 fps +41%
    AMD Ryzen 9 7950X
    242 fps +41%
    Intel Core i5-14600K
    237 fps +38%
    AMD Ryzen 5 7600X
    228 fps +32%
    AMD Ryzen 5 9600X
    228 fps +32%
    Intel Core i7-13700
    222 fps +29%
    Intel Core i7-13700K
    222 fps +29%
    Intel Core Ultra 9 285K
    196.6 fps +14%
    Intel Core i7-12700
    185.6 fps +8%
    Intel Core Ultra 5 245K
    172.1 fps
    Intel Core i5-13400
    169 fps -2%
    Intel Core i5-12400F
    155 fps -10%
    Far Cry New Dawn - 1280x720 Low Preset
    AMD Ryzen 7 7800X3D
    291 (218min - 442max) fps +79%
    AMD Ryzen 9 7950X3D
    255 (145min - 381max) fps +56%
    Intel Core i9-14900K
    235 (156min - 353max) fps +44%
    AMD Ryzen 5 9600X
    226 (163min - 362max) fps +39%
    Intel Core i9-13900K
    222 (150min - 335max) fps +36%
    Intel Core i5-14600K
    216 (168min - 312max) fps +33%
    Intel Core i7-13700
    203 (144min - 297max) fps +25%
    Intel Core i7-13700K
    203 (157min - 304max) fps +25%
    AMD Ryzen 9 7950X
    200 (140min - 302max) fps +23%
    AMD Ryzen 5 7600X
    199 (140min - 316max) fps +22%
    Intel Core Ultra 9 285K
    184 (140min - 275max) fps +13%
    Intel Core i7-12700
    174 (103min - 253max) fps +7%
    Intel Core Ultra 5 245K
    163 (122min - 246max) fps
    Intel Core i5-13400
    159 (110min - 233max) fps -2%
    Intel Core i5-12400F
    147 (102min - 216max) fps -10%
    Shadow of the Tomb Raider - 1280x720 Lowest Preset
    AMD Ryzen 7 7800X3D
    407 fps +65%
    AMD Ryzen 9 7950X3D
    383 fps +56%
    AMD Ryzen 9 7950X
    332 fps +35%
    Intel Core i9-14900K
    332 fps +35%
    AMD Ryzen 5 7600X
    321 fps +30%
    Intel Core i9-13900K
    320 fps +30%
    AMD Ryzen 5 9600X
    319 fps +30%
    Intel Core i5-14600K
    281 fps +14%
    Intel Core i7-13700
    272 fps +11%
    Intel Core i7-13700K
    272 fps +11%
    Intel Core Ultra 9 285K
    263 fps +7%
    Intel Core Ultra 5 245K
    246 fps
    Intel Core i7-12700
    231 fps -6%
    Intel Core i5-13400
    204 fps -17%
    Intel Core i5-12400F
    196.4 fps -20%
    Tiny Tina's Wonderlands - 1920x1080 Low Preset (DX12)
    AMD Ryzen 7 7800X3D
    506 fps +39%
    Intel Core i9-14900K
    502 fps +38%
    AMD Ryzen 9 7950X3D
    477 fps +31%
    Intel Core i5-14600K
    429 fps +18%
    AMD Ryzen 9 7950X
    428 fps +18%
    AMD Ryzen 5 7600X
    415 fps +14%
    AMD Ryzen 5 9600X
    411 fps +13%
    Intel Core Ultra 9 285K
    403 fps +11%
    Intel Core i9-13900K
    398 fps +10%
    Intel Core i7-13700
    378 fps +4%
    Intel Core i7-13700K
    371 fps +2%
    Intel Core Ultra 5 245K
    363 fps
    Intel Core i7-12700
    303 fps -17%
    Intel Core i5-13400
    275 fps -24%
    Intel Core i5-12400F
    258 fps -29%
    Strange Brigade - 1280x720 lowest AF:1
    AMD Ryzen 5 7600X
    780 (275min, 597P1 - 1128max) fps +18%
    Intel Core i9-14900K
    762 (261min, 605P1 - 1027max) fps +15%
    AMD Ryzen 7 7800X3D
    760 (257min, 602P1 - 1084max) fps +15%
    AMD Ryzen 5 9600X
    735 (154.9min, 595P1 - 998max) fps +11%
    Intel Core i5-14600K
    717 (186min, 554P1 - 1036max) fps +8%
    AMD Ryzen 9 7950X
    698 (182.7min, 569P1 - 937max) fps +6%
    Intel Core i9-13900K
    691 (60.2min, 543P1 - 929max) fps +5%
    Intel Core Ultra 9 285K
    681 (43.7min, 531P1 - 898max) fps +3%
    AMD Ryzen 9 7950X3D
    672 (259min, 529P1 - 894max) fps +2%
    Intel Core Ultra 5 245K
    661 (248min, 487P1 - 949max) fps
    Intel Core i7-13700K
    646 (277min, 510P1 - 858max) fps -2%
    Intel Core i7-13700
    626 (284min, 497P1 - 830max) fps -5%
    Intel Core i7-12700
    523 (243min, 410P1 - 698max) fps -21%
    Intel Core i5-12400F
    444 (33.1min, 345P1 - 648max) fps -33%
    Intel Core i5-13400
    408 (153.5min, 319P1 - 565max) fps -38%
    Metro Exodus - 1280x720 Low Quality AF:4x
    AMD Ryzen 7 7800X3D
    374 (214.41min - 571.76max) fps +46%
    AMD Ryzen 5 9600X
    349 (182.25min - 551.57max) fps +36%
    Intel Core i9-14900K
    319 (166.53min - 527.7max) fps +25%
    AMD Ryzen 5 7600X
    309 (157.23min - 500.25max) fps +21%
    AMD Ryzen 9 7950X
    300 (162.95min - 476.42max) fps +17%
    Intel Core i5-14600K
    296 (170.68min - 455.17max) fps +16%
    AMD Ryzen 9 7950X3D
    293 (157.18min - 462.11max) fps +14%
    Intel Core Ultra 9 285K
    276 (133.01min - 479.85max) fps +8%
    Intel Core i7-13700
    268 (127.73min - 445.04max) fps +5%
    Intel Core i9-13900K
    261 (116.81min - 454.13max) fps +2%
    Intel Core i7-13700K
    261 (117.16min - 442.09max) fps +2%
    Intel Core Ultra 5 245K
    256 (135.37min - 427.35max) fps
    Intel Core i7-12700
    233 (124.52min - 364.56max) fps -9%
    Intel Core i5-12400F
    203 (112.65min - 299.76max) fps -21%
    Intel Core i5-13400
    196.9 (110.05min - 286.04max) fps -23%
    F1 2020 - 1280x720 Ultra Low Preset
    AMD Ryzen 7 7800X3D
    681 (531min - 769max) fps +77%
    AMD Ryzen 5 9600X
    630 (468min - 710max) fps +64%
    Intel Core i9-14900K
    598 (473min - 679max) fps +56%
    AMD Ryzen 9 7950X3D
    594 (461min - 653max) fps +55%
    AMD Ryzen 9 7950X
    563 (437min - 628max) fps +47%
    AMD Ryzen 5 7600X
    559 (420min - 634max) fps +46%
    Intel Core i9-13900K
    526 (418min - 596max) fps +37%
    Intel Core i7-13700K
    465 (325min - 539max) fps +21%
    Intel Core i7-13700
    461 (323min - 528max) fps +20%
    Intel Core Ultra 9 285K
    454 (355min - 499max) fps +18%
    Intel Core i5-14600K
    403 (333min - 436max) fps +5%
    Intel Core i7-12700
    388 (314min - 434max) fps +1%
    Intel Core Ultra 5 245K
    384 (313min - 422max) fps
    Intel Core i5-12400F
    322 (266min - 345max) fps -16%
    Intel Core i5-13400
    292 (253min - 317max) fps -24%
    F1 2021 - 1280x720 Ultra Low Preset
    AMD Ryzen 7 7800X3D
    830 (632min, 515P1 - 919max) fps +115%
    Intel Core i9-14900K
    733 (560min, 450P1 - 806max) fps +90%
    AMD Ryzen 5 7600X
    690 (453min, 397P1 - 783max) fps +79%
    AMD Ryzen 9 7950X3D
    682 (522min, 418P1 - 767max) fps +77%
    AMD Ryzen 9 7950X
    677 (504min, 418P1 - 754max) fps +75%
    AMD Ryzen 5 9600X
    669 (451min, 412P1 - 741max) fps +73%
    Intel Core i9-13900K
    599 (469min, 379P1 - 653max) fps +55%
    Intel Core i7-13700K
    588 (466min, 371P1 - 639max) fps +52%
    Intel Core i7-13700
    572 (447min, 359P1 - 620max) fps +48%
    Intel Core i5-14600K
    562 (468min, 364P1 - 618max) fps +46%
    Intel Core Ultra 9 285K
    527 (401min, 329P1 - 583max) fps +37%
    Intel Core i7-12700
    448 (363min, 297P1 - 477max) fps +16%
    Intel Core i5-12400F
    393 (309min, 274P1 - 416max) fps +2%
    Intel Core Ultra 5 245K
    386 (318min, 250P1 - 422max) fps
    Intel Core i5-13400
    337 (277min, 237P1 - 358max) fps -13%

    Leistungsvergleich im GPU-Limit

    Performance Rating - Percent
    AMD Ryzen 7 7800X3D
    98.7 pt
    AMD Ryzen 9 7950X3D
    97 pt
    Intel Core i9-14900K
    96.6 pt
    Intel Core i5-14600K
    94.6 pt
    AMD Ryzen 9 7950X
    94 pt
    AMD Ryzen 5 9600X
    93.8 pt
    AMD Ryzen 5 7600X
    93.6 pt
    Intel Core i9-13900K
    93.4 pt
    Intel Core i7-13700K
    92.6 pt
    Intel Core i7-13700
    91.9 pt
    Intel Core Ultra 9 285K
    90.5 pt
    Intel Core Ultra 5 245K
    88 pt
    Intel Core i7-12700
    87.6 pt
    Intel Core i5-13400
    83.3 pt
    Intel Core i5-12400F
    80.7 pt
    F1 22 - 3840x2160 Ultra High Preset AA:T AF:16x
    Intel Core Ultra 9 285K
    86.2 (74min, 70P1 - 101max) fps +1%
    Intel Core Ultra 5 245K
    85.5 (74min, 69P1 - 98max) fps
    AMD Ryzen 5 9600X
    85 (73min, 72P1 - 99max) fps -1%
    AMD Ryzen 7 7800X3D
    84.5 (72min, 71P1 - 97max) fps -1%
    Intel Core i5-14600K
    83.5 (72min, 71P1 - 96max) fps -2%
    Intel Core i9-14900K
    83.4 (72min, 71P1 - 96max) fps -2%
    AMD Ryzen 5 7600X
    83 (72min, 71P1 - 95max) fps -3%
    AMD Ryzen 9 7950X
    82.5 (72min, 71P1 - 96max) fps -4%
    Intel Core i7-13700K
    82.4 (72min, 71P1 - 95max) fps -4%
    AMD Ryzen 9 7950X3D
    82.3 (71min, 70P1 - 94max) fps -4%
    Intel Core i5-12400F
    81.7 (71min, 70P1 - 95max) fps -4%
    Intel Core i7-13700
    81.6 (71min, 70P1 - 93max) fps -5%
    Intel Core i7-12700
    81.3 (71min, 68P1 - 93max) fps -5%
    Intel Core i5-13400
    81.2 (72min, 67P1 - 93max) fps -5%
    Intel Core i9-13900K
    81.1 (71min, 70P1 - 93max) fps -5%
    Far Cry 5 - 3840x2160 Ultra Preset AA:T
    AMD Ryzen 7 7800X3D
    187 (166min - 215max) fps +22%
    Intel Core i9-14900K
    187 (168min - 216max) fps +22%
    Intel Core i9-13900K
    182 (148min - 212max) fps +19%
    AMD Ryzen 9 7950X3D
    182 (157min - 212max) fps +19%
    Intel Core i5-14600K
    181 (151min - 215max) fps +18%
    AMD Ryzen 9 7950X
    175 (140min - 212max) fps +14%
    AMD Ryzen 5 7600X
    173 (142min - 209max) fps +13%
    Intel Core i7-13700K
    172 (137min - 206max) fps +12%
    Intel Core i7-13700
    171 (140min - 207max) fps +12%
    AMD Ryzen 5 9600X
    170 (136min - 198max) fps +11%
    Intel Core Ultra 9 285K
    158 (125min - 209max) fps +3%
    Intel Core i7-12700
    153 (117min - 203max) fps 0%
    Intel Core Ultra 5 245K
    153 (117min - 210max) fps
    Intel Core i5-13400
    142 (108min - 190max) fps -7%
    Intel Core i5-12400F
    131 (97min - 177max) fps -14%
    X-Plane 11.11 - 3840x2160 high (fps_test=3)
    AMD Ryzen 7 7800X3D
    160.5 fps +72%
    AMD Ryzen 9 7950X3D
    158.4 fps +70%
    AMD Ryzen 5 9600X
    136.6 fps +46%
    Intel Core i9-14900K
    136.3 fps +46%
    Intel Core i9-13900K
    132.3 fps +42%
    AMD Ryzen 5 7600X
    125.8 fps +35%
    Intel Core i5-14600K
    124.6 fps +33%
    AMD Ryzen 9 7950X
    124.5 fps +33%
    Intel Core i7-13700K
    121.8 fps +30%
    Intel Core i7-13700
    119.3 fps +28%
    Intel Core Ultra 9 285K
    105.8 fps +13%
    Intel Core i7-12700
    105.4 fps +13%
    Intel Core i5-13400
    95 fps +2%
    Intel Core Ultra 5 245K
    93.4 fps
    Intel Core i5-12400F
    77 fps -18%
    Final Fantasy XV Benchmark - 3840x2160 High Quality
    Intel Core Ultra 5 245K
    162.3 fps
    Intel Core i9-14900K
    161.9 fps 0%
    Intel Core Ultra 9 285K
    161.7 fps 0%
    Intel Core i5-14600K
    161.5 fps 0%
    Intel Core i9-13900K
    161.3 fps -1%
    AMD Ryzen 9 7950X
    161.1 fps -1%
    AMD Ryzen 5 7600X
    159.2 fps -2%
    AMD Ryzen 7 7800X3D
    158.2 fps -3%
    Intel Core i7-13700
    157.9 fps -3%
    AMD Ryzen 9 7950X3D
    157.6 fps -3%
    Intel Core i7-13700K
    155.9 fps -4%
    Intel Core i7-12700
    153.4 fps -5%
    Intel Core i5-12400F
    151.9 fps -6%
    AMD Ryzen 5 9600X
    150.9 fps -7%
    Intel Core i5-13400
    149.8 fps -8%
    Dota 2 Reborn - 3840x2160 ultra (3/3) best looking
    AMD Ryzen 7 7800X3D
    258.2 (201.3min) fps +54%
    AMD Ryzen 9 7950X3D
    245.4 (195.9min) fps +46%
    AMD Ryzen 9 7950X
    234.4 (192.2min) fps +40%
    Intel Core i9-13900K
    230 (185.3min) fps +37%
    Intel Core i9-14900K
    227.8 (188.3min) fps +36%
    AMD Ryzen 5 9600X
    225 (189.1min) fps +34%
    AMD Ryzen 5 7600X
    223.4 (185.4min) fps +33%
    Intel Core i5-14600K
    211.5 (179.5min) fps +26%
    Intel Core i7-13700K
    200.2 (165.5min) fps +19%
    Intel Core i7-13700
    196.8 (166.7min) fps +17%
    Intel Core Ultra 9 285K
    193.6 (162.4min) fps +15%
    Intel Core Ultra 5 245K
    168 (143.3min) fps
    Intel Core i7-12700
    163.7 (141.2min) fps -3%
    Intel Core i5-12400F
    150.3 (129.4min) fps -11%
    Intel Core i5-13400
    149.8 (129.3min) fps -11%
    The Witcher 3 - 3840x2160 High Graphics & Postprocessing (Nvidia HairWorks Off)
    AMD Ryzen 5 7600X
    294 fps +4%
    Intel Core i9-14900K
    293 (121.6min, 193.2P0.1, 243P1 - 865max) fps +3%
    Intel Core i5-14600K
    288 (85.6min, 166.1P0.1, 233P1 - 721max) fps +1%
    Intel Core Ultra 9 285K
    286 (152.2min, 226P0.1, 257P1 - 596max) fps +1%
    AMD Ryzen 9 7950X
    284 (88.3min, 166.6P0.1, 240P1 - 831max) fps 0%
    Intel Core Ultra 5 245K
    284 (132.6min, 215P0.1, 256P1 - 516max) fps
    Intel Core i5-13400
    282.2 fps -1%
    Intel Core i7-13700
    282.1 fps -1%
    Intel Core i7-12700
    282 fps -1%
    AMD Ryzen 7 7800X3D
    281 fps -1%
    Intel Core i7-13700K
    278.9 fps -2%
    AMD Ryzen 5 9600X
    277 (20.2min, 154.7P0.1, 219P1 - 925max) fps -2%
    AMD Ryzen 9 7950X3D
    275.2 fps -3%
    Intel Core i5-12400F
    254 fps -11%
    Intel Core i9-13900K
    239 (103.3min, 154P0.1, 203P1 - 639max) fps -16%
    GTA V - 3840x2160 High/On (Advanced Graphics Off) AA:FX AF:8x
    AMD Ryzen 7 7800X3D
    188 (2.69min, 200P1 - 698max) fps +2%
    AMD Ryzen 5 9600X
    187.7 (4.85min, 200P1 - 597max) fps +2%
    Intel Core i9-14900K
    187.6 (4.19min, 200P1 - 613max) fps +2%
    Intel Core i9-13900K
    187.5 (3.71min, 200P1 - 553max) fps +2%
    AMD Ryzen 9 7950X
    187.5 (2.97min, 200P1 - 593max) fps +2%
    Intel Core i7-13700K
    187.5 (6.22min, 200P1 - 502max) fps +2%
    Intel Core i5-14600K
    187.4 (5.2min, 200P1 - 502max) fps +2%
    Intel Core i7-13700
    187.2 (1.451min, 200P1 - 464max) fps +2%
    AMD Ryzen 5 7600X
    186.5 (2.19min, 166.7P1 - 524max) fps +2%
    AMD Ryzen 9 7950X3D
    186.5 (2.67min, 166.7P1 - 575max) fps +2%
    Intel Core Ultra 9 285K
    186 (2.01min, 166.7P1 - 464max) fps +1%
    Intel Core Ultra 5 245K
    183.7 (2.01min, 125P1 - 443max) fps
    Intel Core i7-12700
    182 (2.29min, 142.9P1 - 460max) fps -1%
    Intel Core i5-13400
    178.2 (2.26min, 125P1 - 359max) fps -3%
    Intel Core i5-12400F
    175.6 (3.48min, 125P1 - 323max) fps -4%
    Borderlands 3 - 3840x2160 Badass Overall Quality (DX11)
    Intel Core i7-13700K
    143.4 fps +16%
    Intel Core i9-14900K
    137.9 fps +11%
    AMD Ryzen 7 7800X3D
    137.4 fps +11%
    AMD Ryzen 9 7950X3D
    136.4 fps +10%
    Intel Core i5-14600K
    136.1 fps +10%
    Intel Core i9-13900K
    135.5 fps +9%
    AMD Ryzen 9 7950X
    135 fps +9%
    AMD Ryzen 5 7600X
    133.4 fps +8%
    Intel Core i7-13700
    132.4 fps +7%
    AMD Ryzen 5 9600X
    131.8 fps +6%
    Intel Core Ultra 9 285K
    128.6 fps +4%
    Intel Core i7-12700
    125.5 fps +1%
    Intel Core Ultra 5 245K
    124 fps
    Intel Core i5-13400
    120.5 fps -3%
    Intel Core i5-12400F
    114.4 fps -8%
    Far Cry New Dawn - 3840x2160 Ultra Preset
    AMD Ryzen 7 7800X3D
    180 (147min - 219max) fps +50%
    AMD Ryzen 9 7950X3D
    171 (130min - 219max) fps +43%
    Intel Core i9-14900K
    161 (122min - 221max) fps +34%
    Intel Core i9-13900K
    154 (113min - 219max) fps +28%
    Intel Core i5-14600K
    153 (115min - 219max) fps +28%
    AMD Ryzen 5 9600X
    148 (110min - 200max) fps +23%
    AMD Ryzen 9 7950X
    145 (104min - 215max) fps +21%
    Intel Core i7-13700
    145 (106min - 212max) fps +21%
    Intel Core i7-13700K
    145 (109min - 213max) fps +21%
    AMD Ryzen 5 7600X
    142 (99min - 212max) fps +18%
    Intel Core Ultra 9 285K
    130 (90min - 200max) fps +8%
    Intel Core i7-12700
    127 (92min - 198max) fps +6%
    Intel Core Ultra 5 245K
    120 (85min - 198max) fps
    Intel Core i5-13400
    119 (88min - 182max) fps -1%
    Intel Core i5-12400F
    110 (79min - 170max) fps -8%
    Tiny Tina's Wonderlands - 3840x2160 Badass Preset (DX12)
    Intel Core Ultra 5 245K
    132.6 fps
    Intel Core Ultra 9 285K
    132.6 fps 0%
    Intel Core i9-14900K
    131.7 fps -1%
    AMD Ryzen 9 7950X3D
    131.3 fps -1%
    AMD Ryzen 5 7600X
    130.6 fps -2%
    Intel Core i5-14600K
    130.4 fps -2%
    AMD Ryzen 9 7950X
    130.3 fps -2%
    Intel Core i7-13700
    130.2 fps -2%
    AMD Ryzen 5 9600X
    130 fps -2%
    Intel Core i9-13900K
    129.8 fps -2%
    AMD Ryzen 7 7800X3D
    129.8 fps -2%
    Intel Core i7-12700
    129.7 fps -2%
    Intel Core i5-13400
    129.7 fps -2%
    Intel Core i7-13700K
    129.6 fps -2%
    Intel Core i5-12400F
    114.2 fps -14%
    Strange Brigade - 3840x2160 ultra AA:ultra AF:16
    Intel Core i9-14900K
    291 (120min, 249P1 - 467max) fps +2%
    AMD Ryzen 7 7800X3D
    289 (119.3min, 246P1 - 463max) fps +1%
    Intel Core i5-14600K
    289 (243min, 249P1 - 426max) fps +1%
    Intel Core Ultra 9 285K
    288 (214min, 245P1 - 410max) fps +1%
    AMD Ryzen 5 9600X
    286 (37.1min, 244P1 - 520max) fps 0%
    Intel Core i7-13700K
    285 (59.9min, 241P1 - 552max) fps 0%
    AMD Ryzen 9 7950X3D
    285 (53.2min, 243P1 - 469max) fps 0%
    Intel Core Ultra 5 245K
    285 (195.3min, 242P1 - 410max) fps
    Intel Core i7-12700
    284 (44.1min, 236P1 - 407max) fps 0%
    AMD Ryzen 5 7600X
    283 (39.7min, 242P1 - 668max) fps -1%
    Intel Core i7-13700
    282 (28.1min, 238P1 - 533max) fps -1%
    AMD Ryzen 9 7950X
    281 (31.7min, 239P1 - 482max) fps -1%
    Intel Core i5-12400F
    281 (59.7min, 240P1 - 421max) fps -1%
    Intel Core i9-13900K
    279 (59.9min, 239P1 - 532max) fps -2%
    Intel Core i5-13400
    278 (59.8min, 227P1 - 408max) fps -2%
    Metro Exodus - 3840x2160 Ultra Quality AF:16x
    Intel Core i9-14900K
    143.4 (84.04min - 227.17max) fps +6%
    Intel Core i5-14600K
    142.1 (81.45min - 230.73max) fps +5%
    AMD Ryzen 7 7800X3D
    141.6 (85.41min - 213.31max) fps +5%
    AMD Ryzen 9 7950X
    139.7 (76.95min - 229.15max) fps +4%
    AMD Ryzen 9 7950X3D
    139.4 (76.47min - 227.32max) fps +3%
    Intel Core i9-13900K
    138.6 (76.78min - 237.3max) fps +3%
    AMD Ryzen 5 9600X
    138 (71.03min - 235.4max) fps +2%
    AMD Ryzen 5 7600X
    137 (71.99min - 228.62max) fps +2%
    Intel Core i7-13700
    136.9 (71.43min - 234.36max) fps +2%
    Intel Core i7-13700K
    136.9 (72.87min - 233.59max) fps +2%
    Intel Core Ultra 5 245K
    134.7 (69.85min - 225.07max) fps
    Intel Core Ultra 9 285K
    134 (68.14min - 237.76max) fps -1%
    Intel Core i7-12700
    132.4 (68.05min - 211.86max) fps -2%
    Intel Core i5-13400
    126.7 (68.66min - 196.97max) fps -6%
    Intel Core i5-12400F
    124.1 (74min - 188.01max) fps -8%
    F1 2020 - 3840x2160 Ultra High Preset AA:T AF:16x
    Intel Core i9-14900K
    289 (237min - 340max) fps +7%
    AMD Ryzen 9 7950X3D
    288 (242min - 339max) fps +7%
    AMD Ryzen 7 7800X3D
    288 (242min - 333max) fps +7%
    Intel Core i5-14600K
    288 (242min - 338max) fps +7%
    AMD Ryzen 5 9600X
    287 (243min - 337max) fps +6%
    AMD Ryzen 9 7950X
    286 (245min - 335max) fps +6%
    Intel Core i9-13900K
    285 (240min - 333max) fps +6%
    AMD Ryzen 5 7600X
    285 (241min - 333max) fps +6%
    Intel Core i7-13700K
    284 (242min - 329max) fps +5%
    Intel Core i7-13700
    283 (240min - 332max) fps +5%
    Intel Core i7-12700
    275 (197min - 319max) fps +2%
    Intel Core Ultra 9 285K
    273 (236min - 319max) fps +1%
    Intel Core Ultra 5 245K
    270 (233min - 318max) fps
    Intel Core i5-12400F
    247 (202min - 285max) fps -9%
    Intel Core i5-13400
    229 (184min - 265max) fps -15%
    F1 2021 - 3840x2160 Ultra High Preset + Raytracing AA:T AF:16x
    AMD Ryzen 7 7800X3D
    207 (179min, 176P1 - 230max) fps +5%
    AMD Ryzen 5 9600X
    205 (176min, 168P1 - 232max) fps +4%
    AMD Ryzen 5 7600X
    203 (173min, 170P1 - 228max) fps +3%
    AMD Ryzen 9 7950X3D
    203 (169min, 169P1 - 225max) fps +3%
    Intel Core i9-14900K
    203 (173min, 165P1 - 226max) fps +3%
    Intel Core i5-14600K
    201 (173min, 153P1 - 227max) fps +2%
    Intel Core Ultra 9 285K
    200 (168min, 137P1 - 218max) fps +2%
    AMD Ryzen 9 7950X
    199.1 (168min, 166P1 - 223max) fps +1%
    Intel Core i7-13700K
    197.5 (169min, 158P1 - 222max) fps 0%
    Intel Core Ultra 5 245K
    196.9 (171min, 139P1 - 211max) fps
    Intel Core i7-13700
    196.8 (166min, 156P1 - 217max) fps 0%
    Intel Core i9-13900K
    196.5 (166min, 152P1 - 220max) fps 0%
    Intel Core i7-12700
    193.1 (162min, 137P1 - 211max) fps -2%
    Intel Core i5-12400F
    185 (153min, 132P1 - 197max) fps -6%
    Intel Core i5-13400
    176.2 (144min, 127P1 - 189max) fps -11%

    Intel Core Ultra 5 245K mit Nvidia GeForce RTX 4090

    min.mittelhochmax.QHD4K
    GTA V (2015) 187.7 187.4 186 149.8 151.7 183.7
    The Witcher 3 (2015) 536 485 461 308 273 284
    Dota 2 Reborn (2015) 213.7 192.2 185.3 172.9 168
    Final Fantasy XV Benchmark (2018) 235 235 219 214 162.3
    X-Plane 11.11 (2018) 129.1 114.5 98.2 93.4
    Far Cry 5 (2018) 204 177 169 156 155 153
    Strange Brigade (2018) 661 503 498 491 479 285
    Shadow of the Tomb Raider (2018) 246 235 232 233 229 186.6
    Far Cry New Dawn (2019) 163 141 136 123 122 120
    Metro Exodus (2019) 256 233 203 175.4 169 134.7
    Total War: Three Kingdoms (2019) 471.8 317.1 263.6 232.3 199 104.7
    Borderlands 3 (2019) 172.1 157.5 146.1 138.8 140.9 124
    F1 2020 (2020) 384 333 333 314 311 270
    F1 2021 (2021) 386 362 316 203 201 196.9
    Far Cry 6 (2021) 181.7 156.3 139.9 143.5 137.3 126.5
    God of War (2022) 227 227 223 206 181.6 127.2
    Tiny Tina's Wonderlands (2022) 363 308 273 260 226 132.6
    F1 22 (2022) 311 302 282 161 152.1 85.5
    The Witcher 3 v4.00 (2023) 273 233 219 204 205 171.9
    Dead Space Remake (2023) 215 213 207 203 176.4 97.2
    Returnal (2023) 202 202 192 187 173 114
    F1 23 (2023) 288 290 276 160.7 148 80
    Baldur's Gate 3 (2023) 254 238 218 223 206 135.3
    Cyberpunk 2077 2.1 Phantom Liberty (2023) 190.4 190.9 175.6 164.1 151 74.7
    Assassin's Creed Mirage (2023) 267 259 253 183 179 128
    Total War Pharaoh (2023) 399.7 235.8 197.1 159.4 157.2 147.4
    Avatar Frontiers of Pandora (2023) 238 225 201 166 121 69
    F1 24 (2024) 302 321 301 173.4 144.2 79.1

    Energiebedarf

    Beim Energiebedarf hat Intel einen großen Schritt nach vorn gemacht. Der Intel Core Ultra 5 245K konnte in der Mittelklasse mit einer besseren CPU-Leistung überzeugen, und obendrein sehen wir, dass deutlich weniger Energie benötigt wird. AMD zeigt aber, dass es noch besser gehen kann. Die ausufernde Leistungsaufnahme der vorherigen CPU-Generationen sehen wir beim Intel Core Ultra 5 245K nicht. Das Power-Limit beträgt 159 Watt und ist als PL1 und PL2 gesetzt, womit die CPU auch bei anhaltender Last die maximale Leistung abrufen kann. Mitunter wird der Grenzwert gelegentlich auch überschritten, wie man anhand der Grafik entnehmen kann. Im Test sehen wir gelegentliche Spitzen von bis zu 173 Watt. Die für einen Intel Prozessor moderate Leistungsaufnahme unter Volllast lässt sich gut kühlen und erfordert beim Intel Core Ultra 5 245K keine extremen Kühleinheiten. Ein Kühler, der mit einer TDP-Angabe von 200 Watt versehen ist, sollte in den meisten Fällen ausreichen, um den Intel Core Ultra 5 245K im Zaum zu halten.

    Bei den Temperaturen bewegen wir uns immer im grünen Bereich. Werden alle Limits im BIOS deaktiviert, steigt die Leistungsaufnahme des Prozessors jedoch nicht spürbar an. Auch die Temperaturen bewegen sich auf ähnlichem Niveau wie bei aktivierten Intel Default Settings, welche als Grundlage für unsere Leistungstests dienen. Aufgrund der deutlich geringen Leistungsaufnahme kann der Intel Core Ultra 5 245K in der Effizienzübersicht einen großen Vorsprung zum Intel Core i5-14600K erzielen.

    Stromverbrauch Testsystem - Leerlauf
    Stromverbrauch Testsystem - Leerlauf
    Stromverbrauch Testsystem - Cinebench-R15-nT
    Stromverbrauch Testsystem - Cinebench-R15-nT
    Stromverbrauch Testsystem - Cinebench-R23-nT
    Stromverbrauch Testsystem - Cinebench-R23-nT
    Stromverbrauch Testsystem - Cinebench-R23-1T
    Stromverbrauch Testsystem - Cinebench-R23-1T
    Stromverbrauch Testsystem - Spielen (The Witcher 3, Ultra-Preset)
    Stromverbrauch Testsystem - Spielen (The Witcher 3, Ultra-Preset)
    Stromverbrauch Testsystem - Stresstest Prime95
    Stromverbrauch Testsystem - Stresstest Prime95
    Stresstest - Prime95
    Stresstest - Prime95
     

    Effizienzübersicht

    Performance Rating
    Ryzen 7 9700X
    93.5 pt
    Ryzen 9 9950X
    93.4 pt
    Core Ultra 9 285K
    92 pt
    Core Ultra 5 245K
    85.8 pt
    R9 7950X
    78.3 pt
    Ryzen 5 9600X
    67.5 pt
    i9-14900K
    65.2 pt
    R7 7800X3D
    62.8 pt
    i5-14600K
    60.7 pt
    Power Consumption / Cinebench R23 Single Power Efficiency - external Monitor
    Ryzen 7 9700X
    19.7 Points per Watt +6%
    Core Ultra 9 285K
    19.5 Points per Watt +5%
    Core Ultra 5 245K
    18.6 Points per Watt
    Ryzen 9 9950X
    15.8 Points per Watt -15%
    i9-14900K
    15.51 Points per Watt -17%
    Ryzen 5 9600X
    15.2 Points per Watt -18%
    i5-14600K
    13.8 Points per Watt -26%
    R9 7950X
    13.1 Points per Watt -30%
    R7 7800X3D
    9.54 Points per Watt -49%
    Power Consumption / Cinebench R23 Multi Power Efficiency - external Monitor
    Ryzen 9 9950X
    129.5 Points per Watt +18%
    Core Ultra 9 285K
    119.8 Points per Watt +9%
    Ryzen 7 9700X
    116.9 Points per Watt +6%
    Core Ultra 5 245K
    109.9 Points per Watt
    R9 7950X
    108.4 Points per Watt -1%
    R7 7800X3D
    89.1 Points per Watt -19%
    Ryzen 5 9600X
    82.2 Points per Watt -25%
    i9-14900K
    77.57 Points per Watt -29%
    i5-14600K
    73.8 Points per Watt -33%
    Power Consumption / Cinebench R15 Multi Efficiency (external Monitor)
    Ryzen 9 9950X
    20.2 Points per Watt +28%
    Ryzen 7 9700X
    18.2 Points per Watt +15%
    R9 7950X
    17.1 Points per Watt +8%
    Core Ultra 9 285K
    17.1 Points per Watt +8%
    Core Ultra 5 245K
    15.8 Points per Watt
    R7 7800X3D
    14.4 Points per Watt -9%
    Ryzen 5 9600X
    12.5 Points per Watt -21%
    i9-14900K
    11.5 Points per Watt -27%
    i5-14600K
    11.1 Points per Watt -30%
    Power Consumption / Cinebench R15 Multi (external Monitor)
    Intel Core i9-14900K
    548 (545min, 545P1 - 551max) Watt * -125%
    Intel Core Ultra 9 285K
    373 (360min, 360P1 - 402max) Watt * -53%
    Intel Core i7-13700
    365 (363min, 363P1 - 367max) Watt * -50%
    Intel Core i7-13700K
    357 (356min, 356P1 - 362max) Watt * -46%
    Intel Core i5-14600K
    329 (323min, 324P1 - 331max) Watt * -35%
    Intel Core i7-12700
    284 (282min, 282P1 - 287max) Watt * -16%
    AMD Ryzen 9 7950X3D
    273 (264min, 264P1 - 304max) Watt * -12%
    Intel Core Ultra 5 245K
    244 (242min, 242P1 - 246max) Watt *
    AMD Ryzen 5 7600X
    215 (134.8min, 135.6P1 - 259max) Watt * +12%
    AMD Ryzen 5 9600X
    210 (209min, 209P1 - 210max) Watt * +14%
    AMD Ryzen 7 7800X3D
    207 (203min, 203P1 - 216max) Watt * +15%
    Intel Core i5-13400
    196.6 (194.6min, 194.6P1 - 207max) Watt * +19%
    Intel Core i5-12400F
    194.4 (192.3min, 192.3P1 - 200max) Watt * +20%
    Power Consumption / Prime95 V2810 Stress (external Monitor)
    Intel Core i9-14900K
    537 (508min, 510P1 - 606max) Watt * -104%
    Intel Core i7-13700
    386 (363min, 364P1 - 487max) Watt * -47%
    Intel Core Ultra 9 285K
    382 (374min, 376P1 - 392max) Watt * -45%
    Intel Core i5-14600K
    370 (349min, 349P1 - 422max) Watt * -41%
    Intel Core i7-13700K
    357 (341min, 342P1 - 458max) Watt * -36%
    Intel Core i7-12700
    327 (304min, 305P1 - 394max) Watt * -24%
    AMD Ryzen 9 7950X3D
    276 (267min, 267P1 - 329max) Watt * -5%
    Intel Core Ultra 5 245K
    263 (256min, 256P1 - 271max) Watt *
    Intel Core i5-12400F
    239 (225min, 226P1 - 252max) Watt * +9%
    Intel Core i5-13400
    229 (224min, 224P1 - 247max) Watt * +13%
    AMD Ryzen 5 7600X
    227 (218min, 219P1 - 245max) Watt * +14%
    AMD Ryzen 7 7800X3D
    218 (214min, 215P1 - 223max) Watt * +17%
    AMD Ryzen 5 9600X
    213 (207min, 208P1 - 220max) Watt * +19%

    * ... kleinere Werte sind besser
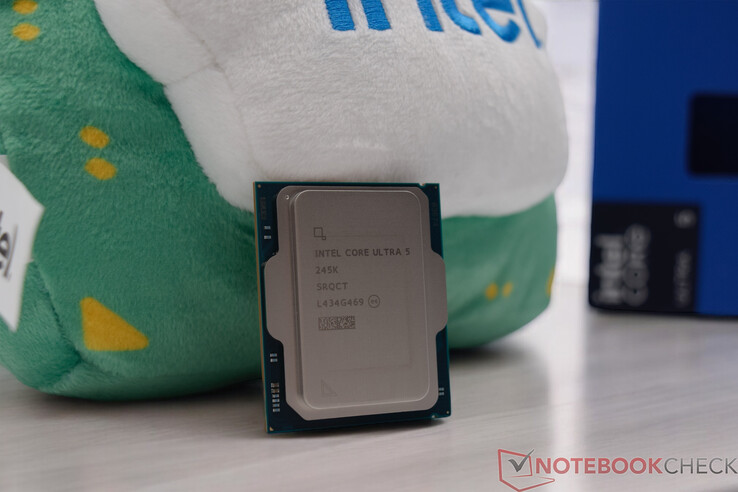
    Energieaufnahme mit externem Monitor

    0306090120150180210240270300330360390420450480510540570Tooltip
    Intel Core Ultra 5 245K Core Ultra 5 245K, NVIDIA GeForce RTX 4090; Prime95 V2810 Stress (external Monitor): Ø263 (256-271)
    Intel Core Ultra 9 285K Core Ultra 9 285K, NVIDIA GeForce RTX 4090; Prime95 V2810 Stress (external Monitor): Ø382 (374-392)
    Intel Core Ultra 5 245K Core Ultra 5 245K, NVIDIA GeForce RTX 4090; Cinebench R15 Multi (external Monitor): Ø244 (242-246)
    Intel Core Ultra 9 285K Core Ultra 9 285K, NVIDIA GeForce RTX 4090; Cinebench R15 Multi (external Monitor): Ø373 (360-402)
    Intel Core Ultra 5 245K Core Ultra 5 245K, NVIDIA GeForce RTX 4090; Cinebench R23 Single (external Monitor): Ø114.4 (109.6-170.5)
    Intel Core Ultra 9 285K Core Ultra 9 285K, NVIDIA GeForce RTX 4090; Cinebench R23 Single (external Monitor): Ø120 (114.3-180.3)
    Intel Core Ultra 5 245K Core Ultra 5 245K, NVIDIA GeForce RTX 4090; Cinebench R23 Multi (external Monitor): Ø228 (225-232)
    Intel Core Ultra 9 285K Core Ultra 9 285K, NVIDIA GeForce RTX 4090; Cinebench R23 Multi (external Monitor): Ø355 (352-359)
    Intel Core Ultra 5 245K Core Ultra 5 245K, NVIDIA GeForce RTX 4090; 1280x720 FurMark 1.19 GPU Stress Test (external Monitor): Ø552 (534-578)
    Intel Core Ultra 9 285K Core Ultra 9 285K, NVIDIA GeForce RTX 4090; 1280x720 FurMark 1.19 GPU Stress Test (external Monitor): Ø557 (538-585)

    Energieaufnahme mit externem Monitor

    0306090120150180210240270300330360390420450480510Tooltip
    Intel Core Ultra 5 245K Core Ultra 5 245K, NVIDIA GeForce RTX 4090; Idle 1min (external Monitor): Ø93.8 (91.9-96.8)
    Intel Core Ultra 9 285K Core Ultra 9 285K, NVIDIA GeForce RTX 4090; Idle 1min (external Monitor): Ø95.7 (91.8-102.2)
    Intel Core Ultra 5 245K Core Ultra 5 245K, NVIDIA GeForce RTX 4090; Cyberpunk 2077 FHD ultra no FSR - external Monitor: Ø425 (411-433)
    Intel Core Ultra 9 285K Core Ultra 9 285K, NVIDIA GeForce RTX 4090; Cyberpunk 2077 FHD ultra no FSR - external Monitor: Ø439 (432-447)
    Intel Core Ultra 5 245K Core Ultra 5 245K, NVIDIA GeForce RTX 4090; 1920x1080 The Witcher 3 ultra (external Monitor): Ø492 (455-506)
    Intel Core Ultra 9 285K Core Ultra 9 285K, NVIDIA GeForce RTX 4090; 1920x1080 The Witcher 3 ultra (external Monitor): Ø515 (499-537)

    Notebookcheck Gesamtbewertung

    Der Intel Core Ultra 5 245K bietet eine hervorragende Balance aus Leistung und Effizienz, ideal für Gaming und Multitasking. Mit moderner Architektur überzeugt er als vielseitiger Allrounder.

    Transparenz

    Die Auswahl der zu testenden Geräte erfolgt innerhalb der Redaktion. Das vorliegende Testmuster wurde dem Autor vom Hersteller oder einem Shop zu Testzwecken leihweise zur Verfügung gestellt. Eine Einflussnahme des Leihstellers auf den Testbericht gab es nicht, der Hersteller erhielt keine Version des Reviews vor der Veröffentlichung. Es bestand keine Verpflichtung zur Publikation. Unsere Reviews erfolgen stets ohne Gegenleistung oder Kompensationen. Als eigenständiges, unabhängiges Unternehmen unterliegt Notebookcheck keiner Diktion von Herstellern, Shops und Verlagen.

    So testet Notebookcheck

    Pro Jahr werden von Notebookcheck hunderte Laptops und Smartphones unabhängig in von uns standardisierten technischen Verfahren getestet, um eine Vergleichbarkeit aller Testergebnisse zu gewährleisten. Seit rund 20 Jahren entwickeln wir diese Testmethoden kontinuierlich weiter und setzen damit Branchenstandards. In unseren Testlaboren kommt ausschließlich hochwertiges Messequipment in die Hände erfahrener Techniker und Redakteure. Die Tests unterliegen einer mehrstufigen Kontrolle. Unsere komplexe Gesamtbewertung basiert auf hunderten fundierten Messergebnissen und Benchmarks, womit Ihnen Objektivität garantiert ist. Weitere Informationen zu unseren Testmethoden gibt es hier.

    static version load dynamic
    Die Kommentare zum Artikel werden geladen
    Diesen Artikel kommentieren / Antworten
    Teilen Sie diesen Artikel, um uns zu unterstützen. Jeder Link hilft!
    > Notebook Test, Laptop Test und News > Tests > Sonstige Tests > Intel Core Ultra 5 245K im Test: Die perfekte Balance zwischen Power und Effizienz?
    Autor: Sebastian Bade, 24.10.2024 (Update: 25.10.2024)