Notebookcheck Logo

NVIDIA Quadro FX 3500M vs NVIDIA GeForce GTX 1070 Ti (Desktop) vs NVIDIA Quadro FX 770M

NVIDIA Quadro FX 3500M

► remove from comparison NVIDIA Quadro FX 3500M

Die NVIDIA Quadro FX 3500M ist der Vorgänger der FX 3600M und eine professionelle Grafiklösung für den mobilen Einsatz. Der Quadro FX 3500M eignet sich insbesondere für CAD, digitale Bild- und Videobearbeitung sowie wissenschaftliche Visualisierungen (laut NVIDIA). Sie basiert auf den Grafikkern der  NVIDIA GeForce Go 7950 GTX und sollte dadurch auch sehr gute DirectX 9 Spieleleistung (für 2007) erwarten lassen (mit modifizierten Treibern). Die Karte wird mit zertifizierten Treibern für professionelle Anwendungen ausgeliefert, die jedoch nicht für Spiele optimiert sind (inoffiziell sollte jedoch auch die manuelle Installation von Forceware Treibern möglich sein).

Die Treiber der Quadro FX Serie sind zertifiziert für CAD Anwendungen (z.B. AutoCad, Inventor, Solidstation, Solid Edge, ...) und DCC Anwendungen (z.B. Maya, 3DS Max, Lightwave 3D, ...) und bieten eine 12-Bit-Präzision für Subpixel, Vollbild-Antialiasing, Hardwarebeschleunigtes Antialiasing für Punkte und Linien und weitere für CAD und DCC optimierte Einstellungen.

Von Nvidia wird die 3000er Serie als Kraftpaket für große Modelle und Datenstrukturen beschrieben.

NVIDIA GeForce GTX 1070 Ti (Desktop)

► remove from comparison NVIDIA GeForce GTX 1070 Ti (Desktop)

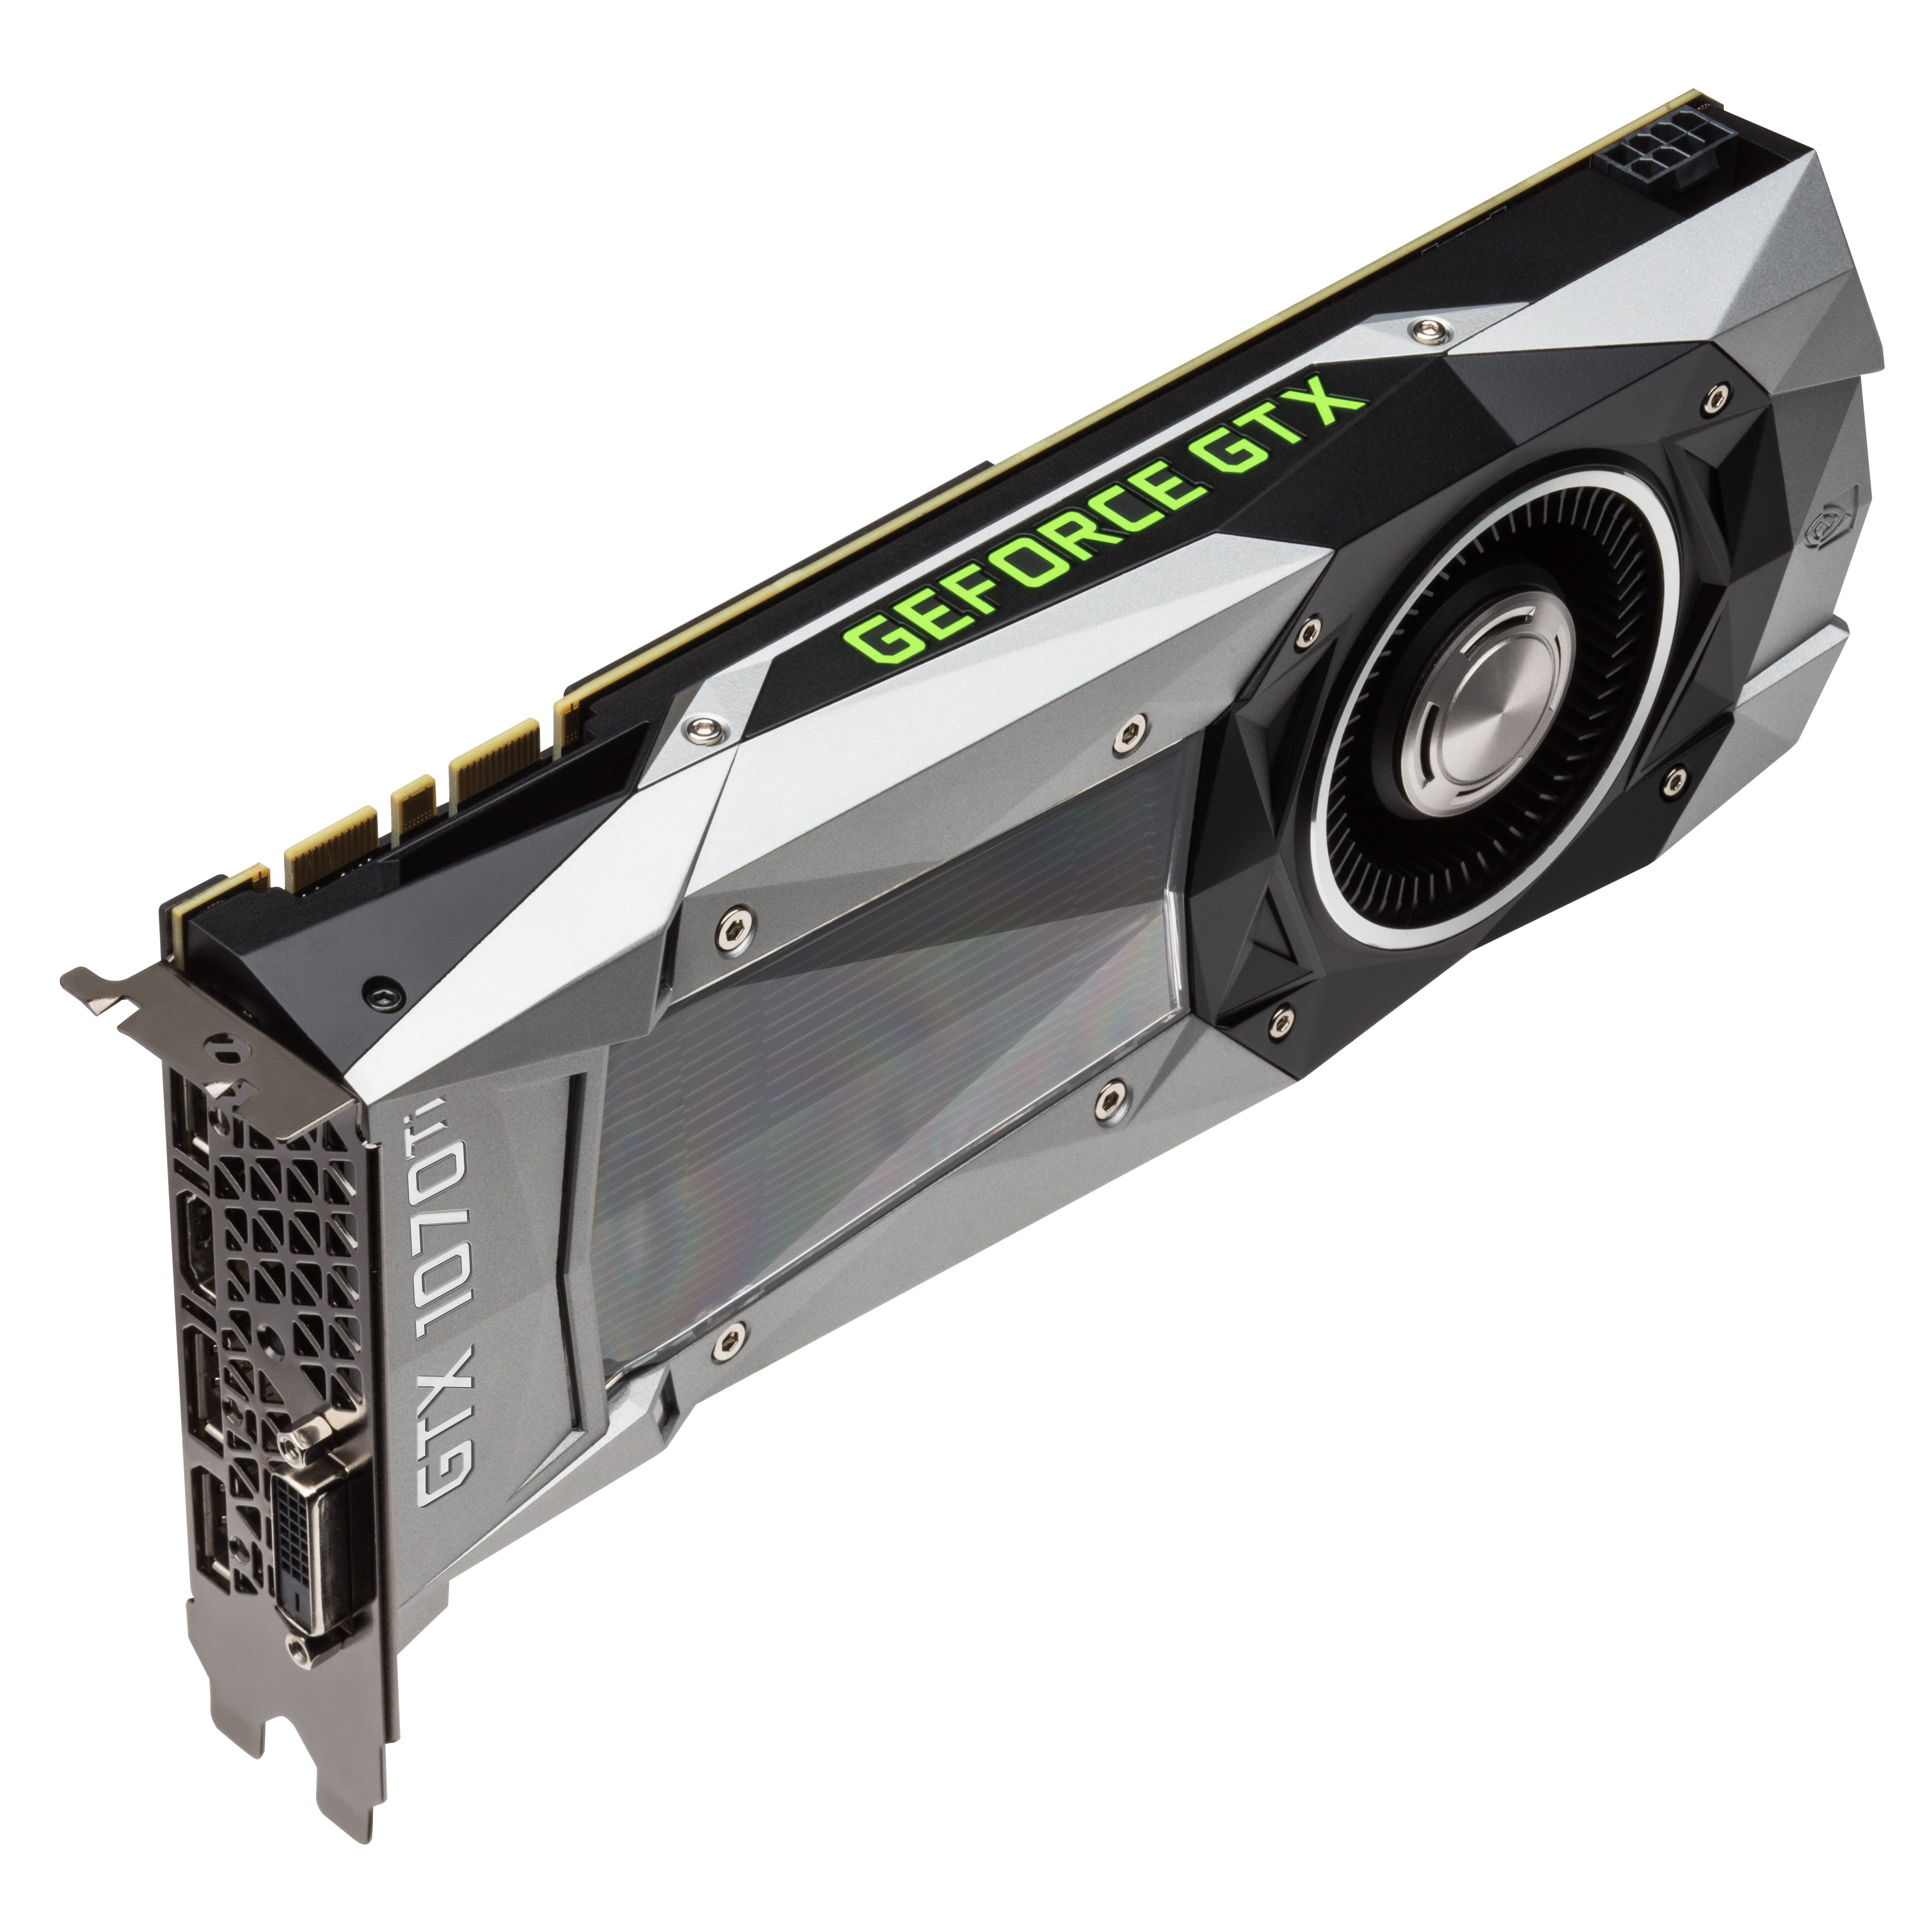
Die Nvidia GeForce GTX 1070 Ti ist eine schnelle Desktop Grafikkarte der Pascal Generation. Sie positioniert sich zwischen GTX 1070 und GTX 1080 und wurde als Konter zur Radeon Vega 56 positioniert. Die Vorstellung war im November 2017. Im Vergleich zur GTX 1070 bietet die GTX 1070 Ti mehr Shader (2.432 versus 1.920) bei gleichem Boost Takt. Der 8 GB große Grafikspeicher ist wie bei der GTX 1070 vom Typ GDDR5 und nicht GDDR5X wie bei der GTX 1080. 

Features

Der GP104-Chip wird in einem 16nm-FinFET-Prozess bei TSMC gefertigt und bietet eine Reihe neuer Features, unter anderem Support für DisplayPort 1.4 (ready), HDMI 2.0b, HDR, Simultaneous Multi-Projection (SMP) sowie verbessertes H.265 Video De- und Encoding (PlayReady 3.0). Eine genaue Auflistung der Verbesserungen und Features der neuen Pascal Desktop-GPUs finden Sie in unserem Pascal-Architektur-Artikel.

Performance

Die GeForce GTX 1070 Ti positioniert sich wenig überraschend zwischen GTX 1070 und GTX 1080. Damit eignet sich die Grafikkarte am besten für 2560x1440 mit maximalen Details für aktuelle Spiele. Anspruchslosere Spiele können auch in 4K flüssig gespielt werden.

Leistungsaufnahme

Die Leistungsaufnahme der GeForce GTX 1070 Ti wird vom Hersteller mit 180 Watt beziffert und liegt damit in einer ähnlichen Größenordnung wie die GTX 1080. In unseren Tests positioniert sich die Karte leicht darunter aber auch deutlich über der GTX 1070 (150 Watt TDP).

NVIDIA Quadro FX 770M

► remove from comparison NVIDIA Quadro FX 770M

Die Quadro FX 770M ist eine professionelle Midrange Grafikkarte für Notebooks / mobile Workstations. Der Haupteinsatzzweck der FX770M sind CAD, DCC und Visualisierungsapplikationen. Für die populärsten Anwendungen sind die Treiber der Quadro Serie auch zertifiziert (garantieren den einwandfreien Betrieb).

Technisch basiert die Quadro FX 770M auf den Chip der GeForce 9600M GT und bietet daher die selben Features (PureVideo HD). Auch die theoretische Spieleleistung ist vergleichbar, jedoch kann es zu einer schlechteren Performance (durch die auf Anwendungen / OpenGL optimierten Treiber) kommen.

Speziell bei OpenGL zeigt die Quadro eine deutlich bessere Performance als die Consumer 9600M GT. Im Cinebench R10 OpenGL Test rechnet die 770M ungefähr doppelt so schnell wie die 9600M GT.

Wie die gesamte GeForce 9000M Serie, bietet die 770M auch CUDA Unterstützung. 

NVIDIA Quadro FX 3500MNVIDIA GeForce GTX 1070 Ti (Desktop)NVIDIA Quadro FX 770M
Quadro FX Serie
Quadro FX 3800M 128 @ 0.68 GHz256 Bit @ 1000 MHz
Quadro FX 3700M 128 @ 0.55 GHz256 Bit @ 800 MHz
Quadro FX 2800M 96 @ 0.6 GHz256 Bit @ 1000 MHz
Quadro FX 3600M 96 @ 0.5 GHz256 Bit @ 800 MHz
Quadro FX 1800M 72 @ 0.56 GHz128 Bit @ 1100 MHz
Quadro FX 2700M 48 @ 0.53 GHz256 Bit @ 800 MHz
Quadro FX 880M 48 @ 0.55 GHz128 Bit @ 790 MHz
Quadro FX 3500M 24/8 cores @ 0.58 GHz256 Bit @ 700 MHz
Quadro FX 2500M 24/8 cores @ 0.5 GHz256 Bit @ 600 MHz
Quadro FX 1700M 32 @ 0.63 GHz128 Bit @ 800 MHz
Quadro FX 1600M 32 @ 0.63 GHz128 Bit @ 800 MHz
Quadro FX 1500M 20/7 cores @ 0.38 GHz256 Bit @ 500 MHz
Quadro FX 770M 32 @ 0.5 GHz128 Bit @ 800 MHz
Quadro FX 570M 32 @ 0.48 GHz128 Bit @ 700 MHz
Quadro FX 380M 16 @ 0.63 GHz64 Bit @ 800 MHz
Quadro FX 370M 8 @ 0.58 GHz64 Bit @ 700 MHz
Quadro FX 360M 16 @ 0.4 GHz64 Bit @ 600 MHz
Quadro FX 350M 4/3 cores @ 0.45 GHz64 Bit @ 350 MHz
GeForce GTX 1080 Ti 3584 @ 1.48 - 1.6 GHz352 Bit @ 11000 MHz
GeForce GTX 1080 SLI (Laptop) 5120 @ 1.56 - 1.73 GHz256 Bit @ 10000 MHz
GeForce GTX 1070 SLI (Desktop) 3840 @ 1.51 - 1.68 GHz256 Bit @ 8000 MHz
GeForce GTX 1070 SLI (Laptop) 4096 @ 1.44 - 1.65 GHz256 Bit @ 8000 MHz
GeForce GTX 1080 (Desktop) 2560 @ 1.61 - 1.73 GHz256 Bit @ 10000 MHz
GeForce GTX 1080 Mobile 2560 @ 1.57 - 1.73 GHz256 Bit @ 10000 MHz
GeForce GTX 1070 Ti (Desktop) 2432 @ 1.61 - 1.68 GHz256 Bit @ 8000 MHz
GeForce GTX 1070 (Desktop) 1920 @ 1.51 - 1.68 GHz256 Bit @ 8000 MHz
GeForce GTX 1080 Max-Q 2560 @ 1.1 - 1.28 GHz256 Bit @ 10000 MHz
GeForce GTX 1070 Mobile 2048 @ 1.44 - 1.65 GHz256 Bit @ 8000 MHz
GeForce GTX 1070 Max-Q 2048 @ 1.1 - 1.27 GHz256 Bit @ 8000 MHz
GeForce GTX 1060 (Desktop) 1280 @ 1.51 - 1.71 GHz192 Bit @ 8000 MHz
GeForce GTX 1060 Mobile 1280 @ 1.4 - 1.67 GHz192 Bit @ 8000 MHz
GeForce GTX 1060 Max-Q 1280 @ 1.06 - 1.34 GHz192 Bit @ 8000 MHz
GeForce GTX 1050 Ti Mobile 768 @ 1.49 - 1.62 GHz128 Bit @ 7000 MHz
GeForce GTX 1050 Ti (Desktop) 768 @ 1.29 - 1.39 GHz128 Bit @ 7008 MHz
GeForce GTX 1050 Ti Max-Q 768 @ 1.15 - 1.29 GHz128 Bit @ 7000 MHz
GeForce GTX 1050 (Desktop) 640 @ 1.35 - 1.46 GHz128 Bit @ 7008 MHz
GeForce GTX 1050 Mobile 640 @ 1.35 - 1.49 GHz128 Bit @ 7000 MHz
GeForce GTX 1050 Max-Q 640 @ 1 - 1.14 GHz128 Bit @ 7000 MHz
GeForce GT 1030 (Desktop) 384 @ 1.23 - 1.67 GHz64 Bit @ 6000 MHz
Quadro FX 3800M 128 @ 0.68 GHz256 Bit @ 1000 MHz
Quadro FX 3700M 128 @ 0.55 GHz256 Bit @ 800 MHz
Quadro FX 2800M 96 @ 0.6 GHz256 Bit @ 1000 MHz
Quadro FX 3600M 96 @ 0.5 GHz256 Bit @ 800 MHz
Quadro FX 1800M 72 @ 0.56 GHz128 Bit @ 1100 MHz
Quadro FX 2700M 48 @ 0.53 GHz256 Bit @ 800 MHz
Quadro FX 880M 48 @ 0.55 GHz128 Bit @ 790 MHz
Quadro FX 3500M 24/8 cores @ 0.58 GHz256 Bit @ 700 MHz
Quadro FX 2500M 24/8 cores @ 0.5 GHz256 Bit @ 600 MHz
Quadro FX 1700M 32 @ 0.63 GHz128 Bit @ 800 MHz
Quadro FX 1600M 32 @ 0.63 GHz128 Bit @ 800 MHz
Quadro FX 1500M 20/7 cores @ 0.38 GHz256 Bit @ 500 MHz
Quadro FX 770M 32 @ 0.5 GHz128 Bit @ 800 MHz
Quadro FX 570M 32 @ 0.48 GHz128 Bit @ 700 MHz
Quadro FX 380M 16 @ 0.63 GHz64 Bit @ 800 MHz
Quadro FX 370M 8 @ 0.58 GHz64 Bit @ 700 MHz
Quadro FX 360M 16 @ 0.4 GHz64 Bit @ 600 MHz
Quadro FX 350M 4/3 cores @ 0.45 GHz64 Bit @ 350 MHz
CodenameG71GLMPascal GP104NB9P-GLM
ArchitekturG7xPascalG9x
Pipelines24 / 8 Pixel- / Vertexshader2432 - unified32 - unified
Kerntakt575 MHz1607 - 1683 (Boost) MHz500 MHz
Speichertakt700 MHz8000 MHz800 MHz
Speicherbandbreite256 Bit256 Bit128 Bit
SpeichertypGDDR3GDDR5GDDR2 / GDDR3
Max. Speichergröße512 MB8 GB512 MB
Shared Memoryneinneinnein
APIDirectX 9c, Shader 3.0DirectX 12_1, OpenGL 4.5DirectX 10, Shader 4.0
Stromverbrauch45 Watt180 Watt35 Watt
Transistors278 Million7.2 Billion314 Million
Herstellungsprozess90 nm16 nm65 nm
Features12-Bit-Sub-Pixel, 32-Bit-Floating-Point Präzision, 32-Bit Gleitkomma Präzision, 128 Bit Grafikpipeline, Hardware 3D Window Clipping, High Precision Dynamic-Range (DPDR) Technology, Unified Memory Architecture, nView Multi-Display (für Multi-Monitor Unterstützung), PowerMizer Energiesparoptionen, Workstation optimierte Architektur, Rotated-Grid Full-Scene Antialiasing (RG FSAA), Unified Driver Architecture, NVIDIA PureVideo TechnologieMulti-Projection, VR Ready, G-SYNC, Vulkan, Multi MonitorOpenGL 2.1, PowerMizer 8.0, 12-Bit Subpixel-Präzision, 128 Bit Grafikpipeline
Notebookgrößegroß (17" z.B.)mittel (15.4" z.B.)
Erscheinungsdatum01.03.2007 02.11.2017 14.08.2008
Herstellerseitewww.nvidia.comwww.nvidia.atwww.nvidia.com
Shadertakt1250 MHz

Benchmarks

3DMark - 3DMark Time Spy Score
6177 Points (18%)
3DMark - 3DMark Time Spy Graphics
6531 Points (17%)
3DMark - 3DMark Ice Storm Unlimited Graphics
442105 Points (45%)
3DMark - 3DMark Cloud Gate Score
29364 Points (31%)
3DMark - 3DMark Cloud Gate Graphics
88161 Points (23%)
3DMark - 3DMark Fire Strike Standard Score
15061 Points (27%)
3DMark - 3DMark Fire Strike Standard Graphics
18405 Points (21%)
3DMark 11 - 3DM11 Performance Score
20106 Points (28%)
3DMark 11 - 3DM11 Performance GPU
27503 Points (24%)
3DMark 2001SE - 3DMark 2001 - Standard
34871 Points (36%)
3DMark 03 - 3DMark 03 - Standard
20736 Points (11%)
17192 Points (9%)
3DMark 05 - 3DMark 05 - Standard
9295 Points (10%)
11161 Points (12%)
3DMark 06 3DMark 06 - Score Unknown Settings + NVIDIA Quadro FX 3500M
3DMark 06
5254 Points (7%)
3DMark 06 - Standard 1280x1024 + NVIDIA GeForce GTX 1070 Ti (Desktop)
3DMark 06
36475 Points (48%)
3DMark 06 - Standard 1280x1024 + NVIDIA Quadro FX 770M
min: 5230     avg: 5297     median: 5296.5 (7%)     max: 5363 Points
SPEC Viewperf 10.0 - SPEC Viewperf 10.0 - 3dsmax
33.1 Points (69%)
SPEC Viewperf 10.0 - SPEC Viewperf 10.0 - Catia
40.1 Points (84%)
SPEC Viewperf 10.0 - SPEC Viewperf 10.0 - EnSight
31.7 Points (67%)
SPEC Viewperf 10.0 - SPEC Viewperf 10.0 - Maya
85.1 Points (46%)
SPEC Viewperf 10.0 - SPEC Viewperf 10.0 - Pro/Engeneer
36.1 Points (71%)
SPEC Viewperf 10.0 - SPEC Viewperf 10.0 - SolidWorks
55 Points (81%)
SPEC Viewperf 10.0 - SPEC Viewperf 10.0 - UGS Teamcenter
19 Points (49%)
SPEC Viewperf 10.0 - SPEC Viewperf 10.0 - UGS NX
17.5 Points (36%)
Cinebench R10 Cinebench R10 Shading (32bit) + NVIDIA Quadro FX 770M
Cinebench R10 - Cinebench R10 Shading (32bit)
6180 Points (4%)
LuxMark v2.0 64Bit - LuxMark v2.0 Room GPU
2542 Samples/s (11%)
LuxMark v2.0 64Bit - LuxMark v2.0 Sala GPU
5159 Samples/s (9%)
ComputeMark v2.1 - ComputeMark v2.1 Result
15488 Points (17%)
Power Consumption - Furmark Stress Test Power Consumption - external Monitor *
291 Watt (41%)
Power Consumption - The Witcher 3 Power Consumption - external Monitor *
290 Watt (41%)
Power Consumption - Witcher 3 ultra Power Efficiency - external Monitor
0.2 fps per Watt (21%)
Clock Speed - GPU Clock Witcher 3 ultra
1810 MHz (71%)
Clock Speed - GPU Clock Speed Furmark
1677 MHz (66%)

Average Benchmarks NVIDIA Quadro FX 3500M → 0% n=0

Average Benchmarks NVIDIA GeForce GTX 1070 Ti (Desktop) → 0% n=0

Average Benchmarks NVIDIA Quadro FX 770M → 0% n=0

- Bereich der Benchmarkergebnisse für diese Grafikkarte
- Durchschnittliche Benchmarkergebnisse für diese Grafikkarte
* Smaller numbers mean a higher performance
1 This benchmark is not used for the average calculation

Spiele-Benchmarks

Die folgenden Benchmarks basieren auf unseren Spieletests mit Testnotebooks. Die Performance dieser Grafikkarte bei den gelisteten Spielen ist abhängig von der verwendeten CPU, Speicherausstattung, Treiber und auch Betriebssystem. Dadurch müssen die untenstehenden Werte nicht repräsentativ sein. Detaillierte Informationen über das verwendete System sehen Sie nach einem Klick auf den fps-Wert.

Control

Control

2019
low 1280x720
GeForce GTX 1070 Ti (Desktop):
200  fps
med. 1920x1080
GeForce GTX 1070 Ti (Desktop):
78  fps
high 1920x1080
GeForce GTX 1070 Ti (Desktop):
58.5  fps
QHD 2560x1440
GeForce GTX 1070 Ti (Desktop):
37.1  fps
4K 3840x2160
GeForce GTX 1070 Ti (Desktop):
17.9  fps
F1 2019

F1 2019

2019
low 1280x720
GeForce GTX 1070 Ti (Desktop):
244  fps
med. 1920x1080
GeForce GTX 1070 Ti (Desktop):
183  fps
high 1920x1080
GeForce GTX 1070 Ti (Desktop):
164  fps
ultra 1920x1080
GeForce GTX 1070 Ti (Desktop):
120  fps
QHD 2560x1440
GeForce GTX 1070 Ti (Desktop):
94  fps
4K 3840x2160
GeForce GTX 1070 Ti (Desktop):
57  fps
low 1280x720
GeForce GTX 1070 Ti (Desktop):
271  fps
med. 1920x1080
GeForce GTX 1070 Ti (Desktop):
249  fps
high 1920x1080
GeForce GTX 1070 Ti (Desktop):
241  fps
ultra 1920x1080
GeForce GTX 1070 Ti (Desktop):
219  fps
QHD 2560x1440
GeForce GTX 1070 Ti (Desktop):
222  fps
4K 3840x2160
GeForce GTX 1070 Ti (Desktop):
221  fps
high 1920x1080
GeForce GTX 1070 Ti (Desktop):
86.6  fps
ultra 1920x1080
GeForce GTX 1070 Ti (Desktop):
63.4  fps
QHD 2560x1440
GeForce GTX 1070 Ti (Desktop):
41.2  fps
4K 3840x2160
GeForce GTX 1070 Ti (Desktop):
20.3  fps
Anno 1800

Anno 1800

2019
ultra 1920x1080
GeForce GTX 1070 Ti (Desktop):
46  fps
QHD 2560x1440
GeForce GTX 1070 Ti (Desktop):
40.4  fps
4K 3840x2160
GeForce GTX 1070 Ti (Desktop):
24.1  fps
low 1280x720
GeForce GTX 1070 Ti (Desktop):
121  fps
med. 1920x1080
GeForce GTX 1070 Ti (Desktop):
107  fps
high 1920x1080
GeForce GTX 1070 Ti (Desktop):
103  fps
ultra 1920x1080
GeForce GTX 1070 Ti (Desktop):
93  fps
QHD 2560x1440
GeForce GTX 1070 Ti (Desktop):
76  fps
4K 3840x2160
GeForce GTX 1070 Ti (Desktop):
42  fps
low 1280x720
GeForce GTX 1070 Ti (Desktop):
147  fps
med. 1920x1080
GeForce GTX 1070 Ti (Desktop):
83  fps
high 1920x1080
GeForce GTX 1070 Ti (Desktop):
63  fps
ultra 1920x1080
GeForce GTX 1070 Ti (Desktop):
52.3  fps
QHD 2560x1440
GeForce GTX 1070 Ti (Desktop):
40.2  fps
4K 3840x2160
GeForce GTX 1070 Ti (Desktop):
24.6  fps
low 1280x720
GeForce GTX 1070 Ti (Desktop):
144  fps
med. 1920x1080
GeForce GTX 1070 Ti (Desktop):
138  fps
high 1920x1080
GeForce GTX 1070 Ti (Desktop):
123  fps
ultra 1920x1080
GeForce GTX 1070 Ti (Desktop):
121  fps
QHD 2560x1440
GeForce GTX 1070 Ti (Desktop):
81  fps
4K 3840x2160
GeForce GTX 1070 Ti (Desktop):
42.4  fps
ultra 1920x1080
GeForce GTX 1070 Ti (Desktop):
88  fps
QHD 2560x1440
GeForce GTX 1070 Ti (Desktop):
64  fps
4K 3840x2160
GeForce GTX 1070 Ti (Desktop):
35.3  fps
ultra 1920x1080
GeForce GTX 1070 Ti (Desktop):
110  fps
QHD 2560x1440
GeForce GTX 1070 Ti (Desktop):
74  fps
4K 3840x2160
GeForce GTX 1070 Ti (Desktop):
35.4  fps
ultra 1920x1080
GeForce GTX 1070 Ti (Desktop):
111  fps
QHD 2560x1440
GeForce GTX 1070 Ti (Desktop):
83  fps
4K 3840x2160
GeForce GTX 1070 Ti (Desktop):
47.1  fps
ultra 1920x1080
GeForce GTX 1070 Ti (Desktop):
120  fps
QHD 2560x1440
GeForce GTX 1070 Ti (Desktop):
80  fps
4K 3840x2160
GeForce GTX 1070 Ti (Desktop):
40.1  fps
ultra 1920x1080
GeForce GTX 1070 Ti (Desktop):
63  fps
QHD 2560x1440
GeForce GTX 1070 Ti (Desktop):
48  fps
4K 3840x2160
GeForce GTX 1070 Ti (Desktop):
27  fps
ultra 1920x1080
GeForce GTX 1070 Ti (Desktop):
100  fps
QHD 2560x1440
GeForce GTX 1070 Ti (Desktop):
81  fps
4K 3840x2160
GeForce GTX 1070 Ti (Desktop):
55  fps
FIFA 19

FIFA 19

2018
ultra 1920x1080
GeForce GTX 1070 Ti (Desktop):
267  fps
4K 3840x2160
GeForce GTX 1070 Ti (Desktop):
141  fps
ultra 1920x1080
GeForce GTX 1070 Ti (Desktop):
84  fps
QHD 2560x1440
GeForce GTX 1070 Ti (Desktop):
51  fps
4K 3840x2160
GeForce GTX 1070 Ti (Desktop):
28  fps
F1 2018

F1 2018

2018
ultra 1920x1080
GeForce GTX 1070 Ti (Desktop):
97  fps
QHD 2560x1440
GeForce GTX 1070 Ti (Desktop):
78  fps
4K 3840x2160
GeForce GTX 1070 Ti (Desktop):
49  fps
ultra 1920x1080
GeForce GTX 1070 Ti (Desktop):
78  fps
QHD 2560x1440
GeForce GTX 1070 Ti (Desktop):
48.5  fps
4K 3840x2160
GeForce GTX 1070 Ti (Desktop):
23.8  fps
Far Cry 5

Far Cry 5

2018
low 1280x720
GeForce GTX 1070 Ti (Desktop):
135  fps
med. 1920x1080
GeForce GTX 1070 Ti (Desktop):
114  fps
high 1920x1080
GeForce GTX 1070 Ti (Desktop):
108  fps
ultra 1920x1080
GeForce GTX 1070 Ti (Desktop):
102  fps
QHD 2560x1440
GeForce GTX 1070 Ti (Desktop):
75  fps
4K 3840x2160
GeForce GTX 1070 Ti (Desktop):
39  fps
low 1280x720
GeForce GTX 1070 Ti (Desktop):
101  fps
med. 1920x1080
GeForce GTX 1070 Ti (Desktop):
89  fps
high 1920x1080
GeForce GTX 1070 Ti (Desktop):
74.5  fps
4K 3840x2160
GeForce GTX 1070 Ti (Desktop):
66.7  fps
low 1280x720
GeForce GTX 1070 Ti (Desktop):
154  fps
med. 1920x1080
GeForce GTX 1070 Ti (Desktop):
100  fps
high 1920x1080
GeForce GTX 1070 Ti (Desktop):
82  fps
ultra 1920x1080
GeForce GTX 1070 Ti (Desktop):
59.1  fps
QHD 2560x1440
GeForce GTX 1070 Ti (Desktop):
42.4  fps
4K 3840x2160
GeForce GTX 1070 Ti (Desktop):
22.7  fps
low 1280x720
GeForce GTX 1070 Ti (Desktop):
146  fps
med. 1920x1080
GeForce GTX 1070 Ti (Desktop):
87  fps
high 1920x1080
GeForce GTX 1070 Ti (Desktop):
63  fps
4K 3840x2160
GeForce GTX 1070 Ti (Desktop):
27.7  fps
Fortnite

Fortnite

2018
ultra 1920x1080
GeForce GTX 1070 Ti (Desktop):
109  fps
QHD 2560x1440
GeForce GTX 1070 Ti (Desktop):
72  fps
4K 3840x2160
GeForce GTX 1070 Ti (Desktop):
36  fps
ultra 1920x1080
GeForce GTX 1070 Ti (Desktop):
117  fps
QHD 2560x1440
GeForce GTX 1070 Ti (Desktop):
77  fps
4K 3840x2160
GeForce GTX 1070 Ti (Desktop):
38  fps
ultra 1920x1080
GeForce GTX 1070 Ti (Desktop):
122  fps
QHD 2560x1440
GeForce GTX 1070 Ti (Desktop):
85  fps
4K 3840x2160
GeForce GTX 1070 Ti (Desktop):
45  fps
low 1280x720
GeForce GTX 1070 Ti (Desktop):
103  fps
med. 1920x1080
GeForce GTX 1070 Ti (Desktop):
92  fps
high 1920x1080
GeForce GTX 1070 Ti (Desktop):
88  fps
ultra 1920x1080
GeForce GTX 1070 Ti (Desktop):
75  fps
QHD 2560x1440
GeForce GTX 1070 Ti (Desktop):
58  fps
4K 3840x2160
GeForce GTX 1070 Ti (Desktop):
34  fps
low 1280x720
GeForce GTX 1070 Ti (Desktop):
165  fps
med. 1920x1080
GeForce GTX 1070 Ti (Desktop):
136  fps
high 1920x1080
GeForce GTX 1070 Ti (Desktop):
109  fps
ultra 1920x1080
GeForce GTX 1070 Ti (Desktop):
85  fps
4K 3840x2160
GeForce GTX 1070 Ti (Desktop):
34  fps
ultra 1920x1080
GeForce GTX 1070 Ti (Desktop):
47.1  fps
4K 3840x2160
GeForce GTX 1070 Ti (Desktop):
17.3  fps
F1 2017

F1 2017

2017
ultra 1920x1080
GeForce GTX 1070 Ti (Desktop):
106  fps
4K 3840x2160
GeForce GTX 1070 Ti (Desktop):
52  fps
4K 3820x2160
GeForce GTX 1070 Ti (Desktop):
152  fps
Dirt 4

Dirt 4

2017
4K 3840x2160
GeForce GTX 1070 Ti (Desktop):
57.9  fps
high 1920x1080
GeForce GTX 1070 Ti (Desktop):
223  fps
4K 3840x2160
GeForce GTX 1070 Ti (Desktop):
92  fps
ultra 1920x1080
GeForce GTX 1070 Ti (Desktop):
54.2  fps
4K 3840x2160
GeForce GTX 1070 Ti (Desktop):
35.8  fps
For Honor

For Honor

2017
high 1920x1080
GeForce GTX 1070 Ti (Desktop):
156  fps
ultra 1920x1080
GeForce GTX 1070 Ti (Desktop):
122  fps
4K 3840x2160
GeForce GTX 1070 Ti (Desktop):
47.9  fps
4K 3840x2160
GeForce GTX 1070 Ti (Desktop):
67.8  fps
4K 3840x2160
GeForce GTX 1070 Ti (Desktop):
80  fps
ultra 1920x1080
GeForce GTX 1070 Ti (Desktop):
108  fps
4K 3840x2160
GeForce GTX 1070 Ti (Desktop):
91  fps
ultra 1920x1080
GeForce GTX 1070 Ti (Desktop):
67.9  fps
4K 3840x2160
GeForce GTX 1070 Ti (Desktop):
31.9  fps
Overwatch

Overwatch

2016
ultra 1920x1080
GeForce GTX 1070 Ti (Desktop):
182  fps
4K 3840x2160
GeForce GTX 1070 Ti (Desktop):
88.7  fps
ultra 1920x1080
GeForce GTX 1070 Ti (Desktop):
94.6  fps
4K 3840x2160
GeForce GTX 1070 Ti (Desktop):
45.6  fps
ultra 1920x1080
GeForce GTX 1070 Ti (Desktop):
98  fps
4K 3840x2160
GeForce GTX 1070 Ti (Desktop):
41  fps
ultra 1920x1080
GeForce GTX 1070 Ti (Desktop):
111  fps
4K 3840x2160
GeForce GTX 1070 Ti (Desktop):
46.5  fps
ultra 1920x1080
GeForce GTX 1070 Ti (Desktop):
177  fps
4K 3840x2160
GeForce GTX 1070 Ti (Desktop):
77  fps
low 1280x720
GeForce GTX 1070 Ti (Desktop):
142.7  fps
med. 1366x768
GeForce GTX 1070 Ti (Desktop):
134.2  fps
high 1920x1080
GeForce GTX 1070 Ti (Desktop):
126.6  fps
ultra 1920x1080
GeForce GTX 1070 Ti (Desktop):
121.2  fps
4K 3840x2160
GeForce GTX 1070 Ti (Desktop):
105  fps
low 1024x768
GeForce GTX 1070 Ti (Desktop):
293  fps
ultra 1920x1080
GeForce GTX 1070 Ti (Desktop):
71.8  fps
4K 3840x2160
GeForce GTX 1070 Ti (Desktop):
47.1  fps
GTA V

GTA V

2015
4K 3840x2160
GeForce GTX 1070 Ti (Desktop):
67  fps
ultra 1920x1080
GeForce GTX 1070 Ti (Desktop):
132  fps
Crysis - GPU Benchmark

Crysis - GPU Benchmark

2007
low 1024x768
Quadro FX 770M:
94.2  fps
med. 1024x768
Quadro FX 770M:
39  fps
high 1024x768
Quadro FX 770M:
19.5  fps
Crysis - CPU Benchmark

Crysis - CPU Benchmark

2007
low 1024x768
Quadro FX 770M:
84.7  fps
med. 1024x768
Quadro FX 770M:
35.4  fps
high 1024x768
Quadro FX 770M:
18.1  fps
Doom 3

Doom 3

2004
low 640x480
Quadro FX 770M:
165.2  fps
med. 640x480
Quadro FX 770M:
171.3  fps
high 800x600
Quadro FX 770M:
158.7  fps
ultra 1024x768
Quadro FX 770M:
126.1  fps
NVIDIA GeForce GTX 1070 Ti (Desktop)lowmed.highultraQHD4K
Control2007858.537.117.9
F1 20192441831641209457
League of Legends271249241219222221
Total War: Three Kingdoms86.663.441.220.3
Anno 18004640.424.1
Far Cry New Dawn121107103937642
Metro Exodus147836352.340.224.6
Apex Legends1441381231218142.4
Just Cause 4886435.3
Darksiders III1107435.4
Battlefield V1118347.1
Call of Duty Black Ops 41208040.1
Assassin´s Creed Odyssey634827
Forza Horizon 41008155
FIFA 19267141
Shadow of the Tomb Raider845128
F1 2018977849
Monster Hunter World7848.523.8
Far Cry 51351141081027539
X-Plane 11.111018974.566.7
Kingdom Come: Deliverance1541008259.142.422.7
Final Fantasy XV Benchmark146876327.7
Fortnite1097236
Star Wars Battlefront 21177738
Need for Speed Payback1228545
Assassin´s Creed Origins1039288755834
Middle-earth: Shadow of War1651361098534
Ark Survival Evolved47.117.3
F1 201710652
Team Fortress 2152
Dirt 457.9
Rocket League22392
Ghost Recon Wildlands54.235.8
For Honor15612247.9
Call of Duty Infinite Warfare67.8
Farming Simulator 1780
Civilization VI10891
Deus Ex Mankind Divided67.931.9
Overwatch18288.7
The Division94.645.6
Far Cry Primal9841
Rise of the Tomb Raider11146.5
Rainbow Six Siege17777
Dota 2 Reborn142.7134.2126.6121.2105
The Witcher 329371.847.1
GTA V67
BioShock Infinite132
< 30 fps
< 60 fps
< 120 fps
≥ 120 fps


2
12


8
5

1
9
6

5
22
11

9
13
1
10
24
9
3
NVIDIA Quadro FX 770Mlowmed.highultraQHD4K
Crysis - GPU Benchmark94.23919.5
Crysis - CPU Benchmark84.735.418.1
Doom 3165.2171.3158.7126.1
< 30 fps
< 60 fps
< 120 fps
≥ 120 fps


2
1

2

1
2


1


1


Eine Liste mit weiteren Spielen und allen Grafikkarten finden Sie auf unserer Seite: Welches Spiel ist mit welcher Grafikkarte spielbar?

v1.28
log 19. 12:09:07

#0 ran 0s before starting gpusingle class +0s ... 0s

#1 checking url part for id 61 +0s ... 0s

#2 checking url part for id 8258 +0s ... 0s

#3 checking url part for id 884 +0s ... 0s

#4 redirected to Ajax server, took 1726740547s time from redirect:0 +0s ... 0s

#5 did not recreate cache, as it is less than 5 days old! Created at Thu, 19 Sep 2024 05:16:33 +0200 +0s ... 0s

#6 composed specs +0.004s ... 0.004s

#7 did output specs +0s ... 0.004s

#8 start showIntegratedCPUs +0s ... 0.004s

#9 getting avg benchmarks for device 61 +0.009s ... 0.014s

#10 got single benchmarks 61 +0s ... 0.014s

#11 getting avg benchmarks for device 8258 +0s ... 0.014s

#12 got single benchmarks 8258 +0s ... 0.014s

#13 getting avg benchmarks for device 884 +0s ... 0.015s

#14 got single benchmarks 884 +0.005s ... 0.019s

#15 got avg benchmarks for devices +0s ... 0.019s

#16 min, max, avg, median took s +0.011s ... 0.03s

#17 before gaming benchmark output +0s ... 0.03s

#18 Got 160 rows for game benchmarks. +0.004s ... 0.034s

#19 composed SQL query for gamebenchmarks +0s ... 0.034s

#20 got data and put it in $dataArray +0.002s ... 0.036s

#21 benchmarks composed for output. +0.015s ... 0.051s

#22 calculated avg scores. +0s ... 0.051s

#23 return log +0s ... 0.051s

Teilen Sie diesen Artikel, um uns zu unterstützen. Jeder Link hilft!
> Notebook Test, Laptop Test und News > Benchmarks / Technik > Benchmarks / Technik > Grafikkarten Vergleich - Head 2 Head
Autor: Klaus Hinum,  8.09.2017 (Update:  1.07.2023)