Notebookcheck Logo

NVIDIA GeForce RTX 3050 A Laptop GPU vs NVIDIA Quadro T2000 Max-Q vs NVIDIA GeForce RTX 3070 Ti

NVIDIA GeForce RTX 3050 A Laptop GPU

► remove from comparison NVIDIA GeForce RTX 3050 A Laptop GPU

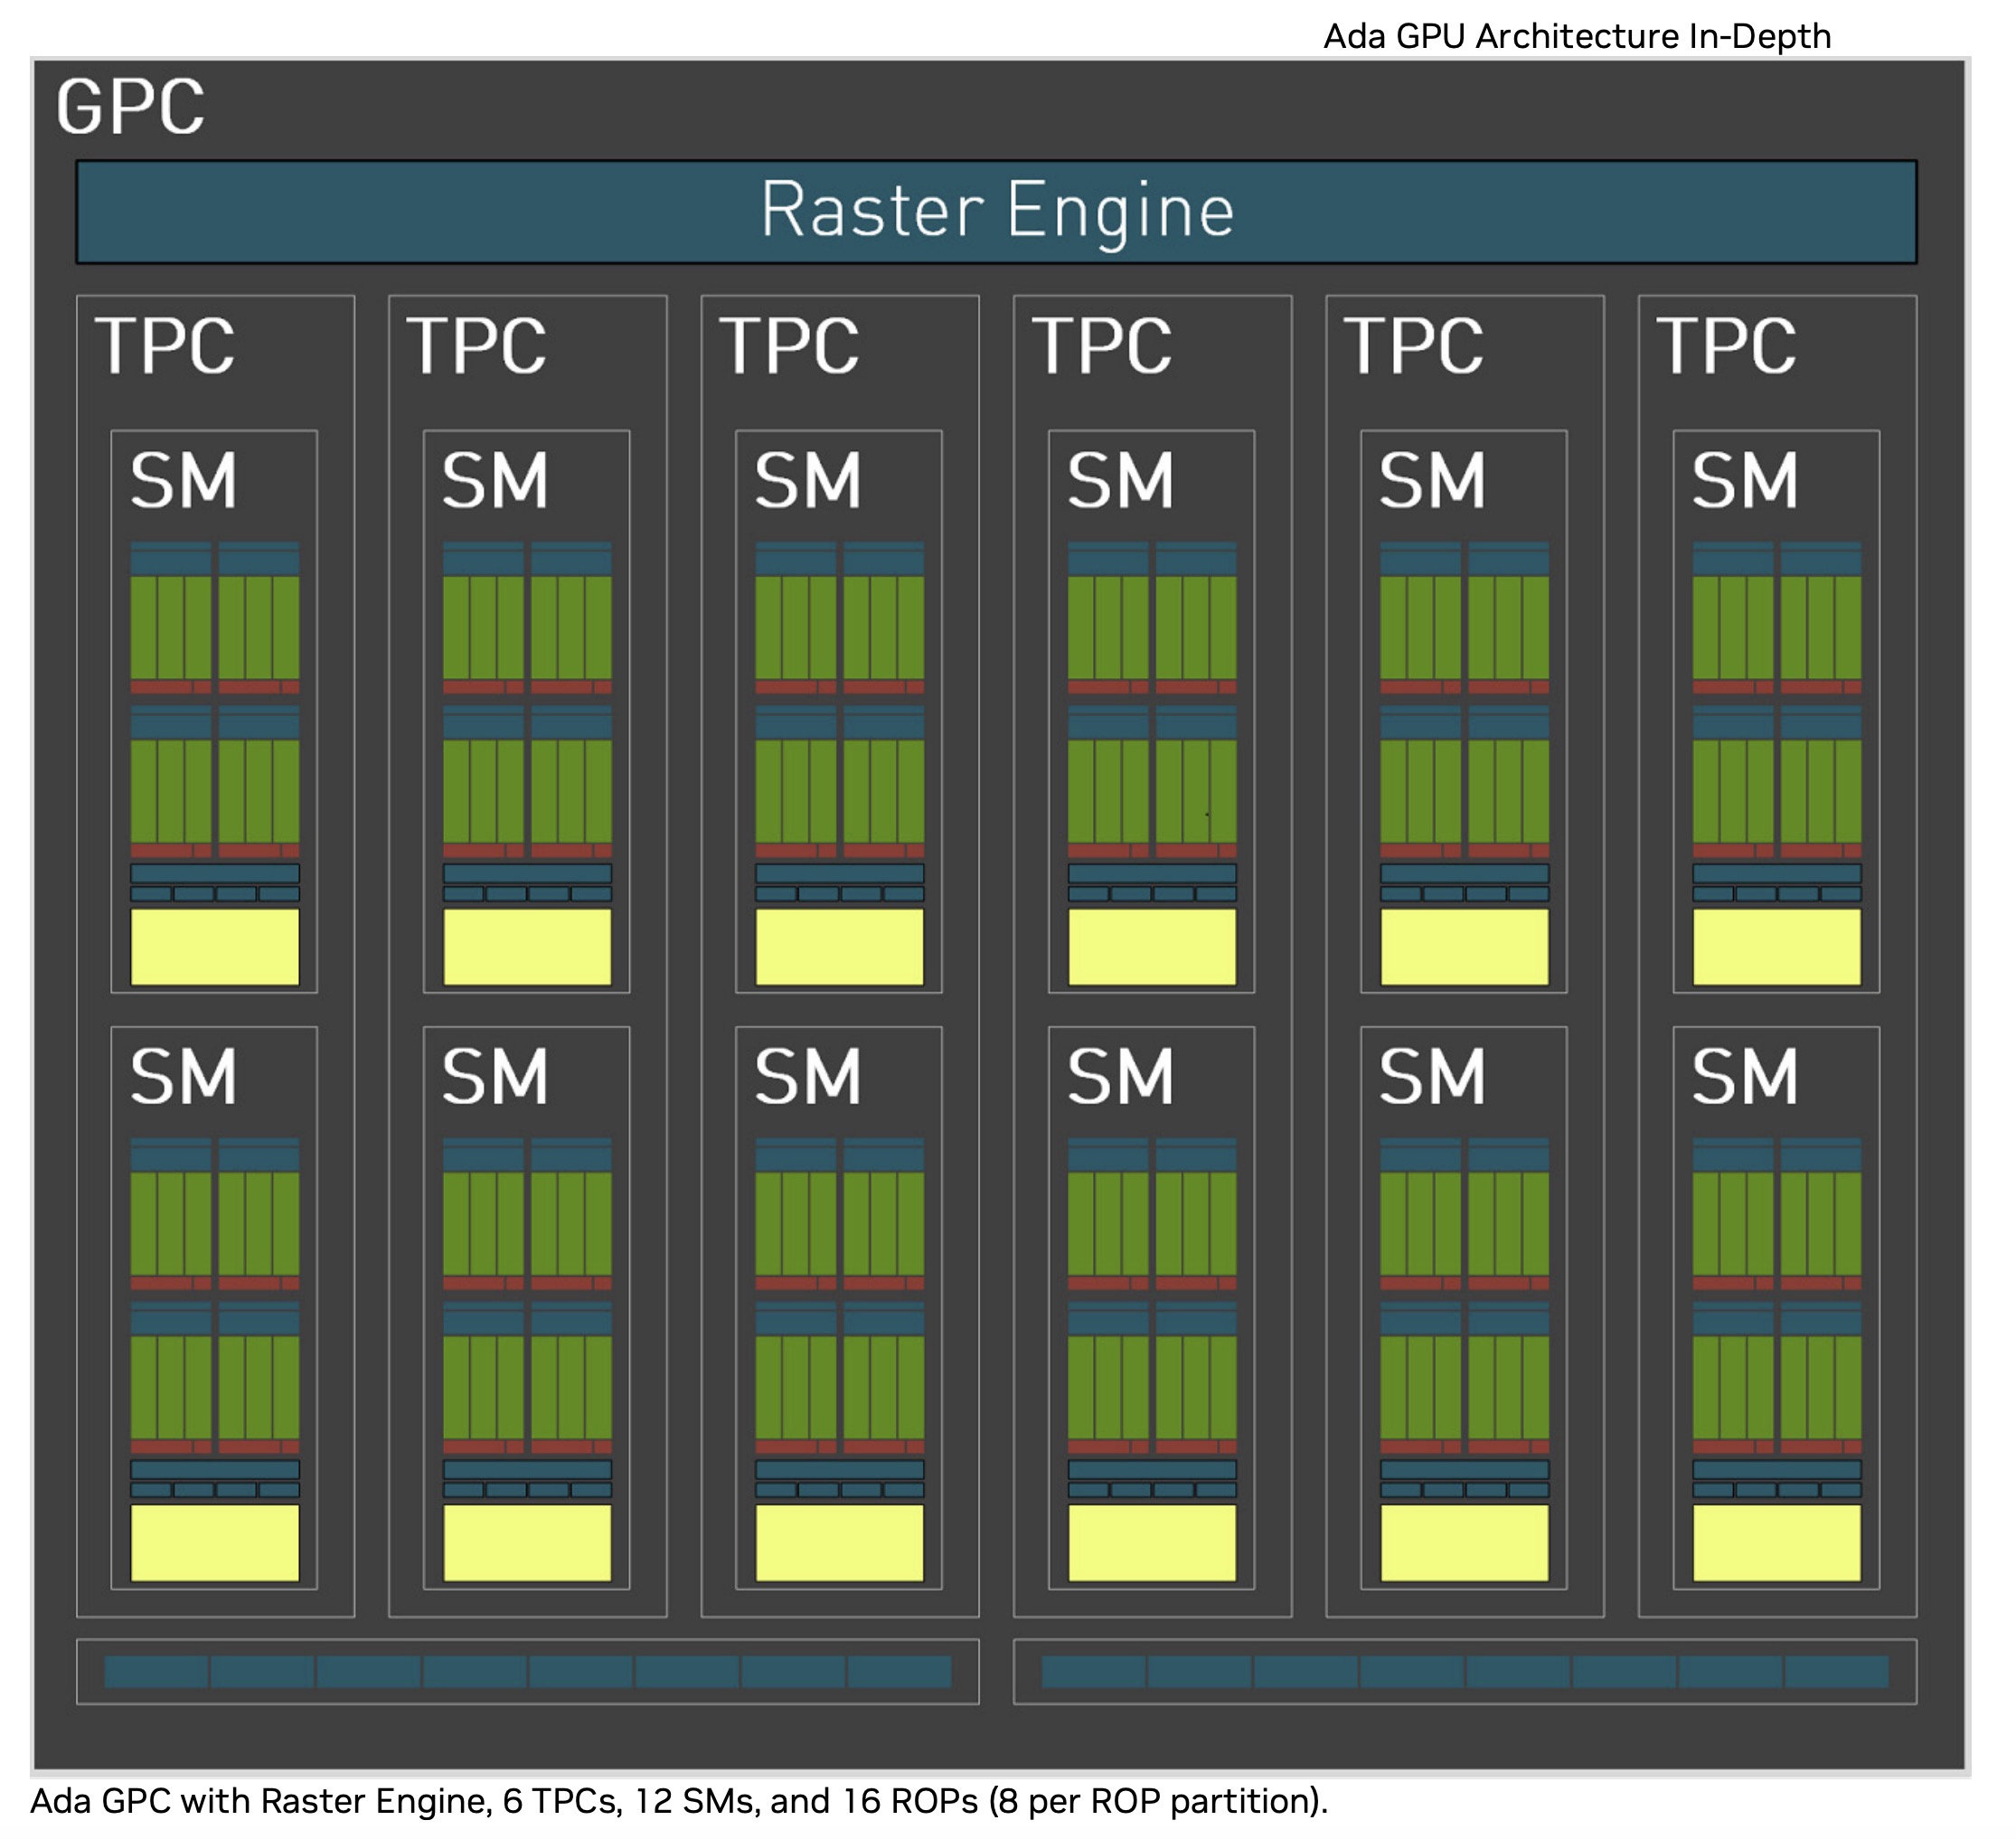
Die Nvidia GeForce RTX 3050 A Laptop GPU (oder Mobile) ist eine neue Variante basierend auf die aktuelle Ada Lovelace Architektur (im Vergleich zu Ampere bei den anderen RTX 3050 Laptop GPUs). Sie nutzt den AD106 Chip der RTX 4060 oder AD107 der RTX 4050, jedoch mit deutlich verringerter Kernanzahl und Speicherbus. Die RTX 3050 A bietet nur 1.792 GPU Kerne (CUDA Cores) und ein 4GB GDDR6 Grafikspeicher der nur mit 64-Bit angebunden ist. Nach aktuellen Informationen ist die 3050 A zum Launch nur für den Indischen Markt gedacht.

Durch die geringe Kernanzahl und den kleinen Speicherbus, sollte die Performance nicht deutlich überhalb der alten RTX 3050 4GB Laptop GPU liegen.

Der AD106 Chip wird bei TSMC im 5nm (4N) Verfahren gefertigt und ist dadurch deutlich effizienter als der alte Ampere Chip der RTX 3050 4GB. Der TGP kann vom Notebookhersteller zwischen 35 und 50 Watt gewählt werden (System Power).

NVIDIA Quadro T2000 Max-Q

► remove from comparison

Die Nvidia Quadro T2000 with Max-Q Designs ist eine professionelle Mittelklasse-Grafikkarte für Notebooks und mobile Workstations. Sie basiert auf den selben TU117 Turing-Chip wie die Consumer GTX 1650 Ti (Desktop) mit 1024 Shadern. Die Max-Q Variante ist eine auf Effizienz optimierte Version der Quadro T2000 mit verringerten Taktraten. Nach aktuellen Informationen gibt es zwei Varianten mit 35 und 40 Watt Stromverbrauch (TGP) und unterschiedlichen Taktraten.

VarianteShaderTGP (W)Base (MHz)Boost (MHz)
Quadro T2000 Mobile10246015751785
Quadro T2000 Max-Q10244012001620
Quadro T2000 Max-Q1024359301500
GeForce GTX 1650 Ti (Desktop)102475?15301725
GeForce GTX 1660 Ti Mobile15368014551590
GeForce GTX 1650 Mobile8965013951560

Die Quadro-Grafikkarten bieten zertifizierte Treiber, welche auf Stabiltität und Performance bei professionellen Anwendungen (CAD-, DCC-, Medizin-, Prospektions-, Visualisierungsanwendungen) optimiert sind. Dadurch ist die Performance im Vergleich zu den Consumergrafikkarten mit gleichem Chip in diesen Bereichen deutlich besser.

Die kleineren Chips der Turing Serie bietet im Unterschied zu den stärkeren RTX Karten (z.B. Quadro RTX 3000) keine Raytracing und Tensor Kerne. Bei der Turing Architektur gab es auch auf der Ebene der CUDA-Kerne deutliche Verbesserungen. Float und INT Operationen können nun gleichzeitig ausgeführt werden, der Cache wurde vereinheitlicht und verbessert und Adaptive Shading eingeführt. Nvidia spricht dadurch von einer bis zu 50% höheren Leistung pro Kern im Vergleich zu Pascal.

Die Leistung im professionellen Bereich ist je nach Version deutlich unter der normalen Quadro T2000, bei Spielen sollte die Performance der mobilen GTX 1650 trotz der niedrigen Taktraten erreicht werden.

Der Chip wird bei TSMC im 12nm FFN Prozess produziert und durch den relativ niedrigen Stromverbrauch der Max-Q Varianten, eignet sich die T2000Max-Q auch für dünne und leichte Notebooks.

NVIDIA GeForce RTX 3070 Ti

► remove from comparison NVIDIA GeForce RTX 3070 Ti

Die Nvidia GeForce RTX 3070 Ti ist eine schnelle Desktop-Grafikkarte der Ampere-Generation und tritt die Nachfolge der GeForce RTX 2070 Super an. Sie nutzt den großen GA104-Chip mit 6.144 Shadern und 8 GB GDDR6 Grafikspeicher. Mit einer Leistungsaufnahme von 290 Watt braucht die GPU zwar viel Strom unter Last, die Energieeffizienz (Leistung pro Watt) konnte mit Ampere gegenüber Turing aber dennoch gesteigert werden.

NVIDIA GeForce RTX 3050 A Laptop GPUNVIDIA Quadro T2000 Max-QNVIDIA GeForce RTX 3070 Ti
GeForce RTX 3000 Serie
NVIDIA GeForce RTX 3090 Ti 10752 @ 1.56 - 1.86 GHz384 Bit @ 21000 MHz
NVIDIA GeForce RTX 3090 10496 @ 1.4 - 1.7 GHz384 Bit @ 19500 MHz
NVIDIA GeForce RTX 3080 Ti 10240 @ 1.37 - 1.67 GHz384 Bit @ 19000 MHz
NVIDIA GeForce RTX 3080 12 GB 8960/ cores @ 1.26 - 1.71 GHz384 Bit @ 19000 MHz
NVIDIA GeForce RTX 3080 8704 @ 1.45 - 1.71 GHz320 Bit @ 19000 MHz
GeForce RTX 3070 Ti 6144 @ 1.58 - 1.77 GHz256 Bit @ 19000 MHz
GeForce RTX 3080 Ti Laptop GPU 7424 @ 0.98 - 1.59 GHz256 Bit @ 14000 MHz
NVIDIA GeForce RTX 3070 5888 @ 1.5 - 1.73 GHz256 Bit @ 14000 MHz
GeForce RTX 3080 Laptop GPU 6144 @ 0.78 - 1.25 GHz256 Bit @ 14000 MHz
NVIDIA GeForce RTX 3060 Ti 4864 @ 1.41 - 1.67 GHz256 Bit @ 14000 MHz
GeForce RTX 3070 Ti Laptop GPU 5888 @ 0.92 - 1.48 GHz256 Bit @ 14000 MHz
GeForce RTX 3070 Laptop GPU 5120 @ 0.78 - 1.29 GHz256 Bit @ 14000 MHz
NVIDIA GeForce RTX 3060 3584 @ 1.32 - 1.78 GHz192 Bit @ 15000 MHz
GeForce RTX 3080 Max-Q 6144 @ 0.78 - 1.25 GHz256 Bit @ 6000 MHz
GeForce RTX 3070 Max-Q 5120 @ 1.29 GHz256 Bit
GeForce RTX 3060 Laptop GPU 3840 @ 0.82 - 1.7 GHz192 Bit @ 14000 MHz
GeForce RTX 3060 Max-Q 3840 @ 1.28 GHz192 Bit
NVIDIA GeForce RTX 3050 2560 @ 1.55 - 1.78 GHz128 Bit Bit @ 1750 MHz
GeForce RTX 3050 Ti Laptop GPU 2560 @ 1.22 - 1.49 GHz128 Bit @ 12000 MHz
GeForce RTX 3050 6GB Laptop GPU 2560 @ 1.24 - 1.49 GHz96 Bit @ 12000 MHz
GeForce RTX 3050 A Laptop GPU 1792 64 Bit
GeForce RTX 3050 4GB Laptop GPU 2048 @ 1.24 - 1.5 GHz128 Bit @ 12000 MHz
Quadro RTX 6000 (Laptop) 4608 @ 1.28 - 1.46 GHz384 Bit @ 14000 MHz
Quadro RTX 5000 (Laptop) 3072 @ 1.04 - 1.55 GHz256 Bit @ 14000 MHz
Quadro RTX 5000 Max-Q 3072 @ 0.6 - 1.35 GHz256 Bit @ 14000 MHz
Quadro RTX 4000 (Laptop) 2560 @ 1.11 - 1.56 GHz256 Bit @ 14000 MHz
Quadro RTX 4000 Max-Q 2560 @ 0.78 - 1.38 GHz256 Bit @ 14000 MHz
Quadro RTX 3000 (Laptop) 1920 @ 0.95 - 1.38 GHz192 Bit @ 14000 MHz
Quadro RTX 3000 Max-Q 1920 @ 0.6 - 1.22 GHz192 Bit @ 14000 MHz
Quadro T2000 (Laptop) 1024 @ 1.58 - 1.79 GHz128 Bit @ 8000 MHz
Quadro T2000 Max-Q 1024 @ 0.93 - 1.5 GHz128 Bit @ 8000 MHz
T1000
T1200 Laptop GPU 1024 @ 0.86 - 1.43 GHz128 Bit @ 10000 MHz
Quadro T1000 (Laptop) 768 @ 1.4 - 1.46 GHz128 Bit @ 8000 MHz
Quadro T1000 Max-Q 768 @ 0.8 - 1.46 GHz128 Bit @ 8000 MHz
T600 Laptop GPU 896 @ 1.4 GHz128 Bit @ 10000 MHz
T550 Laptop GPU 1024 @ 1.07 - 1.67 GHz64 Bit @ 12000 MHz
T500 Laptop GPU 896 @ 1.37 - 1.7 GHz64 Bit @ 10000 MHz
T600 640 @ 0.74 - 1.34 GHz128 Bit @ 10000 MHz
NVIDIA GeForce RTX 3090 Ti 10752 @ 1.56 - 1.86 GHz384 Bit @ 21000 MHz
NVIDIA GeForce RTX 3090 10496 @ 1.4 - 1.7 GHz384 Bit @ 19500 MHz
NVIDIA GeForce RTX 3080 Ti 10240 @ 1.37 - 1.67 GHz384 Bit @ 19000 MHz
NVIDIA GeForce RTX 3080 12 GB 8960/ cores @ 1.26 - 1.71 GHz384 Bit @ 19000 MHz
NVIDIA GeForce RTX 3080 8704 @ 1.45 - 1.71 GHz320 Bit @ 19000 MHz
GeForce RTX 3070 Ti 6144 @ 1.58 - 1.77 GHz256 Bit @ 19000 MHz
GeForce RTX 3080 Ti Laptop GPU 7424 @ 0.98 - 1.59 GHz256 Bit @ 14000 MHz
NVIDIA GeForce RTX 3070 5888 @ 1.5 - 1.73 GHz256 Bit @ 14000 MHz
GeForce RTX 3080 Laptop GPU 6144 @ 0.78 - 1.25 GHz256 Bit @ 14000 MHz
NVIDIA GeForce RTX 3060 Ti 4864 @ 1.41 - 1.67 GHz256 Bit @ 14000 MHz
GeForce RTX 3070 Ti Laptop GPU 5888 @ 0.92 - 1.48 GHz256 Bit @ 14000 MHz
GeForce RTX 3070 Laptop GPU 5120 @ 0.78 - 1.29 GHz256 Bit @ 14000 MHz
NVIDIA GeForce RTX 3060 3584 @ 1.32 - 1.78 GHz192 Bit @ 15000 MHz
GeForce RTX 3080 Max-Q 6144 @ 0.78 - 1.25 GHz256 Bit @ 6000 MHz
GeForce RTX 3070 Max-Q 5120 @ 1.29 GHz256 Bit
GeForce RTX 3060 Laptop GPU 3840 @ 0.82 - 1.7 GHz192 Bit @ 14000 MHz
GeForce RTX 3060 Max-Q 3840 @ 1.28 GHz192 Bit
NVIDIA GeForce RTX 3050 2560 @ 1.55 - 1.78 GHz128 Bit Bit @ 1750 MHz
GeForce RTX 3050 Ti Laptop GPU 2560 @ 1.22 - 1.49 GHz128 Bit @ 12000 MHz
GeForce RTX 3050 6GB Laptop GPU 2560 @ 1.24 - 1.49 GHz96 Bit @ 12000 MHz
GeForce RTX 3050 A Laptop GPU 1792 64 Bit
GeForce RTX 3050 4GB Laptop GPU 2048 @ 1.24 - 1.5 GHz128 Bit @ 12000 MHz
ArchitekturAda LovelaceTuringAmpere
Pipelines1792 - unified1024 - unified6144 - unified
Speicherbandbreite64 Bit128 Bit256 Bit
SpeichertypGDDR6GDDR5GDDR6
Max. Speichergröße4 GB4 GB8 GB
Shared Memoryneinneinnein
APIDirectX 12_2, Shader 6.7, OpenGL 4.6DirectX 12_1, OpenGL 4.6DirectX 12_, Shader 6.7, OpenGL 4.6, OpenCL 3.0, Vulkan 1.3
Stromverbrauch45 Watt (35 - 80 Watt TGP)35 - 40 Watt290 Watt
Herstellungsprozess5 nm12 nm8 nm
PCIe4.0PCIe 4.0 x16
DisplaysHDMI 2.1, DisplayPort 1.4a4 Displays (max.), HDMI 2.1, DisplayPort 1.4a
FeaturesNVIDIA DLSS, NVIDIA Reflex, Resizable BAR, NVIDIA Broadcast, NVIDIA Ansel, NVIDIA ShadowPlay, NVIDIA G-SYNC, Advanced Optimus, Nvidia Max-Q, Dynamic Boost
Notebookgrößemittel (15.4" z.B.)mittel (15.4" z.B.)
Erscheinungsdatum26.07.2024 27.05.2019 31.05.2021
PredecessorGeForce RTX 3050 4GB Laptop GPU
CodenameN19P-Q3 MAX-QAmpere GA104
Kerntakt930 / 1200 - 1500 / 1620 (Boost) MHz1575 - 1770 (Boost) MHz
Speichertakt8000 MHz19000 effective = 1188 MHz
Transistors4.7 Billion17.4 Billion
TMUs192
ROPs96
Raytracing Cores48
Tensor / AI Cores192
CacheL1: 128 KB, L2: 4 MB
Memory Bandwidth608.3 GB/s
Die Size 392 mm²

Benchmarks

Performance Rating - 3DMark 11 + Fire Strike + Time Spy - GeForce RTX 3070 Ti
16.7 pt (50%)
3DMark - 3DMark Time Spy Score
min: 3348     avg: 3352     median: 3352 (10%)     max: 3356 Points
min: 15076     avg: 15360     median: 15243 (44%)     max: 15762 Points
3DMark - 3DMark Time Spy Graphics
min: 3066     avg: 3094     median: 3094 (8%)     max: 3122 Points
min: 14783     avg: 14893     median: 14923 (39%)     max: 14972 Points
3DMark - 3DMark Ice Storm Unlimited Graphics
75193 Points (8%)
min: 795061     avg: 817850     median: 822127 (83%)     max: 836363 Points
3DMark - 3DMark Ice Storm Extreme Graphics
min: 569417     avg: 598957     median: 605049 (75%)     max: 622405 Points
3DMark - 3DMark Cloud Gate Score
min: 21582     avg: 24992     median: 24991.5 (27%)     max: 28401 Points
min: 82735     avg: 83547     median: 83142 (89%)     max: 84765 Points
3DMark - 3DMark Cloud Gate Graphics
min: 39803     avg: 41106     median: 41106 (11%)     max: 42409 Points
min: 175918     avg: 198137     median: 208428 (55%)     max: 210065 Points
3DMark - 3DMark Fire Strike Standard Score
min: 7320     avg: 7544     median: 7543.5 (13%)     max: 7767 Points
min: 34036     avg: 35493     median: 36017 (64%)     max: 36426 Points
3DMark - 3DMark Fire Strike Standard Graphics
min: 8107     avg: 8262     median: 8261.5 (9%)     max: 8416 Points
min: 37472     avg: 37780     median: 37663 (43%)     max: 38206 Points
3DMark - 3DMark Ice Storm Graphics
min: 633420     avg: 676165     median: 666747 (78%)     max: 728328 Points
3DMark - 3DMark Night Raid
min: 80725     avg: 83692     median: 80881 (76%)     max: 89469 Points
3DMark - 3DMark Night Raid Graphics Score
min: 168217     avg: 170669     median: 170907 (66%)     max: 172883 Points
3DMark 11 - 3DM11 Performance Score
min: 11695     avg: 11907     median: 11907 (17%)     max: 12119 Points
min: 43271     avg: 44206     median: 44497 (62%)     max: 44850 Points
3DMark 11 - 3DM11 Performance GPU
min: 11454     avg: 11461     median: 11461 (10%)     max: 11468 Points
min: 49416     avg: 49875     median: 49760 (43%)     max: 50450 Points
3DMark Vantage
3DM Vant. Perf. total + NVIDIA Quadro T2000 Max-Q
3DMark Vantage - 3DM Vant. Perf. total
39269 Points (11%)
3DM Vant. Perf. total + NVIDIA GeForce RTX 3070 Ti
min: 120188     avg: 120454     median: 120454 (35%)     max: 120720 Points
3DM Vant. Perf. GPU no PhysX + NVIDIA Quadro T2000 Max-Q
3DMark Vantage - 3DM Vant. Perf. GPU no PhysX
36812 Points (20%)
3DM Vant. Perf. GPU no PhysX + NVIDIA GeForce RTX 3070 Ti
min: 126244     avg: 126438     median: 126438 (69%)     max: 126631 Points
3DMark 05 - 3DMark 05 - Standard
min: 84337     avg: 85241     median: 85240.5 (93%)     max: 86144 Points
3DMark 06 3DMark 06 - Standard 1280x1024 + NVIDIA Quadro T2000 Max-Q
3DMark 06
36376 Points (48%)
3DMark 06 - Standard 1280x1024 + NVIDIA GeForce RTX 3070 Ti
min: 66399     avg: 67408     median: 67407.5 (88%)     max: 68416 Points
Unigine Valley 1.0 - Unigine Valley 1.0 DX
min: 193.2     avg: 194.5     median: 194.5 (60%)     max: 195.7 fps
Blender - Blender 3.3 Classroom CUDA *
33 Seconds (5%)
Blender - Blender 3.3 Classroom OPTIX *
20 Seconds (7%)
SPECviewperf 12
specvp12 sw-03 + NVIDIA Quadro T2000 Max-Q
SPECviewperf 12 - specvp12 sw-03
min: 94     avg: 97.4     median: 97.4 (24%)     max: 100.8 fps
specvp12 sw-03 + NVIDIA GeForce RTX 3070 Ti
min: 101     avg: 101.5     median: 101.5 (25%)     max: 102 fps
specvp12 snx-02 + NVIDIA Quadro T2000 Max-Q
SPECviewperf 12 - specvp12 snx-02
min: 74.5     avg: 74.6     median: 74.6 (11%)     max: 74.6 fps
specvp12 snx-02 + NVIDIA GeForce RTX 3070 Ti
min: 14.7     avg: 14.9     median: 14.9 (2%)     max: 15.1 fps
specvp12 showcase-01 + NVIDIA Quadro T2000 Max-Q
SPECviewperf 12 - specvp12 showcase-01
min: 37.81     avg: 40.3     median: 40.3 (9%)     max: 42.75 fps
specvp12 showcase-01 + NVIDIA GeForce RTX 3070 Ti
min: 187     avg: 193     median: 193 (42%)     max: 199 fps
specvp12 mediacal-01 + NVIDIA Quadro T2000 Max-Q
SPECviewperf 12 - specvp12 mediacal-01
min: 28.57     avg: 32.1     median: 32.1 (8%)     max: 35.53 fps
specvp12 mediacal-01 + NVIDIA GeForce RTX 3070 Ti
106 fps (27%)
specvp12 maya-04 + NVIDIA Quadro T2000 Max-Q
SPECviewperf 12 - specvp12 maya-04
min: 50.4     avg: 50.7     median: 50.7 (14%)     max: 51 fps
specvp12 maya-04 + NVIDIA GeForce RTX 3070 Ti
min: 279     avg: 281     median: 281 (77%)     max: 283 fps
specvp12 energy-01 + NVIDIA Quadro T2000 Max-Q
SPECviewperf 12 - specvp12 energy-01
min: 6.31     avg: 7.1     median: 7.1 (6%)     max: 7.79 fps
specvp12 energy-01 + NVIDIA GeForce RTX 3070 Ti
min: 18     avg: 18.1     median: 18.1 (16%)     max: 18.1 fps
specvp12 creo-01 + NVIDIA Quadro T2000 Max-Q
SPECviewperf 12 - specvp12 creo-01
min: 88.3     avg: 89     median: 89 (36%)     max: 89.6 fps
specvp12 creo-01 + NVIDIA GeForce RTX 3070 Ti
min: 72.6     avg: 72.7     median: 72.7 (29%)     max: 72.8 fps
specvp12 catia-04 + NVIDIA Quadro T2000 Max-Q
SPECviewperf 12 - specvp12 catia-04
min: 88.9     avg: 90.5     median: 90.5 (15%)     max: 92 fps
specvp12 catia-04 + NVIDIA GeForce RTX 3070 Ti
min: 136     avg: 136.5     median: 136.5 (23%)     max: 137 fps
specvp12 3dsmax-05 + NVIDIA Quadro T2000 Max-Q
SPECviewperf 12 - specvp12 3dsmax-05
min: 93.7     avg: 93.9     median: 93.9 (16%)     max: 94 fps
specvp12 3dsmax-05 + NVIDIA GeForce RTX 3070 Ti
330 fps (58%)
SPECviewperf 13 specvp13 sw-04 + NVIDIA Quadro T2000 Max-Q
SPECviewperf 13 - specvp13 sw-04
min: 97.2     avg: 100.6     median: 100.6 (27%)     max: 103.9 fps
specvp13 sw-04 + NVIDIA GeForce RTX 3070 Ti
min: 146     avg: 146.5     median: 146.5 (39%)     max: 147 fps
specvp13 snx-03 + NVIDIA Quadro T2000 Max-Q
SPECviewperf 13 - specvp13 snx-03
min: 139.4     avg: 141.6     median: 141.6 (16%)     max: 143.8 fps
specvp13 snx-03 + NVIDIA GeForce RTX 3070 Ti
min: 26.4     avg: 26.9     median: 26.9 (3%)     max: 27.3 fps
specvp13 showcase-02 + NVIDIA Quadro T2000 Max-Q
SPECviewperf 13 - specvp13 showcase-02
min: 37.56     avg: 40     median: 40 (9%)     max: 42.39 fps
specvp13 showcase-02 + NVIDIA GeForce RTX 3070 Ti
min: 188     avg: 193     median: 193 (42%)     max: 198 fps
specvp13 medical-02 + NVIDIA Quadro T2000 Max-Q
SPECviewperf 13 - specvp13 medical-02
min: 41.71     avg: 44.9     median: 44.9 (9%)     max: 48.02 fps
specvp13 medical-02 + NVIDIA GeForce RTX 3070 Ti
min: 83.6     avg: 84.1     median: 84.1 (18%)     max: 84.6 fps
specvp13 maya-05 + NVIDIA Quadro T2000 Max-Q
SPECviewperf 13 - specvp13 maya-05
min: 105.7     avg: 108     median: 108 (12%)     max: 110.2 fps
specvp13 maya-05 + NVIDIA GeForce RTX 3070 Ti
437 fps (50%)
specvp13 energy-02 + NVIDIA Quadro T2000 Max-Q
SPECviewperf 13 - specvp13 energy-02
min: 14.87     avg: 15.3     median: 15.3 (5%)     max: 15.66 fps
specvp13 energy-02 + NVIDIA GeForce RTX 3070 Ti
min: 30     avg: 30.1     median: 30.1 (10%)     max: 30.2 fps
specvp13 creo-02 + NVIDIA Quadro T2000 Max-Q
SPECviewperf 13 - specvp13 creo-02
min: 109.6     avg: 113.2     median: 113.2 (17%)     max: 116.8 fps
specvp13 creo-02 + NVIDIA GeForce RTX 3070 Ti
min: 286     avg: 287     median: 287 (42%)     max: 288 fps
specvp13 catia-05 + NVIDIA Quadro T2000 Max-Q
SPECviewperf 13 - specvp13 catia-05
min: 134.6     avg: 139.3     median: 139.3 (15%)     max: 143.9 fps
specvp13 catia-05 + NVIDIA GeForce RTX 3070 Ti
min: 201     avg: 201.5     median: 201.5 (22%)     max: 202 fps
specvp13 3dsmax-06 + NVIDIA Quadro T2000 Max-Q
SPECviewperf 13 - specvp13 3dsmax-06
min: 88.9     avg: 91.1     median: 91.1 (16%)     max: 93.3 fps
specvp13 3dsmax-06 + NVIDIA GeForce RTX 3070 Ti
330 fps (57%)
SPECviewperf 2020 specvp2020 snx-04 4k + NVIDIA GeForce RTX 3070 Ti
SPECviewperf 2020 - specvp2020 snx-04 4k
min: 22.2     avg: 22.4     median: 22.4 (2%)     max: 22.5 fps
specvp2020 medical-03 4k + NVIDIA GeForce RTX 3070 Ti
SPECviewperf 2020 - specvp2020 medical-03 4k
min: 16.3     avg: 16.4     median: 16.4 (16%)     max: 16.5 fps
specvp2020 maya-06 4k + NVIDIA GeForce RTX 3070 Ti
SPECviewperf 2020 - specvp2020 maya-06 4k
min: 289     avg: 289.5     median: 289.5 (47%)     max: 290 fps
specvp2020 energy-03 4k + NVIDIA GeForce RTX 3070 Ti
SPECviewperf 2020 - specvp2020 energy-03 4k
min: 39.1     avg: 39.4     median: 39.4 (9%)     max: 39.6 fps
specvp2020 creo-03 4k + NVIDIA GeForce RTX 3070 Ti
SPECviewperf 2020 - specvp2020 creo-03 4k
min: 99.3     avg: 99.4     median: 99.4 (47%)     max: 99.5 fps
specvp2020 catia-06 4k + NVIDIA GeForce RTX 3070 Ti
SPECviewperf 2020 - specvp2020 catia-06 4k
min: 48     avg: 48.3     median: 48.3 (32%)     max: 48.6 fps
specvp2020 3dsmax-07 4k + NVIDIA GeForce RTX 3070 Ti
SPECviewperf 2020 - specvp2020 3dsmax-07 4k
min: 99     avg: 99.3     median: 99.3 (41%)     max: 99.5 fps
Cinebench R10 Cinebench R10 Shading (32bit) + NVIDIA Quadro T2000 Max-Q
Cinebench R10 - Cinebench R10 Shading (32bit)
5840 Points (4%)
Cinebench R11.5 Cinebench R11.5 OpenGL 64 Bit + NVIDIA Quadro T2000 Max-Q
Cinebench R11.5 - Cinebench R11.5 OpenGL 64 Bit
141.2 fps (46%)
Cinebench R15
Cinebench R15 OpenGL 64 Bit + NVIDIA Quadro T2000 Max-Q
Cinebench R15 - Cinebench R15 OpenGL 64 Bit
min: 216     avg: 220     median: 220 (13%)     max: 224 fps
Cinebench R15 OpenGL Ref. Match 64 Bit + NVIDIA Quadro T2000 Max-Q
Cinebench R15 - Cinebench R15 OpenGL Ref. Match 64 Bit
99.6 % (100%)
GFXBench - GFXBench 5.0 Aztec Ruins High Tier Offscreen
64.8 fps (12%)
GFXBench - GFXBench 5.0 Aztec Ruins Normal Tier Offscreen
133.4 fps (10%)
GFXBench - GFXBench Car Chase Offscreen
150.8 fps (17%)
GFXBench 3.1 - GFXBench Manhattan ES 3.1 Offscreen
234.9 fps (5%)
GFXBench 3.0 - GFXBench 3.0 Manhattan Offscreen
255.2 fps (15%)
GFXBench (DX / GLBenchmark) 2.7
GFXBench T-Rex HD Offscreen C24Z16 + NVIDIA Quadro T2000 Max-Q
GFXBench (DX / GLBenchmark) 2.7 - GFXBench T-Rex HD Offscreen C24Z16
622 fps (5%)
LuxMark v2.0 64Bit - LuxMark v2.0 Room GPU
1640 Samples/s (7%)
min: 4481     avg: 4487     median: 4486.5 (20%)     max: 4492 Samples/s
LuxMark v2.0 64Bit - LuxMark v2.0 Sala GPU
3050 Samples/s (5%)
min: 11083     avg: 11105     median: 11104.5 (19%)     max: 11126 Samples/s
ComputeMark v2.1 - ComputeMark v2.1 Result
6331 Points (7%)
min: 34007     avg: 34173     median: 34173 (37%)     max: 34339 Points
Power Consumption - Furmark Stress Test Power Consumption - external Monitor *
min: 472     avg: 474     median: 474 (67%)     max: 476 Watt
Power Consumption - The Witcher 3 Power Consumption - external Monitor *
453 Watt (63%)
Power Consumption - Witcher 3 Power Consumption *
min: 76.7     avg: 83.3     median: 83.3 (18%)     max: 89.9 Watt
Power Consumption - Witcher 3 ultra Power Efficiency
min: 0.3604     avg: 0.4     median: 0.4 (36%)     max: 0.4355 fps per Watt
Power Consumption - Witcher 3 ultra Power Efficiency - external Monitor
0.3 fps per Watt (27%)
Power Consumption - Cyberpunk 2077 Power Consumption - external Monitor *
566 Watt (72%)
Emissions Witcher 3 Fan Noise + NVIDIA Quadro T2000 Max-Q
Emissions - Witcher 3 Fan Noise
min: 34.7     avg: 36.9     median: 36.9 (59%)     max: 39 dB(A)

Average Benchmarks NVIDIA Quadro T2000 Max-Q → 0% n=0

Average Benchmarks NVIDIA GeForce RTX 3070 Ti → 0% n=0

- Bereich der Benchmarkergebnisse für diese Grafikkarte
- Durchschnittliche Benchmarkergebnisse für diese Grafikkarte
* Smaller numbers mean a higher performance
1 This benchmark is not used for the average calculation

Spiele-Benchmarks

Die folgenden Benchmarks basieren auf unseren Spieletests mit Testnotebooks. Die Performance dieser Grafikkarte bei den gelisteten Spielen ist abhängig von der verwendeten CPU, Speicherausstattung, Treiber und auch Betriebssystem. Dadurch müssen die untenstehenden Werte nicht repräsentativ sein. Detaillierte Informationen über das verwendete System sehen Sie nach einem Klick auf den fps-Wert.

low 1920x1080
GeForce RTX 3070 Ti:
240  fps
med. 1920x1080
GeForce RTX 3070 Ti:
205  fps
high 1920x1080
GeForce RTX 3070 Ti:
166  fps
ultra 1920x1080
GeForce RTX 3070 Ti:
152.3  fps
QHD 2560x1440
GeForce RTX 3070 Ti:
101.3  fps
4K 3840x2160
GeForce RTX 3070 Ti:
53.9  fps
low 1920x1080
GeForce RTX 3070 Ti:
214  fps
med. 1920x1080
GeForce RTX 3070 Ti:
141.8  fps
high 1920x1080
GeForce RTX 3070 Ti:
110.2  fps
ultra 1920x1080
GeForce RTX 3070 Ti:
94.2  fps
QHD 2560x1440
GeForce RTX 3070 Ti:
63.8  fps
4K 3840x2160
GeForce RTX 3070 Ti:
35.9  fps
4K DLSS 3840x2160
GeForce RTX 3070 Ti:
35.2  fps
F1 24

F1 24

2024
low 1920x1080
GeForce RTX 3070 Ti:
429  fps
med. 1920x1080
GeForce RTX 3070 Ti:
357  fps
high 1920x1080
GeForce RTX 3070 Ti:
270  fps
ultra 1920x1080
GeForce RTX 3070 Ti:
88.2  fps
QHD 2560x1440
GeForce RTX 3070 Ti:
57.5  fps
4K 3840x2160
GeForce RTX 3070 Ti:
28.2  fps
4K DLSS 3840x2160
GeForce RTX 3070 Ti:
50.2  fps
low 1920x1080
GeForce RTX 3070 Ti:
87.8  fps
med. 1920x1080
GeForce RTX 3070 Ti:
73.3  fps
high 1920x1080
GeForce RTX 3070 Ti:
53.6  fps
QHD 2560x1440
GeForce RTX 3070 Ti:
38.8  fps
4K 3840x2160
GeForce RTX 3070 Ti:
17.1  fps
4K DLSS 3840x2160
GeForce RTX 3070 Ti:
37.1  fps
low 1920x1080
GeForce RTX 3070 Ti:
140.1  fps
med. 1920x1080
GeForce RTX 3070 Ti:
120.6  fps
high 1920x1080
GeForce RTX 3070 Ti:
109.9  fps
ultra 1920x1080
GeForce RTX 3070 Ti:
86.9  fps
QHD 2560x1440
GeForce RTX 3070 Ti:
48.9  fps
4K 3840x2160
GeForce RTX 3070 Ti:
27.4  fps
4K DLSS 3840x2160
GeForce RTX 3070 Ti:
55.4  fps
low 1920x1080
GeForce RTX 3070 Ti:
106.8  fps
high 1920x1080
GeForce RTX 3070 Ti:
97.3  fps
QHD 2560x1440
GeForce RTX 3070 Ti:
76.9  fps
4K 3840x2160
GeForce RTX 3070 Ti:
47.4  fps
4K DLSS 3840x2160
GeForce RTX 3070 Ti:
49.9  fps
low 1920x1080
GeForce RTX 3070 Ti:
158.3  fps
med. 1920x1080
GeForce RTX 3070 Ti:
134.9  fps
high 1920x1080
GeForce RTX 3070 Ti:
97  fps
ultra 1920x1080
GeForce RTX 3070 Ti:
86.7  fps
QHD 2560x1440
GeForce RTX 3070 Ti:
68.5  fps
4K 3840x2160
GeForce RTX 3070 Ti:
29.1  fps
4K DLSS 3840x2160
GeForce RTX 3070 Ti:
61.6  fps
low 1920x1080
GeForce RTX 3070 Ti:
271  fps
med. 1920x1080
GeForce RTX 3070 Ti:
264  fps
high 1920x1080
GeForce RTX 3070 Ti:
226  fps
ultra 1920x1080
GeForce RTX 3070 Ti:
159.6  fps
QHD 2560x1440
GeForce RTX 3070 Ti:
99.4  fps
4K 3840x2160
GeForce RTX 3070 Ti:
26  fps
4K DLSS 3840x2160
GeForce RTX 3070 Ti:
86.2  fps
low 1920x1080
GeForce RTX 3070 Ti:
295  fps
med. 1920x1080
GeForce RTX 3070 Ti:
293  fps
high 1920x1080
GeForce RTX 3070 Ti:
281  fps
ultra 1920x1080
GeForce RTX 3070 Ti:
232  fps
QHD 2560x1440
GeForce RTX 3070 Ti:
156.3  fps
4K 3840x2160
GeForce RTX 3070 Ti:
79.6  fps
low 1920x1080
GeForce RTX 3070 Ti:
153  fps
med. 1920x1080
GeForce RTX 3070 Ti:
140  fps
high 1920x1080
GeForce RTX 3070 Ti:
112  fps
ultra 1920x1080
GeForce RTX 3070 Ti:
87  fps
QHD 2560x1440
GeForce RTX 3070 Ti:
72  fps
4K 3840x2160
GeForce RTX 3070 Ti:
45  fps
4K DLSS 3840x2160
GeForce RTX 3070 Ti:
66  fps
low 1920x1080
GeForce RTX 3070 Ti:
208  fps
med. 1920x1080
GeForce RTX 3070 Ti:
156.5  fps
high 1920x1080
GeForce RTX 3070 Ti:
137.5  fps
ultra 1920x1080
GeForce RTX 3070 Ti:
134.1  fps
QHD 2560x1440
GeForce RTX 3070 Ti:
97.7  fps
4K 3840x2160
GeForce RTX 3070 Ti:
45.9  fps
low 1920x1080
GeForce RTX 3070 Ti:
105.2  fps
med. 1920x1080
GeForce RTX 3070 Ti:
91.4  fps
high 1920x1080
GeForce RTX 3070 Ti:
78.3  fps
ultra 1920x1080
GeForce RTX 3070 Ti:
59.6  fps
QHD 2560x1440
GeForce RTX 3070 Ti:
41.8  fps
4K 3840x2160
GeForce RTX 3070 Ti:
23.9  fps
Palworld

Palworld

2024
low 1920x1080
GeForce RTX 3070 Ti:
239  fps
med. 1920x1080
GeForce RTX 3070 Ti:
219  fps
high 1920x1080
GeForce RTX 3070 Ti:
143.4  fps
ultra 1920x1080
GeForce RTX 3070 Ti:
132.4  fps
QHD 2560x1440
GeForce RTX 3070 Ti:
96.5  fps
4K 3840x2160
GeForce RTX 3070 Ti:
54.3  fps
4K DLSS 3840x2160
GeForce RTX 3070 Ti:
73.2  fps
med. 1920x1080
GeForce RTX 3070 Ti:
359  fps
high 1920x1080
GeForce RTX 3070 Ti:
359  fps
ultra 1920x1080
GeForce RTX 3070 Ti:
359  fps
QHD 2560x1440
GeForce RTX 3070 Ti:
359  fps
4K 3840x2160
GeForce RTX 3070 Ti:
267  fps
low 1920x1080
GeForce RTX 3070 Ti:
297  fps
med. 1920x1080
GeForce RTX 3070 Ti:
293  fps
high 1920x1080
GeForce RTX 3070 Ti:
263  fps
ultra 1920x1080
GeForce RTX 3070 Ti:
201  fps
QHD 2560x1440
GeForce RTX 3070 Ti:
124.7  fps
4K 3840x2160
GeForce RTX 3070 Ti:
58.7  fps
4K DLSS 3840x2160
GeForce RTX 3070 Ti:
115.7  fps
low 1920x1080
GeForce RTX 3070 Ti:
346  fps
med. 1920x1080
GeForce RTX 3070 Ti:
271  fps
high 1920x1080
GeForce RTX 3070 Ti:
238  fps
ultra 1920x1080
GeForce RTX 3070 Ti:
184.8  fps
QHD 2560x1440
GeForce RTX 3070 Ti:
118.7  fps
4K 3840x2160
GeForce RTX 3070 Ti:
57.8  fps
low 1920x1080
GeForce RTX 3070 Ti:
111 113 ~ 112 fps
med. 1920x1080
GeForce RTX 3070 Ti:
103 104 ~ 104 fps
high 1920x1080
GeForce RTX 3070 Ti:
89 90 ~ 90 fps
ultra 1920x1080
GeForce RTX 3070 Ti:
69 69 ~ 69 fps
QHD 2560x1440
GeForce RTX 3070 Ti:
47 47 ~ 47 fps
4K 3840x2160
GeForce RTX 3070 Ti:
24 25 ~ 25 fps
4K DLSS 3840x2160
GeForce RTX 3070 Ti:
39 42 ~ 41 fps
low 1920x1080
GeForce RTX 3070 Ti:
172  fps
med. 1920x1080
GeForce RTX 3070 Ti:
154  fps
high 1920x1080
GeForce RTX 3070 Ti:
121  fps
ultra 1920x1080
GeForce RTX 3070 Ti:
114  fps
QHD 2560x1440
GeForce RTX 3070 Ti:
81  fps
4K 3840x2160
GeForce RTX 3070 Ti:
50  fps
low 1920x1080
GeForce RTX 3070 Ti:
191.4  fps
med. 1920x1080
GeForce RTX 3070 Ti:
146.5  fps
high 1920x1080
GeForce RTX 3070 Ti:
134.9  fps
ultra 1920x1080
GeForce RTX 3070 Ti:
126.3  fps
QHD 2560x1440
GeForce RTX 3070 Ti:
93.8  fps
4K 3840x2160
GeForce RTX 3070 Ti:
52.2  fps
4K DLSS 3840x2160
GeForce RTX 3070 Ti:
77.5  fps
low 1920x1080
GeForce RTX 3070 Ti:
86.7  fps
med. 1920x1080
GeForce RTX 3070 Ti:
72.5  fps
high 1920x1080
GeForce RTX 3070 Ti:
66.7  fps
QHD 2560x1440
GeForce RTX 3070 Ti:
49.5  fps
4K 3840x2160
GeForce RTX 3070 Ti:
29.4  fps
low 1920x1080
GeForce RTX 3070 Ti:
129.2  fps
med. 1920x1080
GeForce RTX 3070 Ti:
108.9  fps
high 1920x1080
GeForce RTX 3070 Ti:
83.2  fps
ultra 1920x1080
GeForce RTX 3070 Ti:
57.2  fps
QHD 2560x1440
GeForce RTX 3070 Ti:
40  fps
4K 3840x2160
GeForce RTX 3070 Ti:
20.7  fps
4K DLSS 3840x2160
GeForce RTX 3070 Ti:
39.3  fps
low 1920x1080
GeForce RTX 3070 Ti:
508.5  fps
med. 1920x1080
GeForce RTX 3070 Ti:
321.8  fps
high 1920x1080
GeForce RTX 3070 Ti:
202.4  fps
ultra 1920x1080
GeForce RTX 3070 Ti:
163.5  fps
QHD 2560x1440
GeForce RTX 3070 Ti:
119.4  fps
4K 3840x2160
GeForce RTX 3070 Ti:
62.9  fps
low 1920x1080
GeForce RTX 3070 Ti:
152 165 ~ 159 fps
med. 1920x1080
GeForce RTX 3070 Ti:
141 155 ~ 148 fps
high 1920x1080
GeForce RTX 3070 Ti:
135 147 ~ 141 fps
ultra 1920x1080
GeForce RTX 3070 Ti:
110 118 ~ 114 fps
QHD 2560x1440
GeForce RTX 3070 Ti:
88 91 ~ 90 fps
4K 3840x2160
GeForce RTX 3070 Ti:
55 59 ~ 57 fps
4K DLSS 3840x2160
GeForce RTX 3070 Ti:
71 77 ~ 74 fps
low 1920x1080
GeForce RTX 3070 Ti:
358  fps
med. 1920x1080
GeForce RTX 3070 Ti:
318  fps
high 1920x1080
GeForce RTX 3070 Ti:
262  fps
ultra 1920x1080
GeForce RTX 3070 Ti:
246  fps
QHD 2560x1440
GeForce RTX 3070 Ti:
190  fps
4K 3840x2160
GeForce RTX 3070 Ti:
116.6  fps
low 1920x1080
GeForce RTX 3070 Ti:
350  fps
med. 1920x1080
GeForce RTX 3070 Ti:
337  fps
high 1920x1080
GeForce RTX 3070 Ti:
292  fps
ultra 1920x1080
GeForce RTX 3070 Ti:
240  fps
QHD 2560x1440
GeForce RTX 3070 Ti:
159.5  fps
4K 3840x2160
GeForce RTX 3070 Ti:
94.2  fps
low 1920x1080
GeForce RTX 3070 Ti:
192.7  fps
med. 1920x1080
GeForce RTX 3070 Ti:
152  fps
high 1920x1080
GeForce RTX 3070 Ti:
130.6  fps
ultra 1920x1080
GeForce RTX 3070 Ti:
114.4  fps
QHD 2560x1440
GeForce RTX 3070 Ti:
71.4  fps
4K 3840x2160
GeForce RTX 3070 Ti:
32.5  fps
Lies of P

Lies of P

2023
low 1920x1080
GeForce RTX 3070 Ti:
263  fps
med. 1920x1080
GeForce RTX 3070 Ti:
230  fps
high 1920x1080
GeForce RTX 3070 Ti:
201  fps
ultra 1920x1080
GeForce RTX 3070 Ti:
180.9  fps
QHD 2560x1440
GeForce RTX 3070 Ti:
124.3  fps
4K 3840x2160
GeForce RTX 3070 Ti:
65.2  fps
4K DLSS 3840x2160
GeForce RTX 3070 Ti:
100.3  fps
Starfield

Starfield

2023
low 1920x1080
GeForce RTX 3070 Ti:
86.4  fps
med. 1920x1080
GeForce RTX 3070 Ti:
74.9  fps
high 1920x1080
GeForce RTX 3070 Ti:
61.7  fps
ultra 1920x1080
GeForce RTX 3070 Ti:
56.3  fps
QHD 2560x1440
GeForce RTX 3070 Ti:
46.7  fps
4K 3840x2160
GeForce RTX 3070 Ti:
31.8  fps
low 1920x1080
GeForce RTX 3070 Ti:
119.6  fps
med. 1920x1080
GeForce RTX 3070 Ti:
119.6  fps
high 1920x1080
GeForce RTX 3070 Ti:
119.6  fps
ultra 1920x1080
GeForce RTX 3070 Ti:
119.3  fps
QHD 2560x1440
GeForce RTX 3070 Ti:
109.8  fps
4K 3840x2160
GeForce RTX 3070 Ti:
66.2  fps
low 1920x1080
GeForce RTX 3070 Ti:
85.3  fps
high 1920x1080
GeForce RTX 3070 Ti:
72.6  fps
ultra 1920x1080
GeForce RTX 3070 Ti:
60  fps
QHD 2560x1440
GeForce RTX 3070 Ti:
41.9  fps
4K 3840x2160
GeForce RTX 3070 Ti:
23.2  fps
low 1920x1080
GeForce RTX 3070 Ti:
183.2  fps
med. 1920x1080
GeForce RTX 3070 Ti:
190.4  fps
high 1920x1080
GeForce RTX 3070 Ti:
195.7  fps
ultra 1920x1080
GeForce RTX 3070 Ti:
159.7  fps
QHD 2560x1440
GeForce RTX 3070 Ti:
110.9  fps
4K 3840x2160
GeForce RTX 3070 Ti:
60.8  fps
low 1920x1080
GeForce RTX 3070 Ti:
207  fps
med. 1920x1080
GeForce RTX 3070 Ti:
162  fps
high 1920x1080
GeForce RTX 3070 Ti:
142.1  fps
ultra 1920x1080
GeForce RTX 3070 Ti:
140.1  fps
QHD 2560x1440
GeForce RTX 3070 Ti:
97.8  fps
4K 3840x2160
GeForce RTX 3070 Ti:
51.7  fps
4K DLSS 3840x2160
GeForce RTX 3070 Ti:
83.8  fps
low 1920x1080
GeForce RTX 3070 Ti:
132.6  fps
med. 1920x1080
GeForce RTX 3070 Ti:
115  fps
high 1920x1080
GeForce RTX 3070 Ti:
93.7  fps
ultra 1920x1080
GeForce RTX 3070 Ti:
83.7  fps
QHD 2560x1440
GeForce RTX 3070 Ti:
69.1  fps
4K 3840x2160
GeForce RTX 3070 Ti:
45.7  fps
F1 23

F1 23

2023
low 1920x1080
GeForce RTX 3070 Ti:
450  fps
med. 1920x1080
GeForce RTX 3070 Ti:
399  fps
high 1920x1080
GeForce RTX 3070 Ti:
284  fps
ultra 1920x1080
GeForce RTX 3070 Ti:
92.4  fps
QHD 2560x1440
GeForce RTX 3070 Ti:
59.3  fps
4K 3840x2160
GeForce RTX 3070 Ti:
28.8  fps
4K DLSS 3840x2160
GeForce RTX 3070 Ti:
50.7  fps
Diablo 4

Diablo 4

2023
low 1920x1080
GeForce RTX 3070 Ti:
385  fps
med. 1920x1080
GeForce RTX 3070 Ti:
340  fps
high 1920x1080
GeForce RTX 3070 Ti:
299  fps
ultra 1920x1080
GeForce RTX 3070 Ti:
252  fps
QHD 2560x1440
GeForce RTX 3070 Ti:
158.8  fps
4K 3840x2160
GeForce RTX 3070 Ti:
89.1  fps
low 1920x1080
GeForce RTX 3070 Ti:
123.7  fps
med. 1920x1080
GeForce RTX 3070 Ti:
109.1  fps
high 1920x1080
GeForce RTX 3070 Ti:
96.4  fps
ultra 1920x1080
GeForce RTX 3070 Ti:
100.5  fps
QHD 2560x1440
GeForce RTX 3070 Ti:
61.1  fps
4K 3840x2160
GeForce RTX 3070 Ti:
30.3  fps
low 1920x1080
GeForce RTX 3070 Ti:
351  fps
med. 1920x1080
GeForce RTX 3070 Ti:
332  fps
high 1920x1080
GeForce RTX 3070 Ti:
250  fps
ultra 1920x1080
GeForce RTX 3070 Ti:
191  fps
QHD 2560x1440
GeForce RTX 3070 Ti:
133.6  fps
4K 3840x2160
GeForce RTX 3070 Ti:
67.9  fps
low 1920x1080
GeForce RTX 3070 Ti:
148.8  fps
med. 1920x1080
GeForce RTX 3070 Ti:
121.9  fps
high 1920x1080
GeForce RTX 3070 Ti:
108.3  fps
ultra 1920x1080
GeForce RTX 3070 Ti:
90.1  fps
QHD 2560x1440
GeForce RTX 3070 Ti:
57  fps
4K 3840x2160
GeForce RTX 3070 Ti:
25  fps
4K DLSS 3840x2160
GeForce RTX 3070 Ti:
41.9  fps
low 1920x1080
GeForce RTX 3070 Ti:
219  fps
med. 1920x1080
GeForce RTX 3070 Ti:
155.7  fps
high 1920x1080
GeForce RTX 3070 Ti:
143.7  fps
ultra 1920x1080
GeForce RTX 3070 Ti:
105  fps
QHD 2560x1440
GeForce RTX 3070 Ti:
79.2  fps
4K 3840x2160
GeForce RTX 3070 Ti:
47.2  fps
low 1920x1080
GeForce RTX 3070 Ti:
195  fps
med. 1920x1080
GeForce RTX 3070 Ti:
159  fps
high 1920x1080
GeForce RTX 3070 Ti:
104  fps
ultra 1920x1080
GeForce RTX 3070 Ti:
103  fps
QHD 2560x1440
GeForce RTX 3070 Ti:
78  fps
4K 3840x2160
GeForce RTX 3070 Ti:
46.7  fps
low 1920x1080
GeForce RTX 3070 Ti:
187.9  fps
med. 1920x1080
GeForce RTX 3070 Ti:
176.6  fps
high 1920x1080
GeForce RTX 3070 Ti:
153.8  fps
ultra 1920x1080
GeForce RTX 3070 Ti:
129.8  fps
QHD 2560x1440
GeForce RTX 3070 Ti:
98.7  fps
4K 3840x2160
GeForce RTX 3070 Ti:
55.8  fps
low 1920x1080
GeForce RTX 3070 Ti:
175.9  fps
med. 1920x1080
GeForce RTX 3070 Ti:
162.5  fps
high 1920x1080
GeForce RTX 3070 Ti:
151.3  fps
ultra 1920x1080
GeForce RTX 3070 Ti:
143.3  fps
QHD 2560x1440
GeForce RTX 3070 Ti:
110.7  fps
4K 3840x2160
GeForce RTX 3070 Ti:
58.3  fps
low 1920x1080
GeForce RTX 3070 Ti:
151  fps
med. 1920x1080
GeForce RTX 3070 Ti:
143  fps
high 1920x1080
GeForce RTX 3070 Ti:
115  fps
ultra 1920x1080
GeForce RTX 3070 Ti:
113  fps
QHD 2560x1440
GeForce RTX 3070 Ti:
81  fps
4K 3840x2160
GeForce RTX 3070 Ti:
50  fps
4K DLSS 3840x2160
GeForce RTX 3070 Ti:
78  fps
low 1920x1080
GeForce RTX 3070 Ti:
106.2  fps
med. 1920x1080
GeForce RTX 3070 Ti:
104.4  fps
high 1920x1080
GeForce RTX 3070 Ti:
100.4  fps
ultra 1920x1080
GeForce RTX 3070 Ti:
96.4  fps
QHD 2560x1440
GeForce RTX 3070 Ti:
77.4  fps
4K 3840x2160
GeForce RTX 3070 Ti:
38.5  fps
low 1920x1080
GeForce RTX 3070 Ti:
167.1  fps
med. 1920x1080
GeForce RTX 3070 Ti:
129.1  fps
high 1920x1080
GeForce RTX 3070 Ti:
95.8  fps
ultra 1920x1080
GeForce RTX 3070 Ti:
75.5  fps
QHD 2560x1440
GeForce RTX 3070 Ti:
52.8  fps
4K 3840x2160
GeForce RTX 3070 Ti:
30.5  fps
FIFA 23

FIFA 23

2022
low 1920x1080
GeForce RTX 3070 Ti:
318  fps
med. 1920x1080
GeForce RTX 3070 Ti:
272  fps
high 1920x1080
GeForce RTX 3070 Ti:
226  fps
ultra 1920x1080
GeForce RTX 3070 Ti:
224  fps
QHD 2560x1440
GeForce RTX 3070 Ti:
193.5  fps
4K 3840x2160
GeForce RTX 3070 Ti:
116.1  fps
low 1920x1080
GeForce RTX 3070 Ti:
234  fps
med. 1920x1080
GeForce RTX 3070 Ti:
174.3  fps
high 1920x1080
GeForce RTX 3070 Ti:
143.5  fps
ultra 1920x1080
GeForce RTX 3070 Ti:
115.6  fps
QHD 2560x1440
GeForce RTX 3070 Ti:
81.1  fps
4K 3840x2160
GeForce RTX 3070 Ti:
44.4  fps
F1 22

F1 22

2022
low 1920x1080
GeForce RTX 3070 Ti:
408 409 ~ 409 fps
med. 1920x1080
GeForce RTX 3070 Ti:
395 397 ~ 396 fps
high 1920x1080
GeForce RTX 3070 Ti:
296 299 ~ 298 fps
ultra 1920x1080
GeForce RTX 3070 Ti:
96.1 97.4 ~ 97 fps
QHD 2560x1440
GeForce RTX 3070 Ti:
61 62.9 ~ 62 fps
4K 3840x2160
GeForce RTX 3070 Ti:
29.8 30.9 ~ 30 fps
low 1920x1080
GeForce RTX 3070 Ti:
313 316 ~ 315 fps
med. 1920x1080
GeForce RTX 3070 Ti:
247 250 ~ 249 fps
high 1920x1080
GeForce RTX 3070 Ti:
168.5 169.6 ~ 169 fps
ultra 1920x1080
GeForce RTX 3070 Ti:
129.9 131.3 ~ 131 fps
QHD 2560x1440
GeForce RTX 3070 Ti:
92.1 93 ~ 93 fps
4K 3840x2160
GeForce RTX 3070 Ti:
50.8 51 ~ 51 fps
low 1920x1080
GeForce RTX 3070 Ti:
174.2 182.7 ~ 178 fps
med. 1920x1080
GeForce RTX 3070 Ti:
138.2 144.6 ~ 141 fps
high 1920x1080
GeForce RTX 3070 Ti:
121 126.2 ~ 124 fps
ultra 1920x1080
GeForce RTX 3070 Ti:
111.1 114.2 ~ 113 fps
QHD 2560x1440
GeForce RTX 3070 Ti:
72.7 73 ~ 73 fps
4K 3840x2160
GeForce RTX 3070 Ti:
34.9 35.5 ~ 35 fps
low 1920x1080
GeForce RTX 3070 Ti:
258 317 ~ 288 fps
med. 1920x1080
GeForce RTX 3070 Ti:
228 285 ~ 257 fps
high 1920x1080
GeForce RTX 3070 Ti:
203 248 ~ 226 fps
ultra 1920x1080
GeForce RTX 3070 Ti:
171.8 185.6 ~ 179 fps
QHD 2560x1440
GeForce RTX 3070 Ti:
146.1 175.6 ~ 161 fps
4K 3840x2160
GeForce RTX 3070 Ti:
96.7 99.6 ~ 98 fps
low 1920x1080
GeForce RTX 3070 Ti:
194.9  fps
med. 1920x1080
GeForce RTX 3070 Ti:
163.8  fps
high 1920x1080
GeForce RTX 3070 Ti:
132.9  fps
ultra 1920x1080
GeForce RTX 3070 Ti:
94.2  fps
QHD 2560x1440
GeForce RTX 3070 Ti:
81  fps
4K 3840x2160
GeForce RTX 3070 Ti:
56.4  fps
low 1280x720
GeForce RTX 3070 Ti:
303  fps
med. 1920x1080
GeForce RTX 3070 Ti:
210  fps
high 1920x1080
GeForce RTX 3070 Ti:
196  fps
ultra 1920x1080
GeForce RTX 3070 Ti:
121  fps
QHD 2560x1440
GeForce RTX 3070 Ti:
102  fps
4K 3840x2160
GeForce RTX 3070 Ti:
70  fps
Far Cry 6

Far Cry 6

2021
low 1280x720
GeForce RTX 3070 Ti:
215 222 ~ 219 fps
med. 1920x1080
GeForce RTX 3070 Ti:
181.9 185.5 ~ 184 fps
high 1920x1080
GeForce RTX 3070 Ti:
160.3 162.8 ~ 162 fps
ultra 1920x1080
GeForce RTX 3070 Ti:
144.1 148.2 ~ 146 fps
QHD 2560x1440
GeForce RTX 3070 Ti:
111.9 112.8 ~ 112 fps
4K 3840x2160
GeForce RTX 3070 Ti:
16 17 ~ 17 fps
F1 2021

F1 2021

2021
low 1280x720
GeForce RTX 3070 Ti:
649  fps
med. 1920x1080
GeForce RTX 3070 Ti:
486  fps
high 1920x1080
GeForce RTX 3070 Ti:
379  fps
ultra 1920x1080
GeForce RTX 3070 Ti:
183.9  fps
QHD 2560x1440
GeForce RTX 3070 Ti:
135  fps
4K 3840x2160
GeForce RTX 3070 Ti:
76.7  fps
low 1280x720
GeForce RTX 3070 Ti:
218  fps
med. 1920x1080
GeForce RTX 3070 Ti:
193  fps
high 1920x1080
GeForce RTX 3070 Ti:
166  fps
ultra 1920x1080
GeForce RTX 3070 Ti:
108  fps
QHD 2560x1440
GeForce RTX 3070 Ti:
81  fps
4K 3840x2160
GeForce RTX 3070 Ti:
46  fps
F1 2020

F1 2020

2020
low 1280x720
Quadro T2000 Max-Q:
182  fps
GeForce RTX 3070 Ti:
556  fps
med. 1920x1080
Quadro T2000 Max-Q:
96  fps
GeForce RTX 3070 Ti:
427  fps
high 1920x1080
Quadro T2000 Max-Q:
78  fps
GeForce RTX 3070 Ti:
352  fps
ultra 1920x1080
Quadro T2000 Max-Q:
55  fps
GeForce RTX 3070 Ti:
243  fps
QHD 2560x1440
GeForce RTX 3070 Ti:
183.8  fps
4K 3840x2160
GeForce RTX 3070 Ti:
104.8  fps
low 1280x720
Quadro T2000 Max-Q:
263.3  fps
med. 1920x1080
Quadro T2000 Max-Q:
77.5  fps
high 1920x1080
Quadro T2000 Max-Q:
47.6  fps
ultra 1920x1080
Quadro T2000 Max-Q:
35.1  fps
low 1280x720
Quadro T2000 Max-Q:
147.4  fps
med. 1920x1080
Quadro T2000 Max-Q:
85.5  fps
high 1920x1080
Quadro T2000 Max-Q:
58.1  fps
low 1280x720
Quadro T2000 Max-Q:
141.3  fps
med. 1920x1080
Quadro T2000 Max-Q:
50.3  fps
high 1920x1080
Quadro T2000 Max-Q:
44.5  fps
med. 1920x1080
Quadro T2000 Max-Q:
64.2  fps
high 1920x1080
Quadro T2000 Max-Q:
53.1  fps
ultra 1920x1080
Quadro T2000 Max-Q:
47  fps
GRID 2019

GRID 2019

2019
low 1280x720
Quadro T2000 Max-Q:
179  fps
med. 1920x1080
Quadro T2000 Max-Q:
94.7  fps
high 1920x1080
Quadro T2000 Max-Q:
77.7  fps
ultra 1920x1080
Quadro T2000 Max-Q:
51  fps
low 1280x720
Quadro T2000 Max-Q:
123.4  fps
GeForce RTX 3070 Ti:
237 240 ~ 239 fps
med. 1920x1080
Quadro T2000 Max-Q:
56  fps
GeForce RTX 3070 Ti:
209 210 ~ 210 fps
high 1920x1080
Quadro T2000 Max-Q:
35.8  fps
GeForce RTX 3070 Ti:
165.2 165.2 ~ 165 fps
ultra 1920x1080
Quadro T2000 Max-Q:
27.3  fps
GeForce RTX 3070 Ti:
131.8 132.7 ~ 132 fps
QHD 2560x1440
GeForce RTX 3070 Ti:
95.9 96.2 ~ 96 fps
4K 3840x2160
GeForce RTX 3070 Ti:
53 53.5 ~ 53 fps
Control

Control

2019
low 1280x720
Quadro T2000 Max-Q:
120.2  fps
med. 1920x1080
Quadro T2000 Max-Q:
40.4  fps
high 1920x1080
Quadro T2000 Max-Q:
28.3  fps
low 1280x720
Quadro T2000 Max-Q:
148.4  fps
med. 1920x1080
Quadro T2000 Max-Q:
60.3  fps
high 1920x1080
Quadro T2000 Max-Q:
36.3  fps
ultra 1920x1080
Quadro T2000 Max-Q:
24.4  fps
Anno 1800

Anno 1800

2019
low 1280x720
Quadro T2000 Max-Q:
27.9  fps
med. 1920x1080
Quadro T2000 Max-Q:
12.9  fps
high 1920x1080
Quadro T2000 Max-Q:
9.8  fps
low 1280x720
Quadro T2000 Max-Q:
271  fps
med. 1920x1080
Quadro T2000 Max-Q:
86.1  fps
high 1920x1080
Quadro T2000 Max-Q:
69.9  fps
ultra 1920x1080
Quadro T2000 Max-Q:
40.3  fps
low 1280x720
Quadro T2000 Max-Q:
83  fps
GeForce RTX 3070 Ti:
197 197 ~ 197 fps
med. 1920x1080
Quadro T2000 Max-Q:
58  fps
GeForce RTX 3070 Ti:
172 174 ~ 173 fps
high 1920x1080
Quadro T2000 Max-Q:
55  fps
GeForce RTX 3070 Ti:
166 166 ~ 166 fps
ultra 1920x1080
Quadro T2000 Max-Q:
50  fps
GeForce RTX 3070 Ti:
148 148 ~ 148 fps
QHD 2560x1440
GeForce RTX 3070 Ti:
134 135 ~ 135 fps
4K 3840x2160
GeForce RTX 3070 Ti:
84 84 ~ 84 fps
low 1280x720
Quadro T2000 Max-Q:
91.5  fps
GeForce RTX 3070 Ti:
285 311 ~ 298 fps
med. 1920x1080
Quadro T2000 Max-Q:
41.7  fps
GeForce RTX 3070 Ti:
183.8 185.9 ~ 185 fps
high 1920x1080
Quadro T2000 Max-Q:
31.2  fps
GeForce RTX 3070 Ti:
139.9 141.2 ~ 141 fps
ultra 1920x1080
Quadro T2000 Max-Q:
24.6  fps
GeForce RTX 3070 Ti:
109.8 111.2 ~ 111 fps
QHD 2560x1440
GeForce RTX 3070 Ti:
87.9 89.5 ~ 89 fps
4K 3840x2160
GeForce RTX 3070 Ti:
55.9 56.9 ~ 56 fps
low 1280x720
Quadro T2000 Max-Q:
144  fps
med. 1920x1080
Quadro T2000 Max-Q:
86.4  fps
high 1920x1080
Quadro T2000 Max-Q:
72.7  fps
ultra 1920x1080
Quadro T2000 Max-Q:
64.9  fps
low 1280x720
Quadro T2000 Max-Q:
71  fps
GeForce RTX 3070 Ti:
230  fps
med. 1920x1080
Quadro T2000 Max-Q:
53  fps
GeForce RTX 3070 Ti:
171  fps
high 1920x1080
Quadro T2000 Max-Q:
45  fps
GeForce RTX 3070 Ti:
147  fps
ultra 1920x1080
Quadro T2000 Max-Q:
25  fps
GeForce RTX 3070 Ti:
103  fps
QHD 2560x1440
GeForce RTX 3070 Ti:
93  fps
4K 3840x2160
GeForce RTX 3070 Ti:
58  fps
low 1280x720
Quadro T2000 Max-Q:
101  fps
GeForce RTX 3070 Ti:
325 334 ~ 330 fps
med. 1920x1080
Quadro T2000 Max-Q:
56  fps
GeForce RTX 3070 Ti:
228 233 ~ 231 fps
high 1920x1080
Quadro T2000 Max-Q:
48  fps
GeForce RTX 3070 Ti:
207 211 ~ 209 fps
ultra 1920x1080
Quadro T2000 Max-Q:
42  fps
GeForce RTX 3070 Ti:
190.1 193.7 ~ 192 fps
QHD 2560x1440
GeForce RTX 3070 Ti:
132.5 134.8 ~ 134 fps
4K 3840x2160
GeForce RTX 3070 Ti:
72.8 73.9 ~ 73 fps
Strange Brigade

Strange Brigade

2018
low 1280x720
GeForce RTX 3070 Ti:
703 703 ~ 703 fps
med. 1920x1080
GeForce RTX 3070 Ti:
398 398 ~ 398 fps
high 1920x1080
GeForce RTX 3070 Ti:
316 316 ~ 316 fps
ultra 1920x1080
GeForce RTX 3070 Ti:
274 274 ~ 274 fps
QHD 2560x1440
GeForce RTX 3070 Ti:
205 205 ~ 205 fps
4K 3840x2160
GeForce RTX 3070 Ti:
119 119 ~ 119 fps
Far Cry 5

Far Cry 5

2018
low 1280x720
GeForce RTX 3070 Ti:
242 243 ~ 243 fps
med. 1920x1080
GeForce RTX 3070 Ti:
203 206 ~ 205 fps
high 1920x1080
GeForce RTX 3070 Ti:
195 196 ~ 196 fps
ultra 1920x1080
GeForce RTX 3070 Ti:
183 183 ~ 183 fps
QHD 2560x1440
GeForce RTX 3070 Ti:
150 150 ~ 150 fps
4K 3840x2160
GeForce RTX 3070 Ti:
82 82 ~ 82 fps
low 1280x720
Quadro T2000 Max-Q:
91.9 101 ~ 96 fps
GeForce RTX 3070 Ti:
219 254 ~ 237 fps
med. 1920x1080
Quadro T2000 Max-Q:
76 87 ~ 82 fps
GeForce RTX 3070 Ti:
192 223 ~ 208 fps
high 1920x1080
Quadro T2000 Max-Q:
64.8 73 ~ 69 fps
GeForce RTX 3070 Ti:
149.6 173.6 ~ 162 fps
4K 3840x2160
Quadro T2000 Max-Q:
47.2  fps
GeForce RTX 3070 Ti:
126.9 142.5 ~ 135 fps
low 1280x720
Quadro T2000 Max-Q:
91  fps
GeForce RTX 3070 Ti:
234 235 ~ 235 fps
med. 1920x1080
Quadro T2000 Max-Q:
41.7 48.5 ~ 45 fps
GeForce RTX 3070 Ti:
204 211 ~ 208 fps
high 1920x1080
Quadro T2000 Max-Q:
28.8 36.8 ~ 33 fps
GeForce RTX 3070 Ti:
148.9 155.1 ~ 152 fps
QHD 2560x1440
Quadro T2000 Max-Q:
25.7  fps
GeForce RTX 3070 Ti:
112.7 114.5 ~ 114 fps
4K 3840x2160
Quadro T2000 Max-Q:
12.3 13.7 ~ 13 fps
GeForce RTX 3070 Ti:
64.9 68.5 ~ 67 fps
low 1280x720
GeForce RTX 3070 Ti:
253  fps
med. 1920x1080
GeForce RTX 3070 Ti:
173  fps
high 1920x1080
GeForce RTX 3070 Ti:
161  fps
ultra 1920x1080
GeForce RTX 3070 Ti:
143  fps
QHD 2560x1440
GeForce RTX 3070 Ti:
117  fps
4K 3840x2160
GeForce RTX 3070 Ti:
77  fps
low 1280x720
Quadro T2000 Max-Q:
145 153 ~ 149 fps
GeForce RTX 3070 Ti:
292 298.5 ~ 295 fps
med. 1366x768
Quadro T2000 Max-Q:
132 140 ~ 136 fps
GeForce RTX 3070 Ti:
264.5 267 ~ 266 fps
high 1920x1080
Quadro T2000 Max-Q:
118 130 ~ 124 fps
GeForce RTX 3070 Ti:
249 260 ~ 255 fps
ultra 1920x1080
Quadro T2000 Max-Q:
108 118 ~ 113 fps
GeForce RTX 3070 Ti:
230.1 240 ~ 235 fps
4K 3840x2160
Quadro T2000 Max-Q:
43.4 47.9 ~ 46 fps
GeForce RTX 3070 Ti:
193.5 200 ~ 197 fps
low 1024x768
Quadro T2000 Max-Q:
181  fps
GeForce RTX 3070 Ti:
697  fps
med. 1366x768
Quadro T2000 Max-Q:
107.6  fps
GeForce RTX 3070 Ti:
475  fps
high 1920x1080
Quadro T2000 Max-Q:
62.5  fps
GeForce RTX 3070 Ti:
292  fps
ultra 1920x1080
Quadro T2000 Max-Q:
32.4 33.4 ~ 33 fps
GeForce RTX 3070 Ti:
146.8  fps
4K 3840x2160
GeForce RTX 3070 Ti:
109.1  fps
GTA V

GTA V

2015
low 1024x768
GeForce RTX 3070 Ti:
188  fps
med. 1366x768
GeForce RTX 3070 Ti:
187.9  fps
high 1920x1080
GeForce RTX 3070 Ti:
186.9  fps
ultra 1920x1080
GeForce RTX 3070 Ti:
159.1  fps
QHD 2560x1440
GeForce RTX 3070 Ti:
137.3  fps
4K 3840x2160
GeForce RTX 3070 Ti:
147.3  fps
ultra 1920x1080
Quadro T2000 Max-Q:
79.5  fps
NVIDIA GeForce RTX 3070 Tilowmed.highultraQHD4K
Once Human240205166152.3101.353.9
The First Descendant214141.8110.294.263.835.9
F1 2442935727088.257.528.2
Senua's Saga Hellblade 287.873.353.638.817.1
Ghost of Tsushima140.1120.6109.986.948.927.4
Dragon's Dogma 2106.897.376.947.4
Horizon Forbidden West158.3134.99786.768.529.1
Alone in the Dark271264226159.699.426
Last Epoch295293281232156.379.6
Skull & Bones153140112877245
Helldivers 2208156.5137.5134.197.745.9
Enshrouded105.291.478.359.641.823.9
Palworld239219143.4132.496.554.3
Prince of Persia The Lost Crown359359359359267
Ready or Not297293263201124.758.7
The Finals346271238184.8118.757.8
Avatar Frontiers of Pandora11210490694725
Call of Duty Modern Warfare 3 20231721541211148150
EA Sports WRC191.4146.5134.9126.393.852.2
Alan Wake 286.772.566.749.529.4
Lords of the Fallen129.2108.983.257.24020.7
Total War Pharaoh508.5321.8202.4163.5119.462.9
Assassin's Creed Mirage1591481411149057
EA Sports FC 24358318262246190116.6
Counter-Strike 2350337292240159.594.2
Cyberpunk 2077 2.1 Phantom Liberty192.7152130.6114.471.432.5
Lies of P263230201180.9124.365.2
Starfield86.474.961.756.346.731.8
Armored Core 6119.6119.6119.6119.3109.866.2
Immortals of Aveum85.372.66041.923.2
Atlas Fallen183.2190.4195.7159.7110.960.8
Baldur's Gate 3207162142.1140.197.851.7
Ratchet & Clank Rift Apart132.611593.783.769.145.7
F1 2345039928492.459.328.8
Diablo 4385340299252158.889.1
Star Wars Jedi Survivor123.7109.196.4100.561.130.3
Dead Island 2351332250191133.667.9
The Last of Us148.8121.9108.390.15725
Resident Evil 4 Remake219155.7143.710579.247.2
The Callisto Protocol1951591041037846.7
Need for Speed Unbound187.9176.6153.8129.898.755.8
Spider-Man Miles Morales175.9162.5151.3143.3110.758.3
Call of Duty Modern Warfare 2 20221511431151138150
Uncharted Legacy of Thieves Collection106.2104.4100.496.477.438.5
A Plague Tale Requiem167.1129.195.875.552.830.5
FIFA 23318272226224193.5116.1
The Quarry234174.3143.5115.681.144.4
F1 22409396298976230
Tiny Tina's Wonderlands3152491691319351
Cyberpunk 2077 1.61781411241137335
GRID Legends28825722617916198
God of War194.9163.8132.994.28156.4
Forza Horizon 530321019612110270
Far Cry 621918416214611217
F1 2021649486379183.913576.7
Watch Dogs Legion2181931661088146
F1 2020556427352243183.8104.8
Borderlands 32392101651329653
Far Cry New Dawn19717316614813584
Metro Exodus2981851411118956
Assassin´s Creed Odyssey2301711471039358
Shadow of the Tomb Raider33023120919213473
Strange Brigade703398316274205119
Far Cry 524320519618315082
X-Plane 11.11237208162135
Final Fantasy XV Benchmark23520815211467
Assassin´s Creed Origins25317316114311777
Dota 2 Reborn295266255235197
The Witcher 3697475292146.8109.1
GTA V188187.9186.9159.1137.3147.3
< 30 fps
< 60 fps
< 120 fps
≥ 120 fps


9
60


10
58

1
19
50

3
27
35

12
38
17
13
32
21
4
NVIDIA Quadro T2000 Max-Qlowmed.highultraQHD4K
F1 2020182967855
Gears Tactics263.377.547.635.1
Doom Eternal147.485.558.1
Hunt Showdown141.350.344.5
Star Wars Jedi Fallen Order64.253.147
GRID 201917994.777.751
Borderlands 3123.45635.827.3
Control120.240.428.3
Total War: Three Kingdoms148.460.336.324.4
Anno 180027.8612.99.8
Dirt Rally 2.027186.169.940.3
Far Cry New Dawn83585550
Metro Exodus91.541.7431.224.6
Apex Legends14486.472.764.9
Assassin´s Creed Odyssey71534525
Shadow of the Tomb Raider101564842
X-Plane 11.1196826947.2
Final Fantasy XV Benchmark91453325.713
Dota 2 Reborn14913612411346
The Witcher 3181107.662.533
BioShock Infinite79.5
< 30 fps
< 60 fps
< 120 fps
≥ 120 fps
1

6
12
1
8
10
1
2
11
6
1
4
8
3
1


1
2

Eine Liste mit weiteren Spielen und allen Grafikkarten finden Sie auf unserer Seite: Welches Spiel ist mit welcher Grafikkarte spielbar?

v1.28
log 19. 04:02:00

#0 ran 0s before starting gpusingle class +0s ... 0s

#1 checking url part for id 12736 +0s ... 0s

#2 checking url part for id 9886 +0s ... 0s

#3 checking url part for id 11450 +0s ... 0s

#4 redirected to Ajax server, took 1726711320s time from redirect:0 +0s ... 0s

#5 did not recreate cache, as it is less than 5 days old! Created at Mon, 16 Sep 2024 05:16:32 +0200 +0s ... 0s

#6 composed specs +0.029s ... 0.029s

#7 did output specs +0s ... 0.029s

#8 start showIntegratedCPUs +0s ... 0.029s

#9 getting avg benchmarks for device 12736 +0.027s ... 0.056s

#10 got single benchmarks 12736 +0s ... 0.056s

#11 getting avg benchmarks for device 9886 +0s ... 0.056s

#12 got single benchmarks 9886 +0.006s ... 0.062s

#13 getting avg benchmarks for device 11450 +0.004s ... 0.066s

#14 got single benchmarks 11450 +0.006s ... 0.072s

#15 got avg benchmarks for devices +0s ... 0.072s

#16 min, max, avg, median took s +0.041s ... 0.113s

#17 before gaming benchmark output +0s ... 0.113s

#18 Got 612 rows for game benchmarks. +0.018s ... 0.131s

#19 composed SQL query for gamebenchmarks +0s ... 0.131s

#20 got data and put it in $dataArray +0.004s ... 0.135s

#21 benchmarks composed for output. +0.025s ... 0.161s

#22 calculated avg scores. +0s ... 0.161s

#23 return log +0.001s ... 0.162s

Teilen Sie diesen Artikel, um uns zu unterstützen. Jeder Link hilft!
> Notebook Test, Laptop Test und News > Benchmarks / Technik > Benchmarks / Technik > Grafikkarten Vergleich - Head 2 Head
Autor: Klaus Hinum,  8.09.2017 (Update:  1.07.2023)