Notebookcheck Logo

Qualcomm Adreno 685 vs ARM Mali-G68 MP5

Qualcomm Adreno 685

► remove from comparison Qualcomm Adreno 685

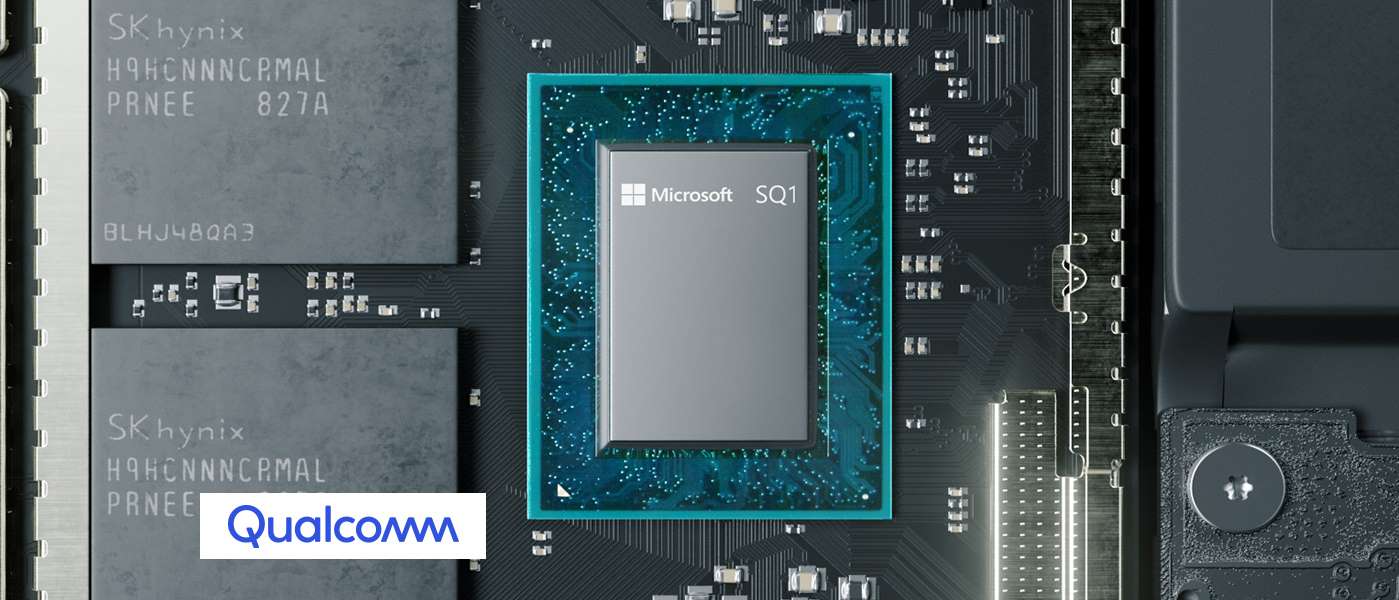
Die Qualcomm Adreno 685 ist eine im Microsoft SQ1 integrierte Grafikeinheit für Windows-Tablets (Microsoft Surface X). Technisch eine Adreno 680 wie im Qualcomm Snapdragon 8cx ARM-SoC, jedoch wahrscheinlich höher getaktet. Microsoft gibt 2 Tflops theoretische Leistung an, versus 1.8 bei der Adreno 680 im 8cx.

ARM Mali-G68 MP5

► remove from comparison ARM Mali-G68 MP5

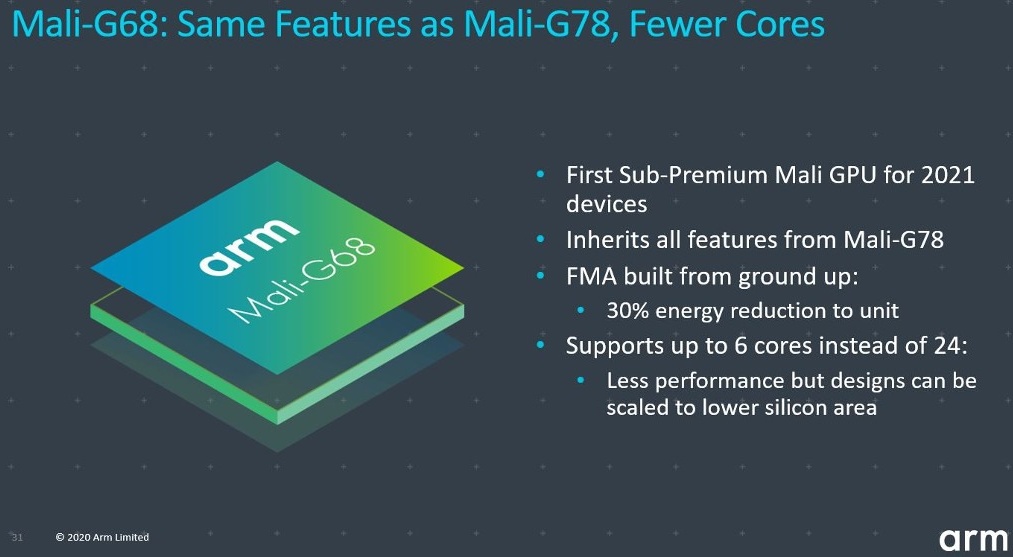
Die ARM Mali-G68 MP5 ist eine integrierte Mittelklasse-Grafikeinheit für ARM-basierte SoCs, welche in Smartphones und Tablets mit Android Verwendung finden kann. Die G68-Serie lässt sich theoretisch mit bis zu sechs Kernen nutzen. 

Die ARM Mali-G68 ist eine auf der Valhall-Architektur basierende GPU und wird von ARM für Geräte der Sub-Premiumklasse ausgelobt. Sie ermöglicht komplexe Anwendungsfälle von High-Fidelity-Grafik bis hin zu maschinellem Lernen (ML) und unterstützt alle aktuellen APIs wie Vulkan 1.2, OpenGL ES 3.2 und OpenCL 2.0.

Qualcomm Adreno 685ARM Mali-G68 MP5
Mali-G Serie
Adreno 660 compare
Adreno 650 compare @ 0.25 - 0.67 GHz
Adreno 690 compare
Adreno 685
Adreno 680 compare
Adreno 644 compare
Adreno 643 compare @ 0.81 GHz
Adreno 642 compare
Adreno 642L compare
Adreno 640 compare
Adreno 630 compare
Adreno 620 compare
Adreno 619 compare
Adreno 619L compare
Adreno 618 compare
Adreno 616 compare
Adreno 613 compare @ 0.96 GHz
Adreno 612 compare
Adreno 610 compare
Mali-G78 MP24 compare 24
Mali-G78 MP22 compare 24
Mali-G78 MP20 compare 24
Mali-G78 MP14 compare 14
Mali-G77 MP11 compare 11
Mali-G77 MP9 compare 9
Mali-G76 MP16 compare 16
Mali-G76 MP12 compare 10
Mali-G76 MP10 compare 10 @ 0.72 GHz
Mali-G68 MP5 5
Mali-G57 MP6 compare 6
Mali-G57 MP5 compare 5
Mali-G72 MP18 compare 18 @ 0.85 GHz
Mali-G71 MP20 compare 8 @ 0.9 GHz
Mali-G72 MP12 compare 12 @ 0.85 GHz
Mali-G71 MP8 compare 8 @ 0.9 GHz
Mali-G76 MP4 compare 4 @ 0.8 GHz
Mali-G71 MP2 compare 2 @ 0.77 GHz
Mali-G72 MP3 compare 3 @ 0.85 GHz
Mali-G68 MP4 compare 4
Mali-G52 MP6 compare 6
Mali-G68 MP2 compare 2
Mali-G52 MP2 compare 2 @ 0.95 GHz
Mali-G52 MP1 compare 1 @ 0.8 GHz
Mali-G57 MP4 compare 4
Mali-G57 MP3 compare 3
Mali-G57 MP2 compare 2
Mali-G57 MP1 compare 1
Mali-G51 MP4 compare 4 @ 0.65 GHz
Shared Memoryjanein
APIDirectX 12
Stromverbrauch7 Watt
Herstellungsprozess7 nm5 nm
Erscheinungsdatum06.12.2018 14.09.2021
CodenameValhall
ArchitekturValhall
Pipelines5 - unified
Herstellerseitewww.arm.com
CPU in Adreno 685GPU Base SpeedGPU Boost / Turbo
Microsoft SQ18 x 3000 MHz? MHz? MHz
CPU in Mali-G68 MP5GPU Base SpeedGPU Boost / Turbo
Samsung Exynos 13808 x 2000 MHz? MHz950 MHz

Benchmarks

3DMark - 3DMark Sling Shot (ES 3.0) Unlimited
min: 6103     avg: 6217     median: 6224 (27%)     max: 6317 Points
3DMark - 3DMark Sling Shot (ES 3.0) Unlimited Graphics
min: 7030     avg: 7122     median: 7134 (16%)     max: 7189 Points
3DMark - 3DMark Sling Shot Extreme (ES 3.1) Unlimited
min: 4897     avg: 4978     median: 5002 (25%)     max: 5043 Points
3DMark - 3DMark Sling Shot Extreme (ES 3.1) Unlimited Graphics
min: 5118     avg: 5208     median: 5233 (16%)     max: 5323 Points
3DMark - 3DMark Sling Shot (ES 3.0)
min: 5790     avg: 5815     median: 5792 (51%)     max: 5864 Points
3DMark - 3DMark Sling Shot (ES 3.0) Graphics
min: 6630     avg: 6658     median: 6647 (40%)     max: 6698 Points
3DMark - 3DMark Sling Shot Extreme (ES 3.1)
min: 4629     avg: 4724     median: 4730.5 (23%)     max: 4805 Points
3DMark - 3DMark Sling Shot Extreme (ES 3.1) Graphics
min: 4848     avg: 4966     median: 4972 (17%)     max: 5070 Points
3DMark - 3DMark Wild Life Unlimited
min: 2796     avg: 2911     median: 2955 (1%)     max: 2987 Points
3DMark - 3DMark Wild Life Extreme Unlimited
min: 796     avg: 1252     median: 825 (1%)     max: 3001 Points
3DMark 11 - 3DM11 Performance Score
1968 Points (3%)
3DMark 11 - 3DM11 Performance GPU
1927 Points (2%)
Cinebench R10 Cinebench R10 Shading (32bit) + Qualcomm Adreno 685
Cinebench R10 - Cinebench R10 Shading (32bit)
373 Points (0%)
GFXBench - GFXBench 5.0 4K Aztec Ruins High Tier Offscreen
min: 5.8     avg: 5.9     median: 5.9 (2%)     max: 6 fps
GFXBench - GFXBench 5.0 Aztec Ruins High Tier Offscreen
min: 13     avg: 13.4     median: 13 (2%)     max: 14 fps
GFXBench - GFXBench 5.0 Aztec Ruins Normal Tier Offscreen
min: 34     avg: 34.4     median: 34 (3%)     max: 35 fps
GFXBench - GFXBench Car Chase Offscreen
min: 30     avg: 30.8     median: 31 (3%)     max: 31 fps
GFXBench 3.1 - GFXBench Manhattan ES 3.1 Offscreen
min: 52     avg: 52.2     median: 52 (1%)     max: 53 fps
GFXBench 3.0 - GFXBench 3.0 Manhattan Offscreen
31.7 fps (2%)
GFXBench (DX / GLBenchmark) 2.7
GFXBench T-Rex HD Offscreen C24Z16 + Qualcomm Adreno 685
GFXBench (DX / GLBenchmark) 2.7 - GFXBench T-Rex HD Offscreen C24Z16
167.7 fps (1%)
GFXBench T-Rex HD Offscreen C24Z16 + ARM Mali-G68 MP5
Antutu v9 - AnTuTu v9 GPU
min: 143857     avg: 147409     median: 148214 (18%)     max: 149350 Points
Basemark GPU 1.2 - Basemark GPU 1.2 Vulkan Official Medium Offscreen 1080
min: 41.45     avg: 41.7     median: 41.7 (0%)     max: 41.92 fps
Geekbench 6.2 - Geekbench 6.2 GPU OpenCL
min: 2971     avg: 3046     median: 3069 (1%)     max: 3098 Points
Geekbench 6.2 - Geekbench 6.2 GPU Vulkan
min: 3039     avg: 3083     median: 3102 (1%)     max: 3109 Points
ComputeMark v2.1 - ComputeMark v2.1 Result
2292 Points (2%)
PassMark PerformanceTest Mobile V1 - PerformanceTest Mobile V1 2D Graphics Tests
12517 Points (4%)
PassMark PerformanceTest Mobile V1 - PerformanceTest Mobile V1 3D Graphics Tests
3997 Points (7%)
Power Consumption - GFXBench Aztec Ruins Normal Tier Offscreen Power Consumption 150cd *
min: 4.32     avg: 5.1     median: 5.2 (2%)     max: 6.04 Watt

Average Benchmarks Qualcomm Adreno 685 → 100% n=2

Average Benchmarks ARM Mali-G68 MP5 → 160% n=2

- Bereich der Benchmarkergebnisse für diese Grafikkarte
- Durchschnittliche Benchmarkergebnisse für diese Grafikkarte
* Smaller numbers mean a higher performance
1 This benchmark is not used for the average calculation

Spiele-Benchmarks

Die folgenden Benchmarks basieren auf unseren Spieletests mit Testnotebooks. Die Performance dieser Grafikkarte bei den gelisteten Spielen ist abhängig von der verwendeten CPU, Speicherausstattung, Treiber und auch Betriebssystem. Dadurch müssen die untenstehenden Werte nicht repräsentativ sein. Detaillierte Informationen über das verwendete System sehen Sie nach einem Klick auf den fps-Wert.

Diablo Immortal

Diablo Immortal

2022
low Medium
Mali-G68 MP5:
58.5  fps
Genshin Impact

Genshin Impact

2020
low
Mali-G68 MP5:
50 56 58 ~ 55 fps
med.
Mali-G68 MP5:
43 50 ~ 47 fps
ultra
Mali-G68 MP5:
36 38 39.7 ~ 38 fps
PUBG Mobile

PUBG Mobile

2018
low
Mali-G68 MP5:
30 30 30 ~ 30 fps
med.
Mali-G68 MP5:
30  fps
high
Mali-G68 MP5:
30 30 30 39.8 ~ 32 fps
Asphalt 9: Legends

Asphalt 9: Legends

2013
low
Mali-G68 MP5:
60  fps
high
Mali-G68 MP5:
60  fps
ARM Mali-G68 MP5lowmed.highultraQHD4K
Diablo Immortal58.5
Genshin Impact554738
PUBG Mobile303032
Asphalt 9: Legends6060
< 30 fps
< 60 fps
< 120 fps
≥ 120 fps

3
1

2


1
1

1


Eine Liste mit weiteren Spielen und allen Grafikkarten finden Sie auf unserer Seite: Welches Spiel ist mit welcher Grafikkarte spielbar?

Add one or more devices and compare

In the following list you can select (and also search for) devices that should be added to the comparison. You can select more than one device.

restrict list:

show all (including archived), 2024, 2023
v1.28
log 20. 11:47:44

#0 ran 0s before starting gpusingle class +0s ... 0s

#1 checking url part for id 9954 +0s ... 0s

#2 checking url part for id 11584 +0s ... 0s

#3 redirected to Ajax server, took 1726825664s time from redirect:0 +0s ... 0s

#4 did not recreate cache, as it is less than 5 days old! Created at Thu, 19 Sep 2024 05:16:33 +0200 +0s ... 0s

#5 composed specs +0.003s ... 0.003s

#6 did output specs +0s ... 0.003s

#7 start showIntegratedCPUs +0s ... 0.003s

#8 getting avg benchmarks for device 9954 +0.01s ... 0.013s

#9 got single benchmarks 9954 +0s ... 0.013s

#10 getting avg benchmarks for device 11584 +0s ... 0.014s

#11 got single benchmarks 11584 +0.007s ... 0.021s

#12 got avg benchmarks for devices +0s ... 0.021s

#13 min, max, avg, median took s +0.012s ... 0.032s

#14 before gaming benchmark output +0s ... 0.032s

#15 Got 19 rows for game benchmarks. +0.004s ... 0.036s

#16 composed SQL query for gamebenchmarks +0s ... 0.036s

#17 got data and put it in $dataArray +0s ... 0.036s

#18 benchmarks composed for output. +0.001s ... 0.038s

#19 calculated avg scores. +0s ... 0.038s

#20 return log +0.002s ... 0.039s

Teilen Sie diesen Artikel, um uns zu unterstützen. Jeder Link hilft!
> Notebook Test, Laptop Test und News > Benchmarks / Technik > Benchmarks / Technik > Grafikkarten Vergleich - Head 2 Head
Autor: Klaus Hinum,  8.09.2017 (Update:  1.07.2023)