Intel Core i9-13980HX vs Qualcomm Snapdragon 778G 5G vs Intel Core i7-13700HX
Intel Core i9-13980HX ► remove from comparison
Der Intel Core i9-13980HX ist eine High-End-CPU auf Basis der neuen Raptor-Lake-Architektur für große und schwere Notebooks. Die CPU wurde Anfang 2023 vorgestellt und ist ähnlich zum Desktop Core i9-13900K , jedoch mit niedrigeren Taktraten.
Die insgesamt 32 Threads unterteilen sich in P-Cores und E-Cores, die wir bereits von Alder-Lake her kennen. Dabei kommen nach wie vor 8 Performance-Kerne (P-Cores) mit Hyperthreading zum Einsatz. Die Anzahl der energieeffizienten E-Cores hat sich indes auf 16 erhöht, sodass in Summe 32 Threads gleichzeitig verarbeitet werden können. Die P-Cores takten von 2,2 bis 5,6 GHz und die E-Cores von 1,6 bis 4 GHz. Der integrierte Speicherkontroller unterstützt DDR5 mit 5600 MHz.
Die neue Raptor Lake Architektur bietet im Vergleich zu Alder Lake verbesserte P-Cores (Raptor Cove Architektur mit mehr Cache), mehr E-Cores (selbe Gracemont Architektur) und höhere Taktraten dank des verbesserten Intel 7 Prozesses. Weiters unterstützt Intel bei den Topmodellen nun schnelleren DDR5 Hauptspeicher (bis 5600 MHz).
Performance
Im Vergleich zum Intel Core i9-12900HX bietet der Core i9-13980HX weiterhin 8 Kerne, welche aber durch 16 weitere E-Cores bei anspruchsvollen Anwendungen entlastet werden und somit für eine sehr hohe Multi-Thread-Performance sorgen. Die E-Cores kümmern sich in erster Linie um Hintergrundanwendungen. Die hybride Architektur vertraut dabei auf den Intel Thread Direktor, der für die richtige Zuteilung der Aufgaben zuständig ist. Im Vergleich zu Alder-Lake konnte die IPC deutlich gesteigert werden. Zusammen mit dem deutlich höheren Boost profitiert die CPU in allen Belangen von einer deutlich spürbaren Leistungssteigerung.
Der 13980HX wird im weiter verbesserten 10nm FinFET Verfahren bei Intel gefertigt (Intel 7 Prozess) und ist spezifiziert mit 55 Watt Base Power und 157 Watt Turbo Power.
Qualcomm Snapdragon 778G 5G ► remove from comparison
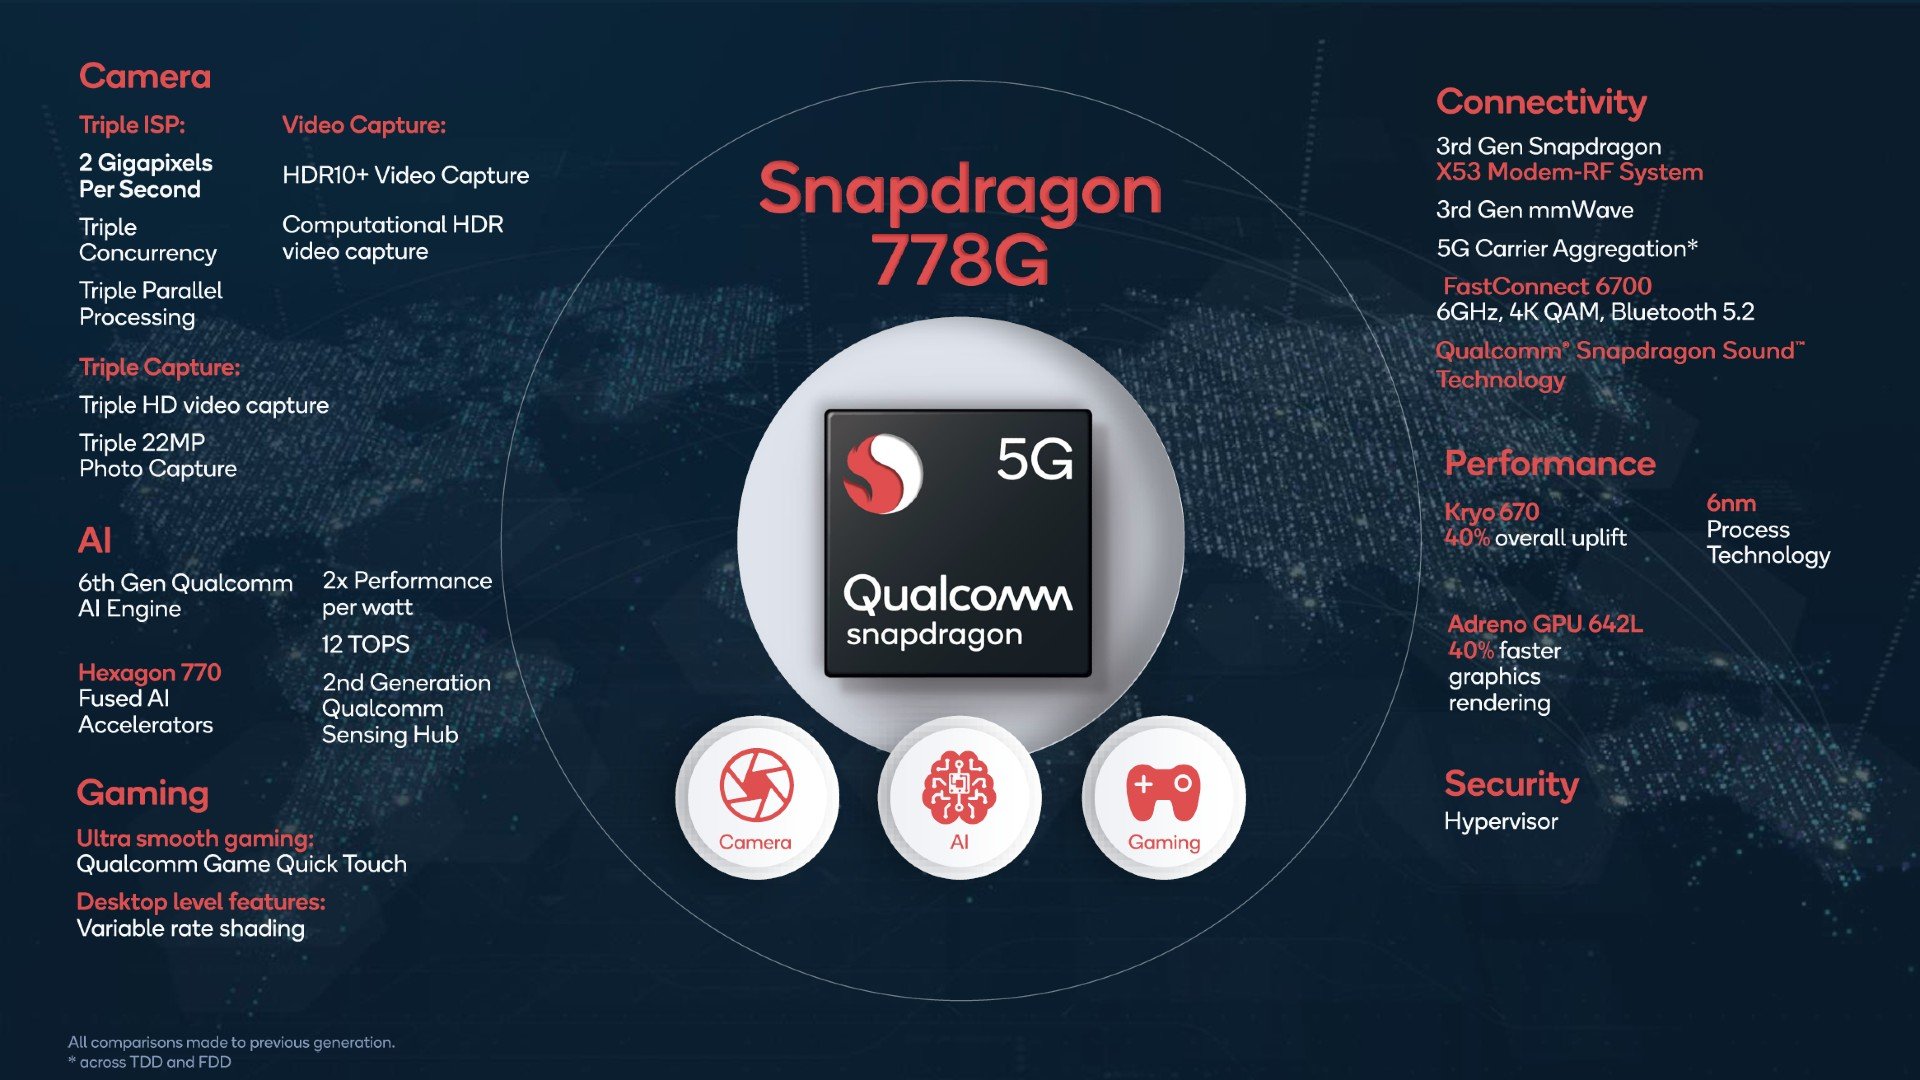
Der Qualcomm Snapdragon 778G (SDM778G 5G Mobile Platform) ist ein ARMv8-A-basierter SoC für Tablets und Smartphones aus dem gehobenen Mittelklasse-Segment . Er integriert insgesamt 8 Kerne aufgeteilt in zwei Cluster. Der ARM Cortex-A78 Cluster bietet vier Kerne mit bis zu 2,4 GHz. Die restlichen 4 Kerne basieren auf die kleinere A55 Architektur und können mit bis zu 1,8 GHz getaktet werden. Es können alle Kerne gleichzeitig laufen und je nach Last auch nur ein einzelner Cluster.
Das "G" am Ende bezeichnet die Spezialisierung auf Gaming-Performance, dafür wurden laut Qualcomm einige WiFi-Features angepasst und die Grafikkarte beschleunigt.
LPDDR5 RAM wird unterstützt, mit einer Frequenz von bis zu 3.200 MHz.
Als Modem kommt das Snapdragon X53 5G Modem zum Einsatz. Das X53 unterstützt eine Reihe von SA- und NSA 5G mmWave- und Sub-6 GHz-Frequenzen sowie Dynamic Spectrum Sharing (DSS). DSS ermöglicht dem Provider Frequenzen für 4G und 5G gleichzeitig zu nutzen, womit die Kosten für die Einführung von 5G gesenkt werden können. Das X53 kann eine maximale Downlink-Geschwindigkeit von bis zu 3,7 Gbit/s und eine Uplink-Geschwindigkeit von bis zu 2,9 Gbit/s in 5G-Netzen erreichen.
Der Adreno 642L bildet das Grafiksubsystem. Der SD 778G enthält auch ausgewählte Snapdragon Elite Gaming-Funktionen wie Game Smoother, Game Fast Loader und Game Network Latency Manager. Die GPU ist in der Lage, FHD+-Displays mit bis zu 144 Hz anzusteuern.
Der Snapdragon 778G wird im modernen 6nm EUV Prozess bei TSMC gefertigt.
Intel Core i7-13700HX ► remove from comparison
Der Intel Core i7-13700HX ist eine High-End-CPU auf Basis der neuen Raptor-Lake-Architektur für große und schwere Notebooks. Die CPU wurde Anfang 2023 vorgestellt und ist ähnlich zur Desktop Core i9-13700K, jedoch mit niedrigeren Taktraten.
Die insgesamt 24 Threads unterteilen sich in P-Cores und E-Cores, die wir bereits von Alder-Lake her kennen. Der 13700HX bietet 8 Performance-Kerne (P-Cores) mit Hyperthreading und 8 Effizienzkerne (E-Cores) ohne Hyperthreading. Daher werden insgesamt 20 Threads unterstützt. Die P-Cores takten von 2,1 bis 5 GHz (Einzelkern) bzw. 4,5 GHz (alle Kerne) und die E-Cores von 1,5 bis 3,7 GHz. Der integrierte Speicherkontroller unterstützt maximal DDR5 mit 4800 MHz (und nicht 5600 MHz wie die i9 HX Modelle).
Die neue Raptor Lake Architektur bietet im Vergleich zu Alder Lake verbesserte P-Cores (Raptor Cove Architektur mit mehr Cache), mehr E-Cores (selbe Gracemont Architektur) und höhere Taktraten dank des verbesserten Intel 7 Prozesses. Weiters unterstützt Intel bei den Topmodellen nun schnelleren DDR5 Hauptspeicher (bis 5600 MHz bei den i9).
Die Performance sollte etwas oberhalb des älteren Alder Lake basierenden i7-12850HX liegen, welcher ebenfalls 16 Kerne bietet und bis zu 4,8 GHz taktet.
Der 13700HX wird im weiter verbesserten 10nm FinFET Verfahren bei Intel gefertigt (Intel 7 Prozess) und ist spezifiziert mit 55 Watt Base Power und 157 Watt Turbo Power.
Model Intel Core i9-13980HX Qualcomm Snapdragon 778G 5G Intel Core i7-13700HX Series Intel Raptor Lake-HX Qualcomm Snapdragon Intel Raptor Lake-HX Codename Raptor Lake-HX Kryo 670 (Cortex-A78/A55) Raptor Lake-HX Serie: Raptor Lake-HX Raptor Lake-HX Clock 1600 - 5600 MHz 1800 - 2400 MHz 1500 - 5000 MHz L2 Cache 32 MB 24 MB L3 Cache 36 MB 30 MB Cores / Threads 24 / 32 8 x 5.6 GHz Intel Raptor Cove P-Core 16 x 4.0 GHz Intel Gracemont E-Core 8 / 8 16 / 24 8 x 5.0 GHz Intel Raptor Cove P-Core 8 x 3.7 GHz Intel Gracemont E-Core TDP 55 Watt 55 Watt Technology 10 nm 6 nm 10 nm Die Size 257 mm2 257 mm2 max. Temp. 100 °C 100 °C Socket BGA1964 BGA1964 Features DDR4-3200/DDR5-5600 RAM, PCIe 5, Thr. Dir., DL Boost, GNA, MMX, SSE, SSE2, SSE3, SSSE3, SSE4.1, SSE4.2, AVX, AVX2, BMI2, ABM, FMA, ADX, SMEP, SMAP, EIST, TM1, TM2, Hyper-Threading, Turbo, SST, AES-NI, RDRAND, RDSEED, SHA Adreno 642L GPU, X53 5G Modem, Hexagon 770 DSP, Spectra 570L ISP, Wi-Fi 6E DDR4-3200/DDR5-4800 RAM, PCIe 5, Thr. Director, DL Boost, GNA, MMX, SSE, SSE2, SSE3, SSSE3, SSE4.1, SSE4.2, AVX, AVX2, BMI2, ABM, FMA, ADX, VMX, SMEP, SMAP, EIST, TM1, TM2, HT, Turbo, SST, AES-NI, RDRAND, RDSEED, SHA iGPU Intel UHD Graphics 770 ( - 1650 MHz)Qualcomm Adreno 642L Intel UHD Graphics 770 ( - 1550 MHz)Architecture x86 ARM x86 Announced Manufacturer ark.intel.com www.qualcomm.com ark.intel.com
Benchmarks Performance Rating - CB R15 + R20 + 7-Zip + X265 + Blender + 3DM11 CPU - i9-13980HX
54.5 pt (76%)
...
max:
Performance Rating - Geekbench 5.5, PCM Work, Sling Shot Physics, Antutu v8 CPU - SD 778G 5G
min: 1.035 avg: 1 median: 1 (80%) max: 1.3 pt
Qualcomm Snapdragon 778G 5G
max:
Performance Rating - CB R15 + R20 + 7-Zip + X265 + Blender + 3DM11 CPU - i7-13700HX
46.8 pt (65%)
...
...
max:
Cinebench 2024 - Cinebench 2024 CPU Single Core
112 Points (78%)
Cinebench 2024 - Cinebench 2024 CPU Multi Core
971 Points (18%)
Cinebench R23 - Cinebench R23 Multi Core
min: 28301 avg: 30428 median: 30273 (28%) max: 33052 Points
CPU TDP ? TDP 65 W TDP 80 W TDP 125 W TDP 130 W TDP 143 W TDP 157 W TDP 170 W 94% 87% 89% 92% 93% 100% 89% 97%
min: 19987 avg: 21150 median: 20997.5 (19%) max: 22598 Points
CPU TDP ? TDP 65 W TDP 70 W TDP 80 W TDP 90 W TDP 115 W TDP 117 W TDP 122 W TDP 125 W TDP 130 W TDP 135 W TDP 143 W TDP 157 W TDP 170 W 88% 75% 62% 76% 62% 69% 61% 66% 92% 93% 67% 100% 78% 97%
Cinebench R23 - Cinebench R23 Single Core
min: 1825 avg: 2081 median: 2110 (90%) max: 2169 Points
CPU TDP ? TDP 65 W TDP 80 W TDP 125 W TDP 130 W TDP 143 W TDP 170 W 98% 97% 85% 99% 99% 98% 100%
min: 1666 avg: 1842 median: 1882 (80%) max: 1933 Points
CPU TDP ? TDP 65 W TDP 70 W TDP 80 W TDP 90 W TDP 115 W TDP 117 W TDP 122 W TDP 125 W TDP 130 W TDP 135 W TDP 143 W TDP 157 W TDP 170 W 95% 88% 89% 87% 87% 89% 78% 85% 99% 99% 90% 98% 90% 100%
Cinebench R20 - Cinebench R20 CPU (Single Core)
min: 717 avg: 790 median: 807 (90%) max: 825 Points
CPU TDP ? TDP 65 W TDP 80 W TDP 125 W TDP 130 W TDP 143 W TDP 157 W TDP 170 W 98% 97% 87% 88% 99% 98% 94% 100%
min: 644 avg: 711 median: 724.5 (81%) max: 740 Points
CPU TDP ? TDP 65 W TDP 70 W TDP 80 W TDP 90 W TDP 115 W TDP 117 W TDP 122 W TDP 125 W TDP 130 W TDP 135 W TDP 143 W TDP 157 W TDP 170 W 94% 88% 88% 88% 87% 89% 79% 86% 88% 99% 90% 98% 92% 100%
Cinebench R20 - Cinebench R20 CPU (Multi Core)
min: 10353 avg: 11583 median: 11510 (28%) max: 12437 Points
CPU TDP ? TDP 65 W TDP 80 W TDP 125 W TDP 130 W TDP 143 W TDP 157 W TDP 170 W 95% 83% 91% 90% 94% 100% 90% 97%
min: 6889 avg: 7981 median: 7966 (19%) max: 8610 Points
CPU TDP ? TDP 65 W TDP 70 W TDP 80 W TDP 90 W TDP 115 W TDP 117 W TDP 122 W TDP 125 W TDP 130 W TDP 135 W TDP 143 W TDP 157 W TDP 170 W 87% 73% 63% 77% 62% 69% 55% 67% 90% 94% 67% 100% 77% 97%
Cinebench R15 - Cinebench R15 CPU Multi 64 Bit
min: 4358 avg: 4724 median: 4717 (30%) max: 5172 Points
CPU TDP ? TDP 65 W TDP 80 W TDP 125 W TDP 130 W TDP 143 W TDP 157 W TDP 170 W 98% 87% 94% 92% 94% 100% 91% 96%
min: 3008 avg: 3288 median: 3324 (21%) max: 3482 Points
CPU TDP ? TDP 65 W TDP 70 W TDP 80 W TDP 90 W TDP 115 W TDP 117 W TDP 122 W TDP 125 W TDP 130 W TDP 135 W TDP 143 W TDP 157 W TDP 170 W 88% 76% 69% 78% 60% 68% 65% 67% 92% 94% 70% 100% 77% 96%
Cinebench R15 - Cinebench R15 CPU Single 64 Bit
min: 289 avg: 303.6 median: 304.5 (92%) max: 312 Points
CPU TDP ? TDP 65 W TDP 80 W TDP 125 W TDP 130 W TDP 143 W TDP 157 W TDP 170 W 98% 98% 93% 97% 97% 97% 94% 100%
min: 243 avg: 269 median: 272.5 (82%) max: 279 Points
CPU TDP ? TDP 65 W TDP 70 W TDP 80 W TDP 90 W TDP 115 W TDP 117 W TDP 122 W TDP 125 W TDP 130 W TDP 135 W TDP 143 W TDP 157 W TDP 170 W 95% 88% 89% 91% 85% 87% 85% 84% 97% 97% 89% 97% 92% 100%
Cinebench R11.5 - Cinebench R11.5 CPU Multi 64 Bit
55.8 Points (73%)
Cinebench R11.5 - Cinebench R11.5 CPU Single 64 Bit
3.7 Points (93%)
Cinebench R10 - Cinebench R10 Rend. Single (32bit)
11940 Points (72%)
Cinebench R10 - Cinebench R10 Rend. Multi (32bit)
85088 Points (62%)
Cinebench R10 - Cinebench R10 Rend. Multi (64bit)
125983 Points (87%)
Cinebench R10 - Cinebench R10 Rend. Single (64bit)
17400 Points (21%)
wPrime 2.10 - wPrime 2.0 1024m *
183.5 s (2%)
wPrime 2.10 - wPrime 2.0 32m *
3 s (1%)
11438 Points (18%)
7-Zip 18.03 - 7-Zip 18.03 Multli Thread 4 runs
min: 104616 avg: 118958 median: 119244 (68%) max: 129804 MIPS
CPU TDP ? TDP 65 W TDP 80 W TDP 125 W TDP 130 W TDP 143 W TDP 157 W TDP 170 W 94% 89% 81% 91% 90% 100% 86% 95%
min: 72220 avg: 79565 median: 78488 (45%) max: 89294 MIPS
CPU TDP ? TDP 65 W TDP 70 W TDP 80 W TDP 90 W TDP 115 W TDP 117 W TDP 122 W TDP 125 W TDP 130 W TDP 135 W TDP 143 W TDP 157 W TDP 170 W 86% 72% 58% 71% 60% 63% 60% 67% 91% 90% 56% 100% 75% 95%
7-Zip 18.03 - 7-Zip 18.03 Single Thread 4 runs
min: 6889 avg: 6991 median: 6972 (83%) max: 7163 MIPS
CPU TDP ? TDP 65 W TDP 80 W TDP 125 W TDP 130 W TDP 143 W TDP 157 W TDP 170 W 98% 99% 98% 98% 99% 97% 88% 100%
min: 5552 avg: 6125 median: 6201.5 (74%) max: 6409 MIPS
CPU TDP ? TDP 65 W TDP 70 W TDP 80 W TDP 90 W TDP 115 W TDP 117 W TDP 122 W TDP 125 W TDP 130 W TDP 135 W TDP 143 W TDP 157 W TDP 170 W 95% 89% 90% 94% 84% 88% 81% 86% 98% 99% 90% 97% 89% 100%
X264 HD Benchmark 4.0 - x264 Pass 2
198.1 fps (69%)
X264 HD Benchmark 4.0 - x264 Pass 1
374 fps (86%)
HWBOT x265 Benchmark v2.2 - HWBOT x265 4k Preset
min: 27 avg: 31.1 median: 31.6 (56%) max: 33.4 fps
CPU TDP ? TDP 65 W TDP 80 W TDP 125 W TDP 130 W TDP 143 W TDP 170 W 97% 88% 81% 95% 90% 99% 100%
min: 19.7 avg: 22.6 median: 22.3 (39%) max: 25.5 fps
CPU TDP ? TDP 65 W TDP 70 W TDP 80 W TDP 90 W TDP 115 W TDP 117 W TDP 122 W TDP 125 W TDP 130 W TDP 135 W TDP 143 W TDP 157 W TDP 170 W 90% 75% 59% 74% 63% 71% 72% 73% 95% 90% 65% 99% 67% 100%
TrueCrypt - TrueCrypt Serpent
2.5 GB/s (0%)
TrueCrypt - TrueCrypt Twofish
4.9 GB/s (84%)
TrueCrypt - TrueCrypt AES
18.4 GB/s (48%)
Blender - Blender 3.3 Classroom CPU *
min: 170 avg: 194.7 median: 190 (2%) max: 249 Seconds
CPU TDP ? TDP 65 W TDP 80 W TDP 125 W TDP 130 W TDP 143 W TDP 170 W 101% 101% 100% 101% 101% 101% 101%
min: 240 avg: 278.9 median: 270.5 (3%) max: 345 Seconds
CPU TDP ? TDP 65 W TDP 70 W TDP 80 W TDP 90 W TDP 115 W TDP 117 W TDP 122 W TDP 125 W TDP 130 W TDP 135 W TDP 143 W TDP 157 W TDP 170 W 101% 101% 100% 101% 100% 100% 101% 101% 102% 102% 101% 102% 101% 102%
Blender - Blender 2.79 BMW27 CPU *
min: 97 avg: 108.4 median: 106 (1%) max: 136 Seconds
CPU TDP ? TDP 65 W TDP 80 W TDP 125 W TDP 130 W TDP 143 W TDP 157 W TDP 170 W 100% 100% 100% 100% 100% 100% 100% 100%
min: 138 avg: 161.4 median: 159 (1%) max: 198 Seconds
CPU TDP ? TDP 65 W TDP 70 W TDP 80 W TDP 115 W TDP 117 W TDP 122 W TDP 125 W TDP 130 W TDP 135 W TDP 143 W TDP 157 W TDP 170 W 100% 100% 100% 100% 100% 100% 100% 101% 101% 100% 101% 100% 101%
R Benchmark 2.5 - R Benchmark 2.5 *
min: 0.3793 avg: 0.4 median: 0.4 (8%) max: 0.4041 sec
CPU TDP ? TDP 65 W TDP 80 W TDP 125 W TDP 130 W TDP 143 W TDP 157 W TDP 170 W 101% 101% 101% 102% 101% 101% 100% 102%
min: 0.4274 avg: 0.5 median: 0.4 (10%) max: 0.493 sec
CPU TDP ? TDP 65 W TDP 70 W TDP 80 W TDP 90 W TDP 115 W TDP 117 W TDP 122 W TDP 125 W TDP 130 W TDP 135 W TDP 143 W TDP 157 W TDP 170 W 102% 101% 101% 101% 100% 101% 100% 100% 102% 102% 101% 102% 101% 102%
3DMark 06 - CPU - 3DMark 06 - CPU
19734 Points (42%)
min: 15688 avg: 17169 median: 17038 (36%) max: 18780 Points
CPU TDP 65 W TDP 70 W TDP 157 W TDP 170 W 95% 79% 86% 100%
Super Pi mod 1.5 XS 1M - Super Pi mod 1.5 XS 1M *
7.4 s (2%)
Super Pi mod 1.5 XS 2M - Super Pi mod 1.5 XS 2M *
15.5 s (1%)
Super Pi Mod 1.5 XS 32M - Super Pi mod 1.5 XS 32M *
345.8 s (2%)
3DMark 11 - 3DM11 Performance Physics
min: 12665 avg: 23608 median: 25051 (68%) max: 27094 Points
CPU TDP ? TDP 65 W TDP 80 W TDP 125 W TDP 130 W TDP 143 W TDP 170 W 89% 84% 47% 88% 95% 100% 98%
min: 21590 avg: 23818 median: 23995.5 (65%) max: 25859 Points
CPU TDP ? TDP 65 W TDP 70 W TDP 80 W TDP 90 W TDP 115 W TDP 117 W TDP 122 W TDP 125 W TDP 130 W TDP 135 W TDP 143 W TDP 157 W TDP 170 W 90% 86% 90% 63% 88% 83% 89% 95% 88% 95% 81% 100% 93% 98%
3DMark - 3DMark Ice Storm Physics
min: 91195 avg: 94076 median: 94075.5 (76%) max: 96956 Points
CPU TDP 130 W TDP 170 W 100% 94%
103646 Points (84%)
CPU TDP 130 W TDP 135 W TDP 170 W 94% 100% 88%
3DMark - 3DMark Ice Storm Extreme Physics
91414 Points (74%)
103932 Points (84%)
CPU TDP 135 W TDP 170 W 100% 88%
3DMark - 3DMark Ice Storm Unlimited Physics
94552 Points (80%)
min: 22441 avg: 30385 median: 30384.5 (26%) max: 38328 Points
CPU TDP ? TDP 170 W 32% 100%
103341 Points (87%)
CPU TDP ? TDP 135 W TDP 170 W 29% 100% 91%
3DMark - 3DMark Cloud Gate Physics
min: 15674 avg: 20652 median: 21142 (53%) max: 24650 Points
CPU TDP 65 W TDP 80 W TDP 130 W TDP 170 W 74% 64% 100% 98%
min: 17714 avg: 20672 median: 20745.5 (52%) max: 22722 Points
CPU TDP 65 W TDP 70 W TDP 80 W TDP 115 W TDP 130 W TDP 135 W TDP 157 W TDP 170 W 73% 86% 72% 91% 100% 83% 92% 98%
3DMark - 3DMark Fire Strike Standard Physics
min: 19708 avg: 37344 median: 40175 (72%) max: 41644 Points
CPU TDP ? TDP 65 W TDP 80 W TDP 125 W TDP 130 W TDP 143 W TDP 170 W 93% 87% 47% 93% 98% 100% 99%
min: 30988 avg: 34044 median: 33720 (60%) max: 36417 Points
CPU TDP ? TDP 65 W TDP 70 W TDP 80 W TDP 90 W TDP 115 W TDP 117 W TDP 122 W TDP 125 W TDP 130 W TDP 135 W TDP 143 W TDP 157 W TDP 170 W 91% 83% 79% 61% 79% 82% 85% 87% 93% 98% 80% 100% 85% 99%
3DMark - 3DMark Time Spy CPU
min: 14503 avg: 16587 median: 17026 (72%) max: 18234 Points
CPU TDP ? TDP 65 W TDP 80 W TDP 125 W TDP 130 W TDP 143 W TDP 170 W 100% 82% 84% 100% 95% 99% 90%
min: 12569 avg: 14765 median: 14971.5 (63%) max: 16441 Points
CPU TDP ? TDP 65 W TDP 70 W TDP 80 W TDP 90 W TDP 115 W TDP 117 W TDP 122 W TDP 125 W TDP 130 W TDP 135 W TDP 143 W TDP 157 W TDP 170 W 97% 81% 85% 80% 82% 85% 84% 92% 100% 95% 71% 99% 85% 90%
3DMark - 3DMark Sling Shot Extreme (ES 3.1) Unlimited Physics
min: 4166 avg: 4710 median: 4831 (57%) max: 4942 Points
3DMark - 3DMark Sling Shot (ES 3.0) Unlimited Physics
min: 4224 avg: 4892 median: 4684 (54%) max: 6394 Points
Geekbench 6.2 - Geekbench 6.2 Single-Core
min: 2802 avg: 2882 median: 2881.5 (78%) max: 2961 Points
CPU TDP ? TDP 125 W 95% 100%
min: 2541 avg: 2591 median: 2593 (70%) max: 2638 Points
CPU TDP ? TDP 125 W TDP 135 W TDP 157 W 91% 100% 86% 89%
Geekbench 6.2 - Geekbench 6.2 Multi-Core
min: 17472 avg: 17564 median: 17564 (69%) max: 17656 Points
CPU TDP ? TDP 125 W 100% 99%
min: 11793 avg: 13739 median: 14402 (57%) max: 15022 Points
CPU TDP ? TDP 125 W TDP 135 W TDP 157 W 94% 100% 67% 82%
Geekbench 5.5 - Geekbench 5.1 - 5.4 64 Bit Single-Core
min: 1986 avg: 2079 median: 2099 (89%) max: 2139 Points
CPU TDP ? TDP 65 W TDP 80 W TDP 125 W TDP 130 W TDP 143 W TDP 157 W TDP 170 W 97% 99% 94% 100% 98% 97% 84% 98%
min: 765 avg: 781 median: 787 (33%) max: 791 Points
CPU TDP ? TDP 65 W TDP 80 W TDP 125 W TDP 130 W TDP 143 W TDP 157 W TDP 170 W 46% 99% 94% 100% 98% 97% 84% 98%
min: 1666 avg: 1834 median: 1852.5 (78%) max: 1899 Points
CPU TDP ? TDP 65 W TDP 70 W TDP 80 W TDP 90 W TDP 115 W TDP 117 W TDP 122 W TDP 125 W TDP 130 W TDP 135 W TDP 143 W TDP 157 W TDP 170 W 49% 88% 87% 91% 88% 89% 83% 85% 100% 98% 85% 97% 85% 98%
Geekbench 5.5 - Geekbench 5.1 - 5.4 64 Bit Multi-Core
min: 18475 avg: 20205 median: 20329 (36%) max: 22200 Points
CPU TDP ? TDP 65 W TDP 80 W TDP 125 W TDP 130 W TDP 143 W TDP 157 W TDP 170 W 93% 85% 83% 93% 89% 100% 86% 94%
min: 2785 avg: 2882 median: 2889 (5%) max: 3000 Points
CPU TDP ? TDP 65 W TDP 80 W TDP 125 W TDP 130 W TDP 143 W TDP 157 W TDP 170 W 25% 85% 83% 93% 89% 100% 86% 94%
min: 12389 avg: 14660 median: 14695 (26%) max: 15850 Points
CPU TDP ? TDP 65 W TDP 70 W TDP 80 W TDP 90 W TDP 115 W TDP 117 W TDP 122 W TDP 125 W TDP 130 W TDP 135 W TDP 143 W TDP 157 W TDP 170 W 29% 75% 68% 74% 67% 70% 64% 70% 93% 89% 56% 100% 76% 94%
Geekbench 5.0 - Geekbench 5.0 64 Bit Single-Core
1987 Points (9%)
min: 1712 avg: 1786 median: 1788.5 (8%) max: 1855 Points
CPU TDP 90 W TDP 115 W TDP 117 W TDP 122 W TDP 143 W 92% 93% 86% 88% 100%
Geekbench 5.0 - Geekbench 5.0 64 Bit Multi-Core
22107 Points (70%)
min: 13815 avg: 14802 median: 15008.5 (47%) max: 15376 Points
CPU TDP 90 W TDP 115 W TDP 117 W TDP 122 W TDP 143 W 67% 69% 62% 70% 100%
Geekbench 4.4 - Geekbench 4.1 - 4.4 64 Bit Single-Core
min: 3452 avg: 3486 median: 3500 (35%) max: 3505 Points
8059 Points (81%)
CPU TDP ? TDP 115 W 43% 100%
Geekbench 4.4 - Geekbench 4.1 - 4.4 64 Bit Multi-Core
min: 10974 avg: 11228 median: 11003 (12%) max: 11708 Points
57031 Points (63%)
CPU TDP ? TDP 115 W 20% 100%
Mozilla Kraken 1.1 - Kraken 1.1 Total Score *
min: 446 avg: 459.9 median: 451 (1%) max: 515 ms
CPU TDP ? TDP 65 W TDP 80 W TDP 125 W TDP 130 W TDP 143 W TDP 170 W 100% 100% 100% 100% 100% 100% 100%
min: 1323 avg: 1620 median: 1708.8 (2%) max: 1893 ms
CPU TDP ? TDP 65 W TDP 80 W TDP 125 W TDP 130 W TDP 143 W TDP 170 W 100% 101% 101% 101% 101% 101% 101%
min: 489 avg: 508 median: 503.5 (1%) max: 538 ms
CPU TDP ? TDP 65 W TDP 70 W TDP 80 W TDP 90 W TDP 115 W TDP 117 W TDP 122 W TDP 125 W TDP 130 W TDP 135 W TDP 143 W TDP 157 W TDP 170 W 100% 101% 101% 101% 101% 101% 101% 101% 101% 101% 101% 101% 101% 101%
Octane V2 - Octane V2 Total Score
min: 96184 avg: 102620 median: 102620 (90%) max: 109055 Points
CPU TDP 80 W TDP 130 W 88% 100%
min: 23915 avg: 27285 median: 25445 (22%) max: 31915 Points
CPU TDP ? TDP 80 W TDP 130 W 25% 88% 100%
min: 86875 avg: 92028 median: 92283 (81%) max: 96670 Points
CPU TDP ? TDP 65 W TDP 70 W TDP 80 W TDP 115 W TDP 130 W TDP 157 W 25% 80% 89% 88% 88% 100% 81%
WebXPRT 4 - WebXPRT 4 Score
min: 254 avg: 298.6 median: 306 (88%) max: 318 Points
CPU TDP ? TDP 80 W TDP 125 W TDP 130 W TDP 143 W TDP 170 W 94% 80% 96% 96% 96% 100%
min: 64 avg: 71.3 median: 73.5 (21%) max: 74 Points
CPU TDP ? TDP 80 W TDP 125 W TDP 130 W TDP 143 W TDP 170 W 37% 80% 96% 96% 96% 100%
min: 247 avg: 267.4 median: 270.5 (78%) max: 283 Points
CPU TDP ? TDP 65 W TDP 70 W TDP 80 W TDP 90 W TDP 115 W TDP 117 W TDP 122 W TDP 125 W TDP 130 W TDP 135 W TDP 143 W TDP 157 W TDP 170 W 37% 78% 86% 80% 84% 89% 78% 86% 96% 96% 84% 96% 88% 100%
WebXPRT 3 - WebXPRT 3 Score
min: 277 avg: 330.2 median: 337 (70%) max: 349 Points
CPU TDP ? TDP 65 W TDP 80 W TDP 125 W TDP 130 W TDP 143 W TDP 170 W 94% 98% 79% 100% 97% 97% 97%
min: 93 avg: 107 median: 105.5 (22%) max: 131 Points
CPU TDP ? TDP 65 W TDP 80 W TDP 125 W TDP 130 W TDP 143 W TDP 170 W 41% 98% 79% 100% 97% 97% 97%
min: 238 avg: 304.1 median: 316 (66%) max: 336 Points
CPU TDP ? TDP 65 W TDP 70 W TDP 80 W TDP 90 W TDP 115 W TDP 117 W TDP 122 W TDP 125 W TDP 130 W TDP 143 W TDP 157 W TDP 170 W 45% 90% 93% 86% 85% 96% 68% 91% 100% 97% 97% 87% 97%
min: 72277 avg: 76124 median: 73811 (62%) max: 83387 Points
AnTuTu v8 - AnTuTu v8 MEM
min: 76203 avg: 81700 median: 82261 (66%) max: 89525 Points
AnTuTu v8 - AnTuTu v8 GPU
min: 114681 avg: 127474 median: 116173 (21%) max: 145964 Points
AnTuTu v8 - AnTuTu v8 CPU
min: 136885 avg: 150928 median: 153671 (56%) max: 158840 Points
AnTuTu v8 - AnTuTu v8 Total Score
min: 422597 avg: 436226 median: 435272 (42%) max: 452805 Points
Antutu v9 - AnTuTu v9 Total Score
min: 438254 avg: 501252 median: 508662 (31%) max: 540593 Points
Antutu v9 - AnTuTu v9 CPU
min: 123260 avg: 152750 median: 157904 (43%) max: 162858 Points
PassMark PerformanceTest Mobile V1 - PerformanceTest Mobile V1 CPU Tests
min: 4322 avg: 4439 median: 4438.5 (1%) max: 4555 Points
PCMark for Android - PCM f. Android Storage 2.0 random write internal
42.9 MB/s (32%)
PCMark for Android - PCM f. Android Storage 2.0 seq write internal
411.5 MB/s (13%)
PCMark for Android - PCM f. Android Storage 2.0 random read internal
28.8 MB/s (35%)
PCMark for Android - PCM f. Android Storage 2.0 seq read internal
826 MB/s (23%)
PCMark for Android - PCM f. Android Storage 2.0 score
min: 14645 avg: 20211 median: 22224 (35%) max: 23765 Points
PCMark for Android - PCM f. Android Work Score 3.0
min: 9330 avg: 11553 median: 11915 (55%) max: 13296 Points
PCMark for Android - PCM f. Android Computer Vision
8000 Points (42%)
PCMark for Android - PCM f. Android Storage
16076 Points (34%)
PCMark for Android - PCM f. Android Work Score 2.0
min: 8501 avg: 10073 median: 10073 (66%) max: 11645 Points
PCMark for Android - PCM f. Android Work Score
10619 Points (53%)
CrossMark - CrossMark Overall
min: 1935 avg: 2079 median: 2080 (80%) max: 2182 Points
CPU TDP 65 W TDP 80 W TDP 125 W TDP 130 W TDP 143 W TDP 170 W 93% 94% 89% 99% 100% 96%
min: 621 avg: 663 median: 658 (25%) max: 734 Points
CPU TDP ? TDP 65 W TDP 80 W TDP 125 W TDP 130 W TDP 143 W TDP 170 W 30% 93% 94% 89% 99% 100% 96%
min: 1663 avg: 1875 median: 1831 (70%) max: 2105 Points
CPU TDP ? TDP 65 W TDP 70 W TDP 80 W TDP 90 W TDP 115 W TDP 117 W TDP 122 W TDP 125 W TDP 130 W TDP 135 W TDP 143 W TDP 157 W TDP 170 W 30% 87% 95% 89% 78% 97% 76% 90% 89% 99% 79% 100% 94% 96%
Power Consumption - Prime95 Power Consumption - external Monitor *
min: 157.3 avg: 197.5 median: 191.9 (33%) max: 262 Watt
CPU TDP 65 W TDP 80 W TDP 125 W TDP 130 W TDP 143 W 123% 129% 116% 127% 100%
min: 100.4 avg: 157.7 median: 166.5 (29%) max: 189.7 Watt
CPU TDP 65 W TDP 70 W TDP 80 W TDP 90 W TDP 115 W TDP 117 W TDP 122 W TDP 125 W TDP 130 W TDP 135 W TDP 143 W TDP 157 W 137% 147% 130% 126% 130% 127% 123% 116% 127% 130% 100% 130%
Power Consumption - Cinebench R15 Multi Power Consumption - external Monitor *
min: 172.2 avg: 222.5 median: 225 (41%) max: 291 Watt
CPU TDP 65 W TDP 80 W TDP 125 W TDP 130 W TDP 143 W TDP 170 W 146% 132% 116% 135% 100% 122%
min: 166.3 avg: 187.3 median: 183.9 (34%) max: 221 Watt
CPU TDP 65 W TDP 80 W TDP 90 W TDP 115 W TDP 117 W TDP 122 W TDP 125 W TDP 130 W TDP 135 W TDP 143 W TDP 170 W 146% 132% 144% 127% 142% 140% 116% 135% 149% 100% 122%
Power Consumption - Geekbench 5.5 Power Consumption 150cd *
230 Watt (100%)
min: 3.56 avg: 4.7 median: 4 (2%) max: 9.49 Watt
Power Consumption - Idle Power Consumption - external Monitor *
min: 19.8 avg: 25.3 median: 23.2 (15%) max: 32.3 Watt
CPU TDP 65 W TDP 80 W TDP 125 W TDP 130 W TDP 143 W TDP 170 W 103% 110% 100% 110% 108% 101%
min: 12.9 avg: 22 median: 22.1 (15%) max: 28.7 Watt
CPU TDP 65 W TDP 70 W TDP 80 W TDP 90 W TDP 115 W TDP 117 W TDP 122 W TDP 125 W TDP 130 W TDP 135 W TDP 143 W TDP 157 W TDP 170 W 107% 110% 107% 109% 108% 107% 116% 100% 110% 103% 108% 110% 101%
Power Consumption - Idle Power Consumption 150cd 1min *
min: 15.2 avg: 25.2 median: 24.9 (28%) max: 37.8 Watt
CPU TDP 65 W TDP 80 W TDP 125 W TDP 130 W TDP 143 W TDP 170 W 121% 143% 101% 139% 125% 100%
min: 0.899 avg: 1.7 median: 1.4 (2%) max: 5.08 Watt
CPU TDP ? TDP 65 W TDP 80 W TDP 125 W TDP 130 W TDP 143 W TDP 170 W 169% 121% 143% 101% 139% 125% 100%
min: 12.1 avg: 16.8 median: 15.2 (17%) max: 25.4 Watt
CPU TDP ? TDP 65 W TDP 70 W TDP 80 W TDP 90 W TDP 115 W TDP 117 W TDP 122 W TDP 125 W TDP 130 W TDP 143 W TDP 157 W TDP 170 W 169% 135% 142% 146% 128% 141% 124% 144% 101% 139% 125% 145% 100%
Power Consumption - Cinebench R15 Multi Power Efficiency - external Monitor
min: 18.3 avg: 21.1 median: 20.4 (15%) max: 25.3 Points per Watt
CPU TDP 65 W TDP 125 W TDP 130 W TDP 170 W 100% 72% 81% 80%
min: 16.9 avg: 18.3 median: 17.7 (13%) max: 20.9 Points per Watt
CPU TDP 65 W TDP 90 W TDP 117 W TDP 122 W TDP 125 W TDP 130 W TDP 135 W TDP 170 W 100% 67% 70% 70% 72% 81% 83% 80%
Average Benchmarks Intel Core i9-13980HX → 100% n=8 Average Benchmarks Qualcomm Snapdragon 778G 5G → 37% n=8 Average Benchmarks Intel Core i7-13700HX → 91% n=8
- Bereich der Benchmarkergebnisse für diese Grafikkarte
- Durchschnittliche Benchmarkergebnisse für diese Grafikkarte
* Smaller numbers mean a higher performance
1 This benchmark is not used for the average calculation
v1.28
log 06. 16:10:30
#0 checking url part for id 14665 +0s ... 0s
#1 checking url part for id 13821 +0s ... 0s
#2 checking url part for id 14661 +0s ... 0s
#3 redirected to Ajax server, took 1720275030 +0s ... 0s
#4 did not recreate cache, as it is less than 5 days old! Created at Thu, 04 Jul 2024 05:15:21 +0200 +0s ... 0s
#5 composed specs +0.006s ... 0.006s
#6 did output specs +0s ... 0.006s
#7 getting avg benchmarks for device 14665 +0.004s ... 0.011s
#8 got single benchmarks 14665 +0.016s ... 0.027s
#9 getting avg benchmarks for device 13821 +0.004s ... 0.031s
#10 got single benchmarks 13821 +0.014s ... 0.045s
#11 getting avg benchmarks for device 14661 +0.004s ... 0.049s
#12 got single benchmarks 14661 +0.018s ... 0.067s
#13 got avg benchmarks for devices +0s ... 0.067s
#14 min, max, avg, median took s +0.07s ... 0.137s
#15 return log +0s ... 0.137s
Teilen Sie diesen Artikel, um uns zu unterstützen. Jeder Link hilft!
Autor: Klaus Hinum, 8.09.2017 (Update: 1.07.2023)