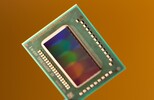
Intel Core i7-7920HQ vs Intel Core i7-2860QM
Intel Core i7-7920HQ
► remove from comparison
Der Intel Core i7-7920HQ ist ein schneller Quad-Core-Prozessor für Notebooks auf Basis der Kaby-Lake-Architektur, der im Jänner 2017 vorgestellt wurde. Zum Zeitpunkt der Präsentation stellt er das Consumer-Topmodell seiner Baureihe dar und wird nur vom Xeon E3-1535M v6 minimal geschlagen. Neben den vier CPU-Kernen inklusive Hyper-Threading-Support, die mit 3,1 bis 4,1 GHz takten (4 Kerne: max. 3,7 GHz, 2 Kerne: max. 3,9 GHz), integriert der Prozessor auch eine HD Graphics 630 Grafikeinheit sowie einen Dual-Channel-Speichercontroller (DDR3L-1600/DDR4-2133). Die Fertigung erfolgt in einem 14-Nanometer-Prozess mit FinFET-Transistoren.
Architektur
Im Vergleich mit Skylake hat Intel die zugrundeliegende Mikroarchitektur praktisch unverändert übernommen, sodass sich keine Unterschiede in der Pro-MHz-Leistung ergeben. Überarbeitet wurde lediglich die Speed-Shift-Technik zur schnelleren dynamischen Anpassung von Spannungen und Taktraten, zudem gestattet der gereifte 14-Nanometer-Prozess deutlich höhere Frequenzen und eine bessere Energieeffizienz als bislang.
Performance
Durch die leicht erhöhten Taktraten (max 7,9%) verglichen mit dem Skylake Vorgänger Core i7-6920HQ (2,9 - 3,8 GHz) steigt auch die Performance leicht an und kann sich daher an die Spitze der mobilen (Consumer) Prozessoren Anfang 2017 setzen. Dadurch reicht die Leistung auch für sehr anspruchsvolle Aufgaben und ist auf einem Level mit schnellen Desktop Quad-Core Prozessoren.
Grafikeinheit
Die integrierte Intel HD Graphics 630 Grafikkarte verfügt wie die alte HD Graphics 530 über 24 Ausführungseinheiten (EUs) und taktet in diesem Fall mit 350 - 1100 MHz. Die Performance hängt stark vom verwendeten Arbeitsspeicher ab; mit schnellem DDR4-2133 im Dual-Channel-Betrieb sollte die Leistung mit einer dedizerten Nvidia GeForce 920M vergleichbar sein.
Anders als Skylake kann Kaby Lake nun auch H.265/HEVC im Main10-Profil mit 10 Bit Farbtiefe sowie Googles VP9-Codec in Hardware decodieren. Die Anfang Jänner eingeführten Dual-Core-Kaby-Lake-Prozessoren sollten außerdem schon HDCP 2.2 beherrschen.
Leistungsaufnahme
Die Fertigung erfolgt in einem weiter verbesserten 14-Nanometer-Prozess mit FinFET-Transistoren, wodurch die Energieeffizienz nochmals spürbar gestiegen ist. Die TDP wird mit 45 Watt spezifiziert und kann je nach Einsatzzweck auch auf 35 Watt abgesenkt werden vom Notebookhersteeller (cTDP Down). Dadurch verringert sich jedoch auch die Durchschnittliche Leistung, da der Turbo nicht so lange gehalten wird.
Intel Core i7-2860QM
► remove from comparison
Der Intel Core i7-2860QM ist ein Quad-Core Prozessor basierend auf der Sandy Bridge Architektur und Nachfolger des Core i7-2820QM. Im 3. Quartal 2011 ist er der zweitschnellste mobile Prozessor für Notebooks hinter dem i7-2960XM und überholt sogar den alten Spitzenreiter Core i7-2920XM. Er bietet 4 Kerne und kann dank Hyperthreading 8 Threads gleichzeitig bearbeiten. Im Vergleich zu den Clarksfield Quad-Cores wird der 2860QM bereits in 32nm gefertigt. Der langsamere 2760QM ist etwas geringer getaktet und bietet deutlich weniger Level 3 Cache (6 vs. 8 MB).
Sandy Bridge ist eine Weiterentwicklung der Arrandale Architektur. Neben Optimierungen sind besonders die neuen 256 Bit AVX Instruktionen im CPU Teil und der verbesserte Turbo 2.0 erwähnenswert. Weiterhin sind nun ebenfalls AES Funktionen und ein verbesserter Dual Channel DDR3 Speichercontroller direkt im Prozessor integriert.
Die intergrierte Intel HD Graphics 3000 Grafikkarte ist direkt in der CPU untergebracht und teilt sich mit dieser den Level 3 / Last Level Cache. Dadurch sinkt zwar die Prozessorleistung etwas bei aktivierter Grafik, die Grafikleistung ist jedoch deutlich besser als bei der alten Intel HD Graphics und auf dem Niveau einer Nvidia Geforce 310M Einstiegsgrafikkarte. Dank Turbo Boost wird sie im 2860QM von 650 MHz bis 1300 MHz getaktet.
Die Performance liegt durch den höheren Turbo-Takt etwas über dem ehemaligen Spitzenreiter Core i7-2920XM. Dieser bietet jedoch einen freien Multiplikator zur einfachen Übertaktung, aber auch eine höhere TDP. Dadurch ist die Quad Core CPU für alle Anwendungen und Spiele ausreichend schnell und eignet sich auch für Rendering und anspruchsvollen Videoschnitt.
Im Vergleich zu den Sandy Bridge Doppelkernprozessoren sind die Quad Core CPUs mit einer höheren TDP spezifiziert und eignen sich daher nur für große Notebooks. Im Vergleich zu den Clarksfield CPUs beinhaltet die TDP jedoch nun auch die Grafikkarte, wodurch sie im Schnitt sparsamer wurden.
| Model | Intel Core i7-7920HQ | Intel Core i7-2860QM | ||||||||||||||||||||||||||||||||||||||||||||||||||||||||||||||||||||||||||||||||||||||||||||||||||||||||||||||||||||||||||||||||||||||||||||||||||||||||||||||||||||||||||||||||||||||||||||||||||||||||||||||||||||||||||||||||||||||||||||||||
| Codename | Kaby Lake | Sandy Bridge | ||||||||||||||||||||||||||||||||||||||||||||||||||||||||||||||||||||||||||||||||||||||||||||||||||||||||||||||||||||||||||||||||||||||||||||||||||||||||||||||||||||||||||||||||||||||||||||||||||||||||||||||||||||||||||||||||||||||||||||||||
| Series | Intel Kaby Lake | Intel Core i7 | ||||||||||||||||||||||||||||||||||||||||||||||||||||||||||||||||||||||||||||||||||||||||||||||||||||||||||||||||||||||||||||||||||||||||||||||||||||||||||||||||||||||||||||||||||||||||||||||||||||||||||||||||||||||||||||||||||||||||||||||||
| Serie: Core i7 Sandy Bridge |
|
| ||||||||||||||||||||||||||||||||||||||||||||||||||||||||||||||||||||||||||||||||||||||||||||||||||||||||||||||||||||||||||||||||||||||||||||||||||||||||||||||||||||||||||||||||||||||||||||||||||||||||||||||||||||||||||||||||||||||||||||||||
| Clock | 3100 - 4100 MHz | 2500 - 3600 MHz | ||||||||||||||||||||||||||||||||||||||||||||||||||||||||||||||||||||||||||||||||||||||||||||||||||||||||||||||||||||||||||||||||||||||||||||||||||||||||||||||||||||||||||||||||||||||||||||||||||||||||||||||||||||||||||||||||||||||||||||||||
| L1 Cache | 256 KB | 256 KB | ||||||||||||||||||||||||||||||||||||||||||||||||||||||||||||||||||||||||||||||||||||||||||||||||||||||||||||||||||||||||||||||||||||||||||||||||||||||||||||||||||||||||||||||||||||||||||||||||||||||||||||||||||||||||||||||||||||||||||||||||
| L2 Cache | 1 MB | 1 MB | ||||||||||||||||||||||||||||||||||||||||||||||||||||||||||||||||||||||||||||||||||||||||||||||||||||||||||||||||||||||||||||||||||||||||||||||||||||||||||||||||||||||||||||||||||||||||||||||||||||||||||||||||||||||||||||||||||||||||||||||||
| L3 Cache | 8 MB | 8 MB | ||||||||||||||||||||||||||||||||||||||||||||||||||||||||||||||||||||||||||||||||||||||||||||||||||||||||||||||||||||||||||||||||||||||||||||||||||||||||||||||||||||||||||||||||||||||||||||||||||||||||||||||||||||||||||||||||||||||||||||||||
| Cores / Threads | 4 / 8 | 4 / 8 | ||||||||||||||||||||||||||||||||||||||||||||||||||||||||||||||||||||||||||||||||||||||||||||||||||||||||||||||||||||||||||||||||||||||||||||||||||||||||||||||||||||||||||||||||||||||||||||||||||||||||||||||||||||||||||||||||||||||||||||||||
| TDP | 45 Watt | 45 Watt | ||||||||||||||||||||||||||||||||||||||||||||||||||||||||||||||||||||||||||||||||||||||||||||||||||||||||||||||||||||||||||||||||||||||||||||||||||||||||||||||||||||||||||||||||||||||||||||||||||||||||||||||||||||||||||||||||||||||||||||||||
| Technology | 14 nm | 32 nm | ||||||||||||||||||||||||||||||||||||||||||||||||||||||||||||||||||||||||||||||||||||||||||||||||||||||||||||||||||||||||||||||||||||||||||||||||||||||||||||||||||||||||||||||||||||||||||||||||||||||||||||||||||||||||||||||||||||||||||||||||
| max. Temp. | 100 °C | 100 °C | ||||||||||||||||||||||||||||||||||||||||||||||||||||||||||||||||||||||||||||||||||||||||||||||||||||||||||||||||||||||||||||||||||||||||||||||||||||||||||||||||||||||||||||||||||||||||||||||||||||||||||||||||||||||||||||||||||||||||||||||||
| Features | Dual-Channel DDR4 Memory Controller, HyperThreading, AVX, AVX2, Quick Sync, Virtualization, AES-NI | HD Graphics 3000, DDR-1333 Memory Controller, HyperThreading, AVX, Quick Sync, Virtualization | ||||||||||||||||||||||||||||||||||||||||||||||||||||||||||||||||||||||||||||||||||||||||||||||||||||||||||||||||||||||||||||||||||||||||||||||||||||||||||||||||||||||||||||||||||||||||||||||||||||||||||||||||||||||||||||||||||||||||||||||||
| iGPU | Intel HD Graphics 630 (300 - 1150 MHz) | Intel HD Graphics 3000 (650 - 1300 MHz) | ||||||||||||||||||||||||||||||||||||||||||||||||||||||||||||||||||||||||||||||||||||||||||||||||||||||||||||||||||||||||||||||||||||||||||||||||||||||||||||||||||||||||||||||||||||||||||||||||||||||||||||||||||||||||||||||||||||||||||||||||
| Architecture | x86 | x86 | ||||||||||||||||||||||||||||||||||||||||||||||||||||||||||||||||||||||||||||||||||||||||||||||||||||||||||||||||||||||||||||||||||||||||||||||||||||||||||||||||||||||||||||||||||||||||||||||||||||||||||||||||||||||||||||||||||||||||||||||||
| $378 U.S. | $568 U.S. | |||||||||||||||||||||||||||||||||||||||||||||||||||||||||||||||||||||||||||||||||||||||||||||||||||||||||||||||||||||||||||||||||||||||||||||||||||||||||||||||||||||||||||||||||||||||||||||||||||||||||||||||||||||||||||||||||||||||||||||||||
| Announced | ||||||||||||||||||||||||||||||||||||||||||||||||||||||||||||||||||||||||||||||||||||||||||||||||||||||||||||||||||||||||||||||||||||||||||||||||||||||||||||||||||||||||||||||||||||||||||||||||||||||||||||||||||||||||||||||||||||||||||||||||||
| Transistors | 995 Million | |||||||||||||||||||||||||||||||||||||||||||||||||||||||||||||||||||||||||||||||||||||||||||||||||||||||||||||||||||||||||||||||||||||||||||||||||||||||||||||||||||||||||||||||||||||||||||||||||||||||||||||||||||||||||||||||||||||||||||||||||
| Die Size | 216 mm2 |
Benchmarks
Average Benchmarks Intel Core i7-7920HQ → 100% n=15
Average Benchmarks Intel Core i7-2860QM → 73% n=15
* Smaller numbers mean a higher performance
1 This benchmark is not used for the average calculation


