Notebookcheck Logo

Intel Core i7-7700T vs Intel Core i5-13500 vs Intel Pentium Gold 4415U

Intel Core i7-7700T

► remove from comparison Intel i7-7700T

Der Intel Core i7-7700T ist ein High-End Quad-Core Desktop-Prozessor auf Basis der Kaby-Lake-Architektur, der Anfang 2017 vorgestellt wurde. Im Vergleich zu dem deutlich schnelleren Core i7-7700K ist der Core i7-7700T geringer getaktet aber auch deutlich sparsamer mit einem TDP von 35 Watt.

Performance

Die Performance des Intel Core i7-7700T liegt knapp oberhalb eines Core i5-7600K durch die geringere Taktung. Zur Zeit der Erscheinung ist er der schnellste 35-Watt-Desktop-Prozessor der Kaby-Lake-Serie von Intel. Auch anspruchsvollste Programme und Spiele werden von der High-End-CPU problemlos bewältigt. 

Grafikeinheit

Für Grafikberechnungen zeigt sich die im Prozessor integrierte Intel HD Graphics 630 mit 24 EUs (Execution Units) verantwortlich, die mit 350 - 1150 MHz taktet. Die Leistung ist vergleichbar mit der alten Intel HD Graphics 530 und siedelt sich daher im absoluten Low-End-Bereich an, sodass aktuelle Spiele allenfalls in niedrigen Einstellungen flüssig dargestellt werden.

Intel Core i5-13500

► remove from comparison

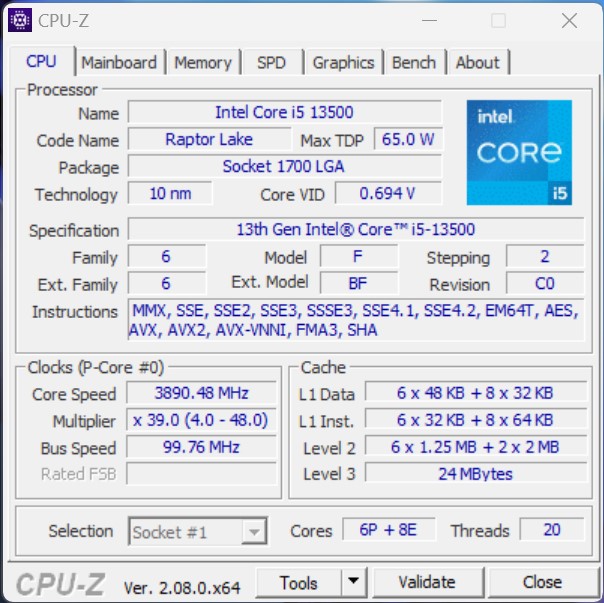
Der Intel Core i5-13500 ist ein schneller und sparsamer Desktop-Prozessor auf Basis der Raptor-Lake-Architektur, die bereits im Oktober 2022 vorgestellt wurde. Der Prozessor bietet einen Basistakt von 2,5 GHz und erreicht bis zu 4,8 GHz im Turbo. Die mit Alder-Lake eingeführte hybride CPU-Architektur kommt auch bei den Raptor-Lake-Prozessoren zum Einsatz. Im Vergleich zum Intel Core i5-12500 bietet der Intel Core i5-13500 mehr Kerne, womit eine höhere Gesamtleistung erzielt werden kann. In Summe kann der Intel Core i5-13500 bis zu 20 Threads parallel verarbeiten. Die Performance-Kerne (P-Cores) bieten hierzu Hyperthreading, was den energieeffizienten Kernen (E-Cores) vorenthalten wird.

Performance

Aufgrund der höheren Anzahl an physikalischen Recheneinheiten bietet der Intel Core i5-13500 gegenüber dem Intel Core i5-12500 spürbar mehr Leistung. Beide Prozessoren verfügen über 6 P-Kerne, wenngleich nur der Intel Core i5-13500 zusätzlich mit 8 E-Kernen bestückt ist.

Grafikeinheit

Wie auch der Intel Core i5-12600K bietet der Intel Core i5-13500 eine integrierte Grafikeinheit. Als Basis dient weiterhin die Intel Iris Xe-Architektur. Rein leistungstechnisch hat sich bei der neuen Intel UHD Graphics 770 aber nicht viel verändert. 

Leistungsaufnahme

Die TDP des Intel Core i5-13500 beläuft sich auf 65 Watt, mit der Option, diese im Turbo auf bis zu 154 Watt zu erhöhen. Gegenüber dem Intel Core i5-12500 steigt der Energiebedarf etwas an.

Intel Pentium Gold 4415U

► remove from comparison Intel Pentium 4415U

Der Intel Pentium Gold 4415U ist ein sparsamer Dual-Core-SoC auf Basis der Kaby-Lake-Architektur, der im 1. Quartal 2017 vorgestellt wurde. Die CPU wird hauptsächlich in Ultrabooks, aber auch gewöhnlichen Notebooks verbaut. Neben den zwei CPU-Kernen samt Hyper-Threading, die mit 2,3 GHz takten (kein Turbo Boost), integriert der Prozessor auch eine HD Graphics 610 Grafikeinheit sowie einen Dual-Channel-Speichercontroller (LPDDR3-1866/DDR4-2133/DDR3L-1600). Die Fertigung erfolgt in einem 14-Nanometer-Prozess mit FinFET-Transistoren.

Architektur

Im Vergleich mit Skylake hat Intel die zugrundeliegende Mikroarchitektur praktisch unverändert übernommen, sodass sich keine Unterschiede in der Pro-MHz-Leistung ergeben. Überarbeitet wurde lediglich die Speed-Shift-Technik zur schnelleren dynamischen Anpassung von Spannungen und Taktraten, zudem gestattet der gereifte 14-Nanometer-Prozess deutlich höhere Frequenzen und eine bessere Energieeffizienz als bislang.

Performance

Dank Hyper-Threading-Support rückt der Pentium 4415U nahe an die preislich höher positionierte Core-i3-Serie heran und erreicht in etwa die Leistung des alten Core i3-4000M (Haswell 2.4 GHz Dual-Core). Damit stehen für alltägliche Anwendungen, aber auch viele anspruchsvollere Programme ausreichende Reserven bereit.

Grafikeinheit

Die integrierte Grafikeinheit namens Intel HD Graphics 610 repräsentiert die kleinste, auch "GT1" genannte Ausbaustufe der Kaby-Lake-GPU (Intel Gen. 9).

Leistungsaufnahme

Dank "Configurable TDP" kann die CPU ausgehend von den standardmäßigen 15 Watt auch mit einer TDP von 10 Watt (cTDP Down) betrieben werden, wodurch sich jedoch die Performance reduziert. Je nach Einstellung ist der Chip für schlanke Note- und Ultrabooks ab etwa 11 Zoll Bilddiagonale geeignet.

ModelIntel Core i7-7700TIntel Core i5-13500Intel Pentium Gold 4415U
SeriesIntel Kaby LakeIntel Raptor Lake-SIntel Kaby Lake
CodenameKaby LakeRaptor LakeKaby Lake
Serie: Kaby Lake Kaby Lake
Intel Core i7-7700K4.2 - 4.5 GHz4 / 8 cores8 MB L3
Intel Core i7-77003.6 - 4.2 GHz4 / 8 cores8 MB L3
Intel Xeon E3-1535M v63.1 - 4.2 GHz4 / 8 cores8 MB L3
Intel Core i7-7920HQ3.1 - 4.1 GHz4 / 8 cores8 MB L3
Intel Core i7-7700T « 2.9 - 3.8 GHz4 / 8 cores8 MB L3
Intel Core i5-7600K3.8 - 4.2 GHz4 / 4 cores8 MB L3
Intel Xeon E3-1505M v63 - 4 GHz4 / 8 cores8 MB L3
Intel Core i7-7820HQ2.9 - 3.9 GHz4 / 8 cores8 MB L3
Intel Core i7-7820HK2.9 - 3.9 GHz4 / 8 cores8 MB L3
Intel Core i7-7700HQ2.8 - 3.8 GHz4 / 8 cores6 MB L3
Intel Core i5-75003.4 - 3.8 GHz4 / 4 cores6 MB L3
Intel Core i5-7440HQ2.8 - 3.8 GHz4 / 4 cores6 MB L3
Intel Core i7-7567U3.5 - 4 GHz2 / 4 cores4 MB L3
Intel Core i7-7660U2.5 - 4 GHz2 / 4 cores4 MB L3
Intel Core i7-7600U2.8 - 3.9 GHz2 / 4 cores4 MB L3
Intel Core i5-7300HQ2.5 - 3.5 GHz4 / 4 cores6 MB L3
Intel Core i5-7500T2.7 - 3.3 GHz4 / 4 cores6 MB L3
Intel Core i5-7287U3.3 - 3.7 GHz2 / 4 cores4 MB L3
Intel Core i7-7560U2.4 - 3.8 GHz2 / 4 cores4 MB L3
Intel Core i5-7267U3.1 - 3.5 GHz2 / 4 cores4 MB L3
Intel Core i5-7360U2.3 - 3.6 GHz2 / 4 cores4 MB L3
Intel Core i7-7500U2.7 - 3.5 GHz2 / 4 cores4 MB L3
Intel Core i5-7300U2.6 - 3.5 GHz2 / 4 cores3 MB L3
Intel Core i5-7260U2.2 - 3.4 GHz2 / 4 cores4 MB L3
Intel Core i5-7200U2.5 - 3.1 GHz2 / 4 cores3 MB L3
Intel Core i3-7100H3 GHz2 / 4 cores3 MB L3
Intel Core i3-7167U2.8 GHz2 / 4 cores3 MB L3
Intel Core i7-7Y751.3 - 3.6 GHz2 / 4 cores4 MB L3
Intel Core i5-7Y571.2 - 3.3 GHz2 / 4 cores4 MB L3
Intel Core i5-7Y541.2 - 3.2 GHz2 / 4 cores4 MB L3
Intel Core i3-7100U2.4 GHz2 / 4 cores3 MB L3
Intel Core m3-7Y321 - 3 GHz2 / 4 cores4 MB L3
Intel Pentium Gold 4415U2.3 GHz2 / 4 cores2 MB L3
Intel Core m3-7Y301 - 2.6 GHz2 / 4 cores4 MB L3
Intel Celeron 3965U2.2 GHz2 / 2 cores2 MB L3
Intel Core i3-7020U2.3 GHz2 / 4 cores3 MB L3
Intel Celeron 3867U1.8 GHz2 / 2 cores2 MB L3
Intel Celeron 3865U1.8 GHz2 / 2 cores2 MB L3
Intel Pentium Gold 4425Y1.7 GHz2 / 4 cores2 MB L3
Intel Pentium Gold 4415Y1.6 GHz2 / 4 cores2 MB L3
Intel Pentium Gold 4410Y1.5 GHz2 / 4 cores2 MB L3
Intel Celeron 3965Y1.5 GHz2 / 2 cores2 MB L3
Intel Core i9-13900K3 - 5.8 GHz24 / 32 cores36 MB L3
Intel Core i7-13700K3.4 - 5.4 GHz16 / 24 cores30 MB L3
Intel Core i5-13600K3.5 - 5.1 GHz14 / 20 cores24 MB L3
Intel Core i5-13500 « 2.5 - 4.8 GHz14 / 20 cores24 MB L3
Intel Core i5-13500T1.6 - 4.6 GHz14 / 20 cores24 MB L3
Intel Core i7-7700K4.2 - 4.5 GHz4 / 8 cores8 MB L3
Intel Core i7-77003.6 - 4.2 GHz4 / 8 cores8 MB L3
Intel Xeon E3-1535M v63.1 - 4.2 GHz4 / 8 cores8 MB L3
Intel Core i7-7920HQ3.1 - 4.1 GHz4 / 8 cores8 MB L3
Intel Core i7-7700T2.9 - 3.8 GHz4 / 8 cores8 MB L3
Intel Core i5-7600K3.8 - 4.2 GHz4 / 4 cores8 MB L3
Intel Xeon E3-1505M v63 - 4 GHz4 / 8 cores8 MB L3
Intel Core i7-7820HQ2.9 - 3.9 GHz4 / 8 cores8 MB L3
Intel Core i7-7820HK2.9 - 3.9 GHz4 / 8 cores8 MB L3
Intel Core i7-7700HQ2.8 - 3.8 GHz4 / 8 cores6 MB L3
Intel Core i5-75003.4 - 3.8 GHz4 / 4 cores6 MB L3
Intel Core i5-7440HQ2.8 - 3.8 GHz4 / 4 cores6 MB L3
Intel Core i7-7567U3.5 - 4 GHz2 / 4 cores4 MB L3
Intel Core i7-7660U2.5 - 4 GHz2 / 4 cores4 MB L3
Intel Core i7-7600U2.8 - 3.9 GHz2 / 4 cores4 MB L3
Intel Core i5-7300HQ2.5 - 3.5 GHz4 / 4 cores6 MB L3
Intel Core i5-7500T2.7 - 3.3 GHz4 / 4 cores6 MB L3
Intel Core i5-7287U3.3 - 3.7 GHz2 / 4 cores4 MB L3
Intel Core i7-7560U2.4 - 3.8 GHz2 / 4 cores4 MB L3
Intel Core i5-7267U3.1 - 3.5 GHz2 / 4 cores4 MB L3
Intel Core i5-7360U2.3 - 3.6 GHz2 / 4 cores4 MB L3
Intel Core i7-7500U2.7 - 3.5 GHz2 / 4 cores4 MB L3
Intel Core i5-7300U2.6 - 3.5 GHz2 / 4 cores3 MB L3
Intel Core i5-7260U2.2 - 3.4 GHz2 / 4 cores4 MB L3
Intel Core i5-7200U2.5 - 3.1 GHz2 / 4 cores3 MB L3
Intel Core i3-7100H3 GHz2 / 4 cores3 MB L3
Intel Core i3-7167U2.8 GHz2 / 4 cores3 MB L3
Intel Core i7-7Y751.3 - 3.6 GHz2 / 4 cores4 MB L3
Intel Core i5-7Y571.2 - 3.3 GHz2 / 4 cores4 MB L3
Intel Core i5-7Y541.2 - 3.2 GHz2 / 4 cores4 MB L3
Intel Core i3-7100U2.4 GHz2 / 4 cores3 MB L3
Intel Core m3-7Y321 - 3 GHz2 / 4 cores4 MB L3
Intel Pentium Gold 4415U « 2.3 GHz2 / 4 cores2 MB L3
Intel Core m3-7Y301 - 2.6 GHz2 / 4 cores4 MB L3
Intel Celeron 3965U2.2 GHz2 / 2 cores2 MB L3
Intel Core i3-7020U2.3 GHz2 / 4 cores3 MB L3
Intel Celeron 3867U1.8 GHz2 / 2 cores2 MB L3
Intel Celeron 3865U1.8 GHz2 / 2 cores2 MB L3
Intel Pentium Gold 4425Y1.7 GHz2 / 4 cores2 MB L3
Intel Pentium Gold 4415Y1.6 GHz2 / 4 cores2 MB L3
Intel Pentium Gold 4410Y1.5 GHz2 / 4 cores2 MB L3
Intel Celeron 3965Y1.5 GHz2 / 2 cores2 MB L3
Clock2900 - 3800 MHz2500 - 4800 MHz2300 MHz
L1 Cache256 KB128 KB
L2 Cache1 MB11.5 MB512 KB
L3 Cache8 MB24 MB2 MB
Cores / Threads4 / 814 / 20
6 x 4.8 GHz Intel Raptor Cove P-Core
8 x 3.5 GHz Intel Gracemont E-Core
2 / 4
TDP35 Watt65 Watt15 Watt
Technology14 nm10 nm14 nm
SocketFCLGA1151LGA 1700BGA
FeaturesDDR3(L)-1600/DDR4-2400 Memory Controller, AVX, AVX2, AES-NI, TSX-NI, Quick Sync, Virtualization, vProIntel UHD Graphics 770, DDR5 4800 MT/s, DDR4 3200 MT/sDual-Channel LPDDR3-1866/DDR4-2133 Memory Controller, HyperThreading, AVX, AVX2, Quick Sync, Virtualization, AES-NI
iGPUIntel HD Graphics 630 (350 - 1150 MHz)Intel UHD Graphics 770 (300 - 1550 MHz)Intel HD Graphics 610 (300 - 950 MHz)
Architecturex86x86x86
$303 U.S.$161 U.S.
Announced
Manufacturerark.intel.comwww.intel.deark.intel.com
TDP Turbo PL2154 Watt
Die Size215 mm2
max. Temp.100 °C100 °C

Benchmarks

Performance Rating - CB R15 + R20 + 7-Zip + X265 + Blender + 3DM11 CPU - i5-13500
38.7 pt (64%)
Performance Rating - CB R15 + R20 + 7-Zip + X265 + Blender + 3DM11 CPU - Pentium 4415U
18.3 pt (30%)
Cinebench 2024 - Cinebench 2024 CPU Single Core
107 Points (74%)
Cinebench 2024 - Cinebench 2024 CPU Multi Core
822 Points (15%)
Cinebench R23 - Cinebench R23 Multi Core
14573 Points (14%)
1366 Points (1%)
Cinebench R23 - Cinebench R23 Single Core
1780 Points (76%)
529 Points (23%)
Cinebench R20 - Cinebench R20 CPU (Single Core)
685 Points (76%)
181.3 Points (20%)
Cinebench R20 - Cinebench R20 CPU (Multi Core)
5633 Points (14%)
356 Points (1%)
Cinebench R15 - Cinebench R15 CPU Multi 64 Bit
714 Points (5%)
2405 Points (15%)
min: 238     avg: 239.5     median: 239.5 (2%)     max: 241 Points
Cinebench R15 - Cinebench R15 CPU Single 64 Bit
155 Points (45%)
256 Points (74%)
min: 93     avg: 94     median: 94 (27%)     max: 95 Points
Cinebench R11.5 - Cinebench R11.5 CPU Multi 64 Bit
7.6 Points (10%)
28.4 Points (37%)
2.7 Points (4%)
Cinebench R11.5 - Cinebench R11.5 CPU Single 64 Bit
1.8 Points (43%)
3.1 Points (77%)
1 Points (25%)
Cinebench R10 - Cinebench R10 Rend. Single (32bit)
6824 Points (41%)
8875 Points (54%)
3587 Points (22%)
Cinebench R10 - Cinebench R10 Rend. Multi (32bit)
21587 Points (16%)
49300 Points (36%)
8169 Points (6%)
Cinebench R10 - Cinebench R10 Rend. Multi (64bit)
79625 Points (55%)
Cinebench R10 - Cinebench R10 Rend. Single (64bit)
14282 Points (17%)
wPrime 2.10 - wPrime 2.0 1024m *
234.2 s (3%)
100.7 s (1%)
659 s (8%)
wPrime 2.10 - wPrime 2.0 32m *
6.9 s (1%)
4 s (1%)
20.9 s (4%)
WinRAR - WinRAR 4.0
4268 Points (7%)
7704 Points (12%)
2003 Points (3%)
7-Zip 18.03 - 7-Zip 18.03 Multli Thread 4 runs
55528 MIPS (32%)
6602 MIPS (4%)
7-Zip 18.03 - 7-Zip 18.03 Single Thread 4 runs
5887 MIPS (70%)
2575 MIPS (31%)
X264 HD Benchmark 4.0 - x264 Pass 2
42.7 fps (15%)
134.6 fps (47%)
16 fps (6%)
X264 HD Benchmark 4.0 - x264 Pass 1
173.2 fps (40%)
306 fps (71%)
85.7 fps (20%)
HWBOT x265 Benchmark v2.2 - HWBOT x265 4k Preset
16.3 fps (29%)
1.6 fps (3%)
TrueCrypt - TrueCrypt Serpent
0.4 GB/s (13%)
1.3 GB/s (39%)
0.1 GB/s (4%)
TrueCrypt - TrueCrypt Twofish
0.7 GB/s (11%)
2.3 GB/s (40%)
0.2 GB/s (4%)
TrueCrypt - TrueCrypt AES
4.4 GB/s (11%)
12 GB/s (31%)
1.4 GB/s (4%)
Blender - Blender 3.3 Classroom CPU *
399 Seconds (5%)
3786 Seconds (48%)
Blender - Blender 2.79 BMW27 CPU *
626 Seconds (4%)
223 Seconds (2%)
2188 Seconds (15%)
R Benchmark 2.5 - R Benchmark 2.5 *
0.4 sec (10%)
1.2 sec (26%)
3DMark 06 - CPU - 3DMark 06 - CPU
8273 Points (18%)
14875 Points (32%)
3249 Points (7%)
Super Pi mod 1.5 XS 1M - Super Pi mod 1.5 XS 1M *
14.5 s (3%)
7.8 s (2%)
16.7 s (4%)
Super Pi mod 1.5 XS 2M - Super Pi mod 1.5 XS 2M *
28.7 s (1%)
17.2 s (1%)
37.6 s (2%)
Super Pi Mod 1.5 XS 32M - Super Pi mod 1.5 XS 32M *
661 s (3%)
3DMark Vantage - 3DM Vant. Perf. CPU no Physx
69725 Points (61%)
9098 Points (8%)
3DMark 11 - 3DM11 Performance Physics
8078 Points (22%)
18026 Points (49%)
min: 2788     avg: 3025     median: 3024.5 (8%)     max: 3261 Points
3DMark - 3DMark Ice Storm Physics
84456 Points (69%)
31354 Points (25%)
3DMark - 3DMark Ice Storm Extreme Physics
83392 Points (68%)
30220 Points (25%)
3DMark - 3DMark Ice Storm Unlimited Physics
81778 Points (69%)
31593 Points (27%)
3DMark - 3DMark Cloud Gate Physics
17891 Points (45%)
2628 Points (7%)
3DMark - 3DMark Fire Strike Standard Physics
26263 Points (47%)
3755 Points (7%)
3DMark - 3DMark Time Spy CPU
9655 Points (41%)
Geekbench 6.2 - Geekbench 6.2 Single-Core
2483 Points (67%)
Geekbench 6.2 - Geekbench 6.2 Multi-Core
10348 Points (41%)
Geekbench 5.5 - Geekbench 5.1 - 5.5 64 Bit Single-Core
1805 Points (72%)
599 Points (24%)
Geekbench 5.5 - Geekbench 5.1 - 5.5 64 Bit Multi-Core
10322 Points (18%)
1374 Points (2%)
Geekbench 5.0 - Geekbench 5.0 64 Bit Single-Core
1749 Points (8%)
Geekbench 5.0 - Geekbench 5.0 64 Bit Multi-Core
10213 Points (32%)
Geekbench 4.4 - Geekbench 4.1 - 4.4 64 Bit Single-Core
4342 Points (43%)
7379 Points (74%)
2943 Points (29%)
Geekbench 4.4 - Geekbench 4.1 - 4.4 64 Bit Multi-Core
13974 Points (15%)
39094 Points (43%)
5630 Points (6%)
Geekbench 4.0 - Geekbench 4.0 64 Bit Single-Core
2816 Points (38%)
Geekbench 4.0 - Geekbench 4.0 64 Bit Multi-Core
5455 Points (13%)
Geekbench 3 - Geekbench 3 32 Bit Multi-Core
5270 Points (9%)
Geekbench 3 - Geekbench 3 32 Bit Single-Core
2510 Points (49%)
Geekbench 3 - Geekbench 3 64 Bit Multi-Core
5481 Points (9%)
Geekbench 3 - Geekbench 3 64 Bit Single-Core
2625 Points (39%)
Geekbench 2 - 32 Bit - Geekbench Stream
7986 Points (64%)
Geekbench 2 - 32 Bit - Geekbench Memory
6662 Points (60%)
Geekbench 2 - 32 Bit - Geekbench Floating Point
5132 Points (10%)
Geekbench 2 - 32 Bit - Geekbench Integer
5122 Points (10%)
Geekbench 2 - 32 Bit - Geekbench Total Score
5719 Points (15%)
Mozilla Kraken 1.1 - Kraken 1.1 Total Score *
519 ms (1%)
min: 1652     avg: 1697     median: 1696.5 (2%)     max: 1741 ms
Sunspider - Sunspider 1.0 Total Score *
119.1 ms (1%)
Octane V2 - Octane V2 Total Score
21322 Points (19%)
WebXPRT 4 - WebXPRT 4 Score
254 Points (73%)
82.2 Points (24%)
WebXPRT 3 - WebXPRT 3 Score
266 Points (55%)
110.2 Points (23%)
CrossMark - CrossMark Overall
1549 Points (59%)
Power Consumption - Prime95 Power Consumption - external Monitor *
98.7 Watt (17%)
Power Consumption - Cinebench R15 Multi Power Consumption - external Monitor *
121 Watt (22%)
Power Consumption - Idle Power Consumption - external Monitor *
7.9 Watt (5%)
Power Consumption - Cinebench R15 Multi Power Efficiency - external Monitor
19.9 Points per Watt (15%)

Average Benchmarks Intel Core i7-7700T → 100% n=21

Average Benchmarks Intel Core i5-13500 → 233% n=21

Average Benchmarks Intel Pentium Gold 4415U → 46% n=21

- Bereich der Benchmarkergebnisse für diese Grafikkarte
- Durchschnittliche Benchmarkergebnisse für diese Grafikkarte
* Smaller numbers mean a higher performance
1 This benchmark is not used for the average calculation

v1.28
log 05. 17:29:29

#0 ran 0s before starting gpusingle class +0s ... 0s

#1 checking url part for id 12579 +0s ... 0s

#2 checking url part for id 17901 +0s ... 0s

#3 checking url part for id 9292 +0s ... 0s

#4 redirected to Ajax server, took 1728142169s time from redirect:0 +0s ... 0s

#5 did not recreate cache, as it is less than 5 days old! Created at Fri, 04 Oct 2024 05:16:25 +0200 +0s ... 0s

#6 composed specs +0.004s ... 0.004s

#7 did output specs +0s ... 0.004s

#8 getting avg benchmarks for device 12579 +0s ... 0.005s

#9 got single benchmarks 12579 +0s ... 0.005s

#10 getting avg benchmarks for device 17901 +0.001s ... 0.006s

#11 got single benchmarks 17901 +0s ... 0.007s

#12 getting avg benchmarks for device 9292 +0.004s ... 0.011s

#13 got single benchmarks 9292 +0.008s ... 0.018s

#14 got avg benchmarks for devices +0s ... 0.018s

#15 min, max, avg, median took s +0.042s ... 0.061s

#16 return log +0s ... 0.061s

Teilen Sie diesen Artikel, um uns zu unterstützen. Jeder Link hilft!
> Notebook Test, Laptop Test und News > Benchmarks / Technik > Benchmarks / Technik > Prozessor Vergleich - Head 2 Head
Autor: Klaus Hinum,  8.09.2017 (Update:  1.07.2023)