Notebookcheck Logo

Intel Core i5-7600K vs Intel Core i5-13500 vs Intel Core i7-7700T

Intel Core i5-7600K

► remove from comparison Intel i5-7600K

Der Intel Core i5-7600K ist ein High-End Quad-Core Desktop-Prozessor auf Basis der Kaby-Lake-Architektur, der im August 2015 vorgestellt wurde. Die in einem verbesserten 14-Nanometer-Prozess gefertigte CPU taktet mit 3,8 bis 4,2 GHz, bietet jedoch kein Hyper-Threading (daher nur 4 Threads). Als sogenanntes "K"-Modell verfügt der Core i7-7700K über einen freien Multiplikator und lässt sich so besonders einfach übertakten.

Performance

Durch die relativ hohe Taktrate positioniert sich der i5-7600K etwa 10% vor dem direkten Vorgänger, dem Core i5-6600K und etwas hinter dem älteren Spitzenmodell i7-4790K. Die Leistung pro Takt ist identisch zu den Skylake Modellen. Auch anspruchsvollste Programme und Spiele werden von der High-End-CPU problemlos bewältigt. 

Mehr Benchmarks finden Sie auch in unserem Vergleich der AMD Ryzen 7 CPUs gegen Intel CPUs.

Grafikeinheit

Für Grafikberechnungen zeigt sich die im Prozessor integrierte Intel HD Graphics 630 mit 24 EUs (Execution Units) verantwortlich, die mit 350 - 1150 MHz taktet. Die Leistung ist vergleichbar mit der alten Intel HD Graphics 530 und siedelt sich daher im absoluten Low-End-Bereich an, sodass aktuelle Spiele allenfalls in niedrigen Einstellungen flüssig dargestellt werden.

Leistungsaufnahme

Der TDP ist wie beim Spitzenmodell i7-7700K mit 91 Watt festgelegt.

Intel Core i5-13500

► remove from comparison

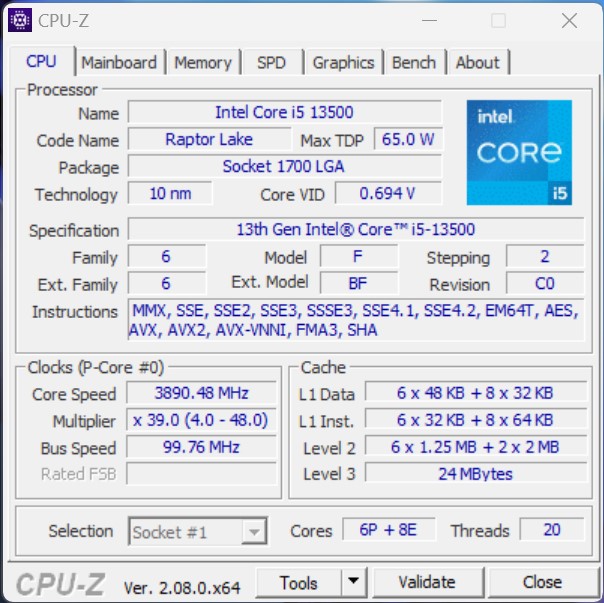
Der Intel Core i5-13500 ist ein schneller und sparsamer Desktop-Prozessor auf Basis der Raptor-Lake-Architektur, die bereits im Oktober 2022 vorgestellt wurde. Der Prozessor bietet einen Basistakt von 2,5 GHz und erreicht bis zu 4,8 GHz im Turbo. Die mit Alder-Lake eingeführte hybride CPU-Architektur kommt auch bei den Raptor-Lake-Prozessoren zum Einsatz. Im Vergleich zum Intel Core i5-12500 bietet der Intel Core i5-13500 mehr Kerne, womit eine höhere Gesamtleistung erzielt werden kann. In Summe kann der Intel Core i5-13500 bis zu 20 Threads parallel verarbeiten. Die Performance-Kerne (P-Cores) bieten hierzu Hyperthreading, was den energieeffizienten Kernen (E-Cores) vorenthalten wird.

Performance

Aufgrund der höheren Anzahl an physikalischen Recheneinheiten bietet der Intel Core i5-13500 gegenüber dem Intel Core i5-12500 spürbar mehr Leistung. Beide Prozessoren verfügen über 6 P-Kerne, wenngleich nur der Intel Core i5-13500 zusätzlich mit 8 E-Kernen bestückt ist.

Grafikeinheit

Wie auch der Intel Core i5-12600K bietet der Intel Core i5-13500 eine integrierte Grafikeinheit. Als Basis dient weiterhin die Intel Iris Xe-Architektur. Rein leistungstechnisch hat sich bei der neuen Intel UHD Graphics 770 aber nicht viel verändert. 

Leistungsaufnahme

Die TDP des Intel Core i5-13500 beläuft sich auf 65 Watt, mit der Option, diese im Turbo auf bis zu 154 Watt zu erhöhen. Gegenüber dem Intel Core i5-12500 steigt der Energiebedarf etwas an.

Intel Core i7-7700T

► remove from comparison Intel i7-7700T

Der Intel Core i7-7700T ist ein High-End Quad-Core Desktop-Prozessor auf Basis der Kaby-Lake-Architektur, der Anfang 2017 vorgestellt wurde. Im Vergleich zu dem deutlich schnelleren Core i7-7700K ist der Core i7-7700T geringer getaktet aber auch deutlich sparsamer mit einem TDP von 35 Watt.

Performance

Die Performance des Intel Core i7-7700T liegt knapp oberhalb eines Core i5-7600K durch die geringere Taktung. Zur Zeit der Erscheinung ist er der schnellste 35-Watt-Desktop-Prozessor der Kaby-Lake-Serie von Intel. Auch anspruchsvollste Programme und Spiele werden von der High-End-CPU problemlos bewältigt. 

Grafikeinheit

Für Grafikberechnungen zeigt sich die im Prozessor integrierte Intel HD Graphics 630 mit 24 EUs (Execution Units) verantwortlich, die mit 350 - 1150 MHz taktet. Die Leistung ist vergleichbar mit der alten Intel HD Graphics 530 und siedelt sich daher im absoluten Low-End-Bereich an, sodass aktuelle Spiele allenfalls in niedrigen Einstellungen flüssig dargestellt werden.

ModelIntel Core i5-7600KIntel Core i5-13500Intel Core i7-7700T
SeriesIntel Kaby Lake Raptor Lake-SIntel Kaby Lake
CodenameKaby LakeRaptor LakeKaby Lake
Serie: Kaby Lake Kaby Lake
Intel Core i7-7700K4.2 - 4.5 GHz4 / 8 cores8 MB L3
Intel Core i7-77003.6 - 4.2 GHz4 / 8 cores8 MB L3
Intel Xeon E3-1535M v63.1 - 4.2 GHz4 / 8 cores8 MB L3
Intel Core i7-7920HQ3.1 - 4.1 GHz4 / 8 cores8 MB L3
Intel Core i7-7700T2.9 - 3.8 GHz4 / 8 cores8 MB L3
Intel Core i5-7600K « 3.8 - 4.2 GHz4 / 4 cores8 MB L3
Intel Xeon E3-1505M v63 - 4 GHz4 / 8 cores8 MB L3
Intel Core i7-7820HQ2.9 - 3.9 GHz4 / 8 cores8 MB L3
Intel Core i7-7820HK2.9 - 3.9 GHz4 / 8 cores8 MB L3
Intel Core i7-7700HQ2.8 - 3.8 GHz4 / 8 cores6 MB L3
Intel Core i5-75003.4 - 3.8 GHz4 / 4 cores6 MB L3
Intel Core i5-7440HQ2.8 - 3.8 GHz4 / 4 cores6 MB L3
Intel Core i7-7567U3.5 - 4 GHz2 / 4 cores4 MB L3
Intel Core i7-7660U2.5 - 4 GHz2 / 4 cores4 MB L3
Intel Core i7-7600U2.8 - 3.9 GHz2 / 4 cores4 MB L3
Intel Core i5-7300HQ2.5 - 3.5 GHz4 / 4 cores6 MB L3
Intel Core i5-7500T2.7 - 3.3 GHz4 / 4 cores6 MB L3
Intel Core i5-7287U3.3 - 3.7 GHz2 / 4 cores4 MB L3
Intel Core i7-7560U2.4 - 3.8 GHz2 / 4 cores4 MB L3
Intel Core i5-7267U3.1 - 3.5 GHz2 / 4 cores4 MB L3
Intel Core i5-7360U2.3 - 3.6 GHz2 / 4 cores4 MB L3
Intel Core i7-7500U2.7 - 3.5 GHz2 / 4 cores4 MB L3
Intel Core i5-7300U2.6 - 3.5 GHz2 / 4 cores3 MB L3
Intel Core i5-7260U2.2 - 3.4 GHz2 / 4 cores4 MB L3
Intel Core i5-7200U2.5 - 3.1 GHz2 / 4 cores3 MB L3
Intel Core i3-7100H3 GHz2 / 4 cores3 MB L3
Intel Core i3-7167U2.8 GHz2 / 4 cores3 MB L3
Intel Core i7-7Y751.3 - 3.6 GHz2 / 4 cores4 MB L3
Intel Core i5-7Y571.2 - 3.3 GHz2 / 4 cores4 MB L3
Intel Core i5-7Y541.2 - 3.2 GHz2 / 4 cores4 MB L3
Intel Core i3-7100U2.4 GHz2 / 4 cores3 MB L3
Intel Core m3-7Y321 - 3 GHz2 / 4 cores4 MB L3
Intel Pentium Gold 4415U2.3 GHz2 / 4 cores2 MB L3
Intel Core m3-7Y301 - 2.6 GHz2 / 4 cores4 MB L3
Intel Celeron 3965U2.2 GHz2 / 2 cores2 MB L3
Intel Core i3-7020U2.3 GHz2 / 4 cores3 MB L3
Intel Celeron 3867U1.8 GHz2 / 2 cores2 MB L3
Intel Celeron 3865U1.8 GHz2 / 2 cores2 MB L3
Intel Pentium Gold 4425Y1.7 GHz2 / 4 cores2 MB L3
Intel Pentium Gold 4415Y1.6 GHz2 / 4 cores2 MB L3
Intel Pentium Gold 4410Y1.5 GHz2 / 4 cores2 MB L3
Intel Celeron 3965Y1.5 GHz2 / 2 cores2 MB L3
Intel Core i9-13900K3 - 5.8 GHz24 / 32 cores36 MB L3
Intel Core i7-13700K3.4 - 5.4 GHz16 / 24 cores30 MB L3
Intel Core i5-13600K3.5 - 5.1 GHz14 / 20 cores24 MB L3
Intel Core i5-13500 « 2.5 - 4.8 GHz14 / 20 cores24 MB L3
Intel Core i5-13500T2.5 - 4.6 GHz14 / 20 cores24 MB L3
Intel Core i7-7700K4.2 - 4.5 GHz4 / 8 cores8 MB L3
Intel Core i7-77003.6 - 4.2 GHz4 / 8 cores8 MB L3
Intel Xeon E3-1535M v63.1 - 4.2 GHz4 / 8 cores8 MB L3
Intel Core i7-7920HQ3.1 - 4.1 GHz4 / 8 cores8 MB L3
Intel Core i7-7700T « 2.9 - 3.8 GHz4 / 8 cores8 MB L3
Intel Core i5-7600K3.8 - 4.2 GHz4 / 4 cores8 MB L3
Intel Xeon E3-1505M v63 - 4 GHz4 / 8 cores8 MB L3
Intel Core i7-7820HQ2.9 - 3.9 GHz4 / 8 cores8 MB L3
Intel Core i7-7820HK2.9 - 3.9 GHz4 / 8 cores8 MB L3
Intel Core i7-7700HQ2.8 - 3.8 GHz4 / 8 cores6 MB L3
Intel Core i5-75003.4 - 3.8 GHz4 / 4 cores6 MB L3
Intel Core i5-7440HQ2.8 - 3.8 GHz4 / 4 cores6 MB L3
Intel Core i7-7567U3.5 - 4 GHz2 / 4 cores4 MB L3
Intel Core i7-7660U2.5 - 4 GHz2 / 4 cores4 MB L3
Intel Core i7-7600U2.8 - 3.9 GHz2 / 4 cores4 MB L3
Intel Core i5-7300HQ2.5 - 3.5 GHz4 / 4 cores6 MB L3
Intel Core i5-7500T2.7 - 3.3 GHz4 / 4 cores6 MB L3
Intel Core i5-7287U3.3 - 3.7 GHz2 / 4 cores4 MB L3
Intel Core i7-7560U2.4 - 3.8 GHz2 / 4 cores4 MB L3
Intel Core i5-7267U3.1 - 3.5 GHz2 / 4 cores4 MB L3
Intel Core i5-7360U2.3 - 3.6 GHz2 / 4 cores4 MB L3
Intel Core i7-7500U2.7 - 3.5 GHz2 / 4 cores4 MB L3
Intel Core i5-7300U2.6 - 3.5 GHz2 / 4 cores3 MB L3
Intel Core i5-7260U2.2 - 3.4 GHz2 / 4 cores4 MB L3
Intel Core i5-7200U2.5 - 3.1 GHz2 / 4 cores3 MB L3
Intel Core i3-7100H3 GHz2 / 4 cores3 MB L3
Intel Core i3-7167U2.8 GHz2 / 4 cores3 MB L3
Intel Core i7-7Y751.3 - 3.6 GHz2 / 4 cores4 MB L3
Intel Core i5-7Y571.2 - 3.3 GHz2 / 4 cores4 MB L3
Intel Core i5-7Y541.2 - 3.2 GHz2 / 4 cores4 MB L3
Intel Core i3-7100U2.4 GHz2 / 4 cores3 MB L3
Intel Core m3-7Y321 - 3 GHz2 / 4 cores4 MB L3
Intel Pentium Gold 4415U2.3 GHz2 / 4 cores2 MB L3
Intel Core m3-7Y301 - 2.6 GHz2 / 4 cores4 MB L3
Intel Celeron 3965U2.2 GHz2 / 2 cores2 MB L3
Intel Core i3-7020U2.3 GHz2 / 4 cores3 MB L3
Intel Celeron 3867U1.8 GHz2 / 2 cores2 MB L3
Intel Celeron 3865U1.8 GHz2 / 2 cores2 MB L3
Intel Pentium Gold 4425Y1.7 GHz2 / 4 cores2 MB L3
Intel Pentium Gold 4415Y1.6 GHz2 / 4 cores2 MB L3
Intel Pentium Gold 4410Y1.5 GHz2 / 4 cores2 MB L3
Intel Celeron 3965Y1.5 GHz2 / 2 cores2 MB L3
Clock3800 - 4200 MHz2500 - 4800 MHz2900 - 3800 MHz
L1 Cache256 KB256 KB
L2 Cache1 MB11.5 MB1 MB
L3 Cache8 MB24 MB8 MB
Cores / Threads4 / 414 / 20
6 x 4.8 GHz Intel Raptor Cove P-Core
8 x 3.5 GHz Intel Gracemont E-Core
4 / 8
TDP91 Watt65 Watt35 Watt
Technology14 nm10 nm14 nm
SocketFCLGA1151LGA 1700FCLGA1151
FeaturesDDR3(L)-1600/DDR4-2400 Memory Controller, AVX, AVX2, AES-NI, TSX-NI, Quick Sync, Virtualization, vProIntel UHD Graphics 770, DDR5 4800 MT/s, DDR4 3200 MT/sDDR3(L)-1600/DDR4-2400 Memory Controller, AVX, AVX2, AES-NI, TSX-NI, Quick Sync, Virtualization, vPro
iGPUIntel HD Graphics 630 (350 - 1150 MHz)Intel UHD Graphics 770 (300 - 1550 MHz)Intel HD Graphics 630 (350 - 1150 MHz)
Architecturex86x86x86
$242 U.S.$303 U.S.
Announced
Manufacturerark.intel.comwww.intel.deark.intel.com
TDP Turbo PL2154 Watt
Die Size215 mm2
max. Temp.100 °C

Benchmarks

Performance Rating - CB R15 + R20 + 7-Zip + X265 + Blender + 3DM11 CPU - i5-13500
42.6 pt (59%)
Cinebench 2024 - Cinebench 2024 CPU Single Core
107 Points (74%)
Cinebench 2024 - Cinebench 2024 CPU Multi Core
822 Points (15%)
Cinebench R23 - Cinebench R23 Multi Core
14573 Points (14%)
Cinebench R23 - Cinebench R23 Single Core
1780 Points (76%)
Cinebench R20 - Cinebench R20 CPU (Single Core)
685 Points (76%)
Cinebench R20 - Cinebench R20 CPU (Multi Core)
5633 Points (14%)
Cinebench R15 - Cinebench R15 CPU Multi 64 Bit
min: 660     avg: 674     median: 674 (4%)     max: 688 Points
2405 Points (15%)
714 Points (5%)
Cinebench R15 - Cinebench R15 CPU Single 64 Bit
min: 168     avg: 179.5     median: 179.5 (54%)     max: 191 Points
256 Points (77%)
155 Points (47%)
Cinebench R11.5 - Cinebench R11.5 CPU Multi 64 Bit
min: 7.67     avg: 7.9     median: 7.9 (10%)     max: 8.07 Points
28.4 Points (37%)
7.6 Points (10%)
Cinebench R11.5 - Cinebench R11.5 CPU Single 64 Bit
min: 1.98     avg: 2     median: 2 (50%)     max: 2.05 Points
3.1 Points (77%)
1.8 Points (44%)
Cinebench R10 - Cinebench R10 Rend. Single (32bit)
min: 6730     avg: 6814     median: 6814 (41%)     max: 6898 Points
8875 Points (54%)
6824 Points (41%)
Cinebench R10 - Cinebench R10 Rend. Multi (32bit)
min: 23585     avg: 24179     median: 24179 (18%)     max: 24773 Points
49300 Points (36%)
21587 Points (16%)
Cinebench R10 - Cinebench R10 Rend. Multi (64bit)
79625 Points (55%)
Cinebench R10 - Cinebench R10 Rend. Single (64bit)
14282 Points (17%)
wPrime 2.10 - wPrime 2.0 1024m *
min: 253.6     avg: 256.6     median: 256.6 (3%)     max: 259.5 s
100.7 s (1%)
234.2 s (3%)
wPrime 2.10 - wPrime 2.0 32m *
min: 8.3     avg: 8.5     median: 8.5 (2%)     max: 8.672 s
4 s (1%)
6.9 s (1%)
WinRAR - WinRAR 4.0
3570 Points (6%)
7704 Points (12%)
4268 Points (7%)
7-Zip 18.03 - 7-Zip 18.03 Multli Thread 4 runs
55528 MIPS (32%)
7-Zip 18.03 - 7-Zip 18.03 Single Thread 4 runs
5887 MIPS (70%)
X264 HD Benchmark 4.0 - x264 Pass 2
46.2 fps (16%)
134.6 fps (47%)
42.7 fps (15%)
X264 HD Benchmark 4.0 - x264 Pass 1
223 fps (51%)
306 fps (71%)
173.2 fps (40%)
HWBOT x265 Benchmark v2.2 - HWBOT x265 4k Preset
16.3 fps (29%)
TrueCrypt - TrueCrypt Serpent
min: 0.303     avg: 0.3     median: 0.3 (0%)     max: 0.367 GB/s
1.3 GB/s (0%)
0.4 GB/s (0%)
TrueCrypt - TrueCrypt Twofish
min: 0.534     avg: 0.6     median: 0.6 (10%)     max: 0.611 GB/s
2.3 GB/s (40%)
0.7 GB/s (11%)
TrueCrypt - TrueCrypt AES
min: 2.9     avg: 3.3     median: 3.3 (9%)     max: 3.7 GB/s
12 GB/s (31%)
4.4 GB/s (11%)
Blender - Blender 3.3 Classroom CPU *
399 Seconds (5%)
Blender - Blender 2.79 BMW27 CPU *
223 Seconds (2%)
626 Seconds (4%)
R Benchmark 2.5 - R Benchmark 2.5 *
0.4 sec (10%)
3DMark 06 - CPU - 3DMark 06 - CPU
8532 Points (18%)
14875 Points (32%)
8273 Points (18%)
Super Pi mod 1.5 XS 1M - Super Pi mod 1.5 XS 1M *
min: 8.74     avg: 8.8     median: 8.8 (2%)     max: 8.891 s
7.8 s (2%)
14.5 s (3%)
Super Pi mod 1.5 XS 2M - Super Pi mod 1.5 XS 2M *
min: 19.9     avg: 20.1     median: 20.1 (1%)     max: 20.22 s
17.2 s (1%)
28.7 s (1%)
Super Pi Mod 1.5 XS 32M - Super Pi mod 1.5 XS 32M *
min: 465     avg: 466.3     median: 466.3 (2%)     max: 467.5 s
661 s (3%)
3DMark Vantage - 3DM Vant. Perf. CPU no Physx
69725 Points (61%)
3DMark 11 - 3DM11 Performance Physics
8381 Points (23%)
18026 Points (49%)
8078 Points (22%)
3DMark - 3DMark Ice Storm Physics
65821 Points (53%)
84456 Points (69%)
3DMark - 3DMark Ice Storm Extreme Physics
66315 Points (54%)
83392 Points (68%)
3DMark - 3DMark Ice Storm Unlimited Physics
69090 Points (58%)
81778 Points (69%)
3DMark - 3DMark Cloud Gate Physics
5972 Points (15%)
17891 Points (45%)
3DMark - 3DMark Fire Strike Standard Physics
min: 8839     avg: 9066     median: 9065.5 (16%)     max: 9292 Points
26263 Points (47%)
3DMark - 3DMark Time Spy CPU
4152 Points (18%)
9655 Points (41%)
Geekbench 6.2 - Geekbench 6.2 Single-Core
2483 Points (67%)
Geekbench 6.2 - Geekbench 6.2 Multi-Core
10348 Points (41%)
Geekbench 5.5 - Geekbench 5.1 - 5.4 64 Bit Single-Core
1805 Points (76%)
Geekbench 5.5 - Geekbench 5.1 - 5.4 64 Bit Multi-Core
10322 Points (18%)
Geekbench 5.0 - Geekbench 5.0 64 Bit Single-Core
1749 Points (8%)
Geekbench 5.0 - Geekbench 5.0 64 Bit Multi-Core
10213 Points (32%)
Geekbench 4.4 - Geekbench 4.1 - 4.4 64 Bit Single-Core
7379 Points (74%)
4342 Points (43%)
Geekbench 4.4 - Geekbench 4.1 - 4.4 64 Bit Multi-Core
39094 Points (43%)
13974 Points (15%)
Geekbench 4.0 - Geekbench 4.0 64 Bit Single-Core
5225 Points (71%)
Geekbench 4.0 - Geekbench 4.0 64 Bit Multi-Core
15030 Points (37%)
Geekbench 3 - Geekbench 3 64 Bit Multi-Core
14426 Points (23%)
Geekbench 3 - Geekbench 3 64 Bit Single-Core
4455 Points (67%)
Mozilla Kraken 1.1 - Kraken 1.1 Total Score *
818 ms (1%)
519 ms (1%)
Sunspider - Sunspider 1.0 Total Score *
56.9 ms (1%)
WebXPRT 4 - WebXPRT 4 Score
254 Points (73%)
WebXPRT 3 - WebXPRT 3 Score
266 Points (55%)
CrossMark - CrossMark Overall
1549 Points (59%)
Power Consumption - Prime95 Power Consumption - external Monitor *
124 Watt (21%)
98.7 Watt (17%)
Power Consumption - Cinebench R15 Multi Power Consumption - external Monitor *
98 Watt (18%)
121 Watt (22%)
Power Consumption - Idle Power Consumption - external Monitor *
7.9 Watt (5%)
Power Consumption - Cinebench R15 Multi Power Efficiency - external Monitor
7 Points per Watt (5%)
19.9 Points per Watt (15%)

Average Benchmarks Intel Core i5-7600K → 100% n=18

Average Benchmarks Intel Core i5-13500 → 219% n=18

Average Benchmarks Intel Core i7-7700T → 101% n=18

- Bereich der Benchmarkergebnisse für diese Grafikkarte
- Durchschnittliche Benchmarkergebnisse für diese Grafikkarte
* Smaller numbers mean a higher performance
1 This benchmark is not used for the average calculation

v1.28
log 07. 00:04:33

#0 checking url part for id 8528 +0s ... 0s

#1 checking url part for id 17901 +0s ... 0s

#2 checking url part for id 12579 +0s ... 0s

#3 redirected to Ajax server, took 1720303473 +0s ... 0s

#4 did not recreate cache, as it is less than 5 days old! Created at Thu, 04 Jul 2024 05:15:21 +0200 +0s ... 0s

#5 composed specs +0.005s ... 0.005s

#6 did output specs +0s ... 0.005s

#7 getting avg benchmarks for device 8528 +0.001s ... 0.006s

#8 got single benchmarks 8528 +0.004s ... 0.01s

#9 getting avg benchmarks for device 17901 +0.004s ... 0.014s

#10 got single benchmarks 17901 +0.004s ... 0.018s

#11 getting avg benchmarks for device 12579 +0.001s ... 0.019s

#12 got single benchmarks 12579 +0.003s ... 0.022s

#13 got avg benchmarks for devices +0s ... 0.022s

#14 min, max, avg, median took s +0.048s ... 0.07s

#15 return log +0s ... 0.07s

Teilen Sie diesen Artikel, um uns zu unterstützen. Jeder Link hilft!
> Notebook Test, Laptop Test und News > Benchmarks / Technik > Benchmarks / Technik > Prozessor Vergleich - Head 2 Head
Autor: Klaus Hinum,  8.09.2017 (Update:  1.07.2023)