Intel Core i3-1210U vs Intel Core i7-2600K
Intel Core i3-1210U
► remove from comparison
Der Intel Core i3-1210U ist eine sparsame Notebook-CPU auf Basis der neuen Alder-Lake-Architektur, die im Januar 2022 vorgestellt wurde. Die CPU basiert auf den Alder Lake-M Chip (für die 9W U-Serie) und bietet 2 Performance Kerne (P-Kerne, Golden Cove Architektur) und 4 Effizienzkerne (E-Kerne, Gracemont Architektur). Die P-Kerne unterstützten Hyperthreading (daher gemeinsam 12 Threads) und takten von 1 bis 4,4 GHz. Die E-Kerne takten von 0,7 - 3,3 GHz und sollen eine vergleichbare Performance wie alte Skylake Kerne bieten (z.B. i7-6300HQ).
Performance
Durch die 6 Kerne und die neue Architektur sollte die Leistung in allen Bereichen deutlich oberhalb der alten 7-Watt 4-Kerner der Comet-Lake-Y Serie liegen (wie z.B. dem i5-10310Y). Im Vergleich zum ähnlich benannten i3-1215U sollte jedoch der verringerte TDP deutlich limitieren.
Grafikeinheit
Wie auch der Vorgänger, integriert Intel in Alder Lake eine Intel Xe basierende Grafikeinheit. Beim 1210U sind 64 der 96 EUs aktiviert und takten mit bis zu 0,85 GHz.
Features
Wie auch Tiger Lake, hat auch Alder-Lake-P WiFi 6E und Thunderbolt 4 (4x) teilintegriert. Der integrierte Speicherkontroller unterstützt DDR5-4800, DDR4-3200, LPDDR5-5200 und LPDDR4x-4267. Der integrierte Gaussian and Neural Accelerator (GNA) ist nun in Version 3.0 verbaut. Die Media Engine Quick Sync 8 ist die selbe wie in Rocket Lake und unterstützt MPEG-2, AVC, VC-1 Decode, JPEG, VP8 Decode, VP9, HEVC und AV1 Decode. Der Chip unterstützt nur PCIe 4.0 (x8 for GPU und zwei x4 für SSDs).
Leistungsaufnahme
Der Intel Core i3-1210U ist mit 9 Watt (PL1) TDP und 29 Watt (PL2) max. Turbo Power angegeben. Gefertigt wird der Prozessor im modernen Intel 7 Prozess (10 nm).
Intel Core i7-2600K
► remove from comparison
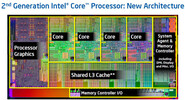
Der Intel Core i7-2600K ist ein High-End Quad-Core Desktop Prozessor der Sandy Bridge Reihe. Er wurde anfang 2011 vorgestellt und war bis zur Ablösung durch den i7-2700K der schnellste Sandy Bridge Prozessor. Trotzdem bietet er nicht alle Features der Sandy Bridge Architektur. vPro, VT-d und Trusted-Execution fehlen auf der Feature Liste.
Die vier Prozessorkerne können gleichzeitig 8 Threads bearbeiten (dank Hyperthreading) und takten mit mindestens 3,4 unter Last. Dank Turbo Boost kann er sich bei ausreichender Kühlung bis auf 3,8 GHz übertakten:
- 3,8 GHz - 1 Kern belastet
- 3,7 GHz - 2 Kerne belastet
- 3,6 GHz - 3 Kerne belastet
- 3,5 GHz - 4 Kerne belastet
Als "K" Modell bietet der i7-2600K einen offenen Multiplikator und lässt sich dadurch einfach übertakten.
Die integrierte Intel HD Graphics 3000 Grafikkarte taktet mit 850 - 1350 MHz (ebenfalls dank Turbo Boost). Der integrierte Speicherkontroller erlaubt den Einsatz von bis zu 32 GB DDR3-1333 (Dual Channel).
| Model | Intel Core i3-1210U | Intel Core i7-2600K | ||||||||||||||||||||||||||||||||||||||||||||||||||||||||||||||||
| Codename | Alder Lake-U | Sandy Bridge | ||||||||||||||||||||||||||||||||||||||||||||||||||||||||||||||||
| Series | Intel Alder Lake-M | Intel Core i7 (Desktop) | ||||||||||||||||||||||||||||||||||||||||||||||||||||||||||||||||
| Serie: Core i7 (Desktop) Sandy Bridge |
|
| ||||||||||||||||||||||||||||||||||||||||||||||||||||||||||||||||
| Clock | 700 - 4400 MHz | 3400 - 3800 MHz | ||||||||||||||||||||||||||||||||||||||||||||||||||||||||||||||||
| L1 Cache | 544 KB | |||||||||||||||||||||||||||||||||||||||||||||||||||||||||||||||||
| L2 Cache | 5 MB | 1 MB | ||||||||||||||||||||||||||||||||||||||||||||||||||||||||||||||||
| L3 Cache | 10 MB | 8 MB | ||||||||||||||||||||||||||||||||||||||||||||||||||||||||||||||||
| Cores / Threads | 6 / 8 | 4 / 8 | ||||||||||||||||||||||||||||||||||||||||||||||||||||||||||||||||
| TDP | 9 Watt | 95 Watt | ||||||||||||||||||||||||||||||||||||||||||||||||||||||||||||||||
| Technology | 10 nm | 32 nm | ||||||||||||||||||||||||||||||||||||||||||||||||||||||||||||||||
| max. Temp. | 100 °C | 72.6 °C | ||||||||||||||||||||||||||||||||||||||||||||||||||||||||||||||||
| Socket | BGA1744 | LGA1155 | ||||||||||||||||||||||||||||||||||||||||||||||||||||||||||||||||
| Features | LPDDR4x-4266/LPDDR5-5200 RAM, PCIe 4, Thr. Director, DL Boost, GNA, MMX, SSE, SSE2, SSE3, SSSE3, SSE4.1, SSE4.2, AES, AVX, AVX2, FMA3, SHA | SSE4.1, SSE4.2, AVX, Turbo Boost (3.80GHz), Hyper-Threading, VT-x, AES-NI, Intel 64, Idle States, EIST, Thermal Monitoring Technologies, Intel Fast Memory Access, Intel Flex Memory Access, XD bit, open Multiplicator | ||||||||||||||||||||||||||||||||||||||||||||||||||||||||||||||||
| iGPU | Intel UHD Graphics 64EUs (Alder Lake 12th Gen) ( - 850 MHz) | Intel HD Graphics 3000 (850 - 1350 MHz) | ||||||||||||||||||||||||||||||||||||||||||||||||||||||||||||||||
| Architecture | x86 | x86 | ||||||||||||||||||||||||||||||||||||||||||||||||||||||||||||||||
| Announced | ||||||||||||||||||||||||||||||||||||||||||||||||||||||||||||||||||
| Manufacturer | ark.intel.com | ark.intel.com | ||||||||||||||||||||||||||||||||||||||||||||||||||||||||||||||||
| Transistors | 995 Million | |||||||||||||||||||||||||||||||||||||||||||||||||||||||||||||||||
| Die Size | 216 mm2 | |||||||||||||||||||||||||||||||||||||||||||||||||||||||||||||||||
| $317 U.S. |
Benchmarks
Average Benchmarks Intel Core i7-2600K → 0% n=0
* Smaller numbers mean a higher performance
1 This benchmark is not used for the average calculation


