Notebookcheck Logo

Intel Core i3-10320 vs Intel Core i5-9300H

Intel Core i3-10320

► remove from comparison Intel i3-10320
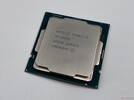
Der Intel Core i3-10320 ist ein Einstiegs-Desktop-Prozessor der Comet Lake-S Serie und wurde im 2. Quartal 2020 vorgestellt. Er bietet vier Kerne und acht Threads mit 3,8 - 4,6 GHz Taklung. Gefertigt wird der Intel Core i3-10320 weiterhin im 14-nm-Prozess.

Performance

In vielen Bereichen kann der kleine i3 mit dem alten Spitzenmodell, dem Core i7-7700K mithalten. Dieser bietet zwar einen etwas geringeren Maximaltakt, aber einen etwas höheren TDP.

Grafikeinheit

Wie schon zuvor bietet auch der Intel Core i5-10600K mit der Intel UHD Graphics 630 eine iGPU, welche sich aber aufgrund der geringen Leistung nicht für aufwendige Spiele eignet. Als Low-End-Lösung können aktuelle Videospiele, wenn überhaupt, lediglich in verminderter Detailstufe flüssig wiedergegeben werden. 

Leistungsaufnahme

Die TDP ist mit 65 Watt (Pl1) spezifiziert und daher für Desktop-CPUs relativ gering. Für 28s kann die CPU auch 90 Watt nutzen (PL2).

Intel Core i5-9300H

► remove from comparison Intel i5-9300H

Der Intel Core i5-9300H ist ein Quad-Core-SoC für Notebooks, der auf der Coffee-Lake-Architektur (Refresh in 2019 CFL-HR) basiert. Er taktet die vier Prozessorkerne mit 2,4 - 4,1 GHz (Ein- und Zweikern Turbo) bzw. maximal 4 GHz wenn alle Kerne ausgelastet sind. Die integrierte Grafikkarte hört auf den Namen UHD Graphics 630 und entspricht der alten HD Graphics 630. Die Leistungsaufnahme ist mit 45 Watt TDP spezifiziert und kann wahrscheinlich vom Notebookhersteller auf 35 Watt heruntergesetzt werden (configurable TDP = cTDP Down). Im Vergleich zum Vorgänger dem Core i5-8300H wurde nur der Takt um 100 MHz (GPU +50 MHz) erhöht, sonst gibt es keine Unterschiede.

Die einzelnen Kerne haben sich bei Coffee Lake im Vergleich zu Kaby Lake nicht verändert. Die Leistung pro Takt bleibt also gleich und Coffee Lake kann nur durch die leicht verbesserte Fertigung (14nm++) und die zusätzlichen Kerne punkten. Auch die Grafikkarte wurde nicht verbessert, sondern lediglich teilweise höher getaktet.

Mit einem spezifizierten TDP von 45 Watt eignet sich der i5-9300H am besten für große und schwere Notebooks, per "configurable TDP-down" kann die CPU auch mit 35 Watt betrieben werden, bei geringerer Leistung (Turbo wird nicht so lange gehalten).

ModelIntel Core i3-10320Intel Core i5-9300H
CodenameComet Lake-SCoffee Lake-H
SeriesIntel Comet LakeIntel Coffee Lake
Serie: Coffee Lake Coffee Lake-H
Intel Core i9-10850K compare3.6 - 5.2 GHz10 / 20 cores20 MB L3
Intel Core i9-10910 compare3.6 - 5 GHz10 / 20 cores20 MB L3
Intel Core i3-10320 « 3.8 - 4.6 GHz4 / 8 cores7.9 MB L3
Intel Core i3-10100 compare3.6 - 4.3 GHz4 / 8 cores6 MB L3
Intel Core i9-9980HK compare2.4 - 5 GHz8 / 16 cores16 MB L3
Intel Core i9-9880H compare2.3 - 4.8 GHz8 / 16 cores16 MB L3
Intel Core i9-8950HK compare2.9 - 4.8 GHz6 / 12 cores12 MB L3
Intel Xeon E-2186M compare2.9 - 4.8 GHz6 / 12 cores12 MB L3
Intel Xeon E-2276M compare2.8 - 4.7 GHz6 / 12 cores12 MB L3
Intel Core i7-9850H compare2.6 - 4.6 GHz6 / 12 cores12 MB L3
Intel Core i7-9750H compare2.6 - 4.5 GHz6 / 12 cores12 MB L3
Intel Xeon E-2176M compare2.7 - 4.4 GHz6 / 12 cores12 MB L3
Intel Core i7-8850H compare2.6 - 4.3 GHz6 / 12 cores9 MB L3
Intel Core i7-8750H compare2.2 - 4.1 GHz6 / 12 cores9 MB L3
Intel Core i5-9400H compare2.5 - 4.3 GHz4 / 8 cores8 MB L3
Intel Core i5-9300HF compare2.4 - 4.1 GHz4 / 8 cores8 MB L3
Intel Core i5-9300H « 2.4 - 4.1 GHz4 / 8 cores8 MB L3
Intel Core i5-8400H compare2.5 - 4.2 GHz4 / 8 cores8 MB L3
Intel Core i5-8300H compare2.3 - 4 GHz4 / 8 cores8 MB L3
Intel Core i3-8100H compare3 GHz4 / 4 cores8 MB L3
Clock3800 - 4600 MHz2400 - 4100 MHz
L1 Cache256 KB256 KB
L2 Cache1 MB1 MB
L3 Cache7.9 MB8 MB
Cores / Threads4 / 84 / 8
TDP65 Watt45 Watt
Technology14 nm14 nm
max. Temp.100 °C100 °C
SocketLGA 1200FCBGA1440
FeaturesHyperThreading, AVX, AVX2, FMA3, Quick Sync, VirtualizationDual-Channel DDR4 Memory Controller, HyperThreading, AVX, AVX2, Quick Sync, Virtualization, AES-NI
iGPUIntel UHD Graphics 630 (350 - 1150 MHz)Intel UHD Graphics 630 (350 - 1050 MHz)
Architecturex86x86
$162 U.S.$250 U.S.
Announced
Manufacturerark.intel.comark.intel.com

Benchmarks

Performance Rating - CB R15 + R20 + 7-Zip + X265 + Blender + 3DM11 CPU - i3-10320
30 pt (50%)
Performance Rating - CB R15 + R20 + 7-Zip + X265 + Blender + 3DM11 CPU - i5-9300H
28.2 pt (47%)
Cinebench R23 - Cinebench R23 Multi Core
5986 Points (6%)
Cinebench R23 - Cinebench R23 Single Core
1185 Points (50%)
Cinebench R20 - Cinebench R20 CPU (Single Core)
458 Points (51%)
min: 398     avg: 415.2     median: 419 (46%)     max: 427 Points
Cinebench R20 - Cinebench R20 CPU (Multi Core)
2320 Points (6%)
min: 1530     avg: 1727     median: 1737 (4%)     max: 1877 Points
Cinebench R15 - Cinebench R15 CPU Multi 64 Bit
949 Points (6%)
min: 717     avg: 784     median: 790 (5%)     max: 850 Points
Cinebench R15 - Cinebench R15 CPU Single 64 Bit
188 Points (53%)
min: 169     avg: 172.6     median: 172 (48%)     max: 176 Points
Cinebench R11.5 - Cinebench R11.5 CPU Multi 64 Bit
10.5 Points (14%)
Cinebench R11.5 - Cinebench R11.5 CPU Single 64 Bit
2.1 Points (50%)
Cinebench R10 - Cinebench R10 Rend. Single (32bit)
7164 Points (43%)
min: 6421     avg: 6561     median: 6572 (40%)     max: 6677 Points
Cinebench R10 - Cinebench R10 Rend. Multi (32bit)
28383 Points (21%)
min: 21798     avg: 24198     median: 24623 (18%)     max: 25656 Points
WinRAR - WinRAR 4.0
5663 Points (9%)
7-Zip 18.03 - 7-Zip 18.03 Multi Thread 4 runs
25864 MIPS (15%)
min: 20736     avg: 22008     median: 22133 (13%)     max: 23155 MIPS
7-Zip 18.03 - 7-Zip 18.03 Single Thread 4 runs
4899 MIPS (58%)
min: 4542     avg: 4592     median: 4609 (54%)     max: 4626 MIPS
X264 HD Benchmark 4.0 - x264 Pass 2
58.8 fps (20%)
49.4 fps (17%)
X264 HD Benchmark 4.0 - x264 Pass 1
218 fps (50%)
193.7 fps (45%)
HWBOT x265 Benchmark v2.2 - HWBOT x265 4k Preset
8.2 fps (14%)
min: 5.7     avg: 6.1     median: 6 (11%)     max: 6.5 fps
TrueCrypt - TrueCrypt Serpent
0.5 GB/s (16%)
0.5 GB/s (15%)
TrueCrypt - TrueCrypt Twofish
0.9 GB/s (16%)
0.8 GB/s (14%)
TrueCrypt - TrueCrypt AES
5.3 GB/s (14%)
4.7 GB/s (12%)
Blender - Blender 2.79 BMW27 CPU *
469 Seconds (3%)
min: 588     avg: 611     median: 602 (4%)     max: 643 Seconds
R Benchmark 2.5 - R Benchmark 2.5 *
0.6 sec (14%)
3DMark 06 - CPU - 3DMark 06 - CPU
9911 Points (21%)
min: 7787     avg: 8354     median: 8107 (17%)     max: 9169 Points
Super Pi mod 1.5 XS 1M - Super Pi mod 1.5 XS 1M *
9.7 s (2%)
9.1 s (2%)
Super Pi mod 1.5 XS 2M - Super Pi mod 1.5 XS 2M *
20.3 s (1%)
Super Pi Mod 1.5 XS 32M - Super Pi mod 1.5 XS 32M *
516 s (2%)
496 s (2%)
3DMark Vantage - 3DM Vant. Perf. CPU no Physx
26995 Points (21%)
3DMark 11 - 3DM11 Performance Physics
10518 Points (27%)
min: 7499     avg: 8987     median: 9107 (23%)     max: 10557 Points
3DMark - 3DMark Ice Storm Physics
63063 Points (51%)
min: 52412     avg: 55875     median: 56000 (46%)     max: 58466 Points
3DMark - 3DMark Ice Storm Extreme Physics
min: 49250     avg: 54277     median: 54947 (45%)     max: 58074 Points
3DMark - 3DMark Ice Storm Unlimited Physics
min: 58114     avg: 58963     median: 58413 (48%)     max: 61541 Points
3DMark - 3DMark Cloud Gate Physics
9675 Points (24%)
min: 5356     avg: 7678     median: 7828.5 (20%)     max: 8903 Points
3DMark - 3DMark Fire Strike Standard Physics
13564 Points (24%)
min: 9387     avg: 11376     median: 11698 (21%)     max: 12349 Points
3DMark - 3DMark Time Spy CPU
4368 Points (18%)
min: 3165     avg: 4074     median: 4189 (18%)     max: 4861 Points
Geekbench 5.5 - Geekbench 5.1 - 5.5 64 Bit Single-Core
1217 Points (48%)
Geekbench 5.5 - Geekbench 5.1 - 5.5 64 Bit Multi-Core
4846 Points (9%)
Geekbench 5.0 - Geekbench 5.0 64 Bit Single-Core
min: 1095     avg: 1118     median: 1123 (5%)     max: 1137 Points
Geekbench 5.0 - Geekbench 5.0 64 Bit Multi-Core
min: 3697     avg: 4014     median: 4146 (13%)     max: 4200 Points
Geekbench 4.4 - Geekbench 4.1 - 4.4 64 Bit Single-Core
min: 4704     avg: 4898     median: 4901 (49%)     max: 5089 Points
Geekbench 4.4 - Geekbench 4.1 - 4.4 64 Bit Multi-Core
min: 14853     avg: 16246     median: 16541 (16%)     max: 17684 Points
Geekbench 4.0 - Geekbench 4.0 64 Bit Single-Core
5266 Points (72%)
Geekbench 4.0 - Geekbench 4.0 64 Bit Multi-Core
16911 Points (41%)
Geekbench 3 - Geekbench 3 32 Bit Multi-Core
min: 14195     avg: 15338     median: 15527.5 (28%)     max: 16101 Points
Geekbench 3 - Geekbench 3 32 Bit Single-Core
min: 3596     avg: 3854     median: 3854.5 (75%)     max: 4109 Points
Mozilla Kraken 1.1 - Kraken 1.1 Total Score *
784 ms (1%)
min: 1079     avg: 1138     median: 1108.5 (1%)     max: 1349 ms
Sunspider - Sunspider 1.0 Total Score *
160 ms (2%)
86.6 ms (1%)
Octane V2 - Octane V2 Total Score
min: 22225     avg: 32344     median: 33646 (28%)     max: 34957 Points
WebXPRT 3 - WebXPRT 3 Score
224 Points (40%)
222 Points (40%)
CrossMark - CrossMark Overall
1254 Points (47%)
Power Consumption - Prime95 Power Consumption - external Monitor *
115 Watt (20%)
Power Consumption - Cinebench R15 Multi Power Consumption - external Monitor *
96.3 Watt (18%)
Power Consumption - Cinebench R15 Multi Power Efficiency - external Monitor
9.9 Points per Watt (7%)

Average Benchmarks Intel Core i3-10320 → 100% n=26

Average Benchmarks Intel Core i5-9300H → 92% n=26

- Bereich der Benchmarkergebnisse für diese Grafikkarte
red legend - Durchschnittliche Benchmarkergebnisse für diese Grafikkarte
* Smaller numbers mean a higher performance
1 This benchmark is not used for the average calculation

Add one or more devices and compare

In the following list you can select (and also search for) devices that should be added to the comparison. You can select more than one device.

restrict list:
v1.28
log 11. 08:24:13

#0 ran 0s before starting gpusingle class +0s ... 0s

#1 checking url part for id 14009 +0s ... 0s

#2 checking url part for id 11356 +0s ... 0s

#3 redirected to Ajax server, took 1736580252s time from redirect:1 +0s ... 0s

#4 did not recreate cache, as it is less than 5 days old! Created at Fri, 10 Jan 2025 05:19:39 +0100 +0s ... 0s

#5 composed specs +0.005s ... 0.005s

#6 did output specs +0s ... 0.005s

#7 getting avg benchmarks for device 14009 +0.004s ... 0.009s

#8 got single benchmarks 14009 +0.004s ... 0.013s

#9 getting avg benchmarks for device 11356 +0.004s ... 0.017s

#10 got single benchmarks 11356 +0.016s ... 0.033s

#11 got avg benchmarks for devices +0s ... 0.033s

#12 min, max, avg, median took s +0.039s ... 0.072s

#13 return log +0.003s ... 0.074s

Teilen Sie diesen Artikel, um uns zu unterstützen. Jeder Link hilft!
Mail Logo
> Notebook Test, Laptop Test und News > Benchmarks / Technik > Benchmarks / Technik > Prozessor Vergleich - Head 2 Head
Autor: Klaus Hinum,  8.09.2017 (Update:  1.07.2023)