AMD Radeon RX Vega 9 vs Intel HD Graphics 510 vs Intel UHD Graphics 605
AMD Radeon RX Vega 9 ► remove from comparison
Die AMD Radeon RX Vega 9 ist eine integrierte Grafikkarte für Notebooks. Sie befindet sich in den Ryzen 5 APUs (z.B. Ryzen 5 3580U Microsoft Surface Edition), welche gegen Ende 2019 vorgestellt wurden. Die GPU basiert auf die Vega Architektur (5. Generation GCN) und bietet 9 der 11 CUs (= 576 der 704 Shader) mit bis zu 1300 MHz (im Ryzen 5 3580U). Die Leistung ist abhängig vom konfigurierten TDP (12-25 Watt zum Launch), der Taktung im Modell, der Kühlung und vom verbauten Hauptspeicher. Von schnellem Dual-Channel DDR4-2400 Speicher dürfte die Grafikkarte deutlich profitieren (im Gegensatz zu auch möglichen DDR4-2133 Single-Channel).
Die Vega Architektur bietet einige Verbesserungen zur Polaris Generation und unterstützt nun z.B. DirectX 12 Feature Level 12_1. Mehr Informationen dazu finden Sie in unserem Raven Ridge Architekturartikel .
Die Leistung dürfte sich theoretisch auf dem Niveau der GeForce 940MX befinden. Durch den fehlenden eigenen Grafikspeicher, ist die Performance jedoch pro Spiel und Setting unterschiedlich. Generell eignet sie sich aber eher für anspruchslose Spiele wie League of Legends oder Counter Strike: Go. Im Vergleich zur Vega 8 und Vega 10 , sollte sich die Vega 9 klarerweise zwischen beiden einordnen.
Der Stromverbrauch ist dank 14nm Prozess und ausgeklügelten Stromsparmechanismen relativ gering (laut AMD) und daher eignet sich die Grafikkarte auch für dünne und leichte Notebooks.
Intel HD Graphics 510 ► remove from comparison
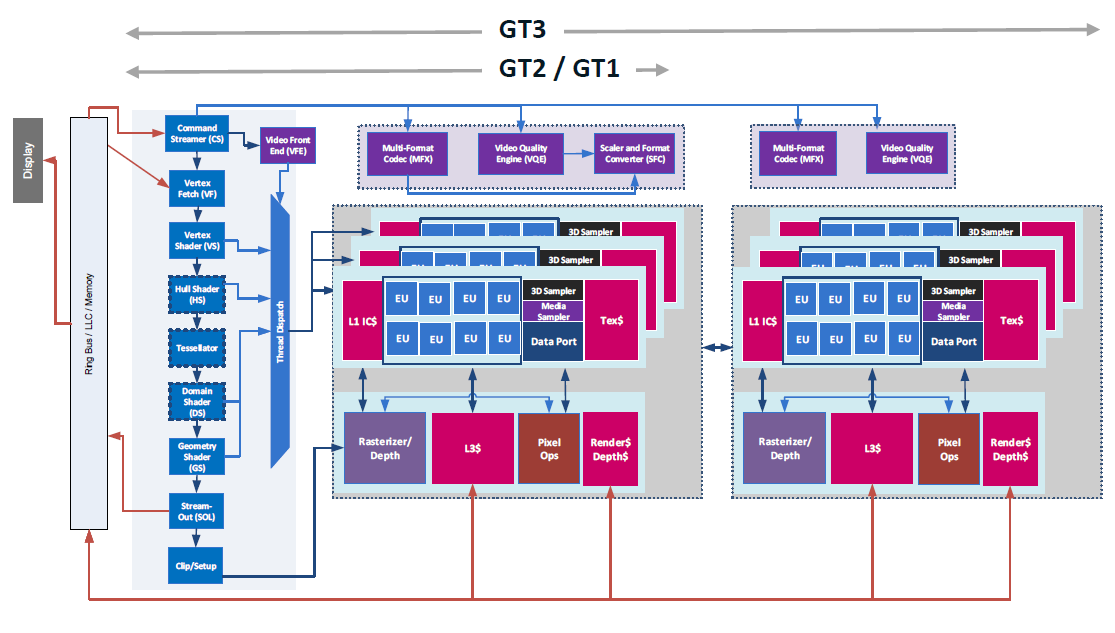
Die Intel HD Graphics 510 (GT1) ist eine Prozessorgrafikkarte der im September 2015 vorgestellten Skylake-Generation (z.B. Pentium 4405U ). Zwar glänzt die GPU mit einer niedrigen Leistungsaufnahme, allerdings siedelt sich die Performance nur im Low-End-Segment an und ist für neuere Spiele selten ausreichend. Als sogenannte GT1-Ausbaustufe der Skylake-GPU verfügt die HD Graphics 510 über 12 Execution Units (EUs), die je nach Modell mit bis zu 950 MHz takten.
Mangels eigenem Grafikspeicher oder eDRAM-Cache greift die HD Graphics 510 über das Interface des Prozessors auf den System-RAM zu (2x 64 Bit DDR3L-1600/LPDDR3-1866).
Performance
Die exakte Leistung der HD Graphics 510 dürfte sich knapp unterhalb der älteren HD Graphics 4400 ansiedeln, sodass aktuelle Spiele (Stand 2015) nur in wenigen Fällen und in niedrigsten Einstellungen flüssig dargestellt werden.
Features
Der überarbeitete Videodecoder decodiert nun auch H.265-/HEVC-Videos vollständig in Hardware und arbeitet dadurch deutlich effizienter als bislang. Die Bildausgabe erfolgt über DP 1.2/eDP 1.3 (max. 3.840 x 2.160 @ 60 Hz), wohingegen HDMI nur in der älteren Version 1.4a angeboten wird. Ein HDMI-2.0-Anschluss kann aber mittels Konverter von DisplayPort ergänzt werden. Maximal lassen sich drei Displays parallel angesteuern.
Leistungsaufnahme
Die TDP des gesamten Chips liegt standardmäßig bei 15 Watt, sodass die GPU vor allem in Ultrabooks oder oder schlanken Notebooks zu finden ist. Teils kann die TDP auch auf 10 Watt abgesenkt werden, wodurch allerdings die Performance sinkt.
Intel UHD Graphics 605 ► remove from comparison
Die Intel UHD Graphics 605 ist eine Prozessorgrafikkarte der Ende 2017 vorgestellten Gemini-Lake-Generation (z.B. Pentium Silver N5000). Zwar glänzt die GPU mit einer sehr niedrigen Leistungsaufnahme, allerdings siedelt sich die Performance nur im Low-End-Segment an und ist für neuere Spiele nicht ausreichend. Als maximale Ausbaustufe der Gemini-Lake-GPU verfügt die UHD Graphics 605 über 18 Execution Units (EUs), die mit bis zu 750 MHz takten. Technisch basiert die GPU auf der Intel-Gen9-Architektur, die auch bei der teureren Skylake-Serie zum Einsatz kommt. Im Vergleich zur alten Intel HD Graphics 505 in Apollo Lake , wurden nur die Displayausgänge verbessert (Gen. 10). Performance und Architektur blieben unangetastet.
Mangels eigenem Grafikspeicher oder eDRAM-Cache greift die UHD Graphics 605 über das Interface des Prozessors auf den System-RAM zu (2x 64 Bit DDR3L/LPDDR4-2400).
Performance
Die theoretische Grafikleistung entspricht in etwa der älteren Core-M-Grafikeinheit HD Graphics 5300 . Dadurch sind nur wenige anspruchslose Spiele flüssig spielbar (siehe auch die Spielebenchmarks der Intel HD Graphics 505 ). In unseren Tests erreichte z.B. nur wenige Spiele wie Dirt Rally oder Sims 4 spielbare Frameraten in niedrigsten Detailstufe.
Features
Der überarbeitete Videodecoder decodiert und encodiert H.265-/HEVC-Videos (8b und 10b) sowie VP9 vollständig in Hardware und arbeitet dadurch deutlich effizienter als bislang. Bei der Bildausgabe unterstützt der SoC dank Gen.10 nun auch HDMI 2.0a mit HDCP 2.2 un DisplayPort 1.2a nativ.
Leistungsaufnahme
Die TDP des gesamten Chips liegt beim Pentium N5000 standardmäßig bei 6 Watt, sodass die GPU vor allem in (oftmals passiv gekühlten) Netbooks oder schlanken Notebooks zu finden ist. Optional kann die TDP auch auf 4,8 Watt abgesenkt werden, wodurch allerdings die Performance sinkt.
AMD Radeon RX Vega 9 Intel HD Graphics 510 Intel UHD Graphics 605 Gen. 9 Serie Codename Vega Raven Ridge Skylake GT1 Gemini Lake Architektur Vega Gen. 9 Skylake Gen. 9 Apollo Lake Pipelines 576 - unified 12 - unified 18 - unified Kerntakt 1300 (Boost) MHz 300 - 950 (Boost) MHz 300 - 750 (Boost) MHz Shared Memory nein ja ja API DirectX 12_1 DirectX 12_1, OpenGL 4.4 DirectX 12_1, OpenGL 4.4 Stromverbrauch 15 Watt Transistors 4.5 Billion Herstellungsprozess 14 nm 14 nm 14 nm Features Tiled Rasterization, Shared Memory (up to Dual-Channel DDR4-2400) QuickSync QuickSync Erscheinungsdatum 26.10.2017 01.09.2015 11.12.2017 Speicherbandbreite 64/128 Bit 64/128 Bit Speichertyp DDR3/DDR4 DDR4 / LPDDR4 Herstellerseite ark.intel.com
Benchmarks Performance Rating - 3DMark 11 + Fire Strike + Time Spy - Vega 9
1.3 pt (4%)
...
...
max:
Performance Rating - 3DMark 11 + Fire Strike + Time Spy - HD Graphics 510
0.3 pt (1%)
...
...
max:
Performance Rating - 3DMark 11 + Fire Strike + Time Spy - UHD Graphics 605
0.2 pt (1%)
...
...
max:
3DMark - 3DMark Time Spy Score
974 Points (3%)
129 Points (0%)
3DMark - 3DMark Time Spy Graphics
872 Points (2%)
113 Points (0%)
3DMark - 3DMark Ice Storm Unlimited Graphics
131922 Points (13%)
43274 Points (4%)
min: 32770 avg: 43574 median: 45008 (5%) max: 55453 Points
3DMark - 3DMark Ice Storm Extreme Graphics
70492 Points (9%)
26846 Points (3%)
min: 13350 avg: 16118 median: 16553.5 (2%) max: 18016 Points
3DMark - 3DMark Cloud Gate Score
13582 Points (15%)
4721 Points (5%)
min: 2670 avg: 3247 median: 3154 (3%) max: 4294 Points
3DMark - 3DMark Cloud Gate Graphics
19255 Points (5%)
5664 Points (1%)
min: 2874 avg: 3518 median: 3359.5 (1%) max: 4485 Points
3DMark - 3DMark Fire Strike Standard Score
2524 Points (4%)
570 Points (1%)
min: 376 avg: 450.1 median: 419 (1%) max: 620 Points
3DMark - 3DMark Fire Strike Standard Graphics
2789 Points (3%)
621 Points (1%)
min: 411 avg: 473.4 median: 454 (1%) max: 576 Points
3DMark - 3DMark Ice Storm Graphics
94659 Points (11%)
62653 Points (7%)
min: 20859 avg: 25930 median: 26031 (3%) max: 30797 Points
3DMark - 3DMark Sling Shot (ES 3.0) Unlimited
2870 Points (12%)
3DMark - 3DMark Sling Shot (ES 3.0) Unlimited Graphics
2805 Points (6%)
3DMark - 3DMark Sling Shot Extreme (ES 3.1) Unlimited
1628 Points (8%)
3DMark - 3DMark Sling Shot Extreme (ES 3.1) Unlimited Graphics
1450 Points (4%)
3DMark - 3DMark Sling Shot (ES 3.0)
2642 Points (23%)
3DMark - 3DMark Sling Shot (ES 3.0) Graphics
2628 Points (16%)
3DMark - 3DMark Sling Shot Extreme (ES 3.1)
1789 Points (9%)
3DMark - 3DMark Sling Shot Extreme (ES 3.1) Graphics
1636 Points (5%)
3DMark - 3DMark Wild Life Unlimited
882 Points (0%)
3DMark - 3DMark Wild Life Extreme Unlimited
281 Points (0%)
3DMark - 3DMark Night Raid
min: 1614 avg: 1751 median: 1619 (2%) max: 2019 Points
3DMark - 3DMark Night Raid Graphics Score
min: 1849 avg: 2059 median: 1893 (1%) max: 2434 Points
3DMark 11 - 3DM11 Performance Score
4424 Points (6%)
985 Points (1%)
min: 655 avg: 795 median: 748 (1%) max: 1009 Points
3DMark 11 - 3DM11 Performance GPU
4380 Points (4%)
847 Points (1%)
min: 588 avg: 701 median: 648 (1%) max: 902 Points
3DMark Vantage + AMD Radeon RX Vega 9 3DMark Vantage - 3DM Vant. Perf. total
12628 Points (4%)
3DM Vant. Perf. total + Intel HD Graphics 510
3798 Points (1%)
3DM Vant. Perf. total + Intel UHD Graphics 605
2162 Points (1%)
3DM Vant. Perf. GPU no PhysX + AMD Radeon RX Vega 9 3DMark Vantage - 3DM Vant. Perf. GPU no PhysX
11100 Points (6%)
3DM Vant. Perf. GPU no PhysX + Intel HD Graphics 510
3125 Points (2%)
3DM Vant. Perf. GPU no PhysX + Intel UHD Graphics 605
1785 Points (1%)
3DMark 03 - 3DMark 03 - Standard
8388 Points (4%)
3DMark 05 - 3DMark 05 - Standard
5802 Points (6%)
3DMark 06 3DMark 06 - Standard 1280x1024 + AMD Radeon RX Vega 9
13365 Points (17%)
3DMark 06 - Standard 1280x1024 + Intel HD Graphics 510
7253 Points (9%)
Modell CPU GPU RAM Wert 3DMark 06 - Standard 1280x1024 Asus Vivobook F556UQ-XO626D (3DMark 06 - Standard 1280x1024) 6198DU HD Graphics 510 100 MHz8 GB 7253
3DMark 06 - Standard 1280x1024 + Intel UHD Graphics 605
min: 2882 avg: 4208 median: 4171 (5%) max: 5570 Points
Unigine Valley 1.0 - Unigine Valley 1.0 DX
1.7 fps (1%)
Unigine Heaven 3.0 - Unigine Heaven 3.0 DX 11
9.3 fps (3%)
6.5 fps (2%)
Unigine Heaven 3.0 - Unigine Heaven 3.0 OpenGL
10.8 fps (5%)
7.2 fps (3%)
Unigine Heaven 2.1 - Heaven 2.1 high
13.5 fps (3%)
9 fps (2%)
Cinebench R10 Cinebench R10 Shading (32bit) + AMD Radeon RX Vega 9 Cinebench R10 - Cinebench R10 Shading (32bit)
6966 Points (5%)
Cinebench R10 Shading (32bit) + Intel HD Graphics 510
7348 Points (5%)
Cinebench R10 Shading (32bit) + Intel UHD Graphics 605
min: 3505 avg: 3812 median: 3773 (3%) max: 4366 Points
Cinebench R11.5 Cinebench R11.5 OpenGL 64 Bit + AMD Radeon RX Vega 9 Cinebench R11.5 - Cinebench R11.5 OpenGL 64 Bit
46.6 fps (15%)
Cinebench R11.5 OpenGL 64 Bit + Intel HD Graphics 510
17.2 fps (6%)
Cinebench R11.5 OpenGL 64 Bit + Intel UHD Graphics 605
min: 15.24 avg: 17.9 median: 17.9 (6%) max: 20.5 fps
Cinebench R15 + AMD Radeon RX Vega 9 Cinebench R15 - Cinebench R15 OpenGL 64 Bit
55 fps (3%)
Cinebench R15 OpenGL 64 Bit + Intel HD Graphics 510
28 fps (2%)
Cinebench R15 OpenGL 64 Bit + Intel UHD Graphics 605
min: 13.37 avg: 18.2 median: 18.1 (1%) max: 25.6 fps
Cinebench R15 OpenGL Ref. Match 64 Bit + AMD Radeon RX Vega 9 Cinebench R15 - Cinebench R15 OpenGL Ref. Match 64 Bit
98 % (98%)
Cinebench R15 OpenGL Ref. Match 64 Bit + Intel UHD Graphics 605
97.8 % (98%)
GFXBench - GFXBench 5.0 Aztec Ruins High Tier Offscreen
min: 5.9 avg: 6.4 median: 6.4 (1%) max: 6.8 fps
GFXBench - GFXBench 5.0 Aztec Ruins Normal Tier Offscreen
min: 9.9 avg: 12.8 median: 12.8 (1%) max: 15.7 fps
GFXBench - GFXBench Car Chase Offscreen
49 fps (6%)
35.9 fps (4%)
min: 7.1 avg: 11 median: 11.3 (1%) max: 14.6 fps
GFXBench 3.1 - GFXBench Manhattan ES 3.1 Offscreen
57.4 fps (1%)
51.7 fps (1%)
min: 13 avg: 17.6 median: 16.5 (0%) max: 23.3 fps
GFXBench 3.0 - GFXBench 3.0 Manhattan Offscreen
73.1 fps (4%)
64.6 fps (4%)
min: 16 avg: 23.8 median: 22.1 (1%) max: 33.4 fps
GFXBench (DX / GLBenchmark) 2.7 + AMD Radeon RX Vega 9 GFXBench (DX / GLBenchmark) 2.7 - GFXBench T-Rex HD Offscreen C24Z16
192 fps (2%)
GFXBench T-Rex HD Offscreen C24Z16 + Intel HD Graphics 510
121.9 fps (1%)
GFXBench T-Rex HD Offscreen C24Z16 + Intel UHD Graphics 605 min: 32 avg: 43.1 median: 45.5 (0%) max: 51.9 fps
Basemark GPU 1.2 - Basemark GPU 1.2 Vulkan Official Medium Offscreen 1080
23.3 fps (0%)
Basemark GPU 1.2 - Basemark GPU 1.2 Vulkan Official High Offscreen 2160
2 fps (0%)
LuxMark v2.0 64Bit - LuxMark v2.0 Room GPU
239 Samples/s (1%)
167 Samples/s (1%)
min: 67 avg: 93.5 median: 93.5 (0%) max: 120 Samples/s
LuxMark v2.0 64Bit - LuxMark v2.0 Sala GPU
588 Samples/s (1%)
302 Samples/s (1%)
min: 96 avg: 142 median: 142 (0%) max: 188 Samples/s
ComputeMark v2.1 - ComputeMark v2.1 Result
2806 Points (3%)
500 Points (1%)
min: 432 avg: 490.5 median: 490.5 (1%) max: 549 Points
Power Consumption - Furmark Stress Test Power Consumption - external Monitor *
42.2 Watt (6%)
min: 10.3 avg: 11 median: 11 (2%) max: 11.6 Watt
Power Consumption - The Witcher 3 Power Consumption - external Monitor *
40.3 Watt (6%)
Power Consumption - Witcher 3 Power Consumption *
45.1 Watt (10%)
11.8 Watt (3%)
Power Consumption - Witcher 3 ultra Power Efficiency
0.2 fps per Watt (16%)
0.1 fps per Watt (9%)
Power Consumption - Witcher 3 ultra Power Efficiency - external Monitor
0.2 fps per Watt (17%)
Emissions Witcher 3 Fan Noise + AMD Radeon RX Vega 9 Emissions - Witcher 3 Fan Noise
39 dB(A) (62%)
Clock Speed - GPU Clock Speed Furmark
515 MHz (20%)
Average Benchmarks AMD Radeon RX Vega 9 → 100% n=22 Average Benchmarks Intel HD Graphics 510 → 48% n=22 Average Benchmarks Intel UHD Graphics 605 → 26% n=22
- Bereich der Benchmarkergebnisse für diese Grafikkarte
- Durchschnittliche Benchmarkergebnisse für diese Grafikkarte
* Smaller numbers mean a higher performance
1 This benchmark is not used for the average calculation
Spiele-Benchmarks Die folgenden Benchmarks basieren auf unseren Spieletests mit Testnotebooks. Die Performance dieser Grafikkarte bei den gelisteten Spielen ist abhängig von der verwendeten CPU, Speicherausstattung, Treiber und auch Betriebssystem. Dadurch müssen die untenstehenden Werte nicht repräsentativ sein. Detaillierte Informationen über das verwendete System sehen Sie nach einem Klick auf den fps-Wert.
UHD Graphics 605:
31.1 [X] Topjoy Falcon Intel Pentium Silver N5000 1.1GHz
UHD Graphics 605
min:
26 fps, max:
58 fps
fps
16%
UHD Graphics 605:
7 8.2 [X] Topjoy Falcon Intel Pentium Silver N5000 1.1GHz
UHD Graphics 605
min:
6 fps, max:
11 fps
~ 8 fps
UHD Graphics 605:
49.8 [X] Topjoy Falcon Intel Pentium Silver N5000 1.1GHz
UHD Graphics 605
min:
41 fps, max:
60 fps
fps
UHD Graphics 605:
39 [X] Topjoy Falcon Intel Pentium Silver N5000 1.1GHz
UHD Graphics 605
min:
24 fps, max:
50 fps
fps
UHD Graphics 605:
26.6 [X] Topjoy Falcon Intel Pentium Silver N5000 1.1GHz
UHD Graphics 605
min:
18 fps, max:
34 fps
fps
UHD Graphics 605:
24.9 [X] Topjoy Falcon Intel Pentium Silver N5000 1.1GHz
UHD Graphics 605
min:
17 fps, max:
32 fps
fps
UHD Graphics 605:
23.6 [X] Topjoy Falcon Intel Pentium Silver N5000 1.1GHz
UHD Graphics 605
min:
11 fps, max:
33 fps
fps
UHD Graphics 605:
15 [X] Topjoy Falcon Intel Pentium Silver N5000 1.1GHz
UHD Graphics 605
min:
8 fps, max:
22 fps
fps
UHD Graphics 605:
11.7 (!) [X] Topjoy Falcon Intel Pentium Silver N5000 1.1GHz
UHD Graphics 605
min:
9 fps, max:
15 fps
17.6 ~ 15 fps
12%
UHD Graphics 605:
7.2 fps
14%
UHD Graphics 605:
4 fps
UHD Graphics 605:
5 6.4 7.2 8.6 [X] Intel NUC7PJYHN Intel Pentium Silver J5040 2GHz
UHD Graphics 605
9.1 ~ 7 fps
UHD Graphics 605:
3.5 5.9 6 6.1 [X] Intel NUC7PJYHN Intel Pentium Silver J5040 2GHz
UHD Graphics 605
~ 5 fps
UHD Graphics 605:
3.1 5.3 5.5 5.5 [X] Intel NUC7PJYHN Intel Pentium Silver J5040 2GHz
UHD Graphics 605
~ 5 fps
UHD Graphics 605:
3.4 4.2 4.4 5.2 7.5 [X] Intel NUC7PJYHN 1.3
Intel Pentium Silver J5040 2GHz
UHD Graphics 605
~ 5 fps
UHD Graphics 605:
3.3 [X] Intel NUC7PJYHN 1.3
Intel Pentium Silver J5040 2GHz
UHD Graphics 605
fps
UHD Graphics 605:
38 41.4 ~ 40 fps
UHD Graphics 605:
17 18.4 ~ 18 fps
UHD Graphics 605:
18.8 fps
22%
UHD Graphics 605:
9.9 10 ~ 10 fps
HD Graphics 510:
18.3 [X] Asus Vivobook F556UQ-XO626D Intel Core i5-6198DU 2.3GHz
HD Graphics 510
fps
HD Graphics 510:
19.9 [X] Asus Vivobook F556UQ-XO626D Intel Core i5-6198DU 2.3GHz
HD Graphics 510
fps
HD Graphics 510:
15.4 [X] Asus Vivobook F556UQ-XO626D Intel Core i5-6198DU 2.3GHz
HD Graphics 510
fps
HD Graphics 510:
70.6 [X] Asus Vivobook F556UQ-XO626D Intel Core i5-6198DU 2.3GHz
HD Graphics 510
fps
HD Graphics 510:
41.3 [X] Asus Vivobook F556UQ-XO626D Intel Core i5-6198DU 2.3GHz
HD Graphics 510
fps
HD Graphics 510:
24.5 [X] Asus Vivobook F556UQ-XO626D Intel Core i5-6198DU 2.3GHz
HD Graphics 510
fps
UHD Graphics 605:
12.7 fps
HD Graphics 510:
9.4 [X] Asus Vivobook F556UQ-XO626D Intel Core i5-6198DU 2.3GHz
HD Graphics 510
fps
12%
UHD Graphics 605:
11.4 fps
HD Graphics 510:
13.4 [X] Asus Vivobook F556UQ-XO626D Intel Core i5-6198DU 2.3GHz
HD Graphics 510
fps
HD Graphics 510:
7.7 [X] Asus Vivobook F556UQ-XO626D Intel Core i5-6198DU 2.3GHz
HD Graphics 510
fps
HD Graphics 510:
11.1 [X] Asus Vivobook F556UQ-XO626D Intel Core i5-6198DU 2.3GHz
HD Graphics 510
fps
HD Graphics 510:
7 [X] Asus Vivobook F556UQ-XO626D Intel Core i5-6198DU 2.3GHz
HD Graphics 510
fps
HD Graphics 510:
25 [X] Asus Vivobook F556UQ-XO626D Intel Core i5-6198DU 2.3GHz
HD Graphics 510
fps
UHD Graphics 605:
12.3 fps
HD Graphics 510:
15.9 [X] Asus Vivobook F556UQ-XO626D Intel Core i5-6198DU 2.3GHz
HD Graphics 510
fps
HD Graphics 510:
19.9 [X] Asus Vivobook F556UQ-XO626D Intel Core i5-6198DU 2.3GHz
HD Graphics 510
fps
HD Graphics 510:
11 [X] Asus Vivobook F556UQ-XO626D Intel Core i5-6198DU 2.3GHz
HD Graphics 510
fps
HD Graphics 510:
48.7 [X] Asus Vivobook F556UQ-XO626D Intel Core i5-6198DU 2.3GHz
HD Graphics 510
fps
UHD Graphics 605:
22.7 24.7 [X] Topjoy Falcon Intel Pentium Silver N5000 1.1GHz
UHD Graphics 605
min:
11 fps, max:
35 fps
~ 24 fps
HD Graphics 510:
29.2 [X] Asus Vivobook F556UQ-XO626D Intel Core i5-6198DU 2.3GHz
HD Graphics 510
fps
UHD Graphics 605:
14.3 fps
HD Graphics 510:
38.9 [X] Asus Vivobook F556UQ-XO626D Intel Core i5-6198DU 2.3GHz
HD Graphics 510
fps
UHD Graphics 605:
21.6 fps
HD Graphics 510:
25.2 [X] Asus Vivobook F556UQ-XO626D Intel Core i5-6198DU 2.3GHz
HD Graphics 510
fps
UHD Graphics 605:
15.8 fps
HD Graphics 510:
66.2 [X] Asus Vivobook F556UQ-XO626D Intel Core i5-6198DU 2.3GHz
HD Graphics 510
fps
UHD Graphics 605:
32.5 33.7 35 35.9 36.5 49.5 [X] Intel NUC7PJYHN Intel Pentium Silver J5040 2GHz
UHD Graphics 605
min:
42.8 fps, max:
-1 fps
~ 37 fps
HD Graphics 510:
41.8 [X] Asus Vivobook F556UQ-XO626D Intel Core i5-6198DU 2.3GHz
HD Graphics 510
fps
UHD Graphics 605:
11.5 14 14.3 14.3 15.1 18.6 [X] Intel NUC7PJYHN Intel Pentium Silver J5040 2GHz
UHD Graphics 605
min:
13.1 fps, max:
-1 fps
~ 15 fps
UHD Graphics 605:
5.9 6.7 7.4 7.8 10.6 [X] Intel NUC7PJYHN Intel Pentium Silver J5040 2GHz
UHD Graphics 605
min:
8.7 fps, max:
-1 fps
~ 8 fps
UHD Graphics 605:
5.9 6.7 10 [X] Intel NUC7PJYHN Intel Pentium Silver J5040 2GHz
UHD Graphics 605
min:
8.2 fps, max:
-1 fps
~ 8 fps
15%
UHD Graphics 605:
1.2 fps
HD Graphics 510:
110.4 [X] Asus Vivobook F556UQ-XO626D Intel Core i5-6198DU 2.3GHz
HD Graphics 510
fps
HD Graphics 510:
19.3 [X] Asus Vivobook F556UQ-XO626D Intel Core i5-6198DU 2.3GHz
HD Graphics 510
fps
UHD Graphics 605:
12.5 fps
HD Graphics 510:
30.9 [X] Asus Vivobook F556UQ-XO626D Intel Core i5-6198DU 2.3GHz
HD Graphics 510
fps
UHD Graphics 605:
9.5 11.6 11.7 [X] Topjoy Falcon Intel Pentium Silver N5000 1.1GHz
UHD Graphics 605
min:
0.501 fps, P1:
5.85 fps, max:
33.2 fps
~ 11 fps
HD Graphics 510:
26.8 [X] Asus Vivobook F556UQ-XO626D Intel Core i5-6198DU 2.3GHz
HD Graphics 510
fps
UHD Graphics 605:
9.3 [X] Topjoy Falcon Intel Pentium Silver N5000 1.1GHz
UHD Graphics 605
min:
0.3784 fps, P1:
4.59 fps, max:
34.4 fps
fps
HD Graphics 510:
31.5 [X] Asus Vivobook F556UQ-XO626D Intel Core i5-6198DU 2.3GHz
HD Graphics 510
fps
UHD Graphics 605:
10.9 fps
HD Graphics 510:
22.2 [X] Asus Vivobook F556UQ-XO626D Intel Core i5-6198DU 2.3GHz
HD Graphics 510
fps
HD Graphics 510:
72 [X] Asus Vivobook F556UQ-XO626D Intel Core i5-6198DU 2.3GHz
HD Graphics 510
fps
HD Graphics 510:
47 [X] Asus Vivobook F556UQ-XO626D Intel Core i5-6198DU 2.3GHz
HD Graphics 510
fps
UHD Graphics 605:
17.5 fps
UHD Graphics 605:
13.1 fps
UHD Graphics 605:
14.4 fps
HD Graphics 510:
173.7 [X] Asus Vivobook F556UQ-XO626D Intel Core i5-6198DU 2.3GHz
HD Graphics 510
fps
UHD Graphics 605:
96.9 fps
HD Graphics 510:
32.2 [X] Asus Vivobook F556UQ-XO626D Intel Core i5-6198DU 2.3GHz
HD Graphics 510
fps
UHD Graphics 605:
21.8 fps
UHD Graphics 605:
10.5 fps
UHD Graphics 605:
14.3 fps
HD Graphics 510:
135.5 [X] Asus Vivobook F556UQ-XO626D Intel Core i5-6198DU 2.3GHz
HD Graphics 510
fps
UHD Graphics 605:
58.5 fps
HD Graphics 510:
32.8 [X] Asus Vivobook F556UQ-XO626D Intel Core i5-6198DU 2.3GHz
HD Graphics 510
fps
UHD Graphics 605:
16.5 fps
UHD Graphics 605:
12.5 fps
HD Graphics 510:
33.4 [X] Asus Vivobook F556UQ-XO626D Intel Core i5-6198DU 2.3GHz
HD Graphics 510
fps
HD Graphics 510:
22.5 [X] Asus Vivobook F556UQ-XO626D Intel Core i5-6198DU 2.3GHz
HD Graphics 510
fps
HD Graphics 510:
15.9 [X] Asus Vivobook F556UQ-XO626D Intel Core i5-6198DU 2.3GHz
HD Graphics 510
fps
UHD Graphics 605:
34.7 fps
UHD Graphics 605:
17.1 fps
33%
HD Graphics 510:
39 [X] Asus Vivobook F556UQ-XO626D Intel Core i5-6198DU 2.3GHz
HD Graphics 510
fps
HD Graphics 510:
20.1 [X] Asus Vivobook F556UQ-XO626D Intel Core i5-6198DU 2.3GHz
HD Graphics 510
fps
HD Graphics 510:
17.7 [X] Asus Vivobook F556UQ-XO626D Intel Core i5-6198DU 2.3GHz
HD Graphics 510
fps
HD Graphics 510:
52.7 [X] Asus Vivobook F556UQ-XO626D Intel Core i5-6198DU 2.3GHz
HD Graphics 510
fps
UHD Graphics 605:
31.6 fps
HD Graphics 510:
23.9 [X] Asus Vivobook F556UQ-XO626D Intel Core i5-6198DU 2.3GHz
HD Graphics 510
fps
UHD Graphics 605:
18.5 fps
HD Graphics 510:
16.2 [X] Asus Vivobook F556UQ-XO626D Intel Core i5-6198DU 2.3GHz
HD Graphics 510
fps
UHD Graphics 605:
12.5 fps
UHD Graphics 605:
32.3 fps
UHD Graphics 605:
17.1 fps
UHD Graphics 605:
14.1 fps
UHD Graphics 605:
28.8 fps
UHD Graphics 605:
21.1 fps
UHD Graphics 605:
18.6 fps
UHD Graphics 605:
12.5 fps
UHD Graphics 605:
11.4 fps
UHD Graphics 605:
19.9 fps
UHD Graphics 605:
12.3 fps
UHD Graphics 605:
27.4 fps
UHD Graphics 605:
21.2 fps
UHD Graphics 605:
55.6 fps
UHD Graphics 605:
22.7 fps
UHD Graphics 605:
15.2 fps
UHD Graphics 605:
12.5 fps
UHD Graphics 605:
78.7 fps
UHD Graphics 605:
17.4 fps
Average Gaming AMD Radeon RX Vega 9 → 100% Average Gaming 30-70 fps → 100%
Average Gaming Intel HD Graphics 510 → 33% Average Gaming 30-70 fps → 33%
Average Gaming Intel UHD Graphics 605 → 17% AMD Radeon RX Vega 9 low med. high ultra QHD 4K Borderlands 3 28.3 13.5 7.8 F1 2019 51 21 18 12 Apex Legends 60.7 20.9 18 14.5 Shadow of the Tomb Raider 29 8 Fortnite 48 22.3 15.7 9.1 Rocket League 100.7 46.2 30.4 Overwatch 92.3 36.3 19.3 The Witcher 3 41.9 13.3 8.1 BioShock Infinite 117.9 20.5 < 30 fps < 60 fps < 120 fps ≥ 120 fps 2 3 4 5 1 5 2 6
v1.28
log 04. 16:36:59
#0 ran 0s before starting gpusingle class +0s ... 0s
#1 checking url part for id 9952 +0s ... 0s
#2 checking url part for id 6475 +0s ... 0s
#3 checking url part for id 8270 +0s ... 0s
#4 redirected to Ajax server, took 1728052618s time from redirect:0 +0s ... 0s
#5 did not recreate cache, as it is less than 5 days old! Created at Fri, 04 Oct 2024 05:16:46 +0200 +0s ... 0s
#6 composed specs +0.004s ... 0.004s
#7 did output specs +0s ... 0.005s
#8 start showIntegratedCPUs +0s ... 0.005s
#9 getting avg benchmarks for device 9952 +0.011s ... 0.015s
#10 got single benchmarks 9952 +0s ... 0.016s
#11 getting avg benchmarks for device 6475 +0.001s ... 0.017s
#12 got single benchmarks 6475 +0.001s ... 0.017s
#13 getting avg benchmarks for device 8270 +0.003s ... 0.021s
#14 got single benchmarks 8270 +0.016s ... 0.036s
#15 got avg benchmarks for devices +0s ... 0.036s
#16 min, max, avg, median took s +0.039s ... 0.075s
#17 before gaming benchmark output +0s ... 0.075s
#18 Got 259 rows for game benchmarks. +0.013s ... 0.088s
#19 composed SQL query for gamebenchmarks +0s ... 0.088s
#20 got data and put it in $dataArray +0.003s ... 0.091s
#21 benchmarks composed for output. +0.019s ... 0.11s
#22 calculated avg scores. +0s ... 0.11s
#23 return log +0s ... 0.111s
Teilen Sie diesen Artikel, um uns zu unterstützen. Jeder Link hilft!
Autor: Klaus Hinum, 8.09.2017 (Update: 1.07.2023)
 Deutsch
 English
 Español
 Français
 Italiano
 Nederlands
 Polski
 Português
 Русский
 Türkçe
 Svenska
 Chinese
 Magyar