Intel Core Ultra 7 155H vs Apple A18 vs HiSilicon k3v2 Hi3620
Intel Core Ultra 7 155H ► remove from comparison
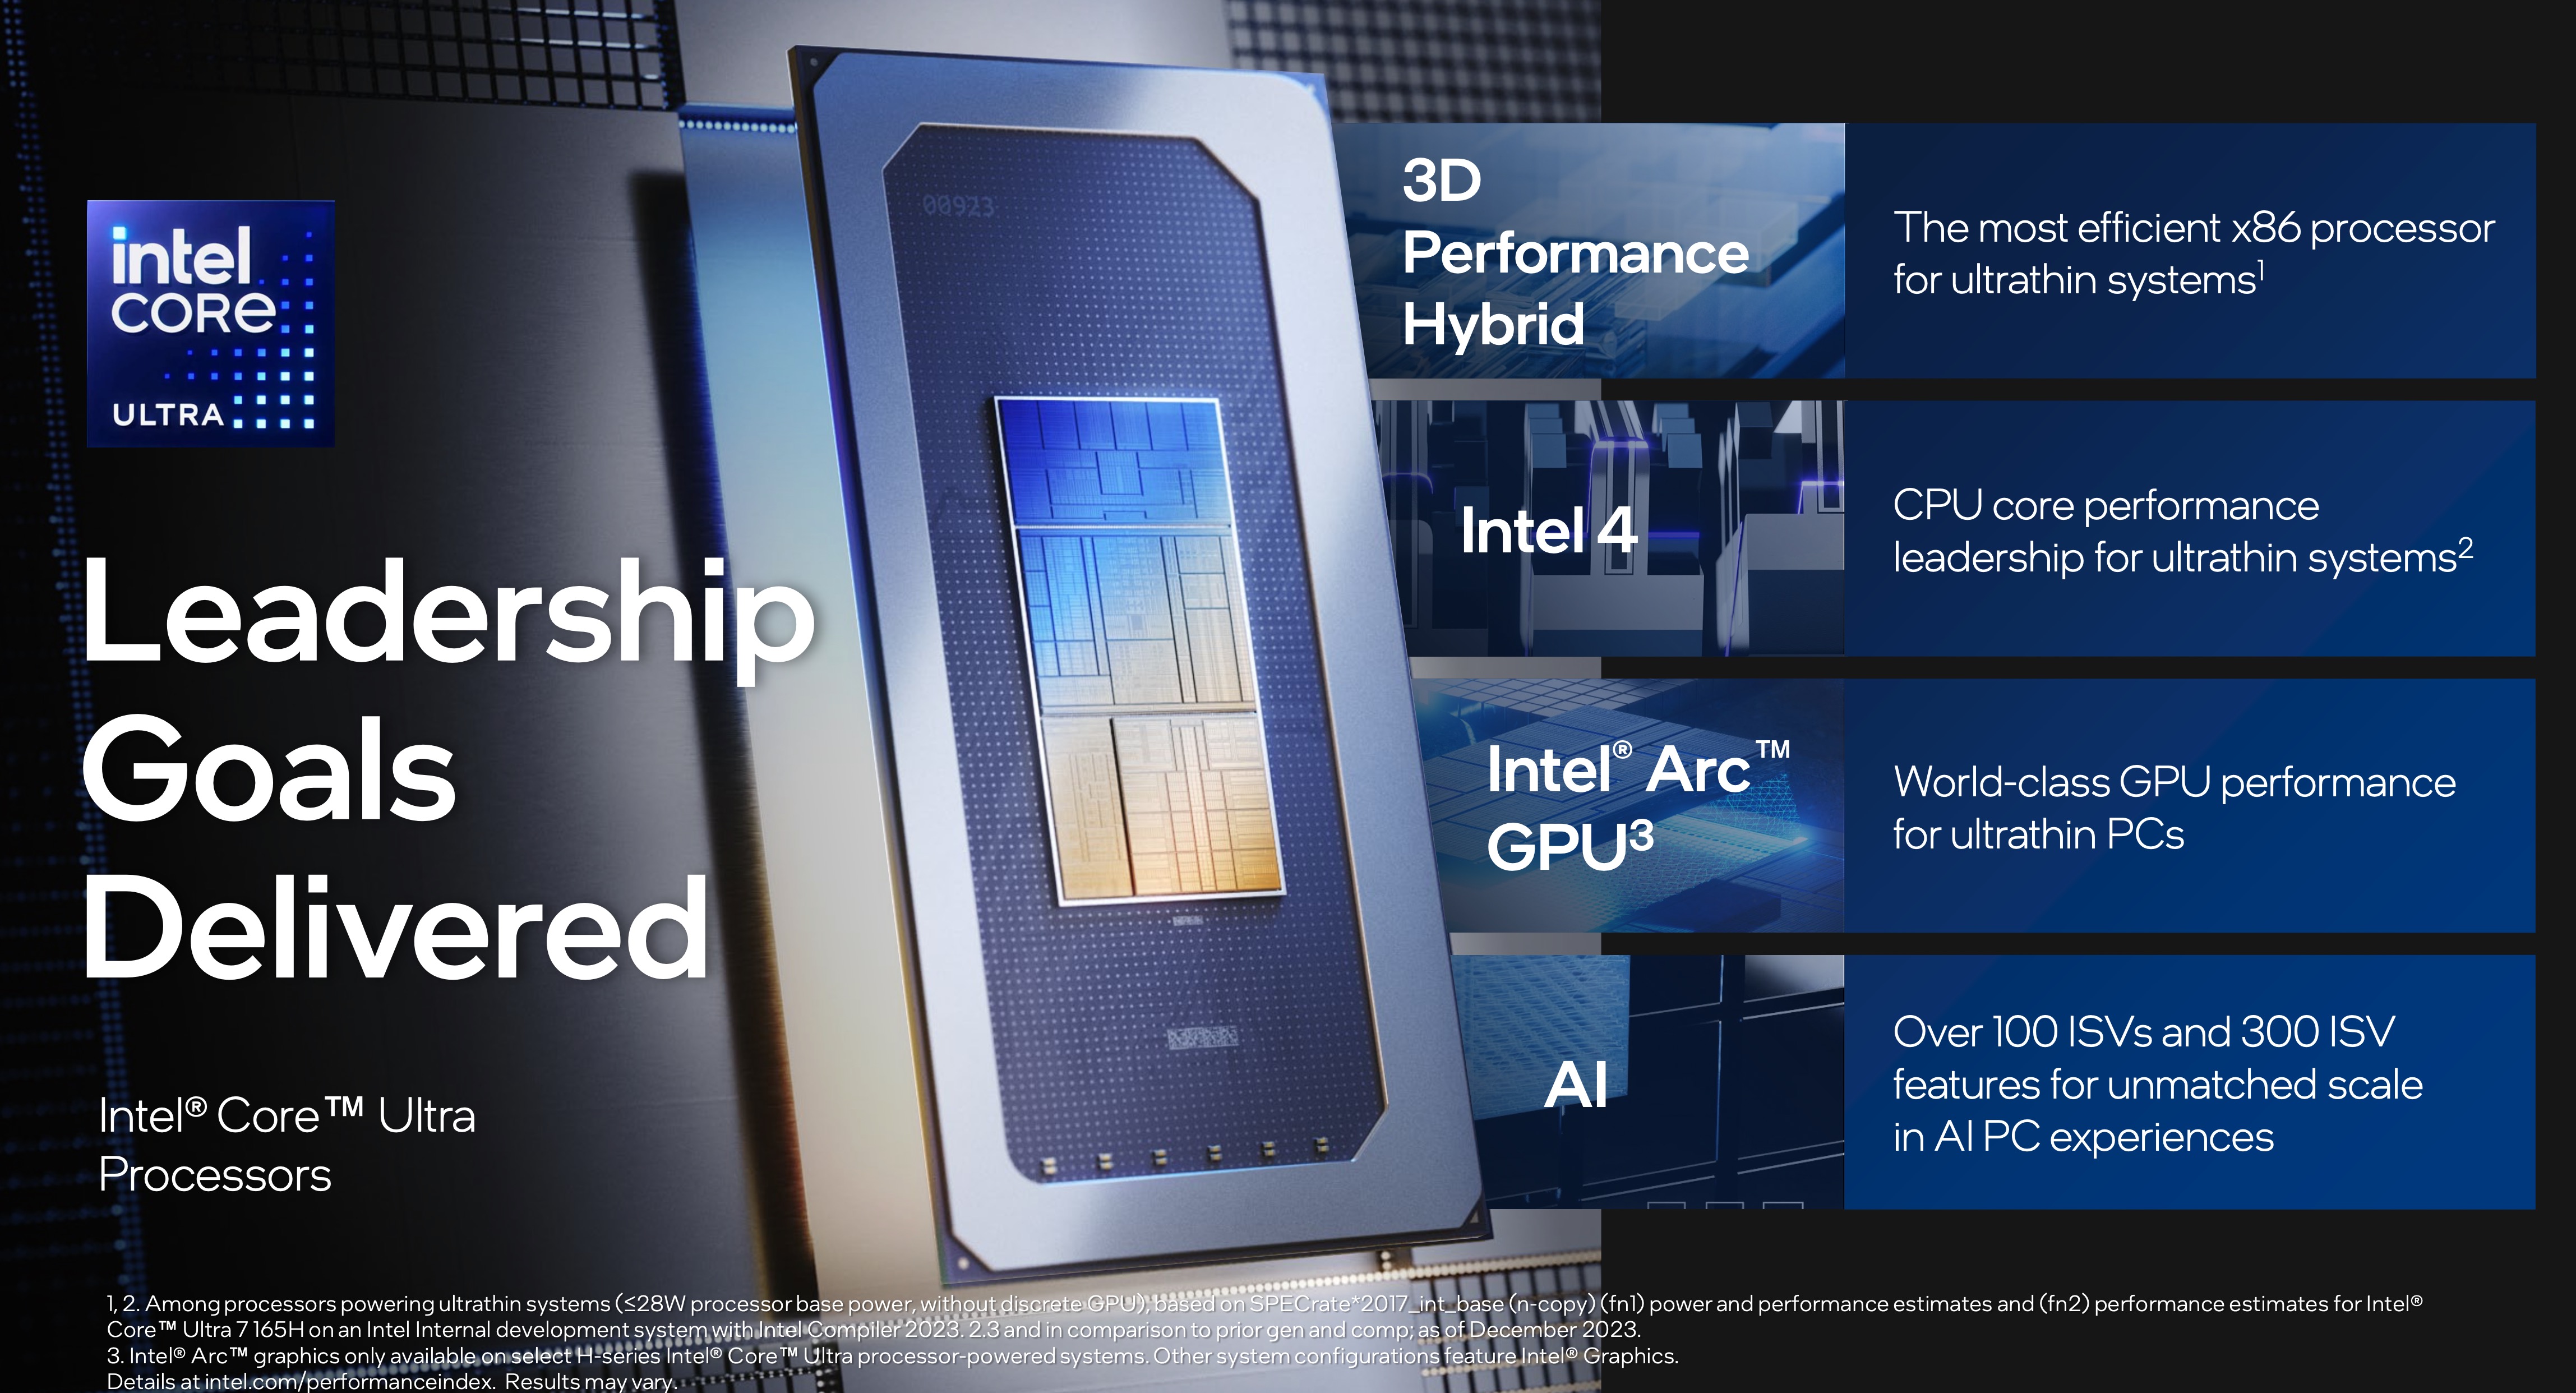
Der Intel Core Ultra 7 155H ist eine High-End-CPU der Meteor-Lake-H-Serie die im Dezember 2023 vorgestellt wurde. Der SoC setzt zum ersten Mal auf ein Tile/Chiplet-Design. Der Compute-Tile bietet 6 Performance Kerne (P-Kerne, Redwood Cove Architektur) und 8 Effizienzkerne (E-Kerne, Crestmont Architektur). Die P-Kerne unterstützten Hyperthreading (daher gemeinsam 22 Threads) und takten bis 4,8 GHz. Die E-Kerne takten mit maximal 3,8 GHz. Zusätzlich gibt es nun noch zwei weitere Low-Power-Efficiency-Kerne auf der Low-Power-Island, im Leerlauf und bei einfachen Aufgaben kann der Compute-Tile daher komplett deaktiviert werden, um Strom zu sparen.
Performance
Mit Meteor-Lake-P wird die bisherige Architektur weiter verbessert, es gibt aber keine grundlegenden Änderungen. Die Leistung ist daher auch nur geringfügig höher als bei den Raptor-Lake-Prozessoren.
Grafikeinheit
Der Core Ultra 7 155H bietet eine neue ARC-iGPU mit 8 Xe-Kernen und 128 EUs, die maximal 2,25 GHz erreichen. Die Leistung gegenüber der alten Iris Xe Graphics G7 mit 96 EUs konnte ungefähr verdoppelt werden.
Features
Meteor Lake-H hat WiFi 6E und Thunderbolt 4 (4x) integriert. Der integrierte Speicherkontroller unterstützt jetzt LPDDR5/x-7467 (max. 64 GB) oder DDR5-5600 (max. 96 GB). Es kommt nun eine dedizierte NPU (2x Gen3 Neural Compute Engines) zum Einsatz. Die Xe Media Engine unterstützt MPEG-2, AVC, VC-1 Decode, JPEG, VP8 Decode, VP9, HEVC und AV1 Decode bis zu 8K 10-Bit HDR. Der Chip unterstützt jetzt PCIe-5.0 (x8 für GPU) und PCIe-4.0 (drei x12 für SSDs).
Leistungsaufnahme
Der Intel Core Ultra 7 155H ist mit 28 Watt TDP (Base) und 64 Watt bzw. 115 Watt (PL2) max. Turbo Power angegeben. Meteor Lake besteht aus fünf einzelnen Chips, wobei der Prozessorteil im neuen Intel 4 Prozess (7nm) gefertigt wird. Die Grafikeinheit wird bei TSMC in N5 produziert und SoC und I/O-Tile im älteren N6 Prozess. Diese 4 Chips werden dann per Foveros-Verfahren auf den 22nm Base-Tile aufgebracht.
HiSilicon k3v2 Hi3620 ► remove from comparison
Coretex A9 Quad-Core - max 1.5 GHz, im Huawei Mediapad 10 FHD mit 1.2 GHz
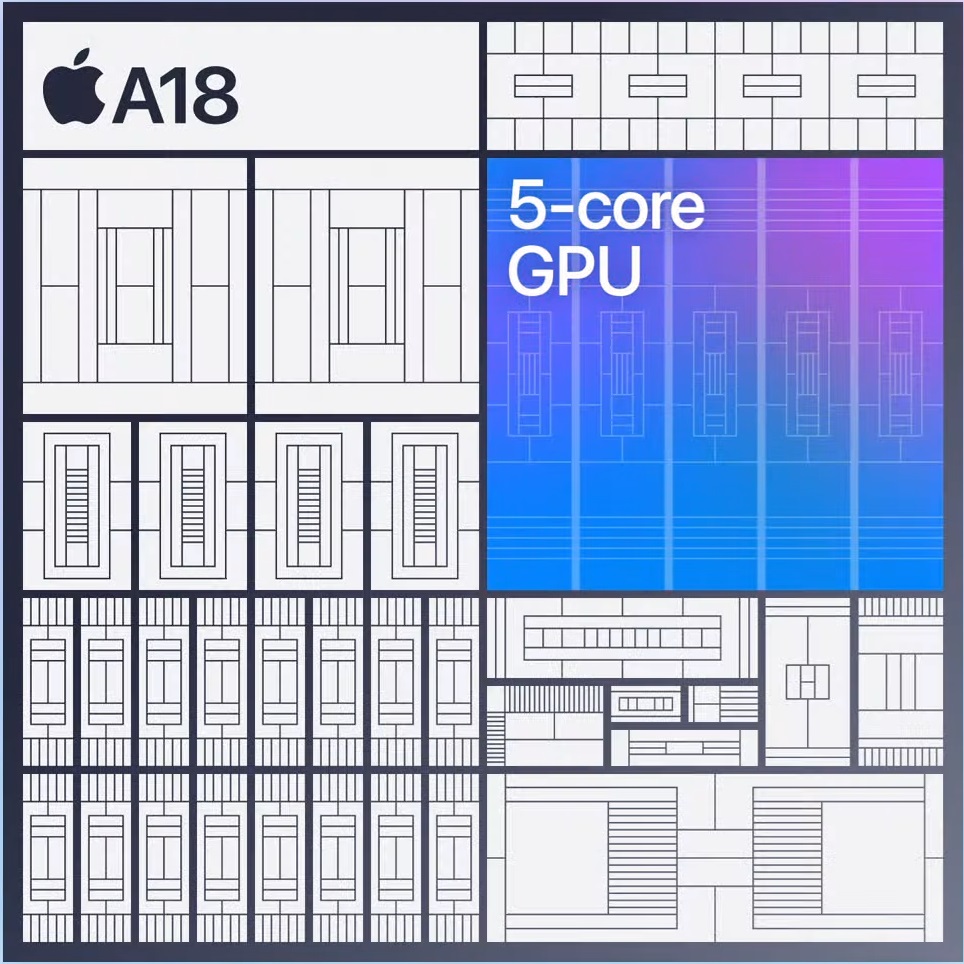
Model Intel Core Ultra 7 155H Apple A18 HiSilicon k3v2 Hi3620 Series Intel Meteor Lake-H Apple Codename Meteor Lake-H Serie: Clock 3800 - 4800 MHz <=3800 MHz 1200 MHz L3 Cache 24 MB Cores / Threads 16 / 22 6 / 6 4 / 4 TDP 28 Watt Technology 7 nm 3 nm 40 nm max. Temp. 110 °C Socket BGA2049 Features DDR5-5600/LPDDR5-7467/LPDDR5x-7467 RAM, PCIe 5, Thr. Director, DL Boost, AI Boost, vPro Ess., MMX, SSE, SSE2, SSE3, SSSE3, SSE4.1, SSE4.2, AES, AVX, AVX2, AVX-VNNI, FMA3, SHA 16-core Neural Engine, USB 2.0 (480 Mbps) ARMv7 iGPU Intel Arc 8-Core iGPU ( - 2250 MHz)Architecture x86 ARM ARM Announced Manufacturer ark.intel.com TDP Turbo PL2 10 Watt
Benchmarks Performance Rating - CB R15 + R20 + 7-Zip + X265 + Blender + 3DM11 CPU - Ultra 7 155H
37.9 pt (63%)
...
...
max:
Cinebench 2024 - Cinebench 2024 CPU Single Core
min: 2.2 avg: 92.7 median: 102.8 (71%) max: 108 Points
CPU TDP ? TDP 24 W TDP 28 W TDP 30 W TDP 31 W TDP 45 W TDP 50 W TDP 57 W TDP 65 W TDP 85 W TDP 102 W 100% 94% 51% 96% 98% 99% 99% 93% 51% 98% 95%
Cinebench 2024 - Cinebench 2024 CPU Multi Core
min: 6.94 avg: 740 median: 794 (15%) max: 1024 Points
CPU TDP ? TDP 24 W TDP 25 W TDP 28 W TDP 30 W TDP 31 W TDP 44 W TDP 45 W TDP 50 W TDP 57 W TDP 65 W TDP 85 W TDP 102 W 68% 66% 68% 26% 65% 66% 83% 84% 88% 77% 50% 98% 100%
Cinebench R23 - Cinebench R23 Multi Core
min: 9769 avg: 14965 median: 15013 (14%) max: 19007 Points
CPU TDP ? TDP 20 W TDP 22 W TDP 24 W TDP 25 W TDP 28 W TDP 30 W TDP 31 W TDP 39 W TDP 40 W TDP 42 W TDP 43 W TDP 44 W TDP 45 W TDP 50 W TDP 54 W TDP 55 W TDP 57 W TDP 60 W TDP 65 W TDP 70 W TDP 85 W TDP 102 W 69% 64% 56% 63% 77% 71% 75% 70% 76% 77% 85% 76% 82% 84% 92% 70% 77% 91% 100% 93% 99% 97% 97%
Cinebench R23 - Cinebench R23 Single Core
min: 1496 avg: 1728 median: 1749 (74%) max: 1815 Points
CPU TDP ? TDP 20 W TDP 22 W TDP 24 W TDP 25 W TDP 28 W TDP 30 W TDP 31 W TDP 39 W TDP 40 W TDP 42 W TDP 43 W TDP 44 W TDP 45 W TDP 50 W TDP 54 W TDP 55 W TDP 57 W TDP 60 W TDP 65 W TDP 70 W TDP 85 W TDP 102 W 96% 95% 85% 93% 95% 92% 98% 97% 99% 96% 96% 98% 95% 97% 96% 96% 91% 91% 97% 95% 100% 99% 96%
Cinebench R20 - Cinebench R20 CPU (Single Core)
min: 601 avg: 666 median: 670 (74%) max: 696 Points
CPU TDP ? TDP 20 W TDP 22 W TDP 24 W TDP 25 W TDP 28 W TDP 30 W TDP 31 W TDP 39 W TDP 40 W TDP 42 W TDP 43 W TDP 44 W TDP 45 W TDP 50 W TDP 54 W TDP 55 W TDP 57 W TDP 60 W TDP 65 W TDP 70 W TDP 85 W TDP 102 W 94% 94% 89% 94% 95% 93% 97% 96% 98% 98% 97% 99% 96% 98% 100% 87% 97% 91% 99% 95% 99% 97% 97%
Cinebench R20 - Cinebench R20 CPU (Multi Core)
min: 3798 avg: 5806 median: 5784 (14%) max: 7409 Points
CPU TDP ? TDP 20 W TDP 22 W TDP 24 W TDP 25 W TDP 28 W TDP 30 W TDP 31 W TDP 39 W TDP 40 W TDP 42 W TDP 43 W TDP 44 W TDP 45 W TDP 50 W TDP 54 W TDP 55 W TDP 57 W TDP 60 W TDP 65 W TDP 70 W TDP 85 W TDP 102 W 65% 64% 58% 62% 73% 70% 82% 70% 75% 74% 84% 65% 81% 82% 92% 70% 76% 92% 100% 93% 98% 96% 95%
Cinebench R15 - Cinebench R15 CPU Multi 64 Bit
min: 1932 avg: 2446 median: 2429.5 (15%) max: 2880 Points
CPU TDP ? TDP 20 W TDP 22 W TDP 24 W TDP 25 W TDP 28 W TDP 30 W TDP 31 W TDP 39 W TDP 40 W TDP 42 W TDP 43 W TDP 44 W TDP 45 W TDP 50 W TDP 55 W TDP 57 W TDP 60 W TDP 65 W TDP 70 W TDP 85 W TDP 102 W 81% 77% 71% 74% 80% 77% 91% 81% 86% 83% 90% 68% 87% 88% 94% 88% 94% 99% 93% 100% 98% 99%
Cinebench R15 - Cinebench R15 CPU Single 64 Bit
min: 99.6 avg: 250.2 median: 255 (74%) max: 268 Points
CPU TDP ? TDP 20 W TDP 22 W TDP 24 W TDP 25 W TDP 28 W TDP 30 W TDP 31 W TDP 39 W TDP 40 W TDP 42 W TDP 43 W TDP 44 W TDP 45 W TDP 50 W TDP 55 W TDP 57 W TDP 60 W TDP 65 W TDP 70 W TDP 85 W TDP 102 W 93% 92% 86% 93% 93% 79% 95% 96% 99% 96% 93% 96% 95% 96% 99% 99% 90% 100% 95% 99% 97% 96%
Cinebench R11.5 - Cinebench R11.5 CPU Multi 64 Bit
min: 29.98 avg: 31.7 median: 31.7 (41%) max: 33.49 Points
CPU TDP 45 W TDP 65 W 90% 100%
Cinebench R11.5 - Cinebench R11.5 CPU Single 64 Bit
min: 3.07 avg: 3.1 median: 3.1 (76%) max: 3.13 Points
CPU TDP 45 W TDP 65 W 98% 100%
Cinebench R10 - Cinebench R10 Rend. Single (32bit)
min: 9828 avg: 9874 median: 9873.5 (60%) max: 9919 Points
CPU TDP 45 W TDP 65 W 100% 99%
Cinebench R10 - Cinebench R10 Rend. Multi (32bit)
min: 56242 avg: 58357 median: 58357 (42%) max: 60472 Points
CPU TDP 45 W TDP 65 W 93% 100%
Cinebench R10 - Cinebench R10 Rend. Multi (64bit)
min: 13726 avg: 54366 median: 54365.5 (38%) max: 95005 Points
CPU TDP 45 W TDP 65 W 14% 100%
Cinebench R10 - Cinebench R10 Rend. Single (64bit)
min: 13938 avg: 48020 median: 48020 (58%) max: 82102 Points
CPU TDP 45 W TDP 65 W 100% 17%
wPrime 2.10 - wPrime 2.0 1024m *
139.6 s (2%)
wPrime 2.10 - wPrime 2.0 32m *
3.5 s (1%)
wPrime 1.55 - wPrime 1.55 1024m *
482 s (2%)
wPrime 1.55 - wPrime 1.55 32m *
3.4 s (2%)
min: 7084 avg: 7404 median: 7403.5 (12%) max: 7723 Points
CPU TDP 45 W TDP 65 W 92% 100%
7-Zip 18.03 - 7-Zip 18.03 Multli Thread 4 runs
min: 41739 avg: 59119 median: 61091 (35%) max: 70254 MIPS
CPU TDP ? TDP 20 W TDP 22 W TDP 24 W TDP 25 W TDP 28 W TDP 30 W TDP 31 W TDP 39 W TDP 40 W TDP 42 W TDP 43 W TDP 44 W TDP 45 W TDP 50 W TDP 54 W TDP 55 W TDP 57 W TDP 60 W TDP 65 W TDP 70 W TDP 85 W TDP 102 W 74% 72% 62% 74% 76% 76% 77% 75% 70% 79% 88% 76% 87% 89% 98% 88% 93% 91% 100% 93% 100% 100% 96%
7-Zip 18.03 - 7-Zip 18.03 Single Thread 4 runs
min: 5037 avg: 5364 median: 5401 (65%) max: 5621 MIPS
CPU TDP ? TDP 20 W TDP 22 W TDP 24 W TDP 25 W TDP 28 W TDP 30 W TDP 31 W TDP 39 W TDP 40 W TDP 42 W TDP 43 W TDP 44 W TDP 45 W TDP 50 W TDP 54 W TDP 55 W TDP 57 W TDP 60 W TDP 65 W TDP 70 W TDP 85 W TDP 102 W 96% 96% 94% 97% 97% 95% 97% 96% 98% 96% 94% 96% 96% 98% 99% 98% 98% 91% 100% 95% 100% 99% 91%
X264 HD Benchmark 4.0 - x264 Pass 2
min: 128.04 avg: 141.1 median: 141.1 (49%) max: 154.15 fps
CPU TDP 45 W TDP 65 W 83% 100%
X264 HD Benchmark 4.0 - x264 Pass 1
min: 282.57 avg: 303.8 median: 303.8 (70%) max: 325 fps
CPU TDP 45 W TDP 65 W 87% 100%
HWBOT x265 Benchmark v2.2 - HWBOT x265 4k Preset
min: 9.93 avg: 16.5 median: 16.7 (29%) max: 21.2 fps
CPU TDP ? TDP 20 W TDP 22 W TDP 24 W TDP 25 W TDP 28 W TDP 30 W TDP 31 W TDP 39 W TDP 40 W TDP 42 W TDP 43 W TDP 44 W TDP 45 W TDP 50 W TDP 54 W TDP 55 W TDP 57 W TDP 60 W TDP 65 W TDP 70 W TDP 85 W TDP 102 W 63% 61% 47% 62% 76% 68% 74% 66% 63% 73% 82% 69% 82% 83% 94% 76% 83% 84% 98% 92% 100% 98% 100%
TrueCrypt - TrueCrypt Serpent
min: 0.944 avg: 1 median: 1 (29%) max: 1 GB/s
CPU TDP 45 W TDP 65 W 94% 100%
TrueCrypt - TrueCrypt Twofish
1.7 GB/s (29%)
CPU TDP 45 W TDP 65 W 100% 100%
TrueCrypt - TrueCrypt AES
min: 10.2 avg: 10.4 median: 10.4 (27%) max: 10.6 GB/s
CPU TDP 45 W TDP 65 W 96% 100%
Blender - Blender 3.3 Classroom CPU *
min: 296 avg: 414.4 median: 382.5 (5%) max: 692 Seconds
CPU TDP ? TDP 20 W TDP 22 W TDP 24 W TDP 25 W TDP 28 W TDP 30 W TDP 31 W TDP 39 W TDP 40 W TDP 42 W TDP 43 W TDP 44 W TDP 45 W TDP 50 W TDP 54 W TDP 55 W TDP 57 W TDP 60 W TDP 65 W TDP 70 W TDP 85 W TDP 102 W 102% 101% 100% 101% 103% 102% 103% 102% 102% 103% 103% 103% 103% 104% 104% 104% 104% 103% 104% 104% 105% 104% 105%
Blender - Blender 2.79 BMW27 CPU *
min: 175 avg: 233 median: 220 (2%) max: 381 Seconds
CPU TDP ? TDP 20 W TDP 22 W TDP 24 W TDP 25 W TDP 28 W TDP 30 W TDP 31 W TDP 39 W TDP 40 W TDP 42 W TDP 43 W TDP 44 W TDP 45 W TDP 50 W TDP 54 W TDP 55 W TDP 57 W TDP 60 W TDP 65 W TDP 70 W TDP 85 W 100% 100% 100% 100% 101% 100% 101% 101% 101% 101% 101% 101% 101% 101% 101% 101% 101% 101% 101% 101% 101% 101%
R Benchmark 2.5 - R Benchmark 2.5 *
min: 0.4457 avg: 0.5 median: 0.5 (10%) max: 0.53 sec
CPU TDP ? TDP 20 W TDP 22 W TDP 24 W TDP 25 W TDP 28 W TDP 30 W TDP 31 W TDP 39 W TDP 40 W TDP 42 W TDP 43 W TDP 44 W TDP 45 W TDP 50 W TDP 54 W TDP 55 W TDP 57 W TDP 60 W TDP 65 W TDP 70 W TDP 85 W TDP 102 W 101% 101% 100% 101% 101% 101% 101% 101% 101% 101% 101% 102% 101% 101% 102% 100% 100% 101% 102% 102% 102% 101% 101%
3DMark 06 - CPU - 3DMark 06 - CPU
min: 13031 avg: 13619 median: 13097 (28%) max: 14729 Points
CPU TDP 45 W TDP 50 W TDP 65 W 44% 100% 89%
Super Pi mod 1.5 XS 1M - Super Pi mod 1.5 XS 1M *
min: 7.046 avg: 7.1 median: 7.1 (2%) max: 7.168 s
CPU TDP 45 W TDP 65 W 100% 100%
Super Pi mod 1.5 XS 2M - Super Pi mod 1.5 XS 2M *
min: 15.767 avg: 16 median: 15.9 (1%) max: 16.125 s
CPU TDP 45 W TDP 65 W 100% 100%
Super Pi Mod 1.5 XS 32M - Super Pi mod 1.5 XS 32M *
min: 394.754 avg: 397.5 median: 397.5 (2%) max: 400.292 s
CPU TDP 45 W TDP 65 W 100% 100%
3DMark Vantage - 3DM Vant. Perf. CPU no Physx
min: 62245 avg: 69514 median: 71676 (63%) max: 74620 Points
CPU TDP 45 W TDP 50 W TDP 65 W 83% 96% 100%
3DMark 11 - 3DM11 Performance Physics
min: 6531 avg: 18400 median: 19779.5 (53%) max: 23779 Points
CPU TDP ? TDP 20 W TDP 24 W TDP 25 W TDP 28 W TDP 30 W TDP 31 W TDP 39 W TDP 40 W TDP 42 W TDP 43 W TDP 44 W TDP 45 W TDP 50 W TDP 55 W TDP 57 W TDP 60 W TDP 65 W TDP 85 W TDP 102 W 74% 35% 48% 65% 61% 79% 69% 93% 75% 84% 73% 71% 86% 97% 91% 96% 93% 91% 99% 100%
3DMark - 3DMark Ice Storm Physics
min: 53255 avg: 72535 median: 74001.5 (60%) max: 85435 Points
CPU TDP ? TDP 28 W TDP 45 W TDP 54 W TDP 55 W TDP 65 W 85% 57% 83% 100% 87% 73%
min: 3209 avg: 4477 median: 4894 (4%) max: 5167 Points
CPU TDP ? TDP 28 W TDP 45 W TDP 54 W TDP 55 W TDP 65 W 18% 57% 83% 100% 87% 73%
3DMark - 3DMark Ice Storm Extreme Physics
66925 Points (54%)
min: 5354 avg: 5357 median: 5357 (4%) max: 5360 Points
3DMark - 3DMark Cloud Gate Physics
min: 7073 avg: 15528 median: 15140 (38%) max: 19549 Points
CPU TDP ? TDP 22 W TDP 25 W TDP 28 W TDP 31 W TDP 39 W TDP 40 W TDP 42 W TDP 44 W TDP 45 W TDP 54 W TDP 55 W TDP 57 W TDP 65 W 85% 36% 63% 68% 71% 84% 71% 93% 79% 82% 76% 96% 100% 100%
3DMark - 3DMark Fire Strike Standard Physics
min: 5249 avg: 22492 median: 23288.5 (42%) max: 28337 Points
CPU TDP ? TDP 20 W TDP 22 W TDP 24 W TDP 25 W TDP 28 W TDP 30 W TDP 31 W TDP 39 W TDP 40 W TDP 42 W TDP 43 W TDP 44 W TDP 45 W TDP 50 W TDP 54 W TDP 55 W TDP 57 W TDP 60 W TDP 65 W TDP 85 W TDP 102 W 72% 55% 46% 60% 84% 71% 19% 75% 93% 86% 88% 83% 91% 88% 99% 81% 95% 97% 87% 93% 100% 98%
3DMark - 3DMark Time Spy CPU
min: 3922 avg: 8827 median: 9437 (40%) max: 12145 Points
CPU TDP ? TDP 20 W TDP 22 W TDP 24 W TDP 25 W TDP 28 W TDP 30 W TDP 31 W TDP 39 W TDP 40 W TDP 42 W TDP 43 W TDP 44 W TDP 45 W TDP 50 W TDP 54 W TDP 55 W TDP 57 W TDP 60 W TDP 65 W TDP 85 W TDP 102 W 64% 45% 44% 44% 77% 56% 65% 67% 87% 84% 76% 70% 86% 80% 89% 75% 85% 92% 87% 87% 87% 100%
Geekbench 6.2 - Geekbench 6.2 Single-Core
min: 1901 avg: 2383 median: 2410 (65%) max: 2473 Points
CPU TDP ? TDP 20 W TDP 22 W TDP 24 W TDP 25 W TDP 28 W TDP 30 W TDP 31 W TDP 32 W TDP 39 W TDP 40 W TDP 42 W TDP 43 W TDP 44 W TDP 45 W TDP 50 W TDP 54 W TDP 55 W TDP 57 W TDP 60 W TDP 65 W TDP 70 W TDP 85 W TDP 102 W 93% 96% 94% 97% 98% 93% 99% 98% 100% 99% 98% 97% 99% 97% 98% 99% 98% 98% 91% 100% 98% 97% 98% 97%
Geekbench 6.2 - Geekbench 6.2 Multi-Core
min: 7732 avg: 12284 median: 12403.5 (49%) max: 13656 Points
CPU TDP ? TDP 20 W TDP 22 W TDP 24 W TDP 25 W TDP 28 W TDP 30 W TDP 31 W TDP 32 W TDP 39 W TDP 40 W TDP 42 W TDP 43 W TDP 44 W TDP 45 W TDP 50 W TDP 54 W TDP 55 W TDP 57 W TDP 60 W TDP 65 W TDP 70 W TDP 85 W TDP 102 W 82% 91% 84% 88% 89% 87% 97% 88% 91% 93% 91% 93% 77% 93% 91% 97% 92% 97% 87% 96% 94% 95% 100% 93%
Geekbench 5.5 - Geekbench 5.1 - 5.5 64 Bit Single-Core
min: 1462 avg: 1757 median: 1764 (70%) max: 1824 Points
CPU TDP ? TDP 20 W TDP 22 W TDP 24 W TDP 25 W TDP 28 W TDP 30 W TDP 31 W TDP 32 W TDP 39 W TDP 40 W TDP 42 W TDP 43 W TDP 44 W TDP 45 W TDP 50 W TDP 54 W TDP 55 W TDP 57 W TDP 60 W TDP 65 W TDP 70 W TDP 85 W TDP 102 W 97% 97% 93% 99% 98% 92% 97% 97% 100% 96% 99% 97% 98% 97% 98% 99% 98% 99% 90% 100% 96% 99% 98% 96%
Geekbench 5.5 - Geekbench 5.1 - 5.5 64 Bit Multi-Core
min: 10017 avg: 12025 median: 12189 (22%) max: 13556 Points
CPU TDP ? TDP 20 W TDP 22 W TDP 24 W TDP 25 W TDP 28 W TDP 30 W TDP 31 W TDP 32 W TDP 39 W TDP 40 W TDP 42 W TDP 43 W TDP 44 W TDP 45 W TDP 50 W TDP 54 W TDP 55 W TDP 57 W TDP 60 W TDP 65 W TDP 70 W TDP 85 W TDP 102 W 83% 86% 79% 83% 85% 85% 95% 84% 88% 94% 88% 90% 74% 90% 90% 96% 85% 93% 90% 97% 95% 96% 100% 91%
Geekbench 5.0 - Geekbench 5.0 64 Bit Single-Core
min: 1636 avg: 1693 median: 1696 (7%) max: 1745 Points
CPU TDP 44 W TDP 45 W TDP 65 W 100% 95% 98%
Geekbench 5.0 - Geekbench 5.0 64 Bit Multi-Core
min: 11112 avg: 11900 median: 12025 (38%) max: 12438 Points
CPU TDP 44 W TDP 45 W TDP 65 W 99% 92% 100%
Geekbench 4.4 - Geekbench 4.1 - 4.4 64 Bit Single-Core
min: 6838 avg: 6899 median: 6927 (69%) max: 6932 Points
CPU TDP 45 W TDP 65 W 99% 100%
Geekbench 4.4 - Geekbench 4.1 - 4.4 64 Bit Multi-Core
min: 39509 avg: 42885 median: 43897 (48%) max: 45250 Points
CPU TDP 45 W TDP 65 W 92% 100%
Geekbench 3 - Geekbench 3 32 Bit Multi-Core
1094 Points (2%)
Geekbench 3 - Geekbench 3 32 Bit Single-Core
327 Points (6%)
Geekbench 2 - 32 Bit - Geekbench Stream
min: 439 avg: 489.9 median: 500 (4%) max: 547 Points
Geekbench 2 - 32 Bit - Geekbench Memory
min: 940 avg: 1187 median: 1218 (11%) max: 1290 Points
Geekbench 2 - 32 Bit - Geekbench Floating Point
min: 1793 avg: 2360 median: 2351 (5%) max: 2731 Points
Geekbench 2 - 32 Bit - Geekbench Integer
min: 1000 avg: 1317 median: 1275 (3%) max: 1591 Points
Geekbench 2 - 32 Bit - Geekbench Total Score
min: 1209 avg: 1573 median: 1557 (4%) max: 1819 Points
Linpack Android / IOS - Linpack Multi Thread
min: 92.3 avg: 133.3 median: 138.1 (5%) max: 151.8 MFLOPS
Linpack Android / IOS - Linpack Single Thread
min: 37.8 avg: 44.2 median: 46.6 (5%) max: 48.71 MFLOPS
Mozilla Kraken 1.1 - Kraken 1.1 Total Score *
min: 416.4 avg: 539 median: 535 (1%) max: 642 ms
CPU TDP ? TDP 20 W TDP 22 W TDP 24 W TDP 25 W TDP 28 W TDP 30 W TDP 31 W TDP 39 W TDP 40 W TDP 42 W TDP 43 W TDP 44 W TDP 45 W TDP 50 W TDP 54 W TDP 55 W TDP 57 W TDP 60 W TDP 65 W TDP 70 W TDP 102 W 100% 100% 100% 100% 100% 100% 100% 100% 100% 100% 100% 100% 100% 100% 100% 100% 100% 100% 100% 100% 100% 100%
26477 ms (31%)
CPU TDP ? TDP 20 W TDP 22 W TDP 24 W TDP 25 W TDP 28 W TDP 30 W TDP 31 W TDP 39 W TDP 40 W TDP 42 W TDP 43 W TDP 44 W TDP 45 W TDP 50 W TDP 54 W TDP 55 W TDP 57 W TDP 60 W TDP 65 W TDP 70 W TDP 102 W 100% 108% 108% 108% 108% 108% 108% 108% 108% 108% 108% 108% 108% 108% 108% 108% 108% 108% 108% 108% 108% 108%
Sunspider - Sunspider 1.0 Total Score *
min: 856 avg: 2197 median: 1610 (18%) max: 4026 ms
Sunspider - Sunspider 0.9.1 Total Score *
min: 1522 avg: 1643 median: 1540 (15%) max: 2080 ms
Octane V2 - Octane V2 Total Score
min: 77142 avg: 88837 median: 89406.5 (79%) max: 97162 Points
CPU TDP ? TDP 20 W TDP 24 W TDP 28 W TDP 30 W TDP 43 W TDP 45 W TDP 50 W TDP 60 W 88% 89% 92% 95% 96% 96% 99% 100% 100%
WebXPRT 4 - WebXPRT 4 Score
min: 234 avg: 254.6 median: 255 (73%) max: 309 Points
CPU TDP ? TDP 20 W TDP 24 W TDP 25 W TDP 28 W TDP 30 W TDP 31 W TDP 39 W TDP 40 W TDP 42 W TDP 43 W TDP 44 W TDP 45 W TDP 50 W TDP 57 W TDP 60 W TDP 65 W TDP 70 W TDP 85 W TDP 102 W 93% 93% 98% 98% 96% 98% 97% 93% 100% 97% 97% 98% 99% 98% 94% 100% 93% 98% 97% 98%
WebXPRT 3 - WebXPRT 3 Score
min: 213 avg: 276.9 median: 278 (58%) max: 299 Points
CPU TDP ? TDP 20 W TDP 22 W TDP 24 W TDP 25 W TDP 28 W TDP 30 W TDP 31 W TDP 39 W TDP 40 W TDP 42 W TDP 43 W TDP 44 W TDP 45 W TDP 50 W TDP 54 W TDP 55 W TDP 57 W TDP 60 W TDP 65 W TDP 70 W TDP 85 W TDP 102 W 91% 89% 92% 96% 100% 88% 96% 98% 91% 96% 94% 94% 99% 94% 96% 96% 95% 90% 98% 94% 97% 96% 100%
Quadrant Standard Edition 2.0 - Quadrant Standard 2.0 Total Score
min: 4404 avg: 4736 median: 4736 (11%) max: 5068 points
AnTuTu v3 - AnTuTu v3 CPU
min: 4820 avg: 5667 median: 5662 (37%) max: 6713 Points
AnTuTu v4 - AnTuTu v4 Total Score
14434 Points (34%)
AndEBench - AndEBench Java
min: 92 avg: 191 median: 191 (6%) max: 290 Iter./s
AndEBench - AndEBench Native
min: 8740 avg: 8897 median: 8897 (29%) max: 9054 Iter./s
PassMark PerformanceTest Mobile V1 - PerformanceTest Mobile V1 CPU Tests
min: 8223 avg: 8737 median: 8678 (1%) max: 9118 Points
CrossMark - CrossMark Overall
min: 1366 avg: 1670 median: 1688.5 (65%) max: 1903 Points
CPU TDP ? TDP 20 W TDP 22 W TDP 24 W TDP 25 W TDP 28 W TDP 30 W TDP 31 W TDP 32 W TDP 39 W TDP 40 W TDP 42 W TDP 43 W TDP 44 W TDP 45 W TDP 50 W TDP 57 W TDP 60 W TDP 65 W TDP 70 W TDP 85 W TDP 102 W 82% 85% 79% 80% 86% 85% 89% 89% 100% 86% 88% 95% 89% 90% 90% 87% 89% 91% 88% 90% 97% 93%
Power Consumption - Prime95 Power Consumption - external Monitor *
min: 37.1 avg: 72.8 median: 71.6 (12%) max: 168 Watt
CPU TDP ? TDP 20 W TDP 22 W TDP 24 W TDP 25 W TDP 28 W TDP 30 W TDP 31 W TDP 40 W TDP 42 W TDP 44 W TDP 45 W TDP 50 W TDP 55 W TDP 57 W TDP 60 W TDP 65 W TDP 85 W TDP 102 W 131% 131% 132% 131% 127% 127% 127% 128% 123% 126% 122% 122% 118% 123% 111% 114% 117% 113% 100%
Power Consumption - Cinebench R15 Multi Power Consumption - external Monitor *
min: 46.9 avg: 91.2 median: 87.9 (16%) max: 160.1 Watt
CPU TDP ? TDP 20 W TDP 24 W TDP 25 W TDP 28 W TDP 30 W TDP 31 W TDP 40 W TDP 44 W TDP 45 W TDP 50 W TDP 57 W TDP 60 W TDP 65 W TDP 85 W TDP 102 W 127% 127% 127% 124% 125% 114% 126% 119% 120% 117% 114% 108% 101% 115% 110% 100%
Power Consumption - Idle Power Consumption - external Monitor *
min: 2.54 avg: 6.5 median: 5.8 (4%) max: 19.6 Watt
CPU TDP ? TDP 20 W TDP 22 W TDP 24 W TDP 25 W TDP 28 W TDP 30 W TDP 31 W TDP 40 W TDP 42 W TDP 44 W TDP 45 W TDP 50 W TDP 55 W TDP 57 W TDP 60 W TDP 65 W TDP 85 W TDP 102 W 101% 104% 105% 103% 104% 102% 103% 106% 103% 103% 105% 103% 100% 104% 102% 103% 100% 103% 102%
Power Consumption - Idle Power Consumption 150cd 1min *
min: 3.51 avg: 10.3 median: 7.8 (9%) max: 90.3 Watt
CPU TDP ? TDP 20 W TDP 22 W TDP 24 W TDP 25 W TDP 28 W TDP 30 W TDP 31 W TDP 40 W TDP 42 W TDP 43 W TDP 44 W TDP 45 W TDP 50 W TDP 55 W TDP 57 W TDP 60 W TDP 85 W TDP 102 W 199% 195% 201% 204% 204% 196% 194% 207% 204% 195% 192% 100% 195% 192% 203% 195% 198% 193% 195%
Power Consumption - Cinebench R15 Multi Power Efficiency - external Monitor
min: 17.7 avg: 31.2 median: 29.1 (22%) max: 64.7 Points per Watt
CPU TDP ? TDP 20 W TDP 24 W TDP 25 W TDP 28 W TDP 30 W TDP 31 W TDP 40 W TDP 44 W TDP 45 W TDP 50 W TDP 57 W TDP 60 W TDP 65 W TDP 85 W TDP 102 W 75% 81% 77% 73% 100% 50% 79% 60% 62% 58% 52% 42% 37% 54% 47% 36%
Average Benchmarks Intel Core Ultra 7 155H → 0% n=0 Average Benchmarks HiSilicon k3v2 Hi3620 → 0% n=0
- Bereich der Benchmarkergebnisse für diese Grafikkarte
- Durchschnittliche Benchmarkergebnisse für diese Grafikkarte
* Smaller numbers mean a higher performance
1 This benchmark is not used for the average calculation
v1.28
log 21. 09:48:56
#0 ran 0s before starting gpusingle class +0s ... 0s
#1 checking url part for id 16906 +0s ... 0s
#2 checking url part for id 18007 +0s ... 0s
#3 checking url part for id 3613 +0s ... 0s
#4 redirected to Ajax server, took 1726904936s time from redirect:0 +0s ... 0s
#5 did not recreate cache, as it is less than 5 days old! Created at Thu, 19 Sep 2024 05:16:12 +0200 +0s ... 0s
#6 composed specs +0.039s ... 0.039s
#7 did output specs +0s ... 0.039s
#8 getting avg benchmarks for device 16906 +0.005s ... 0.043s
#9 got single benchmarks 16906 +0.058s ... 0.102s
#10 getting avg benchmarks for device 18007 +0.001s ... 0.103s
#11 got single benchmarks 18007 +0.004s ... 0.107s
#12 getting avg benchmarks for device 3613 +0.001s ... 0.107s
#13 got single benchmarks 3613 +0.002s ... 0.109s
#14 got avg benchmarks for devices +0s ... 0.109s
#15 min, max, avg, median took s +0.056s ... 0.165s
#16 return log +0s ... 0.165s
Teilen Sie diesen Artikel, um uns zu unterstützen. Jeder Link hilft!
Autor: Klaus Hinum, 8.09.2017 (Update: 1.07.2023)
 Deutsch
 English
 Español
 Français
 Italiano
 Nederlands
 Polski
 Português
 Русский
 Türkçe
 Svenska
 Chinese
 Magyar