Intel UHD Graphics Xe 750 32EUs (Rocket Lake) vs Nvidia RTX A2000 vs Intel UHD Graphics 24EUs (Alder Lake-N)
Intel UHD Graphics Xe 750 32EUs (Rocket Lake) ► remove from comparison
Die Intel UHD Graphics Xe 750 (Rocket-Lake mit 32 EUs) ist eine Prozessorgrafikkarte, welche im März 2021 vorgestellt wurde. Sie basiert auf die neue Xe Architektur (Gen12, wie auch Tiger Lake) und bietet eine deutlich höhere Leistung als die Vorgängergenerationen. Die Leistung ist abhängig von der Taktrate (je nach Prozessormodell) und dem verwendeten Hauptspeicher (da shared Memory). Die Xe 750 ist die stärkere Variante mit 32 EUs = 256 Shadern.
Die Spiele-Leistung ist nur im Einsteigersegment angeordnet und daher nur für geringe Detailstufen in anspruchslosen Spielen geeignet.
Im Unterschied zur Xe Graphics in Tiger-Lake, wird die Xe 750 in Rocket Lake noch im alten 14nm+++ Prozess gefertigt.
Nvidia RTX A2000 ► remove from comparison
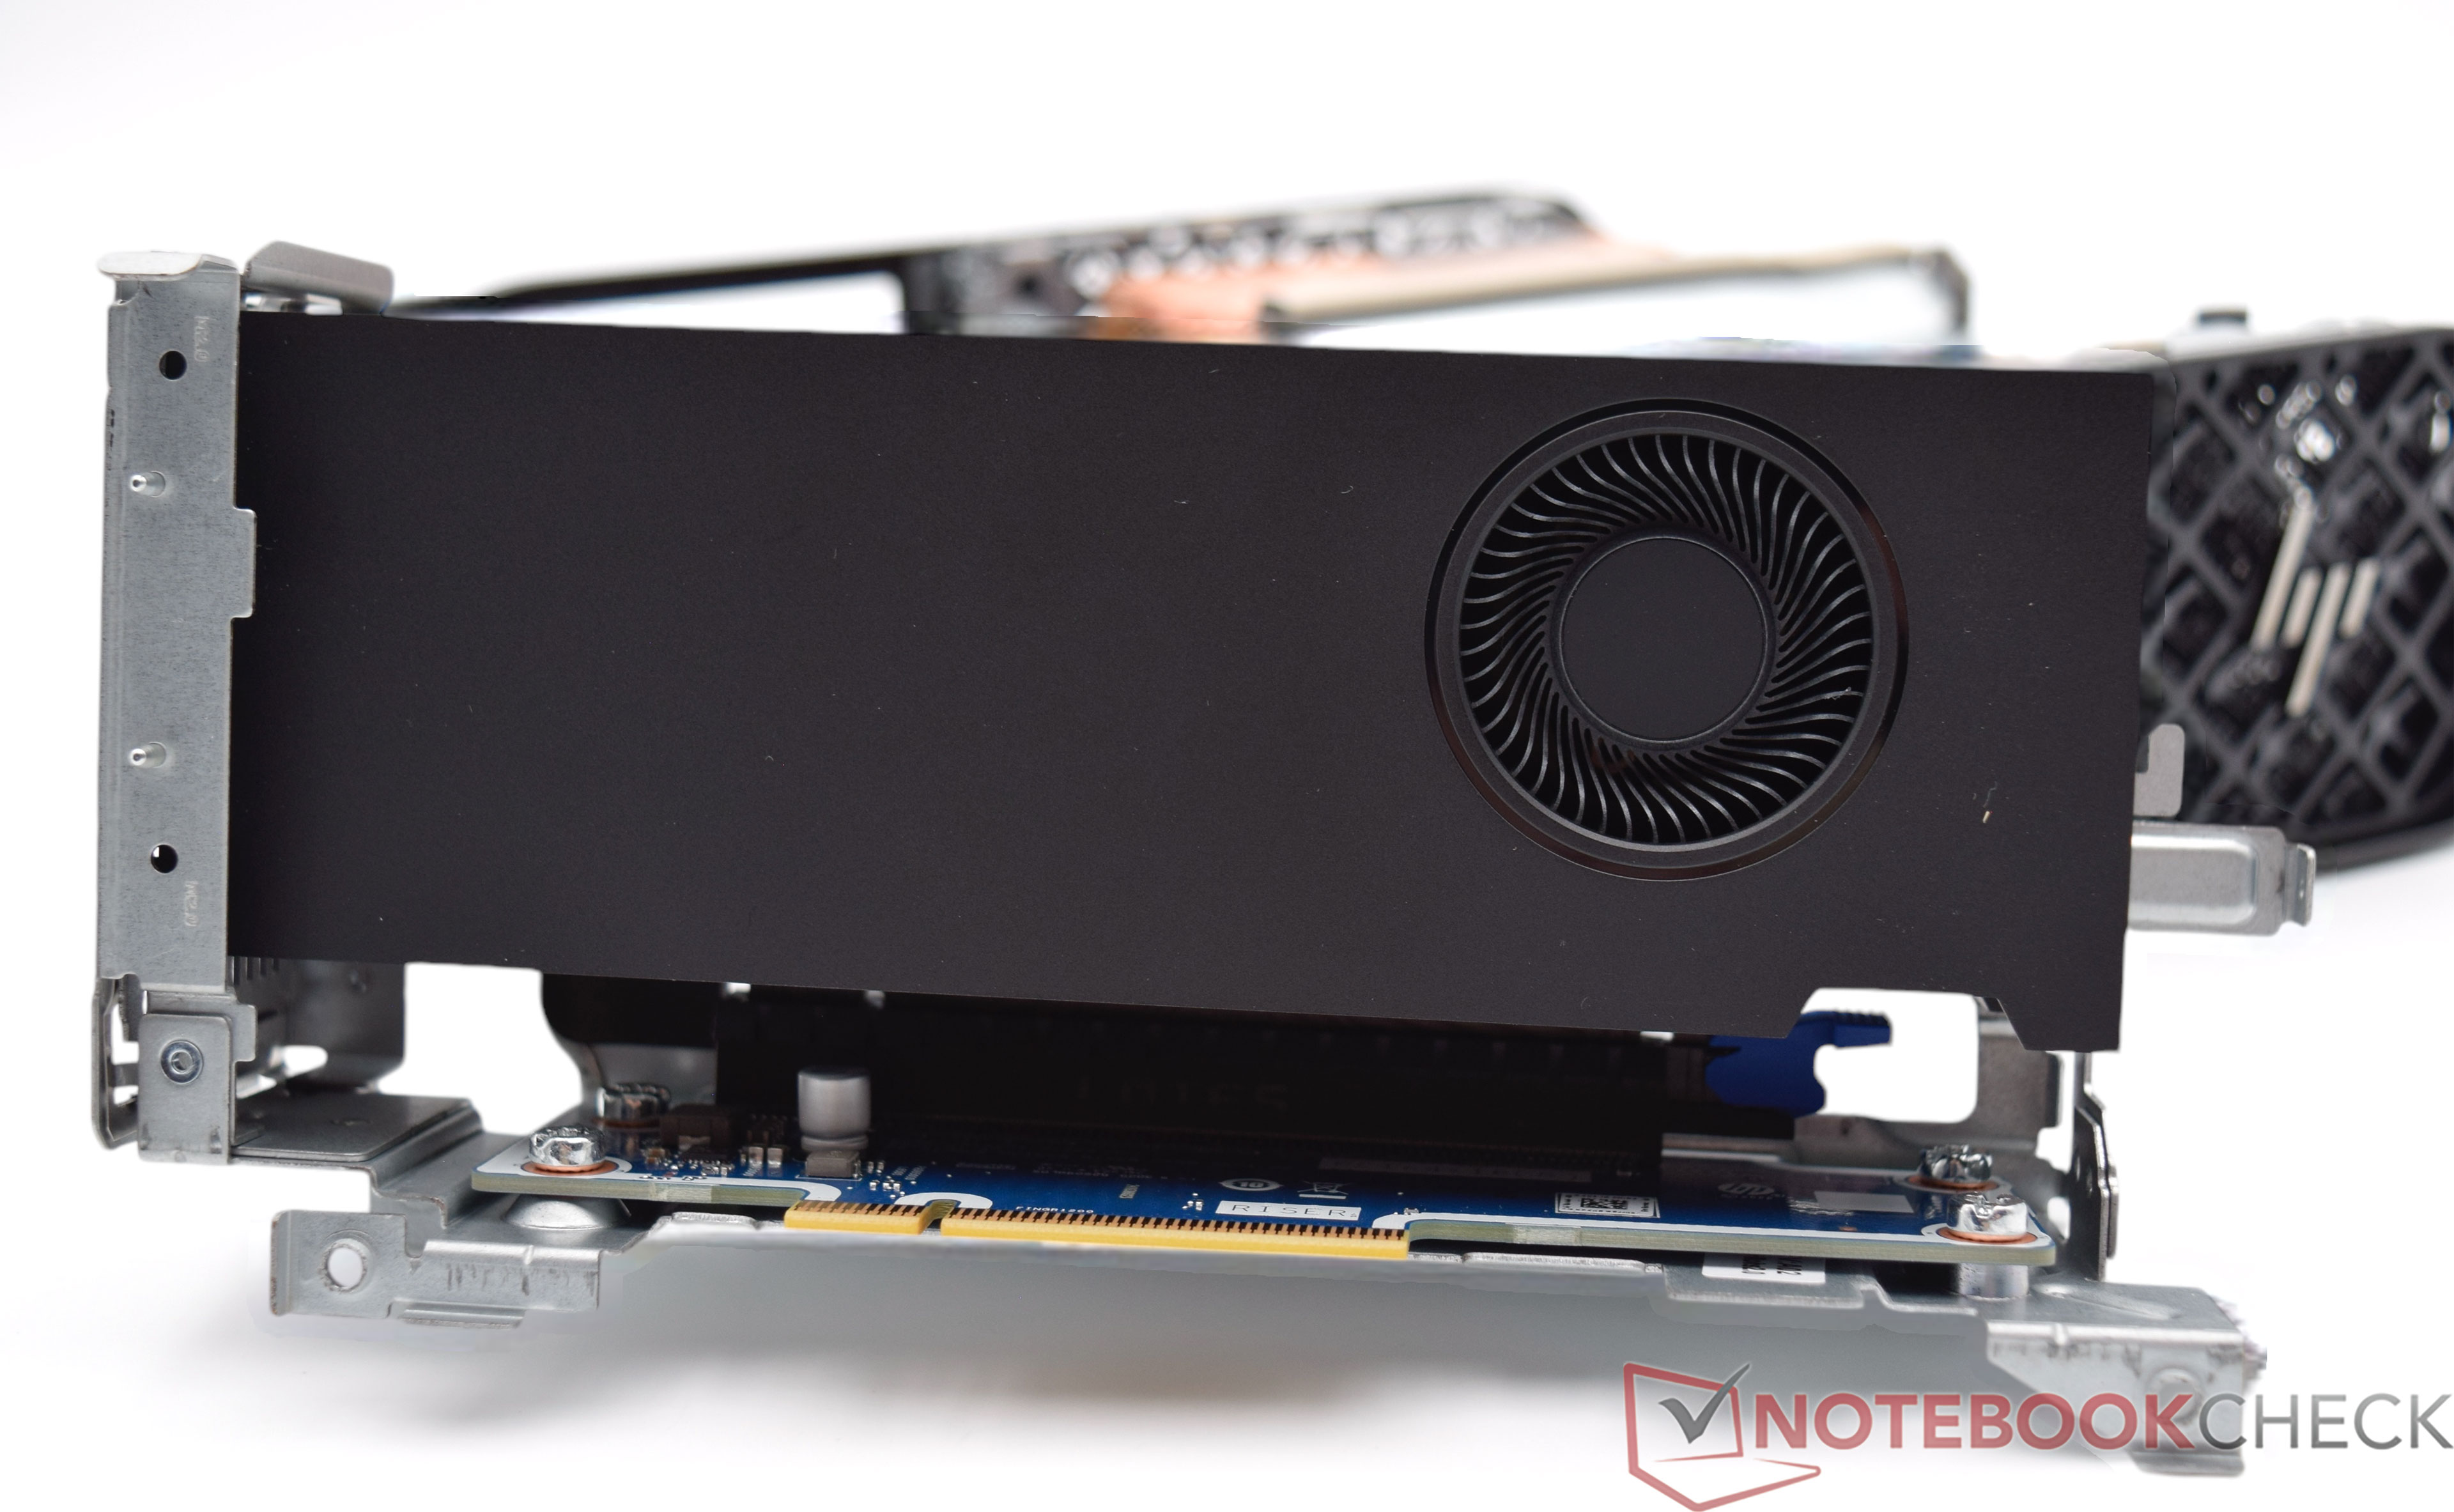
Die Nvidia RTX A2000 Desktop GPU
Die professionellen Grafikkarten von Nvidia bieten zertifizierte Treiber , welche auf Stabiltität und Performance bei professionellen Anwendungen (CAD-, DCC-, Medizin-, Prospektions-, Visualisierungsanwendungen) optimiert sind. Daraus ergeben sich viele Vorteile gegenüber den Consumer-Grafikkarten.
Kompaktes Design und Flexibilität :
Die RTX A2000 ist im Low-Profile-Formfaktor ausgeführt, was sie ideal für kleinere Workstations oder Systeme macht, bei denen Platz eine begrenzte Ressource ist. Trotz ihrer kompakten Größe bietet die Nvidia RTX A2000 eine beachtliche Rechenleistung.
Die Grafikkarte eignet sich hervorragend für 3D-Modelle, CAD-Anwendungen, Videobearbeitung und visuelle Effekte, bei denen hohe Präzision und Geschwindigkeit im Vordergrund stehen. Dank der Kombination aus CUDA-, Tensor- und Raytracing-Kernen bietet die Nvidia RTX A2000 erhebliche Leistungssteigerungen in den Bereichen Echtzeit-Rendering und KI-gestützte Bildverarbeitung.
Energieeffizienz und Leistungsaufnahme:
Mit einer TDP von nur 70 Watt ist die Nvidia RTX A2000 eine der energieeffizientesten Workstation-GPUs auf dem Markt. Diese Effizienz ermöglicht es, in Workflows, die intensive Grafikverarbeitung erfordern, produktiver zu arbeiten, ohne die Systemleistung zu beeinträchtigen oder übermäßig Energie zu benötigen.
Zusammenfassend ist die NVIDIA RTX A2000 eine kompakte, leistungsstarke und energieeffiziente Lösung für professionelle Anwender.
Intel UHD Graphics 24EUs (Alder Lake-N) ► remove from comparison
Die Intel UHD Graphics 24 EUs (Xe-LP, Alder Lake-N, Gen 12.2) ist eine Prozessorgrafikkarte in Alder Lake-N CPU, welche in 2022 vorgestellt wurden. Sie basiert auf die neue Xe Architektur (Gen12) und bietet eine deutlich höhere Leistung als die Vorgängergenerationen. Die Leistung ist abhängig von der Taktrate (je nach Prozessormodell) und dem verwendeten Hauptspeicher (da shared Memory). Die 24 EU-Variante (Execution Units) bietet nur 24 der 32 EUs (192 der 256 Shader).
Durch die geringe CPU-Leistung, fehlenden dedizierten Speicher, single Channel-Spiecherkanal und die geringe Anzahl an Shader, ist die Spieleleistung der UHD Graphics in Alder Lake-N deutlich eingeschränkt. Dadurch sind nur wenige aktuelle Spiele flüssig spielbar.
Die GPU unterstützt maximal drei Displays mit einer maximalen Auflösung von 4096x2160 bei 60Hz.
Intel UHD Graphics Xe 750 32EUs (Rocket Lake) Nvidia RTX A2000 Intel UHD Graphics 24EUs (Alder Lake-N) Gen. 12 / Xe Serie Codename Rocket Lake Xe GA106 Alder Lake Xe Architektur Gen. 12 Quadro Ampere Gen. 12 Pipelines 32 - unified 3328 - unified 24 - unified Kerntakt 350 - 1450 (Boost) MHz 562 - 1200 (Boost) MHz 450 - 750 (Boost) MHz Shared Memory ja nein ja API DirectX 12_1, OpenGL 4.6 DirectX 12 Ultimate (12_2), Shader 6.8, OpenGL 4.6, OpenCL 3.0, Vulkan 1.3 DirectX 12_1, OpenGL 4.6 Herstellungsprozess 14 nm 8 nm 10 nm Features QuickSync 4x DisplayPort 1.4a, PCIe 4.0 x16 QuickSync Erscheinungsdatum 30.03.2021 23.11.2021 03.01.2023 TMUs 104 ROPs 48 Raytracing Cores 26 Tensor / AI Cores 104 Theoretical Performance 7987 TFLOPS FP16, 7987 TFLOPS FP32, 0.1248 TFLOPS FP64 Speichertakt 12000 effective = 1500 MHz Speicherbandbreite 192 Bit Speichertyp GDDR6 Max. Speichergröße 12 GB Memory Bandwidth 288 GB/s Stromverbrauch 70 Watt Transistors 12 Billion Die Size 276 mm² PCIe 4.0 x16 Displays 4 Displays (max.), DisplayPort 1.4a
Benchmarks Performance Rating - 3DMark 11 + Fire Strike + Time Spy - UHD Graphics Xe 750 32EUs
1 pt (3%)
...
Intel UHD Graphics Xe 750 32EUs (Rocket Lake)
...
max:
Performance Rating - 3DMark 11 + Fire Strike + Time Spy - RTX A2000
6.6 pt (20%)
...
...
max:
Performance Rating - 3DMark 11 + Fire Strike + Time Spy - UHD Graphics 24EUs (Alder Lake-N)
0.5 pt (2%)
...
Intel UHD Graphics 24EUs (Alder Lake-N)
...
max:
3DMark - 3DMark Time Spy Score
min: 383 avg: 622 median: 735 (2%) max: 747 Points
6282 Points (18%)
GPU TDP ? TDP 70 W 10% 100%
min: 345 avg: 377.8 median: 364 (1%) max: 538 Points
3DMark - 3DMark Time Spy Graphics
min: 342 avg: 539 median: 634 (2%) max: 642 Points
5675 Points (15%)
GPU TDP ? TDP 70 W 10% 100%
min: 304 avg: 330.8 median: 321 (1%) max: 473 Points
3DMark - 3DMark Ice Storm Unlimited Graphics
50628 Points (5%)
561627 Points (57%)
min: 54707 avg: 57720 median: 55685 (6%) max: 79785 Points
GPU TDP ? TDP 70 W 10% 100%
3DMark - 3DMark Ice Storm Extreme Graphics
min: 25463 avg: 29673 median: 29673 (3%) max: 33883 Points
310737 Points (36%)
GPU TDP ? TDP 70 W 10% 100%
min: 21251 avg: 30932 median: 30479.5 (4%) max: 41235 Points
GPU TDP ? TDP 70 W 10% 100%
3DMark - 3DMark Cloud Gate Score
min: 5545 avg: 10811 median: 12119 (11%) max: 13460 Points
56330 Points (53%)
GPU TDP ? TDP 70 W 19% 100%
min: 6007 avg: 6803 median: 6786 (6%) max: 8596 Points
GPU TDP ? TDP 70 W 14% 100%
3DMark - 3DMark Cloud Gate Graphics
min: 7604 avg: 10689 median: 11315 (3%) max: 12523 Points
94407 Points (23%)
GPU TDP ? TDP 70 W 11% 100%
min: 7218 avg: 8482 median: 8303 (2%) max: 11498 Points
GPU TDP ? TDP 70 W 10% 100%
3DMark - 3DMark Fire Strike Standard Score
min: 1024 avg: 1860 median: 2094 (4%) max: 2227 Points
14566 Points (24%)
GPU TDP ? TDP 70 W 13% 100%
min: 1009 avg: 1140 median: 1129.5 (2%) max: 1512 Points
3DMark - 3DMark Fire Strike Standard Graphics
min: 1144 avg: 1955 median: 2174.5 (2%) max: 2327 Points
14934 Points (17%)
GPU TDP ? TDP 70 W 13% 100%
min: 1080 avg: 1207 median: 1184.5 (1%) max: 1646 Points
3DMark - 3DMark Ice Storm Graphics
min: 35756 avg: 39116 median: 38682.5 (4%) max: 43344 Points
369883 Points (41%)
GPU TDP ? TDP 70 W 11% 100%
min: 22501 avg: 46670 median: 46436.5 (5%) max: 62083 Points
GPU TDP ? TDP 70 W 12% 100%
3DMark - 3DMark Wild Life Unlimited
2660 Points (1%)
3DMark - 3DMark Wild Life Extreme Unlimited
732 Points (1%)
3DMark - 3DMark Night Raid
3692 Points (3%)
48115 Points (45%)
3DMark - 3DMark Night Raid Graphics Score
4435 Points (2%)
68223 Points (26%)
3DMark 11 - 3DM11 Performance Score
min: 1407 avg: 2653 median: 3264 (4%) max: 3289 Points
20964 Points (27%)
GPU TDP ? TDP 70 W 13% 100%
min: 1626 avg: 1761 median: 1716 (2%) max: 2504 Points
3DMark 11 - 3DM11 Performance GPU
min: 1349 avg: 2328 median: 2811 (2%) max: 2824 Points
19978 Points (17%)
GPU TDP ? TDP 70 W 12% 100%
min: 1458 avg: 1542 median: 1489 (1%) max: 2233 Points
3DMark Vantage + Intel UHD Graphics Xe 750 32EUs (Rocket Lake) 3DMark Vantage - 3DM Vant. Perf. total
5134 Points (1%)
3DM Vant. Perf. total + Nvidia RTX A2000
76281 Points (22%)
3DM Vant. Perf. total + Intel UHD Graphics 24EUs (Alder Lake-N)
min: 5527 avg: 6122 median: 5775.5 (2%) max: 8332 Points
3DM Vant. Perf. GPU no PhysX + Intel UHD Graphics Xe 750 32EUs (Rocket Lake) 3DMark Vantage - 3DM Vant. Perf. GPU no PhysX
4452 Points (2%)
3DM Vant. Perf. GPU no PhysX + Nvidia RTX A2000
71338 Points (39%)
3DM Vant. Perf. GPU no PhysX + Intel UHD Graphics 24EUs (Alder Lake-N)
min: 4603 avg: 5188 median: 4957 (3%) max: 7213 Points
3DMark 05 - 3DMark 05 - Standard
8935 Points (10%)
63697 Points (70%)
GPU TDP ? TDP 70 W 14% 100%
min: 12034 avg: 16771 median: 17649 (19%) max: 21014 Points
GPU TDP ? TDP 70 W 25% 100%
3DMark 06 3DMark 06 - Standard 1280x1024 + Intel UHD Graphics Xe 750 32EUs (Rocket Lake)
min: 8090 avg: 14361 median: 17392 (23%) max: 17601 Points
3DMark 06 - Standard 1280x1024 + Nvidia RTX A2000
43178 Points (56%)
GPU TDP ? TDP 70 W 33% 100%
3DMark 06 - Standard 1280x1024 + Intel UHD Graphics 24EUs (Alder Lake-N)
min: 8849 avg: 10419 median: 10057 (13%) max: 13452 Points
GPU TDP ? TDP 70 W 26% 100%
Unigine Valley 1.0 - Unigine Valley 1.0 DX
3.5 fps (1%)
72.1 fps (22%)
min: 4.1 avg: 4.8 median: 4.7 (1%) max: 5.7 fps
Blender - Blender 3.3 Classroom CUDA *
70 Seconds (10%)
Blender - Blender 3.3 Classroom OPTIX *
37 Seconds (14%)
SPECviewperf 12 + Nvidia RTX A2000 SPECviewperf 12 - specvp12 sw-03
135 fps (33%)
specvp12 sw-03 + Intel UHD Graphics 24EUs (Alder Lake-N)
min: 20.9 avg: 21.3 median: 21.1 (5%) max: 22 fps
GPU TDP ? TDP 70 W 16% 100%
specvp12 snx-02 + Nvidia RTX A2000 SPECviewperf 12 - specvp12 snx-02
125 fps (18%)
specvp12 snx-02 + Intel UHD Graphics 24EUs (Alder Lake-N) min: 2 avg: 2.1 median: 2.1 (0%) max: 2.13 fps
specvp12 showcase-01 + Nvidia RTX A2000 SPECviewperf 12 - specvp12 showcase-01
79 fps (17%)
specvp12 showcase-01 + Intel UHD Graphics 24EUs (Alder Lake-N)
min: 5.71 avg: 6 median: 6 (1%) max: 6.19 fps
specvp12 mediacal-01 + Nvidia RTX A2000 SPECviewperf 12 - specvp12 mediacal-01
48 fps (12%)
specvp12 mediacal-01 + Intel UHD Graphics 24EUs (Alder Lake-N)
min: 2.53 avg: 2.7 median: 2.8 (1%) max: 2.83 fps
specvp12 maya-04 + Nvidia RTX A2000 SPECviewperf 12 - specvp12 maya-04
137 fps (37%)
specvp12 maya-04 + Intel UHD Graphics 24EUs (Alder Lake-N)
min: 11.4 avg: 11.6 median: 11.5 (3%) max: 12 fps
specvp12 energy-01 + Nvidia RTX A2000 SPECviewperf 12 - specvp12 energy-01
10.2 fps (9%)
specvp12 energy-01 + Intel UHD Graphics 24EUs (Alder Lake-N) min: 0.15 avg: 0.2 median: 0.2 (0%) max: 0.18 fps
specvp12 creo-01 + Nvidia RTX A2000 SPECviewperf 12 - specvp12 creo-01
117 fps (47%)
specvp12 creo-01 + Intel UHD Graphics 24EUs (Alder Lake-N)
min: 8.48 avg: 8.6 median: 8.5 (3%) max: 8.69 fps
specvp12 catia-04 + Nvidia RTX A2000 SPECviewperf 12 - specvp12 catia-04
129 fps (21%)
specvp12 catia-04 + Intel UHD Graphics 24EUs (Alder Lake-N)
min: 10.9 avg: 11 median: 10.9 (2%) max: 11.3 fps
specvp12 3dsmax-05 + Nvidia RTX A2000 SPECviewperf 12 - specvp12 3dsmax-05
162 fps (28%)
specvp12 3dsmax-05 + Intel UHD Graphics 24EUs (Alder Lake-N)
min: 13.6 avg: 14.1 median: 13.8 (2%) max: 14.9 fps
SPECviewperf 13 specvp13 sw-04 + Nvidia RTX A2000 SPECviewperf 13 - specvp13 sw-04
138 fps (37%)
specvp13 sw-04 + Intel UHD Graphics 24EUs (Alder Lake-N)
min: 27.4 avg: 27.7 median: 27.7 (7%) max: 28.1 fps
GPU TDP ? TDP 70 W 20% 100%
specvp13 snx-03 + Nvidia RTX A2000 SPECviewperf 13 - specvp13 snx-03
239 fps (27%)
specvp13 snx-03 + Intel UHD Graphics 24EUs (Alder Lake-N) min: 3.6 avg: 3.7 median: 3.8 (0%) max: 3.84 fps
specvp13 showcase-02 + Nvidia RTX A2000 SPECviewperf 13 - specvp13 showcase-02
79.2 fps (17%)
specvp13 showcase-02 + Intel UHD Graphics 24EUs (Alder Lake-N)
min: 5.69 avg: 6 median: 6 (1%) max: 6.17 fps
specvp13 medical-02 + Nvidia RTX A2000 SPECviewperf 13 - specvp13 medical-02
119 fps (25%)
specvp13 medical-02 + Intel UHD Graphics 24EUs (Alder Lake-N)
min: 2.28 avg: 2.6 median: 2.8 (1%) max: 2.84 fps
specvp13 maya-05 + Nvidia RTX A2000 SPECviewperf 13 - specvp13 maya-05
221 fps (25%)
specvp13 maya-05 + Intel UHD Graphics 24EUs (Alder Lake-N)
min: 15.9 avg: 16.4 median: 16.3 (2%) max: 17 fps
specvp13 energy-02 + Nvidia RTX A2000 SPECviewperf 13 - specvp13 energy-02
32.9 fps (11%)
specvp13 energy-02 + Intel UHD Graphics 24EUs (Alder Lake-N) 310 fps (100%)
GPU TDP ? TDP 70 W 100% 11%
specvp13 creo-02 + Nvidia RTX A2000 SPECviewperf 13 - specvp13 creo-02
217 fps (32%)
specvp13 creo-02 + Intel UHD Graphics 24EUs (Alder Lake-N)
min: 11.6 avg: 11.7 median: 11.7 (2%) max: 11.8 fps
specvp13 3dsmax-06 + Nvidia RTX A2000 SPECviewperf 13 - specvp13 3dsmax-06
162 fps (28%)
specvp13 3dsmax-06 + Intel UHD Graphics 24EUs (Alder Lake-N)
min: 13.4 avg: 14 median: 13.7 (2%) max: 14.8 fps
specvp13 catia-05 + Intel UHD Graphics 24EUs (Alder Lake-N) SPECviewperf 13 - specvp13 catia-05
min: 15.6 avg: 15.9 median: 15.8 (2%) max: 16.2 fps
SPECviewperf 2020 specvp2020 medical-03 1080p + Nvidia RTX A2000 SPECviewperf 2020 - specvp2020 medical-03 1080p
68.8 fps (45%)
specvp2020 maya-06 1080p + Nvidia RTX A2000 SPECviewperf 2020 - specvp2020 maya-06 1080p
271 fps (30%)
specvp2020 energy-03 1080p + Nvidia RTX A2000 SPECviewperf 2020 - specvp2020 energy-03 1080p
33.6 fps (22%)
specvp2020 creo-03 1080p + Nvidia RTX A2000 SPECviewperf 2020 - specvp2020 creo-03 1080p
112 fps (55%)
specvp2020 catia-06 1080p + Nvidia RTX A2000 SPECviewperf 2020 - specvp2020 catia-06 1080p
64 fps (39%)
specvp2020 3dsmax-07 1080p + Nvidia RTX A2000 SPECviewperf 2020 - specvp2020 3dsmax-07 1080p
79.1 fps (25%)
specvp2020 snx-04 4k + Nvidia RTX A2000 SPECviewperf 2020 - specvp2020 snx-04 4k
159 fps (16%)
specvp2020 medical-03 4k + Nvidia RTX A2000 SPECviewperf 2020 - specvp2020 medical-03 4k
24.2 fps (23%)
specvp2020 maya-06 4k + Nvidia RTX A2000 SPECviewperf 2020 - specvp2020 maya-06 4k
126 fps (21%)
specvp2020 energy-03 4k + Nvidia RTX A2000 SPECviewperf 2020 - specvp2020 energy-03 4k
15.8 fps (2%)
specvp2020 creo-03 4k + Nvidia RTX A2000 SPECviewperf 2020 - specvp2020 creo-03 4k
75.1 fps (36%)
specvp2020 catia-06 4k + Nvidia RTX A2000 SPECviewperf 2020 - specvp2020 catia-06 4k
38.8 fps (25%)
specvp2020 3dsmax-07 4k + Nvidia RTX A2000 SPECviewperf 2020 - specvp2020 3dsmax-07 4k
49.8 fps (21%)
Cinebench R10 Cinebench R10 Shading (32bit) + Intel UHD Graphics Xe 750 32EUs (Rocket Lake) Cinebench R10 - Cinebench R10 Shading (32bit)
6088 Points (4%)
Cinebench R10 Shading (32bit) + Nvidia RTX A2000
6827 Points (5%)
GPU TDP ? TDP 70 W 89% 100%
Cinebench R10 Shading (32bit) + Intel UHD Graphics 24EUs (Alder Lake-N)
min: 7035 avg: 8399 median: 8492.5 (6%) max: 10013 Points
GPU TDP ? TDP 70 W 100% 83%
Cinebench R11.5 Cinebench R11.5 OpenGL 64 Bit + Intel UHD Graphics Xe 750 32EUs (Rocket Lake) Cinebench R11.5 - Cinebench R11.5 OpenGL 64 Bit
min: 22.96 avg: 25.5 median: 25.5 (8%) max: 28.12 fps
Cinebench R11.5 OpenGL 64 Bit + Nvidia RTX A2000 303.9 fps (100%)
Cinebench R11.5 OpenGL 64 Bit + Intel UHD Graphics 24EUs (Alder Lake-N)
min: 33.23 avg: 38.1 median: 36.8 (12%) max: 49.39 fps
GPU TDP ? TDP 70 W 12% 100%
Cinebench R15 + Intel UHD Graphics Xe 750 32EUs (Rocket Lake) Cinebench R15 - Cinebench R15 OpenGL 64 Bit
min: 27.38 avg: 29.8 median: 28 (2%) max: 34.1 fps
Cinebench R15 OpenGL 64 Bit + Nvidia RTX A2000
371.8 fps (22%)
Cinebench R15 OpenGL 64 Bit + Intel UHD Graphics 24EUs (Alder Lake-N)
min: 34.3 avg: 40.5 median: 39.7 (2%) max: 56.41 fps
GPU TDP ? TDP 70 W 10% 100%
Cinebench R15 OpenGL Ref. Match 64 Bit + Intel UHD Graphics Xe 750 32EUs (Rocket Lake) Cinebench R15 - Cinebench R15 OpenGL Ref. Match 64 Bit
97.8 % (98%)
Cinebench R15 OpenGL Ref. Match 64 Bit + Nvidia RTX A2000
99.6 % (100%)
GPU TDP ? TDP 70 W 98% 100%
Cinebench R15 OpenGL Ref. Match 64 Bit + Intel UHD Graphics 24EUs (Alder Lake-N)
97.8 % (98%)
GPU TDP ? TDP 70 W 98% 100%
Basemark GPU 1.2 - Basemark GPU 1.2 Vulkan Official Medium Offscreen 1080
31.7 fps (0%)
667 fps (4%)
min: 46.4 avg: 106.6 median: 54.6 (0%) max: 315 fps
GPU TDP ? TDP 70 W 15% 100%
Basemark GPU 1.2 - Basemark GPU 1.2 Vulkan Official High Offscreen 2160
3 fps (1%)
61.5 fps (14%)
min: 3.64 avg: 5.6 median: 3.9 (1%) max: 15.3 fps
Geekbench 6.3 - Geekbench 6.3 GPU OpenCL
2902 Points (1%)
72935 Points (21%)
min: 3010 avg: 3420 median: 3321 (1%) max: 5145 Points
Geekbench 6.3 - Geekbench 6.3 GPU Vulkan
3872 Points (1%)
72741 Points (20%)
min: 3443 avg: 3899 median: 3800 (1%) max: 5822 Points
LuxMark v2.0 64Bit - LuxMark v2.0 Room GPU
min: 129 avg: 336 median: 336 (1%) max: 543 Samples/s
3120 Samples/s (11%)
GPU TDP ? TDP 70 W 11% 100%
min: 222 avg: 313.8 median: 254 (1%) max: 760 Samples/s
GPU TDP ? TDP 70 W 10% 100%
LuxMark v2.0 64Bit - LuxMark v2.0 Sala GPU
min: 369 avg: 742 median: 742 (1%) max: 1115 Samples/s
6758 Samples/s (12%)
GPU TDP ? TDP 70 W 11% 100%
min: 473 avg: 653 median: 524.5 (1%) max: 1386 Samples/s
GPU TDP ? TDP 70 W 10% 100%
ComputeMark v2.1 - ComputeMark v2.1 Result
min: 700 avg: 1024 median: 1024 (1%) max: 1348 Points
15520 Points (17%)
min: 628 avg: 679 median: 655.5 (1%) max: 911 Points
Power Consumption - Furmark Stress Test Power Consumption - external Monitor *
min: 14.2 avg: 44.8 median: 56.9 (8%) max: 63.4 Watt
119.2 Watt (17%)
GPU TDP ? TDP 70 W 113% 100%
min: 9.49 avg: 16.6 median: 15.6 (2%) max: 27.5 Watt
GPU TDP ? TDP 70 W 117% 100%
Power Consumption - The Witcher 3 Power Consumption - external Monitor *
min: 70 avg: 86.4 median: 92.9 (13%) max: 96.2 Watt
min: 21.5 avg: 26.4 median: 26.5 (4%) max: 31.1 Watt
Power Consumption - Witcher 3 Power Consumption *
min: 12.4 avg: 17 median: 17 (4%) max: 21.5 Watt
Power Consumption - Witcher 3 ultra Power Efficiency
0.3 fps per Watt (28%)
Power Consumption - Cyberpunk 2077 Power Consumption - external Monitor *
244 Watt (31%)
Power Consumption - Cyberpunk 2077 ultra Power Efficiency
0.2 fps per Watt (25%)
Emissions Witcher 3 Fan Noise + Intel UHD Graphics 24EUs (Alder Lake-N) Emissions - Witcher 3 Fan Noise
33 dB(A) (53%)
Average Benchmarks Intel UHD Graphics Xe 750 32EUs (Rocket Lake) → 100% n=27 Average Benchmarks Nvidia RTX A2000 → 1099% n=27 Average Benchmarks Intel UHD Graphics 24EUs (Alder Lake-N) → 98% n=27
- Bereich der Benchmarkergebnisse für diese Grafikkarte
- Durchschnittliche Benchmarkergebnisse für diese Grafikkarte
* Smaller numbers mean a higher performance
1 This benchmark is not used for the average calculation
Spiele-Benchmarks Die folgenden Benchmarks basieren auf unseren Spieletests mit Testnotebooks. Die Performance dieser Grafikkarte bei den gelisteten Spielen ist abhängig von der verwendeten CPU, Speicherausstattung, Treiber und auch Betriebssystem. Dadurch müssen die untenstehenden Werte nicht repräsentativ sein. Detaillierte Informationen über das verwendete System sehen Sie nach einem Klick auf den fps-Wert.
100%
UHD Graphics Xe 750 32EUs:
8 [X] MSI GE76 Raider 11UH-472US Intel Core i9-11980HK 3.3GHz
UHD Graphics Xe 750 32EUs
P1:
6 fps
fps
100%
UHD Graphics Xe 750 32EUs:
5 [X] MSI GE76 Raider 11UH-472US Intel Core i9-11980HK 3.3GHz
UHD Graphics Xe 750 32EUs
min:
4 fps, max:
6 fps
fps
100%
UHD Graphics Xe 750 32EUs:
4 [X] MSI GE76 Raider 11UH-472US Intel Core i9-11980HK 3.3GHz
UHD Graphics Xe 750 32EUs
min:
3 fps, max:
5 fps
fps
100%
UHD Graphics Xe 750 32EUs:
3 [X] MSI GE76 Raider 11UH-472US Intel Core i9-11980HK 3.3GHz
UHD Graphics Xe 750 32EUs
min:
2 fps, max:
3 fps
fps
RTX A2000:
49.7 [X] HP Z2 Mini G9-996Q4ET Intel Core i7-14700K 2.5GHz
RTX A2000
min:
11.4 fps, P0.1:
38.4 fps, P1:
40.9 fps, max:
130.7 fps
fps
RTX A2000:
18.6 [X] HP Z2 Mini G9-996Q4ET Intel Core i7-14700K 2.5GHz
RTX A2000
min:
8.27 fps, P0.1:
15.3 fps, P1:
16.3 fps, max:
105.1 fps
fps
UHD Graphics 24EUs (Alder Lake-N):
6.1 [X] Acemagic S1 2.11
Intel Processor N97 GHz
UHD Graphics 24EUs (Alder Lake-N)
min:
4.62 fps, max:
7.72 fps
fps
UHD Graphics 24EUs (Alder Lake-N):
4.7 [X] Acemagic S1 2.11
Intel Processor N97 GHz
UHD Graphics 24EUs (Alder Lake-N)
min:
3.75 fps, max:
5.57 fps
fps
UHD Graphics 24EUs (Alder Lake-N):
4 [X] Acemagic S1 2.11
Intel Processor N97 GHz
UHD Graphics 24EUs (Alder Lake-N)
min:
3.31 fps, max:
4.85 fps
fps
RTX A2000:
74.9 [X] HP Z2 Mini G9-996Q4ET Intel Core i7-14700K 2.5GHz
RTX A2000
min:
57.5 fps, P0.1:
58.6 fps, P1:
62.8 fps, max:
113.2 fps
fps
100%
UHD Graphics Xe 750 32EUs:
21.1 [X] Asus ROG Maximus XIII Hero, Intel Xe 750 918016
Intel Core i9-11900K 3.5GHz
UHD Graphics Xe 750 32EUs
min:
18 fps, P1:
18 fps, max:
24 fps
fps
100%
UHD Graphics Xe 750 32EUs:
18.8 [X] Asus ROG Maximus XIII Hero, Intel Xe 750 918016
Intel Core i9-11900K 3.5GHz
UHD Graphics Xe 750 32EUs
min:
16 fps, P1:
16 fps, max:
21 fps
fps
UHD Graphics 24EUs (Alder Lake-N):
5.2 [X] Trigkey G4 Intel Processor N100 1GHz
UHD Graphics 24EUs (Alder Lake-N)
6.6 [X] Acemagic S1 Intel Processor N95 GHz
UHD Graphics 24EUs (Alder Lake-N)
7 8.5 [X] Acemagic S1 Intel Processor N97 GHz
UHD Graphics 24EUs (Alder Lake-N)
10.2 [X] Acemagic S1 Intel Processor N97 GHz
UHD Graphics 24EUs (Alder Lake-N)
~ 7 fps
UHD Graphics 24EUs (Alder Lake-N):
3.9 [X] Trigkey G4 Intel Processor N100 1GHz
UHD Graphics 24EUs (Alder Lake-N)
5.3 [X] Acemagic S1 Intel Processor N95 GHz
UHD Graphics 24EUs (Alder Lake-N)
5.5 7.9 [X] Acemagic S1 Intel Processor N97 GHz
UHD Graphics 24EUs (Alder Lake-N)
~ 6 fps
UHD Graphics 24EUs (Alder Lake-N):
3.2 [X] Acemagic S1 Intel Processor N95 GHz
UHD Graphics 24EUs (Alder Lake-N)
3.3 [X] Trigkey G4 Intel Processor N100 1GHz
UHD Graphics 24EUs (Alder Lake-N)
3.4 4.9 [X] Acemagic S1 Intel Processor N97 GHz
UHD Graphics 24EUs (Alder Lake-N)
~ 4 fps
UHD Graphics 24EUs (Alder Lake-N):
1.8 [X] Trigkey G4 Intel Processor N100 1GHz
UHD Graphics 24EUs (Alder Lake-N)
fps
UHD Graphics 24EUs (Alder Lake-N):
17.7 [X] BOSGAME N95 800660
Intel Processor N95 GHz
UHD Graphics 24EUs (Alder Lake-N)
min:
6.73 fps, max:
36.1 fps
fps
UHD Graphics 24EUs (Alder Lake-N):
13.6 [X] BOSGAME N95 800660
Intel Processor N95 GHz
UHD Graphics 24EUs (Alder Lake-N)
min:
4.64 fps, max:
51.9 fps
fps
UHD Graphics 24EUs (Alder Lake-N):
9.5 [X] BOSGAME N95 800660
Intel Processor N95 GHz
UHD Graphics 24EUs (Alder Lake-N)
min:
2.41 fps, max:
79.3 fps
fps
100%
UHD Graphics Xe 750 32EUs:
12.9 (!) [X] Asus ROG Maximus XIII Hero, Intel Xe 750 Intel Core i9-11900K 3.5GHz
UHD Graphics Xe 750 32EUs
min:
7.82 fps, P0.1:
7.9 fps, P1:
8.9 fps, max:
26.4 fps
fps
RTX A2000:
57.4 [X] HP Z2 Mini G9-996Q4ET Intel Core i7-14700K 2.5GHz
RTX A2000
min:
43.4 fps, P0.1:
47.2 fps, P1:
51.2 fps, max:
100.8 fps
fps
UHD Graphics 24EUs (Alder Lake-N):
29.8 [X] BOSGAME N95 874931
Intel Processor N95 GHz
UHD Graphics 24EUs (Alder Lake-N)
min:
24 fps, P1:
23 fps, max:
34 fps
30.6 [X] Blackview MP80 874931
Intel Processor N95 GHz
UHD Graphics 24EUs (Alder Lake-N)
min:
24 fps, P1:
24 fps, max:
36 fps
~ 30 fps
UHD Graphics 24EUs (Alder Lake-N):
12.4 [X] Blackview MP80 874931
Intel Processor N95 GHz
UHD Graphics 24EUs (Alder Lake-N)
min:
10 fps, P1:
10 fps, max:
13 fps
fps
UHD Graphics 24EUs (Alder Lake-N):
9.9 [X] Blackview MP80 874931
Intel Processor N95 GHz
UHD Graphics 24EUs (Alder Lake-N)
min:
8 fps, P1:
8 fps, max:
11 fps
fps
UHD Graphics 24EUs (Alder Lake-N):
6.3 [X] Blackview MP80 874931
Intel Processor N95 GHz
UHD Graphics 24EUs (Alder Lake-N)
min:
5 fps, P1:
5 fps, max:
7 fps
fps
UHD Graphics 24EUs (Alder Lake-N):
25.4 [X] BOSGAME N95 759689
Intel Processor N95 GHz
UHD Graphics 24EUs (Alder Lake-N)
min:
21 fps, max:
30 fps
25.7 [X] Blackview MP80 759689
Intel Processor N95 GHz
UHD Graphics 24EUs (Alder Lake-N)
min:
22 fps, max:
30 fps
~ 26 fps
UHD Graphics 24EUs (Alder Lake-N):
11.2 [X] Blackview MP80 759689
Intel Processor N95 GHz
UHD Graphics 24EUs (Alder Lake-N)
min:
9 fps, max:
12 fps
11.3 [X] BOSGAME N95 759689
Intel Processor N95 GHz
UHD Graphics 24EUs (Alder Lake-N)
min:
9 fps, max:
12 fps
~ 11 fps
UHD Graphics 24EUs (Alder Lake-N):
8.1 [X] Blackview MP80 759689
Intel Processor N95 GHz
UHD Graphics 24EUs (Alder Lake-N)
min:
6 fps, max:
9 fps
8.1 [X] BOSGAME N95 759689
Intel Processor N95 GHz
UHD Graphics 24EUs (Alder Lake-N)
min:
6 fps, max:
9 fps
~ 8 fps
100%
UHD Graphics Xe 750 32EUs:
198.3 [X] Asus ROG Maximus XIII Hero, Intel Xe 750 Intel Core i9-11900K 3.5GHz
UHD Graphics Xe 750 32EUs
min:
5.35 fps, P0.1:
75.2 fps, P1:
112.9 fps, max:
501 fps
fps
100%
UHD Graphics Xe 750 32EUs:
64.1 [X] Asus ROG Maximus XIII Hero, Intel Xe 750 Intel Core i9-11900K 3.5GHz
UHD Graphics Xe 750 32EUs
min:
5.06 fps, P0.1:
43.2 fps, P1:
48.2 fps, max:
163 fps
fps
100%
UHD Graphics Xe 750 32EUs:
50.8 [X] Asus ROG Maximus XIII Hero, Intel Xe 750 Intel Core i9-11900K 3.5GHz
UHD Graphics Xe 750 32EUs
min:
21.1 fps, P0.1:
37.3 fps, P1:
39 fps, max:
95.6 fps
fps
100%
UHD Graphics Xe 750 32EUs:
36.1 [X] Asus ROG Maximus XIII Hero, Intel Xe 750 Intel Core i9-11900K 3.5GHz
UHD Graphics Xe 750 32EUs
min:
27.9 fps, P0.1:
28.2 fps, P1:
28.9 fps, max:
46.8 fps
fps
UHD Graphics 24EUs (Alder Lake-N):
12 [X] Acemagic S1 Intel Processor N95 GHz
UHD Graphics 24EUs (Alder Lake-N)
13.6 [X] Trigkey G4 Intel Processor N100 1GHz
UHD Graphics 24EUs (Alder Lake-N)
13.7 19.8 [X] Acemagic S1 Intel Processor N97 GHz
UHD Graphics 24EUs (Alder Lake-N)
~ 15 fps
UHD Graphics 24EUs (Alder Lake-N):
5.2 [X] Acemagic S1 Intel Processor N95 GHz
UHD Graphics 24EUs (Alder Lake-N)
5.8 [X] Trigkey G4 Intel Processor N100 1GHz
UHD Graphics 24EUs (Alder Lake-N)
5.9 8.3 [X] Acemagic S1 Intel Processor N97 GHz
UHD Graphics 24EUs (Alder Lake-N)
~ 6 fps
UHD Graphics 24EUs (Alder Lake-N):
2.9 [X] Acemagic S1 Intel Processor N95 GHz
UHD Graphics 24EUs (Alder Lake-N)
3.4 [X] Trigkey G4 Intel Processor N100 1GHz
UHD Graphics 24EUs (Alder Lake-N)
3.4 4.9 [X] Acemagic S1 Intel Processor N97 GHz
UHD Graphics 24EUs (Alder Lake-N)
~ 4 fps
UHD Graphics 24EUs (Alder Lake-N):
2.1 [X] Acemagic S1 Intel Processor N95 GHz
UHD Graphics 24EUs (Alder Lake-N)
2.4 [X] Trigkey G4 Intel Processor N100 1GHz
UHD Graphics 24EUs (Alder Lake-N)
2.4 3.6 [X] Acemagic S1 Intel Processor N97 GHz
UHD Graphics 24EUs (Alder Lake-N)
~ 3 fps
UHD Graphics 24EUs (Alder Lake-N):
14 [X] BOSGAME N95 Intel Processor N95 GHz
UHD Graphics 24EUs (Alder Lake-N)
min:
10 fps, max:
17 fps
14 [X] Acemagic S1 Intel Processor N95 GHz
UHD Graphics 24EUs (Alder Lake-N)
min:
10 fps, max:
17 fps
14 [X] Trigkey G4 Intel Processor N100 1GHz
UHD Graphics 24EUs (Alder Lake-N)
min:
9 fps, max:
17 fps
14 [X] Geekom MiniAir 12 Intel Processor N100 1GHz
UHD Graphics 24EUs (Alder Lake-N)
min:
9 fps, max:
18 fps
15 [X] Blackview MP80 Intel Processor N95 GHz
UHD Graphics 24EUs (Alder Lake-N)
min:
10 fps, max:
18 fps
19 [X] Acemagic S1 Intel Processor N97 GHz
UHD Graphics 24EUs (Alder Lake-N)
min:
13 fps, max:
24 fps
~ 15 fps
UHD Graphics 24EUs (Alder Lake-N):
7 [X] BOSGAME N95 Intel Processor N95 GHz
UHD Graphics 24EUs (Alder Lake-N)
min:
5 fps, max:
8 fps
7 [X] Blackview MP80 Intel Processor N95 GHz
UHD Graphics 24EUs (Alder Lake-N)
min:
5 fps, max:
9 fps
7 [X] Acemagic S1 Intel Processor N95 GHz
UHD Graphics 24EUs (Alder Lake-N)
min:
5 fps, max:
8 fps
7 [X] Trigkey G4 Intel Processor N100 1GHz
UHD Graphics 24EUs (Alder Lake-N)
min:
5 fps, max:
9 fps
7 [X] Geekom MiniAir 12 Intel Processor N100 1GHz
UHD Graphics 24EUs (Alder Lake-N)
min:
5 fps, max:
9 fps
10 [X] Acemagic S1 Intel Processor N97 GHz
UHD Graphics 24EUs (Alder Lake-N)
min:
7 fps, max:
12 fps
~ 8 fps
UHD Graphics 24EUs (Alder Lake-N):
6 [X] BOSGAME N95 Intel Processor N95 GHz
UHD Graphics 24EUs (Alder Lake-N)
min:
5 fps, max:
8 fps
6 [X] Blackview MP80 Intel Processor N95 GHz
UHD Graphics 24EUs (Alder Lake-N)
min:
5 fps, max:
8 fps
6 [X] Acemagic S1 Intel Processor N95 GHz
UHD Graphics 24EUs (Alder Lake-N)
min:
5 fps, max:
8 fps
6 [X] Trigkey G4 Intel Processor N100 1GHz
UHD Graphics 24EUs (Alder Lake-N)
min:
5 fps, max:
8 fps
7 [X] Geekom MiniAir 12 Intel Processor N100 1GHz
UHD Graphics 24EUs (Alder Lake-N)
min:
5 fps, max:
8 fps
9 [X] Acemagic S1 Intel Processor N97 GHz
UHD Graphics 24EUs (Alder Lake-N)
min:
7 fps, max:
11 fps
~ 7 fps
UHD Graphics 24EUs (Alder Lake-N):
6 [X] BOSGAME N95 Intel Processor N95 GHz
UHD Graphics 24EUs (Alder Lake-N)
min:
4 fps, max:
7 fps
6 [X] Acemagic S1 Intel Processor N95 GHz
UHD Graphics 24EUs (Alder Lake-N)
min:
4 fps, max:
7 fps
6 [X] Trigkey G4 Intel Processor N100 1GHz
UHD Graphics 24EUs (Alder Lake-N)
min:
4 fps, max:
8 fps
6 [X] Geekom MiniAir 12 Intel Processor N100 1GHz
UHD Graphics 24EUs (Alder Lake-N)
min:
4 fps, max:
8 fps
~ 6 fps
100%
UHD Graphics Xe 750 32EUs:
24 [X] Intel Core i9-11900K Intel Core i9-11900K 3.5GHz
UHD Graphics Xe 750 32EUs
min:
14.19 fps, max:
36.89 fps
fps
54%
UHD Graphics 24EUs (Alder Lake-N):
12.4 [X] Trigkey G4 Intel Processor N100 1GHz
UHD Graphics 24EUs (Alder Lake-N)
min:
8.07 fps, max:
17.64 fps
12.6 [X] Geekom MiniAir 12 Intel Processor N100 1GHz
UHD Graphics 24EUs (Alder Lake-N)
min:
7.91 fps, max:
18.46 fps
13 [X] Acemagic S1 Intel Processor N95 GHz
UHD Graphics 24EUs (Alder Lake-N)
min:
8.26 fps, max:
18.75 fps
~ 13 fps
100%
UHD Graphics Xe 750 32EUs:
10.6 [X] Intel Core i9-11900K Intel Core i9-11900K 3.5GHz
UHD Graphics Xe 750 32EUs
min:
5.39 fps, max:
15.76 fps
fps
57%
UHD Graphics 24EUs (Alder Lake-N):
5.6 [X] Trigkey G4 Intel Processor N100 1GHz
UHD Graphics 24EUs (Alder Lake-N)
min:
2.91 fps, max:
7.96 fps
5.8 [X] Geekom MiniAir 12 Intel Processor N100 1GHz
UHD Graphics 24EUs (Alder Lake-N)
min:
3.02 fps, max:
8.32 fps
5.9 [X] Acemagic S1 Intel Processor N95 GHz
UHD Graphics 24EUs (Alder Lake-N)
min:
3.25 fps, max:
7.8 fps
~ 6 fps
100%
UHD Graphics Xe 750 32EUs:
7.7 [X] Intel Core i9-11900K Intel Core i9-11900K 3.5GHz
UHD Graphics Xe 750 32EUs
min:
3.83 fps, max:
11.85 fps
fps
52%
UHD Graphics 24EUs (Alder Lake-N):
4.3 [X] Trigkey G4 Intel Processor N100 1GHz
UHD Graphics 24EUs (Alder Lake-N)
min:
2.12 fps, max:
5.99 fps
4.4 [X] Geekom MiniAir 12 Intel Processor N100 1GHz
UHD Graphics 24EUs (Alder Lake-N)
min:
2.11 fps, max:
6.25 fps
4.5 [X] Acemagic S1 Intel Processor N95 GHz
UHD Graphics 24EUs (Alder Lake-N)
min:
2.33 fps, max:
6.29 fps
~ 4 fps
UHD Graphics 24EUs (Alder Lake-N):
3.6 [X] Trigkey G4 Intel Processor N100 1GHz
UHD Graphics 24EUs (Alder Lake-N)
min:
1.86 fps, max:
4.87 fps
fps
UHD Graphics 24EUs (Alder Lake-N):
4.9 6 [X] Acemagic S1 Intel Processor N95 GHz
UHD Graphics 24EUs (Alder Lake-N)
6.5 [X] Trigkey G4 Intel Processor N100 1GHz
UHD Graphics 24EUs (Alder Lake-N)
6.5 6.6 9 [X] Acemagic S1 Intel Processor N97 GHz
UHD Graphics 24EUs (Alder Lake-N)
~ 7 fps
UHD Graphics 24EUs (Alder Lake-N):
6 6 [X] Trigkey G4 Intel Processor N100 1GHz
UHD Graphics 24EUs (Alder Lake-N)
6 8.3 [X] Acemagic S1 Intel Processor N97 GHz
UHD Graphics 24EUs (Alder Lake-N)
~ 7 fps
100%
UHD Graphics Xe 750 32EUs:
25.2 51.1 [X] Intel Core i9-11900K 1.47.22.14 D3D12
Intel Core i9-11900K 3.5GHz
UHD Graphics Xe 750 32EUs
min:
10.4 fps, P1:
14.5 fps, max:
566 fps
~ 38 fps
74%
UHD Graphics 24EUs (Alder Lake-N):
23.2 26.9 27 [X] Trigkey G4 1.47.22.14 D3D12
Intel Processor N100 1GHz
UHD Graphics 24EUs (Alder Lake-N)
min:
6.1 fps, P1:
7.25 fps, max:
274 fps
27.6 [X] Chuwi Hi10 Max 1.47.22.14 D3D12
Intel Processor N100 1GHz
UHD Graphics 24EUs (Alder Lake-N)
min:
6.1 fps, P1:
7.84 fps, max:
280 fps
27.8 [X] Geekom MiniAir 12 1.47.22.14 D3D12
Intel Processor N100 1GHz
UHD Graphics 24EUs (Alder Lake-N)
min:
6.2 fps, P1:
7.49 fps, max:
267 fps
27.9 [X] BOSGAME N95 1.47.22.14 D3D12
Intel Processor N95 GHz
UHD Graphics 24EUs (Alder Lake-N)
min:
6 fps, P1:
7.32 fps, max:
245 fps
28 [X] Acemagic S1 1.47.22.14 D3D12
Intel Processor N95 GHz
UHD Graphics 24EUs (Alder Lake-N)
min:
6.3 fps, P1:
7.37 fps, max:
246 fps
28.7 [X] Blackview MP80 1.47.22.14 D3D12
Intel Processor N95 GHz
UHD Graphics 24EUs (Alder Lake-N)
min:
6.5 fps, P1:
7.42 fps, max:
245 fps
37.7 [X] Acemagic S1 1.47.22.14 D3D12
Intel Processor N97 GHz
UHD Graphics 24EUs (Alder Lake-N)
min:
8.6 fps, P1:
10.3 fps, max:
249 fps
~ 28 fps
100%
UHD Graphics Xe 750 32EUs:
10.1 19 [X] Intel Core i9-11900K 1.47.22.14 D3D12
Intel Core i9-11900K 3.5GHz
UHD Graphics Xe 750 32EUs
min:
5 fps, P1:
5 fps, max:
430 fps
~ 15 fps
1109%
RTX A2000:
166.4 [X] HP Z2 Mini G9-996Q4ET 1.47.22.14 D3D12
Intel Core i7-14700K 2.5GHz
RTX A2000
min:
134.9 fps, P1:
141.9 fps, max:
269 fps
fps
80%
UHD Graphics 24EUs (Alder Lake-N):
9.7 10.1 10.2 [X] BOSGAME N95 1.47.22.14 D3D12
Intel Processor N95 GHz
UHD Graphics 24EUs (Alder Lake-N)
min:
5 fps, P1:
5 fps, max:
206 fps
10.2 [X] Trigkey G4 1.47.22.14 D3D12
Intel Processor N100 1GHz
UHD Graphics 24EUs (Alder Lake-N)
min:
5 fps, P1:
5 fps, max:
216 fps
10.4 [X] Acemagic S1 1.47.22.14 D3D12
Intel Processor N95 GHz
UHD Graphics 24EUs (Alder Lake-N)
min:
5 fps, P1:
5 fps, max:
204 fps
10.8 [X] Geekom MiniAir 12 1.47.22.14 D3D12
Intel Processor N100 1GHz
UHD Graphics 24EUs (Alder Lake-N)
min:
5 fps, P1:
5 fps, max:
181.5 fps
14.1 [X] Blackview MP80 1.47.22.14 D3D12
Intel Processor N95 GHz
UHD Graphics 24EUs (Alder Lake-N)
min:
5 fps, P1:
5 fps, max:
205 fps
14.1 [X] Acemagic S1 1.47.22.14 D3D12
Intel Processor N97 GHz
UHD Graphics 24EUs (Alder Lake-N)
min:
5 fps, P1:
6.1 fps, max:
209 fps
14.9 [X] Chuwi Hi10 Max 1.47.22.14 D3D12
Intel Processor N100 1GHz
UHD Graphics 24EUs (Alder Lake-N)
min:
5 fps, P1:
5 fps, max:
234 fps
~ 12 fps
100%
UHD Graphics Xe 750 32EUs:
9.2 15 [X] Intel Core i9-11900K 1.47.22.14 D3D12
Intel Core i9-11900K 3.5GHz
UHD Graphics Xe 750 32EUs
min:
5 fps, P1:
5 fps, max:
446 fps
~ 12 fps
1084%
RTX A2000:
130.1 [X] HP Z2 Mini G9-996Q4ET 1.47.22.14 D3D12
Intel Core i7-14700K 2.5GHz
RTX A2000
min:
93.5 fps, P1:
97.6 fps, max:
278 fps
fps
92%
UHD Graphics 24EUs (Alder Lake-N):
9.4 [X] Trigkey G4 1.47.22.14 D3D12
Intel Processor N100 1GHz
UHD Graphics 24EUs (Alder Lake-N)
min:
5 fps, P1:
5 fps, max:
215 fps
9.5 9.7 9.9 [X] BOSGAME N95 1.47.22.14 D3D12
Intel Processor N95 GHz
UHD Graphics 24EUs (Alder Lake-N)
min:
5 fps, P1:
5 fps, max:
195.2 fps
10.1 [X] Geekom MiniAir 12 1.47.22.14 D3D12
Intel Processor N100 1GHz
UHD Graphics 24EUs (Alder Lake-N)
min:
5 fps, P1:
5 fps, max:
186.8 fps
10.7 [X] Blackview MP80 1.47.22.14 D3D12
Intel Processor N95 GHz
UHD Graphics 24EUs (Alder Lake-N)
min:
5 fps, P1:
5 fps, max:
188.4 fps
10.8 [X] Acemagic S1 1.47.22.14 D3D12
Intel Processor N95 GHz
UHD Graphics 24EUs (Alder Lake-N)
min:
5 fps, P1:
5 fps, max:
212 fps
11.9 [X] Acemagic S1 1.47.22.14 D3D12
Intel Processor N97 GHz
UHD Graphics 24EUs (Alder Lake-N)
min:
5 fps, P1:
5 fps, max:
206 fps
12.5 [X] Chuwi Hi10 Max 1.47.22.14 D3D12
Intel Processor N100 1GHz
UHD Graphics 24EUs (Alder Lake-N)
min:
5 fps, P1:
5 fps, max:
251 fps
~ 11 fps
100%
UHD Graphics Xe 750 32EUs:
13.2 [X] Intel Core i9-11900K 1.47.22.14 D3D12
Intel Core i9-11900K 3.5GHz
UHD Graphics Xe 750 32EUs
min:
5 fps, P1:
5 fps, max:
512 fps
fps
828%
RTX A2000:
109.3 [X] HP Z2 Mini G9-996Q4ET 1.47.22.14 D3D12
Intel Core i7-14700K 2.5GHz
RTX A2000
min:
65.9 fps, P1:
83.1 fps, max:
172.9 fps
fps
91%
UHD Graphics 24EUs (Alder Lake-N):
9.7 [X] Blackview MP80 1.47.22.14 D3D12
Intel Processor N95 GHz
UHD Graphics 24EUs (Alder Lake-N)
min:
5 fps, P1:
5 fps, max:
193.6 fps
10.6 10.8 [X] Chuwi Hi10 Max 1.47.22.14 D3D12
Intel Processor N100 1GHz
UHD Graphics 24EUs (Alder Lake-N)
min:
5 fps, P1:
5 fps, max:
204 fps
14.2 [X] Trigkey G4 1.47.22.14 D3D12
Intel Processor N100 1GHz
UHD Graphics 24EUs (Alder Lake-N)
min:
5 fps, P1:
5 fps, max:
213 fps
14.8 [X] Acemagic S1 1.47.22.14 D3D12
Intel Processor N97 GHz
UHD Graphics 24EUs (Alder Lake-N)
min:
5 fps, P1:
5 fps, max:
202 fps
~ 12 fps
RTX A2000:
79 [X] HP Z2 Mini G9-996Q4ET 1.47.22.14 D3D12
Intel Core i7-14700K 2.5GHz
RTX A2000
min:
56.8 fps, P1:
62.4 fps, max:
115.3 fps
fps
UHD Graphics 24EUs (Alder Lake-N):
14 [X] BOSGAME N95 Intel Processor N95 GHz
UHD Graphics 24EUs (Alder Lake-N)
min:
11 fps, max:
16 fps
14 [X] Acemagic S1 Intel Processor N95 GHz
UHD Graphics 24EUs (Alder Lake-N)
min:
12 fps, max:
16 fps
15 [X] Blackview MP80 Intel Processor N95 GHz
UHD Graphics 24EUs (Alder Lake-N)
min:
13 fps, max:
18 fps
15 [X] Trigkey G4 Intel Processor N100 1GHz
UHD Graphics 24EUs (Alder Lake-N)
min:
13 fps, max:
18 fps
15 [X] Geekom MiniAir 12 Intel Processor N100 1GHz
UHD Graphics 24EUs (Alder Lake-N)
min:
13 fps, max:
18 fps
15 20 [X] Acemagic S1 Intel Processor N97 GHz
UHD Graphics 24EUs (Alder Lake-N)
min:
17 fps, max:
22 fps
~ 15 fps
UHD Graphics 24EUs (Alder Lake-N):
6 [X] Acemagic S1 Intel Processor N95 GHz
UHD Graphics 24EUs (Alder Lake-N)
min:
5 fps, max:
8 fps
7 [X] Blackview MP80 Intel Processor N95 GHz
UHD Graphics 24EUs (Alder Lake-N)
min:
5 fps, max:
8 fps
7 [X] Trigkey G4 Intel Processor N100 1GHz
UHD Graphics 24EUs (Alder Lake-N)
min:
5 fps, max:
9 fps
7 [X] Geekom MiniAir 12 Intel Processor N100 1GHz
UHD Graphics 24EUs (Alder Lake-N)
min:
6 fps, max:
9 fps
7 9 [X] Acemagic S1 Intel Processor N97 GHz
UHD Graphics 24EUs (Alder Lake-N)
min:
8 fps, max:
11 fps
~ 7 fps
UHD Graphics 24EUs (Alder Lake-N):
6 [X] Blackview MP80 Intel Processor N95 GHz
UHD Graphics 24EUs (Alder Lake-N)
min:
5 fps, max:
8 fps
6 [X] Acemagic S1 Intel Processor N95 GHz
UHD Graphics 24EUs (Alder Lake-N)
min:
5 fps, max:
7 fps
6 [X] Trigkey G4 Intel Processor N100 1GHz
UHD Graphics 24EUs (Alder Lake-N)
min:
5 fps, max:
8 fps
6 [X] Geekom MiniAir 12 Intel Processor N100 1GHz
UHD Graphics 24EUs (Alder Lake-N)
min:
5 fps, max:
8 fps
9 [X] Acemagic S1 Intel Processor N97 GHz
UHD Graphics 24EUs (Alder Lake-N)
min:
8 fps, max:
11 fps
~ 7 fps
UHD Graphics 24EUs (Alder Lake-N):
5 [X] Acemagic S1 Intel Processor N95 GHz
UHD Graphics 24EUs (Alder Lake-N)
min:
5 fps, max:
7 fps
6 [X] Trigkey G4 Intel Processor N100 1GHz
UHD Graphics 24EUs (Alder Lake-N)
min:
5 fps, max:
7 fps
6 [X] Geekom MiniAir 12 Intel Processor N100 1GHz
UHD Graphics 24EUs (Alder Lake-N)
min:
5 fps, max:
7 fps
~ 6 fps
100%
UHD Graphics Xe 750 32EUs:
11.3 17.6 [X] Asus ROG Maximus XIII Hero, Intel Xe 750 Intel Core i5-11600K 3.9GHz
UHD Graphics Xe 750 32EUs
18.3 [X] Asus Maximus XIII Hero Intel Core i7-11700K 3.6GHz
UHD Graphics Xe 750 32EUs
~ 16 fps
100%
UHD Graphics Xe 750 32EUs:
8.5 17.3 [X] Asus Maximus XIII Hero Intel Core i7-11700K 3.6GHz
UHD Graphics Xe 750 32EUs
18.8 [X] Asus ROG Maximus XIII Hero, Intel Xe 750 Intel Core i5-11600K 3.9GHz
UHD Graphics Xe 750 32EUs
~ 15 fps
1176%
RTX A2000:
176.4 fps
100%
UHD Graphics Xe 750 32EUs:
7.6 16.4 [X] Asus Maximus XIII Hero Intel Core i7-11700K 3.6GHz
UHD Graphics Xe 750 32EUs
18 [X] Asus ROG Maximus XIII Hero, Intel Xe 750 Intel Core i5-11600K 3.9GHz
UHD Graphics Xe 750 32EUs
~ 14 fps
100%
UHD Graphics Xe 750 32EUs:
5.9 23 [X] Intel Core i9-11900K 1.3
Intel Core i9-11900K 3.5GHz
UHD Graphics Xe 750 32EUs
23.6 [X] Asus ROG Maximus XIII Hero, Intel Xe 750 1.3
Intel Core i9-11900K 3.5GHz
UHD Graphics Xe 750 32EUs
~ 18 fps
100%
UHD Graphics Xe 750 32EUs:
3.5 12.3 [X] Asus ROG Maximus XIII Hero, Intel Xe 750 1.3
Intel Core i9-11900K 3.5GHz
UHD Graphics Xe 750 32EUs
12.4 [X] Intel Core i9-11900K 1.3
Intel Core i9-11900K 3.5GHz
UHD Graphics Xe 750 32EUs
~ 9 fps
100%
UHD Graphics Xe 750 32EUs:
2.5 8.4 [X] Asus ROG Maximus XIII Hero, Intel Xe 750 1.3
Intel Core i9-11900K 3.5GHz
UHD Graphics Xe 750 32EUs
8.5 [X] Intel Core i9-11900K 1.3
Intel Core i9-11900K 3.5GHz
UHD Graphics Xe 750 32EUs
~ 6 fps
100%
UHD Graphics Xe 750 32EUs:
6 [X] Asus ROG Maximus XIII Hero, Intel Xe 750 1.3
Intel Core i9-11900K 3.5GHz
UHD Graphics Xe 750 32EUs
fps
100%
UHD Graphics Xe 750 32EUs:
3.5 [X] Asus ROG Maximus XIII Hero, Intel Xe 750 1.3
Intel Core i9-11900K 3.5GHz
UHD Graphics Xe 750 32EUs
fps
100%
UHD Graphics Xe 750 32EUs:
35.1 84.8 [X] Intel Core i9-11900K Intel Core i9-11900K 3.5GHz
UHD Graphics Xe 750 32EUs
min:
31.6 fps, max:
-1 fps
126 [X] Asus ROG Maximus XIII Hero, Intel Xe 750 Intel Core i5-11600K 3.9GHz
UHD Graphics Xe 750 32EUs
min:
108.5 fps, max:
-1 fps
132 [X] Asus ROG Maximus XIII Hero, Intel Xe 750 Intel Core i9-11900K 3.5GHz
UHD Graphics Xe 750 32EUs
min:
109.7 fps, max:
-1 fps
133 [X] Asus Maximus XIII Hero Intel Core i7-11700K 3.6GHz
UHD Graphics Xe 750 32EUs
min:
107.7 fps, max:
-1 fps
~ 102 fps
68%
UHD Graphics 24EUs (Alder Lake-N):
44.7 52 62.1 68.7 [X] Acemagic S1 Intel Processor N95 GHz
UHD Graphics 24EUs (Alder Lake-N)
min:
48 fps, max:
-1 fps
69.3 [X] Blackview MP80 Intel Processor N95 GHz
UHD Graphics 24EUs (Alder Lake-N)
min:
50.1 fps, max:
-1 fps
69.7 72.7 [X] Acemagic S1 Intel Processor N97 GHz
UHD Graphics 24EUs (Alder Lake-N)
min:
53.4 fps, max:
-1 fps
74 [X] Geekom MiniAir 12 Intel Processor N100 1GHz
UHD Graphics 24EUs (Alder Lake-N)
min:
53.5 fps, max:
-1 fps
74.2 [X] BOSGAME N95 Intel Processor N95 GHz
UHD Graphics 24EUs (Alder Lake-N)
min:
56 fps, max:
-1 fps
76.6 [X] Trigkey G4 Intel Processor N100 1GHz
UHD Graphics 24EUs (Alder Lake-N)
min:
56.5 fps, max:
-1 fps
77.9 [X] Chuwi Hi10 Max Intel Processor N100 1GHz
UHD Graphics 24EUs (Alder Lake-N)
min:
57.4 fps, max:
-1 fps
80.8 ~ 69 fps
100%
UHD Graphics Xe 750 32EUs:
20.6 60.3 [X] Intel Core i9-11900K Intel Core i9-11900K 3.5GHz
UHD Graphics Xe 750 32EUs
min:
29.5 fps, max:
-1 fps
73.8 [X] Asus ROG Maximus XIII Hero, Intel Xe 750 Intel Core i9-11900K 3.5GHz
UHD Graphics Xe 750 32EUs
min:
64.6 fps, max:
-1 fps
74.2 [X] Asus Maximus XIII Hero Intel Core i7-11700K 3.6GHz
UHD Graphics Xe 750 32EUs
min:
65.4 fps, max:
-1 fps
74.7 [X] Asus ROG Maximus XIII Hero, Intel Xe 750 Intel Core i5-11600K 3.9GHz
UHD Graphics Xe 750 32EUs
min:
66.1 fps, max:
-1 fps
~ 61 fps
74%
UHD Graphics 24EUs (Alder Lake-N):
27.6 33.2 41 44.9 47.1 [X] Acemagic S1 Intel Processor N95 GHz
UHD Graphics 24EUs (Alder Lake-N)
min:
39.2 fps, max:
-1 fps
47.8 [X] BOSGAME N95 Intel Processor N95 GHz
UHD Graphics 24EUs (Alder Lake-N)
min:
40.4 fps, max:
-1 fps
47.9 [X] Trigkey G4 Intel Processor N100 1GHz
UHD Graphics 24EUs (Alder Lake-N)
min:
41.8 fps, max:
-1 fps
48.3 [X] Blackview MP80 Intel Processor N95 GHz
UHD Graphics 24EUs (Alder Lake-N)
min:
34.8 fps, max:
-1 fps
49.9 [X] Geekom MiniAir 12 Intel Processor N100 1GHz
UHD Graphics 24EUs (Alder Lake-N)
min:
41.6 fps, max:
-1 fps
50 [X] Chuwi Hi10 Max Intel Processor N100 1GHz
UHD Graphics 24EUs (Alder Lake-N)
min:
43.4 fps, max:
-1 fps
51.6 52 [X] Acemagic S1 Intel Processor N97 GHz
UHD Graphics 24EUs (Alder Lake-N)
min:
39.9 fps, max:
-1 fps
~ 45 fps
100%
UHD Graphics Xe 750 32EUs:
10.9 32.6 [X] Intel Core i9-11900K Intel Core i9-11900K 3.5GHz
UHD Graphics Xe 750 32EUs
min:
7.8 fps, max:
-1 fps
34.9 [X] Asus ROG Maximus XIII Hero, Intel Xe 750 Intel Core i5-11600K 3.9GHz
UHD Graphics Xe 750 32EUs
min:
31.8 fps, max:
-1 fps
35.5 [X] Asus Maximus XIII Hero Intel Core i7-11700K 3.6GHz
UHD Graphics Xe 750 32EUs
min:
32.4 fps, max:
-1 fps
35.6 [X] Asus ROG Maximus XIII Hero, Intel Xe 750 Intel Core i9-11900K 3.5GHz
UHD Graphics Xe 750 32EUs
min:
32.3 fps, max:
-1 fps
~ 30 fps
67%
UHD Graphics 24EUs (Alder Lake-N):
14.2 18.2 18.7 [X] Acemagic S1 Intel Processor N95 GHz
UHD Graphics 24EUs (Alder Lake-N)
min:
17.5 fps, max:
-1 fps
18.8 [X] BOSGAME N95 Intel Processor N95 GHz
UHD Graphics 24EUs (Alder Lake-N)
min:
17.5 fps, max:
-1 fps
19.2 19.6 [X] Blackview MP80 Intel Processor N95 GHz
UHD Graphics 24EUs (Alder Lake-N)
min:
18.2 fps, max:
-1 fps
19.8 [X] Trigkey G4 Intel Processor N100 1GHz
UHD Graphics 24EUs (Alder Lake-N)
min:
18.6 fps, max:
-1 fps
20.1 20.2 [X] Chuwi Hi10 Max Intel Processor N100 1GHz
UHD Graphics 24EUs (Alder Lake-N)
min:
18.9 fps, max:
-1 fps
20.3 [X] Geekom MiniAir 12 Intel Processor N100 1GHz
UHD Graphics 24EUs (Alder Lake-N)
min:
18.9 fps, max:
-1 fps
20.7 26.8 [X] Acemagic S1 Intel Processor N97 GHz
UHD Graphics 24EUs (Alder Lake-N)
min:
25.1 fps, max:
-1 fps
~ 20 fps
100%
UHD Graphics Xe 750 32EUs:
9.9 30 [X] Intel Core i9-11900K Intel Core i9-11900K 3.5GHz
UHD Graphics Xe 750 32EUs
min:
11.4 fps, max:
-1 fps
31.9 [X] Asus ROG Maximus XIII Hero, Intel Xe 750 Intel Core i5-11600K 3.9GHz
UHD Graphics Xe 750 32EUs
min:
29.2 fps, max:
-1 fps
32.5 [X] Asus Maximus XIII Hero Intel Core i7-11700K 3.6GHz
UHD Graphics Xe 750 32EUs
min:
29.6 fps, max:
-1 fps
32.6 [X] Asus ROG Maximus XIII Hero, Intel Xe 750 Intel Core i9-11900K 3.5GHz
UHD Graphics Xe 750 32EUs
min:
29.7 fps, max:
-1 fps
~ 27 fps
67%
UHD Graphics 24EUs (Alder Lake-N):
13.4 17 17.4 [X] Acemagic S1 Intel Processor N95 GHz
UHD Graphics 24EUs (Alder Lake-N)
min:
16.2 fps, max:
-1 fps
17.5 [X] BOSGAME N95 Intel Processor N95 GHz
UHD Graphics 24EUs (Alder Lake-N)
min:
16.4 fps, max:
-1 fps
17.8 18 [X] Blackview MP80 Intel Processor N95 GHz
UHD Graphics 24EUs (Alder Lake-N)
min:
16.9 fps, max:
-1 fps
18.4 [X] Trigkey G4 Intel Processor N100 1GHz
UHD Graphics 24EUs (Alder Lake-N)
min:
17.2 fps, max:
-1 fps
18.6 18.8 [X] Geekom MiniAir 12 Intel Processor N100 1GHz
UHD Graphics 24EUs (Alder Lake-N)
min:
17.5 fps, max:
-1 fps
18.8 [X] Chuwi Hi10 Max Intel Processor N100 1GHz
UHD Graphics 24EUs (Alder Lake-N)
min:
17.5 fps, max:
-1 fps
19.1 24.9 [X] Acemagic S1 Intel Processor N97 GHz
UHD Graphics 24EUs (Alder Lake-N)
min:
23.1 fps, max:
-1 fps
~ 18 fps
100%
UHD Graphics Xe 750 32EUs:
12.4 [X] Asus ROG Maximus XIII Hero, Intel Xe 750 Intel Core i9-11900K 3.5GHz
UHD Graphics Xe 750 32EUs
min:
11.5 fps, max:
-1 fps
fps
UHD Graphics 24EUs (Alder Lake-N):
16 22 [X] BOSGAME N95 Intel Processor N95 GHz
UHD Graphics 24EUs (Alder Lake-N)
22 22.3 [X] Trigkey G4 Intel Processor N100 1GHz
UHD Graphics 24EUs (Alder Lake-N)
min:
9.85 fps, P0.1:
11.2 fps, P1:
12.8 fps, max:
97.4 fps
22.5 22.9 [X] Geekom MiniAir 12 Intel Processor N100 1GHz
UHD Graphics 24EUs (Alder Lake-N)
min:
9.81 fps, P0.1:
10.8 fps, P1:
13 fps, max:
111.5 fps
23.1 [X] Acemagic S1 Intel Processor N95 GHz
UHD Graphics 24EUs (Alder Lake-N)
min:
6.38 fps, P0.1:
8.66 fps, P1:
13.9 fps, max:
98.3 fps
33.3 [X] Acemagic S1 Intel Processor N97 GHz
UHD Graphics 24EUs (Alder Lake-N)
min:
3.59 fps, P0.1:
11.3 fps, P1:
17 fps, max:
121.4 fps
~ 23 fps
RTX A2000:
217 [X] HP Z2 Mini G9-996Q4ET Intel Core i7-14700K 2.5GHz
RTX A2000
min:
28.5 fps, P0.1:
119.9 fps, P1:
179.3 fps, max:
606 fps
fps
UHD Graphics 24EUs (Alder Lake-N):
14.6 [X] Trigkey G4 Intel Processor N100 1GHz
UHD Graphics 24EUs (Alder Lake-N)
min:
6.86 fps, P0.1:
7.07 fps, P1:
8.24 fps, max:
63.3 fps
14.7 [X] Geekom MiniAir 12 Intel Processor N100 1GHz
UHD Graphics 24EUs (Alder Lake-N)
min:
1.581 fps, P0.1:
4.59 fps, P1:
8.41 fps, max:
65.3 fps
14.8 [X] Acemagic S1 Intel Processor N95 GHz
UHD Graphics 24EUs (Alder Lake-N)
min:
1.456 fps, P0.1:
5.17 fps, P1:
8.48 fps, max:
69.5 fps
15.2 20.9 [X] Acemagic S1 Intel Processor N97 GHz
UHD Graphics 24EUs (Alder Lake-N)
min:
1.552 fps, P0.1:
10.9 fps, P1:
12.2 fps, max:
80.3 fps
~ 16 fps
UHD Graphics 24EUs (Alder Lake-N):
7.2 [X] BOSGAME N95 Intel Processor N95 GHz
UHD Graphics 24EUs (Alder Lake-N)
7.4 [X] Acemagic S1 Intel Processor N95 GHz
UHD Graphics 24EUs (Alder Lake-N)
min:
3.77 fps, P0.1:
3.86 fps, P1:
4.29 fps, max:
41.2 fps
7.8 [X] Trigkey G4 Intel Processor N100 1GHz
UHD Graphics 24EUs (Alder Lake-N)
min:
4.16 fps, P0.1:
4.19 fps, P1:
4.45 fps, max:
31 fps
8.2 [X] Geekom MiniAir 12 Intel Processor N100 1GHz
UHD Graphics 24EUs (Alder Lake-N)
min:
4.19 fps, P0.1:
4.42 fps, P1:
4.54 fps, max:
36.4 fps
8.4 10.8 [X] Acemagic S1 Intel Processor N97 GHz
UHD Graphics 24EUs (Alder Lake-N)
min:
5.74 fps, P0.1:
5.93 fps, P1:
6.14 fps, max:
50.2 fps
~ 8 fps
RTX A2000:
63.9 [X] HP Z2 Mini G9-996Q4ET Intel Core i7-14700K 2.5GHz
RTX A2000
min:
36.2 fps, P0.1:
49.5 fps, P1:
54.3 fps, max:
169.5 fps
fps
UHD Graphics 24EUs (Alder Lake-N):
3.8 5.2 [X] Acemagic S1 Intel Processor N97 GHz
UHD Graphics 24EUs (Alder Lake-N)
min:
3.14 fps, P0.1:
3.16 fps, P1:
3.24 fps, max:
12.8 fps
~ 4 fps
RTX A2000:
47.2 [X] HP Z2 Mini G9-996Q4ET Intel Core i7-14700K 2.5GHz
RTX A2000
min:
28.7 fps, P0.1:
32.5 fps, P1:
39.5 fps, max:
169.3 fps
fps
RTX A2000:
40.1 [X] HP Z2 Mini G9-996Q4ET Intel Core i7-14700K 2.5GHz
RTX A2000
min:
21.5 fps, P0.1:
24.7 fps, P1:
34.5 fps, max:
106.4 fps
fps
100%
UHD Graphics Xe 750 32EUs:
36.8 fps
149%
UHD Graphics 24EUs (Alder Lake-N):
44.7 51 [X] Trigkey G4 Intel Processor N100 1GHz
UHD Graphics 24EUs (Alder Lake-N)
min:
15.2 fps, P1:
35.7 fps, max:
97.9 fps
54 [X] Acemagic S1 Intel Processor N95 GHz
UHD Graphics 24EUs (Alder Lake-N)
min:
15.4 fps, P1:
37 fps, max:
88.1 fps
54.3 [X] BOSGAME N95 Intel Processor N95 GHz
UHD Graphics 24EUs (Alder Lake-N)
min:
1.817 fps, P1:
26.3 fps, max:
103.8 fps
57.2 [X] Blackview MP80 Intel Processor N95 GHz
UHD Graphics 24EUs (Alder Lake-N)
min:
17.3 fps, P1:
40 fps, max:
101.9 fps
57.7 [X] Chuwi Hi10 Max Intel Processor N100 1GHz
UHD Graphics 24EUs (Alder Lake-N)
min:
3.06 fps, P1:
27.8 fps, max:
154.1 fps
58.2 [X] Acemagic S1 Intel Processor N97 GHz
UHD Graphics 24EUs (Alder Lake-N)
min:
7.46 fps, P1:
37 fps, max:
180.9 fps
59 [X] Geekom MiniAir 12 Intel Processor N100 1GHz
UHD Graphics 24EUs (Alder Lake-N)
min:
27.3 fps, P1:
43.5 fps, max:
97.9 fps
~ 55 fps
100%
UHD Graphics Xe 750 32EUs:
34.1 fps
129%
UHD Graphics 24EUs (Alder Lake-N):
36.6 39.4 [X] BOSGAME N95 Intel Processor N95 GHz
UHD Graphics 24EUs (Alder Lake-N)
min:
3.32 fps, P1:
20 fps, max:
95.5 fps
41.9 [X] Acemagic S1 Intel Processor N95 GHz
UHD Graphics 24EUs (Alder Lake-N)
min:
17.9 fps, P1:
29.4 fps, max:
70.1 fps
42.1 [X] Trigkey G4 Intel Processor N100 1GHz
UHD Graphics 24EUs (Alder Lake-N)
min:
18.8 fps, P1:
30.3 fps, max:
70.1 fps
46.6 [X] Chuwi Hi10 Max Intel Processor N100 1GHz
UHD Graphics 24EUs (Alder Lake-N)
min:
7.82 fps, P1:
23.8 fps, max:
90.6 fps
48 [X] Geekom MiniAir 12 Intel Processor N100 1GHz
UHD Graphics 24EUs (Alder Lake-N)
min:
27.9 fps, P1:
35.7 fps, max:
82.2 fps
48 [X] Acemagic S1 Intel Processor N97 GHz
UHD Graphics 24EUs (Alder Lake-N)
min:
3.5 fps, P1:
31.3 fps, max:
81.1 fps
51.3 [X] Blackview MP80 Intel Processor N95 GHz
UHD Graphics 24EUs (Alder Lake-N)
min:
19.4 fps, P1:
37 fps, max:
78.4 fps
~ 44 fps
UHD Graphics 24EUs (Alder Lake-N):
5.9 6.4 [X] Acemagic S1 Intel Processor N95 GHz
UHD Graphics 24EUs (Alder Lake-N)
min:
3.66 fps, P1:
5.13 fps, max:
33.8 fps
6.4 [X] Trigkey G4 Intel Processor N100 1GHz
UHD Graphics 24EUs (Alder Lake-N)
min:
2.61 fps, P1:
4.78 fps, max:
33.3 fps
6.9 [X] Chuwi Hi10 Max Intel Processor N100 1GHz
UHD Graphics 24EUs (Alder Lake-N)
min:
3.13 fps, P1:
4.48 fps, max:
51.7 fps
7.2 [X] Blackview MP80 Intel Processor N95 GHz
UHD Graphics 24EUs (Alder Lake-N)
min:
4.2 fps, P1:
5.52 fps, max:
38.5 fps
7.7 [X] Acemagic S1 Intel Processor N97 GHz
UHD Graphics 24EUs (Alder Lake-N)
min:
3.86 fps, P1:
5.62 fps, max:
33.2 fps
36.5 [X] BOSGAME N95 Intel Processor N95 GHz
UHD Graphics 24EUs (Alder Lake-N)
min:
0.2961 fps, P1:
3.83 fps, max:
88.9 fps
~ 11 fps
UHD Graphics 24EUs (Alder Lake-N):
2.7 [X] Trigkey G4 Intel Processor N100 1GHz
UHD Graphics 24EUs (Alder Lake-N)
min:
1.226 fps, P1:
1.558 fps, max:
13.3 fps
2.8 [X] Trigkey G4 Intel Processor N100 1GHz
UHD Graphics 24EUs (Alder Lake-N)
min:
1.26 fps, P1:
1.608 fps, max:
21.5 fps
2.9 [X] Acemagic S1 Intel Processor N95 GHz
UHD Graphics 24EUs (Alder Lake-N)
min:
1.295 fps, P1:
1.563 fps, max:
16.1 fps
3.2 [X] Blackview MP80 Intel Processor N95 GHz
UHD Graphics 24EUs (Alder Lake-N)
min:
1.439 fps, P1:
1.761 fps, max:
18.7 fps
3.2 [X] Blackview MP80 Intel Processor N95 GHz
UHD Graphics 24EUs (Alder Lake-N)
min:
1.461 fps, P1:
1.821 fps, max:
19.5 fps
3.4 [X] Acemagic S1 Intel Processor N97 GHz
UHD Graphics 24EUs (Alder Lake-N)
min:
1.558 fps, P1:
2.15 fps, max:
21.5 fps
~ 3 fps
Average Gaming Intel UHD Graphics Xe 750 32EUs (Rocket Lake) → 100% Average Gaming 30-70 fps → 100%
Average Gaming Nvidia RTX A2000 → 821% Average Gaming 30-70 fps → 848%
Average Gaming Intel UHD Graphics 24EUs (Alder Lake-N) → 82% Average Gaming 30-70 fps → 105%
 Deutsch
 English
 Español
 Français
 Italiano
 Nederlands
 Polski
 Português
 Русский
 Türkçe
 Svenska
 Chinese
 Magyar