Intel UHD Graphics P630 vs Intel HD Graphics 5600 vs Intel Iris Plus Graphics 640
Intel UHD Graphics P630 ► remove from comparison
Die Intel UHD Graphics P630 (GT2) ist eine integrierte Grafikeinheit, die in verschiedenen Desktop- und Notebook-Prozessoren der 2017 vorgestellten Coffee-Lake-Generation (Xeon) zu finden ist. Die mittlere, auch "GT2" genannte Ausbaustufe verfügt über 24 EUs (Execution Units bzw. Ausführungseinheiten). Technisch unterscheidet sie sich von der UHD Graphics 630 in Consumer Prozessoren (siehe für Benchmarks) .
Performance
Die exakte Leistung der UHD Graphics 630 hängt vom jeweiligen CPU-Modell ab, da sich TDP, Maximaltaktrate und Größe des L3-Caches teils stark unterscheiden können. Zum anderen bestimmt auch der verwendete Speicher (DDR3/DDR4) die Performance. Im Durchschnitt sollte die Leistung jedoch nur minimal oberhalb der Intel HD Graphics 530 liegen, wodurch sich anspruchsvolle Spiele aus 2016 wie Watch Dogs 2, Dishonored 2 oder Mafia 3 nicht spielbar sind. Weniger anspruchsvolle Spiele wie Overwatch oder Farming Simulator 17 sind jedoch in niedrigen Details flüssig spielbar.
Features
Die Features entsprechen der Intel HD Graphics 630. Somit unterstützt die integrierte Videoengine H.265 in 4K und 10 Bit in Hardware und dank HDCP 2.2 sollten auch Netflix-Videos unter Windows 10 in 4K ausgegeben werden können. HDMI 2.0 unterstützt die UHD Graphics 630 jedoch wahrscheinlich weiterhin nur per Wandler (LSPCon) über den DisplayPort.
Leistungsaufnahme
Die UHD Graphics P630 ist in Desktop- und Notebook-Prozessoren verschiedener TDP-Klassen zu finden. Die Quad-Core CPUs sind jedoch meistens in größeren und schwereren Notebooks verbaut. Der verbesserte 14nm++ Prozess verspricht jedoch eine etwas geringere Leistungsaufnahme im Vergleich zur Intel HD Graphics P530.
Intel HD Graphics 5600 ► remove from comparison
Die Intel HD Graphics 5600 (GT2) ist eine Prozessorgrafikkarte in den CPUs der Broadwell- Generation. Die GPU wird in Standard-Voltage-Modellen der Core-Serie verbaut und bietet 24 EUs (Execution Units bzw. Ausführungseinheiten). Die Kerntaktrate des bislang einzigen Modells (Core i7-5700HQ ) liegt bei max. 1.050 MHz mit Turbo.
Architektur und Features
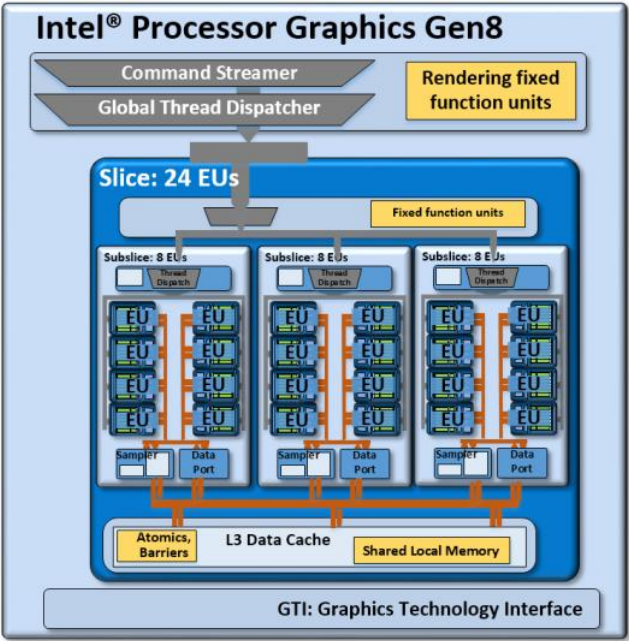
Broadwell integriert eine Grafikeinheit auf Basis der Intel-Gen8-Architektur, die gegenüber dem Vorgänger Intel Gen7.5 (Haswell) in verschiedenen Punkten weiterentwickelt wurde. So hat Intel unter anderem die "Subslice" genannten Shader-Arrays umorganisiert, die nun jeweils 8 Execution Units (EUs) beinhalten. Drei Subslices bilden wiederum einen Slice mit insgesamt 24 EUs. Hinzu kommen größere L1-Caches und Verbesserungen im Front-End, die die Leistung zusätzlich steigern sollen.
Die HD Graphics 5600 repräsentiert die mittlere, auch "GT2" bezeichnete Ausbaustufe der Broadwell-GPU mit einem Slice und 24 EUs. Daneben existieren auch eine teildeaktivierte GT1-Variante (12 EUs) sowie die GT3/GT3e (48 EUs) ohne/mit zusätzlichem eDRAM-Cache.
Alle Broadwell-GPUs unterstützen OpenCL 2.0 sowie DirectX 12 (FL 11_1) . Zudem kann der Videodecoder nun auch den H.265-Codec verarbeiten, greift dafür allerdings nur teilweise auf besonders sparsame Fixed-Function-Einheiten zurück. Die Bildausgabe erfolgt über DP 1.2/eDP 1.3 (max. 3.840 x 2.160 @ 60 Hz) oder HDMI 1.4a (max. 3.840 x 2.160 @ 24 Hz), HDMI 2.0 steht dagegen nicht zur Verfügung. Es können maximal drei Displays parallel angesteuert werden.
Performance
Dank zusätzlicher Ausführungseinheiten sowie der verbesserten Architektur liegt die Performance der HD Graphics 5600 etwa 20 Prozent oberhalb des Vorgängers HD Graphics 4600 . Dennoch ordnet sich die GPU weiterhin im Low-End-Segment ein und kommt nicht ganz an dedizierte Einstiegsbeschleuniger wie die GeForce 920M oder Radeon R7 M360 heran. Spiele des Jahres 2014/2015 werden darum meist nur in niedrigen Einstellungen flüssig wiedergegeben, einige besonders anspruchsvolle Titel wie The Witcher 3 teilweise nicht einmal das.
Leistungsaufnahme
Die TDP des gesamten Chips liegt standardmäßig bei 47 Watt (i7-5700HQ), sodass die HD Graphics 5600 vor allem in größeren Notebooks ab 14 oder 15 Zoll zu finden ist. Laut HWInfo braucht der GPU Part in einem i7-5700HQ (MSI GP62) auf dem Windows Desktop etwa 0,04 Watt, bei World of Warships 9,6 Watt (41 Watt die gesamte CPU). Verwendet man die dedizierte 940M im GP62, verringern sich die Werte auf 0,4 Watt bzw. 29 Watt für die gesamte CPU.
Intel Iris Plus Graphics 640 ► remove from comparison
Die Intel Iris Plus Graphics 640 (GT3e) ist eine Prozessorgrafikkarte der im Jänner 2017 vorgestellten Kaby-Lake-Modelle. Als Nachfolger der Iris Graphics 540 (Skylake) ist die Iris Plus Graphics 640 dabei in den ULV-Modellen der 15-Watt-Klasse zu finden und besitzt einen dedizierten eDRAM-Cache mit 64 MB Kapazität. Die sogenannte GT3e-Ausbaustufe der Kaby-Lake-GPU verfügt weiterhin über 48 Execution Units (EUs), die je nach Modell mit bis zu 1.050 MHz takten.
Neben dem eDRAM-Cache kann die Iris 640 auch über das Interface des Prozessors auf den Hauptspeicher zugreifen (2x 64 Bit DDR3L-1600/LPDDR3-1866/DDR4-2133).
Von der Iris Plus 650 der 28-Watt-Modelle unterscheidet sich die Iris 640 lediglich durch ihren etwas geringeren Maximaltakt sowie die geringere TDP, wodurch der Turbo-Boost-Spielraum weniger lang ausgenutzt werden kann.
Performance
Die exakte Leistung der Iris Plus Graphics 640 hängt vom jeweiligen CPU-Modell ab, da sich die Maximaltaktrate leicht unterscheiden kann. Zum anderen beeinflusst auch der verwendete Speicher (DDR3/DDR4) die Performance.
Die höchste Leistung erreichen hochtaktende Core-i7-Ableger wie der Core i7-7660U. Je nach Spiel ordnet sich die Iris 640 wahrscheinlich wie der Vorgänger zwischen einer dedizierten GeForce 920M und GeForce 940M ein und kann aktuelle Spiele meist nur in niedrigen Einstellungen flüssig darstellen.
Features
Die überarbeitete Videoeinheit dekodiert H.265-/HEVC-Videos vollständig in Hardware. Anders als Skylake kann Kaby Lake nun auch H.265/HEVC im Main10-Profil mit 10 Bit Farbtiefe sowie Googles VP9-Codec in Hardware dekodieren. Die Bildausgabe erfolgt über DP 1.2/eDP 1.3 (max. 3.840 x 2.160 @ 60 Hz), wohingegen HDMI nur in der älteren Version 1.4a angeboten wird. Ein HDMI-2.0-Anschluss kann aber mittels Konverter von DisplayPort ergänzt werden. Maximal lassen sich drei Displays parallel angesteuern.
Leistungsaufnahme
Die Iris Graphics 640 ist in ULV-Prozessoren der 15-Watt-Klasse zu finden und damit für schlanke Note- und Ultrabooks geeignet.
Intel UHD Graphics P630 Intel HD Graphics 5600 Intel Iris Plus Graphics 640 Gen. 9.5 Serie Codename Coffee-Lake-GT2 Broadwell GT2 Kaby Lake GT3e Architektur Gen. 9.5 Gen. 8 Broadwell Gen. 9.5 Kaby Lake Pipelines 24 - unified 24 - unified 48 - unified Kerntakt 300 - 1200 (Boost) MHz 300 - 1050 (Boost) MHz 300 - 1050 (Boost) MHz Speicherbandbreite 64/128 Bit 64/128 Bit 64/128 Bit Shared Memory ja ja ja API DirectX 12_1, OpenGL 4.4 DirectX 12 (FL 11_1), OpenGL 4.3 DirectX 12_1, OpenGL 4.4 Herstellungsprozess 14 nm 14 nm 14 nm Features QuickSync QuickSync QuickSync Erscheinungsdatum 01.10.2017 02.06.2015 03.01.2017 Speichertyp DDR3/DDR4 Max. Speichergröße 64 MB
Benchmarks Performance Rating - 3DMark 11 + Fire Strike + Time Spy - HD Graphics 5600
0.4 pt (1%)
...
...
max:
3DMark - 3DMark Time Spy Score
min: 467 avg: 499.8 median: 494.5 (1%) max: 543 Points
3DMark - 3DMark Time Spy Graphics
min: 413 avg: 442.5 median: 437 (1%) max: 483 Points
3DMark - 3DMark Ice Storm Unlimited Graphics
min: 142163 avg: 147298 median: 145481 (15%) max: 154251 Points
3DMark - 3DMark Cloud Gate Score
7499 Points (8%)
min: 7558 avg: 8025 median: 8067 (9%) max: 8711 Points
3DMark - 3DMark Cloud Gate Graphics
7757 Points (2%)
min: 10486 avg: 11119 median: 11248 (3%) max: 11495 Points
3DMark - 3DMark Fire Strike Standard Score
944 Points (2%)
min: 1236 avg: 1349 median: 1310 (2%) max: 1509 Points
3DMark - 3DMark Fire Strike Standard Graphics
991 Points (1%)
min: 1315 avg: 1411 median: 1393.5 (2%) max: 1541 Points
3DMark - 3DMark Ice Storm Graphics
79039 Points (9%)
3DMark 11 - 3DM11 Performance Score
1651 Points (2%)
min: 2136 avg: 2440 median: 2561 (4%) max: 2664 Points
3DMark 11 - 3DM11 Performance GPU
1431 Points (1%)
min: 1980 avg: 2275 median: 2379 (2%) max: 2493 Points
3DMark 06 3DMark 06 - Standard 1280x1024 + Intel Iris Plus Graphics 640
min: 13164 avg: 14118 median: 14117.5 (18%) max: 15071 Points
Unigine Valley 1.0 - Unigine Valley 1.0 DX
6.5 fps (2%)
Cinebench R10 Cinebench R10 Shading (32bit) + Intel HD Graphics 5600 Cinebench R10 - Cinebench R10 Shading (32bit)
7445 Points (5%)
Cinebench R10 Shading (32bit) + Intel Iris Plus Graphics 640
min: 8824 avg: 9678 median: 9703 (7%) max: 10506 Points
Cinebench R11.5 Cinebench R11.5 OpenGL 64 Bit + Intel HD Graphics 5600 Cinebench R11.5 - Cinebench R11.5 OpenGL 64 Bit
41.2 fps (14%)
Cinebench R11.5 OpenGL 64 Bit + Intel Iris Plus Graphics 640
46.1 fps (15%)
Cinebench R15 + Intel HD Graphics 5600 Cinebench R15 - Cinebench R15 OpenGL 64 Bit
37.9 fps (2%)
Cinebench R15 OpenGL 64 Bit + Intel Iris Plus Graphics 640
min: 41.32 avg: 54 median: 56.2 (3%) max: 62.3 fps
Cinebench R15 OpenGL Ref. Match 64 Bit + Intel Iris Plus Graphics 640 Cinebench R15 - Cinebench R15 OpenGL Ref. Match 64 Bit
min: 97.8 avg: 98.2 median: 97.8 (98%) max: 99.3 %
GFXBench - GFXBench Car Chase Offscreen
40.7 fps (5%)
GFXBench 3.1 - GFXBench Manhattan ES 3.1 Offscreen
56.1 fps (1%)
GFXBench 3.0 - GFXBench 3.0 Manhattan Offscreen
31.2 fps (2%)
GFXBench (DX / GLBenchmark) 2.7 + Intel Iris Plus Graphics 640 GFXBench (DX / GLBenchmark) 2.7 - GFXBench T-Rex HD Offscreen C24Z16
171 fps (1%)
LuxMark v2.0 64Bit - LuxMark v2.0 Room GPU
min: 315 avg: 325 median: 325 (1%) max: 335 Samples/s
LuxMark v2.0 64Bit - LuxMark v2.0 Sala GPU
min: 748 avg: 779 median: 778.5 (1%) max: 809 Samples/s
ComputeMark v2.1 - ComputeMark v2.1 Result
min: 1575 avg: 1677 median: 1677 (2%) max: 1779 Points
Power Consumption - Furmark Stress Test Power Consumption - external Monitor *
57.8 Watt (8%)
min: 30.8 avg: 33.6 median: 31.5 (4%) max: 38.5 Watt
Power Consumption - The Witcher 3 Power Consumption - external Monitor *
44.6 Watt (6%)
min: 28 avg: 33.5 median: 33.5 (5%) max: 38.9 Watt
Power Consumption - Witcher 3 Power Consumption *
min: 31.7 avg: 34.9 median: 34.9 (8%) max: 38.1 Watt
Power Consumption - Witcher 3 ultra Power Efficiency - external Monitor
0.1 fps per Watt (9%)
Emissions Witcher 3 Fan Noise + Intel Iris Plus Graphics 640 Emissions - Witcher 3 Fan Noise
33.4 dB(A) (53%)
Clock Speed - GPU Clock Witcher 3 ultra
min: 748 avg: 823 median: 823 (32%) max: 898 MHz
Clock Speed - GPU Clock Speed Furmark
min: 570 avg: 634 median: 634 (25%) max: 698 MHz
Average Benchmarks Intel HD Graphics 5600 → 0% n=0 Average Benchmarks Intel Iris Plus Graphics 640 → 0% n=0
- Bereich der Benchmarkergebnisse für diese Grafikkarte
- Durchschnittliche Benchmarkergebnisse für diese Grafikkarte
* Smaller numbers mean a higher performance
1 This benchmark is not used for the average calculation
Spiele-Benchmarks Die folgenden Benchmarks basieren auf unseren Spieletests mit Testnotebooks. Die Performance dieser Grafikkarte bei den gelisteten Spielen ist abhängig von der verwendeten CPU, Speicherausstattung, Treiber und auch Betriebssystem. Dadurch müssen die untenstehenden Werte nicht repräsentativ sein. Detaillierte Informationen über das verwendete System sehen Sie nach einem Klick auf den fps-Wert.
HD Graphics 5600:
15.1 [X] MSI GP62 2QD Intel Core i7-5700HQ 2.7GHz
HD Graphics 5600
min:
13 fps, max:
20 fps
fps
HD Graphics 5600:
10.4 [X] MSI GP62 2QD Intel Core i7-5700HQ 2.7GHz
HD Graphics 5600
min:
8 fps, max:
13 fps
fps
HD Graphics 5600:
8.7 [X] MSI GP62 2QD Intel Core i7-5700HQ 2.7GHz
HD Graphics 5600
min:
1 fps, max:
14 fps
fps
Iris Plus Graphics 640:
13.8 fps
Iris Plus Graphics 640:
28 fps
HD Graphics 5600:
71 [X] MSI GP62 2QD Intel Core i7-5700HQ 2.7GHz
HD Graphics 5600
min:
58 fps, max:
79 fps
fps
Iris Plus Graphics 640:
69.5 (!) [X] Microsoft Surface Laptop i7 Intel Core i7-7660U 2.5GHz
Iris Plus Graphics 640
min:
59 fps, max:
78 fps
fps
HD Graphics 5600:
0 (!) [X] MSI GP62 2QD Intel Core i7-5700HQ 2.7GHz
HD Graphics 5600
fps
Iris Plus Graphics 640:
38.8 (!) [X] Microsoft Surface Laptop i7 Intel Core i7-7660U 2.5GHz
Iris Plus Graphics 640
min:
34 fps, max:
43 fps
fps
Iris Plus Graphics 640:
33 38 ~ 36 fps
Iris Plus Graphics 640:
15 15 ~ 15 fps
Iris Plus Graphics 640:
22.9 fps
HD Graphics 5600:
103 [X] MSI GP62 2QD Intel Core i7-5700HQ 2.7GHz
HD Graphics 5600
min:
93 fps
fps
HD Graphics 5600:
94 [X] MSI GP62 2QD Intel Core i7-5700HQ 2.7GHz
HD Graphics 5600
min:
88 fps
fps
Iris Plus Graphics 640:
99 fps
HD Graphics 5600:
42 [X] MSI GP62 2QD Intel Core i7-5700HQ 2.7GHz
HD Graphics 5600
min:
39 fps
fps
Iris Plus Graphics 640:
48 fps
HD Graphics 5600:
15.4 [X] MSI GP62 2QD Intel Core i7-5700HQ 2.7GHz
HD Graphics 5600
min:
14 fps
fps
Iris Plus Graphics 640:
31.8 fps
HD Graphics 5600:
39.7 [X] MSI GP62 2QD Intel Core i7-5700HQ 2.7GHz
HD Graphics 5600
min:
37 fps, max:
43 fps
fps
HD Graphics 5600:
55.2 [X] MSI GP62 2QD Intel Core i7-5700HQ 2.7GHz
HD Graphics 5600
min:
49 fps, max:
63 fps
fps
HD Graphics 5600:
28.6 [X] MSI GP62 2QD Intel Core i7-5700HQ 2.7GHz
HD Graphics 5600
min:
24 fps, max:
33 fps
fps
Iris Plus Graphics 640:
39.9 45.4 ~ 43 fps
Iris Plus Graphics 640:
17.9 18.1 ~ 18 fps
Iris Plus Graphics 640:
14.8 fps
Iris Plus Graphics 640:
33.8 fps
HD Graphics 5600:
17.1 [X] MSI GP62 2QD Intel Core i7-5700HQ 2.7GHz
HD Graphics 5600
min:
14 fps, max:
22 fps
fps
Iris Plus Graphics 640:
20.4 fps
Iris Plus Graphics 640:
16 16.6 ~ 16 fps
HD Graphics 5600:
21.9 [X] MSI GP62 2QD Intel Core i7-5700HQ 2.7GHz
HD Graphics 5600
min:
15 fps, max:
32 fps
fps
Iris Plus Graphics 640:
30.8 33.5 ~ 32 fps
HD Graphics 5600:
8.5 [X] MSI GP62 2QD Intel Core i7-5700HQ 2.7GHz
HD Graphics 5600
min:
7 fps, max:
11 fps
fps
Iris Plus Graphics 640:
11.8 12.7 ~ 12 fps
HD Graphics 5600:
14.9 [X] MSI GP62 2QD Intel Core i7-5700HQ 2.7GHz
HD Graphics 5600
min:
12 fps, max:
18 fps
fps
HD Graphics 5600:
12.3 [X] MSI GP62 2QD Intel Core i7-5700HQ 2.7GHz
HD Graphics 5600
min:
10 fps, max:
15 fps
fps
HD Graphics 5600:
0 (!) [X] MSI GP62 2QD Intel Core i7-5700HQ 2.7GHz
HD Graphics 5600
fps
Iris Plus Graphics 640:
42.9 45 ~ 44 fps
Iris Plus Graphics 640:
31.4 fps
Iris Plus Graphics 640:
22.9 fps
Iris Plus Graphics 640:
121 fps
HD Graphics 5600:
45.5 [X] MSI GP62 2QD Intel Core i7-5700HQ 2.7GHz
HD Graphics 5600
min:
43 fps, max:
56 fps
fps
Iris Plus Graphics 640:
91 fps
HD Graphics 5600:
18.1 [X] MSI GP62 2QD Intel Core i7-5700HQ 2.7GHz
HD Graphics 5600
min:
16 fps, max:
22 fps
fps
Iris Plus Graphics 640:
31.6 fps
Iris Plus Graphics 640:
17.8 fps
HD Graphics 5600:
29.8 [X] MSI GP62 2QD Intel Core i7-5700HQ 2.7GHz
HD Graphics 5600
min:
27 fps, max:
32 fps
fps
HD Graphics 5600:
19.3 [X] MSI GP62 2QD Intel Core i7-5700HQ 2.7GHz
HD Graphics 5600
min:
16 fps, max:
21 fps
fps
Iris Plus Graphics 640:
19.6 24.2 ~ 22 fps
HD Graphics 5600:
8.8 [X] MSI GP62 2QD Intel Core i7-5700HQ 2.7GHz
HD Graphics 5600
min:
7 fps, max:
10 fps
fps
Iris Plus Graphics 640:
9.2 11.1 ~ 10 fps
HD Graphics 5600:
7.6 [X] MSI GP62 2QD Intel Core i7-5700HQ 2.7GHz
HD Graphics 5600
min:
6 fps, max:
9 fps
fps
HD Graphics 5600:
8.3 [X] MSI GP62 2QD Intel Core i7-5700HQ 2.7GHz
HD Graphics 5600
min:
5 fps, max:
12 fps
fps
HD Graphics 5600:
68 (!) [X] MSI GP62 2QD Intel Core i7-5700HQ 2.7GHz
HD Graphics 5600
min:
50 fps, max:
77 fps
fps
HD Graphics 5600:
50.4 (!) [X] MSI GP62 2QD Intel Core i7-5700HQ 2.7GHz
HD Graphics 5600
min:
41 fps, max:
57 fps
fps
HD Graphics 5600:
28.1 (!) [X] MSI GP62 2QD Intel Core i7-5700HQ 2.7GHz
HD Graphics 5600
min:
23 fps, max:
31 fps
fps
Iris Plus Graphics 640:
20.2 fps
HD Graphics 5600:
40 [X] MSI GP62 2QD Intel Core i7-5700HQ 2.7GHz
HD Graphics 5600
min:
32 fps, max:
49 fps
fps
HD Graphics 5600:
28 [X] MSI GP62 2QD Intel Core i7-5700HQ 2.7GHz
HD Graphics 5600
min:
23 fps, max:
34 fps
fps
Iris Plus Graphics 640:
19.5 fps
HD Graphics 5600:
5.8 [X] MSI GP62 2QD Intel Core i7-5700HQ 2.7GHz
HD Graphics 5600
fps
HD Graphics 5600:
17.4 [X] MSI GP62 2QD Intel Core i7-5700HQ 2.7GHz
HD Graphics 5600
min:
13 fps, max:
25 fps
fps
Iris Plus Graphics 640:
24.9 fps
HD Graphics 5600:
16 [X] MSI GP62 2QD Intel Core i7-5700HQ 2.7GHz
HD Graphics 5600
min:
13 fps, max:
20 fps
fps
Iris Plus Graphics 640:
28 fps
HD Graphics 5600:
8 [X] MSI GP62 2QD Intel Core i7-5700HQ 2.7GHz
HD Graphics 5600
min:
7 fps, max:
9 fps
fps
Iris Plus Graphics 640:
13 fps
HD Graphics 5600:
15.8 [X] MSI GP62 2QD Intel Core i7-5700HQ 2.7GHz
HD Graphics 5600
min:
13 fps, max:
20 fps
fps
HD Graphics 5600:
0 (!) [X] MSI GP62 2QD Intel Core i7-5700HQ 2.7GHz
HD Graphics 5600
fps
Iris Plus Graphics 640:
23.5 25.8 ~ 25 fps
Iris Plus Graphics 640:
16.7 19.4 ~ 18 fps
Iris Plus Graphics 640:
9.1 fps
Iris Plus Graphics 640:
14.2 fps
HD Graphics 5600:
0 (!) [X] MSI GP62 2QD Intel Core i7-5700HQ 2.7GHz
HD Graphics 5600
fps
Iris Plus Graphics 640:
44.7 fps
Iris Plus Graphics 640:
26.2 fps
Iris Plus Graphics 640:
12.9 fps
HD Graphics 5600:
17.9 [X] MSI GP62 2QD Intel Core i7-5700HQ 2.7GHz
HD Graphics 5600
min:
11 fps, max:
25 fps
fps
HD Graphics 5600:
31.2 [X] MSI GP62 2QD Intel Core i7-5700HQ 2.7GHz
HD Graphics 5600
min:
28 fps, max:
35 fps
fps
HD Graphics 5600:
18.5 [X] MSI GP62 2QD Intel Core i7-5700HQ 2.7GHz
HD Graphics 5600
min:
15 fps, max:
22 fps
fps
HD Graphics 5600:
70 [X] MSI GP62 2QD Intel Core i7-5700HQ 2.7GHz
HD Graphics 5600
min:
64 fps, max:
76 fps
fps
HD Graphics 5600:
39.8 [X] MSI GP62 2QD Intel Core i7-5700HQ 2.7GHz
HD Graphics 5600
min:
34 fps, max:
44 fps
fps
HD Graphics 5600:
20.8 [X] MSI GP62 2QD Intel Core i7-5700HQ 2.7GHz
HD Graphics 5600
min:
17 fps, max:
23 fps
fps
HD Graphics 5600:
74 [X] MSI GP62 2QD Intel Core i7-5700HQ 2.7GHz
HD Graphics 5600
min:
50 fps, max:
87 fps
fps
HD Graphics 5600:
48 [X] MSI GP62 2QD Intel Core i7-5700HQ 2.7GHz
HD Graphics 5600
min:
32 fps, max:
58 fps
fps
HD Graphics 5600:
22.9 [X] MSI GP62 2QD Intel Core i7-5700HQ 2.7GHz
HD Graphics 5600
min:
13 fps, max:
31 fps
fps
HD Graphics 5600:
16.5 [X] MSI GP62 2QD Intel Core i7-5700HQ 2.7GHz
HD Graphics 5600
min:
11 fps, max:
24 fps
fps
HD Graphics 5600:
31.2 [X] MSI GP72 Intel Core i7-5700HQ 2.7GHz
HD Graphics 5600
fps
HD Graphics 5600:
20.7 [X] MSI GP72 Intel Core i7-5700HQ 2.7GHz
HD Graphics 5600
fps
HD Graphics 5600:
7.2 [X] MSI GP72 Intel Core i7-5700HQ 2.7GHz
HD Graphics 5600
fps
HD Graphics 5600:
16.4 [X] MSI GP72 Intel Core i7-5700HQ 2.7GHz
HD Graphics 5600
fps
HD Graphics 5600:
7.6 [X] MSI GP72 Intel Core i7-5700HQ 2.7GHz
HD Graphics 5600
fps
Iris Plus Graphics 640:
68 92 ~ 80 fps
Iris Plus Graphics 640:
55 63.7 ~ 59 fps
Iris Plus Graphics 640:
27.6 29.5 ~ 29 fps
Iris Plus Graphics 640:
19.8 23 ~ 21 fps
HD Graphics 5600:
12 [X] MSI GP72 Intel Core i7-5700HQ 2.7GHz
HD Graphics 5600
fps
HD Graphics 5600:
9 [X] MSI GP72 Intel Core i7-5700HQ 2.7GHz
HD Graphics 5600
fps
HD Graphics 5600:
5 [X] MSI GP72 Intel Core i7-5700HQ 2.7GHz
HD Graphics 5600
fps
HD Graphics 5600:
14.7 [X] MSI GT72 Intel Core i7-5700HQ 2.7GHz
HD Graphics 5600
fps
HD Graphics 5600:
9.6 [X] MSI GT72 Intel Core i7-5700HQ 2.7GHz
HD Graphics 5600
fps
Iris Plus Graphics 640:
13.4 fps
HD Graphics 5600:
5.6 [X] MSI GT72 Intel Core i7-5700HQ 2.7GHz
HD Graphics 5600
fps
HD Graphics 5600:
3.1 [X] MSI GT72 Intel Core i7-5700HQ 2.7GHz
HD Graphics 5600
fps
Iris Plus Graphics 640:
4 fps
HD Graphics 5600:
112.7 [X] MSI GT72 Intel Core i7-5700HQ 2.7GHz
HD Graphics 5600
fps
HD Graphics 5600:
27.4 [X] MSI GT72 Intel Core i7-5700HQ 2.7GHz
HD Graphics 5600
fps
HD Graphics 5600:
12.9 [X] MSI GT72 Intel Core i7-5700HQ 2.7GHz
HD Graphics 5600
fps
HD Graphics 5600:
12.5 [X] MSI GT72 Intel Core i7-5700HQ 2.7GHz
HD Graphics 5600
fps
Iris Plus Graphics 640:
56.7 fps
Iris Plus Graphics 640:
28.9 fps
Iris Plus Graphics 640:
11.8 fps
HD Graphics 5600:
37.8 [X] MSI GT72 Intel Core i7-5700HQ 2.7GHz
HD Graphics 5600
fps
HD Graphics 5600:
26.8 [X] MSI GT72 Intel Core i7-5700HQ 2.7GHz
HD Graphics 5600
fps
HD Graphics 5600:
10.8 [X] MSI GT72 Intel Core i7-5700HQ 2.7GHz
HD Graphics 5600
fps
HD Graphics 5600:
6 [X] MSI GT72 Intel Core i7-5700HQ 2.7GHz
HD Graphics 5600
fps
HD Graphics 5600:
19 [X] MSI GT72 Intel Core i7-5700HQ 2.7GHz
HD Graphics 5600
fps
HD Graphics 5600:
13.5 [X] MSI GT72 Intel Core i7-5700HQ 2.7GHz
HD Graphics 5600
fps
HD Graphics 5600:
7.7 [X] MSI GT72 Intel Core i7-5700HQ 2.7GHz
HD Graphics 5600
fps
HD Graphics 5600:
6.7 [X] MSI GT72 Intel Core i7-5700HQ 2.7GHz
HD Graphics 5600
fps
HD Graphics 5600:
32.1 [X] MSI GT72 Intel Core i7-5700HQ 2.7GHz
HD Graphics 5600
fps
HD Graphics 5600:
20.3 [X] MSI GT72 Intel Core i7-5700HQ 2.7GHz
HD Graphics 5600
fps
HD Graphics 5600:
7.2 [X] MSI GT72 Intel Core i7-5700HQ 2.7GHz
HD Graphics 5600
fps
HD Graphics 5600:
4.2 [X] MSI GT72 Intel Core i7-5700HQ 2.7GHz
HD Graphics 5600
fps
HD Graphics 5600:
22.5 [X] MSI GT72 Intel Core i7-5700HQ 2.7GHz
HD Graphics 5600
fps
HD Graphics 5600:
16.3 [X] MSI GT72 Intel Core i7-5700HQ 2.7GHz
HD Graphics 5600
fps
HD Graphics 5600:
8.4 [X] MSI GT72 Intel Core i7-5700HQ 2.7GHz
HD Graphics 5600
fps
HD Graphics 5600:
6.3 [X] MSI GT72 Intel Core i7-5700HQ 2.7GHz
HD Graphics 5600
fps
HD Graphics 5600:
0 (!) [X] MSI GT72 Intel Core i7-5700HQ 2.7GHz
HD Graphics 5600
fps
HD Graphics 5600:
0 (!) [X] MSI GT72 Intel Core i7-5700HQ 2.7GHz
HD Graphics 5600
fps
HD Graphics 5600:
0 (!) [X] MSI GT72 Intel Core i7-5700HQ 2.7GHz
HD Graphics 5600
fps
HD Graphics 5600:
0 (!) [X] MSI GT72 Intel Core i7-5700HQ 2.7GHz
HD Graphics 5600
fps
HD Graphics 5600:
44.6 [X] MSI GT72 Intel Core i7-5700HQ 2.7GHz
HD Graphics 5600
fps
HD Graphics 5600:
21.8 [X] MSI GT72 Intel Core i7-5700HQ 2.7GHz
HD Graphics 5600
fps
HD Graphics 5600:
9.9 [X] MSI GT72 Intel Core i7-5700HQ 2.7GHz
HD Graphics 5600
fps
HD Graphics 5600:
5.2 [X] MSI GT72 Intel Core i7-5700HQ 2.7GHz
HD Graphics 5600
fps
HD Graphics 5600:
74 [X] MSI GT72 Intel Core i7-5700HQ 2.7GHz
HD Graphics 5600
fps
HD Graphics 5600:
49 [X] MSI GT72 Intel Core i7-5700HQ 2.7GHz
HD Graphics 5600
fps
HD Graphics 5600:
25 [X] MSI GT72 Intel Core i7-5700HQ 2.7GHz
HD Graphics 5600
fps
HD Graphics 5600:
15 [X] MSI GT72 Intel Core i7-5700HQ 2.7GHz
HD Graphics 5600
fps
HD Graphics 5600:
21.8 [X] MSI GT72 Intel Core i7-5700HQ 2.7GHz
HD Graphics 5600
fps
HD Graphics 5600:
14 [X] MSI GT72 Intel Core i7-5700HQ 2.7GHz
HD Graphics 5600
fps
HD Graphics 5600:
6.7 [X] MSI GT72 Intel Core i7-5700HQ 2.7GHz
HD Graphics 5600
fps
HD Graphics 5600:
6.3 [X] MSI GT72 Intel Core i7-5700HQ 2.7GHz
HD Graphics 5600
fps
HD Graphics 5600:
45.3 [X] MSI GT72 Intel Core i7-5700HQ 2.7GHz
HD Graphics 5600
fps
HD Graphics 5600:
28.3 [X] MSI GT72 Intel Core i7-5700HQ 2.7GHz
HD Graphics 5600
fps
HD Graphics 5600:
14.4 [X] MSI GT72 Intel Core i7-5700HQ 2.7GHz
HD Graphics 5600
fps
HD Graphics 5600:
10.5 [X] MSI GT72 Intel Core i7-5700HQ 2.7GHz
HD Graphics 5600
fps
HD Graphics 5600:
32 [X] MSI GT72 Intel Core i7-5700HQ 2.7GHz
HD Graphics 5600
fps
HD Graphics 5600:
19.9 [X] MSI GT72 Intel Core i7-5700HQ 2.7GHz
HD Graphics 5600
fps
HD Graphics 5600:
10.5 [X] MSI GT72 Intel Core i7-5700HQ 2.7GHz
HD Graphics 5600
fps
HD Graphics 5600:
8.3 [X] MSI GT72 Intel Core i7-5700HQ 2.7GHz
HD Graphics 5600
fps
HD Graphics 5600:
65.3 [X] MSI GT72 Intel Core i7-5700HQ 2.7GHz
HD Graphics 5600
fps
HD Graphics 5600:
45.7 [X] MSI GT72 Intel Core i7-5700HQ 2.7GHz
HD Graphics 5600
fps
HD Graphics 5600:
24.7 [X] MSI GT72 Intel Core i7-5700HQ 2.7GHz
HD Graphics 5600
fps
HD Graphics 5600:
187.4 [X] MSI GT72 Intel Core i7-5700HQ 2.7GHz
HD Graphics 5600
fps
HD Graphics 5600:
52.6 [X] MSI GT72 Intel Core i7-5700HQ 2.7GHz
HD Graphics 5600
fps
HD Graphics 5600:
25.2 [X] MSI GT72 Intel Core i7-5700HQ 2.7GHz
HD Graphics 5600
fps
Iris Plus Graphics 640:
28.6 fps
HD Graphics 5600:
16.8 [X] MSI GT72 Intel Core i7-5700HQ 2.7GHz
HD Graphics 5600
fps
Iris Plus Graphics 640:
20.2 20.8 ~ 21 fps
HD Graphics 5600:
101.1 [X] MSI GT72 Intel Core i7-5700HQ 2.7GHz
HD Graphics 5600
fps
HD Graphics 5600:
44.9 [X] MSI GT72 Intel Core i7-5700HQ 2.7GHz
HD Graphics 5600
fps
HD Graphics 5600:
22.9 [X] MSI GT72 Intel Core i7-5700HQ 2.7GHz
HD Graphics 5600
fps
HD Graphics 5600:
12.5 [X] MSI GT72 Intel Core i7-5700HQ 2.7GHz
HD Graphics 5600
fps
HD Graphics 5600:
30.3 [X] MSI GT72 Intel Core i7-5700HQ 2.7GHz
HD Graphics 5600
fps
HD Graphics 5600:
17.9 [X] MSI GT72 Intel Core i7-5700HQ 2.7GHz
HD Graphics 5600
fps
HD Graphics 5600:
5.9 [X] MSI GT72 Intel Core i7-5700HQ 2.7GHz
HD Graphics 5600
fps
HD Graphics 5600:
3.8 [X] MSI GT72 Intel Core i7-5700HQ 2.7GHz
HD Graphics 5600
fps
HD Graphics 5600:
27.7 [X] MSI GT72 Intel Core i7-5700HQ 2.7GHz
HD Graphics 5600
fps
HD Graphics 5600:
15.9 [X] MSI GT72 Intel Core i7-5700HQ 2.7GHz
HD Graphics 5600
fps
HD Graphics 5600:
12.7 [X] MSI GT72 Intel Core i7-5700HQ 2.7GHz
HD Graphics 5600
fps
HD Graphics 5600:
6.1 [X] MSI GT72 Intel Core i7-5700HQ 2.7GHz
HD Graphics 5600
fps
HD Graphics 5600:
46.9 [X] MSI GT72 Intel Core i7-5700HQ 2.7GHz
HD Graphics 5600
fps
Iris Plus Graphics 640:
43.1 60.3 ~ 52 fps
HD Graphics 5600:
30.9 [X] MSI GT72 Intel Core i7-5700HQ 2.7GHz
HD Graphics 5600
fps
Iris Plus Graphics 640:
29.7 42 ~ 36 fps
HD Graphics 5600:
18.6 [X] MSI GT72 Intel Core i7-5700HQ 2.7GHz
HD Graphics 5600
fps
Iris Plus Graphics 640:
23.2 30.7 ~ 27 fps
HD Graphics 5600:
6 [X] MSI GT72 Intel Core i7-5700HQ 2.7GHz
HD Graphics 5600
fps
Iris Plus Graphics 640:
8.2 9.9 ~ 9 fps
HD Graphics 5600:
32.9 [X] MSI GT72 Intel Core i7-5700HQ 2.7GHz
HD Graphics 5600
fps
HD Graphics 5600:
24 [X] MSI GT72 Intel Core i7-5700HQ 2.7GHz
HD Graphics 5600
fps
HD Graphics 5600:
15.8 [X] MSI GT72 Intel Core i7-5700HQ 2.7GHz
HD Graphics 5600
fps
HD Graphics 5600:
7.5 [X] MSI GT72 Intel Core i7-5700HQ 2.7GHz
HD Graphics 5600
fps
HD Graphics 5600:
57.6 [X] MSI GT72 Intel Core i7-5700HQ 2.7GHz
HD Graphics 5600
fps
Iris Plus Graphics 640:
61 68.2 ~ 65 fps
HD Graphics 5600:
30.3 [X] MSI GT72 Intel Core i7-5700HQ 2.7GHz
HD Graphics 5600
fps
Iris Plus Graphics 640:
40.2 45.1 ~ 43 fps
HD Graphics 5600:
25 [X] MSI GT72 Intel Core i7-5700HQ 2.7GHz
HD Graphics 5600
fps
Iris Plus Graphics 640:
33.5 38.3 ~ 36 fps
HD Graphics 5600:
7.5 [X] MSI GT72 Intel Core i7-5700HQ 2.7GHz
HD Graphics 5600
fps
Iris Plus Graphics 640:
10.7 12.5 ~ 12 fps
HD Graphics 5600:
81.6 [X] MSI GT72 Intel Core i7-5700HQ 2.7GHz
HD Graphics 5600
fps
Iris Plus Graphics 640:
103 132.6 ~ 118 fps
HD Graphics 5600:
39.4 [X] MSI GT72 Intel Core i7-5700HQ 2.7GHz
HD Graphics 5600
fps
Iris Plus Graphics 640:
54.1 68.7 ~ 61 fps
HD Graphics 5600:
25 [X] MSI GT72 Intel Core i7-5700HQ 2.7GHz
HD Graphics 5600
fps
Iris Plus Graphics 640:
37 47.1 ~ 42 fps
HD Graphics 5600:
11.4 [X] MSI GT72 Intel Core i7-5700HQ 2.7GHz
HD Graphics 5600
fps
Iris Plus Graphics 640:
17.2 21.6 ~ 19 fps
HD Graphics 5600:
30.8 [X] MSI GT72 Intel Core i7-5700HQ 2.7GHz
HD Graphics 5600
fps
HD Graphics 5600:
18.8 [X] MSI GT72 Intel Core i7-5700HQ 2.7GHz
HD Graphics 5600
fps
HD Graphics 5600:
12.4 [X] MSI GT72 Intel Core i7-5700HQ 2.7GHz
HD Graphics 5600
fps
HD Graphics 5600:
4.7 [X] MSI GT72 Intel Core i7-5700HQ 2.7GHz
HD Graphics 5600
fps
Iris Plus Graphics 640:
35.2 fps
Iris Plus Graphics 640:
28.5 fps
v1.28
log 21. 14:32:17
#0 ran 0s before starting gpusingle class +0s ... 0s
#1 checking url part for id 9906 +0s ... 0s
#2 checking url part for id 5949 +0s ... 0s
#3 checking url part for id 7656 +0s ... 0s
#4 redirected to Ajax server, took 1726921936s time from redirect:0 +0s ... 0s
#5 did not recreate cache, as it is less than 5 days old! Created at Thu, 19 Sep 2024 05:16:33 +0200 +0s ... 0s
#6 composed specs +0.005s ... 0.005s
#7 did output specs +0s ... 0.005s
#8 start showIntegratedCPUs +0s ... 0.005s
#9 getting avg benchmarks for device 9906 +0.01s ... 0.015s
#10 got single benchmarks 9906 +0s ... 0.015s
#11 getting avg benchmarks for device 5949 +0.004s ... 0.019s
#12 got single benchmarks 5949 +0.004s ... 0.023s
#13 getting avg benchmarks for device 7656 +0s ... 0.023s
#14 got single benchmarks 7656 +0.001s ... 0.024s
#15 got avg benchmarks for devices +0s ... 0.024s
#16 min, max, avg, median took s +0.014s ... 0.038s
#17 before gaming benchmark output +0s ... 0.038s
#18 Got 275 rows for game benchmarks. +0.009s ... 0.047s
#19 composed SQL query for gamebenchmarks +0s ... 0.047s
#20 got data and put it in $dataArray +0.003s ... 0.05s
#21 benchmarks composed for output. +0.019s ... 0.069s
#22 calculated avg scores. +0s ... 0.069s
#23 return log +0.001s ... 0.07s
Teilen Sie diesen Artikel, um uns zu unterstützen. Jeder Link hilft!
Autor: Klaus Hinum, 8.09.2017 (Update: 1.07.2023)
 Deutsch
 English
 Español
 Français
 Italiano
 Nederlands
 Polski
 Português
 Русский
 Türkçe
 Svenska
 Chinese
 Magyar