Notebookcheck Logo

Intel UHD Graphics (Jasper Lake 24 EU) vs Intel UHD Graphics 615 vs Intel HD Graphics P630

Intel UHD Graphics (Jasper Lake 24 EU)

► remove from comparison Intel UHD Graphics (Jasper Lake 24 EU)

Die Intel UHD Graphics 24 EUs (Jasper Lake, Gen. 11) ist eine Prozessorgrafikkarte, die im Januar 2021 vorgestellt wurde. Sie wird in den Mid-Range-Modellen der Jasper Lake Prozessoren genutzt (Celeron) und bietet alle 24 der 32 EUs (Executing Units - Shader Cluster) und keinen eigenen dedizierten Grafikspeicher. Die Taktung ist abhängig vom CPU-Modell und variiert von 350 - 800 MHz (minimaler Basis bis maximaler Boost-Takt). Zum Launch findet man die GPU im mobilen Celeron N5100 (6W) und im Desktop N5105 (10W).

Die Gen. 11 (Generation 11) Architektur wird in Ice Lake, Lakefield und Jasper Lake eingesetzt und bietet einen deutlichen Geschwindigkeitsschub im Vergleich zur Vorgängergeneration. Die neuere Xe Graphics (Gen. 12) in Tiger Lake ist aber nochmals deutlich schneller.

Als besonderes Feature hebt Intel das neue Variable Rate Shading (VRS) der Gen11 Grafik hervor. Damit kann der Spielentwickler Bereiche definieren die mit weniger Genauigkeit geshadet werden (z.B. weit entfernte Objekte, oder Objekte im Nebel) und somit bei gleicher visueller Qualität deutlich Performance gewinnen. Hier können je nach Szene bis zu 20 - 30% (Unreal Engine bzw Civ6) an Leistung gewonnen werden. Bis jetzt unterstütz VRS lediglich Nvidia mit Turing (GTX 1650 und aufwärts).

Neben der Spieleleistung soll auch der Videoencoder deutlich schneller geworden sein. Wie der Vorgänger sollte er weiterhin H.265/HEVC im Main10-Profil mit 10 Bit Farbtiefe sowie Googles VP9-Codec in Hardware dekodieren.

Die Intel UHD wird wie Ice Lake und Lakefield im 10nm Prozess bei Intel gefertigt und soll mit TSMCs 7nm Prozess mithalten können.

Intel UHD Graphics 615

► remove from comparison Intel UHD Graphics 615

Die Intel UHD Graphics 615 (GT2) ist eine Prozessorgrafikkarte der im Sommer 2018 vorgestellten Amber-Lake-Generation. Als Nachfolger der Intel HD Graphics 615 (Kaby-Lake-Y) ist die UHD 615 dabei in der besonders sparsamen Y-Serie mit 5 Watt TDP zu finden. Die sogenannte GT2-Ausbaustufe der GPU verfügt über 24 Ausführungseinheiten (EUs) und taktet je nach Modell mit bis zu 1.000 MHz. Technisch gibt es keine Unterschiede zur alten HD Graphics 615, nur die Taktraten wurden leicht abgeändert und durch den verbesserten 14nm++ Prozess könnte der Turbo etwas länger gehalten werden.

Mangels eigenem Grafikspeicher oder eDRAM-Cache greift die UHD Graphics 615 über das Interface des Prozessors auf den System-RAM zu (2x 64 Bit DDR3L/LPDDR3).

Performance

Die exakte Leistung der UHD Graphics 615 hängt stark vom jeweiligen CPU-Modell sowie dem konkreten Endgerät ab, da sich Maximaltaktrate sowie TDP-Konfiguration/Kühlung erheblich unterscheiden können. Zum anderen bestimmt auch der verwendete Speicher (DDR3L/LPDDR3) die Performance. Insgesamt dürfte die UHD 615 etwa das Niveau der alten Kaby-Lake HD Graphics 615 erreichen. Einige aktuelle anspruchslose Spiele wie Farming Simulator 17 oder Rocket League können so in niedrigsten Einstellungen flüssig dargestellt werden. Mit gelegentlichen Rucklern muss man jedoch immer rechnen. Detaillierte Benchmarks und viele Spieletests der gleich schnellen HD Graphics 615 finden sie hier.

Anders als Skylake kann Kaby Lake und damit auch Amber Lake nun auch H.265/HEVC im Main10-Profil mit 10 Bit Farbtiefe sowie Googles VP9-Codec in Hardware decodieren. HDCP 2.2 sollte unterstützt werden, was beispielsweise für die Ausgabe von Netflix-Videos in 4K benötigt wird. HDMI 2.0 unterstützt die UHD Graphics 615 jedoch weiterhin nur per Wandler (LSPCon) über den DisplayPort.

Leistungsaufnahme

Die UHD Graphics 615 ist in ULV-Prozessoren der 5-Watt-Klasse zu finden (TDP kann vom Gerätehersteller angepasst werden) und damit für passiv gekühlte Tablets und Ultrabooks geeignet.

Intel HD Graphics P630

► remove from comparison Intel HD Graphics P630

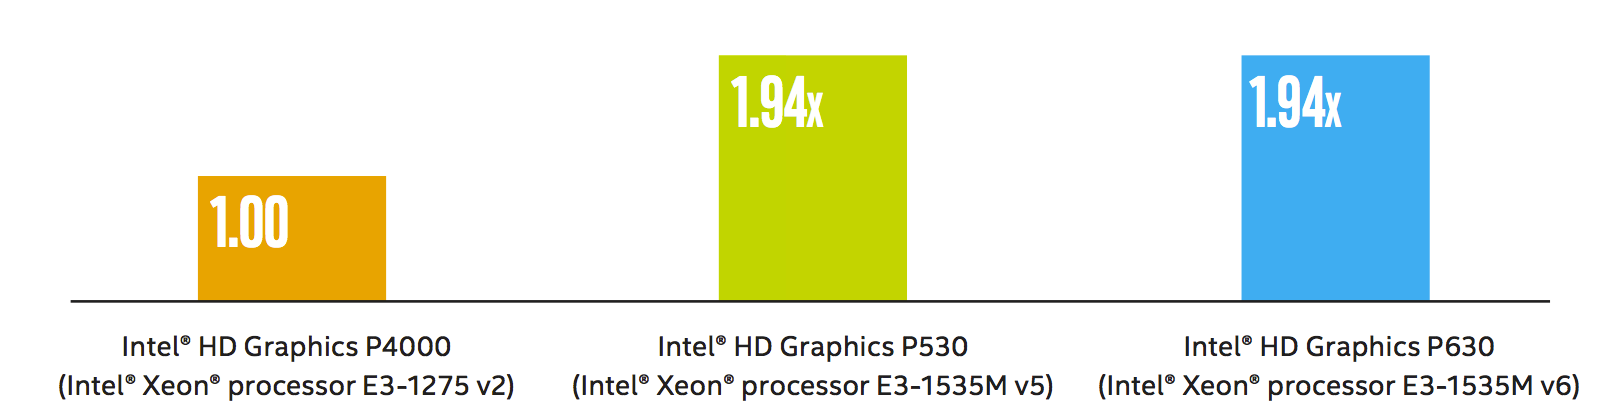
Die Intel HD Graphics P630 (GT2) ist eine integrierte Workstation-Grafikeinheit, die in verschiedenen Desktop- und Notebook-Prozessoren der 2017 vorgestellten Kaby-Lake-Generation zu finden ist (Xeon E3-1200 v6 und e3-1500M v6 Serien). Sie ist identisch mit der Intel HD Graphics 630, jedoch sind die Treiber für professionelle Software optimiert. Daher unterscheidet sie sich auch nicht von der Intel HD Graphics P530 und erreicht laut Intel auch die selbe Leistung im SPEC Viewperf12 (1.94x der alten Intel HD Graphics P4000). Die Grafikkarte ist derzeit für 15 CAD- und Workstation-Anwendungen zertifiziert.

Features

Neu bei der Kaby-Lake Generation ist die verbesserte Videoengine, welche nun auch H.265/HEVC im Main10-profil mit 10 Bit Farbtiefe sowie Googles VP9-Codec in Hardware dekodieren kann. Die Chips mit HD Graphics 530 sollten auch bereits HDCP 2.2 unterstützen und somit z.B. Netflix-Videos unter Windows 10 in 4K ausgeben können (im Gegensatz zu den ersten Kaby-Lake Dual-Core Chips mit Intel HD Graphics 620).

Leistungsaufnahme

Die HD Graphics P630 ist in Desktop- und Notebook-Prozessoren verschiedener TDP-Klassen zu finden. Die Quad-Core CPUs sind jedoch meistens in größeren und schwereren Notebooks verbaut. Der verbesserte 14nm+ Prozess verspricht jedoch eine etwas geringere Leistungsaufnahme im Vergleich zur Intel HD Graphics P530.

Quelle: http://www.intel.com/content/dam/www/public/us/en/documents/guides/hd-graphics-performance-guide.pdf

Intel UHD Graphics (Jasper Lake 24 EU)Intel UHD Graphics 615Intel HD Graphics P630
Gen. 9.5 Serie
Iris Plus Graphics G7 (Ice Lake 64 EU) 64 @ 0.3 - 1.1 GHz
Iris Plus Graphics G4 (Ice Lake 48 EU) 48 @ 0.3 - 1.1 GHz
UHD Graphics G1 (Ice Lake 32 EU) 32 @ 0.3 - 1.1 GHz
UHD Graphics G7 (Lakefield GT2 64 EU) 64 @ 0.2 - 0.5 GHz
UHD Graphics G4 (Lakefield GT1 48 EU) 48 @ 0.2 - 0.5 GHz
UHD Graphics (Jasper Lake 32 EU) 32 @ 0.35 - 0.9 GHz
UHD Graphics (Elkhart Lake 32 EU) 32 @ 0.4 - 0.85 GHz
UHD Graphics (Jasper Lake 24 EU) 24 @ 0.35 - 0.8 GHz
UHD Graphics (Elkhart Lake 16 EU) 16 @ 0.25 - 0.85 GHz
UHD Graphics (Jasper Lake 16 EU) 24 @ 0.35 - 0.8 GHz
Iris Plus Graphics 655 48 @ 0.3 - 1.2 GHz
Iris Plus Graphics 650 48 @ 0.3 - 1.1 GHz64/128 Bit
Iris Plus Graphics 645 48 @ 0.3 - 1.15 GHz
Iris Plus Graphics 640 48 @ 0.3 - 1.05 GHz64/128 Bit
UHD Graphics 630 24 @ 0.3 - 1.15 GHz64/128 Bit
UHD Graphics P630 24 @ 0.3 - 1.2 GHz64/128 Bit
HD Graphics 630 24 @ 0.3 - 1.15 GHz64/128 Bit
HD Graphics P630 24 64/128 Bit
UHD Graphics 620 24 @ 0.3 - 1.15 GHz
HD Graphics 620 24 @ 0.3 - 1.05 GHz64/128 Bit
UHD Graphics 617 24 @ 0.3 - 1.15 GHz64/128 Bit
UHD Graphics 615 24 @ 0.3 - 1 GHz64/128 Bit
HD Graphics 615 24 @ 0.3 - 1.05 GHz64/128 Bit
CodenameGen. 11Kaby-Lake GT2Kaby-Lake-H-GT2
ArchitekturGen. 11Gen. 9 Amber LakeGen. 9.5 Kaby Lake
Pipelines24 - unified24 - unified24 - unified
Kerntakt350 - 800 (Boost) MHz300 - 1000 (Boost) MHz
Shared Memoryjajaja
APIDirectX 12_1, OpenGL 4.5DirectX 12_1, OpenGL 4.4DirectX 12_1, OpenGL 4.4
Stromverbrauch4.8 - 10 Watt5 Watt
Herstellungsprozess10 nm14 nm14 nm
FeaturesQuickSyncQuickSyncQuickSync
Erscheinungsdatum11.01.2021 30.08.2018 05.08.2015
Speicherbandbreite64/128 Bit64/128 Bit
SpeichertypDDR3L/LPDDR3
CPU in UHD Graphics (Jasper Lake 24 EU)GPU Base SpeedGPU Boost / Turbo
Intel Celeron N51054 x 2000 MHz, 10 W450 MHz800 MHz
Intel Celeron N51004 x 1100 MHz, 6 W350 MHz800 MHz
min. - max.350 - 450 MHz800 MHz
CPU in UHD Graphics 615GPU Base SpeedGPU Boost / Turbo
Intel Core i5-10310Y4 x 1100 MHz, 7 W300 MHz1050 MHz
Intel Core i5-10210Y4 x 1000 MHz, 7 W300 MHz1050 MHz
Intel Core i7-8500Y2 x 1500 MHz, 5 W300 MHz1000 MHz
min. - max.300 - 450 MHz800 - 1050 MHz
CPU in HD Graphics P630GPU Base SpeedGPU Boost / Turbo
Intel Xeon E3-1535M v64 x 3100 MHz, 45 W300 MHz1150 MHz
Intel Xeon E3-1505M v64 x 3000 MHz, 45 W300 MHz1150 MHz
min. - max.300 - 450 MHz800 - 1150 MHz

Benchmarks

Performance Rating - 3DMark 11 + Fire Strike + Time Spy - UHD Graphics 615
0.4 pt (1%)
3DMark - 3DMark Time Spy Score
355 Points (1%)
min: 232     avg: 277.2     median: 275 (1%)     max: 328 Points
400 Points (1%)
3DMark - 3DMark Time Spy Graphics
312 Points (1%)
min: 205     avg: 244.7     median: 242.5 (1%)     max: 289 Points
3DMark - 3DMark Ice Storm Unlimited Graphics
min: 50702     avg: 60159     median: 57024 (6%)     max: 73265 Points
3DMark - 3DMark Ice Storm Extreme Graphics
min: 23099     avg: 26792     median: 25456 (3%)     max: 35452 Points
3DMark - 3DMark Cloud Gate Score
6659 Points (7%)
min: 3490     avg: 4533     median: 4423 (5%)     max: 5622 Points
8280 Points (9%)
3DMark - 3DMark Cloud Gate Graphics
8388 Points (2%)
min: 4521     avg: 6316     median: 6583 (2%)     max: 7568 Points
3DMark - 3DMark Fire Strike Standard Score
1043 Points (2%)
min: 509     avg: 730     median: 738 (1%)     max: 881 Points
1040 Points (2%)
3DMark - 3DMark Fire Strike Standard Graphics
1106 Points (1%)
min: 563     avg: 816     median: 819 (1%)     max: 976 Points
3DMark - 3DMark Ice Storm Graphics
min: 34728     avg: 42945     median: 42909 (5%)     max: 53693 Points
3DMark - 3DMark Sling Shot (ES 3.0)
2413 Points (21%)
3DMark - 3DMark Sling Shot (ES 3.0) Graphics
3161 Points (19%)
3DMark - 3DMark Sling Shot Extreme (ES 3.1)
1838 Points (9%)
3DMark - 3DMark Sling Shot Extreme (ES 3.1) Graphics
2049 Points (7%)
3DMark - 3DMark Wild Life Unlimited
1911 Points (1%)
3DMark - 3DMark Wild Life Extreme Unlimited
530 Points (1%)
3DMark - 3DMark Night Raid
min: 2535     avg: 2962     median: 2975 (3%)     max: 3376 Points
3DMark - 3DMark Night Raid Graphics Score
min: 2887     avg: 3543     median: 3810 (1%)     max: 3933 Points
3DMark 11 - 3DM11 Performance Score
1654 Points (2%)
3DMark 11 - 3DM11 Performance GPU
1458 Points (1%)
3DMark Vantage
3DM Vant. Perf. total + Intel UHD Graphics 615
3DMark Vantage - 3DM Vant. Perf. total
3813 Points (1%)
3DM Vant. Perf. GPU no PhysX + Intel UHD Graphics 615
3DMark Vantage - 3DM Vant. Perf. GPU no PhysX
3240 Points (2%)
3DMark 06 3DMark 06 - Standard 1280x1024 + Intel UHD Graphics 615
3DMark 06
min: 6386     avg: 6602     median: 6601.5 (9%)     max: 6817 Points
Cinebench R10 Cinebench R10 Shading (32bit) + Intel UHD Graphics 615
Cinebench R10 - Cinebench R10 Shading (32bit)
min: 4302     avg: 6351     median: 6378 (5%)     max: 8347 Points
Cinebench R11.5 Cinebench R11.5 OpenGL 64 Bit + Intel UHD Graphics 615
Cinebench R11.5 - Cinebench R11.5 OpenGL 64 Bit
min: 19.94     avg: 24.9     median: 25.6 (8%)     max: 28.49 fps
Cinebench R15
Cinebench R15 OpenGL 64 Bit + Intel UHD Graphics (Jasper Lake 24 EU)
Cinebench R15 - Cinebench R15 OpenGL 64 Bit
36.9 fps (2%)
Cinebench R15 OpenGL 64 Bit + Intel UHD Graphics 615
min: 22.54     avg: 32.9     median: 35.2 (2%)     max: 44.49 fps
Cinebench R15 OpenGL Ref. Match 64 Bit + Intel UHD Graphics (Jasper Lake 24 EU)
Cinebench R15 - Cinebench R15 OpenGL Ref. Match 64 Bit
97.8 % (98%)
Cinebench R15 OpenGL Ref. Match 64 Bit + Intel UHD Graphics 615
GFXBench - GFXBench 5.0 Aztec Ruins High Tier Offscreen
min: 6.5     avg: 7.1     median: 7.1 (1%)     max: 7.6 fps
GFXBench - GFXBench 5.0 Aztec Ruins Normal Tier Offscreen
min: 16     avg: 18.1     median: 18.1 (1%)     max: 20.2 fps
GFXBench - GFXBench Car Chase Offscreen
min: 15     avg: 17.7     median: 17.3 (2%)     max: 20.9 fps
GFXBench 3.1 - GFXBench Manhattan ES 3.1 Offscreen
min: 22     avg: 24.7     median: 24.4 (1%)     max: 27.7 fps
GFXBench 3.0 - GFXBench 3.0 Manhattan Offscreen
min: 32     avg: 36.6     median: 36.8 (2%)     max: 40.9 fps
GFXBench (DX / GLBenchmark) 2.7
GFXBench T-Rex HD Offscreen C24Z16 + Intel UHD Graphics 615
GFXBench (DX / GLBenchmark) 2.7 - GFXBench T-Rex HD Offscreen C24Z16
min: 65     avg: 74.2     median: 69.6 (1%)     max: 88 fps
Geekbench 6.2 - Geekbench 6.2 GPU OpenCL
3272 Points (1%)
Geekbench 6.2 - Geekbench 6.2 GPU Vulkan
4154 Points (1%)
LuxMark v2.0 64Bit - LuxMark v2.0 Room GPU
198 Samples/s (1%)
LuxMark v2.0 64Bit - LuxMark v2.0 Sala GPU
473 Samples/s (1%)
ComputeMark v2.1 - ComputeMark v2.1 Result
860 Points (1%)
Power Consumption - Furmark Stress Test Power Consumption - external Monitor *
19.9 Watt (3%)
Power Consumption - The Witcher 3 Power Consumption - external Monitor *
19.1 Watt (3%)
Power Consumption - Witcher 3 Power Consumption *
19.1 Watt (4%)
Power Consumption - Witcher 3 ultra Power Efficiency
0.2 fps per Watt (18%)
Power Consumption - Witcher 3 ultra Power Efficiency - external Monitor
0.2 fps per Watt (17%)
Emissions Witcher 3 Fan Noise + Intel UHD Graphics (Jasper Lake 24 EU)
Emissions - Witcher 3 Fan Noise
24.4 dB(A) (39%)

Average Benchmarks Intel UHD Graphics (Jasper Lake 24 EU) → 100% n=3

Average Benchmarks Intel UHD Graphics 615 → 72% n=3

Average Benchmarks Intel HD Graphics P630 → 112% n=3

- Bereich der Benchmarkergebnisse für diese Grafikkarte
- Durchschnittliche Benchmarkergebnisse für diese Grafikkarte
* Smaller numbers mean a higher performance
1 This benchmark is not used for the average calculation

Spiele-Benchmarks

Die folgenden Benchmarks basieren auf unseren Spieletests mit Testnotebooks. Die Performance dieser Grafikkarte bei den gelisteten Spielen ist abhängig von der verwendeten CPU, Speicherausstattung, Treiber und auch Betriebssystem. Dadurch müssen die untenstehenden Werte nicht repräsentativ sein. Detaillierte Informationen über das verwendete System sehen Sie nach einem Klick auf den fps-Wert.

GRID 2019

GRID 2019

2019
low 1280x720
UHD Graphics 615:
17.7  fps
med. 1920x1080
UHD Graphics 615:
6.9  fps
low 1280x720
UHD Graphics 615:
7.3  fps
med. 1920x1080
UHD Graphics 615:
3.1  fps
Control

Control

2019
low 1280x720
UHD Graphics 615:
7.6  fps
med. 1920x1080
UHD Graphics 615:
2.4  fps
F1 2019

F1 2019

2019
low 1280x720
UHD Graphics 615:
12  fps
low 1280x720
UHD Graphics 615:
15.2  fps
Anno 1800

Anno 1800

2019
low 1280x720
UHD Graphics 615:
9.7 15.1 ~ 12 fps
med. 1920x1080
UHD Graphics 615:
5.2  fps
low 1280x720
UHD Graphics 615:
5  fps
low 1280x720
UHD Graphics 615:
19.2  fps
low 1280x720
UHD Graphics 615:
7  fps
low 1280x720
UHD Graphics 615:
6.2  fps
med. 1920x1080
UHD Graphics 615:
3.5  fps
low 1280x720
UHD Graphics 615:
8.8  fps
low 1280x720
UHD Graphics 615:
10.5  fps
low 1280x720
UHD Graphics 615:
15.7  fps
med. 1920x1080
UHD Graphics 615:
5  fps
low 1280x720
UHD Graphics 615:
5.8  fps
low 1280x720
UHD Graphics 615:
42.1  fps
med. 1920x1080
UHD Graphics 615:
15.8  fps
Hitman 2

Hitman 2

2018
low 1280x720
UHD Graphics 615:
7.6  fps
low 1280x720
UHD Graphics 615:
7  fps
low 1280x720
UHD Graphics 615:
13  fps
low 1280x720
UHD Graphics 615:
10  fps
F1 2018

F1 2018

2018
low 1280x720
UHD Graphics 615:
19  fps
med. 1920x1080
UHD Graphics 615:
12  fps
low 1280x720
UHD Graphics 615:
11.5  fps
Far Cry 5

Far Cry 5

2018
low 1280x720
UHD Graphics 615:
6  fps
World of Tanks enCore

World of Tanks enCore

2018
low 1366x768
UHD Graphics 615:
95.1  fps
med. 1920x1080
UHD Graphics 615:
11.8  fps
low 1280x720
100%
UHD Graphics (Jasper Lake 24 EU):
20.8  fps
53%
UHD Graphics 615:
7.8 8.1 10 10.2 19.2 ~ 11 fps
med. 1920x1080
100%
UHD Graphics (Jasper Lake 24 EU):
13.3  fps
60%
UHD Graphics 615:
6.3 6.5 7.2 8.2 12.5 ~ 8 fps
high 1920x1080
100%
UHD Graphics (Jasper Lake 24 EU):
12.3  fps
65%
UHD Graphics 615:
6 6.1 7.7 11.3 ~ 8 fps
low 1280x720
100%
UHD Graphics (Jasper Lake 24 EU):
13.7  fps
45%
UHD Graphics 615:
6.1  fps
med. 1920x1080
UHD Graphics 615:
3.3  fps
Fortnite

Fortnite

2018
low 1280x720
UHD Graphics 615:
15.9  fps
med. 1920x1080
UHD Graphics 615:
8  fps
ELEX

ELEX

2017
low 1280x720
UHD Graphics 615:
9.2  fps
low 1280x720
UHD Graphics 615:
15 17 ~ 16 fps
med. 1920x1080
UHD Graphics 615:
7  fps
low 1280x720
UHD Graphics 615:
51.8  fps
med. 1366x768
UHD Graphics 615:
45.6  fps
high 1920x1080
UHD Graphics 615:
29  fps
low 1280x720
UHD Graphics 615:
33.2 49.1 ~ 41 fps
med. 1920x1080
UHD Graphics 615:
16  fps
high 1920x1080
UHD Graphics 615:
10.3  fps
Prey

Prey

2017
low 1280x720
UHD Graphics 615:
14.1 16.8 ~ 15 fps
med. 1920x1080
UHD Graphics 615:
6.9 8.6 ~ 8 fps
low 1280x720
UHD Graphics 615:
8.1  fps
For Honor

For Honor

2017
low 1280x720
UHD Graphics 615:
16.4  fps
low 1024x768
UHD Graphics 615:
29.5  fps
Overwatch

Overwatch

2016
low 1280x720
UHD Graphics 615:
29.9  fps
med. 1366x768
UHD Graphics 615:
21.6  fps
low 1024x768
UHD Graphics 615:
10.5 10.6 15.2 ~ 12 fps
med. 1366x768
UHD Graphics 615:
6.3 9.9 ~ 8 fps
high 1920x1080
UHD Graphics 615:
5.3  fps
low 1024x768
UHD Graphics 615:
31.3  fps
med. 1366x768
UHD Graphics 615:
19.5  fps
low 1366x768
UHD Graphics 615:
53  fps
med. 1366x768
UHD Graphics 615:
34.6  fps
low 1280x720
100%
UHD Graphics (Jasper Lake 24 EU):
73.8  fps
72%
UHD Graphics 615:
40.8 49.5 52 52.6 55.3 56.6 57.2 60.1 ~ 53 fps
med. 1366x768
100%
UHD Graphics (Jasper Lake 24 EU):
24.1  fps
104%
UHD Graphics 615:
17.4 17.7 25.9 25.9 26.3 27.3 29.3 32.1 ~ 25 fps
high 1920x1080
100%
UHD Graphics (Jasper Lake 24 EU):
16.8  fps
77%
UHD Graphics 615:
8.5 11.3 12.1 12.9 13.4 13.6 15.2 15.4 ~ 13 fps
ultra 1920x1080
100%
UHD Graphics (Jasper Lake 24 EU):
15.5  fps
71%
UHD Graphics 615:
7.6 10.3 11.3 11.6 11.8 12.3 13.7 ~ 11 fps
low 1024x768
100%
UHD Graphics (Jasper Lake 24 EU):
21.6  fps
46%
UHD Graphics 615:
9.3 9.5 12.1 ~ 10 fps
med. 1366x768
100%
UHD Graphics (Jasper Lake 24 EU):
14.4  fps
41%
UHD Graphics 615:
5.9  fps
high 1920x1080
100%
UHD Graphics (Jasper Lake 24 EU):
7.8  fps
ultra 1920x1080
100%
UHD Graphics (Jasper Lake 24 EU):
3.9  fps
GTA V

GTA V

2015
low 1024x768
UHD Graphics 615:
16.4  fps
med. 1366x768
UHD Graphics 615:
16.9  fps
low 1280x720
UHD Graphics 615:
27.8  fps
med. 1344x756
UHD Graphics 615:
16.7  fps
low 1024x768
UHD Graphics 615:
97.4  fps
med. 1366x768
UHD Graphics 615:
34.4  fps
high 1920x1080
UHD Graphics 615:
24.7  fps
low 1024x768
UHD Graphics 615:
25.3 31.3 ~ 28 fps
med. 1366x768
UHD Graphics 615:
18.4 21.2 ~ 20 fps
high 1366x768
UHD Graphics 615:
12.1 16.4 ~ 14 fps
low 1280x720
UHD Graphics 615:
27.5 31.1 38.3 38.8 39.2 41.6 49.1 50.2 ~ 39 fps
med. 1366x768
UHD Graphics 615:
15.8 18.1 19.8 22.4 23.6 25 26.5 28.6 ~ 22 fps
high 1366x768
UHD Graphics 615:
13.3 15.8 17.5 18.1 18.2 20.3 22.5 ~ 18 fps
ultra 1920x1080
UHD Graphics 615:
0 (!) 4.4 5.7 6.1 7 7.6 ~ 5 fps
low 1024x768
UHD Graphics 615:
51.2 59.9 ~ 56 fps
med. 1366x768
UHD Graphics 615:
25.7 31.4 ~ 29 fps
high 1366x768
UHD Graphics 615:
16.9 21.2 ~ 19 fps
ultra 1920x1080
UHD Graphics 615:
7.9  fps
low 1024x768
UHD Graphics 615:
100.2  fps
med. 1366x768
UHD Graphics 615:
61.4  fps
high 1366x768
UHD Graphics 615:
36  fps
low 1024x768
UHD Graphics 615:
54.7  fps
med. 1366x768
UHD Graphics 615:
37.5  fps
high 1366x768
UHD Graphics 615:
33.9  fps
ultra 1920x1080
UHD Graphics 615:
19.4  fps
low 1280x720
UHD Graphics 615:
41.7  fps
med. 1366x768
UHD Graphics 615:
23.3  fps
low 1024x768
UHD Graphics 615:
58  fps
high 1366x768
UHD Graphics 615:
39.6  fps
ultra 1920x1080
UHD Graphics 615:
16  fps
low 1024x768
UHD Graphics 615:
144.1  fps
med. 1360x768
UHD Graphics 615:
36.3  fps
high 1360x768
UHD Graphics 615:
23.5  fps

Average Gaming Intel UHD Graphics (Jasper Lake 24 EU) → 100%

Average Gaming Intel UHD Graphics 615 → 63%

Average Gaming 30-70 fps → 72%

Intel UHD Graphics 615lowmed.highultraQHD4K
GRID 201917.76.9
Borderlands 37.33.1
Control7.62.4
F1 201912
Total War: Three Kingdoms15.2
Anno 1800125.22
The Division 25
Dirt Rally 2.019.2
Far Cry New Dawn7
Metro Exodus6.23.5
Apex Legends8.8
Just Cause 410.5
Darksiders III15.75
Battlefield V5.8
Farming Simulator 1942.115.8
Hitman 27.6
Assassin´s Creed Odyssey7
Forza Horizon 413
Shadow of the Tomb Raider10
F1 20181912
Monster Hunter World11.5
Far Cry 56
World of Tanks enCore95.111.8
X-Plane 11.111188
Final Fantasy XV Benchmark6.13.3
Fortnite15.98
ELEX9.2
Middle-earth: Shadow of War167
Team Fortress 251.845.629
Rocket League411610.3
Prey158
Ghost Recon Wildlands8.1
For Honor16.4
Civilization VI29.5
Overwatch29.921.6
Rise of the Tomb Raider1285.3
Rainbow Six Siege31.319.5
World of Warships5334.6
Dota 2 Reborn53251311
The Witcher 3105.9
GTA V16.416.9
Middle-earth: Shadow of Mordor27.816.7
GRID: Autosport97.434.424.7
Battlefield 4282014
BioShock Infinite3922185
Tomb Raider5629197.9
Counter-Strike: GO100.261.436
Diablo III54.737.533.919.4
The Elder Scrolls V: Skyrim41.723.3
Deus Ex Human Revolution5839.616
StarCraft 2144.136.323.5
< 30 fps
< 60 fps
< 120 fps
≥ 120 fps
36
11
3
1
26
5
1
10
3

5


Intel UHD Graphics (Jasper Lake 24 EU)lowmed.highultraQHD4K
X-Plane 11.1120.813.312.3
Final Fantasy XV Benchmark13.7
Dota 2 Reborn73.824.116.815.5
The Witcher 321.614.47.83.9
< 30 fps
< 60 fps
< 120 fps
≥ 120 fps
3

1
3


3


2


Eine Liste mit weiteren Spielen und allen Grafikkarten finden Sie auf unserer Seite: Welches Spiel ist mit welcher Grafikkarte spielbar?

v1.28
log 27. 09:30:04

#0 ran 0s before starting gpusingle class +0s ... 0s

#1 checking url part for id 10642 +0s ... 0s

#2 checking url part for id 8832 +0s ... 0s

#3 checking url part for id 7657 +0s ... 0s

#4 redirected to Ajax server, took 1727422204s time from redirect:0 +0s ... 0s

#5 did not recreate cache, as it is less than 5 days old! Created at Wed, 25 Sep 2024 05:16:56 +0200 +0s ... 0s

#6 composed specs +0.006s ... 0.006s

#7 did output specs +0s ... 0.006s

#8 start showIntegratedCPUs +0s ... 0.006s

#9 getting avg benchmarks for device 10642 +0.019s ... 0.025s

#10 got single benchmarks 10642 +0.002s ... 0.027s

#11 getting avg benchmarks for device 8832 +0.004s ... 0.031s

#12 got single benchmarks 8832 +0.017s ... 0.047s

#13 getting avg benchmarks for device 7657 +0s ... 0.048s

#14 got single benchmarks 7657 +0.002s ... 0.05s

#15 got avg benchmarks for devices +0s ... 0.05s

#16 min, max, avg, median took s +0.023s ... 0.074s

#17 before gaming benchmark output +0s ... 0.074s

#18 Got 192 rows for game benchmarks. +0.013s ... 0.087s

#19 composed SQL query for gamebenchmarks +0s ... 0.087s

#20 got data and put it in $dataArray +0.003s ... 0.09s

#21 benchmarks composed for output. +0.016s ... 0.106s

#22 calculated avg scores. +0s ... 0.106s

#23 return log +0.001s ... 0.106s

Teilen Sie diesen Artikel, um uns zu unterstützen. Jeder Link hilft!
> Notebook Test, Laptop Test und News > Benchmarks / Technik > Benchmarks / Technik > Grafikkarten Vergleich - Head 2 Head
Autor: Klaus Hinum,  8.09.2017 (Update:  1.07.2023)