Notebookcheck Logo

Intel UHD Graphics (Jasper Lake 16 EU) vs Intel Iris Plus Graphics 640 vs Intel HD Graphics P630

Intel UHD Graphics (Jasper Lake 16 EU)

► remove from comparison Intel UHD Graphics (Jasper Lake 16 EU)

Die Intel UHD Graphics 16 EUs (Jasper Lake, Gen. 11) ist eine Prozessorgrafikkarte, die im Januar 2021 vorgestellt wurde. Sie wird in den Mid-Range-Modellen der Jasper Lake Prozessoren genutzt (Celeron) und bietet alle 16 der 32 EUs (Executing Units - Shader Cluster) und keinen eigenen dedizierten Grafikspeicher. Die Taktung ist abhängig vom CPU-Modell und variiert von 350 - 750 MHz (minimaler Basis bis maximaler Boost-Takt). Zum Launch findet man die GPU im mobilen Celeron N4500 (6W) und im Desktop N4505 (10W).

Die Gen. 11 (Generation 11) Architektur wird in Ice Lake, Lakefield und Jasper Lake eingesetzt und bietet einen deutlichen Geschwindigkeitsschub im Vergleich zur Vorgängergeneration. Die neuere Xe Graphics (Gen. 12) in Tiger Lake ist aber nochmals deutlich schneller.

Als besonderes Feature hebt Intel das neue Variable Rate Shading (VRS) der Gen11 Grafik hervor. Damit kann der Spielentwickler Bereiche definieren die mit weniger Genauigkeit geshadet werden (z.B. weit entfernte Objekte, oder Objekte im Nebel) und somit bei gleicher visueller Qualität deutlich Performance gewinnen. Hier können je nach Szene bis zu 20 - 30% (Unreal Engine bzw Civ6) an Leistung gewonnen werden. Bis jetzt unterstütz VRS lediglich Nvidia mit Turing (GTX 1650 und aufwärts).

Neben der Spieleleistung soll auch der Videoencoder deutlich schneller geworden sein. Wie der Vorgänger sollte er weiterhin H.265/HEVC im Main10-Profil mit 10 Bit Farbtiefe sowie Googles VP9-Codec in Hardware dekodieren.

Die Intel UHD wird wie Ice Lake und Lakefield im 10nm Prozess bei Intel gefertigt und soll mit TSMCs 7nm Prozess mithalten können.

Intel Iris Plus Graphics 640

► remove from comparison Intel Iris Plus Graphics 640

Die Intel Iris Plus Graphics 640 (GT3e) ist eine Prozessorgrafikkarte der im Jänner 2017 vorgestellten Kaby-Lake-Modelle. Als Nachfolger der Iris Graphics 540 (Skylake) ist die Iris Plus Graphics 640 dabei in den ULV-Modellen der 15-Watt-Klasse zu finden und besitzt einen dedizierten eDRAM-Cache mit 64 MB Kapazität. Die sogenannte GT3e-Ausbaustufe der Kaby-Lake-GPU verfügt weiterhin über 48 Execution Units (EUs), die je nach Modell mit bis zu 1.050 MHz takten.

Neben dem eDRAM-Cache kann die Iris 640 auch über das Interface des Prozessors auf den Hauptspeicher zugreifen (2x 64 Bit DDR3L-1600/LPDDR3-1866/DDR4-2133).

Von der Iris Plus 650 der 28-Watt-Modelle unterscheidet sich die Iris 640 lediglich durch ihren etwas geringeren Maximaltakt sowie die geringere TDP, wodurch der Turbo-Boost-Spielraum weniger lang ausgenutzt werden kann.

Performance

Die exakte Leistung der Iris Plus Graphics 640 hängt vom jeweiligen CPU-Modell ab, da sich die Maximaltaktrate leicht unterscheiden kann. Zum anderen beeinflusst auch der verwendete Speicher (DDR3/DDR4) die Performance.

Die höchste Leistung erreichen hochtaktende Core-i7-Ableger wie der Core i7-7660U. Je nach Spiel ordnet sich die Iris 640 wahrscheinlich wie der Vorgänger zwischen einer dedizierten GeForce 920M und GeForce 940M ein und kann aktuelle Spiele meist nur in niedrigen Einstellungen flüssig darstellen.

Features

Die überarbeitete Videoeinheit dekodiert H.265-/HEVC-Videos vollständig in Hardware. Anders als Skylake kann Kaby Lake nun auch H.265/HEVC im Main10-Profil mit 10 Bit Farbtiefe sowie Googles VP9-Codec in Hardware dekodieren. Die Bildausgabe erfolgt über DP 1.2/eDP 1.3 (max. 3.840 x 2.160 @ 60 Hz), wohingegen HDMI nur in der älteren Version 1.4a angeboten wird. Ein HDMI-2.0-Anschluss kann aber mittels Konverter von DisplayPort ergänzt werden. Maximal lassen sich drei Displays parallel angesteuern.

Leistungsaufnahme

Die Iris Graphics 640 ist in ULV-Prozessoren der 15-Watt-Klasse zu finden und damit für schlanke Note- und Ultrabooks geeignet.

Intel HD Graphics P630

► remove from comparison Intel HD Graphics P630

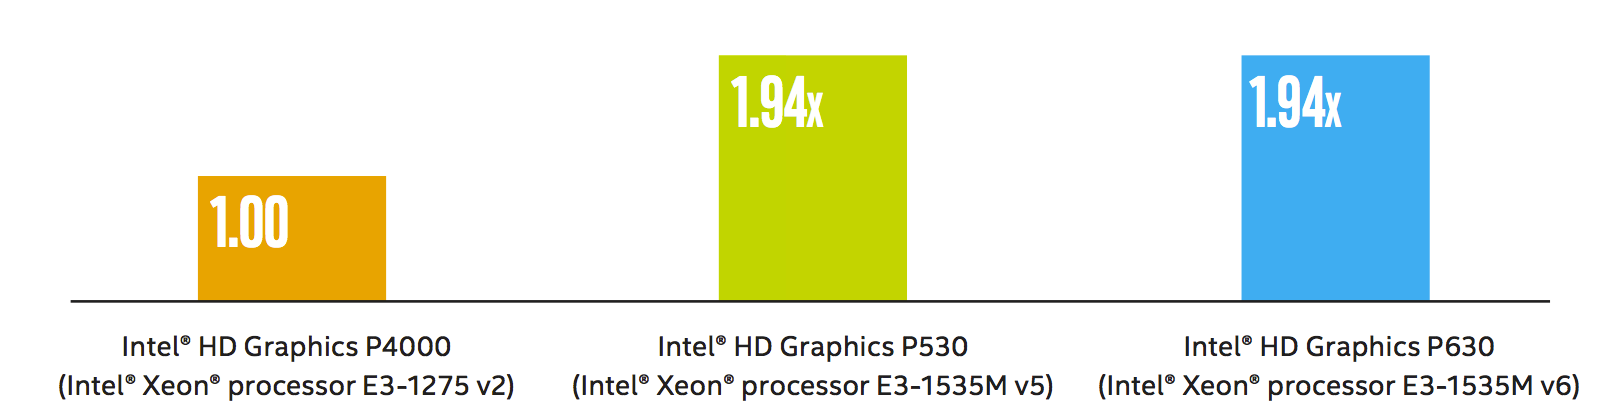
Die Intel HD Graphics P630 (GT2) ist eine integrierte Workstation-Grafikeinheit, die in verschiedenen Desktop- und Notebook-Prozessoren der 2017 vorgestellten Kaby-Lake-Generation zu finden ist (Xeon E3-1200 v6 und e3-1500M v6 Serien). Sie ist identisch mit der Intel HD Graphics 630, jedoch sind die Treiber für professionelle Software optimiert. Daher unterscheidet sie sich auch nicht von der Intel HD Graphics P530 und erreicht laut Intel auch die selbe Leistung im SPEC Viewperf12 (1.94x der alten Intel HD Graphics P4000). Die Grafikkarte ist derzeit für 15 CAD- und Workstation-Anwendungen zertifiziert.

Features

Neu bei der Kaby-Lake Generation ist die verbesserte Videoengine, welche nun auch H.265/HEVC im Main10-profil mit 10 Bit Farbtiefe sowie Googles VP9-Codec in Hardware dekodieren kann. Die Chips mit HD Graphics 530 sollten auch bereits HDCP 2.2 unterstützen und somit z.B. Netflix-Videos unter Windows 10 in 4K ausgeben können (im Gegensatz zu den ersten Kaby-Lake Dual-Core Chips mit Intel HD Graphics 620).

Leistungsaufnahme

Die HD Graphics P630 ist in Desktop- und Notebook-Prozessoren verschiedener TDP-Klassen zu finden. Die Quad-Core CPUs sind jedoch meistens in größeren und schwereren Notebooks verbaut. Der verbesserte 14nm+ Prozess verspricht jedoch eine etwas geringere Leistungsaufnahme im Vergleich zur Intel HD Graphics P530.

Quelle: http://www.intel.com/content/dam/www/public/us/en/documents/guides/hd-graphics-performance-guide.pdf

Intel UHD Graphics (Jasper Lake 16 EU)Intel Iris Plus Graphics 640Intel HD Graphics P630
Gen. 9.5 Serie
Iris Plus Graphics G7 (Ice Lake 64 EU) 64 @ 0.3 - 1.1 GHz
Iris Plus Graphics G4 (Ice Lake 48 EU) 48 @ 0.3 - 1.1 GHz
UHD Graphics G1 (Ice Lake 32 EU) 32 @ 0.3 - 1.1 GHz
UHD Graphics G7 (Lakefield GT2 64 EU) 64 @ 0.2 - 0.5 GHz
UHD Graphics G4 (Lakefield GT1 48 EU) 48 @ 0.2 - 0.5 GHz
UHD Graphics (Jasper Lake 32 EU) 32 @ 0.35 - 0.9 GHz
UHD Graphics (Elkhart Lake 32 EU) 32 @ 0.4 - 0.85 GHz
UHD Graphics (Jasper Lake 24 EU) 24 @ 0.35 - 0.8 GHz
UHD Graphics (Elkhart Lake 16 EU) 16 @ 0.25 - 0.85 GHz
UHD Graphics (Jasper Lake 16 EU) 24 @ 0.35 - 0.8 GHz
Iris Plus Graphics 655 48 @ 0.3 - 1.2 GHz
Iris Plus Graphics 650 48 @ 0.3 - 1.1 GHz64/128 Bit
Iris Plus Graphics 645 48 @ 0.3 - 1.15 GHz
Iris Plus Graphics 640 48 @ 0.3 - 1.05 GHz64/128 Bit
UHD Graphics 630 24 @ 0.3 - 1.15 GHz64/128 Bit
UHD Graphics P630 24 @ 0.3 - 1.2 GHz64/128 Bit
HD Graphics 630 24 @ 0.3 - 1.15 GHz64/128 Bit
HD Graphics P630 24 64/128 Bit
UHD Graphics 620 24 @ 0.3 - 1.15 GHz
HD Graphics 620 24 @ 0.3 - 1.05 GHz64/128 Bit
UHD Graphics 617 24 @ 0.3 - 1.15 GHz64/128 Bit
UHD Graphics 615 24 @ 0.3 - 1 GHz64/128 Bit
HD Graphics 615 24 @ 0.3 - 1.05 GHz64/128 Bit
CodenameGen. 11Kaby Lake GT3eKaby-Lake-H-GT2
ArchitekturGen. 11Gen. 9.5 Kaby LakeGen. 9.5 Kaby Lake
Pipelines24 - unified48 - unified24 - unified
Kerntakt350 - 800 (Boost) MHz300 - 1050 (Boost) MHz
Shared Memoryjajaja
APIDirectX 12_1, OpenGL 4.5, OpenCL 1.2DirectX 12_1, OpenGL 4.4DirectX 12_1, OpenGL 4.4
Stromverbrauch4.8 - 10 Watt
Herstellungsprozess10 nm14 nm14 nm
Displays3 Displays (max.)
FeaturesQuickSyncQuickSyncQuickSync
Erscheinungsdatum11.01.2021 03.01.2017 05.08.2015
PredecessorUHD Graphics 600
Speicherbandbreite64/128 Bit64/128 Bit
SpeichertypDDR3/DDR4
Max. Speichergröße64 MB
CPU in UHD Graphics (Jasper Lake 16 EU)GPU Base SpeedGPU Boost / Turbo
Intel Celeron N5095A4 x 2000 MHz, 15 W450 MHz750 MHz
Intel Celeron N50954 x 2000 MHz, 15 W450 MHz750 MHz
Intel Celeron N62112 x 1200 MHz, 6.5 W250 MHz750 MHz
min. - max.250 - 450 MHz750 MHz
CPU in Iris Plus Graphics 640GPU Base SpeedGPU Boost / Turbo
Intel Core i7-7660U2 x 2500 MHz, 15 W300 MHz1050 MHz
Intel Core i7-7560U2 x 2400 MHz, 15 W300 MHz1050 MHz
Intel Core i5-7360U2 x 2300 MHz, 15 W300 MHz1000 MHz
Intel Core i5-7260U2 x 2200 MHz, 15 W300 MHz950 MHz
min. - max.250 - 450 MHz750 - 1050 MHz
CPU in HD Graphics P630GPU Base SpeedGPU Boost / Turbo
Intel Xeon E3-1535M v64 x 3100 MHz, 45 W300 MHz1150 MHz
Intel Xeon E3-1505M v64 x 3000 MHz, 45 W300 MHz1150 MHz
min. - max.250 - 450 MHz750 - 1150 MHz

Benchmarks

Performance Rating - 3DMark 11 + Fire Strike + Time Spy - UHD Graphics (Jasper Lake 16 EU)
0.3 pt (1%)
3DMark - 3DMark Time Spy Score
min: 145     avg: 192.4     median: 203 (1%)     max: 210 Points
min: 467     avg: 499.8     median: 494.5 (1%)     max: 543 Points
400 Points (1%)
3DMark - 3DMark Time Spy Graphics
min: 129     avg: 168.2     median: 178 (0%)     max: 182 Points
min: 413     avg: 442.5     median: 437 (1%)     max: 483 Points
3DMark - 3DMark Ice Storm Unlimited Graphics
min: 43067     avg: 44131     median: 43609.5 (4%)     max: 46236 Points
min: 142163     avg: 147298     median: 145481 (15%)     max: 154251 Points
3DMark - 3DMark Ice Storm Extreme Graphics
min: 15477     avg: 18377     median: 17921 (2%)     max: 22189 Points
min: 7558     avg: 8025     median: 8067 (9%)     max: 8711 Points
8280 Points (9%)
min: 10486     avg: 11119     median: 11248 (3%)     max: 11495 Points
min: 1236     avg: 1349     median: 1310 (2%)     max: 1509 Points
1040 Points (2%)
min: 1315     avg: 1411     median: 1393.5 (2%)     max: 1541 Points
3DMark - 3DMark Ice Storm Graphics
min: 23782     avg: 32522     median: 35101 (4%)     max: 38682 Points
3DMark - 3DMark Sling Shot (ES 3.0)
2356 Points (21%)
3DMark - 3DMark Sling Shot (ES 3.0) Graphics
2842 Points (17%)
3DMark - 3DMark Sling Shot Extreme (ES 3.1)
1952 Points (10%)
3DMark - 3DMark Sling Shot Extreme (ES 3.1) Graphics
2129 Points (7%)
min: 2136     avg: 2440     median: 2561 (4%)     max: 2664 Points
min: 1980     avg: 2275     median: 2379 (2%)     max: 2493 Points
3DMark Vantage
3DM Vant. Perf. total + Intel UHD Graphics (Jasper Lake 16 EU)
3DMark Vantage - 3DM Vant. Perf. total
3411 Points (1%)
3DM Vant. Perf. GPU no PhysX + Intel UHD Graphics (Jasper Lake 16 EU)
3DMark Vantage - 3DM Vant. Perf. GPU no PhysX
2969 Points (2%)
3DMark 05 - 3DMark 05 - Standard
12573 Points (14%)
3DMark 06 3DMark 06 - Standard 1280x1024 + Intel UHD Graphics (Jasper Lake 16 EU)
3DMark 06
min: 5796     avg: 6344     median: 6438 (8%)     max: 6704 Points
3DMark 06 - Standard 1280x1024 + Intel Iris Plus Graphics 640
min: 13164     avg: 14118     median: 14117.5 (18%)     max: 15071 Points
Unigine Valley 1.0 - Unigine Valley 1.0 DX
3.5 fps (1%)
Cinebench R10 Cinebench R10 Shading (32bit) + Intel UHD Graphics (Jasper Lake 16 EU)
Cinebench R10 - Cinebench R10 Shading (32bit)
min: 4674     avg: 5514     median: 5649.5 (4%)     max: 6082 Points
Cinebench R10 Shading (32bit) + Intel Iris Plus Graphics 640
min: 8824     avg: 9678     median: 9703 (7%)     max: 10506 Points
Cinebench R11.5 Cinebench R11.5 OpenGL 64 Bit + Intel UHD Graphics (Jasper Lake 16 EU)
Cinebench R11.5 - Cinebench R11.5 OpenGL 64 Bit
min: 19.02     avg: 19.5     median: 19.3 (6%)     max: 20.53 fps
Cinebench R11.5 OpenGL 64 Bit + Intel Iris Plus Graphics 640
46.1 fps (15%)
Cinebench R15
Cinebench R15 OpenGL 64 Bit + Intel UHD Graphics (Jasper Lake 16 EU)
Cinebench R15 - Cinebench R15 OpenGL 64 Bit
min: 11.8     avg: 24.5     median: 26.2 (2%)     max: 28.9 fps
Cinebench R15 OpenGL 64 Bit + Intel Iris Plus Graphics 640
min: 41.32     avg: 54     median: 56.2 (3%)     max: 62.3 fps
Cinebench R15 OpenGL Ref. Match 64 Bit + Intel UHD Graphics (Jasper Lake 16 EU)
Cinebench R15 OpenGL Ref. Match 64 Bit + Intel Iris Plus Graphics 640
min: 97.8     avg: 98.2     median: 97.8 (98%)     max: 99.3 %
GFXBench - GFXBench 5.0 4K Aztec Ruins High Tier Offscreen
1.4 fps (1%)
GFXBench - GFXBench 5.0 Aztec Ruins High Tier Offscreen
min: 3.2     avg: 4.9     median: 4.9 (1%)     max: 6.5 fps
GFXBench - GFXBench 5.0 Aztec Ruins Normal Tier Offscreen
min: 7.8     avg: 12.7     median: 12.7 (1%)     max: 17.5 fps
GFXBench - GFXBench Car Chase Offscreen
min: 10     avg: 14.2     median: 14.2 (2%)     max: 18.3 fps
40.7 fps (5%)
GFXBench 3.1 - GFXBench Manhattan ES 3.1 Offscreen
min: 8.2     avg: 16.5     median: 16.5 (0%)     max: 24.7 fps
56.1 fps (1%)
GFXBench 3.0 - GFXBench 3.0 Manhattan Offscreen
min: 18     avg: 30.7     median: 30.7 (2%)     max: 43.4 fps
31.2 fps (2%)
GFXBench (DX / GLBenchmark) 2.7
GFXBench T-Rex HD Offscreen C24Z16 + Intel UHD Graphics (Jasper Lake 16 EU)
GFXBench (DX / GLBenchmark) 2.7 - GFXBench T-Rex HD Offscreen C24Z16
min: 38     avg: 56.3     median: 56.3 (0%)     max: 74.5 fps
GFXBench T-Rex HD Offscreen C24Z16 + Intel Iris Plus Graphics 640
171 fps (1%)
Geekbench 6.2 - Geekbench 6.2 GPU Vulkan
1452 Points (0%)
LuxMark v2.0 64Bit - LuxMark v2.0 Room GPU
min: 96     avg: 106.3     median: 111 (1%)     max: 112 Samples/s
min: 315     avg: 325     median: 325 (1%)     max: 335 Samples/s
LuxMark v2.0 64Bit - LuxMark v2.0 Sala GPU
min: 206     avg: 220     median: 226 (0%)     max: 228 Samples/s
min: 748     avg: 779     median: 778.5 (1%)     max: 809 Samples/s
ComputeMark v2.1 - ComputeMark v2.1 Result
min: 536     avg: 549     median: 548 (1%)     max: 564 Points
min: 1575     avg: 1677     median: 1677 (2%)     max: 1779 Points
Power Consumption - Furmark Stress Test Power Consumption - external Monitor *
min: 11.1     avg: 14.4     median: 15.2 (2%)     max: 16 Watt
min: 30.8     avg: 33.6     median: 31.5 (4%)     max: 38.5 Watt
Power Consumption - The Witcher 3 Power Consumption - external Monitor *
0 Watt (0%)
min: 28     avg: 33.5     median: 33.5 (5%)     max: 38.9 Watt
Power Consumption - Witcher 3 Power Consumption *
13.1 Watt (3%)
min: 31.7     avg: 34.9     median: 34.9 (8%)     max: 38.1 Watt
Power Consumption - GFXBench Aztec Ruins Normal Tier Offscreen Power Consumption 150cd *
12.7 Watt (5%)
Power Consumption - Witcher 3 ultra Power Efficiency - external Monitor
0.1 fps per Watt (9%)
Emissions Witcher 3 Fan Noise + Intel UHD Graphics (Jasper Lake 16 EU)
Emissions - Witcher 3 Fan Noise
30.4 dB(A) (49%)
Witcher 3 Fan Noise + Intel Iris Plus Graphics 640
33.4 dB(A) (53%)
Clock Speed - GPU Clock Witcher 3 ultra
min: 748     avg: 823     median: 823 (32%)     max: 898 MHz
Clock Speed - GPU Clock Speed Furmark
min: 570     avg: 634     median: 634 (25%)     max: 698 MHz

Average Benchmarks Intel UHD Graphics (Jasper Lake 16 EU) → 100% n=3

Average Benchmarks Intel Iris Plus Graphics 640 → 209% n=3

Average Benchmarks Intel HD Graphics P630 → 181% n=3

- Bereich der Benchmarkergebnisse für diese Grafikkarte
- Durchschnittliche Benchmarkergebnisse für diese Grafikkarte
* Smaller numbers mean a higher performance
1 This benchmark is not used for the average calculation

Spiele-Benchmarks

Die folgenden Benchmarks basieren auf unseren Spieletests mit Testnotebooks. Die Performance dieser Grafikkarte bei den gelisteten Spielen ist abhängig von der verwendeten CPU, Speicherausstattung, Treiber und auch Betriebssystem. Dadurch müssen die untenstehenden Werte nicht repräsentativ sein. Detaillierte Informationen über das verwendete System sehen Sie nach einem Klick auf den fps-Wert.

F1 22

F1 22

2022
low 1920x1080
UHD Graphics (Jasper Lake 16 EU):
0 (!)  fps
low 1920x1080
100%
UHD Graphics (Jasper Lake 16 EU):
5.2  fps
F1 2021

F1 2021

2021
low 1280x720
100%
UHD Graphics (Jasper Lake 16 EU):
19  fps
low 1280x720
100%
UHD Graphics (Jasper Lake 16 EU):
15.2  fps
low 1280x720
100%
UHD Graphics (Jasper Lake 16 EU):
7  fps
Strange Brigade

Strange Brigade

2018
low 1280x720
100%
UHD Graphics (Jasper Lake 16 EU):
16.2 16.2 ~ 16 fps
med. 1920x1080
100%
UHD Graphics (Jasper Lake 16 EU):
6.5 6.6 ~ 7 fps
high 1920x1080
100%
UHD Graphics (Jasper Lake 16 EU):
6 6.5 ~ 6 fps
Far Cry 5

Far Cry 5

2018
low 1280x720
100%
UHD Graphics (Jasper Lake 16 EU):
7  fps
low 1280x720
100%
UHD Graphics (Jasper Lake 16 EU):
10.1 10.8 11 13.2 13.3 15.1 ~ 12 fps
med. 1920x1080
100%
UHD Graphics (Jasper Lake 16 EU):
7.5 8.4 9 9.2 9.2 ~ 9 fps
high 1920x1080
100%
UHD Graphics (Jasper Lake 16 EU):
7.1 7.9 8.3 8.6 8.6 ~ 8 fps
low 1280x720
100%
UHD Graphics (Jasper Lake 16 EU):
2.2 6.9 6.9 6.9 7.1 7.2 ~ 6 fps
med. 1920x1080
100%
UHD Graphics (Jasper Lake 16 EU):
3.2 3.3 3.3 ~ 3 fps
high 1920x1080
100%
UHD Graphics (Jasper Lake 16 EU):
2.3 2.3 ~ 2 fps
low 1280x720
Iris Plus Graphics 640:
13.8  fps
low 1280x720
Iris Plus Graphics 640:
28  fps
FIFA 18

FIFA 18

2017
low 1280x720
Iris Plus Graphics 640:
69.5 (!)  fps
med. 1920x1080
Iris Plus Graphics 640:
38.8 (!)  fps
F1 2017

F1 2017

2017
low 1280x720
Iris Plus Graphics 640:
33 38 ~ 36 fps
med. 1920x1080
Iris Plus Graphics 640:
15 15 ~ 15 fps
low 1280x720
Iris Plus Graphics 640:
22.9  fps
med. 1366x768
Iris Plus Graphics 640:
99  fps
high 1920x1080
Iris Plus Graphics 640:
48  fps
ultra 1920x1080
Iris Plus Graphics 640:
31.8  fps
Dirt 4

Dirt 4

2017
med. 1920x1080
Iris Plus Graphics 640:
27.5 (!)  fps
low 1280x720
Iris Plus Graphics 640:
69.3 96 101 103 ~ 92 fps
med. 1920x1080
Iris Plus Graphics 640:
33.9 35.8 42.6 48.2 ~ 40 fps
high 1920x1080
Iris Plus Graphics 640:
24.9 25.3 29.3 33.6 ~ 28 fps
Prey

Prey

2017
low 1280x720
Iris Plus Graphics 640:
39.9 45.4 ~ 43 fps
med. 1920x1080
Iris Plus Graphics 640:
17.9 18.1 ~ 18 fps
high 1920x1080
Iris Plus Graphics 640:
14.8  fps
low 1280x720
Iris Plus Graphics 640:
33.8  fps
low 1280x720
Iris Plus Graphics 640:
20.4  fps
low 1280x720
Iris Plus Graphics 640:
16 16.6 ~ 16 fps
For Honor

For Honor

2017
low 1280x720
Iris Plus Graphics 640:
30.8 33.5 ~ 32 fps
med. 1920x1080
Iris Plus Graphics 640:
11.8 12.7 ~ 12 fps
low 1280x720
Iris Plus Graphics 640:
42.9 45 ~ 44 fps
med. 1366x768
Iris Plus Graphics 640:
31.4  fps
high 1920x1080
Iris Plus Graphics 640:
22.9  fps
low 1280x720
Iris Plus Graphics 640:
121  fps
med. 1366x768
Iris Plus Graphics 640:
91  fps
high 1920x1080
Iris Plus Graphics 640:
31.6  fps
ultra 1920x1080
Iris Plus Graphics 640:
17.8  fps
low 1280x720
Iris Plus Graphics 640:
26.6 29.2 38.6 ~ 31 fps
med. 1366x768
Iris Plus Graphics 640:
19.6 24.2 ~ 22 fps
high 1920x1080
Iris Plus Graphics 640:
9.2 11.1 ~ 10 fps
low 1280x720
Iris Plus Graphics 640:
20.2  fps
Overwatch

Overwatch

2016
low 1280x720
Iris Plus Graphics 640:
53.6 56.1 63.3 67.3 ~ 60 fps
med. 1366x768
Iris Plus Graphics 640:
24.1 36.5 41 52.9 ~ 39 fps
high 1920x1080
Iris Plus Graphics 640:
15.9 29.9 36.5 ~ 27 fps
ultra 1920x1080
Iris Plus Graphics 640:
19.5  fps
low 1280x720
Iris Plus Graphics 640:
24.9  fps
low 1280x720
Iris Plus Graphics 640:
28  fps
med. 1920x1080
Iris Plus Graphics 640:
13  fps
low 1024x768
Iris Plus Graphics 640:
23.5 25.8 ~ 25 fps
med. 1366x768
Iris Plus Graphics 640:
16.7 19.4 ~ 18 fps
high 1920x1080
Iris Plus Graphics 640:
9.1  fps
low 1024x768
Iris Plus Graphics 640:
45.4 (!) 50.5 59.2 ~ 52 fps
med. 1366x768
Iris Plus Graphics 640:
29 30.7 (!) 32.9 ~ 31 fps
high 1920x1080
Iris Plus Graphics 640:
16.4 16.6 (!) 18.7 ~ 17 fps
ultra 1920x1080
Iris Plus Graphics 640:
14.2  fps
low 1024x768
Iris Plus Graphics 640:
44.7  fps
med. 1366x768
Iris Plus Graphics 640:
26.2  fps
high 1920x1080
Iris Plus Graphics 640:
12.9  fps
low 1280x720
100%
UHD Graphics (Jasper Lake 16 EU):
18.9 36.2 47.7 57.3 58.3 58.6 61.2 ~ 48 fps
167%
Iris Plus Graphics 640:
68 92 ~ 80 fps
med. 1366x768
100%
UHD Graphics (Jasper Lake 16 EU):
20.7 22 22.8 26.6 26.9 26.9 ~ 24 fps
246%
Iris Plus Graphics 640:
55 63.7 ~ 59 fps
high 1920x1080
100%
UHD Graphics (Jasper Lake 16 EU):
11.6 11.8 11.8 11.8 12 12 ~ 12 fps
242%
Iris Plus Graphics 640:
27.6 29.5 ~ 29 fps
ultra 1920x1080
100%
UHD Graphics (Jasper Lake 16 EU):
10.8 10.8 10.9 10.9 11.2 11.2 ~ 11 fps
191%
Iris Plus Graphics 640:
19.8 23 ~ 21 fps
low 1024x768
100%
UHD Graphics (Jasper Lake 16 EU):
4 13.5 14 ~ 11 fps
173%
Iris Plus Graphics 640:
16.4 17.5 21 21.7 ~ 19 fps
med. 1366x768
Iris Plus Graphics 640:
13.4  fps
ultra 1920x1080
Iris Plus Graphics 640:
4  fps
GTA V

GTA V

2015
low 1024x768
100%
UHD Graphics (Jasper Lake 16 EU):
0 (!) 25.1 ~ 13 fps
436%
Iris Plus Graphics 640:
56.7  fps
med. 1366x768
100%
UHD Graphics (Jasper Lake 16 EU):
25  fps
116%
Iris Plus Graphics 640:
28.9  fps
high 1920x1080
100%
UHD Graphics (Jasper Lake 16 EU):
5.6  fps
211%
Iris Plus Graphics 640:
11.8  fps
Sims 4

Sims 4

2014
high 1920x1080
Iris Plus Graphics 640:
28.6  fps
ultra 1920x1080
Iris Plus Graphics 640:
20.2 20.8 ~ 21 fps
low 1024x768
Iris Plus Graphics 640:
43.1 60.3 ~ 52 fps
med. 1366x768
Iris Plus Graphics 640:
29.7 42 ~ 36 fps
high 1366x768
Iris Plus Graphics 640:
23.2 30.7 ~ 27 fps
ultra 1920x1080
Iris Plus Graphics 640:
8.2 9.9 ~ 9 fps
low 1280x720
Iris Plus Graphics 640:
61 68.2 ~ 65 fps
med. 1366x768
Iris Plus Graphics 640:
40.2 45.1 ~ 43 fps
high 1366x768
Iris Plus Graphics 640:
33.5 38.3 ~ 36 fps
ultra 1920x1080
Iris Plus Graphics 640:
10.7 12.5 ~ 12 fps
low 1024x768
Iris Plus Graphics 640:
103 132.6 ~ 118 fps
med. 1366x768
Iris Plus Graphics 640:
54.1 68.7 ~ 61 fps
high 1366x768
Iris Plus Graphics 640:
37 47.1 ~ 42 fps
ultra 1920x1080
Iris Plus Graphics 640:
17.2 21.6 ~ 19 fps
low 1024x768
100%
UHD Graphics (Jasper Lake 16 EU):
57.6  fps
med. 1366x768
100%
UHD Graphics (Jasper Lake 16 EU):
48.1  fps
ultra 1920x1080
100%
UHD Graphics (Jasper Lake 16 EU):
17.8  fps
ultra 1920x1080
Iris Plus Graphics 640:
35.2  fps
World of Warcraft

World of Warcraft

2005
high 1280x1024
Iris Plus Graphics 640:
28.5  fps

Average Gaming Intel UHD Graphics (Jasper Lake 16 EU) → 100%

Average Gaming 30-70 fps → 100%

Average Gaming Intel Iris Plus Graphics 640 → 223%

Average Gaming 30-70 fps → 341%

Intel UHD Graphics (Jasper Lake 16 EU)lowmed.highultraQHD4K
F1 22
Elden Ring5.18
F1 202119
Total War: Three Kingdoms15.2
Shadow of the Tomb Raider7
Strange Brigade1676
Far Cry 57
X-Plane 11.111298
Final Fantasy XV Benchmark632
Dota 2 Reborn48241211
The Witcher 311
GTA V13255.59
Counter-Strike: GO57.648.117.8
< 30 fps
< 60 fps
< 120 fps
≥ 120 fps
10
2

5
1

5


2


Intel Iris Plus Graphics 640lowmed.highultraQHD4K
The Evil Within 213.8
Middle-earth: Shadow of War28
FIFA 1869.538.8
F1 20173615
Playerunknown's Battlegrounds (PUBG)22.9
Team Fortress 2994831.8
Dirt 427.5
Rocket League924028
Prey431814.8
Warhammer 40.000: Dawn of War III33.8
Mass Effect Andromeda20.4
Ghost Recon Wildlands16
For Honor3212
Titanfall 24431.422.9
Farming Simulator 171219131.617.8
Battlefield 1312210
Deus Ex Mankind Divided20.2
Overwatch60392719.5
The Division24.9
Far Cry Primal2813
Rise of the Tomb Raider25189.1
Rainbow Six Siege52311714.2
Star Wars Battlefront44.726.212.9
Dota 2 Reborn80592921
The Witcher 31913.44
GTA V56.728.911.8
Sims 428.621
Battlefield 45236279
BioShock Infinite65433612
Tomb Raider118614219
Diablo III35.2
World of Warcraft28.5
< 30 fps
< 60 fps
< 120 fps
≥ 120 fps
10
10
6
1
10
8
3
13
4

9
2


Eine Liste mit weiteren Spielen und allen Grafikkarten finden Sie auf unserer Seite: Welches Spiel ist mit welcher Grafikkarte spielbar?

v1.28
log 27. 17:24:16

#0 ran 0s before starting gpusingle class +0s ... 0s

#1 checking url part for id 10644 +0s ... 0s

#2 checking url part for id 7656 +0s ... 0s

#3 checking url part for id 7657 +0s ... 0s

#4 redirected to Ajax server, took 1727450656s time from redirect:0 +0s ... 0s

#5 did not recreate cache, as it is less than 5 days old! Created at Wed, 25 Sep 2024 05:16:56 +0200 +0s ... 0s

#6 composed specs +0.005s ... 0.005s

#7 did output specs +0s ... 0.005s

#8 start showIntegratedCPUs +0s ... 0.005s

#9 getting avg benchmarks for device 10644 +0.021s ... 0.026s

#10 got single benchmarks 10644 +0.002s ... 0.028s

#11 getting avg benchmarks for device 7656 +0s ... 0.028s

#12 got single benchmarks 7656 +0.007s ... 0.035s

#13 getting avg benchmarks for device 7657 +0s ... 0.035s

#14 got single benchmarks 7657 +0.002s ... 0.038s

#15 got avg benchmarks for devices +0s ... 0.038s

#16 No cached benchmark found, getting uncached values +0.022s ... 0.06s

#17 min, max, avg, median took s +0.003s ... 0.063s

#18 before gaming benchmark output +0s ... 0.063s

#19 Got 207 rows for game benchmarks. +0.014s ... 0.077s

#20 composed SQL query for gamebenchmarks +0s ... 0.077s

#21 got data and put it in $dataArray +0.002s ... 0.079s

#22 benchmarks composed for output. +0.012s ... 0.091s

#23 calculated avg scores. +0s ... 0.091s

#24 return log +0.001s ... 0.091s

Teilen Sie diesen Artikel, um uns zu unterstützen. Jeder Link hilft!
> Notebook Test, Laptop Test und News > Benchmarks / Technik > Benchmarks / Technik > Grafikkarten Vergleich - Head 2 Head
Autor: Klaus Hinum,  8.09.2017 (Update:  1.07.2023)