Notebookcheck Logo

Intel UHD Graphics (Jasper Lake 16 EU) vs Intel HD Graphics 4200 vs Intel HD Graphics (Bay Trail)

Intel UHD Graphics (Jasper Lake 16 EU)

► remove from comparison Intel UHD Graphics (Jasper Lake 16 EU)

Die Intel UHD Graphics 16 EUs (Jasper Lake, Gen. 11) ist eine Prozessorgrafikkarte, die im Januar 2021 vorgestellt wurde. Sie wird in den Mid-Range-Modellen der Jasper Lake Prozessoren genutzt (Celeron) und bietet alle 16 der 32 EUs (Executing Units - Shader Cluster) und keinen eigenen dedizierten Grafikspeicher. Die Taktung ist abhängig vom CPU-Modell und variiert von 350 - 750 MHz (minimaler Basis bis maximaler Boost-Takt). Zum Launch findet man die GPU im mobilen Celeron N4500 (6W) und im Desktop N4505 (10W).

Die Gen. 11 (Generation 11) Architektur wird in Ice Lake, Lakefield und Jasper Lake eingesetzt und bietet einen deutlichen Geschwindigkeitsschub im Vergleich zur Vorgängergeneration. Die neuere Xe Graphics (Gen. 12) in Tiger Lake ist aber nochmals deutlich schneller.

Als besonderes Feature hebt Intel das neue Variable Rate Shading (VRS) der Gen11 Grafik hervor. Damit kann der Spielentwickler Bereiche definieren die mit weniger Genauigkeit geshadet werden (z.B. weit entfernte Objekte, oder Objekte im Nebel) und somit bei gleicher visueller Qualität deutlich Performance gewinnen. Hier können je nach Szene bis zu 20 - 30% (Unreal Engine bzw Civ6) an Leistung gewonnen werden. Bis jetzt unterstütz VRS lediglich Nvidia mit Turing (GTX 1650 und aufwärts).

Neben der Spieleleistung soll auch der Videoencoder deutlich schneller geworden sein. Wie der Vorgänger sollte er weiterhin H.265/HEVC im Main10-Profil mit 10 Bit Farbtiefe sowie Googles VP9-Codec in Hardware dekodieren.

Die Intel UHD wird wie Ice Lake und Lakefield im 10nm Prozess bei Intel gefertigt und soll mit TSMCs 7nm Prozess mithalten können.

Intel HD Graphics 4200

► remove from comparison Intel HD Graphics 4200

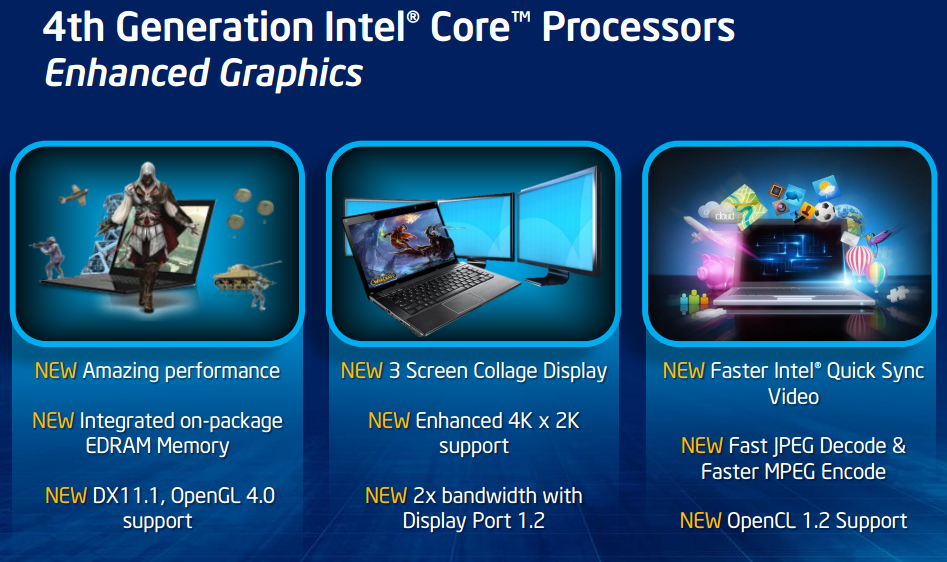
Die Intel HD Graphics 4200 (GT2) ist eine Low-End Prozessorgrafikkarte in einigen besonders sparsamen ULV-CPUs der Haswell-Generation.

Der Grafikkern wurde im Vergleich zum Intel HD Graphics 4000 der Ivy-Bridge-Generation in verschiedenen Punkten weiterentwickelt. So unterstützt die GPU nun mit DirectX 11.1, OpenCL 1.2 und OpenGL 4.0 alle wichtigen aktuellen Standards. Auch ein verbesserter Decoder für 4K-Videos sowie ein überarbeiteter Quick-Sync-Encoder sind mit an Bord.

Die Performance der HD Graphics 4200 liegt im Schnitt noch deutlich unter der HD 4600 und HD 4400, da die GPU für ULV-Modelle der Y-Serie (11,5 Watt TDP) mit sehr niedriger Taktrate vorgesehen ist. Insgesamt entspricht die Leistung trotz der geringeren Kernfrequenz in etwa der HD 4000 der Ivy-Bridge-Generation. Neben architektonischen Verbesserungen wird dies vor allem über eine gesteigerte Zahl an Ausführungseinheiten erreicht: Die GT2-Ausbaustufe integriert nun 20 (HD 4000: 16) der sogenannten EUs.

In einfachen Spielen wie Anno 2070 oder Counter Strike: Global Offensive genügt die Performance, um niedrige Einstellungen und 1.024 x 768 Pixel zu bewältigen. Viele aktuelle Titel wie Battlefield 4 sind hingegen selbst bei minimaler grafischer Qualität nicht flüssig spielbar. Detaillierte Benchmarks können sie weiter unten auf dieser Seite finden.

Der Stromverbrauch ist dank des 22-Nanometer-Prozesses mit Tri-Gate-Transistoren relativ gering und wird dynamisch vom TDP-Budget des gesamten Chips abgezweigt. Zusätzlich zur TDP von 11,5 Watt gibt Intel auch eine durchschnittliche Leistungsaufnahme (SDP) an, die je nach Modell bei 4,5 oder 6 Watt liegt.

Weitere Details zur Grafikkartenarchitektur der Haswell Generation finden Sie in unserem Artikel zur Haswell-Architektur sowie dem Bericht vom IDF 2012.

Intel HD Graphics (Bay Trail)

► remove from comparison Intel HD Graphics (Bay Trail)

Die Intel HD Graphics (Bay Trail) ist eine in den Tablet- (z.B. Z3770), Nettop- (z.B. J2850) und Notebook-SoCs (z.B. N3510) der Bay-Trail-Serie integrierte Grafikeinheit. Sie ist in verschiedenen Atom-, Celeron- und Pentium-Modellen zu finden und basiert auf der DirectX-11-tauglichen GPU der Ivy-Bridge-Generation. Taktrate und Einheitenzahl fallen allerdings deutlich niedriger aus, sodass sich die Performance nur im Low-End-Segment ansiedelt.

Im Vergleich zu Ivy Bridge, dessen Gen-7-GPU entweder 6 oder 16 Executions Units bietet, kommt die HD Graphics (Bay Trail) nur mit lediglich 4 EUs daher. Abhängig von Temperatur und Leistungsaufnahme kann die niedrige Basisfrequenz dynamisch bis auf den maximalen Turbo-Takt angehoben werden, der ja nach Modell bei bis zu 896 MHz liegt. Ebenfalls modellabhängig ist das Speicherinterface, welches im Single- oder Dual-Channel-Betrieb sowie mit verschiedene Speicherstandards (DDR3(L), DDR3L-RS, LPDDR3) arbeiten kann. Insbesondere Varianten mit einem nur 32 Bit breiten Interface (Atom Z3735G) verlieren teils erheblich an Performance.

Die schnellsten Notebook-Modelle erreichen knapp die Performance der HD Graphics (Sandy Bridge) sowie der Radeon HD 6310. Das reicht, um einige ältere und sehr anspruchslose Windows-Spiele wie World of Warcraft oder Half-Life 2 in niedrigen Einstellungen flüssig darzustellen. Für aktuelle Windows-Titel ist die GPU dagegen praktisch nicht geeignet.

Verglichen mit konkurrierenden ARM-SoCs ordnet sich die Grafikeinheit dagegen im unteren High-End-Segment ein und übertrifft knapp die Adreno 320, die in verschiedenen Qualcomm-SoCs wie dem Snapdragon 600 zu finden ist. Damit entspricht Grafik-Performance in etwa Nvidias Tegra 4. Auch sehr aufwändige Android-Spiele werden damit in hohen Auflösungen flüssig bewältigt (Stand 2013).

Der integrierte Videodecoder unterstützt alle gängigen Codecs wie MPEG2, H.264, VC1, MVC oder VP8 und ist für Auflösungen bis 4K (maximal 100 Mbit/s) geeignet. Das Bildsignal kann per HDMI 1.4 (max. 1.920 x 1.080) oder DisplayPort 1.2 (max. 2.560 x 1.600) an bis zu zwei Displays ausgegeben werden. Eine weitere Neuerung ist die Unterstützung von Wireless Display sowie Quick Sync, Intels schnellem und sparsamen H-264-Hardwareencoder. Einige dieser Features sind jedoch nicht bei allen Modellen verfügbar.

Je nach Modell liegt die Leistungsaufnahme des gesamten SoCs zwischen rund 2 und 10 Watt. Die besonders sparsamen Versionen sind damit auch für passiv gekühlte Tablets geeignet, andere werden in größeren (Sub-) Notebooks mit aktiver Kühlung eingesetzt.

Intel UHD Graphics (Jasper Lake 16 EU)Intel HD Graphics 4200Intel HD Graphics (Bay Trail)
HD Graphics Serie
Iris Plus Graphics G7 (Ice Lake 64 EU) 64 @ 0.3 - 1.1 GHz
Iris Plus Graphics G4 (Ice Lake 48 EU) 48 @ 0.3 - 1.1 GHz
UHD Graphics G1 (Ice Lake 32 EU) 32 @ 0.3 - 1.1 GHz
UHD Graphics G7 (Lakefield GT2 64 EU) 64 @ 0.2 - 0.5 GHz
UHD Graphics G4 (Lakefield GT1 48 EU) 48 @ 0.2 - 0.5 GHz
UHD Graphics (Jasper Lake 32 EU) 32 @ 0.35 - 0.9 GHz
UHD Graphics (Elkhart Lake 32 EU) 32 @ 0.4 - 0.85 GHz
UHD Graphics (Jasper Lake 24 EU) 24 @ 0.35 - 0.8 GHz
UHD Graphics (Elkhart Lake 16 EU) 16 @ 0.25 - 0.85 GHz
UHD Graphics (Jasper Lake 16 EU) 24 @ 0.35 - 0.8 GHz
HD Graphics P530 24 @ 0.35 - 1.05 GHz64/128 Bit
HD Graphics 5600 24 @ 0.3 - 1.05 GHz64/128 Bit
HD Graphics 6000 48 @ 0.3 - 1 GHz64/128 Bit
HD Graphics 4600 20 @ 0.2 - 1.35 GHz64/128 Bit
HD Graphics 5500 24 @ 0.3 - 0.95 GHz64/128 Bit
HD Graphics 5000 40 @ 0.2 - 1.1 GHz64/128 Bit
HD Graphics 4400 20 @ 0.2 - 1.1 GHz64/128 Bit
HD Graphics 5300 24 @ 0.1 - 0.9 GHz64/128 Bit
HD Graphics 4000 16 @ 0.35 - 1.35 GHz64/128 Bit
HD Graphics (Broadwell) 12 @ 0.1 - 0.85 GHz64/128 Bit
HD Graphics 4200 20 @ 0.2 - 0.85 GHz64/128 Bit
HD Graphics (Skylake) 12 @ 0.3 - 0.8 GHz64/128 Bit
HD Graphics 405 (Braswell) 16 @ 0.32 - 0.7 GHz64/128 Bit
HD Graphics (Braswell) 16 @ 0.32 - 0.7 GHz64/128 Bit
HD Graphics 400 (Braswell) 12 @ 0.32 - 0.64 GHz64/128 Bit
HD Graphics (Haswell) 10 @ 0.2 - 1 GHz64/128 Bit
HD Graphics (Cherry Trail) 16 @ 0.2 - 0.6 GHz64/128 Bit
HD Graphics 3000 12 @ 0.35 - 1.35 GHz64/128 Bit
HD Graphics 2500 6 @ 0.65 - 1.15 GHz64/128 Bit
HD Graphics (Ivy Bridge) 6 @ 0.35 - 1.1 GHz64/128 Bit
HD Graphics 2000 6 @ 0.85 - 1.35 GHz64/128 Bit
HD Graphics (Sandy Bridge) 6 @ 0.35 - 1.1 GHz64/128 Bit
HD Graphics (Bay Trail) 4 @ 0.31 - 0.9 GHz32/64/128 Bit
CodenameGen. 11Haswell GT2Bay Trail
ArchitekturGen. 11Gen. 7.5 HaswellGen. 7 Ivy Bridge
Pipelines24 - unified20 - unified4 - unified
Kerntakt350 - 800 (Boost) MHz200 - 850 (Boost) MHz311 - 896 (Boost) MHz
Shared Memoryjajaja
APIDirectX 12_1, OpenGL 4.5, OpenCL 1.2DirectX 11.1, Shader 5.0, OpenGL 4.0DirectX 11, Shader 5.0, OpenGL 4.0, ES 3.0
Stromverbrauch4.8 - 10 Watt
Herstellungsprozess10 nm22 nm22 nm
Displays3 Displays (max.)
FeaturesQuickSyncQuickSync
Erscheinungsdatum11.01.2021 05.06.2013 11.09.2013
PredecessorUHD Graphics 600
Speicherbandbreite64/128 Bit32/64/128 Bit
CPU in UHD Graphics (Jasper Lake 16 EU)GPU Base SpeedGPU Boost / Turbo
Intel Celeron N5095A4 x 2000 MHz, 15 W450 MHz750 MHz
Intel Celeron N50954 x 2000 MHz, 15 W450 MHz750 MHz
Intel Celeron N62112 x 1200 MHz, 6.5 W250 MHz750 MHz
min. - max.250 - 450 MHz750 MHz
CPU in HD Graphics 4200GPU Base SpeedGPU Boost / Turbo
Intel Core i7-4610Y2 x 1700 MHz, 11.5 W200 MHz850 MHz
Intel Core i5-4300Y2 x 1600 MHz, 11.5 W200 MHz850 MHz
Intel Core i5-4302Y2 x 1600 MHz, 11.5 W200 MHz850 MHz
min. - max.200 - 450 MHz750 - 850 MHz
CPU in HD Graphics (Bay Trail)GPU Base SpeedGPU Boost / Turbo
Intel Pentium N35404 x 2160 MHz, 7.5 W313 MHz896 MHz
Intel Pentium J29004 x 2410 MHz, 10 W688 MHz896 MHz
Intel Pentium N35304 x 2160 MHz, 7.5 W313 MHz896 MHz
min. - max.200 - ? MHz400 - 896 MHz

Benchmarks

Performance Rating - 3DMark 11 + Fire Strike + Time Spy - UHD Graphics (Jasper Lake 16 EU)
0.3 pt (1%)
Performance Rating - 3DMark 11 + Fire Strike + Time Spy - HD Graphics 4200
0.2 pt (1%)
Performance Rating - 3DMark 11 + Fire Strike + Time Spy - HD Graphics (Bay Trail)
0.1 pt (0%)
3DMark - 3DMark Time Spy Score
min: 145     avg: 192.4     median: 203 (1%)     max: 210 Points
3DMark - 3DMark Time Spy Graphics
min: 129     avg: 168.2     median: 178 (0%)     max: 182 Points
3DMark - 3DMark Ice Storm Unlimited Graphics
min: 43067     avg: 44131     median: 43609.5 (4%)     max: 46236 Points
41579 Points (4%)
3DMark - 3DMark Ice Storm Extreme Graphics
min: 15477     avg: 18377     median: 17921 (2%)     max: 22189 Points
min: 354     avg: 1182     median: 1188 (1%)     max: 1703 Points
min: 362     avg: 1230     median: 1228.5 (0%)     max: 1670 Points
min: 83     avg: 185     median: 147 (0%)     max: 495 Points
3DMark - 3DMark Ice Storm Graphics
min: 23782     avg: 32522     median: 35101 (4%)     max: 38682 Points
min: 17834     avg: 32317     median: 34087 (4%)     max: 46175 Points
min: 5056     avg: 15391     median: 16047 (2%)     max: 21351 Points
3DMark - 3DMark Sling Shot (ES 3.0)
2356 Points (21%)
3DMark - 3DMark Sling Shot (ES 3.0) Graphics
2842 Points (17%)
3DMark - 3DMark Sling Shot Extreme (ES 3.1)
1952 Points (10%)
3DMark - 3DMark Sling Shot Extreme (ES 3.1) Graphics
2129 Points (7%)
min: 367     avg: 660     median: 712 (1%)     max: 828 Points
min: 143     avg: 222.6     median: 216 (0%)     max: 280 Points
min: 122     avg: 192.1     median: 186.5 (0%)     max: 237 Points
3DMark Vantage
3DM Vant. Perf. total + Intel UHD Graphics (Jasper Lake 16 EU)
3DMark Vantage - 3DM Vant. Perf. total
3411 Points (1%)
3DM Vant. Perf. total + Intel HD Graphics 4200
min: 2165     avg: 2538     median: 2537.5 (1%)     max: 2910 Points
3DM Vant. Perf. total + Intel HD Graphics (Bay Trail)
3DM Vant. Perf. GPU no PhysX + Intel UHD Graphics (Jasper Lake 16 EU)
3DMark Vantage - 3DM Vant. Perf. GPU no PhysX
2969 Points (2%)
3DM Vant. Perf. GPU no PhysX + Intel HD Graphics 4200
min: 1678     avg: 1985     median: 1807 (1%)     max: 2471 Points
3DM Vant. Perf. GPU no PhysX + Intel HD Graphics (Bay Trail)
3DMark 2001SE - 3DMark 2001 - Standard
7727 Points (8%)
3DMark 03 - 3DMark 03 - Standard
min: 4226     avg: 4997     median: 5220 (3%)     max: 5323 Points
3DMark 05 - 3DMark 05 - Standard
12573 Points (14%)
min: 2666     avg: 3195     median: 3331 (4%)     max: 3445 Points
3DMark 06 3DMark 06 - Standard 1280x1024 + Intel UHD Graphics (Jasper Lake 16 EU)
3DMark 06
min: 5796     avg: 6344     median: 6438 (8%)     max: 6704 Points
3DMark 06 - Standard 1280x1024 + Intel HD Graphics 4200
min: 2060     avg: 3529     median: 3383 (4%)     max: 5020 Points
3DMark 06 - Standard 1280x1024 + Intel HD Graphics (Bay Trail)
min: 814     avg: 1785     median: 1866 (2%)     max: 2151 Points
3DMark 06 - Score Unknown Settings + Intel HD Graphics (Bay Trail)
3DMark 06
2108 Points (3%)
3DMark 06 - Standard 1280x800 + Intel HD Graphics (Bay Trail)
3DMark 06
2087 Points (3%)
Unigine Valley 1.0 - Unigine Valley 1.0 DX
3.5 fps (1%)
Unigine Heaven 3.0 - Unigine Heaven 3.0 DX 11
3.6 fps (1%)
Unigine Heaven 2.1 - Heaven 2.1 high
min: 2.4     avg: 2.8     median: 2.8 (1%)     max: 3.4 fps
Cinebench R10 Cinebench R10 Shading (32bit) + Intel UHD Graphics (Jasper Lake 16 EU)
Cinebench R10 - Cinebench R10 Shading (32bit)
min: 4674     avg: 5514     median: 5649.5 (4%)     max: 6082 Points
Cinebench R10 Shading (32bit) + Intel HD Graphics 4200
min: 1991     avg: 4602     median: 4514 (3%)     max: 6367 Points
Cinebench R10 Shading (32bit) + Intel HD Graphics (Bay Trail)
min: 898     avg: 2014     median: 1991.5 (1%)     max: 2889 Points
Cinebench R11.5 Cinebench R11.5 OpenGL 64 Bit + Intel UHD Graphics (Jasper Lake 16 EU)
Cinebench R11.5 - Cinebench R11.5 OpenGL 64 Bit
min: 19.02     avg: 19.5     median: 19.3 (6%)     max: 20.53 fps
Cinebench R11.5 OpenGL 64 Bit + Intel HD Graphics 4200
Cinebench R11.5 OpenGL 64 Bit + Intel HD Graphics (Bay Trail)
min: 0.37     avg: 6.2     median: 6.4 (2%)     max: 7.69 fps
Cinebench R15
Cinebench R15 OpenGL 64 Bit + Intel UHD Graphics (Jasper Lake 16 EU)
Cinebench R15 - Cinebench R15 OpenGL 64 Bit
min: 11.8     avg: 24.5     median: 26.2 (2%)     max: 28.9 fps
Cinebench R15 OpenGL 64 Bit + Intel HD Graphics 4200
min: 8.82     avg: 15.6     median: 17 (1%)     max: 19.99 fps
Cinebench R15 OpenGL 64 Bit + Intel HD Graphics (Bay Trail)
min: 2.88     avg: 5     median: 5.5 (0%)     max: 6.55 fps
Cinebench R15 OpenGL Ref. Match 64 Bit + Intel UHD Graphics (Jasper Lake 16 EU)
Cinebench R15 OpenGL Ref. Match 64 Bit + Intel HD Graphics 4200
Cinebench R15 OpenGL Ref. Match 64 Bit + Intel HD Graphics (Bay Trail)
min: 63     avg: 96.1     median: 97.8 (98%)     max: 97.8 %
GFXBench - GFXBench 5.0 4K Aztec Ruins High Tier Offscreen
1.4 fps (1%)
GFXBench - GFXBench 5.0 Aztec Ruins High Tier Offscreen
min: 3.2     avg: 4.9     median: 4.9 (1%)     max: 6.5 fps
GFXBench - GFXBench 5.0 Aztec Ruins Normal Tier Offscreen
min: 7.8     avg: 12.7     median: 12.7 (1%)     max: 17.5 fps
GFXBench - GFXBench Car Chase Offscreen
min: 10     avg: 14.2     median: 14.2 (2%)     max: 18.3 fps
GFXBench 3.1 - GFXBench Manhattan ES 3.1 Offscreen
min: 8.2     avg: 16.5     median: 16.5 (0%)     max: 24.7 fps
GFXBench 3.0 - GFXBench 3.0 Manhattan Offscreen
min: 18     avg: 30.7     median: 30.7 (2%)     max: 43.4 fps
GFXBench (DX / GLBenchmark) 2.7
GFXBench T-Rex HD Offscreen C24Z16 + Intel UHD Graphics (Jasper Lake 16 EU)
GFXBench (DX / GLBenchmark) 2.7 - GFXBench T-Rex HD Offscreen C24Z16
min: 38     avg: 56.3     median: 56.3 (0%)     max: 74.5 fps
GFXBench T-Rex HD Offscreen C24Z16 + Intel HD Graphics 4200
min: 21     avg: 35.8     median: 37.5 (0%)     max: 47 fps
GFXBench T-Rex HD Offscreen C24Z16 + Intel HD Graphics (Bay Trail)
Basemark ES 2.0 - Basemark ES 2.0
min: 45.08     avg: 49.1     median: 49.1 (81%)     max: 53.1 fps
Basemark X 1.0 - Basemark X 1.0 Off-Screen
10.1 fps (48%)
Basemark X 1.1 - Basemark X 1.1 High Quality
min: 3008     avg: 6663     median: 8456 (19%)     max: 8524 Points
Basemark X 1.1 - Basemark X 1.1 Medium Quality
min: 4802     avg: 12880     median: 14509 (32%)     max: 17701 Points
NenaMark2 - NenaMark2 Score
min: 59     avg: 59.4     median: 59.4 (88%)     max: 59.7 fps
Geekbench 6.2 - Geekbench 6.2 GPU Vulkan
1452 Points (0%)
LuxMark v2.0 64Bit - LuxMark v2.0 Room GPU
min: 96     avg: 106.3     median: 111 (1%)     max: 112 Samples/s
min: 102     avg: 113.5     median: 113.5 (1%)     max: 125 Samples/s
min: 25     avg: 28.5     median: 27 (0%)     max: 35 Samples/s
LuxMark v2.0 64Bit - LuxMark v2.0 Sala GPU
min: 206     avg: 220     median: 226 (0%)     max: 228 Samples/s
min: 162     avg: 176.5     median: 176.5 (0%)     max: 191 Samples/s
min: 26     avg: 29     median: 29 (0%)     max: 34 Samples/s
ComputeMark v2.1 - ComputeMark v2.1 Result
min: 536     avg: 549     median: 548 (1%)     max: 564 Points
min: 469     avg: 486     median: 486 (1%)     max: 503 Points
min: 160     avg: 172.8     median: 174 (0%)     max: 192 Points
PassMark PerformanceTest Mobile V1 - PerformanceTest Mobile V1 2D Graphics Tests
min: 3822     avg: 4036     median: 3866 (1%)     max: 4588 Points
PassMark PerformanceTest Mobile V1 - PerformanceTest Mobile V1 3D Graphics Tests
min: 1058     avg: 1251     median: 1228 (2%)     max: 1488 Points
Power Consumption - Furmark Stress Test Power Consumption - external Monitor *
min: 11.1     avg: 14.4     median: 15.2 (2%)     max: 16 Watt
Power Consumption - The Witcher 3 Power Consumption - external Monitor *
0 Watt (0%)
Power Consumption - Witcher 3 Power Consumption *
13.1 Watt (3%)
Power Consumption - GFXBench Aztec Ruins Normal Tier Offscreen Power Consumption 150cd *
12.7 Watt (5%)
Emissions Witcher 3 Fan Noise + Intel UHD Graphics (Jasper Lake 16 EU)
Emissions - Witcher 3 Fan Noise
30.4 dB(A) (49%)

Average Benchmarks Intel UHD Graphics (Jasper Lake 16 EU) → 100% n=19

Average Benchmarks Intel HD Graphics 4200 → 77% n=19

Average Benchmarks Intel HD Graphics (Bay Trail) → 30% n=19

- Bereich der Benchmarkergebnisse für diese Grafikkarte
- Durchschnittliche Benchmarkergebnisse für diese Grafikkarte
* Smaller numbers mean a higher performance
1 This benchmark is not used for the average calculation

Spiele-Benchmarks

Die folgenden Benchmarks basieren auf unseren Spieletests mit Testnotebooks. Die Performance dieser Grafikkarte bei den gelisteten Spielen ist abhängig von der verwendeten CPU, Speicherausstattung, Treiber und auch Betriebssystem. Dadurch müssen die untenstehenden Werte nicht repräsentativ sein. Detaillierte Informationen über das verwendete System sehen Sie nach einem Klick auf den fps-Wert.

F1 22

F1 22

2022
low 1920x1080
UHD Graphics (Jasper Lake 16 EU):
0 (!)  fps
low 1920x1080
100%
UHD Graphics (Jasper Lake 16 EU):
5.2  fps
F1 2021

F1 2021

2021
low 1280x720
100%
UHD Graphics (Jasper Lake 16 EU):
19  fps
low 1280x720
100%
UHD Graphics (Jasper Lake 16 EU):
15.2  fps
low 1280x720
100%
UHD Graphics (Jasper Lake 16 EU):
7  fps
Strange Brigade

Strange Brigade

2018
low 1280x720
100%
UHD Graphics (Jasper Lake 16 EU):
16.2 16.2 ~ 16 fps
med. 1920x1080
100%
UHD Graphics (Jasper Lake 16 EU):
6.5 6.6 ~ 7 fps
high 1920x1080
100%
UHD Graphics (Jasper Lake 16 EU):
6 6.5 ~ 6 fps
Far Cry 5

Far Cry 5

2018
low 1280x720
100%
UHD Graphics (Jasper Lake 16 EU):
7  fps
low 1280x720
100%
UHD Graphics (Jasper Lake 16 EU):
10.1 10.8 11 13.2 13.3 15.1 ~ 12 fps
med. 1920x1080
100%
UHD Graphics (Jasper Lake 16 EU):
7.5 8.4 9 9.2 9.2 ~ 9 fps
high 1920x1080
100%
UHD Graphics (Jasper Lake 16 EU):
7.1 7.9 8.3 8.6 8.6 ~ 8 fps
low 1280x720
100%
UHD Graphics (Jasper Lake 16 EU):
2.2 6.9 6.9 6.9 7.1 7.2 ~ 6 fps
med. 1920x1080
100%
UHD Graphics (Jasper Lake 16 EU):
3.2 3.3 3.3 ~ 3 fps
high 1920x1080
100%
UHD Graphics (Jasper Lake 16 EU):
2.3 2.3 ~ 2 fps
low 1280x720
HD Graphics (Bay Trail):
26.7  fps
med. 1366x768
HD Graphics (Bay Trail):
23.4  fps
Dirt 4

Dirt 4

2017
low 1280x720
HD Graphics (Bay Trail):
6  fps
low 1280x720
HD Graphics (Bay Trail):
12.6  fps
XCOM 2

XCOM 2

2016
low 1280x720
HD Graphics 4200:
9.8  fps
low 1024x768
HD Graphics 4200:
11.2  fps
med. 1366x768
HD Graphics 4200:
6.4  fps
low 1024x768
HD Graphics 4200:
17.2  fps
med. 1366x768
HD Graphics 4200:
10.7  fps
low 1024x768
HD Graphics 4200:
12  fps
med. 1366x768
HD Graphics 4200:
11.3  fps
low 1024x768
HD Graphics 4200:
19.2  fps
med. 1366x768
HD Graphics 4200:
11.5  fps
low 1024x768
HD Graphics 4200:
14.9  fps
HD Graphics (Bay Trail):
0 (!)  fps
med. 1366x768
HD Graphics 4200:
9.3  fps
Anno 2205

Anno 2205

2015
low 1024x768
HD Graphics 4200:
18  fps
med. 1366x768
HD Graphics 4200:
7.7  fps
low 1366x768
HD Graphics 4200:
37.7  fps
HD Graphics (Bay Trail):
12.1  fps
med. 1366x768
HD Graphics 4200:
24.8  fps
low 1024x768
HD Graphics 4200:
30.7  fps
HD Graphics (Bay Trail):
10.8  fps
med. 1366x768
HD Graphics 4200:
20.5  fps
low 1280x720
100%
UHD Graphics (Jasper Lake 16 EU):
18.9 36.2 47.7 57.3 58.3 58.6 61.2 ~ 48 fps
51%
HD Graphics (Bay Trail):
24.7  fps
med. 1366x768
100%
UHD Graphics (Jasper Lake 16 EU):
20.7 22 22.8 26.6 26.9 26.9 ~ 24 fps
40%
HD Graphics (Bay Trail):
9.7  fps
high 1920x1080
100%
UHD Graphics (Jasper Lake 16 EU):
11.6 11.8 11.8 11.8 12 12 ~ 12 fps
46%
HD Graphics (Bay Trail):
5.5  fps
ultra 1920x1080
100%
UHD Graphics (Jasper Lake 16 EU):
10.8 10.8 10.9 10.9 11.2 11.2 ~ 11 fps
49%
HD Graphics (Bay Trail):
5.4  fps
low 1024x768
100%
UHD Graphics (Jasper Lake 16 EU):
4 13.5 14 ~ 11 fps
80%
HD Graphics 4200:
8.8  fps
med. 1366x768
HD Graphics 4200:
5.1  fps
low 1024x768
HD Graphics 4200:
67.9  fps
HD Graphics (Bay Trail):
22 24.2 ~ 23 fps
med. 1366x768
HD Graphics 4200:
15.6  fps
HD Graphics (Bay Trail):
0 (!) 12.5 ~ 6 fps
GTA V

GTA V

2015
low 1024x768
100%
UHD Graphics (Jasper Lake 16 EU):
0 (!) 25.1 ~ 13 fps
med. 1366x768
100%
UHD Graphics (Jasper Lake 16 EU):
25  fps
high 1920x1080
100%
UHD Graphics (Jasper Lake 16 EU):
5.6  fps
low 1024x768
HD Graphics (Bay Trail):
7.3  fps
med. 1366x768
HD Graphics (Bay Trail):
5.1  fps
Evolve

Evolve

2015
low 1024x768
HD Graphics (Bay Trail):
3.2  fps
med. 1366x768
HD Graphics (Bay Trail):
1.7  fps
The Crew

The Crew

2014
low 1280x720
HD Graphics 4200:
7.8  fps
HD Graphics (Bay Trail):
8.1  fps
med. 1366x768
HD Graphics (Bay Trail):
4.7  fps
low 1024x768
HD Graphics 4200:
8.5 18.5 ~ 14 fps
HD Graphics (Bay Trail):
7  fps
med. 1366x768
HD Graphics 4200:
5.7 11.8 ~ 9 fps
HD Graphics (Bay Trail):
4.6  fps
Far Cry 4

Far Cry 4

2014
low 1024x768
HD Graphics 4200:
6.1  fps
HD Graphics (Bay Trail):
5.6  fps
med. 1366x768
HD Graphics (Bay Trail):
3.8  fps
low 1024x768
HD Graphics 4200:
3.3  fps
HD Graphics (Bay Trail):
4.3  fps
med. 1366x768
HD Graphics (Bay Trail):
2.4  fps
low 1024x768
HD Graphics 4200:
7.3  fps
HD Graphics (Bay Trail):
9.6 11.5 ~ 11 fps
med. 1366x768
HD Graphics 4200:
4.2  fps
HD Graphics (Bay Trail):
4.3  fps
F1 2014

F1 2014

2014
low 1024x768
HD Graphics 4200:
16  fps
HD Graphics (Bay Trail):
12 14 ~ 13 fps
med. 1366x768
HD Graphics 4200:
12  fps
HD Graphics (Bay Trail):
12  fps
high 1920x1080
HD Graphics 4200:
12  fps
low 1024x768
HD Graphics 4200:
6.6  fps
HD Graphics (Bay Trail):
5.2  fps
med. 1366x768
HD Graphics (Bay Trail):
3.6  fps
low 1024x768
HD Graphics 4200:
6.2  fps
HD Graphics (Bay Trail):
3.7  fps
med. 1366x768
HD Graphics 4200:
4.2  fps
HD Graphics (Bay Trail):
2.5  fps
low 1024x768
HD Graphics 4200:
12.9  fps
HD Graphics (Bay Trail):
9.1  fps
med. 1366x768
HD Graphics 4200:
9  fps
HD Graphics (Bay Trail):
5.1  fps
high 1920x1080
HD Graphics 4200:
5.1  fps
low 1280x720
HD Graphics 4200:
9.7 15.1 ~ 12 fps
HD Graphics (Bay Trail):
8.5  fps
med. 1344x756
HD Graphics 4200:
8.4  fps
HD Graphics (Bay Trail):
6.1  fps
high 1920x1080
HD Graphics 4200:
3.4 4 ~ 4 fps
Fifa 15

Fifa 15

2014
low 1280x720
HD Graphics 4200:
15.3  fps
HD Graphics (Bay Trail):
12.4  fps
high 1366x768
HD Graphics 4200:
10.9  fps
HD Graphics (Bay Trail):
8.5  fps
Sims 4

Sims 4

2014
low 1024x768
HD Graphics 4200:
89.1  fps
HD Graphics (Bay Trail):
53.7 56 ~ 55 fps
med. 1366x768
HD Graphics 4200:
24.4  fps
HD Graphics (Bay Trail):
6.6 7 ~ 7 fps
low 1024x768
HD Graphics 4200:
19.9  fps
HD Graphics (Bay Trail):
8.4  fps
med. 1366x768
HD Graphics 4200:
11.7  fps
HD Graphics (Bay Trail):
5.9  fps
low 1024x768
HD Graphics 4200:
57.5  fps
HD Graphics (Bay Trail):
31.6 41.8 ~ 37 fps
med. 1366x768
HD Graphics 4200:
18.9  fps
HD Graphics (Bay Trail):
12.5 12.5 ~ 13 fps
low 1024x768
HD Graphics 4200:
9.7  fps
HD Graphics (Bay Trail):
8.3  fps
med. 1366x768
HD Graphics 4200:
6.5  fps
HD Graphics (Bay Trail):
4.6  fps
low 1280x720
HD Graphics 4200:
27.2  fps
HD Graphics (Bay Trail):
11.1  fps
med. 1280x720
HD Graphics 4200:
21.9  fps
HD Graphics (Bay Trail):
9.6  fps
low 1024x768
HD Graphics 4200:
43.1  fps
HD Graphics (Bay Trail):
25.2  fps
med. 1366x768
HD Graphics 4200:
23.4  fps
HD Graphics (Bay Trail):
9.2  fps
high 1366x768
HD Graphics 4200:
15  fps
Thief

Thief

2014
low 1024x768
HD Graphics 4200:
11 14 ~ 13 fps
HD Graphics (Bay Trail):
3.1 5.1 ~ 4 fps
med. 1366x768
HD Graphics 4200:
5.3 7.1 ~ 6 fps
HD Graphics (Bay Trail):
3.3  fps
high 1366x768
HD Graphics 4200:
5.8  fps
low 1024x768
HD Graphics 4200:
13  fps
HD Graphics (Bay Trail):
8.7  fps
med. 1366x768
HD Graphics 4200:
9.8  fps
HD Graphics (Bay Trail):
5.8  fps
low 1024x768
HD Graphics 4200:
26.2  fps
HD Graphics (Bay Trail):
12.8  fps
med. 1366x768
HD Graphics 4200:
13.9  fps
HD Graphics (Bay Trail):
6  fps
low 1024x768
HD Graphics 4200:
14.1  fps
low 1024x768
HD Graphics 4200:
18.4  fps
med. 1366x768
HD Graphics 4200:
12.7  fps
high 1366x768
HD Graphics 4200:
4.2  fps
low 1024x768
HD Graphics 4200:
15.9  fps
HD Graphics (Bay Trail):
7.3  fps
med. 1366x768
HD Graphics 4200:
10.1  fps
high 1366x768
HD Graphics 4200:
6.6  fps
ultra 1920x1080
HD Graphics 4200:
2.5  fps
low 1024x768
HD Graphics 4200:
24  fps
HD Graphics (Bay Trail):
14  fps
med. 1366x768
HD Graphics 4200:
14  fps
HD Graphics (Bay Trail):
8  fps
high 1366x768
HD Graphics 4200:
7  fps
F1 2013

F1 2013

2013
low 1024x768
HD Graphics 4200:
31  fps
HD Graphics (Bay Trail):
12  fps
med. 1366x768
HD Graphics 4200:
21  fps
high 1366x768
HD Graphics 4200:
16  fps
ultra 1920x1080
HD Graphics 4200:
12  fps
Fifa 14

Fifa 14

2013
low 1024x768
HD Graphics 4200:
90.8  fps
HD Graphics (Bay Trail):
12.6 18.7 19.9 29.8 33.6 60 ~ 29 fps
med. 1366x768
HD Graphics 4200:
59.7  fps
HD Graphics (Bay Trail):
10.5 19.5 33 ~ 21 fps
high 1366x768
HD Graphics 4200:
33.3  fps
HD Graphics (Bay Trail):
7.8 12.8 22 ~ 14 fps
ultra 1920x1080
HD Graphics 4200:
22.3  fps
low 1024x768
HD Graphics 4200:
27.7  fps
HD Graphics (Bay Trail):
7.7  fps
med. 1366x768
HD Graphics 4200:
18.4  fps
high 1366x768
HD Graphics 4200:
13.3  fps
ultra 1920x1080
HD Graphics 4200:
4.7  fps
low 1280x720
HD Graphics 4200:
11.3  fps
HD Graphics (Bay Trail):
6.3  fps
med. 1366x768
HD Graphics 4200:
8.8  fps
high 1366x768
HD Graphics 4200:
5.2  fps
ultra 1920x1080
HD Graphics 4200:
3.5  fps
low 1024x768
HD Graphics 4200:
11.9  fps
HD Graphics (Bay Trail):
10.2  fps
med. 1366x768
HD Graphics 4200:
8.2  fps
HD Graphics (Bay Trail):
6.1  fps
high 1366x768
HD Graphics 4200:
6.6  fps
low 1024x768
HD Graphics 4200:
17.8  fps
HD Graphics (Bay Trail):
11  fps
med. 1366x768
HD Graphics 4200:
10.4  fps
HD Graphics (Bay Trail):
7.8  fps
high 1366x768
HD Graphics 4200:
5.8  fps
Dota 2

Dota 2

2013
low 1024x768
HD Graphics 4200:
28.3 40 42.1 ~ 37 fps
HD Graphics (Bay Trail):
18.2 20.8 28.4 31.9 ~ 25 fps
med. 1366x768
HD Graphics 4200:
15.8 21.6 22.7 ~ 20 fps
HD Graphics (Bay Trail):
9.5 10.4 13.7 19.4 ~ 13 fps
ultra 1920x1080
HD Graphics 4200:
9.8 11.5 ~ 11 fps
low 1024x768
HD Graphics 4200:
8.3  fps
HD Graphics (Bay Trail):
4.4  fps
med. 1366x768
HD Graphics 4200:
7  fps
high 1366x768
HD Graphics 4200:
4.3  fps
GRID 2

GRID 2

2013
low 1024x768
HD Graphics 4200:
51.1  fps
HD Graphics (Bay Trail):
14.1 16.2 17.9 20.4 23.2 ~ 18 fps
med. 1366x768
HD Graphics 4200:
25.7  fps
HD Graphics (Bay Trail):
12.5 12.6 ~ 13 fps
high 1366x768
HD Graphics 4200:
17.9  fps
low 1024x768
HD Graphics 4200:
12.7  fps
HD Graphics (Bay Trail):
5  fps
med. 1366x768
HD Graphics 4200:
9.1  fps
high 1366x768
HD Graphics 4200:
5.3  fps
ultra 1920x1080
HD Graphics 4200:
3  fps
low 1280x720
HD Graphics 4200:
10.4 24 25.4 26 ~ 21 fps
HD Graphics (Bay Trail):
8.4 8.4 10.9 11.4 12.2 13.3 14.2 14.7 15 ~ 12 fps
med. 1366x768
HD Graphics 4200:
5.2 12.9 13.1 15 ~ 12 fps
HD Graphics (Bay Trail):
3.5 5.3 5.6 5.7 6.3 6.8 6.9 7.1 ~ 6 fps
high 1366x768
HD Graphics 4200:
10.6 11.2 ~ 11 fps
HD Graphics (Bay Trail):
2.1 4.8 4.9 5.8 5.9 6.2 ~ 5 fps
ultra 1920x1080
HD Graphics 4200:
2.8  fps
HD Graphics (Bay Trail):
1.2  fps
low 1024x768
HD Graphics 4200:
95 109.2 ~ 102 fps
HD Graphics (Bay Trail):
39 56.2 69 ~ 55 fps
med. 1366x768
HD Graphics 4200:
31 38.8 ~ 35 fps
HD Graphics (Bay Trail):
12.3 12.8 14 ~ 13 fps
high 1366x768
HD Graphics 4200:
20 22.7 ~ 21 fps
ultra 1920x1080
HD Graphics 4200:
7  fps
SimCity

SimCity

2013
low 1024x768
HD Graphics 4200:
18.8  fps
med. 1366x768
HD Graphics 4200:
10.1  fps
high 1366x768
HD Graphics 4200:
6.8  fps
low 1024x768
HD Graphics 4200:
14 18.6 22.4 25 31.5 33.9 34.5 38 44.4 46.8 ~ 31 fps
HD Graphics (Bay Trail):
10 11.7 11.8 12 12.4 12.5 12.5 12.6 12.7 12.9 13.2 13.4 13.7 13.8 14 14.1 14.2 14.4 14.4 14.7 14.8 15 15.3 15.4 15.5 15.5 15.9 15.9 16 16.5 16.9 17.6 18 ~ 14 fps
med. 1366x768
HD Graphics 4200:
7.7 10.3 12.3 14.3 17.1 17.3 18.9 22.4 22.8 ~ 16 fps
HD Graphics (Bay Trail):
5.1 6.1 6.2 6.4 6.7 6.7 6.9 6.9 7 7 7.1 7.1 7.4 7.4 7.4 7.5 7.5 7.6 7.8 7.9 8 8 8.1 8.1 8.2 8.3 8.4 9.2 10.4 ~ 7 fps
high 1366x768
HD Graphics 4200:
7.4 8.1 9.9 10.6 10.9 12.8 12.9 ~ 10 fps
HD Graphics (Bay Trail):
3.1 4.5 4.6 4.8 4.8 4.8 4.8 4.9 4.9 5.2 5.2 5.4 5.4 6.1 7.3 ~ 5 fps
ultra 1920x1080
HD Graphics 4200:
4.3  fps
HD Graphics (Bay Trail):
0.3  fps
Crysis 3

Crysis 3

2013
low 1024x768
HD Graphics 4200:
11.4  fps
med. 1366x768
HD Graphics 4200:
7.2  fps
high 1366x768
HD Graphics 4200:
4.9  fps
low 1024x768
HD Graphics 4200:
47.6  fps
HD Graphics (Bay Trail):
15.1 23.6 ~ 19 fps
med. 1366x768
HD Graphics 4200:
20.9  fps
HD Graphics (Bay Trail):
5.2 9.7 ~ 7 fps
high 1366x768
HD Graphics 4200:
14.2  fps
ultra 1920x1080
HD Graphics 4200:
7.2  fps
Far Cry 3

Far Cry 3

2012
low 1024x768
HD Graphics 4200:
26.2  fps
HD Graphics (Bay Trail):
10.3  fps
med. 1366x768
HD Graphics 4200:
16.5  fps
HD Graphics (Bay Trail):
6.2  fps
low 1024x768
HD Graphics 4200:
16.7  fps
HD Graphics (Bay Trail):
10.1  fps
med. 1366x768
HD Graphics 4200:
11.4  fps
HD Graphics (Bay Trail):
6  fps
high 1366x768
HD Graphics 4200:
3.8  fps
low 1024x768
HD Graphics 4200:
27.2  fps
HD Graphics (Bay Trail):
12.4  fps
med. 1366x768
HD Graphics 4200:
19.1  fps
HD Graphics (Bay Trail):
7.3  fps
high 1366x768
HD Graphics 4200:
8.9  fps
low 1024x768
HD Graphics 4200:
22.9  fps
med. 1366x768
HD Graphics 4200:
15.1  fps
low 1024x768
HD Graphics 4200:
17.8  fps
HD Graphics (Bay Trail):
12.5 14.3 ~ 13 fps
med. 1366x768
HD Graphics 4200:
14.5  fps
HD Graphics (Bay Trail):
9.8 11.2 ~ 11 fps
high 1366x768
HD Graphics 4200:
13.9  fps
ultra 1920x1080
HD Graphics 4200:
8.5  fps
Fifa 13

Fifa 13

2012
low 1024x768
HD Graphics 4200:
104.8  fps
med. 1366x768
HD Graphics 4200:
55.6  fps
high 1366x768
HD Graphics 4200:
49.2  fps
ultra 1920x1080
HD Graphics 4200:
31.7  fps
low 1024x768
HD Graphics 4200:
20  fps
med. 1366x768
HD Graphics 4200:
15.5  fps
high 1366x768
HD Graphics 4200:
9.3  fps
low 1024x768
HD Graphics (Bay Trail):
42  fps
low 1024x768
HD Graphics 4200:
41  fps
high 1366x768
HD Graphics 4200:
10  fps
ultra 1920x1080
HD Graphics 4200:
4  fps
low 1024x768
100%
UHD Graphics (Jasper Lake 16 EU):
57.6  fps
123%
HD Graphics 4200:
70.7  fps
63%
HD Graphics (Bay Trail):
26.1 46.6 ~ 36 fps
med. 1366x768
100%
UHD Graphics (Jasper Lake 16 EU):
48.1  fps
74%
HD Graphics 4200:
35.5  fps
46%
HD Graphics (Bay Trail):
20 23.9 ~ 22 fps
high 1366x768
HD Graphics 4200:
18.9  fps
ultra 1920x1080
100%
UHD Graphics (Jasper Lake 16 EU):
17.8  fps
70%
HD Graphics 4200:
12.5  fps
low 1024x768
HD Graphics 4200:
22.7  fps
HD Graphics (Bay Trail):
12.9 13.2 ~ 13 fps
med. 1366x768
HD Graphics 4200:
16.5  fps
HD Graphics (Bay Trail):
7.5 8.1 ~ 8 fps
high 1366x768
HD Graphics 4200:
8.2  fps
ultra 1920x1080
HD Graphics 4200:
5.5  fps
low 1024x768
HD Graphics 4200:
34.5  fps
HD Graphics (Bay Trail):
28  fps
med. 1366x768
HD Graphics 4200:
18.9  fps
high 1366x768
HD Graphics 4200:
12.6  fps
ultra 1920x1080
HD Graphics 4200:
4.9  fps
low 1024x768
HD Graphics 4200:
32.5 38.7 ~ 36 fps
HD Graphics (Bay Trail):
9.2 10.7 14.8 15.6 16.5 18.4 19.3 ~ 15 fps
med. 1366x768
HD Graphics 4200:
21.8 23.3 ~ 23 fps
HD Graphics (Bay Trail):
6 9.5 10.3 11.4 12 ~ 10 fps
high 1366x768
HD Graphics 4200:
16.9 19 ~ 18 fps
HD Graphics (Bay Trail):
7.9 9.6 ~ 9 fps
ultra 1920x1080
HD Graphics 4200:
9.8  fps
HD Graphics (Bay Trail):
5 5.9 ~ 5 fps
low 1280x720
HD Graphics 4200:
28.2  fps
HD Graphics (Bay Trail):
8.5 12.4 ~ 10 fps
high 1366x768
HD Graphics 4200:
19.5  fps
HD Graphics (Bay Trail):
8.1  fps
ultra 1920x1080
HD Graphics 4200:
11.1  fps
Alan Wake

Alan Wake

2012
low 1024x768
HD Graphics 4200:
8.4  fps
HD Graphics (Bay Trail):
5.8  fps
med. 1366x768
HD Graphics 4200:
6.1  fps
HD Graphics (Bay Trail):
2.3  fps
Anno 2070

Anno 2070

2011
low 1024x768
HD Graphics 4200:
21 36.8 41.8 ~ 33 fps
HD Graphics (Bay Trail):
11.8 14.6 15 15.1 15.3 16.1 16.5 16.8 16.8 17.4 17.4 18 18 18.2 19.7 22.8 ~ 17 fps
med. 1366x768
HD Graphics 4200:
14 17.3 21.2 ~ 18 fps
HD Graphics (Bay Trail):
6.3 6.4 6.4 6.8 6.9 7.2 7.5 7.5 7.6 8 8.1 9.3 ~ 7 fps
high 1366x768
HD Graphics 4200:
10.3 12.3 ~ 11 fps
HD Graphics (Bay Trail):
3.6 4 4 4.1 5.5 ~ 4 fps
ultra 1920x1080
HD Graphics 4200:
5.4  fps
HD Graphics (Bay Trail):
1.1  fps
low 1280x720
HD Graphics 4200:
24.4  fps
HD Graphics (Bay Trail):
11 11.8 ~ 11 fps
med. 1366x768
HD Graphics 4200:
10.2  fps
HD Graphics (Bay Trail):
10  fps
high 1366x768
HD Graphics 4200:
5.7  fps
ultra 1920x1080
HD Graphics 4200:
2.9  fps
low 1024x768
HD Graphics 4200:
13.9  fps
HD Graphics (Bay Trail):
8  fps
med. 1366x768
HD Graphics 4200:
9.9  fps
HD Graphics (Bay Trail):
4.8  fps
high 1366x768
HD Graphics 4200:
5.4  fps
low 1024x768
HD Graphics 4200:
27.5 42.6 ~ 35 fps
HD Graphics (Bay Trail):
19.7  fps
high 1366x768
HD Graphics 4200:
15.4 19 ~ 17 fps
ultra 1920x1080
HD Graphics 4200:
8.9  fps
Dirt 3

Dirt 3

2011
low 800x600
HD Graphics 4200:
24.4 67.8 ~ 46 fps
HD Graphics (Bay Trail):
24.1 36.9 ~ 31 fps
med. 1024x768
HD Graphics 4200:
12 34.1 ~ 23 fps
HD Graphics (Bay Trail):
12.9 13.3 ~ 13 fps
high 1360x768
HD Graphics 4200:
20.4  fps
Total War: Shogun 2

Total War: Shogun 2

2011
low 1024x768
HD Graphics 4200:
54.8  fps
Civilization 5

Civilization 5

2010
low 1024x768
HD Graphics (Bay Trail):
9.3  fps
Mafia 2

Mafia 2

2010
low 800x600
HD Graphics (Bay Trail):
5 10.5 ~ 8 fps
med. 1024x768
HD Graphics (Bay Trail):
5.6  fps
high 1360x768
HD Graphics (Bay Trail):
3.7  fps
low 1024x768
HD Graphics (Bay Trail):
32 48 49 53.3 ~ 46 fps
med. 1360x768
HD Graphics (Bay Trail):
6 9 9 ~ 8 fps
high 1360x768
HD Graphics (Bay Trail):
3  fps
low 800x600
HD Graphics (Bay Trail):
12  fps
med. 1360x768
HD Graphics (Bay Trail):
9  fps
low 1024x768
HD Graphics 4200:
32.2  fps
HD Graphics (Bay Trail):
12.8  fps
med. 1366x768
HD Graphics 4200:
24.5  fps
HD Graphics (Bay Trail):
9  fps
high 1366x768
HD Graphics 4200:
15.6  fps
Risen

Risen

2009
low 800x600
HD Graphics 4200:
37.5  fps
HD Graphics (Bay Trail):
23.1 25 26.2 28.8 ~ 26 fps
med. 1024x768
HD Graphics 4200:
19.5  fps
HD Graphics (Bay Trail):
8.7 9 10.4 11.1 ~ 10 fps
high 1366x768
HD Graphics 4200:
14  fps
Resident Evil 5

Resident Evil 5

2009
low 800x600
HD Graphics 4200:
56.5  fps
HD Graphics (Bay Trail):
17.1 26.1 26.2 26.3 ~ 24 fps
high 1360x768
HD Graphics 4200:
22.8  fps
Trackmania Nations Forever

Trackmania Nations Forever

2008
low 640x480
HD Graphics 4200:
121 130 ~ 126 fps
HD Graphics (Bay Trail):
42.9 69.8 69.8 71.6 72 72.7 75.1 75.5 76 76.7 77.1 80.9 83.1 83.9 84.3 84.8 85.6 86.9 90.2 ~ 77 fps
high 1024x768
HD Graphics 4200:
43.9 46.9 ~ 45 fps
HD Graphics (Bay Trail):
10.3 14 17.7 18 18.1 18.1 18.7 18.8 19.3 19.4 19.4 19.8 19.8 20.5 20.5 20.6 21 21.5 23.6 ~ 19 fps
ultra 1920x1080
HD Graphics (Bay Trail):
6.4 7.7 ~ 7 fps
Crysis - GPU Benchmark

Crysis - GPU Benchmark

2007
low 1024x768
HD Graphics (Bay Trail):
18.9 19 ~ 19 fps
med. 1024x768
HD Graphics (Bay Trail):
7.6 8.7 ~ 8 fps
World of Warcraft

World of Warcraft

2005
low 800x600
HD Graphics 4200:
64.6  fps
HD Graphics (Bay Trail):
33 33 35 38 44 46.2 47 48 49 49 50 52 ~ 44 fps
med. 1024x768
HD Graphics 4200:
53.4  fps
HD Graphics (Bay Trail):
9.6 11.5 20 22 23 25.3 26 26 28 34 ~ 23 fps
high 1280x1024
HD Graphics (Bay Trail):
12 12 13.5 ~ 13 fps
ultra 1920x1080
HD Graphics (Bay Trail):
5.6 7 ~ 6 fps
Quake 3 Arena - Timedemo

Quake 3 Arena - Timedemo

1999
high 1024x768
HD Graphics (Bay Trail):
190  fps

Average Gaming Intel UHD Graphics (Jasper Lake 16 EU) → 100%

Average Gaming 30-70 fps → 100%

Average Gaming Intel HD Graphics 4200 → 87%

Average Gaming 30-70 fps → 74%

Average Gaming Intel HD Graphics (Bay Trail) → 49%

Average Gaming 30-70 fps → 63%

Intel UHD Graphics (Jasper Lake 16 EU)lowmed.highultraQHD4K
F1 22
Elden Ring5.18
F1 202119
Total War: Three Kingdoms15.2
Shadow of the Tomb Raider7
Strange Brigade1676
Far Cry 57
X-Plane 11.111298
Final Fantasy XV Benchmark632
Dota 2 Reborn48241211
The Witcher 311
GTA V13255.59
Counter-Strike: GO57.648.117.8
< 30 fps
< 60 fps
< 120 fps
≥ 120 fps
10
2

5
1

5


2


Intel HD Graphics (Bay Trail)lowmed.highultraQHD4K
Team Fortress 226.723.4
Dirt 46
Rocket League12.6
Call of Duty: Black Ops 30
World of Warships12.1
Metal Gear Solid V10.8
Dota 2 Reborn24.79.75.55.4
Dirt Rally236
Battlefield Hardline7.35.1
Evolve3.21.7
The Crew8.14.7
Dragon Age: Inquisition74.6
Far Cry 45.63.8
Assassin's Creed Unity4.32.4
Civilization: Beyond Earth114.3
F1 20141312
The Evil Within5.23.6
Ryse: Son of Rome3.72.5
Alien: Isolation9.15.1
Middle-earth: Shadow of Mordor8.56.1
Fifa 1512.48.5
Sims 4557
Risen 3: Titan Lords8.45.9
GRID: Autosport3713
Watch Dogs8.34.6
Wolfenstein: The New Order11.19.6
The Elder Scrolls Online25.29.2
Thief43.3
Assassin´s Creed IV: Black Flag8.75.8
X-Plane 10.2512.86
Battlefield 47.3
Batman: Arkham Origins148
F1 201312
Fifa 14292114
Total War: Rome II7.7
Saints Row IV6.3
The Bureau: XCOM Declassified10.26.1
Splinter Cell: Blacklist117.8
Dota 22513
Company of Heroes 24.4
GRID 21813
Metro: Last Light5
BioShock Infinite12651.2
StarCraft II: Heart of the Swarm5513
Tomb Raider14750.3
Dead Space 3197
Far Cry 310.36.2
Hitman: Absolution10.16
Call of Duty: Black Ops 212.47.3
Dishonored1311
Torchlight 242
Counter-Strike: GO3622
Sleeping Dogs138
Dirt Showdown28
Diablo III151095
Mass Effect 3108.1
Alan Wake5.82.3
Anno 207017741.1
The Elder Scrolls V: Skyrim1110
Battlefield 384.8
Deus Ex Human Revolution19.7
Dirt 33113
Civilization 59.3
Mafia 285.63.7
StarCraft 24683
Metro 2033129
Battlefield: Bad Company 212.89
Risen2610
Resident Evil 524
Trackmania Nations Forever77197
Crysis - GPU Benchmark198
World of Warcraft4423136
Quake 3 Arena - Timedemo190
< 30 fps
< 60 fps
< 120 fps
≥ 120 fps
62
8
1
53


12


1
7


Intel HD Graphics 4200lowmed.highultraQHD4K
XCOM 29.8
Rise of the Tomb Raider11.26.4
Rainbow Six Siege17.210.7
Just Cause 31211.3
Star Wars Battlefront19.211.5
Call of Duty: Black Ops 314.99.3
Anno 2205187.7
World of Warships37.724.8
Metal Gear Solid V30.720.5
The Witcher 38.85.1
Dirt Rally67.915.6
The Crew7.8
Dragon Age: Inquisition149
Far Cry 46.1
Assassin's Creed Unity3.3
Civilization: Beyond Earth7.34.2
F1 2014161212
The Evil Within6.6
Ryse: Son of Rome6.24.2
Alien: Isolation12.995.1
Middle-earth: Shadow of Mordor128.434
Fifa 1515.310.9
Sims 489.124.4
Risen 3: Titan Lords19.911.7
GRID: Autosport57.518.9
Watch Dogs9.76.5
Wolfenstein: The New Order27.221.9
The Elder Scrolls Online43.123.415
Thief1365.8
Assassin´s Creed IV: Black Flag139.8
X-Plane 10.2526.213.9
Need for Speed: Rivals14.1
Call of Duty: Ghosts18.412.74.2
Battlefield 415.910.16.62.5
Batman: Arkham Origins24147
F1 201331211612
Fifa 1490.859.733.322.3
Total War: Rome II27.718.413.34.7
Saints Row IV11.38.85.23.5
The Bureau: XCOM Declassified11.98.26.6
Splinter Cell: Blacklist17.810.45.8
Dota 2372011
Company of Heroes 28.374.3
GRID 251.125.717.9
Metro: Last Light12.79.15.33
BioShock Infinite2112112.8
StarCraft II: Heart of the Swarm10235217
SimCity18.810.16.8
Tomb Raider3116104.3
Crysis 311.47.24.9
Dead Space 347.620.914.27.2
Far Cry 326.216.5
Hitman: Absolution16.711.43.8
Call of Duty: Black Ops 227.219.18.9
Medal of Honor: Warfighter22.915.1
Dishonored17.814.513.98.5
Fifa 13104.855.649.231.7
Borderlands 22015.59.3
Guild Wars 241104
Counter-Strike: GO70.735.518.912.5
Sleeping Dogs22.716.58.25.5
Dirt Showdown34.518.912.64.9
Diablo III3623189.8
Mass Effect 328.219.511.1
Alan Wake8.46.1
Anno 20703318115.4
The Elder Scrolls V: Skyrim24.410.25.72.9
Battlefield 313.99.95.4
Deus Ex Human Revolution35178.9
Dirt 3462320.4
Total War: Shogun 254.8
Battlefield: Bad Company 232.224.515.6
Risen37.519.514
Resident Evil 556.522.8
Trackmania Nations Forever12645
World of Warcraft64.653.4
< 30 fps
< 60 fps
< 120 fps
≥ 120 fps
49
19
7
1
58
5

41
3

21
1


Eine Liste mit weiteren Spielen und allen Grafikkarten finden Sie auf unserer Seite: Welches Spiel ist mit welcher Grafikkarte spielbar?

v1.28
log 04. 23:16:46

#0 ran 0s before starting gpusingle class +0s ... 0s

#1 checking url part for id 10644 +0s ... 0s

#2 checking url part for id 4576 +0s ... 0s

#3 checking url part for id 4922 +0s ... 0s

#4 redirected to Ajax server, took 1728076606s time from redirect:0 +0s ... 0s

#5 did not recreate cache, as it is less than 5 days old! Created at Fri, 04 Oct 2024 05:16:46 +0200 +0s ... 0s

#6 composed specs +0.005s ... 0.005s

#7 did output specs +0s ... 0.005s

#8 start showIntegratedCPUs +0s ... 0.005s

#9 getting avg benchmarks for device 10644 +0.002s ... 0.007s

#10 got single benchmarks 10644 +0.001s ... 0.008s

#11 getting avg benchmarks for device 4576 +0.001s ... 0.009s

#12 got single benchmarks 4576 +0.001s ... 0.011s

#13 getting avg benchmarks for device 4922 +0.003s ... 0.014s

#14 got single benchmarks 4922 +0.009s ... 0.023s

#15 got avg benchmarks for devices +0s ... 0.023s

#16 No cached benchmark found, getting uncached values +0.009s ... 0.031s

#17 No cached benchmark found, getting uncached values +0.001s ... 0.032s

#18 No cached benchmark found, getting uncached values +0.022s ... 0.054s

#19 min, max, avg, median took s +0.001s ... 0.055s

#20 before gaming benchmark output +0s ... 0.055s

#21 Got 746 rows for game benchmarks. +0.061s ... 0.116s

#22 composed SQL query for gamebenchmarks +0s ... 0.116s

#23 got data and put it in $dataArray +0.004s ... 0.12s

#24 benchmarks composed for output. +0.028s ... 0.148s

#25 calculated avg scores. +0s ... 0.148s

#26 return log +0.001s ... 0.149s

Teilen Sie diesen Artikel, um uns zu unterstützen. Jeder Link hilft!
> Notebook Test, Laptop Test und News > Benchmarks / Technik > Benchmarks / Technik > Grafikkarten Vergleich - Head 2 Head
Autor: Klaus Hinum,  8.09.2017 (Update:  1.07.2023)