Notebookcheck Logo

Intel UHD Graphics 617 vs Intel HD Graphics 400 (Braswell) vs Intel HD Graphics P630

Intel UHD Graphics 617

► remove from comparison Intel UHD Graphics 617

Die Intel UHD Graphics 617 (GT2) ist eine Prozessorgrafikkarte der im Sommer 2018 vorgestellten Amber-Lake-Generation. Als Nachfolger der Intel HD Graphics 615 (Kaby-Lake-Y) ist die UHD 615 und 617 dabei in der besonders sparsamen Y-Serie mit 5-7 Watt TDP zu finden. Die sogenannte GT2-Ausbaustufe der GPU verfügt über 24 Ausführungseinheiten (EUs) und taktet je nach Modell mit bis zu 1.050 MHz. Technisch gibt es keine Unterschiede zur alten HD Graphics 615, nur die Taktraten wurden leicht abgeändert und durch den verbesserten 14nm++ Prozess könnte der Turbo etwas länger gehalten werden. Im Vergleich zur UHD Graphics 615 in anderen Amber Lake Modellen, bietet die 617 einen höheren Boost-Takt und 7 Watt TDP.

Mangels eigenem Grafikspeicher oder eDRAM-Cache greift die UHD Graphics 617 über das Interface des Prozessors auf den System-RAM zu (2x 64 Bit DDR3L/LPDDR3).

Performance

Die exakte Leistung der UHD Graphics 617 hängt stark vom jeweiligen CPU-Modell sowie dem konkreten Endgerät ab, da sich Maximaltaktrate sowie TDP-Konfiguration/Kühlung erheblich unterscheiden können. Zum anderen bestimmt auch der verwendete Speicher (DDR3L/LPDDR3) die Performance. Insgesamt dürfte die UHD 617 etwa das Niveau der alten Kaby-Lake HD Graphics 615 erreichen. Einige aktuelle anspruchslose Spiele wie Farming Simulator 17 oder Rocket League können so in niedrigsten Einstellungen flüssig dargestellt werden. Mit gelegentlichen Rucklern muss man jedoch immer rechnen. Detaillierte Benchmarks und viele Spieletests der gleich schnellen HD Graphics 615 finden sie hier.

Anders als Skylake kann Kaby Lake und damit auch Amber Lake nun auch H.265/HEVC im Main10-Profil mit 10 Bit Farbtiefe sowie Googles VP9-Codec in Hardware decodieren. HDCP 2.2 sollte unterstützt werden, was beispielsweise für die Ausgabe von Netflix-Videos in 4K benötigt wird. HDMI 2.0 unterstützt die UHD Graphics 615 jedoch weiterhin nur per Wandler (LSPCon) über den DisplayPort.

Leistungsaufnahme

Die UHD Graphics 617 ist in ULV-Prozessoren der 7-Watt-Klasse zu finden (TDP kann vom Gerätehersteller angepasst werden) und damit für passiv gekühlte Subnotebooks wie das MacBook Air geeignet.

Intel HD Graphics 400 (Braswell)

► remove from comparison Intel HD Graphics 400 (Braswell)

Die Intel HD Graphics 400 ist eine in den Low-End-SoCs der Braswell-Serie (z.B. Celeron Serie in 2016) integrierte Grafikeinheit. Sie basiert auf der gleichen Architektur wie die GPU verschiedener Broadwell-Prozessoren (z.B. HD Graphics 5300), bietet allerdings deutlich weniger Shadereinheiten und geringere Taktraten. Die genauen Spezifikationen hängen vom jeweiligen SoC ab: Die schnellste Variante bietet derzeit 12 EUs und maximal 640 MHz.

Anfangs wurde die GPU nur Intel HD Graphics benannt, später als Intel HD Graphics 400 (12 EU Version) und Intel HD Graphics 405 (16 EU Version) bezeichnet.

Anwender müssen sich deshalb insbesondere bei den Celeron-Modellen, die zusätzlich durch die Beschneidung auf nur zwei CPU-Kerne ausgebremst werden, auf ältere und anspruchslose Spiele beschränken. Videos werden dagegen auch in 4K/H.265 flüssig wiedergeben.

Für mehr Benchmarks besuchen sie auch die Seite der Intel HD Graphics (Braswell) GPU, welche Benchmarks der älteren baugleichen 12 und 16 EU Versionen beinhaltet.

Intel HD Graphics P630

► remove from comparison Intel HD Graphics P630

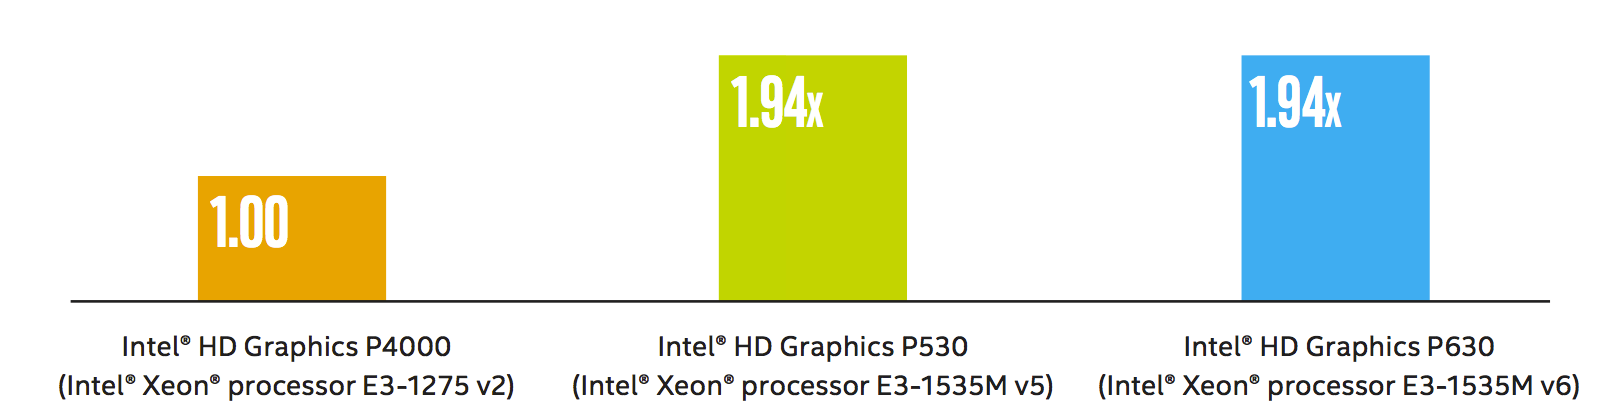
Die Intel HD Graphics P630 (GT2) ist eine integrierte Workstation-Grafikeinheit, die in verschiedenen Desktop- und Notebook-Prozessoren der 2017 vorgestellten Kaby-Lake-Generation zu finden ist (Xeon E3-1200 v6 und e3-1500M v6 Serien). Sie ist identisch mit der Intel HD Graphics 630, jedoch sind die Treiber für professionelle Software optimiert. Daher unterscheidet sie sich auch nicht von der Intel HD Graphics P530 und erreicht laut Intel auch die selbe Leistung im SPEC Viewperf12 (1.94x der alten Intel HD Graphics P4000). Die Grafikkarte ist derzeit für 15 CAD- und Workstation-Anwendungen zertifiziert.

Features

Neu bei der Kaby-Lake Generation ist die verbesserte Videoengine, welche nun auch H.265/HEVC im Main10-profil mit 10 Bit Farbtiefe sowie Googles VP9-Codec in Hardware dekodieren kann. Die Chips mit HD Graphics 530 sollten auch bereits HDCP 2.2 unterstützen und somit z.B. Netflix-Videos unter Windows 10 in 4K ausgeben können (im Gegensatz zu den ersten Kaby-Lake Dual-Core Chips mit Intel HD Graphics 620).

Leistungsaufnahme

Die HD Graphics P630 ist in Desktop- und Notebook-Prozessoren verschiedener TDP-Klassen zu finden. Die Quad-Core CPUs sind jedoch meistens in größeren und schwereren Notebooks verbaut. Der verbesserte 14nm+ Prozess verspricht jedoch eine etwas geringere Leistungsaufnahme im Vergleich zur Intel HD Graphics P530.

Quelle: http://www.intel.com/content/dam/www/public/us/en/documents/guides/hd-graphics-performance-guide.pdf

Intel UHD Graphics 617Intel HD Graphics 400 (Braswell)Intel HD Graphics P630
Gen. 9.5 Serie
Iris Plus Graphics 655 48 @ 0.3 - 1.2 GHz
Iris Plus Graphics 650 48 @ 0.3 - 1.1 GHz64/128 Bit
Iris Plus Graphics 645 48 @ 0.3 - 1.15 GHz
Iris Plus Graphics 640 48 @ 0.3 - 1.05 GHz64/128 Bit
UHD Graphics 630 24 @ 0.3 - 1.15 GHz64/128 Bit
UHD Graphics P630 24 @ 0.3 - 1.2 GHz64/128 Bit
HD Graphics 630 24 @ 0.3 - 1.15 GHz64/128 Bit
HD Graphics P630 24 64/128 Bit
UHD Graphics 620 24 @ 0.3 - 1.15 GHz
HD Graphics 620 24 @ 0.3 - 1.05 GHz64/128 Bit
UHD Graphics 617 24 @ 0.3 - 1.15 GHz64/128 Bit
UHD Graphics 615 24 @ 0.3 - 1 GHz64/128 Bit
HD Graphics 615 24 @ 0.3 - 1.05 GHz64/128 Bit
HD Graphics P530 24 @ 0.35 - 1.05 GHz64/128 Bit
HD Graphics 5600 24 @ 0.3 - 1.05 GHz64/128 Bit
HD Graphics 6000 48 @ 0.3 - 1 GHz64/128 Bit
HD Graphics 4600 20 @ 0.2 - 1.35 GHz64/128 Bit
HD Graphics 5500 24 @ 0.3 - 0.95 GHz64/128 Bit
HD Graphics 5000 40 @ 0.2 - 1.1 GHz64/128 Bit
HD Graphics 4400 20 @ 0.2 - 1.1 GHz64/128 Bit
HD Graphics 5300 24 @ 0.1 - 0.9 GHz64/128 Bit
HD Graphics 4000 16 @ 0.35 - 1.35 GHz64/128 Bit
HD Graphics (Broadwell) 12 @ 0.1 - 0.85 GHz64/128 Bit
HD Graphics 4200 20 @ 0.2 - 0.85 GHz64/128 Bit
HD Graphics (Skylake) 12 @ 0.3 - 0.8 GHz64/128 Bit
HD Graphics 405 (Braswell) 16 @ 0.32 - 0.7 GHz64/128 Bit
HD Graphics (Braswell) 16 @ 0.32 - 0.7 GHz64/128 Bit
HD Graphics 400 (Braswell) 12 @ 0.32 - 0.64 GHz64/128 Bit
HD Graphics (Haswell) 10 @ 0.2 - 1 GHz64/128 Bit
HD Graphics (Cherry Trail) 16 @ 0.2 - 0.6 GHz64/128 Bit
HD Graphics 3000 12 @ 0.35 - 1.35 GHz64/128 Bit
HD Graphics 2500 6 @ 0.65 - 1.15 GHz64/128 Bit
HD Graphics (Ivy Bridge) 6 @ 0.35 - 1.1 GHz64/128 Bit
HD Graphics 2000 6 @ 0.85 - 1.35 GHz64/128 Bit
HD Graphics (Sandy Bridge) 6 @ 0.35 - 1.1 GHz64/128 Bit
HD Graphics (Bay Trail) 4 @ 0.31 - 0.9 GHz32/64/128 Bit
Iris Plus Graphics 655 48 @ 0.3 - 1.2 GHz
Iris Plus Graphics 650 48 @ 0.3 - 1.1 GHz64/128 Bit
Iris Plus Graphics 645 48 @ 0.3 - 1.15 GHz
Iris Plus Graphics 640 48 @ 0.3 - 1.05 GHz64/128 Bit
UHD Graphics 630 24 @ 0.3 - 1.15 GHz64/128 Bit
UHD Graphics P630 24 @ 0.3 - 1.2 GHz64/128 Bit
HD Graphics 630 24 @ 0.3 - 1.15 GHz64/128 Bit
HD Graphics P630 24 64/128 Bit
UHD Graphics 620 24 @ 0.3 - 1.15 GHz
HD Graphics 620 24 @ 0.3 - 1.05 GHz64/128 Bit
UHD Graphics 617 24 @ 0.3 - 1.15 GHz64/128 Bit
UHD Graphics 615 24 @ 0.3 - 1 GHz64/128 Bit
HD Graphics 615 24 @ 0.3 - 1.05 GHz64/128 Bit
CodenameKaby-Lake GT2BraswellKaby-Lake-H-GT2
ArchitekturGen. 9 Amber LakeGen. 8Gen. 9.5 Kaby Lake
Pipelines24 - unified12 - unified24 - unified
Kerntakt300 - 1150 (Boost) MHz320 - 640 (Boost) MHz
Speicherbandbreite64/128 Bit64/128 Bit64/128 Bit
SpeichertypDDR3L/LPDDR3
Shared Memoryjajaja
APIDirectX 12_1, OpenGL 4.4DirectX 11.2, Shader 5.0DirectX 12_1, OpenGL 4.4
Herstellungsprozess14 nm14 nm14 nm
FeaturesQuickSyncQuickSync
Erscheinungsdatum30.10.2018 01.04.2016 05.08.2015
CPU in UHD Graphics 617GPU Base SpeedGPU Boost / Turbo
Intel Core i7-10510Y4 x 1200 MHz, 7 W300 MHz1150 MHz
Intel Core i5-8210Y2 x 1600 MHz, 7 W300 MHz1050 MHz
min. - max.300 MHz1050 - 1150 MHz
CPU in HD Graphics 400 (Braswell)GPU Base SpeedGPU Boost / Turbo
Intel Atom x5-Z85504 x 1440 MHz200 MHz600 MHz
Intel Celeron N30602 x 1600 MHz, 6 W320 MHz700 MHz
min. - max.200 - 320 MHz600 - 1150 MHz
CPU in HD Graphics P630GPU Base SpeedGPU Boost / Turbo
Intel Xeon E3-1535M v64 x 3100 MHz, 45 W300 MHz1150 MHz
Intel Xeon E3-1505M v64 x 3000 MHz, 45 W300 MHz1150 MHz
min. - max.200 - 320 MHz600 - 1150 MHz

Benchmarks

Performance Rating - 3DMark 11 + Fire Strike + Time Spy - HD Graphics 400 (Braswell)
0.1 pt (0%)
3DMark - 3DMark Time Spy Score
min: 322     avg: 338.3     median: 337 (1%)     max: 356 Points
400 Points (1%)
3DMark - 3DMark Time Spy Graphics
min: 286     avg: 299     median: 300 (1%)     max: 311 Points
3DMark - 3DMark Ice Storm Unlimited Graphics
77156 Points (8%)
3DMark - 3DMark Ice Storm Extreme Graphics
14334 Points (2%)
3DMark - 3DMark Cloud Gate Score
4841 Points (5%)
8280 Points (9%)
3DMark - 3DMark Cloud Gate Graphics
7231 Points (2%)
3DMark - 3DMark Fire Strike Standard Score
min: 845     avg: 890     median: 889.5 (2%)     max: 934 Points
min: 176     avg: 188     median: 188 (0%)     max: 200 Points
1040 Points (2%)
3DMark - 3DMark Fire Strike Standard Graphics
min: 947     avg: 997     median: 997 (1%)     max: 1047 Points
min: 202     avg: 218     median: 218 (0%)     max: 234 Points
3DMark - 3DMark Ice Storm Graphics
min: 13689     avg: 18517     median: 18516.5 (2%)     max: 23344 Points
3DMark - 3DMark Sling Shot (ES 3.0) Unlimited
min: 1502     avg: 1926     median: 1925.5 (8%)     max: 2349 Points
3DMark - 3DMark Sling Shot (ES 3.0) Unlimited Graphics
min: 1452     avg: 2046     median: 2046 (4%)     max: 2640 Points
3DMark - 3DMark Sling Shot Extreme (ES 3.1) Unlimited
1180 Points (6%)
3DMark - 3DMark Sling Shot Extreme (ES 3.1) Unlimited Graphics
977 Points (3%)
3DMark - 3DMark Sling Shot (ES 3.0)
min: 1473     avg: 1871     median: 1870.5 (17%)     max: 2268 Points
3DMark - 3DMark Sling Shot (ES 3.0) Graphics
min: 1431     avg: 2005     median: 2005 (12%)     max: 2579 Points
3DMark - 3DMark Sling Shot Extreme (ES 3.1)
1050 Points (5%)
3DMark - 3DMark Sling Shot Extreme (ES 3.1) Graphics
967 Points (3%)
3DMark - 3DMark Night Raid
3711 Points (4%)
3DMark - 3DMark Night Raid Graphics Score
4496 Points (2%)
3DMark 11 - 3DM11 Performance Score
min: 1632     avg: 1672     median: 1671.5 (2%)     max: 1711 Points
3DMark 11 - 3DM11 Performance GPU
min: 1509     avg: 1541     median: 1540.5 (1%)     max: 1572 Points
3DMark 06 3DMark 06 - Standard 1280x1024 + Intel UHD Graphics 617
3DMark 06
8662 Points (11%)
3DMark 06 - Standard 1280x1024 + Intel HD Graphics 400 (Braswell)
2474 Points (3%)
Cinebench R10 Cinebench R10 Shading (32bit) + Intel HD Graphics 400 (Braswell)
Cinebench R10 - Cinebench R10 Shading (32bit)
min: 1627     avg: 2057     median: 2052.5 (1%)     max: 2510 Points
Cinebench R11.5 Cinebench R11.5 OpenGL 64 Bit + Intel HD Graphics 400 (Braswell)
Cinebench R11.5 - Cinebench R11.5 OpenGL 64 Bit
min: 9.97     avg: 10.1     median: 10 (3%)     max: 10.12 fps
Cinebench R15
Cinebench R15 OpenGL 64 Bit + Intel UHD Graphics 617
Cinebench R15 - Cinebench R15 OpenGL 64 Bit
min: 34.7     avg: 39.1     median: 39.1 (2%)     max: 43.5 fps
Cinebench R15 OpenGL 64 Bit + Intel HD Graphics 400 (Braswell)
Cinebench R15 OpenGL Ref. Match 64 Bit + Intel UHD Graphics 617
Cinebench R15 - Cinebench R15 OpenGL Ref. Match 64 Bit
min: 97.8     avg: 98.6     median: 98.6 (99%)     max: 99.3 %
Cinebench R15 OpenGL Ref. Match 64 Bit + Intel HD Graphics 400 (Braswell)
GFXBench - GFXBench 5.0 Aztec Ruins High Tier Offscreen
3.3 fps (1%)
GFXBench - GFXBench 5.0 Aztec Ruins Normal Tier Offscreen
9.3 fps (1%)
GFXBench 3.1 - GFXBench Manhattan ES 3.1 Offscreen
min: 7.2     avg: 10.6     median: 10.6 (0%)     max: 14 fps
GFXBench 3.0 - GFXBench 3.0 Manhattan Offscreen
min: 14     avg: 16     median: 16 (1%)     max: 18 fps
GFXBench (DX / GLBenchmark) 2.7
GFXBench T-Rex HD Offscreen C24Z16 + Intel HD Graphics 400 (Braswell)
GFXBench (DX / GLBenchmark) 2.7 - GFXBench T-Rex HD Offscreen C24Z16
min: 27     avg: 29     median: 29 (0%)     max: 31 fps

Average Benchmarks Intel UHD Graphics 617 → 100% n=2

Average Benchmarks Intel HD Graphics 400 (Braswell) → 26% n=2

Average Benchmarks Intel HD Graphics P630 → 144% n=2

- Bereich der Benchmarkergebnisse für diese Grafikkarte
- Durchschnittliche Benchmarkergebnisse für diese Grafikkarte
* Smaller numbers mean a higher performance
1 This benchmark is not used for the average calculation

Spiele-Benchmarks

Die folgenden Benchmarks basieren auf unseren Spieletests mit Testnotebooks. Die Performance dieser Grafikkarte bei den gelisteten Spielen ist abhängig von der verwendeten CPU, Speicherausstattung, Treiber und auch Betriebssystem. Dadurch müssen die untenstehenden Werte nicht repräsentativ sein. Detaillierte Informationen über das verwendete System sehen Sie nach einem Klick auf den fps-Wert.

low 1280x720
HD Graphics 400 (Braswell):
14.1  fps
low 1280x720
100%
UHD Graphics 617:
20.2  fps
med. 1920x1080
100%
UHD Graphics 617:
14.1  fps
high 1920x1080
100%
UHD Graphics 617:
12.8  fps
low 1280x720
HD Graphics 400 (Braswell):
18.5  fps
med. 1366x768
HD Graphics 400 (Braswell):
16  fps
low 1280x720
100%
UHD Graphics 617:
61.2  fps
21%
HD Graphics 400 (Braswell):
12.7  fps
med. 1920x1080
100%
UHD Graphics 617:
26  fps
high 1920x1080
100%
UHD Graphics 617:
18.3  fps
Prey

Prey

2017
low 1280x720
HD Graphics 400 (Braswell):
6.8  fps
low 1280x720
HD Graphics 400 (Braswell):
10.7  fps
low 1280x720
HD Graphics 400 (Braswell):
20.9  fps
med. 1366x768
HD Graphics 400 (Braswell):
5.8  fps
low 1024x768
HD Graphics 400 (Braswell):
9.7  fps
Overwatch

Overwatch

2016
low 1280x720
HD Graphics 400 (Braswell):
15 15.1 ~ 15 fps
med. 1366x768
HD Graphics 400 (Braswell):
9.5 9.7 ~ 10 fps
low 1024x768
100%
UHD Graphics 617:
16.1  fps
33%
HD Graphics 400 (Braswell):
5.3  fps
low 1024x768
HD Graphics 400 (Braswell):
7.3  fps
med. 1366x768
HD Graphics 400 (Braswell):
3.2  fps
FIFA 16

FIFA 16

2015
low 1280x720
HD Graphics 400 (Braswell):
36.5  fps
high 1366x768
HD Graphics 400 (Braswell):
14.2  fps
ultra 1920x1080
HD Graphics 400 (Braswell):
9  fps
low 1366x768
HD Graphics 400 (Braswell):
13  fps
med. 1366x768
HD Graphics 400 (Braswell):
8  fps
low 1024x768
HD Graphics 400 (Braswell):
13.3  fps
low 1280x720
100%
UHD Graphics 617:
67.2  fps
32%
HD Graphics 400 (Braswell):
21.3  fps
med. 1366x768
100%
UHD Graphics 617:
28.2  fps
40%
HD Graphics 400 (Braswell):
11.4  fps
high 1920x1080
100%
UHD Graphics 617:
14.6  fps
ultra 1920x1080
100%
UHD Graphics 617:
13.6  fps
low 1024x768
HD Graphics 400 (Braswell):
8.5  fps
med. 1366x768
HD Graphics 400 (Braswell):
5.6  fps
low 1024x768
HD Graphics 400 (Braswell):
40.1  fps
med. 1366x768
HD Graphics 400 (Braswell):
11.7  fps
GTA V

GTA V

2015
low 1024x768
HD Graphics 400 (Braswell):
14.3  fps
low 1024x768
HD Graphics 400 (Braswell):
5.4  fps
med. 1366x768
HD Graphics 400 (Braswell):
2.9  fps
F1 2014

F1 2014

2014
low 1024x768
HD Graphics 400 (Braswell):
27  fps
med. 1366x768
HD Graphics 400 (Braswell):
16  fps
low 1024x768
HD Graphics 400 (Braswell):
11.5 11.9 ~ 12 fps
med. 1366x768
HD Graphics 400 (Braswell):
7  fps
Sims 4

Sims 4

2014
low 1024x768
HD Graphics 400 (Braswell):
37  fps
med. 1366x768
HD Graphics 400 (Braswell):
7.6  fps
low 1024x768
HD Graphics 400 (Braswell):
6.5  fps
med. 1366x768
HD Graphics 400 (Braswell):
4.8  fps
low 1024x768
HD Graphics 400 (Braswell):
28.9  fps
med. 1366x768
HD Graphics 400 (Braswell):
12.5  fps
low 1024x768
HD Graphics 400 (Braswell):
11.8  fps
low 1024x768
HD Graphics 400 (Braswell):
16.2  fps
med. 1366x768
HD Graphics 400 (Braswell):
12.3  fps
high 1366x768
HD Graphics 400 (Braswell):
7.9  fps
Dead Trigger 2

Dead Trigger 2

2013
high
HD Graphics 400 (Braswell):
30  fps
F1 2013

F1 2013

2013
low 1024x768
HD Graphics 400 (Braswell):
28  fps
med. 1366x768
HD Graphics 400 (Braswell):
17  fps
Asphalt 8: Airborne

Asphalt 8: Airborne

2013
low
HD Graphics 400 (Braswell):
30  fps
high
HD Graphics 400 (Braswell):
30  fps
GRID 2

GRID 2

2013
low 1024x768
HD Graphics 400 (Braswell):
19.9  fps
med. 1366x768
HD Graphics 400 (Braswell):
12.5  fps
low 1280x720
100%
UHD Graphics 617:
47.6  fps
38%
HD Graphics 400 (Braswell):
16.2 16.5 16.9 18.1 18.5 18.7 18.8 19.5 ~ 18 fps
med. 1366x768
100%
UHD Graphics 617:
27.9  fps
32%
HD Graphics 400 (Braswell):
7.2 7.8 8.5 8.8 8.9 9.1 9.6 ~ 9 fps
high 1366x768
100%
UHD Graphics 617:
25  fps
25%
HD Graphics 400 (Braswell):
6.2  fps
ultra 1920x1080
100%
UHD Graphics 617:
8.4  fps
21%
HD Graphics 400 (Braswell):
1.8  fps
low 1024x768
HD Graphics 400 (Braswell):
24.8  fps
med. 1366x768
HD Graphics 400 (Braswell):
10.2 (!)  fps
low 1024x768
HD Graphics 400 (Braswell):
21.1  fps
med. 1366x768
HD Graphics 400 (Braswell):
10.8  fps
high 1366x768
HD Graphics 400 (Braswell):
8.7  fps
low 1024x768
HD Graphics 400 (Braswell):
10.5  fps
low 1024x768
HD Graphics 400 (Braswell):
18.3  fps
Anno 2070

Anno 2070

2011
low 1024x768
HD Graphics 400 (Braswell):
27.7  fps
low 1280x720
HD Graphics 400 (Braswell):
19.8  fps
med. 1366x768
HD Graphics 400 (Braswell):
9.5  fps
low 1024x768
HD Graphics 400 (Braswell):
18.4  fps
high 1366x768
HD Graphics 400 (Braswell):
11.3  fps
Dirt 3

Dirt 3

2011
low 800x600
HD Graphics 400 (Braswell):
29.4  fps
med. 1024x768
HD Graphics 400 (Braswell):
14.3  fps
high 1360x768
HD Graphics 400 (Braswell):
12.5  fps
low 1024x768
HD Graphics 400 (Braswell):
34.5  fps
med. 1360x768
HD Graphics 400 (Braswell):
8.8  fps
high 1360x768
HD Graphics 400 (Braswell):
5.6  fps
Trackmania Nations Forever

Trackmania Nations Forever

2008
low 640x480
HD Graphics 400 (Braswell):
60 88.5 ~ 74 fps
high 1024x768
HD Graphics 400 (Braswell):
22.6 25.2 ~ 24 fps
ultra 1920x1080
HD Graphics 400 (Braswell):
9.9  fps

Average Gaming Intel UHD Graphics 617 → 100%

Average Gaming 30-70 fps → 100%

Average Gaming Intel HD Graphics 400 (Braswell) → 30%

Intel HD Graphics 400 (Braswell)lowmed.highultraQHD4K
Farming Simulator 1914.1
Team Fortress 218.516
Rocket League12.7
Prey6.8
Resident Evil 710.7
Farming Simulator 1720.95.8
Civilization VI9.7
Overwatch1510
Rise of the Tomb Raider5.3
Rainbow Six Siege7.33.2
FIFA 1636.514.29
World of Warships138
Metal Gear Solid V13.3
Dota 2 Reborn21.311.4
The Witcher 38.55.6
Dirt Rally40.111.7
GTA V14.3
Dragon Age: Inquisition5.42.9
F1 20142716
Alien: Isolation127
Sims 4377.6
Risen 3: Titan Lords6.54.8
GRID: Autosport28.912.5
X-Plane 10.2511.8
Battlefield 416.212.37.9
Dead Trigger 230
F1 20132817
Asphalt 8: Airborne3030
GRID 219.912.5
BioShock Infinite1896.231.8
Tomb Raider24.810.2
Dead Space 321.110.88.7
Counter-Strike: GO10.5
Diablo III18.3
Anno 207027.7
The Elder Scrolls V: Skyrim19.89.5
Deus Ex Human Revolution18.411.3
Dirt 329.414.312.5
StarCraft 234.58.85.6
Trackmania Nations Forever74249.9
< 30 fps
< 60 fps
< 120 fps
≥ 120 fps
33
5
1
23


8
2

3


Intel UHD Graphics 617lowmed.highultraQHD4K
X-Plane 11.1120.214.112.8
Rocket League61.22618.3
Rise of the Tomb Raider16.1
Dota 2 Reborn67.228.214.613.6
BioShock Infinite47.627.9258.4
< 30 fps
< 60 fps
< 120 fps
≥ 120 fps
2
1
2
4


4


2


Eine Liste mit weiteren Spielen und allen Grafikkarten finden Sie auf unserer Seite: Welches Spiel ist mit welcher Grafikkarte spielbar?

v1.28
log 21. 10:43:45

#0 ran 0s before starting gpusingle class +0s ... 0s

#1 checking url part for id 9356 +0s ... 0s

#2 checking url part for id 7349 +0s ... 0s

#3 checking url part for id 7657 +0s ... 0s

#4 redirected to Ajax server, took 1726908225s time from redirect:0 +0s ... 0s

#5 did not recreate cache, as it is less than 5 days old! Created at Thu, 19 Sep 2024 05:16:33 +0200 +0s ... 0s

#6 composed specs +0.052s ... 0.052s

#7 did output specs +0s ... 0.052s

#8 start showIntegratedCPUs +0s ... 0.052s

#9 getting avg benchmarks for device 9356 +0.029s ... 0.081s

#10 got single benchmarks 9356 +0.005s ... 0.085s

#11 getting avg benchmarks for device 7349 +0.004s ... 0.089s

#12 got single benchmarks 7349 +0.023s ... 0.112s

#13 getting avg benchmarks for device 7657 +0s ... 0.112s

#14 got single benchmarks 7657 +0.002s ... 0.115s

#15 got avg benchmarks for devices +0s ... 0.115s

#16 min, max, avg, median took s +0.02s ... 0.135s

#17 before gaming benchmark output +0s ... 0.135s

#18 Got 108 rows for game benchmarks. +0.008s ... 0.142s

#19 composed SQL query for gamebenchmarks +0s ... 0.142s

#20 got data and put it in $dataArray +0.002s ... 0.144s

#21 benchmarks composed for output. +0.012s ... 0.157s

#22 calculated avg scores. +0s ... 0.157s

#23 return log +0s ... 0.157s

Teilen Sie diesen Artikel, um uns zu unterstützen. Jeder Link hilft!
> Notebook Test, Laptop Test und News > Benchmarks / Technik > Benchmarks / Technik > Grafikkarten Vergleich - Head 2 Head
Autor: Klaus Hinum,  8.09.2017 (Update:  1.07.2023)