Notebookcheck Logo

Intel UHD Graphics 24EUs (Alder Lake-N) vs Intel HD Graphics P630

Intel UHD Graphics 24EUs (Alder Lake-N)

► remove from comparison Intel UHD Graphics 24EUs (Alder Lake-N)

Die Intel UHD Graphics 24 EUs (Xe-LP, Alder Lake-N, Gen 12.2) ist eine Prozessorgrafikkarte in Alder Lake-N CPU, welche in 2022 vorgestellt wurden. Sie basiert auf die neue Xe Architektur (Gen12) und bietet eine deutlich höhere Leistung als die Vorgängergenerationen. Die Leistung ist abhängig von der Taktrate (je nach Prozessormodell) und dem verwendeten Hauptspeicher (da shared Memory). Die 24 EU-Variante (Execution Units) bietet nur 24 der 32 EUs (192 der 256 Shader).

Durch die geringe CPU-Leistung, fehlenden dedizierten Speicher, single Channel-Spiecherkanal und die geringe Anzahl an Shader, ist die Spieleleistung der UHD Graphics in Alder Lake-N deutlich eingeschränkt. Dadurch sind nur wenige aktuelle Spiele flüssig spielbar.

Die GPU unterstützt maximal drei Displays mit einer maximalen Auflösung von 4096x2160 bei 60Hz.

Intel HD Graphics P630

► remove from comparison Intel HD Graphics P630

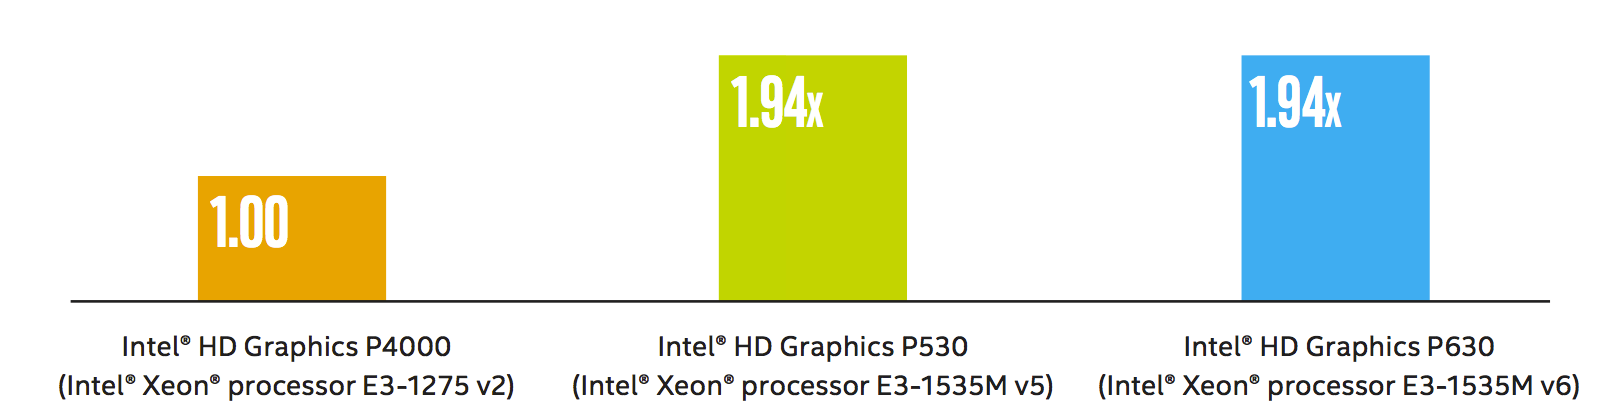
Die Intel HD Graphics P630 (GT2) ist eine integrierte Workstation-Grafikeinheit, die in verschiedenen Desktop- und Notebook-Prozessoren der 2017 vorgestellten Kaby-Lake-Generation zu finden ist (Xeon E3-1200 v6 und e3-1500M v6 Serien). Sie ist identisch mit der Intel HD Graphics 630, jedoch sind die Treiber für professionelle Software optimiert. Daher unterscheidet sie sich auch nicht von der Intel HD Graphics P530 und erreicht laut Intel auch die selbe Leistung im SPEC Viewperf12 (1.94x der alten Intel HD Graphics P4000). Die Grafikkarte ist derzeit für 15 CAD- und Workstation-Anwendungen zertifiziert.

Features

Neu bei der Kaby-Lake Generation ist die verbesserte Videoengine, welche nun auch H.265/HEVC im Main10-profil mit 10 Bit Farbtiefe sowie Googles VP9-Codec in Hardware dekodieren kann. Die Chips mit HD Graphics 530 sollten auch bereits HDCP 2.2 unterstützen und somit z.B. Netflix-Videos unter Windows 10 in 4K ausgeben können (im Gegensatz zu den ersten Kaby-Lake Dual-Core Chips mit Intel HD Graphics 620).

Leistungsaufnahme

Die HD Graphics P630 ist in Desktop- und Notebook-Prozessoren verschiedener TDP-Klassen zu finden. Die Quad-Core CPUs sind jedoch meistens in größeren und schwereren Notebooks verbaut. Der verbesserte 14nm+ Prozess verspricht jedoch eine etwas geringere Leistungsaufnahme im Vergleich zur Intel HD Graphics P530.

Quelle: http://www.intel.com/content/dam/www/public/us/en/documents/guides/hd-graphics-performance-guide.pdf

Intel UHD Graphics 24EUs (Alder Lake-N)Intel HD Graphics P630
Gen. 9.5 Serie
Iris Xe G7 96EUs compare 96 @ 0.4 - 1.35 GHz
Iris Xe G7 80EUs compare 80 @ 0.4 - 1.35 GHz
UHD Graphics 64EUs compare 64 @ 1.4 GHz
UHD Graphics Xe G4 48EUs compare 48 @ 0.35 - 1.45 GHz
UHD Graphics 32EUs compare 32 @ 1.25 GHz
UHD Graphics Xe 32EUs (Tiger Lake-H) compare 32 @ 0.35 - 1.45 GHz
UHD Graphics Xe 750 32EUs compare 32 @ 0.35 - 1.45 GHz
UHD Graphics 24EUs (Alder Lake-N) 24 @ 0.45 - 0.75 GHz
UHD Graphics Xe 16EUs (Tiger Lake-H) compare 16 @ 0.35 - 1.45 GHz
Iris Plus Graphics 655 compare 48 @ 0.3 - 1.2 GHz
Iris Plus Graphics 650 compare 48 @ 0.3 - 1.1 GHz64/128 Bit
Iris Plus Graphics 645 compare 48 @ 0.3 - 1.15 GHz
Iris Plus Graphics 640 compare 48 @ 0.3 - 1.05 GHz64/128 Bit
UHD Graphics 630 compare 24 @ 0.3 - 1.15 GHz64/128 Bit
UHD Graphics P630 compare 24 @ 0.3 - 1.2 GHz64/128 Bit
HD Graphics 630 compare 24 @ 0.3 - 1.15 GHz64/128 Bit
HD Graphics P630 24 64/128 Bit
UHD Graphics 620 compare 24 @ 0.3 - 1.15 GHz
HD Graphics 620 compare 24 @ 0.3 - 1.05 GHz64/128 Bit
UHD Graphics 617 compare 24 @ 0.3 - 1.15 GHz64/128 Bit
UHD Graphics 615 compare 24 @ 0.3 - 1 GHz64/128 Bit
HD Graphics 615 compare 24 @ 0.3 - 1.05 GHz64/128 Bit
CodenameAlder Lake XeKaby-Lake-H-GT2
ArchitekturGen. 12Gen. 9.5 Kaby Lake
Pipelines24 - unified24 - unified
Kerntakt450 - 750 (Boost) MHz
Shared Memoryjaja
APIDirectX 12_1, OpenGL 4.6DirectX 12_1, OpenGL 4.4
Herstellungsprozess10 nm14 nm
FeaturesQuickSyncQuickSync
Erscheinungsdatum03.01.2023 05.08.2015
Speicherbandbreite64/128 Bit
CPU in UHD Graphics 24EUs (Alder Lake-N)GPU Base SpeedGPU Boost / Turbo
Intel Processor N974 x ? MHz, 12 W? MHz1200 MHz
Intel Processor N1004 x 1000 MHz, 6 W? MHz750 MHz
min. - max.? MHz750 - 1200 MHz
CPU in HD Graphics P630GPU Base SpeedGPU Boost / Turbo
Intel Xeon E3-1535M v64 x 3100 MHz, 45 W300 MHz1150 MHz
Intel Xeon E3-1505M v64 x 3000 MHz, 45 W300 MHz1150 MHz
min. - max.300 - ? MHz750 - 1200 MHz

Benchmarks

Performance Rating - 3DMark 11 + Fire Strike + Time Spy - UHD Graphics 24EUs (Alder Lake-N)
0.5 pt (2%)
3DMark - 3DMark Time Spy Score
min: 345     avg: 377.9     median: 364 (1%)     max: 538 Points
400 Points (1%)
3DMark - 3DMark Time Spy Graphics
min: 304     avg: 331.1     median: 320 (1%)     max: 473 Points
3DMark - 3DMark Ice Storm Unlimited Graphics
min: 54707     avg: 57907     median: 55681 (6%)     max: 79785 Points
3DMark - 3DMark Ice Storm Extreme Graphics
min: 21251     avg: 30932     median: 30479.5 (4%)     max: 41235 Points
3DMark - 3DMark Cloud Gate Score
min: 6007     avg: 6805     median: 6751 (7%)     max: 8596 Points
8280 Points (9%)
3DMark - 3DMark Cloud Gate Graphics
min: 7218     avg: 8532     median: 8303.5 (2%)     max: 11498 Points
3DMark - 3DMark Fire Strike Standard Score
min: 1009     avg: 1140     median: 1127 (2%)     max: 1512 Points
1040 Points (2%)
3DMark - 3DMark Fire Strike Standard Graphics
min: 1080     avg: 1209     median: 1184 (1%)     max: 1646 Points
3DMark - 3DMark Ice Storm Graphics
min: 22501     avg: 46670     median: 46436.5 (6%)     max: 62083 Points
3DMark 11 - 3DM11 Performance Score
min: 1626     avg: 1763     median: 1710 (2%)     max: 2504 Points
3DMark 11 - 3DM11 Performance GPU
min: 1458     avg: 1545     median: 1488.5 (1%)     max: 2233 Points
3DMark Vantage
3DM Vant. Perf. total + Intel UHD Graphics 24EUs (Alder Lake-N)
3DMark Vantage - 3DM Vant. Perf. total
min: 5527     avg: 6122     median: 5775.5 (2%)     max: 8332 Points
3DM Vant. Perf. GPU no PhysX + Intel UHD Graphics 24EUs (Alder Lake-N)
3DMark Vantage - 3DM Vant. Perf. GPU no PhysX
min: 4603     avg: 5188     median: 4957 (3%)     max: 7213 Points
3DMark 05 - 3DMark 05 - Standard
min: 12034     avg: 16771     median: 17649 (19%)     max: 21014 Points
3DMark 06 3DMark 06 - Standard 1280x1024 + Intel UHD Graphics 24EUs (Alder Lake-N)
3DMark 06
min: 8849     avg: 10419     median: 10057 (13%)     max: 13452 Points
Unigine Valley 1.0 - Unigine Valley 1.0 DX
min: 4.1     avg: 4.8     median: 4.7 (2%)     max: 5.7 fps
SPECviewperf 12
specvp12 sw-03 + Intel UHD Graphics 24EUs (Alder Lake-N)
SPECviewperf 12 - specvp12 sw-03
min: 20.9     avg: 21.3     median: 21.1 (5%)     max: 22 fps
specvp12 snx-02 + Intel UHD Graphics 24EUs (Alder Lake-N)
SPECviewperf 12 - specvp12 snx-02
min: 2     avg: 2.1     median: 2.1 (0%)     max: 2.13 fps
specvp12 showcase-01 + Intel UHD Graphics 24EUs (Alder Lake-N)
SPECviewperf 12 - specvp12 showcase-01
min: 5.71     avg: 6     median: 6 (1%)     max: 6.19 fps
specvp12 mediacal-01 + Intel UHD Graphics 24EUs (Alder Lake-N)
SPECviewperf 12 - specvp12 mediacal-01
min: 2.53     avg: 2.7     median: 2.8 (1%)     max: 2.83 fps
specvp12 maya-04 + Intel UHD Graphics 24EUs (Alder Lake-N)
SPECviewperf 12 - specvp12 maya-04
min: 11.4     avg: 11.6     median: 11.5 (3%)     max: 12 fps
specvp12 energy-01 + Intel UHD Graphics 24EUs (Alder Lake-N)
SPECviewperf 12 - specvp12 energy-01
min: 0.15     avg: 0.2     median: 0.2 (0%)     max: 0.18 fps
specvp12 creo-01 + Intel UHD Graphics 24EUs (Alder Lake-N)
SPECviewperf 12 - specvp12 creo-01
min: 8.48     avg: 8.6     median: 8.5 (3%)     max: 8.69 fps
specvp12 catia-04 + Intel UHD Graphics 24EUs (Alder Lake-N)
SPECviewperf 12 - specvp12 catia-04
min: 10.9     avg: 11     median: 10.9 (2%)     max: 11.3 fps
specvp12 3dsmax-05 + Intel UHD Graphics 24EUs (Alder Lake-N)
SPECviewperf 12 - specvp12 3dsmax-05
min: 13.6     avg: 14.1     median: 13.8 (2%)     max: 14.9 fps
SPECviewperf 13 specvp13 sw-04 + Intel UHD Graphics 24EUs (Alder Lake-N)
SPECviewperf 13 - specvp13 sw-04
min: 27.4     avg: 27.7     median: 27.7 (7%)     max: 28.1 fps
specvp13 snx-03 + Intel UHD Graphics 24EUs (Alder Lake-N)
SPECviewperf 13 - specvp13 snx-03
min: 3.6     avg: 3.7     median: 3.8 (0%)     max: 3.84 fps
specvp13 showcase-02 + Intel UHD Graphics 24EUs (Alder Lake-N)
SPECviewperf 13 - specvp13 showcase-02
min: 5.69     avg: 6     median: 6 (1%)     max: 6.17 fps
specvp13 medical-02 + Intel UHD Graphics 24EUs (Alder Lake-N)
SPECviewperf 13 - specvp13 medical-02
min: 2.28     avg: 2.6     median: 2.8 (1%)     max: 2.84 fps
specvp13 maya-05 + Intel UHD Graphics 24EUs (Alder Lake-N)
SPECviewperf 13 - specvp13 maya-05
min: 15.9     avg: 16.4     median: 16.3 (2%)     max: 17 fps
specvp13 energy-02 + Intel UHD Graphics 24EUs (Alder Lake-N)
SPECviewperf 13 - specvp13 energy-02
310 fps (100%)
specvp13 creo-02 + Intel UHD Graphics 24EUs (Alder Lake-N)
SPECviewperf 13 - specvp13 creo-02
min: 11.6     avg: 11.7     median: 11.7 (2%)     max: 11.8 fps
specvp13 catia-05 + Intel UHD Graphics 24EUs (Alder Lake-N)
SPECviewperf 13 - specvp13 catia-05
min: 15.6     avg: 15.9     median: 15.8 (2%)     max: 16.2 fps
specvp13 3dsmax-06 + Intel UHD Graphics 24EUs (Alder Lake-N)
SPECviewperf 13 - specvp13 3dsmax-06
min: 13.4     avg: 14     median: 13.7 (2%)     max: 14.8 fps
Cinebench R10 Cinebench R10 Shading (32bit) + Intel UHD Graphics 24EUs (Alder Lake-N)
Cinebench R10 - Cinebench R10 Shading (32bit)
min: 7035     avg: 8399     median: 8492.5 (6%)     max: 10013 Points
Cinebench R11.5 Cinebench R11.5 OpenGL 64 Bit + Intel UHD Graphics 24EUs (Alder Lake-N)
Cinebench R11.5 - Cinebench R11.5 OpenGL 64 Bit
min: 33.23     avg: 38.1     median: 36.8 (13%)     max: 49.39 fps
Cinebench R15
Cinebench R15 OpenGL 64 Bit + Intel UHD Graphics 24EUs (Alder Lake-N)
Cinebench R15 - Cinebench R15 OpenGL 64 Bit
min: 34.3     avg: 40.6     median: 39.8 (2%)     max: 56.41 fps
Cinebench R15 OpenGL Ref. Match 64 Bit + Intel UHD Graphics 24EUs (Alder Lake-N)
Cinebench R15 - Cinebench R15 OpenGL Ref. Match 64 Bit
97.8 % (98%)
Basemark GPU 1.2 - Basemark GPU 1.2 Vulkan Official Medium Offscreen 1080
min: 46.4     avg: 80.6     median: 54.1 (0%)     max: 217 fps
Basemark GPU 1.2 - Basemark GPU 1.2 Vulkan Official High Offscreen 2160
min: 3.64     avg: 5.6     median: 3.9 (1%)     max: 15.3 fps
Geekbench 6.2 - Geekbench 6.2 GPU OpenCL
min: 3010     avg: 3430     median: 3310 (1%)     max: 5145 Points
Geekbench 6.2 - Geekbench 6.2 GPU Vulkan
min: 3443     avg: 3911     median: 3802.5 (1%)     max: 5822 Points
LuxMark v2.0 64Bit - LuxMark v2.0 Room GPU
min: 222     avg: 313.8     median: 254 (1%)     max: 760 Samples/s
LuxMark v2.0 64Bit - LuxMark v2.0 Sala GPU
min: 473     avg: 653     median: 524.5 (1%)     max: 1386 Samples/s
ComputeMark v2.1 - ComputeMark v2.1 Result
min: 628     avg: 679     median: 655.5 (1%)     max: 911 Points
Power Consumption - Furmark Stress Test Power Consumption - external Monitor *
min: 9.49     avg: 16.8     median: 15.8 (2%)     max: 27.5 Watt
Power Consumption - The Witcher 3 Power Consumption - external Monitor *
min: 21.5     avg: 26.4     median: 26.5 (4%)     max: 31.1 Watt
Power Consumption - Witcher 3 Power Consumption *
min: 12.4     avg: 17     median: 17 (4%)     max: 21.5 Watt
Power Consumption - Witcher 3 ultra Power Efficiency
0.3 fps per Watt (28%)
Emissions Witcher 3 Fan Noise + Intel UHD Graphics 24EUs (Alder Lake-N)
Emissions - Witcher 3 Fan Noise
33 dB(A) (53%)

Average Benchmarks Intel UHD Graphics 24EUs (Alder Lake-N) → 100% n=3

Average Benchmarks Intel HD Graphics P630 → 108% n=3

- Bereich der Benchmarkergebnisse für diese Grafikkarte
- Durchschnittliche Benchmarkergebnisse für diese Grafikkarte
* Smaller numbers mean a higher performance
1 This benchmark is not used for the average calculation

Spiele-Benchmarks

Die folgenden Benchmarks basieren auf unseren Spieletests mit Testnotebooks. Die Performance dieser Grafikkarte bei den gelisteten Spielen ist abhängig von der verwendeten CPU, Speicherausstattung, Treiber und auch Betriebssystem. Dadurch müssen die untenstehenden Werte nicht repräsentativ sein. Detaillierte Informationen über das verwendete System sehen Sie nach einem Klick auf den fps-Wert.

low 1920x1080
100%
UHD Graphics 24EUs (Alder Lake-N):
6.1  fps
med. 1920x1080
100%
UHD Graphics 24EUs (Alder Lake-N):
4.7  fps
high 1920x1080
100%
UHD Graphics 24EUs (Alder Lake-N):
4  fps
low 1920x1080
100%
UHD Graphics 24EUs (Alder Lake-N):
5.2 6.6 7 8.5 10.2 ~ 7 fps
med. 1920x1080
100%
UHD Graphics 24EUs (Alder Lake-N):
3.9 5.3 5.5 7.9 ~ 6 fps
high 1920x1080
100%
UHD Graphics 24EUs (Alder Lake-N):
3.2 3.3 3.4 4.9 ~ 4 fps
ultra 1920x1080
100%
UHD Graphics 24EUs (Alder Lake-N):
1.8  fps
low 1920x1080
100%
UHD Graphics 24EUs (Alder Lake-N):
17.7  fps
med. 1920x1080
100%
UHD Graphics 24EUs (Alder Lake-N):
13.6  fps
high 1920x1080
100%
UHD Graphics 24EUs (Alder Lake-N):
9.5  fps
F1 2021

F1 2021

2021
low 1280x720
100%
UHD Graphics 24EUs (Alder Lake-N):
29.8 30.6 ~ 30 fps
med. 1920x1080
100%
UHD Graphics 24EUs (Alder Lake-N):
12.4  fps
high 1920x1080
100%
UHD Graphics 24EUs (Alder Lake-N):
9.9  fps
ultra 1920x1080
100%
UHD Graphics 24EUs (Alder Lake-N):
6.3  fps
F1 2020

F1 2020

2020
low 1280x720
100%
UHD Graphics 24EUs (Alder Lake-N):
25.4 25.7 ~ 26 fps
med. 1920x1080
100%
UHD Graphics 24EUs (Alder Lake-N):
11.2 11.3 ~ 11 fps
high 1920x1080
100%
UHD Graphics 24EUs (Alder Lake-N):
8.1 8.1 ~ 8 fps
low 1280x720
100%
UHD Graphics 24EUs (Alder Lake-N):
12 13.6 13.7 19.8 ~ 15 fps
med. 1920x1080
100%
UHD Graphics 24EUs (Alder Lake-N):
5.2 5.8 5.9 8.3 ~ 6 fps
high 1920x1080
100%
UHD Graphics 24EUs (Alder Lake-N):
2.9 3.4 3.4 4.9 ~ 4 fps
ultra 1920x1080
100%
UHD Graphics 24EUs (Alder Lake-N):
2.1 2.4 2.4 3.6 ~ 3 fps
low 1280x720
100%
UHD Graphics 24EUs (Alder Lake-N):
14 14 14 14 15 19 ~ 15 fps
med. 1920x1080
100%
UHD Graphics 24EUs (Alder Lake-N):
7 7 7 7 7 10 ~ 8 fps
high 1920x1080
100%
UHD Graphics 24EUs (Alder Lake-N):
6 6 6 6 7 9 ~ 7 fps
ultra 1920x1080
100%
UHD Graphics 24EUs (Alder Lake-N):
6 6 6 6 ~ 6 fps
low 1280x720
100%
UHD Graphics 24EUs (Alder Lake-N):
12.4 12.6 13 ~ 13 fps
med. 1920x1080
100%
UHD Graphics 24EUs (Alder Lake-N):
5.6 5.8 5.9 ~ 6 fps
high 1920x1080
100%
UHD Graphics 24EUs (Alder Lake-N):
4.3 4.4 4.5 ~ 4 fps
ultra 1920x1080
100%
UHD Graphics 24EUs (Alder Lake-N):
3.6  fps
low 1280x720
100%
UHD Graphics 24EUs (Alder Lake-N):
10.1 13 14.9 15.2 16.7 16.8 ~ 14 fps
med. 1920x1080
100%
UHD Graphics 24EUs (Alder Lake-N):
4.9 6 6.5 6.5 6.6 9 ~ 7 fps
high 1920x1080
100%
UHD Graphics 24EUs (Alder Lake-N):
6 6 6 8.3 ~ 7 fps
Strange Brigade

Strange Brigade

2018
low 1280x720
100%
UHD Graphics 24EUs (Alder Lake-N):
23.2 26.9 27 27.8 27.9 28 28.7 37.7 ~ 28 fps
med. 1920x1080
100%
UHD Graphics 24EUs (Alder Lake-N):
9.7 10.1 10.2 10.2 10.4 10.8 14.1 14.1 ~ 11 fps
high 1920x1080
100%
UHD Graphics 24EUs (Alder Lake-N):
9.4 9.5 9.7 9.9 10.1 10.7 10.8 11.9 ~ 10 fps
ultra 1920x1080
100%
UHD Graphics 24EUs (Alder Lake-N):
9.7 10.6 14.2 14.8 ~ 12 fps
Far Cry 5

Far Cry 5

2018
low 1280x720
100%
UHD Graphics 24EUs (Alder Lake-N):
14 14 15 15 15 20 ~ 16 fps
med. 1920x1080
100%
UHD Graphics 24EUs (Alder Lake-N):
6 7 7 7 9 ~ 7 fps
high 1920x1080
100%
UHD Graphics 24EUs (Alder Lake-N):
6 6 6 6 9 ~ 7 fps
ultra 1920x1080
100%
UHD Graphics 24EUs (Alder Lake-N):
5 6 6 ~ 6 fps
low 1280x720
100%
UHD Graphics 24EUs (Alder Lake-N):
12.9 13.6 13.7 19.6 19.6 20.6 22.5 24.3 24.7 ~ 19 fps
med. 1920x1080
100%
UHD Graphics 24EUs (Alder Lake-N):
8.8 10.9 12 12.5 12.6 13.2 14.7 15 15 ~ 13 fps
high 1920x1080
100%
UHD Graphics 24EUs (Alder Lake-N):
7.8 10.4 10.9 11.2 11.8 13.6 13.8 13.9 ~ 12 fps
low 1280x720
100%
UHD Graphics 24EUs (Alder Lake-N):
12 12.3 12.4 12.8 12.9 13 13.3 13.4 17.8 ~ 13 fps
med. 1920x1080
100%
UHD Graphics 24EUs (Alder Lake-N):
5.6 5.9 5.9 6.2 6.3 6.4 6.4 8.7 ~ 6 fps
high 1920x1080
100%
UHD Graphics 24EUs (Alder Lake-N):
4.2 4.3 4.4 4.4 4.5 4.6 6.3 ~ 5 fps
low 1280x720
100%
UHD Graphics 24EUs (Alder Lake-N):
44.7 52 62.1 68.7 69.3 69.7 72.7 74 74.2 76.6 80.8 ~ 68 fps
med. 1366x768
100%
UHD Graphics 24EUs (Alder Lake-N):
27.6 33.2 41 44.9 47.1 47.8 47.9 48.3 49.9 51.6 52 ~ 45 fps
high 1920x1080
100%
UHD Graphics 24EUs (Alder Lake-N):
14.2 18.2 18.7 18.8 19.2 19.6 19.8 20.1 20.3 20.7 26.8 ~ 20 fps
ultra 1920x1080
100%
UHD Graphics 24EUs (Alder Lake-N):
13.4 17 17.4 17.5 17.8 18 18.4 18.6 18.8 19.1 24.9 ~ 18 fps
low 1024x768
100%
UHD Graphics 24EUs (Alder Lake-N):
16 22 22.3 22.5 22.9 23.1 33.3 ~ 23 fps
med. 1366x768
100%
UHD Graphics 24EUs (Alder Lake-N):
14.6 14.7 14.8 15.2 20.9 ~ 16 fps
high 1920x1080
100%
UHD Graphics 24EUs (Alder Lake-N):
7.2 7.4 7.8 8.2 8.4 10.8 ~ 8 fps
ultra 1920x1080
100%
UHD Graphics 24EUs (Alder Lake-N):
3.8 5.2 ~ 4 fps
GTA V

GTA V

2015
low 1024x768
100%
UHD Graphics 24EUs (Alder Lake-N):
44.7 51 54 54.3 57.2 58.2 59 ~ 54 fps
med. 1366x768
100%
UHD Graphics 24EUs (Alder Lake-N):
36.6 39.4 41.9 42.1 48 48 51.3 ~ 44 fps
high 1920x1080
100%
UHD Graphics 24EUs (Alder Lake-N):
5.9 6.4 6.4 7.2 7.7 36.5 ~ 12 fps
ultra 1920x1080
100%
UHD Graphics 24EUs (Alder Lake-N):
2.7 2.8 2.9 3.2 3.2 3.4 ~ 3 fps

Average Gaming Intel UHD Graphics 24EUs (Alder Lake-N) → 100%

Average Gaming 30-70 fps → 100%

Intel UHD Graphics 24EUs (Alder Lake-N)lowmed.highultraQHD4K
Cyberpunk 2077 2.1 Phantom Liberty6.074.664.02
Tiny Tina's Wonderlands7641.77
GRID Legends17.713.69.52
F1 20213012.49.946.26
F1 202026118
Borderlands 315643
Far Cry New Dawn15876
Metro Exodus13643.59
Shadow of the Tomb Raider1477
Strange Brigade28111012
Far Cry 516776
X-Plane 11.11191312
Final Fantasy XV Benchmark1365
Dota 2 Reborn68452018
The Witcher 3231684
GTA V5444123
< 30 fps
< 60 fps
< 120 fps
≥ 120 fps
13
2
1
14
2

16


10


Eine Liste mit weiteren Spielen und allen Grafikkarten finden Sie auf unserer Seite: Welches Spiel ist mit welcher Grafikkarte spielbar?

Add one or more devices and compare

In the following list you can select (and also search for) devices that should be added to the comparison. You can select more than one device.

restrict list:

show all (including archived), 2024, 2023
v1.28
log 04. 21:58:52

#0 checking url part for id 11547 +0s ... 0s

#1 checking url part for id 7657 +0s ... 0s

#2 redirected to Ajax server, took 1720123131 +0s ... 0s

#3 did not recreate cache, as it is less than 5 days old! Created at Thu, 04 Jul 2024 05:15:44 +0200 +0s ... 0s

#4 composed specs +0.061s ... 0.062s

#5 did output specs +0s ... 0.062s

#6 start showIntegratedCPUs +0s ... 0.062s

#7 getting avg benchmarks for device 11547 +0.024s ... 0.085s

#8 got single benchmarks 11547 +0.018s ... 0.103s

#9 getting avg benchmarks for device 7657 +0s ... 0.104s

#10 got single benchmarks 7657 +0.003s ... 0.106s

#11 got avg benchmarks for devices +0s ... 0.106s

#12 min, max, avg, median took s +0.028s ... 0.135s

#13 before gaming benchmark output +0s ... 0.135s

#14 Got 282 rows for game benchmarks. +0.026s ... 0.161s

#15 composed SQL query for gamebenchmarks +0s ... 0.161s

#16 got data and put it in $dataArray +0.001s ... 0.162s

#17 benchmarks composed for output. +0.007s ... 0.169s

#18 calculated avg scores. +0s ... 0.169s

#19 return log +0.002s ... 0.171s

Teilen Sie diesen Artikel, um uns zu unterstützen. Jeder Link hilft!
> Notebook Test, Laptop Test und News > Benchmarks / Technik > Benchmarks / Technik > Grafikkarten Vergleich - Head 2 Head
Autor: Klaus Hinum,  8.09.2017 (Update:  1.07.2023)