Notebookcheck Logo

Google Tensor vs MediaTek Dimensity 8050

Google Tensor

► remove from comparison Google Tensor
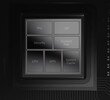
Der Google Tensor Chipsatz (G1, erste Generation) ist das erste System-on-a-Chip (SoC) von Google und positioniert sich im Highend-Bereich für Android-basierte Smartphones. Zentraler Bestandteil ist der integrierte TPU (Tensor Processung Unit) die AI und ML Aufgaben schnell und effizient ausführen soll. Die Nachfolger sind der Tensor G2 und G3.

Die CPU-Einheit besitzt acht Kerne. Diese setzen sich aus zwei leistungsstarken Cortex-X1-Kernen, welche mit bis zu 2,8 GHz arbeiten, zwei Cortex A76 (jeweils bis zu 2,25 GHz) sowie vier Cortex-A55-Kernen (bis zu 1,8 GHz) zusammen. 

Zusätzlich integriert Google ein isoliertes Sicherheitskern-Subsystem, welches den Co-Prozessor Titan M2 nutzt, für einen zusätzlichen Schutz der eigenen Daten auf Hardwarebasis zu sorgen. Verbesserte Eigenschaften im Bereich maschinelles Lernen ermöglichen Echtzeit-Transkriptionen und Übersetzungen in Videos sowie eine hochentwickelte Spracherkennung. 

Als Grafikeinheit ist eine ARM Mali-G78 mit 20 Kernen integriert. 

MediaTek Dimensity 8050

► remove from comparison Mediatek Dimensity 8050

Der MediaTek Dimensity 8050 ist ein ARM-basiertes SoC (System-on-a-Chip), welches bei TSMC im 6-nm-Prozess gefertigt wird. Es unterstützt alle aktuellen Mobilfunkstandards inklusive Dual-SIM-5G (5G SA & NSA, max 4.7 Gbps Download und 2.5 Gbps Upload). Außerdem unterstützt das SoC Wi-Fi 6 und Bluetooth 5.2.

Der MediaTek Dimensity 8050 wurde speziell für den Einsatz in Android-Smartphones entworfen und sortiert sich leistungstechnisch in die obere Mittelklasse ein.

Der CPU-Teil besteht aus drei Clustern: Einem schnellen Performance-Kern, basierend auf der ARM-Cortex-A78-Architektur und getaktet mit bis zu 3 GHz. Der zweite Cluster besteht aus drei Cortex-A78-Kernen mit bis zu 2,6 GHz. Als Stromspar-Cluster sind vier ARM Cortex-A55 Kerne mit bis zu 2 GHz verbaut. Die integrierte Grafikeinheit ARM Mali-G77 MC9 kann Displays mit einer Auflösung von bis zu 2.560 x 1.080 und einer Bildwiederholrate von bis zu 144 Hz befeuern (ev. nur bei Full HD+).

Technisch ist das SoC ähnlich zum älteren Dimensity 1300. 

ModelGoogle TensorMediaTek Dimensity 8050
SeriesGoogle Mediatek
CodenameExynos X1 / Cortex-A76 / A55Cortex-A78 / A55
Clock1800 - 2800 MHz2000 - 3000 MHz
L3 Cache4 MB
Cores / Threads8 / 88 / 8
1 x 3.0 GHz ARM Cortex-A78
3 x 2.6 GHz ARM Cortex-A78
4 x 2.0 GHz ARM Cortex-A55
Technology5 nm6 nm
FeaturesARM Mali-G78MP20 GPU1x ARM Cortex-A77 (3 GHz), 3x ARM Cortex-A77 (2.6 GHz), 4x ARM Cortex-A55 (2 GHz), ARM Mali-G77 MP9, APU 570, 5G Modem, MiraVision HDR10+, Wi-Fi 6, Bluetooth 5.2, UFS 3.1, LPDDR4x
iGPUARM Mali-G78 MP20ARM Mali-G77 MP9
ArchitectureARMARM
Announced
Manufacturerblog.googlewww.mediatek.com
Serie: Cortex-A78 / A55
MediaTek Dimensity 8050 « 2 - 3 GHz8 / 8 cores Cortex-A78 / A55
MediaTek Dimensity 1300 compare2 - 3 GHz8 / 8 cores Cortex-A78 / A55
MediaTek Dimensity 8100 compare2 - 2.85 GHz8 / 8 cores Cortex-A78 / A55
MediaTek Dimensity 1200 compare2 - 3 GHz8 / 8 cores Cortex-A78 / A55
MediaTek Kompanio 1300T compare2 - 2.6 GHz8 / 8 cores Cortex-A78 / A55
MediaTek Dimensity 8200-Ultra compare2 - 3.1 GHz8 / 8 cores4 MB L3 Cortex-A78 / A55
MediaTek Dimensity 8020 compare2 - 2.6 GHz8 / 8 cores Cortex-A78 / A55
MediaTek Dimensity 7300X compare2 - 2.5 GHz8 / 8 cores Cortex-A78 / A55
MediaTek Dimensity 7300 compare2 - 2.5 GHz8 / 8 cores Cortex-A78 / A55
MediaTek Dimensity 1100 compare2 - 2.6 GHz8 / 8 cores Cortex-A78 / A55
MediaTek Dimensity 7050 compare2 - 2.6 GHz8 / 8 cores Cortex-A78 / A55
MediaTek Dimensity 7030 compare2 - 2.5 GHz8 / 8 cores Cortex-A78 / A55
MediaTek Dimensity 1080 compare2 - 2.6 GHz8 / 8 cores Cortex-A78 / A55
MediaTek Dimensity 920 compare2 - 2.5 GHz8 / 8 cores Cortex-A78 / A55
MediaTek Dimensity 7020 compare2 - 2.5 GHz8 / 8 cores Cortex-A78 / A55
MediaTek Dimensity 930 compare2 - 2.2 GHz8 / 8 cores Cortex-A78 / A55
MediaTek MT8188J compare2 - 2.2 GHz8 / 8 cores Cortex-A78 / A55
MediaTek Dimensity 900 compare2 - 2.4 GHz8 / 8 cores Cortex-A78 / A55

Benchmarks

3DMark - 3DMark Sling Shot Extreme (ES 3.1) Unlimited Physics
100%
1 Tensor +
min: 3643     avg: 3946     median: 3919 (46%)     max: 4277 Points
3DMark - 3DMark Sling Shot (ES 3.0) Unlimited Physics
100%
1 Tensor +
min: 3393     avg: 4014     median: 4147 (47%)     max: 4501 Points
Geekbench 6.2 - Geekbench 6.2 Single-Core
min: 958     avg: 1036     median: 1036 (28%)     max: 1114 Points
Geekbench 6.2 - Geekbench 6.2 Multi-Core
min: 2926     avg: 3173     median: 3173 (13%)     max: 3420 Points
Geekbench 5.5 - Geekbench 5.1 - 5.5 64 Bit Single-Core
min: 1025     avg: 1041     median: 1041 (41%)     max: 1057 Points
min: 864     avg: 868     median: 867.5 (34%)     max: 871 Points
Geekbench 5.5 - Geekbench 5.1 - 5.5 64 Bit Multi-Core
min: 2805     avg: 2895     median: 2940 (5%)     max: 2941 Points
min: 2779     avg: 2852     median: 2852 (5%)     max: 2925 Points
Geekbench 4.4 - Geekbench 4.1 - 4.4 64 Bit Single-Core
4815 Points (48%)
4348 Points (43%)
Geekbench 4.4 - Geekbench 4.1 - 4.4 64 Bit Multi-Core
11589 Points (13%)
11466 Points (13%)
Geekbench 4.0 - Geekbench 4.0 64 Bit Single-Core
100%
1 Tensor +
4608 Points (63%)
Geekbench 4.0 - Geekbench 4.0 64 Bit Multi-Core
100%
1 Tensor +
11058 Points (27%)
Geekbench 3 - Geekbench 3 64 Bit Multi-Core
100%
1 Tensor +
9830 Points (15%)
Geekbench 3 - Geekbench 3 64 Bit Single-Core
100%
1 Tensor +
3264 Points (49%)
Mozilla Kraken 1.1 - Kraken 1.1 Total Score *
min: 915     avg: 1160     median: 1034 (1%)     max: 1531.6 ms
min: 1395.4     avg: 1713     median: 1713.3 (2%)     max: 2031.1 ms
Octane V2 - Octane V2 Total Score
min: 33046     avg: 40152     median: 43376 (38%)     max: 44034 Points
min: 29792     avg: 31904     median: 31904 (28%)     max: 34016 Points
WebXPRT 4 - WebXPRT 4 Score
72 Points (21%)
min: 71     avg: 76     median: 76 (22%)     max: 81 Points
WebXPRT 3 - WebXPRT 3 Score
min: 77     avg: 97.3     median: 105 (22%)     max: 110 Points
89 Points (19%)
AnTuTu v8 - AnTuTu v8 UX
100%
1 Tensor +
80242 Points (67%)
AnTuTu v8 - AnTuTu v8 MEM
100%
1 Tensor +
91046 Points (73%)
AnTuTu v8 - AnTuTu v8 GPU
100%
1 Tensor +
266666 Points (49%)
AnTuTu v8 - AnTuTu v8 CPU
100%
1 Tensor +
173530 Points (63%)
AnTuTu v8 - AnTuTu v8 Total Score
100%
1 Tensor +
611484 Points (59%)
Antutu v9 - AnTuTu v9 Total Score
min: 702981     avg: 713075     median: 715338 (43%)     max: 720905 Points
min: 643695     avg: 685759     median: 685759 (42%)     max: 727823 Points
Antutu v9 - AnTuTu v9 CPU
min: 179373     avg: 186798     median: 189382 (52%)     max: 191638 Points
min: 161711     avg: 173949     median: 173948 (48%)     max: 186186 Points
PassMark PerformanceTest Mobile V1 - PerformanceTest Mobile V1 CPU Tests
min: 4722     avg: 6101     median: 6101 (1%)     max: 7480 Points
PCMark for Android - PCM f. Android Storage 2.0 score
min: 17485     avg: 22609     median: 22608.5 (36%)     max: 27732 Points
min: 37737     avg: 39361     median: 39360.5 (62%)     max: 40984 Points
PCMark for Android - PCM f. Android Work Score 3.0
min: 9717     avg: 10577     median: 10409 (48%)     max: 11605 Points
min: 11254     avg: 12862     median: 12862 (59%)     max: 14470 Points
PCMark for Android - PCM f. Android Storage 2.0 random write internal
min: 62.3     avg: 76.5     median: 76.5 (56%)     max: 90.6 MB/s
PCMark for Android - PCM f. Android Storage 2.0 seq write internal
min: 1180     avg: 1354     median: 1353.5 (39%)     max: 1527 MB/s
PCMark for Android - PCM f. Android Storage 2.0 random read internal
min: 42.8     avg: 44.5     median: 44.5 (55%)     max: 46.2 MB/s
PCMark for Android - PCM f. Android Storage 2.0 seq read internal
min: 1484     avg: 1547     median: 1547 (43%)     max: 1610 MB/s
CrossMark - CrossMark Overall
min: 849     avg: 873     median: 865 (33%)     max: 906 Points
min: 738     avg: 741     median: 741 (28%)     max: 744 Points
Power Consumption - Geekbench 5.5 Power Consumption 150cd *
100%
1 Tensor +
min: 5.28     avg: 5.4     median: 5.4 (2%)     max: 5.64 Watt
Power Consumption - Idle Power Consumption 150cd 1min *
100%
1 Tensor +
min: 0.758     avg: 0.9     median: 0.8 (1%)     max: 1.013 Watt

Average Benchmarks Google Tensor → 100% n=13

Average Benchmarks MediaTek Dimensity 8050 → 97% n=13

- Bereich der Benchmarkergebnisse für diese Grafikkarte
- Durchschnittliche Benchmarkergebnisse für diese Grafikkarte
* Smaller numbers mean a higher performance
1 This benchmark is not used for the average calculation

Add one or more devices and compare

In the following list you can select (and also search for) devices that should be added to the comparison. You can select more than one device.

restrict list:

show all (including archived), 2024, 2023
v1.28
log 19. 23:56:43

#0 ran 0s before starting gpusingle class +0s ... 0s

#1 checking url part for id 14022 +0s ... 0s

#2 checking url part for id 15089 +0s ... 0s

#3 redirected to Ajax server, took 1726783003s time from redirect:0 +0s ... 0s

#4 did not recreate cache, as it is less than 5 days old! Created at Thu, 19 Sep 2024 05:16:12 +0200 +0s ... 0s

#5 composed specs +0.029s ... 0.03s

#6 did output specs +0s ... 0.03s

#7 getting avg benchmarks for device 14022 +0.001s ... 0.03s

#8 got single benchmarks 14022 +0.005s ... 0.035s

#9 getting avg benchmarks for device 15089 +0.001s ... 0.036s

#10 got single benchmarks 15089 +0.004s ... 0.04s

#11 got avg benchmarks for devices +0s ... 0.04s

#12 min, max, avg, median took s +0.019s ... 0.058s

#13 return log +0.002s ... 0.061s

Teilen Sie diesen Artikel, um uns zu unterstützen. Jeder Link hilft!
> Notebook Test, Laptop Test und News > Benchmarks / Technik > Benchmarks / Technik > Prozessor Vergleich - Head 2 Head
Autor: Klaus Hinum,  8.09.2017 (Update:  1.07.2023)