NVIDIA T1000 vs NVIDIA GeForce GTX 1660 Ti Max-Q vs NVIDIA Quadro RTX 6000 (Laptop)
NVIDIA T1000 ► remove from comparison
Die Nvidia T1000 Desktop ist eine professionelle Grafikkarte für kleine Workstations der Einstiegsklasse. Sie basiert auf dem selben TU117 Turing-Chip wie die Consumer GeForce GTX1650 . Auch die Anzahl der Shadereinheiten ist mit 896 identisch. Mit 8-GB-VRAM bietet die Nvidia T1000 mehr VRAM, welcher weiterhin über ein 128 Bit Speicherbus angebunden ist. Die Leistungsaufnahme der Nvidia T1000 beträgt nur 50 Watt und kommt daher ohne einen zusätzlichen Stromanschluss aus.
Die professionellen Grafikkarten bieten zertifizierte Treiber , welche auf Stabiltität und Performance bei professionellen Anwendungen (CAD-, DCC-, Medizin-, Prospektions-, Visualisierungsanwendungen) optimiert sind. Dadurch ist die Performance im Vergleich zu den Consumergrafikkarten mit gleichem Chip in diesen Bereichen deutlich besser.
Die kleineren Chips der Turing Serie bietet im Unterschied zu den stärkeren RTX Karten (z.B. Quadro RTX 3000 ) keine Raytracing und Tensor Kerne. Bei der Turing Architektur gab es auch auf der Ebene der CUDA-Kerne deutliche Verbesserungen. Float und INT Operationen können nun gleichzeitig ausgeführt werden, der Cache wurde vereinheitlicht und verbessert und Adaptive Shading eingeführt. Nvidia spricht dadurch von einer bis zu 50% höheren Leistung pro Kern im Vergleich zu Pascal.
NVIDIA GeForce GTX 1660 Ti Max-Q ► remove from comparison
Die Nvidia GeForce GTX 1660 Ti mit Max-Q Design für Laptops ist eine mobile Grafikkarte basierend auf der Turing Architektur. Sie ist gedacht für dünne und leichte Notebook und je nach Kühlungsdesign etwa 10-15% langsamer als eine normale GTX 1660 Ti für Laptops (22% geringerer Basis-Takt und 16% geringerer Boost-Takt). Sie basiert wie die Desktop-Version auf den TU116 Chip und wurde Ende April 2019 vorgestellt. Die GTX 1660 Serie bietet im Unterschied zu den stärkeren RTX 2000er Karten (z.B. RTX 2060 ) keine Raytracing und Tensor Kerne. Die Leistung sollte vergleichbar mit einer GTX 1070 Max-Q sein, jedoch bei deutlich geringerem Stromverbrauch von 60 Watt TGP (versus 80 Watt der Laptop 1660 Ti und 115 Watt der Desktop-Version).
Im April 2020 gab es einen Refresh der GeFroce GTX 1660 Ti Max-Q mit dem Codenamen N18E-G0-A1. Die Specs bleiben aber vergleichbar, der Chip ist im selben Package erhältlich wie die neuen RTX Chips (z.b. RTX 2070 Super ).
Bei der Turing Architektur gab es auch auf der Ebene der CUDA-Kerne deutliche Verbesserungen. Float und INT Operationen können nun gleichzeitig ausgeführt werden, der Cache wurde vereinheitlicht und verbessert und Adaptive Shading eingeführt. Nvidia spricht dadurch von einer bis zu 50% höheren Leistung pro Kern im Vergleich zu Pascal.
Der Stromverbrauch ist mit 60 Watt TGP (Total Graphics Power) von Nvidia spezifiziert und damit 20 Watt unterhalb der normalen (Max-P) Version . Dadurch eignet sich die GPU auch für dünnere Gaming-Laptops. Der verbaute TU116 Chip wird bei TSMC im 12nm FFN Verfahren gefertigt.
NVIDIA Quadro RTX 6000 (Laptop) ► remove from comparison
Die Nvidia Quadro RTX 6000 für Laptops ist eine professionelle Grafikkarte für große und schwere Notebooks. Sie basiert wie die Consumer GeForce RTX 2080 Ti auf den TU102 Chip, bietet jedoch mit 4.608 Shader und 24 GB GDDR6 Grafikspeicher. Im Vergleich zur Desktop RTX 6000, wird die mobile deutlich geringer getaktet.
Die Quadro-Grafikkarten bieten zertifizierte Treiber , welche auf Stabiltität und Performance bei professionellen Anwendungen (CAD-, DCC-, Medizin-, Prospektions-, Visualisierungsanwendungen) optimiert sind. Dadurch ist die Performance im Vergleich zu den Consumergrafikkarten mit gleichem Chip in diesen Bereichen deutlich besser.
Features
Der TU102-Chip wird in 12nm gefertigt und bietet eine Reihe neuer Features, wie DLSS (Deep Learning Super Sampling) und Real Time Ray Tracing. Dadurch lassen sich vor allem Beleuchtungseffekte sehr viel realistischer darstellen. Weiterhin gibt es Support für DisplayPort 1.4 (ready), HDMI 2.0b, HDR, Simultaneous Multi-Projection (SMP) sowie H.265 Video De- und Encoding (PlayReady 3.0).
Performance
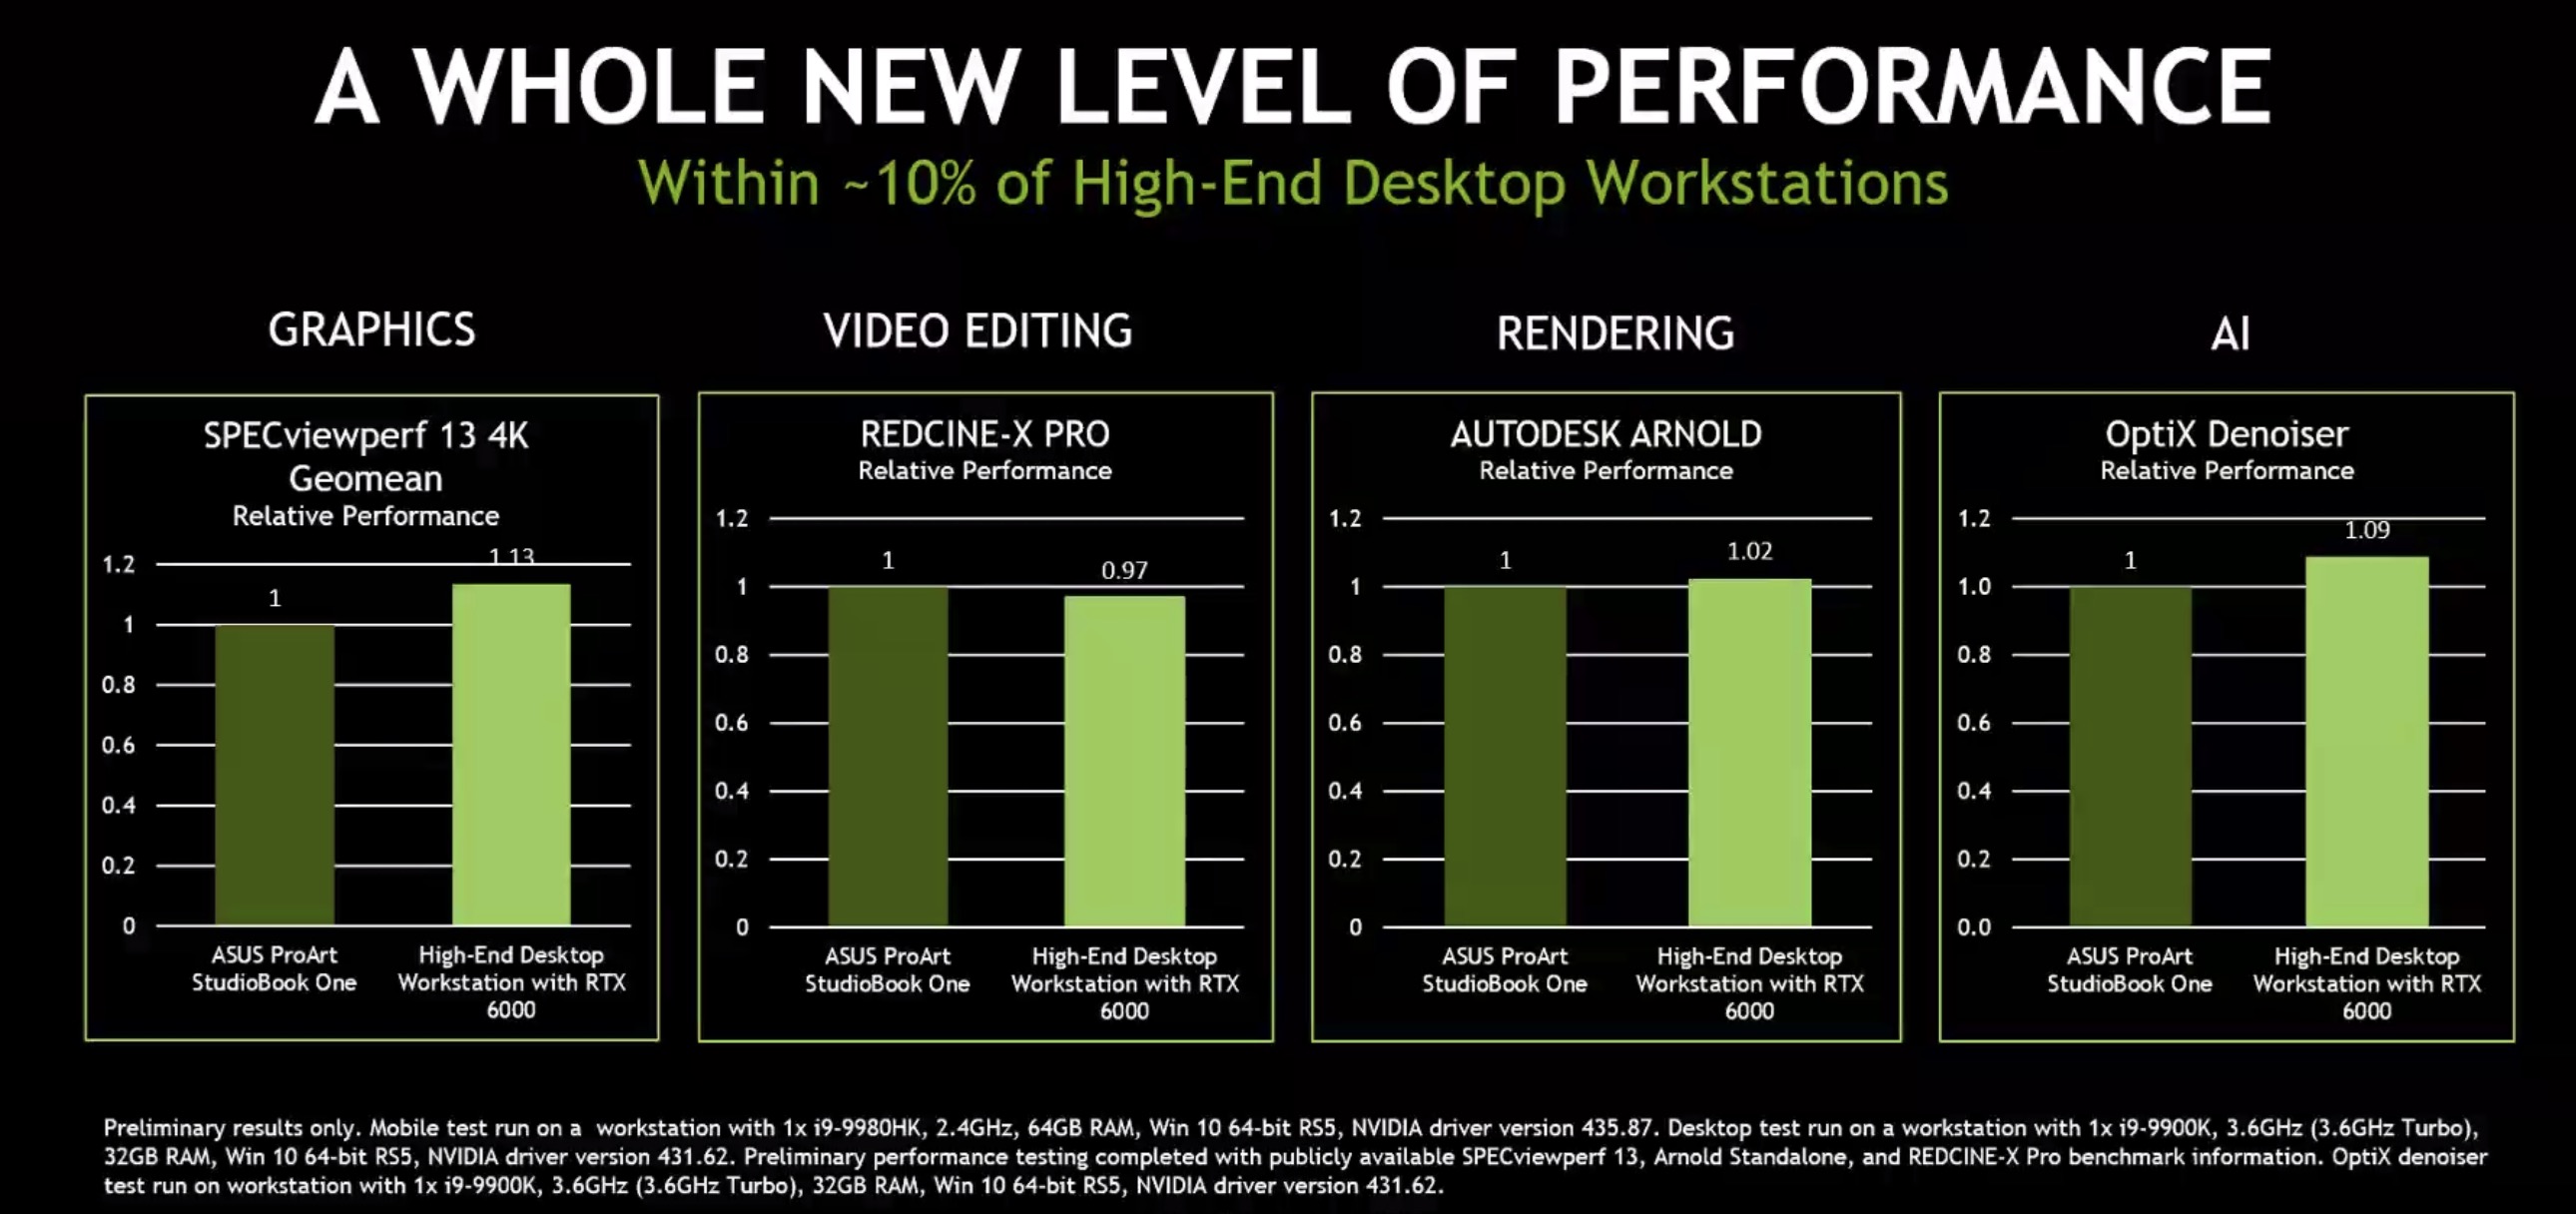
Durch die verringerten Taktraten bleibt die RTX 6000 für Notebooks etwas hinter der gleichnamigen Desktop GPU zurück. Nvidia selbst gibt and das die Desktop Version 13% schneller ist im Durchschnittswert des SPECviewperf 13 4K.
Der extrem hohe TDP von 200 Watt ermöglicht die nutzung der mobilen Quadro RTX 6000 nur in großen Notebooks mit hervorragender Kühllösung.
NVIDIA T1000 NVIDIA GeForce GTX 1660 Ti Max-Q NVIDIA Quadro RTX 6000 (Laptop) Quadro Turing Serie Architektur Turing Turing Turing Pipelines 896 - unified 1536 - unified 4608 - unified TMUs 56 ROPs 32 Kerntakt 1065 - 1395 (Boost) MHz 1140 - 1335 (Boost) MHz 1275 - 1455 (Boost) MHz Theoretical Performance 5000 TFLOPS FP16, 2500 TFLOPS FP32, 0.7812 TFLOPS FP64 Speichertakt 10000 effective = 1250 MHz 12000 MHz 14000 MHz Speicherbandbreite 128 Bit 192 Bit 384 Bit Speichertyp GDDR6 GDDR6 GDDR6 Max. Speichergröße 8 GB 6 GB 24 GB Shared Memory nein nein nein Memory Bandwidth 160 GB/s API DirectX 12_1, Shader 6.8, OpenGL 4.6, OpenCL 3.0, Vulkan 1.3 DirectX 12_1, OpenGL 4.6 DirectX 12_1, OpenGL 4.6 Stromverbrauch 50 Watt 60 Watt 200 Watt Transistors 4.7 Billion 18.6 Billion Die Size 200 mm² Herstellungsprozess 12 nm 12 nm 12 nm PCIe 3.0 x16 Displays 4 Displays (max.), DisplayPort 1.4a Erscheinungsdatum 06.05.2021 23.04.2019 04.09.2019 Codename N18E-G0 TU102 Notebookgröße mittel (15.4" z.B.) groß (17" z.B.) Herstellerseite www.nvidia.com Features NVLink, DLSS, Raytraycing, VR Ready, G-SYNC, Vulkan, Multi Monitor
Benchmarks Performance Rating - 3DMark 11 + Fire Strike + Time Spy - T1000
3.7 pt (11%)
...
...
Performance Rating - 3DMark 11 + Fire Strike + Time Spy - GeForce GTX 1660 Ti Max-Q
5.9 pt (18%)
...
NVIDIA GeForce GTX 1660 Ti Max-Q
...
3DMark - 3DMark Time Spy Score
3534 Points (10%)
min: 4547 avg: 5197 median: 5072 (15%) max: 6395 Points
11084 Points (32%)
GPU TDP ? TDP 200 W 45% 100%
3DMark - 3DMark Time Spy Graphics
3088 Points (8%)
min: 4867 avg: 5089 median: 5084.5 (13%) max: 5440 Points
3DMark - 3DMark Ice Storm Unlimited Graphics
398761 Points (40%)
min: 220799 avg: 314100 median: 306910 (31%) max: 414592 Points
3DMark - 3DMark Ice Storm Extreme Graphics
179865 Points (21%)
min: 76153 avg: 110626 median: 110626 (13%) max: 145099 Points
3DMark - 3DMark Cloud Gate Score
37881 Points (36%)
min: 16807 avg: 29350 median: 33027 (31%) max: 39942 Points
3DMark - 3DMark Cloud Gate Graphics
50553 Points (12%)
min: 38321 avg: 63736 median: 63086 (16%) max: 89505 Points
3DMark - 3DMark Fire Strike Standard Score
8124 Points (14%)
min: 10103 avg: 11548 median: 11615 (20%) max: 12739 Points
3DMark - 3DMark Fire Strike Standard Graphics
8450 Points (10%)
min: 12903 avg: 13356 median: 13355 (15%) max: 13870 Points
3DMark - 3DMark Ice Storm Graphics
237130 Points (26%)
min: 59373 avg: 104094 median: 86295 (10%) max: 166615 Points
3DMark - 3DMark Night Raid
34584 Points (33%)
3DMark - 3DMark Night Raid Graphics Score
41157 Points (16%)
3DMark 11 - 3DM11 Performance Score
12953 Points (17%)
min: 12279 avg: 15364 median: 15913 (21%) max: 17377 Points
3DMark 11 - 3DM11 Performance GPU
11793 Points (10%)
min: 17010 avg: 17711 median: 17439 (15%) max: 18653 Points
3DMark Vantage + NVIDIA T1000 3DMark Vantage - 3DM Vant. Perf. total
46318 Points (13%)
3DM Vant. Perf. total + NVIDIA GeForce GTX 1660 Ti Max-Q
31845 Points (9%)
3DM Vant. Perf. GPU no PhysX + NVIDIA T1000 3DMark Vantage - 3DM Vant. Perf. GPU no PhysX
39668 Points (22%)
3DM Vant. Perf. GPU no PhysX + NVIDIA GeForce GTX 1660 Ti Max-Q
34951 Points (19%)
3DMark 05 - 3DMark 05 - Standard
78565 Points (86%)
3DMark 06 3DMark 06 - Standard 1280x1024 + NVIDIA T1000
58968 Points (77%)
3DMark 06 - Standard 1280x1024 + NVIDIA GeForce GTX 1660 Ti Max-Q
min: 24029 avg: 28247 median: 25211 (33%) max: 38536 Points
Unigine Valley 1.0 - Unigine Valley 1.0 DX
42.2 fps (13%)
Blender - Blender 3.3 Classroom CUDA *
159 Seconds (24%)
Blender - Blender 3.3 Classroom OPTIX *
159 Seconds (59%)
SPECviewperf 13 specvp13 sw-04 + NVIDIA Quadro RTX 6000 (Laptop) SPECviewperf 13 - specvp13 sw-04
217 fps (58%)
specvp13 3dsmax-06 + NVIDIA Quadro RTX 6000 (Laptop) SPECviewperf 13 - specvp13 3dsmax-06
217 fps (38%)
SPECviewperf 2020 specvp2020 medical-03 1080p + NVIDIA T1000 SPECviewperf 2020 - specvp2020 medical-03 1080p
39.3 fps (26%)
specvp2020 energy-03 1080p + NVIDIA T1000 SPECviewperf 2020 - specvp2020 energy-03 1080p
18.1 fps (12%)
specvp2020 creo-03 1080p + NVIDIA T1000 SPECviewperf 2020 - specvp2020 creo-03 1080p
78.1 fps (38%)
specvp2020 catia-06 1080p + NVIDIA T1000 SPECviewperf 2020 - specvp2020 catia-06 1080p
37.3 fps (23%)
specvp2020 3dsmax-07 1080p + NVIDIA T1000 SPECviewperf 2020 - specvp2020 3dsmax-07 1080p
44 fps (14%)
specvp2020 medical-03 4k + NVIDIA T1000 SPECviewperf 2020 - specvp2020 medical-03 4k
13.4 fps (13%)
specvp2020 maya-06 4k + NVIDIA T1000 SPECviewperf 2020 - specvp2020 maya-06 4k
62.8 fps (10%)
specvp2020 energy-03 4k + NVIDIA T1000 SPECviewperf 2020 - specvp2020 energy-03 4k
9.5 fps (1%)
specvp2020 creo-03 4k + NVIDIA T1000 SPECviewperf 2020 - specvp2020 creo-03 4k
43.3 fps (21%)
specvp2020 catia-06 4k + NVIDIA T1000 SPECviewperf 2020 - specvp2020 catia-06 4k
21.9 fps (14%)
specvp2020 3dsmax-07 4k + NVIDIA T1000 SPECviewperf 2020 - specvp2020 3dsmax-07 4k
27.4 fps (11%)
Cinebench R10 Cinebench R10 Shading (32bit) + NVIDIA T1000 Cinebench R10 - Cinebench R10 Shading (32bit)
6837 Points (5%)
Cinebench R10 Shading (32bit) + NVIDIA GeForce GTX 1660 Ti Max-Q
min: 6820 avg: 9290 median: 8562.5 (6%) max: 13213 Points
Cinebench R11.5 Cinebench R11.5 OpenGL 64 Bit + NVIDIA T1000 Cinebench R11.5 - Cinebench R11.5 OpenGL 64 Bit
252.5 fps (83%)
Cinebench R11.5 OpenGL 64 Bit + NVIDIA GeForce GTX 1660 Ti Max-Q
min: 49.83 avg: 59.5 median: 59.5 (20%) max: 69.2 fps
Cinebench R15 + NVIDIA T1000 Cinebench R15 - Cinebench R15 OpenGL 64 Bit
335.8 fps (20%)
Cinebench R15 OpenGL 64 Bit + NVIDIA GeForce GTX 1660 Ti Max-Q
min: 78.2 avg: 100.5 median: 96.9 (6%) max: 130.7 fps
Cinebench R15 OpenGL Ref. Match 64 Bit + NVIDIA T1000 Cinebench R15 - Cinebench R15 OpenGL Ref. Match 64 Bit
99.6 % (100%)
Cinebench R15 OpenGL Ref. Match 64 Bit + NVIDIA GeForce GTX 1660 Ti Max-Q
99.6 % (100%)
GFXBench - GFXBench 5.0 Aztec Ruins High Tier Offscreen
110.2 fps (20%)
GFXBench - GFXBench 5.0 Aztec Ruins Normal Tier Offscreen
253.8 fps (19%)
GFXBench - GFXBench Car Chase Offscreen
227.4 fps (26%)
GFXBench 3.1 - GFXBench Manhattan ES 3.1 Offscreen
345.8 fps (7%)
GFXBench 3.0 - GFXBench 3.0 Manhattan Offscreen
360.6 fps (21%)
GFXBench (DX / GLBenchmark) 2.7 + NVIDIA GeForce GTX 1660 Ti Max-Q GFXBench (DX / GLBenchmark) 2.7 - GFXBench T-Rex HD Offscreen C24Z16
943 fps (8%)
Basemark GPU 1.2 - Basemark GPU 1.2 Vulkan Official Medium Offscreen 1080
386 fps (2%)
Basemark GPU 1.2 - Basemark GPU 1.2 Vulkan Official High Offscreen 2160
31.9 fps (7%)
Geekbench 6.3 - Geekbench 6.3 GPU OpenCL
38611 Points (11%)
Geekbench 6.3 - Geekbench 6.3 GPU Vulkan
36031 Points (10%)
LuxMark v2.0 64Bit - LuxMark v2.0 Room GPU
1987 Samples/s (7%)
2141 Samples/s (8%)
LuxMark v2.0 64Bit - LuxMark v2.0 Sala GPU
4129 Samples/s (7%)
4254 Samples/s (7%)
ComputeMark v2.1 - ComputeMark v2.1 Result
6369 Points (7%)
10027 Points (11%)
Power Consumption - Furmark Stress Test Power Consumption - external Monitor *
101.9 Watt (14%)
min: 77.6 avg: 86.3 median: 86.3 (12%) max: 95 Watt
Power Consumption - The Witcher 3 Power Consumption - external Monitor *
min: 92 avg: 96.6 median: 96.6 (13%) max: 101.2 Watt
Power Consumption - Witcher 3 Power Consumption *
min: 94.2 avg: 104.8 median: 106.9 (24%) max: 121 Watt
Power Consumption - Witcher 3 ultra Power Efficiency
min: 0.4388 avg: 0.5 median: 0.5 (43%) max: 0.537 fps per Watt
Power Consumption - Witcher 3 ultra Power Efficiency - external Monitor
min: 0.4822 avg: 0.5 median: 0.5 (44%) max: 0.578 fps per Watt
Power Consumption - Cyberpunk 2077 Power Consumption - external Monitor *
156.8 Watt (20%)
Power Consumption - Cyberpunk 2077 ultra Power Efficiency
0.1 fps per Watt (11%)
Emissions Witcher 3 Fan Noise + NVIDIA GeForce GTX 1660 Ti Max-Q Emissions - Witcher 3 Fan Noise
min: 34 avg: 43.4 median: 43.7 (70%) max: 53.8 dB(A)
Clock Speed - GPU Clock Witcher 3 ultra
1501 MHz (59%)
Clock Speed - GPU Clock Speed Furmark
1062 MHz (42%)
Average Benchmarks NVIDIA T1000 → 100% n=1 Average Benchmarks NVIDIA GeForce GTX 1660 Ti Max-Q → 144% n=1 Average Benchmarks NVIDIA Quadro RTX 6000 (Laptop) → 314% n=1
- Bereich der Benchmarkergebnisse für diese Grafikkarte
- Durchschnittliche Benchmarkergebnisse für diese Grafikkarte
* Smaller numbers mean a higher performance
1 This benchmark is not used for the average calculation
Spiele-Benchmarks Die folgenden Benchmarks basieren auf unseren Spieletests mit Testnotebooks. Die Performance dieser Grafikkarte bei den gelisteten Spielen ist abhängig von der verwendeten CPU, Speicherausstattung, Treiber und auch Betriebssystem. Dadurch müssen die untenstehenden Werte nicht repräsentativ sein. Detaillierte Informationen über das verwendete System sehen Sie nach einem Klick auf den fps-Wert.
GeForce GTX 1660 Ti Max-Q:
55.1 fps
GeForce GTX 1660 Ti Max-Q:
49.4 fps
GeForce GTX 1660 Ti Max-Q:
37.1 fps
GeForce GTX 1660 Ti Max-Q:
25.3 fps
GeForce GTX 1660 Ti Max-Q:
119 fps
GeForce GTX 1660 Ti Max-Q:
78 fps
GeForce GTX 1660 Ti Max-Q:
65 fps
GeForce GTX 1660 Ti Max-Q:
51 fps
GeForce GTX 1660 Ti Max-Q:
136.1 fps
GeForce GTX 1660 Ti Max-Q:
87.7 fps
GeForce GTX 1660 Ti Max-Q:
81.3 fps
GeForce GTX 1660 Ti Max-Q:
78.4 fps
GeForce GTX 1660 Ti Max-Q:
219 fps
GeForce GTX 1660 Ti Max-Q:
130 fps
GeForce GTX 1660 Ti Max-Q:
112 fps
GeForce GTX 1660 Ti Max-Q:
79 fps
GeForce GTX 1660 Ti Max-Q:
214.7 fps
GeForce GTX 1660 Ti Max-Q:
130.2 fps
GeForce GTX 1660 Ti Max-Q:
79.9 fps
GeForce GTX 1660 Ti Max-Q:
56.1 fps
GeForce GTX 1660 Ti Max-Q:
168.9 fps
GeForce GTX 1660 Ti Max-Q:
101.7 fps
GeForce GTX 1660 Ti Max-Q:
95.4 fps
GeForce GTX 1660 Ti Max-Q:
93.4 fps
GeForce GTX 1660 Ti Max-Q:
176.8 fps
GeForce GTX 1660 Ti Max-Q:
81.2 fps
GeForce GTX 1660 Ti Max-Q:
63.3 fps
GeForce GTX 1660 Ti Max-Q:
121.2 fps
GeForce GTX 1660 Ti Max-Q:
98.3 fps
GeForce GTX 1660 Ti Max-Q:
90.5 fps
GeForce GTX 1660 Ti Max-Q:
87.7 fps
GeForce GTX 1660 Ti Max-Q:
115.1 fps
GeForce GTX 1660 Ti Max-Q:
71.7 fps
GeForce GTX 1660 Ti Max-Q:
47.2 fps
GeForce GTX 1660 Ti Max-Q:
29.4 fps
GeForce GTX 1660 Ti Max-Q:
91.5 fps
GeForce GTX 1660 Ti Max-Q:
78.1 fps
GeForce GTX 1660 Ti Max-Q:
72.4 fps
GeForce GTX 1660 Ti Max-Q:
95.8 fps
GeForce GTX 1660 Ti Max-Q:
83 fps
GeForce GTX 1660 Ti Max-Q:
73.9 fps
GeForce GTX 1660 Ti Max-Q:
66.9 fps
GeForce GTX 1660 Ti Max-Q:
135.2 fps
GeForce GTX 1660 Ti Max-Q:
88 fps
GeForce GTX 1660 Ti Max-Q:
72.6 fps
GeForce GTX 1660 Ti Max-Q:
62.6 fps
GeForce GTX 1660 Ti Max-Q:
112.9 fps
GeForce GTX 1660 Ti Max-Q:
86.5 fps
GeForce GTX 1660 Ti Max-Q:
72 fps
GeForce GTX 1660 Ti Max-Q:
58.7 fps
GeForce GTX 1660 Ti Max-Q:
83 114 ~ 99 fps
GeForce GTX 1660 Ti Max-Q:
68 72 ~ 70 fps
GeForce GTX 1660 Ti Max-Q:
65 66 ~ 66 fps
GeForce GTX 1660 Ti Max-Q:
48 51 ~ 50 fps
GeForce GTX 1660 Ti Max-Q:
147.9 fps
GeForce GTX 1660 Ti Max-Q:
145.4 fps
GeForce GTX 1660 Ti Max-Q:
141 fps
GeForce GTX 1660 Ti Max-Q:
139.3 fps
68%
GeForce GTX 1660 Ti Max-Q:
87 116.5 ~ 102 fps
128%
GeForce GTX 1660 Ti Max-Q:
72.1 81.5 ~ 77 fps
141%
GeForce GTX 1660 Ti Max-Q:
52.9 54.9 ~ 54 fps
147%
GeForce GTX 1660 Ti Max-Q:
41.5 42.3 ~ 42 fps
GeForce GTX 1660 Ti Max-Q:
158.3 fps
GeForce GTX 1660 Ti Max-Q:
63.7 fps
GeForce GTX 1660 Ti Max-Q:
47.1 fps
GeForce GTX 1660 Ti Max-Q:
155 183 ~ 169 fps
GeForce GTX 1660 Ti Max-Q:
119 140 ~ 130 fps
GeForce GTX 1660 Ti Max-Q:
106 117 ~ 112 fps
GeForce GTX 1660 Ti Max-Q:
71 77 ~ 74 fps
90%
GeForce GTX 1660 Ti Max-Q:
144.1 209.4 ~ 177 fps
142%
GeForce GTX 1660 Ti Max-Q:
76.5 93.1 ~ 85 fps
150%
GeForce GTX 1660 Ti Max-Q:
54.7 57.1 ~ 56 fps
170%
GeForce GTX 1660 Ti Max-Q:
41.1 41.6 ~ 41 fps
GeForce GTX 1660 Ti Max-Q:
70.9 76.2 ~ 74 fps
GeForce GTX 1660 Ti Max-Q:
58.7 65.8 ~ 62 fps
GeForce GTX 1660 Ti Max-Q:
58.2 64.8 ~ 62 fps
GeForce GTX 1660 Ti Max-Q:
59.6 87.9 ~ 74 fps
GeForce GTX 1660 Ti Max-Q:
58.7 83.2 ~ 71 fps
GeForce GTX 1660 Ti Max-Q:
45.3 64.1 ~ 55 fps
GeForce GTX 1660 Ti Max-Q:
26 33.2 ~ 30 fps
GeForce GTX 1660 Ti Max-Q:
110 142 ~ 126 fps
GeForce GTX 1660 Ti Max-Q:
80 87 ~ 84 fps
GeForce GTX 1660 Ti Max-Q:
66 69 ~ 68 fps
GeForce GTX 1660 Ti Max-Q:
49 50 ~ 50 fps
GeForce GTX 1660 Ti Max-Q:
88.7 103.2 ~ 96 fps
GeForce GTX 1660 Ti Max-Q:
57.3 59.2 ~ 58 fps
GeForce GTX 1660 Ti Max-Q:
53.6 fps
GeForce GTX 1660 Ti Max-Q:
48.9 fps
GeForce GTX 1660 Ti Max-Q:
48.8 fps
GeForce GTX 1660 Ti Max-Q:
46.4 fps
83%
GeForce GTX 1660 Ti Max-Q:
97 fps
131%
GeForce GTX 1660 Ti Max-Q:
81 fps
134%
GeForce GTX 1660 Ti Max-Q:
78 fps
134%
GeForce GTX 1660 Ti Max-Q:
71 fps
131%
GeForce GTX 1660 Ti Max-Q:
53.9 60 66.5 ~ 60 fps
GeForce GTX 1660 Ti Max-Q:
144 144 ~ 144 fps
GeForce GTX 1660 Ti Max-Q:
90.1 99.6 ~ 95 fps
GeForce GTX 1660 Ti Max-Q:
89 99.6 ~ 94 fps
GeForce GTX 1660 Ti Max-Q:
135.6 fps
GeForce GTX 1660 Ti Max-Q:
85.8 fps
GeForce GTX 1660 Ti Max-Q:
77.4 fps
GeForce GTX 1660 Ti Max-Q:
72.8 fps
GeForce GTX 1660 Ti Max-Q:
61 73 85 ~ 73 fps
GeForce GTX 1660 Ti Max-Q:
37.9 fps
GeForce GTX 1660 Ti Max-Q:
115.2 fps
GeForce GTX 1660 Ti Max-Q:
87.9 fps
GeForce GTX 1660 Ti Max-Q:
84.6 fps
GeForce GTX 1660 Ti Max-Q:
83.1 fps
GeForce GTX 1660 Ti Max-Q:
48 64 90 ~ 67 fps
GeForce GTX 1660 Ti Max-Q:
43 56 71 ~ 57 fps
GeForce GTX 1660 Ti Max-Q:
39 51 60 ~ 50 fps
GeForce GTX 1660 Ti Max-Q:
33 42 44 ~ 40 fps
GeForce GTX 1660 Ti Max-Q:
53 57 83 85 ~ 70 fps
GeForce GTX 1660 Ti Max-Q:
52 53 74 75 ~ 64 fps
GeForce GTX 1660 Ti Max-Q:
49 49 64 67 ~ 57 fps
GeForce GTX 1660 Ti Max-Q:
66.9 fps
GeForce GTX 1660 Ti Max-Q:
59.3 fps
GeForce GTX 1660 Ti Max-Q:
59.5 fps
GeForce GTX 1660 Ti Max-Q:
50.8 fps
68%
GeForce GTX 1660 Ti Max-Q:
68 103 ~ 86 fps
111%
GeForce GTX 1660 Ti Max-Q:
54 84 ~ 69 fps
116%
GeForce GTX 1660 Ti Max-Q:
53 79 ~ 66 fps
117%
GeForce GTX 1660 Ti Max-Q:
50 74 ~ 62 fps
GeForce GTX 1660 Ti Max-Q:
30 fps
GeForce GTX 1660 Ti Max-Q:
376.8 fps
GeForce GTX 1660 Ti Max-Q:
215.9 fps
GeForce GTX 1660 Ti Max-Q:
117.3 fps
GeForce GTX 1660 Ti Max-Q:
125.6 fps
GeForce GTX 1660 Ti Max-Q:
91.7 fps
GeForce GTX 1660 Ti Max-Q:
77.3 fps
GeForce GTX 1660 Ti Max-Q:
53.7 fps
138%
GeForce GTX 1660 Ti Max-Q:
44.9 50 54.6 ~ 50 fps
GeForce GTX 1660 Ti Max-Q:
138 fps
GeForce GTX 1660 Ti Max-Q:
92.2 fps
GeForce GTX 1660 Ti Max-Q:
89.5 fps
GeForce GTX 1660 Ti Max-Q:
78.6 fps
GeForce GTX 1660 Ti Max-Q:
91 fps
GeForce GTX 1660 Ti Max-Q:
82 fps
GeForce GTX 1660 Ti Max-Q:
72 fps
GeForce GTX 1660 Ti Max-Q:
61 fps
GeForce GTX 1660 Ti Max-Q:
130.4 fps
GeForce GTX 1660 Ti Max-Q:
78.1 fps
GeForce GTX 1660 Ti Max-Q:
72.4 fps
GeForce GTX 1660 Ti Max-Q:
41.5 fps
GeForce GTX 1660 Ti Max-Q:
193.7 fps
GeForce GTX 1660 Ti Max-Q:
140.7 fps
GeForce GTX 1660 Ti Max-Q:
116 fps
GeForce GTX 1660 Ti Max-Q:
42.4 fps
GeForce GTX 1660 Ti Max-Q:
40.7 fps
GeForce GTX 1660 Ti Max-Q:
93.7 fps
GeForce GTX 1660 Ti Max-Q:
72.7 fps
GeForce GTX 1660 Ti Max-Q:
64.5 fps
GeForce GTX 1660 Ti Max-Q:
232.8 fps
GeForce GTX 1660 Ti Max-Q:
200.1 fps
GeForce GTX 1660 Ti Max-Q:
163.6 fps
GeForce GTX 1660 Ti Max-Q:
148.8 fps
GeForce GTX 1660 Ti Max-Q:
60 fps
GeForce GTX 1660 Ti Max-Q:
60 fps
GeForce GTX 1660 Ti Max-Q:
60 fps
44%
GeForce GTX 1660 Ti Max-Q:
93.3 113 119 ~ 108 fps
GeForce GTX 1660 Ti Max-Q:
89 fps
GeForce GTX 1660 Ti Max-Q:
69 fps
GeForce GTX 1660 Ti Max-Q:
51 fps
GeForce GTX 1660 Ti Max-Q:
30.9 fps
86%
GeForce GTX 1660 Ti Max-Q:
161.3 fps
81%
GeForce GTX 1660 Ti Max-Q:
151.5 fps
111%
GeForce GTX 1660 Ti Max-Q:
114.6 fps
119%
GeForce GTX 1660 Ti Max-Q:
59.6 fps
GeForce GTX 1660 Ti Max-Q:
343.8 fps
GeForce GTX 1660 Ti Max-Q:
322.9 fps
GeForce GTX 1660 Ti Max-Q:
296.9 fps
GeForce GTX 1660 Ti Max-Q:
166.1 fps
Average Gaming NVIDIA T1000 → 100% Average Gaming 30-70 fps → 100%
Average Gaming NVIDIA GeForce GTX 1660 Ti Max-Q → 108% Average Gaming 30-70 fps → 130%
NVIDIA T1000 low med. high ultra QHD 4K F1 24 98.4 82.6 58.8 Avatar Frontiers of Pandora 22 19 15 10 Total War Pharaoh 138.6 90.8 50.6 39.8 Assassin's Creed Mirage 44 40 38 Cyberpunk 2077 2.1 Phantom Liberty 45.1 34.2 28.3 23.8 Baldur's Gate 3 45 35.2 30.2 29.5 F1 23 108.3 96.5 63.6 Tiny Tina's Wonderlands 69.2 55.6 35.3 27.6 GRID Legends 125.4 91.3 69.6 49.7 God of War 51.8 42.5 33.5 21.4 Far Cry 6 110.4 56.9 47.4 40.3 Borderlands 3 151 60 38.2 28.6 Total War: Three Kingdoms 195.9 60 37.3 24.1 Far Cry New Dawn 117 62 58 53 Metro Exodus 102.3 45.9 33 26.1 Strange Brigade 226 87.2 69.4 59.9 Far Cry 5 127 62 57 53 X-Plane 11.11 211 145.8 130.1 Final Fantasy XV Benchmark 101.3 49.3 36.2 Dota 2 Reborn 246.2 217.7 150.4 136.5 The Witcher 3 188.8 113.8 63.9 35.2 GTA V 187.4 187.1 103.5 50.2 < 30 fps < 60 fps < 120 fps ≥ 120 fps 1 4 7 10 1 8 10 3 2 13 5 2 8 8 1
v1.28
log 15. 03:59:01
#0 ran 0s before starting gpusingle class +0s ... 0s
#1 checking url part for id 12782 +0s ... 0s
#2 checking url part for id 9832 +0s ... 0s
#3 checking url part for id 9923 +0s ... 0s
#4 redirected to Ajax server, took 1731639541s time from redirect:0 +0s ... 0s
#5 did not recreate cache, as it is less than 5 days old! Created at Wed, 13 Nov 2024 05:16:40 +0100 +0s ... 0s
#6 composed specs +0.031s ... 0.031s
#7 did output specs +0s ... 0.031s
#8 start showIntegratedCPUs +0s ... 0.031s
#9 getting avg benchmarks for device 12782 +0.038s ... 0.069s
#10 got single benchmarks 12782 +0.005s ... 0.074s
#11 getting avg benchmarks for device 9832 +0.004s ... 0.078s
#12 got single benchmarks 9832 +0.012s ... 0.09s
#13 getting avg benchmarks for device 9923 +0s ... 0.09s
#14 got single benchmarks 9923 +0.003s ... 0.093s
#15 got avg benchmarks for devices +0s ... 0.093s
#16 min, max, avg, median took s +0.038s ... 0.131s
#17 before gaming benchmark output +0s ... 0.131s
#18 Got 424 rows for game benchmarks. +0.023s ... 0.154s
#19 composed SQL query for gamebenchmarks +0s ... 0.154s
#20 got data and put it in $dataArray +0.004s ... 0.158s
#21 benchmarks composed for output. +0.02s ... 0.178s
#22 calculated avg scores. +0s ... 0.178s
#23 return log +0.001s ... 0.179s
Teilen Sie diesen Artikel, um uns zu unterstützen. Jeder Link hilft!
Autor: Klaus Hinum, 8.09.2017 (Update: 1.07.2023)
 Deutsch
 English
 Español
 Français
 Italiano
 Nederlands
 Polski
 Português
 Русский
 Türkçe
 Svenska
 Chinese
 Magyar